Tag Archives: artificial intelligence

Amazon Lookout for Vision – New ML Service Simplifies Defect Detection for Manufacturing

Post Syndicated from Marcia Villalba original https://aws.amazon.com/blogs/aws/amazon-lookout-for-vision-new-machine-learning-service-that-simplifies-defect-detection-for-manufacturing/

Today, I’m excited to announce Amazon Lookout for Vision, a new machine learning (ML) service that helps customers in industrial environments to detect visual defects on production units and equipment in an easy and cost-effective way.

Can you spot the circuit board with the defect in these images?

Image of 3 circuit boards - one is faulty

Maybe you can if you are familiar with circuit boards, but I have to say that it took me a while to discover the error. Humans, when properly trained and are well rested, are great at finding anomalies in a set of objects. However, when they are tired or not properly trained – like me in this example – they can be slow, prone to errors and inconsistent.

That’s why many companies use machine vision technologies to detect anomalies. However, these technologies need to be calibrated with controlled lighting and camera viewpoints. In addition, you need to specify hard-coded rules that define what is a defect and what is not, making the technologies very specialized and complex to build.

Lookout for Vision is a new machine learning service that helps increase industrial product quality and reduce operational costs by automating visual inspection of product defects across production processes. Lookout for Vision uses deep learning models to replace hard-coded rules and handles the differences in camera angle, lighting and other challenges that arise from the operational environment. With Lookout for Vision, you can reduce the need for carefully controlled environments.

Using Lookout for Vision, you can detect damages to manufactured parts, identify missing components or parts, and uncover underlying process-related issues in your manufacturing lines.

How to Get Started With Lookout for Vision
The first thing I want to mention is that to use Lookout for Vision, you don’t need to be a machine learning expert. Lookout for Vision is a fully managed service and comes with anomaly detection models that can be optimized for your use case and your data.

There are several steps for using Lookout for Vision. The first is preparing the dataset, which includes creating a dataset of images and adding labels to the images. Then, Lookout for Vision uses this dataset to automatically train the ML model that learns to detect anomalies in your product. The final part is using the model in production. You can keep evaluating the performance of your trained model and improve it at any time using tools that Lookout for Vision provides.

Service console tutorial for getting started

Preparing the Data
To get started with the model, you first need a set of images of your product. For better results, include images with normal (no defects) and anomalous content (includes defects). To get started with training, you will need at least 20 normal images and 10 anomalous images.

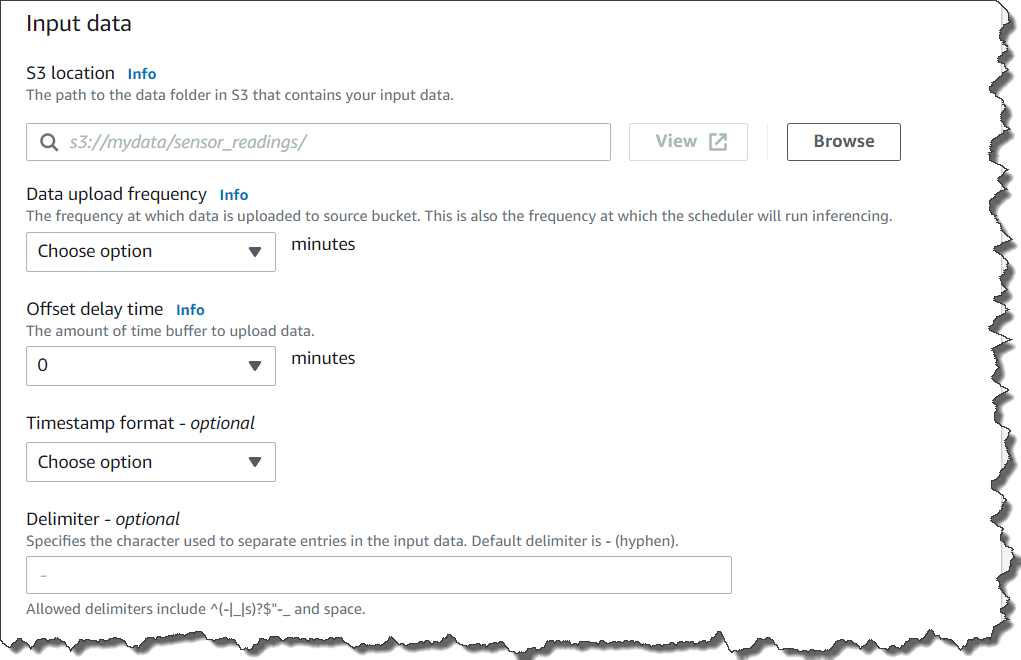
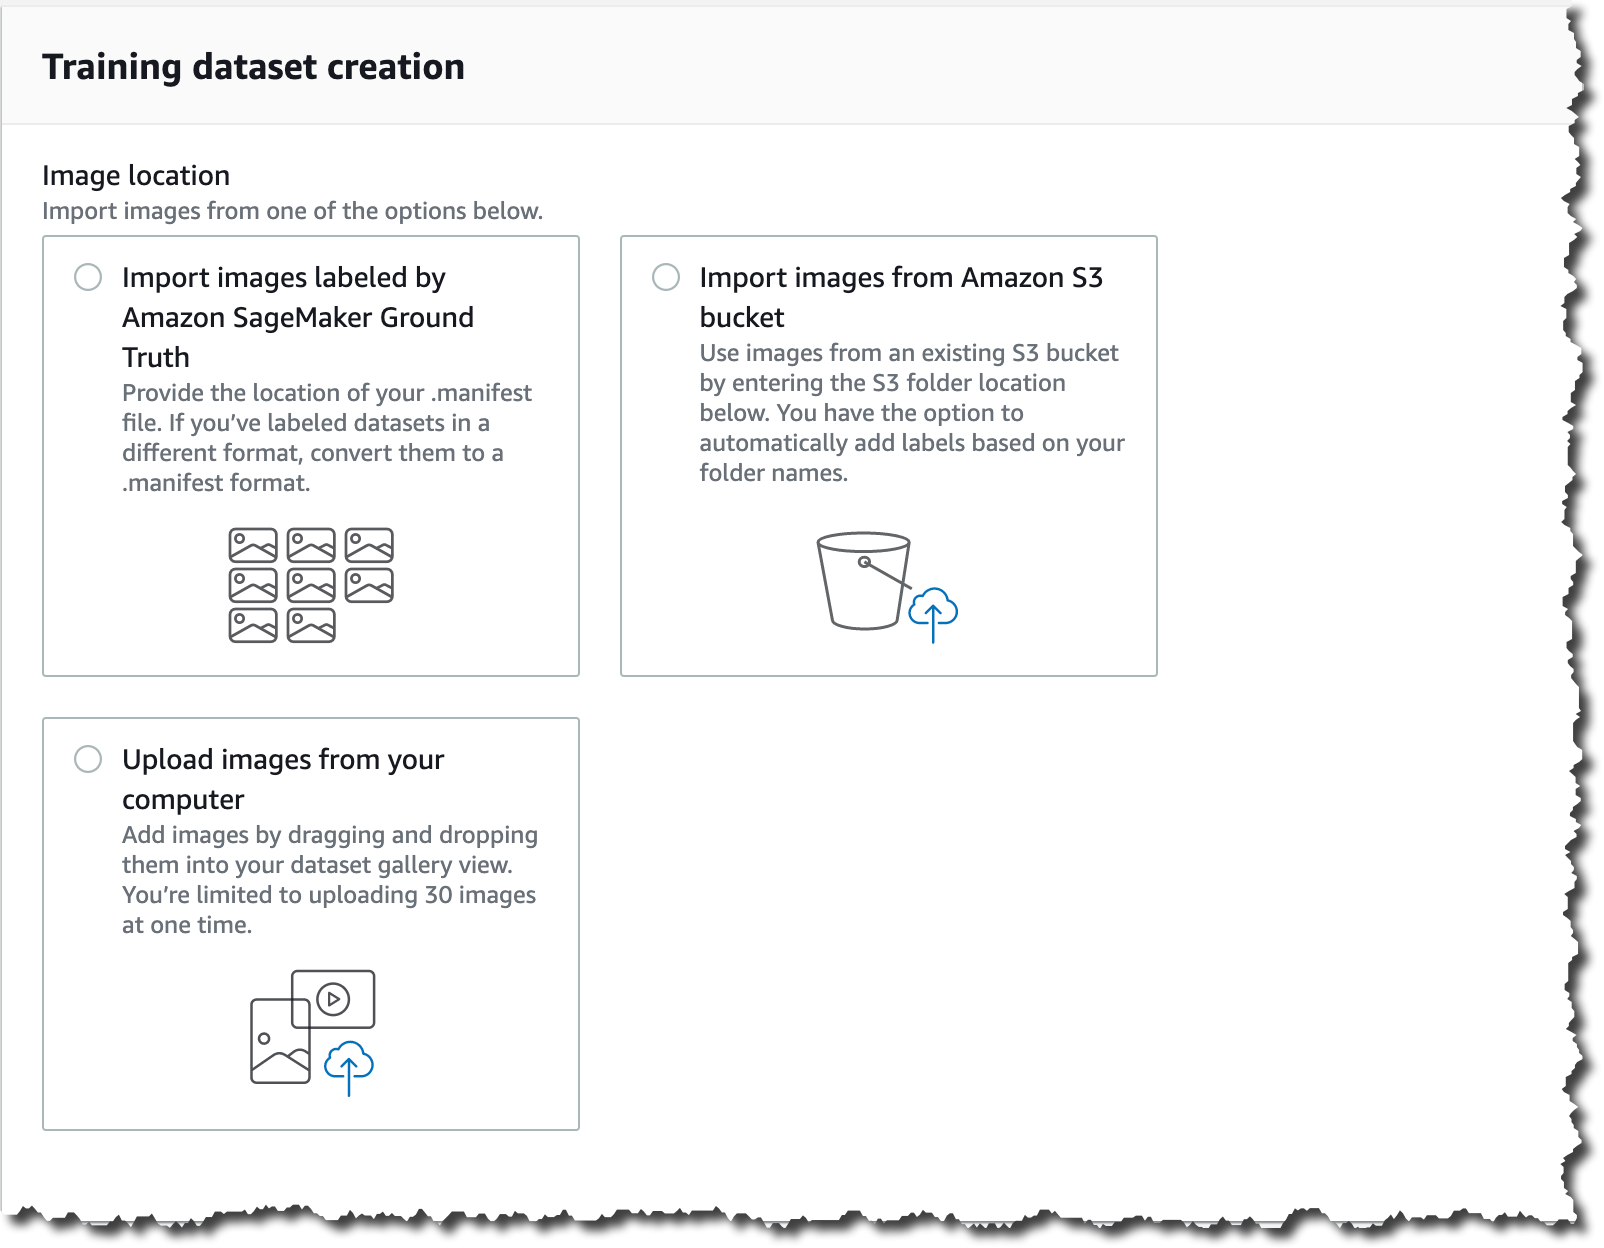
There are many ways of importing images into Lookout for Vision from the AWS Management Console: You can provide manifests for annotated images using the Amazon SageMaker Ground Truth service, provide images from an S3 bucket or upload directly from your computer.

Different ways to import your images.

After you upload the images, you need to add labels to classify the images in your dataset as normal or anomalous. Labeling is a very important step, as this is the key information that Lookout for Vision uses to train the model for your use case.

For this demo, I import the images from an S3 bucket. If you’ve organized the images in your S3 bucket by folder name (/anomaly/01.jpeg), Lookout for Vision will automatically import the folder structure into corresponding labels.

Training the Model
When our dataset is ready, we need to train our model with it. The training button is enabled once you have the minimum number of labeled images: 20 normal and 10 anomalous.

Depending on the size of the dataset, training may take a while to complete: for me, it took around an hour to train the model with 100 images. Note that you will begin incurring costs when Lookout for Vision starts to actually train the model. After training is complete, your model is ready to detect anomalies in new images.

Screenshot of a model in training.

Evaluating the Model
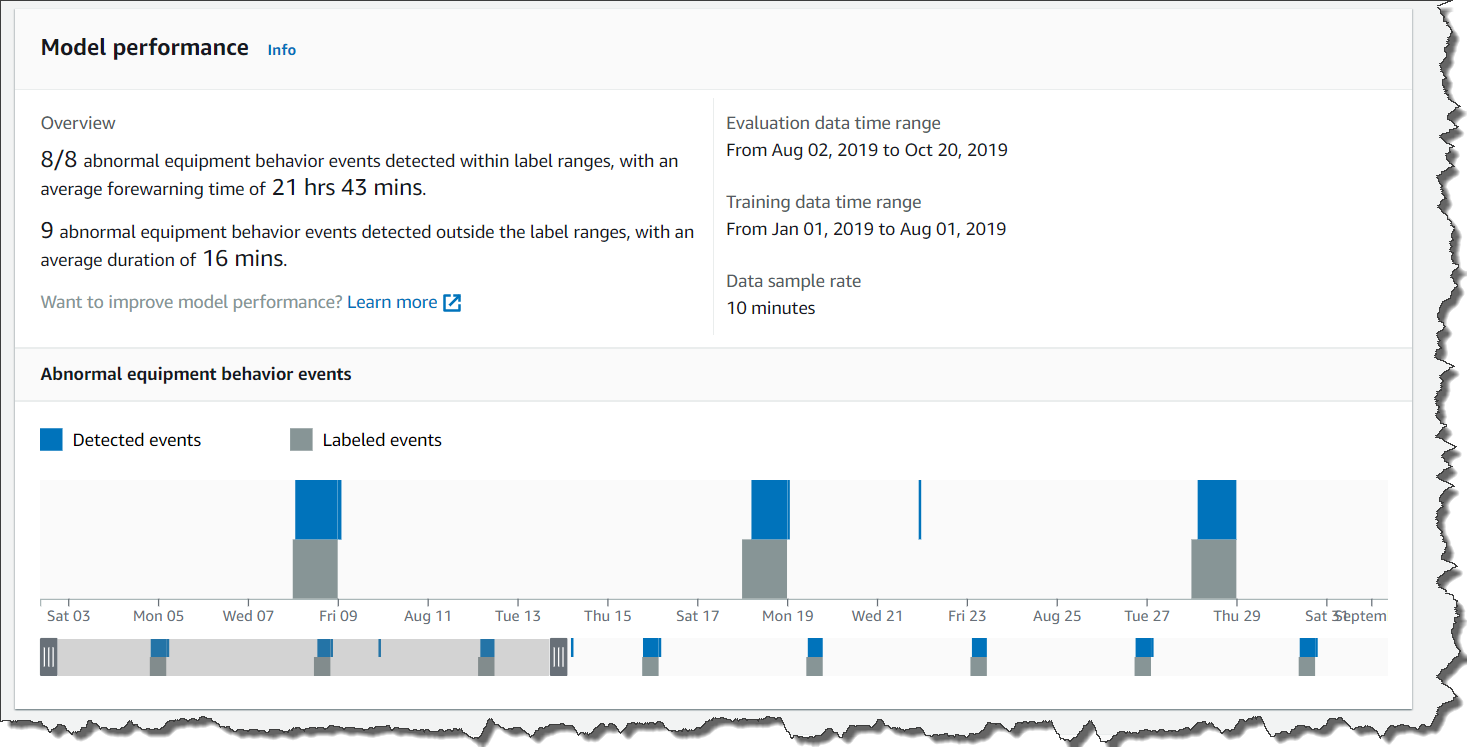
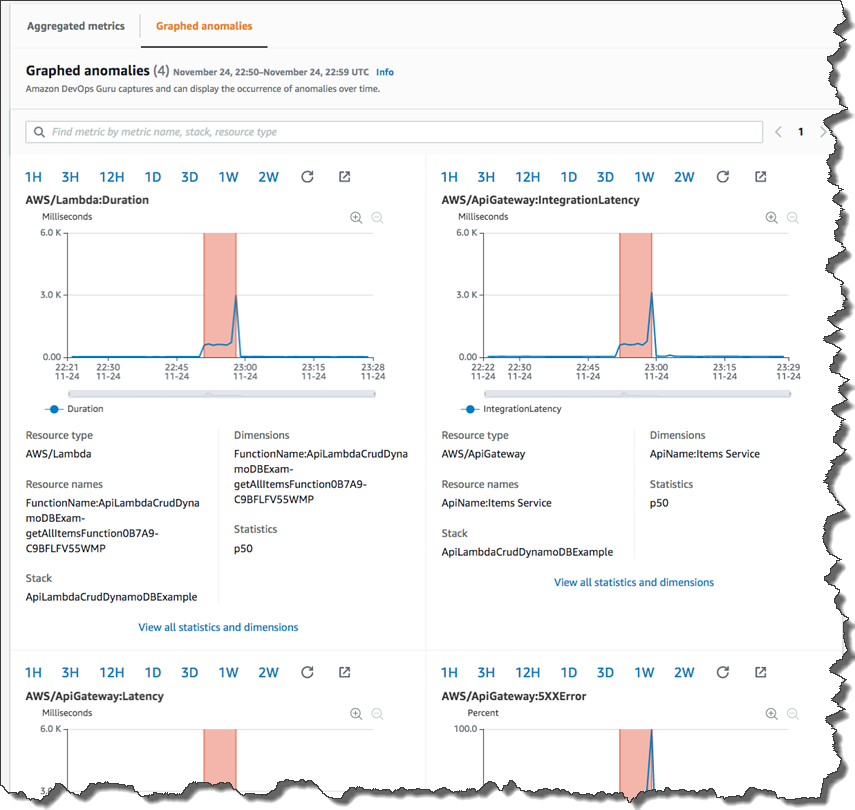
There are a couple of ways to evaluate whether your model is ready to be deployed to production. The first is to review the performance metrics of the model and the second is to run some productionlike tests that will help you to verify if the model is ready to be deployed.

There are three main performance metrics: precision, recall and the F1 score. Precision measures the percentage of times the model prediction is correct and recall measures the percentage of true defects the model identified. F1 score is used to determine the model performance metric.

Screenshot of model performance metrics

If you want to run some production-like tests to verify if your model is ready, use the run trial detection feature. This will enable you to run your Lookout for Vision model and predict anomalies on new images. You can further improve the model by manually verifying the results and adding new training images.

Create a new job to predict anomalies.

I used the three images that appear at the beginning of this post for my trial detection. The trial detection job ran for 15-20 minutes, and after that Lookout for Vision used the trained model to classify the images into “Normal” and “Anomaly.” When Lookout for Vision finalizes the trial detection job, you can verify the results as correct or incorrect, and add this images to the dataset.

Screenshot verifying the results of the trial

Using the Model in Production
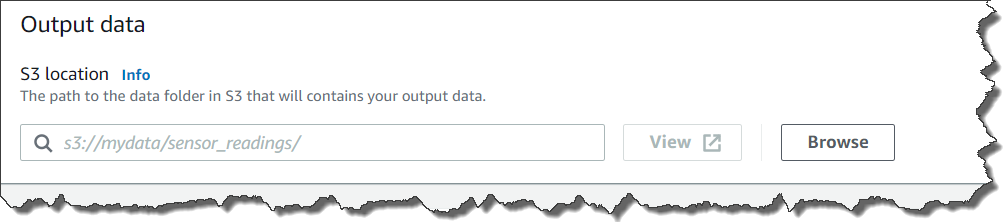
To use Lookout for Vision, you need to integrate the AWS SDKs or CLI in the systems that are processing the images of the products in the manufacturing line, and internet connectivity is required for this to work. The first thing you need to do is to start the model. When using Lookout for Vision, you are billed for the time your model is running and making inferences. For example, if you start your model at 8 a.m. and stop it at 5 p.m., you will be billed for 9 hours.

# Example CLI
aws lookoutvision start-model 
--project-name circuitBoard 
--model-version 1
--additional-output-config "Bucket=<OUTPUT_BUCKET>,Prefix=<PREFIX_KEY>" 
--min-anomaly-detection-units 10 

# Example response
{ "status" : "STARTING_HOSTING" }

When your model is ready, you can call the detect-anomalies API from Lookout for Vision.

# Example CLI
aws lookoutvision detect-anomalies 
--project-name circuitBoard 
--model-version 1 

And this API will return a JSON response that shows if the image is an anomaly or not, along with the confidence level of that prediction.

{
    "DetectAnomalyResult": {
        "Source": {
            "Type": "direct"
        },
        "IsAnomalous": true,
        "Confidence": 0.97
    }
}

When you are done with detecting anomalies for the day, use the stop-model API. In the Lookout for Vision service console you can find code snippets on how to use these APIs.

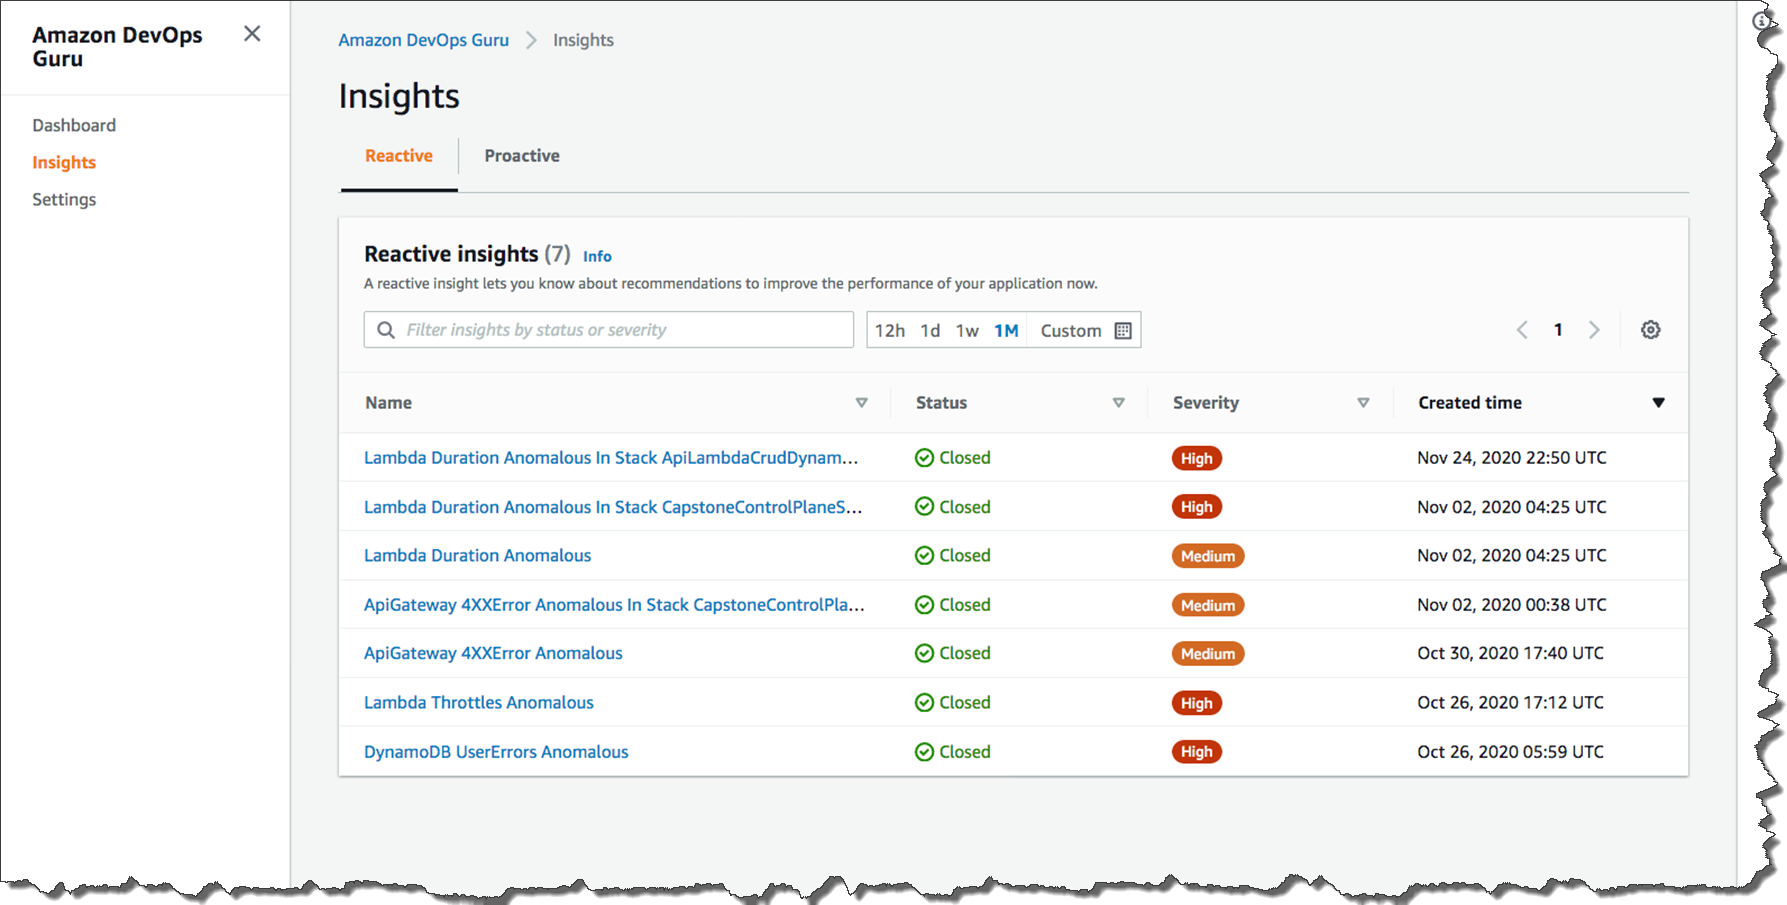
When you are using Lookout for Vision in production, you’ll find a dashboard that helps you to sort and track the production lines by most defective line, line with the most recent defects, and the line with the highest anomaly ratio.

Available Today
Lookout for Vision is available in all AWS Regions.

To get started with Amazon Lookout for Vision, visit the service page today.

Marcia

New – Amazon Lookout for Equipment Analyzes Sensor Data to Help Detect Equipment Failure

Post Syndicated from Harunobu Kameda original https://aws.amazon.com/blogs/aws/new-amazon-lookout-for-equipment-analyzes-sensor-data-to-help-detect-equipment-failure/

Companies that operate industrial equipment are constantly working to improve operational efficiency and avoid unplanned downtime due to component failure. They invest heavily and repeatedly in physical sensors (tags), data connectivity, data storage, and building dashboards over the years to monitor the condition of their equipment and get real-time alerts. The primary data analysis methods are single-variable threshold and physics-based modeling approaches, and while these methods are effective in detecting specific failure types and operating conditions, they can often miss important information detected by deriving multivariate relationships for each piece of equipment.

With machine learning, more powerful technologies have become available that can provide data-driven models that learn from an equipment’s historical data. However, implementing such machine learning solutions is time-consuming and expensive owing to capital investment and training of engineers.

Today, we are happy to announce Amazon Lookout for Equipment, an API-based machine learning (ML) service that detects abnormal equipment behavior. With Lookout for Equipment, customers can bring in historical time series data and past maintenance events generated from industrial equipment that can have up to 300 data tags from components such as sensors and actuators per model. Lookout for Equipment automatically tests the possible combinations and builds an optimal machine learning model to learn the normal behavior of the equipment. Engineers don’t need machine learning expertise and can easily deploy models for real-time processing in the cloud.

Customers can then easily perform ML inference to detect abnormal behavior of the equipment. The results can be integrated into existing monitoring software or AWS IoT SiteWise Monitor to visualize the real-time output or to receive alerts if an asset tends toward anomalous conditions.

How Lookout for Equipment Works
Lookout for Equipment reads directly from Amazon S3 buckets. Customers can publish their industrial data in S3 and leverage Lookout for Equipment for model development. A user determines the value or time period to be used for training and assigns an appropriate label. Given this information, Lookout for Equipment launches a task to learn and creates the best ML model for each customer.

Because Lookout for Equipment is an automated machine learning tool, it gets smarter over time as users use Lookout for Equipment to retrain their models with new data. This is useful for model re-creation when new invisible failures occur, or when the model drifts over time. Once the model is complete and can be inferred, Lookout for Equipment provides real-time analysis.

With the equipment data being published to S3, the user can scheduled inference that ranges from 5 minutes to one hour. When the user data arrives in S3, Lookout for Equipment fetches the new data on the desired schedule, performs data inference, and stores the results in another S3 bucket.

Set up Lookout for Equipment with these simply steps:

  1. Upload data to S3 buckets
  2. Create datasets
  3. Ingest data
  4. Create a model
  5. Schedule inference (if you need real-time analysis)

1. Upload data
You need to upload tag data from equipment to any S3 bucket.

2. Create Datasets

Select Create dataset, and set Dataset name, and set Data Schema. Data schema is like a data design document that defines the data to be fed in later. Then select Create.

creating datasets console

3. Ingest data
After a dataset is created, the next step is to ingest data. If you are familiar with Amazon Personalize or Amazon Forecast, doesn’t this screen feel familiar? Yes, Lookout for Equipment is as easy to use as those are.

Select Ingest data.

Ingesting data consoleSpecify the S3 bucket location where you uploaded your data, and an IAM role. The IAM role has to have a trust relationship to “lookoutequipment.amazonaws.com” You can use the following policy file for the test.

{
  "Version": "2012-10-17",
  "Statement": [
    {
      "Effect": "Allow",
      "Principal": {
        "Service": "lookoutequipment.amazonaws.com"
      },
      "Action": "sts:AssumeRole"
    }
  ]
}

The data format in the S3 bucket has to match the Data Schema you set up in step 2. Please check our technical documents for more detail. Ingesting data takes a few minutes to tens of minutes depending on your data volume.

4. Create a model
After data ingest is completed, you can train your own ML model now. Select Create new model. Fields show us a list of fields in the ingested data. By default, no field is selected. You can select fields you want Lookout for Equipment to learn. Lookout for Equipment automatically finds and trains correlations from multiple specified fields and creates a model.

Image illustrates setting up fields.

If you are sure that your data has some unusual data included, you can optionally set the windows to exclude that data.

setting up maintenance windowOptionally, you can divide ingested data for training and then for evaluation. The data specified during the evaluation period is checked compared to the trained model.

setting up evaluation window

Once you select Create, Lookout for Equipment starts to train your model. This process takes minutes to hours depending on your data volume. After training is finished, you can evaluate your model with the evaluation period data.

model performance console

5. Schedule Inference
Now it is time to analyze your real time data. Select Schedule Inference, and set up your S3 buckets for input.

setting up input S3 bucket

You can also set Data upload frequency, which is actually the same as inferencing frequency, and Offset delay time. Then, you need to set up Output data as Lookout for Equipment outputs the result of inference.

setting up inferenced output S3 bucket

Amazon Lookout for Equipment is In Preview Today
Amazon Lookout for Equipment is in preview today at US East (N. Virginia), Asia Pacific (Seoul), and Europe (Ireland) and you can see the documentation here.

– Kame

Amazon Monitron, a Simple and Cost-Effective Service Enabling Predictive Maintenance

Post Syndicated from Julien Simon original https://aws.amazon.com/blogs/aws/amazon-monitron-a-simple-cost-effective-service-enabling-predictive-maintenance/

Today, I’m extremely happy to announce Amazon Monitron, a condition monitoring service that detects potential failures and allows user to track developing faults enabling you to implement predictive maintenance and reduce unplanned downtime.

True story: A few months ago, I bought a new washing machine. As the delivery man was installing it in my basement, we were chatting about how unreliable these things seemed to be nowadays; never lasting more than a few years. As the gentleman made his way out, I pointed to my aging and poorly maintained water heater, telling him that I had decided to replace it in the coming weeks and that he’d be back soon to install a new one. Believe it or not, it broke down the next day. You can laugh at me, it’s OK. I deserve it for not planning ahead.

As annoying as this minor domestic episode was, it’s absolutely nothing compared to the tremendous loss of time and money caused by the unexpected failure of machines located in industrial environments, such as manufacturing production lines and warehouses. Any proverbial grain of sand can cause unplanned outages, and Murphy’s Law has taught us that they’re likely to happen in the worst possible configuration and at the worst possible time, resulting in severe business impacts.

To avoid breakdowns, reliability managers and maintenance technicians often combine three strategies:

  1. Run to failure: where equipment is operated without maintenance until it no longer operates reliably. When the repair is completed, equipment is returned to service; however, the condition of the equipment is unknown and failure is uncontrolled.
  2. Planned maintenance: where predefined maintenance activities are performed on a periodic or meter basis, regardless of condition. The effectiveness of planned maintenance activities is dependent on the quality of the maintenance instructions and planned cycle. It risks equipment being both over- and under-maintained, incurring unnecessary cost or still experiencing breakdowns.
  3. Condition-based maintenance: where maintenance is completed when the condition of a monitored component breaches a defined threshold. Monitoring physical characteristics such as tolerance, vibration or temperature is a more optimal strategy, requiring less maintenance and reducing maintenance costs.
  4. Predictive maintenance: where the condition of components is monitored, potential failures detected and developing faults tracked. Maintenance is planned at a time in the future prior to expected failure and when the total cost of maintenance is most cost-effective.

Condition-based maintenance and predictive maintenance require sensors to be installed on critical equipment. These sensors measure and capture physical quantities such as temperature and vibration, whose change is a leading indicator of a potential failure or a deteriorating condition.

As you can guess, building and deploying such maintenance systems can be a long, complex, and costly project involving bespoke hardware, software, infrastructure, and processes. Our customers asked us for help, and we got to work.

Introducing Amazon Monitron
Amazon Monitron is an easy and cost-effective condition monitoring service that allows you to monitor the condition of equipment in your facilities, enabling the implementation of a predictive maintenance program.

Illustration

Setting up Amazon Monitron is extremely simple. You first install Monitron sensors that capture vibration and temperature data from rotating machines, such as bearings, gearboxes, motors, pumps, compressors, and fans. Sensors send vibration and temperature measurements hourly to a nearby Monitron gateway, using Bluetooth Low Energy (BLE) technology allowing the sensors to run for at least three years. The Monitron gateway is itself connected to your WiFi network, and sends sensor data to AWS, where it is stored and analyzed using machine learning and ISO 20816 vibration standards.

As communication is infrequent, up to 20 sensors can be connected to a single gateway, which can be located up to 30 meters away (depending on potential interference). Thanks to the scalability and cost efficiency of Amazon Monitron, you can deploy as many sensors as you need, including on pieces of equipment that until now weren’t deemed critical enough to justify the cost of traditional sensors. As with any data-driven application, security is our No. 1 priority. The Monitron service authenticates the gateway and the sensors to make sure that they’re legitimate. Data is also encrypted end-to-end, without any decryption taking place on the gateway.

Setting up your gateways and sensors only requires installing the Monitron mobile application on an Android mobile device with Bluetooth support for gateway setup, and NFC support for sensor setup. This is an extremely simple process, and you’ll be monitoring in minutes. Technicians will also use the mobile application to receive alerts indicating abnormal machine conditions. They can acknowledge these alerts and provide feedback to improve their accuracy (say, to minimize false alerts and missed anomalies).

Customers are already using Amazon Monitron today, and here are a couple of examples.

Fender Musical Instruments Corporation is an iconic brand and a leading manufacturer of stringed instruments and amplifiers. Here’s what Bill Holmes, Global Director of Facilities at Fender, told us: “Over the past year we have partnered with AWS to help develop a critical but sometimes overlooked part of running a successful manufacturing business which is knowing the condition of your equipment. For manufacturers worldwide, uptime of equipment is the only way we can remain competitive with a global market. Ensuring equipment is up and running and not being surprised by sudden breakdowns helps get the most out of our equipment. Unplanned downtime is costly both in loss of production and labor due to the firefighting nature of the breakdown. The Amazon Monitron condition monitoring system has the potential of giving both large industry as well as small ‘mom and pop shops’ the ability to predict failures of their equipment before a catastrophic breakdown shuts them down. This will allow for a scheduled repair of failing equipment before it breaks down.

GE Gas Power is a leading provider of power generation equipment, solutions and services. It operates many manufacturing sites around the world, in which much of the manufacturing equipment is not connected nor monitored for health. Magnus Akesson, CIO at GE Gas Power Manufacturing says: “Naturally, we can reduce both maintenance costs and downtime, if we can easily and cheaply connect and monitor these assets at scale. Additionally, we want to take advantage of advanced algorithms to look forward, to know not just the current state but also predict future health and to detect abnormal behaviors. This will allow us to transition from time-based to predictive and prescriptive maintenance practices. Using Amazon Monitron, we are now able to quickly retrofit our assets with sensors and connecting them to real- time analytics in the AWS cloud. We can do this without having to require deep technical skills or having to configure our own IT and OT networks. From our initial work on vibration-prone tumblers, we are seeing this vision come to life at an amazing speed: the ease-of-use for the operators and maintenance team, the simplicity, and the ability to implement at scale is extremely attractive to GE. During our pilot, we were also delighted to see one-click capabilities for updating the sensors via remote Over the Air (OTA) firmware upgrades, without having to physically touch the sensors. As we grow in scale, this is a critical capability in order to be able to support and maintain the fleet of sensors.

Now, let me show you how to get started with Amazon Monitron.

Setting up Amazon Monitron
First, I open the Monitron console. In just a few clicks, I create a project, and an administrative user allowed to manage it. Using a link provided in the console, I download and install the Monitron mobile application on my Android phone. Opening the app, I log in using my administrative credentials.

The first step is to create a site describing assets, sensors, and gateways. I name it “my-thor-project.”

Application screenshot

Let’s add a gateway. Enabling BlueTooth on my phone, I press the pairing button on the gateway.

Application screenshot

The name of the gateway appears immediately.

Application screenshot

I select the gateway, and I configure it with my WiFi credentials to let it connect to AWS. A few seconds later, the gateway is online.

Application screenshot

My next step is to create an asset that I’d like to monitor, say a process water pump set, with a motor and a pump that I would like to monitor. I first create the asset itself, simply defining its name, and the appropriate ISO 20816 class (a standard for measurement and evaluation of machine vibration).

Application screenshot

Then, I add a sensor for the motor.

Application screenshot

I start by physically attaching the sensor to the motor using the suggested adhesive. Next, I specify a sensor position, enable the NFC on my smartphone, and tap the Monitron sensor that I attached to the motor with my phone. Within seconds, the sensor is commissioned.

Application screenshot

I repeat the same operation for the pump. Looking at my asset, I see that both sensors are operational.

Application screenshot

They are now capturing temperature and vibration information. Although there isn’t much to see for the moment, graphs are available in the mobile app.

Application screenshot

Over time, the gateway will keep sending this data securely to AWS, where it will be analyzed for early signs of failure. Should either of my assets exhibit these, I would receive an alert in the mobile application, where I could visualize historical data, and decide what the best course of action would be.

Getting Started
As you can see, Monitron makes it easy to deploy sensors enabling predictive maintenance applications. The service is available today in the US East (N. Virginia) region, and using it costs $50 per sensor per year.

If you’d like to evaluate the service, the Monitron Starter Kit includes everything you need (a gateway with a mounting kit, five sensors, and a power supply), and it’s available for $715. Then, you can scale your deployment with additional sensors, which you can buy in 5-packs for $575.

Starter kit picture

Give Amazon Monitron a try, and let us know what you think. We’re always looking forward to your feedback, either through your usual AWS support contacts, or on the AWS Forum for Monitron.

– Julien

Special thanks to my colleague Dave Manley for taking the time to educate me on industrial maintenance operations.

New- Amazon DevOps Guru Helps Identify Application Errors and Fixes

Post Syndicated from Harunobu Kameda original https://aws.amazon.com/blogs/aws/amazon-devops-guru-machine-learning-powered-service-identifies-application-errors-and-fixes/

Today, we are announcing Amazon DevOps Guru, a fully managed operations service that makes it easy for developers and operators to improve application availability by automatically detecting operational issues and recommending fixes. DevOps Guru applies machine learning informed by years of operational excellence from Amazon.com and Amazon Web Services (AWS) to automatically collect and analyze data such as application metrics, logs, and events to identify behavior that deviates from normal operational patterns.

Once a behavior is identified as an operational problem or risk, DevOps Guru alerts developers and operators to the details of the problem so they can quickly understand the scope of the problem and possible causes. DevOps Guru provides intelligent recommendations for fixing problems, saving you time resolving them. With DevOps Guru, there is no hardware or software to deploy, and you only pay for the data analyzed; there is no upfront cost or commitment.

Distributed/Complex Architecture and Operational Excellence
As applications become more distributed and complex, operators need more automated practices to maintain application availability and reduce the time and effort spent on detecting, debugging, and resolving operational issues. Application downtime, for example, as caused by misconfiguration, unbalanced container clusters, or resource depletion, can result in significant revenue loss to an enterprise.

In many cases, companies must invest developer time in deploying and managing multiple monitoring tools, such as metrics, logs, traces, and events, and storing them in various locations for analysis. Developers or operators also spend time developing and maintaining custom alarms to alert them to issues such as sudden spikes in load balancer errors or unusual drops in application request rates. When a problem occurs, operators receive multiple alerts related to the same issue and spend time combining alerts to prioritize those that need immediate attention.

How DevOps Guru Works
The DevOps Guru machine learning models leverages AWS expertise in running highly available applications for the world’s largest e-commerce business for the past 20 years. DevOps Guru automatically detects operational problems, details the possible causes, and recommends remediation actions. DevOps Guru provides customers with a single console experience to search and visualize operational data by integrating data across multiple sources supporting Amazon CloudWatch, AWS Config, AWS CloudTrail, AWS CloudFormation, and AWS X-Ray and reduces the need to use multiple tools.

Getting Started with DevOps Guru
Activating DevOps Guru is as easy as accessing the AWS Management Console and clicking Enable. When enabling DevOps Guru, you can select the IAM role. You’ll then choose the AWS resources to analyze, which may include all resources in your AWS account or just specified CloudFormation StackSets. Finally, you can set an Amazon SNS topic if you want to send notifications from DevOps Guru via SNS.

DevOps Guru starts to accumulate logs and analyze your environment; it can take up to several hours. Let’s assume we have a simple serverless architecture as shown in this illustration.

When the system has an error, the operator needs to investigate if the error came from Amazon API Gateway, AWS Lambda, or AWS DynamoDB. They must then determine the root cause and how to fix the issue. With DevOps Guru, the process is now easy and simple.

When a developer accesses the management console of DevOps Guru, they will see a list of insights which is a collection of anomalies that are created during the analysis of the AWS resources configured within your application. In this case, Amazon API Gateway, AWS Lambda, and Amazon DynamoDB. Each insight contains observations, recommendations, and contextual data you can use to better understand and resolve the operational problem.

The list below shows the insight name, the status (closed or ongoing), severity, and when the insight was created. Without checking any logs, you can immediately see that in the most recent issue (line1), a problem with a Lambda function within your stack was the cause of the issue, and it was related to duration. If the issue was still occurring, the status would be listed as Ongoing. Since this issue was temporary, the status is showing Closed.

Insights

Let’s look deeper at the most recent anomaly by clicking through the first insight link. There are two tabs: Aggregated metrics and Graphed anomalies.

Aggregated metrics display metrics that are related to the insight. Operators can see which AWS CloudFormation stack created the resource that emitted the metric, the name of the resource, and its type. The red lines on a timeline indicate spans of time when a metric emitted unusual values. In this case, the operator can see the specific time of day on Nov 24 when the anomaly occurred for each metric.

Graphed anomalies display detailed graphs for each of the insight’s anomalies. Operators can investigate and look at an anomaly at the resource level and per statistic. The graphs are grouped by metric name.

metrics

By reviewing aggregated and graphed anomalies, an operator can see when the issue occurred, whether it is still ongoing, as well as the resources impacted. It appears the increased Lambda duration had a corresponding impact on API Gateway causing timeouts and resulted in 5XX errors in API Gateway.

Dev Ops Guru also provides Relevant events which are related to activities that changed your application’s configuration as illustrated below.

Events

We can now see that a configuration change happened 2 hours before this issue occurred. If we click the point on the graph at 20:30 on 11/24, we can learn more and see the details of that change.

If you click through to the Ops event, the AWS CloudTrail logs would show that the configuration change was twofold: 1) a change in the concurrency provisioned capacity on a Lambda function and 2) the reduction in the integration timeout on an API integration latency.

recommendations to fix

The recommendations tell the operator to evaluate the provisioned concurrency for Lambda and how to troubleshoot errors in API Gateway. After further evaluation, the operator will discover this is exactly correct. The root cause is a mismatch between the Lambda provisioned concurrency setting and the API Gateway integration latency timeout. When the Lambda configuration was updated in the last deployment, it altered how this application responded to burst traffic, and it no longer fit within the API Gateway timeout window. This error is unlikely to have been found in unit testing and will occur repeatedly if the configurations are not updated.

DevOps Guru can send alerts of anomalies to operators via Amazon SNS, and it is integrated with AWS Systems Manager OpsCenter, enabling customers to receive insights directly within OpsCenter as quickly diagnose and remediate issues.

Available for Preview Today
Amazon DevOps Guru is available for preview in US East (N. Virginia), US East (Ohio), US West (Oregon), Europe (Ireland), and Asia Pacific (Tokyo). To learn more about DevOps Guru, please visit our web site and technical documentation, and get started today.

– Kame


Majority of Alexa Now Running on Faster, More Cost-Effective Amazon EC2 Inf1 Instances

Post Syndicated from Sébastien Stormacq original https://aws.amazon.com/blogs/aws/majority-of-alexa-now-running-on-faster-more-cost-effective-amazon-ec2-inf1-instances/

Today, we are announcing that the Amazon Alexa team has migrated the vast majority of their GPU-based machine learning inference workloads to Amazon Elastic Compute Cloud (EC2) Inf1 instances, powered by AWS Inferentia. This resulted in 25% lower end-to-end latency, and 30% lower cost compared to GPU-based instances for Alexa’s text-to-speech workloads. The lower latency allows Alexa engineers to innovate with more complex algorithms and to improve the overall Alexa experience for our customers.

AWS built AWS Inferentia chips from the ground up to provide the lowest-cost machine learning (ML) inference in the cloud. They power the Inf1 instances that we launched at AWS re:Invent 2019. Inf1 instances provide up to 30% higher throughput and up to 45% lower cost per inference compared to GPU-based G4 instances, which were, before Inf1, the lowest-cost instances in the cloud for ML inference.

Alexa is Amazon’s cloud-based voice service that powers Amazon Echo devices and more than 140,000 models of smart speakers, lights, plugs, smart TVs, and cameras. Today customers have connected more than 100 million devices to Alexa. And every month, tens of millions of customers interact with Alexa to control their home devices (“Alexa, increase temperature in living room,” “Alexa, turn off bedroom’“), to listen to radios and music (“Alexa, start Maxi 80 on bathroom,” “Alexa, play Van Halen from Spotify“), to be informed (“Alexa, what is the news?” “Alexa, is it going to rain today?“), or to be educated, or entertained with 100,000+ Alexa Skills.

If you ask Alexa where she lives, she’ll tell you she is right here, but her head is in the cloud. Indeed, Alexa’s brain is deployed on AWS, where she benefits from the same agility, large-scale infrastructure, and global network we built for our customers.

How Alexa Works
When I’m in my living room and ask Alexa about the weather, I trigger a complex system. First, the on-device chip detects the wake word (Alexa). Once detected, the microphones record what I’m saying and stream the sound for analysis in the cloud. At a high level, there are two phases to analyze the sound of my voice. First, Alexa converts the sound to text. This is known as Automatic Speech Recognition (ASR). Once the text is known, the second phase is to understand what I mean. This is Natural Language Understanding (NLU). The output of NLU is an Intent (what does the customer want) and associated parameters. In this example (“Alexa, what’s the weather today ?”), the intent might be “GetWeatherForecast” and the parameter can be my postcode, inferred from my profile.

This whole process uses Artificial Intelligence heavily to transform the sound of my voice to phonemes, phonemes to words, words to phrases, phrases to intents. Based on the NLU output, Alexa routes the intent to a service to fulfill it. The service might be internal to Alexa or external, like one of the skills activated on my Alexa account. The fulfillment service processes the intent and returns a response as a JSON document. The document contains the text of the response Alexa must say.

The last step of the process is to generate the voice of Alexa from the text. This is known as Text-To-Speech (TTS). As soon as the TTS starts to produce sound data, it is streamed back to my Amazon Echo device: “The weather today will be partly cloudy with highs of 16 degrees and lows of 8 degrees.” (I live in Europe, these are Celsius degrees 🙂 ). This Text-To-Speech process also heavily involves machine learning models to build a phrase that sounds natural in terms of pronunciations, rhythm, connection between words, intonation etc.

Alexa is one of the most popular hyperscale machine learning services in the world, with billions of inference requests every week. Of Alexa’s three main inference workloads (ASR, NLU, and TTS), TTS workloads initially ran on GPU-based instances. But the Alexa team decided to move to the Inf1 instances as fast as possible to improve the customer experience and reduce the service compute cost.

What is AWS Inferentia?
AWS Inferentia is a custom chip, built by AWS, to accelerate machine learning inference workloads and optimize their cost. Each AWS Inferentia chip contains four NeuronCores. Each NeuronCore implements a high-performance systolic array matrix multiply engine, which massively speeds up typical deep learning operations such as convolution and transformers. NeuronCores are also equipped with a large on-chip cache, which helps cut down on external memory accesses, dramatically reducing latency and increasing throughput.

AWS Inferentia can be used natively from popular machine-learning frameworks like TensorFlow, PyTorch, and MXNet, with AWS Neuron. AWS Neuron is a software development kit (SDK) for running machine learning inference using AWS Inferentia chips. It consists of a compiler, run-time, and profiling tools that enable you to run high-performance and low latency inference.

Who Else is Using Amazon EC2 Inf1?
In addition to Alexa, Amazon Rekognition is also adopting AWS Inferentia. Running models such as object classification on Inf1 instances resulted in 8x lower latency and doubled throughput compared to running these models on GPU instances.

Customers, from Fortune 500 companies to startups, are using Inf1 instances for machine learning inference. For example, Snap Inc.​ incorporates machine learning (ML) into many aspects of Snapchat, and exploring innovation in this field is a key priority for them. Once they heard about AWS Inferentia, they collaborated with AWS to adopt Inf1 instances to help with ML deployment, including around performance and cost. They started with their recommendation models inference, and are now looking forward to deploying more models on Inf1 instances in the future.

Conde Nast, one of the world’s leading media companies, saw a 72% reduction in cost of inference compared to GPU-based instances for its recommendation engine. And Anthem, one of the leading healthcare companies in the US, observed 2x higher throughput compared to GPU-based instances for its customer sentiment machine learning workload.

How to Get Started with Amazon EC2 Inf1
You can start using Inf1 instances today.

If you prefer to manage your own machine learning application development platforms, you can get started by either launching Inf1 instances with AWS Deep Learning AMIs, which include the Neuron SDK, or you can use Inf1 instances via Amazon Elastic Kubernetes Service or Amazon ECS for containerized machine learning applications. To learn more about running containers on Inf1 instances, read this blog to get started on ECS and this blog to get started on EKS.

The easiest and quickest way to get started with Inf1 instances is via Amazon SageMaker, a fully managed service that enables developers to build, train, and deploy machine learning models quickly.

Get started with Inf1 on Amazon SageMaker today.

— seb

PS: The team just released this video, check it out!

Improving customer experience and reducing cost with CodeGuru Profiler

Post Syndicated from Rajesh original https://aws.amazon.com/blogs/devops/improving-customer-experience-and-reducing-cost-with-codeguru-profiler/

Amazon CodeGuru is a set of developer tools powered by machine learning that provides intelligent recommendations for improving code quality and identifying an application’s most expensive lines of code. Amazon CodeGuru Profiler allows you to profile your applications in a low impact, always on manner. It helps you improve your application’s performance, reduce cost and diagnose application issues through rich data visualization and proactive recommendations. CodeGuru Profiler has been a very successful and widely used service within Amazon, before it was offered as a public service. This post discusses a few ways in which internal Amazon teams have used and benefited from continuous profiling of their production applications. These uses cases can provide you with better insights on how to reap similar benefits for your applications using CodeGuru Profiler.

Inside Amazon, over 100,000 applications currently use CodeGuru Profiler across various environments globally. Over the last few years, CodeGuru Profiler has served as an indispensable tool for resolving issues in the following three categories:

  1. Performance bottlenecks, high latency and CPU utilization
  2. Cost and Infrastructure utilization
  3. Diagnosis of an application impacting event

API latency improvement for CodeGuru Profiler

What could be a better example than CodeGuru Profiler using itself to improve its own performance?
CodeGuru Profiler offers an API called BatchGetFrameMetricData, which allows you to fetch time series data for a set of frames or methods. We noticed that the 99th percentile latency (i.e. the slowest 1 percent of requests over a 5 minute period) metric for this API was approximately 5 seconds, higher than what we wanted for our customers.

Solution

CodeGuru Profiler is built on a micro service architecture, with the BatchGetFrameMetricData API implemented as set of AWS Lambda functions. It also leverages other AWS services such as Amazon DynamoDB to store data and Amazon CloudWatch to record performance metrics.

When investigating the latency issue, the team found that the 5-second latency spikes were happening during certain time intervals rather than continuously, which made it difficult to easily reproduce and determine the root cause of the issue in pre-production environment. The new Lambda profiling feature in CodeGuru came in handy, and so the team decided to enable profiling for all its Lambda functions. The low impact, continuous profiling capability of CodeGuru Profiler allowed the team to capture comprehensive profiles over a period of time, including when the latency spikes occurred, enabling the team to better understand the issue.
After capturing the profiles, the team went through the flame graphs of one of the Lambda functions (TimeSeriesMetricsGeneratorLambda) and learned that all of its CPU time was spent by the thread responsible to publish metrics to CloudWatch. The following screenshot shows a flame graph during one of these spikes.

TimeSeriesMetricsGeneratorLambda taking 100% CPU

As seen, there is a single call stack visible in the above flame graph, indicating all the CPU time was taken by the thread invoking above code. This helped the team immediately understand what was happening. Above code was related to the thread responsible for publishing the CloudWatch metrics. This thread was publishing these metrics in a synchronized block and as this thread took most of the CPU, it caused all other threads to wait and the latency to spike. To fix the issue, the team simply changed the TimeSeriesMetricsGeneratorLambda Lambda code, to publish CloudWatch metrics at the end of the function, which eliminated contention of this thread with all other threads.

Improvement

After the fix was deployed, the 5 second latency spikes were gone, as seen in the following graph.

Latency reduction for BatchGetFrameMetricData API

Cost, infrastructure and other improvements for CAGE

CAGE is an internal Amazon retail service that does royalty aggregation for digital products, such as Kindle eBooks, MP3 songs and albums and more. Like many other Amazon services, CAGE is also customer of CodeGuru Profiler.

CAGE was experiencing latency delays and growing infrastructure cost, and wanted to reduce them. Thanks to CodeGuru Profiler’s always-on profiling capabilities, rich visualization and recommendations, the team was able to successfully diagnose the issues, determine the root cause and fix them.

Solution

With the help of CodeGuru Profiler, the CAGE team identified several reasons for their degraded service performance and increased hardware utilization:

  • Excessive garbage collection activity – The team reviewed the service flame graphs (see the following screenshot) and identified that a lot of CPU time was spent getting garbage collection activities, 65.07% of the total service CPU.

Excessive garbage collection activities for CAGE

  • Metadata overhead – The team followed CodeGuru Profiler recommendation to identify that the service’s DynamoDB responses were consuming higher CPU, 2.86% of total CPU time. This was due to the response metadata caching in the AWS SDK v1.x HTTP client that was turned on by default. This was causing higher CPU overhead for high throughput applications such as CAGE. The following screenshot shows the relevant recommendation.

Response metadata recommendation for CAGE

  • Excessive logging – The team also identified excessive logging of its internal Amazon ION structures. The team initially added this logging for debugging purposes, but was unaware of its impact on the CPU cost, taking 2.28% of the overall service CPU. The following screenshot is part of the flame graph that helped identify the logging impact.

Excessive logging in CAGE service

The team used these flame graphs and CodeGuru Profiler provided recommendations to determine the root cause of the issues and systematically resolve them by doing the following:

  • Switching to a more efficient garbage collector
  • Removing excessive logging
  • Disabling metadata caching for Dynamo DB response

Improvements

After making these changes, the team was able to reduce their infrastructure cost by 25%, saving close to $2600 per month. Service latency also improved, with a reduction in service’s 99th percentile latency from approximately 2,500 milliseconds to 250 milliseconds in their North America (NA) region as shown below.

CAGE Latency Reduction

The team also realized a side benefit of having reduced log verbosity and saw a reduction in log size by 55%.

Event Analysis of increased checkout latency for Amazon.com

During one of the high traffic times, Amazon retail customers experienced higher than normal latency on their checkout page. The issue was due to one of the downstream service’s API experiencing high latency and CPU utilization. While the team quickly mitigated the issue by increasing the service’s servers, the always-on CodeGuru Profiler came to the rescue to help diagnose and fix the issue permanently.

Solution

The team analyzed the flame graphs from CodeGuru Profiler at the time of the event and noticed excessive CPU consumption (69.47%) when logging exceptions using Log4j2. See the following screenshot taken from an earlier version of CodeGuru Profiler user interface.

Excessive CPU consumption when logging exceptions using Log4j2

With CodeGuru Profiler flame graph and other metrics, the team quickly confirmed that the issue was due to excessive exception logging using Log4j2. This downstream service had recently upgraded to Log4j2 version 2.8, in which exception logging could be expensive, due to the way Log4j2 handles class-loading of certain stack frames. Log4j 2.x versions enabled class loading by default, which was disabled in 1.x versions, causing the increased latency and CPU utilization. The team was not able to detect this issue in pre-production environment, as the impact was observable only in high traffic situations.

Improvement

After they understood the issue, the team successfully rolled out the fix, removing the unnecessary exception trace logging to fix the issue. Such performance issues and many others are proactively offered as CodeGuru Profiler recommendations, to ensure you can proactively learn about such issues with your applications and quickly resolve them.

Conclusion

I hope this post provided a glimpse into various ways CodeGuru Profiler can benefit your business and applications. To get started using CodeGuru Profiler, see Setting up CodeGuru Profiler.
For more information about CodeGuru Profiler, see the following:

Investigating performance issues with Amazon CodeGuru Profiler

Optimizing application performance with Amazon CodeGuru Profiler

Find Your Application’s Most Expensive Lines of Code and Improve Code Quality with Amazon CodeGuru


AI-Man: a handy guide to video game artificial intelligence

Post Syndicated from Ryan Lambie original https://www.raspberrypi.org/blog/ai-man-a-handy-guide-to-video-game-artificial-intelligence/

Discover how non-player characters make decisions by tinkering with this Unity-based Pac-Man homage. Paul Roberts wrote this for the latest issue of Wireframe magazine.

From the first video game to the present, artificial intelligence has been a vital part of the medium. While most early games had enemies that simply walked left and right, like the Goombas in Super Mario Bros., there were also games like Pac-Man, where each ghost appeared to move intelligently. But from a programming perspective, how do we handle all the different possible states we want our characters to display?

Here’s AI-Man, our homage to a certain Namco maze game. You can switch between AI types to see how they affect the ghosts’ behaviours.

For example, how do we control whether a ghost is chasing Pac-Man, or running away, or even returning to their home? To explore these behaviours, we’ll be tinkering with AI-Man – a Pac-Man-style game developed in Unity. It will show you how the approaches discussed in this article are implemented, and there’s code available for you to modify and add to. You can freely download the AI-Man project here. One solution to managing the different states a character can be in, which has been used for decades, is a finite state machine, or FSM for short. It’s an approach that describes the high-level actions of an agent, and takes its name simply from the fact that there are a finite number of states from which to transition between, with each state only ever doing one thing.

Altered states

To explain what’s meant by high level, let’s take a closer look at the ghosts in Pac-Man. The highlevel state of a ghost is to ‘Chase’ Pac-Man, but the low level is how the ghost actually does this. In Pac-Man, each ghost has its own behaviour in which it hunts the player down, but they’re all in the same high-level state of ‘Chase’. Looking at Figure 1, you can see how the overall behaviour of a ghost can be depicted extremely easily, but there’s a lot of hidden complexity. At what point do we transition between states? What are the conditions on moving between states across the connecting lines? Once we have this information, the diagram can be turned into code with relative ease. You could use simple switch statements to achieve this, or we could achieve the same using an object-oriented approach.

Figure 1: A finite state machine

Using switch statements can quickly become cumbersome the more states we add, so I’ve used the object-oriented approach in the accompanying project, and an example code snippet can be seen in Code Listing 1. Each state handles whether it needs to transition into another state, and lets the state machine know. If a transition’s required, the Exit() function is called on the current state, before calling the Enter() function on the new state. This is done to ensure any setup or cleanup is done, after which the Update() function is called on whatever the current state is. The Update()function is where the low-level code for completing the state is processed. For a project as simple as Pac-Man, this only involves setting a different position for the ghost to move to.

Hidden complexity

Extending this approach, it’s reasonable for a state to call multiple states from within. This is called a hierarchical finite state machine, or HFSM for short. An example is an agent in Call of Duty: Strike Team being instructed to seek a stealthy position, so the high-level state is ‘Find Cover’, but within that, the agent needs to exit the dumpster he’s currently hiding in, find a safe location, calculate a safe path to that location, then repeatedly move between points on that path until he reaches the target position.

FSMs can appear somewhat predictable as the agent will always transition into the same state. This can be accommodated for by having multiple options that achieve the same goal. For example, when the ghosts in our Unity project are in the ‘Chase’ state, they can either move to the player, get in front of the player, or move to a position behind the player. There’s also an option to move to a random position. The FSM implemented has each ghost do one of these, whereas the behaviour tree allows all ghosts to switch between the options every ten seconds. A limitation of the FSM approach is that you can only ever be in a single state at a particular time. Imagine a tank battle game where multiple enemies can be engaged. Simply being in the ‘Retreat’ state doesn’t look smart if you’re about to run into the sights of another enemy. The worst-case scenario would be our tank transitions between ‘Attack’ and ‘Retreat’ states on each frame – an issue known as state thrashing – and gets stuck, and seemingly confused about what to do in this situation. What we need is away to be in multiple states at the same time: ideally retreating from tank A, whilst attacking tank B. This is where fuzzy finite state machines, or FFSM for short, come in useful.

This approach allows you to be in a particular state to a certain degree. For example, my tank could be 80% committed to the Retreat state (avoid tank A), and 20% committed to the Attack state (attack tank B). This allows us to both Retreat and Attack at the same time. To achieve this, on each update, your agent needs to check each possible state to determine its degree of commitment, and then call each of the active states’ updates. This differs from a standard FSM, where you can only ever be in a single state. FFSMs can be in none, one, two, or however many states you like at one time. This can prove tricky to balance, but it does offer an alternative to the standard approach.

No memory

Another potential issue with an FSM is that the agent has no memory of what they were previously doing. Granted, this may not be important: in the example given, the ghosts in Pac-Man don’t care about what they were doing, they only care about what they are doing, but in other games, memory can be extremely important. Imagine instructing a character to gather wood in a game like Age of Empires, and then the character gets into a fight. It would be extremely frustrating if the characters just stood around with nothing to do after the fight had concluded, and for the player to have to go back through all these characters and reinstruct them after the fight is over. It would be much better for the characters to return to their previous duties.

“FFSMs can be in one, none,

two, or however many states

you like.”

We can incorporate the idea of memory quite easily by using the stack data structure. The stack will hold AI states, with only the top-most element receiving the update. This in effect means that when a state is completed, it’s removed from the stack and the previous state is then processed. Figure 2 depicts how this was achieved in our Unity project. To differentiate the states from the FSM approach, I’ve called them tasks for the stackbased implementation. Looking at Figure 2, it shows how (from the bottom), the ghost was chasing the player, then the player collected a power pill, which resulted in the AI adding an Evade_Task – this now gets the update call, not the Chase_Task. While evading the player, the ghost was then eaten.

At this point, the ghost needed to return home, so the appropriate task was added. Once home, the ghost needed to exit this area, so again, the relevant task was added. At the point the ghost exited home, the ExitHome_Task was removed, which drops processing back to MoveToHome_Task. This was no longer required, so it was also removed. Back in the Evade_Task, if the power pill was still active, the ghost would return to avoiding the player, but if it had worn off, this task, in turn, got removed, putting the ghost back in its default task of Chase_Task, which will get the update calls until something else in the world changes.

Figure 2: Stack-based finite state machine.

Behaviour trees

In 2002, Halo 2 programmer Damian Isla expanded on the idea of HFSM in a way that made it more scalable and modular for the game’s AI. This became known as the behaviour tree approach. It’s now a staple in AI game development. The behaviour tree is made up of nodes, which can be one of three types – composite, decorator, or leaf nodes. Each has a different function within the tree and affects the flow through the tree. Figure 3 shows how this approach is set up for our Unity project. The states we’ve explored so far are called leaf nodes. Leaf nodes end a particular branch of the tree and don’t have child nodes – these are where the AI behaviours are located. For example, Leaf_ExitHome, Leaf_Evade, and Leaf_ MoveAheadOfPlayer all tell the ghost where to move to. Composite nodes can have multiple child nodes and are used to determine the order in which the children are called. This could be in the order in which they’re described by the tree, or by selection, where the children nodes will compete, with the parent node selecting which child node gets the go-ahead. Selector_Chase allows the ghost to select a single path down the tree by choosing a random option, whereas Sequence_ GoHome has to complete all the child paths to complete its behaviour.

Code Listing 2 shows how simple it is to choose a random behaviour to use – just be sure to store the index for the next update. Code Listing 3 demonstrates how to go through all child nodes, and to return SUCCESS only when all have completed, otherwise the status RUNNING is returned. FAILURE only gets returned when a child node itself returns a FAILURE status.

Complex behaviours

Although not used in our example project, behaviour trees can also have nodes called decorators. A decorator node can only have a single child, and can modify the result returned. For example, a decorator may iterate the child node for a set period, perhaps indefinitely, or even flip the result returned from being a success to a failure. From what first appears to be a collection of simple concepts, complex behaviours can then develop.

Figure 3: Behaviour tree

Video game AI is all about the illusion of intelligence. As long as the characters are believable in their context, the player should maintain their immersion in the game world and enjoy the experience we’ve made. Hopefully, the approaches introduced here highlight how even simple approaches can be used to develop complex characters. This is just the tip of the iceberg: AI development is a complex subject, but it’s also fun and rewarding to explore.

Wireframe #43, with the gorgeous Sea of Stars on the cover.

The latest issue of Wireframe Magazine is out now. available in print from the Raspberry Pi Press onlinestore, your local newsagents, and the Raspberry Pi Store, Cambridge.

You can also download the PDF directly from the Wireframe Magazine website.

The post AI-Man: a handy guide to video game artificial intelligence appeared first on Raspberry Pi.

Amazon SageMaker Continues to Lead the Way in Machine Learning and Announces up to 18% Lower Prices on GPU Instances

Post Syndicated from Julien Simon original https://aws.amazon.com/blogs/aws/amazon-sagemaker-leads-way-in-machine-learning/

Since 2006, Amazon Web Services (AWS) has been helping millions of customers build and manage their IT workloads. From startups to large enterprises to public sector, organizations of all sizes use our cloud computing services to reach unprecedented levels of security, resiliency, and scalability. Every day, they’re able to experiment, innovate, and deploy to production in less time and at lower cost than ever before. Thus, business opportunities can be explored, seized, and turned into industrial-grade products and services.

As Machine Learning (ML) became a growing priority for our customers, they asked us to build an ML service infused with the same agility and robustness. The result was Amazon SageMaker, a fully managed service launched at AWS re:Invent 2017 that provides every developer and data scientist with the ability to build, train, and deploy ML models quickly.

Today, Amazon SageMaker is helping tens of thousands of customers in all industry segments build, train and deploy high quality models in production: financial services (Euler Hermes, Intuit, Slice Labs, Nerdwallet, Root Insurance, Coinbase, NuData Security, Siemens Financial Services), healthcare (GE Healthcare, Cerner, Roche, Celgene, Zocdoc), news and media (Dow Jones, Thomson Reuters, ProQuest, SmartNews, Frame.io, Sportograf), sports (Formula 1, Bundesliga, Olympique de Marseille, NFL, Guiness Six Nations Rugby), retail (Zalando, Zappos, Fabulyst), automotive (Atlas Van Lines, Edmunds, Regit), dating (Tinder), hospitality (Hotels.com, iFood), industry and manufacturing (Veolia, Formosa Plastics), gaming (Voodoo), customer relationship management (Zendesk, Freshworks), energy (Kinect Energy Group, Advanced Microgrid Systems), real estate (Realtor.com), satellite imagery (Digital Globe), human resources (ADP), and many more.

When we asked our customers why they decided to standardize their ML workloads on Amazon SageMaker, the most common answer was: “SageMaker removes the undifferentiated heavy lifting from each step of the ML process.” Zooming in, we identified five areas where SageMaker helps them most.

#1 – Build Secure and Reliable ML Models, Faster
As many ML models are used to serve real-time predictions to business applications and end users, making sure that they stay available and fast is of paramount importance. This is why Amazon SageMaker endpoints have built-in support for load balancing across multiple AWS Availability Zones, as well as built-in Auto Scaling to dynamically adjust the number of provisioned instances according to incoming traffic.

For even more robustness and scalability, Amazon SageMaker relies on production-grade open source model servers such as TensorFlow Serving, the Multi-Model Server, and TorchServe. A collaboration between AWS and Facebook, TorchServe is available as part of the PyTorch project, and makes it easy to deploy trained models at scale without having to write custom code.

In addition to resilient infrastructure and scalable model serving, you can also rely on Amazon SageMaker Model Monitor to catch prediction quality issues that could happen on your endpoints. By saving incoming requests as well as outgoing predictions, and by comparing them to a baseline built from a training set, you can quickly identify and fix problems like missing features or data drift.

Says Aude Giard, Chief Digital Officer at Veolia Water Technologies: “In 8 short weeks, we worked with AWS to develop a prototype that anticipates when to clean or change water filtering membranes in our desalination plants. Using Amazon SageMaker, we built a ML model that learns from previous patterns and predicts the future evolution of fouling indicators. By standardizing our ML workloads on AWS, we were able to reduce costs and prevent downtime while improving the quality of the water produced. These results couldn’t have been realized without the technical experience, trust, and dedication of both teams to achieve one goal: an uninterrupted clean and safe water supply.” You can learn more in this video.

#2 – Build ML Models Your Way
When it comes to building models, Amazon SageMaker gives you plenty of options. You can visit AWS Marketplace, pick an algorithm or a model shared by one of our partners, and deploy it on SageMaker in just a few clicks. Alternatively, you can train a model using one of the built-in algorithms, or your own code written for a popular open source ML framework (TensorFlow, PyTorch, and Apache MXNet), or your own custom code packaged in a Docker container.

You could also rely on Amazon SageMaker AutoPilot, a game-changing AutoML capability. Whether you have little or no ML experience, or you’re a seasoned practitioner who needs to explore hundreds of datasets, SageMaker AutoPilot takes care of everything for you with a single API call. It automatically analyzes your dataset, figures out the type of problem you’re trying to solve, builds several data processing and training pipelines, trains them, and optimizes them for maximum accuracy. In addition, the data processing and training source code is available in auto-generated notebooks that you can review, and run yourself for further experimentation. SageMaker Autopilot also now creates machine learning models up to 40% faster with up to 200% higher accuracy, even with small and imbalanced datasets.

Another popular feature is Automatic Model Tuning. No more manual exploration, no more costly grid search jobs that run for days: using ML optimization, SageMaker quickly converges to high-performance models, saving you time and money, and letting you deploy the best model to production quicker.

NerdWallet relies on data science and ML to connect customers with personalized financial products“, says Ryan Kirkman, Senior Engineering Manager. “We chose to standardize our ML workloads on AWS because it allowed us to quickly modernize our data science engineering practices, removing roadblocks and speeding time-to-delivery. With Amazon SageMaker, our data scientists can spend more time on strategic pursuits and focus more energy where our competitive advantage is—our insights into the problems we’re solving for our users.” You can learn more in this case study.
Says Tejas Bhandarkar, Senior Director of Product, Freshworks Platform: “We chose to standardize our ML workloads on AWS because we could easily build, train, and deploy machine learning models optimized for our customers’ use cases. Thanks to Amazon SageMaker, we have built more than 30,000 models for 11,000 customers while reducing training time for these models from 24 hours to under 33 minutes. With SageMaker Model Monitor, we can keep track of data drifts and retrain models to ensure accuracy. Powered by Amazon SageMaker, Freddy AI Skills is constantly-evolving with smart actions, deep-data insights, and intent-driven conversations.

#3 – Reduce Costs
Building and managing your own ML infrastructure can be costly, and Amazon SageMaker is a great alternative. In fact, we found out that the total cost of ownership (TCO) of Amazon SageMaker over a 3-year horizon is over 54% lower compared to other options, and developers can be up to 10 times more productive. This comes from the fact that Amazon SageMaker manages all the training and prediction infrastructure that ML typically requires, allowing teams to focus exclusively on studying and solving the ML problem at hand.

Furthermore, Amazon SageMaker includes many features that help training jobs run as fast and as cost-effectively as possible: optimized versions of the most popular machine learning libraries, a wide range of CPU and GPU instances with up to 100GB networking, and of course Managed Spot Training which lets you save up to 90% on your training jobs. Last but not least, Amazon SageMaker Debugger automatically identifies complex issues developing in ML training jobs. Unproductive jobs are terminated early, and you can use model information captured during training to pinpoint the root cause.

Amazon SageMaker also helps you slash your prediction costs. Thanks to Multi-Model Endpoints, you can deploy several models on a single prediction endpoint, avoiding the extra work and cost associated with running many low-traffic endpoints. For models that require some hardware acceleration without the need for a full-fledged GPU, Amazon Elastic Inference lets you save up to 90% on your prediction costs. At the other end of the spectrum, large-scale prediction workloads can rely on AWS Inferentia, a custom chip designed by AWS, for up to 30% higher throughput and up to 45% lower cost per inference compared to GPU instances.

Lyft, one of the largest transportation networks in the United States and Canada, launched its Level 5 autonomous vehicle division in 2017 to develop a self-driving system to help millions of riders. Lyft Level 5 aggregates over 10 terabytes of data each day to train ML models for their fleet of autonomous vehicles. Managing ML workloads on their own was becoming time-consuming and expensive. Says Alex Bain, Lead for ML Systems at Lyft Level 5: “Using Amazon SageMaker distributed training, we reduced our model training time from days to couple of hours. By running our ML workloads on AWS, we streamlined our development cycles and reduced costs, ultimately accelerating our mission to deliver self-driving capabilities to our customers.

#4 – Build Secure and Compliant ML Systems
Security is always priority #1 at AWS. It’s particularly important to customers operating in regulated industries such as financial services or healthcare, as they must implement their solutions with the highest level of security and compliance. For this purpose, Amazon SageMaker implements many security features, making it compliant with the following global standards: SOC 1/2/3, PCI, ISO, FedRAMP, DoD CC SRG, IRAP, MTCS, C5, K-ISMS, ENS High, OSPAR, and HITRUST CSF. It’s also HIPAA BAA eligible.

Says Ashok Srivastava, Chief Data Officer, Intuit: “With Amazon SageMaker, we can accelerate our Artificial Intelligence initiatives at scale by building and deploying our algorithms on the platform. We will create novel large-scale machine learning and AI algorithms and deploy them on this platform to solve complex problems that can power prosperity for our customers.”

#5 – Annotate Data and Keep Humans in the Loop
As ML practitioners know, turning data into a dataset requires a lot of time and effort. To help you reduce both, Amazon SageMaker Ground Truth is a fully managed data labeling service that makes it easy to annotate and build highly accurate training datasets at any scale (text, image, video, and 3D point cloud datasets).

Says Magnus Soderberg, Director, Pathology Research, AstraZeneca: “AstraZeneca has been experimenting with machine learning across all stages of research and development, and most recently in pathology to speed up the review of tissue samples. The machine learning models first learn from a large, representative data set. Labeling the data is another time-consuming step, especially in this case, where it can take many thousands of tissue sample images to train an accurate model. AstraZeneca uses Amazon SageMaker Ground Truth, a machine learning-powered, human-in-the-loop data labeling and annotation service to automate some of the most tedious portions of this work, resulting in reduction of time spent cataloging samples by at least 50%.

Amazon SageMaker is Evaluated
The hundreds of new features added to Amazon SageMaker since launch are testimony to our relentless innovation on behalf of customers. In fact, the service was highlighted in February 2020 as the overall leader in Gartner’s Cloud AI Developer Services Magic Quadrant. Gartner subscribers can click here to learn more about why we have an overall score of 84/100 in their “Solution Scorecard for Amazon SageMaker, July 2020”, the highest rating among our peer group. According to Gartner, we met 87% of required criteria, 73% of preferred, and 85% of optional.

Announcing a Price Reduction on GPU Instances

To thank our customers for their trust and to show our continued commitment to make Amazon SageMaker the best and most cost-effective ML service, I’m extremely happy to announce a significant price reduction on all ml.p2 and ml.p3 GPU instances. It will apply starting October 1st for all SageMaker components and across the following regions: US East (N. Virginia), US East (Ohio), US West (Oregon), EU (Ireland), EU (Frankfurt), EU (London), Canada (Central), Asia Pacific (Singapore), Asia Pacific (Sydney), Asia Pacific (Seoul), Asia Pacific (Tokyo), Asia Pacific (Mumbai), and AWS GovCloud (US-Gov-West).

Instance Name Price Reduction
ml.p2.xlarge -11%
ml.p2.8xlarge -14%
ml.p2.16xlarge -18%
ml.p3.2xlarge -11%
ml.p3.8xlarge -14%
ml.p3.16xlarge -18%
ml.p3dn.24xlarge -18%

Getting Started with Amazon SageMaker
As you can see, there are a lot of exciting features in Amazon SageMaker, and I encourage you to try them out! Amazon SageMaker is available worldwide, so chances are you can easily get to work on your own datasets. The service is part of the AWS Free Tier, letting new users work with it for free for hundreds of hours during the first two months.

If you’d like to kick the tires, this tutorial will get you started in minutes. You’ll learn how to use SageMaker Studio to build, train, and deploy a classification model based on the XGBoost algorithm.

Last but not least, I just published a book named “Learn Amazon SageMaker“, a 500-page detailed tour of all SageMaker features, illustrated by more than 60 original Jupyter notebooks. It should help you get up to speed in no time.

As always, we’re looking forward to your feedback. Please share it with your usual AWS support contacts, or on the AWS Forum for SageMaker.

– Julien

Amazon Transcribe Now Supports Automatic Language Identification

Post Syndicated from Julien Simon original https://aws.amazon.com/blogs/aws/amazon-transcribe-now-supports-automatic-language-identification/

In 2017, we launched Amazon Transcribe, an automatic speech recognition service that makes it easy for developers to add a speech-to-text capability to their applications. Since then, we added support for more languages, enabling customers globally to transcribe audio recordings in 31 languages, including 6 in real-time.

A popular use case for Amazon Transcribe is transcribing customer calls. This allows companies to analyze the transcribed text using natural language processing techniques to detect sentiment or to identify the most common call causes. If you operate in a country with multiple official languages or across multiple regions, your audio files can contain different languages. Thus, files have to be tagged manually with the appropriate language before transcription can take place. This typically involves setting up teams of multi-lingual speakers, which creates additional costs and delays in processing audio files.

The media and entertainment industry often uses Amazon Transcribe to convert media content into accessible and searchable text files. Use cases include generating subtitles or transcripts, moderating content, and more. Amazon Transcribe is also used by operations team for quality control, for example checking that audio and video are in sync thanks to the timestamps present in the extracted text. However, other problems couldn’t be easily solved, such as verifying that the main spoken language in your videos is correctly labeled to avoid streaming video in the wrong language.

Today, I’m extremely happy to announce that Amazon Transcribe can now automatically identify the dominant language in an audio recording. This feature will help customers build more efficient transcription workflows by getting rid of manual tagging. In addition to the examples mentioned above, you can now also easily use Amazon Transcribe to automatically recognize and transcribe voicemails, meetings, and any form of recorded communication.

Introducing Automatic Language Identification
With a minimum of 30 seconds of audio, Amazon Transcribe can efficiently generate transcripts in the spoken language without wasting time and resources on manual tagging. Automatic identification of the dominant language is available in batch transcription mode for all 31 languages. Thanks to sampling techniques, language identification happens much faster than the transcription itself, in the matter of seconds.

If you’re already using Amazon Transcribe for speech recognition, you just need to enable the feature in the StartTranscriptionJob API. Before your transcription job is complete, the response of the GetTranscriptionJob API will tell the dominant language of the audio recording, and its confidence score between 0 and 1. The transcript lists the top five languages and their respective confidence scores.

Of course, if you want to use Amazon Transcribe exclusively for automatic language identification, you can simply process the API response and ignore the transcript. In this case, you should stick to short 30-45 second audio recordings to minimize costs.

You can also restrict languages that Amazon Transcribe tries to identify, by passing a list of languages to the StartTranscriptionJob API. For example, if your company call center only receives calls in English, Spanish and French, then restricting identifiable languages to this list will increase language identification accuracy.

Now, I’d like to show you how easy it us to use this new feature!

Detecting the Dominant Language With Amazon Transcribe
First, let’s try a high quality sample. I’ll use the audio track from one of my breakout sessions at AWS Summit Paris 2019. I can easily download it using the youtube-dl tool.

$ youtube-dl -f bestaudio https://www.youtube.com/watch?v=AFN5jaTurfA
$ mv AWS\ \&\ EarthCube\ _\ Deep\ learning\ démarrer\ avec\ MXNet\ et\ Tensorflow\ en\ 10\ minutes-AFN5jaTurfA.m4a video.m4a

Using ffmpeg, I shorten the audio clip to 1 minute.

$ ffmpeg -i video.m4a -ss 00:00:00.00 -t 00:01:00.00 video-1mn.m4a

Then, I upload the clip to an Amazon Simple Storage Service (S3) bucket.

$ aws s3 cp video-1mn.m4a s3://jsimon-transcribe-uswest2/

Next, I use the AWS CLI to run a transcription job on this audio clip, with language identification enabled.

$ awscli transcribe start-transcription-job --transcription-job-name video-test --identify-language --media MediaFileUri=s3://jsimon-transcribe-uswest2/video-1mn.m4a

Waiting only a few seconds, I check the status of the job. I could also use a Amazon CloudWatch event to be notified that language identification is complete.

$ awscli transcribe get-transcription-job --transcription-job-name video-test
{
    "TranscriptionJob": {
        "TranscriptionJobName": "video-test",
        "TranscriptionJobStatus": "IN_PROGRESS",
        "LanguageCode": "fr-FR",
        "MediaSampleRateHertz": 44100,
        "MediaFormat": "mp4",
        "Media": {
        "MediaFileUri": "s3://jsimon-transcribe-uswest2/video-1mn.m4a"
    },
    "Transcript": {},
    "StartTime": 1593704323.312,
"CreationTime": 1593704323.287,

    "Settings": {
        "ChannelIdentification": false,
        "ShowAlternatives": false
    },
    "IdentifyLanguage": true,
    "IdentifiedLanguageScore": 0.915885329246521
    }
}

As highlighted in the output, the dominant language has been correctly detected in seconds, with a high confidence score of 91.59%. A few more seconds later, the transcription job is complete. Running the same CLI call, I can retrieve a link to the transcription, which also includes the top 5 languages for the audio clip, sorted by decreasing score.

"language_identification":[{"score":"0.9159","code":"fr-FR"},{"score":"0.0839","code":"fr-CA"},{"score":"0.0001","code":"en-GB"},{"score":"0.0001","code":"pt-PT"},{"score":"0.0001","code":"de-CH"}]

Adding up French and Canadian French, we pretty much get a score of 100%, so there’s no doubt that this clip is in French. In some cases, you may not care for that level of detail, and you’ll see in the next example how to restrict the list of detected languages.

Restricting the List of Detected Languages
As customer call transcription is a popular use case for Amazon Transcribe, here is a 40-second audio clip (WAV, 8KHz, 16-bit resolution), where I’m reading a paragraph from the French version of the Amazon Transcribe page. As you can hear, quality is pretty awful, and I added background music (Bach-ground, actually) for good measure.

Again, I upload the clip to an S3 bucket, and I use the AWS CLI to transcribe it. This time, I restrict the list of languages to French, Spanish, German, US English, and British English.

$ aws s3 cp speech-8k.wav s3://jsimon-transcribe-uswest2/
$ awscli transcribe start-transcription-job --transcription-job-name speech-8k-test --identify-language --media MediaFileUri=s3://jsimon-transcribe-uswest2/speech-8k.wav --language-options fr-FR es-ES de-DE en-US en-GB

A few seconds later, I check the status of the job.

$ awscli transcribe get-transcription-job --transcription-job-name speech-8k-test
{
    "TranscriptionJob": {
    "TranscriptionJobName": "speech-8k-test",
    "TranscriptionJobStatus": "IN_PROGRESS",
    "LanguageCode": "fr-FR",
    "MediaSampleRateHertz": 8000,
    "MediaFormat": "wav",
    "Media": {
        "MediaFileUri": "s3://jsimon-transcribe-uswest2/speech-8k.wav"
    },
    "Transcript": {},
    "StartTime": 1593705151.446,
"CreationTime": 1593705151.423,

    "Settings": {
        "ChannelIdentification": false,
        "ShowAlternatives": false
    },
    "IdentifyLanguage": true,
    "LanguageOptions": [
        "fr-FR","es-ES","de-DE","en-US","en-GB"
    ],
    "IdentifiedLanguageScore": 0.9995
    }
}

As highlighted in the output, the dominant language has been correctly detected with a very high confidence score in spite of the terrible audio quality. Restricting the list of languages certainly helps, and you should use it whenever possible.

Getting Started
Automatic Language Identification is available today in these regions:

  • US East (N. Virginia), US East (Ohio), US West (N. California), US West (Oregon), AWS GovCloud (US-West).
  • Canada (Central).
  • South America (São Paulo).
  • Europe (Ireland), Europe (London), Europe (Paris), Europe (Frankfurt).
  • Middle East (Bahrain).
  • Asia Pacific (Hong Kong), Asia Pacific (Mumbai), Asia Pacific (Tokyo), Asia Pacific (Seoul), Asia Pacific (Singapore), Asia Pacific (Sydney).

There is no additional charge on top of the existing pricing. Give it a try, and please send us feedback either through your usual AWS Support contacts, or on the AWS Forum for Amazon Transcribe.

– Julien

AWS Architecture Monthly Magazine: Robotics

Post Syndicated from Annik Stahl original https://aws.amazon.com/blogs/architecture/architecture-monthly-magazine-robotics/

Architecture Monthly: RoboticsSeptember’s issue of AWS Architecture Monthly issue is all about robotics. Discover why iRobot, the creator of your favorite (though maybe not your pet’s favorite) little robot vacuum, decided to move its mission-critical platform to the serverless architecture of AWS. Learn how and why you sometimes need to test in a virtual environment instead of a physical one. You’ll also have the opportunity to hear from technical experts from across the robotics industry who came together for the AWS Cloud Robotics Summit in August.

Our expert this month, Matt Hansen (who has dreamed of building robots since he was a teen), gives us his outlook for the industry and explains why cloud will be an essential part of that.

In September’s Robotics issue

  • Ask an Expert: Matt Hansen, Principle Solutions Architect
  • Blog: Testing a PR2 Robot in a Simulated Hospital
  • Case Study: iRobot
  • Blog: Introduction to Automatic Testing of Robotics Applications
  • Case Study: Multiply Labs Uses AWS RoboMaker to Manufacture Individualized Medicines
  • Demos & Videos: AWS Cloud Robotics Summit (August 18-19, 2020)
  • Related Videos: iRobot and ZS Associates

Survey opportunity

This month, we’re also asking you to take a 10-question survey about your experiences with this magazine. The survey is hosted by an external company (Qualtrics), so the below survey button doesn’t lead to our website. Please note that AWS will own the data gathered from this survey, and we will not share the results we collect with survey respondents. Your responses to this survey will be subject to Amazon’s Privacy Notice. Please take a few moments to give us your opinions.

How to access the magazine

We hope you’re enjoying Architecture Monthly, and we’d like to hear from you—leave us star rating and comment on the Amazon Kindle Newsstand page or contact us anytime at [email protected].

Learn why AWS is the best cloud to run Microsoft Windows Server and SQL Server workloads

Post Syndicated from Fred Wurden original https://aws.amazon.com/blogs/compute/learn-why-aws-is-the-best-cloud-to-run-microsoft-windows-server-and-sql-server-workloads/

Fred Wurden, General Manager, AWS Enterprise Engineering (Windows, VMware, RedHat, SAP, Benchmarking)

For companies that rely on Windows Server but find it daunting to move those workloads to the cloud, there is no easier way to run Windows in the cloud than AWS. Customers as diverse as Expedia, Pearson, Seven West Media, and RepricerExpress have chosen AWS over other cloud providers to unlock the Microsoft products they currently rely on, including Windows Server and SQL Server. The reasons are several: by embracing AWS, they’ve achieved cost savings through forthright pricing options and expanded breadth and depth of capabilities. In this blog, we break down these advantages to understand why AWS is the simplest, most popular and secure cloud to run your business-critical Windows Server and SQL Server workloads.

AWS lowers costs and increases choice with flexible pricing options

Customers expect accurate and transparent pricing so you can make the best decisions for your business. When assessing which cloud to run your Windows workloads, customers look at the total cost of ownership (TCO) of workloads.

Not only does AWS provide cost-effective ways to run Windows and SQL Server workloads, we also regularly lower prices to make it even more affordable. Since launching in 2006, AWS has reduced prices 85 times. In fact, we recently dropped pricing by and average of 25% for Amazon RDS for SQL Server Enterprise Edition database instances in the Multi-AZ configuration, for both On-Demand Instance and Reserved Instance types on the latest generation hardware.

The AWS pricing approach makes it simple to understand your costs, even as we actively help you pay AWS less now and in the future. For example, AWS Trusted Advisor provides real-time guidance to provision your resources more efficiently. This means that you spend less money with us. We do this because we know that if we aren’t creating more and more value for you each year, you’ll go elsewhere.

In addition, we have several other industry-leading initiatives to help lower customer costs, including AWS Compute Optimizer, Amazon CodeGuru, and AWS Windows Optimization and Licensing Assessments (AWS OLA). AWS Compute Optimizer recommends optimal AWS Compute resources for your workloads by using machine learning (ML) to analyze historical utilization metrics. Customers who use Compute Optimizer can save up to 25% on applications running on Amazon Elastic Compute Cloud (Amazon EC2). Machine learning also plays a key role in Amazon CodeGuru, which provides intelligent recommendations for improving code quality and identifying an application’s most expensive lines of code. Finally, AWS OLA helps customers to optimize licensing and infrastructure provisioning based on actual resource consumption (ARC) to offer cost-effective Windows deployment options.

Cloud pricing shouldn’t be complicated

Other cloud providers bury key pricing information when making comparisons to other vendors, thereby incorrectly touting pricing advantages. Often those online “pricing calculators” that purport to clarify pricing neglect to include hidden fees, complicating costs through licensing rules (e.g., you can run this workload “for free” if you pay us elsewhere for “Software Assurance”). At AWS, we believe such pricing and licensing tricks are contrary to the fundamental promise of transparent pricing for cloud computing.

By contrast, AWS makes it straightforward for you to run Windows Server applications where you want. With our End-of-Support Migration Program (EMP) for Windows Server, you can easily move your legacy Windows Server applications—without needing any code changes. The EMP technology decouples the applications from the underlying OS. This enables AWS Partners or AWS Professional Services to migrate critical applications from legacy Windows Server 2003, 2008, and 2008 R2 to newer, supported versions of Windows Server on AWS. This allows you to avoid extra charges for extended support that other cloud providers charge.

Other cloud providers also may limit your ability to Bring-Your-Own-License (BYOL) for SQL Server to your preferred cloud provider. Meanwhile, AWS improves the BYOL experience using EC2 Dedicated Hosts and AWS License Manager. With EC2 Dedicated Hosts, you can save costs by moving existing Windows Server and SQL Server licenses do not have Software Assurance to AWS. AWS License Manager simplifies how you manage your software licenses from software vendors such as Microsoft, SAP, Oracle, and IBM across AWS and on-premises environments. We also work hard to help our customers spend less.

How AWS helps customers save money on Windows Server and SQL Server workloads

The first way AWS helps customers save money is by delivering the most reliable global cloud infrastructure for your Windows workloads. Any downtime costs customers in terms of lost revenue, diminished customer goodwill, and reduced employee productivity.

With respect to pricing, AWS offers multiple pricing options to help our customers save. First, we offer AWS Savings Plans that provide you with a flexible pricing model to save up to 72 percent on your AWS compute usage. You can sign up for Savings Plans for a 1- or 3-year term. Our Savings Plans help you easily manage your plans by taking advantage of recommendations, performance reporting and budget alerts in AWS Cost Explorer, which is a unique benefit only AWS provides. Not only that, but we also offer Amazon EC2 Spot Instances that help you save up to 90 percent on your compute costs vs. On-Demand Instance pricing.

Customers don’t need to walk this migration path alone. In fact, AWS customers often make the most efficient use of cloud resources by working with assessment partners like Cloudamize, CloudChomp, or Migration Evaluator (formerly TSO Logic), which is now part of AWS. By running detailed assessments of their environments with Migration Evaluator before migration, customers can achieve an average of 36 percent savings using AWS over three years. So how do you get from an on-premises Windows deployment to the cloud? AWS makes it simple.

AWS has support programs and tools to help you migrate to the cloud

Though AWS Migration Acceleration Program (MAP) for Windows is a great way to reduce the cost of migrating Windows Server and SQL Server workloads, MAP is more than a cost savings tool. As part of MAP, AWS offers a number of resources to support and sustain your migration efforts. This includes an experienced APN Partner ecosystem to execute migrations, our AWS Professional Services team to provide best practices and prescriptive advice, and a training program to help IT professionals understand and carry out migrations successfully. We help you figure out which workloads to move first, then leverage the combined experience of our Professional Services and partner teams to guide you through the process. For customers who want to save even more (up to 72% in some cases) we are the leaders in helping customers transform legacy systems to modernized managed services.

Again, we are always available to help guide you in your Windows journey to the cloud. We guide you through our technologies like AWS Launch Wizard, which provides a guided way of sizing, configuring, and deploying AWS resources for Microsoft applications like Microsoft SQL Server Always On, or through our comprehensive ecosystem of tens of thousands of partners and third-party solutions, including many with deep expertise with Windows technologies.

Why run Windows Server and SQL Server anywhere else but AWS?

Not only does AWS offer significantly more services than any other cloud, with over 48 services without comparable equivalents on other clouds, but AWS also provides better ways to use Microsoft products than any other cloud. This includes Active Directory as a managed service and FSx for Windows File Server, the only fully managed file storage service for Windows. If you’re interested in learning more about how AWS improves the Windows experience, please visit this article on our Modernizing with AWS blog.

Bring your Windows Server and SQL Server workloads to AWS for the most secure, reliable, and performant cloud, providing you with the depth and breadth of capabilities at the lowest cost. To learn more, visit Windows on AWS. Contact us today to learn more on how we can help you move your Windows to AWS or innovate on open source solutions.

About the Author
Fred Wurden is the GM of Enterprise Engineering (Windows, VMware, Red Hat, SAP, benchmarking) working to make AWS the most customer-centric cloud platform on Earth. Prior to AWS, Fred worked at Microsoft for 17 years and held positions, including: EU/DOJ engineering compliance for Windows and Azure, interoperability principles and partner engagements, and open source engineering. He lives with his wife and a few four-legged friends since his kids are all in college now.