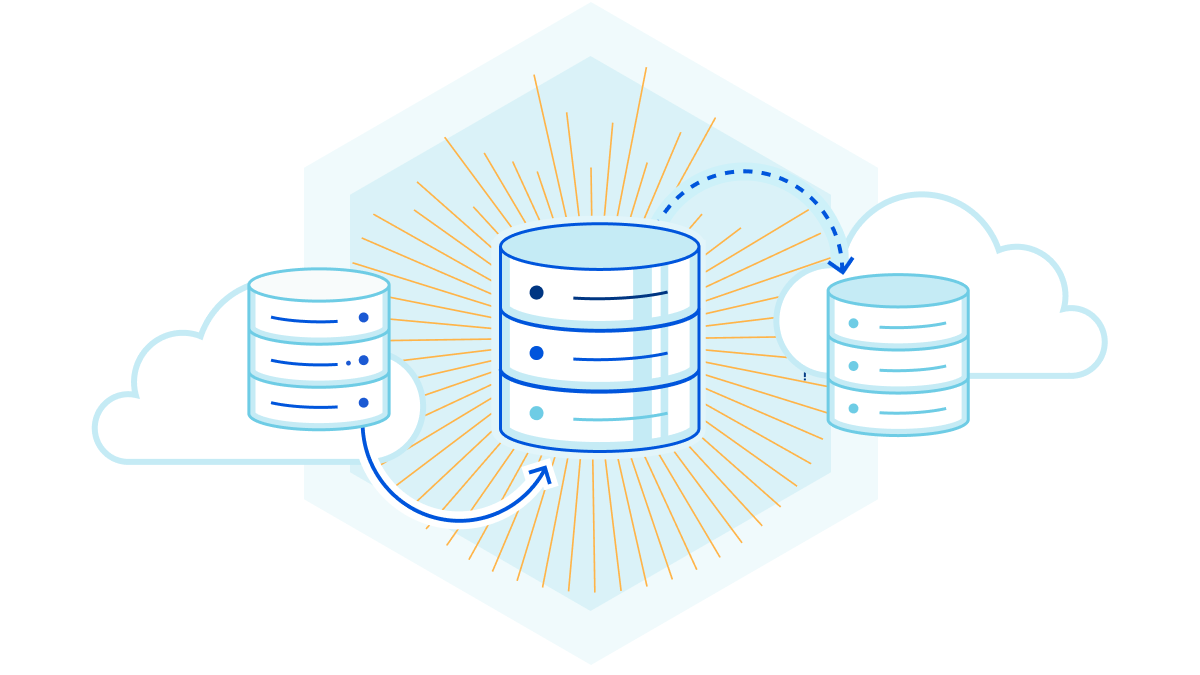
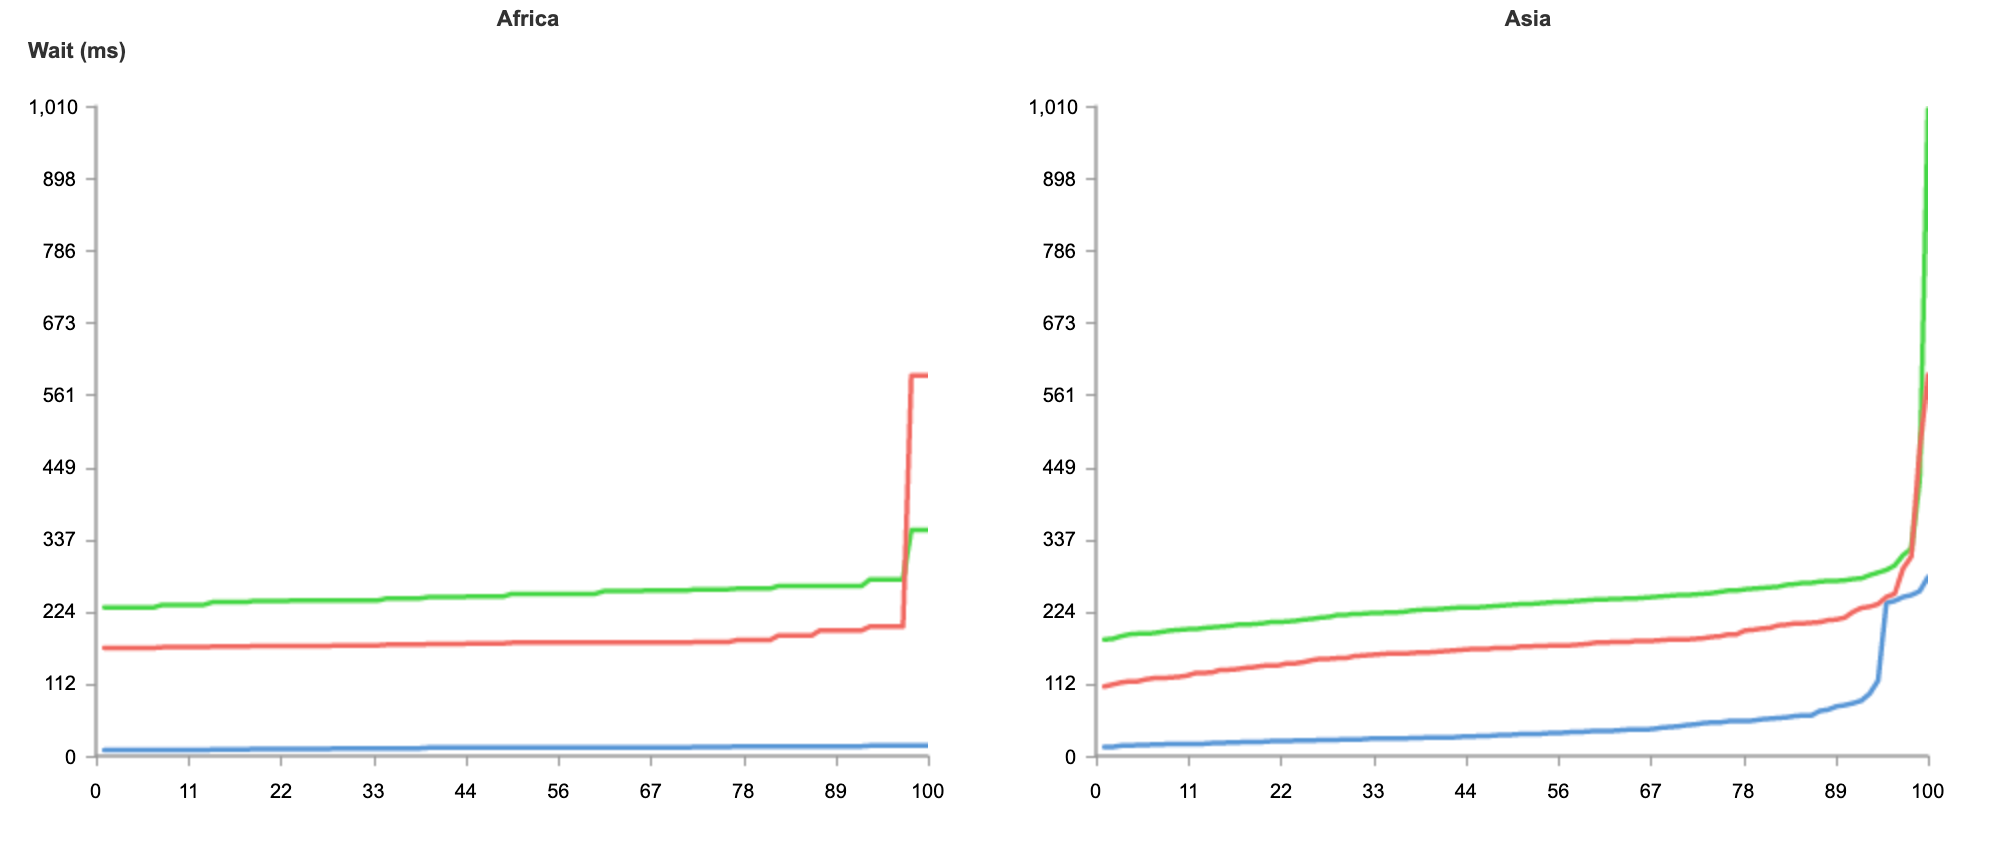
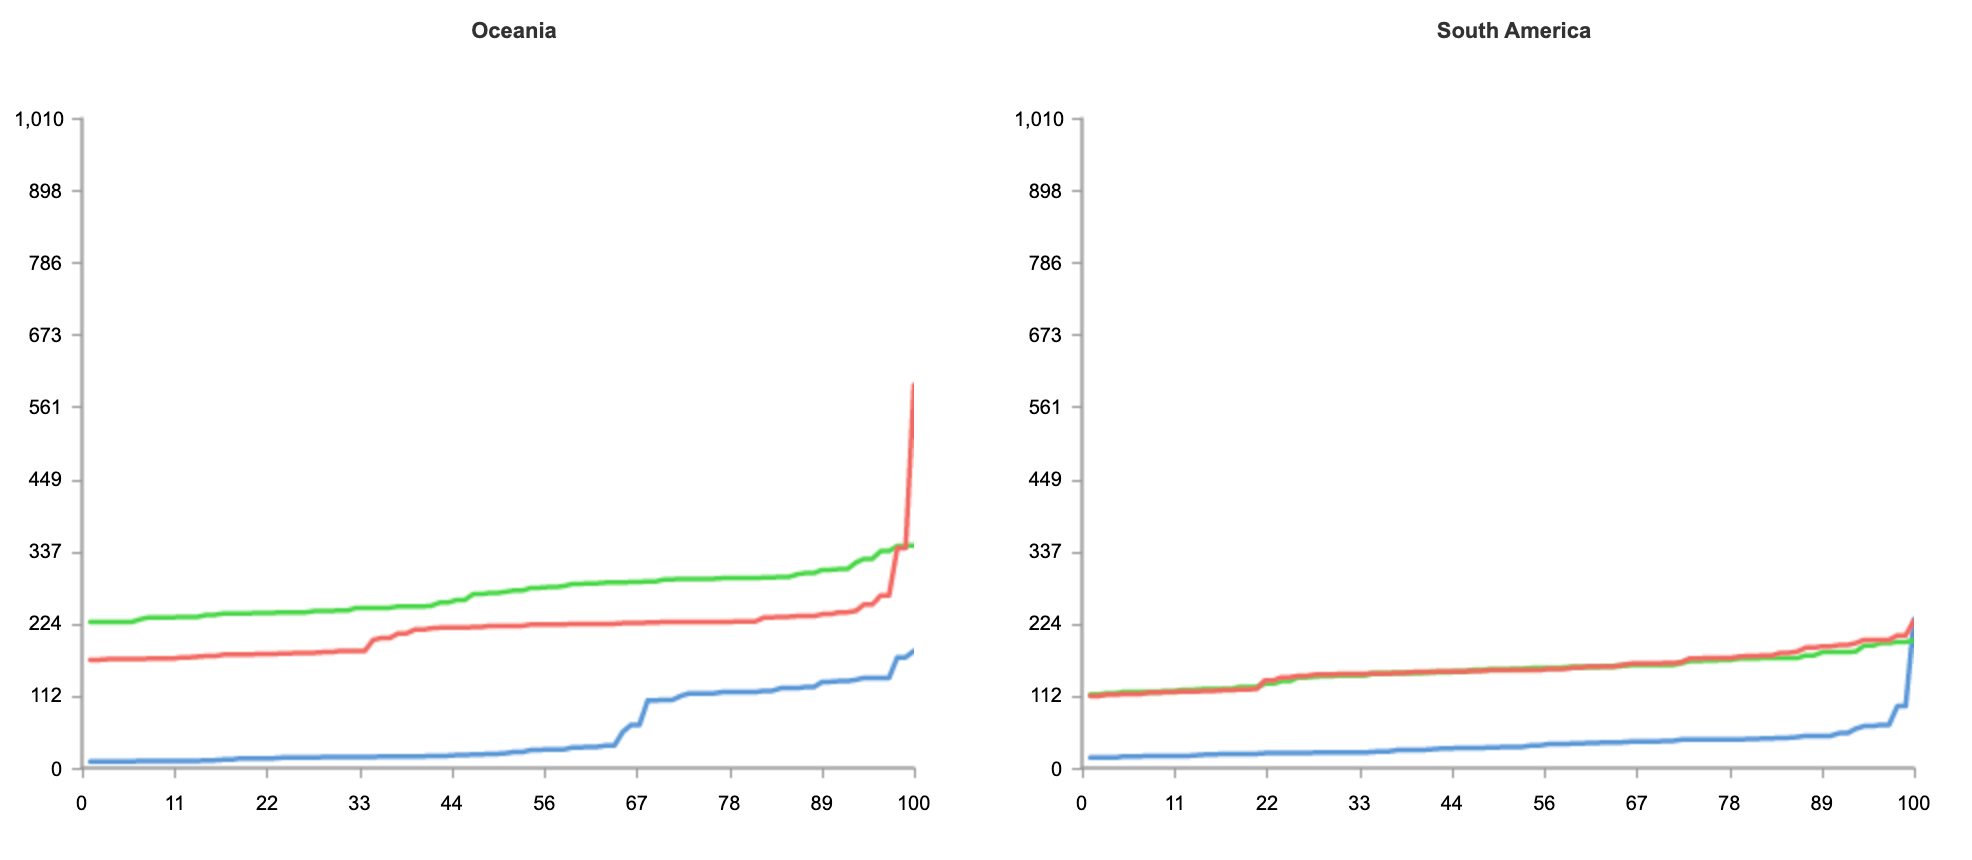
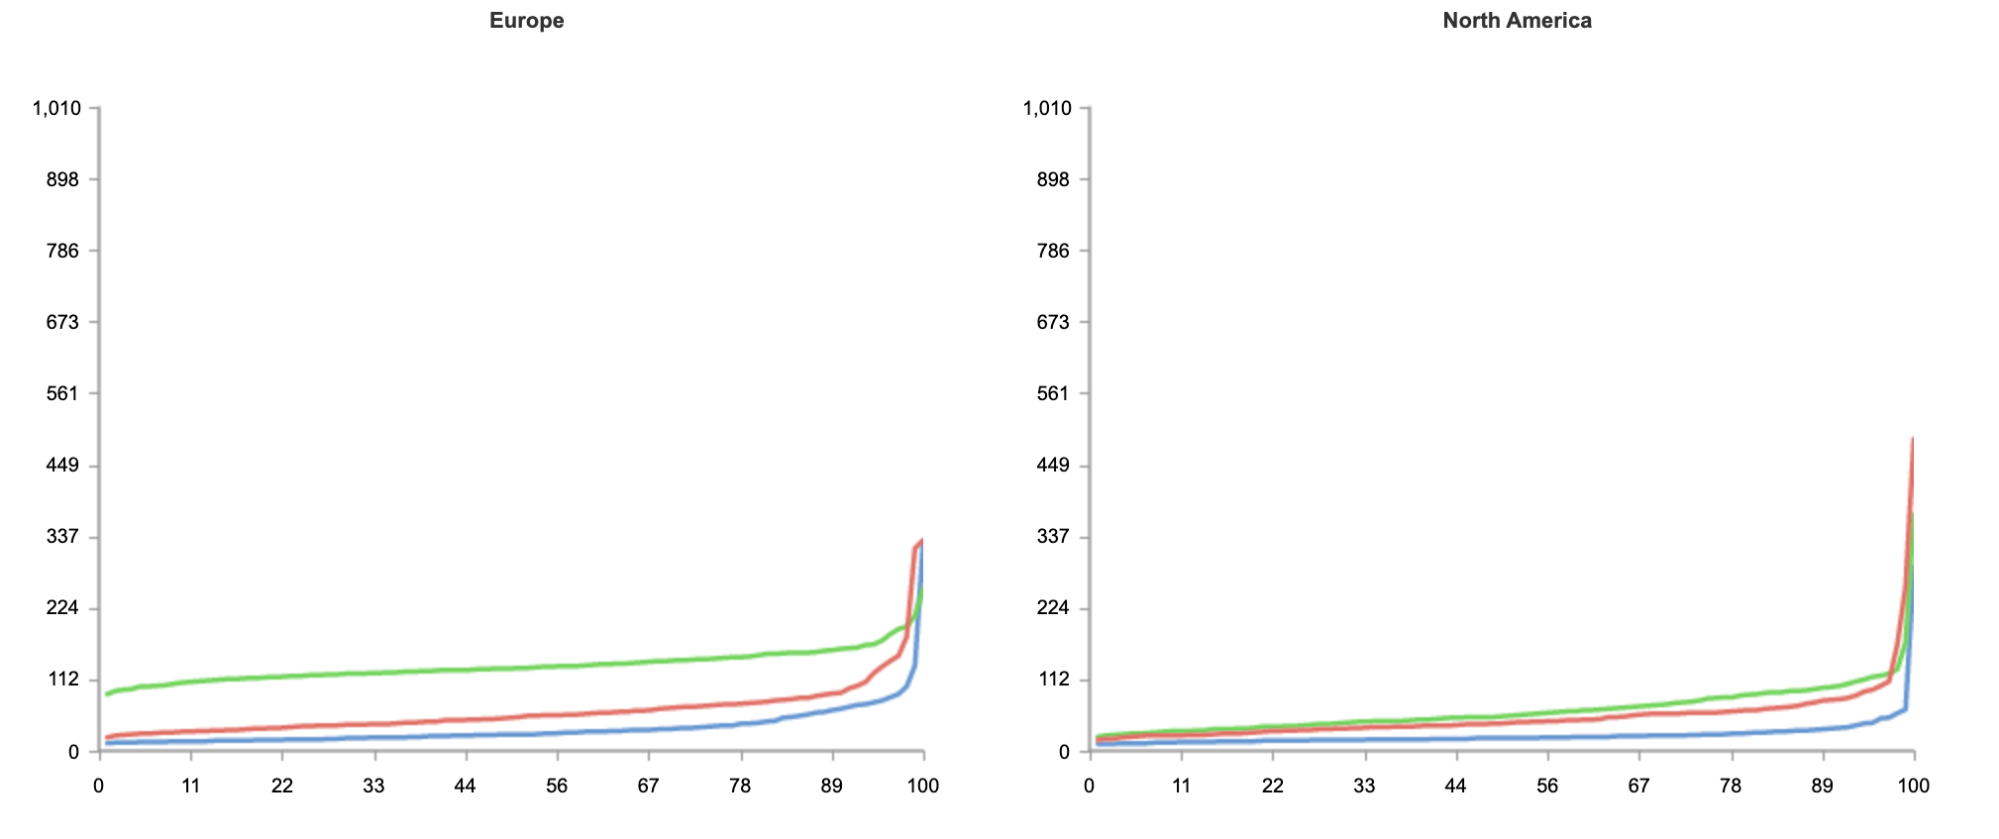
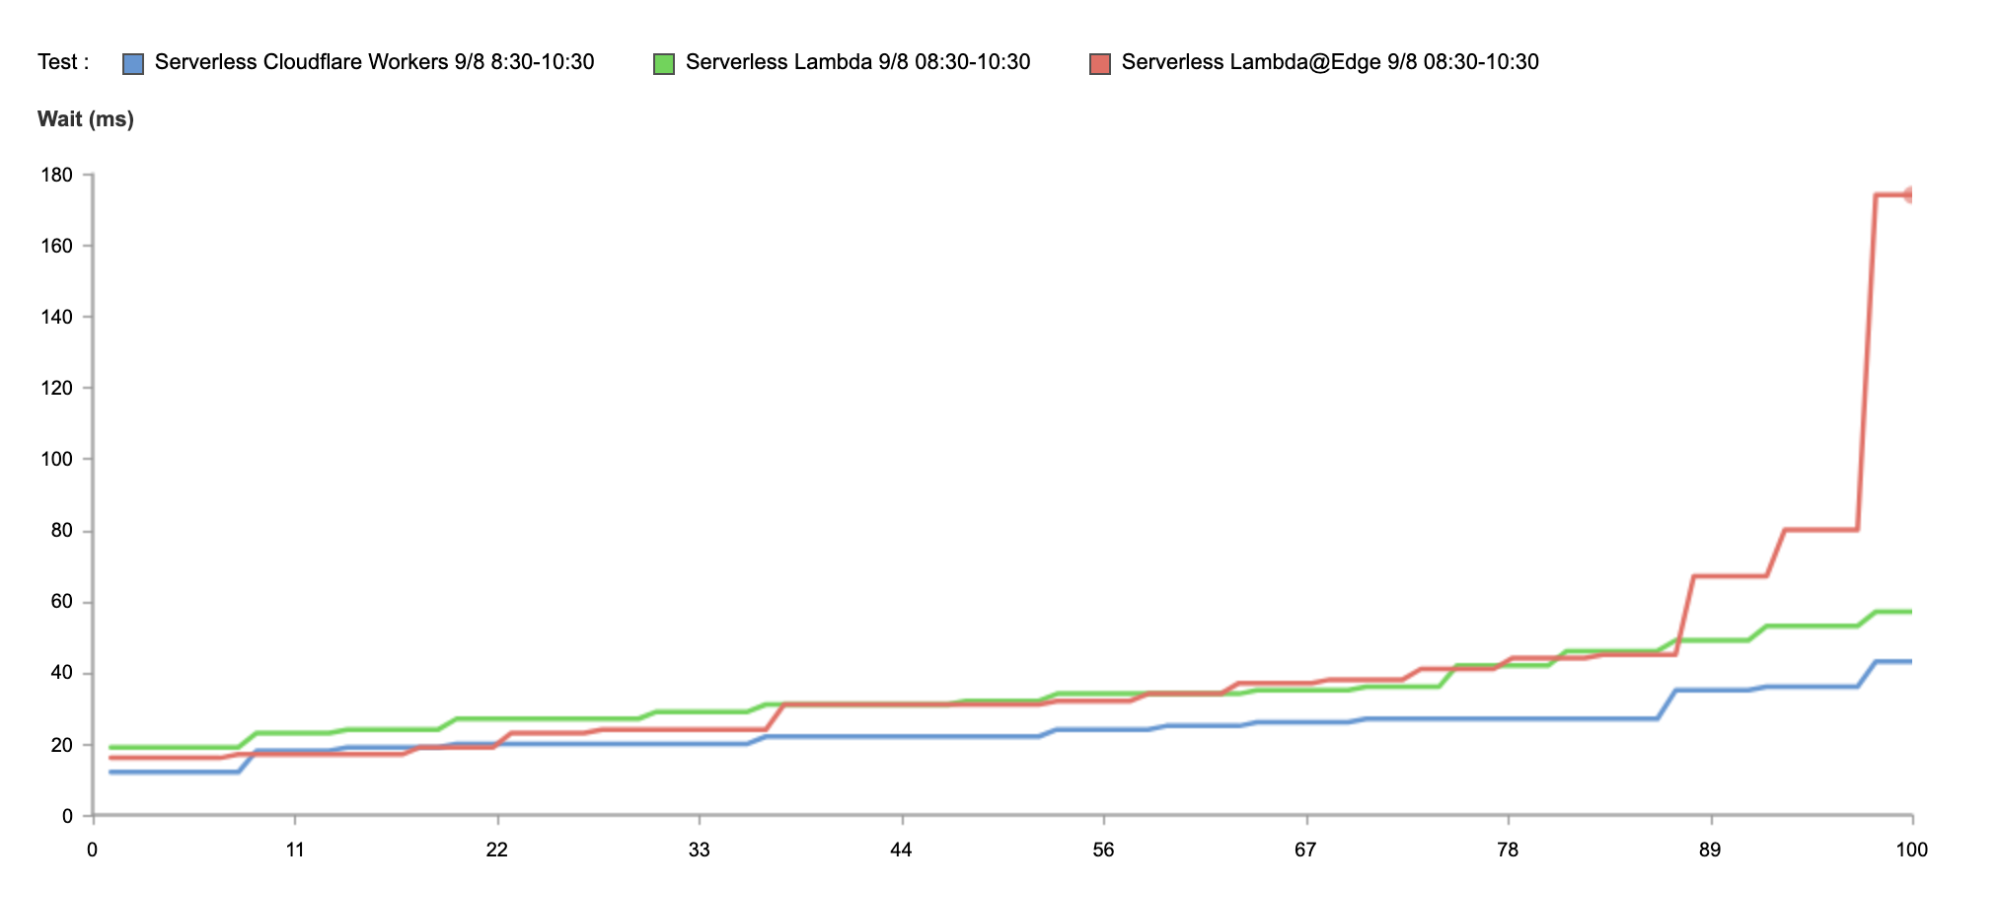
At Cloudflare, we’re building the best compute platform in the world. We want to make it easy, seamless, and obvious to build your applications with us. But simply making the best compute platform is not enough — at the heart of your applications are the data they interact with.
Cloudflare has multiple data storage solutions available today: Workers KV, R2, and Durable Objects. All three follow Cloudflare’s design goals for Workers: global by default, infinitely scalable, and delightful for developers to use. We’ve partnered with third-party storage solutions like Fauna, MongoDB and Prisma, who have built data platforms that align beautifully with our design goals and written tutorials for databases that already support HTTP connections.
The one area that’s been sorely missed: relational databases. Cloudflare itself runs on relational databases, and we’re not alone. In April, we asked which Node libraries you wanted us to support, and four of the top five requests were related to databases. For this Full Stack Week, we asked ourselves: how could we support relational databases in a way that aligned with our design goals?
Today, we’re taking a first step towards that world by announcing support for relational databases, including Postgres and MySQL from Workers.
Connecting to a database is no simple task — if it were as easy as passing a connection string to a database driver, we would have already done it. We’ve had to overcome several hurdles to reach this point, and have several more still to conquer.
Our goal with this announcement is to work with you, our developers, to solve the unique pain points that come from accessing databases inside Workers. If you’d like to work with us, fill out this form or join us on Discord — this is just the beginning. If you’d just like to grab the code and play around, use this example to get started connecting to your own database, or check out our demo.
Why are Database Connectors so hard to build?
Serverless database connections are challenging to support for several reasons.
Databases are needy — they often require TCP connections, since they assume long-lived connections between an application server and the database. The Workers runtime doesn’t currently support TCP connections, so we’ve only been able to support HTTP-based databases or proxies.
Like a relationship, establishing a connection isn’t quite enough. Developers use client libraries for databases to make submitting queries and managing the responses easy. Since the Workers runtime is not entirely Node.js compatible, we need to either roll our own database library or find one that does not use unsupported built-in libraries.
Finally, databases are sensitive. It often takes external libraries to manage shared connections between an application server and a database, since these connections tend to be expensive to establish.
Moving past these challenges
Our approach today gives us the foundation to address each of these challenges in creative ways going forward.
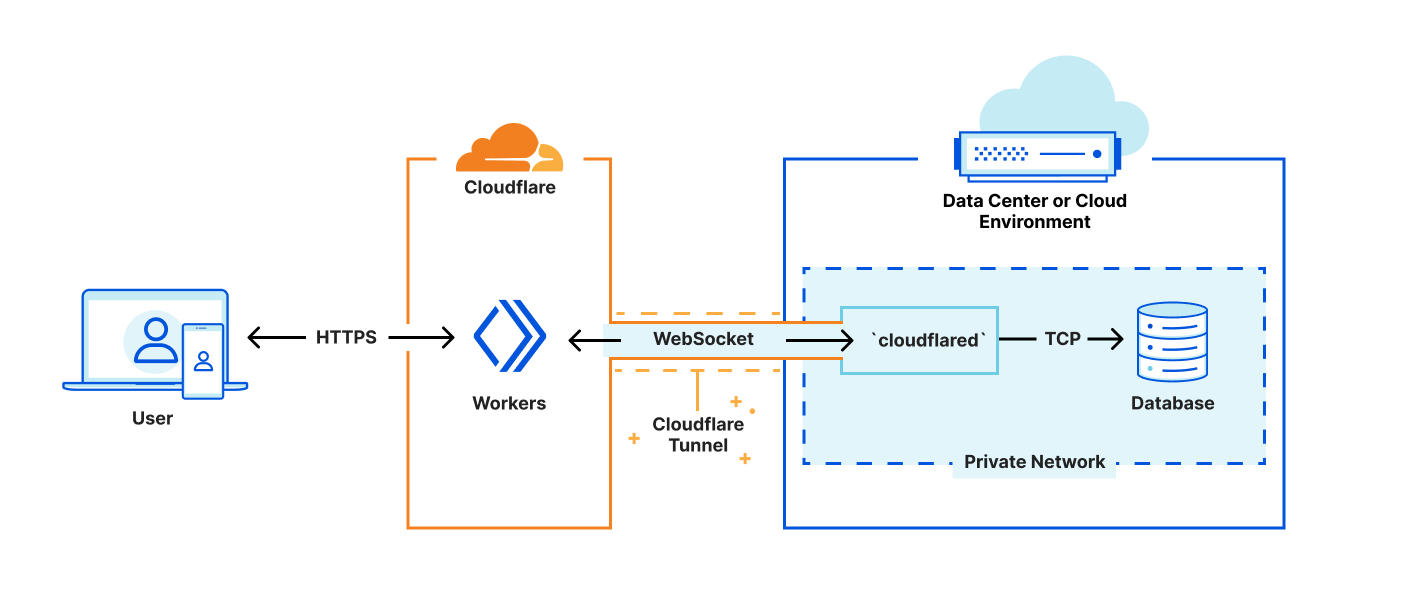
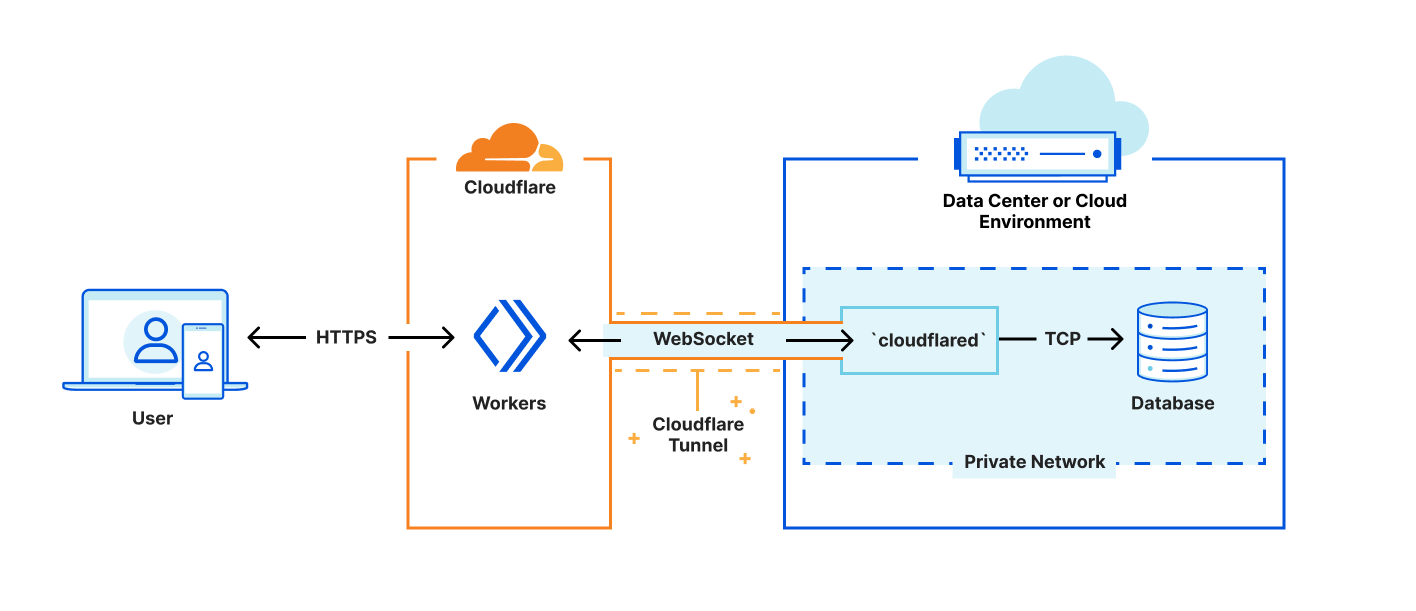
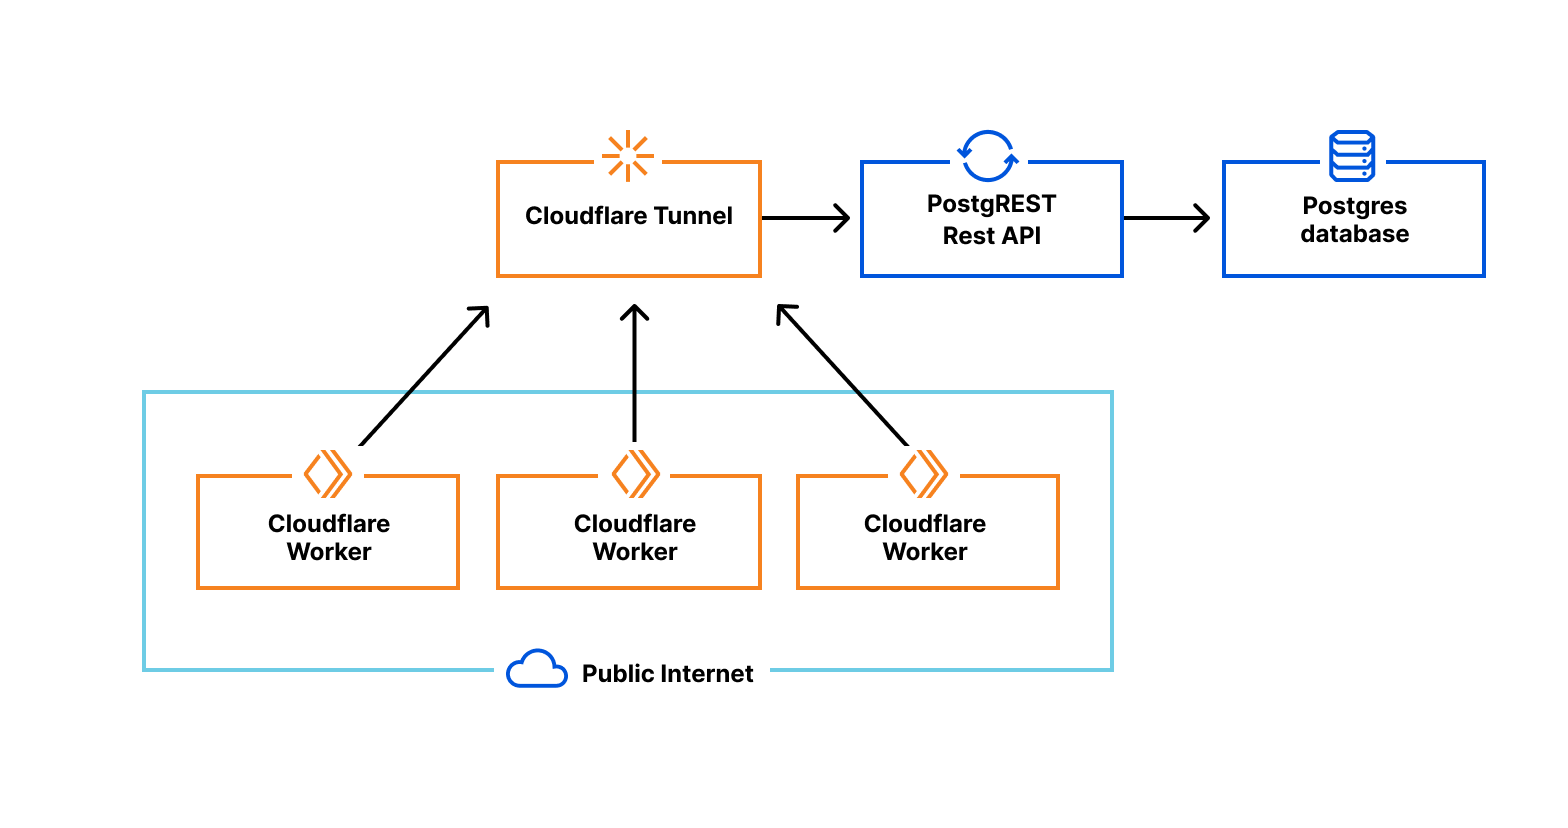
First, we’re leveraging cloudflared to create a secure tunnel between Cloudflare and a private network within your existing infrastructure. Cloudflared already supports proxying HTTP to TCP over WebSockets — Our challenge is providing interfaces that look like the socket interfaces existing libraries expect, while rewiring the implementations to redirect reads and writes to our websocket. This method is fast, safe, and secure; but limiting in that we lack control of where to direct the final connections. This is a problem we will solve soon, but until then our approach is essential to gathering latency and performance data to see where else we need to improve.
Next, we’ve created a shim-layer that adapts the socket API from a popular runtime to connect directly to databases using a WebSocket. This allows us to bundle code as-is, without forking or otherwise making significant changes to the database library. As part of this announcement, we’ve published a tutorial on how to connect to and query a Postgres database from your Workers, using existing Cloudflare technology and a driver from the growing community at Deno. We’re excited to work with the upstream maintainers, on expanding support.
Finally, we’re most excited for how this approach will let us begin to manage connection pooling and connection establishment overhead. While our current tech demo requires setting up the Cloudflare Tunnel on your own infrastructure, we’re looking for customers who’d like to pilot a model where Cloudflare hosts the tunnel for you.
Where we’re going
We’re just getting started. Our goal with today’s announcement is to find customers who are looking to build new applications or migrate existing applications to Workers while working with data that’s stored in a relational database.
Just as Cloudflare started by providing security, performance, and reliability for customer’s websites, we’re excited about a future where Cloudflare manages database connections, handles replication of data across cloud providers and provides low-latency access to data globally.
First, we’re looking to add support for TCP into the runtime natively. With native support for TCP we’ll not only have better support for databases, but expand the Workers runtime to work with data infrastructure more broadly.
Our position in the network layer of the stack makes providing performance, security benefits and extremely reduced egress costs to global databases all possible realities. To do so, we’ll repurpose the HTTP to TCP proxy service that we’ve currently built and run it for developers as a connection pooling service, managing connections to their databases on their behalf.
Finally, our network makes caching data and making it accessible globally at low latency possible. Once we have connections back to your data, making it globally accessible in Cloudflare’s network will unlock fundamentally new architectures for distributed data.
Take our connectors for a spin
Want to check things out? There are three main steps to getting up-and-running:
Deploying cloudflared within your infrastructure.
Deploying a database that connects to cloudflared.
Deploying a Worker with the database driver that submits queries.
Welcome to a new blog post series called Developer Spotlight. In this series we will be showcasing interesting applications built on top of the Cloudflare Workers Ecosystem.
And to celebrate Durable Objects going GA, what better to kick off the series than with a really cool tech demo of Durable Objects called Full Tilt?
Full Tilt by Guido Zuidhof is a game jam entry for Ludum Dare, one of the biggest and oldest game jams around, where he won first place in the innovation category. A game jam is like a hackathon for games, where you have a very short amount of time (usually 48-72 hours) to create a game from scratch.
We love Full Tilt, not just because Guido used Workers and Durable Objects to build a cool game where you control a game on your computer via your phone, but especially because it shows how powerful Durable Objects are. In less than 48 hours Guido was able to write all the logic to instantly spin up a personal gaming server anywhere in the world, as close to that player as possible. And it is so fast that you feel like you are controlling the computer directly.
But here is Guido, to tell you about his experience developing Full Tilt.
Last October I participated in the Ludum Dare 49 game jam. The thing I love about game jams is that the time constraint forces you to work quickly, iterate often, and most importantly cut scope.
In this game jam I created Full Tilt, a game in which you seamlessly use your phone as a Wiimote-like motion controller for a game that is run on your laptop in a web browser. The secret sauce to making it so smooth was in combining a game jam with Jamstack and mixing in some Durable Objects.
Full Tilt is a browser game in which you move the player character by moving your hand around. There are a few different ways we can do that. One idea would be to use your computer’s webcam to track a marker object through 3D space. While that is possible, it is tricky to get it working in any situation (a dark room can be problematic!) and also some players may feel uncomfortable turning on their webcam for a simple web game.
A smartphone has a bunch of sensors built in, including a magnetometer and gyroscope — those sensors are exactly what we need, and we can assume that the majority of our potential players have a smartphone within arm’s reach. When a native mobile application uses these sensors, it adds a lot of friction (users now have to install an app), as well as a bunch of implementation work. Fortunately modern web browsers allow you to read from these sensors through the DeviceMotion API: a small web app will do the job perfectly!
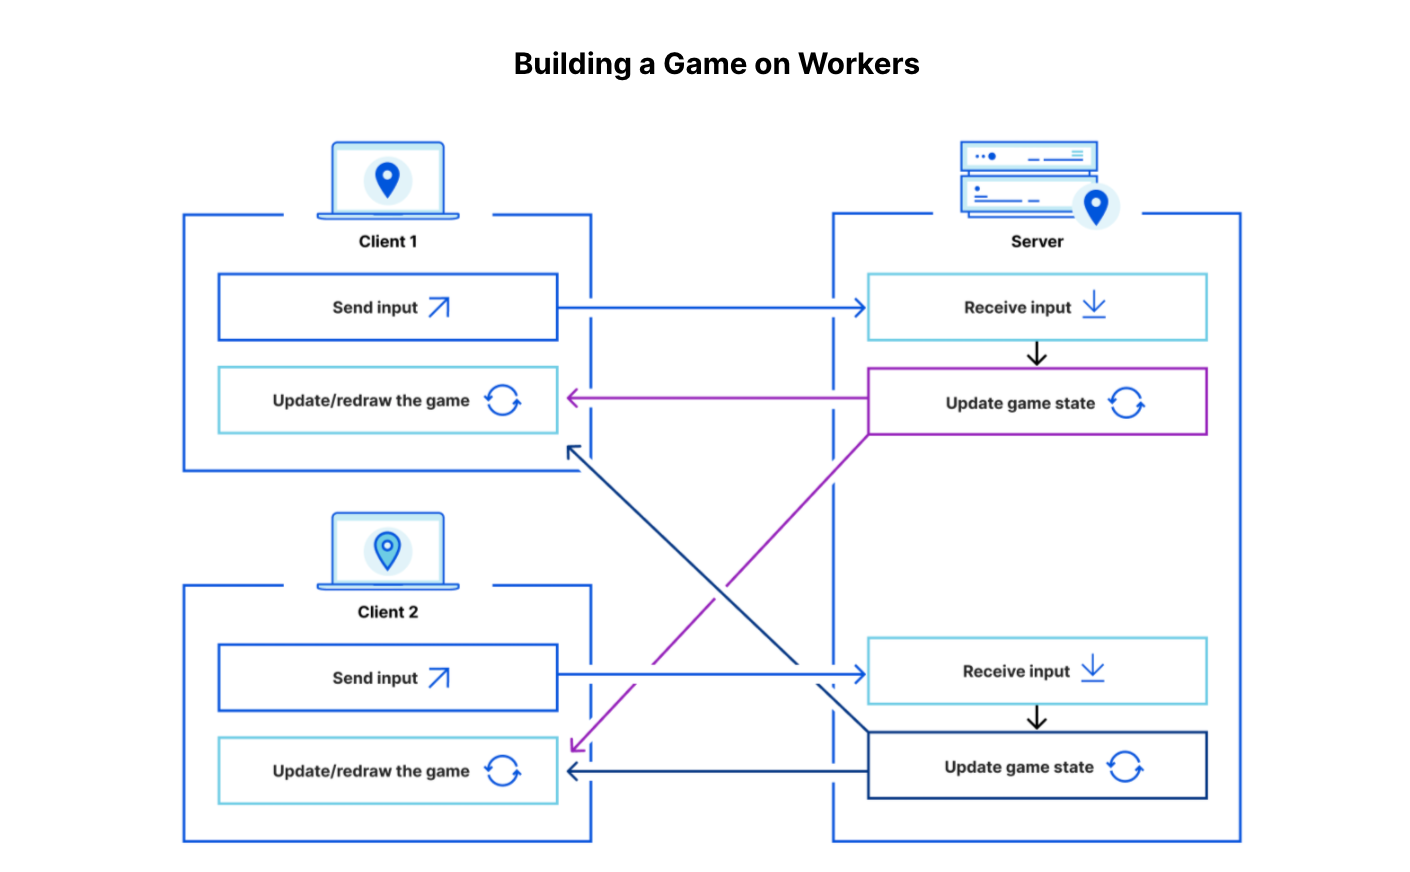
The next challenge is communicating the sensor readings from the phone to the game running on the main computer. For that we will use a combination of Cloudflare Workers and Durable Objects. There needs to be some shared contact (i.e., a game server) that both the main computer and the smartphone talk to. Using a serverless solution makes a lot of sense for a web game. And as we only have 48 hours here, less stuff to worry about is a big selling point too. Workers and Durable Objects also make it easy to keep the game running after the game jam, without having to pay for — and more importantly worry about — keeping servers running.
Setting up a line of communication
There are roughly two ways for browsers to communicate: through a shared connection (a game server somewhere) or a peer to peer connection, so browsers can talk directly to each other without a middleman by leveraging WebRTC DataChannels.
WebRTC can be very challenging to make reliable and may still need a proxy server for some especially problematic network setups behind multiple NATs. Setting up a WebRTC connection may have been the perfect solution for the lowest possible latency, but it was out of scope for such a short game jam.
The game we are creating has low latency requirements, when I tilt my phone the game should respond quickly. We can probably get away with anything under 100ms, although low double digits or less is definitely preferred! If I’m geographically located in one place and the game server is geographically close enough, then this game server will be able to pass messages from my smartphone to my laptop without too much delay. Edge computing is hot nowadays, and for this gaming use case it is not just a nice-to-have but also a necessity.
Enough background, let’s architect the system.
On-demand game rooms
The first thing I needed to set up was game rooms. Something that both the phone and the computer browsers could connect to, so they can pass messages between them.
Durable Objects allow us to create a large amount of small stateful “mini servers” or “rooms” that multiple clients can connect to simultaneously over WebSockets, providing perfect small on-demand game servers. Think of Durable Objects as a single thread of Javascript that runs in a data center close to where the user first asked for it to be created.
After the browser on the computer starts the game, it asks our Cloudflare Worker API to create a room for the current game session. This API request is a simple POST request, the server responds with a four character room code that uniquely identifies the room that was created. The reason we want the room code to be short is because the user may need to copy this code and type it into their smartphone if they are unable to scan a QR code.
Humans are notoriously bad at copying random character strings as different characters look alike, so we use a limited character set that excludes the most commonly confused characters:
const DICTIONARY = "2345679ADEFGHJKLMNPQRSTUVWXYZ"; // 29 chars (no 0, O, I, 1, B, 8)
A four character code will allow us to uniquely point to ~700,000 different rooms, that seems like it would be enough even if our game got quite popular! What’s more: these game sessions don’t last forever. After some period of time (say 24 hours) we can be certain enough that the game session has ended, and we can re-use that room code.
Room code coordination
In your Cloudflare Worker script, there are two ways to create a Durable Object: either we ask for one to be created with an ID generated from a name, or we ask for one to be created with a random unique ID. The naive solution would be to create a Durable Object with an ID generated from the room code. However, that is not a good idea here because a Durable Object gets created in a data center that is geographically close to the end user.
A problematic situation would be if a user in Mumbai requests a room and gets room code ABCD. Initially, they play the game for a bit, and it works great.
The issue comes a week later when that room code is reused for another player based in Los Angeles, The game room Durable Object will be revived in Mumbai and latency will be awful for our Los Angeles player. In the future, Durable Objects may get migrated between data centers, but that’s not yet guaranteed.
Instead, what we can do is create a new Durable Object with a random ID for every new game session and keep a mapping from the four character room code to this random ID. We are introducing some state in our system: we will need a central source of truth which is where Durable Objects can come to the rescue again.
We will solve this by creating a single “Room Hub” Durable Object that keeps track of this mapping from room code to Durable Object ID. This Durable Object will have two endpoints, one to request a new room and another to look up a room’s information.
Here’s our request handler for the Room Request endpoint (the argument is a Sunder Context, Sunder is the web framework I used for this project):
export async function handleRoomRequest(ctx: Context<Env>) {
const now = Date.now();
const reqBody = await ctx.request.json();
// We make some attempts to find a room that is available..
const attempts = 5
let roomCode: string;
let roomStorageKey: string;
for (let i = 0; i < attempts; i++) {
roomCode = generateRoomCode();
roomStorageKey = ROOM_STATE_PREFIX + roomCode;
const room = await ctx.state.storage.get<RoomData>(roomStorageKey);
if (room === undefined) {
break;
} else if (now - room.createdAt > MAX_ROOM_AGE) {
await ctx.state.storage.delete(roomStorageKey);
break;
}
if (i === attempts-1) {
return ctx.throw("Couldn't find available room code :(");
}
}
const roomData: RoomData = {
roomCode: roomCode,
durableObjectId: reqBody.durableObjectId,
createdAt: now,
}
await ctx.state.storage.put<RoomData>(roomStorageKey, roomData);
ctx.response.body = {
room: roomData
};
ctx.response.status = HttpStatus.Created;
}
In a nutshell, we generate a few room codes until we find one that has never been used or hasn’t been used in a long enough time.
There is a subtle but important nuance in this code: the Durable Object gets created in the Cloudflare Worker that talks to our Room Hub, not in the Room Hub itself. Our Room Hub will run in a single data center somewhere on Cloudflare’s network. If we create the game room from there it may still be far away from our end user!
Looking up a room’s information is simpler, we return either the room data or status 404.
export async function handleRoomLookup(ctx: Context<Env, {roomCode: string}>) {
const now = Date.now();
let roomStorageKey = ROOM_STATE_PREFIX + ctx.params.roomCode;
const roomData = await ctx.state.storage.get<RoomData>(roomStorageKey);
if (roomData === undefined) {
ctx.throw(404, "Room not found");
return;
}
if (now - roomData.createdAt > MAX_ROOM_AGE) {
// About time we cleaned it up.
await ctx.state.storage.delete(roomStorageKey);
ctx.response.status = HttpStatus.NotFound;
return;
}
ctx.response.body = {
room: roomData
};
}
The smartphone browser needs to connect to that same room. To make things easy for the user we generate a four character room code which points at that specific “Game Room” Durable Object. This way the user can take their smartphone, navigate to the website address https://ld49.pages.dev, and enter the code “ABCD” (or more commonly, they scan a QR code with the link https://ld49.pages.dev?room=ABCD).
Game Room Durable Object
Our game room Durable Object can be pretty simple since it is only responsible for passing along messages from the smartphone to the laptop with the latest sensor readings. I was able to modify the Durable Objects chat room example to do exactly this — a good time saver for a game jam!
When a browser connects, they either connect as a “peer” or as a “host” role. Any messages sent by peers are forwarded to the host, and all messages from the host get forwarded to all peers. In this case, our host is the laptop browser running the game and the peer is the smartphone controller. Implementation-wise this means that we keep two lists of users: the peers and the hosts. Whenever a message comes in, we loop over the list to broadcast it to all connections of the other role. In practice, the code is a bit more involved to deal with users disconnecting.
Full Tilt is a singleplayer game, but adapting it to be a multiplayer game would be easy with this setup. Imagine a Mario Kart-like game that runs in your browser in which multiple friends can join using their smartphones as their steering wheel controller! Unfortunately there was not enough time in this game jam to make a polished game.
Front end
With the backend ready, we still need to create the actual game and the controller web app.
My initial plan was to create a game in which you fly a 3D plane by tilting your phone, collecting stars and completing aerobatic tricks. It would fit the theme “Unstable” as I expected this control method to be pretty flimsy! Since there was no time left to create anything close to that, it was time to cut scope.
I ended up using the Phaser game engine and put the entire system together in a Svelte app. This was certainly a challenge, as I had only used Phaser once before many years ago and had never used Svelte. Luckily, I was able to put together something simple quickly enough: a snake-like game in which you move a thingy to collect blips that appear randomly on the screen.
In order for a game to be a game there needs to be some goal for the user, usually some game over condition. I changed the game to go faster and faster over time, added a score counter, and added a game over condition where you lose the game if you touch the edge of the screen. I made my “art” in MS Paint, generated some sound effects using the online tool sfxr, and “composed” the music soundtrack in Chrome’s Music Lab Song Maker.
Simultaneously I wrote a small client for my game server and duct-taped together the smartphone controller app which is powered by the browser’s DeviceMotion APIs. To distribute my game I used Cloudflare Pages, which worked like a charm the first time.
All done
And then the deadline was there — I barely made it, but I submitted something I was proud of. A not-so-great game, but with an interesting backend system and a novel input method. Do try the game yourself here, and the source code is available here (warning: it’s pretty hacky code of course!).
The reception of my co-jammers was great. While everybody agreed the game itself and its graphics were awful, it was novel. The game ended up rated first in the *Innovation* category for this game jam, out of hundreds of other games!
Finally, is this the future of game servers? For indie developers and smaller studios, setting up and maintaining a globally distributed fleet of game servers is both a huge distraction and cost. Serverless and in particular Durable Objects can provide an amazing solution.
But not every game is well-suited for a WebSocket-based backend. In some real-time games you are not interested in what happened a second ago and only the latest information matters. This is where the reliable and ordered nature of WebSockets can get in the way.
All in all my first impressions of Durable Objects are very positive, it is a great tool to have in your toolbelt for all kinds of web projects. You can now tackle problems that would otherwise take days in mere minutes. I am very excited to see what other problems will be made easy by Durable Objects, even those I haven’t even thought of yet.
Today we are excited to announce that we are developing APIs and infrastructure to support more TCP, UDP, and QUIC-based protocols in Cloudflare Workers. Once released, these new capabilities will make it possible to use non-HTTP socket connections to and from a Worker or Durable Object as easily as one can use HTTP and WebSockets today.
Out of the box, fetch and WebSocket APIs. With just a few internal changes to make it operational in Workers, we’ve developed an example using an off-the-shelf driver (in this example, a Deno-based Postgres client driver) to communicate with a remote Postgres server via WebSocket over a secure Cloudflare Tunnel.
import { Client } from './driver/postgres/postgres'

export default {
  async fetch(request: Request, env, ctx: ExecutionContext) {
    try {
      const client = new Client({
        user: 'postgres',
        database: 'postgres',
        hostname: 'https://db.example.com',
        password: '',
        port: 5432,
      })
      await client.connect()
      const result = await client.queryArray('SELECT * FROM users WHERE uuid=1;')
      ctx.waitUntil(client.end())
      return new Response(JSON.stringify(result.rows[0]))
    } catch (e) {
      return new Response((e as Error).message)
    }
  },
}
The example works by replacing the bits of the Postgres client driver that use the Deno-specific TCP socket APIs with standard fetch and WebSockets APIs. We then establish a WebSocket connection with a remote Cloudflare Tunnel daemon running adjacent to the Postgres server, establishing what is effectively TCP-over-WebSockets.
While the fact we were able to build the example and communicate effectively and efficiently with the Postgres server — without making any changes to the Cloudflare Workers runtime — is impressive, there are limitations to the approach. For one, the solution requires additional infrastructure to establish and maintain the WebSocket tunnel — in this case, the instance of the Cloudflare Tunnel daemon running adjacent to the Postgres server. While we are certainly happy to provide that daemon to customers, it would just be better if that component were not required at all. Second, tunneling TCP over WebSockets, which is itself tunneled via HTTP over TCP is a bit suboptimal. It works, but we can do better.
Making connections from Cloudflare Workers
Currently, there is no standard API for socket connections in JavaScript. We want to change that.
If you’ve used Node.js before, then you’re most likely familiar with the net.Socket and net.TLSSocket objects. If you use Deno, then you might know that they’ve recently introduced the Deno.connect() and Deno.connectTLS() APIs. When you look at those APIs, what should immediately be apparent is how different they are from one another despite doing the exact same thing.
When we decided that we would add the ability to open and use socket connections from within Workers, we also agreed that we really have no interest in developing yet another non-standard, platform-specific API that is unlike the APIs provided by other platforms. Therefore, we are extending an invitation to all JavaScript runtime platforms that need socket capabilities to collaborate on a new (and eventually standardized) API that just works no matter which runtime you choose to develop on.
Here’s a rough example of what we have in mind for opening and reading from a simple TCP client connection:
const socket = new Socket({
  remote: { address: '123.123.123.123', port: 1234 },
})
for await (const chunk of socket.readable)
  console.log(chunk)
Or, this example, sending a simple “hello world” packet using UDP:
The API will be designed generically enough to work both client and server-side; for TCP, UDP, and QUIC; with or without TLS, and will not rely on any mechanism specific to any single JavaScript runtime. It will build on existing broadly supported Web Platform standards such as EventTarget, ReadableStream, WritableStream, AbortSignal, and promises. It will be familiar to developers who are already familiar with the fetch() API, service workers, and promises using async/await.
This is just a proposal at this point and the details will very likely change from the examples above by the time the capability is delivered in Workers. It is our hope that other platforms will join us in the effort of developing and supporting this new API so that developers have a consistent foundation upon which to build regardless of where they run their code.
Introducing Socket Workers
The ability to open socket client connections is only half of the story.
When we first started talking about adding these capabilities an obvious question was asked: What about using non-HTTP protocols to connect to Workers? What if instead of just having the ability to connect a Worker to some other back-end database, we could implement the entire database itself on the edge, inside Workers, and have non-HTTP clients connect to it? For that matter, what if we could implement an SMTP server in Workers? Or an MQTT message queue? Or a full VoIP platform? Or implement packet filters, transformations, inspectors, or protocol transcoders?
Workers are far too powerful to limit to just HTTP and WebSockets, so we will soon introduce Socket Workers — that is, Workers that can be connected to directly using raw TCP, UDP, or QUIC protocols without using HTTP.
What will this new Workers feature look like? Many of the details are still being worked through, but the idea is to deploy a Worker script that understands and responds to “connect” events in much the same way that “fetch” events work today. Importantly, this would build on the same common socket API being developed for client connections:
The new socket API for JavaScript and Socket Workers are under active development, with focus initially on enabling better and more efficient ways for Workers to connect to databases on the backend — you can sign up here to join the waitlist for access to Database Connectors and Socket Workers. We are excited to work with early users, as well as our technology partners to develop, refine, and test these new capabilities.
Once released, we expect Socket Workers to blow the doors wide open on the types of intelligent distributed applications that can be deployed to the Cloudflare network edge, and we are excited to see what you build with them.
We’ve heard a common theme over the past year: developers want to build more of their applications on Workers. With built-in global deployments, insane scalability and the flexibility of JavaScript, more and more applications are choosing to build on our global platform.
To do so, developers need access to data. Our strategy for data on Workers has had three parts:
One, to provide first-party solutions that are designed for infinite scale, like Workers KV and Durable Objects.
Two, to support a wide array of NoSQL databases that connect over HTTP, and to begin to build connections to data where it already lives today with TCP Database Connectors.
Three, to partner with best-of-breed data companies to bring their capabilities to the Workers platform.
Today we’re excited to announce that, in addition to our existing partners Fauna and Macrometa, Cloudflare Workers has added support for Prisma and MongoDB Atlas. These data platforms are heavily demanded by developers — Prisma’s modern ORM brings support for Postgres, SQL Server, MySQL via their Prisma client, while MongoDB topped the ranks of integrations most demanded by our users.
Both clients are available in their respective mainline git repositories, realm-web for MongoDB and prisma for Prisma. You can begin using them right away by importing them into your Workers.
What’s great about MongoDB?
MongoDB is a database loved by developers — its document model makes it easy to start with, while transactions and a scale-out distributed systems architecture let it scale with your application.
MongoDB brings a robust query language, MQL, to developers on the Workers platform, supporting rich aggregations right within the database. MongoDB support is provided via the Realm SDK, which integrates directly with MongoDB Atlas — the easiest way to run MongoDB.
MongoDB Atlas also includes Global Cluster, perfect for creating a low-latency, geo-distributed MongoDB database to back your Workers.
Together with MongoDB, we’ve put together a demo application that you can play with on MongoDB’s blog. Check it out and let us know if you have questions!
What’s great about Prisma?
Prisma is an ORM, or object-relational mapper, which transforms entries in a database into objects in code. What makes Prisma great is its ability to abstract away the complexities of working with the database — Prisma handles type-safety, schema migrations, query optimization and the actual interactions between your code and the database. Like Workers does for compute at the edge, Prisma makes managing your database dead-simple.
Prisma currently supports Postgres, MySQL, SQL Server, SQLite and MongoDB. These databases can be existing on any cloud provider or can be spun up on-demand on Heroku.
Prisma integrates with Workers via the Prisma Data Proxy. After setting up the Proxy, you can import the Prisma client into your Workers script and define a schema to begin using any of the supported databases!
What’s next?
Alongside our existing partnerships with Macrometa and Fauna, we’re excited to add the MongoDB and Prisma integrations to Worker’s growing library. If you have a data platform you’d like to use with Workers, reach out to us, and we’ll make it happen!
“Which came first, the chicken or the egg?” It’s one of life’s great questions. There are hundreds of articles published which conclude with eggs predating chickens by millions of years. Unfortunately, Cloudflare users don’t have New Scientist on hand to answer similar questions.
Which runs first, Firewall Rules or Workers? Page Rules or Transform Rules? Whilst not as philosophically challenging, the answers to these questions are key to setting up your Cloudflare zone correctly. Answering them has become increasingly difficult as more and more functionality is added, thanks to our incredible rate of shipping products. What was once a relatively easy to understand traffic flow exploded in complexity with the introduction of products such as Workers, Load Balancing Rules and Transform Rules. And this big bang of product announcements is only accelerating each year.
To begin addressing this problem, we developed Traffic Sequence. Traffic Sequence is a simple dashboard illustration which shows a default, high-level overview of how Cloudflare products interact. Think of this as your atlas, rather than your black cab driver’s “Knowledge”. This helps you understand that London is in the south east of the UK, but not that it’s quicker to walk than use the London Underground between Leicester Square and Covent Garden.
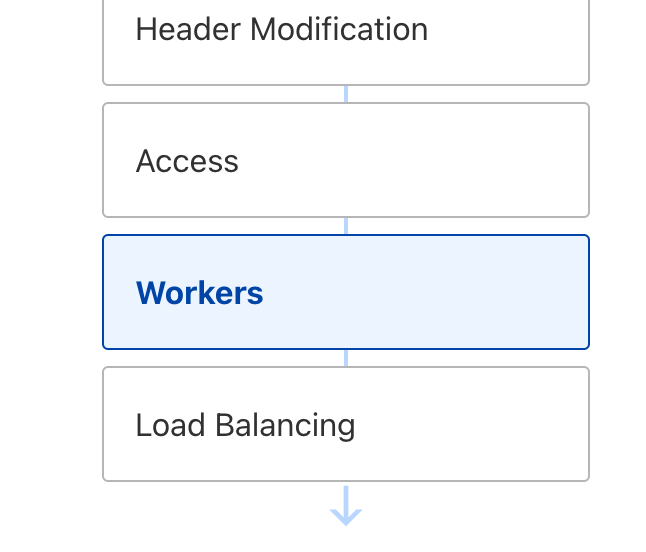
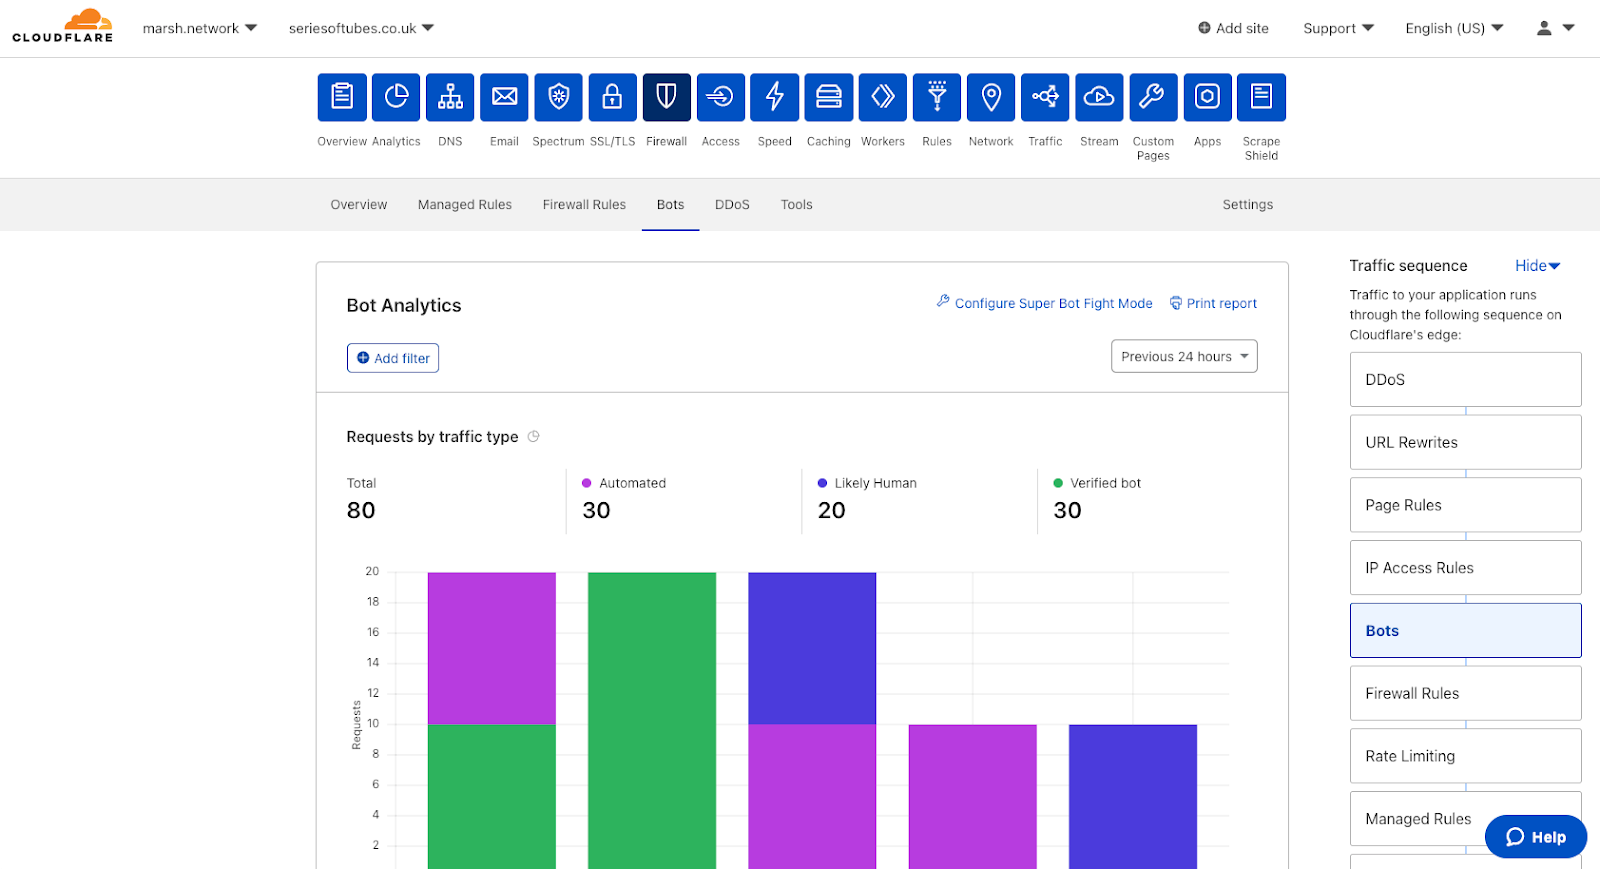
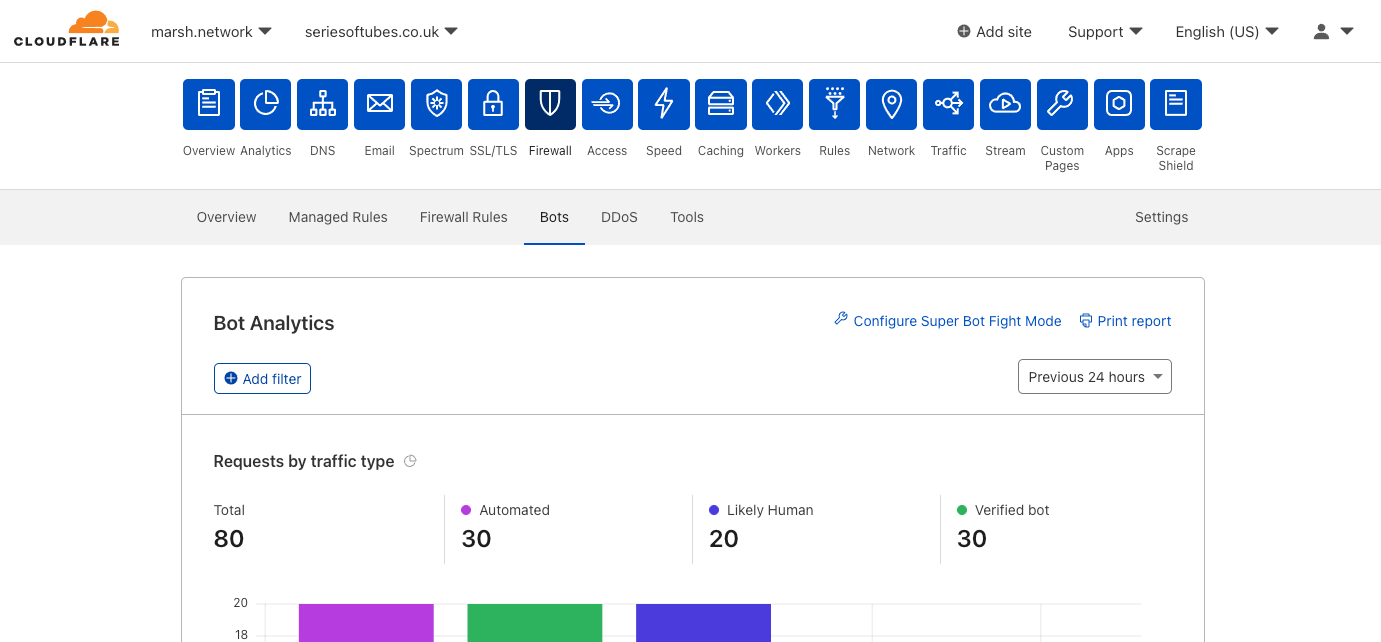
Traffic Sequence is now enabled for all zones by default, appearing on ten product pages within the dashboard. Traffic Sequence highlights in blue the product area you are currently configuring, showing where within the HTTP request lifecycle the specific product sits. This provides context and allows users to understand which products will see the impact of changes here, and which products will not.
Traffic Sequence is designed to make Cloudflare’s edge clearer to our customers, allowing users to understand how products fit together and understand how HTTP requests flow between each.
Dear Cloudflare, which runs first?
Understanding how traffic is routed through Cloudflare has been one of the most common questions from both Cloudflare staff and customers alike.
Love Cloudflare, but still can’t my head around workers. do they come before the cache? After? Page Rules? I’ve asked in the forums and chat , but a single reference doc would be so goood! (specific page rules & cache settings ex: interaction with Cache Everything)
But why does it matter? Let’s go through a simple example.
Released in April 2021, “Transform Rules” lets users rewrite URLs of HTTP requests as they proxy through their zone — for example, rewriting /login.php to /super/secret/login-page.php, all invisible to the end user.
In this scenario, the administrator also has a Firewall Rule blocking requests to the URI Path /login.php when the visitor is coming from a country other than the United States. What they would see, however, is that visitors from these other countries are still reaching the /login.php page on their servers. Why is this?
This is because URL rewrites happen before Firewall Rules, meaning the Firewall Rules product won’t see a URI Path of /login.php. Instead it will see HTTP requests with the rewritten URI path of /super/secret/login-page.php. Thus, when Firewall Rules evaluates the customers rule it checks:
Is this from a country that is not the USA? Yes
AND – Is this request going to a URI Path of /login.php? No.
As both criteria are not evaluated as ‘true’, the rule does not match and the traffic is allowed on its journey.
This is why it is so important to know how Cloudflare’s products interoperate to get the most out of your plan, and achieve your goals without having to dig through mountains of documentation.
In an alternate timeline, Traffic Sequence is used to highlight that Firewall Rules run after URL rewriting occurs, and therefore see’s the rewritten value in the URI Path. With this information the customer can then configure a Firewall Rule to look for the rewritten value in URI Path and accomplish their desired setup.
From napkin to working prototype
Traffic Sequence was originally borne out of a “back of the napkin” idea during the creation of Transform Rules and URL Normalization, in an attempt to show where these transformations were happening:
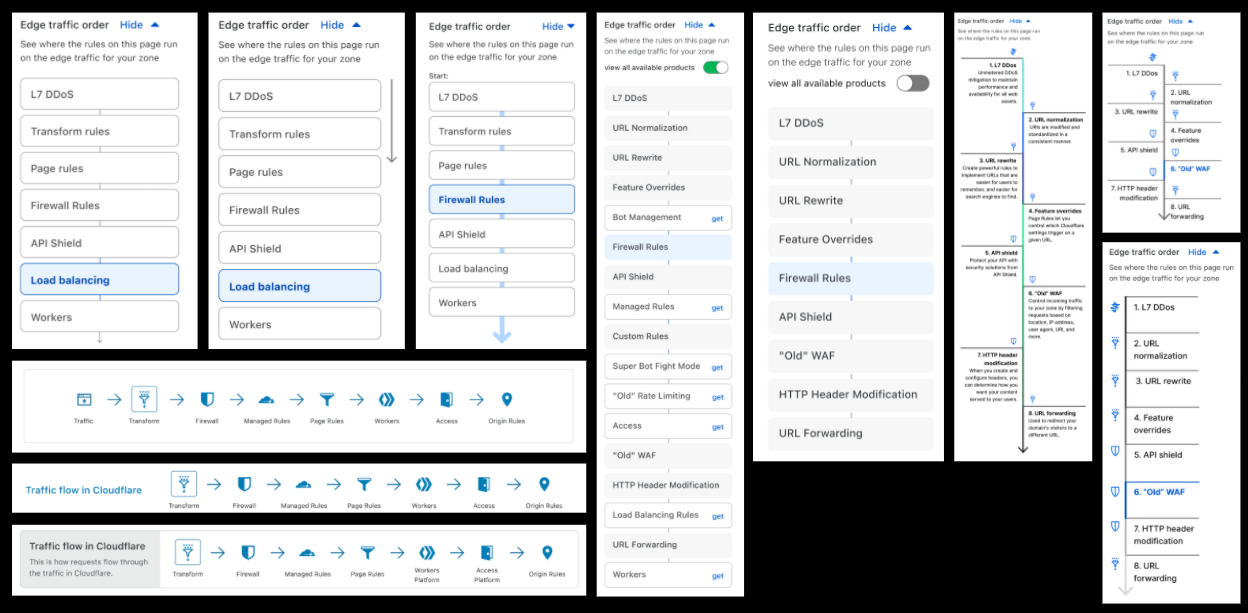
The idea might have started from a need of our own, but it ended up addressing well known customer and internal problems: whenever we build a new product everyone wants to understand how it fits into the big picture. So we pushed the idea further, proposing it to other teams and soliciting feedback.
This project was a great example of how bringing the right level of fidelity of thinking to the table can be evolved into an opportunity to ship to learn. Something that was initially meant as an explainer diagram for one rule type has become an almost bespoke experience of the dashboard, as it is unique to each customer’s Cloudflare environment, displaying only the products available for use in that zone. We offer many options and routes to products, but we didn’t have a straightforward flow of information that customers can rely on, focusing only on what they have set up and have access to.
As part of the design process, we try to focus on asking lots of questions rather than just finding an answer. Some of the considerations we had were:
What if we show customers a product they aren’t using?
What if we show customers a product they aren’t entitled to on their plan level?
Why aren’t we showing “this product”?
Do we have this visualisation on by default?
After gaining internal momentum to flesh out this project, we decided to focus on three areas:
Simplifying a complex ecosystem – what is a useful simplification?
Value that this will add beyond this first application
Opportunity to test out different navigation and mental models.
After all, this is not just a map of our system, but a new way of navigating it entirely.
Positive early internal feedback not only aligned with our goals, but allowed us to iterate on points that needed improvement. We knew that this could be a game-changer for promoting clarity, improving discoverability and saving time with navigation: going for one click instead of three for most items.
A couple of iterations later, we were ready to put this in the hands of our users for early testing:
Ever wondered how traffic is handled by our various products when configuring your @Cloudflare zone? You arent alone. We hear you. If you are interested in trying our latest experiment, get in touch. We’d LOVE your feedback. #Cloudflarepic.twitter.com/mh906T0JxV
Thanks to our incredible community we had a high level of interest in the first week, providing insight into how this feature would be used in the real world, and answering the ultimate question of this experiment: “Does this solve the problem of understanding how Cloudflare handles HTTP requests?” via our Traffic Sequence survey form:
“I didn’t know where my requests were going… until now.”
“It’s always been confusing which products/features affect which other products/features.”
“It’s really handy to be able to explain the ordering that these are happening in, and I like the deeplink into the relevant area.”
These were all a great reminder that what triggered this work was ingrained in real customer needs.
Other feedback was rapidly incorporated into the prototype; specifically splitting Transform Rules into two separate sections to highlight that URL rewrites and header modifications occur at different parts of the request flow. We also added features which our users deemed important for clarity, such as IP Access Rules.
Traffic Sequence for all
Thanks to the great feedback and participation of all testers, both internal and external, we are now in a position where we are comfortable to take the covers off and make Traffic Sequence available to all users.
The visualisation can be hidden easily by clicking on the “hide” button, and the display automatically hides to preserve critical whitespace when needed:
When new products are added, or updates to products occur which modify the traffic order, this diagram will be updated accordingly.
Evolving Traffic Sequence
We know this is a high level, generic overview of how Cloudflare products interact. There is a level of nuance underneath, and a number of products and features not shown in the Traffic Sequence illustration which play an important part in keeping users safe and secure.
In the future we have aspirations to build “the other side of the coin”. Traffic Sequence provides a simple to understand view of how the products work by default at a high level. We also want to create a detailed, almost traceroute-like feature which allows users to see exactly what happens to their traffic — which products it goes via and what happens within those products, and potentially a lot more. Stay tuned!
Try it now
This feature is now enabled by default on all customer zones, and is visible within the dashboard locations outlined above.
Please do try it out and let us know what you think via the Cloudflare Community
Cloudflare Workers is our serverless platform that runs your code in 250+ cities worldwide.
On the Workers team, we have a policy:
A change to the Workers Runtime must never break an application that is live in production.
It seems obvious enough, but this policy has deep consequences. What if our API has a bug, and some deployed Workers accidentally depend on that bug? Then, seemingly, we can’t fix the bug! That sounds… bad?
This post will dig deeper into our policy, explaining why Workers is different from traditional server stacks in this respect, and how we’re now making backwards-incompatible changes possible by introducing “compatibility dates”.
TL;DR: Developers may now opt into backwards-incompatible fixes by setting a compatibility date.
Serverless demands strict compatibility
Workers is a serverless platform, which means we maintain the server stack for you. You do not have to manage the runtime version, you only manage your own code. This means that when we update the Workers Runtime, we update it for everyone. We do this at least once a week, sometimes more.
This means that if a runtime upgrade breaks someone’s application, it’s really bad. The developer didn’t make any change, so won’t be watching for problems. They may be asleep, or on vacation. If we want people to trust serverless, we can’t let this happen.
This is very different from traditional server platforms, where the developer maintains their own stack. For example, when a developer maintains a traditional VM-based server running Node.js applications, then the developer must decide exactly when to upgrade to a new version of Node.js. Careful developers do not upgrade Node.js 14 to Node.js 16 in production without testing first. They typically verify that their application works in a staging environment before going to production. A developer who doesn’t have time to spend testing each new version may instead choose to rely on a long-term support release, applying only low-risk security patches.
In the old world, if the Node.js maintainers decide to make a breaking change to an obscure API between releases, it’s OK. Downstream developers are expected to test their code before upgrading, and address any breakages. But in the serverless world, it’s not OK: developers have no control over when upgrades happen, therefore upgrades must never break anything.
But sometimes we need to fix things
Sometimes, we get things wrong, and we need to fix them. But sometimes, the fix would break people.
For example, in Workers, the fetch() function is used to make outgoing HTTP requests. Unfortunately, due to an oversight, our original implementation of fetch(), when given a non-HTTP URL, would silently interpret it as HTTP instead. For example, if you did fetch(“ftp://example.com”), you’d get the same result as fetch(“http://example.com”).
This is obviously not what we want and could lead to confusion or deeper bugs. Instead, fetch() should throw an exception in these cases. However, we couldn’t simply fix the problem, because a surprising number of live Workers depended on the behavior. For whatever reason, some Workers fetch FTP URLs and expect to get a result back. Perhaps they are fetching from sites that support both FTP and HTTP, and they arbitrarily chose FTP and it worked. Perhaps the fetches aren’t actually working, but changing a 404 error result into an exception would break things worse. When you have tens of thousands of new developers deploying applications every month, inevitably there’s always someone relying on any bug. We can’t “fix” the bug because it would break these applications.
The obvious solutions don’t work
Could we contact developers and ask them to fix their code?
No, because the problem is our fault, not the application developer’s, and the developer may not have time to help us fix our problems.
The fact that a Worker is doing something “wrong” — like using an FTP URL when they should be using HTTP — doesn’t necessarily mean the developer did anything wrong. Everyone writes code with bugs. Good developers rely on careful testing to make sure their code does what it is supposed to.
But what if the test only worked because of a bug in the underlying platform that caused it to do the right thing by accident? Well, that’s the platform’s fault. The developer did everything they could: they tested their code thoroughly, and it worked.
Developers are busy people. Nobody likes hearing that they need to drop whatever they are doing to fix a problem in code that they thought worked — especially code that has been working fine for years without anyone touching it. We think developers have enough on their plates already, we shouldn’t be adding more work.
Could we run multiple versions of the Workers Runtime?
No, for three reasons.
First, in order for edge computing to be effective, we need to be able to host a very large number of applications in each instance of the Workers Runtime. This is what allows us to run your code in hundreds of locations around the world at minimal cost. If we ran a separate copy of the runtime for each application, we’d need to charge a lot more, or deploy your code to far fewer locations. So, realistically it is infeasible for us to have different Workers asking for different versions of the runtime.
Second, part of the promise of serverless is that developers shouldn’t have to worry about updating their stack. If we start letting people pin old versions, then we have to start telling people how long they are allowed to do so, alerting people about security updates, giving people documentation that differentiates versions, and so on. We don’t want developers to have to think about any of that.
Third, this doesn’t actually solve the real problem anyway. We can easily implement multiple behaviors within the same runtime binary. But how do we know which behavior to use for any particular Worker?
Introducing Compatibility Dates
Going forward, every Worker is assigned a “compatibility date”, which must be a date in the past. The date is specified inside the project’s metadata (for Wrangler projects, in wrangler.toml). This metadata is passed to the Cloudflare API along with the application code whenever it is updated and deployed. A compatibility date typically starts out as the date when the Worker was first created, but can be updated from time to time.
# wrangler.toml
compatibility_date = "2021-09-20"
We can now introduce breaking changes. When we do, the Workers Runtime must implement both the old and the new behavior, and chooses behavior based on the compatibility date. Each time we introduce a new change, we choose a date in the future when that change will become the default. Workers with a later compatibility date will see the change; Workers with an older compatibility date will retain the old behavior.
A page in our documentation lists the history of breaking changes — and only breaking changes. When you wish to update your Worker’s compatibility date, you can refer to this page to quickly determine what might be affected, so that you can test for problems.
We will reserve the compatibility system strictly for changes which cannot be made without causing a breakage. We don’t want to force people to update their compatibility date to get regular updates, including new features, non-breaking bug fixes, and so on.
If you’d prefer never to update your compatibility date, that’s OK! Old compatibility dates are intended to be supported forever. However, if you are frequently updating your code, you should update your compatibility date along with it.
Acknowledgement
While the details are a bit different, we were inspired by Stripe’s API versioning, as well as the absolute promise of backwards compatibility maintained by both the Linux kernel system call API and the Web Platform implemented by browsers.
Last year, I wrote about the Cloudflare Workers security model, including how we fight Spectre attacks. In that post, I explained that there is no known complete defense against Spectre — regardless of whether you’re using isolates, processes, containers, or virtual machines to isolate tenants. What we do have, though, is a huge number of tools to increase the cost of a Spectre attack, to the point where it becomes infeasible. Cloudflare Workers has been designed from the very beginning with protection against side channel attacks in mind, and because of this we have been able to incorporate many defenses that other platforms — such as virtual machines and web browsers — cannot. However, the performance and scalability requirements of edge compute make it infeasible to run every Worker in its own private process, so we cannot rely on the usual defenses provided by the operating system kernel and address space separation.
Given our different approach, we cannot simply rely on others to tell us if we are safe. We had to do our own research. To do this we partnered with researchers at Graz Technical University (TU Graz) to study the impact of Spectre on our environment. The team at TU Graz are some of the foremost experts on the topic, having co-discovered Spectre initially as well as discovered several follow-on bugs like NetSpectre, ZombieLoad, Fallout, and others.
Today we are publishing a paper describing our findings, authored by Martin Schwarzl, Pietro Borrello, Andreas Kogler, Thomas Schuster, Daniel Gruss, Michael Schwarz, and myself. This paper covers research done in 2019 and early 2020. The research both tests the possibility of attacking Workers using Spectre, and proposes a new defense mechanism, which we now employ in production.
For this research, the team at TU Graz had full access to the Workers Runtime source code and were able to compile and run it locally for testing.
The research has two basic components.
Part 1: Develop an attack
A side channel attack (of which Spectre is one variety) is kind of like playing poker with a CPU. In poker, players try to understand what their opponents are thinking by looking for subtle unconscious behaviors, such as a nervous look or a hand motion. These behaviors are called “tells”. In a side channel attack, the attacker wants to find out secrets that the CPU knows. The CPU won’t reveal these secrets directly, but they can sometimes subtly affect how long the CPU spends to perform certain operations, kind of like a poker tell. If an attacker can carefully time the CPU’s actions, they can potentially discover the underlying secrets. Spectre attacks in particular focus on side channels that result from the CPU’s use of speculative execution, in which the CPU executes code that it is not yet sure should be executed, and then attempts to roll it back if not. Speculative execution is a particularly potent tool in side channel attacks because it essentially allows the attacker to program custom side channels in speculatively-executed code.
Many Spectre defenses focus on eliminating the “tells” by trying to prevent the variability in the CPU’s timing. This is hard, because CPUs are extremely complex and there are many ways that their timing can be affected. While many specific “tells” have been found and mitigated, there are undoubtedly many more that haven’t been disclosed. This has led to a game of whack-a-mole, where researchers continuously find new “tells” while CPU vendors rush out kernel and microcode patches to solve them — often with large performance losses as a side effect.
In Workers, we have focused on a different approach: preventing the attacker from seeing the “tells”. The Workers Runtime is designed to prevent a Worker from measuring its own execution time, as well as to prevent other forms of non-deterministic behavior like multithreading that could be used in place of a timer. I described these techniques in detail in last year’s post.
However, this approach can’t be perfect as long as Workers are allowed to talk to the rest of the world. A Worker could always communicate with a remote time server to measure time. Such communications will be far less accurate than a local timer, and since the timing differences are extremely small, they will be hard to measure this way. But, by using amplification techniques to improve the strength of the signal, repeating the attack many times and applying statistics, it could still be possible to derive secrets.
We therefore set out to develop an attack based on this approach. Upon applying the best techniques available to us, we were indeed able to produce a working Spectre variant 1 attack that could leak memory at a rate of 120 bits per hour. Compared to attacks demonstrated on many other platforms, 120 bits per hour is pretty slow. However, it’s obviously still fast enough to be a problem.
It’s important to note, though, that this speed was achieved in an ideal scenario:
Since the Workers Runtime prevents Workers from measuring their own execution time, any attack would need to rely on a remote time server. But for the purpose of our test, the “remote” server was in fact located on the same machine. In a real-world scenario, such a server would need to be accessed over the Internet, making the timing less accurate.
The machine running the test had no other load. A real-world machine would be processing hundreds or thousands of requests concurrently, creating noise.
The attack only demonstrated that it could read some bits that it shouldn’t. In order to read interesting bits, an attacker would first need to locate those bits, which likely would require reading hundreds or thousands of other bits first.
In the real world, these factors appear to make an attack too slow to be interesting. If an attack takes days or weeks to carry out, the contents of memory are highly likely to change before it can read them. For example, we update the Workers Runtime code at least once a week, which causes a restart of all processes.
That said, we did not feel comfortable relying on this argument as our defense. Instead, we set out to do better.
Part 2: Enhance our defenses
In the second part of the research, we designed and implemented a novel Spectre defense which we call Dynamic Process Isolation.
In short, our defense uses hardware performance counters to detect Workers whose performance characteristics could be indicative of an attack. Before the attack has had enough time to leak any bits, we move the Worker into a separate operating system process, thus taking advantage of the additional defenses implemented by the OS kernel. Crucially, since a benign Worker can still operate normally while in an isolated process, we are able to use a detector that produces false positives, as long as the rate is relatively low. This affordance made it possible for us to develop a working classifier where previous work in the area had struggled.
Specifically, we developed a detector based on measuring branch mispredictions. Spectre variant 1 attacks — the fastest and easiest kind of Spectre attack — work by fooling the CPU’s branch predictor to trigger speculative code execution. Such an attack, when running in our environment, must trigger repeated mispredictions in a loop, in order to get enough data to apply statistics to overcome the noise floor. We can see these mispredictions in the hardware performance counters. While an attack could try to evade the detector by spreading out its trials over a longer time period, doing so would slow down the attack by orders of magnitude, which is exactly our goal. Classifiers for other Spectre variants might be straightforward to build as well, however, we find other variants already produce much lower bandwidth or are otherwise effectively mitigated by our existing defenses.
This defense successfully detects and mitigates the attack we developed. We also tested it against a number of Spectre proofs of concept and found it caught all of them. Meanwhile, the rate of false positives is well within the range we can tolerate: Out of many thousands of Workers running on our platform, we see only about 20 being falsely detected as attacks.
Collaborating with TU Graz was a great experience. We are very happy to work with some of the world’s foremost experts on this problem, and to have produced not just an attack but also a constructive defense.
For many developers, the term Web3 feels like a buzzword — it’s the sort of thing you see on a popular “Things you need to learn in 2021” tweet. As a software developer, I’ve spent years feeling the same way. In the last few months, I’ve taken a closer look at the Web3 ecosystem, to better understand how it works, and why it matters.
Web3 can generally be described as a decentralized evolution of the Internet. Instead of a few providers acting as the mediators of how your interactions and daily life on the web should work, a Web3-based future would liberate your data from proprietary databases and operate without centralization via the incentive structure inherent in blockchains.
The Web3 space in 2021 looks and feels much different from what it did a few years ago. Blockchains like Ethereum are handling incredible amounts of traffic with relative ease — although some improvements are needed — and newer blockchains like Solana have entered the space as genuine alternatives that could alleviate some of the scaling issues we’ve seen in the past few years.
Cloudflare is incredibly well-suited to empower developers to build the future with Web3. The announcement of Cloudflare’s Ethereum gateway earlier today will enable developers to build scalable Web3 applications on Cloudflare’s reliable network. Today, we’re also releasing an open-source example showing how to deploy, mint, and render NFTs, or non-fungible tokens, using Cloudflare Workers and Cloudflare Pages. You can try it out here, or check out the open-source codebase on GitHub to get started deploying your own NFTs to production.
The problem Web3 solves
When you begin to read about Web3 online, it’s easy to get excited about the possibilities. As a software developer, I found myself asking: “What actually is a Web3 application? How do I build one?“
Most traditional applications make use of three pieces: the database, a code interface to that database, and the user interface. This model — best exemplified in the Model-View-Controller (MVC) architecture — has served the web well for decades. In MVC, the database serves as the storage system for your data models, and the controller determines how clients interact with that data. You define views with HTML, CSS and JavaScript that take that data and display it, as well as provide interactions for creating and updating that data.
Imagine a social media application with a billion users. In the MVC model, the data models for this application include all the user-generated content that are created daily: posts, friendships, events, and anything else. The controllers written for that application determine who can interact with that data internally; for instance, only the two users in a private conversation can access that conversation. But those controllers — and the application as a whole — don’t allow external access to that data. The social media application owns that data and leases it out “for free” in exchange for viewing ads or being tracked across the web.
This was the lightbulb moment for me: understanding how Web3 offers a compelling solution to these problems. If the way MVC-based, Web 2.0 applications has presented itself is as a collection of “walled gardens” — meaning disparate, closed-off platforms with no interoperability or ownership of data — Web3 is, by design, the exact opposite.
In Web3 applications, there are effectively two pieces. The blockchain (let’s use Ethereum as our example), and the user interface. The blockchain has two parts: an account, for a user, a group of users, or an organization, and the blockchain itself, which serves as an immutable system of record of everything taking place on the network.
One crucial aspect to understand about the blockchain is the idea that code can be deployed to that blockchain and that users of that blockchain can execute the code. In Ethereum, this is called a “smart contract”. Smart contracts executed against the blockchain are like the controller of our MVC model. Instead of living in shrouded mystery, smart contracts are verifiable, and the binary code can be viewed by anyone.
For our hypothetical social media application, that means that any actions taken by a user are not stored in a central database. Instead, the user interacts with the smart contract deployed on the blockchain network, using a program that can be verified by anyone. Developers can begin building user interfaces to display that information and easily interact with it, with no walled gardens or platform lock-in. In fact, another developer could come up with a better user interface or smart contract, allowing users to move between these interfaces and contracts based on which aligns best with their needs.
Operating with these smart contracts happens via a wallet (for instance, an Ethereum wallet managed by MetaMask). The wallet is owned by a user and not by the company providing the service. This means you can take your wallet (the final authority on your data) and do what you want with it at any time. Wallets themselves are another programmable aspect of the blockchain — while they can represent a single user, they can also be complex multi-signature wallets that represent the interests of an entire organization. Owners of that wallet can choose to make consensus decisions about what to do with their data.
people are talking trash about "web3" as a term,
but having all my data on multiple websites is cool
and having websites compete on interfaces for the same data is rad
One of the biggest recent shifts in the Web3 space has been the growth of NFTs — non-fungible tokens. Non-fungible tokens are unique assets stored on the blockchain that users can trade and verify ownership of. In 2019, Cloudflare was already writing about NFTs, as part of our announcement of the Cloudflare Ethereum Gateway. Since then, NFTs have exploded in popularity, with projects like CryptoPunks and Bored Ape Yacht Club trading millions of dollars in volume monthly.
NFTs are a fascinating addition to the Web3 space because they represent how ownership of data and community can look in a post-walled garden world. If you’ve heard of NFTs before, you may know them as a very visual medium: CryptoPunks and Bored Ape Yacht Club are, at their core, art. You can buy a Punk or Ape and use it as your profile picture on social media. But underneath that, owning an Ape isn’t just owning a profile picture; they also have exclusive ownership of a blockchain-verified asset.
It should be noted that the proliferation of NFT contracts led to an increase in the number of scams. Blockchain-based NFTs are a medium of conveying ownership, based on a given smart contract. This smart contract can be deployed by anyone, and associated with any content. There is no guarantee of authenticity, until you verify the trustworthiness and identity of the contract you are interacting with. Some platforms may support Verified accounts, while others are only allowing a set of trusted partners to appear on their platform. NFTs are flexible enough to allow multiple approaches, but these trust assumptions have to be communicated clearly.
That asset, tied to a smart contract deployed on Ethereum, can be traded, verified, or used as a way to gate access to programs. An NFT developer can hook into the trade event for their NFTs and charge a royalty fee, or when “minting”, or creating an NFT, they can charge a mint price, generating revenue on sales and trades to fund their next big project. In this way, NFTs can create strong incentive alignment between developers and community members, more so than your average web application.
What we built
To better understand Web3 (and how Cloudflare fits into the puzzle), we needed to build something using the Web3 stack, end-to-end.
To allow you to do the same, we’re open-sourcing a full-stack application today, showing you how to mint and manage an NFT from start to finish. The smart contract for the application is deployed and verified on Ethereum’s Rinkeby network, which is a testing environment for Ethereum projects and smart contracts. The Rinkeby test network allows you to test the smart contract off of the main blockchain, using the exact same workflow, without using real ethers. When your project is ready to be deployed on Ethereum’s Mainnet, you can take the same contract, deploy and verify it, and begin using it in production.
Once deployed, the smart contract will provide the ability to manage your NFT project, compliant with the ERC-721 spec, that can be minted by users, displayed on NFT marketplaces like OpenSea and your own web applications. We also provided a web interface and example code for minting these NFTs — as a user, you can visit the web application with a compatible Ethereum wallet installed and claim a NFT.
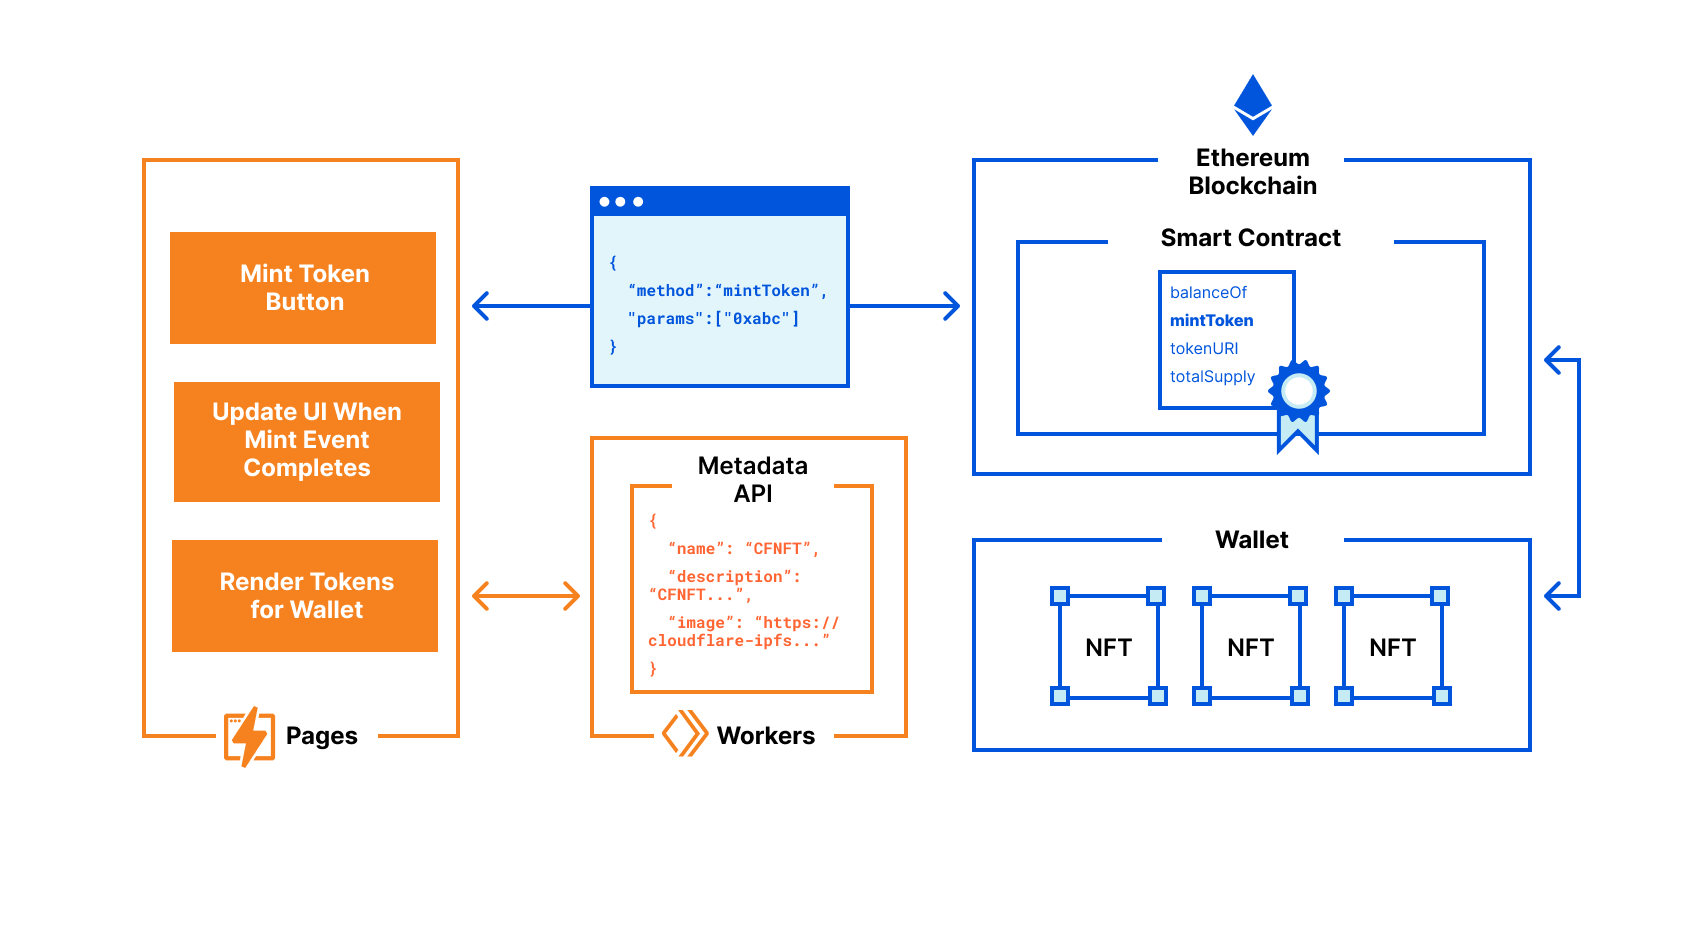
Once you’ve minted the NFT, the example user interface will render the metadata for each claimed NFT. According to the ERC-721 (NFT) spec, a deployed token must have a corresponding URL that provides JSON metadata. This JSON endpoint, which we’ve built with Cloudflare Workers, returns a name and description for each unique NFT, as well as an image. To host this image, we’ve used Infura to pin the service, and Cloudflare IPFS Gateway to serve it. Our NFT identifies the content via its hash, making it not replaceable with something different in the future.
This open-source project provides all the tools that you need to build an NFT project. By building on Workers and Pages, you have all the tools you need to scale a successful NFT launch, and always provide up-to-date metadata for your NFT assets as users mint and trade them between wallets.
Architecture diagram of Cloudflare’s open-source NFT project
Cloudflare + Web3
Cloudflare’s developer platform — including Workers, Pages, and the IPFS gateway — works together to provide scalable solutions at each step of your NFT project’s lifecycle. When you move your NFT project to production, Cloudflare’s Ethereum and IPFS gateways are available to handle any traffic that your project may have.
We’re excited about Web3 at Cloudflare. The world is shifting back to a decentralized model of the Internet, the kind envisioned in the early days of the World Wide Web. As we say a lot around Cloudflare, The Network is the Computer — we believe that whatever form Web3 may take, whether through projects like Metaverses, DAOs (decentralized autonomous organizations) and NFTs for community and social networking, DeFi (decentralized finance) applications for managing money, and a whole class of decentralized applications that we probably haven’t even thought of… Cloudflare will be foundational to that future.
We’re excited to announce Cloudflare R2 Storage! By giving developers the ability to store large amounts of unstructured data, we’re expanding what’s possible with Cloudflare while slashing the egress bandwidth fees associated with typical cloud storage services to zero.
Cloudflare R2 Storage includes full S3 API compatibility, working with existing tools and applications as built.
Let’s get into the R2 details.
R2 means “Really Requestable”
Object Storage, sometimes referred to as blob storage, stores arbitrarily large, unstructured files. Object storage is well suited to storing everything from media files or log files to application-specific metadata, all retrievable with consistent latency, high durability, and limitless capacity.
The most familiar API for Object Storage, and the API R2 implements, is Amazon’s Simple Storage Service (S3). When S3 launched in 2006, cloud storage services were a godsend for developers. It didn’t happen overnight, but over the last fifteen years, developers have embraced cloud storage and its promise of infinite storage space.
As transformative as cloud storage has been, a downside emerged: actually getting your data back. Over time, companies have amassed massive amounts of data on cloud provider networks. When they go to retrieve that data, they’re hit with massive egress fees that don’t correspond to any customer value — just a tax developers have grown accustomed to paying.
Enter R2.
Traditional object storage charges developers for three things: bandwidth, storage size and storage operations.
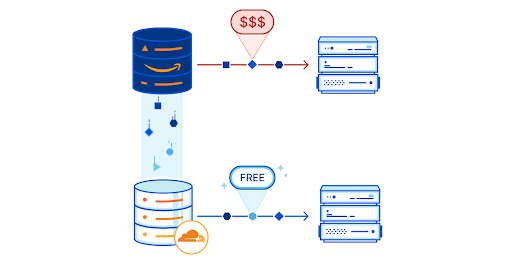
R2 builds on Cloudflare’s commitment to the Bandwidth Alliance, providing zero-cost egress for stored objects — no matter your request rate. Egress bandwidth is often the largest charge for developers utilizing object storage and is also the hardest charge to predict. Eliminating it is a huge win for open-access to data stored in the cloud.
That doesn’t mean we are shifting bandwidth costs elsewhere. Cloudflare R2 will be priced at $0.015 per GB of data stored per month — significantly cheaper than major incumbent providers.
Infrequent access to objects is often trivial for providers to support yet incurs the same per-operation charges. We don’t think it’s fair that typical object storage bills a developer making one request a second the same rate as an enterprise making thousands of requests a second — or frequently a higher rate when considering negotiated volume discounts.
On the flip side, providers designed for infrequent access typically can’t scale to heavy usage.
R2 will zero-rate infrequent storage operations under a threshold — currently planned to be in the single digit requests per second range. Above this range, R2 will charge significantly less per-operation than the major providers. Our object storage will be extremely inexpensive for infrequent access and yet capable of and cheaper than major incumbent providers at scale.
This cheaper price doesn’t come with reduced scalability. Behind the scenes, R2 automatically and intelligently manages the tiering of data to drive both performance at peak load and low-cost for infrequently requested objects. We’ve gotten rid of complex, manual tiering policies in favor of what developers have always wanted out of object storage: limitless scale at the lowest possible cost.
R2 means “Repositioning Records”
Zero egress means you can get objects out easily, but what about putting objects in? Migrating data across cloud providers, even if they both support the complete S3 API, is error-prone and costly.
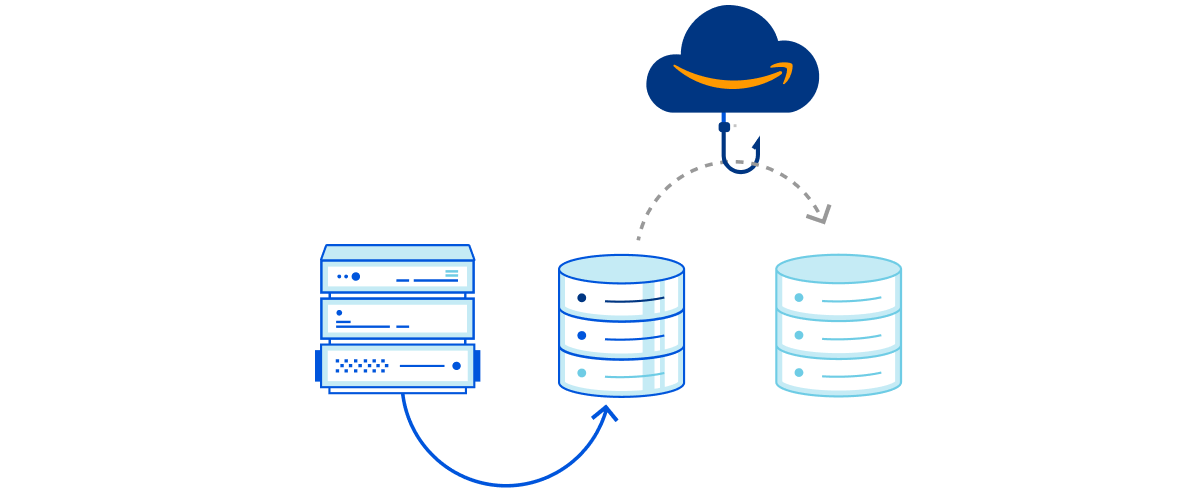
To make this easy for you, without requiring you to change any of your tooling, Cloudflare R2 will include automatic migration from other S3-compatible cloud storage services. Migrations are designed to be dead simple. After specifying an existing storage bucket, R2 will serve requests for objects from the existing bucket, egressing the object only once before copying and serving from R2. Our easy-to-use migrator will reduce egress costs from the second you turn it on in the Cloudflare dashboard.
Our vision for R2 includes multi-region storage that automatically replicates objects to the locations they’re frequently requested from. As with Durable Objects, we plan on introducing jurisdictional restrictions that allow developers to comply with complex data sovereignty requirements via a simple API.
R2 means “Ridiculously Reliable”
The core of what makes Object Storage great is reliability — we designed R2 for data durability and resilience at its core. R2 will provide 99.999999999% (eleven 9’s) of annual durability, which describes the likelihood of data loss. If you store 1,000,000 objects on R2, you can expect to lose one once every 100,000 years — the same level of durability as other major providers. R2 will be resistant to regional failures, replicating objects multiple times for high availability.
R2 is designed with redundancy across a large number of regions for reliability. We plan on starting from automatic global distribution and adding back region-specific controls for when data has to be stored locally, as described above.
R2 means “Radically Reprogrammable”
R2 is fully integrated with the Cloudflare Workers serverless runtime. You can bind a Worker to a specific bucket, dynamically transforming objects as they are written to or read from storage buckets. The deep integration between Workers and R2 makes building data pipelines and manipulating objects incredibly easy.
Cloudflare R2 is designed to easily integrate with the rest of Cloudflare’s products. As a few examples, our plan is to allow Durable Objects to be configured with R2 as a backup target, and provide automatic integration between R2 and Cloudflare cache to greatly extend cache lifetimes for infrequently changing objects.
What will you be able to build with Cloudflare R2?
There’s a lot you can do with long-term storage, especially with access to the Workers compute platform just alongside it.
For example, streaming data from a large number of IoT devices becomes a breeze with R2. Starting with a Worker to transform and manipulate the data, R2 can ingest large volumes of sensor data and store it at low cost. With no egress fees, it becomes simple to migrate volumes of data to multiple databases and analytics solutions as needed, dramatically reducing storage costs. With the ability to run a Worker on the outgoing data as well, the data pipeline itself is more flexible.
R2 is also a great place for CDN assets and large media files. For large files, R2 can significantly extend cache lifetimes while dramatically slashing egress bills. Combined with the Cache API and Workers, content can be dynamically cached for low-latency access around the globe.
More than anything, R2’s lack of egress bandwidth charges makes it ideal for storing content that’s accessed frequently. Today, R2 scales well to handle heavy request loads, dynamically tiering your objects to provide the best performance at the lowest cost. This dynamic tiering allows us to offer the lowest prices while supporting peak performance — with no user configuration required.
Accessing Cloudflare R2
R2 is currently under development — you can sign up here to join the waitlist for access. We’re excited to work with a number of earlier users to refine and test the product. We’ll be announcing an open beta where any user will be able to sign up for the service soon.
We’re excited to continue to build the product and push towards open beta, and we have big ideas for what the future of storage at Cloudflare’s edge could look like. If you’re a distributed systems engineer who wants to help us build the future of state at the edge, come work with us!
Over the course of this summer, I had the incredible opportunity to join the Workers Developer Productivity team and help improve the developer experience of Workers. Today, I’ll talk about my project to implement the OAuth 2.0 login protocol for Wrangler, the Workers command line interface (CLI).
Wrangler needs to be authorized in order to carry out its job. API tokens are one way to authorize Wrangler, but they do not provide the best user experience as the user needs to manually copy and paste their tokens. This is where the OAuth 2.0 protocol comes into play.
Wrangler login and OAuth 2.0
Previously, the wrangler login command used API tokens to authenticate Wrangler. However, managing API tokens can sometimes be cumbersome, since you need to go to the Cloudflare dashboard to create or modify a token. By using OAuth 2.0, we can allow users to directly choose permissions or scopes from Wrangler. OAuth 2.0 helps simplify the login process while making it more secure.
OAuth 2.0 is an industry-standard protocol for allowing users to authorize applications without having to share a password. In order to understand this protocol, we need to define some terminology:
Resource Owner:an entity capable of granting access to a protected resource. This is the user.
Resource Server:the server hosting the protected resource. This is the Cloudflare API.
Client:an application making protected resource requests on behalf of the resource owner and with its authorization. This is Wrangler, making API calls on the behalf of the user.
Authorization Server:The server issuing access tokens to the client after successfully authenticating the resource owner and obtaining authorization. This is our OAuth 2.0 service provider.
The protocol has several flows, but they all share the same objective. The resource owner needs to explicitly grant permission to the client, which can then receive an access token from the authorization server. With this access token, the client is authorized to access protected resources stored on the resource server.
Authorization Code Flow
Among the different types of flows that make up the OAuth 2.0 protocol, Wrangler implements the Authorization Code Flow with PKCE challenges. Let’s take a look at what this entails!
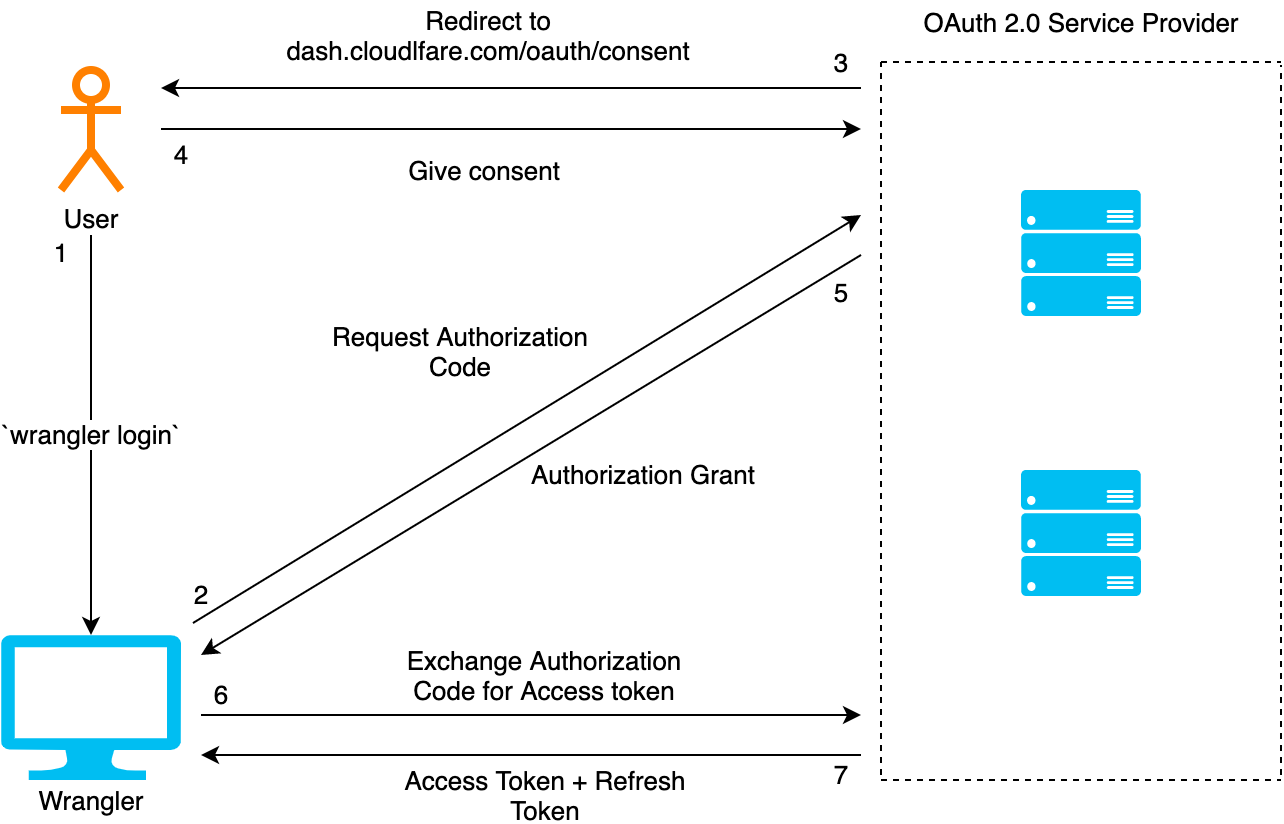
When running wrangler login, the user is first prompted to log in to the Cloudflare dashboard. Once they are logged in, they are redirected to an authorization page, where they can decide to grant or deny authorization to Wrangler. If authorization is granted, Wrangler receives an authorization grant from the OAuth service provider. Once received, Wrangler exchanges the authorization grant for an access token and a refresh token. At this point, Wrangler stores both of these tokens on disk and uses the access token to make authorized API calls. Since the access token is short-lived, refresh tokens are used to update an expired access token. Throughout this flow, Wrangler and the OAuth service provider also use additional measures to verify the identity of each other, as later described in the Security section of this blog.
Use what you need, only when you need it
In addition to providing a smoother developer experience, the new wrangler login also allows a user to specify which scopes they need. For example, if you would like to have an OAuth token with just account and user read permissions, you can do so by running:
wrangler login --scopes account:read user:read
For more information about the currently available scopes, you can run wrangler login --scopes-list or visit the Wrangler login documentation.
Revoke access at any time
The OAuth 2.0 protocol also defines a flow to revoke authorization from Wrangler. In this workflow, a user can deny Wrangler access to protected resources by simply using the command wrangler logout. This command will make a request to the OAuth 2.0 service provider and invalidate the refresh token, which will automatically invalidate the associated access token.
Security
The OAuth integration also brings improved security by using Cross-Site Request Forgery (CSRF) states, Proof Key for Code Exchange (PKCE) challenges, and short-lived access tokens.
Throughout the first part of the wrangler login flow, Wrangler needs to request an authorization grant. In order to avoid the possibility of a forged response, Wrangler includes a CSRF state in the parameters of the authorization code request. The CSRF state is a unique randomly generated value, which is used to confirm the response received from the OAuth service provider. In addition to the CSRF state, Wrangler will also include a PKCE code_challenge. This code_challenge will be used by the OAuth service provider to verify that Wrangler is the same application when exchanging the authorization grant for an access token. The PKCE challenge is a protection against stolen authorization grants. As the OAuth service provider will reject access token requests if it cannot verify the PKCE code_challenge.
The final way the new OAuth workflow improves security is by making access tokens short-lived. In this sense, if an access token gets stolen, how can we notify the resource server that the access token should not be trusted? Well, we can’t really. So, there are three options: 1) wait until the expiration time; 2) use the refresh token to get a new access token, which invalidates the previous access token; or 3) invalidate both refresh and access tokens. This provides us with three ways to protect resources from bad actors with stolen access tokens.
What’s next
OAuth 2.0 integration is now available in the 1.19.3 version release of Wrangler. Try it out and let us know your experience. If you prefer the API tokens or global API keys, no worries. You can still access them using the wrangler config command.
I would also like to thank the Workers team and other Cloudflare teams for the incredible internship experience. This opportunity gave me a glimpse into what industry software development looks like, and the opportunity to dive deep into a meaningful project. I enjoyed the responsiveness and teamwork during the internship, making this a great summer.
In the year since Cloudflare’s launch of Workers Unbound, developers have unlocked the ability to run computationally intensive workloads on the Cloudflare edge network — like image processing, game logic, and other complex algorithms. With all that additional computing power comes a host of questions around performance. Our customers often ask us how they can profile or monitor their Workers to see where they spend the most CPU time, or to see whether their changes improve performance.
Here at Cloudflare, we not only want to build the fastest, most affordable, and most flexible compute platform at the edge; we also want to make the lives of our developers easier in building their applications. To do this, Cloudflare has begun to integrate with existing tools — places our developers feel comfortable and efficient in their day-to-day work. To help measure performance of our customers’ Workers, we’re beginning to integrate with the Chrome DevTools protocol. Just like you can use chrome://inspect to debug your Node backend, you can also use it to profile your Cloudflare Workers.
Introducing Chrome DevTools Integration (Beta)
We’re starting off this integration with beta support for local CPU profiling, using Wrangler. To show off how to use this feature, I’m going to be optimizing a simple JavaScript program which outputs the first thousand integers separated by a space. Let’s start by installing the latest version of Wrangler. We’ll also need a Worker cloned down to your local machine. I’ll be using Workers Profiling Example, but feel free to use any CPU intensive Worker for this tutorial.
For reference, my sample code is below. You’ll notice this code is intentionally performing a computation that will slow down our Worker.
addEventListener("fetch", event => {
  event.respondWith(handleRequest(event.request));
});

async function handleRequest(request) {
  let body = '';
  for (let i = 0; i < 1000; ++i) {
    body = body + ' ' + i;
  }

  return new Response(body, {
    headers: { 'content-type': 'text/plain' },
  });
}
To confirm this, we’ll run Chrome DevTools and profile our Worker locally. In the directory of your sample project, run wrangler dev --inspect. To launch the DevTools, open chrome://inspect in Chrome or Chromium. You’ll see Chrome’s DevTools homepage pop up:
Click ‘Configure’ and add localhost://9230 as one of the targets. You should see wrangler[{Worker name}] appear under “Remote Targets”, where {Worker name} is the name of your project.
Click ‘inspect’, then in the popup, ‘Profiler’.
Click ‘Start’ and, in a different browser tab, make a few requests to your site, then click ‘Stop’. It should be available locally on localhost:8787.
Analyze the flame graph. For my Slow Worker, I see the following graph:
When I click on handleRequest, I see the following annotated source of my Worker:
In particular, it shows that, unsurprisingly, most of the time is being spent on memory allocations in the body of the loop. Note that the profiler is not always accurate with regard to exact timing, but does paint a picture of your largest bottlenecks.
Understanding the Profile
The profiler works by gathering a stack trace of your program at a sampled rate, so remember that the profile is an approximation of where your code tends to spend the majority of its execution time, and is not meant to be perfectly accurate. In fact, functions that execute in less than 100 microseconds have a chance to not appear in the profile at all.
What’s Next?
With the Workers platform, we’re striving to build in the observability our users expect out of a robust compute platform. We’d love to hear more from the community about ways we can improve visibility into the code you’re writing on the edge. If you haven’t already, please join the Cloudflare Workers Discord community at https://discord.gg/PX8s2TmJ7s. Happy building!
This post explains how we implemented the Cloudflare Images product with reusable Rust libraries and Cloudflare Workers. It covers the technical design of Cloudflare Image Resizing and Cloudflare Images. Using Rust and Cloudflare Workers helps us quickly iterate and deliver product improvements over the coming weeks and months.
Reuse of code in Rusty image projects
We developed Image Resizing in Rust. It’s a web server that receives HTTP requests for images along with resizing options, fetches the full-size images from the origin, applies resizing and other image processing operations, compresses, and returns the HTTP response with the optimized image.
Rust makes it easy to split projects into libraries (called crates). The image processing and compression parts of Image Resizing are usable as libraries.
We also have a product called Polish, which is a Golang-based service that recompresses images in our cache. Polish was initially designed to run command-line programs like jpegtran and pngcrush. We took the core of Image Resizing and wrapped it in a command-line executable. This way, when Polish needs to apply lossy compression or generate WebP images or animations, it can use Image Resizing via a command-line tool instead of a third-party tool.
Reusing libraries has allowed us to easily unify processing between Image Resizing and Polish (for example, to ensure that both handle metadata and color profiles in the same way).
Cloudflare Images is another product we’ve built in Rust. It added support for a custom storage back-end, variants (size presets), support for signing URLs and more. We made it as a collection of Rust crates, so we can reuse pieces of it in other services running anywhere in our network. Image Resizing provides image processing for Cloudflare Images and shares libraries with Images to understand the new URL scheme, access the storage back-end, and database for variants.
How Image Resizing works
The Image Resizing service runs at the edge and is deployed on every server of the Cloudflare global network. Thanks to Cloudflare’s global Anycast network, the closest Cloudflare data center will handle eyeball image resizing requests. Image Resizing is tightly integrated with the Cloudflare cache and handles eyeball requests only on a cache miss.
There are two ways to use Image Resizing. The default URL scheme provides an easy, declarative way of specifying image dimensions and other options. The other way is to use a JavaScript API in a Worker. Cloudflare Workers give powerful programmatic control over every image resizing request.
How Cloudflare Images work
Cloudflare Images consists of the following components:
The Images core service that powers the public API to manage images assets.
The Image Resizing service responsible for image transformations and caching.
The Image delivery Cloudflare Worker responsible for serving images and passing corresponding parameters through to the Imaging Resizing service.
Image storage that provides access and storage for original image assets.
To support Cloudflare Images scenarios for image transformations, we made several changes to the Image Resizing service:
Added access to Cloudflare storage with original image assets.
Added access to variant definitions (size presets).
Added support for signing URLs.
Image delivery
The primary use case for Cloudflare Images is to provide a simple and easy-to-use way of managing images assets. To cover egress costs, we provide image delivery through the Cloudflare managed imagedelivery.net domain. It is configured with Tiered Caching to maximize the cache hit ratio for image assets. imagedelivery.net provides image hosting without a need to configure a custom domain to proxy through Cloudflare.
A Cloudflare Worker powers image delivery. It parses image URLs and passes the corresponding parameters to the image resizing service.
How we store Cloudflare Images
There are several places we store information on Cloudflare Images:
image metadata in Cloudflare’s core data centers
variant definitions in Cloudflare’s edge data centers
original images in core data centers
optimized images in Cloudflare cache, physically close to eyeballs.
Image variant definitions are stored and delivered to the edge using Cloudflare’s distributed key-value store called Quicksilver. We use a single source of truth for variants. The Images core service makes calls to Quicksilver to read and update variant definitions.
The rest of the information about the image is stored in the image URL itself: https://imagedelivery.net/<encoded account id>/<image id>/<variant name>
<image id> contains a flag, whether it’s publicly available or requires access verification. It’s not feasible to store any image metadata in Quicksilver as the data volume would increase linearly with the number of images we host. Instead, we only allow a finite number of variants per account, so we responsibly utilize available disk space on the edge. The downside of storing image metadata as part of <image id> is that <image id> will change on access change.
How we keep Cloudflare Images up to date
The only way to access images is through the use of variants. Each variant is a named image resizing configuration. Once the image asset is fetched, we cache the transformed image in the Cloudflare cache. The critical question is how we keep processed images up to date. The answer is by purging the Cloudflare cache when necessary. There are two use cases:
access to the image is changed
the variant definition is updated
In the first instance, we purge the cache by calling a URL: https://imagedelivery.net/<encoded account id>/<image id>
Then, the customer updates the variant we issue a cache purge request by tag: account-id/variant-name
To support cache purge by tag, the image resizing service adds the necessary tags for all transformed images.
How we restrict access to Cloudflare Images
The Image resizing service supports restricted access to images by using URL signatures with expiration. URLs are signed with an SHA-256 HMAC key. The steps to produce valid signatures are:
Take the path and query string (the path starts with /).
Compute the path’s SHA-256 HMAC with the query string, using the Images’ URL signing key as the secret. The key is configured in the Dashboard.
If the URL is meant to expire, compute the Unix timestamp (number of seconds since 1970) of the expiration time, and append ?exp= and the timestamp as an integer to the URL.
Append ? or & to the URL as appropriate (? if it had no query string; & if it had a query string).
Append sig= and the HMAC as hex-encoded 64 characters.
A signed URL looks like this:
A signed URL with an expiration timestamp looks like this:
Signature of /hello/world URL with a secret ‘this is a secret’ is 6293f9144b4e9adc83416d1b059abcac750bf05b2c5c99ea72fd47cc9c2ace34.
Direct creator uploads with Cloudflare Worker and KV
Similar to Cloudflare Stream, Images supports direct creator uploads. That allow users to upload images without API tokens. Everyday use of direct creator uploads is by web apps, client-side applications, or mobile apps where users upload content directly to Cloudflare Images.
Once again, we used our serverless platform to support direct creator uploads. The successful API call stores the account’s information in Workers KV with the specified expiration date. A simple Cloudflare Worker handles the upload URL, which reads the KV value and grants upload access only on a successful call to KV.
Future Work
Cloudflare Images product has an exciting product roadmap. Let’s review what’s possible with the current architecture of Cloudflare Images.
Resizing hints on upload
At the moment, no image transformations happen on upload. That means we can serve the image globally once it is uploaded to Image storage. We are considering adding resizing hints on image upload. That won’t necessarily schedule image processing in all cases but could provide a valuable signal to resize the most critical image variants. An example could be to generate an AVIF variant for the most vital image assets.
Serving images from custom domains
We think serving images from a domain we manage (with Tiered Caching) is a great default option for many customers. The downside is that loading Cloudflare images requires additional TLS negotiations on the client-side, adding latency and impacting loading performance. On the other hand, serving Cloudflare Images from custom domains will be a viable option for customers who set up a website through Cloudflare. The good news is that we can support such functionality with the current architecture without radical changes in the architecture.
Conclusion
The Cloudflare Images product runs on top of the Cloudflare global network. We built Cloudflare Images in Rust and Cloudflare Workers. This way, we use Rust reusable libraries in several products such as Cloudflare Images, Image Resizing, and Polish. Cloudflare’s serverless platform is an indispensable tool to build Cloudflare products internally. If you are interested in building innovative products in Rust and Cloudflare Workers, we’re hiring.
Just about four years ago, we announced Cloudflare Workers, a serverless platform that runs directly on the edge.
Throughout this week, we will talk about the many ways Cloudflare is helping make applications that already exist on the web faster. But if today is the day you decide to make your idea come to life, building your project on the Cloudflare edge, and deploying it directly to the tubes of the Internet is the best way to guarantee your application will always be fast, for every user, regardless of their location.
It’s been a few years since we talked about how Cloudflare Workers compares to other serverless platforms when it comes to performance, so we decided it was time for an update. While most of our work on the Workers platform over the past few years has gone into making the platform more powerful: introducing new features, APIs, storage, debugging and observability tools, performance has not been neglected.
Today, Workers is 30% faster than it was three years ago at P90. And it is 210% faster than Lambda@Edge, and 298% faster than Lambda.
How do you measure the performance of serverless platforms?
I’ve run hundreds of performance benchmarks between CDNs in the past — the formula is simple: we use a tool called Catchpoint, which makes requests from nodes all over the world to the same asset, and reports back on the time it took for each location to return a response.
Measuring serverless performance is a bit different — since the thing you’re comparing is the performance of compute, rather than a static asset, we wanted to make sure all functions performed the same operation.
In our 2018 blog on speed testing, we had each function simply return the current time. For the purposes of this test, “serverless” products that were not able to meet the minimum criteria of being able to perform this task were disqualified. Serverless products used in this round of testing executed the same function, of identical computational complexity, to ensure accurate and fair results.
It’s also important to note what it is that we’re measuring. The reason performance matters, is because it impacts the experience of actual end customers. It doesn’t matter what the source of latency is: DNS, network congestion, cold starts… the customer doesn’t care what the source is, they care about wasting time waiting for their application to load.
It is therefore important to measure performance in terms of the end user experience — end to end, which is why we use global benchmarks to measure performance.
The result below shows tests run from 50 nodes all over the world, across North America, South America, Europe, Asia and Oceania.
As you can see from the results, no matter where users are in the world, when it comes to speed, Workers can guarantee the best experience for customers.
In the case of Workers, getting the best performance globally requires no additional effort on the developers’ part. Developers do not need to do any additional load balancing, or configuration of regions. Every deployment is instantly live on Cloudflare’s extensive edge network.
Even if you’re not seeking to address a global audience, and your customer base is conveniently located on the East coast of the United States, Workers is able to guarantee the fastest response on all requests.
Above, we have the results just from Washington, DC, as close as we could get to us-east-1. And again, without any optimization, Workers is 34% faster.
Why is that?
What defines the performance of a serverless platform?
Other than the performance of the code itself, from the perspective of the end user, serverless application performance is fundamentally a function of two variables: distance an application executes from the user, and the time it takes the runtime itself to spin up. The realization that distance from the user is becoming a greater and greater bottleneck on application performance is causing many serverless vendors to push deeper and deeper into the edge. Running applications on the edge — closer to the end user — increases performance. As 5G comes online, this trend will only continue to accelerate.
However, many cloud vendors in the serverless space run into a critical problem when addressing the issue when competing for faster performance. And that is: the legacy architecture they’re using to build out their offerings doesn’t work well with the inherent limitations of the edge.
Since the goal behind the serverless model is to intentionally abstract away the underlying architecture, not everyone is clear on how legacy cloud providers like AWS have created serverless offerings like Lambda. Legacy cloud providers deliver serverless offerings by spinning up a containerized process for your code. The provider auto-scales all the different processes in the background. Every time a container is spun up, the entire language runtime is spun up with it, not just your code.
To help address the first graph, measuring global performance, vendors are attempting to move away from their large, centralized architecture (a few, big data centers) to a distributed, edge-based world (a greater number of smaller data centers all over the world) to close the distance between applications and end users. But there’s a problem with their approach: smaller data centers mean fewer machines, and less memory. Each time vendors pursue a small but many data centers strategy to operate closer to the edge, the likelihood of a cold start occurring on any individual process goes up.
This effectively creates a performance ceiling for serverless applications on container-based architectures. If legacy vendors with small data centers move your application closer to the edge (and the users), there will be fewer servers, less memory, and more likely that an application will need a cold start. To reduce the likelihood of that, they’re back to a more centralized model; but that means running your applications from one of a few big centralized data centers. These larger centralized data centers, by definition, are almost always going to be further away from your users.
You can see this at play in the graph above by looking at the results of the tests when running in Lambda@Edge — despite the reduced proximity to the end user, p90 performance is slower than that of Lambda’s, as containers have to spin up more frequently.
Serverless architectures built on containers can move up and down the frontier, but ultimately, there’s not much they can do to shift that frontier curve.
What makes Workers so fast?
Workers was designed from the ground up for an edge-first serverless model. Since Cloudflare started with a distributed edge network, rather than trying to push compute from large centralized data centers out into the edge, working under those constraints forced us to innovate.
In one of our previous blog posts, we’ve discussed how this innovation translated to a new paradigm shift with Workers’ architecture being built on lightweight V8 isolates that can spin up quickly, without introducing a cold start on every request.
Not only has running isolates given us advantage out of the box, but as V8 gets better, so does our platform. For example, when V8 announced Liftoff, a compiler for WASM, all WASM Workers instantly got faster.
Similarly, whenever improvements are made to Cloudflare’s network (for example, when we add new data centers) or stack (e.g., supporting new, faster protocols like HTTP/3), Workers instantly benefits from it.
Additionally, we’re always seeking to make improvements to Workers itself to make the platform even faster. For example, last year, we released an improvement that helped eliminate cold starts for our customers.
One key advantage that helps Workers identify and address performance gaps is the scale at which it operates. Today, Workers services hundreds of thousands of developers, ranging from hobbyists to enterprises all over the world, serving millions of requests per second. Whenever we make improvements for a single customer, the entire platform gets faster.
Performance that matters
The ultimate goal of the serverless model is to enable developers to focus on what they do best — build experiences for their users. Choosing a serverless platform that can offer the best performance out of the box means one less thing developers have to worry about. If you’re spending your time optimizing for cold starts, you’re not spending your time building the best feature for your customers.
Just like developers want to create the best experience for their users by improving the performance of their application, we’re constantly striving to improve the experience for developers building on Workers as well.
In the same way customers don’t want to wait for slow responses, developers don’t want to wait on slow deployment cycles.
This is where the Workers platform excels yet again.
Any deployment on Cloudflare Workers takes less than a second to propagate globally, so you don’t want to spend time waiting on your code deploy, and users can see changes as quickly as possible.
Of course, it’s not just the deployment time itself that’s important, but the efficiency of the full development cycle, which is why we’re always seeking to improve it at every step: from sign up to debugging.
Don’t just take our word for it!
Needless to say, much as we try to remain neutral, we’re always going to be just a little biased. Luckily, you don’t have to take our word for it.
We invite you to sign up and deploy your first Worker today — it’ll just take a few minutes!
Cloudflare Workers has long supported the building blocks to run many languages using WebAssembly. However, there has always been a challenging “trampoline” step required to allow languages like Rust to talk to JavaScript APIs such as fetch().
In addition to the sizable amount of boilerplate needed, lots of “off the shelf” bindings between languages don’t include support for Cloudflare APIs such as KV and Durable Objects. What we wanted was a way to write a Worker in idiomatic Rust, quickly, and without needing knowledge of the host JavaScript environment. While we had a nice “starter” template that made it easy enough to pull in some Rust libraries and use them from JavaScript, the barrier was still too high if your goal was to write a full program in Rust and ship it to our edge.
Not anymore!
Introducing the worker crate, available on GitHub and crates.io, which makes Rust developers feel right at home on the Workers platform by running code inside the V8 WebAssembly engine. In the snippet below, you can see how the worker crate does all the heavy lifting by providing Rustacean-friendly Workers APIs.
use worker::*;

#[event(fetch)]
pub async fn main(req: Request, env: Env) -> Result<Response> {
    console_log!(
        "{} {}, located at: {:?}, within: {}",
        req.method().to_string(),
        req.path(),
        req.cf().coordinates().unwrap_or_default(),
        req.cf().region().unwrap_or("unknown region".into())
    );

    if !matches!(req.method(), Method::Post) {
        return Response::error("Method Not Allowed", 405);
    }

    if let Some(file) = req.form_data().await?.get("file") {
        return match file {
            FormEntry::File(buf) => {
                Response::ok(&format!("size = {}", buf.bytes().await?.len()))
            }
            _ => Response::error("`file` part of POST form must be a file", 400),
        };
    }

    Response::error("Bad Request", 400)
}
Get your own Worker in Rust started with a single command:
# see installation instructions for our `wrangler` CLI at https://github.com/cloudflare/wrangler
# (requires v1.19.2 or higher)
$ wrangler generate --type=rust my-project
We’ve stripped away all the glue code, provided an ergonomic HTTP framework, and baked in what you need to build small scripts or full-fledged Workers apps in Rust. You’ll find fetch, a router, easy-to-use HTTP functionality, Workers KV stores and Durable Objects, secrets, and environment variables too. It’s all open source, and we’d love your feedback!
Why are we doing this?
Cloudflare Workers is on a mission to simplify the developer experience. When we took a hard look at the previous experience writing non-JavaScript Workers, we knew we could do better. Rust happens to be a great language for us to kick-start our mission: it has first-class support for WebAssembly, and a wonderful, growing ecosystem. Tools like wasm-bindgen, libraries like web-sys, and Rust’s powerful macro system gave us a significant starting-off point. Plus, Rust’s popularity is growing rapidly, and if our own use of Rust at Cloudflare is any indication, there is no question that Rust is staking its claim as a must-have in the developer toolbox.
So give it a try, leave some feedback, even open a PR! By the way, we’re always on the lookout for great people to join us, and we are hiring for many open roles (including Rust engineers!) — take a look.
If you’re writing code: what can go wrong, will go wrong.
Many developers know the feeling: “It worked in the local testing suite, it worked in our staging environment, but… it’s broken in production?” Testing can reduce mistakes and debugging can help find them, but logs give us the tools to understand and improve what we are creating.
if (this === undefined) {
  console.log("there’s no way… right?") // Narrator: there was.
}
While logging can help you understand when the seemingly impossible is actually possible, it’s something that no developer really wants to set up or maintain on their own. That’s why we’re excited to launch a new addition to the Cloudflare Workers platform: logs and exceptions from the dashboard.
Starting today, you can view and filter the console.log output and exceptions from a Worker… at no additional cost with no configuration needed!
View logs, just a click away
When you view a Worker in the dashboard, you’ll now see a “Logs” tab which you can click on to view a detailed stream of logs and exceptions. Here’s what it looks like in action:
Each log entry contains an event with a list of logs, exceptions, and request headers if it was triggered by an HTTP request. We also automatically redact sensitive URLs and headers such as Authorization, Cookie, or anything else that appears to have a sensitive name.
If you are in the Durable Objects open beta, you will also be able to view the logs and requests sent to each Durable Object. This is a great tool to help you understand and debug the interactions between your Worker and a Durable Object.
For now, we support filtering by event status and type. Though, you can expect more filters to be added to the dashboard very soon! Today, we support advanced filtering with the wrangler CLI, which will be discussed later in this blog.
console.log(), and you’re all set
It’s really simple to get started with logging for Workers. Simply invoke one of the standard console APIs, such as console.log(), and we handle the rest. That’s it! There’s no extra setup, no configuration needed, and no hidden logging fees.
function logRequest (request) {
  const { cf, headers } = request
  const { city, region, country, colo, clientTcpRtt  } = cf

  console.log("Detected location:", [city, region, country].filter(Boolean).join(", "))
  if (clientTcpRtt) {
     console.debug("Round-trip time from client to", colo, "is", clientTcpRtt, "ms")
  }

  // You can also pass an object, which will be interpreted as JSON.
  // This is great if you want to define your own structured log schema.
  console.log({ headers })
}
In fact, you don’t even need to use console.log to view an event from the dashboard. If your Worker doesn’t generate any logs or exceptions, you will still be able to see the request headers from the event.
Advanced filters, from your terminal
If you need more advanced filters you can use wrangler, our command-line tool for deploying Workers. We’ve updated the wrangler tail command to support sampling and a new set of advanced filters. You also no longer need to install or configure cloudflared to use the command. Not to mention it’s much faster, no more waiting around for logs to appear. Here are a few examples:
# Filter by your own IP address, and if there was an uncaught exception.
wrangler tail --format=pretty --ip-address=self --status=error

# Filter by HTTP method, then apply a 10% sampling rate.
wrangler tail --format=pretty --method=GET --sampling-rate=0.1

# Filter using a generic search query.
wrangler tail --format=pretty --search="TypeError"
We recommend using the “pretty” format, since wrangler will output your logs in a colored, human-readable format. (We’re also working on a similar display for the dashboard.)
However, if you want to access structured logs, you can use the “json” format. This is great if you want to pipe your logs to another tool, such as jq, or save them to a file. Here are a few more examples:
# Parses each log event, but only outputs the url.
wrangler tail --format=json | jq .event.request?.url

# You can also specify --once to disconnect the tail after receiving the first log.
# This is useful if you want to run tests in a CI/CD environment.
wrangler tail --format=json --once > event.json
Try it out!
Both logs from the dashboard and wrangler tail are available and free for existing Workers customers. If you would like more information or a step-by-step guide, check out any of the resources below.
There are a lot of experiences we have all grown to miss over the last year and a half. After hearing from our community, two of the top experiences they miss are collaborating with peers, and getting Cloudflare swag. Perhaps even in the reverse order! In-person events like conferences were once a key channel to satisfy both these interests, however today’s remote world makes that much harder. But does it have to?
Today, we are excited to introduce the Cloudflare Developer Summer Challenge. We will be rewarding 300 participants with boxes of our most popular swag, while enabling collaboration with other participants through our Workers Discord channel.
To participate, you have to build a project that uses Cloudflare Workers and at least one other product in our rapidly expanding developer platform. We will judge submissions and award swag boxes to those with the most innovative projects, limited to one box per person.The Challenge will be open for submissions between today, and closing November 1, 2021. See a full list of terms and conditions here.
What are the details?
Cloudflare’s developer platform offers all the building blocks to create end-to-end applications with products across compute, storage, and frontend services. To successfully participate in the Cloudflare Developer Summer Challenge, you need to build a project with at least two of the following products in the Cloudflare developer platform. Bonus points for using more! These products include:
Cloudflare Workers: an edge-based serverless computing platform where you can deploy code automatically worldwide, with speed, security, and scale baked in.
Workers KV: a global low-latency key value data store for exceptionally high read volumes, making it possible to build highly dynamic APIs and websites which respond as quickly as a cached static file would.
Durable Objects: a storage platform providing low-latency coordination and consistent storage at the edge, enabling stateful serverless use cases.
Cloudflare Pages: a Jamstack web development platform to collaborate on and deploy high performance sites quickly across the world.
How will submissions be judged?
Submissions will be based on three criteria:
The first criteria is to meet the basic requirements of the challenge. This includes using at least two products in the platform, and submitting the live link of your project and your code repository. You must submit before November 1, 2021.
The second criteria we will judge is around innovation. Projects that are unique and useful to users will be more likely to win the swag boxes.
The third criteria is based on the breadth of the Cloudflare platform you use. The more products you integrate, the better!
How do I participate?
Step 1: Get Started: You can get started with the developer platform by visiting the Cloudflare Workers Quickstart Guide, and reviewing the Workers KV and/or Durable Objects documentation. To host your frontend site on Cloudflare Pages, you can visit the Pages Quickstart Guide.
Step 2: Build your Project: If you would like inspiration, you can view our tutorials, and examples. You can also view our Built With Workers page. If you want to try and build something more advanced, you can see some additional examples below.
Step 3: Share your Project: Successful submission includes a link to your live project, and a link to your code repository. We also encourage you to share your work, or pictures of you unboxing/ using your swag by tagging @CloudflareDev on Twitter with the hashtag #CloudflareSummerChallenge.
Optional: Engage with the Community To promote collaboration and interaction with peers, we will have a dedicated channel in the Cloudflare Workers Discord server. For those who want to, you can learn what others are building, share your project, or join Q&A sessions if you have questions or need help getting started. You can also meet developers participating around the world.
What are examples of advanced projects I can build?
The Cloudflare developer platform is ideal for a wide range of use cases – from augmenting existing applications to building entirely new ones without needing to maintain underlying infrastructure. Essentially, you write the code, and we handle the rest. Running on the Cloudflare edge network, applications scale automatically and run worldwide within seconds of users.
Build a Serverless API for your Frontend
Cloudflare Workers’ high performance and edge network make it well-suited for building APIs. It is also a great companion to your frontend applications on Cloudflare Pages. You can use Workers as the backend, and build your frontend with frameworks such as React, Gatsby, Hugo, Svelte, and more — and then deploy your site onto Pages.
You can easily begin building a serverless API for your frontend by creating a new Workers project with the Wrangler CLI:
To complete this type of project, you can follow the rest of the steps outlined in our Pages documentation.
Build an Interactive Game
Combining Cloudflare Workers, Durable Objects, and WebSockets makes a powerful platform for managing state at the edge. Running on Cloudflare’s global network enables exceptionally low latency, so users can interact instantly worldwide. Examples of interactive applications can range from chat rooms to multiplayer video games.
To build interactive video games, you can integrate with popular tools such as Unity and WebGL using an authoritative client model (we have an example of how to achieve this). You do not even need expertise in building video games. Following this example above, the client can run a compiled game directly in the browser with WebAssembly. The server, running on Cloudflare Workers, can be interacted with via WebSockets, and uses Durable Objects to manage game state.
Build an E-Commerce Experience
Whether you are building a small e-commerce app or an online ordering site with millions of requests per month, your users can experience exceptional performance and reliability with Cloudflare’s developer platform.
At a small scale, you can instantly personalize a user’s e-commerce experience by setting up A/B testing, performing localization, or providing geo-specific targeting, such as local currency or exchange rates. You can see the linked code samples to quickly get started.
Integration with Workers KV and other third party tools can also streamline the development process. Instead of having to build out an entire database for your application, you can use Workers KV to store product information such as product ID, name, description, price, etc. Outside the Workers platform, you can integrate with popular tools such as Stripe or Shopify. To learn more about how to build an e-commerce application with Workers, Workers KV, and Stripe, you can read this blog post on building an e-commerce experience.
At a larger scale, we have customers building their entire online ordering site on Workers and Pages. Dig, a popular American restaurant chain with nearly 50 locations nationwide, decided to run their ordering site on Cloudflare’s developer platform. They needed high performance and reliability as traffic spiked during the pandemic. The team used a headless React application that is entirely hosted on Cloudflare Pages. Javascript calls an underlying API to get and handle dynamic ordering logic. You can learn more about their story in this case study.
Conclusion
We have heard from our community, and we want to help bring back some of their favorite pre-pandemic experiences: collaboration and swag. The Cloudflare Developer Summer Challenge is meant to do just that. While the last year and a half has transformed the way we all live, it has also been a period of significant expansion of the Cloudflare developer platform. With new products across compute, storage, and frontend services, you now have all the building blocks to quickly create powerful applications end-to-end on our edge network. We hope you enjoy the experience (and the swag!). We cannot wait to see what you build!
If you haven’t already heard, we’re hosting the Cloudflare Summer Developer Challenge, a contest for the Cloudflare community at large. Anybody – yes, including you – can sign up for free and compete for a chance to win one of 300 available prizes. To submit you need to use at least two products from the Cloudflare developer platform — which makes this contest a great opportunity to give them a try if you haven’t already! The top 300 submissions will receive a box of our most popular swag, so you should give it a go!
Coincidentally, the Cloudflare Summer Developer Challenge’s landing page and signup workflow qualifies as a valid project submission (so meta), so if you’re looking for some inspiration, this walkthrough will shed some light on how it was built.
Overview
At its core, the application is a series of static HTML pages, most of which have a form to submit, with a backend API to handle those submissions, and a storage layer to persist the data. In a Cloudflare lens, this would point towards using Pages, a Worker, and Workers KV. And while this should be the preferred stack for a project like this, truthfully, this “application” was originally intended to be a single HTML page with a single form, but its list of requirements grew over time, as things tend to do. So instead, this project began as–and remains–a Workers Site project, comprised of a single Worker and a single Workers KV namespace.
Workers Sites, the precursor to our Pages product, is a pattern where your Worker handles all the requests for your site’s assets. While doing this, your Worker Site can still include backend-y things, like offering a collection of JSON API endpoints. Basically, Workers Sites is a coined term for building monoliths within a Worker, but without the negative associations that the word “monolith” can bring. Given that a Workers Site is still a Worker, this means your monolith is deployed globally – tough to beat!
As with all Workers Sites, routing is the primary concern. For this, I used the worktop web framework, which includes a router among many other utilities. (Disclosure: I am also the author of worktop.) This allowed me to quickly structure the layout of the entire application:
import { Router } from 'worktop';
import * as Cache from 'worktop/cache';

const API = new Router;

API.add('GET', '/', (req, res) => {
  res.send(200, 'TODO: send HTML for landing page');
});

API.add('GET', '/rules', (req, res) => {
  res.send(200, 'TODO: send HTML for terms & conditions');
});

API.add('POST', '/signup', (req, res) => {
  res.send(201, 'TODO: parse & save initial registration');
});

API.add('GET', '/submit', (req, res) => {
  res.send(200, 'TODO: render the unique submission form');
});

API.add('POST', '/submit', (req, res) => {
  res.send(201, 'TODO: parse, validate, save submission data');
});

// init; w/ Cache API
Cache.listen(API.run);
At this point, nothing useful is happening, but having an application skeleton laid out like this is my preferred format for a TODO list. It’s very satisfying to go through and fill out the handler bodies as development progresses. Additionally, the Cache.listen helper at the bottom of the file integrates the entire application with the Cache API, which I know I’ll want since most of the requests will be for the static HTML pages anyway.
Building and Optimizing the Client pages
Historically, deploying a Workers Site meant uploading all of your assets into a KV namespace. Then you would include something like @cloudflare/kv-asset-handler into your Worker so that incoming requests would seamlessly route to keys within the namespace. However, I chose to go a different route.
Knowing that each of my static pages would – at most – have one CSS stylesheet and sometimes only one JavaScript file, I thought it would be pretty nifty to include a build system that would inline these assets into the built HTML page. This would mean that my static HTML pages would have absolutely zero network requests for additional resources, which is generally good news for performance.
And while I would love to say that I did this purely for performance reasons, I must also admit that the lazy-me appreciated that I didn’t have to set up additional URL routing, deal with KV asset uploading, or deal with additional Cache lifespans. A win-win in this case!
The trouble is: avoiding any external assets is not a common goal. In fact, this is very much a side quest I bestowed upon myself. And since no frameworks (that I know of, at least) can do this, I had to assemble my own miniature toolkit to accommodate my needs.
In the end, it proved to be a fun detour and didn’t take very long at all to put together. I incorporated Stylus, my preferred CSS preprocessor, and came up with a rather simple convention to inline CSS and/or JS files where needed. Instead of fancy AST parsers and transformers, I opted to simply read the HTML file contents as strings and search for HTML comments that matched the <!-- inject:(path) --> format:
In this example, the submit/index.html file is injecting the submit/index.styl, which is its own stylesheet, and the index.js script, which does not live within the `submit` directory because it’s used by other pages. The toolkit looks at both asset paths, converts the Stylus to plain CSS, and then embeds the contents into the appropriate <script> or <style> HTML tags.
Finally, for production builds, the setup will pass the final HTML source through a minifier, which compresses the entire document, including any CSS or JavaScript that was injected. This step is optional, but it never hurts to send fewer bytes down the wire.
Once these pages were built, I was satisfied with the Network Activity panel when loading the main page:
You can see how the localhost document loads, only dispatching a single request for the favicon-128.png file, which is hosted externally. The three data:image/* requests are Blob URLs and don’t actually transfer network packets. All in all, this means that the HTML document is fully self-contained.
Including HTML into the Worker
Workers can send anything in a Response. Of course, this includes a HTML string. If I wanted to make things incredibly difficult for myself, I could have skipped the /src directory with its own build system, and instead written the HTML, CSS, and JS entirely within a JS string. This would certainly work, but it would be a nightmare to maintain and (for me, at least) be extremely error prone:
Thankfully, I planned ahead and already have a build system that produces better HTML files anyway. So now I just needed a way to load those built outputs into my Worker code.
Now for the second half of this project’s toolkit; I find it perfectly acceptable to have a two-step build pipeline. Here, this means that the static site should be built first, followed by building the Worker. I was planning to use TypeScript to author my Worker anyway, which meant I was already going to need a build step – the only change here is that these build steps would now have to be sequential and ordered.
The Worker is built using esbuild, which is an extremely quick JavaScript bundler and compiler that is capable of translating TypeScript, too. It also has its own plugin system, which allowed me the opportunity to add the “inline my HTML files” behavior I needed. The Worker’s build script actually isn’t too intimidating and allows the Worker to `import` HTML files directly. This allows the insanity from above can be safely replaced with this pattern:
import { Router } from 'worktop';
import * as Cache from 'worktop/cache';

// loaded via esbuild plugin
import LANDING from 'index.html';
import RULES from 'rules/index.html';

API.add('GET', '/', (req, res) => {
  res.setHeader('Content-Type', 'text/html;charset=utf-8');
  res.setHeader('Cache-Control', 'public,max-age=60');
  res.send(200, LANDING);
});

API.add('GET', '/rulees', (req, res) => {
  res.setHeader('Content-Type', 'text/html;charset=utf-8');
  res.setHeader('Cache-Control', 'public,max-age=1800');
  res.send(200, RULES);
});

// ...

// init; w/ Cache API
Cache.listen(API.run);
Of course, this is much cleaner and sensible in the long-run. Clarity makes it easier to identify and extract common patterns into utility functions. I took the opportunity to introduce a render function, the first of many reusable helpers this project would encounter:
Finally, most of the pages need to dynamically insert values into the HTML markup. For example, the submission form should render with the participant’s name and email address and the landing page is required to reflect the current value of remaining prizes. Much like any other monolithic application, the Worker Site is fully aware – and capable – of injecting these values where needed.
To do this, I standardized the {{ variable }} syntax in my project’s HTML. Each of these variables would be replaced during the Worker request with the appropriate value. Of course, it also requires that each endpoint actually provide the correct information to make the substitutions. With this in mind, I modified the `render` utility and updated the landing page’s route handler:
// worker/utils.ts
import type { KV } from 'worktop/kv';
import type { ServerResponse } from 'worktop/response';

// TypeScript placeholder
// Defines the `DATA` KV binding
declare const DATA: KV.Namespace;

export function render(res: ServerResponse, template: string, values: Record<string, string> = {}) {
  for (let key in values) {
    template = template.replace('{{ ' + key + ' }}', values[key]);
  }
  res.setHeader('Content-Type', 'text/html;charset=UTF-8');
  res.send(200, template);
}

export function toCount(): Promise<string> {
  return DATA.get('::remain', 'text').then(v => v || '300+');
}

// worker/index.ts
import * as utils from './utils';

API.add('GET', '/', async (req, res) => {
  // Get the "::remain" count from KV
  const count = await utils.toCount();

  // Short-term TTL for remaining swag updates
  res.setHeader('Cache-Control', 'public,max-age=60');

  // Render the HTML, passing in `count` variable
  return utils.render(res, LANDING, { count });
});
With these changes, the landing page will always check the KV namespace for the latest ::remain value and inject it into the correct location. If you’re interested in checking out the project’s source code, you’ll find that this pattern is used in nearly every HTML response.
Accepting Form Submissions
As expected, this application made heavy use of form submissions. Luckily, the Fetch API offers a variety of built-in body parsers to make retrieval of the data trivial. Additionally, worktop offers a convenience function that will automatically invoke the correct parser based on the request’s Content-Type header. It’s aptly named req.body().
It’s easy to parse and retrieve user data, but it still has to be validated. There are a number of ways to do this, all of which boil down to an input object, a group of rules, and a loop through those rules, collecting any error messages into an errors object. This is precisely what my utils.validate helper does, allowing me to clearly define and manage my rules inline.
Let’s see how this looks within the POST /submit handler, which accepts the initial registration form:
Only after the data is considered valid can data be stored into KV for future use. For the initial registration, a number of things need to happen:
Ensure that the input.email hasn’t already been registered;
Persist the new registration using the `input` values, identifying each document with the user:<email> key;
Generate and save a unique code for the registration, which will be used later to ensure (a) that unregistered persons cannot submit projects and (b) that a registrant can only submit once;
Send the user an email, containing their unique submission link; and
Render a confirmation page, reminding the user to check their inbox for their link.
It can seem like a lot, but after piecing together a few utility helpers and abstractions, it can actually feel quite approachable:
// worker/index.ts
import * as utils from './utils';
import * as Sparkpost from './emails';
import * as Signup from './signup';
import * as Code from './code';

function toError(res: ServerResponse, status: number, reason: string) {
  return res.send(status, { status, reason });
}

API.add('POST', '/signup', async (req, res) => {
  try {
    var input = await req.body<Entry>();
  } catch (err) {
    return toError(res, 400, 'Error parsing input');
  }

  let { email, firstname, lastname } = input || {};
  firstname = String(firstname||'').trim();
  lastname = String(lastname||'').trim();
  email = String(email||'').trim();

  // truncated: validation

  // Ensure email is not already in use
  let exists = await Signup.find(email);
  if (exists) return toError(res, 400, 'You have already signed up');

  // Generate new `Entry` record
  let entry = Signup.prepare({ email, firstname, lastname });

  // create "user:<unique email>" document
  let isOK = await Signup.save(entry);
  if (!isOK) return toError(res, 500, 'Error persisting entry');

  // create "code:<unique value>" document
  isOK = await Code.save(entry);
  if (!isOK) return toError(res, 500, 'Error saving unique code');

  // dispatch "We received your registration" email
  let sent = await Sparkpost.confirm(entry);
  if (!sent) return toError(res, 500, 'Error sending confirmation email');

  // render "Thank you, check your {{ email }} for next steps" page
  return utils.render(res, CONFIRM, { email: entry.email });
});
A full HTML response is returned, which means that the client-side form handler should be able to see this content and render it directly in the browser window. This can be seen in the following index.js snippet, which was referenced earlier in the submit/index.html as an injected asset:
// (client) index.js

$('form').onsubmit = async function (ev) {
  ev.preventDefault();

  var form = ev.target;
  var res = await fetch(form.action, {
    method: form.method || 'POST',
    body: new FormData(form),
  });

  // truncate: clear existing errors

  if (res.ok) {
    form.reset();
    // Receive HTML response
    let html = await res.text();
    // Force-write the new HTML into this window
    document.documentElement.innerHTML = html;
  } else {
    // truncate: render errors
  }
};
BONUS: Because a full HTML response is returned, and all the client-side <form> elements are semantically correct, the form submission workflow will work with JavaScript disabled! The client-side validation will remain functional, but be a degraded experience – the error dialog won’t popup and any error messages will not appear beneath their respective form inputs.
Sending Transactional Emails
It should (hopefully) come as no surprise that programmatically sending an email is pretty straightforward these days. We chose to use SparkPost, but practically every service has the same API mechanics:
Obtain an API Token
Send a POST request to an endpoint with:
your API Token as an Authorization header
your recipient, sender identity, and text and/or HTML content as the POST body
Wait for a 200-level response, or deal with any API errors
Most email-as-a-service providers allow you to define templates, which allow you to replace variables with unique values per email – essentially the same thing our utils.render function is doing with our HTML contents. The benefit of this is that you only have to worry about writing your emails once; then you’re just POST’ing new values to the API endpoint.
SparkPost allows templates to be referenced by a custom name rather than a randomly generated identifier, which makes it easy to track and debug templates over time.
The above snippet includes the entirePOST request formatter – there’s nearly more type-hinting than there is code! Also shown is an example confirm method, which is responsible for sending the unique submission link to the newly-registered user. You’ll notice that firstname and code are the injected variables, required by the “devchallenge-confirm” template.
Overall Performance
I’d call this a success!
Even though this certainly wasn’t my first Worker project – and definitely won’t be my last – I’m consistently amazed how much the Workers runtime lets me get away with. I mean, if you could only take away two points from this article, they should be:
I was able to build a moderately complex application, from scratch, while incorporating a Cache layer, a globally-replicated storage layer, and a super-performant JS runtime, all of which live under the same roof.
I (probably) spent more time fussing with a custom client-side build pipeline than I did piecing together the mission-critical API form handlers.
The cherry on top: Should this contest go viral and lure in millions of visitors, I’d only be paying a couple of dollars at the end of the month. Obviously I have a bias here, but it’s pretty amazing really.
Finally, performance-wise, this may justify the time spent fiddling with the HTML build output:
Lessons Learned
As I alluded to earlier, if I were to rebuild this application, or if I were to add more to it down the road, I would replace the Workers Site architecture with a Pages project and deploy a Worker in front of it for my API requirements and dynamic KV injections.
Since the static assets would no longer be embedded into the Worker’s source, I would need to replace the `utils.render` approach for another utility that fetches the URL from Pages (which becomes my “origin server”) and then uses HTMLRewriter to inject the variables. Also, not that I was anywhere near the 1MB size limit, the largest contributor to my Worker’s bytesize would disappear.
But, more significantly, this refactor would also reduce my total tooling since the majority of the project’s complexity lies in the custom build system for the frontend assets. In other words, the entire /src directory could have been built and deployed like a normal static website, which would allow me to make use of existing frameworks and/or toolkits instead of taking my self-imposed detour. There would have been no need to create a custom frontend toolkit and its bridge to get the static assets loaded into my Worker.
However, none of this is to say that Workers Sites was a bad approach for this application. It’s quite the contrary! This is all to highlight the flexibility of Worker Sites – and the Workers platform at large. Cloudflare Pages exists so that I, the developer, can lean into existing, well-traveled paths and let the experts worry about toolkits, build pipelines, and deployments… But that doesn’t prevent you, the resident expert, from customizing every aspect if that’s your desire.
With Cloudflare Pages, deploying your Jamstack applications is easier than ever — integrate with GitHub and a simple git push deploys your site within minutes. However, one of the limitations of Pages was that triggering deployments to your site only happens within the confines of committing to GitHub. We started thinking about how users who author content consistently on their site — our bloggers and writers — may not always be editing their copy directly via the code but perhaps through a different service. Headless content management systems (CMSs) are a simple solution to solve this problem, allowing users to store their backend content through an editing interface as a service for an application like Pages.
It made us wonder: what if we could trigger deployments based on updates made in other places rather than just via GitHub? Today, we are proud to announce a new way to connect your Pages application with your headless CMSs and databases: introducing Deploy Hooks for Pages.
What’s a headless CMS?
Headless CMSs such as Contentful, Ghost and Sanity.io allow optimization of content formatting for any type of interface. With tools like these, you can leverage a “decoupled” content management model where all you need to focus on is writing your content within the CMS editing interface and let its API handle the rest!
Sounds great! What’s the catch?
We started thinking about the implications for those of you who integrate with these headless tools and what your workflow might look like as it relates to Pages. You would build, for example, your blog application on Pages but update all of your content directly on your headless CMS and may make changes to your content three to four times a day. So how exactly does the data from your CMS show up on your Pages site and stay in sync? Enter Deploy Hooks!
What are Deploy Hooks?
Deploy Hooks are URLs created on Pages that accept an HTTP POST request to trigger new deployments outside the realm of a git command. Instead of manually redeploying your site via another git push, any time you update the content within your chosen headless CMS, the Deploy Hook will automatically send a real-time update to Pages. On the Pages side, once these updates are received, a new site build will be triggered to include any new data or content detected. It’s that easy!
How can I create a Deploy Hook?
To set up your deploy hook, navigate to the Deploy Hooks section in your Pages project’s settings. In this section there are two input parameters needed to properly configure your deploy hook and obtain your URL:
Deploy Hook Name: You can name your deploy hook something like “Contentful” or “My Blog” to identify which source the Deploy Hook is monitoring. A unique name for each deploy hook will also help you to differentiate hooks in the event that you create multiple Deploy Hooks for your Pages site.
Branch to Build: You can specify which branch will be built and deployed when the URL is requested with the Deploy Hook. This is especially helpful if you’d like to stage your changes first instead of pushing directly to your production branch.
How can I use a Deploy Hook with my headless CMS?
You can put the unique URL provided in the dashboard into just about any service that accepts a Deploy Hook URL. In a headless CMS, you can create and configure a new webhook and, depending on the tool, you can sometimes choose which events you’d like to trigger deployments. Once you’ve configured this webhook, you can paste the Deploy Hook URL provided by Pages to connect your chosen CMS with your Pages project. After that, you’re all set to update content in your headless tool.
What else can I do with a Deploy Hook?
After creating your Deploy Hook, Pages also provides you with the HTTP POST request snippet with your URL that looks something like this:
curl -X POST "https://api.cloudflare.com/client/v4/pages/webhooks/deploy_hooks/ 66c5dd3a-989f-4ba7-a6e2-6d2695524d7”
Every time you execute the snippet, you will trigger a new build to your Pages site. In addition to utilizing this snippet for a forced deployment within your command line, you can also customize your CI/CD pipeline and trigger deployments only under certain conditions. For example, you only want to deploy if there were changes within specific directories and only after an extensive test suite passes. Additionally, this snippet is useful for scheduling a CRON trigger to initiate builds on a specific timeline or cadence. Read more about how to use Pages deploy hooks in our docs.
Postgres is a ubiquitous open-source database technology. It contains a vast number of features and offers rock-solid reliability. It’s also one of the most popular SQL database tools in the industry. As the industry builds “modern” developer experience tools—real-time and highly interactive—Postgres has also served as a great foundation. Projects like Hasura, which offers a real-time GraphQL engine, and Supabase, an open-source Firebase alternative, use Postgres under the hood. This makes Postgres a technology that every developer should know, and consider using in their applications.
For many developers, REST APIs serve as the primary way we interact with our data. Language-specific libraries like pg allow developers to connect with Postgres in their code, and directly interact with their databases. Yet in almost every case, developers reinvent the wheel, building the same connection logic on an app-by-app basis.
Many developers building applications with Cloudflare Workers, our serverless functions platform, have asked how they can use Postgres in Workers functions. Today, we’re releasing a new tutorial for Workers that shows how to connect to Postgres inside Workers functions. Built on PostgREST, you’ll write a REST API that communicates directly with your database, on the edge.
This means that you can entirely build applications on Cloudflare’s edge — using Workers as a performant and globally-distributed API, and Cloudflare Pages, our Jamstack deployment platform, as the host for your frontend user interface. With Workers, you can add new API endpoints and handle authentication in front of your database without needing to alter your Postgres configuration. With features like Workers KV and Durable Objects, Workers can provide globally-distributed caching in front of your Postgres database. Features like WebSockets can be used to build real-time interactions for your applications, without having to migrate from Postgres to a new database-as-a-service platform.
PostgREST is an open-source tool that generates a standards-compliant REST API for your Postgres databases. Many growing database-as-a-service startups like Retool and Supabase use PostgREST under the hood. PostgREST is fast and has great defaults, allowing you to access your Postgres data using standard REST conventions.
It’s great to be able to access your database directly from Workers, but do you really want to expose your database directly to the public Internet? Luckily, Cloudflare has a solution for this, and it works great with PostgREST: Cloudflare Tunnel. Cloudflare Tunnel is one of my personal favorite products at Cloudflare. It creates a secure tunnel between your local server and the Cloudflare network. We want to expose our PostgREST endpoint, without making our entire database available on the public internet. Cloudflare Tunnel allows us to do that securely.
By using PostgREST with Postgres, we can build REST API-based applications. In particular, it’s an excellent fit for Cloudflare Workers, our serverless function platform. Workers is a great place to build REST APIs. With the open-source JavaScript library postgrest-js, we can interact with a PostgREST endpoint from inside our Workers function, using simple JS-based primitives.
Scaling applications built on Postgres is an incredibly common problem that developers face. Often, this means duplicating your Postgres database and distributing reads between your primary database, and a fleet of “read replicas”. With PostgREST and Workers, we can begin to explore a different approach to solving the scaling problem. Workers’ unique architecture allows us to deploy hyper-performant functions in front of Postgres databases. With tools like Workers KV and Durable Objects, exposed in Workers as basic JavaScript APIs, we can build intelligent caches for our databases, without sacrificing performance or developer experience.
If you’d like to learn more about building REST APIs in Cloudflare Workers using PostgREST, check out our new tutorial! We’ve also provided two open-source libraries to help you get started. cloudflare/postgres-postgrest-cloudflared-example helps you set up a Cloudflare Tunnel-backed Postgres + PostgREST endpoint. postgrest-worker-example is an example of using postgrest-js inside of Cloudflare Workers, to build REST APIs with your Postgres databases.
With postgrest-js, you can build dynamic queries and request data from your database using the JS primitives you know and love:
// Get all users with at least 100 followers
const { data: users, error } = await client
.from('users')
.select(‘*’)
.gte('followers', 100)
You can also join our Cloudflare Developers Discord community! Learn more about what you can build with Cloudflare Workers, and meet our wonderful community of developers from around the world. Get your invite link here.
Early in the life of most startups, there is a time of incredible hustle, creative problem solving, and making the impossible possible through out-of-the-box thinking and elbow grease. Grizzled veterans, who have lived through those days of running on coffee and shoestring budgets, look back on that time and fascinate the newcomers with war stories of back in the day, of adventures and first wins, when they kept the lights on by sheer force of will.
To help early stage startups get going, Cloudflare is giving away one year of the Startup Enterprise plan to all early stage startups in participating accelerator programs. That early stage time is special for product development, and entrepreneurs unlock worlds of possibilities when they have advanced tools on their hands, such as the power of the Cloudflare network.
What’s included in the Startup Enterprise plan?
In addition to the core offerings in the Pro and Business plans (e.g., CDN, DNS, WAF, custom SSL cert, 50 page rules), when founders sign up for the Startup Enterprise plan they’ll get special access to:
An affordable, scalable, on-demand video platform with simple, comprehensive APIs.
Additionally, when there are new Cloudflare products that are still in early access, participants on the Startup Enterprise plan can tell us about their use case for the product managers’ consideration for early access.
What startups are eligible for the Startup Enterprise plan?
To be eligible for the Startup Enterprise plan, a startup must be currently enrolled in a participating accelerator program or be a recent graduate. Additional eligibility criteria will be listed on the vendor perk info page of the accelerator program.
Get started
If you are a founder in a participating accelerator program, find the Cloudflare perk from your program’s vendor perk page and follow the instructions there.
If you are a founder in a program that is not yet a partner, drop us a line at [email protected], or ask the folks who run the vendor perk program at your accelerator program to drop us a line at [email protected].If you run or work for an accelerator program, or are friends with folks who do, do drop us a line at [email protected]. We’d love to make our tools available to your portfolio companies.
The collective thoughts of the interwebz
Manage Consent
To provide the best experiences, we use technologies like cookies to store and/or access device information. Consenting to these technologies will allow us to process data such as browsing behavior or unique IDs on this site. Not consenting or withdrawing consent, may adversely affect certain features and functions.
Functional
Always active
The technical storage or access is strictly necessary for the legitimate purpose of enabling the use of a specific service explicitly requested by the subscriber or user, or for the sole purpose of carrying out the transmission of a communication over an electronic communications network.
Preferences
The technical storage or access is necessary for the legitimate purpose of storing preferences that are not requested by the subscriber or user.
Statistics
The technical storage or access that is used exclusively for statistical purposes.The technical storage or access that is used exclusively for anonymous statistical purposes. Without a subpoena, voluntary compliance on the part of your Internet Service Provider, or additional records from a third party, information stored or retrieved for this purpose alone cannot usually be used to identify you.
Marketing
The technical storage or access is required to create user profiles to send advertising, or to track the user on a website or across several websites for similar marketing purposes.