Tag Archives: Compute

Enabling high availability of Amazon EC2 instances on AWS Outposts servers (Part 3)

Post Syndicated from Brianna Rosentrater original https://aws.amazon.com/blogs/compute/enabling-high-availability-of-amazon-ec2-instances-on-aws-outposts-servers-part-3/

This post is part 3 of the three-part series ‘Enabling high availability of Amazon EC2 instances on AWS Outposts servers’. We provide you with code samples and considerations for implementing custom logic to automate Amazon Elastic Compute Cloud (EC2) relaunch on Outposts servers. This post focuses on guidance for using Outposts servers with third party storage for boot and data volumes, whereas part 1 and part 2 focus on automating EC2 relaunch between standalone servers. Outposts servers support integration with Dell PowerStoreHPE Alletra Storage MP B10000 systems, NetApp on-premises enterprise storage arrays, and Pure Storage FlashArray.

Outposts servers provide compute and networking services that are designed for low-latency, local data processing needs for on-premises locations such as retail stores, branch offices, healthcare provider locations, or environments that are space-constrained. Outposts servers use EC2 instance store storage to provide non-durable block-level storage to the instances running stateless workloads. For applications that require persistent storage, you can create a three-tier architecture by connecting your Outposts servers to a third-party storage appliance. In this post, you will learn how to implement custom logic to provide high availability (HA) for your applications running on Outposts servers using two or more servers for N+1 fault tolerance. The code provided is meant to help you get started, and can be modified further for your unique workload needs.

Overview

In the following sections we will show how custom logic can be used to automate EC2 instance relaunch between two or more Outposts servers using boot and data volumes on third party storage. If your EC2 instance fails while using this solution, an Amazon CloudWatch alarm monitoring the EC2 StatusCheckFailed_Instance metric of your source EC2 instance will be triggered, and you will receive an Amazon Simple Notification Service (Amazon SNS) notification. An AWS Lambda function will then relaunch your EC2 instance onto the destination Outposts server that you’ve set up for resiliency. This is done using a launch template created during setup, and the script will connect your relaunched instance to the existing boot and data volumes on your third party storage appliance. This storage device provides shared storage for your Outposts servers. If a single server fails, new instances can connect to existing volumes on the array. This allows for a zero data loss Recovery Point Objective (RPO) and a Recovery Time Objective (RTO) equaling the time it takes to launch your EC2 instance. Take advantage of the features on your storage appliance for configuring data durability and resiliency to hardware failures, and make sure that you are regularly backing up your SAN volumes.
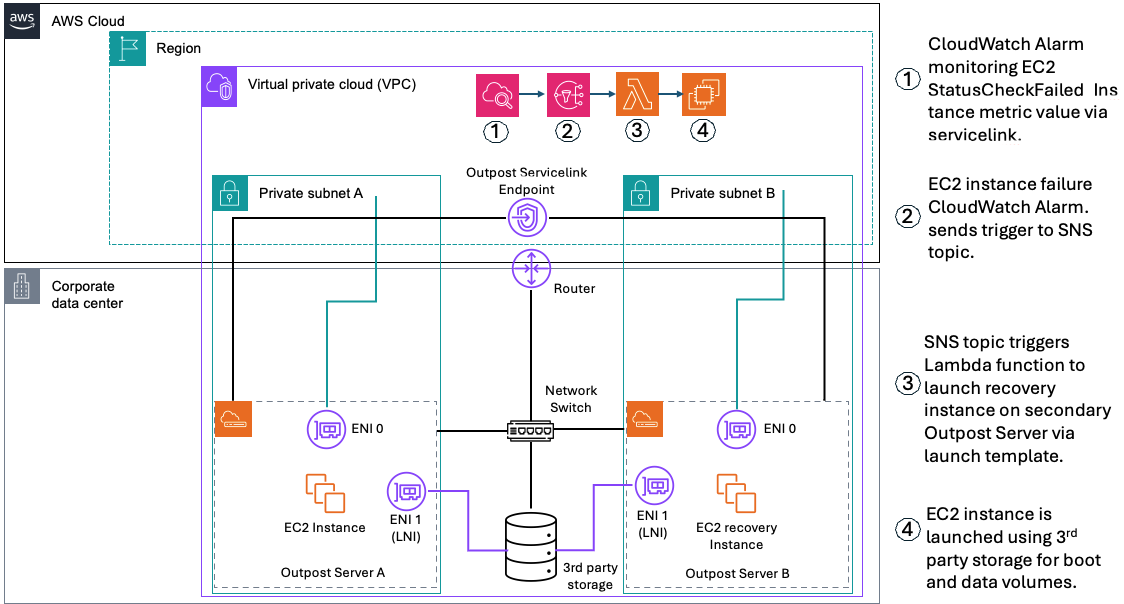
Figure 1 – Solution Architecture for automated EC2 Relaunch

Prerequisites

The following prerequisites are required to complete the walkthrough:

  • Two Outposts servers that can be set up as an active-active or active-passive resilient pair.
  • For workloads with a low threshold for downtime, ensure that your secondary Outpost server that’s used for recovery has a unique service link connection.
  • Outposts servers must be colocated within the same Layer 2 (L2) network.
  • Network latency between the Outposts servers must not exceed 5ms round trip time (RTT).
  • A storage appliance that supports the iSCSI protocol. Credentials to manage the storage appliance initiator/target mappings. See Simplifying the use of third-party block storage with AWS Outposts for more information.
  • If you’re setting this up from an Outposts consumer account, you must configure Amazon CloudWatch cross-account observability between the consumer account and the Outposts owning account to view Outposts metrics in your consumer account.
  • Create launch templates for the EC2 instances that you want to protect, the launch wizard will help you create these.
  • Credentials with permissions for AWS CloudFormation, Amazon EC2, and (optional) AWS Secrets Manager if authentication is required. IAM Permission Examples.md is provided in the repository.
  • A Windows or Linux host that can access the storage appliance and your AWS account (management computer).
  • AWS Outposts iPXE Amazon Machine Image (AMI) from the AWS Marketplace.
  • Python 3.8 or later (recommended) is used to run the init.py script that dynamically creates a CloudFormation stack in the account specified as an input parameter.
  • AWS SDK for Python (Boto3) version 1.26.0 or later recommended.
  • Operating system with iSCSI boot support (Windows Server 2022 and Red Hat Enterprise Linux 9 AMIs are provided).
  • Internet access to AWS service endpoints for the private subnet hosting the recovery Lambda function.
  • Download the repository sample-outposts-third-party-storage-integration.

Walkthrough

The first step is to deploy an EC2 instance configured to boot from a volume on the third-party storage that is prepared with an OS boot image. This step uses the launch wizard portion of the solution.

  1. Download and extract the OutpostServer_Recovery_3Pstorage repository to the management computer that has the AWS SDK for Python (Boto3) and Python installed.
  2. Run launch_wizard from the sample-outposts-third-party-storage-integration directory. You can run interactively or provide arguments for region, subnet, iPXE AMI, storage vendor, storage management ip, and credentials.
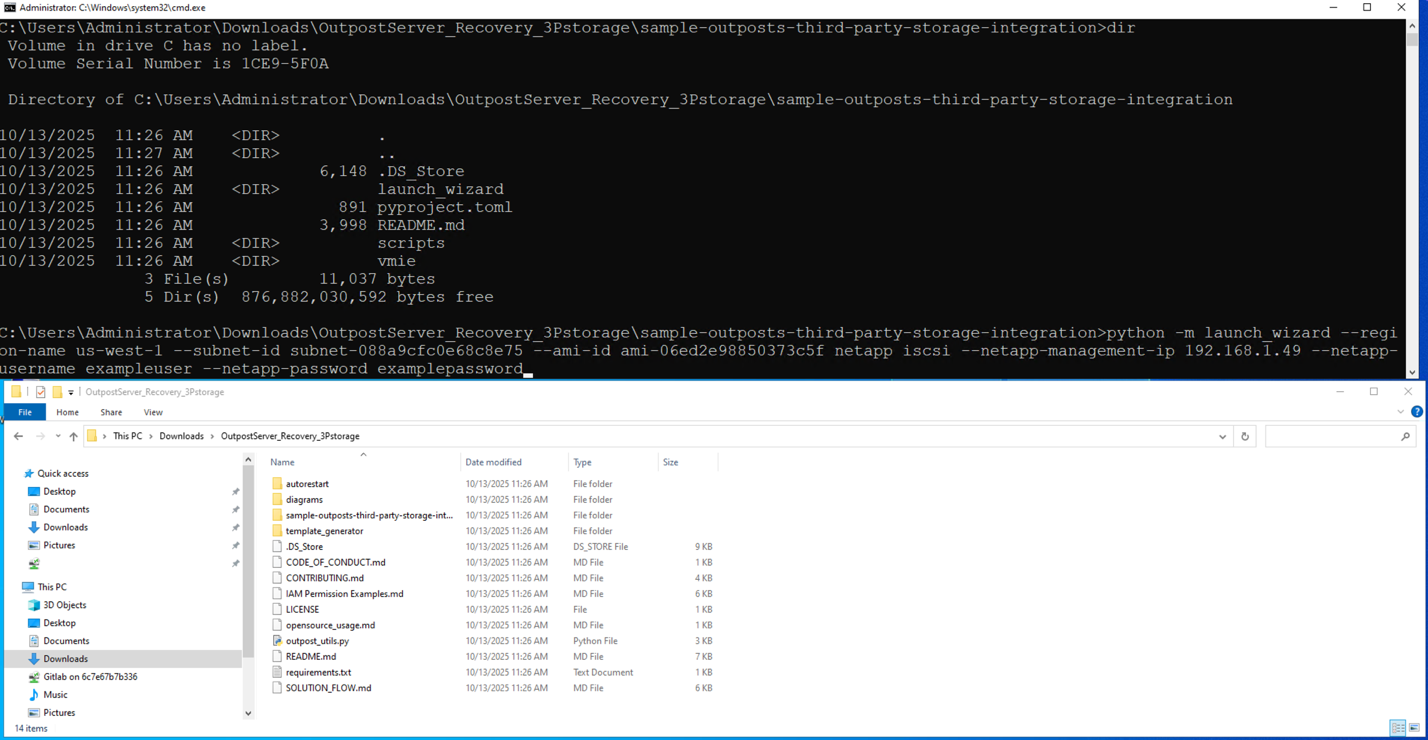
Figure 2 – Running launch wizard

  1. When prompted for a feature name, enter sanboot.
  2. For Guest OS type, enter in Linux or Windows.
  3. When prompted “Do you want to continue with this unverified AMI?”, select Y.
  4. The launch wizard will provide a list of instance types available on the Outpost server associated with the subnet you specified. Enter the instance type that you want to use.
  5. The launch wizard will now prompt you for optional EC2 Key Pair, Security Group, and Instance Profile settings for the EC2 instance that you are launching.
  6. Next, the launch wizard prompts you to specify an instance name. Note that specifying an instance name is required to set up automated instance recovery because the instance name is used as part of the recovery process.

Figure 3 – Taking user input for variable values

  1. The launch wizard prompts for root volume size. This is the root volume that the iPXE AMI boots from. The default is a 1GB volume on the Outpost server instance storage.
  2. Next, the launch wizard prompts you to select which third party storage controller you want to use based on the management ip that you specified. In this example, we are using NetApp, so I select a NetApp Storage Virtual Machine (SVM) named outpost_iscsi.
  3. If the connection to the storage array is successful and the protocol is available (iSCSI or NVMe over TCP) you are provided additional storage options for initiator group and logical unit number (LUN).
  4. In this example, we are using NetApp with iSCSI, so I can select an existing initiator group or create a new one.
  5. You can specify an existing initiator qualified name (IQN), or the launch wizard can generate a new one. IMPORTANT: Make sure that IQNs are unique to each instance because duplicates can cause data corruption.
  6. Next the launch wizard prompts which LUN’s you want to connect to this instance. For this example, I am going to use a Windows Server 2022 boot volume that I already created on the NetApp storage array.
  7. You are now asked which storage array target interface you want to use for connecting to these LUNs.
  8. The launch wizard provides the capability to specify guest OS scripts to customize the OS after sanboot. Combining this capability with storage array cloning provides a streamlined process for deploying new instances.
  9. The launch wizard now displays the EC2 user data template that it generated for use with the iPXE AMI and asks if you want to proceed with launching the instance.
  10. After the EC2 instance is launched, select yes to proceed with automated instance recovery setup.

Figure 4 – Running launch template creation script

Generating EC2 launch templates for recovery and failback

In the second step, we are generating EC2 launch templates for the EC2 instance launched in step 1. Launch templates can be generated for the primary and secondary Outpost servers. The launch template for the secondary Outpost server can be used for automated or manual recovery of the EC2 instance. Failback to the primary Outpost server is manual using the primary launch template.

  1. Select the instance that you want automated recovery for and select the subnet that you launched the instance in. This subnet represents the primary Outpost server that the instance is running on.
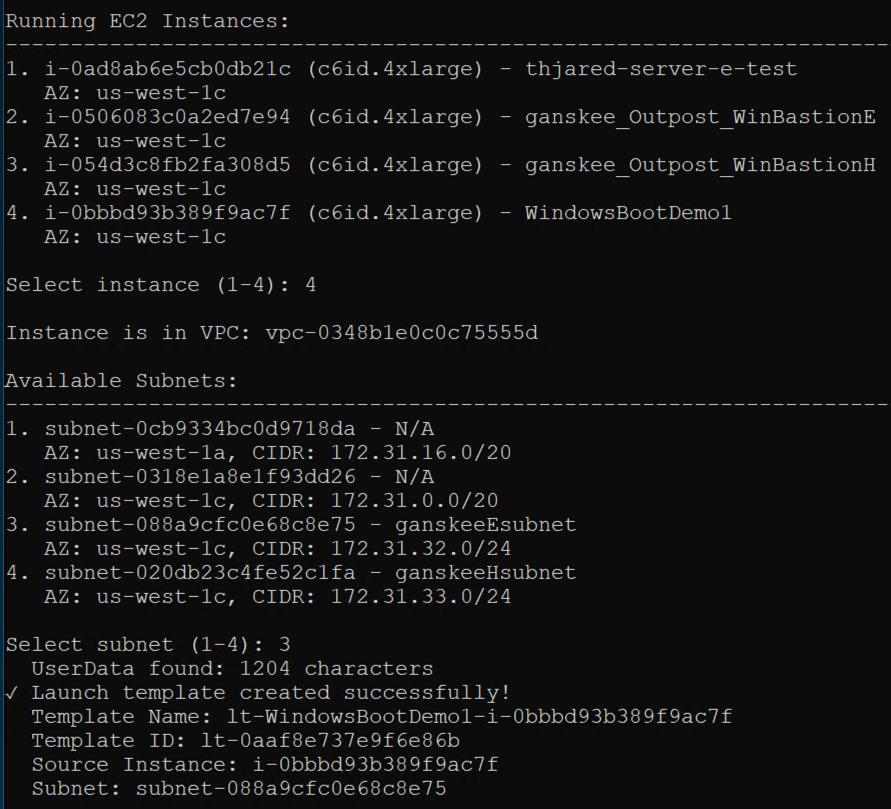
Figure 5 – Selecting subnets for EC2 instance relaunch

  1. When prompted to create a second launch template for Outpost server recovery, select yes, and then select to use the same instance (for recovery on different Outpost server).
  2. When you get a list of available subnets, select the subnet that’s associated with your secondary Outpost server. This is the server that the EC2 instance will be launched on in the event of the EC2 StatusCheckFailed_Instance metric triggers the CloudWatch alarm.
  3. You will see both launch templates created successfully.

Deploying automated EC2 instance recovery

The third step creates a CloudFormation template for monitoring, notifications, and automated recovery of the EC2 instance deployed in step 1. The CloudFormation template automatically captures the instance and secondary launch template information necessary for automatic recovery.

  1. Select Y to set up automated recovery. This will create a CloudFormation stack.
  2. Provide a name and description for the CloudFormation stack.
  3. Select whether you want automated recovery or notification only. This provides flexibility to choose manual or automatic recovery based on whether you want to verify the primary Outpost server is down before initiating recovery.
  4. In the AWS CloudFormation console, monitor the CloudFormation stack creation process.

Figure 6 – CloudFormation stack creation in progress

  1. After the CloudFormation Stack is complete, you have successfully deployed an EC2 instance using third party storage for boot and data volumes on a primary Outpost server. You also created instance recovery capabilities by using the Amazon Outpost server automated recovery solution for third party storage.
  2. You can verify whether the EC2 StatusCheckFailed_Instance is healthy under the Alarms section in the Amazon CloudWatch console.

Considerations

The logic discussed in this post relies on the secondary destination Outposts server having a connected service link. For more information about how to create a highly available service link connection for your Outpost servers, see the Networking section of AWS Outposts High Availability Design and Architecture Considerations whitepaper.

Clean up

Confirm whether it is safe to terminate the Amazon EC2 instance that you launched with this walkthrough. The operating system and data volumes are on the third party storage, so EC2 instance termination only removes the iPXE AMI from the Outposts server instance storage. To clean up, complete the following steps.

  1. Terminate the Amazon EC2 instance. Then, verify that the Instance state is Terminated to ensure that the instance is not using Outposts server resources.
  2. Delete the Amazon EC2 Launch Templates associated with the Amazon EC2 instance that you terminated. The names of the launch templates that were automatically generated will start with ‘lt-‘, followed by the instance name and the instance id. If you generated a recovery launch template, it will have a ‘-recovery’ suffix in the name.
  3. Delete the AWS CloudFormation Stack. The Stack name will start with ‘autorestart-‘ followed by the Amazon EC2 instance name.
  4. Clean up your initiators, initiator group, and LUNs on the third party storage array.

Conclusion

With the use of custom logic through AWS tools such as CloudFormation, CloudWatch, Amazon SNS, and AWS Lambda, you can architect for HA for stateful workloads on Outposts server. By implementing the custom logic in this post, you can automatically relaunch EC2 instances running on a source Outposts server to a secondary destination Outposts server if an instance fails, and connect to existing volumes on a shared storage appliance for recovery. This also reduces the downtime of your applications in the event of a hardware or service link failure. The code provided in this post can be further expanded upon to meet the unique needs of your workload.

While the use of infrastructure-as-code (IaC) can improve your application’s availability and be used to standardize deployments across multiple Outposts servers, it’s crucial to do regular failure drills to test the custom logic in place. This is to make sure that you understand your application’s expected behavior on relaunch in the event of a failure. To learn more about Outposts servers, visit the Outposts servers User Guide. Reach out to your AWS account team, or fill out this form to learn more about Outposts servers.
Introducing OpenClaw on Amazon Lightsail to run your autonomous private AI agents

Post Syndicated from Channy Yun (윤석찬) original https://aws.amazon.com/blogs/aws/introducing-openclaw-on-amazon-lightsail-to-run-your-autonomous-private-ai-agents/

Today, we’re announcing the general availability of OpenClaw on Amazon Lightsail to launch OpenClaw instance, pairing your browser, enabling AI capabilities, and optionally connecting messaging channels. Your Lightsail OpenClaw instance is pre-configured with Amazon Bedrock as the default AI model provider. Once you complete setup, you can start chatting with your AI assistant immediately — no additional configuration required.

OpenClaw is an open-source self-hosted autonomous private AI agent that acts as a personal digital assistant by running directly on your computer. You can AI agents on OpenClaw through your browser to connect to messaging apps like WhatsApp, Discord, or Telegram to perform tasks such as managing emails, browsing the web, and organizing files, rather than just answering questions.

AWS customers have asked if they can run OpenClaw on AWS. Some of them blogged about running OpenClaw on Amazon EC2 instances. As someone who has experienced installing OpenClaw directly on my home device, I learned that this is not easy and that there are many security considerations.

So, let me introduce how to launch a pre-configured OpenClaw instance on Amazon Lightsail more easily and run it securely.

OpenClaw on Amazon Lightsail in action
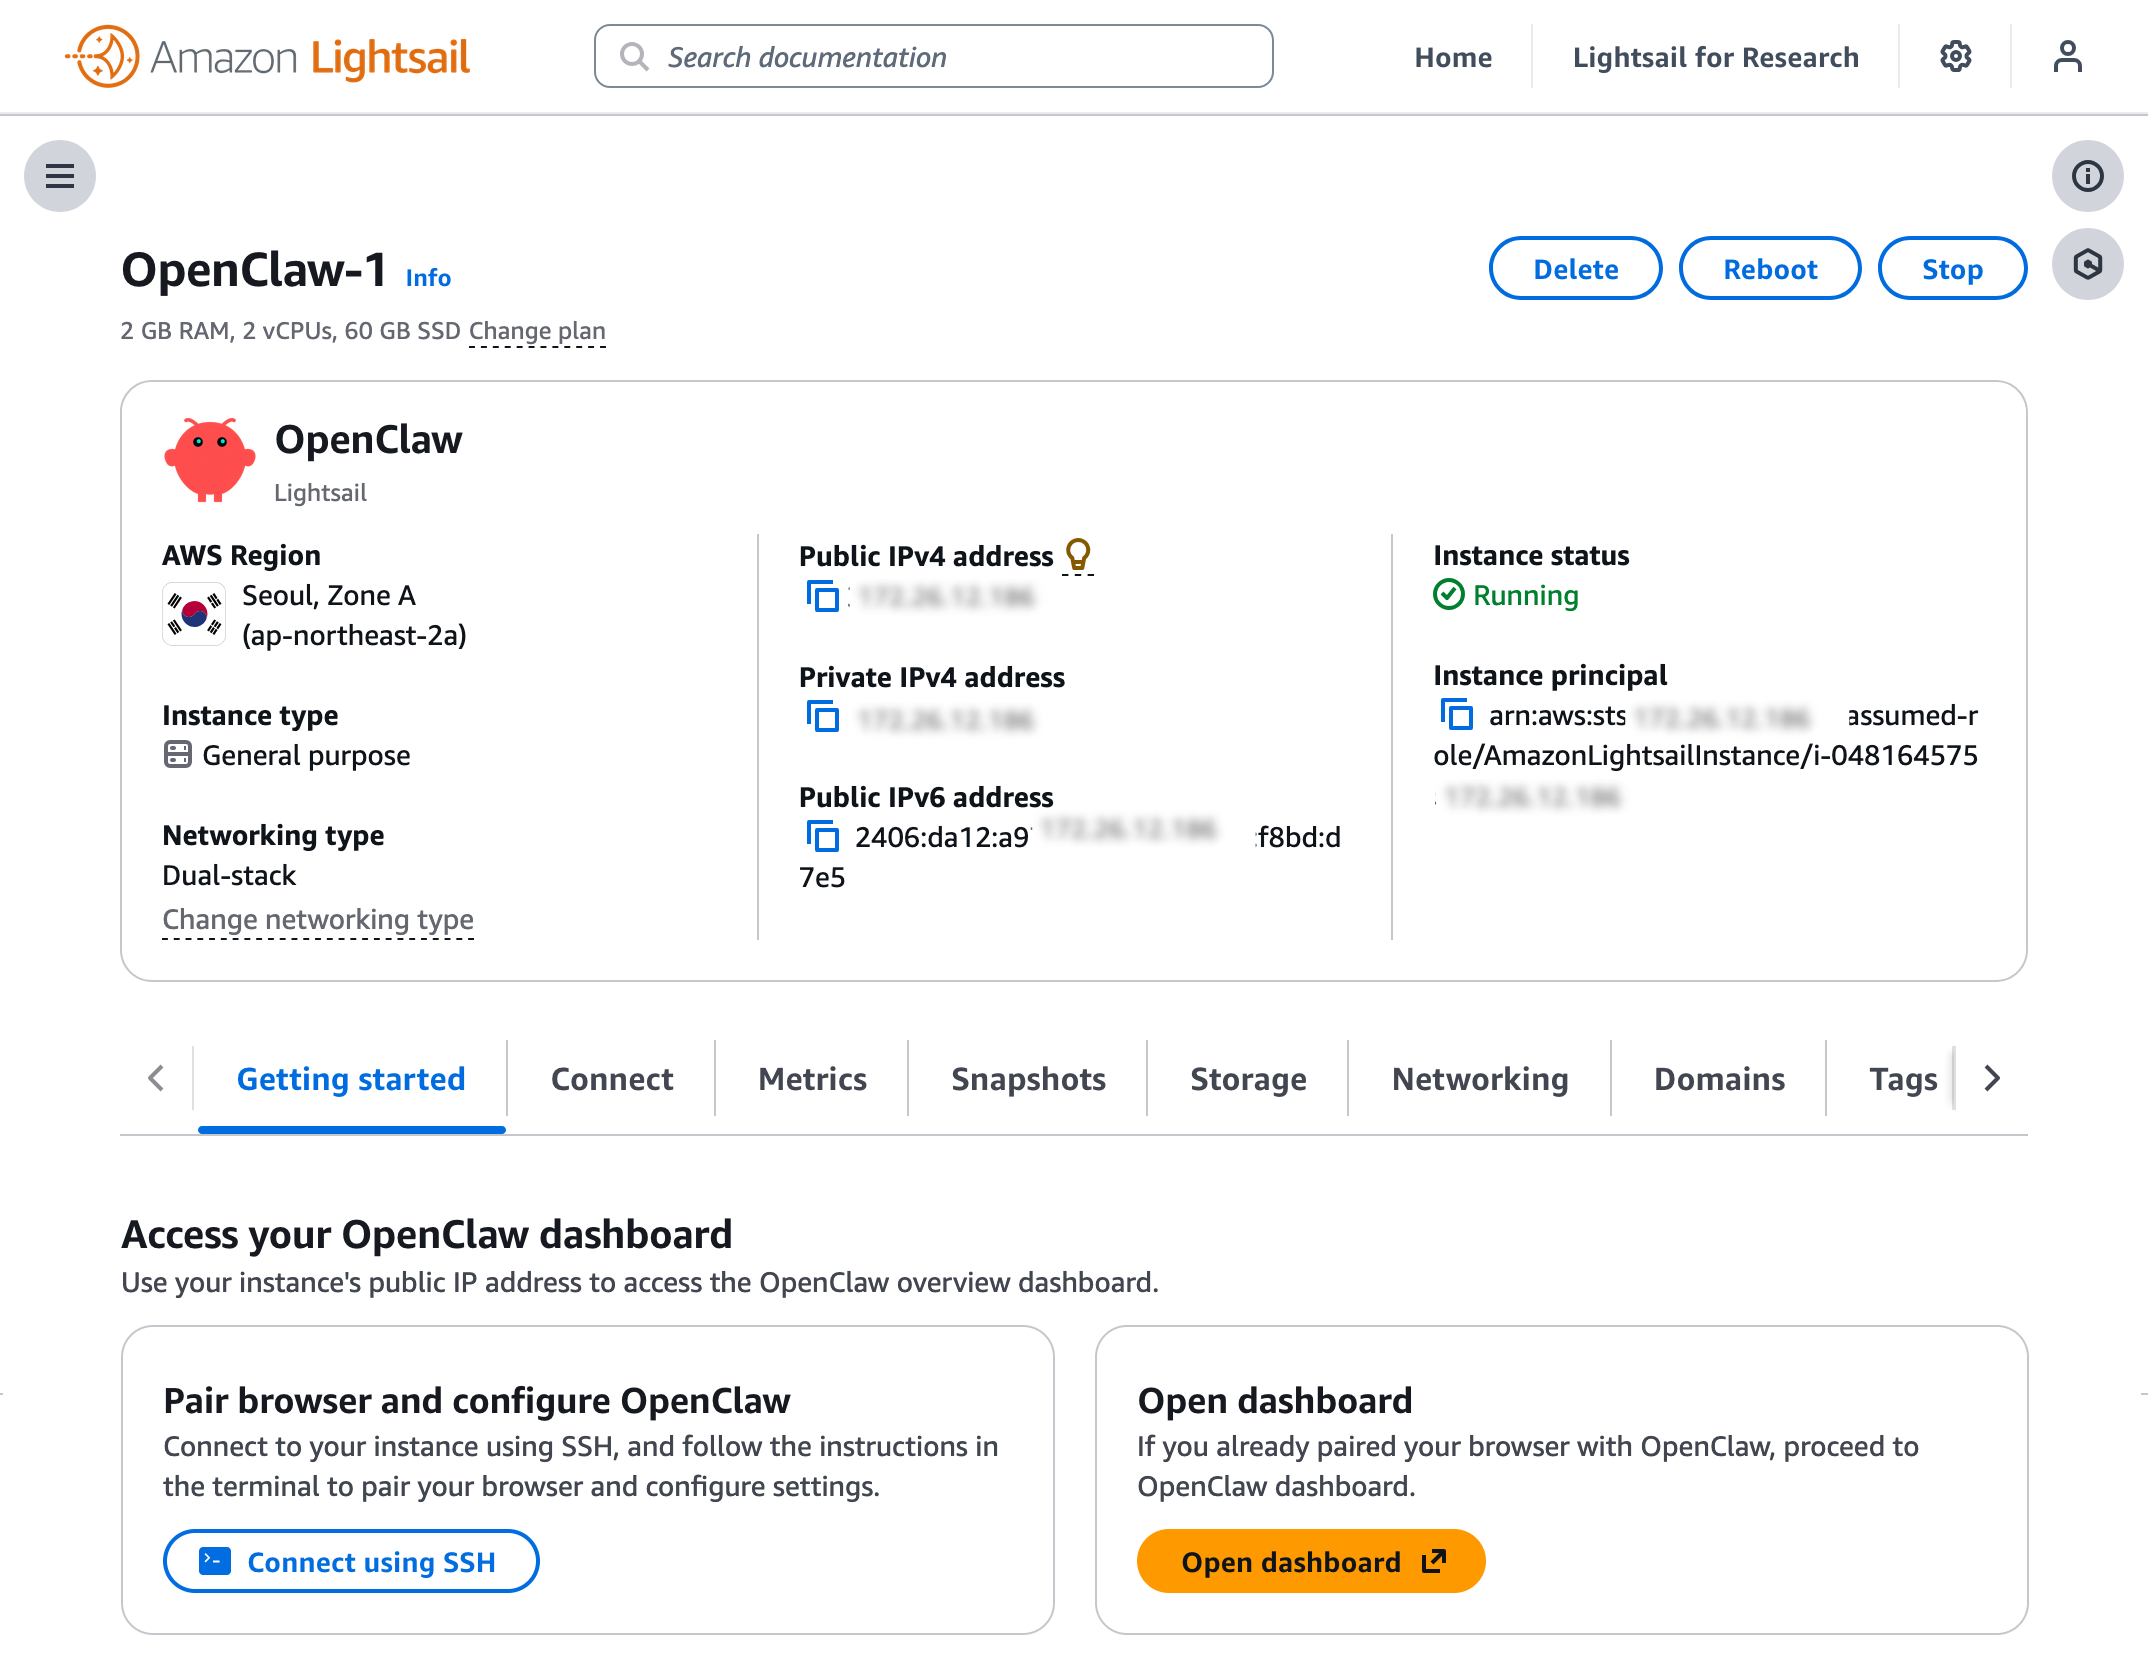
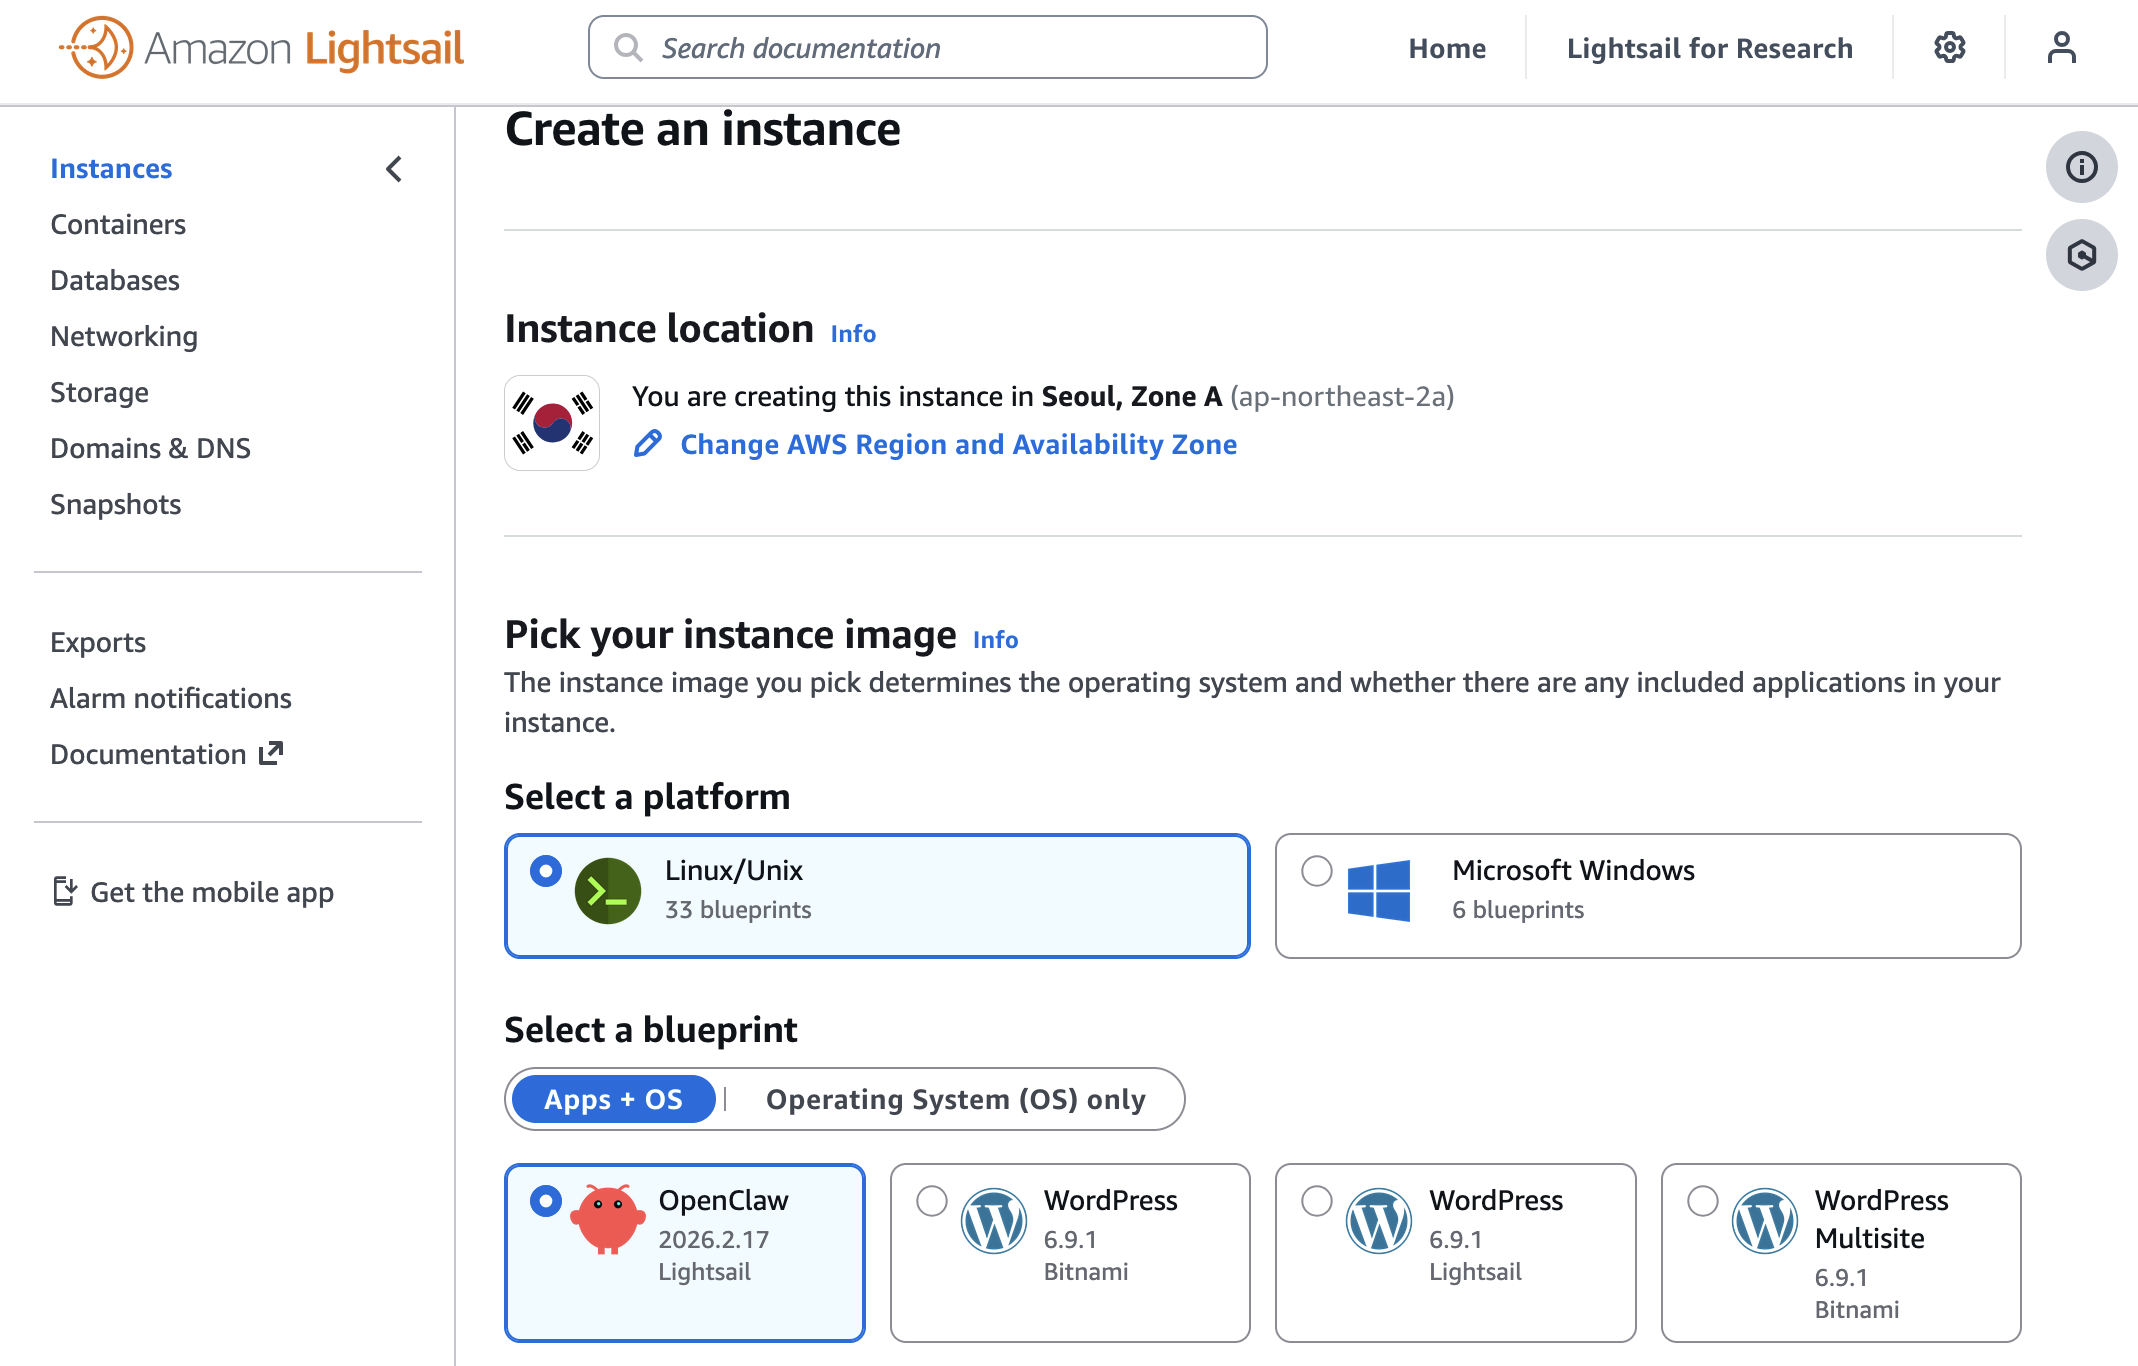
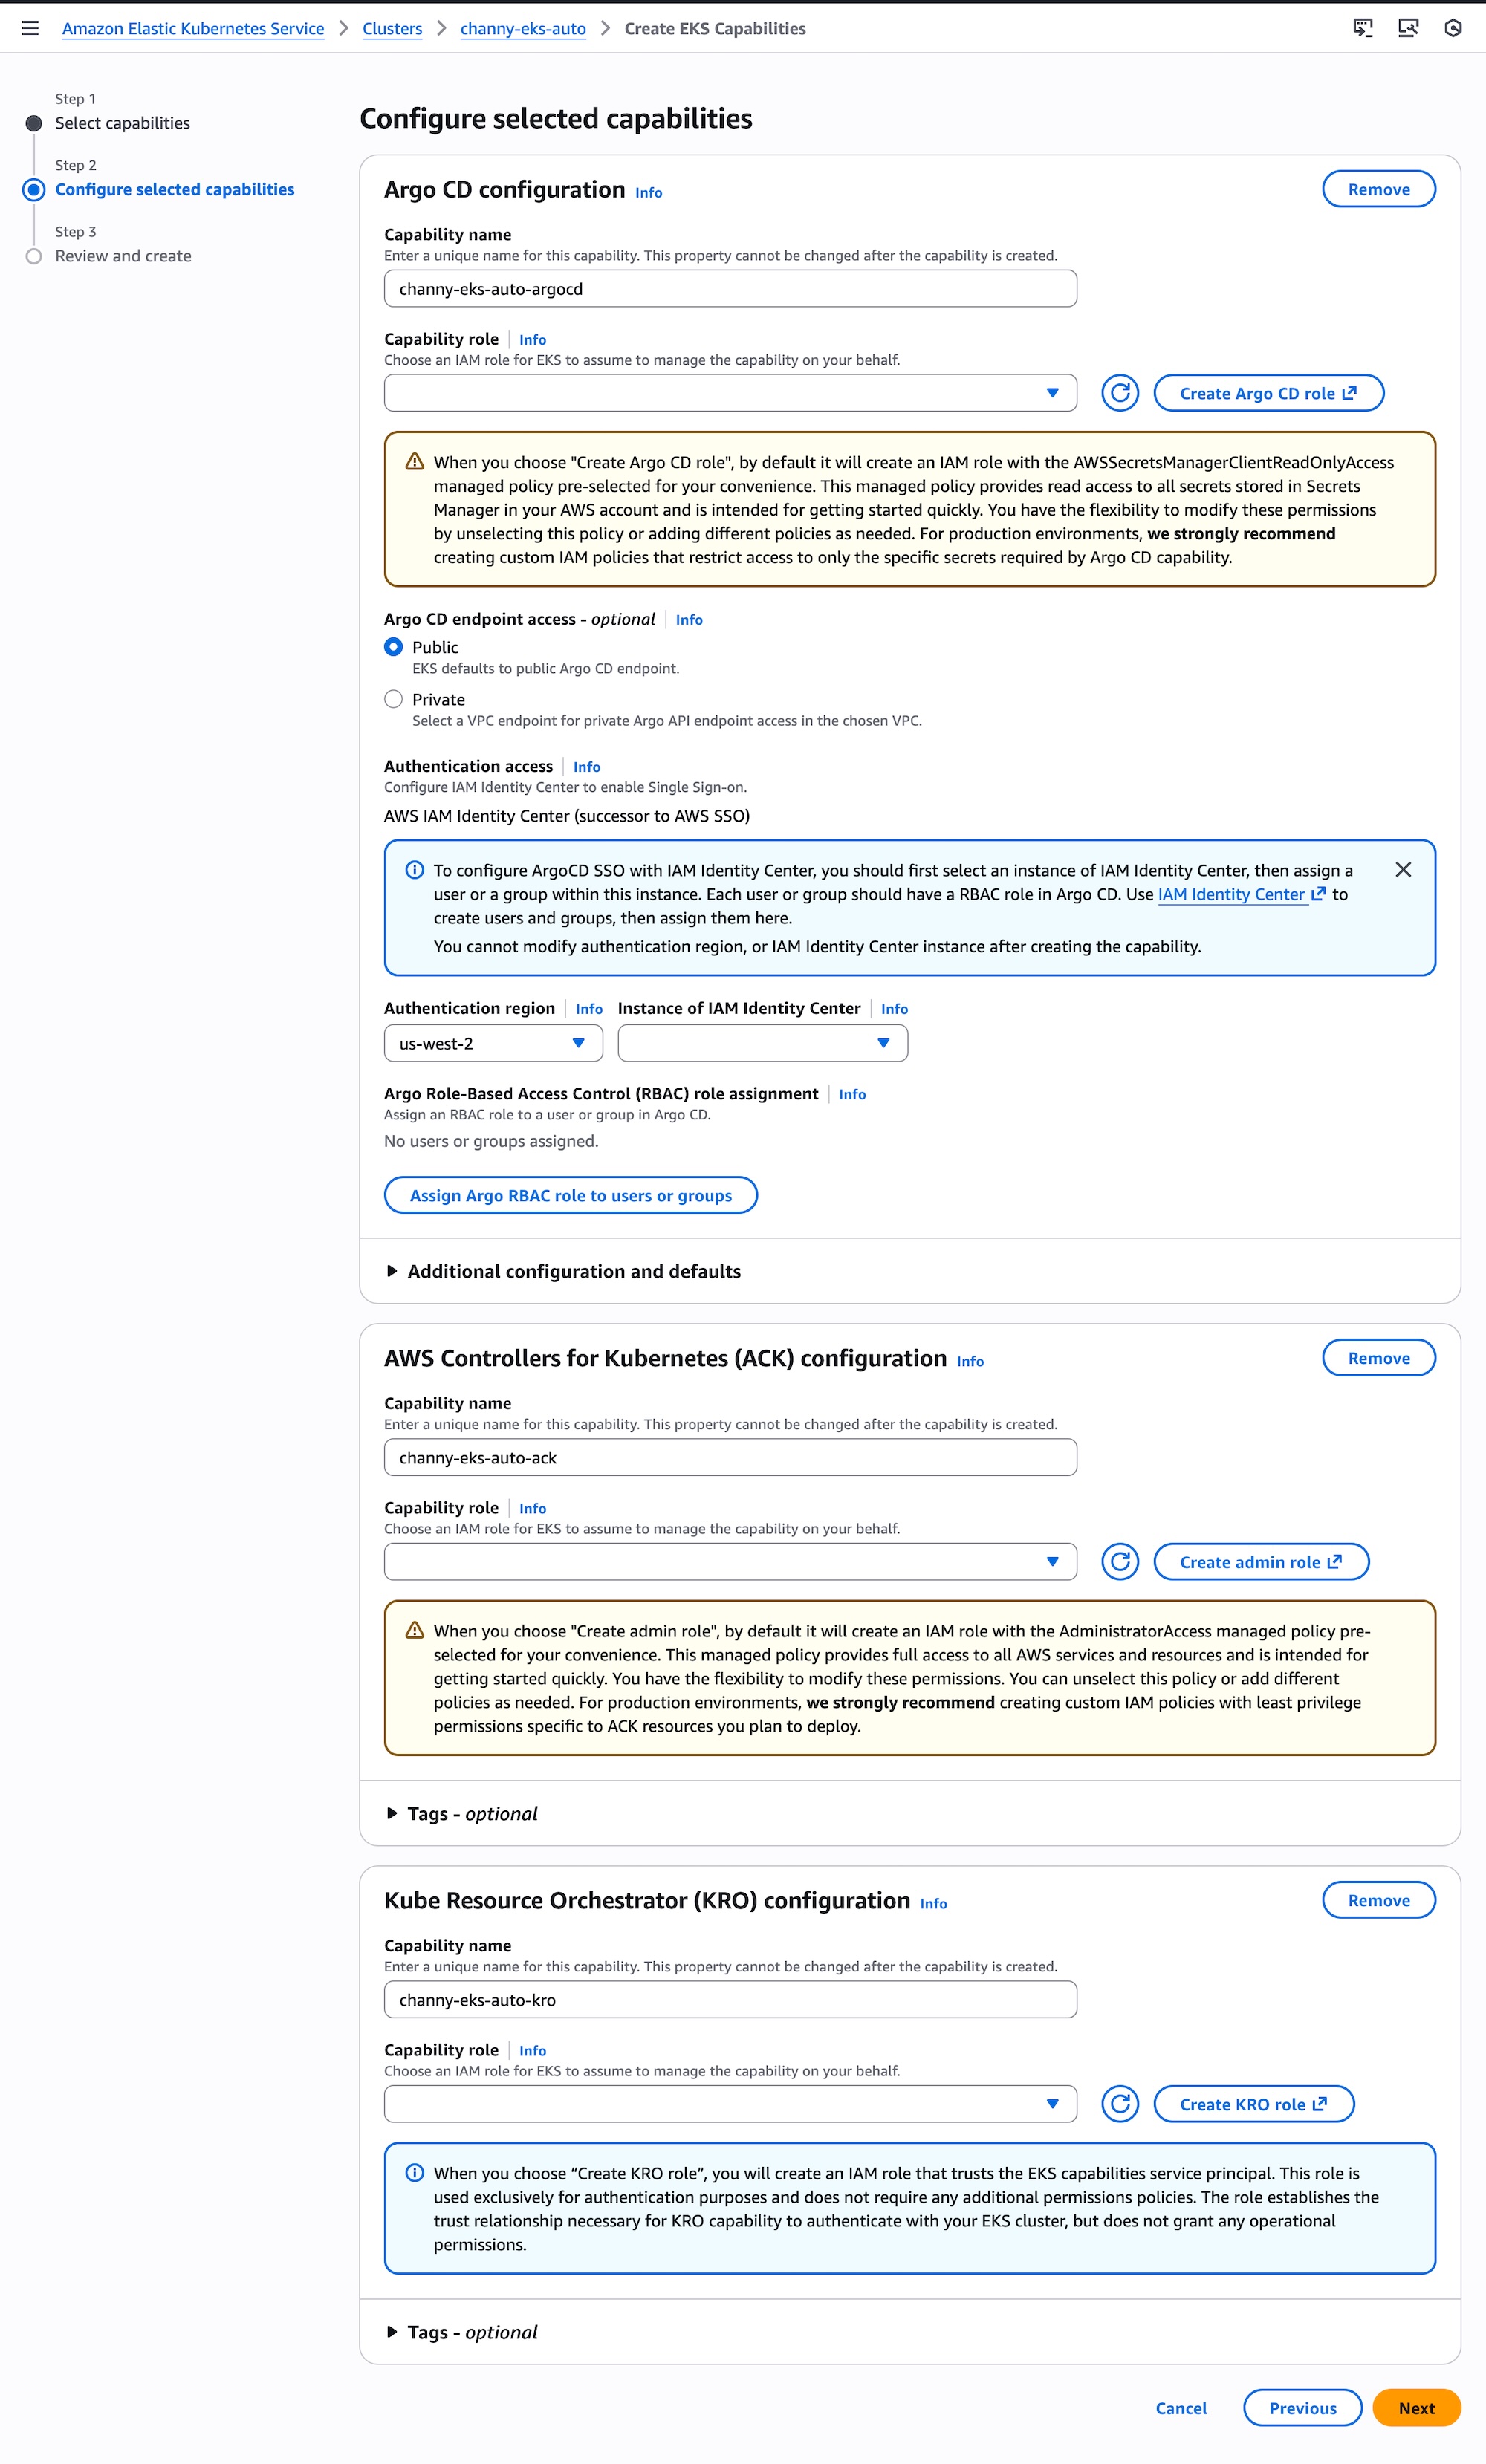
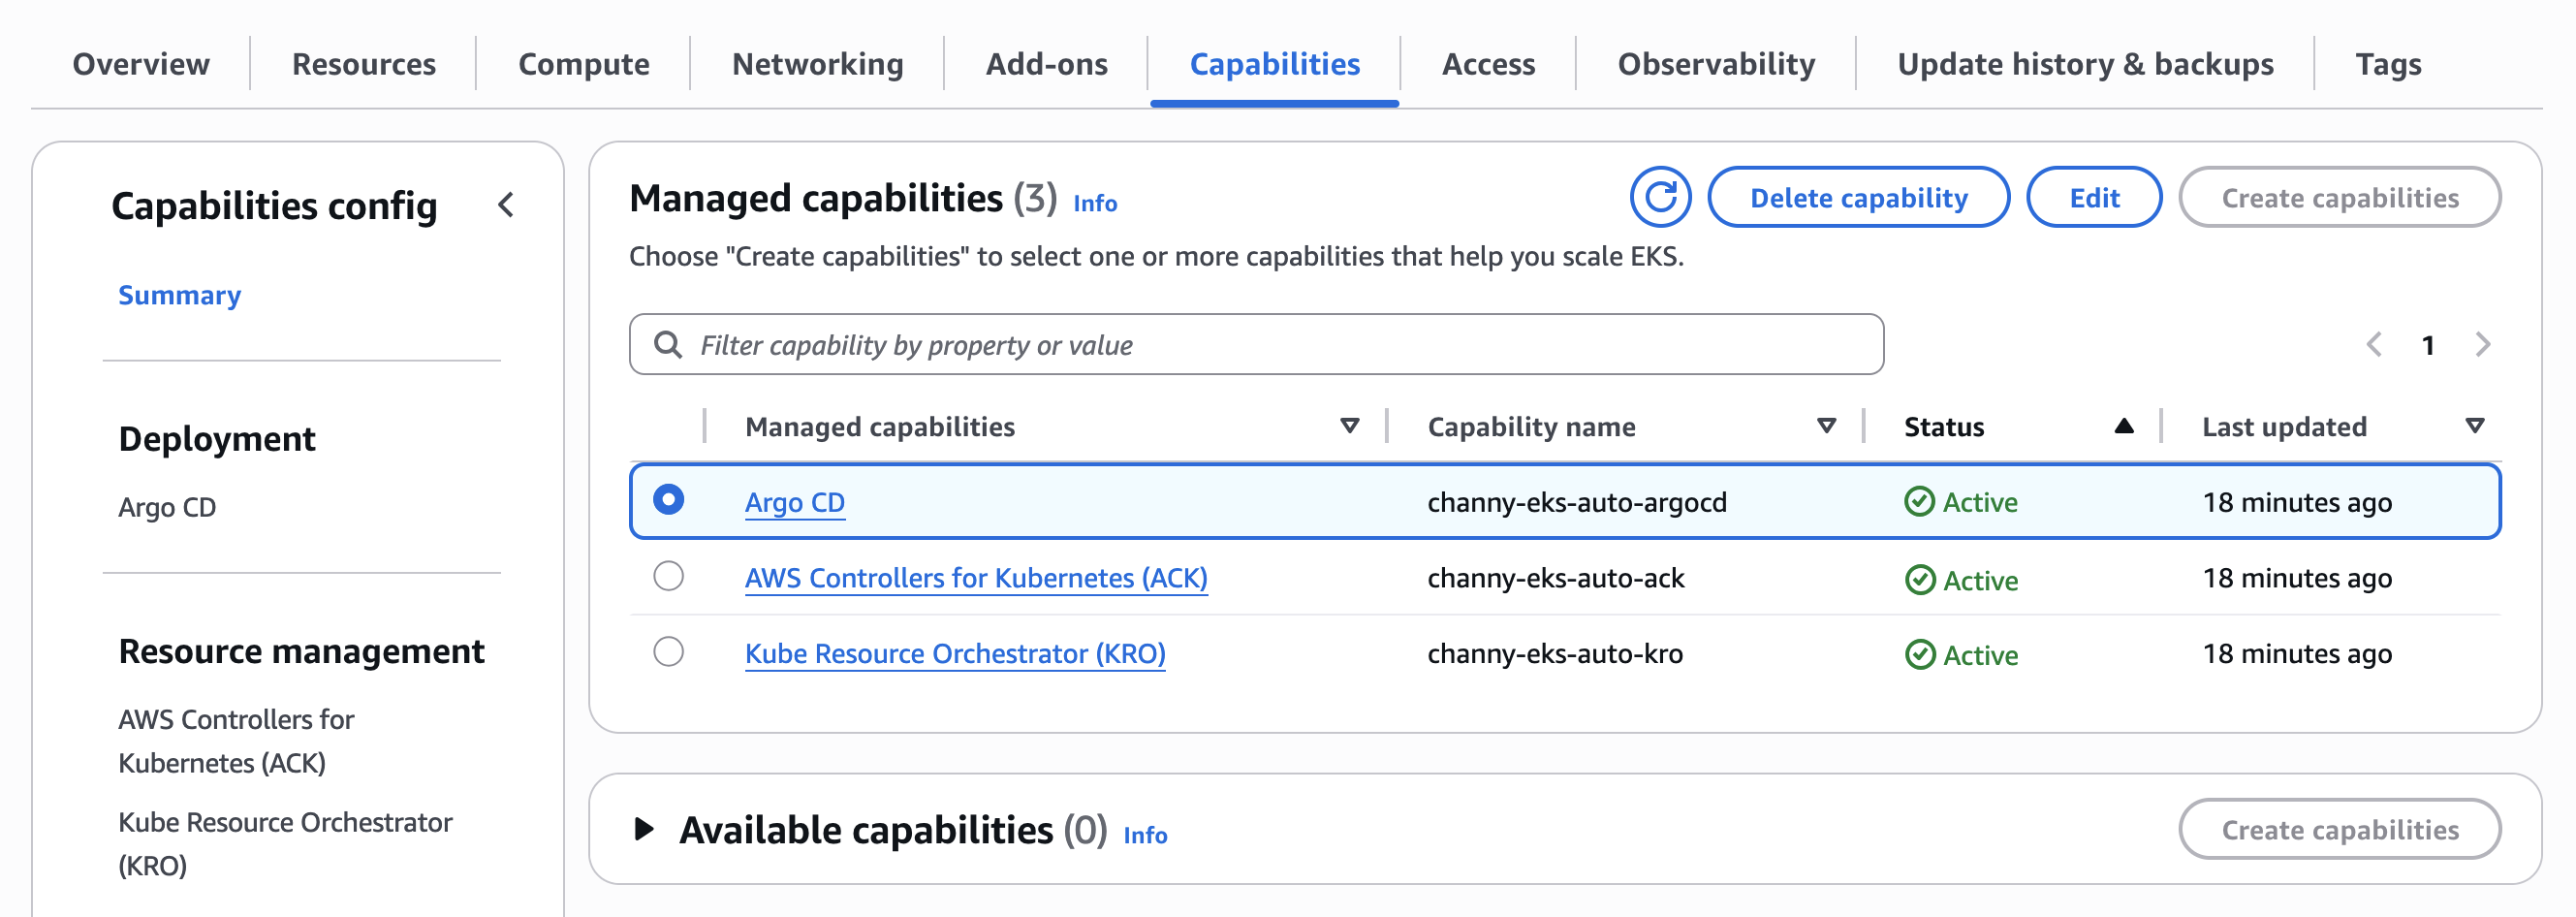
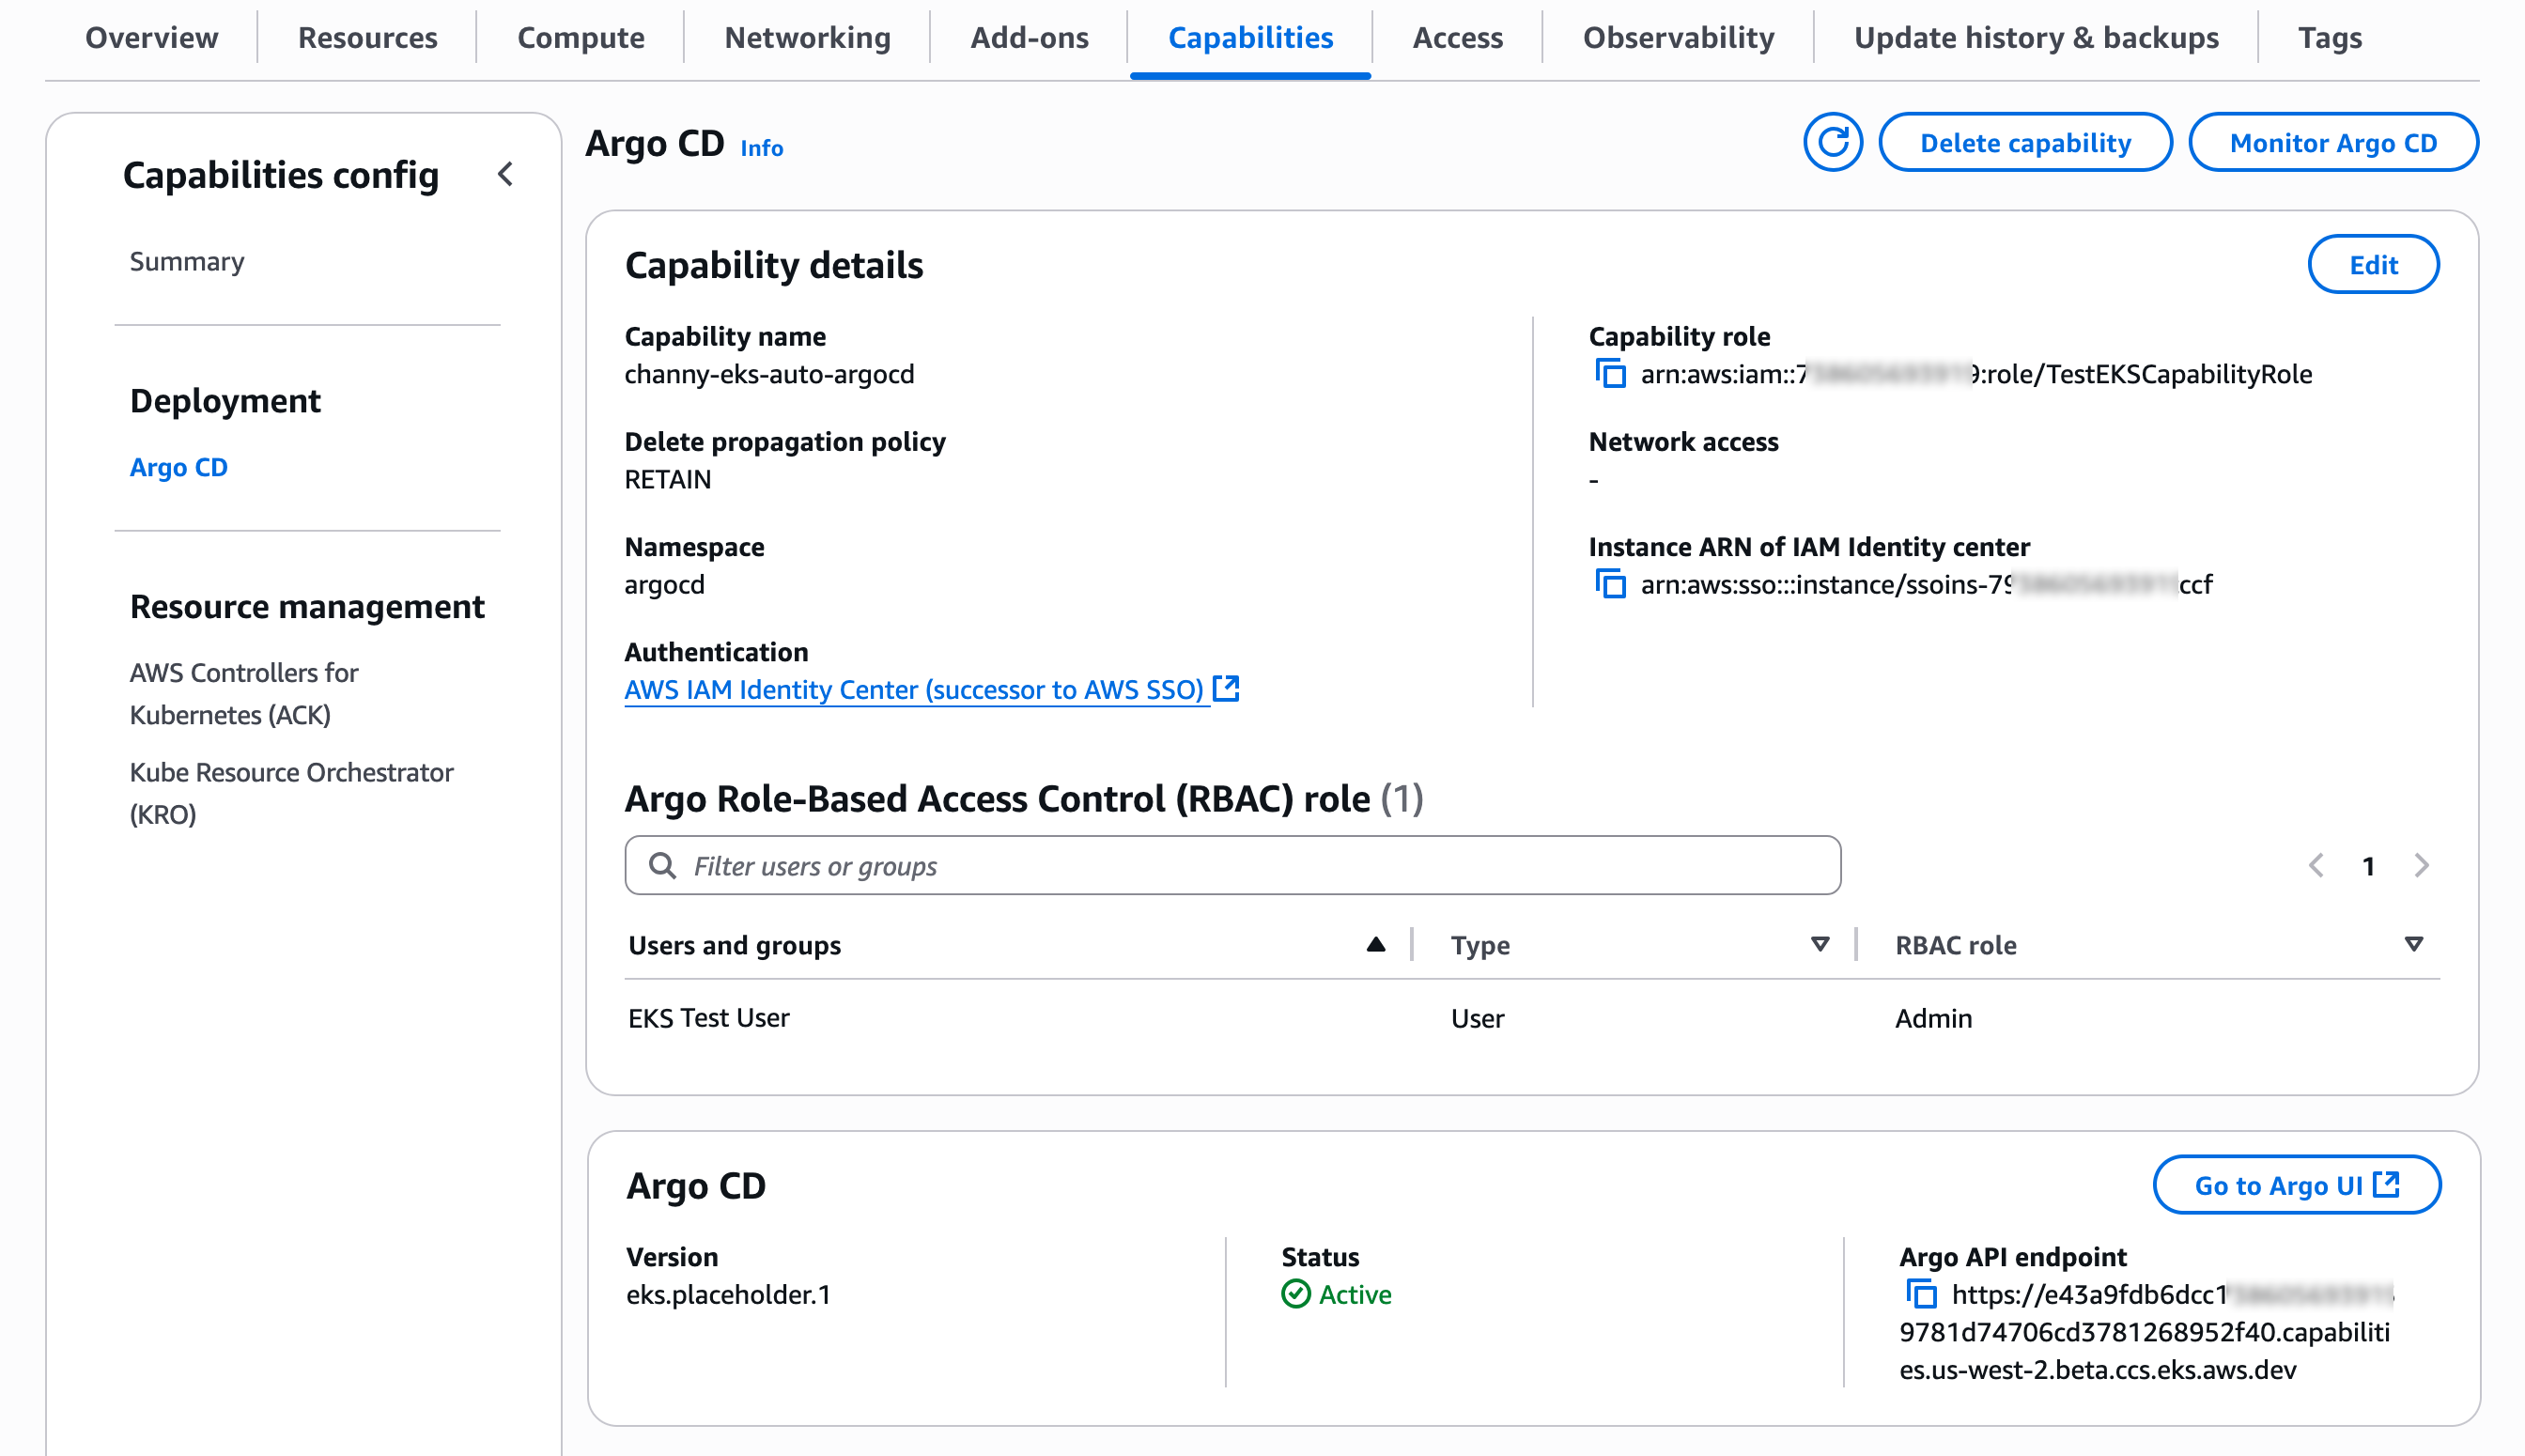
To get started, go to the Amazon Lightsail console and choose Create instance on the Instances section. After choosing your preferred AWS Region and Availability Zone, Linux/Unix platform to run your instance, choose OpenClaw under Select a blueprint.

You can choose your instance plan (4 GB memory plan is recommended for optimal performance) and enter a name for your instance. Finally choose Create instance. Your instance will be in a Running state in a few minutes.

Before you can use the OpenClaw dashboard, you should pair your browser with OpenClaw. This creates a secure connection between your browser session and OpenClaw. To pair your browser with OpenClaw, choose Connect using SSH in the Getting started tab.

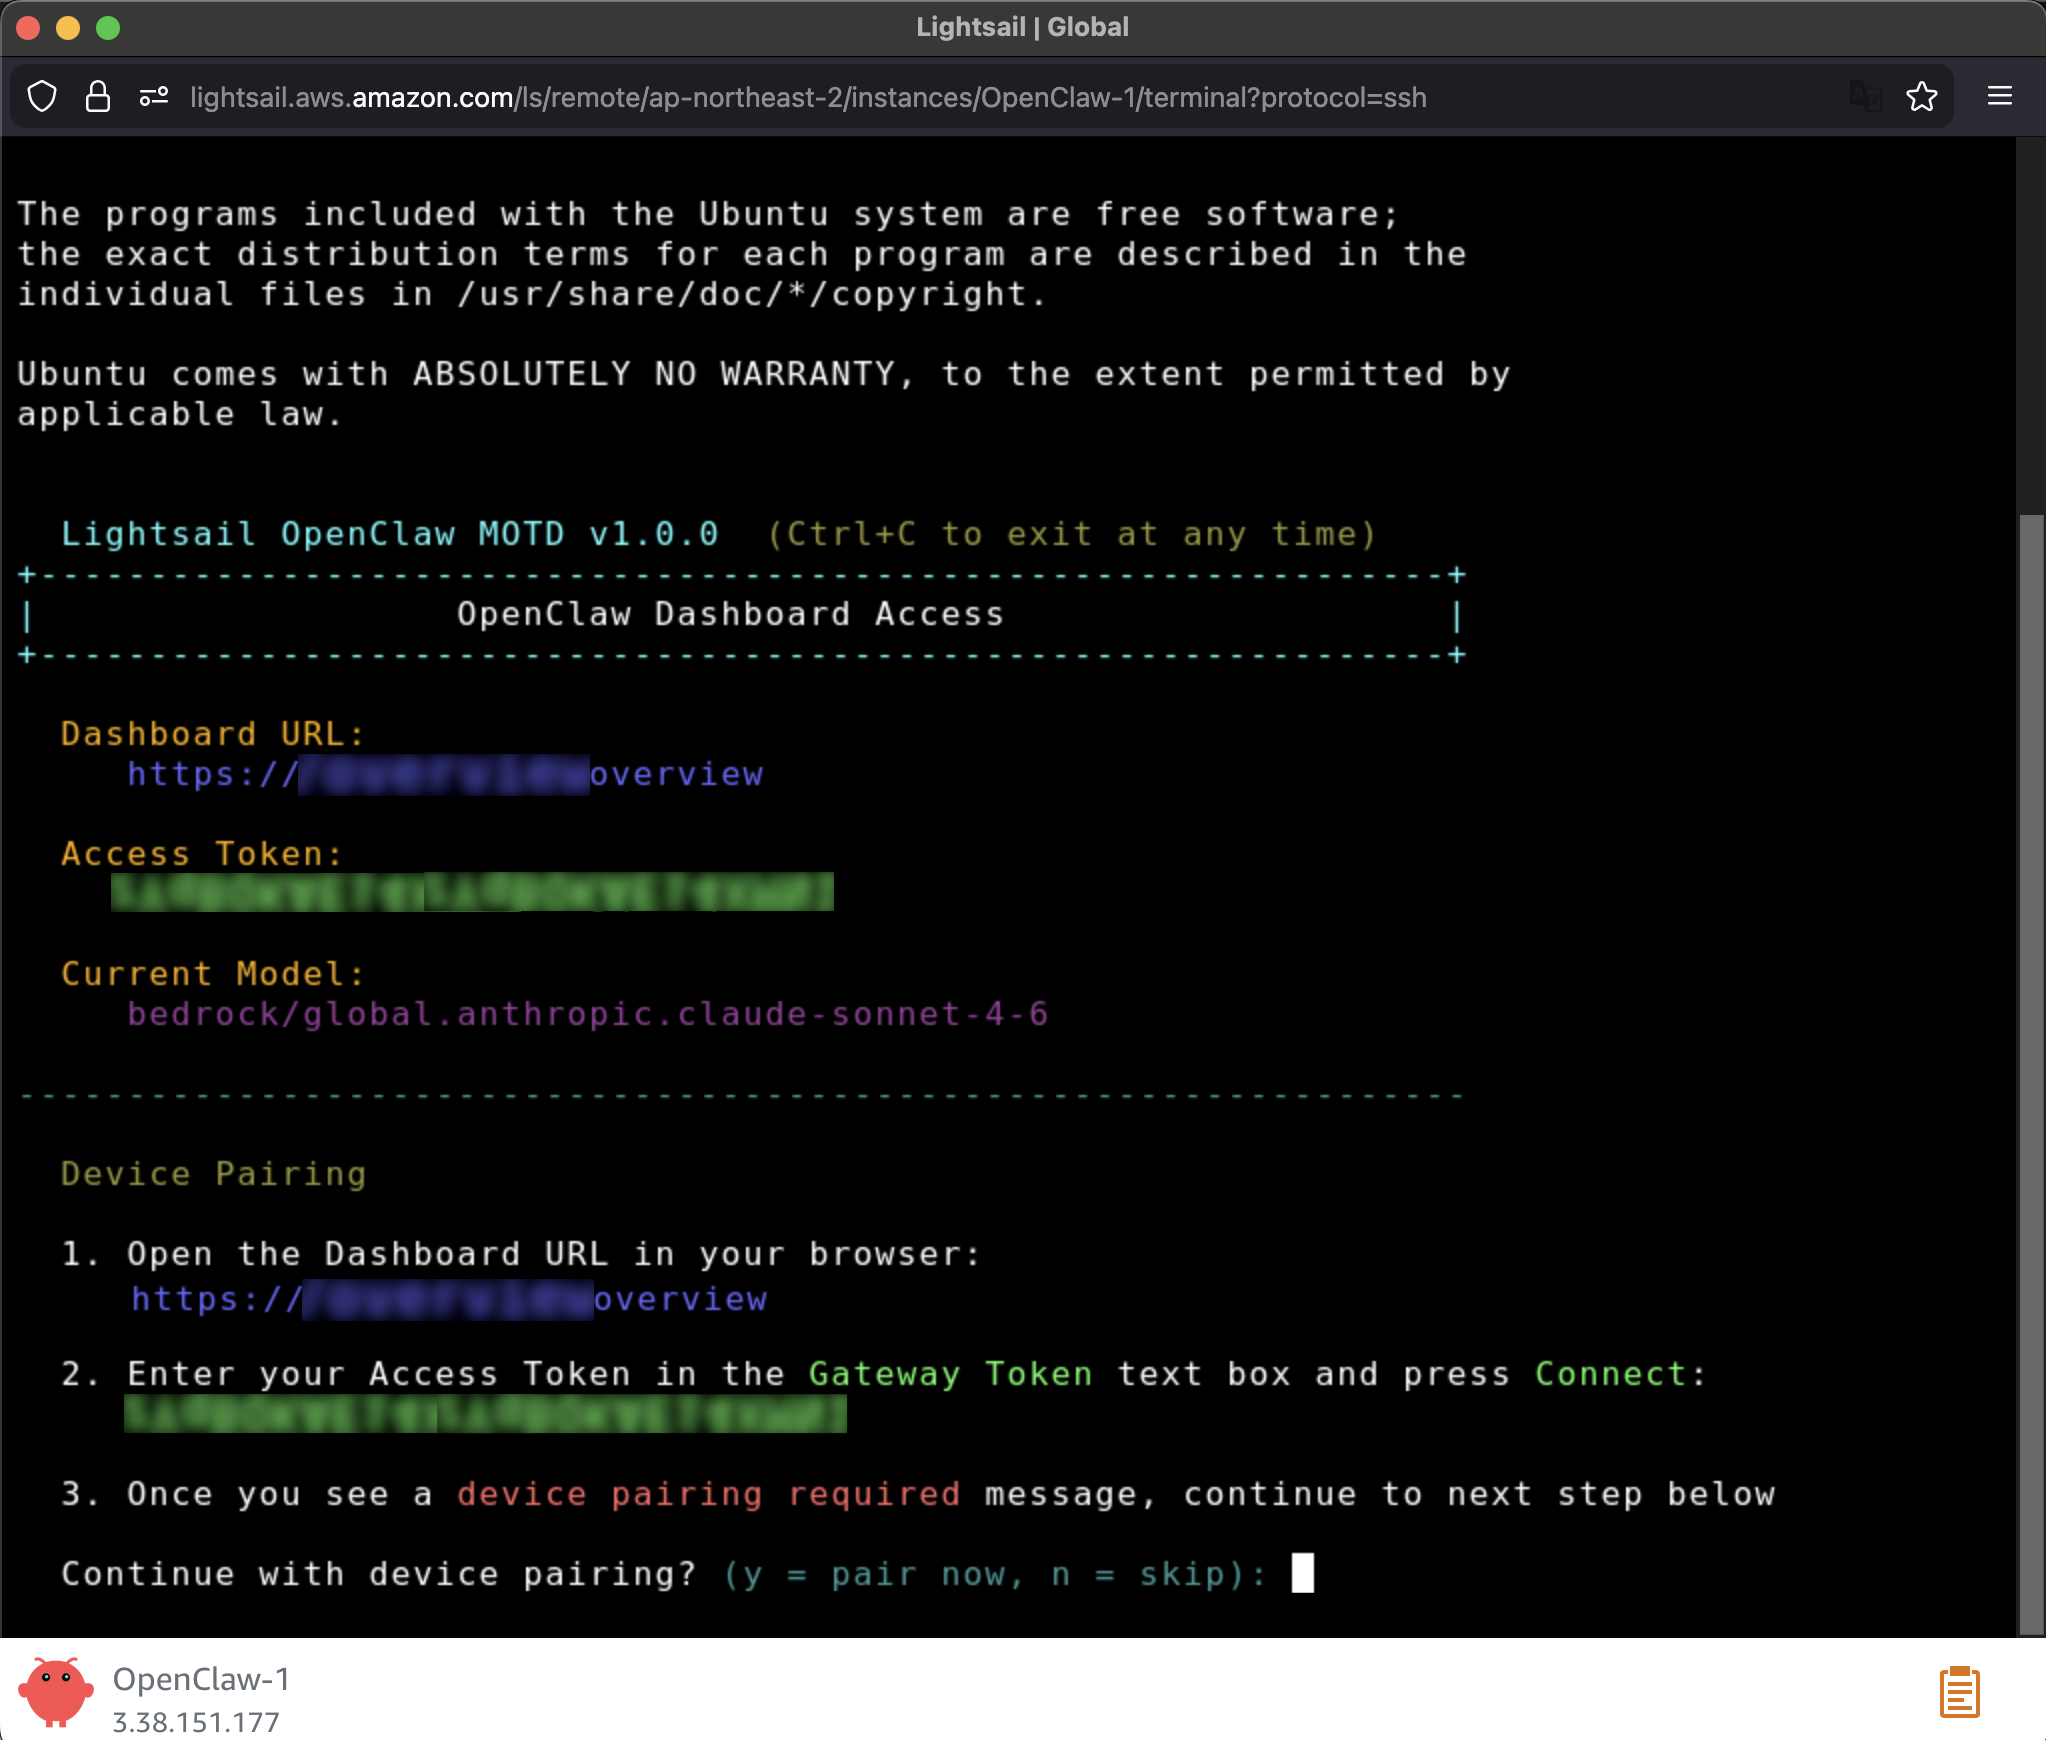
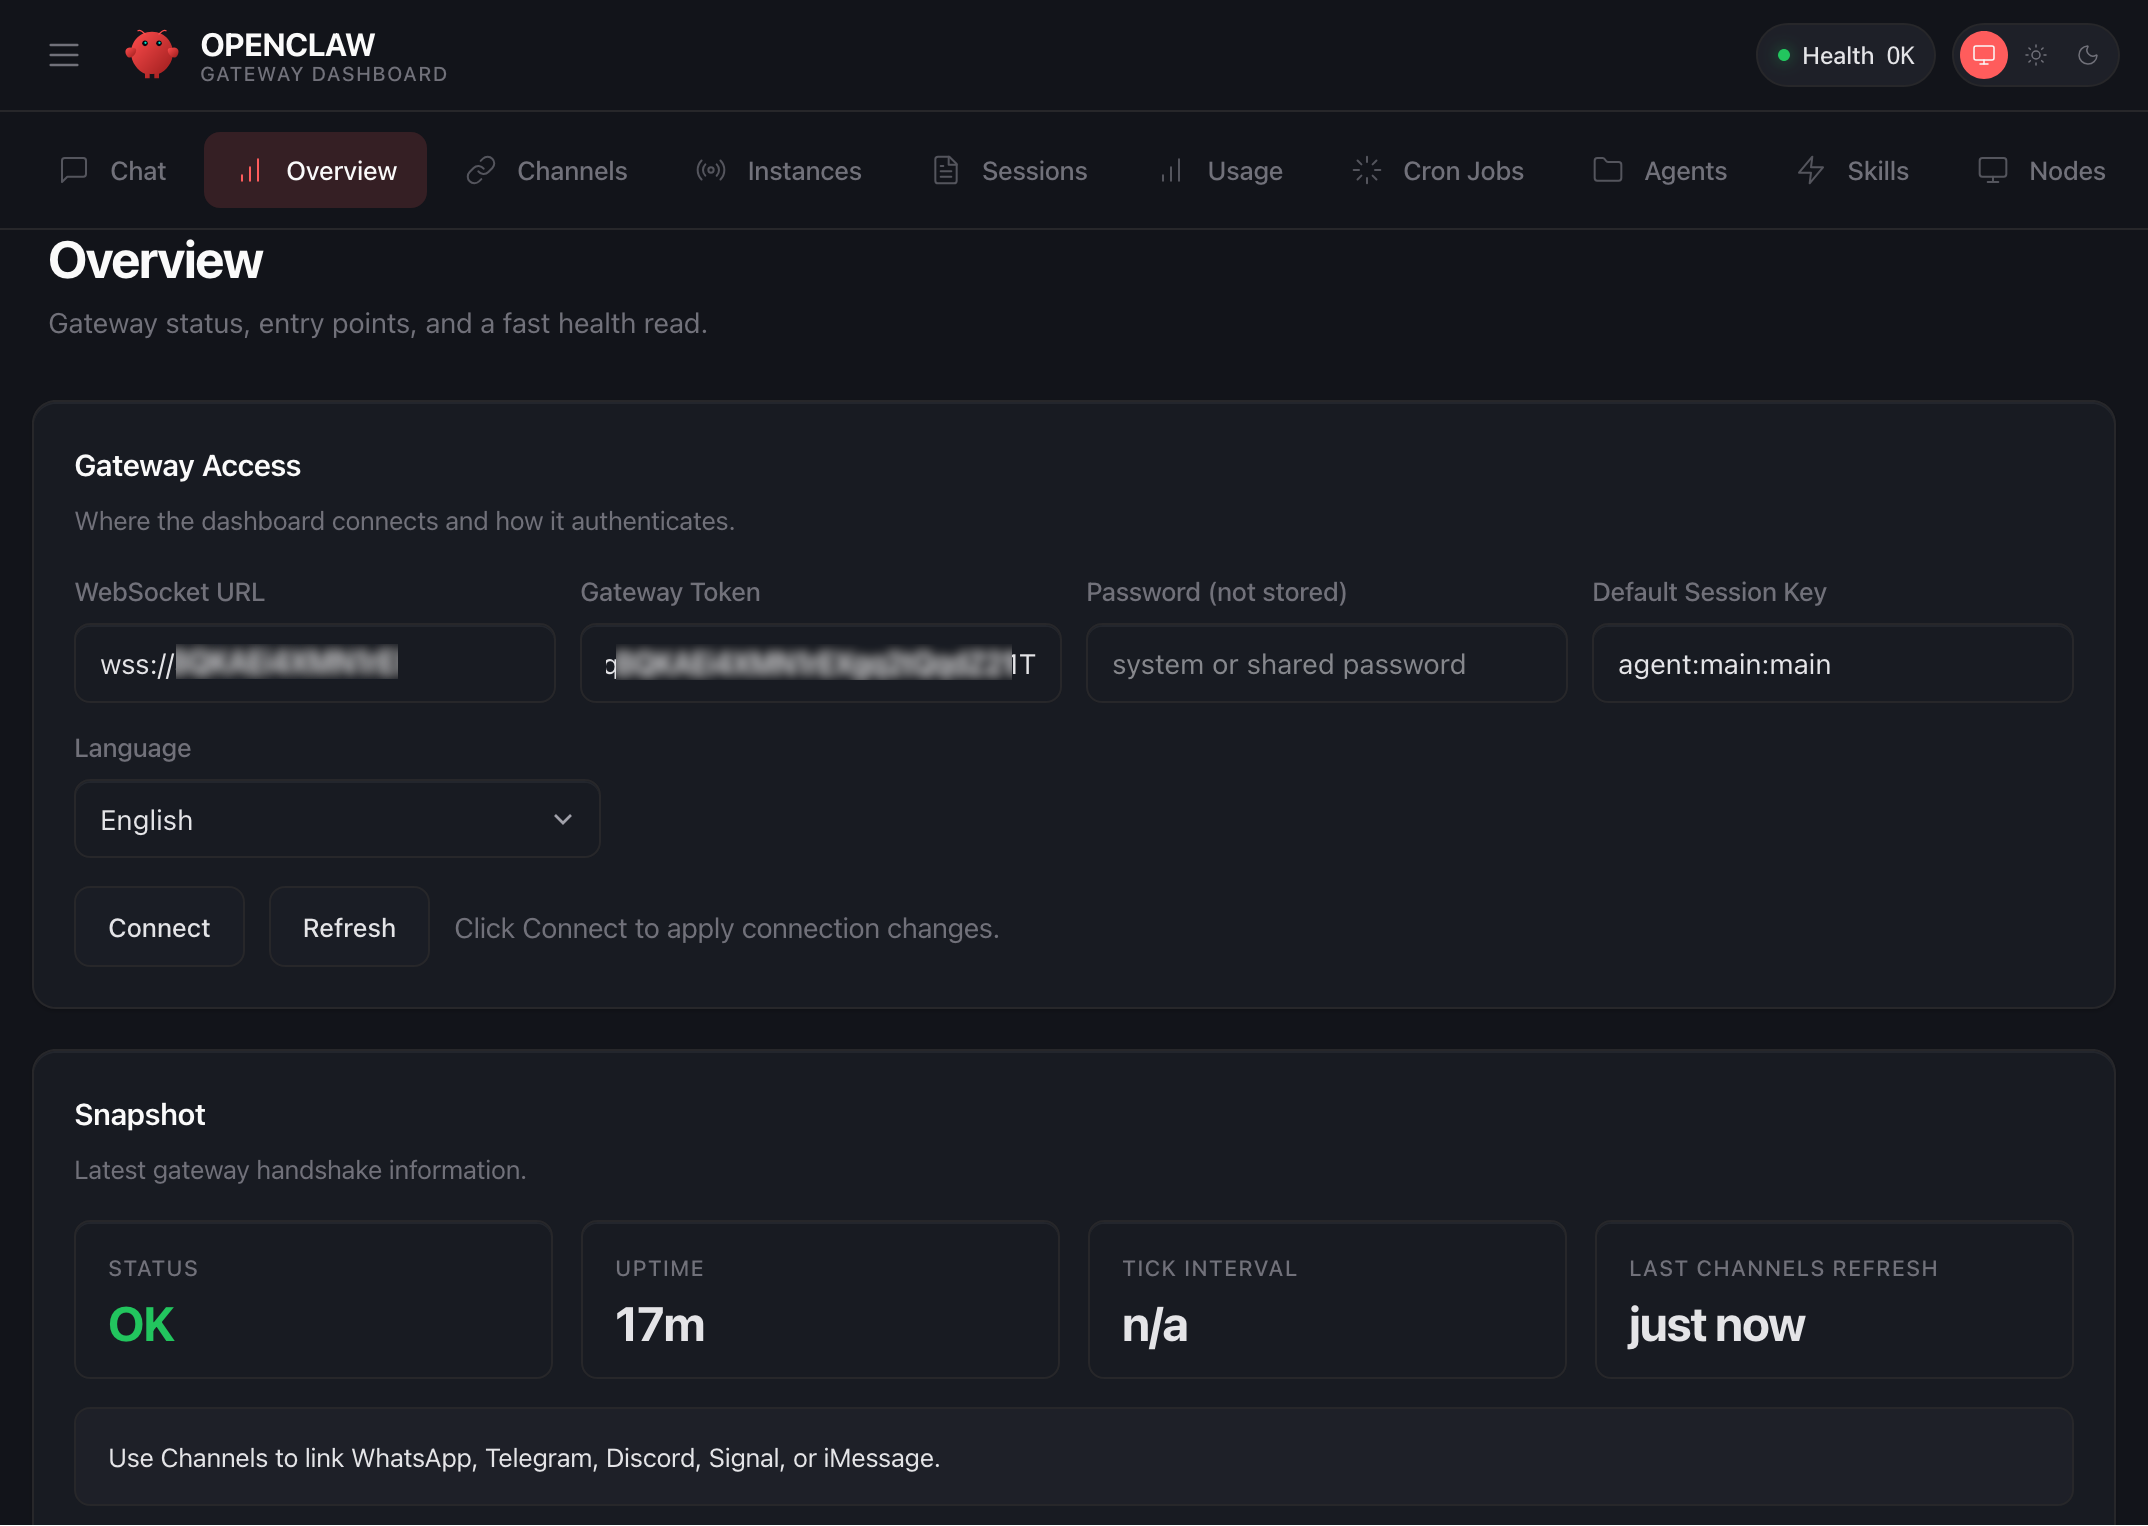
When a browser-based SSH terminal opens, you can see the dashboard URL, security credentials displayed in the welcome message. Copy them and open the dashboard in a new browser tab. In the OpenClaw dashboard, you can paste the copied access token into the Gateway Token field in the OpenClaw dashboard.

When prompted, press y to continue and a to approve with device pairing in the SSH terminal. When pairing is complete, you can see the OK status in the OpenClaw dashboard and your browser is now connected to your OpenClaw instance.

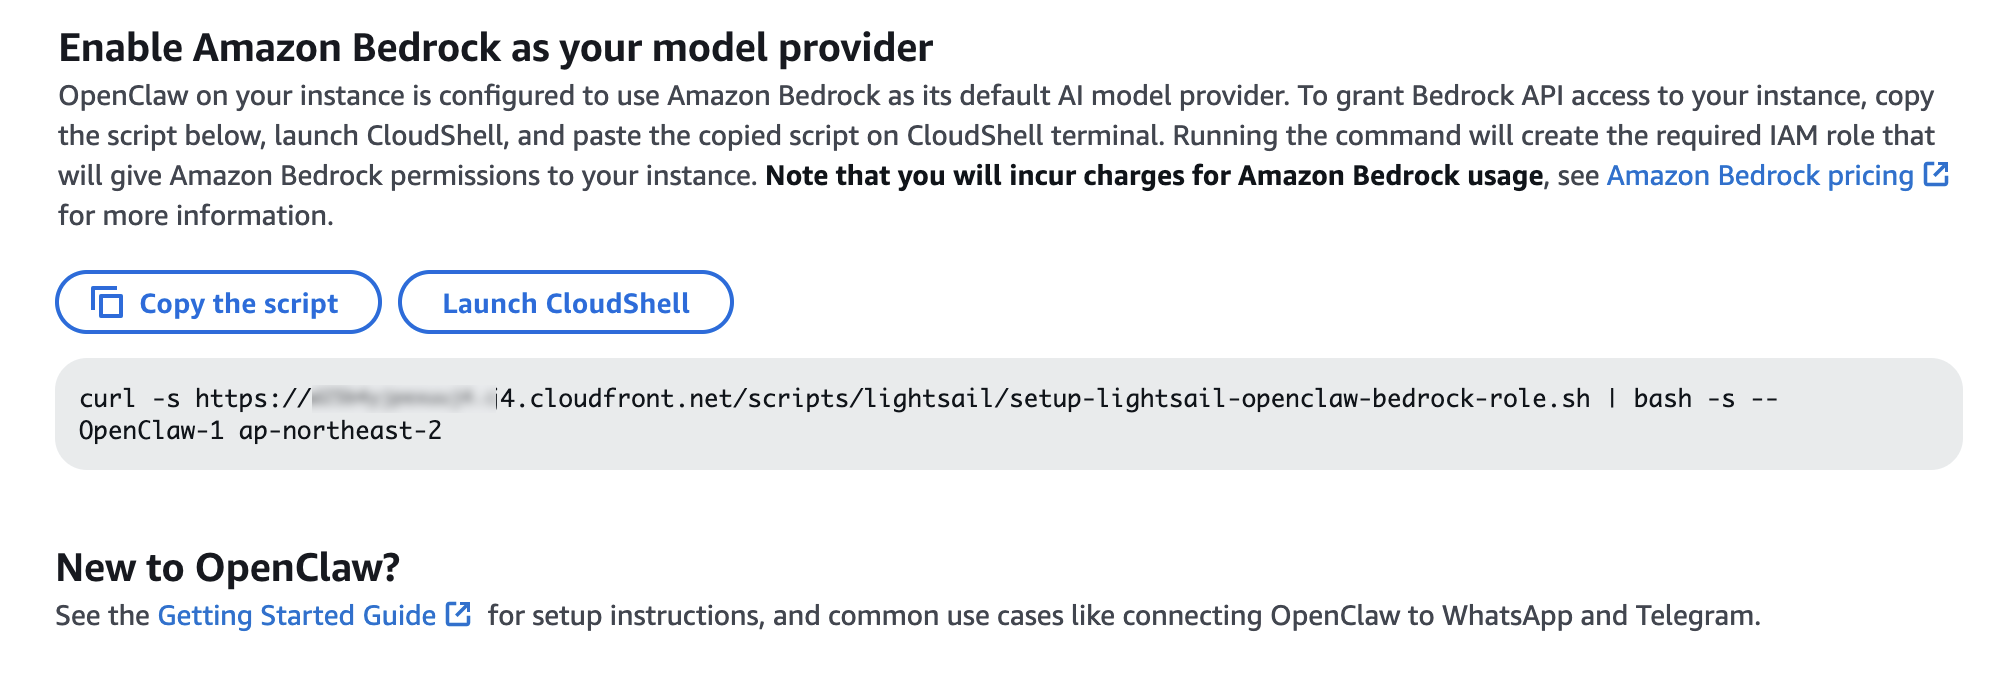
Your OpenClaw instance on Lightsail is configured to use Amazon Bedrock to power its AI assistant. To enable Bedrock API access, copy the script in the Getting started tab and run copied script into the AWS CloudShell terminal.

Once the script is complete, go to Chat in the OpenClaw dashboard to start using your AI assistant!

You can set up OpenClaw to work with messaging apps like Telegram and WhatsApp for interacting with your AI assistant directly from your phone or messaging client. To learn more, visit Get started with OpenClaw on Lightsail in the Amazon Lightsail User Guide.

Things to know
Here are key considerations to know about this feature:

  • Permission — You can customize AWS IAM permissions granted to your OpenClaw instance. The setup script creates an IAM role with a policy that grants access to Amazon Bedrock. You can customize this policy at any time. But, you should be careful when modifying permissions because it may prevent OpenClaw from generating AI responses. To learn more, visit AWS IAM policies in the AWS documentation
  • Cost — You pay for the instance plan you selected on an on-demand hourly rate only for what you use. Every message sent to and received from the OpenClaw assistant is processed through Amazon Bedrock using a token-based pricing model. If you select a third-party model distributed through AWS Marketplace such as Anthropic Claude or Cohere, there may be additional software fees on top of the per-token cost.
  • Security — Running a personal AI agent on OpenClaw is powerful, but it may cause security threat if you are careless. I recommend to hide your OpenClaw gateway never to expose it to open internet. The gateway auth token is your password, so rotate it often and store it in your envirnment file not hardcoded in config file. To learn more about security tips, visit Security on OpenClaw gateway.

Now available
OpenClaw on Amazon Lightsail is now available in all AWS commercial Regions where Amazon Lightsail is available. For Regional availability and a future roadmap, visit the AWS Capabilities by Region.

Give a try in the Lightsail console and send feedback to AWS re:Post for Amazon Lightsail or through your usual AWS support contacts.

Channy

Amazon EC2 Hpc8a Instances powered by 5th Gen AMD EPYC processors are now available

Post Syndicated from Channy Yun (윤석찬) original https://aws.amazon.com/blogs/aws/amazon-ec2-hpc8a-instances-powered-by-5th-gen-amd-epyc-processors-are-now-available/

Today, we’re announcing the general availability of Amazon Elastic Compute Cloud (Amazon EC2) Hpc8a instances, a new high performance computing (HPC) optimized instance type powered by latest 5th Generation AMD EPYC processors with a maximum frequency of up to 4.5 GHz. These instances are ideal for compute-intensive tightly coupled HPC workloads, including computational fluid dynamics, simulations for faster design iterations, high-resolution weather modeling within tight operational windows, and complex crash simulations that require rapid time-to-results.

The new Hpc8a instances deliver up to 40% higher performance, 42% greater memory bandwidth, and up to 25% better price-performance compared to previous generation Hpc7a instances. Customers benefit from the high core density, memory bandwidth, and low-latency networking that helped them scale efficiently and reduce job completion times for their compute-intensive simulation workloads.

Hpc8a instances
Hpc8a instances are available with 192 cores, 768 GiB memory, and 300 Gbps Elastic Fabric Adapter (EFA) networking to run applications requiring high levels of inter node communications at scale.

Instance Name Physical Cores Memory (Gib) EFA Network Bandwidth (Gbps) Network Bandwidth (Gbps) Attached Storage
Hpc8a.96xlarge 192 768 Up to 300 75 EBS Only

Hpc8a instances are available in a single 96xlarge size with a 1:4 core-to-memory ratio. You will have the capability to right size based on HPC workload requirements by customizing the number of cores needed at launch instances. These instances also use sixth-generation AWS Nitro cards, which offload CPU virtualization, storage, and networking functions to dedicated hardware and software, enhancing performance and security for your workloads.

You can use Hpc8a instances with AWS ParallelCluster and AWS Parallel Computing Service (AWS PCS) to simplify workload submission and cluster creation and Amazon FSx for Lustre for sub-millisecond latencies and up to hundreds of gigabytes per second of throughput for storage. To achieve the best performance for HPC workloads, these instances have Simultaneous Multithreading (SMT) disabled.

Now available
Amazon EC2 Hpc8a instances are now available in US East (Ohio) and Europe (Stockholm) AWS Regions. For Regional availability and a future roadmap, search the instance type in the CloudFormation resources tab of AWS Capabilities by Region.

You can purchase these instances as On-Demand Instances and Savings Plan. To learn more, visit the Amazon EC2 Pricing page.

Give Hpc8a instances a try in the Amazon EC2 console. To learn more, visit the Amazon EC2 Hpc8a instances page and send feedback to AWS re:Post for EC2 or through your usual AWS Support contacts.

Channy

Amazon EC2 C8id, M8id, and R8id instances with up to 22.8 TB local NVMe storage are generally available

Post Syndicated from Channy Yun (윤석찬) original https://aws.amazon.com/blogs/aws/amazon-ec2-c8id-m8id-and-r8id-instances-with-up-to-22-8-tb-local-nvme-storage-are-generally-available/

Last year, we launched the Amazon Elastic Compute Cloud (Amazon EC2) C8i instances, M8i instances, and R8i instances powered by custom Intel Xeon 6 processors available only on AWS with sustained all-core 3.9 GHz turbo frequency. They deliver the highest performance and fastest memory bandwidth among comparable Intel processors in the cloud.

Today we’re announcing new Amazon EC2 C8id, M8id, and R8id instances backed by up to 22.8TB of NVMe-based SSD block-level instance storage physically connected to the host server. These instances offer 3 times more vCPUs, memory and local storage compared to previous sixth-generation instances.

These instances deliver up to 43% higher compute performance and 3.3 times more memory bandwidth compared to previous sixth-generation instances. They also deliver up to 46% higher performance for I/O intensive database workloads, and up to 30% faster query results for I/O intensive real-time data analytics compared to previous sixth generation instances.

  • C8id instances are ideal for compute-intensive workloads, including those that need access to high-speed, low-latency local storage like video encoding, image manipulation, and other forms of media processing.
  • M8id instances are best for workloads that require a balance of compute and memory resources along with high-speed, low-latency local block storage, including data logging, media processing, and medium-sized data stores.
  • R8id instances are designed for memory-intensive workloads such as large-scale SQL and NoSQL databases, in-memory databases, large-scale data analytics, and AI inference.

C8id, M8id, and R8id instances now scale up to 96xlarge (versus 32xlarge sizes in the sixth generation) with up to 384 vCPUs, 3TiB of memory, and 22.8TB of local storage that make it easier to scale up applications and drive greater efficiencies. These instances also offer two bare metal sizes (metal-48xl and metal-96xl), allowing you to right size your instances and deploy your most performance sensitive workloads that benefit from direct access to physical resources.

The instances are available in 11 sizes per family, as well as two bare metal configurations each:

Instance Name vCPUs Memory (GiB) (C/M/R) Local NVMe storage (GB) Network bandwidth (Gbps) EBS bandwidth (Gbps)
large 2 4/8/16* 1 x 118 Up to 12.5 Up to 10
xlarge 4 8/16/32* 1 x 237 Up to 12.5 Up to 10
2xlarge 8 16/32/64* 1 x 474 Up to 15 Up to 10
4xlarge 16 32/64/128* 1 x 950 Up to 15 Up to 10
8xlarge 32 64/128/256* 1 x 1,900 15 10
12xlarge 48 96/192/384* 1 x 2,850 22.5 15
16xlarge 64 128/256/512* 1 x 3,800 30 20
24xlarge 96 192/384/768* 2 x 2,850 40 30
32xlarge 128 256/512/1024* 2 x 3,800 50 40
48xlarge 192 384/768/1536* 3 x 3,800 75 60
96xlarge 384 768/1536/3072* 6 x 3,800 100 80
metal-48xl 192 384/768/1536* 3 x 3,800 75 60
metal-96xl 384 768/1536/3072* 6 x 3,800 100 80

*Memory values are for C8id/M8id/R8id respectively.

These instances support the Instance Bandwidth Configuration (IBC) feature like other eighth-generation instance types, offering flexibility to allocate resources between network and Amazon Elastic Block Store (Amazon EBS) bandwidth. You can scale network or EBS bandwidth by 25%, allocating resources optimally for each workload. These instances also use sixth-generation AWS Nitro cards offloading CPU virtualization, storage, and networking functions to dedicated hardware and software, enhancing performance and security for your workloads.

You can use any Amazon Machine Images (AMIs) that include drivers for the Elastic Network Adapter (ENA) and NVMe to fully utilize the performance and capabilities. All current generation AWS Windows and Linux AMIs come with the AWS NVMe driver installed by default. If you use an AMI that does not have the AWS NVMe driver, you can manually install AWS NVMe drivers.
As I noted in my previous blog post, here are a couple of things to remind you about the local NVMe storage on these instances:

  • You don’t have to specify a block device mapping in your AMI or during the instance launch; the local storage will show up as one or more devices (/dev/nvme[0-26]n1 on Linux) after the guest operating system has booted.
  • Each local NVMe device is hardware encrypted using the XTS-AES-256 block cipher and a unique key. Each key is destroyed when the instance is stopped or terminated.
  • Local NVMe devices have the same lifetime as the instance they are attached to and do not persist after the instance has been stopped or terminated.

To learn more, visit Amazon EBS volumes and NVMe in the Amazon EBS User Guide.

Now available
Amazon EC2 C8id, M8id and R8id instances are available in US East (N. Virginia), US East (Ohio), and US West (Oregon) AWS Regions. R8id instances are additionally available in Europe (Frankfurt) Region. For Regional availability and a future roadmap, search the instance type in the CloudFormation resources tab of AWS Capabilities by Region.

You can purchase these instances as On-Demand Instances, Savings Plans, and Spot Instances. These instances are also available as Dedicated Instances and Dedicated Hosts. To learn more, visit the Amazon EC2 Pricing page.

Give C8id, M8id, and R8id instances a try in the Amazon EC2 console. To learn more, visit the EC2 C8i instances, M8i instances, and R8i instances page and send feedback to AWS re:Post for EC2 or through your usual AWS Support contacts.

Channy

Mastering millisecond latency and millions of events: The event-driven architecture behind the Amazon Key Suite

Post Syndicated from Ali Ufuk Yucel original https://aws.amazon.com/blogs/architecture/mastering-millisecond-latency-and-millions-of-events-the-event-driven-architecture-behind-the-amazon-key-suite/

Background

Amazon Key empowers customers to securely manage access to their homes and businesses through innovative solutions. Through a suite of consumer and business products, the Amazon Key team is transforming how customers receive deliveries and manage access to their spaces. Our In-Garage Delivery service offers a secure and convenient solution for receiving Amazon packages and groceries directly inside customers’ garages. For property managers and building owners, Amazon Key provides comprehensive access management solutions that enable safe and efficient delivery operations in apartment buildings and gated communities, enhancing both security and convenience for residents.

In this post, we explore how the Amazon Key team used Amazon EventBridge to modernize their architecture, transforming a tightly coupled monolithic system into a resilient, event-driven solution. We explore the technical challenges we faced, our implementation approach, and the architectural patterns that helped us achieve improved reliability and scalability. The post covers our solutions for managing event schemas at scale, handling multiple service integrations efficiently, and building an extensible architecture that accommodates future growth.

Opportunities

Service Coupling and System Fragility

Our legacy architecture faced significant challenges stemming from its tightly coupled design, where service interactions created a complex web of dependencies impacting system stability and scalability. Making service modifications was particularly challenging, as adding or removing services required careful consideration of numerous interdependencies. An incident highlighted this vulnerability when an issue in Service-A triggered a cascade of failures across many upstream services, with increased timeouts leading to retry attempts and ultimately resulting in service deadlocks. System fragility was further demonstrated when problems with a single device vendor, despite being responsible only for specific delivery operations, caused widespread degradation across multiple system services.

Loose Event Schemas

Our old event management infrastructure lacked explicit schema definitions and employed a loosely-typed data architecture, leading to several critical issues. Events were difficult to maintain as use cases expanded, and the absence of formal schema documentation impacted transparency and team collaboration. The design made it almost impossible to implement backward-incompatible changes, such as removing unused fields or events for performance optimization. Without a repository for schema management, team-to-team collaboration for schema modifications (adding fields, removing fields, deprecating fields, or marking fields as required) became challenging. The system also lacked organized validation logic, making it difficult for publishers to identify invalid events before they entered the system. Additionally, the loosely typed schemas lost important semantic context, such as inheritance and composition relationships between different event schemas.

Inconsistent Event Routing and Management

The event routing logic was manually managed and lacked the sophistication needed for growing use cases. The system only supported basic validation of events, primarily checking for required fields, with limited capability for extending validation rules or implementing more complex routing logic. Features that were commonly available in off-the-shelf solutions, such as parallel publishing to multiple subscribers, required significant custom development and ongoing maintenance effort. The implementation only supported a limited number of subscribers to the event pipeline, with no sustainable pathway for adding more consumers. While attempts were made to reduce coupling through SNS/SQS pairs between services, these solutions were implemented on an ad-hoc basis, lacking standardization and creating additional maintenance overhead. This approach led to redundant work and failed to abstract away common functionality, resulting in an inefficient and hard-to-maintain system.These challenges collectively highlighted the need for a more robust and flexible architectural approach that could better serve the system’s evolving needs while improving reliability, maintainability, and scalability.
Design

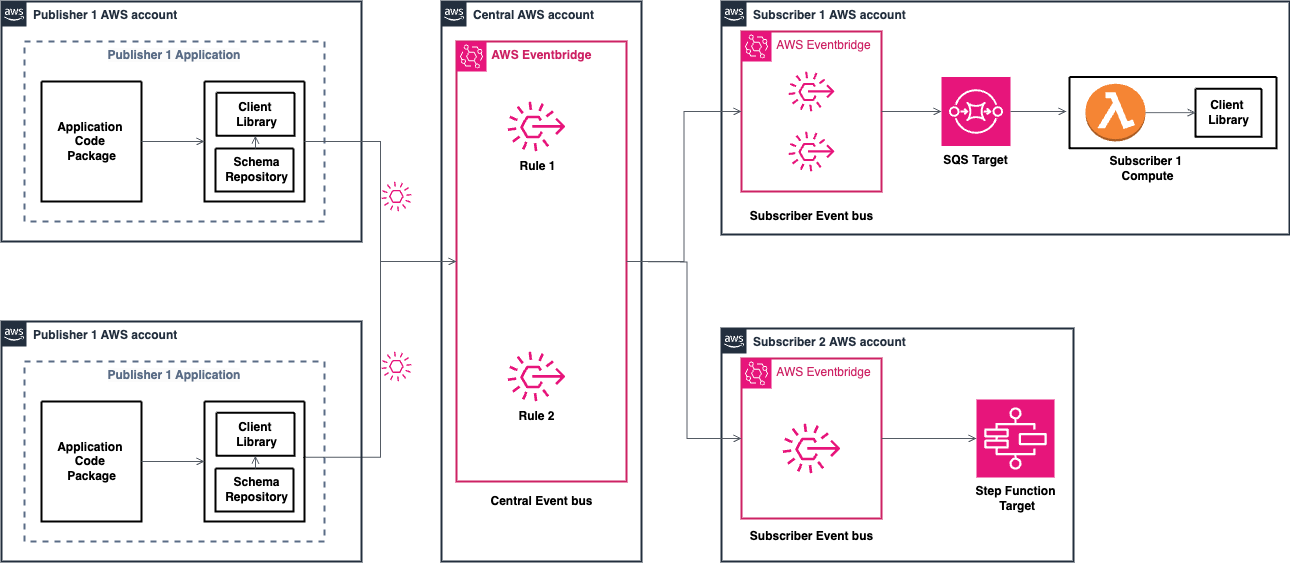
Given our requirements and the architectural challenges we faced, we implemented a single-bus, multi-account pattern to optimize our system architecture. In this design, each service team maintains complete ownership and autonomy over their application stack, enabling independent development and deployment cycles. Meanwhile, our DevOps team manages a centralized infrastructure stack that encompasses event bus rules, target configurations, and service integrations. This separation of concerns provides several key benefits:

  1. Clear ownership boundaries: Service teams can focus on their core business logic while leveraging a standardized event infrastructure.
  2. Centralized governance: The DevOps team facilitates consistent event routing patterns, security controls, and monitoring across service integrations.
  3. Simplified operations: A single event bus reduces operational complexity while maintaining logical separation through well-defined routing rules.
  4. Enhanced security: The multi-account structure provides natural isolation boundaries while still enabling controlled cross-account event flows.
  5. Streamlined compliance: Centralized management of data exchange patterns makes it easier to implement and maintain compliance requirements.

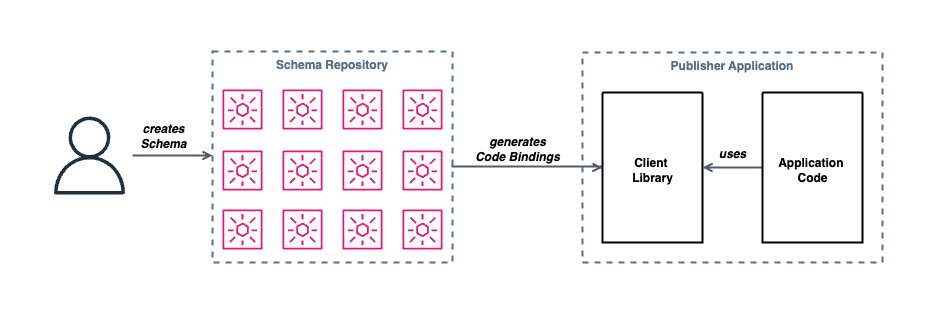
While EventBridge provided the foundation, we developed additional components to meet our specific requirements.  Our team built three key components: a schema repository serving as the single source of truth for event definitions, a client library that handles schema validation and provides developer-friendly abstractions, and an infrastructure library offering reusable components for subscriber integration.

Event Schema Repository

Amazon EventBridge’s schema discovery and documentation capabilities provide powerful solutions for managing event-driven architectures. The service automatically captures event structures in the schema registry, maintaining versions as events evolve over time. While EventBridge provides developers with tools to implement validation using external solutions or custom application code, it currently does not include native schema validation capabilities. For our organization’s large-scale event-driven architecture, schema validation was a critical requirement. We evaluated two implementation approaches: a centralized validation service or client-side validation at the publisher/subscriber level. The centralized approach would have required managing additional infrastructure, scaling considerations, and introduced latency through extra network hops. After analyzing these factors alongside our requirements for schema governance and team autonomy, we implemented a custom schema repository with client-side validation.

This architecture prioritizes developer experience through immediate validation feedback while maintaining our standards for schema versioning and release management. The repository serves as the foundation for our event-driven architecture, providing essential capabilities for data governance and quality control. By acting as the single source of truth for event definitions, it enables standardized validation across clients, enforces data quality checks, establishes clear ownership boundaries, and maintains comprehensive audit trails for schema changes. Publishers and subscribers leverage these schemas to maintain data consistency and compatibility as their services evolve. The repository has become instrumental in facilitating efficient cross-team collaboration through self-service schema discovery, documentation, and automated validation during development. It maintains a comprehensive registry of event publishers and their corresponding subscribers, providing clear visibility into event flow patterns and dependencies across the system. Teams can quickly manage schema evolution with clear deprecation policies and migration paths, while the system helps detect breaking changes early in the development cycle. This collaborative approach has significantly improved team velocity and reduced integration issues between services.

{
    "$schema": "http://json-schema.org/draft-04/schema#",
    "$id": "/resource/event/schema/EventV1.json",
    "title": "EventV1",
    "description": "Schema for a simple event.",
    "type": "object",
    "properties": {
        "id": {
            "description": "Id of the event.",
            "type": "string"
        },
        "type": {
            "description": "Type of the event.",
            "$ref": "EventType.json"
        },
        "time": {
            "description": "Time at which the event occurred. It uses ISO 8601 Date Time Format. Reference: https://www.iso.org/iso-8601-date-and-time-format.html",
            "type": "string",
            "format": "date-time"
        },
        "publisher": {
            "description": "Publisher of the event.",
            "$ref": "../core/Publisher.json"
        }
    },
    "required": [
        "id",
        "type",
        "time",
        "publisher"
    ]
}

Client Library

The client library serves as a crucial component for both publishers and subscribers, streamlining their integration with the central event bus. At its core, the library leverages our Event Schema Repository, generating code bindings at build time to provide developers with type-safe and intuitive interfaces for event creation and handling. This approach significantly enhances developer productivity by offering straightforward and convenient methods to construct events and interact with the bus, reducing the likelihood of errors and improving code readability.

A key feature of the client library is its built-in validation mechanism. By utilizing the schemas from our local repository, the library performs thorough validation of events before they are published. This proactive approach catches potential issues early in the development cycle, making sure that only well-formed events conforming to the agreed-upon schemas make it to the event bus. Once validated, the library handles the serialization process and manages the actual publishing of events to the bus, abstracting and simplifying data transformation and transport.

For subscribers, the client library offers equally valuable functionality. It seamlessly handles the deserialization of incoming events, presenting them to the subscribing services in a readily usable format. This feature saves development time and reduces the risk of parsing errors, allowing teams to focus on business logic rather than data handling intricacies. By providing these comprehensive capabilities, our client library has become an indispensable tool in our event-driven network, promoting consistency, reliability, and efficiency across our microservices architecture.

Subscriber Constructs Library

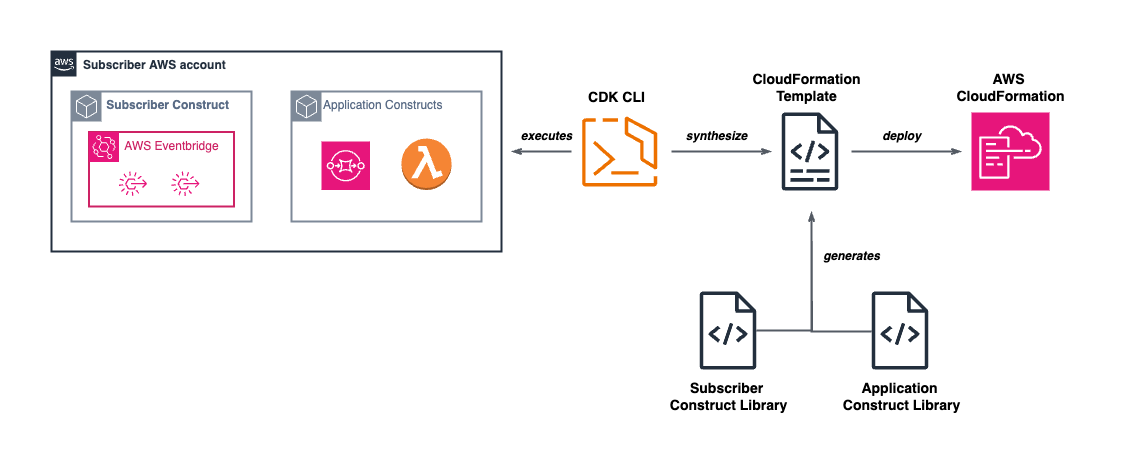
We developed a subscriber constructs library using AWS Cloud Development Kit (CDK) to simplify and standardize the integration process with our central event bus. This library abstracts the setup and management of underlying infrastructure required for event consumption, enabling teams to focus on their core business logic rather than infrastructure configuration details.

The library automates the creation of essential components required for reliable event processing. It provisions a dedicated event bus within the subscriber’s account, establishes the necessary IAM roles and permissions for secure cross-account communication with the central event bus, and configures standardized monitoring and alerting for event processing. This automation not only reduces the potential for configuration errors but also facilitates consistent implementation of our architectural patterns across different teams.

/**
 * Subscriber implementation to provision necessary AWS infrastructure.
 *
 */
const subscription = new Subscription(scope, id, {
    name: "DeliveryService", // Name of your application
    application: {
       region: Region.US_EAST_1, // Region of your Application
    },
});

Conclusion

Amazon Key team’s journey to modernize their architecture and build a resilient, event-driven solution exemplifies the powerful benefits of leveraging AWS EventBridge and adopting a well-designed event-driven architecture. By addressing the challenges of service coupling, loose event schemas, and inconsistent event routing, the team was able to transform their system into a more reliable, scalable, and maintainable resource. The key architectural patterns and components they implemented have had a significant impact on their ability to deliver innovative solutions to their customers.
Reliability and Scale:

  • Built a decoupled event system processing 2000 events/second with 99.99% success rate
  • Achieved consistent 80ms p90 latency from ingestion to target invocation across 14M subscriber calls
  • Avoided the need for new infrastructure for event exchange through standardized event routing
  • Enabled migration of existing complex interdependencies to event-driven architecture

Developer Experience:

  • Reduced service integration time for new use cases from five days to one day (80% improvement)
  • New event onboarding on the Custom Event Schema repository now takes four hours, down from 48 hours
  • Publisher/subscriber integration completed in eight hours, previously took 40 hours
  • Standardized client library addressed 90% of common integration errors

Security and Governance :

  • Single control plane manages 100% of event bus infrastructure
  • Automated security compliance checks catch 100% of unauthorized data exchange patterns
  • Real-time monitoring dashboard tracks every event flow and schema change
  • Schema repository provides complete audit trail for system modifications

The solutions developed by the Amazon Key team provide a blueprint for other organizations looking to modernize their architectures and leverage the power of event-driven design patterns. By adopting similar architectural patterns and components, such as the schema repository and client libraries, other organizations can be empowered to achieve similar benefits.

About the authors

Announcing Amazon EC2 G7e instances accelerated by NVIDIA RTX PRO 6000 Blackwell Server Edition GPUs

Post Syndicated from Channy Yun (윤석찬) original https://aws.amazon.com/blogs/aws/announcing-amazon-ec2-g7e-instances-accelerated-by-nvidia-rtx-pro-6000-blackwell-server-edition-gpus/

Today, we’re announcing the general availability of Amazon Elastic Compute Cloud (Amazon EC2) G7e instances that deliver cost-effective performance for generative AI inference workloads and the highest performance for graphics workloads.

G7e instances are accelerated by the NVIDIA RTX PRO 6000 Blackwell Server Edition GPUs and are well suited for a broad range of GPU-enabled workloads including spatial computing and scientific computing workloads. G7e instances deliver up to 2.3 times inference performance compared to G6e instances.

Improvements made compared to predecessors:

  • NVIDIA RTX PRO 6000 Blackwell GPUs — NVIDIA RTX PRO 6000 Blackwell Server Edition GPUs offer two times the GPU memory and 1.85 times the GPU memory bandwidth compared to G6e instances. By using the higher GPU memory offered by G7e instances, you can run medium-sized models of up to 70B parameters with FP8 precision on a single GPU.
  • NVIDIA GPUDirect P2P — For models that are too large to fit into the memory of a single GPU, you can split the model or computations across multiple GPUs. G7e instances reduce the latency of your multi-GPU workloads with support for NVIDIA GPUDirect P2P, which enables direct communication between GPUs over PCIe interconnect. These instances offer the lowest peer to peer latency for GPUs on the same PCIe switch. Additionally, G7e instances offer up to four times the inter-GPU bandwidth compared to L40s GPUs featured in G6e instances, boosting the performance of multi-GPU workloads. These improvements mean you can run inference for larger models across multiple GPUs offering up to 768 GB of GPU memory in a single node.
  • Networking — G7e instances offer four times the networking bandwidth compared to G6e instances, which means you can use the instance for small-scale multi-node workloads. Additionally, multi-GPU G7e instances support NVIDIA GPUDirect Remote Direct Memory Access (RDMA) with Elastic Fabric Adapter (EFA), which reduces the latency of remote GPU-to-GPU communication for multi-node workloads. These instance sizes also support NVIDIA GPUDirectStorage with Amazon FSx for Lustre, which increases throughput by up to 1.2 Tbps to the instances compared to G6e instances, which means you can quickly load your models.

EC2 G7e specifications
G7e instances feature up to 8 NVIDIA RTX PRO 6000 Blackwell Server Edition GPUs with up to 768 GB of total GPU memory (96 GB of memory per GPU) and Intel Emerald Rapids processors. They also support up to 192 vCPUs, up to 1,600 Gbps of network bandwidth, up to 2,048 GiB of system memory, and up to 15.2 TB of local NVMe SSD storage.

Here are the specs:

Instance name
 GPUs GPU memory (GB) vCPUs Memory (GiB) Storage (TB) EBS bandwidth (Gbps) Network bandwidth (Gbps)
g7e.2xlarge 1 96 8 64 1.9 x 1 Up to 5 50
g7e.4xlarge 1 96 16 128 1.9 x 1 8 50
g7e.8xlarge 1 96 32 256 1.9 x 1 16 100
g7e.12xlarge 2 192 48 512 3.8 x 1 25 400
g7e.24xlarge 4 384 96 1024 3.8 x 2 50 800
g7e.48xlarge 8 768 192 2048 3.8 x 4 100 1600

To get started with G7e instances, you can use the AWS Deep Learning AMIs (DLAMI) for your machine learning (ML) workloads. To run instances, you can use AWS Management Console, AWS Command Line Interface (AWS CLI) or AWS SDKs. For a managed experience, you can use G7e instances with Amazon Elastic Container Service (Amazon ECS), Amazon Elastic Kubernetes Service (Amazon EKS). Support for Amazon SageMaker AI is also coming soon.

Now available
Amazon EC2 G7e instances are available today in the US East (N. Virginia) and US East (Ohio) AWS Regions. For Regional availability and a future roadmap, search the instance type in the CloudFormation resources tab of AWS Capabilities by Region.

The instances can be purchased as On-Demand Instances, Savings Plan, and Spot Instances. G7e instances are also available in Dedicated Instances and Dedicated Hosts. To learn more, visit the Amazon EC2 Pricing page.

Give G7e instances a try in the Amazon EC2 console. To learn more, visit the Amazon EC2 G7e instances page and send feedback to AWS re:Post for EC2 or through your usual AWS Support contacts.

Channy

Amazon EC2 X8i instances powered by custom Intel Xeon 6 processors are generally available for memory-intensive workloads

Post Syndicated from Channy Yun (윤석찬) original https://aws.amazon.com/blogs/aws/amazon-ec2-x8i-instances-powered-by-custom-intel-xeon-6-processors-are-generally-available-for-memory-intensive-workloads/

Since a preview launch at AWS re:Invent 2025, we’re announcing the general availability of new memory-optimized Amazon Elastic Compute Cloud (Amazon EC2) X8i instances. These instances are powered by custom Intel Xeon 6 processors with a sustained all-core turbo frequency of 3.9 GHz, available only on AWS. These SAP certified instances deliver the highest performance and fastest memory bandwidth among comparable Intel processors in the cloud.

X8i instances are ideal for memory-intensive workloads including in-memory databases such as SAP HANA, traditional large-scale databases, data analytics, and electronic design automation (EDA), which require high compute performance and a large memory footprint.

These instances provide 1.5 times more memory capacity (up to 6 TB), and 3.4 times more memory bandwidth compared to previous generation X2i instances. These instances offer up to 43% higher performance compared to X2i instances, with higher gains on some of the real-world workloads. They deliver up to 50% higher SAP Application Performance Standard (SAPS) performance, up to 47% faster PostgreSQL performance, up to 88% faster Memcached performance, and up to 46% faster AI inference performance.

During the preview, customers like RISE with SAP utilized up to 6 TB of memory capacity with 50% higher compute performance compared to X2i instances. This enabled faster transaction processing and improved query response times for SAP HANA workloads. Orion reduced the number of active cores on X8i instances compared to X2idn instances while maintaining performance thresholds, cutting SQL Server licensing costs by 50%.

X8i instances
X8i instances are available in 14 sizes including three larger instance sizes (48xlarge, 64xlarge, and 96xlarge), so you can choose the right size for your application to scale up, and two bare metal sizes (metal-48xl and metal-96xl) to deploy workloads that benefit from direct access to physical resources. X8i instances feature up to 100 Gbps of network bandwidth with support for the Elastic Fabric Adapter (EFA) and up to 80 Gbps of throughput to Amazon Elastic Block Store (Amazon EBS).

Here are the specs for X8i instances:

Instance name vCPUs Memory
(GiB)
Network bandwidth (Gbps) EBS bandwidth (Gbps)
x8i.large 2 32 Up to 12.5 Up to 10
x8i.xlarge 4 64 Up to 12.5 Up to 10
x8i.2xlarge 8 128 Up to 15 Up to 10
x8i.4xlarge 16 256 Up to 15 Up to 10
x8i.8xlarge 32 512 15 10
x8i.12xlarge 48 768 22.5 15
x8i.16xlarge 64 1,024 30 20
x8i.24xlarge 96 1,536 40 30
x8i.32xlarge 128 2,048 50 40
x8i.48xlarge 192 3,072 75 60
x8i.64xlarge 256 4,096 80 70
x8i.96xlarge 384 6,144 100 80
x8i.metal-48xl 192 3,072 75 60
x8i.metal-96xl 384 6,144 100 80

X8i instances support the instance bandwidth configuration (IBC) feature like other eighth-generation instance types, offering flexibility to allocate resources between network and EBS bandwidth. You can scale network or EBS bandwidth by up to 25%, improving database performance, query processing speeds, and logging efficiency. These instances also use sixth-generation AWS Nitro cards, which offload CPU virtualization, storage, and networking functions to dedicated hardware and software, enhancing performance and security for your workloads.

Now available
Amazon EC2 X8i instances are now available in US East (N. Virginia), US East (Ohio), US West (Oregon), and Europe (Frankfurt) AWS Regions. For Regional availability and a future roadmap, search the instance type in the CloudFormation resources tab of AWS Capabilities by Region.

You can purchase these instances as On-Demand Instances, Savings Plan, and Spot Instances. To learn more, visit the Amazon EC2 Pricing page.

Give X8i instances a try in the Amazon EC2 console. To learn more, visit the Amazon EC2 X8i instances page and send feedback to AWS re:Post for EC2 or through your usual AWS Support contacts.

Channy

Build multi-step applications and AI workflows with AWS Lambda durable functions

Post Syndicated from Donnie Prakoso original https://aws.amazon.com/blogs/aws/build-multi-step-applications-and-ai-workflows-with-aws-lambda-durable-functions/

Modern applications increasingly require complex and long-running coordination between services, such as multi-step payment processing, AI agent orchestration, or approval processes awaiting human decisions. Building these traditionally required significant effort to implement state management, handle failures, and integrate multiple infrastructure services.

Starting today, you can use AWS Lambda durable functions to build reliable multi-step applications directly within the familiar AWS Lambda experience. Durable functions are regular Lambda functions with the same event handler and integrations you already know. You write sequential code in your preferred programming language, and durable functions track progress, automatically retry on failures, and suspend execution for up to one year at defined points, without paying for idle compute during waits.

AWS Lambda durable functions use a checkpoint and replay mechanism, known as durable execution, to deliver these capabilities. After enabling a function for durable execution, you add the new open source durable execution SDK to your function code. You then use SDK primitives like “steps” to add automatic checkpointing and retries to your business logic and “waits” to efficiently suspend execution without compute charges. When execution terminates unexpectedly, Lambda resumes from the last checkpoint, replaying your event handler from the beginning while skipping completed operations.

Getting started with AWS Lambda durable functions
Let me walk you through how to use durable functions.

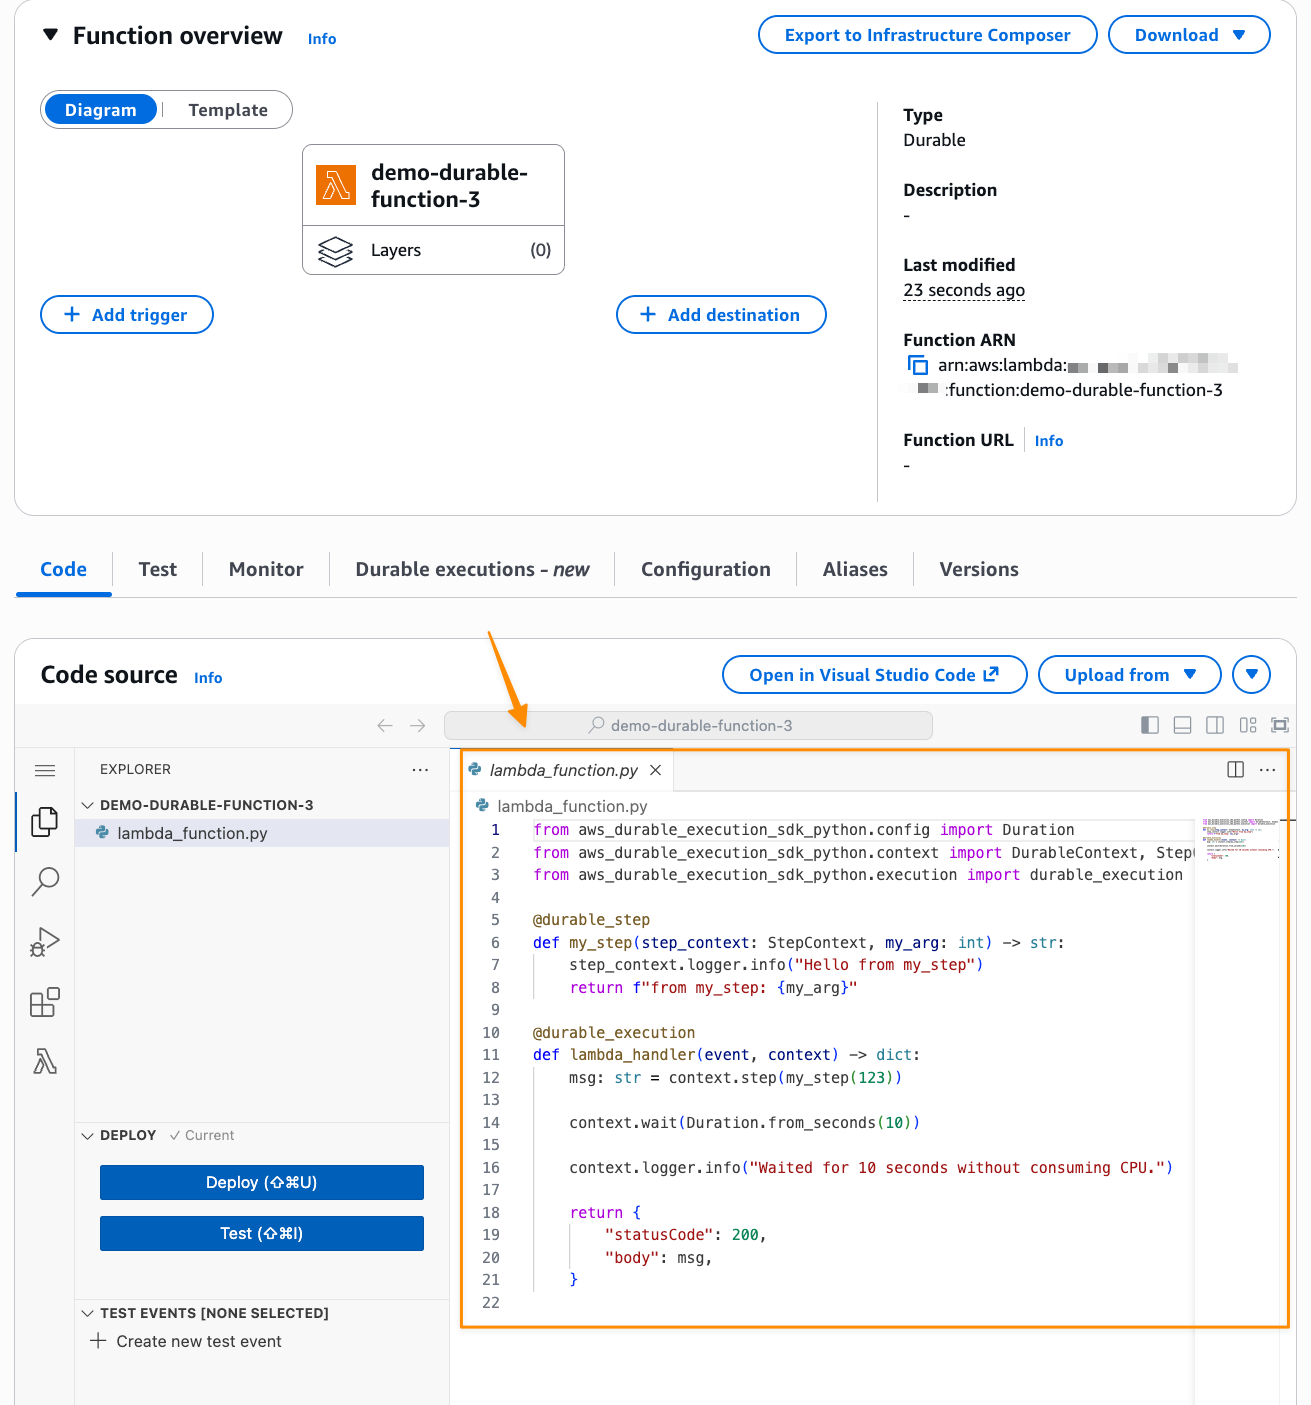
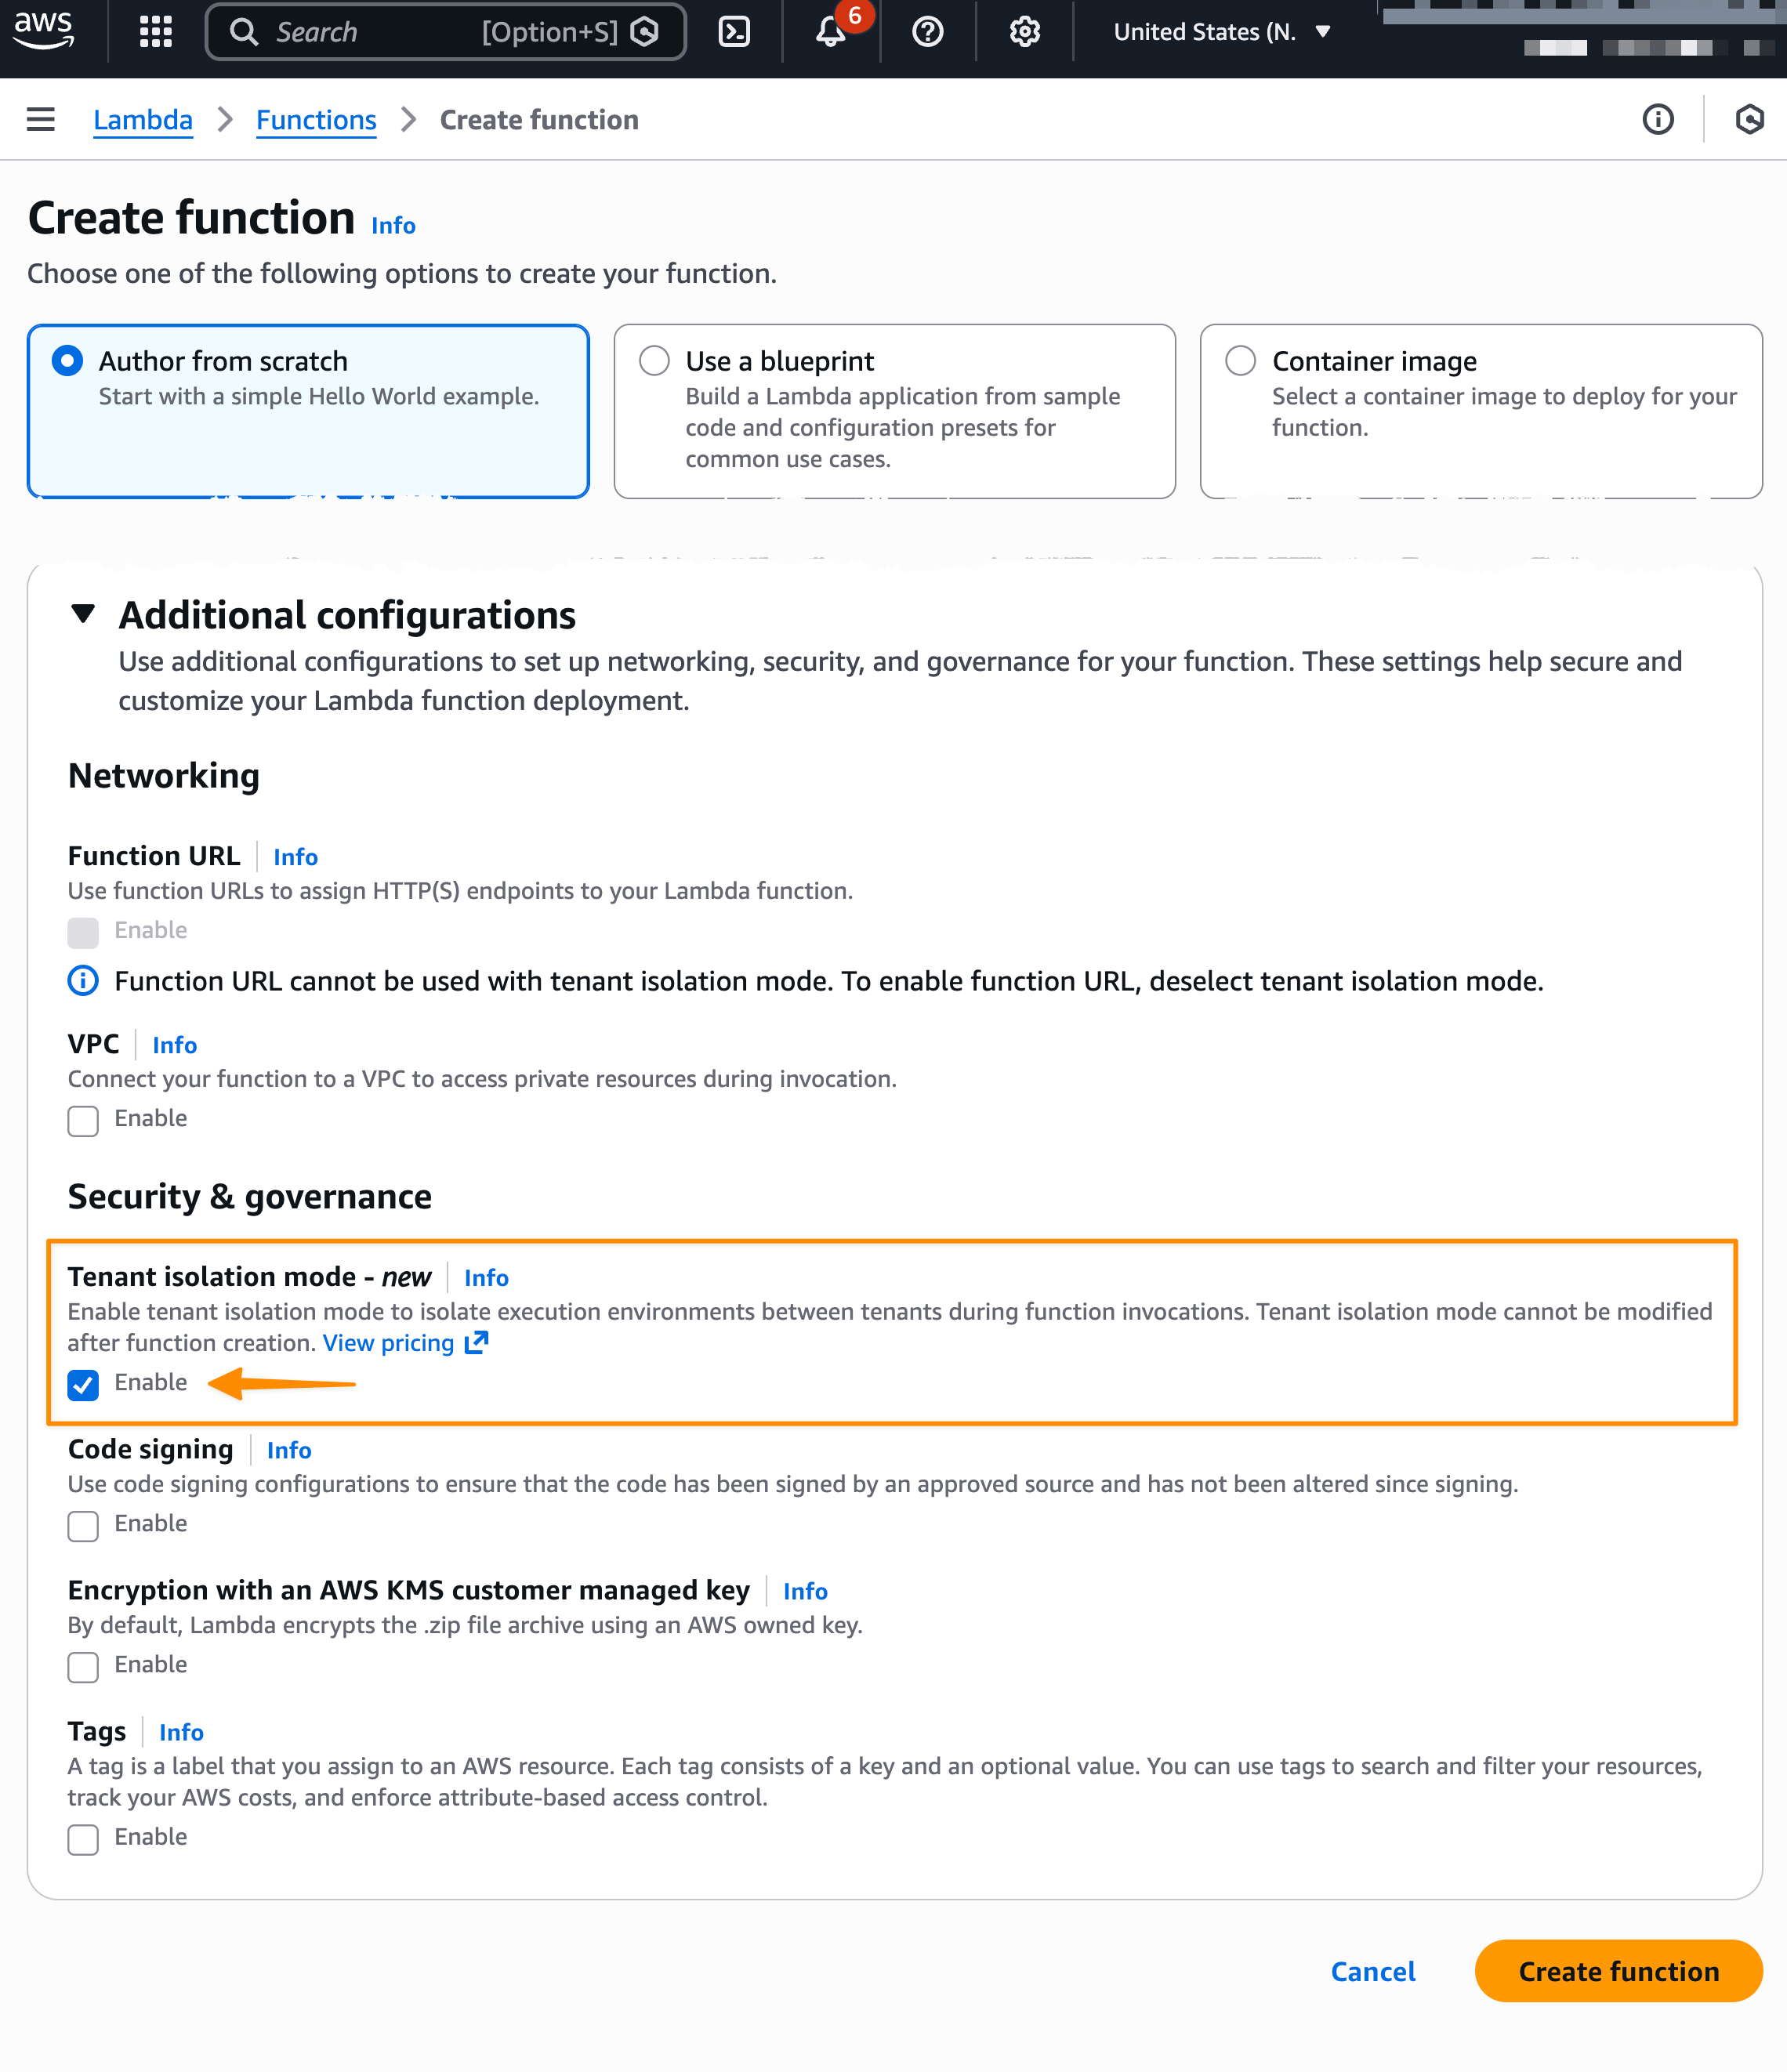
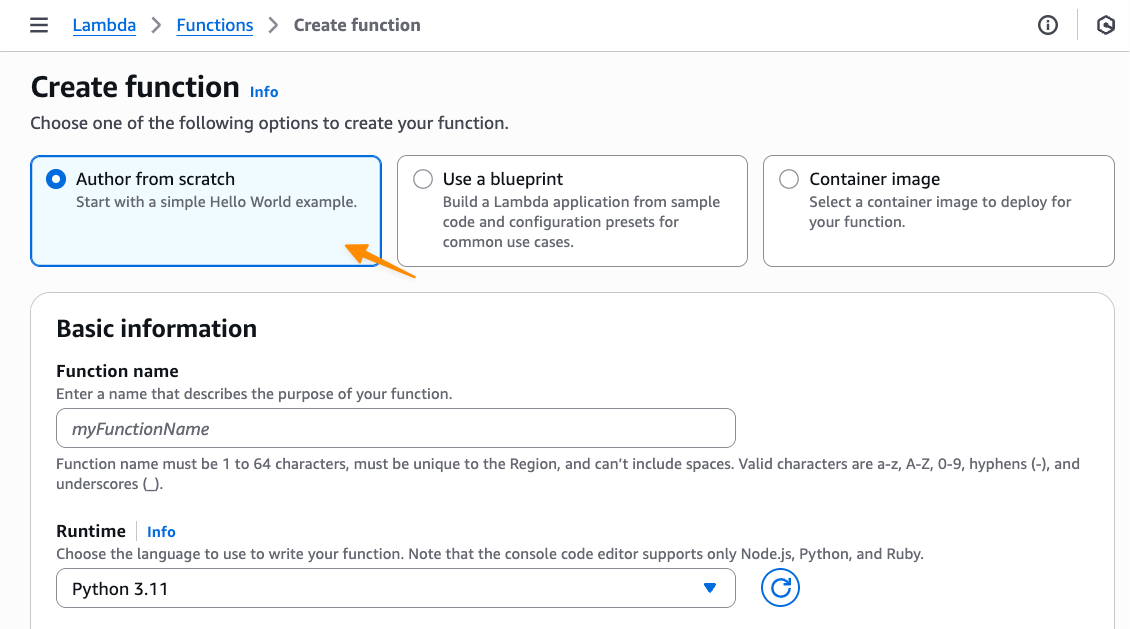
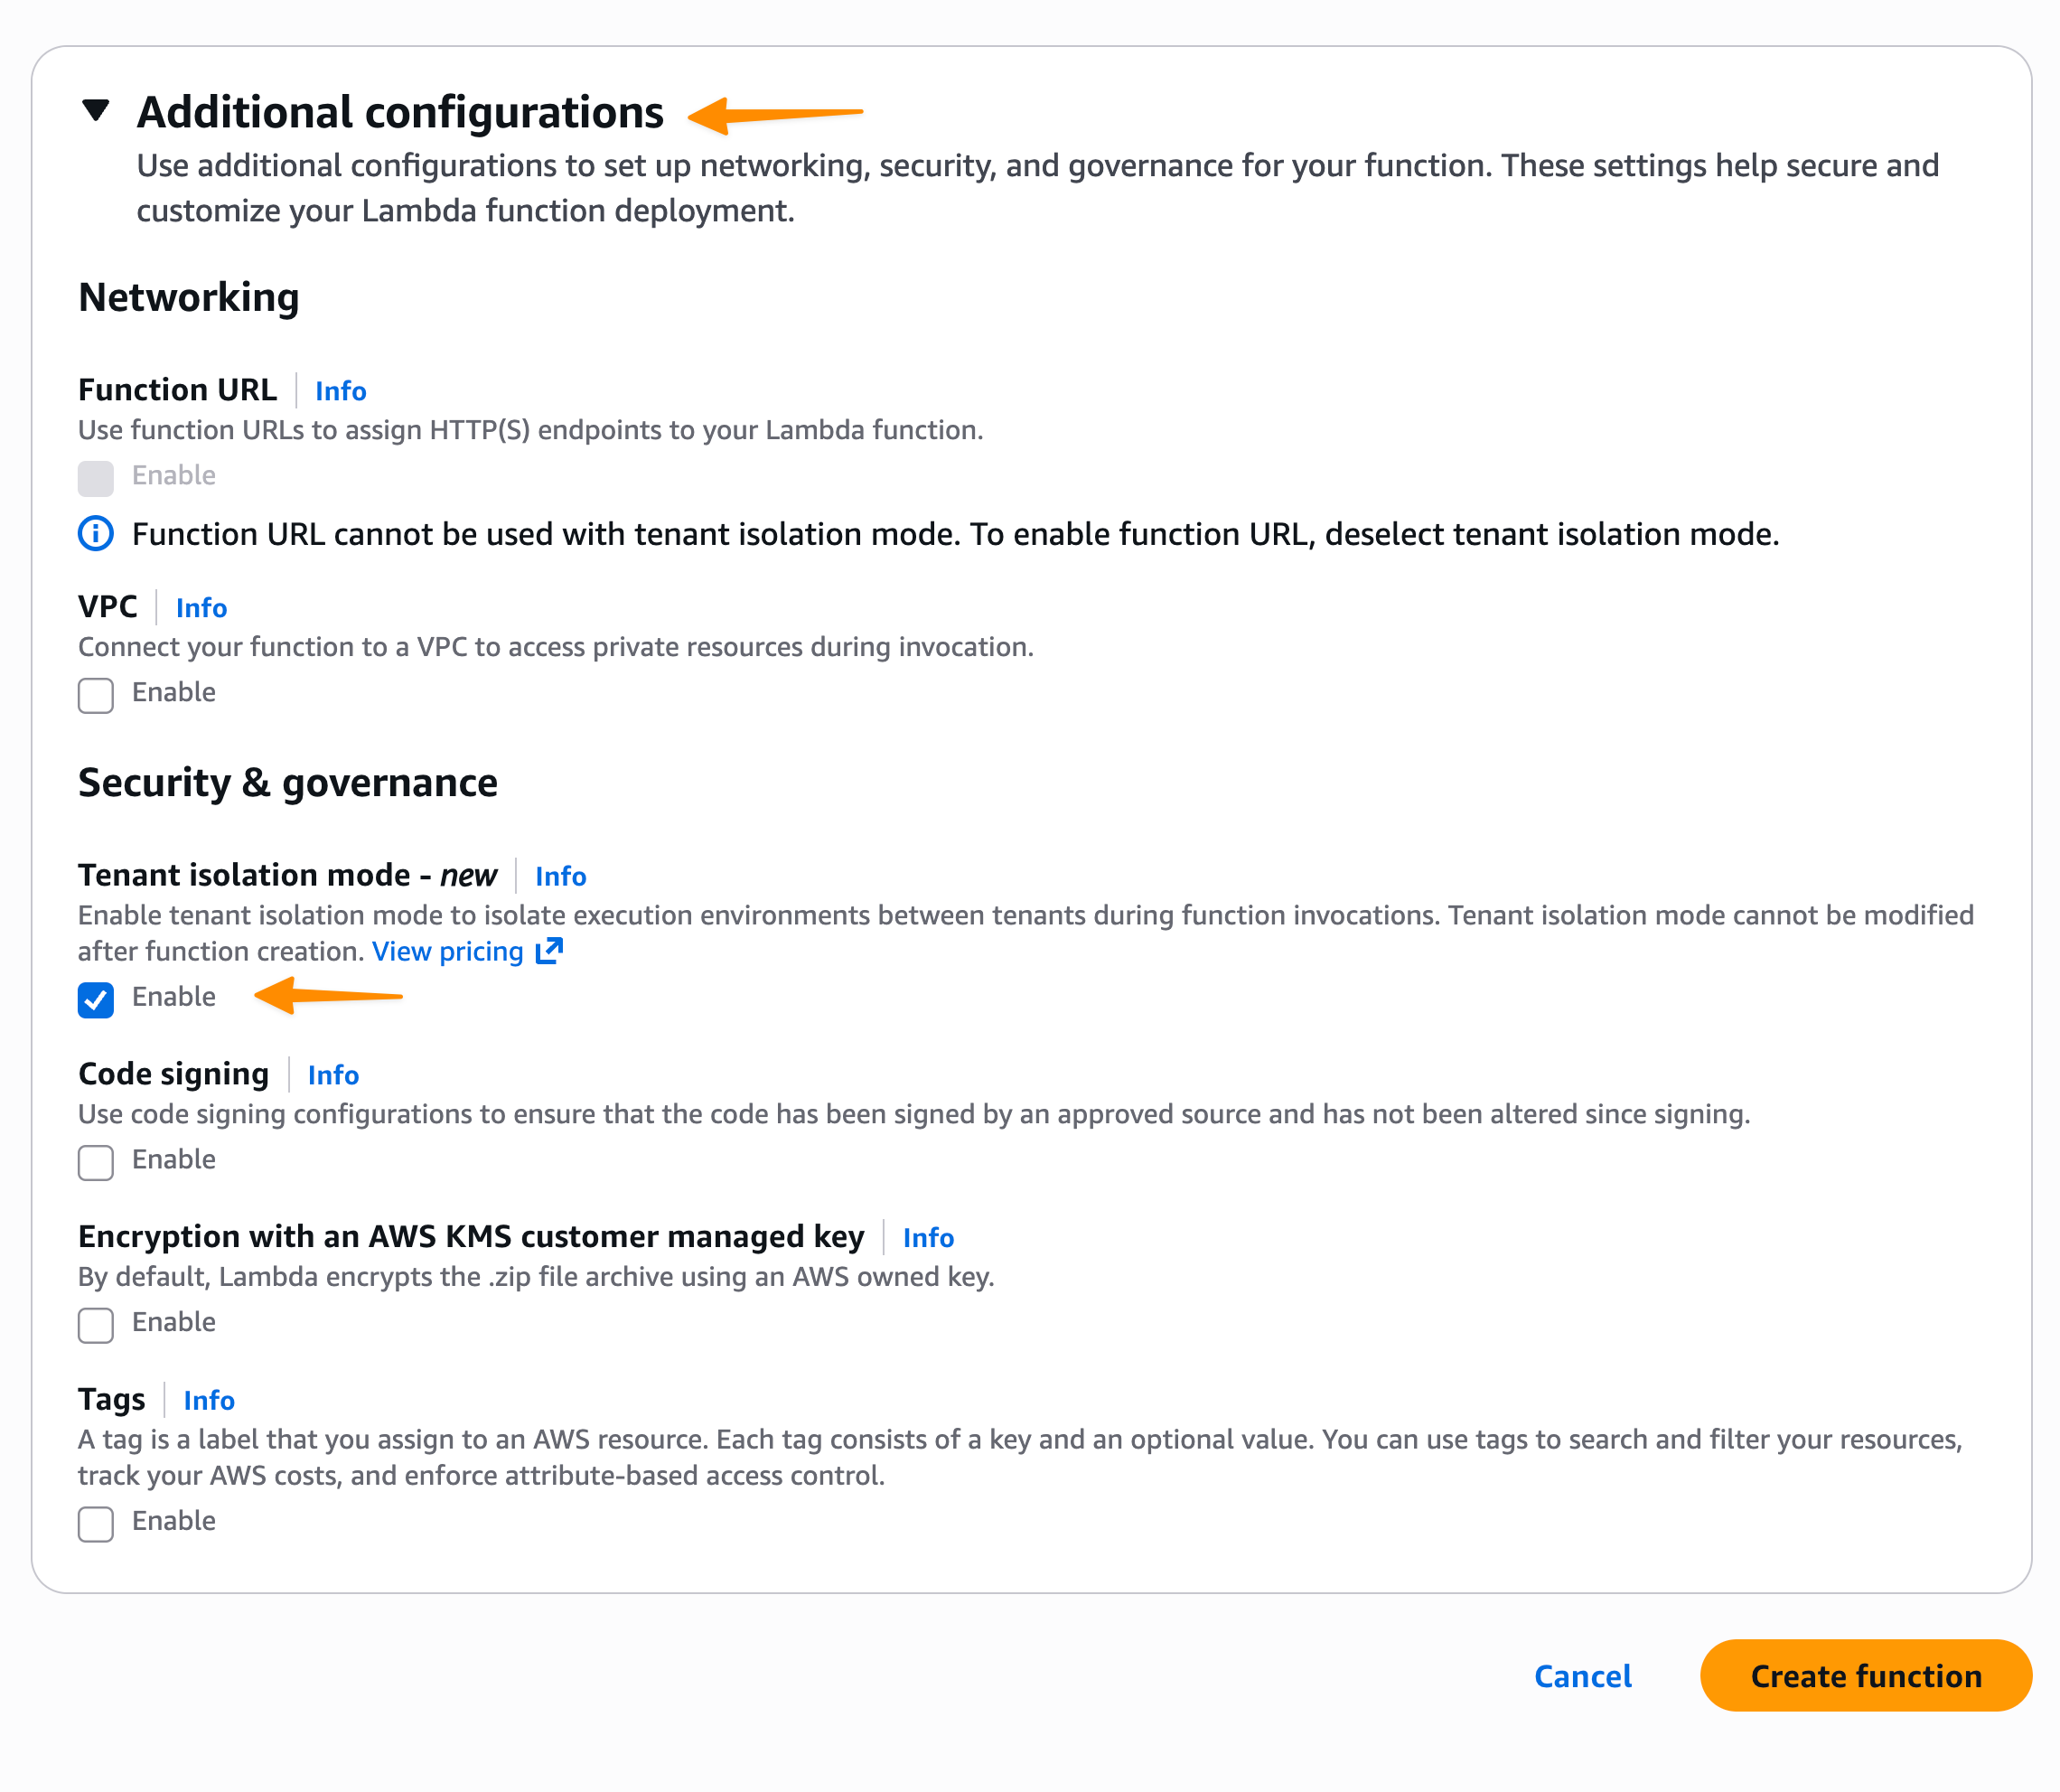
First, I create a new Lambda function in the console and select Author from scratch. In the Durable execution section, I select Enable. Note that, durable function setting can only be set during function creation and currently can’t be modified for existing Lambda functions.

After I create my Lambda durable function, I can get started with the provided code.

Lambda durable functions introduces two core primitives that handle state management and recovery:

  • Steps—The context.step() method adds automatic retries and checkpointing to your business logic. After a step is completed, it will be skipped during replay.
  • Wait—The context.wait() method pauses execution for a specified duration, terminating the function, suspending and resuming execution without compute charges.

Additionally, Lambda durable functions provides other operations for more complex patterns: create_callback() creates a callback that you can use to await results for external events like API responses or human approvals, wait_for_condition() pauses until a specific condition is met like polling a REST API for process completion, and parallel() or map() operations for advanced concurrency use cases.

Building a production-ready order processing workflow
Now let’s expand the default example to build a production-ready order processing workflow. This demonstrates how to use callbacks for external approvals, handle errors properly, and configure retry strategies. I keep the code intentionally concise to focus on these core concepts. In a full implementation, you could enhance the validation step with Amazon Bedrock to add AI-powered order analysis.

Here’s how the order processing workflow works:

  • First, validate_order() checks order data to ensure all required fields are present.
  • Next, send_for_approval() sends the order for external human approval and waits for a callback response, suspending execution without compute charges.
  • Then, process_order() completes order processing.
  • Throughout the workflow, try-catch error handling distinguishes between terminal errors that stop execution immediately and recoverable errors inside steps that trigger automatic retries.

Here’s the complete order processing workflow with step definitions and the main handler:

import random
from aws_durable_execution_sdk_python import (
    DurableContext,
    StepContext,
    durable_execution,
    durable_step,
)
from aws_durable_execution_sdk_python.config import (
    Duration,
    StepConfig,
    CallbackConfig,
)
from aws_durable_execution_sdk_python.retries import (
    RetryStrategyConfig,
    create_retry_strategy,
)


@durable_step
def validate_order(step_context: StepContext, order_id: str) -> dict:
    """Validates order data using AI."""
    step_context.logger.info(f"Validating order: {order_id}")
    # In production: calls Amazon Bedrock to validate order completeness and accuracy
    return {"order_id": order_id, "status": "validated"}


@durable_step
def send_for_approval(step_context: StepContext, callback_id: str, order_id: str) -> dict:
    """Sends order for approval using the provided callback token."""
    step_context.logger.info(f"Sending order {order_id} for approval with callback_id: {callback_id}")
    
    # In production: send callback_id to external approval system
    # The external system will call Lambda SendDurableExecutionCallbackSuccess or
    # SendDurableExecutionCallbackFailure APIs with this callback_id when approval is complete
    
    return {
        "order_id": order_id,
        "callback_id": callback_id,
        "status": "sent_for_approval"
    }


@durable_step
def process_order(step_context: StepContext, order_id: str) -> dict:
    """Processes the order with retry logic for transient failures."""
    step_context.logger.info(f"Processing order: {order_id}")
    # Simulate flaky API that sometimes fails
    if random.random() > 0.4:
        step_context.logger.info("Processing failed, will retry")
        raise Exception("Processing failed")
    return {
        "order_id": order_id,
        "status": "processed",
        "timestamp": "2025-11-27T10:00:00Z",
    }


@durable_execution
def lambda_handler(event: dict, context: DurableContext) -> dict:
    try:
        order_id = event.get("order_id")
        
        # Step 1: Validate the order
        validated = context.step(validate_order(order_id))
        if validated["status"] != "validated":
            raise Exception("Validation failed")  # Terminal error - stops execution
        context.logger.info(f"Order validated: {validated}")
        
        # Step 2: Create callback
        callback = context.create_callback(
            name="awaiting-approval",
            config=CallbackConfig(timeout=Duration.from_minutes(3))
        )
        context.logger.info(f"Created callback with id: {callback.callback_id}")
        
        # Step 3: Send for approval with the callback_id
        approval_request = context.step(send_for_approval(callback.callback_id, order_id))
        context.logger.info(f"Approval request sent: {approval_request}")
        
        # Step 4: Wait for the callback result
        # This blocks until external system calls SendDurableExecutionCallbackSuccess or SendDurableExecutionCallbackFailure
        approval_result = callback.result()
        context.logger.info(f"Approval received: {approval_result}")
        
        # Step 5: Process the order with custom retry strategy
        retry_config = RetryStrategyConfig(max_attempts=3, backoff_rate=2.0)
        processed = context.step(
            process_order(order_id),
            config=StepConfig(retry_strategy=create_retry_strategy(retry_config)),
        )
        if processed["status"] != "processed":
            raise Exception("Processing failed")  # Terminal error
        
        context.logger.info(f"Order successfully processed: {processed}")
        return processed
        
    except Exception as error:
        context.logger.error(f"Error processing order: {error}")
        raise error  # Re-raise to fail the execution

This code demonstrates several important concepts:

  • Error handling—The try-catch block handles terminal errors. When an unhandled exception is thrown outside of a step (like the validation check), it terminates the execution immediately. This is useful when there’s no point in retrying, such as invalid order data.
  • Step retries—Inside the process_order step, exceptions trigger automatic retries based on the default (step 1) or configured RetryStrategy (step 5). This handles transient failures like temporary API unavailability.
  • Logging—I use context.logger for the main handler and step_context.logger inside steps. The context logger suppresses duplicate logs during replay.

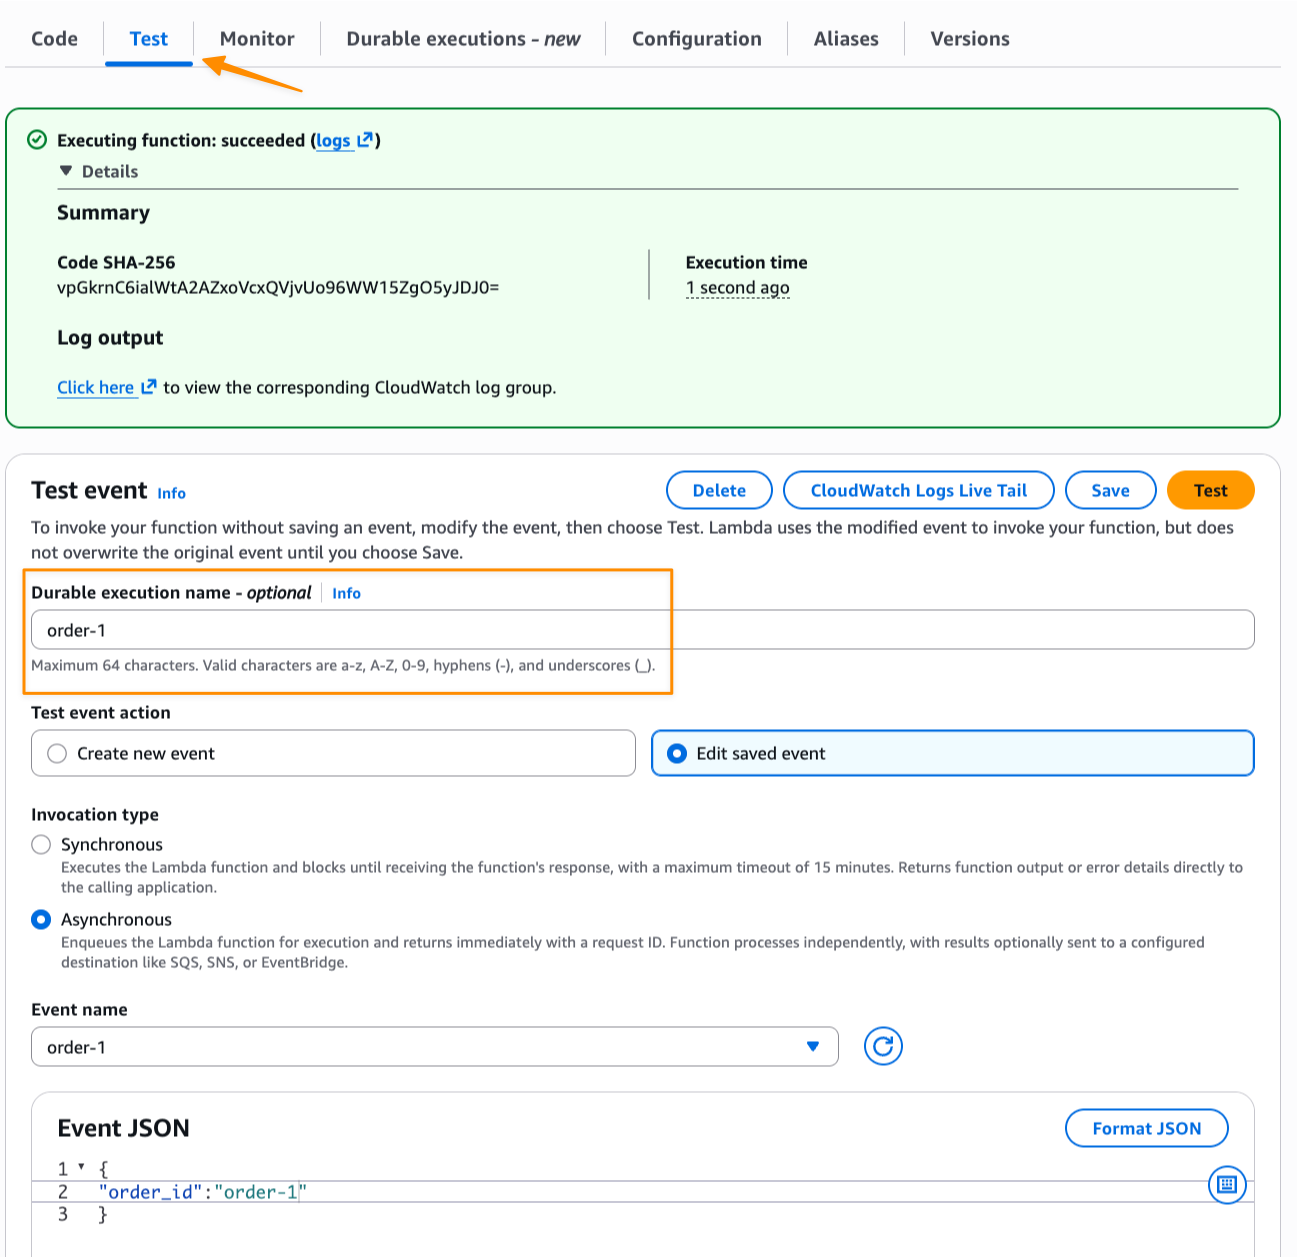
Now I create a test event with order_id and invoke the function asynchronously to start the order workflow. I navigate to the Test tab and fill in the optional Durable execution name to identify this execution. Note that, durable functions provides built-in idempotency. If I invoke the function twice with the same execution name, the second invocation returns the existing execution result instead of creating a duplicate.

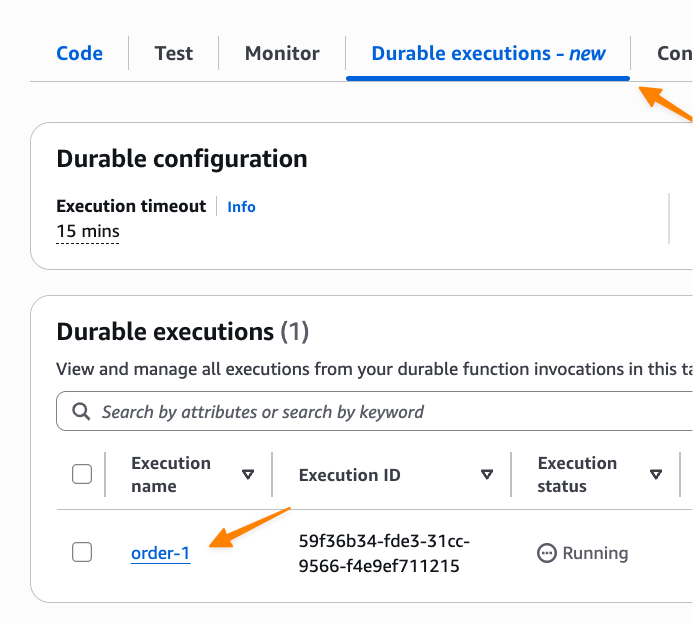
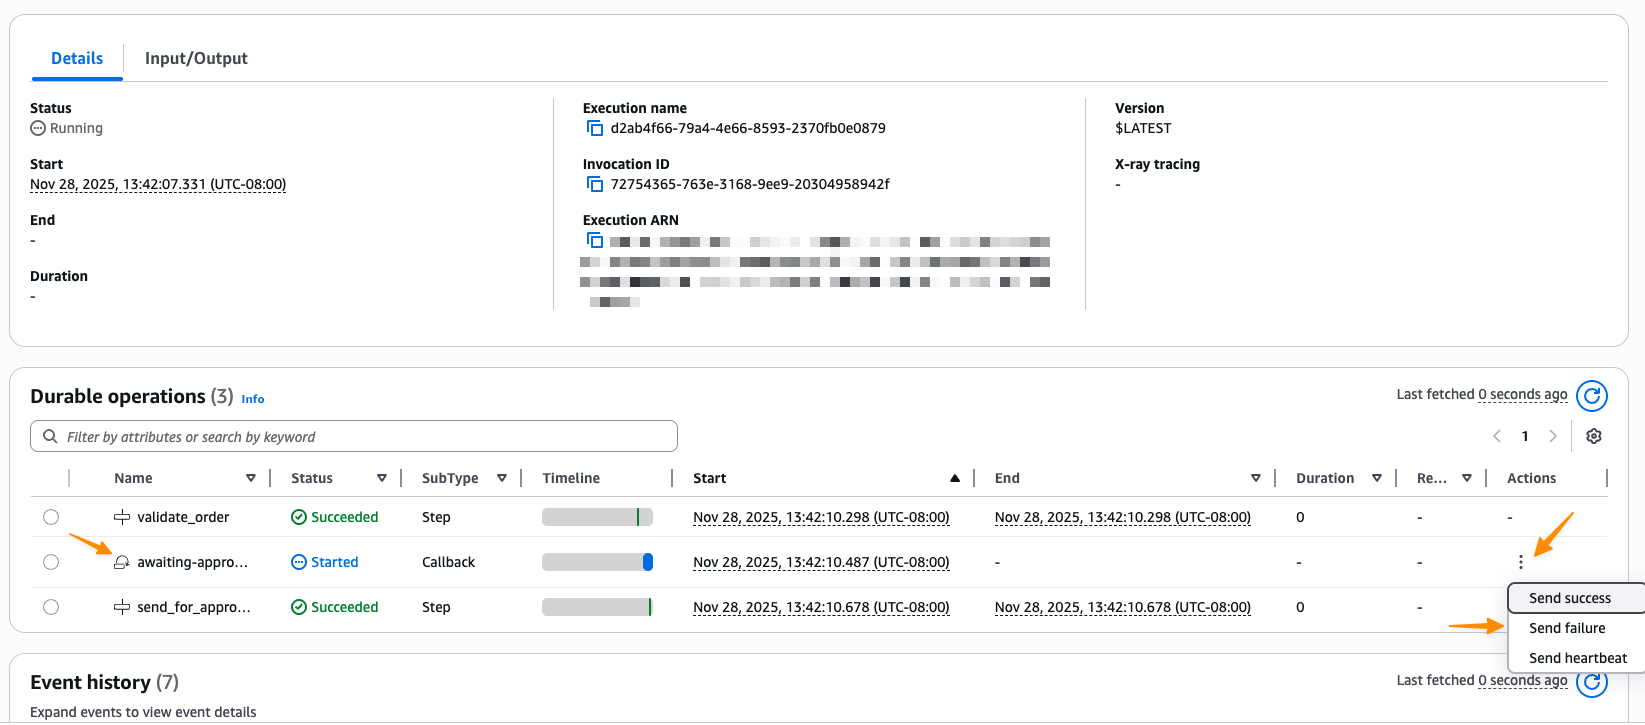
I can monitor the execution by navigating to the Durable executions tab in the Lambda console:

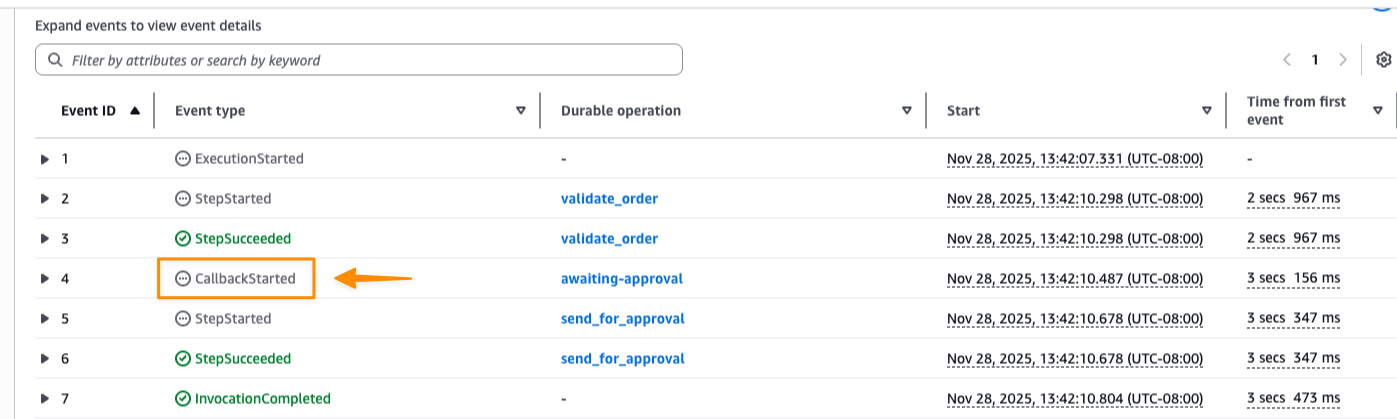
Here I can see each step’s status and timing. The execution shows CallbackStarted followed by InvocationCompleted, which indicates the function has terminated and execution is suspended to avoid idle charges while waiting for the approval callback.

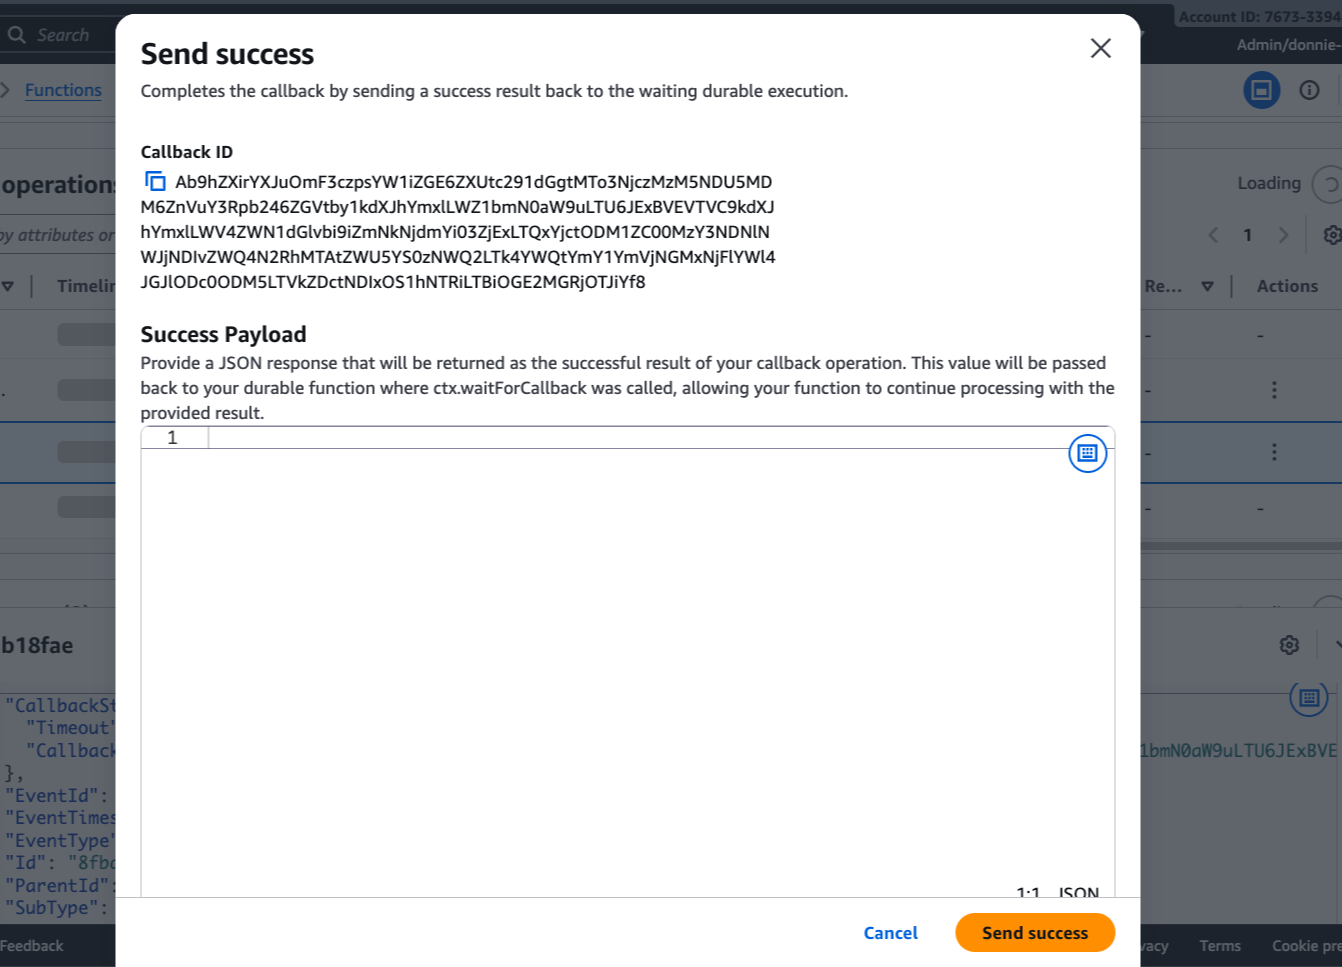
I can now complete the callback directly from the console by choosing Send success or Send failure, or programmatically using the Lambda API.

I choose Send success.

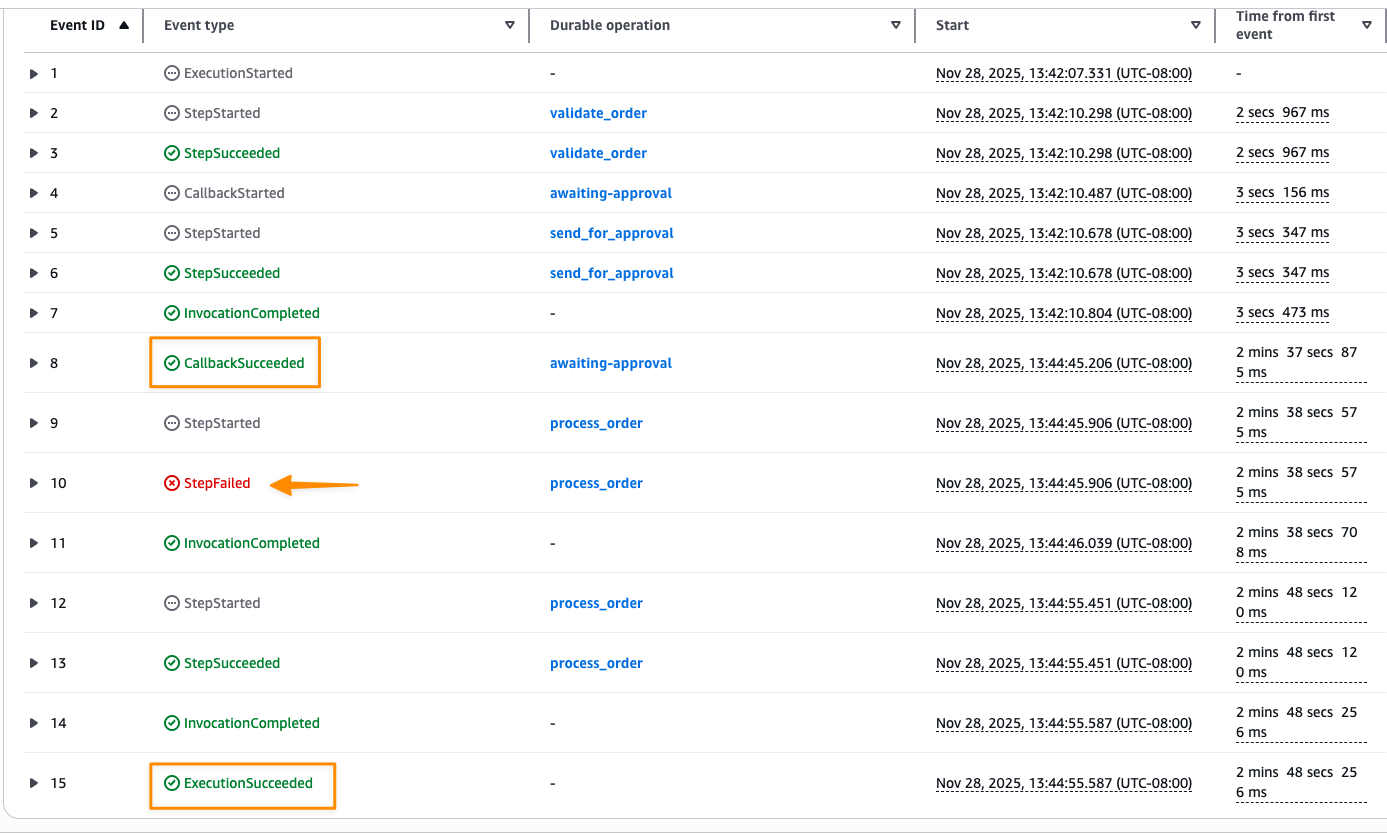
After the callback completes, the execution resumes and processes the order. If the process_order step fails due to the simulated flaky API, it automatically retries based on the configured strategy. Once all retries succeed, the execution completes successfully.

Monitoring executions with Amazon EventBridge
You can also monitor durable function executions using Amazon EventBridge. Lambda automatically sends execution status change events to the default event bus, allowing you to build downstream workflows, send notifications, or integrate with other AWS services.

To receive these events, create an EventBridge rule on the default event bus with this pattern:

{
  "source": ["aws.lambda"],
  "detail-type": ["Durable Execution Status Change"]
}

Things to know
Here are key points to note:

  • Availability—Lambda durable functions are now available in US East (Ohio) AWS Region. For the latest Region availability, visit the AWS Capabilities by Region page.
  • Programming language support—At launch, AWS Lambda durable functions supports JavaScript/TypeScript (Node.js 22/24) and Python (3.13/3.14). We recommend bundling the durable execution SDK with your function code using your preferred package manager. The SDKs are fast-moving, so you can easily update dependencies as new features become available.
  • Using Lambda versions—When deploying durable functions to production, use Lambda versions to ensure replay always happens on the same code version. If you update your function code while an execution is suspended, replay will use the version that started the execution, preventing inconsistencies from code changes during long-running workflows.
  • Testing your durable functions—You can test durable functions locally without AWS credentials using the separate testing SDK with pytest integration and the AWS Serverless Application Model (AWS SAM) command line interface (CLI) for more complex integration testing.
  • Open source SDKs—The durable execution SDKs are open source for JavaScript/TypeScript and Python. You can review the source code, contribute improvements, and stay updated with the latest features.
  • Pricing—To learn more on AWS Lambda durable functions pricing, refer to the AWS Lambda pricing page.

Get started with AWS Lambda durable functions by visiting the AWS Lambda console. To learn more, refer to AWS Lambda durable functions documentation page.

Happy building!

Donnie

Introducing Amazon EC2 X8aedz instances powered by 5th Gen AMD EPYC processors for memory-intensive workloads

Post Syndicated from Channy Yun (윤석찬) original https://aws.amazon.com/blogs/aws/introducing-amazon-ec2-x8aedz-instances-powered-by-5th-gen-amd-epyc-processors-for-memory-intensive-workloads/

Today, we’re announcing the availability of new memory-optimized, high-frequency Amazon Elastic Compute Cloud (Amazon EC2) X8aedz instances powered by a 5th Gen AMD EPYC processor. These instances offer the highest CPU frequency, 5GHz in the cloud. They deliver up to two times higher compute performance and 31% price-performance compared to previous generation X2iezn instances.

X8aedz instances are ideal for electronic design automation (EDA) workloads, such as physical layout and physical verification jobs, and relational databases that benefit from high single-threaded processor performance and a large memory footprint. The combination of 5 GHz processors and local NVMe storage enables faster processing of memory-intensive backend EDA workloads such as floor planning, logic placement, clock tree synthesis (CTS), routing, and power/signal integrity analysis. The high memory-to-vCPU ratio of 32:1 makes these instances particularly effective for applications with vCPU-based licensing models.

Let me explain the instance type naming: The “a” suffix indicates an AMD processor, “e” denotes extended memory in the memory-optimized instance family, “d” represents local NVMe-based SSDs physically connected to the host server, and “z” indicates high-frequency processors.

X8aedz instances
X8aedz instances are available in eight sizes ranging from 2–96 vCPUs with 64–3,072 GiB of memory, including two bare metal sizes. X8aedz instances feature up to 75 Gbps of network bandwidth with support for the Elastic Fabric Adapter (EFA), up to 60 Gbps of throughput to the Amazon Elastic Block Store (Amazon EBS), and up to 8 TB of local NVMe SSD storage.

Here are the specs for X8aedz instances:

Instance name vCPUs Memory
(GiB)
NVMe SSD storage (GB) Network bandwidth (Gbps) EBS bandwidth (Gbps)
x8aedz.large 2 64 158 Up to 18.75 Up to 15
x8aedz.xlarge 4 128 316 Up to 18.75 Up to 15
x8aedz.3xlarge 12 384 950 Up to 18.75 Up to 15
x8aedz.6xlarge 24 768 1,900 18.75 15
x8aedz.12xlarge 48 1,536 3,800 37.5 30
x8aedz.24xlarge 96 3,072 7,600 75 60
x8aedz.metal-12xl 48 1,536 3,800 37.5 30
x8aedz.metal-24xl 96 3,072 7,600 75 60

With the 60 Gbps Amazon EBS bandwidth and up to 8 TB of local NVMe SSD storage, you can achieve faster database response times and reduced latency for EDA operations, ultimately accelerating time-to-market for chip designs. These instances also support the instance bandwidth configuration feature that offers flexibility in allocating resources between network and EBS bandwidth. You can scale network or EBS bandwidth by 25% and improve database (read and write) performance, query processing, and logging speeds.

X8aedz instances use sixth-generation AWS Nitro cards, which offload CPU virtualization, storage, and networking functions to dedicated hardware and software, enhancing performance and security for your workloads.

Now available
Amazon EC2 X8aedz instances are now available in US West (Oregon) and Asia Pacific (Tokyo) AWS Regions, and additional Regions will be coming soon. For Regional availability and future roadmap, search the instance type in the AWS CloudFormation resources tab of the AWS Capabilities by Region.

You can purchase these instances as On-Demand, Savings Plan, Spot Instances, and Dedicated Instances. To learn more, visit the Amazon EC2 Pricing page.

Give X8aedz instances a try in the Amazon EC2 console. To learn more, visit the Amazon EC2 X8aedz instances page and send feedback to AWS re:Post for EC2 or through your usual AWS Support contacts.

Channy

Amazon FSx for NetApp ONTAP now integrates with Amazon S3 for seamless data access

Post Syndicated from Veliswa Boya original https://aws.amazon.com/blogs/aws/amazon-fsx-for-netapp-ontap-now-integrates-with-amazon-s3-for-seamless-data-access/

Today, we’re announcing the ability to access your data in Amazon FSx for NetApp ONTAP file systems using Amazon Simple Storage Service (Amazon S3). With this capability, you can use your enterprise file data to augment generative AI applications with Amazon Bedrock Knowledge Bases for Retrieval Augmented Generation (RAG), train machine learning (ML) models with Amazon SageMaker, generate insights with Amazon S3 integrated third-party services, use comprehensive research capabilities in AI-powered business intelligence (BI) tools such as Amazon Quick Suite, and run analyses using Amazon S3 based cloud-native applications, all while your file data continues to reside in your FSx for NetApp ONTAP file system.

Amazon FSx for NetApp ONTAP is the first and fully AWS managed NetApp ONTAP file system in the cloud to migrate on-premises applications that rely on NetApp ONTAP or other network-attached storage (NAS) appliances to AWS without having to change how you manage your data. FSx for NetApp ONTAP provides the popular capabilities, high performance, and data management APIs of ONTAP file systems with the added benefits of the AWS Cloud, such as simplified management, on-demand scaling, and seamless integration with other AWS services.

Over the years, AWS has developed a broad range of industry-leading AI, ML, and analytics services and applications that work with data in Amazon S3 that organizations use to innovate faster, discover new insights, and make even better data-driven decisions. However, some organizations want to use these services with their enterprise file data stored in NetApp ONTAP or other NAS appliances.

How to get started
You can create and attach an S3 Access Point to your FSx for ONTAP file system using the Amazon FSx console, the AWS Command Line Interface (AWS CLI), or the AWS SDK.

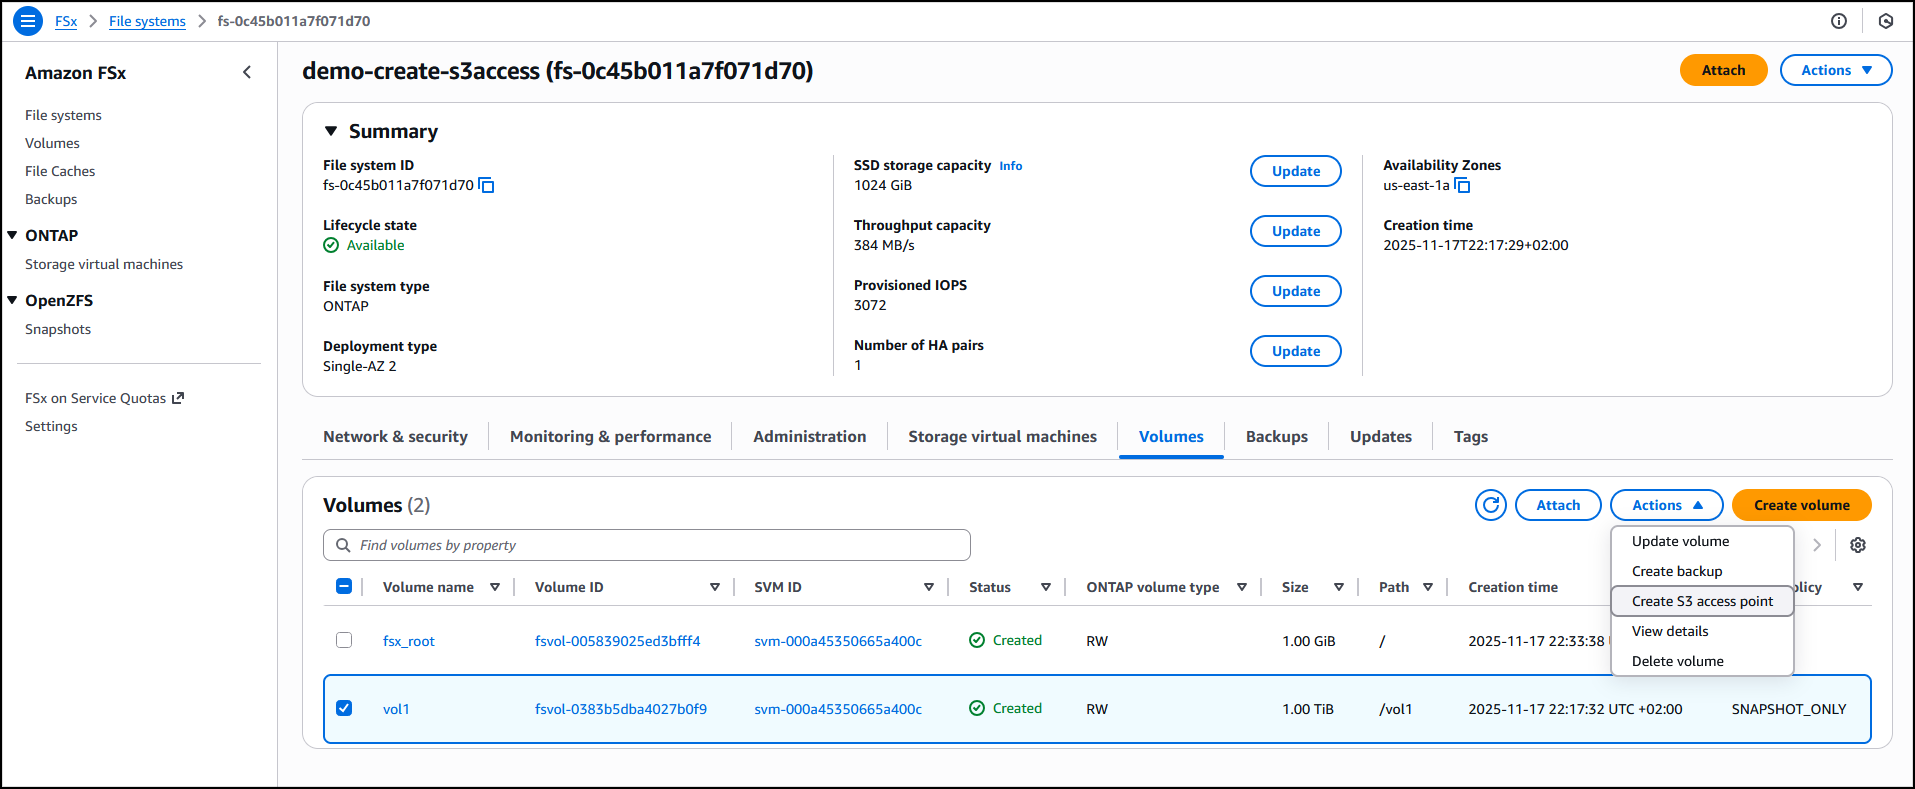
I have an existing FSx for ONTAP file system demo-create-s3access which I created by following the steps in the Creating file systems in the FSx for ONTAP documentation. Using the Amazon FSx console I now choose the file system ID fs-0c45b011a7f071d70 to access the full details of the file system.

I’ll attach the access point to the volume of the file system. I choose the volume vol1 and then select Create S3 Access Point from the Actions dropdown menu.


I enter details such as the access point name, the type of file system user identity and the network configuration, then choose Create s3 Access Point to finalize the process.


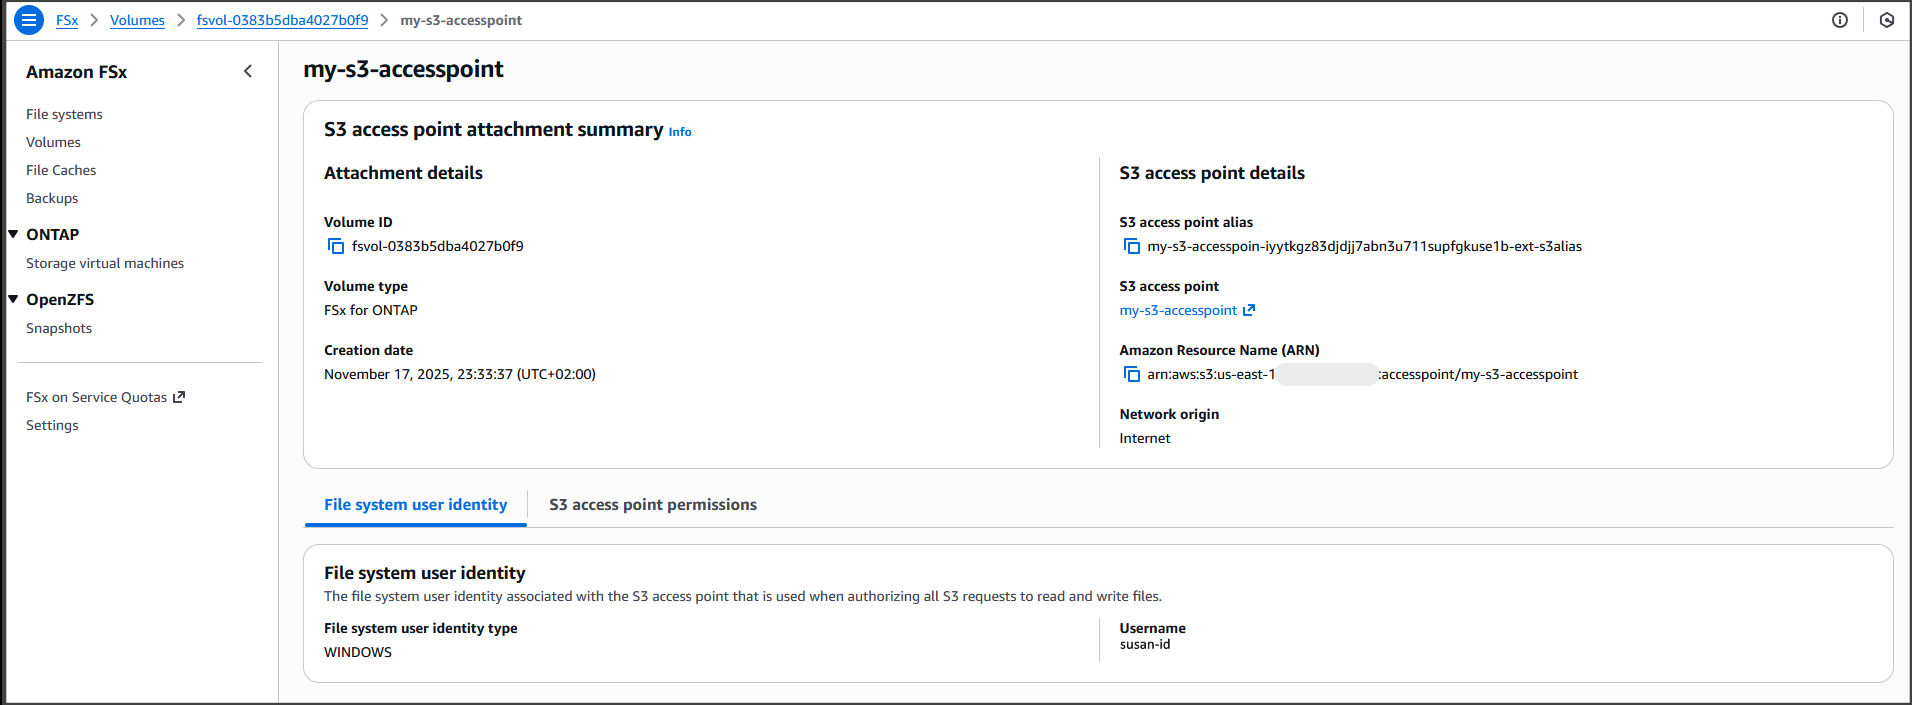
After it’s created, the access point my-s3-accesspoint is ready to allow access to the file data stored in my file system demo-create-s3access from Amazon S3. Amazon Access Points are S3 endpoints that can be attached to Amazon FSx volumes and used to perform Amazon S3 object operations.


I can now bring proprietary data stored in the file system demo-create-s3access to Amazon S3 for use in applications that work with Amazon S3 while my file data continues to reside in the FSx for NetApp ONTAP file system using the access point my-s3-accesspoint (this data remains accessible through the file protocols).

For the walkthrough in this post, I’ll integrate with Quick Suite.

Integrating decades of enterprise file data with the latest AI powered BI tools on AWS
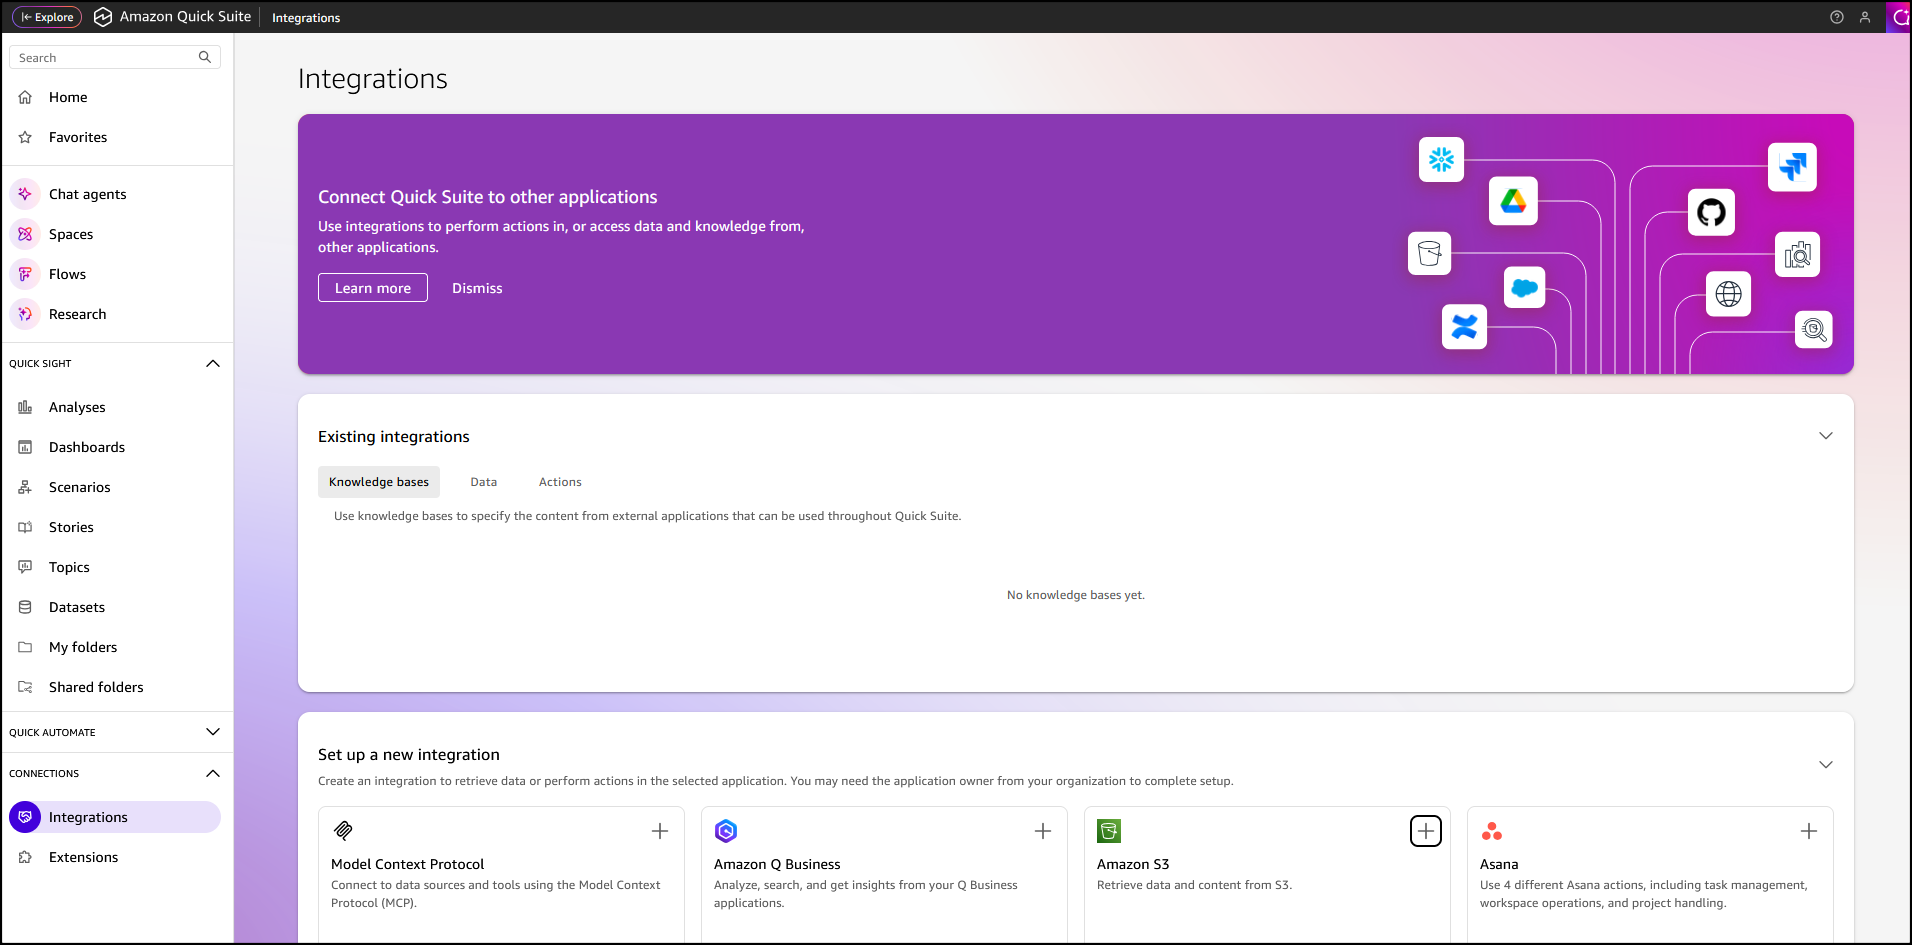
In the Quick Suite Console, in the left navigation pane, I choose Connections, then select Integrations. Before you begin, make sure that you have the correct permissions to the Amazon S3 AWS resource. You can control the AWS resources that Quick Suite can access by following the Amazon Quick Suite user guide.


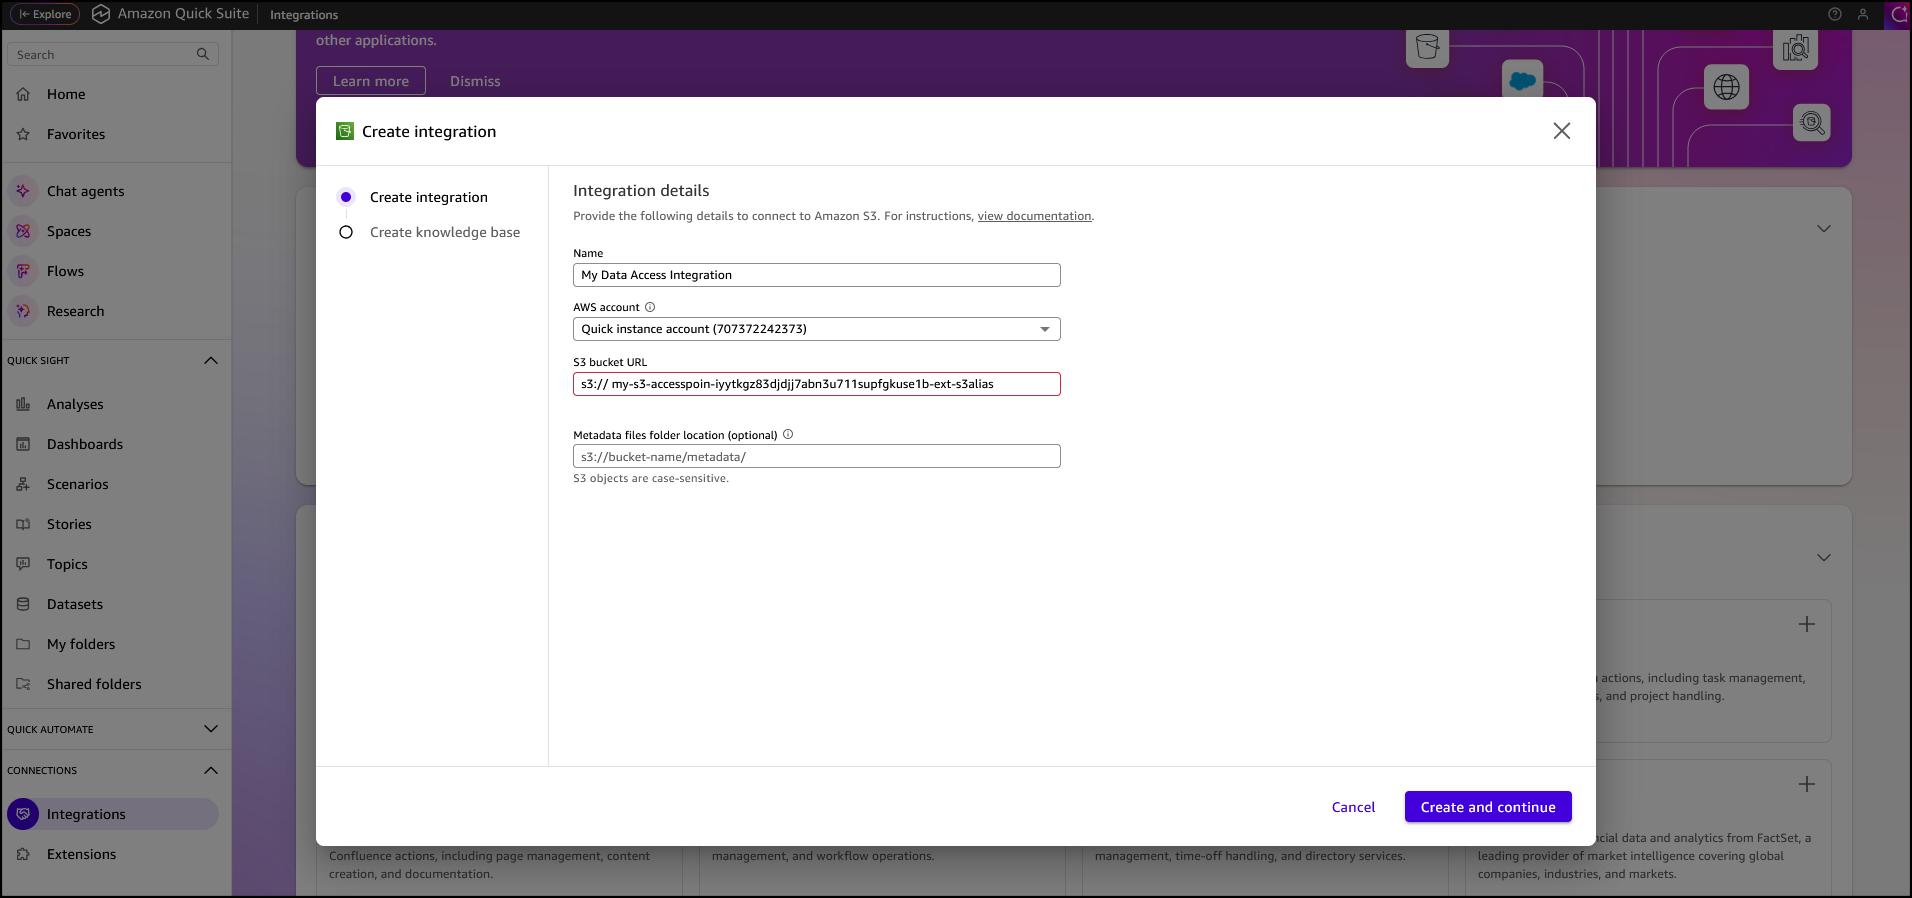
After I’ve selected the Amazon S3 integration I enter my Amazon S3 Access Point alias as the S3 bucket URL, leave the rest of the information as default, then choose Create and continue.


I finalize the process by providing the Name of the knowledge base, the Description, then choose Create.


After the knowledge base has been created it’s automatically synchronized, it’s now available for interaction.


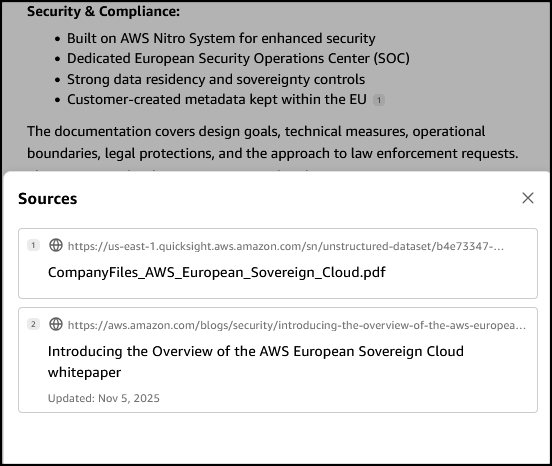
I want to learn more about the AWS European Sovereign Cloud so I’ve updated the file system (accessed through the S3 Access Point my-s3-accesspoin-iyytkgz83djdjj7abn3u711supfgkuse1b-ext-s3alias) with the AWS whitepaper on this topic. In the chat in Amazon Quick Suite. I start asking the first question “do we have any documentation on the europe sovereignty cloud?“. To answer my question, the chat agent accesses and analyzes various types of data sources I have permission to use, including uploaded files in my current conversation, spaces I have access to, knowledge bases from my integrations, and more.

When I verify the source, I see that the document I uploaded to my file system is listed as one of the sources.

Other use cases of Amazon S3 Access Points for Amazon FSx for NetApp ONTAP
Earlier, we looked at use cases such as connecting an organization’s proprietary file data to Amazon Quick Suite for advanced business intelligence. Additionally, Amazon S3 Access Points for Amazon FSx for NetApp ONTAP can be used to seamlessly integrate enterprise file data with comprehensive analytics services, such as Amazon Athena for serverless SQL queries or AWS Glue for ETL processing, to name a few.

Amazon S3 Access Points for Amazon FSx for NetApp ONTAP are also suitable for data access from serverless compute workloads that are cloud-native with containerized microservices that require flexible access to shared enterprise datasets, such as configuration files, reference data, content libraries, model artifacts, and application assets.

Now available
You can get started today using the Amazon FSx console, AWS CLI, or AWS SDK to attach Amazon S3 Access Points to your Amazon FSx for NetApp ONTAP file systems. The feature is available in the following AWS Regions: Africa (Cape Town), Asia Pacific (Hong Kong, Hyderabad, Jakarta, Melbourne, Mumbai, Osaka, Seoul, Singapore, Sydney, Tokyo), Canada (Central, Calgary), Europe (Frankfurt, Ireland, London, Milan, Paris, Spain, Stockholm, Zurich), Israel (Tel Aviv), Middle East (Bahrain, UAE), South America (Sao Paulo), US East (N. Virginia, Ohio), and US West (N. California Oregon). You’re billed by Amazon S3 for the requests and data transfer costs through your S3 Access Point, in addition to your standard Amazon FSx charges. Learn more on the Amazon FSx for NetApp ONTAP pricing page.

PS: Writing a blog post at AWS is always a team effort, even when you see only one name under the post title. In this case, I want to thank Luke Miller, for his expertise and generous help with technical guidance, which made this overview possible and comprehensive.

Veliswa Boya.

Introducing AWS Lambda Managed Instances: Serverless simplicity with EC2 flexibility

Post Syndicated from Micah Walter original https://aws.amazon.com/blogs/aws/introducing-aws-lambda-managed-instances-serverless-simplicity-with-ec2-flexibility/

Today, we’re announcing AWS Lambda Managed Instances, a new capability you can use to run AWS Lambda functions on your Amazon Elastic Compute Cloud (Amazon EC2) compute while maintaining serverless operational simplicity. This enhancement addresses a key customer need: accessing specialized compute options and optimizing costs for steady-state workloads without sacrificing the serverless development experience you know and love.

Although Lambda eliminates infrastructure management, some workloads require specialized hardware, such as specific CPU architectures, or cost optimizations from Amazon EC2 purchasing commitments. This tension forces many teams to manage infrastructure themselves, sacrificing the serverless benefits of Lambda only to access the compute options or pricing models they need. This often leads to a significant architectural shift and greater operational responsibility.

Lambda Managed Instances
You can use Lambda Managed Instances to define how your Lambda functions run on EC2 instances. Amazon Web Services (AWS) handles setting up and managing these instances in your account. You get access to the latest generation of Amazon EC2 instances, and AWS handles all the operational complexity—instance lifecycle management, OS patching, load balancing, and auto scaling. This means you can select compute profiles optimized for your specific workload requirements, like high-bandwidth networking for data-intensive applications, without taking on the operational burden of managing Amazon EC2 infrastructure.

Each execution environment can process multiple requests rather than handling just one request at a time. This can significantly reduce compute consumption, because your code can efficiently share resources across concurrent requests instead of spinning up separate execution environments for each invocation. Lambda Managed Instances provides access to Amazon EC2 commitment-based pricing models such as Compute Savings Plans and Reserved Instances, which can provide up to a 72% discount over Amazon EC2 On-Demand pricing. This offers significant cost savings for steady-state workloads while maintaining the familiar Lambda programming model.

Let’s try it out
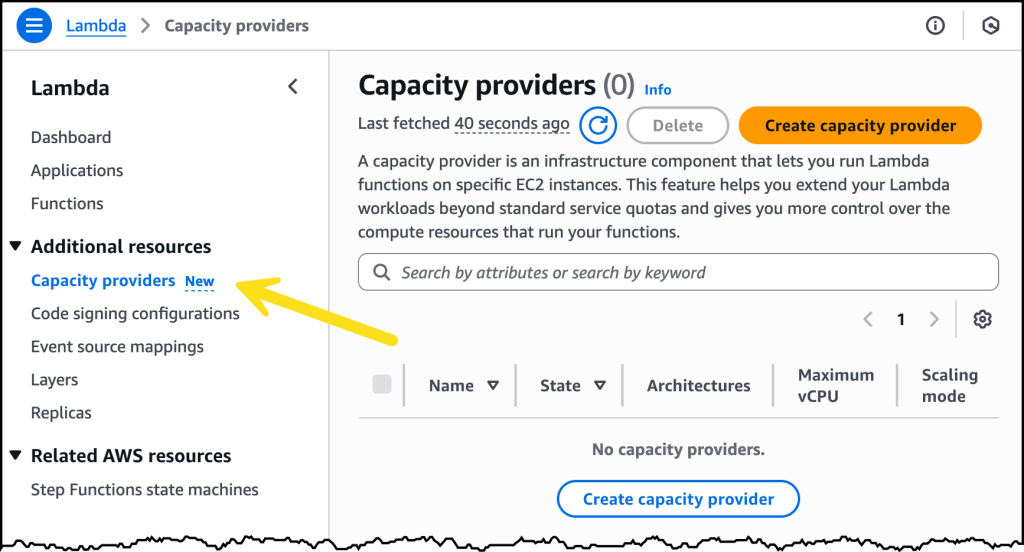
To take Lambda Managed Instances for a spin, I first need to create a Capacity provider. As shown in the following image, there is a new tab for creating these in the navigation pane under Additional resources.

Lambda Managed Instances Console

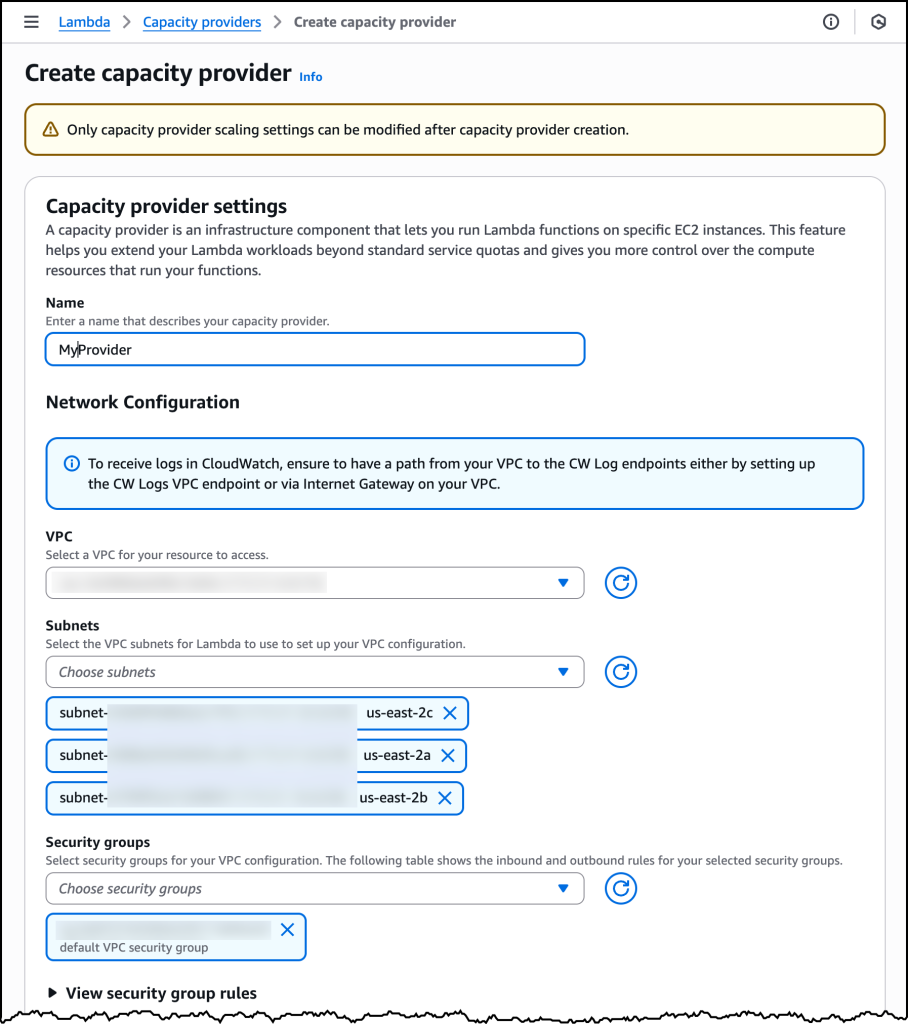
Creating a Capacity provider is where I specify the virtual private cloud (VPC), subnet configuration and security groups. With a capacity provider configuration, I can also tell Lambda where to provision and manage the instances.

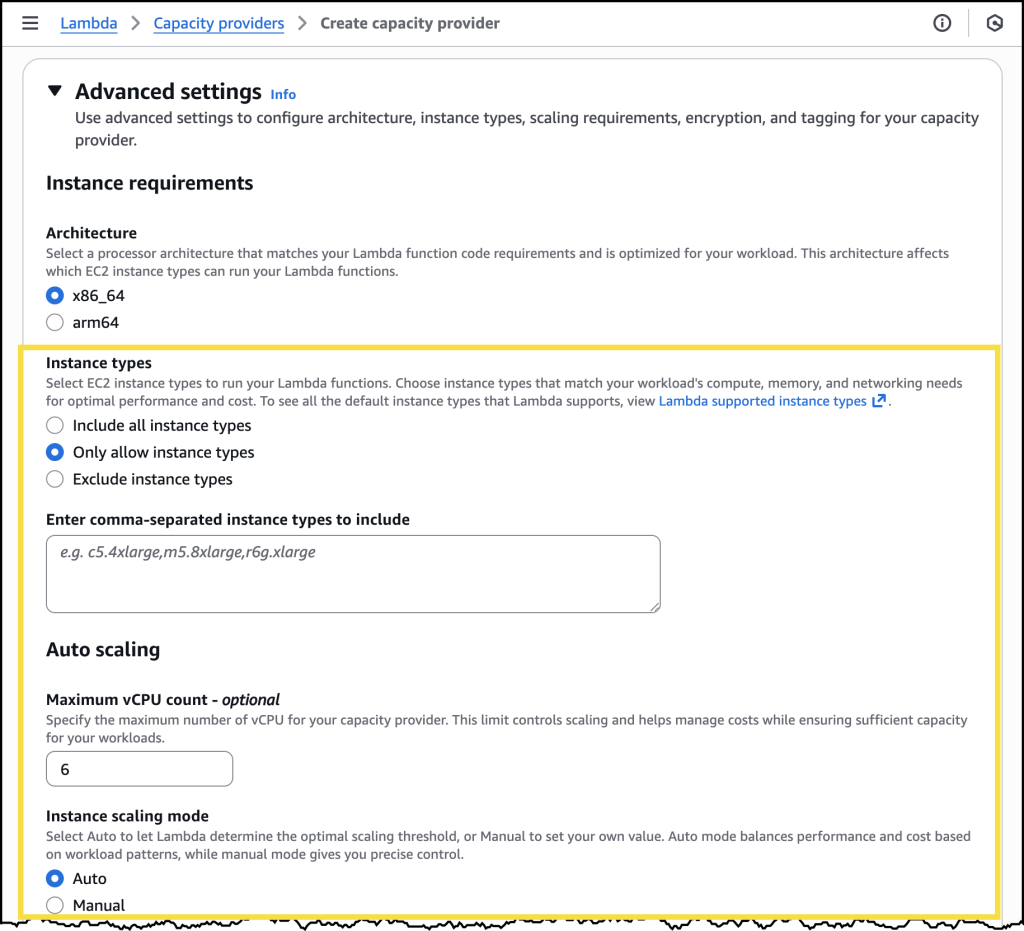
I can also specify the EC2 instance types I’d like to include or exclude, or I can choose to include all instance types for high diversity. Additionally, I can specify a few controls related to auto scaling, including the Maximum vCPU count, and if I want to use Auto scaling or use a CPU policy.

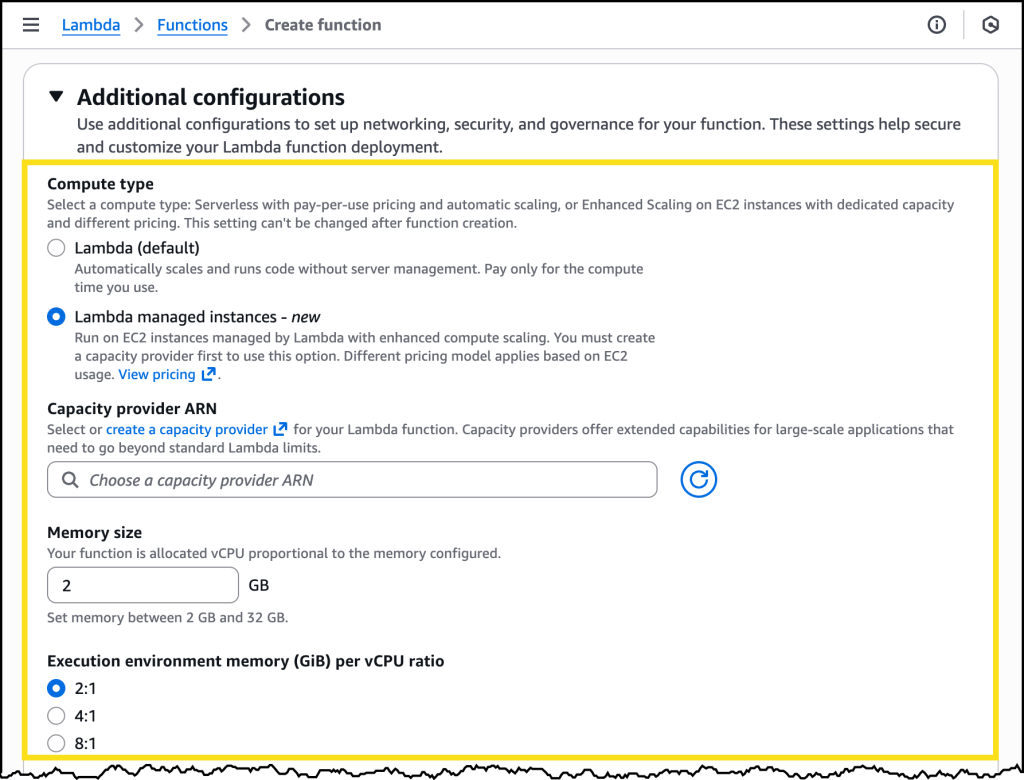
After I have my capacity provider configured, I can choose it through its Amazon Resource Name (ARN) when I go to create a new Lambda function. Here I can also select the memory allocation I want along with a memory-to-vCPU ratio.

Working with Lambda Managed Instances
Now that we’ve seen the basic setup, let’s explore how Lambda Managed Instances works in more detail. The feature organizes EC2 instances into capacity providers that you configure through the Lambda console, AWS Command Line Interface (AWS CLI), or infrastructure as code (IaC) tools such as AWS CloudFormation, AWS Serverless Application Model (AWS SAM), AWS Cloud Development Kit (AWS CDK) and Terraform. Each capacity provider defines the compute characteristics you need, including instance type, networking configuration, and scaling parameters.

When creating a capacity provider, you can choose from the latest generation of EC2 instances to match your workload requirements. For cost-optimized general-purpose compute, you could choose AWS Graviton4 based instances that deliver excellent price performance. If you’re not sure which instance type to select, AWS Lambda provides optimized defaults that balance performance and cost based on your function configuration.

After creating a capacity provider, you attach your Lambda functions to it through a straightforward configuration change. Before attaching a function, you should review your code for programming patterns that can cause issues in multiconcurrency environments, such as writing to or reading from file paths that aren’t unique per request or using shared memory spaces and variables across invocations.

Lambda automatically routes requests to preprovisioned execution environments on the instances, eliminating cold starts that can affect first-request latency. Each execution environment can handle multiple concurrent requests through the multiconcurrency feature, maximizing resource utilization across your functions. When additional capacity is needed during traffic increases, AWS automatically launches new instances within tens of seconds and adds them to your capacity provider. The capacity provider can absorb traffic spikes of up to 50% without needing to scale by default, but built-in circuit breakers protect your compute resources during extreme traffic surges by temporarily throttling requests with 429 status codes if the capacity provider reaches maximum provisioned capacity and additional capacity is still being spun up.

The operational and architectural model remains serverless throughout this process. AWS handles instance provisioning, OS patching, security updates, load balancing across instances, and automatic scaling based on demand. AWS automatically applies security patches and bug fixes to operating system and runtime components, often without disrupting running applications. Additionally, instances have a maximum 14-day lifetime to align with industry security and compliance standards. You don’t need to write automatic scaling policies, configure load balancers, or manage instance lifecycle yourself, and your function code, event source integrations, AWS Identity and Access Management (AWS IAM) permissions, and Amazon CloudWatch monitoring remain unchanged.

Now available
You can start using Lambda Managed Instances today through the Lambda console, AWS CLI, or AWS SDKs. The feature is available in US East (N. Virginia), US East (Ohio), US West (Oregon), Asia Pacific (Tokyo), and Europe (Ireland) Regions. For Regional availability and future roadmap, visit the AWS Capabilities by Region. Learn more about it in the AWS Lambda documentation.

Pricing for Lambda Managed Instances has three components. First, you pay standard Lambda request charges of $0.20 per million invocations. Second, you pay standard Amazon EC2 instance charges for the compute capacity provisioned. Your existing Amazon EC2 pricing agreements, including Compute Savings Plans and Reserved Instances, can be applied to these instance charges to reduce costs for steady-state workloads. Third, you pay a compute management fee of 15% calculated on the EC2 on-demand instance price to cover AWS’s operational management of your instances. Note that unlike traditional Lambda functions, you are not charged separately for execution duration per request. The multiconcurrency feature helps further optimize costs by reducing the total compute time required to process your requests.

The initial release supports the latest versions of Node.js, Java, .NET and Python runtimes, with support for other languages coming soon. The feature integrates with existing Lambda workflows including function versioning, aliases, AWS CloudWatch Lambda Insights, AWS AppConfig extensions, and deployment tools like AWS SAM and AWS CDK. You can migrate existing Lambda functions to Lambda Managed Instances without changing your function code (as long as it has been validated to be thread safe for multiconcurrency) making it easy to adopt this capability for workloads that would benefit from specialized compute or cost optimization.

Lambda Managed Instances represents a significant expansion of Lambda’s capabilities, which means you can run a broader range of workloads while preserving the serverless operational model. Whether you’re optimizing costs for high-traffic applications, or accessing the latest processor architectures like Graviton4, this new capability provides the flexibility you need without operational complexity. We’re excited to see what you build with Lambda Managed Instances.

Announcing Amazon EKS Capabilities for workload orchestration and cloud resource management

Post Syndicated from Channy Yun (윤석찬) original https://aws.amazon.com/blogs/aws/announcing-amazon-eks-capabilities-for-workload-orchestration-and-cloud-resource-management/

Today, we’re announcing Amazon Elastic Kubernetes Service (Amazon EKS) Capabilities, an extensible set of Kubernetes-native solutions that streamline workload orchestration, Amazon Web Services (AWS) cloud resource management, and Kubernetes resource composition and orchestration. These fully managed, integrated platform capabilities include open source Kubernetes solutions that many customers are using today, such as Argo CD, AWS Controllers for Kubernetes, and Kube Resource Orchestrator.

With EKS Capabilities, you can build and scale Kubernetes applications without managing complex solution infrastructure. Unlike typical in-cluster installations, these capabilities actually run in EKS service-owned accounts that are fully abstracted from customers.

With AWS managing infrastructure scaling, patching, and updates of these cluster capabilities, you can use the enterprise reliability and security without needing to maintain and manage the underlying components.

Here are the capabilities available at launch:

  • Argo CD – This is a declarative GitOps tool for Kubernetes that provides continuous continuous deployment (CD) capabilities for Kubernetes. It’s broadly adopted, with more than 45% of Kubernetes end-users reporting production or planned production use in the 2024 Cloud Native Computing Foundation (CNCF) Survey.
  • AWS Controllers for Kubernetes (ACK) – ACK is highly popular with enterprise platform teams in production environments. ACK provides custom resources for Kubernetes that enable the management of AWS Cloud resources directly from within your clusters.
  • Kube Resource Orchestrator (KRO) – KRO provides a streamlined way to create and manage custom resources in Kubernetes. With KRO, platform teams can create reusable resource bundles that abstract away complexity while remaining natively to the Kubernetes ecosystem.

With these features, you can accelerate and scale your Kubernetes use with fully managed capabilities, using its opinionated but flexible features to build for scale right from the start. It is designed to offer a set of foundational cluster capabilities that layer seamlessly with each other, providing integrated features for continuous deployment, resource orchestration, and composition. You can focus on managing and shipping software without needing to spend time and resources building and managing these foundational platform components.

How it works
Platform engineers and cluster administrators can set up EKS Capabilities to offload building and managing custom solutions to provide common foundational services, meaning they can focus on more differentiated features that matter to your business.

Your application developers primarily work with EKS Capabilities as they do other Kubernetes features. They do this by applying declarative configuration to create Kubernetes resources using familiar tools, such as kubectl or through automation from git commit to running code.

Get started with EKS Capabilities
To enable EKS Capabilities, you can use the EKS console, AWS Command Line Interface (AWS CLI), eksctl, or other preferred tools. In the EKS console, choose Create capabilities in the Capabilities tab on your existing EKS cluster. EKS Capabilities are AWS resources, and they can be tagged, managed, and deleted.

You can select one or more capabilities to work together. I checked all three capabilities: ArgoCD, ACK, and KRO. However, these capabilities are completely independent and you can pick and choose which capabilities you want enabled on your clusters.

Now you can configure selected capabilities. You should create AWS Identity and Access Management (AWS IAM) roles to enable EKS to operate these capabilities within your cluster. Please note you cannot modify the capability name, namespace, authentication region, or AWS IAM Identity Center instance after creating the capability. Choose Next and review the settings and enable capabilities.

Now you can see and manage created capabilities. Select ArgoCD to update configuration of the capability.

You can see details of ArgoCD capability. Choose Edit to change configuration settings or Monitor ArgoCD to show the health status of the capability for the current EKS cluster.

Choose Go to Argo UI to visualize and monitor deployment status and application health.

To learn more about how to set up and use each capability in detail, visit Getting started with EKS Capabilities in the Amazon EKS User Guide.

Things to know
Here are key considerations to know about this feature:

  • Permissions – EKS Capabilities are cluster-scoped administrator resources, and resource permissions are configured through AWS IAM. For some capabilities, there is additional configuration for single sign-on. For example, Argo CD single sign-on configuration is enabled directly in EKS with a direct integration with IAM Identity Center.
  • Upgrades – EKS automatically updates cluster capabilities you enable and their related dependencies. It automatically analyzes for breaking changes, patches and updates components as needed, and informs you of conflicts or issues through the EKS cluster insights.
  • Adoptions – ACK provides resource adoption features that enable migration of existing AWS resources into ACK management. ACK also provides read-only resources which can help facilitate a step-wise migration from provisioned resources with Terraform, AWS CloudFormation into EKS Capabilities.

Now available
Amazon EKS Capabilities are now available in commercial AWS Regions. For Regional availability and future roadmap, visit the AWS Capabilities by Region. There are no upfront commitments or minimum fees, and you only pay for the EKS Capabilities and resources that you use. To learn more, visit the EKS pricing page.

Give it a try in the Amazon EKS console and send feedback to AWS re:Post for EKS or through your usual AWS Support contacts.

Channy

Performance benefits of new Amazon EC2 R8a memory-optimized instances

Post Syndicated from Tyler Jones original https://aws.amazon.com/blogs/compute/performance-benefits-of-new-amazon-ec2-r8a-memory-optimized-instances/

Recently we announced the availability of Amazon Elastic Compute Cloud (Amazon EC2) R8a instances, the latest addition to the AMD memory-optimized instance family. These instances are powered by the 5th Generation AMD EPYC (codename Turin) processors with a maximum frequency of 4.5 GHz. In this post I take these instances for a spin and benchmark MySQL later on, but first I discuss the top things you should know about these instances.

Notable characteristics of R8a instances

Each vCPU on an R8a instance corresponds to a physical CPU core (something we started on 7th generation AMD instances). This means that there is no simultaneous multi-threading (SMT). Each vCPU mapped to a dedicated physical core, which means that you get more predictable and consistent performance because there’s no resource sharing or potential interference between threads, which is particularly crucial for performance-sensitive workloads where consistent latency is essential. When evaluating and adopting R8a instances, make sure that you’re re-evaluating your thresholds for CPU usage. You can likely squeeze more out of each instance’s CPU without impacting any of your workload’s SLA metrics.

R8a instances feature sizes of up to 192 vCPU with 1,536 GiB RAM. The following table shows the detailed specs:

Instance size vCPU Memory (GiB) Instance storage Network bandwidth (Gbps) EBS bandwidth (Gbps)
r8a.medium 1 8 EBS Only Up to 12.5 Up to 10
r8a.large 2 16 EBS Only Up to 12.5 Up to 10
r8a.xlarge 4 32 EBS Only Up to 12.5 Up to 10
r8a.2xlarge 8 64 EBS Only Up to 15 Up to 10
r8a.4xlarge 16 128 EBS Only Up to 15 Up to 10
r8a.8xlarge 32 256 EBS Only 15 10
r8a.12xlarge 48 384 EBS Only 22.5 15
r8a.16xlarge 64 512 EBS Only 30 20
r8a.24xlarge 96 768 EBS Only 40 30
r8a.48xlarge 192 1536 EBS Only 75 60
r8a.metal-24xl 96 768 EBS Only 40 30
r8a.metal-48xl 192 1536 EBS Only 75 60

Testing MySQL performance using HammerDB

R8a instances are a great choice for MySQL databases, so I thought that would be a great place to showcase some of these instances capabilities. To test MySQL, I used a series of scripts written by my colleagues to track MySQL performance across software versions and different EC2 instances. These scripts are stored in the repro-collection repository, which is an open source, extensible framework for performance testing that addresses real-world workloads rather than micro-benchmarks. It is built to provide a performance measurement reference usable across multiple organizations, and it’s currently centered on MySQL and actively used in discussions with Linux Kernel developers and maintainers. Furthermore, it helps track any performance impacts created by code changes to MySQL. The scripts contained in this repository set up a MySQL database to be tested, and a load generator running the HammerDB benchmark.

For this benchmark I used an r6a.24xlarge instance for the load generator, and an r6a.xlarge, r7a.xlarge, and r8a.xlarge instances for the MySQL database server all deployed in the same AWS Availability Zone (AZ). I chose a single AZ setup to minimize any latency variability from crossing multiple AZs. This is not meant to be a production-like setup, and I highly recommend using multiple AZs for production workloads. Each MySQL instance was tested separately using the same HammerDB load generator. Each test was run three times, and the results were averaged across the three runs. A diagram of the architecture is shown in the following figure:

Performance testing architecture showing r6a/r7a/r8a instance types with HammerDB load generator executing 9 test runs

HammerDB overall results

R8a instances show great results in the HammerDB benchmark for MySQL databases. For HammerDB’s overall score category, R8a instances outscored R7a instances by 55% and outscored R6a instances by 74%.

Performance comparison chart showing r6a, r7a, and r8a instance scores

HammerDB transactions per minute test

R8a instances also showed a notable improvement in this category. When compared to previous generation R7a instances, R8a out performed R7a by 32%. When compared to R6a instances, R8a outperformed by 63%.

 Performance comparison showing r6a (91,105), r7a (112,686), and r8a (148,478) transactions per minute

HammerDB P99 latency results

R8a instances showed improvement in P99 latency results, showing the efficiency gains driven by the new 5th Generation AMD EPYC CPUs and higher memory bandwidth. R8a shows an 14% latency reduction when compared to R7a, and a 25% latency reduction when compared to R6a.

P99 latency comparison showing decrease from 39.93ms (r6a) to 30.02ms (r8a) across instance generations

Conclusion

Built on the AWS Nitro System using sixth generation Nitro Cards, R8a instances are ideal for high performance, memory-intensive workloads, such as SQL and NoSQL databases, as demonstrated by the bench-marking shown in this post, as well as distributed web scale in-memory caches, in-memory databases, real-time big data analytics, and Electronic Design Automation (EDA) applications. R8a instances offer 12 sizes, including 2 bare metal sizes. Amazon EC2 R8a instances are SAP-certified, and providing 38% more SAPS when compared to R7a instances. If you’re still running 6th generation R6a instances, then I highly encourage you to migrate to the 8th generation instances to use their clear price performance benefits. Staying on modern infrastructure is a great way to drive down costs and provide more features for your customers, and there are clear gains to be had based on the testing shown in this post.

Start optimizing your high performance memory intensive workloads today by migrating to R8a instances. Visit the Amazon EC2 R8a instances page to learn more and get started on your upgrades to use the increased price performance of R8a instances today!

The attendee’s guide to hybrid cloud and edge computing at AWS re:Invent 2025

Post Syndicated from Rachel Zheng original https://aws.amazon.com/blogs/compute/the-attendees-guide-to-hybrid-cloud-and-edge-computing-at-aws-reinvent-2025/

AWS re:Invent 2025 returns to Las Vegas, Nevada, from December 1–5, 2025. This year, we’re offering a comprehensive lineup of sessions and booth activities to help you build resilient, performant, and scalable applications wherever you need them—in the cloud, on premises, or at the edge.

Session types

These sessions are available in the following formats. Most of the sessions are under the topic of Hybrid Cloud and Multicloud (HMC) in the event catalog. If you plan to attend in person, lightning talks and theater sessions are walk-up only. For all other session types, you can reserve your seat through the event portal (login required) or join as a walk-up based on availability.

  • Breakout sessions – Lecture-style 60-minute presentations led by AWS experts and customers.
  • Lightning talks – 20-minute content on specific topics. Each Hybrid Cloud lightning talk features a real-world customer implementation.
  • Chalk talks – 60-minute interactive sessions where AWS experts lead discussions and whiteboard in real time.
  • Code talks – 60-minute sessions featuring coding demonstrations and technical implementations.
  • Workshops – Hands-on, 120-minute sessions where you work directly with AWS services in a guided environment.
  • Theater sessions – 15-minute quick sessions on the Expo floor, typically featuring partner solutions.

Our Hybrid Cloud sessions explore how you can extend AWS infrastructure, services, and tools to distributed locations for low latency, data residency, and local processing needs. These sessions focus on AWS Local Zones, AWS Outposts, and AWS Dedicated Local Zones. We’ve curated the following sessions by theme to help you navigate re:Invent and find content most relevant to your needs.

Leadership session

HMC202 | Breakout Session | AWS wherever you need it: From the cloud to the edge

Wednesday, Dec 3 | 2:30 PM – 3:30 PM PST

Wynn | Convention Promenade | Lafite 7 | Content Hub | Turquoise Theater

Presented by our engineering and product management leaders, Spencer Dillard and Madhura Kale, this session provides an overview of all our latest innovations for hybrid cloud and edge computing, and how they help you address infrastructure requirements in digital sovereignty, generative AI with local data processing needs, and migration and modernization with on-premises dependencies.

Theme 1: Generative AI and agentic AI with local data processing

As you scale generative AI implementations from pilots to production, you need to balance speed of innovation with data sovereignty requirements, low-latency edge inference needs, and space, power, and cost efficiency. In the following sessions, you will learn how to address these challenges.

HMC308 | Breakout session | Build generative and agentic AI applications on-premises and at the edge

Thursday, Dec 4 | 2:30 PM – 3:30 PM PST

Wynn | Upper Convention Promenade | Cristal 7

This session shares reference architectures, best practices, and demos for running small language models (SLMs), Retrieval Augmented Generation (RAG), and agentic AI with AWS Hybrid and Edge services. Gain insights into strategies for model selection and optimization.

HMC324 | Lightning talk | BCC: Hybrid architecture for generative AI to meet regulatory needs

Monday, Dec 1 | 10:00AM – 10:20AM PST

Mandalay Bay | Oceanside C | Content Hub | Lightning Theater

Learn how Bank CenterCredit (BCC) implemented two generative AI use cases: anonymizing personally identifiable information (PII) in customer service calls with Outposts before sending it to the parent AWS Region for foundation model (FM) fine-tuning, and implementing local RAG with regulated data to improve HR efficiency.

HMC311 | Chalk talk | Developing end-to-end SLM pipelines from the cloud to the edge

Thursday, Dec 4 | 11:30AM – 12:30 PM PST

MGM | Level 3 | Chairman’s 362

This session presents a comprehensive approach to deploying SLMs to Local Zones and Outposts using Amazon SageMaker and Amazon EKS. Learn how to deliver domain-specific, fine-tuned SLMs from Regions to edge locations for low-latency inference.

HMC312 | Chalk talk | Implement RAG while meeting data residency requirements

Wednesday, Dec 3 | 5:30PM – 6:30 PM PST

Mandalay Bay | Level 3 South | South Seas A

This session explores how to implement RAG with on-premises and edge data to help you meet data residency and digital sovereignty needs.

HMC317 | Code talk | Implement Agentic AI at the edge for industrial automation

Monday, Dec 1 | 10:30AM – 11:30AM PST

Mandalay Bay | Level 3 South | Jasmine H

Manufacturing and industrial operations demand real-time, intelligent decision-making in low-connectivity environments. Learn how to deploy SmolVLMs (small vision language models) and AI agents to automate site operations using Outposts and Strands Agents.

HMC302 | Workshop | Implementing agentic AI solutions on-premises and at the edge

Wednesday, Dec 3 | 4:00PM – 6:00PM PST

MGM | Level 3 | Chairman’s 368

In this workshop, learn how to extend Amazon Bedrock AgentCore to Outposts and Local Zones to build distributed agentic applications using Model Context Protocol (MCP) and agent-to-agent (A2A) communication with on-premises data.

HMC305 | Workshop | Low-latency SLM deployment: Optimizing inference on AWS Hybrid and Edge services

Monday, Dec 1 | 08:00AM – 10:00AM PST

MGM | Level 1 | Grand 117

This workshop demonstrates a fully local deployment approach for running SLMs at the edge using Local Zones and Outposts. The implementation focuses on achieving low-latency inference and enabling data sovereignty compliance through RAG within local infrastructure.

Theme 2: Migration and modernization with on-premises or edge dependencies

Certain workloads need to stay on-premises or closer to end users. These can be driven by data residency and digital sovereignty requirements or the need to access legacy on-premises systems at a low latency. When a Region is not close enough to meet these needs, AWS brings AWS infrastructure and AWS services closer to where you need them to accelerate migration and modernization.

HMC309 | Breakout session | Migrating your VMware workloads with on-premises dependencies

Thursday, Dec 4 | 11:30AM – 12:30PM PST

Caesars Forum | Level 1 | Summit 212 | Content Hub | Orange Theater

Learn how AWS can help you migrate VMware-based workloads while addressing data residency requirements and latency-sensitive application interdependencies. Gain insights from a real-world implementation at Caesars Entertainment.

HMC217 | Lightning talk | Rivian: Modernize mission-critical manufacturing applications with AWS

Wednesday, Dec 3 | 2:30PM – 2:50PM PST

Mandalay Bay | Level 2 South | Oceanside C | Content Hub | Lightning Theater

Manufacturing applications like Ignition, SCADA, MES, and robotic control require low-latency connectivity to on-premises manufacturing equipment. Learn how Rivian is modernizing mission-critical and latency-sensitive manufacturing applications with Outposts.

HMC313 | Chalk talk | Extend Amazon EKS clusters for on-premises and edge use cases

Wednesday, Dec 3 | 4:00PM – 5:00PM PST

MGM | Level 3 | Chairman’s 356

Dive deep into strategies for modernizing distributed applications with Amazon EKS across Regions, Local Zones, and Outposts.

HMC303 | Workshop | Migrate and modernize VMware workloads with on-premises dependencies

Tuesday, Dec 2 | 12:30PM – 2:30PM PST

Wynn | Convention Promenade | Margaux 2

This workshop guides you through migrating VMware and other on-premises applications to Outposts while modernizing them through containerization.

Theater session | Deploying robust disaster recovery for mission-critical workloads

Wednesday, Dec 3 | 1:00PM – 1:15PM PST

The Venetian | Level 2 | Expo Hall B | NetApp Booth (#1039)

With Outposts third-party storage integration, you can modernize right inside your data centers while leveraging your investment in on-premises storage solutions. Join this session to learn how you can implement a robust disaster recovery solution for mission-critical workloads using Amazon FSx for NetApp ONTAP and on-premises ONTAP with Outposts. Learn how to perform real-time SnapMirror replication between Regions and on-premises environments and monitor replication status and RPO metrics.

Theme 3: Data residency and digital sovereignty

As organizations scale innovative solutions globally, they need to navigate complex digital sovereignty requirements. Learn how AWS Hybrid and Edge services help you adopt a consistent approach to security, monitoring, management, and auditing across jurisdictions while meeting regulatory obligations.

HMC310 | Breakout session | Digital sovereignty and data residency with AWS Hybrid and Edge services

Tuesday, Dec 2 | 4:30PM – 5:30PM PST

Caesars Forum | Level 1 | Summit 212 | Content Hub | Yellow Theater

This session examines best practices for data residency, security controls, and operational consistency across distributed locations. Hear how AWS helped Geidea, a leading fintech company, accelerate business expansion in the Middle East while meeting country-specific data residency requirements.

HMC214 | Lightning talk | DraftKings: Meeting gaming regulations at Super Bowl scale with AWS Local Zones

Wednesday, Dec 3 | 2:00PM – 2:20PM PST

Mandalay Bay | Level 2 South | Oceanside C | Content Hub | Lightning Theater

Learn how DraftKings built a scalable edge strategy using Regions and Local Zones to meet Federal Wire Act requirements while accelerating expansion into 26 US states.

HMC316 | Chalk talk | Address digital sovereignty with hybrid cloud solutions

Monday, Dec 1 | 1:30PM – 2:30PM PST

Mandalay Bay | Lower Level North | South Pacific D

Learn how to choose the best AWS infrastructure option for your sovereign needs and architect applications for data residency and resiliency. Discover how to implement security controls to regulate how data can be stored, processed, and transferred, and how to prevent unauthorized data access.

Theme 4: Optimizing for low and ultra-low latency

Systems like online ticketing, real-time threat detection, manufacturing control, and financial trading require network latency ranging from double-digit milliseconds to low double-digit microseconds. The Hybrid Cloud track discusses how AWS brings cloud services closer to end users and data generation points to satisfy various latency profiles.

SPF206 | Breakout session | Ticketmaster: Enhancing live event experience for fans with AWS Local Zones

Thursday, Dec 4 | 2:30PM – 3:30PM PST

Caesars Forum | Level 1 | Sports Forum | Mainstage

Discover how Ticketmaster delivers superior live event experiences by bringing its online ticket sales platform closer to fans using Local Zones.

HMC216 | Lightning talk | LSEG: Modernizing critical financial systems with multicloud and hybrid cloud

Tuesday, Dec 2 | 3:30PM – 3:50PM PST

Mandalay Bay | Level 2 South | Oceanside C | Content Hub | Lightning Theater

Learn how LSEG is transforming its global PriceStream FX trading platform, implementing a sophisticated architecture for ultra-low latency with managed services. Additionally, explore how LSEG is modernizing clearing systems as critical national infrastructure, balancing regulatory compliance, operational excellence, and business continuity with strict RPO/RTO requirements.

HMC215 | Lightning talk | AWS Local Zones – Sophos’ new edge in the global race against cyber-attacks

Tuesday, Dec 2 | 3:00PM – 3:20PM PST

Mandalay Bay | Level 2 South | Oceanside C | Content Hub | Lightning Theater

Discover how AWS Hybrid and Edge solutions transform how organizations deliver low-latency applications at the edge. Learn how Local Zones extends Regions and services closer to population centers, fitting use cases from media streaming to real-time gaming and financial trading.

HMC213 | Lightning talk | AWS Local Zones & Outposts: Verifone’s Global Edge Computing Strategy

Tuesday, Dec 2 | 11:30AM – 11:50AM PST

Mandalay Bay | Level 2 South | Oceanside C | Content Hub | Lightning Theater

Hear from Verifone on how it transformed its global payment ecosystem, managing 35 million terminals with innovative edge computing. Dive into strategies for deploying point-of-sale (POS) software using multi-tier architectures.

HMC402 | Chalk talk | Meet ultra-low latency and high throughput needs with AWS Outposts

Wednesday, Dec 3 | 10:00AM – 11:00AM PST

Mandalay Bay | Level 2 South | Lagoon G

Dive deep into the new category of accelerated networking Amazon EC2 instances on Outposts, purpose-built for modernizing ultra-low latency and high-throughput mission-critical workloads.

Theme 5: Architecture considerations for hybrid cloud

Running applications outside of Regions requires special architectural considerations to address space, power, and networking constraints. We will share best practices and implementation guidance on improving security, resiliency, and availability.

HMC327 | Lightning talk | Nasdaq: Build resilient infrastructure for global financial services

Tuesday, Dec 2 | 11:00AM – 11:20AM PST

Mandalay Bay | Level 2 South | Oceanside C | Content Hub | Lightning Theater

This session discusses how Nasdaq modernizes its mission-critical capital markets infrastructure while upholding the highest level of resiliency. Learn how Nasdaq integrates Outposts and multi-Region deployments into its core trading and surrounding systems, balancing cloud flexibility with performance and reliability.

HMC328 | Lightning talk | Build resilient and low-latency hybrid telecom infrastructure at scale

Thursday, Dec 4 | 5:00PM – 5:20PM PST

Mandalay Bay | Level 2 South | Oceanside C | Content Hub | Lightning Theater

Discover how Liberty Latin America (LLA) built telecom infrastructure in a hybrid cloud architecture for millions of subscribers. Learn how LLA created a resilient, low-latency network with over 180 VPCs.

HMC314 | Chalk talk | Deploying for resilience: HA/DR strategies for AWS Outposts and AWS Local Zones

Monday, Dec 1 | 1:30PM – 2:30PM PST

MGM | Level 1 | Boulevard 169

In this chalk talk, learn how to plan and implement resilient deployments to deliver high availability and disaster recovery, especially for business-critical or mission-critical workloads.

HMC315 | Chalk talk | Deep dive on AWS hybrid and edge networking architectures

Tuesday, Dec 2 | 1:30PM – 2:30PM PST

MGM | Level 1 | Boulevard 156

This chalk talk covers patterns such as private vs. public connectivity, service link and on-premises connectivity, and designing resilient Multi-AZ architecture across Outposts and Local Zones.

HMC403 | Code talk | Build and optimize edge architecture for resiliency with AI

Wednesday, Dec 3 | 2:30PM – 3:30PM PST

MGM | Level 3 | Chairman’s 356

This live coding session explores how to automate edge infrastructure operations with AI. Discover how to build resilient architectures with the latest Outposts and Local Zones APIs and Strands Agents.

HMC301 | Workshop | Build and operate resilient and performant distributed applications [REPEAT]

HMC301-R: Monday, Dec 1 | 3:00PM – 5:00PM PST | MGM | Grand 117

HMC301-R1: Thursday, Dec 4 | 3:00PM – 5:00PM PST | MGM | Premier 318

This workshop explores how to design and implement applications for multi-geo operations while meeting data residency and performance requirements. You will learn how to design fault-tolerant, latency-sensitive applications across distributed locations with limited hardware resources.

Activities in the Expo

Beyond sessions, join us in the re:Invent Expo (The Venetian, Level 2, Hall B) to meet with AWS experts and learn through interactive demos.

AWS Village (Booth #750)

Connect with AWS experts in the Hybrid Cloud kiosk and AWS Global Infrastructure kiosk to discuss your hybrid cloud and edge computing needs. Watch demos on the following topics and ask questions:

  • Consistent Amazon EKS experience across distributed locations and how it can simplify GPU resource orchestration
  • How to optimize and deploy SLMs locally for AI inference with low latency or data residency needs
  • How to build agentic AI workflows at the edge for manufacturing automation

Stop by the Migration & Modernization area of the AWS Village to see hardware innovations inside the latest generation of Outposts up close and personal.

AWS for Industries Pavillion (Booth #111)

Explore how AWS Hybrid and Edge services unlock new use cases and improve operational efficiency across multiple industries through immersive experiences:

  • AWS for Telecom – Modernizing telecom infrastructure while meeting data sovereignty and performance requirements
  • AWS for Public Sector – Accelerating tactical edge deployments to improve mission outcomes
  • AWS for Automotive – Advancing global R&D of embedded hardware and software

Partner booths

Discover how AWS Hybrid and Edge services and AWS Partner solutions unlock additional use cases through demos:

  • Pure Storage (Booth #1756) – Simplifying cloud migration with on-premises dependencies through Outposts integration with Pure Storage FlashArray
  • Intel (Booth #1010): – Powering physical AI and agentic systems for real-time operations in manufacturing
  • Seagate (Booth #159) – Facilitating data ingestion and pre-processing at the edge

Ready for re:Invent 2025?

We hope this guide to hybrid cloud and edge computing helps you maximize your learning experience at re:Invent. Not able to attend in-person? Register for the virtual-only event offered at no additional cost to livestream keynotes and innovation talks, and access on-demand session content. See you in Las Vegas or virtually!

Optimize unused capacity with Amazon EC2 interruptible capacity reservations

Post Syndicated from Shubham Sarin original https://aws.amazon.com/blogs/compute/optimize-unused-capacity-with-amazon-ec2-interruptible-capacity-reservations/

Organizations running critical workloads on Amazon Elastic Compute Cloud (Amazon EC2) reserve compute capacity using On-Demand Capacity Reservations (ODCR) to have availability when needed. However, reserved capacity can intermittently sit idle during off-peak periods, between deployments, or when workloads scale down. This unused capacity represents a missed opportunity for cost optimization and resource efficiency across the organization.

Amazon EC2 now offers interruptible ODCRs, a new capability that lets you make unused compute capacity temporarily available to other workloads while maintaining control to reclaim it. This feature helps you optimize reservations and reduce costs across your AWS organization.

In this post, we explore how this works through a practical customer scenario.

Customer scenario: Maximizing reservation utilization across

Consider a financial services company where the trading platform team maintains a large fleet of r7i.4xlarge instances reserved around-the-clock for critical blue/green deployments. During off-peak trading hours and weekends, a significant portion of this reserved capacity sits idle. Meanwhile, the data analytics team regularly runs batch processing jobs for risk modeling—workloads that could benefit from additional compute capacity but don’t require the same availability guarantees as the trading platform.

Previously, sharing this capacity meant losing control over when it could be reclaimed, creating operational challenges when the trading platform needed to scale up quickly during market volatility. Interruptible ODCRs solve this problem by giving the reservation owner control to reclaim capacity when needed for critical operations.

In the following sections, we walk through the key steps to configure capacity sharing, launch instances, and reclaim capacity. The high-level steps are:

  1. Set up capacity sharing
  2. Discover available capacity and launch instances
  3. Reclaim capacity and handle interruptions

Step 1: Set up capacity sharing

The trading platform team begins by identifying unused capacity patterns through Amazon EC2 Capacity Manager. They determine that approximately 60% of their reserved r7i.4xlarge capacity remains unused during overnight hours and weekends.

Create interruptible ODCR

For prerequisites, see Interruptible Capacity Reservations for capacity owners in the Amazon EC2 User Guide.

To repurpose this idle capacity, the trading platform team creates an interruptible ODCR using the AWS Management Console, SDK, or AWS Command Line Interface (AWS CLI). To use the console, they complete the following steps:

  1. On the Amazon EC2 console, choose Capacity Reservations in the navigation pane.
  2. Select the source ODCR and choose Create interruptible reservation.
  3. For Instances to allocate, enter how many instances to allocate (out of a 100-instance reservation). For this example, we allocate 60 instances.
  4. Choose Create interruptible reservation.

This configuration withdraws 60 instances from their original reservation and creates a new ODCR with interruptible configuration. The original reservation now shows 40 instances, and the new interruptible reservation shows 60.

Create interruptible on-demand capacity reservation

Share resources across the organization

With the interruptible reservation created, the reservation owning team uses AWS Resource Access Manager (AWS RAM)—a service that helps you securely share AWS resources across accounts and organizations—to share the newly created ODCR with additional accounts in their organization. When sharing your ODCR, you specify which consumer account IDs in your organization will get access to the interruptible ODCR. Alternatively, you can share the ODCR with your entire AWS Organization or Organizational Unit (OU). When it’s complete, the specified accounts get access to the interruptible ODCR capacity and establish a setup like the one illustrated in the following diagram.

Share resources across the organization

Sharing with all accounts (at once) within the organization requires organization-wide sharing to be enabled in AWS Organizations setup. If organization-wide sharing is not enabled, a user can still share with individual accounts by enumerating each account.

Step 2: Discover available capacity and launch instances

After the reservation owner (the trading platform team) shares their reservation, the capacity consumer (data analytics team) needs to find the capacity in their account and launch into it. In this section, we walk through the interruptible ODCR discovery and launch process.

Discover available capacity

The data analytics team, running batch processing jobs in a separate AWS account, can now find the shared interruptible capacity in their account using the console, SDK, or AWS CLI. To use the console, they complete the following steps:

  1. On the Amazon EC2 console, choose Capacity Reservations in the navigation pane.
  2. Choose the ODCR to view its details page.

The interruptible reservation appears with a clear indication that it’s interruptible, showing the instance type (r7i.4xlarge), Availability Zone, and available capacity.

Discover available capacity

Configure Auto Scaling groups for interruptible capacity

To use this capacity for their batch processing workloads, the analytics team creates a new launch template specifically designed for interruptible capacity. The key configuration element is setting the new market-type parameter and targeting the interruptible ODCR.

In the launch template, specify the following:

  • Instance type: r7i.4xlarge (matching the shared capacity)
  • Capacity reservation specification: Targeted
  • Capacity reservation ID: Enter the ID of the shared interruptible ODCR
  • Market type: Use the type interruptible-capacity-reservation

Next, create an Auto Scaling group that uses this launch template. The group is configured as follows:

  • Minimum size: 0 (to avoid unnecessary costs when capacity isn’t needed)
  • Maximum size: 40 (within the available shared capacity)
  • Desired capacity: Set based on job queue length

Launch instances into interruptible capacity

When the analytics team’s batch processing jobs trigger scaling events, the Auto Scaling group launches instances that automatically target the shared interruptible ODCR. These instances launch immediately if capacity is available, providing the team with access to reserved capacity for their fault-tolerant workloads. The instances appear on the Amazon EC2 console with their instance lifecycle as interruptible-capacity-reservation and the ODCR ID in which they’re running. This provides clear indication that they’re running on interruptible capacity, helping with monitoring and cost allocation.

Step 3: Reclaim capacity and handle interruptions

In this section, we review how the capacity owner (the trading platform team) can reclaim their capacity when needed for their critical operations and how the capacity consumer can gracefully handle such interruptions.

Trigger reclamation

When market volatility increases and the trading platform needs to scale up quickly, the platform team initiates capacity reclamation through the console, SDK, or AWS CLI. To use the console, they complete the following steps:

  1. On the Amazon EC2 console, choose Capacity Reservations in the navigation pane.
  2. Choose the ODCR to view its details page.
  3. Choose Edit Interruptible Allocation.
  4. Specify how many instances are needed back (in this case, all 60 instances for maximum trading capacity).
  5. Choose Update, then choose Confirm.

Edit interruptible allocation

The reclamation process can also be automated using AWS Lambda functions triggered by Amazon CloudWatch alarms or scheduled events, providing proactive capacity management based on predictable usage patterns.

Consumer notification and graceful shutdown

After the owner triggers capacity reclamation, consuming instances receive a 2-minute instance interruption warning notice through Amazon EventBridge. The analytics team has configured their batch processing applications to listen for these events. Their applications receive this 2-minute warning and immediately begin checkpointing their current work, saving intermediate results to Amazon Simple Storage Service (Amazon S3), and gracefully shutting down. For EventBridge notification details, refer to the Monitor interruptible Capacity Reservations with EventBridge section in the EC2 Capacity Reservations User Guide.

Automatic capacity restoration to source ODCR

After the 2-minute notice period, Amazon EC2 starts shutting down the consuming instances. After the instances are successfully shut down, Amazon EC2 restores the capacity to the trading platform’s original ODCR. The trading platform can then launch their critical workloads into the same ODCR, resulting in minimal delay for their scaling requirements. The reservation owner can track their capacity reclamation status through the console or API. On the Amazon EC2 console, the ODCR details page shows the current instance allocation, target instance allocation, and request status. When current and target counts match, the status changes to Active, confirming completion.

After the reservation owner requests their capacity back, the capacity reclamation process can take a few minutes, so reservation owners should account for this delay when planning critical activities. This is because Amazon EC2 provides a 2-minute warning to the consumer instances, followed by the instance shutdown period.

Billing and cost considerations

The billing model for interruptible ODCRs follows a clear usage-based approach that aligns costs with consumption:

  • Reservation owner (trading platform team) – Pays EC2 On-Demand rates for unused capacity in the interruptible ODCR, just like any standard ODCR. For example, when the analytics team uses 30 out of 60 available instances, the trading platform pays for the remaining 30 unused instances.
  • Consumer (analytics team) – Pays EC2 On-Demand rates only for the instances they actually launch and use. For example, when they use 30 instances for 4 hours, they’re charged for 30 × 4 = 120 instance-hours at the standard r7i.4xlarge On-Demand rate.

Conclusion

Amazon EC2 interruptible ODCR helps organizations optimize compute spending while maintaining operational control. Through capacity reclamation mechanisms, teams can achieve better resource utilization without compromising availability guarantees. In this post, we showed how this capability addresses real operational challenges through an example use case—enabling a trading platform to maintain their critical capacity guarantees while helping other teams access high-quality compute resources for their workloads. The predictable interruption model creates a sustainable approach to capacity sharing that benefits the entire organization.

To get started with interruptible capacity reservations, refer to EC2 Capacity Reservations User Guide. To learn more about using EC2 Auto Scaling, refer the Interruptible Capacity Reservations with EC2 Auto Scaling guide. Refer to the AWS RAM User Guide to learn more about sharing resources across your organization and the Amazon EventBridge User Guide to learn more about handling interruption notifications in your applications.

Build production-ready applications without infrastructure complexity using Amazon ECS Express Mode

Post Syndicated from Donnie Prakoso original https://aws.amazon.com/blogs/aws/build-production-ready-applications-without-infrastructure-complexity-using-amazon-ecs-express-mode/

Deploying containerized applications to production requires navigating hundreds of configuration parameters across load balancers, auto scaling policies, networking, and security groups. This overhead delays time to market and diverts focus from core application development.

Today, I’m excited to announce Amazon ECS Express Mode, a new capability from Amazon Elastic Container Service (Amazon ECS) that helps you launch highly available, scalable containerized applications with a single command. ECS Express Mode automates infrastructure setup including domains, networking, load balancing, and auto scaling through simplified APIs. This means you can focus on building applications while deploying with confidence using Amazon Web Services (AWS) best practices. Furthermore, when your applications evolve and require advanced features, you can seamlessly configure and access the full capabilities of the resources, including Amazon ECS.

You can get started with Amazon ECS Express Mode by navigating to the Amazon ECS console.

Amazon ECS Express Mode provides a simplified interface to the Amazon ECS service resource with new integrations for creating commonly used resources across AWS. ECS Express Mode automatically provisions and configures ECS clusters, task definitions, Application Load Balancers, auto scaling policies, and Amazon Route 53 domains from a single entry point.

Getting started with ECS Express Mode
Let me walk you through how to use Amazon ECS Express Mode. I’ll focus on the console experience, which provides the quickest way to deploy your containerized application.

For this example, I’m using a simple container image application running on Python with the Flask framework. Here’s the Dockerfile of my demo, which I have pushed to an Amazon Elastic Container Registry (Amazon ECR) repository:


# Build stage
FROM python:3.6-slim as builder
WORKDIR /app
COPY requirements.txt .
RUN pip install --no-cache-dir --user -r requirements.txt gunicorn

# Runtime stage
FROM python:3.6-slim
WORKDIR /app
COPY --from=builder /root/.local /root/.local
COPY app.py .
ENV PATH=/root/.local/bin:$PATH
EXPOSE 80
CMD ["gunicorn", "--bind", "0.0.0.0:80", "app:app"]

On the Express Mode page, I choose Create. The interface is streamlined — I specify my container image URI from Amazon ECR, then select my task execution role and infrastructure role. If you don’t already have these roles, choose Create new role in the drop down to have one created for you from the AWS Identity and Access Management (IAM) managed policy.

If I want to customize the deployment, I can expand the Additional configurations section to define my cluster, container port, health check path, or environment variables.

In this section, I can also adjust CPU, memory, or scaling policies.

Setting up logs in Amazon CloudWatch Logs is something I always configure so I can troubleshoot my applications if needed. When I’m happy with the configurations, I choose Create.

After I choose Create, Express Mode automatically provisions a complete application stack, including an Amazon ECS service with AWS Fargate tasks, Application Load Balancer with health checks, auto scaling policies based on CPU utilization, security groups and networking configuration, and a custom domain with an AWS provided URL. I can also follow the progress in Timeline view on the Resources tab.

If I need to do a programmatic deployment, the same result can be achieved with a single AWS Command Line Interface (AWS CLI) command:

aws ecs create-express-gateway-service \
--image [ACCOUNT_ID].ecr.us-west-2.amazonaws.com/myapp:latest \
--execution-role-arn arn:aws:iam::[ACCOUNT_ID]:role/[IAM_ROLE] \
--infrastructure-role-arn arn:aws:iam::[ACCOUNT_ID]:role/[IAM_ROLE]

After it’s complete, I can see my application URL in the console and access my running application immediately.

After the application is created, I can see the details by visiting the specified cluster, or the default cluster if I didn’t specify one, in the ECS service to monitor performance, view logs, and manage the deployment.

When I need to update my application with a new container version, I can return to the console, select my Express service, and choose Update. I can use the interface to specify a new image URI or adjust resource allocations.

Alternatively, I can use the AWS CLI for updates:

aws ecs update-express-gateway-service \
  --service-arn arn:aws:ecs:us-west-2:[ACCOUNT_ID]:service/[CLUSTER_NAME]/[APP_NAME] \
  --primary-container '{
    "image": "[IMAGE_URI]"
  }'

I find the entire experience reduces setup complexity while still giving me access to all the underlying resources when I need more advanced configurations.

Additional things to know
Here are additional things about ECS Express Mode:

  • Availability – ECS Express Mode is available in all AWS Regions at launch.
  • Infrastructure as Code support – You can use IaC tools such as AWS CloudFormation, AWS Cloud Development Kit (CDK), or Terraform to deploy your applications using Amazon ECS Express Mode.
  • Pricing – There is no additional charge to use Amazon ECS Express Mode. You pay for AWS resources created to launch and run your application.
  • Application Load Balancer sharing – The ALB created is automatically shared across up to 25 ECS services using host-header based listener rules. This helps distribute the cost of the ALB significantly.

Get started with Amazon ECS Express Mode through the Amazon ECS console. Learn more on the Amazon ECS documentation page.

Happy building!
Donnie

Serverless strategies for streaming LLM responses

Post Syndicated from KyungYong Shim original https://aws.amazon.com/blogs/compute/serverless-strategies-for-streaming-llm-responses/

Modern generative AI applications often need to stream large language model (LLM) outputs to users in real-time. Instead of waiting for a complete response, streaming delivers partial results as they become available, which significantly improves the user experience for chat interfaces and long-running AI tasks. This post compares three serverless approaches to handle Amazon Bedrock LLM streaming on Amazon Web Services (AWS), which helps you choose the best fit for your application.

  1. AWS Lambda function URLs with response streaming
  2. Amazon API Gateway WebSocket APIs
  3. AWS AppSync GraphQL subscriptions

We cover how each option works, the implementation details, authentication with Amazon Cognito, and when to choose one over the others.

Lambda function URLs with response streaming

AWS Lambda function URLs provide a direct HTTP(S) endpoint to invoke your Lambda function. Response streaming allows your function to send incremental chunks of data back to the caller without buffering the entire response. This approach is ideal for forwarding the Amazon Bedrock streamed output, providing a faster user experience. Streaming is supported in Node.js 18+. In Node.js, you wrap your handler with awslambda.streamifyResponse(), which provides a stream to write data to, and which sends it immediately to the HTTP response.

Architecture

The following figure shows the architecture.

Lambda function URLs with Amazon Bedrock architecture

  1. The client makes a fetch() call to the Lambda function URL.
  2. Lambda invokes InvokeModelWithResponseStream using the AWS SDK for JavaScript.
  3. As tokens arrive from Amazon Bedrock, they are written to the response stream.

Implementation steps

  1. Create a streaming Lambda function: Use a Node.js 18+ or later runtime (necessary for native streaming). Install the AWS SDK to call Amazon Bedrock. In the handler code, wrap the function with awslambda.streamifyResponse and stream the model output. For example, in Node.js you might do the following:
    const bedrock = new BedrockRuntimeClient({region: “us-east-1”});
    
    // Please consider adding more details when you use it for your application.
    exports.handler = awslambda.streamifyResponse(async (event, responseStream) => 
    {
        // 1. Parse input (e.g., prompt from event)
        const prompt = event.body?.prompt;
        // 2. Call Amazon Bedrock with streaming (using AWS SDK for Amazon Bedrock)
        const command = new InvokeModelWithResponseStreamCommand({ modelId: "YOUR_MODEL_ID", body: { prompt }});
        const response = await bedrock.send(command);
        // 3. Stream Bedrock tokens to client
        for await (const event of response.body) {
            if (event.content) {
                responseStream.write(event.content); // write partial output
            }
        }
        // 4. End stream when done
        responseStream.end();
    });
    

  2. This code snippet uses the Amazon Bedrock SDK’s async iterable to read the event stream of tokens and writes each to the responseStream.
  3. Configure the Lambda role: the execution role must allow the Amazon Bedrock invocation (such as bedrock:InvokeModelWithResponseStream on the LLM model Amazon Resource Name (ARN)).

Authentication with Amazon Cognito

Lambda function URLs can be set to “None” (public) or “AWS_IAM”. Native Cognito User Pool token authentication isn’t supported, thus you need to implement a solution.

  1. JWT verification in Lambda: Allow public access and verify a valid JWT from Amazon Cognito in the request header within your Lambda code. This necessitates development effort.
    // Initialize Cognito JWT Verifier
    const { CognitoJwtVerifier } = require('aws-jwt-verify');
    
    const jwtVerifier = CognitoJwtVerifier.create({
      userPoolId: USER_POOL_ID,
      tokenUse: 'id',
      clientId: USER_POOL_CLIENT_ID
    });
    
    // Verify JWT token from Cognito
    async function verifyToken(token) {
      try {
        if (!token) throw new Error('No authorization token provided');
        
        // Remove 'Bearer ' prefix if present
        if (token.startsWith('Bearer ')) {
          token = token.slice(7);
        }
    
        // Verify the token using Cognito JWT Verifier
        const payload = await jwtVerifier.verify(token);
        logger.info(`Verified token for user: ${payload.sub}`);
        
        return payload;
      } catch (error) {
        logger.error(`Token verification failed: ${error.message}`);
        throw new Error(`Invalid token: ${error.message}`);
      }
    }
    
    //...
    
        // Verify authentication
        let userId;
        try {
          const authHeader = event.headers?.Authorization;
          const payload = await verifyToken(authHeader);
          userId = payload.sub;
          logger.info(`Authenticated user: ${userId}`);
        } catch (error) {
          responseStream.write(`data: ${JSON.stringify({ type: 'error', error: 'Unauthorized', message: error.message })}\n\n`);
          return;
        }
    

  2. IAM authorization with Amazon Cognito identity: Use AWS credentials obtained from Amazon Cognito. A more complex setup, especially for web apps, is potentially overkill for a single function.

Pros and cons of Lambda function URLs

Pros:

  • Clarity: No API Gateway or other services are needed, which minimizes operational overhead.
  • Low latency, high throughput: The response is delivered directly from Lambda to the client. This yields excellent Time To First Byte (TTFB) performance, with no intermediate buffering.
  • Direct implementation: For Node.js developers, enabling streaming is as direct as a wrapper and writing to a stream. This is ideal for quick prototypes or single function microservices.
  • Lower cost for low concurrent usage: You pay only for Lambda execution time. There’s no persistent connection cost, which is the same as with WebSocket or AWS AppSync. If invocations are infrequent or short, then this could be cost-efficient.

Cons:

  • Limited runtime support: Native streaming is only supported in Node.js.
  • No built-in user pool auth: Unlike API Gateway or AWS AppSync, Lambda URLs don’t directly support Amazon Cognito user pool authorizers. You must handle auth either through AWS Identity and Access Management (IAM) or manual token validation, adding some development effort and potential security pitfalls if done incorrectly.
  • Error handling complexity: Streaming makes error propagation trickier. If an error occurs mid-stream, then you need to decide how to inform the client.

API Gateway WebSocket for streaming

API Gateway WebSocket APIs establish persistent, stateful connections between clients and your backend. This is ideal for real-time applications needing server-initiated messages. The client connects once, sends a prompt to Amazon Bedrock through the WebSocket, and the server pushes the streamed response back over the same connection.

Architecture

The following figure shows the architecture.

API Gateway WebSocket with Amazon Bedrock architecture

  1. Client connects through the WebSocket URL and store connectionId.
  2. Client sends a prompt through a custom route to the LLMHandler.
  3. Lambda as LLMHandler invokes Amazon Bedrock and streams back through WebSocket.
  4. Client disconnects through the DisconnectHandler and removes connectionId.

Implementation steps

  1. Create a WebSocket API in API Gateway with routes
    1. $connect: Connected to ConnectHandler Lambda.
    2. $disconnect: Connected to DisconnectHandler Lambda.
    3. $stream: All messages go to StreamHandler Lambda.
  2. Create Lambda Authorizer
    1. Receives the connection request with token in query string.
    2. Validates the JWT token against Amazon Cognito.
    3. Returns Allow/Deny policy for the connection.
      def lambda_handler(event, context):
          # Extract token from querystring
          token = event.get("queryStringParameters", {}).get("token", "")
          
          # Validate JWT token against Cognito
          if validate_token(token):
              return {
                  "isAuthorized": True,
                  # Optionally include context that other handlers can access
                  "context": {
                      "userId": extracted_user_id
                  }
              }
          else:
              return {"isAuthorized": False}
      

  3. Create Connection Handler
    1. Connection Lambda runs after successful authorization.
    2. Receives the new connection’s unique connectionId.
    3. Store connection info in Amazon DynamoDB (optional).
    4. Returns 200 status to complete the connection.
      def lambda_handler(event, context):
          # Extract connectionId
          connection_id = event.get("requestContext", {}).get("connectionId")
          
          # Optionally store in DynamoDB
          # dynamodb.put_item(...)
          
          # Connection established successfully
          return {"statusCode": 200}
      

  4. Create Disconnect Handler
    1. Disconnect Lambda is triggered automatically when clients disconnect.
    2. Receives the terminated connection’s connectionId.
    3. Cleans up any stored connection data.
    4. Returns 200 status
      def lambda_handler(event, context):
          # Extract connectionId
          connection_id = event.get("requestContext", {}).get("connectionId")
          
          # Optionally remove from DynamoDB
          # dynamodb.delete_item(...)
          
          # Disconnection handled successfully
          return {"statusCode": 200}
      

  5. Create LLM Handler
      1. Receives messages sent to the stream route.
      2. Extracts prompt from the message body.
      3. Calls Amazon Bedrock model with streaming response.
      4. Streams tokens back to the client using the connection ID.
        def lambda_handler(event, context):
            # Extract connectionId and domain details for sending responses
            connection_id = event["requestContext"]["connectionId"]
            domain = event["requestContext"]["domainName"]
            stage = event["requestContext"]["stage"]
            
            # Parse message body to get the prompt
            body = json.loads(event.get("body", "{}"))
            prompt = body.get("prompt", "")
            
            # Create API Gateway management client for sending responses
            api_client = boto3.client(
                'apigatewaymanagementapi',
                endpoint_url=f'https://{domain}/{stage}'
            )
            
            # Call Amazon Bedrock with streaming response
            response = bedrock_client.invoke_model_with_response_stream(...)
            
            # Stream tokens back to client
            for chunk in response["body"]:
                # Extract token from chunk
                token = process_chunk(chunk)
                
                # Send token directly back through the WebSocket
                api_client.post_to_connection(
                    ConnectionId=connection_id,
                    Data=json.dumps({"token": token, "isComplete": False})
                )
            
            # Send completion message
            api_client.post_to_connection(
                ConnectionId=connection_id,
                Data=json.dumps({"token": "", "isComplete": True})
            )
            
            return {"statusCode": 200}
        

Authentication with Amazon Cognito

Securing a WebSocket API with Amazon Cognito needs a bit more work. API Gateway WebSocket doesn’t have a built-in Amazon Cognito User Pool authorizer:

  1. Lambda authorizer with JWT authentication: API Gateway invokes your Lambda authorizer upon connection, validating the Amazon Cognito JWT (passed as a query parameter). The Lambda generates an IAM policy granting access and returns it.
  2. IAM authentication for WebSockets: Clients sign requests with SigV4 using AWS credentials from an Amazon Cognito Identity Pool. API Gateway evaluates the request against IAM policies.

Pros and cons of API Gateway WebSocket APIs

Pros:

  • Bidirectional real-time communication: WebSockets are ideal for applications where the server needs to push data such as the LLM’s response without explicit requests.
  • Persistent connection for multi-turn conversations: After the initial handshake, the same connection can be reused for subsequent prompts and responses, avoiding repeated setup latency. This is great for a chat UI where the user asks multiple questions in one session.
  • Scalability: API Gateway is a managed service that can handle 500 connections/second and 10,000 requests/second across APIs, which can be increased by request.

Cons:

  • Higher development complexity: When compared to the clarity of a direct Lambda URL, a WebSocket API involves multiple Lambdas and coordination to manage the connection state.
  • Custom auth implementation: There is no built-in Amazon Cognito user pool integration, thus you must implement a Lambda authorizer.
  • Timeout management: The API Gateway integration timeout is 29 s, thus your Lambda function should return the response promptly.

AWS AppSync GraphQL subscription

AWS AppSync is a fully managed GraphQL service that streamlines building real-time APIs. It handles WebSocket connections and client fan-out automatically. Clients subscribe to a GraphQL subscription, and a Lambda resolver pushes the Amazon Bedrock streamed tokens back.

Architecture

The following figure shows the architecture.

AWS AppSync GraphQL subscription with Amazon Bedrock architecture

  1. Client calls a startStream mutation. AppSync invokes the Request Lambda.
  2. The Request Lambda immediately returns a unique sessionId and sends the processing task to an Amazon Simple Queue Service (Amazon SQS) queue.
  3. Client uses the sessionId to subscribe to an onTokenReceived GraphQL subscription.
  4. The Processing Lambda (triggered by Amazon SQS) invokes Amazon Bedrock and, for each token, calls a publishToken mutation in AWS AppSync.
  5. AWS AppSync automatically pushes the token to all clients subscribed with the matching sessionId.

Implementation steps

  1. Design the GraphQL Schema: define types and operations.
    type StreamResponse {
      sessionId: String!
      status: String!
      message: String
      timestamp: String!
      error: String
    }
    
    type TokenEvent {
      sessionId: String!
      token: String!
      isComplete: Boolean!
      timestamp: String!
    }
    
    type Mutation {
      startStream(prompt: String!): StreamResponse!
      publishToken(sessionId: String!, token: String!, isComplete: Boolean!): TokenEvent!
    }
    
    type Subscription {
      onTokenReceived(sessionId: String!): TokenEvent
    

  2. Create the Request Handler (Request Lambda)
    1. Receives the GraphQL mutation with the prompt.
    2. Generates a unique session ID.
    3. Sends the prompt and session ID to the SQS queue.
    4. Returns the session ID to the client immediately.
      def lambda_handler(event, context):
          # Extract prompt from GraphQL event
          prompt = event["arguments"]["prompt"]
          
          # Generate unique session ID
          session_id = str(uuid.uuid4())
          
          # Send message to SQS queue
          sqs_client.send_message(
              QueueUrl="your-sqs-queue-url",
              MessageBody=json.dumps({
                  "prompt": prompt,
                  "sessionId": session_id
              })
          )
          
          # Return session ID to client
          return {
              "sessionId": session_id,
              "status": "streaming_started",
              "timestamp": datetime.datetime.utcnow().isoformat()
          }
      

  3. Create the Processing Handler (Processing Lambda)
    1. It is triggered by Amazon SQS messages.
    2. It calls Amazon Bedrock with streaming enabled.
    3. For each token generated, it calls the AppSync publishToken mutation.
      def lambda_handler(event, context):
          # Process SQS event records
          for record in event["Records"]:
              body = json.loads(record["body"])
              prompt = body["prompt"]
              session_id = body["sessionId"]
              
              # Call Amazon Bedrock with streaming
              response = bedrock_client.invoke_model_with_response_stream(...)
              
              # Process streaming response
              for chunk in response["body"]:
                  # Extract token from chunk
                  token = process_chunk(chunk)
                  
                  # Publish token to AppSync
                  publish_token_to_appsync(
                      session_id=session_id,
                      token=token,
                      is_complete=False
                  )
              
              # Send completion token
              publish_token_to_appsync(
                  session_id=session_id,
                  token="",
                  is_complete=True
              )
      

  4. Configure GraphQL Resolvers
    1. StartStream resolver: Connect to the Request Lambda.
    2. PublishToken resolver: Trigger subscription with a NONE data source.
  5. Client subscription setup
    1. Make a startStream mutation.
      const { sessionId } = await client.mutate({
        mutation: START_STREAM,
        variables: { prompt }
      });
      

    2. Subscribe to receive tokens.
      client.subscribe({
        query: ON_TOKEN_RECEIVED,
        variables: { sessionId }
      }).subscribe({
        next: ({ data }) => {
          if (data.onTokenReceived.isComplete) {
            // Handle completion
          } else {
            // Append token to UI
            appendToken(data.onTokenReceived.token);
          }
        }
      });
      

Authentication with Amazon Cognito

AWS AppSync integrates seamlessly with Amazon Cognito User Pools. Setting the API’s auth mode to Amazon Cognito User Pool needs a valid JWT for every GraphQL operation. This is the most developer-friendly option for authentication. AWS AppSync handles the handshake and token refresh.

Pros and cons of AWS AppSync subscriptions

Pros:

  • Fully managed real-time protocol: You don’t deal with raw WebSockets or connection IDs at all. AWS AppSync automatically establishes and maintains a secure WebSocket for subscriptions (no need for a connect or disconnect Lambda).
  • Streamlined authentication: Built-in support for Amazon Cognito User Pool tokens means that you can secure the API without writing custom authorizers.

Cons:

  • Potential overhead and complexity: For a direct case (one prompt—one stream), introducing GraphQL and AWS AppSync might be seen as over-engineering if your app doesn’t use GraphQL for other use cases.
  • 30-second resolver limit: AWS AppSync has a 30-second limit for mutation resolvers, thus you need to design the initial request to start the process and immediately return, relying on a subscription to stream the results progressively to avoid blocking the user.

Conclusion

The Amazon Bedrock streaming interface unlocks fluid, low-latency LLM experiences. You can use the right AWS serverless architecture to deliver streamed responses in a secure, scalable, and cost-effective way.

  • Lambda function URLs with streaming: Direct, single-user applications and prototypes.
  • API Gateway WebSocket: Multi-turn conversations, collaborative applications.
  • AppSync: Complex applications already using GraphQL.

Each method is serverless, production-ready, and fully integrated with Amazon Cognito for secure access control. AWS provides the flexibility to design high-quality AI user experiences at scale.

Refer to GitHub sample source code for more details.

Comparative table

Feature LAMBDA FUNCTION URLS API GATEWAY WEBSOCKET APIs APPSYNC GRAPHQL SUBSCRIPTIONS
Complexity Lowest Medium High
Real-time focus Limited Strong Strong
Authentication Needs custom logic Needs custom logic Built-in Amazon Cognito support
Scalability Good Good Excellent
GraphQL support None None Native
Use cases Q&A Chatbots, real-time apps Complex apps, multi-user scenarios
Cost Pay per invocation Connection time and Lambda execution Request/connection-based pricing


Optimize latency-sensitive workloads with Amazon EC2 detailed NVMe statistics

Post Syndicated from Sanjeev Malladi original https://aws.amazon.com/blogs/compute/optimize-latency-sensitive-workloads-with-amazon-ec2-detailed-nvme-statistics/

Amazon Elastic Cloud Compute (Amazon EC2) instances with locally attached NVMe storage can provide the performance needed for workloads demanding ultra-low latency and high I/O throughput. High-performance workloads, from high-frequency trading applications and in-memory databases to real-time analytics engines and AI/ML inference, need comprehensive performance tracking. Operating system tools like iostat and sar provide valuable system-level insights, and Amazon CloudWatch offers important disk IOPs and throughput measurements, but high-performance workloads can benefit from even more detailed visibility into instance store performance.

For latency-sensitive applications where every millisecond counts, enhanced performance monitoring tools provide deep visibility into storage systems, so your teams can track and analyze behavior at a 1 second granularity. This detailed insight can help your organization detect bottlenecks quickly, fine-tune application performance, and deliver reliable service.

In this post, we discuss how you can use Amazon EC2 detailed performance statistics for instance store NVMe volumes, a set of new metrics that provide per-second granularity, to provide real-time visibility into your locally attached storage performance. These statistics are similar to the Amazon EBS detailed performance statistics, providing a consistent monitoring experience across both storage types. You can access these statistics directly from your NVMe devices attached to the Amazon EC2 instance using nvme-cli or using CloudWatch agent to monitor I/O performance at the storage level. We also provide examples of how to use these statistics to identify performance bottlenecks.

Feature overview

Amazon EC2 Nitro-based instances with locally attached NVMe instance storage now offer 11 comprehensive metrics at per-second granularity. These metrics, similar to EBS volume metrics, include queue length measurements, IOPS, throughput data, and IO latency histograms for the locally attached NVMe instance storage. Additionally, they also include IO size-specific latency histograms to provide even more detailed insights into performance patterns of the local NVMe instance storage. These metrics are collected and presented separately for each individual NVMe volume available on an instance.

The statistics are presented in three main formats:

    1. Cumulative counters that track IO operations, throughput, and read/write times
    2. Real-time queue length, displaying the current value at the time of your query
    3. Latency histograms visualizing the distribution of IO operations across different latency ranges by displaying both cumulative view and IO size-specific distributions

Prerequisites

To access detailed performance statistics for local instance storage, complete the following steps:

    1. Launch a new Amazon EC2 Nitro instance or use an existing one, then connect to it using SSH or your preferred connection method.
    2. Identify the NVMe device associated with the local storage to query for the performance statistics. For example, you can run the nvme-cli command in the CLI to output all NVMe devices on the instance.
      $ sudo nvme list.

      The following is an example output of the list command that lists the NVMe devices on the instance and their volume Serial Numbers (SN; masked in the below output for privacy). In this demonstration, consider that the local storage used by your application is /dev/nvme1n1.

      Terminal output showing five NVMe devices: one EBS volume and four EC2 instance storage volumes with 3.75TB capacity each

    3. If you are using Amazon Linux 2023 version 2023.8.20250915 (or later) or Amazon Linux 2 2.0.20251014.0 (or later) you can proceed to Step 4 because nvme-cli will use the latest version. If you are using an earlier Amazon Linux version, update the nvme-cli using the following command, where 2023.8.20250915 can be replaced with the latest Amazon Linux 2023 version:
      $ sudo dnf upgrade --releasever=2023.8.20250915
    4. Run the nvme-cli, with the correct permissions, and pass the device as a parameter. You can use --help to get details on the command usage:
      $ sudo nvme amzn stats --help

      Example output:
      Command help output for 'nvme amzn stats' showing usage syntax and format options
      If you prefer output in a JSON format, you can provide the -o json parameter to the command.

      $ sudo nvme amzn stats /dev/nvme1n1 -o json

      The following output (without the -o json parameter) shows cumulative read/write operations, read/write bytes, total processing time (read and write in microseconds), and duration (in microseconds) when application attempted to exceed the instance’s IOPS/throughput limits.
      Storage performance metrics showing read operations count, total bytes, and timing statistics for an EC2 NVMe volume
      It also displays read/write I/O latency histograms, with each row representing completed I/O operations within a specific bin of time (in microseconds).
      Read latency distribution histogram showing operation counts across different microsecond ranges, with peak activity in 2048-4096 rangeWrite latency distribution histogram showing zero operations across all time ranges, indicating no write activity
      If you want to view the latency histograms across 5 different IO bands: (0, 512 Byte], (512B, 4KiB], (4KiB, 8KiB], (8KiB 32KiB], (32 KiB, MAX], you can provide --details or -d parameter to the command:

      $ sudo nvme amzn stats -d /dev/nvme1n

      The following image is an excerpt of the above command’s output, showing the additional latency histograms (read and write) of the 5 different IO bands.
      Dual read/write I/O latency histogram analyzing small block operations from 0-512 bytes with peak at 4096-8192 rangePerformance analysis histogram showing I/O patterns for 512-4K blocks with significant activity in 512-1024 rangeDual histogram showing I/O latency patterns for 4K-8K block operations with concentrated activity at 4096-8192Performance analysis histogram displaying I/O patterns for 8K-32K blocks with peak activity in 4096-8192 rangeComprehensive I/O latency histogram analyzing largest block sizes from 32K to maximum with concentrated activity in 4096-8192

You can run the stats command at a per second granularity. You can also write scripts to pull the stats at a desired interval (every second or any other duration) with each subsequent output reflecting the updated cumulative totals for the metrics. Calculating the difference in the statistics across the last two outputs allows you to derive insight into the instance storage profile during the interval. Below is a sample script you can use to pull the stats at a default interval of 1 second or at your desired interval.

#!/bin/bash 
# interval of 1 second 
INTERVAL=${1:-1} 
while true; do 
	echo "=== $(date) ===" 
	sudo nvme amzn stats /dev/nvme1 || break 
	echo 
	sleep $INTERVAL 
done

You can save this script, make it executable and run it at either the default 1-second interval or provide a custom interval when executing the script. For example, if you saved the script as nvme_stats.sh, you could use the following commands to make it executable and run to get the output at the default 1-second interval (assuming you are in the same directory as that of nvme_stats.sh).

chmod +x nvme_stats.sh
./nvme_stats.sh

If, for instance, you want to get the output at every 5 seconds, you can use the command below (after making the script executable)

./nvme_stats.sh 5

You can also integrate with CloudWatch using CloudWatch agent to collect and publish these statistics for historical tracking, trend visualization through dashboards, and performance-based alerts to correlate with application metrics and automated notifications for performance issues.

Deriving insights from the Amazon EC2 instance store NVMe detailed performance statistics

Similar to EBS detailed performance statistics, you can use Amazon EC2 instance store NVMe statistics to troubleshoot various workload performance issues. As mentioned in the preceding section, you can also use the detailed statistics to view I/O latency histograms to observe the spread of I/O latency within the period. You can use the read/write operations and time spent statistics to calculate the average latency. The detailed statistics show the average latency at per-second granularity.

The next two example scenarios demonstrate key performance analysis using the statistics. In Scenario 1, we will use the EC2 Instance Local Storage Performance Exceeded (us) metric to check if I/O demands exceed instance storage capabilities, helping with instance right-sizing for sufficient I/O application performance. In Scenario 2, we will use IO-size specific histograms (using --details) to diagnose how large block writes affect subsequent read performance – an issue typically hidden by traditional monitoring tools’ aggregated metrics across all IO sizes.

Scenario 1: Identifying when applications exceed instance storage performance limits

Understanding whether your application’s I/O demands exceed your instance store volumes’ capabilities is important for performance troubleshooting. When applications generate I/O workloads that consistently attempt to exceed the IOPS and throughput limits of specific Amazon EC2 instance types, you’ll experience increased latency and degraded performance. The EC2 Instance Local Storage Performance Exceeded (us) metric helps identify these scenarios by showing the duration (in microseconds) when workloads exceeded supported instance performance. A non-zero value or increasing count between snapshots indicates your current instance size or type may not provide sufficient I/O performance for your application.

The following section shows how to identify if an application is sending more IOPS than the instance’s local storage can support.

The example scenario: An application on an i3en.xlarge instance shows elevated write latency of >1ms. You want to determine if the application’s workload is exceeding the instance’s NVMe volume supported performance.

    1. Select the Instance Storage NVMe device you want to analyze – Identify the instance you want to analyze for the application experiencing elevated latency.
    2. Identify the NVMe device – Use the following nvme-cli command, and identify the NVMe device associated with that instance storage.
      $ sudo nvme list

      Example scenario: We used the list and identified /dev/nvme1n1 as the NVMe device associated with the i3en.xlarge instance that is running the application which is currently seeing elevated write latency >1ms (while read latency is <50us as per normal conditions), so now we want to. analyze it.

    3. Collect statistics for the device at a single point in time or at desired intervals – Collect the detailed performance statistics using the nvme-cli command or use the sample script provided in previous section to capture statistics at the desired intervals, if needed.
      $ sudo nvme amzn stats /dev/nvme1n1

      Example scenario: We choose to collect the statistics only once after noticing elevated write latency of the application.

    4. Analyze the statistics to check if the application demands more than the supported performance of the instance storage – Confirm existence of overall I/O latency degradation by comparing two sets of read/write I/O latency histograms taken some time apart.Example scenario: The following output shows Read IO histogram of the NVMe local instance storage taken 40 seconds apart with no read IO latency issues (as normal read latency for this workload is < 50 us).

      Metric captured at time T:
      AWS EC2 storage performance histogram showing read latency distribution, peak at 16-32 microsecond bucket
      Metric captured at time T+40s:
      AWS EC2 storage performance data showing increased read latency concentration in 16-32 microsecond bucket
      The following output shows Write IO histogram taken 40 seconds apart. We can discern that many write IOs fall into the 1ms – 2ms latency range, which is not expected for this application.
      Metric captured at time T:
      AWS EC2 storage write performance data showing majority of operations between 1-2ms latency
      Metric captured at time T+40s:
      AWS EC2 storage performance metrics showing increased write operations clustered in 1-2ms latency range

    5. Analyze the EC2 Instance Local Storage Performance Exceeded (us) metric which shows total time (in microseconds) IOPS requests exceed volume limits. Ideally, the incremental count of this metric between two snapshot times should be minimal, as any value above 0 indicates that the workload demanded more IOPS than the volume could deliver.Example scenario: Comparing metrics 40 seconds apart shows that for more than 34 seconds, the application’s IOPS demands surpassed the IOPS supported by the local instance storage. This explains elevated write latency: excess IOPS above what the underlying storage can physically handle queue the operations, increasing wait times. This indicates that the i3en.xlarge instance chosen to run this application cannot meet the application’s performance requirements, suggesting either upgrading to a larger instance size or re-evaluating the instance type itself.
      Metric captured at time T:
      EC2 Instance Local Storage Performance exceeded output of nvme-cli for the described scenario at time T
      Metric captured at time T+40s:
      EC2 Instance Local Storage Performance exceeded output of nvme-cli for the described scenario at time T+40 with increased count of metric

It’s important to have the right instance size to avoid performance bottlenecks to your application. Refer to the Amazon EC2 instance documentation for more information on the different instances and their storage size.

Scenario 2: Identifying the block size causing elevated latency in your applications

Many storage performance issues arise from complex interactions between read and write operations with different I/O sizes, which traditional system-level monitoring tools like iostat or sar cannot effectively diagnose due to their aggregated metrics across all I/O sizes. EC2 instance store NVMe detailed performance statistics solves this by providing I/O-size specific latency histograms through the --details option in NVMe CLI. These histograms show latency data for different I/O size ranges: (0, 512 Byte], (512B, 4KiB], (4KiB, 8KiB], (8KiB, 32KiB], (32KiB, MAX], for a more precise correlation between application workload patterns and I/O size-specific latency metrics for targeted optimizations.

In this example scenario, your application performs small reads (typically <=4KiB, like metadata read) followed by large writes (>=32KiB) and shows unexpectedly high read latency. This common issue occurs when large writes impact subsequent read operations’ performance, creating a cascading effect on overall I/O performance.

    1. Gather read and write IO latency by size ranges – Use the NVMe CLI with the --details option to gather read and write IO latency by size ranges:
      $ sudo nvme amzn stats /dev/nvme1n1 --details

    2. Confirm existence of overall IO latency degradation – In the example scenario, examining overall IO latency, both read (left) and write (right) operations are showing higher than expected latency.
      NVMe storage read latency histogram highlighting concentrated IO operations in 4K-16K microsecond rangeNVMe storage write latency histogram highlighting concentrated IO operations in 8-32K microsecond range
    3. Examine the output for patterns across different IO size bands – Analyzing latency by operation sizes shows small read operations (512 bytes to 4K), typically fast, are experiencing unexpected latency spikes while large writes (32K+) show significant delays. Small reads should theoretically maintain good performance regardless of other I/O activities.
      NVMe storage read/write latency histogram highlighting concentrated IO operations in 8-16K microsecond range for IO band of 512 - 4KNVMe storage read/write latency histogram highlighting concentrated IO operations in 8-16K microsecond range in IO band 32K and above
      The observed pattern indicates that the backed-up large write operations create system-wide congestion, affecting all I/O operations of types and sizes. Despite the storage system’s capability to handle small reads efficiently, the queued large writes slow down both read and write operations at the application level.

Based on this analysis, we can implement several targeted optimizations to the application, like using smaller block sizes for write operations when possible, or batching smaller writes instead of performing large single writes.

Clean up

If you created an Amazon EC2 instance with NVMe volume for this exercise, then terminate and delete the appropriate instance to avoid future costs.

Conclusion

Amazon EC2 detailed performance statistics for instance store NVMe volumes provide real-time, sub-minute storage performance monitoring, similar to the detailed performance statistics available for Amazon EBS volumes. This offers consistent monitoring experience across both storage types, with additional IO-size based latency histograms for instance storage for better optimization of I/O patterns, and more effective troubleshooting.

To learn more about Amazon EC2 instance store NVMe volumes, optimization techniques for latency-sensitive workloads or other Amazon EC2 related topics, visit the Amazon EC2 documentation page or explore our other AWS Storage Blog posts on performance optimization.

We’d love to hear how you’re using these statistics to enhance your workloads, or if you have any questions, in the comments section below.

Streamlined multi-tenant application development with tenant isolation mode in AWS Lambda

Post Syndicated from Donnie Prakoso original https://aws.amazon.com/blogs/aws/streamlined-multi-tenant-application-development-with-tenant-isolation-mode-in-aws-lambda/

Multi-tenant applications often require strict isolation when processing tenant-specific code or data. Examples include software-as-a-service (SaaS) platforms for workflow automation or code execution where customers need to ensure that execution environments used for individual tenants or end users remain completely separate from one another. Traditionally, developers have addressed these requirements by deploying separate Lambda functions for each tenant or implementing custom isolation logic within shared functions which increased architectural and operational complexity.

Today, AWS Lambda introduces a new tenant isolation mode that extends the existing isolation capabilities in Lambda. Lambda already provides isolation at the function level, and this new mode extends isolation to the individual tenant or end-user level within a single function. This built-in capability processes function invocations in separate execution environments for each tenant, enabling you to meet strict isolation requirements without additional implementation effort to manage tenant-specific resources within function code.

Here’s how you can enable tenant isolation mode in the AWS Lambda console:

When using the new tenant isolation capability, Lambda associates function execution environments with customer-specified tenant identifiers. This means that execution environments for a particular tenant aren’t used to serve invocation requests from other tenants invoking the same Lambda function.

The feature addresses strict security requirements for SaaS providers processing sensitive data or running untrusted tenant code. You maintain the pay-per-use and performance characteristics of AWS Lambda while gaining execution environment isolation. Additionally, this approach delivers the security benefits of per-tenant infrastructure without the operational overhead of managing dedicated Lambda functions for individual tenants, which can quickly grow as customers adopt your application.

Getting started with AWS Lambda tenant isolation
Let me walk you through how to configure and use tenant isolation for a multi-tenant application.

First, on the Create function page in the AWS Lambda console, I choose Author from scratch option.

Then, under Additional configurations, I select Enable under Tenant isolation mode. Note that, tenant isolation mode can only be set during function creation and can’t be modified for existing Lambda functions.

Next, I write Python code to demonstrate this capability. I can access the tenant identifier in my function code through the context object. Here’s the full Python code:

import json
import os
from datetime import datetime

def lambda_handler(event, context):
    tenant_id = context.tenant_id
    file_path = '/tmp/tenant_data.json'

    # Read existing data or initialize
    if os.path.exists(file_path):
        with open(file_path, 'r') as f:
            data = json.load(f)
    else:
        data = {
            'tenant_id': tenant_id,
            'request_count': 0,
            'first_request': datetime.utcnow().isoformat(),
            'requests': []
        }

    # Increment counter and add request info
    data['request_count'] += 1
    data['requests'].append({
        'request_number': data['request_count'],
        'timestamp': datetime.utcnow().isoformat()
    })

    # Write updated data back to file
    with open(file_path, 'w') as f:
        json.dump(data, f, indent=2)

    # Return file contents to show isolation
    return {
        'statusCode': 200,
        'body': json.dumps({
            'message': f'File contents for {tenant_id} (isolated per tenant)',
            'file_data': data
        })
    }

When I’m finished, I choose Deploy. Now, I need to test this capability by choosing Test. I can see on the Create new test event panel that there’s a new setting called Tenant ID.

If I try to invoke this function without a tenant ID, I’ll get the following error “Add a valid tenant ID in your request and try again.”

Let me try to test this function with a tenant ID called tenant-A.

I can see the function ran successfully and returned request_count: 1. I’ll invoke this function again to get request_count: 2.

Now, let me try to test this function with a tenant ID called tenant-B.

The last invocation returned request_count: 1 because I never invoked this function with tenant-B. Each tenant’s invocations will use separate execution environments, isolating the cached data, global variables, and any files stored in /tmp.

This capability transforms how I approach multi-tenant serverless architecture. Instead of wrestling with complex isolation patterns or managing hundreds of tenant-specific Lambda functions, I let AWS Lambda automatically handle the isolation. This keeps tenant data isolated across tenants, giving me confidence in the security and separation of my multi-tenant application.

Additional things to know
Here’s a list of additional things you need to know:

  • Performance — Same-tenant invocations can still benefit from warm execution environment reuse for optimal performance.
  • Pricing — You’re charged when Lambda creates a new tenant-aware execution environment, with the price depending on the amount of memory you allocate to your function and the CPU architecture you use. For more details, view AWS Lambda pricing.
  • Availability — Available now in all commercial AWS Regions except Asia Pacific (New Zealand), AWS GovCloud (US), and China Regions.

This launch simplifies building multi-tenant applications on AWS Lambda, such as SaaS platforms for workflow automation or code execution. Learn more about how to configure tenant isolation for your next multi-tenant Lambda function in the AWS Lambda Developer Guide.

Happy building!
Donnie

Monitor network performance and traffic across your EKS clusters with Container Network Observability

Post Syndicated from Donnie Prakoso original https://aws.amazon.com/blogs/aws/monitor-network-performance-and-traffic-across-your-eks-clusters-with-container-network-observability/

Organizations are increasingly expanding their Kubernetes footprint by deploying microservices to incrementally innovate and deliver business value faster. This growth places increased reliance on the network, giving platform teams exponentially complex challenges in monitoring network performance and traffic patterns in EKS. As a result, organizations struggle to maintain operational efficiency as their container environments scale, often delaying application delivery and increasing operational costs.

Today, I’m excited to announce Container Network Observability in Amazon Elastic Kubernetes Service (Amazon EKS), a comprehensive set of network observability features in Amazon EKS that you can use to better measure your network performance in your system and dynamically visualize the landscape and behavior of network traffic in EKS.

Here’s a quick look at Container Network Observability in Amazon EKS:

Container Network Observability in EKS addresses observability challenges by providing enhanced visibility of workload traffic. It offers performance insights into network flows within the cluster and those with cluster-external destinations. This makes your EKS cluster network environment more observable while providing built-in capabilities for more precise troubleshooting and investigative efforts.

Getting started with Container Network Observability in EKS

I can enable this new feature for a new or existing EKS cluster. For a new EKS cluster, during the Configure observability setup, I navigate to the Configure network observability section. Here, I select Edit container network observability. I can see there are three included features: Service map, Flow table, and Performance metric endpoint, which are enabled by Amazon CloudWatch Network Flow Monitor.

On the next page, I need to install the AWS Network Flow Monitor Agent.

After it’s enabled, I can navigate to my EKS cluster and select Monitor cluster.

This will bring me to my cluster observability dashboard. Then, I select the Network tab.


Comprehensive observability features
Container Network Observability in EKS provides several key features, including performance metrics, service map, and flow table with three views: AWS service view, cluster view, and external view.

With Performance metrics, you can now scrape network-related system metrics for pods and worker nodes directly from the Network Flow Monitor agent and send them to your preferred monitoring destination. Available metrics include ingress/egress flow counts, packet counts, bytes transferred, and various allowance exceeded counters for bandwidth, packets per second, and connection tracking limits. The following screenshot shows an example of how you can use Amazon Managed Grafana to visualize the performance metrics scraped using Prometheus.


With the Service map feature, you can dynamically visualize intercommunication between workloads in your cluster, making it straightforward to understand your application topology with a quick look. The service map helps you quickly identify performance issues by highlighting key metrics such as retransmissions, retransmission timeouts, and data transferred for network flows between communicating pods.

Let me show you how this works with a sample e-commerce application. The service map provides both high-level and detailed views of your microservices architecture. In this e-commerce example, we can see three core microservices working together: the GraphQL service acts as an API gateway, orchestrating requests between the frontend and backend services.

When a customer browses products or places an order, the GraphQL service coordinates communication with both the products service (for catalog data, pricing, and inventory) and the orders service (for order processing and management). This architecture allows each service to scale independently while maintaining clear separation of concerns.

For deeper troubleshooting, you can expand the view to see individual pod instances and their communication patterns. The detailed view reveals the complexity of microservices communication. Here, you can see multiple pod instances for each service and the network of connections between them.

This granular visibility is crucial for identifying issues like uneven load distribution, pod-to-pod communication bottlenecks, or when specific pod instances are experiencing higher latency. For example, if one GraphQL pod is making disproportionately more calls to a particular products pod, you can quickly spot this pattern and investigate potential causes.

Use the Flow table to monitor the top talkers across Kubernetes workloads in your cluster from three different perspectives, each providing unique insights into your network traffic patterns.

Flow table – Monitor the top talkers across Kubernetes workloads in your cluster from three different perspectives, each providing unique insights into your network traffic patterns:

  • AWS service view shows which workloads generate the most traffic to Amazon Web Services (AWS) services such as Amazon DynamoDB and Amazon Simple Storage Service (Amazon S3), so you can optimize data access patterns and identify potential cost optimization opportunities.
  • The Cluster view reveals the heaviest communicators within your cluster (east-west traffic), which means you can spot chatty microservices that might benefit from optimization or colocation strategies
  • External viewidentifies workloads with the highest traffic to destinations outside AWS (internet or on premises), which is useful for security monitoring and bandwidth management.

The flow table provides detailed metrics and filtering capabilities to analyze network traffic patterns. In this example, we can see the flow table displaying cluster view traffic between our e-commerce services. The table shows that the orders pod is communicating with multiple products pods, transferring amounts of data. This pattern suggests the orders service is making frequent product lookups during order processing.

The filtering capabilities are useful for troubleshooting, for example, to focus on traffic from a specific orders pod. This granular filtering helps you quickly isolate communication patterns when investigating performance issues. For instance, if customers are experiencing slow checkout times, you can filter to see if the orders service is making too many calls to the products service, or if there are network bottlenecks between specific pod instances.

Additional things to know
Here are key points to note about Container Network Observability in EKS:

  • Pricing – For network monitoring, you pay standard Amazon CloudWatch Network Flow Monitor pricing.
  • Availability – Container Network Observability in EKS is available in all commercial AWS regions where Amazon CloudWatch Network Flow Monitor is available.
  • Export metrics to your preferred monitoring solution – Metrics are available in OpenMetrics format, compatible with Prometheus and Grafana. For configuration details, refer to Network Flow Monitor documentation.

Get started with Container Network Observability in Amazon EKS today to improve network observability in your cluster.

Happy building!
Donnie