Tag Archives: Engineering

mTLS: When certificate authentication is done wrong

Post Syndicated from Michael Stepankin original https://github.blog/2023-08-17-mtls-when-certificate-authentication-is-done-wrong/

Although X.509 certificates have been here for a while, they have become more popular for client authentication in zero-trust networks in recent years. Mutual TLS, or authentication based on X.509 certificates in general, brings advantages compared to passwords or tokens, but you get increased complexity in return.

In this post, I’ll deep dive into some interesting attacks on mTLS authentication. We won’t bother you with heavy crypto stuff, but instead we’ll have a look at implementation vulnerabilities and how developers can make their mTLS systems vulnerable to user impersonation, privilege escalation, and information leakages.

We will present some CVEs we found in popular open-source identity servers and ways to exploit them. Finally, we’ll explain how these vulnerabilities can be spotted in source code and how to fix them.

This blog post is based on work that I recently presented at Black Hat USA and DEF CON.

Introduction: What is mutual TLS?

Website certificates are a very widely recognized technology, even to people who don’t work in the tech industry, thanks to the padlock icon used by web browsers. Whenever we connect to Gmail or GitHub, our browser checks the certificate provided by the server to make sure it’s truly the service we want to talk to. Fewer people know that the same technology can be used to authenticate clients: the TLS protocol is also designed to be able to verify the client using public and private key cryptography.

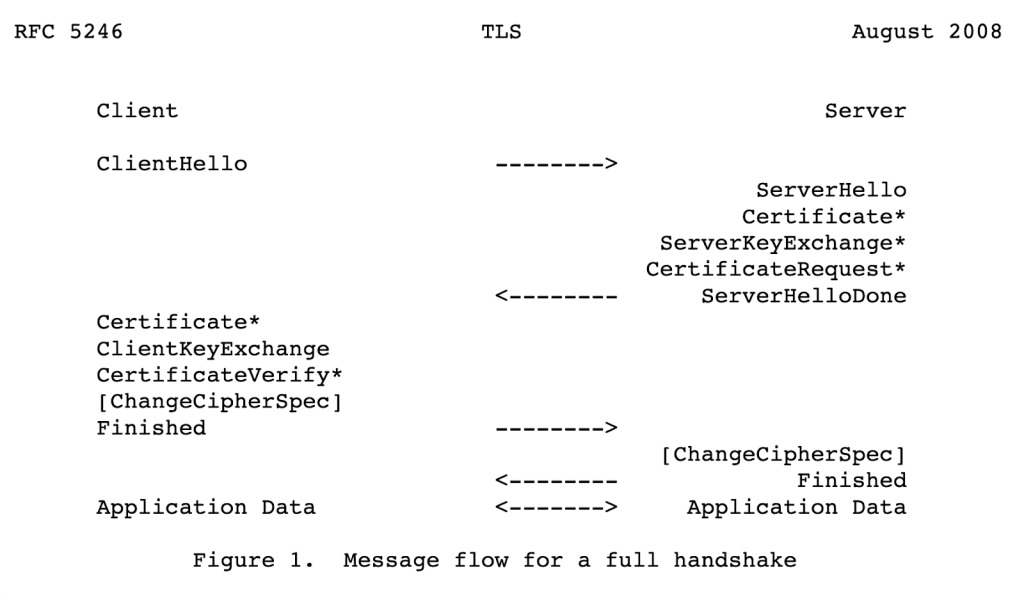
It happens on the handshake level, even before any application data is transmitted:

Excerpt from RFC 5246: "Figure 1. Message flow for a full handshake"

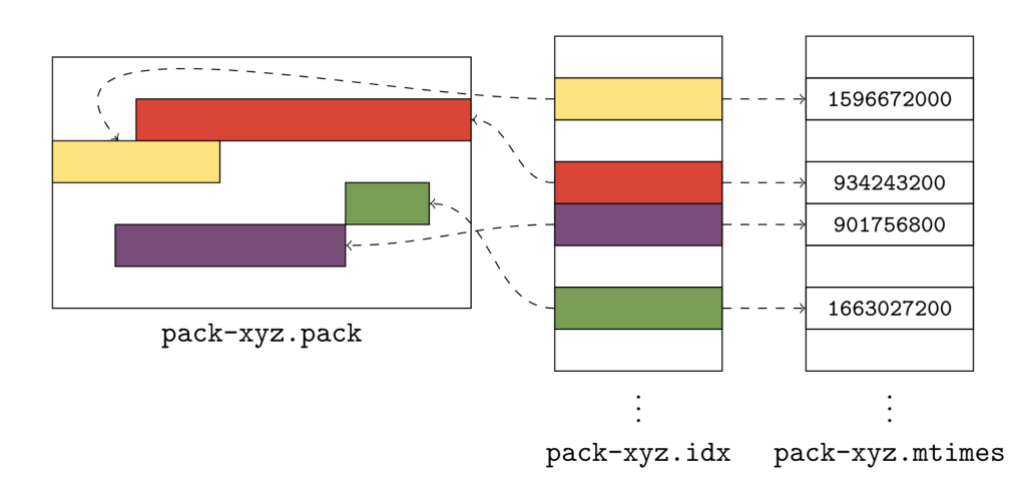
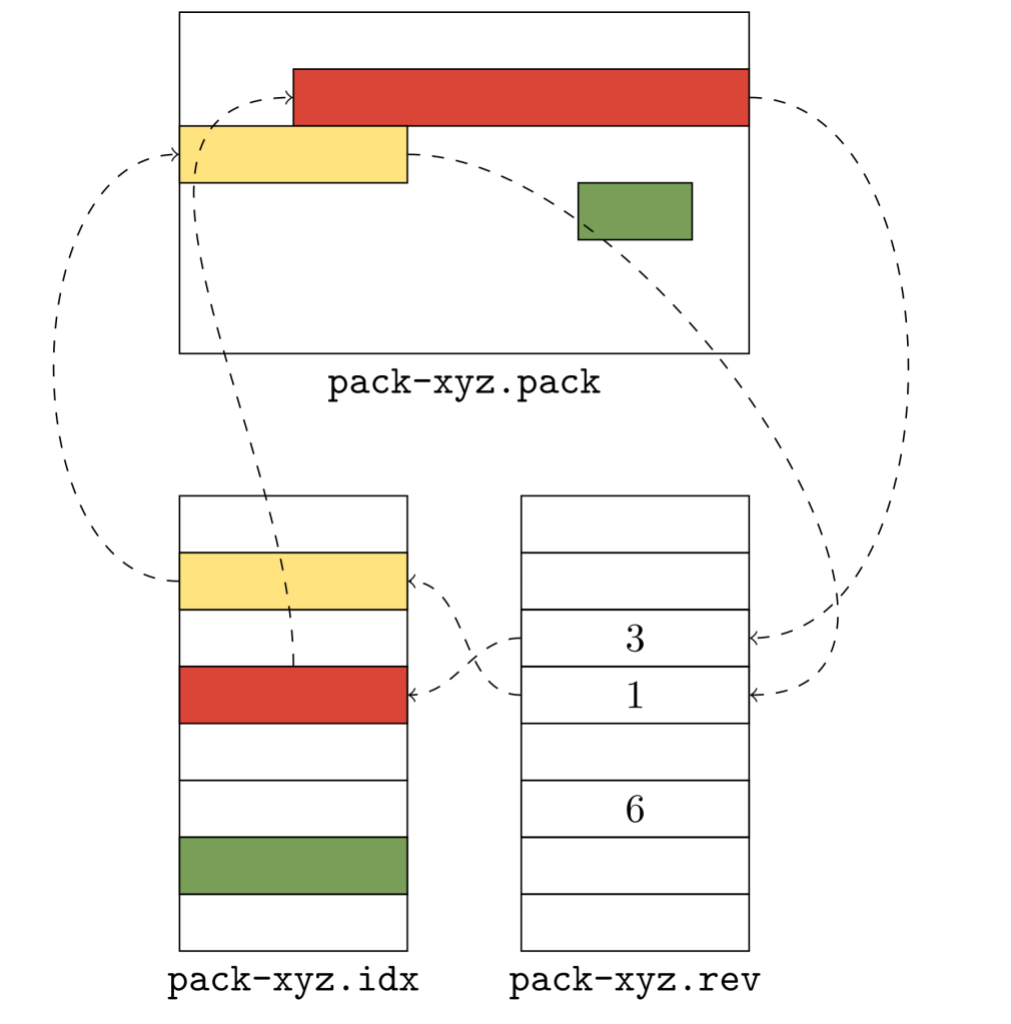
If configured to do so, a server can ask a client to provide a security certificate in the X.509 format. This certificate is just a blob of binary data that contain information about the client, such as its name, public key, issuer, and other fields:

$ openssl x509 -text -in client.crt
Certificate:
    Data:
        Version: 1 (0x0)
        Serial Number:
            d6:2a:25:e3:89:22:4d:1b
    Signature Algorithm: sha256WithRSAEncryption
        Issuer: CN=localhost            //used to locate issuers certificate
        Validity
            Not Before: Jun 13 14:34:28 2023 GMT
            Not After : Jul 13 14:34:28 2023 GMT
        Subject: CN=client          //aka "user name"
        Subject Public Key Info:
            Public Key Algorithm: rsaEncryption
                RSA Public-Key: (2048 bit)
                Modulus:
                    00:9c:7c:b4:e5:e9:3d:c1:70:9c:9d:18:2f:e8:a0:

The server checks that this certificate is signed by one of the trusted authorities. This is a bit similar to checking the signature of a JWT token. Next, the client sends a “Certificate verify” message encrypted with the private key, so that the server can verify that the client actually has the private key.

How certificates are validated

“Certificate validation” commonly refers to the PKIX certificate validation process defined in RFC 5280.

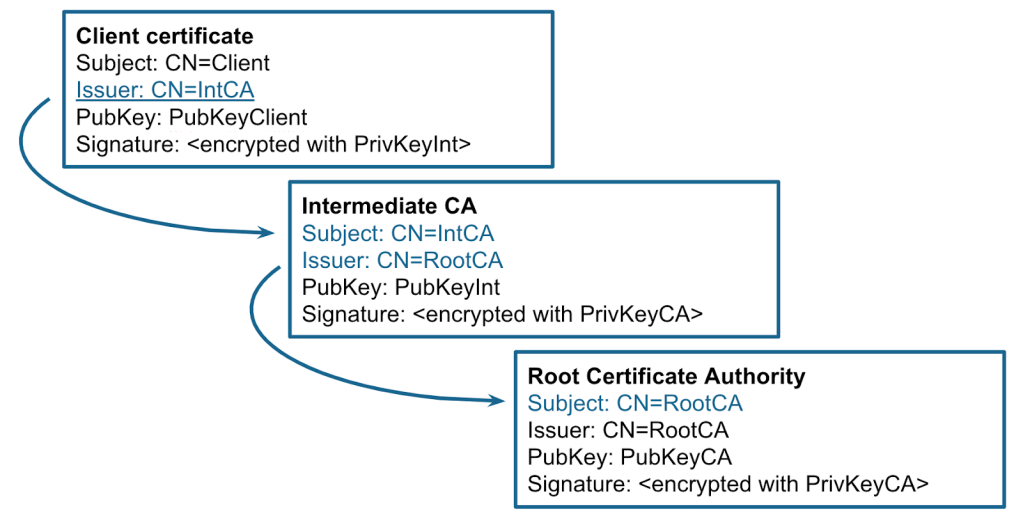
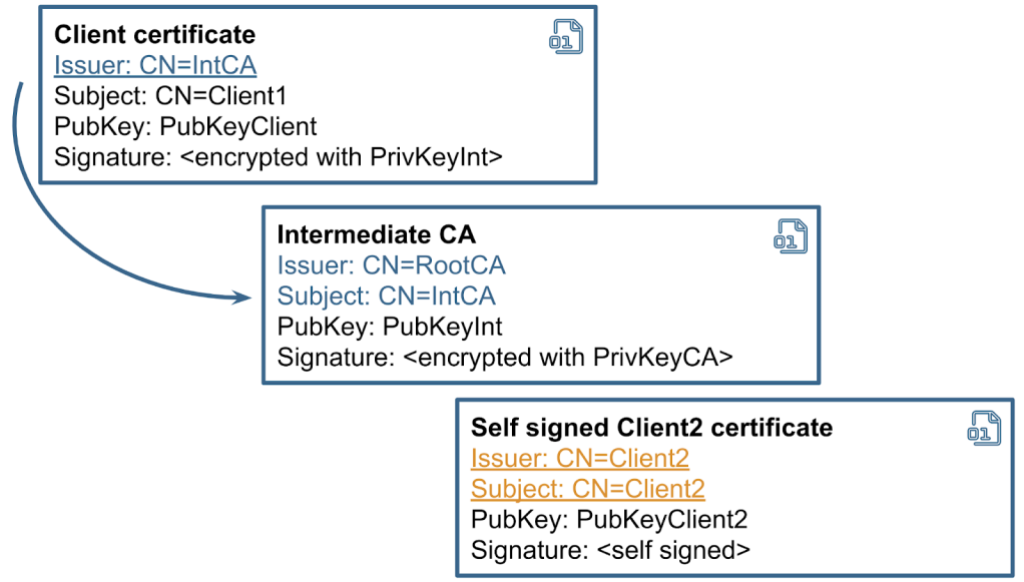
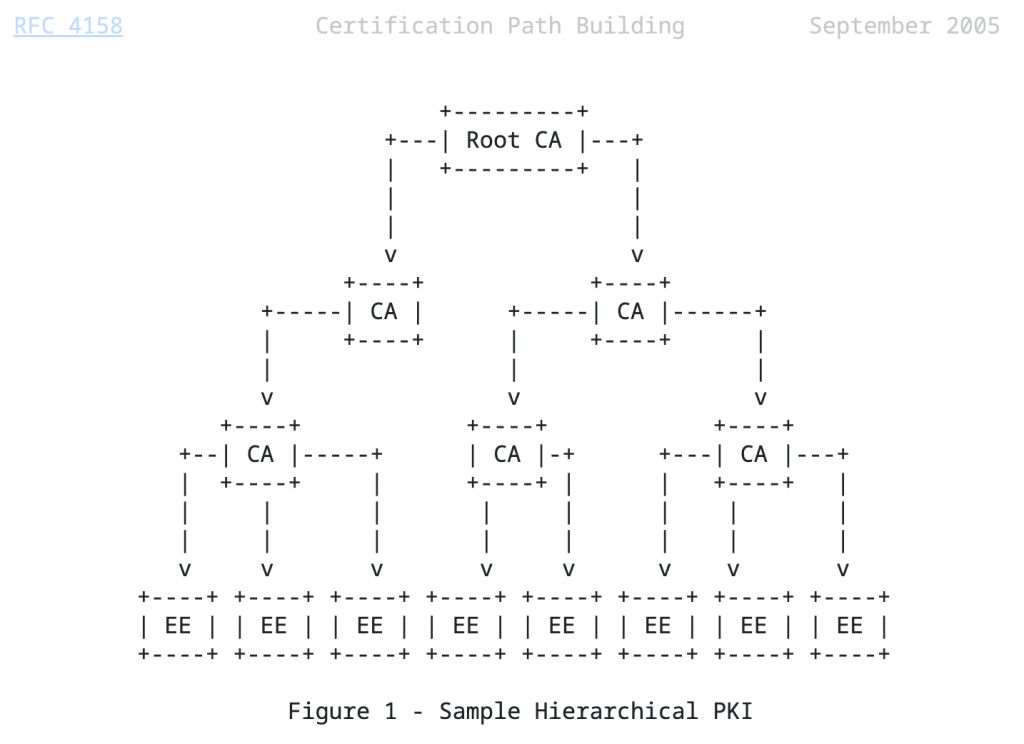
In short, in order to validate the certificate, the server constructs a certification path (also known as a certificate chain) from the target certificate to a trust anchor. The trust anchor is a self-signed root certificate that is inherently trusted by the validator. The end entity certificate is often signed by an intermediate CA, which is also signed by another intermediate certificate or directly by a trust anchor.

Diagram of certificate chain with three links: Client certificate, Intermediate CA, Root Certificate Authority

Then, for each certificate in the chain, the validator checks the signature, validity period, allowed algorithms and key lengths, key usage, and other properties. There are also a number of optional certificate extensions: if they are included in the certificate, they can be checked as well. This process is quite complicated, so every language or library implements it differently.

Note: in my research I mostly looked at how mTLS is implemented in applications written in Java, but it is likely that the ideas and attacks below apply to other languages as well.

mTLS in a Java web application, an example

Let’s see how to use mTLS in a Java web application. The bare minimum configuration is to enable it in the application settings and specify the location of all trusted root certificates, like this:

$ cat application.properties

…
server.ssl.client-auth=need
server.ssl.trust-store=/etc/spring/server-truststore.p12
server.ssl.trust-store-password=changeit

From the client, such as curl, you need to specify which certificate is sent to the server. The rest of the application code, such as request mappings, is exactly the same as for a normal web application.

$ curl -k -v –cert client.pem http://localhost/hello

This setup works for very simple mTLS configurations, when there is only a single root certificate, and all client certificates are signed by it. You can find this example in various articles on the web and it’s quite secure due to its simplicity. Let’s quickly break down its pros and cons.

Pros:

  • Speed: Authorization happens only during TLS handshake, all subsequent “keep-alive” HTTP requests are considered authenticated, saving CPU time.
  • Storage: Similar to JWT, the server does not store all client certificates, only the root certificate.

Cons:

  • No granular control: if mTLS is enabled, all requests have to be authenticated, even to /static/style.css.
  • Any certificate signed by a trusted CA can be used to access this HTTP service. Even if the certificate is issued for another purpose, it still can potentially be used for TLS authentication.
  • No host verification by default: client certificates can be accepted from any IP.
  • Certificate issuance process needs to be implemented separately.
  • Certificates expire, so need to be rotated frequently.

As you can see, this approach brings some advantages and disadvantages compared to traditional authentication methods, such as password or tokens.

Previous attacks

Before we dive into the attack section, I’ll briefly mention some previous well-known attacks on certificate parsing and validation:

  • Obviously, the security of the authentication system depends on the strength of the signature. If we can somehow forge the content of the certificate, but keep the same signature, we can completely break the authentication process.
  • Since the X.509 format is quite complex, just parsing these data structures can lead to buffer and heap overflows.
  • Lack of basic constraints checking. The end-entity certificates should not be used to sign additional certificates.

My approach

In Java, most of these attacks are already mitigated in APIs provided by the JDK. Weak algorithms are intentionally not allowed. Fuzzing of certificate parsing in Java also did not look productive to me, as the vast majority of PKIX code is implemented in memory-safe Java, instead of using native libraries. I had to take a different approach, so I decided to have a deep look at how mTLS is used from the source code perspective. Since the certificate validation process is quite complex, I suspected that someone might implement it in a weird way. After several weeks, it yielded me some interesting vulnerabilities in popular open source projects.

So, let’s move on to the attack’s section.

Chapter 1: Improper certificate extraction

In real-life applications, developers often need to access the certificate presented during the TLS handshake. For example, they might need it for authorization purposes, such as checking the current username. In Java, there are two common ways how to access it:

X509Certificate[] certificates = sslSession.getPeerCertificates();  

// another way
X509Certificate[] certificates = request.getAttribute("javax.servlet.request.X509Certificate");

Interestingly, this API returns an array of certificates presented by the client, not a single one. Why? Perhaps because TLS specification defines that clients may send a full chain of certificates, from end-entity to the root CA.

So, I decided to take a look at how different applications use this API. The most common approach I’ve seen is to take only the first certificate from the array and consider it as the client certificate. This is correct, as mTLS RFC explicitly says that the sender’s certificate MUST come first in the list.

//way 1 is good
String user = certificates[0].getSubjectX500Principal().getName();

At the same time, I discovered some rare cases when applications disregard this rule and iterate over the array trying to find a certificate that matches some criteria.

//way 2 is dangerous
for (X509Certificate cert : certificates) {
   if (isClientCertificate(cert)) {
      user = cert.getSubjectX500Principal().getName();
   }
}

This is dangerous, as the underlying TLS library in Java only verifies the first certificate in the list. Moreover, it does not require the chain to be sent in a strict order.

Example: CVE-2023-2422 improper certificate validation in KeyCloak

One of these examples was a vulnerability I discovered in Keycloak. Keycloak is a popular authorization server that supports OAuth, SAML, and other authorization methods, as well as mutual TLS.

Keycloak iterates over all certificates in the array, searching for the one that matches the client_id form parameter. As soon as it finds a matching certificate, it implicitly trusts it, assuming that its signature has already been checked during the TLS handshake:

X509Certificate[] certs = null;
ClientModel client = null;
try { 
    certs = provider.getCertificateChain(context.getHttpRequest());
    String client_id = null;
    ...
    if (formData != null) {
        client_id = formData.getFirst(OAuth2Constants.CLIENT_ID);
    }
    …
    matchedCertificate = Arrays.stream(certs)
        .map(certificate -> certificate.getSubjectDN().getName())
        .filter(subjectdn -> subjectDNPattern.matcher(subjectdn).matches())
        .findFirst();

In reality, a client can send as many certificates as they want, and the server only verifies the first one.

A potential attacker can exploit this behavior to authenticate under a different username. It is possible to send a list of certificates, where the first one contains one username and is properly chained to a root CA. But the last certificate in the array might be self signed and belong to a different user. The client does not even need to provide a valid private key for it.

Diagram of a certificate list in which the first client certificate is signed by a CA, but the second is self-signed.

Speaking about the exploitation, there are a number of endpoints in Keycloak that support mTLS authentication, but we need one that does not require any additional factors, such as tokens or secrets. “client-management/register-node” is a good example, as it mutates the user’s data. We can normally use this api with mTLS in the following way:

$ cat client1.crt client1.key > chain1.pem
$ curl --tlsv1.2 --tls-max 1.2 --cert chain1.pem -v -i -s -k "https://127.0.0.1:8443/realms/master/clients-managements/register-node?client_id=client1" -d "client_cluster_host=http://127.0.0.1:1213/"

To demonstrate the vulnerability, we generate a new self signed certificate using openssl and add it to the end of the array.

$ openssl req -newkey rsa:2048 -nodes -x509 -subj /CN=client2 -out client2-fake.crt
$ cat client1.crt client1.key client2-fake.crt client1.key > chain2.pem
$ curl --tlsv1.2 --tls-max 1.2 --cert chain2.pem -v -i -s -k "https://127.0.0.1:8443/realms/master/clients-managements/register-node?client_id=client2" -d "client_cluster_host=http://127.0.0.1:1213/"

When we send the second curl request, Keycloak performs this action on behalf of the user specified in client2-fake.crt, instead of client1.crt. Therefore, we can mutate data on the server for any client that supports mTLS.

How to fix that? Easy: just use the first certificate from the array. That’s exactly how Keycloak patched this vulnerability. This CVE is a good example of how developers provide methods and interfaces that can be misunderstood or used incorrectly.

Passing certificate as a header

Another common scenario for mTLS deployments is when the TLS connection is terminated on a reverse proxy. In this case, the reverse proxy often checks the certificate and forwards it to a backend server as an additional header. Here is a typical nginx configuration to enable mTLS:

$ cat nginx.conf

http {
    server {
        server_name example.com;
        listen 443 ssl;
        …
        ssl_client_certificate /etc/nginx/ca.pem;
        ssl_verify_client on;

        location / {
            proxy_pass http://host.internal:80;
            proxy_set_header ssl-client-cert $ssl_client_cert;
        }
    }

I’ve seen a number of systems like that, and in most cases the backend servers behind nginx do not perform additional validation, just trusting the reverse proxy. This behavior is not directly exploitable, but it’s not ideal either. Why? Well, first of all, it means that any server in the local network can make a request with this header, so this network segment needs to be carefully isolated from any traffic coming from outside. Additionally, if the backend or reverse proxy is affected by request smuggling or header injection, its exploitation becomes trivial. Over the past few years, we’ve seen a lot of request and header smuggling vulnerabilities, including the latest CVEs in Netty and Nodejs. Be careful when implementing these scenarios and check the certificate’s signature on all servers if possible.

Chapter 2: “Follow the chain, where does it lead you?”

Excerpt from RFC 4158: "Figure 1 - Sample Hierarchical PKI"

In large systems, servers may not store all root and intermediate certificates locally, but use external storage instead. RFC 4387 explains the concept of a certificate store: an interface you can use to lazily access certificates during chain validation. These stores are implemented over different protocols, such as HTTP, LDAP, FTP, or SQL queries.

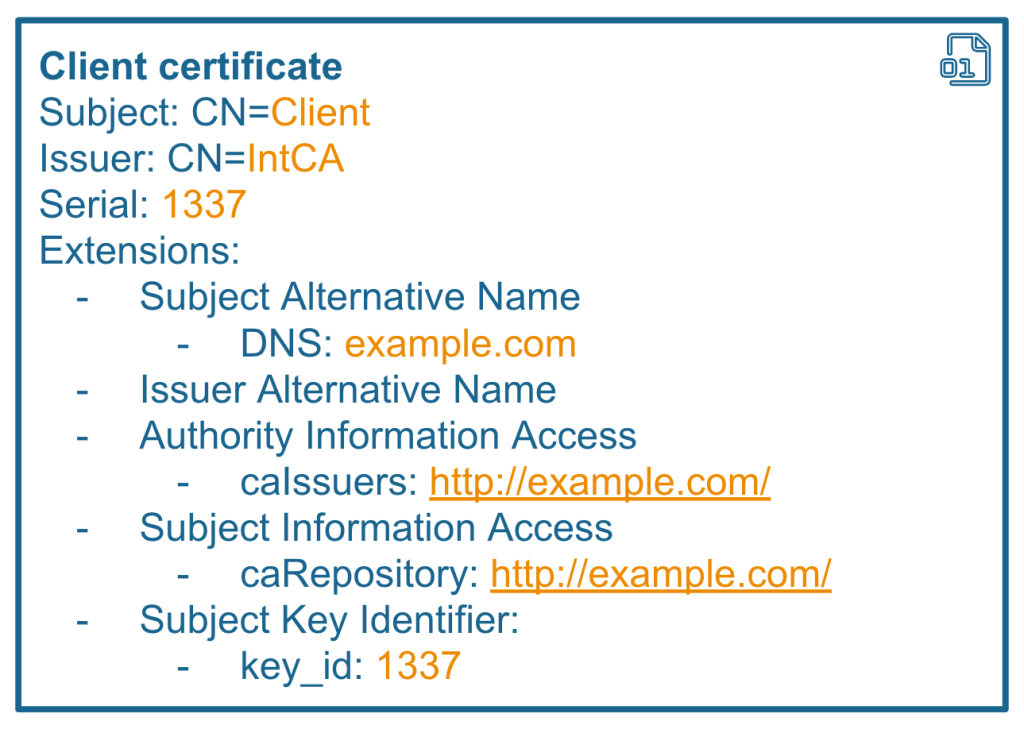
RFC 3280 defines some X.509 certificate extensions that can contain information about where to find the issuer and CA certificates. For instance, the Authority Information Access (AIA) extension contains a URL pointing to the Issuer’s certificate. If this extension is used for validation, there is a high chance that you can exploit it to perform an SSRF attack. Also, Subject, Issuer, Serial, and their alternative names can be used to construct SQL or LDAP queries, creating opportunities for injection attacks.

Client certificate with an AIA extension, containing a link to http://example.com

When certificate stores are in use, you should think of these values as “untrusted user input” or “Insertion points,” similar to those we have in Burp Suite’s Intruder. And what attackers will really love is that all of these values can be used in queries before the signature is checked.

Example: CVE-2023-33201 LDAP injection in Bouncy Castle

To demonstrate an example of this vulnerability, we’ll use LDAPCertStore from the Bouncy Castle library. Bouncy Castle is one of the most popular libraries for certificate validation in Java. Here is an example of how you can use this store to build and validate a certificate chain.

PKIXBuilderParameters pkixParams = new PKIXBuilderParameters(keystore, selector);

//setup additional LDAP store
X509LDAPCertStoreParameters CertStoreParameters = new X509LDAPCertStoreParameters.Builder("ldap://127.0.0.1:1389", "CN=certificates").build();
CertStore certStore = CertStore.getInstance("LDAP", CertStoreParameters, "BC");
pkixParams.addCertStore(certStore);

// Build and verify the certification chain
try {
   CertPathBuilder builder = CertPathBuilder.getInstance("PKIX", "BC");
   PKIXCertPathBuilderResult result =
           (PKIXCertPathBuilderResult) builder.build(pkixParams);

Under the hood, Bouncy Castle uses the Subject field from the certificate to build an LDAP query. The Subject field is inserted in the filter, without—you guessed it—any escaping.

Client certificate containing the text "Subject: CN=Client*)(userPassword=123"

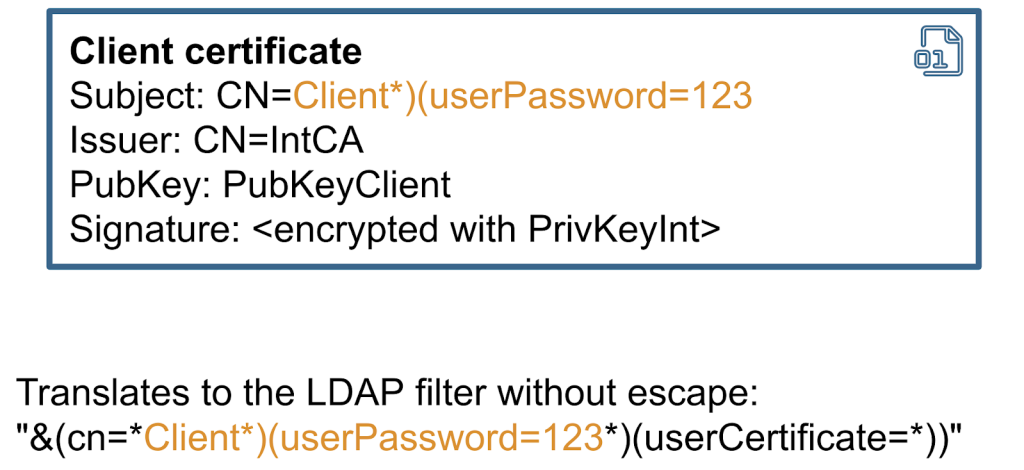
So, if the Subject contains any special characters, it can change the syntax of the query. In most cases, this can be exploited as a blind ldap query injection. Therefore, it might be possible to use this vulnerability to extract other fields from the LDAP directory. The exploitability depends on many factors, including whether the application exposes any errors or not, and it also depends on the structure of the LDAP directory.

In general, whenever you incorporate user-supplied data into an LDAP query, special characters should be properly filtered. That’s exactly how this CVE has been patched in the Bouncy Castle code.

Chapter 3: Certificate revocation and its unintended uses

Similar to Json web tokens, the beauty of certificate chains is that they can be trusted just based on their signature. But what happens if we need to revoke a certificate, so it can no longer be used?

The PKIX specification (RFC 4387) addresses this problem by proposing a special store for revoked certificates, accessible via HTTP or LDAP protocols. Many developers believe that revocation checking is absolutely necessary, whereas others urge to avoid it for performance reasons or only use offline revocation lists.

Generally speaking, the store location can be hardcoded into the application or taken from the certificate itself. There are two certificate extensions used for that: Authority Information Access OSCP URL and CRL Distribution points.

Client certificate containing URLs in its AIA OSCL and CRL Distribution points.

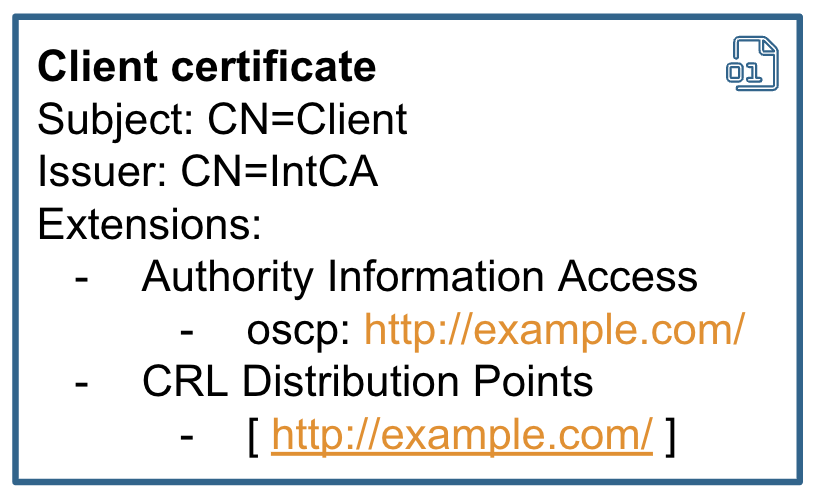
Looking at it from the hackers point of view, I think it’s incredible that the location of the revocation server can be taken from the certificate. So, if the application takes URLs relying on AIA or CRLDP extension to make a revocation check, it can be abused for SSRF attacks.

Sadly for attackers, this normally happens after the signature checks, but in some cases it’s still exploitable.

Moreover, LDAP is also supported, at least in Java. You probably heard that, in Java, unmarshaling an LDAP lookup response can lead to a remote code execution. A few years back, Moritz Bechler reported this problem and remote code execution via revocation has since been patched in the JDK. You can check out his blog post for more details.

In my research, I decided to check if the Bouncy Castle library is also affected. It turns out that Bouncy Castle can be configured to use the CRLDP extension and make calls to an LDAP server. At the same time, Bouncy Castle only fetches a specific attribute from the LDAP response and does not support references. So, remote code execution is not possible there. HTTP SSRF is still viable though.

private static Collection getCrlsFromLDAP(CertificateFactory certFact, URI distributionPoint) throws IOException, CRLException
{
    Map<String, String> env = new Hashtable<String, String>();

    env.put(Context.INITIAL_CONTEXT_FACTORY, "com.sun.jndi.ldap.LdapCtxFactory");
    env.put(Context.PROVIDER_URL, distributionPoint.toString());

    byte[] val = null;
    try
    {
        DirContext ctx = new InitialDirContext((Hashtable)env);
        Attributes avals = ctx.getAttributes("");
        Attribute aval = avals.get("certificateRevocationList;binary");
        val = (byte[])aval.get();
    }

Example: CVE-2023-28857 credentials leak in Apereo CAS

I also had a quick look at open source projects that support mTLS and perform revocation checking. One of these projects was Apereo CAS. It’s another popular authentication server that is highly configurable. Administrators of Apereo CAS can enable the revocation check using an external LDAP server by specifying its address and password in the settings:

cas.authn.x509.crl-fetcher=ldap
cas.authn.x509.ldap.ldap-url=ldap://example.com:1389/
cas.authn.x509.ldap.bind-dn=admin
cas.authn.x509.ldap.bind-credential=s3cr3taaaaa

If these settings are applied, Apereo CAS performs the revocation check for the certificate, fetching the address from the certificate’s CRLDP extension.

/**
* Validate the X509Certificate received.
*
* @param cert the cert
* @throws GeneralSecurityException the general security exception
*/
private void validate(final X509Certificate cert) throws GeneralSecurityException {
   cert.checkValidity();
   this.revocationChecker.check(cert);

   val pathLength = cert.getBasicConstraints();
   if (pathLength < 0) {
       if (!isCertificateAllowed(cert)) {
           val msg = "Certificate subject does not match pattern " + this.regExSubjectDnPattern.pattern();
           LOGGER.error(msg);

I was afraid that this could lead to remote code execution, but it turns out that Apereo CAS uses a custom library for LDAP connection, which does not support external codebases or object factories needed for RCE.

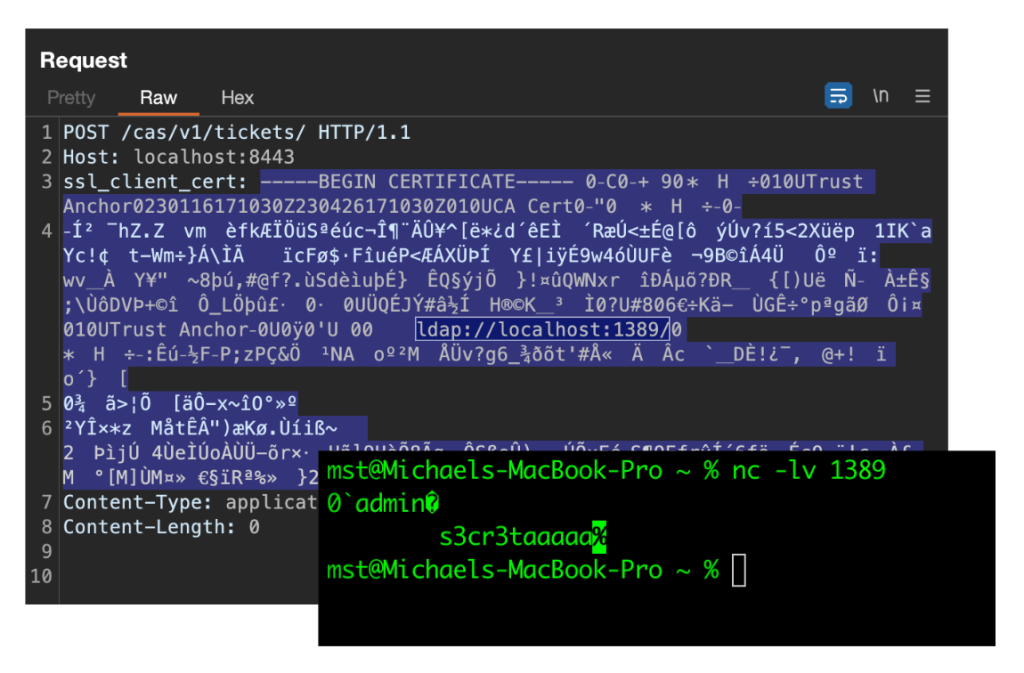
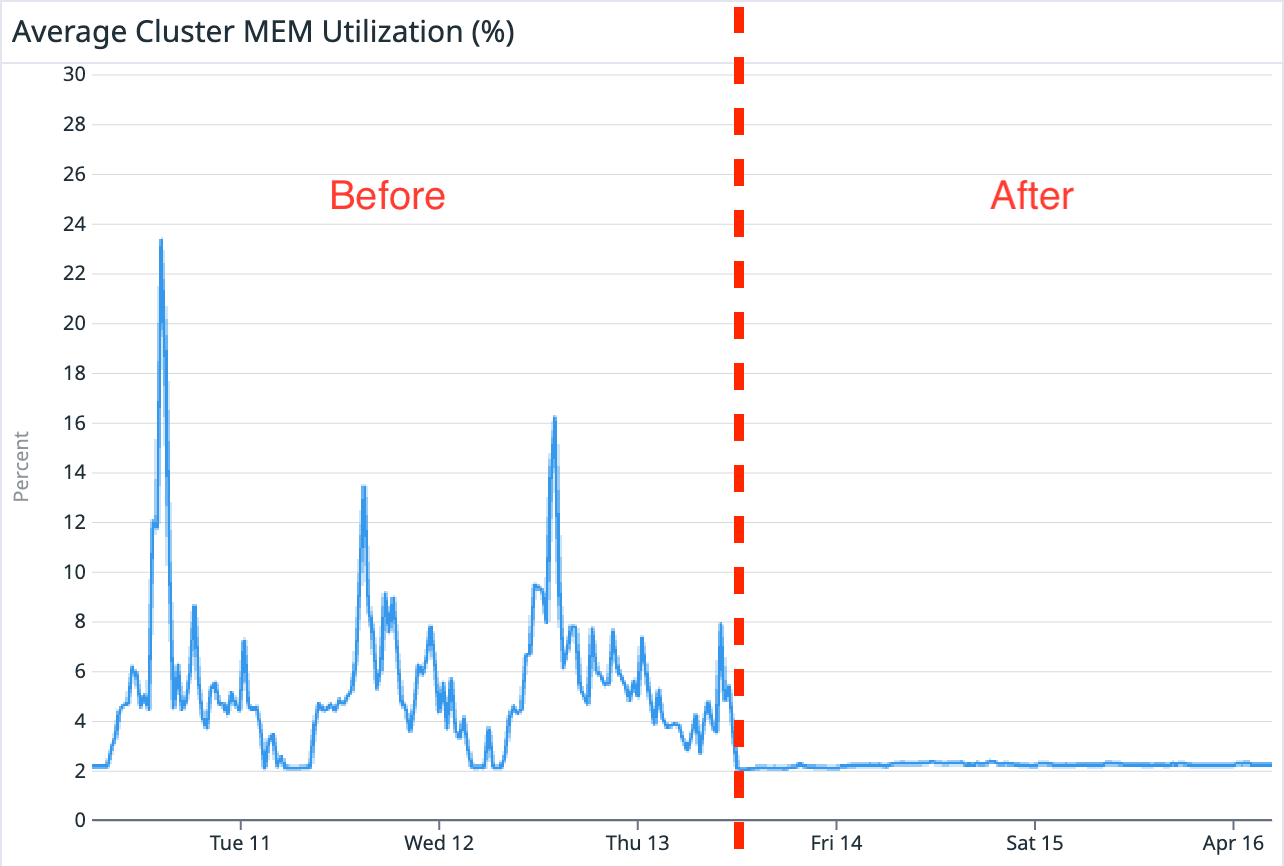
When I tested this in Apereo CAS, I noticed one interesting behavior. The server prefers the LDAP URL located inside the certificate, instead of the one that is configured in settings. At the same time, Apereo CAS still sends the password from the settings. I quickly set up a testing environment and sent a self-signed certificate in the header. My self-signed certificate had a CRLDP extension with the LDAP URL pointing to a netcat listener. After sending this request to Apereo CAS, I received a request to my netcat listener with the username and password leaked.

Pair of screenshots: the first contains a POST request to Apereo CAS and the second is a terminal running netcat.

After reporting this vulnerability, the application developers issued a fix within just one day. They patched it by clearing the login and password used for LDAP connection if the URL is taken from the CRLDP. Therefore, the password leak is no longer possible. Nevertheless, I would say that using URLs from the CRLDP extension is still dangerous, as it broadens the attack surface.

Summary

If you’re developing an mTLS system or performing a security assessment, I suggest:

  1. Pay attention when extracting usernames from the mTLS chain, as the servers only verify the first certificate in the chain.
  2. Use Certificate Stores with caution, as it can lead to LDAP and SQL injections.
  3. Certificate revocation can lead to SSRF or even to RCE in the worst case. So, do the revocation check only after all other checks and do not rely on URLs taken from the certificate extensions.

The post mTLS: When certificate authentication is done wrong appeared first on The GitHub Blog.

Streamlining Grab’s Segmentation Platform with faster creation and lower latency

Post Syndicated from Grab Tech original https://engineering.grab.com/streamlining-grabs-segmentation-platform

Launched in 2019, Segmentation Platform has been Grab’s one-stop platform for user segmentation and audience creation across all business verticals. User segmentation is the process of dividing passengers, driver-partners, or merchant-partners (users) into sub-groups (segments) based on certain attributes. Segmentation Platform empowers Grab’s teams to create segments using attributes available within our data ecosystem and provides APIs for downstream teams to retrieve them.

Checking whether a user belongs to a segment (Membership Check) influences many critical flows on the Grab app:

  1. When a passenger launches the Grab app, our in-house experimentation platform will tailor the app experience based on the segments the passenger belongs to.
  2. When a driver-partner goes online on the Grab app, the Drivers service calls Segmentation Platform to ensure that the driver-partner is not blacklisted.
  3. When launching marketing campaigns, Grab’s communications platform relies on Segmentation Platform to determine which passengers, driver-partners, or merchant-partners to send communication to.

This article peeks into the current design of Segmentation Platform and how the team optimised the way segments are stored to reduce read latency thus unlocking new segmentation use cases.

Architecture

Segmentation Platform comprises two major subsystems:

  1. Segment creation
  2. Segment serving
Fig 1. Segmentation Platform architecture

Segment creation

Segment creation is powered by Spark jobs. When a Grab team creates a segment, a Spark job is started to retrieve data from our data lake. After the data is retrieved, cleaned, and validated, the Spark job calls the serving sub-system to populate the segment with users.

Segment serving

Segment serving is powered by a set of Go services. For persistence and serving, we use ScyllaDB as our primary storage layer. We chose to use ScyllaDB as our NoSQL store due to its ability to scale horizontally and meet our <80ms p99 SLA. Users in a segment are stored as rows indexed by the user ID. The table is partitioned by the user ID ensuring that segment data is evenly distributed across the ScyllaDB clusters.

User ID Segment Name Other metadata columns
1221 Segment_A
3421 Segment_A
5632 Segment_B
7889 Segment_B

With this design, Segmentation Platform handles up to 12K read and 36K write QPS, with a p99 latency of 40ms.

Problems

The existing system has supported Grab, empowering internal teams to create rich and personalised experiences. However, with the increased adoption and use, certain challenges began to emerge:

  1. As more and larger segments are being created, the write QPS became a bottleneck leading to longer wait times for segment creation.
  2. Grab services requested even lower latency for membership checks.

Long segment creation times

As more segments were created by different teams within Grab, the write QPS was no longer able to keep up with the teams’ demands. Teams would have to wait for hours for their segments to be created, reducing their operational velocity.

Read latency

Further, while the platform already offers sub-40ms p99 latency for reads, this was still too slow for certain services and their use cases. For example, Grab’s communications platform needed to check whether a user belongs to a set of segments before sending out communication and incurring increased latency for every communication request was not acceptable. Another use case was for Experimentation Platform, where checks must have low latency to not impact the user experience.
Thus, the team explored alternative ways of storing the segment data with the goals of:

  1. Reducing segment creation time
  2. Reducing segment read latency
  3. Maintaining or reducing cost

Solution

Segments as bitmaps

One of the main engineering challenges was scaling the write throughput of the system to keep pace with the number of segments being created. As a segment is stored across multiple rows in ScyllaDB, creating a large segment incurs a huge number of writes to the database. What we needed was a better way to store a large set of user IDs. Since user IDs are represented as integers in our system, a natural solution to storing a set of integers was a bitmap.

For example, a segment containing the following user IDs: 1, 6, 25, 26, 89 could be represented with a bitmap as follows:

Fig 2. Bitmap representation of a segment

To perform a membership check, a bitwise operation can be used to check if the bit at the user ID’s index is 0 or 1. As a bitmap, the segment can also be stored as a single Blob in object storage instead of inside ScyllaDB.

However, as the number of user IDs in the system is large, a small and sparse segment would lead to prohibitively large bitmaps. For example, if a segment contains 2 user IDs 100 and 200,000,000, it will require a bitmap containing 200 million bits (25MB) where all but 2 of the bits are just 0. Thus, the team needed an encoding to handle sparse segments more efficiently.

Roaring Bitmaps

After some research, we landed on Roaring Bitmaps, which are compressed uint32 bitmaps. With roaring bitmaps, we are able to store a segment with 1 million members in a Blob smaller than 1 megabyte, compared to 4 megabytes required by a naive encoding.

Roaring Bitmaps achieve good compression ratios by splitting the set into fixed-size (216) integer chunks and using three different data structures (containers) based on the data distribution within the chunk. The most significant 16 bits of the integer are used as the index of the chunk, and the least significant 16 bits are stored in the containers.

Array containers

Array containers are used when data is sparse (<= 4096 values). An array container is a sorted array of 16-bit integers. It is memory-efficient for sparse data and provides logarithmic-time access.

Bitmap containers

Bitmap containers are used when data is dense. A bitmap container is a 216 bit container where each bit represents the presence or absence of a value. It is memory-efficient for dense data and provides constant-time access.

Run containers

Finally, run containers are used when a chunk has long consecutive values. Run containers use run-length encoding (RLE) to reduce the storage required for dense bitmaps. Run containers store a pair of values representing the start and the length of the run. It provides good memory efficiency and fast lookups.

The diagram below shows how a dense bitmap container that would have required 91 bits can be compressed into a run container by storing only the start (0) and the length (90). It should be noted that run containers are used only if it reduces the number of bytes required compared to a bitmap.

Fig 3. A dense bitmap container compressed into a run container

By using different containers, Roaring Bitmaps are able to achieve good compression across various data distributions, while maintaining excellent lookup performance. Additionally, as segments are represented as Roaring Bitmaps, service teams are able to perform set operations (union, interaction, and difference, etc) on the segments on the fly, which previously required re-materialising the combined segment into the database.

Caching with an SDK

Even though the segments are now compressed, retrieving a segment from the Blob store for each membership check would incur an unacceptable latency penalty. To mitigate the overhead of retrieving a segment, we developed an SDK that handles the retrieval and caching of segments.

Fig 4. How the SDK caches segments

The SDK takes care of the retrieval, decoding, caching, and watching of segments. Users of the SDK are only required to specify the maximum size of the cache to prevent exhausting the service’s memory. The SDK provides a cache with a least-recently-used eviction policy to ensure that hot segments are kept in the cache. They are also able to watch for updates on a segment and the SDK will automatically refresh the cached segment when it is updated.

Hero teams

Communications Platform

Communications Platform has adopted the SDK to implement a new feature to control the communication frequency based on which segments a user belongs to. Using the SDK, the team is able to perform membership checks on multiple multi-million member segments, achieving peak QPS 15K/s with a p99 latency of <1ms. With the new feature, they have been able to increase communication engagement and reduce the communication unsubscribe rate.

Experimentation Platform

Experimentation Platform powers experimentation across all Grab services. Segments are used heavily in experiments to determine a user’s experience. Prior to using the SDK, Experimentation Platform limited the maximum size of the segments that could be used to prevent exhausting a service’s memory.

After migrating to the new SDK, they were able to lift this restriction due to the compression efficiency of Roaring Bitmaps. Users are now able to use any segments as part of their experiment without worrying that it would require too much memory.

Closing

This blog post discussed the challenges that Segmentation Platform faced when scaling and how the team explored alternative storage and encoding techniques to improve segment creation time, while also achieving low latency reads. The SDK allows our teams to easily make use of segments without having to handle the details of caching, eviction, and updating of segments.

Moving forward, there are still existing use cases that are not able to use the Roaring Bitmap segments and thus continue to rely on segments from ScyllaDB. Therefore, the team is also taking steps to optimise and improve the scalability of our service and database.

Special thanks to Axel, the wider Segmentation Platform team, and Data Technology team for reviewing the post.

Join us

Grab is the leading superapp platform in Southeast Asia, providing everyday services that matter to consumers. More than just a ride-hailing and food delivery app, Grab offers a wide range of on-demand services in the region, including mobility, food, package and grocery delivery services, mobile payments, and financial services across 428 cities in eight countries.

Powered by technology and driven by heart, our mission is to drive Southeast Asia forward by creating economic empowerment for everyone. If this mission speaks to you, join our team today!

GitHub Availability Report: July 2023

Post Syndicated from Jakub Oleksy original https://github.blog/2023-08-09-github-availability-report-july-2023/

In July, we experienced one incident that resulted in degraded performance across GitHub services.

July 21 13:07 UTC (lasting 59 minutes)

On July 21 at 13:07 UTC, GitHub experienced a partial power outage in one of our redundant data centers, which resulted in a loss of compute capacity. GitHub updated the status of six services to yellow at 13:12 UTC. The vast majority of customer impact occurred in the first 10 minutes up to 13:17 UTC as requests were internally rerouted to other nodes in the data center, but we elected to keep status at yellow until full capacity was restored out of an abundance of caution. As a result of this incident, we are conducting reviews of all power feeds with each of our datacenter partners. We have also identified improvements to reduce recovery time after power was restored and are evaluating ways to reduce the time to fail over all traffic.


Please follow our status page for real-time updates on status changes. To learn more about what we’re working on, check out the GitHub Engineering Blog.

The post GitHub Availability Report: July 2023 appeared first on The GitHub Blog.

Introducing code referencing for GitHub Copilot

Post Syndicated from Ryan J. Salva original https://github.blog/2023-08-03-introducing-code-referencing-for-github-copilot/

Make more informed decisions about the code you use. In the rare case where a GitHub Copilot suggestion matches public code, this update will show a list of repositories where that code appears and their licenses. Sign up for the private beta today.

Over the course of the last year, GitHub Copilot, the world’s first at-scale AI pair programmer trained on billions of lines of public code, has attracted more than 1 million developers and helped over 27,000 organizations build faster and more productively. During that time, many developers told us they want to see when GitHub Copilot’s suggestions match public code.

Today, we’re announcing a private beta of GitHub Copilot with code referencing that includes an updated filter which detects and shows context of code suggestions matching public code on GitHub. When the filter is enabled, GitHub Copilot checks code suggestions with surrounding code of about 150 characters and compares it against an index of all the public code on GitHub.com. Matches—along with information about every repository in which they appear—are displayed right in the editor. Developers can now choose whether to block suggestions containing matching code, or allow those suggestions with information about matches.

Why? Some want to learn from others’ work, others may want to take a dependency rather than introduce new app logic, and still others want to give or receive credit for similar work. Whatever the reason, it’s nice to know when similar code is out there.

Let’s see how it works.

How GitHub Copilot code referencing works

With billions of files to index and a latency budget of only 10-20ms, it’s a miracle of engineering that this is even possible. Still, if there’s a match, a notification appears in the editor showing: (1) the matching code, (2) the repositories where that code appears, and (3) the license governing each repository.

Why code referencing matters

In our journey to create a code referencing tool, we discovered a few interesting things:

First, our previous research suggests that matches occur in less than one percent of GitHub Copilot suggestions. But that one percent isn’t evenly distributed across all use cases. In the context of an existing application with surrounding code, we almost never see a match. But in an empty or nearly empty file, we see matches far more often.

Suggestions are heavily biased toward the prompt so GitHub Copilot can provide suggestions tailor-made for your current task. That means, in an existing app with lots of context, you’ll get a suggestion customized for your code. But in an empty, or nearly empty file, there’s little to no context. So, you’re more likely to get a suggestion that matches public code.

We’ve also found that when suggestions match public code, those matches frequently appear in dozens, if not hundreds of repositories. In some ways, this isn’t surprising because the models that power GitHub Copilot are akin to giant probability machines. A code fragment that appears in many repositories is more likely to be a “pattern” detected by the model—similar to the patterns we see elsewhere in public code.

For example, research on Java projects finds that up to 11% of repositories may contain code that resembles solutions posted to Stack Overflow, and the vast majority of those snippets appear without attribution. Another study on Python found that many matches are too generic to trace to an original usage. A smaller-scale study found that Stack Overflow answers contain code from Android applications.

Finally, the repositories with matching code are often governed by multiple, sometimes conflicting licenses, which makes attributing a match to its source more challenging. By consulting a list of references, developers can now:

  • Determine whether, what, and who to attribute rather than having matches simply blocked from the outset.
  • Learn from other developers by studying their approaches to similar problems.
  • Take a dependency on an open source library to avoid new business logic.
  • Evaluate the context of code before accepting a matching suggestion.
  • Discover new projects and contribute upstream.

Building a better developer experience and community

This is just the beginning. As GitHub continues to innovate, we will always strive to help developers stay in the flow, build creatively, and maintain a transparent connection to the community. We’re excited for you to try GitHub Copilot with code referencing.

Happy coding.

How we build containerized services at GitHub using GitHub

Post Syndicated from MV Karan original https://github.blog/2023-08-02-how-we-build-containerized-services-at-github-using-github/

The developer experience engineering team at GitHub works on creating safe, delightful, and inclusive solutions for GitHub engineers to efficiently code, ship, and operate software–setting an example for the world on how to build software with GitHub. To achieve this we provide our developers with a paved path–a comprehensive suite of automated tools and applications to streamline our runtime platforms, deployment, and hosting that helps power some of the microservices on the GitHub.com platform and many internal tools. Let’s take a deeper look at how one of our main paved paths works.

Our development ecosystem

GitHub’s main paved path covers everything that’s needed for running software–creating, deploying, scaling, debugging, and running applications. It is an ecosystem of tools like Kubernetes, Docker, load balancers, and many custom apps that work together to create a cohesive experience for our engineers. It isn’t just infrastructure and isn’t just Kubernetes. Kubernetes is our base layer, and the paved path is a mix of conventions, tools, and settings built on top of it.

The kind of services that we typically run using the paved path include web apps, computation pipelines, batch processors, and monitoring systems.

Kubernetes, which is the base layer of the paved path, runs in a multi-cluster, multi-region topology.

Benefits of the paved path

There are hundreds of services at GitHub–from a small internal tool to an external API supporting production workloads. For a variety of reasons, it would be inefficient to spin up virtual machines for each service.

  • Planning and capacity usage across all services wouldn’t be efficient. We would encounter significant overhead in managing both physical and Kubernetes infrastructure on an ongoing basis.
  • Teams would need to build deep expertise in managing their own Kubernetes clusters and would have less time to focus on their application’s unique needs.
  • We would have less central visibility of applications.
  • Security and compliance would be difficult to standardize and enforce.

With the paved path based on Kubernetes and other runtime apps, we’re instead able to:

  • Plan capacity centrally and only for the Kubernetes nodes, so we can optimally use capacity across nodes, as small workloads and large workloads coexist on the same machines.
  • Scale rapidly thanks to central capacity planning.
  • Easily manage configuration and deployments across services in one central control plane.
  • Consistently provide insights into app and deployment performance for individual services.

Onboarding a service

Onboarding a service with the code living in its own repository has been made easy with our ChatOps command service, called Hubot, and GitHub Apps. Service owners can easily generate some basic scaffolding needed to deploy the service by running a command like:

hubot gh-platform app scaffold monalisa-app

A custom GitHub App installed on the service’s GitHub repository will then automatically generate a pull request to add the necessary configurations, which includes:

  • A deployment.yaml file that defines the service’s deployment environments.
  • Kubernetes manifests that define Deployment and Service objects for deploying the service.
  • A Debian Dockerfile that runs a trivial web server to start off with, which will be used by the Kubernetes manifests.
  • Setting up CI builds as GitHub Checks that build the Docker images on every push, and store in a container registry ready for deployment.

Each service that is onboarded to the paved path has its unique Kubernetes namespace that is defined by <app-name>-<environment> and generally has a staging and production environment. This helps separate the workloads of multiple services, and also multiple environments for the same service since each environment gets its own Kubernetes namespace.

Deploying a service

At GitHub, we deploy branches and perform deployments through Hubot ChatOps commands. To deploy a branch named bug-fixes in the monalisa-app repository to the staging environment, a developer would run a ChatOps command like:

hubot deploy monalisa-app/bug-fixes to staging

This triggers a deployment that fetches the Docker image associated with the latest commit in the bug-fixes branch, updates the Kubernetes manifests, and applies those manifests to the clusters in the runtime platform relevant to that environment.

Typically, the Docker image would be deployed to multiple Kubernetes clusters across multiple geographical sites in a region that forms a part of the runtime platform.

To automate pull request merges into the busiest branches and orchestrate the rollout across environments we’re also using merge queue and deployment pipelines, which our engineers can observe and interact with during their deployment.

Securing our services

For any company, the security of the platform itself, along with services running within it, is critical. In addition to our engineering-wide practices, such as requiring two-person reviews on every pull request, we also have Security and Platform teams automating security measures, such as:

  • Pre-built Docker images to be used as base images for the Dockerfiles. These base images contain only the necessary packages/dependencies with security updates, a set of installed software that is auditable and curated according to shared needs.
  • Build-time and periodic scanning of all packages and running container images, for any vulnerabilities or dependencies needing a patch, powered by our own products for software supply chain security like Dependabot.
  • Build time and periodic scanning of GitHub repositories of services for exposed secrets and vulnerabilities, using GitHub’s native security features for advanced security like code scanning and secret scanning.
  • Multiple authentication and authorization mechanisms that allow only the relevant individuals to directly access underlying Kubernetes resources.
  • Comprehensive telemetry for threat detection.
  • Services running in the platform are by default accessible only within GitHub’s internal networks and not exposed on the public internet.
  • Branch protection policies are enforced on all production repositories. These policies prevent merging a pull request until designated automated tests pass and the change has been reviewed by a different developer from the one who proposed the change.

Another key aspect of security for an application is how secrets like keys and tokens are managed. At GitHub, we use a centralized secret store to manage secrets. Each service and each environment within the service has its own vault to store secrets. These secrets are then injected into the relevant pods in Kubernetes, which are then exposed to the containers.

The deployment flow, from merge to rollout

The whole deployment process would look something like this:

  1. A GitHub engineer merges a pull request to a branch in a repository. In the above example, it is the bug-fixes branch in the monalisa-app repository. This repository would also contain the Kubernetes manifest template files for deploying the application.
  2. The pull request merge triggers relevant CI workflows. One of them is a build of the Docker image, which builds the container image based on the Dockerfile specified in the repository, and pushes the image to an internal artifact registry.
  3. Once all the CI workflows have completed successfully, the engineer initiates a deployment by running a ChatOps command like hubot deploy monalisa-app/bug-fixes to staging. This triggers a deployment to our environments such as Staging.
  4. The build systems fetch the Kubernetes manifest files from the repository branch, replaces the latest image to be deployed from the artifact registry, injects app secrets from the secret store, and runs some custom operations. At the end of this stage, a ready-to-deploy Kubernetes manifest is available.
  5. Our deployment systems then apply the Kubernetes manifest to relevant clusters and monitor the rollout status of new changes.

Conclusion

GitHub’s internal paved path helps developers at GitHub focus on building services and delivering value to our users, with minimal focus on the infrastructure. We accomplish this by providing a streamlined path to our GitHub engineers that uses the power of containers and Kubernetes; scalable security, authentication, and authorization mechanisms; and the GitHub.com platform itself.

Want to try some of these for yourself? Learn more about all of GitHub’s features on github.com/features. If you have adopted any of our practices for your own development, give us a shout on Twitter!

Scaling merge-ort across GitHub

Post Syndicated from Matt Cooper original https://github.blog/2023-07-27-scaling-merge-ort-across-github/

At GitHub, we perform a lot of merges and rebases in the background. For example, when you’re ready to merge your pull request, we already have the resulting merge assembled. Speeding up merge and rebase performance saves both user-visible time and backend resources. Git has recently learned some new tricks which we’re using at scale across GitHub. This post walks through what’s changed and how the experience has improved.

Our requirements for a merge strategy

There are a few non-negotiable parts of any merge strategy we want to employ:

  • It has to be fast. At GitHub’s scale, even a small slowdown is multiplied by the millions of activities going on in repositories we host each day.
  • It has to be correct. For merge strategies, what’s “correct” is occasionally a matter of debate. In those cases, we try to match what users expect (which is often whatever the Git command line does).
  • It can’t check out the repository. There are both scalability and security implications to having a working directory, so we simply don’t.

Previously, we used libgit2 to tick these boxes: it was faster than Git’s default merge strategy and it didn’t require a working directory. On the correctness front, we either performed the merge or reported a merge conflict and halted. However, because of additional code related to merge base selection, sometimes a user’s local Git could easily merge what our implementation could not. This led to a steady stream of support tickets asking why the GitHub web UI couldn’t merge two files when the local command line could. We weren’t meeting those users’ expectations, so from their perspective, we weren’t correct.

A new strategy emerges

Two years ago, Git learned a new merge strategy, merge-ort. As the author details on the mailing list, merge-ort is fast, correct, and addresses many shortcomings of the older default strategy. Even better, unlike merge-recursive, it doesn’t need a working directory. merge-ort is much faster even than our optimized, libgit2-based strategy. What’s more, merge-ort has since become Git’s default. That meant our strategy would fall even further behind on correctness.

It was clear that GitHub needed to upgrade to merge-ort. We split this effort into two parts: first deploy merge-ort for merges, then deploy it for rebases.

merge-ort for merges

Last September, we announced that we’re using merge-ort for merge commits. We used Scientist to run both code paths in production so we can compare timing, correctness, etc. without risking much. The customer still gets the result of the old code path, while the GitHub feature team gets to compare and contrast the behavior of the new code path. Our process was:

  1. Create and enable a Scientist experiment with the new code path.
  2. Roll it out to a fraction of traffic. In our case, we started with some GitHub-internal repositories first before moving to a percentage-based rollout across all of production.
  3. Measure gains, check correctness, and fix bugs iteratively.

We saw dramatic speedups across the board, especially on large, heavily-trafficked repositories. For our own github/github monolith, we saw a 10x speedup in both the average and P99 case. Across the entire experiment, our P50 saw the same 10x speedup and P99 case got nearly a 5x boost.

Chart showing experimental candidate versus control at P50. The candidate implementation fairly consistently stays below 0.1 seconds.

Chart showing experimental candidate versus control at P99. The candidate implementation follows the same spiky pattern as the control, but its peaks are much lower.

Dashboard widgets showing P50 average times for experimental candidate versus control. The control averages 71.07 milliseconds while the candidate averages 7.74 milliseconds.

Dashboard widgets showing P99 average times for experimental candidate versus control. The control averages 1.63 seconds while the candidate averages 329.82 milliseconds.

merge-ort for rebases

Like merges, we also do a huge number of rebases. Customers may choose rebase workflows in their pull requests. We also perform test rebases and other “behind the scenes” operations, so we also brought merge-ort to rebases.

This time around, we powered rebases using a new Git subcommand: git-replay. git replay was written by the original author of merge-ort, Elijah Newren (a prolific Git contributor). With this tool, we could perform rebases using merge-ort and without needing a worktree. Once again, the path was pretty similar:

  1. Merge git-replay into our fork of Git. (We were running the experiment with Git 2.39, which didn’t include the git-replay feature.)
  2. Before shipping, leverage our test suite to detect discrepancies between the old and the new implementations.
  3. Write automation to flush out bugs by performing test rebases of all open pull requests in github/github and comparing the results.
  4. Set up a Scientist experiment to measure the performance delta between libgit2-powered rebases and monitor for unexpected mismatches in behavior.
  5. Measure gains, check correctness, and fix bugs iteratively.

Once again, we were amazed at the results. The following is a great anecdote from testing, as relayed by @wincent (one of the GitHub engineers on this project):

Another way to think of this is in terms of resource usage. We ran the experiment over 730k times. In that interval, our computers spent 2.56 hours performing rebases with libgit2, but under 10 minutes doing the same work with merge-ort. And this was running the experiment for 0.5% of actors. Extrapolating those numbers out to 100%, if we had done all rebases during that interval with merge-ort, it would have taken us 2,000 minutes, or about 33 hours. That same work done with libgit2 would have taken 512 hours!

What’s next

While we’ve covered the most common uses, this is not the end of the story for merge-ort at GitHub. There are still other places in which we can leverage its superpowers to bring better performance, greater accuracy, and improved availability. Squashing and reverting are on our radar for the future, as well as considering what new product features it could unlock down the road.

Appreciation

Many thanks to all the GitHub folks who worked on these two projects. Also, GitHub continues to be grateful for the hundreds of volunteer contributors to the Git open source project, including Elijah Newren for designing, implementing, and continually improving merge-ort.

How to build a GPT-3 App with Nextjs, React, and GitHub Copilot

Post Syndicated from Kedasha Kerr original https://github.blog/2023-07-25-how-to-build-a-gpt-3-app-with-nextjs-react-and-github-copilot/

At the beginning of the year, I started working out with a trainer who wanted me to start tracking my food, but I’ve always been super against tracking my meals because it just doesn’t work for me. Instead of tracking my meals however, I decided to build an application that automagically tells me the nutritional information of any recipe. But to do that I needed some pretty complex natural language parsing capabilities so I figured this would be a great opportunity for me to play around with OpenAI and get to use GitHub Copilot a little bit more to help me build the app quickly.

GitHub Copilot is a great example of a product that takes advantage of Large Language Models (LLM) to solve problems for people and improve their productivity. In this blog,I’ll take you through how I created my own application that finds the nutritional information for any recipe using OpenAI’s GPT-3.5-turbo model, GitHub Copilot, Next.js, React, and Material UI.

Let’s dig right into the tutorial.

1. Create a repository and install dependencies

To get started, let’s create a new repository from the GitHub Codespaces Next.js template to get up and running quickly. Go to this repository, and make a copy. To do so, click on the green “Use this template” button then select “Create a new repository” and name your repository whatever you like. I called mine “mealmetrics-copilot.”

Now, clone the repository to your local machine, and open up the repository in your preferred code editor. I’m using VS Code.

Open up your terminal and cd into the project so we can install a few needed dependencies. In your terminal run the following command:

npm i express openai dotenv @material-ui/core @material-ui/icons

Then, install the following as a dev dependency:

npm i --save-dev nodemon

Once everything installs successfully, we’re ready to start building the server, but first, let’s grab our api key from OpenAI.

2. Getting your OpenAI API key

Go to OpenAI’s developer login page and create a new account or sign in if you already have one. Once you’ve logged in, click your name in the upper right hand corner and select “view API keys.” Click the “Create a new secret key” button. From there you can name your apikey, click the green button to generate the key and then copy the apikey and save it in a secure location (such as a password manager).

Save your apikey in a .env file in vscode at the root of the project and add .env to the gitignore file.

3. Install GitHub Copilot extension

We’ll be using GitHub Copilot as our assistant to build this application. If you’re not familiar with GitHub Copilot, read this blog post to learn more.

In your code editor of choice, go to your extensions panel and search for GitHub Copilot—I’m using VSCode and this is what that looks like.

Click the install button then click the login button to authenticate your access. Once that’s done, you’ll be ready to get started and follow along!

4. Building the server

Now that we have our apikey, have installed dependencies, and have GitHub Copilot in our code editor, let’s dig into building the application!

The first thing we’re going to do is build a simple server with Express.js (if you prefer to use Fastify, NestJS, Koa or something else, feel free to use them!).

In the pages folder, create a folder called api and then a file called server.js. This is where we’ll add our prompting information for GitHub Copilot. Let’s add our first prompt as a comment in the server.js file that says the following:

Create a server with the following specifications:

1. import express and dotenv node modules
3. create the server with express and name it app
4. use port 8080 as default port
5. enable body parser to accept json data
6. state which port the server is listening to and log it to the console

Hit the enter key and GitHub Copilot will start generating suggestions to build the server. To accept the suggestions, hit the tab key. Take a look at this video to see what accepting suggestions look like.

We can update the package.json file to include the script devserver: "nodemon pages/api/server.js then run the command in our terminal using npm run devserver. You’ll see that the server has started!

After we build the simple server, let’s move on to making this a bit more complex by building the controller for our app.

Let’s create a new file in the api folder called generateInfo.js and add the following comment in the file:

Create a controller with the following specifications:

1. import the Configuration class and the OpenAIApi class from the openai npm module
2. create a new configuration object that includes the api key and uses the Configuration class from the openai module
3. create a new instance of the OpenAIApi class and pass in the configuration object
4. create an async function called generateInfo that accepts a request and response object as parameters
5. use try to make a request to the OpenAI completetion api and return the response
6. use catch to catch any errors and return the error include a message to the user
7. export the generateInfo function as a module

As you’ll notice, I’m being very explicit in my instructions to GitHub Copilot. One thing to always remember when working with LLMs is that the magic is in the prompt—the clearer you are in your instructions, the better the results you’ll get.

Hit enter on your keyboard and then hit tab to accept the recommendations that GitHub Copilot provides. In the image below, you’ll notice that Copilot’s suggestions are gray.

Accept the suggestion by hitting tab on your keyboard and let’s do some cleaning up.

Remember, GitHub Copilot is our assistant, so we still need to ensure that the suggestions it provides meet our requirements.

Since we’re building a gpt-3 application, we’ll be using the completion API from OpenAI and the gpt-3.5-turbo model to generate nutritional information for us.

If you look at the suggestion above, we were provided with the davinci engine and parameters that are not needed for this project—we also need the messages parameter to send requests with the 3.5-turbo model.

We also want to add the recipe prompt, create a function called recipe that represents the recipe a user inputs and also update the completion object sent to OpenAI. The keys we’ll be using are max_tokens, prompt, model, temperature and n. Learn more about these parameters by reading OpenAI’s api docs.

Let’s also update the error message to include 401 just in case our api key is invalid. So, let’s make these updates.

1. Add recipe prompt

Create a new folder called data at the root of your project, then create a file called prompt.json. This will contain a part of the recipe prompt that we’ll send to OpenAI. Add the following script to the prompt.json file:

{
"recipePrompt": "I want you to act as a Nutrition Facts Generator. I will provide you with a recipe and your role is to generate nutrition facts for that recipe. You should use your knowledge of nutrition science, nutrition facts labels and other relevant information to generate nutritional information for the recipe. Add each nutrition fact to a new line. I want you to only reply with the nutrition fact. Do not provide any other information. My first request is: "
}

Then import the recipePrompt to the generateInfo.js file and update the main function to grab the recipe submitted by the user.

// add the prompt to the top of the file
const { recipePrompt } = require('../../data/recipe.json');

// update this function to include the recipe before the try
const generateInfo = async(req, res) => {
const { recipe } = req.body
}

2. Update the completion function and response

Now, let’s update the try to look a bit more like what we want.

model: "gpt-3.5-turbo",
messages: [{ role: "user", content: `${recipePrompt}${recipe}` }],
max_tokens: 200,
temperature: 0,
n: 1,

And let’s also update the response that we receive.

const response = completion.data.choices[0].message.content;

return res.status(200).json({
success: true,
data: response,
});

3. Update the error message

Finally, let’s update the catch to have more explicit error messages.

catch (error) {
if (error.response.status === 401) {
return res.status(401).json({
error: "Please provide a valid API key.",
});
}
return res.status(500).json({
error:
"An error occurred while generating recipe information. Please try again later.",
});
}

Once we’ve updated everything, our controller function should look like this:

const { Configuration, OpenAIApi } = require("openai");
const { recipePrompt } = require("../../data/recipe.json");

const config = new Configuration({
apiKey: process.env.OPENAI_API_KEY,
});

const openai = new OpenAIApi(config);

const generateInfo = async (req, res) =&gt; {
const { recipe } = req.body;

try {
const completion = await openai.createChatCompletion({
model: "gpt-3.5-turbo",
messages: [{ role: "user", content: `${recipePrompt}${recipe}` }],
max_tokens: 200,
temperature: 0,
n: 1,
});
const response = completion.data.choices[0].message.content;

return res.status(200).json({
success: true,
data: response,
});
} catch (error) {
console.log(error);
if (error.response.status === 401) {
return res.status(401).json({
error: "Please provide a valid API key.",
});
}
return res.status(500).json({
error:
"An error occurred while generating recipe information. Please try again later.",
});
}
};

module.exports = { generateInfo };

Now, let’s create the router and test this out in Postman. Create a new file called router.js and start typing to allow GitHub Copilot to assist you while typing.

As you can see, GitHub Copilot offered suggestions while I was typing and I hit the tab button to accept the suggestions. Add the newly created router to the server.js file and test the route in postman. Add the following to your server.js file.

app.use('/openai', require('./router'));

Now, let’s test the route in postman with a POST request—make sure your server is still running!

Go to the URL below and add any recipe to the body of the request:

URL: http://localhost:8080/openai/generateinfo

RECIPE:
{
"recipe": "1 cup of all purpose flour, sifted 1 1/2 teaspoon baking powder 1/4 teaspoon salt 2 Tablespoon granulated sugar 1/2 Tablespoon unsalted butter, room temperature Approximately 1/3 cup water"
}

You should receive a successful response that looks like this:

{
"success": true,
"data": "\n\nCalories: 112 \nTotal Fat: 2.3g \nSaturated Fat: 1.3g \nTrans Fat: 0g \nCholesterol: 5.4mg \nSodium: 175.8mg \nTotal Carbohydrates: 21.6g \nDietary Fiber: 0.8g \nSugars: 6.5g \nProtein: 2.6g"
}

Here is the data that we submitted to OpenAI that generated that successful response:

data: '{"model":"text-davinci-003","prompt":"I want you to act as a Nutrition Facts Generator. I will provide you with a recipe and your role is to generate nutrition facts for that recipe. You should use your knowledge of nutrition science, nutrition facts labels and other relevant information to generate nutritional information for the recipe. Add each nutrition fact to a new line. I want you to only reply with the nutrition fact. Do not provide any other information. My first request is: 1 cup of all purpose flour, sifted 1 1/2 teaspoon baking powder 1/4 teaspoon salt 2 Tablespoon granulated sugar 1/2 Tablespoon unsalted butter, room temperature Approximately 1/3 cup water","max_tokens":200,"temperature":0.5,"n":1}',

As you can see, both the prompt script and the recipe entered in the request body was sent to OpenAI, which generated the nutritional data for this Jamaican fried dumpling recipe.

Now, let’s create the frontend of the application to display the info on the web.

5. Building the frontend app

We’ll be using React for the frontend. Delete all the code in the index.js file that currently exists in the project. Then, in a comment, instruct GitHub Copilot to build a simple text area.

Create a text area with the following specifications:
1. a H1 with the text "Find Nutrition Facts for any recipe"
2. a text area for users to upload recipe
3. a button for users to submit the entered recipe
4. a section at the bottom to display nutrition facts
5. Get the data from this link: http://localhost:8080/openai/generateinfo
6. Name the component RecipeInfo

GitHub Copilot quickly generated the code for us.

Let’s hit tab to accept the suggestion and run npm run dev in your terminal to see the app on the web. When you go to localhost:3000, you’ll see the following displayed on the web.

Admittedly, it’s not the most beautiful thing, but we were able to spin this up very quickly.

In less than one minute we completed a functional frontend mvp of our application with GitHub Copilot.

Let’s enter the recipe we have into the text box and see the response that we get back.

And we have our first error—which is not surprising since we didn’t validate the code that was provided. Let’s look into the console and see if we have any additional details.

Seems it’s a CORS issue—classic. Let’s ask GitHub Copilot how to resolve this.

Add the following questions as a comment anywhere in your file:

q: how do I resolve the CORS error?
q: how do I add Access-Control-Allow-Origin to the header?

The question and response should look something like this:

We can also ask GitHub Copilot Chat how to resolve CORS errors and it gives us a seamless response.

Let’s install the cors middleware and add it to the server.js file.

const cors = require("cors");

// Allow cross-origin requests (CORS)
app.use(cors());

Then, let’s update our router.js file.

router.options("/generateInfo", (req, res) => {
res.setHeader("Access-Control-Allow-Origin", "*");
res.setHeader("Access-Control-Allow-Headers", "*");
res.setHeader("Access-Control-Allow-Methods", "*");
res.sendStatus(200);
});

Now, let’s try fetching nutritional data again and see what happens.

And we have another error. Progress!

This time there’s no need to debug with GitHub Copilot since we’re being told that the data being returned is an object with the keys success and data. Let’s change the name of the response function to recipeInfo and update the nutrition state to receive recipeInfo.data.

const recipeInfo = await response.json();
setNutrition(recipeInfo.data);

Let’s try sending the recipe again and hope for a successful response.

Success!

We just created a GPT-3 app in record time with GitHub Copilot, React, Next.js, and OpenAI. Now that we have the data that we need, let’s make the application more beautiful with Material UI.

6. Styling the app with Material UI

In this section, we’ll be using a GitHub Copilot X feature in technical preview for individuals and in public beta for organizationsCopilot Chat–to improve the appearance of our application. You must have GitHub Copilot access to be on the Copilot Chat’s waitlist which is currently open. Sign up today if you haven’t yet!

Let’s ask GitHub Copilot chat how we can implement material-ui into the application:

Let’s go ahead and implement the suggestions and see what happens, and also ask GitHub Copilot chat to implement a header for us.

After we implement the header, new text area and center the content, this is what the app is looking like.

Ok, we’re getting somewhere.

Let’s make a few more updates with the assistance of GitHub Copilot Chat. I’ve included the prompt/questions I asked:

  • Make the text area larger and implement Material UI
update the component to use material ui with the content centered and the buttoned positioned below the text area. use Grid from material ui and any other components needed.
  • Add the paper component from Material UI to elevate the look and feel of the app
add the Paper component from material ui to the text area highlighted
  • Add a second button that clears the text area + facts after a recipe is submitted
add a button to the app to clear the text in the textarea
  • Add a loader while waiting for the data to load
add a loader to the highlighted code that checks if the data is loading. If the data is loading, then display the text "Nutrition Facts" and loader, if there is an error, display the error message otherwise, display nothing
  • Add a theme with custom primary and secondary colors
how do I create a custom theme with material ui and where do I create the custom theme?
  • Prevent the text area from going over the paper component from Material UI
in the highlihghted code how do I prevent the text area line from going over the paper component?
  • Add a new component—footer
Create a footer component with the following specifications:
1. The footer must be fixed at the bottom of the page
2. Use the Paper component from Material UI
3. Use the Typography component from Material UI
3. The text must say "Made with ❤ by LadyKerr & GitHub Copilot" and "Powered by OpenAI"
4. The text "GitHub Copilot" must be a link to https://copilot.github.com/ that opens in a new tab with alt text " GitHub Copilot"
5. The text "OpenAI" must be a link to https://openai.com/ that opens in a new tab with alt text "openai api"

Ask GitHub Copilot chat to make the changes above and, once it’s done, your application should be looking and functioning like this:

Now, let’s create a new component that splits each nutrition fact onto a new line. Create a new file called NutritionFacts.js in the components folder, and write the following as a comment so GitHub Copilot can get to work.

Create a component with the following specifications:
1. the component must split the received string data at /n/n or /n and return a Typography component for each string
2. the component must set a unique key for each Typography component
3. the component must return a div with the Typography components
4. the component must return null if the data is not a string
5. Name the component NutritionFacts
6. Use the Paper Component from Material UI
7. Add text above the data that says "Here are the nutrition facts for your recipe:"

From this prompt, GitHub Copilot generated the following code.

import React from "react";
import { Typography, Paper } from "@material-ui/core";

const NutritionFacts = ({ data }) => {
if (typeof data !== "string") {
return null;
}
const nutritionFacts = data.split(/\n\n|\n/);
return (

Here are the nutrition facts for your recipe:

{nutritionFacts.map((fact, index) => (
{fact}
))}
);
};

export default NutritionFacts;

Brilliant! Let’s import this component into our main index.js file and test the application to see if each fact was split on to a new line as expected.

And it did. Our app is functioning as expected.

Now, let’s move the code for the header into a new file in the components folder called Header.js. Once everything is updated, the final application looks like this and returns the nutritional data for any recipe.

So, there we have it!

We just built an application using GitHub Copilot, OpenAI, React, Next.js, and GitHub Copilot Chat. The next step would be to deploy the application on GitHub Pages and deploy your server on a service like Azure.

You can see the full code here—feel free to clone or fork the project and make it your own. This was a fun little project to build and I hope you learned something new and feel inspired to create your own GPT-3 app!

Learn more about prompting GitHub Copilot by reading How to use GitHub Copilot: Prompts, tips and use cases and A Developer’s Guide to Prompt Engineering and LLMs.

Until next time, happy coding!

Metrics for issues, pull requests, and discussions

Post Syndicated from Zack Koppert original https://github.blog/2023-07-19-metrics-for-issues-pull-requests-and-discussions/

Data-driven insights

At GitHub, we believe that data-driven insights are the keys to success for any software development project. Understanding the health and progress of your issues, pull requests, and discussions is crucial for effective collaboration, maintainership, and project management.

That is why we’re excited to announce the release of the Issue Metrics GitHub Action, a powerful tool that empowers developers and teams to measure key metrics and gain valuable insights into their projects.

With the new Issue Metrics GitHub Action, you can now easily track and monitor important metrics related to issues, pull requests, and discussions, such as time to first response, time to close, and more for any given time period.

Whether you’re an individual developer, a small team, or a large organization, these metrics will help you gauge the overall health, progress, and engagement of your projects.

Sample report

A sample report showing 2 tables. The first table contains overall metrics like average time to first response, anda corresponding value of 50 minutes and 44 seconds. The second table contains a list of the issues measured, with links to the issue and the metrics as measured on the individual issue.

Common use cases

Maintainers: ensuring proper attention

As a maintainer, it is essential to give reasonable attention to the issues and pull requests in the repositories you maintain. With the Issue Metrics GitHub Action, you can track metrics, such as the number of open issues, closed issues, open pull requests, and merged pull requests.

These metrics can provide you with a clear overview of the workload for a project over a given week, month, or even year. The action can also allow you to consider how you or your team prioritize time and attention effectively while also highlighting potentially overlooked requests in need of attention.

First responders: timely user contact

As a first responder in a repository, it’s part of the job description to ensure that users receive contact in a reasonable amount of time. By utilizing the Issue Metrics GitHub Action, you can keep track of metrics like the number of discussions awaiting replies, unresolved issues, or pull requests waiting for reviews. These metrics enable you to maintain a high level of responsiveness, fostering a positive user experience and timely problem resolution. These can be used to build a to-do list or retrospectively to reflect on how long users had to wait for a response during a given time period.

Open Source Program Office (OSPO): streamlining open source requests

An important part of what OSPOs do is making the open source release process easy and efficient while adhering to company policy. This process usually involves employees opening an issue, pull request, or discussion. With the Issue Metrics GitHub Action, OSPOs can gain valuable insights into the number of requests, the ratio of open to closed requests, and metrics related to the time it takes to navigate the open-source process to completion.

These metrics empower you to streamline your workflows, optimize response times, and ensure a smooth open-source collaboration experience. Optimizing the open source release process encourages employees to continue to produce open source projects on the organization’s behalf.

Product development teams: optimizing pull request reviews

Product development teams rely heavily on the code review process to collaborate and build high-quality software. By leveraging the Issue Metrics GitHub Action, teams can measure metrics such as the time it takes to get pull request reviews. These insights allow you to reflect on the data during retrospectives, identify areas for improvement, and optimize the review process to enhance team collaboration and accelerate development cycles.

Certain aspects of efficiency and flow may be hard to measure but often it is possible to spot and remove inefficiencies in the value stream.

– Forsgren et al. 2021

Setup and workflow integration

Setting up the Issue Metrics GitHub Action takes a few minutes, compared to the few hours it takes to calculate these metrics manually. You also only need to set up the action once, and it will run on a regular basis of your own choosing. It integrates into your existing GitHub Actions workflow or you can create a new workflow specifically for metrics tracking.

The action provides a wide range of customizable options, allowing you to tailor the issues, pull requests, and discussions measured by utilizing GitHub’s powerful search filtering. Ready to use configurations have been tested and used internally at GitHub and are now available for you to try out as well.

Here is one such example that runs monthly to report on metrics for issues created last month:

name: Monthly issue metrics
on:
  workflow_dispatch:
  schedule:
    - cron: '3 2 1 * *'

jobs:
  build:
    name: issue metrics
    runs-on: ubuntu-latest

    steps:

    - name: Get dates for last month
      shell: bash
      run: |
        # Get the current date
        current_date=$(date +'%Y-%m-%d')

        # Calculate the previous month
        previous_date=$(date -d "$current_date -1 month" +'%Y-%m-%d')

        # Extract the year and month from the previous date
        previous_year=$(date -d "$previous_date" +'%Y')
        previous_month=$(date -d "$previous_date" +'%m')

        # Calculate the first day of the previous month
        first_day=$(date -d "$previous_year-$previous_month-01" +'%Y-%m-%d')

        # Calculate the last day of the previous month
        last_day=$(date -d "$first_day +1 month -1 day" +'%Y-%m-%d')

        echo "$first_day..$last_day"
        echo "last_month=$first_day..$last_day" >> "$GITHUB_ENV"

    - name: Run issue-metrics tool
      uses: github/issue-metrics@v2
      env:
        GH_TOKEN: ${{ secrets.GH_TOKEN }}
        SEARCH_QUERY: 'repo:owner/repo is:issue created:${{ env.last_month }} -reason:"not planned"'

    - name: Create issue
      uses: peter-evans/create-issue-from-file@v4
      with:
        title: Monthly issue metrics report
        content-filepath: ./issue_metrics.md
        assignees: <YOUR_GITHUB_HANDLE_HERE>

Ready to start leveling up your GitHub project management?

Head over to the Issue Metrics GitHub Action repository to explore the documentation, installation instructions, and examples. The repository provides a comprehensive README file that guides you through the setup process and showcases the wide range of metrics you can measure. If you need additional help, feel free to open an issue in the repository.

GitHub is committed to providing developers with the best tools to enhance collaboration and productivity. The Issue Metrics GitHub Action is a significant step towards empowering teams to measure key metrics related to issues, pull requests, and discussions. By gaining valuable insights into the pulse of your projects, you can drive continuous improvement and deliver exceptional software. We are using this in several places internally across GitHub to help us continually improve and hope this action can help you as well. Happy coding!

A developer’s guide to prompt engineering and LLMs

Post Syndicated from Albert Ziegler original https://github.blog/2023-07-17-prompt-engineering-guide-generative-ai-llms/


In a blog post authored back in 2011, Marc Andreessen warned that, “Software is eating the world.” Over a decade later, we are witnessing the emergence of a new type of technology that’s consuming the world with even greater voracity: generative artificial intelligence (AI). This innovative AI includes a unique class of large language models (LLM), derived from a decade of groundbreaking research, that are capable of out-performing humans at certain tasks. And you don’t have to have a PhD in machine learning to build with LLMs—developers are already building software with LLMs with basic HTTP requests and natural language prompts.

In this article, we’ll tell the story of GitHub’s work with LLMs to help other developers learn how to best make use of this technology. This post consists of two main sections: the first will describe at a high level how LLMs function and how to build LLM-based applications. The second will dig into an important example of an LLM-based application: GitHub Copilot code completions.

Others have done an impressive job of cataloging our work from the outside. Now, we’re excited to share some of the thought processes that have led to the ongoing success of GitHub Copilot.

Let’s jump in.

Everything you need to know about prompt engineering in 1600 tokens or less

You know when you’re tapping out a text message on your phone, and in the middle of the screen just above the keypad, there’s a button you can click to accept a suggested next word? That’s pretty much what an LLM is doing—but at scale.

A GIF show autocomplete functionalities in iOS.
An example of iMessage’s text prediction feature.

Instead of text on your phone, an LLM works to predict the next best group of letters, which are called “tokens.” And in the same way that you can keep tapping that middle button to complete your text message, the LLM completes a document by predicting the next word. It will continue to do that over and over, and it will only stop once it has reached a maximum threshold of tokens or once it has encountered a special token that signals “Stop! This is the end of the document.”

There’s an important difference, though. The language model in your phone is pretty simple—it’s basically saying, “Based only upon the last two words entered, what is the most likely next word?” In contrast, an LLM produces an output that’s more akin to being “based upon the full content of every document ever known to exist in the public domain, what is the most likely next token in your document?” By training such a large, well-architected model on an enormous dataset, an LLM can almost appear to have common sense such as understanding that a glass ball sitting on a table might roll off and shatter.

A screenshot of ChatGPT answering a question about the danger of setting a round glass ball on a small table.
Example of an LLM’s awareness or “common sense” due to its training.

But be warned: LLMs will also sometimes confidently produce information that isn’t real or true, which are typically called “hallucinations” or “fabulations.” LLMs can also appear to learn how to do things they weren’t initially trained to do. Historically, natural language models have been created for one-off tasks, like classifying the sentiment of a tweet, extracting the business entities from an email, or identifying similar documents, but now you can ask AI tools like ChatGPT to perform a task that it was never trained to do.

A screenshot of ChatGPT answering a prompt to create a chicken-based limerick.
John conversing with ChatGPT about serious things.

Building applications using LLMs

A document completion engine is a far cry from the amazing proliferation of LLM applications that are springing up every day, running the gamut from conversational search, writing assistants, automated IT support, and code completion tools, like GitHub Copilot. But how is it possible that all of these tools can come from what is effectively a document completion tool? The secret is any application that uses an LLM is actually mapping between two domains: the user domain and the document domain.

A graphic showing how LLMs work and the processes behind them to determine context before giving an answer.
Diagram of the user flow when communicating with an LLM, in this case, Dave’s user flow.

On the left is the user. His name is Dave, and he has a problem. It’s the day of his big World Cup watch party, and the Wi-Fi is out. If they don’t get it fixed soon, he’ll be the butt of his friends’ jokes for years. Dave calls his internet provider and gets an automated assistant. Ugh! But imagine that we are implementing the automated assistant as an LLM application. Can we help him?

The key here is to figure out how to convert from user domain into document domain. For one thing, we will need to transcribe the user’s speech into text. As soon as the automated support agent says “Please state the nature of your cable-related emergency,” Dave blurts out:

Oh it’s awful! It’s the World Cup finals. My TV was connected to my Wi-Fi, but I bumped the counter and the Wi-Fi box fell off and broke! Now, we can’t watch the game.

At this point, we have text, but it’s not of much use. Maybe you would imagine that this was part of a story and continue it, “I guess, I’ll call up my brother and see if we can watch the game with him.” An LLM with no context will similarly create the continuation of Dave’s story. So, let’s give the LLM some context and establish what type of document this is:

### ISP IT Support Transcript:

The following is a recorded conversation between an ISP customer, Dave Anderson, and Julia Jones, IT support expert. This transcript serves as an example of the excellent support provided by Comcrash to its customers.

*Dave: Oh it's awful! This is the big game day. My TV was connected to my Wi-Fi, but I bumped the counter and the Wi-Fi box fell off and broke! Now we can't watch the game.
*Julia:

Now, if you found this pseudo document on the ground, how would you complete it? Based on the extra context, you would see that Julia is an IT support expert, and apparently a really good one. You would expect the next words to be sage advice to help Dave with his problem. It doesn’t matter that Julia doesn’t exist, and this wasn’t a recorded conversation—what matters is that these extra words offer more context for what a completion might look like. An LLM does the same exact thing. After reading this partial document, it will do its best to complete Julia’s dialogue in a helpful manner.

But there’s more we can do to make the best document for the LLM. The LLM doesn’t know a whole lot about cable TV troubleshooting. (Well, it has read every manual and IT document ever published online, but stay with me here). Let’s assume that its knowledge is lacking in this particular domain. One thing we can do is search for extra content that might help Dave and place it into the document. Let’s assume that we have a complaints search engine that allows us to find documentation that has been helpful in similar situations in the past. Now, all we have to do is weave this information into our pseudo document in a natural place.

Continuing from above:

*Julia:(rifles around in her briefcase and pulls out the perfect documentation for Dave's request)
Common internet connectivity problems ...
<...here we insert 1 page of text that comes from search results against our customer support history database...>
(After reading the document, Julia makes the following recommendation)
*Julia:

Now, given this full body of text, the LLM is conditioned to make use of the implanted documentation, and in the context of “a helpful IT expert,” the model will generate a response. This reply takes into account the documentation as well as Dave’s specific request.

The last step is to move from the document domain into the user’s problem domain. For this example, that means just converting text to voice. And since this is effectively a chat application, we would go back and forth several times between the user and the document domain, making the transcript longer each time.

This, at the core of the example, is prompt engineering. In the example, we crafted a prompt with enough context for the AI to produce the best possible output, which in this case was providing Dave with helpful information to get his Wi-Fi up and running again. In the next section, we’ll take a look at how we at GitHub have refined our prompt engineering techniques for GitHub Copilot.

The art and science of prompt engineering

Converting between the user domain and document domain is the realm of prompt engineering—and since we’ve been working on GitHub Copilot for over two years, we’ve started to identify some patterns in the process.

These patterns have helped us formalize a pipeline, and we think it is an applicable template to help others better approach prompt engineering for their own applications. Now, we’ll demonstrate how this pipeline works by examining it in the context of GitHub Copilot, our AI pair programmer.

The prompt engineering pipeline for GitHub Copilot

From the very beginning, GitHub Copilot’s LLMs have been built on AI models from OpenAI that have continued to get better and better. But what hasn’t changed is the answer to the central question of prompt engineering: what kind of document is the model trying to complete?

The OpenAI models we use have been trained to complete code files on GitHub. Ignoring some filtering and stratification steps that don’t really change the prompt engineering game, this distribution is pretty much that of individual file contents according to the most recent commit to main at data collection time.

The document completion problem the LLM solves is about code, and GitHub Copilot’s task is all about completing code. But the two are very different.

Here are some examples:

  • Most files committed to main are finished. For one, they usually compile. Most of the time the user is typing, the code does not compile because of incompletions that will be fixed before a commit is pushed.
  • The user might even write their code in hierarchical order, method signatures first, then bodies rather than line by line or in a mixed style.
  • Writing code means jumping around. In particular, people’s edits often require them to jump up in the document and make a change there, for example, adding a parameter to a function. Strictly speaking, if Codex suggests using a function that has not been imported yet, no matter how much sense it might make, that’s a mistake. But as a GitHub Copilot suggestion, it would be useful.

The issue is that merely predicting the most likely continuation based on the text in front of the cursor to make a GitHub Copilot suggestion would be a wasted opportunity. That’s because it ignores an incredible wealth of context. We can use that context to guide the suggestion, like metadata, the code below the cursor, the content of imports, the rest of the repository, or issues, and create a strong prompt for the AI assistant.

Software development is a deeply interconnected, multimodal challenge, and the more of that complexity we can tame and present to the model, the better your completions are going to be.

Step 1: Gathering context

GitHub Copilot lives in the context of an IDE such as Visual Studio Code (VS Code), and it can use whatever it can get the IDE to tell it—only if the IDE is quick about it though. In an interactive environment like GitHub Copilot, every millisecond matters. GitHub Copilot promises to take care of the common coding tasks, and if it wants to do that, it needs to display its solution to the developer before they have started to write more code in their IDE. Our rough heuristics say that for every additional 10 milliseconds we take to come up with a suggestion, the chance it’ll arrive in time decreases by one percent.

So, what can we say quickly? Well, here’s an example. Consider this suggestion to a simple piece of Python:

A developer prompting GitHub Copilot to write a simple function in Python to compute Fibonacci numbers.

Wrong! Turns out the user actually wanted to write Ruby, like this:

A developer using GitHub Copilot to write a simple function to compute Fibonacci numbers in Ruby.

The two languages have similar enough syntax so that only a couple of lines can be ambiguous, especially when it’s toward the beginning of the file where much of what we encounter are boilerplate comments. But modern IDEs such as VS Code typically know what language the user is writing in. That makes language mix ups especially annoying to the user because they break the implicit expectation that “the computer should know” (after all, most IDEs highlight language syntax).

So, let’s put the language metadata into our pile of context we might want to include. In fact, let’s add the whole filename too. If it’s available, it usually implies the language through its extension, and additionally sets the tone for what to expect in that file—small, easy pieces of information that won’t turn the tide but are helpful to include.

On the other end of the spectrum, there’s the rest of the repository. Say you’ve got a file that defines an abstract class DataReader. And you have another that defines a subclass CsvReader. And you’re now writing a new file defining another subclass SqlReader. Chances are that to write the new file, you’ll want to check out both existing files as well because they communicate useful background into what you need to implement and how to do it. Typically, developers keep such files open in different tabs and switch to remind themselves of definitions, examples, similar patterns, or tests.

If the content of those two files is useful to you, chances are it would be useful to the AI as well. So, let’s add it as context! After all, the IDE knows what other files from the repository are open as tabs in the same window. The repository might have hundreds or even thousands of files, but only some will be open, and that is a strong hint that they might be useful to what they’re doing right now. Of course, “some” can mean a lot of things, so we don’t consider any more than the 20 most recent tabs.

Step 2: Snippeting

Irrelevant information in an LLM’s context decreases its accuracy. Additionally, source code tends to be long, so even a single file is not guaranteed to fit completely into an LLM’s context window (a problem that occurs roughly a fifth of the time). So, unless the user is very frugal about their tab usage, we simply cannot include all the tabs.

It’s important to be selective about what code to include from other files, so we cut files into (hopefully) natural, overlapping snippets that are no longer than 60 lines. Of course, we don’t want to actually include all overlapping snippets—that’s why we score them and take only the best. In this case, the “score” is meant to reflect relevance. To determine a snippet’s score, we use the Jaccard similarity, a stat that can be used to gauge the similarity or diversity of sample sets. (It’s also super fast to compute, which is great for reducing latency.)

Step 3: Dressing them up

Now we have some context we’d like to pass on to the model. But how? Codex and other models don’t offer an API where you can add other files, or where you can specify the document’s language and filename for that matter. They complete one single document. As mentioned above, you’ll need to inject your context into that document in a natural way.

The path and name might be easiest. Many files start with a preamble that gives some metadata, like author, project name, or filename. So, we’ll pretend this is happening here as well, and add a line at the very top that reads something like # filepath: foo/bar.py or // filepath: foo.bar.js, depending on comment syntax in the file’s language.

Sometimes the path isn’t known, like with new files that haven’t yet been saved. Even then, we could try to at least specify the language, provided the IDE is aware of it. For many languages, we have the opportunity to include shebang lines like #!/usr/bin/python or #!/usr/bin/node. That’s a neat trick that works pretty well at warding against mistaken language identity. But it’s also a bit dangerous since files with shebang lines are a biased subpopulation of all code. So, let’s do it for short files where the danger of mistaken language identity is high, and avoid it for larger or named files.

If comments work as a delivery system for tiny nuggets of information, like path or language, we can also make them work as delivery systems for the chunky deep dives that are 60 lines of related code.

Comments are versatile, and commented-out code exists all over GitHub. Let’s look at some of the most common examples:

  • Old code that doesn’t apply anymore
  • Deleted features
  • Earlier versions of current code
  • Example code specifically left there for documentation purposes
  • Code lifted from other parts of the codebase

Let’s take our inspiration from the last group of examples. Familiarity with groups (1) – (3) makes things a bit easier on the model, but our snippets aim to emulate groups (4) and (5):

# compare this snippet from utils/concatenate.py:

# def crazy_concat(a, b):

# return str(a) + str(b)[::-1]

Note that including the file name and path of the snippet source can be useful. And combined with the current file’s path, this might guide completions referencing imports.

Step 4: Prioritization

So far, we have grabbed many pieces of context from many sources: the text directly above the cursor, text below the cursor, text in other files, and metadata like language and file path.

In the vast majority of cases (around 95%), we have to make the tough choice of what we can or cannot include.

We make that choice by thinking of the items we might include as “wishes.” Each time we uncover a piece of context, like a commented out snippet from an open tab, we make a wish. Wishes come with some priority attached, for example, the shebang lines have rather low priorities. Snippets with a low similarity score are barely higher. In contrast, the lines directly above the cursor have maximum priority. Wishes also come with a desired position in the document. The shebang line needs to be the very first item, while the text directly above the cursor comes last—it should directly precede the LLM’s completion.

The fastest way of selecting which wishes to fill and which ones to discard is by sorting that wishlist by priority. Then, we can keep deleting the lowest priority wishes until what remains fits in the context window. We then sort again by the intended order in the document and paste everything together.

Step 5: The AI does its thing

Now that we’ve assembled an informative prompt, it’s time for the AI to come up with a useful completion. We have always faced a very delicate tradeoff here—GitHub Copilot needs to use a highly capable model because quality makes all the difference between a useful suggestion and a distraction. But at the same time, it needs to be a model capable of speed, because latency makes all the difference between a useful suggestion and not being able to provide a suggestion at all.

So, which AI should we choose to “do its thing” on the completion task: the fastest or the most accurate one? It’s hard to know in advance, so OpenAI developed a fleet of models in collaboration with GitHub. We put two different models in front of developers but found that people got the most mileage (in terms of accepted and retained completions) out of the much faster model. Since then, further optimizations have increased model speed significantly, so that the current version of GitHub Copilot is backed by an even more capable model.

Step 6: Now, over to you!

The generative AI produces a string, and if it’s not stopped, it keeps on producing and will keep going until it predicts the end of the file. That would waste time and compute resources, so you need to set up “stop” criteria.

The most common stop criterion is actually looking for the first line break. In many situations, it seems likely that a software developer wants the current line to be finished, but not more. But some of the most magical contributions by GitHub Copilot are when it suggests multiple lines of code all at once.

Multi-line completions feel natural when they’re about a single semantic unit, such as the body of a function, an if-branch, or a class. GitHub Copilot looks for cases where such a block is being started, either because the developer has just written the start, such as the header, if guard, or class declaration, or is currently writing the start. If the block body appears to be empty, it will attempt to make a suggestion for it, and only stop when the block appears to be done.

This is the point when the suggestion gets surfaced to the coder. And the rest, as they say, is ~~history~~ 10x development.

If you’re interested in learning more about prompt engineering in general and how you can refine your own techniques, check out our guide on getting started with GitHub Copilot.

GitHub Availability Report: June 2023

Post Syndicated from Jakub Oleksy original https://github.blog/2023-07-12-github-availability-report-june-2023/

In June, we experienced two incidents that resulted in degraded performance across GitHub services. 

June 7 16:11 UTC (lasting 2 hours 28 minutes)

On June 7 at 16:11 UTC, GitHub started experiencing increasing delays in an internal job queue used to process Git pushes. Our monitoring systems alerted our first responders after 19 minutes. During this incident, customers experienced GitHub Actions workflow run and webhook delays as long as 55 minutes, and pull requests did not accurately reflect new commits.

We immediately began investigating and found that the delays were caused by a customer making a large number of pushes to a repository with a specific data shape. The jobs processing these pushes became throttled when communicating with the Git backend, leading to increased job execution times. These slow jobs exhausted a worker pool, starving the processing of pushes for other repositories. Once the source was identified and temporarily disabled, the system gradually recovered as the backlog of jobs was completed. To prevent a recurrence, we updated the Git backend’s throttling behavior to fail faster and reduced the Git client timeout within the job to prevent it from hanging.  We have additional repair items in place to reduce the times to detect, diagnose, and recover.

June 29 14:50 UTC (lasting 32 minutes)

On June 29, starting from 17:39 UTC, GitHub was down in parts of North America, particularly the US East coast and South America, for approximately 32 minutes.

GitHub takes measures to ensure that we have redundancy in our system for various disaster scenarios. We have been working on building redundancy to an earlier single point of failure in our network architecture at a second Internet edge facility. This facility was completed in January and has been actively routing production traffic since then in a high availability (HA) architecture alongside the first edge facility. As part of the facility validation steps, we performed a live failover test in order to verify that we could use this second Internet edge facility if the primary were to fail. Unfortunately, during this failover test we inadvertently caused a production outage.

The test exposed a network path configuration issue in the secondary side that prevented it from properly functioning as a primary, which resulted in the outage. This has since been fixed. We were immediately notified of the issue and within two minutes of being alerted we reverted the change and brought the primary facility back online. Once online it took time for traffic to be rebalanced and for our border routers to reconverge restoring public connectivity to GitHub systems.

This failover test helped expose the configuration issue, and we are addressing the gaps in both configuration and our failover testing, which will help make GitHub more resilient. We recognize the severity of this outage and the importance of keeping GitHub available. Moving forward, we will continue our commitment to high availability, improving these tests and scheduling them in a way where potential customer impact is minimized as much as possible.


Please follow our status page for real-time updates on status changes. To learn more about what we’re working on, check out the GitHub Engineering Blog.

GitHub CLI project command is now generally available!

Post Syndicated from Ariel Deitcher original https://github.blog/2023-07-11-github-cli-project-command-is-now-generally-available/

Effective planning and tracking is essential for developer teams of all shapes and sizes. Last year, we announced the general availability of GitHub Projects, connecting your planning directly to the work your teams are doing in GitHub. Today, we’re making GitHub Projects faster and more powerful. The project command for the gh CLI is now generally available!

In this blog, we’ll take a look at how to get started with the new command, share some examples you can try on the command line and in GitHub Actions, and list the steps to upgrade from the archived gh-projects extension. Let’s take a look at how you can conveniently manage and collaborate on GitHub Projects from the command line.

The components of GitHub Projects

Let’s start by familiarizing ourselves with the key components of GitHub Projects. A project is made up of three components—the Project, Project field(s), and Project item(s).

A Project belongs to an owner (which can be either a user or an organization), and is identified by a project number. As an example, the GitHub public roadmap project is number 4247 in the github organization. We’ll use this project in some of our examples later on.

Project fields belong to a Project and have a type such as Status, Assignee, or Number, while field values are set on an item. See understanding fields for more details.

Project items are one of type draft issue, issue, or pull request. An item of type draft issue belongs to a single Project, while items of type issue and pull request can be added to multiple projects.

These three components make up the subcommands of gh project, for example:

  • Project subcommands include: create, copy, list, and view.
  • Project field subcommands include: field-create, field-list , and field-delete.
  • Project item subcommands include: item-add, item-edit, item-archive, and item-list.

For the full list of project commands, check out the manual.

Permissions check

In order to get started with the new command, you’ll need to ensure you have the right permissions. The project command requires the project auth scope, which isn’t part of the default scopes of the gh auth token.

In your terminal, you can check your current scopes with this command:

$ gh auth status
github.com
✓ Logged in to github.com as mntlty (keyring)
✓ Git operations for github.com configured to use https protocol.
✓ Token: gho_************************************
✓ Token scopes: gist, read:org, repo, workflow

If you don’t see project in the list of token scopes, you can add it by following the interactive prompts from this command:

$ gh auth refresh -s project

In GitHub Actions, you must choose one of the options from the documentation to make a token with the project scope available.

Running project commands

Now that you have the permissions you need, let’s look at some examples of running project commands using my user and the GitHub public roadmap project, which you can adapt to your team’s use cases.

List the projects owned by the current user (note that no --owner flag is set):

$ gh project list
NUMBER TITLE STATE ID
1 my first project open PVT_kwxxx
2 @mntlty's second project open PVT_kwxxx

Create a project owned by mntlty:

$ gh project create --owner mntlty --title 'my project'

View the GitHub public roadmap project:

$ gh project view --owner github 4247

Title

GitHub public roadmap

## Description

--

## Visibility

Public

## URL

<https://github.com/orgs/github/projects/4247>

## Item count

208

## Readme

--

## Field Name (Field Type)

Title (ProjectV2Field)

Assignees (ProjectV2Field)

Status (ProjectV2SingleSelectField)

Labels (ProjectV2Field)

Repository (ProjectV2Field)

Milestone (ProjectV2Field)

Linked pull requests (ProjectV2Field)

Reviewers (ProjectV2Field)

Tracks (ProjectV2Field)

Tracked by (ProjectV2Field)

List the items in the GitHub public roadmap project:

$ gh project item-list --owner github 4247

TYPE TITLE NUMBER REPOSITORY ID
Issue Kotlin security analysis support in CodeQL code scanning
(public beta) 207 github/roadmap
PVTI_lADNJr_NE13OAALQgw
Issue Swift security analysis support in CodeQL code scanning
(beta) 206 github/roadmap
PVTI_lADNJr_NE13OAALQhA
Issue Fine-grained PATs (v2 PATs) - [Public Beta]
184 github/roadmap PVTI_lADNJr_NE13OAALQmw

Copy the GitHub public roadmap project structure to a new project owned by mntlty:

$ gh project copy 4247 --source-owner github --target-owner mntlty --title 'my roadmap'

https://github.com/users/mntlty/projects/1

Note that if you are using a TTY and do not pass a --owner flag or the project number argument to a command which requires those values, an interactive prompt will be shown from which you can select those values.

JSON format

Now, let’s look at how to format the command output in JSON, which displays more information for use in scripting, automation, and piping into other commands. Every project subcommand supports outputting to JSON format by setting the --format=json flag:

$ gh project view --owner github 4247 --format=json
{"number":4247,"url":"<https://github.com/orgs/github/projects/4247","shortDescription":"", "public":true,"closed":false,"title":"GitHub> public roadmap","id":"PVT_kwDNJr_NE10","readme":"","items":{"totalCount":208},"fields":{"totalCount":10},"owner":{"type":"Organization","login":"github"}}%

Combining JSON formatted output with a tool such as jq enables you to unlock even more capabilities. For example, you can create a list of the URLs from all of the Issues on the GitHub public roadmap project that have status “Future”:

$ gh project item-list --owner github 4247 --format=json | jq '.items[] |
select(.status=="Future" and .content.type == "Issue") | .content.url'

"<https://github.com/github/roadmap/issues/188>"
"<https://github.com/github/roadmap/issues/187>"
"<https://github.com/github/roadmap/issues/166>"

GitHub Actions

You can also level up your team’s usage of GitHub Projects with project commands in your GitHub Actions workflows to enhance automation, generate on demand reports, and react to events such as when a project item is modified. For example, you can create a workflow which is triggered by a workflow_dispatch event and will close all projects that are owned by mntlty and which have no items:

on: 
  workflow_dispatch:

jobs:
  close_empty:
    runs-on: ubuntu-latest
    env:
      GH_TOKEN: ${{ secrets.PROJECT_TOKEN }}
    steps:
      - run: |
          gh project list --owner mntlty --format=json \
          | jq '.projects[] | select(.items.totalCount == 0) | .number' \
          | xargs -n1 gh project close --owner mntlty 

The latest version of gh is automatically available in the GitHub Actions environment. For more information on using GitHub Actions, see https://docs.github.com/en/actions.

Upgrading from the gh-projects extension

Now that the project command is officially part of the CLI, the gh-projects extension repository has been archived. If you’re currently using the extension, you don’t need to change anything. You can continue installing and using the gh-projects extension; however, it won’t receive any future enhancements. Fortunately, it’s very simple to make the transition from the gh-project extension to the project command:

  • Upgrade to the latest version of gh.
  • Replace flags for --user and --org with --owner in project commands. owner is the login of the project owner, which is either a user or an organization.
  • Replace gh projects with gh project.

To avoid confusion, I also recommend removing the extension by running the following command:

$ gh ext remove gh-projects

Thank you to the community, @mislav, @samcoe, and @vilmibm for providing invaluable feedback and support on gh-projects!

Get started with GitHub CLI project command today

If you’re interested in learning more or giving us feedback, check out these links:

Upgrade to the latest version of the gh CLI to level up your usage of GitHub Projects!

Zero traffic cost for Kafka consumers

Post Syndicated from Grab Tech original https://engineering.grab.com/zero-traffic-cost

Introduction

Coban, Grab’s real-time data streaming platform team, has been building an ecosystem around Kafka, serving all Grab verticals. Along with stability and performance, one of our priorities is also cost efficiency.

In this article, we explain how the Coban team has substantially reduced Grab’s annual cost for data streaming by enabling Kafka consumers to fetch from the closest replica.

Problem statement

The Grab platform is primarily hosted on AWS cloud, located in one region, spanning over three Availability Zones (AZs). When it comes to data streaming, both the Kafka brokers and Kafka clients run across these three AZs.

Figure 1 – Initial design, consumers fetching from the partition leader

Figure 1 shows the initial design of our data streaming platform. To ensure high availability and resilience, we configured each Kafka partition to have three replicas. We have also set up our Kafka clusters to be rack-aware (i.e. 1 “rack” = 1 AZ) so that all three replicas reside in three different AZs.

The problem with this design is that it generates staggering cross-AZ network traffic. This is because, by default, Kafka clients communicate only with the partition leader, which has a 67% probability of residing in a different AZ.

This is a concern as we are charged for cross-AZ traffic as per AWS’s network traffic pricing model. With this design, our cross-AZ traffic amounted to half of the total cost of our Kafka platform.

The Kafka cross-AZ traffic for this design can be broken down into three components as shown in Figure 1:

  • Producing (step 1): Typically, a single service produces data to a given Kafka topic. Cross-AZ traffic occurs when the producer does not reside in the same AZ as the partition leader it is producing data to. This cross-AZ traffic cost is minimal, because the data is transferred to a different AZ at most once (excluding retries).
  • Replicating (step 2): The ingested data is replicated from the partition leader to the two partition followers, which reside in two other AZs. The cost of this is also relatively small, because the data is only transferred to a different AZ twice.
  • Consuming (step 3): Most of the cross-AZ traffic occurs here because there are many consumers for a single Kafka topic. Similar to the producers, the consumers incur cross-AZ traffic when they do not reside in the same AZ as the partition leader. However, on the consuming side, cross-AZ traffic can occur as many times as there are consumers (on average, two-thirds of the number of consumers). The solution described in this article addresses this particular component of the cross-AZ traffic in the initial design.

Solution

Kafka 2.3 introduced the ability for consumers to fetch from partition replicas. This opens the door to a more cost-efficient design.

Figure 2 – Target design, consumers fetching from the closest replica

Step 3 of Figure 2 shows how consumers can now consume data from the replica that resides in their own AZ. Implementing this feature requires rack-awareness and extra configurations for both the Kafka brokers and consumers. We will describe this in the following sections.

The Coban journey

Kafka upgrade

Our journey started with the upgrade of our legacy Kafka clusters. We decided to upgrade them directly to version 3.1, in favour of capturing bug fixes and optimisations over version 2.3. This was a safe move as version 3.1 was deemed stable for almost a year and we projected no additional operational cost for this upgrade.

To perform an online upgrade with no disruptions for our users, we broke down the process into three stages.

  • Stage 1: Upgrading Zookeeper. All versions of Kafka are tested by the community with a specific version of Zookeeper. To ensure stability, we followed this same process. The upgraded Zookeeper would be backward compatible with the pre-upgrade version of Kafka which was still in use at this early stage of the operation.
  • Stage 2: Rolling out the upgrade of Kafka to version 3.1 with an explicit backward-compatible inter-broker protocol version (inter.broker.protocol.version). During this progressive rollout, the Kafka cluster is temporarily composed of brokers with heterogeneous Kafka versions, but they can communicate with one another because they are explicitly set up to use the same inter-broker protocol version. At this stage, we also upgraded Cruise Control to a compatible version, and we configured Kafka to import the updated cruise-control-metrics-reporter JAR file on startup.
  • Stage 3: Upgrading the inter-broker protocol version. This last stage makes all brokers use the most recent version of the inter-broker protocol. During the progressive rollout of this change, brokers with the new protocol version can still communicate with brokers on the old protocol version.

Configuration

Enabling Kafka consumers to fetch from the closest replica requires a configuration change on both Kafka brokers and Kafka consumers. They also need to be aware of their AZ, which is done by leveraging Kafka rack-awareness (1 “rack” = 1 AZ).

Brokers

In our Kafka brokers’ configuration, we already had broker.rack set up to distribute the replicas across different AZs for resiliency. Our Ansible role for Kafka automatically sets it with the AZ ID that is dynamically retrieved from the EC2 instance’s metadata at deployment time.

- name: Get availability zone ID
  uri:
    url: http://169.254.169.254/latest/meta-data/placement/availability-zone-id
    method: GET
    return_content: yes
  register: ec2_instance_az_id

Note that we use AWS AZ IDs (suffixed az1, az2, az3) instead of the typical AWS AZ names (suffixed 1a, 1b, 1c) because the latter’s mapping is not consistent across AWS accounts.

Also, we added the new replica.selector.class parameter, set with value org.apache.kafka.common.replica.RackAwareReplicaSelector, to enable the new feature on the server side.

Consumers

On the Kafka consumer side, we mostly rely on Coban’s internal Kafka SDK in Golang, which streamlines how service teams across all Grab verticals utilise Coban Kafka clusters. We have updated the SDK to support fetching from the closest replica.

Our users only have to export an environment variable to enable this new feature. The SDK then dynamically retrieves the underlying host’s AZ ID from the host’s metadata on startup, and sets a new client.rack parameter with that information. This is similar to what the Kafka brokers do at deployment time.

We have also implemented the same logic for our non-SDK consumers, namely Flink pipelines and Kafka Connect connectors.

Impact

We rolled out fetching from the closest replica at the turn of the year and the feature has been progressively rolled out on more and more Kafka consumers since then.

Figure 3 – Variation of our cross-AZ traffic before and after enabling fetching from the closest replica

Figure 3 shows the relative impact of this change on our cross-AZ traffic, as reported by AWS Cost Explorer. AWS charges cross-AZ traffic on both ends of the data transfer, thus the two data series. On the Kafka brokers’ side, less cross-AZ traffic is sent out, thereby causing the steep drop in the dark green line. On the Kafka consumers’ side, less cross-AZ traffic is received, causing the steep drop in the light green line. Hence, both ends benefit by fetching from the closest replica.

Throughout the observeration period, we maintained a relatively stable volume of data consumption. However, after three months, we observed a substantial 25% drop in our cross-AZ traffic compared to December’s average. This reduction had a direct impact on our cross-AZ costs as it directly correlates with the cross-AZ traffic volume in a linear manner.

Caveats

Increased end-to-end latency

After enabling fetching from the closest replica, we have observed an increase of up to 500ms in end-to-end latency, that comes from the producer to the consumers. Though this is expected by design, it makes this new feature unsuitable for Grab’s most latency-sensitive use cases. For these use cases, we retained the traditional design whereby consumers fetch directly from the partition leaders, even when they reside in different AZs.

Figure 4 – End-to-end latency (99th percentile) of one of our streams, before and after enabling fetching from the closest replica

Inability to gracefully isolate a broker

We have also verified the behaviour of Kafka clients during a broker rotation; a common maintenance operation for Kafka. One of the early steps of our corresponding runbook is to demote the broker that is to be rotated, so that all of its partition leaders are drained and moved to other brokers.

In the traditional architecture design, Kafka clients only communicate with the partition leaders, so demoting a broker gracefully isolates it from all of the Kafka clients. This ensures that the maintenance is seamless for them. However, by fetching from the closest replica, Kafka consumers still consume from the demoted broker, as it keeps serving partition followers. When the broker effectively goes down for maintenance, those consumers are suddenly disconnected. To work around this, they must handle connection errors properly and implement a retry mechanism.

Potentially skewed load

Another caveat we have observed is that the load on the brokers is directly determined by the location of the consumers. If they are not well balanced across all of the three AZs, then the load on the brokers is similarly skewed. At times, new brokers can be added to support an increasing load on an AZ. However, it is undesirable to remove any brokers from the less loaded AZs as more consumers can suddenly relocate there at any time. Having these additional brokers and underutilisation of existing brokers on other AZs can also impact cost efficiency.

Figure 5 – Average CPU utilisation by AZ of one of our critical Kafka clusters

Figure 5 shows the CPU utilisation by AZ for one of our critical Kafka clusters. The skewage is visible after 01/03/2023. To better manage this skewage in load across AZs, we have updated our SDK to expose the AZ as a new metric. This allows us to monitor the skewness of the consumers and take measures proactively, for example, moving some of them to different AZs.

What’s next?

We have implemented the feature to fetch from the closest replica on all our Kafka clusters and all Kafka consumers that we control. This includes internal Coban pipelines as well as the managed pipelines that our users can self-serve as part of our data streaming offering.

We are now evangelising and advocating for more of our users to adopt this feature.

Beyond Coban, other teams at Grab are also working to reduce their cross-AZ traffic, notably, Sentry, the team that is in charge of Grab’s service mesh.

Join us

Grab is the leading superapp platform in Southeast Asia, providing everyday services that matter to consumers. More than just a ride-hailing and food delivery app, Grab offers a wide range of on-demand services in the region, including mobility, food, package and grocery delivery services, mobile payments, and financial services across 428 cities in eight countries.

Powered by technology and driven by heart, our mission is to drive Southeast Asia forward by creating economic empowerment for everyone. If this mission speaks to you, join our team today!

Accessibility considerations behind code search and code view

Post Syndicated from milemons original https://github.blog/2023-07-06-accessibility-considerations-behind-code-search-and-code-view/

GitHub prides itself on being the home for all developers, including developers with disabilities. Accessibility is a core priority for all new projects at GitHub, so it was top of mind when we started our project to rework code search and the code view at GitHub. With the old code view, some developers preferred to look at raw code rather than code view due to accessibility barriers, and that’s what we set out to fix. This blog post will shed light on our process and three major tasks that required thoughtful design and implementation—code search and query builder, the file tree, and navigating code by keyboard.

Process

We worked with a team of experts at GitHub dedicated to accessibility, since while we are confident in our development skills, accessibility has many nuances and requires a large depth of knowledge to get right. This team helped us immensely in three main ways:

  1. External auditing
    In this project, we performed accessibility auditing on all of our features. This meant that another team of auditors reviewed our webpage with all the changes implemented to find accessibility errors. They used tools including screen readers, color contrast tools, and more, to identify areas that users with disabilities may find hard to use. Once those issues were identified, the accessibility team would take a look at those issues and suggest a proper solution to the problem. Then, it was up to us to implement the solution and collaborate with the team where we needed additional assistance.
  2. Design reviews
    The user interface for code search and code view were both entirely redesigned to support our new goals—to allow users to search, navigate, and understand code in a way they weren’t able to before. As a part of the design process, a team of accessibility designers reviewed the Figma mockups to determine proper HTML markup and tab order. Then, they included detailed explanations of what interactions should look like in order to meet our accessibility goals.
  3. Office hours
    The accessibility team at GitHub hosts weekly meetings where engineers can sign up and discuss how to solve problems with their features with the team and a consultant. The consultant is incredibly helpful and knowledgeable about how to properly address issues because he has lived experience with screen readers and accessibility.During these meetings, we were able to discuss complicated issues, such as the following: proper filtering for code search, making an accessible file tree, and navigating code on a keyboard, along with other issues like tab order, and focus management across the whole feature.

Implementation details

This has been written about frequently on our blog—from one post on the details of QueryBuilder, our implementation of an accessible finder component to details about what navigating code search accessibly looks like. Those two posts are great reads and I strongly recommend checking them out, but they’re not the only thing that we’ve worked on. Thanks to @lindseywild, @smockle, @kendallgassner, @owenniblock, and @khiga8 for their guidance and help resolving issues with code search. This is still a work in progress, especially in areas like the filtering behavior on the search pages.

Two areas that also required careful consideration were managing focus after changing the sort order of search results and how to announce the result of the search for screen reader users.

Changing sort—changing focus?

When we first implemented this sort dropdown for non-code search types, if you navigated to it with your keyboard and then selected a different sort option, the whole page would reload and your focus moved back to the header. Our preferred, accessible behavior is that, when a dropdown menu is closed, focus returns to the button that opened the menu. However, our problem was that the “Sort” dropdown didn’t merely perform client-side operations like most dropdowns where you select an option. In this case, once a user selects an option, we do a full page navigation to perform the new search with the sort order added. This meant that the focus was being placed back on the header by default after the page navigation, instead of returning to the sort dropdown. For sighted mouse users, this is a nonissue; for sighted keyboard users, it is unexpected and annoying; for blind users, this is confusing and makes the product hard to use. To fix this, we had to make sure we returned focus to the dropdown after reloading the page.

Screenshot of search results. I have searched “react” and the “Repositories” filter by item is selected. There are 2.2M results, found in 1 second. The "Sort By" dropdown is open with “Best match” selected. The other options are “Most stars”, “Fewest stars”, “Most forks”, “Fewest forks”, “Recently updated”, and “Least recently updated”.

Announcing search results

When a sighted user types in the search bar and presses ‘Enter’ they quickly receive feedback that the search has completed and whether or not they found any results by looking at the page. For screen reader users, though, how to give the feedback that there were results, how many, or if there was an error requires more thought. One solution could be to place focus on the first result. That has a number of problems though.

  1. The user will not receive feedback about the number of search results and may think there’s only one.
  2. The user may miss important context like the Single sign on banner.
  3. The user will have to tab through more elements if they want to get back.

Another solution could be to use aria-live announcements to read out the number of results and success. This has its own problems.

  1. We already have an announcement on page navigation to read out the new title and these two announcements would compete or cause a race condition.
  2. There isn’t a way to programmatically force announcements to be read in order on page load.
  3. Some screen reader users have aria-live announcements turned off since they can be annoying.

After some discussion, we decided to focus and read out the header with the number of search results after a search and allow users to explore for errors, banners, or results on their own once they know how many results they received.

A screenshot of search results showing 0 results and an error message saying, “Invalid repository name.” I have searched “repo:asdfghijkl." The “Code” filter item is selected. There is also some help text on the page that says “Your search did not match any code. However, we found 544k packages that matched your search query. Alternatively, try one of the tips below.

Tree navigation

We knew when redesigning the code viewing experience that we wanted to include the tree panel to allow users to quickly switch between folders or files, because understanding code often requires looking in multiple places. We started the project by making our own tree to the aria spec, but it was too verbose. To fix this, our accessibility and design teams created the TreeView, which is open source. This was implemented to support various generic list elements and use proper HTML structure to make navigating through the tree a breeze, including typeahead (the ability to type a bit and have focus move to the first matching element), proper announcements for asynchronous loading of deeply nested items, and proper IDs for all elements that are guaranteed to be unique (that is, not constructed from their contents which may be the same). The valid markup for a tree view is very specific and developing it requires careful reviews for common issues, like invalid child item types under a role="group" element or using nested list elements without considering screen reader support, which is unlike most TreeView implementations on the internet. For more information about the design details for the tree view, check out the markdown documentation. Thanks to @colebemis, @mperrotti, and @ericwbailey for the work on this.

Reading and navigating code by keyboard

Before the new code view, reading code on GitHub wasn’t a great experience for screen reader users. The old experience presented code as a table—a hidden detail for sighted users but a major hurdle for screen readers, since code isn’t a table, and the semantics didn’t make sense in that context. For example, in code, whitespace has meaning. Whether stylistic or functional, that whitespace gets lost for screen reader users when the code is presented as a table. In addition, table semantics force users into line-by-line navigation, instead of character-by-character or word-by-word navigation. For many users, these hurdles meant that they mostly used GitHub just enough to be able to access the raw code or use a code editor for reading code. Since we want to support all our users, we knew we needed to totally rethink the way we structured code in the DOM.

This problem became even more complicated when we introduced symbols and the symbols panel. Mouse users are able to click on a “symbol” in the code—a special code element, like a function name—to see extra details about it, including references and definitions, in the symbol panel. They can then explore the code more deeply, navigating between lines of code where that symbol is found to investigate and understand the code better. This ability to dive deep has been game changing for many developers. However, for keyboard users, it doesn’t work. At best, a keyboard user can use the “Open symbols panel” button in the code header and then filter all symbol definitions for one they are interested in, but this doesn’t allow users to access symbol references when no definitions are found in a file. In addition, this flow really isn’t the same—if we want to support all developers, then we need to offer keyboard users a way to navigate through the code and select symbols they are interested in.

In addition, for many performance reasons mentioned in the post “Crafting a better, faster code view,” we introduced virtualization to the code viewer which created its own accessibility problems—not having all elements in the DOM can interfere with screen readers and overriding the cmd / ctrl + f shortcut is generally bad practice for screen readers as well. In addition, virtualization posed a problem for selecting text outside of the virtualization window.

This is when we came up with the solution of using a cursor from a <textarea> or a <div> that has the property contentEditable. This solution is modeled after Monaco, the text editor that powers VS Code. <textarea> elements, when not marked as readOnly, and contentEditiable<div> elements have a built in cursor that allows screen reader users to navigate code in their preferred manner using their built in screen reader settings. While a contentEditiable <div> would support syntax highlighting and the deep interactions we needed, screen readers don’t support them well1 which defeats the purpose of the cursor. As a result, we decided to go with the <textarea> However, <textarea> elements do not support syntax highlighting or deeper interactions like selecting symbols, which meant we needed to use both the <textarea> as a hidden element and syntax highlighted elements aligned perfectly above. Since we hide the text element, we need to add a visual “fake” cursor to show and keep it in sync with the “real” <textarea> cursor.

While the <textarea> and cursor help with our goals of allowing screen reader users and keyboard users to navigate code and symbols easily, they also ended up helping us with some of the problems we had run into with virtualization. One example of this was the cmd + f problem that we talk about more in depth in the blog post here. Another problem this solved was the drag and select behavior (or select all) for long files. Since the <textarea> is just one DOM node, we are able to load the whole file contents and select the contents directly from the <textarea> instead of the virtualized syntax highlighted version.

Unfortunately, while the <textarea> solved many problems we had, it also introduced a few other tricky ones. Since we have two layers of text, one hidden unless selected and one visual, we need to make sure that the scroll states are aligned. To do this, we have written observers to watch when one scrolls and mimic the scroll on the other. In addition, we often need to override the default <textarea> behaviors for some events—such as the middle click on mouse which was taking users all the way to the bottom of the code. Along with that issue, different browsers handle <textarea>s differently and making sure our solution behaves properly on all browsers has proven to be time intensive to say the least. In addition, we found that some browsers, like Firefox, allow users to customize their font size using Text zoom, which would apply to the formatted text but not the <textarea>. This led to “ghost text” issues with selection. We were able to resolve that by measuring the height of the text that is rendered and passing that to the <textarea>, though there are still some issues with certain plugins that modify text. We are still working to resolve these specific issues as well. In addition, the <textarea> currently does not work with our Wrap lines view option, which we are working to fix. Thanks especially to @joycezhu, @andrialexandrou, @adamshwert, and @jbrown1618 who put in a ton of work here.

Always iterating

We have taken huge strides to improve accessibility for all developers, but we recognize that we aren’t all the way there. It can be challenging to accommodate all developers, but we are committed to improving and iterating on what we have until we get it right. We want our tools to support everyone to access and explore code. We still have work—a lot of work—to do across GitHub, but we are excited for this journey.

To learn more about accessibility at GitHub, go to accessibility.github.com.


  1. For more information about contentEditable and screen readers, see this article written by @joycezhu from our Accessibility Engineering team. 

Go module proxy at Grab

Post Syndicated from Grab Tech original https://engineering.grab.com/go-module-proxy

At Grab, we rely heavily on a large Go monorepo for backend development, which offers benefits like code reusability and discoverability. However, as we continue to grow, managing a large monorepo brings about its own set of unique challenges.

As an example, using Go commands such as go get and go list can be incredibly slow when fetching Go modules residing in a large multi-module repository. This sluggishness takes a toll on developer productivity, burdens our Continuous Integration (CI) systems, and strains our Version Control System host (VCS), GitLab.

In this blog post, we look at how Athens, a Go module proxy, helps to improve the overall developer experience of engineers working with a large Go monorepo at Grab.

Key highlights

  • We reduced the time of executing the go get command from ~18 minutes to ~12 seconds when fetching monorepo Go modules.
  • We scaled in and scaled down our entire Athens cluster by 70% by utilising the fallback network mode in Athens along with Golang’s GOVCS mode, resulting in cost savings and enhanced efficiency.

Problem statements and solutions

1. Painfully slow performance of Go commands

Problem summary: Running the go get command in our monorepo takes a considerable amount of time and can lead to performance degradation in our VCS.

When working with the Go programming language, go get is one of the most common commands that you’ll use every day. Besides developers, this command is also used by CI systems.

What does go get do?

The go get command is used to download and install packages and their dependencies in Go. Note that it operates differently depending on whether it is run in legacy GOPATH mode or module-aware mode. In Grab, we’re using the module-aware mode in a multi-module repository setup.

Every time go get is run, it uses Git commands, like git ls-remote, git tag, git fetch, etc, to search and download the entire worktree. The excessive use of these Git commands on our monorepo contributes to the long processing time and can be strenuous to our VCS.

How big is our monorepo?

To fully grasp the challenges faced by our engineering teams, it’s crucial to understand the vast scale of the monorepo that we work with daily. For this, we use git-sizer to analyse our monorepo.

Here’s what we found:

  • Overall repository size: The monorepo has a total uncompressed size of 69.3 GiB, a fairly substantial figure. To put things into perspective, the Linux kernel repository, known for its vastness, currently stands at 55.8 GiB.
  • Trees: The total number of trees is 3.21M and tree entries are 99.8M, which consume 3.65 GiB. This may cause performance issues during some Git operations.
  • References: Totalling 10.7k references.
  • Biggest checkouts: There are 64.7k directories in our monorepo. This affects operations like git status and git checkout. Moreover, our monorepo has a maximum path depth of 20. This contributes to a slow processing time on Git and negatively impacts developer experience. The number of files (354k) and the total size of files (5.08 GiB) are also concerns due to their potential impact on the repository’s performance.

To draw a comparison, refer to the git-sizer output of the Linux repository.

How slow is “slow”?

To illustrate the issue further, we will compare the time taken for various Go commands to fetch a single module in our monorepo at a 10 MBps download speed.

This is an example of how a module is structured in our monorepo:

gitlab.company.com/monorepo/go
  |-- go.mod
  |-- commons/util/gk
        |-- go.mod
Go commands GOPROXY Previously cached? Description Result (time taken)
go get -x gitlab.company.com/monorepo/go/commons/util/gk proxy.golang.org,direct Yes Download and install the latest version of the module. This is a common scenario that developers often encounter. 18:50.71 minutes
go get -x gitlab.company.com/monorepo/go/commons/util/gk proxy.golang.org,direct No Download and install the latest version of the module without any module cache 1:11:54.56 hour
go list -x -m -json -versions gitlab.company.com/monorepo/go/util/gk proxy.golang.org,direct Yes List information about the module 3.873 seconds
go list -x -m -json -versions gitlab.company.com/monorepo/go/util/gk proxy.golang.org,direct No List information about the module without any module cache 3:18.58 minutes

In this example, using go get to fetch a module took over 18 minutes to complete. If we needed to retrieve more than one module in our monorepo, it can be incredibly time-consuming.

Why is it slow in a monorepo?

In a large Go monorepo, go get commands can be slow due to several factors:

  1. Large number of files and directories: When running go get, the command needs to search and download the entire worktree. In a large multi-module monorepo, the vast number of files and directories make this search process very expensive and time-consuming.
  2. Number of refs: A large number of refs (branches or tags) in our monorepo can affect performance. Ref advertisements (git ls-remote), which contain every ref in our monorepo, are the first phase in any remote Git operation, such as git clone or git fetch. With a large number of refs, performance takes a hit when performing these operations.
  3. Commit history traversal: Operations that need to traverse a repository’s commit history and consider each ref will be slow in a monorepo. The larger the monorepo, the more time-consuming these operations become.

The consequences: Stifled productivity and strained systems

Developers and CI

When Go command operations like go get are slow, they contribute to significant delays and inefficiencies in software development workflows. This leads to reduced productivity and demotivated developers.

Optimising Go command operations’ speed is crucial to ensure efficient software development workflows and high-quality software products.

Version Control System

It’s also worth noting that overusing go get commands can also lead to performance issues for VCS. When Go packages are frequently downloaded using go get, we saw that it caused a bottleneck in our VCS cluster, which can lead to performance degradation or even cause rate-limiting queue issues.

This negatively impacts the performance of our VCS infrastructure, causing delays or sometimes unavailability for some users and CI.

Solution: Athens + fallback Network Mode + GOVCS + Custom Cache Refresh Solution

Problem summary: Speed up go get command by not fetching from our VCS

We addressed the speed issue by using Athens, a proxy server for Go modules (read more about the GOPROXY protocol).

How does Athens work?

The following sequence diagram describes the default flow of go get command with Athens.

Athens uses a storage system for Go module packages, which can also be configured to use various storage systems such as Amazon S3, and Google Cloud Storage, among others.

By caching these module packages in storage, Athens can serve the packages directly from storage rather than requesting them from an upstream VCS while serving Go commands such as go mod download and certain go build modes. However, just using a Go module proxy didn’t fully resolve our issue since the go get and go list commands still hit our VCS through the proxy.

With this in mind, we thought “what if we could just serve the Go modules directly from Athens’ storage for go get?” This question led us to discover Athens network mode.

What is Athens network mode?

Athens NetworkMode configures how Athens will return the results of the Go commands. It can be assembled from both its own storage and the upstream VCS. As of Athens v0.12.1, it currently supports these 3 modes:

  1. strict: merge VCS versions with storage versions, but fail if either of them fails.
  2. offline: only get storage versions, never reach out to VCS.
  3. fallback: only return storage versions, if VCS fails. Fallback mode does the best effort of giving you what’s available at the time of requesting versions.

Our Athens clusters were initially set to use strict network mode, but this was not ideal for us. So we explored the other network modes.

Exploring offline mode

We initially sought to explore the idea of putting Athens in offline network mode, which would allow Athens to serve Go requests only from its storage. This concept aligned with our aim of reducing VCS hits while also leading to significant performance improvement in Go workflows.

However in practice, it’s not an ideal approach. The default Athens setup (strict mode) automatically updates the module version when a user requests a new module version. Nevertheless, switching Athens to offline mode would disable the automatic updates as it wouldn’t connect to the VCS.

Custom cache refresh solution

To solve this, we implemented a CI pipeline that refreshes Athens’ module cache whenever a new module is released in our monorepo. Employing this with offline mode made Athens effective for the monorepo but it resulted in the loss of automatic updates for other repositories

Restoring this feature requires applying our custom cache refresh solution to all other Go repositories. However, implementing this workaround can be quite cumbersome and significant additional time and effort. We decided to look for another solution that would be easier to maintain in the long run.

A balanced approach: fallback Mode and GOVCS

This approach builds upon our aforementioned custom cache refresh which is specifically designed for the monorepo.

We came across the GOVCS environment variable, which we use in combination with the fallback network mode to effectively put only the monorepo in “offline” mode.

When GOVCS is set to gitlab.company.com/monorepo/go:off, Athens encounters an error whenever it tries to fetch modules from VCS:

gitlab.company.com/monorepo/go/commons/util/[email protected]: unrecognized import path "gitlab.company.com/monorepo/go/commons/util/gk": GOVCS disallows using git for private gitlab.company.com/monorepo/go; see 'go help vcs'

If Athens network mode is set to strict, Athens returns 404 errors to the user. By switching to fallback mode, Athens tries to retrieve the module from its storage if a GOVCS failure occurs.

Here’s the updated Athens configuration (example default config):

GoBinaryEnvVars = ["GOPROXY=direct", 
"GOPRIVATE=gitlab.company.com", 
"GOVCS=gitlab.company.com/monorepo/go:off"]

NetworkMode = "fallback"

With the custom cache refresh solution coupled with this approach, we not only accelerate the retrieval of Go modules within the monorepo but also allow for automatic updates for non-monorepo Go modules.

Final results

This solution resulted in a significant improvement in the performance of Go commands for our developers. With Athens, the same command is completed in just ~12 seconds (down from ~18 minutes), which is impressively fast.

Go commands GOPROXY Previously cached? Description Result (time taken)
go get -x gitlab.company.com/monorepo/go/commons/util/gk goproxy.company.com Yes Download and install the latest version of the module. This is a common scenario that developers often encounter. 11.556 seconds
go get -x gitlab.company.com/monorepo/go/commons/util/gk goproxy.company.com No Download and install the latest version of the module without any module cache 1:05.60 minutes
go list -x -m -json -versions gitlab.company.com/monorepo/go/util/gk goproxy.company.com Yes List information about the monorepo module 0.592 seconds
go list -x -m -json -versions gitlab.company.com/monorepo/go/util/gk goproxy.company.com No List information about the monorepo module without any module cache 1.023 seconds
Average cluster CPU utlisation
Average cluster memory utlisation

In addition, this change to our Athens cluster also leads to substantial reduction in average cluster CPU and memory utilisation. This also enabled us to scale in and scale down our entire Athens cluster by 70%, resulting in cost savings and enhanced efficiency. On top of that, we were also able to effectively eliminate VCS’s rate-limiting issues while making the monorepo’s command operation considerably faster.

2. Go modules in GitLab subgroups

Problem summary: Go modules are unable to work natively with private or internal repositories under GitLab subgroups.

When it comes to managing code repositories and packages, GitLab subgroups and Go modules have become an integral part of the development process at Grab. Go modules help to organise and manage dependencies, and GitLab subgroups provide an additional layer of structure to group related repositories together.

However, a common issue when using Go modules is that they do not work natively with private or internal repositories under a GitLab subgroup (see this GitHub issue).

For example, using go get to retrieve a module from gitlab.company.com/gitlab-org/subgroup/repo will result in a failure. This problem is not specific to Go modules, all repositories under the subgroup will face the same issue.

A cumbersome workaround

To overcome this issue, we had to use workarounds. One workaround is to authenticate the HTTPS calls to GitLab by adding authentication details to the .netrc file on your machine.

The following lines can be added to the .netrc file:

machine gitlab.company.com
    login [email protected]
    password <personal-access-token>

In our case, we are using a Personal Access Token (PAT) since we have 2FA enabled. If 2FA is not enabled, the GitLab password can be used instead. However, this approach would mean configuring the .netrc file in the CI environments as well as on the machine of every Go developer.

Solution: Athens + .netrc

A feasible solution is to set up the .netrc file in the Go proxy server. This method eliminates the need for N number of developers to configure their own .netrc files. Instead, the responsibility for this task is delegated to the Go proxy server.

3. Sharing common libraries

Problem summary: Distributing internal common libraries within a monorepo without granting direct repository access can be challenging.

At Grab, we work with various cross-functional teams, and some could have distinct network access like different VPNs. This adds complexity to sharing our monorepo’s internal common libraries with them. To maintain the security and integrity of our monorepo, we use a Go proxy for controlled access to necessary libraries.

The key difference between granting direct access to the monorepo via VCS and using a Go proxy is that the former allows users to read everything in the repository, while the latter enables us to grant access only to the specific libraries users need within the monorepo. This approach ensures secure and efficient collaboration across diverse network configurations.

Without Go module proxy

Without Athens, we would need to create a separate repository to store the code we want to share and then use a build system to automatically mirror the code from the monorepo to the public repository.

This process can be cumbersome and lead to inconsistencies in code versions between the two repositories, ultimately making it challenging to maintain the shared libraries.

Furthermore, copying code can lead to errors and increase the risk of security breaches by exposing confidential or sensitive information.

Solution: Athens + Download Mode File

To tackle this problem statement, we utilise Athens’ download mode file feature using an allowlist approach to specify which repositories can be downloaded by users.

Here’s an example of the Athens download mode config file:

downloadURL = "https://proxy.golang.org"

mode = "sync"

download "gitlab.company.com/repo/a" {
    mode = "sync"
}

download "gitlab.company.com/repo/b" {
    mode = "sync"
}

download "gitlab.company.com/*" {
    mode = "none"
}

In the configuration file, we specify allowlist entries for each desired repo, including their respective download modes. For example, in the snippet above, repo/a and repo/b are allowed (mode = “sync”), while everything else is blocked using mode = “none”.

Final results

By using Athens’ download mode feature in this case, the benefits are clear. Athens provides a secure, centralised place to store Go modules. This approach not only provides consistency but also improves maintainability, as all code versions are managed in one single location.

Additional benefits of Go proxy

As we’ve touched upon the impressive results achieved by implementing Athens Go proxy at Grab, it’s crucial to explore the supplementary advantages that accompany this powerful solution.

These unsung benefits, though possibly overlooked, play a vital role in enriching the overall developer experience at Grab and promoting more robust software development practices:

  1. Module immutability: ​​As the software world continues to face issues around changing or disappearing libraries, Athens serves as a useful tool in mitigating build disruptions by providing immutable storage for copied VCS code. The use of a Go proxy also ensures that builds remain deterministic, improving consistency across our software.
  2. Uninterrupted development: Athens allows users to fetch dependencies even when VCS is down, ensuring continuous and seamless development workflows.
  3. Enhanced security: Athens offers access control by enabling the blocking of specific packages within Grab. This added layer of security protects our work against potential risks from malicious third-party packages.
  4. Vendor directory removal: Athens prepares us for the eventual removal of the vendor directory, fostering faster workflows in the future.

What’s next?

Since adopting Athens as a Go module proxy, we have observed considerable benefits, such as:

  1. Accelerated Go command operations
  2. Reduced infrastructure costs
  3. Mitigated VCS load issues

Moreover, its lesser-known advantages like module immutability, uninterrupted development, enhanced security, and vendor directory transition have also contributed to improved development practices and an enriched developer experience for Grab engineers.

Today, the straightforward process of exporting three environment variables has greatly influenced our developers’ experience at Grab.

export GOPROXY="goproxy.company.com|proxy.golang.org,direct"

export GONOSUMDB="gitlab.company.com"

export GONOPROXY="none"

At Grab, we are always looking for ways to improve and optimise the way we work, so we contribute to open-sourced projects like Athens, where we help with bug fixes. If you are interested in setting up a Go module proxy, do give Athens (github.com/gomods/athens) a try!

Special thanks to Swaminathan Venkatraman, En Wei Soh, Anuj More, Darius Tan, and Fernando Christyanto for contributing to this project and this article.

Join us

Grab is the leading superapp platform in Southeast Asia, providing everyday services that matter to consumers. More than just a ride-hailing and food delivery app, Grab offers a wide range of on-demand services in the region, including mobility, food, package and grocery delivery services, mobile payments, and financial services across 428 cities in eight countries.

Powered by technology and driven by heart, our mission is to drive Southeast Asia forward by creating economic empowerment for everyone. If this mission speaks to you, join our team today!

Crafting a better, faster code view

Post Syndicated from Joshua Brown original https://github.blog/2023-06-21-crafting-a-better-faster-code-view/

Reading code is not as simple as reading the text of a file end-to-end. It is a non-linear, sometimes chaotic process of jumping between files to follow a trail, building a mental picture of how code relates to its surrounding context. GitHub’s mission is to be the home for all developers, and reading code is one of the core experiences we offer. Every day, millions of users use GitHub to view and interact with code. So, about a year ago we set out to create a new code view that supports the entire code reading experience with features like a file tree, symbol navigation, code search integration, sticky lines, and code section folding. The new code view is powerful, intelligent, and interactive, but it is not an attempt to turn the repository browsing experience into an IDE.

While building the new code view, our team had a few guiding principles on which we refused to compromise:

  • It must add these powerful new features to transform how users read code on GitHub.
  • It must be intuitive and easy to use for all of GitHub’s millions of users.
  • It must be fast.

Initial efforts

The first step was to build out the features we wanted in a natural, straightforward way, taking the advice that “premature optimization is the root of all evil.”1 After all, if simple code satisfactorily solves our problems, then we should stop there. We knew we wanted to build a highly interactive and stateful code viewing experience, so we decided to use React to enable us to iterate more quickly on the user interface. Our initial implementation for the code blob was dead-simple: our syntax highlighting service converted the raw file contents to a list of HTML strings corresponding to the lines of the file, and each of these lines was added to the document.

There was one key problem: our performance scaled badly with the number of lines in the file. In particular, our LCP and TTI times measurably increased at around 500 lines, and this increase became noticeable at around 2,000 lines. Around those same thresholds, interactions like highlighting a line or collapsing a code section became similarly sluggish. We take these performance metrics seriously for a number of reasons. Most importantly, they are user-centric—that is, they are meant to measure aspects of the quality of a user’s experience on the page. On top of that, they are also part of how search engines like Google determine where to rank pages in their search results; fast pages get shown first, and the code view is one of the many ways GitHub’s users can show their work to the world.

As we dug in, we discovered that there were a few things at play:

  • When there are many DOM nodes on the page, style calculations and paints take longer.
  • When there are many DOM nodes on the page, DOM queries take longer, and the results can have a significant memory footprint.
  • When there are many React nodes on the page, renders and DOM reconciliation both take longer.

It’s worth noting that none of these are problems with React specifically; any page with a very large DOM would experience the first two problems, and any solution where a large DOM is created and managed by JavaScript would experience the third.

We mitigated these problems considerably by ensuring that we were not running these expensive operations more than necessary. Typical React optimization techniques like memoization and debouncing user input, as well as some less common solutions like pulling in an observer pattern went a long way toward ensuring that React state updates, and therefore DOM updates, only occurred as needed.

Mitigating the problem, however, is not solving the problem. Even with all of these optimizations in place, the initial render of the page remained a fundamentally expensive operation for large files. In the repository that builds GitHub.com, for example, we have a CODEOWNERS file that is about 18,000 lines long, and pushes the 2MB size limit for displaying files in the UI. With no optimizations besides the ones described above, React’s first pass at building the DOM for this page takes nearly 27 seconds.2 Considering more than half of users will abandon a page if it loads for more than three seconds, there was obviously lots of work left to do.

A promising but incomplete solution

Enter virtualization. Virtualization is a performance optimization technique that examines the scroll state of the page to determine what content to include in the DOM. For example, if we are viewing a 10,000 line file but only about 75 lines fit on the screen at a time, we can save lots of time by only rendering the lines that fit in the viewport. As the user scrolls, we add any lines that need to appear, and remove any lines that can disappear, as illustrated by this demo.3

This satisfies the most basic requirements of the page with flying colors. It loads on average more quickly than the existing experience, and the experience of scrolling through the file is nearly indistinguishable from the non-virtualized case. Remember that 27 second initial render? Virtualizing the file content gets that time down to under a second, and that number does not increase substantially even if we artificially remove our file size limit and pull in hundreds of megabytes of text.

Unfortunately, virtualization is not a cure-all. While our initial implementation added features to the page at the expense of performance, naïvely virtualizing the code lines delivers a fast experience at the expense of vital functionality. The biggest problem was that without the entire text of the file on the page at once, the browser’s built-in find-in-file only surfaced results that are visible in the viewport. Breaking users’ ability to find text on the page breaks our hard requirement that the page remain intuitive and easy to use. Before we could ship any of this to real users, we had to ensure that this use case would be covered.

The immediate solution was to implement our own version of find-in-file by implementing a custom handler for the Ctrl+F shortcut (⌘+F on Mac). We added a new piece of UI in the sidebar to show results as part of our integration with symbol navigation and code search.

Screenshot of the "find" sidebar, showing a search bar with the term "isUn" and a list offive lines of code from the current file that contain that string, the second of which is highlighted as selected.

There is precedent for overriding this native browser feature to allow users to find text in virtualized code lines. Monaco, the text editor behind VS Code, does exactly this to solve the same problem, as do many other online code editors, including Repl.it and CodePen. Some other editors like the official Ruby playground ignore the problem altogether and accept that Ctrl+F will be partially broken within their virtualized editor.

At the time, we felt confident leaning on this precedent. These examples are applications that run in a browser window, and as users, we expect applications to implement their own controls. Writing our own way to find text on the page was a step toward making GitHub’s Code View less of a web page and more of a web application.

When we released the new code view experience as a private beta at GitHub Universe, we received clear feedback that our users think of GitHub as a page, not as an app. We tried to rework the experience to be as similar as possible to the native implementation, both in terms of user experience and performance. But ultimately, there are plenty of good reasons not to override this kind of native browser behavior.

  • Users of assistive technologies often use Ctrl+F to locate elements on a page, so restricting the scope to the contents of the file broke these workflows.
  • Users rely heavily on specific muscle memory for common actions, and we followed a deep rabbit hole to get the custom control to support all of the shortcuts used by various browsers.
  • Finally, the native browser implementation is simply faster.

Despite plenty of precedent for an overridden find experience, this user feedback drove us to dig deeper into how we could lean on the browser for something it already does well.

Virtualization has an important role to play in our final product, but it is only one piece of the puzzle.

How the pieces fit together

Our complete solution for the code view features two pieces:

  1. A textarea that contains the entire text of the raw file. The contents are accessible, keyboard-navigable, copyable, and findable, yet invisible.
  2. A virtualized, syntax-highlighted overlay. The contents are visible, yet hidden from both mouse events and the browser’s find.

Together, these pieces deliver a code view that supports the complete code reading experience with many new features. Despite the added complexity, this new experience is faster to render than the static HTML page that has displayed code on GitHub for more than a decade.

A textarea and a read-only cursor

The first half of this solution came to us from an unexpected angle.

Beyond adding functionality to the code view, we wanted to improve the code reading experience for users of assistive technologies like screen readers. The previous code view was minimally accessible; a code document was displayed as a table, which created a very surprising experience for screen reader users. A code document is not a table, but likewise it is not a paragraph of text. To support a familiar interface for interacting with the code on the page, we added an invisible textarea underneath the virtualized, syntax-highlighted code lines so that users can move through the code with the keyboard in a familiar way. And for the browser, rendering a textarea is much simpler than using JavaScript to insert syntax-highlighted HTML. Browsers can render megabytes of text in a textarea with ease.

Since this textarea contains the entire text of the raw file, it is not just an accessibility feature, but an opportunity to remove our custom implementation of Ctrl+F in favor of native browser implementations.

Hiding text from Ctrl+F

With the addition of the textarea, we now have two copies of every line that is visible in the viewport: one in the textarea, and another in the virtualized, syntax-highlighted overlay. In this state, searching for text yields duplicated results, which is more confusing than a slow or unfamiliar experience.

The question, then, is how to expose only one copy of the text to the browser’s native Ctrl+F. That brings us to the next key part of our solution: how we hid the syntax-highlighted overlay from find.

For a code snippet like this line of Python:

print("Hello!")

the old code view created a bit of HTML that looks like this:

<span class="pl-en">print</span>(<span class="pl-s">"Hello!"</span>)

But the text nodes containing print, (,"Hello!", and ) are all findable. It took two iterations to arrive at a format that looks identical but is consistently hidden fromCtrl+F on all major browsers. And as it turns out, this is not a question that is very easy to research!

The first approach we tried relied on the fact that :before pseudoelements are not part of the DOM, and therefore do not appear in find results. With a bit of a change to our HTML format that moves all text into a data- attribute, we can use CSS to inject the code text into the page without any findable text nodes.

HTML

<span class="pl-en" data-code-text="print"></span>
<span data-code-text="("></span>
<span class="pl-s" data-code-text=""Hello!""></span>
<span data-code-text=")"></span>

CSS

[data-code-text]:before {
   content: attr(data-code-text);
}

But that’s not the end of the story, because the major browsers do not agree on whether text in :before pseudoelements should be findable; Firefox in particular has a powerful Ctrl+F implementation that is not fooled by our first trick.

Our second attempt relied on a fact on which all browsers seem to agree: that text in adjacent pseudoelements is not treated as a contiguous block of text.4 So, even though Firefox would find print in the first example, it would not find print(. The solution, then, is to break up the text character-by-character:

<span class="pl-en">
   <span data-code-text="p"></span>
   <span data-code-text="r"></span>
   <span data-code-text="i"></span>
   <span data-code-text="n"></span>
   <span data-code-text="t"></span>
</span>
<span data-code-text="("></span>
<span class="pl-s">
   <span data-code-text="""></span>
   <span data-code-text="H"></span>
   <span data-code-text="e"></span>
   <span data-code-text="l"></span>
   <span data-code-text="l"></span>
   <span data-code-text="o"></span>
   <span data-code-text="!"></span>
   <span data-code-text="""></span>
</span>
<span data-code-text=")"></span>

At first glance, this might seem to complicate the DOM so much that it might outweigh the performance gains for which we worked so hard. But since these lines are virtualized, we create this overlay for at most a few hundred lines at a time.

Syntax highlighting in a compact format

The path we took to build a faster code view with more features was, like the path one might follow when reading code in a new repository, highly non-linear. Performance optimizations led us to fix behaviors which were not quite right, and those behavior fixes led us to need further performance optimizations. Knowing how we wanted the HTML for the syntax-highlighted overlay to look, we had a few options for how to make it happen. After a number of experiments, we completed our puzzle with a performance optimization that ended this cycle without causing any behavior changes.

Our syntax-highlighting service previously gave us a list of HTML strings, one for each line of code:

[
   "<span class=\"pl-en\">print</span>(<span class=\"pl-s\">"Hello!"</span>)"
]

In order to display code in a different format, we introduced a new format that simply gives the locations and css classes of highlighted segments:

[
   [
       {"start": 0, "end": 5, "cssClass": "pl-en"},
       {"start": 6, "end": 14, "cssClass": "pl-s"}
   ]
]

From here, we can easily generate whatever HTML we want. And that brings us to our final optimization:

within our syntax-highlighted overlay, we save React the trouble of managing the code lines by generating the HTML strings ourselves. This can deliver a surprisingly large performance boost in certain cases, like scrolling all the way through the 18,000-line CODEOWNERS file mentioned earlier. With React managing the entire DOM, we hit the “end” key to move all the way to the end of the file, and it takes the browser 870 milliseconds to finish handling the “keyup” event, followed by 3,700 milliseconds of JavaScript blocking the main thread. When we generate the code lines as HTML strings, handling the “keyup” event takes only 80 milliseconds, followed by about 700 milliseconds of blocking JavaScript.5

In summary

GitHub’s mission is to be the home for all developers. Developers spend a substantial amount of their time reading code, and reading code is hard! We spent the past year building a new code view that supports the entire code reading experience because we are passionate about bringing great tools to the developers of the world to make their lives a bit easier.

After a lot of difficult work, we have created a code view that introduces tons of new features for understanding code in context, and those features can be used by anyone. And we did it all while also making the page faster!

We’re proud of what we built, and we would love for everyone to try it out and send us feedback!

Notes


  1. This quote, popularized by and often attributed to Donald Knuth, was first said by Sir Tony Hoare, the developer of the quicksort algorithm. 
  2. All performance metrics generated for this post use a development build of React in order to better compare apples to apples. 
  3. Check out the source code for this virtualization demo here! 
  4. The fact that browsers do not treat adjacent :before elements as part of the same block of text also introduces another complication: it resets the tab stop location for each node, which means that tabs are not rendered with the correct width! We need the syntax-highlighted overlay to align exactly with the text content underneath because any discrepancy creates a highly confusing user experience. Luckily, since the overlay is neither findable nor copyable, we can modify it however we like. The tab width problem is solved neatly by converting tabs to the appropriate number of spaces in the overlay. 
  5. Although code on GitHub is often nested deeply, the syntax information for a line of code can still be described linearly much of the time—we have a keyword followed by some plain text and then a string literal, etc. But sometimes it is not so simple—we might have a Markdown document with a code section. That code section might be an HTML document with a script tag. That script tag might contain JavaScript. That JavaScript might contain doc comments on a function. Those doc comments might contain @param tags which are rendered as keywords. We can handle this kind of arbitrarily nested syntax tree with a recursive React component. But that means the shape of our tree of React nodes, and therefore the amount of time it takes to perform DOM reconciliation, is determined by the code our users have chosen to write. On top of that, React adds DOM nodes one-at-a-time, and our overlay uses one DOM node per character of code. These are the main reasons that sidestepping React for this part of the page gives us such a dramatic performance boost. 

How to use GitHub Copilot: Prompts, tips, and use cases

Post Syndicated from Rizel Scarlett original https://github.blog/2023-06-20-how-to-write-better-prompts-for-github-copilot/

Leia este artigo em português

As ferramentas de programação de IA generativa estão transformando a maneira como as pessoas desenvolvedoras abordam as tarefas diárias de programação. Desde a documentação de nossas bases de código até a geração de testes de unidade, essas ferramentas estão ajudando a acelerar nossos fluxos de trabalho. No entanto, assim como acontece com qualquer tecnologia emergente, sempre há uma curva de aprendizado. Como resultado, as pessoas desenvolvedoras — tanto iniciantes quanto experientes — às vezes se sentem frustradas quando os assistentes de programação baseados em IA não geram o resultado desejado. (Familiar com isso?)

Por exemplo, ao pedir ao GitHub Copilot para desenhar uma casquinha de sorvete 🍦usando p5.js, uma biblioteca JavaScript para código criativo, continuamos recebendo sugestões irrelevantes ou, às vezes, nenhuma sugestão. Mas quando aprendemos mais sobre a maneira como o GitHub Copilot processa as informações, percebemos que precisávamos ajustar a maneira como nos comunicamos com elas.

Aqui está um exemplo do GitHub Copilot gerando uma solução irrelevante:

When we wrote this prompt to GitHub Copilot,

Quando ajustamos nosso prompt, conseguimos gerar resultados mais precisos:

When we wrote this prompt to GitHub Copilot,

Somos desenvolvedoras e entusiastas de IA. Eu, Rizel, usei o GitHub Copilot para criar uma extensão de navegador; jogo de pedra, papel e tesoura; e para enviar um Tweet. E eu, Michele, abri uma empresa de AI em 2021. Somos ambas Developer Advocates no GitHub e adoramos compartilhar nossas principais dicas para trabalhar com o GitHub Copilot.

Neste guia do GitHub Copilot, abordaremos:

  • O que exatamente é um prompt e o que é engenharia de prompt também (dica: depende se você está falando com uma pessoa desenvolvedora ou pesquisadora de machine learning)
  • Três práticas recomendadas e três dicas adicionais para criação imediata com o GitHub Copilot
  • Um exemplo em que você pode tentar solicitar ao GitHub Copilot para ajudá-lo a criar uma extensão de navegador

Progresso antes de perfeição

Mesmo com nossa experiência no uso de IA, reconhecemos que todes estão em uma fase de tentativa e erro com a tecnologia de IA generativa. Também conhecemos o desafio de fornecer dicas generalizadas de criação de prompts porque os modelos variam, assim como os problemas individuais nos quais as pessoas desenvolvedoras estão trabalhando. Este não é um guia definitivo. Em vez disso, estamos compartilhando o que aprendemos sobre criação de prompts para acelerar o aprendizado coletivo durante esta nova era de desenvolvimento de software.

O que é um prompt e o que é engenharia de prompt?

Depende de com quem você fala.

No contexto das ferramentas de programação de IA generativa, um prompt pode significar coisas diferentes, dependendo se você está perguntando a pessoas pesquisadoras de Machine Learning (ML) que estão construindo e ajustando essas ferramentas ou pessoas desenvolvedoras que as estão usando em seus IDEs.

Para este guia, definiremos os termos do ponto de vista de uma pessoa desenvolvedora que está usando uma ferramenta de programação AI generativa no IDE. Mas, para dar a você uma visão completa, também adicionamos as definições do pesquisador de ML abaixo em nosso gráfico.

Prompts Engenharia de Prompt Contexto
Pessoa Desenvolvedora Blocos de código, linhas individuais de código ou comentários em linguagem natural que uma pessoa desenvolvedora escreve para gerar uma sugestão específica do GitHub Copilot. Fornecer instruções ou comentários no IDE/strong> para gerar sugestões de código específicas. DDetalhes que são fornecidos por uma pessoa desenvolvedora para especificar a saída desejada de uma ferramenta de programação AI generativa.
Pessoa Pesquisadora de ML Compilação de código de IDE
e contexto
relevante (comentários IDE, código em arquivos abertos, etc.) que são continuamente gerados por algoritmos e enviados para o modelo de uma ferramenta de programação AI generativa
Criação de algoritmos que irão gerar prompts (compilações de código IDE e contexto) para um grande modelo de linguagem Detalhes (como dados de seus arquivos abertos e código que você escreveu antes e depois do cursor) que os algoritmos enviam para um modelo de linguagem grande (LLM) como informações adicionais sobre o código

3 melhores práticas para construção de prompt com GitHub Copilot

1. Defina o cenário com um objetivo de alto nível 🖼

Isso é mais útil se você tiver um arquivo em branco ou uma base de código vazia. Em outras palavras, se o GitHub Copilot não tiver contexto do que você deseja criar ou realizar, definir o cenário para a programação em par AI pode ser realmente útil. Isso ajuda a preparar o GitHub Copilot com uma descrição geral do que você deseja gerar – antes de entrar nos detalhes.

Ao solicitar o GitHub Copilot, pense no processo como uma conversa com alguém: como devo detalhar o problema para que possamos resolvê-lo juntes? Como eu abordaria a programação em par com essa pessoa?

Por exemplo, ao construir um editor de markdown em Next.jst, poderíamos escrever um comentário como este:


/*
Crie um editor de markdown básico em Next.jcom as seguintes habilidades:
- Use react hooks
- Crie um estado para markdown com texto default "digite markdown aqui"
- Uma área de texto onde pessoas usuárias podem escrever markdown a
- Mostre uma demostração ao vivo do markdown enquando a pessoas digitaS
- Suporte para sintaxe básica de markdown como cabeçalhos, negrito, itálico
- Use React markdown npm package 
- O texto markdown e resultado em HTML devem ser salvos no estado do componente e atualizado em tempo real 
*/

Isso solicitará que o GitHub Copilot gere o código a seguir e produza um editor de markdown muito simples, sem estilo, mas funcional, em menos de 30 segundos. Podemos usar o tempo restante para estilizar o componente:

We used this prompt to build a markdown editor in Next.jst using GitHub Copilot:
- Use react hooks
- Create state for markdown with default text

Observação: esse nível de detalhe ajuda a criar um resultado mais desejado, mas os resultados ainda podem ser não determinísticos. Por exemplo, no comentário, solicitamos ao GitHub Copilot que criasse um texto padrão que diz “digite markdown aqui”, mas, em vez disso, gerou “visualização de markdown” como as palavras padrão.

2. Faça sua pergunta simples e específica. Procure receber uma saída curta do GitHub Copilot.🗨

Depois de comunicar seu objetivo principal ao Copilot, articule a lógica e as etapas que ele precisa seguir para atingir esse objetivo. O GitHub Copilot entende melhor seu objetivo quando você detalha as coisas. (Imagine que você está escrevendo uma receita. Você dividiria o processo de cozimento em etapas discretas – não escreveria um parágrafo descrevendo o prato que deseja fazer.)

Deixe o GitHub Copilot gerar o código após cada etapa, em vez de pedir que ele gere vários códigos de uma só vez.

Aqui está um exemplo de nós fornecendo ao GitHub Copilot instruções passo a passo para reverter uma função:

We prompted GitHub Copilot to reverse a sentence by writing six prompts one at a time. This allowed GitHub Copilot to generate a suggestion for one prompt before moving onto the text. It also gave us the chance to tweak the suggested code before moving onto the next step. The six prompts we used were: First, let's make the first letter of the sentence lower case if it's not an 'I.' Next, let's split the sentence into an array of words. Then, let's take out the punctuation marks from the sentence. Now, let's remove the punctuation marks from the sentence. Let's reverse the sentence and join it back together. Finally, let's make the first letter of the sentence capital and add the punctuation marks.

3. De alguns exemplos para o GitHub Copilot. ✍

Aprender com exemplos não é útil apenas para humanos, mas também para seu programador Copilot. Por exemplo, queríamos extrair os nomes do array de dados abaixo e armazená-los em um novo array:


const data = [
  [
    { name: 'John', age: 25 },
    { name: 'Jane', age: 30 }
  ],
  [
    { name: 'Bob', age: 40 }
  ]
];

Quando você não mostra um exemplo para o GitHub Copilot …


// Map por um array de arrays de objetos para transformar dados
const data = [
  [
    { name: 'John', age: 25 },
    { name: 'Jane', age: 30 }
  ],
  [
    { name: 'Bob', age: 40 }
  ]
];

Isso gerou um uso incorreto do map:


const mappedData = data.map(x => [x.name](http://x.name/));

console.log(mappedData);

// Results: [undefined, undefined]

Em contraste, quando mostramos um exemplo …


// Map por um array de arrays de objetos
// Exemplo: Extraia nomes  array data
// Resultado desejado: ['John', 'Jane', 'Bob']
const data = [
  [{ name: 'John', age: 25 }, { name: 'Jane', age: 30 }],
  [{ name: 'Bob', age: 40 }]
];

Recebemos o resultado desejado.


const mappedData = data.flatMap(sublist => sublist.map(person => person.name));

console.log(mappedData);
// Results: ['John', 'Jane', 'Bob']

Leia mais sobre abordagens comuns para treinamento de IA, como aprendizado de disparo zero, disparo único e poucos disparos.

Três dicas adicionais para criação imediata com o GitHub Copilot

Aqui estão três dicas adicionais para ajudar a orientar sua conversa com o GitHub Copilot.

1. Experimente com seus prompts.

Assim como a conversa é mais uma arte do que uma ciência, o mesmo acontece com a criação imediata. Portanto, se você não receber o que deseja na primeira tentativa, reformule seu prompt seguindo as práticas recomendadas acima.

Por exemplo, o prompt abaixo é vago. Ele não fornece nenhum contexto ou limites para o GitHub Copilot gerar sugestões relevantes.


# Escreva algum código para grades.py

Repetimos o prompt para sermos mais específicos, mas ainda não obtivemos o resultado exato que procurávamos. Este é um bom lembrete de que adicionar especificidade ao seu prompt é mais difícil do que parece. É difícil saber, desde o início, quais detalhes você deve incluir sobre seu objetivo para gerar as sugestões mais úteis do GitHub Copilot. É por isso que encorajamos a experimentação.
A versão do prompt abaixo é mais específica que a anterior, mas não define claramente os requisitos de entrada e saída.


# Implemente uma função em grades.py para calcular a nota média

Experimentamos o prompt mais uma vez definindo limites e delineando o que queríamos que a função fizesse. Também reformulamos o comentário para que a função fosse mais clara (dando ao GitHub Copilot uma intenção clara de verificação).

Desta vez, obtivemos os resultados que procurávamos.


# Implemente a função calculate_average_grade em grades.py que recebe uma lista de notas como entrada e retorna a nota média como um número de ponto flutuante

2. Mantenha algumas abas abertas.

Não temos um número exato de abas que você deve manter abertas para ajudar o GitHub Copilot a contextualizar seu código, mas, com base em nossa experiência, descobrimos que uma ou duas são úteis.

O GitHub Copilot usa uma técnica chamada de abas vizinhas que permite que a ferramenta programadora em par AI contextualize seu código processando todos os arquivos abertos em seu IDE em vez de apenas um único arquivo em que você está trabalhando. No entanto, não é garantido que o GitHub Copilot considere todos os arquivos abertos como contexto necessário para o seu código.

3. Use boas práticas de programação.

Isso inclui fornecer nomes e funções de variáveis ​​descritivas e seguir estilos e padrões de codificação consistentes. Descobrimos que trabalhar com o GitHub Copilot nos encoraja a seguir boas práticas de programação que aprendemos ao longo de nossas carreiras.

Por exemplo, aqui usamos um nome de função descritivo e seguimos os padrões da base de código para alavancar casos de cobra.


def authenticate_user(username, password):

Como resultado, GitHub Copilot gera uma sugestão de código relevante:


def authenticate_user(username, password):
    # Code for authenticating the user
    if is_valid_user(username, password):
        generate_session_token(username)
        return True
    else:
        return False

Compare isso com o exemplo abaixo, onde introduzimos um estilo de programação inconsistente e nomeamos mal nossa função.


def rndpwd(l):

Em vez de sugerir código, o GitHub Copilot gerou um comentário que dizia: “O código vai aqui”.


def rndpwd(l):
    # Code goes here

Fique esperto

Os LLMs por trás das ferramentas de programação de IA generativas são projetados para encontrar e extrapolar padrões de seus dados de treinamento, aplicar esses padrões à linguagem existente e, em seguida, produzir código que siga esses padrões. Dada a escala desses modelos, eles podem gerar uma sequência de código que ainda nem existe. Assim como você revisaria o código de um colega, você deve sempre avaliar, analisar e validar o código gerado por IA.

Um exemplo de prática 👩🏽‍💻

Tente solicitar ao GitHub Copilot para criar uma extensão de navegador.

Para começar, você precisará ter o GitHub Copilot instalado e aberto em seu IDE. Também temos acesso a uma prévia do bate-papo do GitHub Copilot, que é o que usamos quando tiver dúvidas sobre o nosso código. Se você não tem bate-papo no GitHub Copilot, inscreva-se na lista de espera. Até então, você pode emparelhar o GitHub Copilot com o ChatGPT.

Guias de criação de IA mais generativos (em inglês)

<0l>

  • Um guia para iniciantes sobre engenharia de prompt com o GitHub Copilot
  • Engenharia de alerta para IA
  • Como o GitHub Copilot está melhorando a compreensão do seu código

  • Lee este articulo en español

    Las herramientas de codificación con IA generativa están transformando la forma en que los desarrolladores abordan las tareas de codificación diarias. Desde documentar nuestras bases de código hasta generar pruebas unitarias, estas herramientas están ayudando a acelerar nuestros flujos de trabajo. Sin embargo, como con cualquier tecnología emergente, siempre hay una curva de aprendizaje. Como resultado, los desarrolladores, tanto principiantes como experimentados, a veces se sienten frustrados cuando los asistentes de codificación impulsados por IA no generan el resultado que quieren. (¿Te suena familiar?)

    Por ejemplo, al pedirle a GitHub Copilot que dibuje un cono de helado 🍦 usando p5.js, una biblioteca de JavaScript para codificación creativa, seguimos recibiendo sugerencias irrelevantes, o a veces ninguna sugerencia en absoluto. Pero cuando aprendimos más sobre la forma en que GitHub Copilot procesa la información, nos dimos cuenta de que teníamos que ajustar la forma en que nos comunicábamos.

    Aquí hay un ejemplo de GitHub Copilot generando una solución irrelevante:

    When we wrote this prompt to GitHub Copilot,

    Cuando ajustamos nuestra instrucción, pudimos generar resultados más precisos:

    When we wrote this prompt to GitHub Copilot,

    Somos tanto desarrolladoras como entusiastas de la IA. Yo, Rizel, he utilizado GitHub Copilot para construir una extensión de navegador; un juego de piedra, papel o tijera; y para enviar un tweet. Y yo, Michelle, lancé una compañía de IA en 2016. Ambas somos DevRel en GitHub y nos encanta compartir nuestros mejores consejos para trabajar con GitHub Copilot.

    En esta guía para GitHub Copilot, cubriremos:

    • Qué es exactamente un “prompt” y qué es la ingeniería de prompts (pista: depende de si estás hablando con un desarrollador o con un investigador de aprendizaje automático)
    • Tres mejores prácticas y tres consejos adicionales para la creación de prompts con GitHub Copilot
    • Un ejemplo donde puedes probar a GitHub Copilot para que te ayude en la construcción de una extensión de navegador

    Progreso sobre perfección

    Incluso con nuestra experiencia usando IA, reconocemos que todos están en una fase de prueba y error con la tecnología de IA generativa. También conocemos el desafío de proporcionar consejos generales de elaboración de prompts porque los modelos varían, al igual que los problemas individuales en los que los desarrolladores están trabajando. Esta no es una guía definitiva. En su lugar, estamos compartiendo lo que hemos aprendido sobre la elaboración de prompts para acelerar el aprendizaje colectivo durante esta nueva era del desarrollo de software.

    ¿Qué es un “prompt” y qué es la ingeniería de prompt?

    Depende de con quién hables.

    En el contexto de las herramientas de codificación de IA generativa, un prompt puede significar diferentes cosas, dependiendo de si está preguntando a los investigadores de aprendizaje automático (ML) que están construyendo y ajustando estas herramientas, o a los desarrolladores que las están usando en sus IDE.

    Para esta guía, definiremos los términos desde el punto de vista de un desarrollador que utiliza una herramienta de codificación de IA generativa en el IDE. Pero para brindarle una imagen completa, también agregamos las definiciones de investigador de ML a continuación.

    Prompts Ingenieria de Prompt Contexto
    Desarrollador Bloques de código, líneas individuales de código, o comentarios en lenguaje natural que un desarrollador escribe para generar una sugerencia específica de GitHub Copilot. Proporcionar instrucciones o comentarios en el IDE para generar sugerencias de código específicas Detalles que proporciona un desarrollador para especificar la prompt deseada de una herramienta de codificación generativa de IA
    Investigador de ML Compilación de código de IDE y contexto relevante (comentarios de IDE, código en archivos abiertos, etc.) que se genera continuamente por algoritmos y se envíaal modelo de una herramienta de codificación generativa de IA Creación de algoritmos que generarán prompts (compilaciones de código de IDE y contexto) para un modelo de lenguaje de gran tamaño Detalles (como datos de tus archivos abiertos y código que has escrito antes y después del curso) que los algoritmos envían a un modelo de lenguaje de gran tamaño (LLM) como información adicional sobre el código

    3 mejores prácticas para la elaboración de prompts con GitHub Copilot

    1. Establecer el escenario con un objetivo de alto nivel. 🖼

    Esto es más útil si tienes un archivo en blanco o una base de código vacía. En otras palabras, si GitHub Copilot no tiene ningún contexto de lo que quieres construir o lograr, establecer el escenario para el programador par de IA puede ser realmente útil. Ayuda a preparar a GitHub Copilot con una descripción general de lo que quieres que genere, antes de que te sumerjas en los detalles.

    Al hacer prompts, GitHub Copilot, piensa en el proceso como si estuvieras teniendo una conversación con alguien: ¿Cómo debería desglosar el problema para que podamos resolverlo juntos? ¿Cómo abordaría la programación en pareja con esta persona?

    Por ejemplo, al construir un editor de markdown en Next.js, podríamos escribir un comentario como este:

    
    //
    Crea un editor de markdown básico en Next.js con las siguientes características:
    - Utiliza hooks de React
    - Crea un estado para markdown con texto predeterminado "escribe markdown aquí"
    - Un área de texto donde los usuarios pueden escribir markdown
    - Muestra una vista previa en vivo del texto de markdown mientras escribo
    - Soporte para la sintaxis básica de markdown como encabezados, negrita, cursiva
    - Utiliza el paquete npm de React markdown
    - El texto de markdown y el HTML resultante deben guardarse en el estado del componente y actualizarse en tiempo real 
    */
    

    Esto hará que GitHub Copilot genere el siguiente código y produzca un muy editor de rebajas simple, sin estilo pero funcional en menos de 30 segundos. Podemos usar el tiempo restante para diseñar el componente:

    We used this prompt to build a markdown editor in Next.jst using GitHub Copilot:
- Use react hooks
- Create state for markdown with default text

    Nota: Este nivel de detalle te ayuda a crear una prompt más deseada, pero los resultados aún pueden ser no deterministas. Por ejemplo, en el comentario, solicitamos a GitHub Copilot que cree un texto predeterminado que diga “escribe markdown aquí”, pero en cambio generó “vista previa de markdown” como las palabras predeterminadas.

    2. Haz tu solicitud simple y específica. Apunta a recibir una prompt corta de GitHub Copilot. 🗨

    Una vez que comunicas tu objetivo principal al programador par AI, articula la lógica y los pasos que debe seguir para alcanzar ese objetivo. GitHub Copilot comprende mejor tu objetivo cuando desglosas las cosas. (Imagina que estás escribiendo una receta. Desglosarías el proceso de cocción en pasos discretos, no escribirías un párrafo describiendo el plato que quieres hacer.)
    Deja que GitHub Copilot genere el código después de cada paso, en lugar de pedirle que genere un montón de código de una sola vez.
    Aquí tienes un ejemplo de cómo proporcionamos a GitHub Copilot instrucciones paso a paso para invertir una función:

    We prompted GitHub Copilot to reverse a sentence by writing six prompts one at a time. This allowed GitHub Copilot to generate a suggestion for one prompt before moving onto the text. It also gave us the chance to tweak the suggested code before moving onto the next step. The six prompts we used were: First, let's make the first letter of the sentence lower case if it's not an 'I.' Next, let's split the sentence into an array of words. Then, let's take out the punctuation marks from the sentence. Now, let's remove the punctuation marks from the sentence. Let's reverse the sentence and join it back together. Finally, let's make the first letter of the sentence capital and add the punctuation marks.

    3. Proporciona a GitHub Copilot uno o dos ejemplos. ✍

    Aprender de ejemplos no solo es útil para los humanos, sino también para tu programador par AI. Por ejemplo, queríamos extraer los nombres del siguiente arreglo de datos y almacenarlos en un nuevo arreglo:

    
    const data = [
      [
        { name: 'John', age: 25 },
        { name: 'Jane', age: 30 }
      ],
      [
        { name: 'Bob', age: 40 }
      ]
    ];
    

    Cuando no le mostramos un ejemplo a GitHub Copilot …

    
    // Mapee a través de una matriz de matrices de objetos para transformar datos
    const data = [
      [
        { name: 'John', age: 25 },
        { name: 'Jane', age: 30 }
      ],
      [
        { name: 'Bob', age: 40 }
      ]
    ];
    

    Generó un uso incorrecto del mapa:

    
    const mappedData = data.map(x => [x.name](http://x.name/));
    
    console.log(mappedData);
    
    // Results: [undefined, undefined]
    

    Por el contrario, cuando proporcionamos un ejemplo…

    
    // Recorrer un array de arrays de objetos
    // Ejemplo: Extraer los nombres del array de datos
    // Resultado deseado: ['John', 'Jane', 'Bob']
    const data = [
      [{ name: 'John', age: 25 }, { name: 'Jane', age: 30 }],
      [{ name: 'Bob', age: 40 }]
    ];
    

    Recibimos nuestro resultado deseado.

    
    const mappedData = data.flatMap(sublist => sublist.map(person => person.name));
    
    console.log(mappedData);
    // Results: ['John', 'Jane', 'Bob'] 
    

    Lee más acerca de los enfoques comunes para el entrenamiento de IA, como el aprendizaje de zero-shot, one-shot, and few-shot learning.

    Tres consejos adicionales para la elaboración de prompts con GitHub Copilot

    Aquí tienes tres consejos adicionales para ayudarte a guiar tu conversación con GitHub Copilot.

    1. Experimenta con tus prompts.

    Al igual que la conversación es más un arte que una ciencia, también lo es la elaboración de prompts. Así que, si no recibes lo que quieres en el primer intento, reformula tu prompts siguiendo las mejores prácticas mencionadas anteriormente.

    Por ejemplo, la prompts de abajo es vaga. No proporciona ningún contexto ni límites para que GitHub Copilot genere sugerencias relevantes.

    
    # Escribe algo de código para grades.py
    

    Iteramos en el prompt para ser más específicos, pero aún no obtuvimos el resultado exacto que estábamos buscando. Este es un buen recordatorio de que añadir especificidad a tu prompt es más difícil de lo que parece. Es difícil saber, desde el principio, qué detalles debes incluir sobre tu objetivo para generar las sugerencias más útiles de GitHub Copilot. Por eso animamos a la experimentación.

    La versión del promopt de abajo es más específica que la de arriba, pero no define claramente los requisitos de entrada y salida.

    
    # Implementar una función en grades.py para calcular la nota media
    

    Experimentamos una vez más con el promopt estableciendo límites y delineando lo que queríamos que hiciera la función. También reformulamos el comentario para que la función fuera más clara (dándole a GitHub Copilot una intención clara contra la que verificar).

    Esta vez, obtuvimos los resultados que estábamos buscando.

    
    # Implementa la función calculate_average_grade en grades.py que toma una lista de calificaciones como entrada y devuelve la calificación media como un número flotante.
    

    2. Mantén un par de pestañas relevantes abiertas.

    No tenemos un número exacto de pestañas que debas mantener abiertas para ayudar a GitHub Copilot a contextualizar tu código, pero en nuestra experiencia, hemos encontrado que una o dos es útil.

    GitHub Copilot utiliza una técnica llamada pestañas vecinas que permite al programador de pares de IA contextualizar su código procesando todos los archivos abiertos en su IDE en lugar de solo el archivo en el que está trabajando. Sin embargo, no se garantiza que GItHub Copilot considere todos los archivos abiertos como contexto necesario para su código.

    3. Utilice buenas prácticas de codificación.

    Eso incluye proporcionar nombres y funciones de variables descriptivas, y seguir estilos y patrones de codificación consistentes. Hemos descubierto que trabajar con GitHub Copilot nos anima a seguir las buenas prácticas de codificación que hemos aprendido a lo largo de nuestras carreras.

    Por ejemplo, aquí usamos un nombre de función descriptiva y seguimos los patrones de la base de código para aprovechar el caso de la serpiente.

    
    def authenticate_user(nombre de usuario, contraseña):
    

    Como resultado, GitHub Copilot generó una sugerencia de código relevante:

    
    def authenticate_user(nombre de usuario, contraseña):
        # Código para autenticar al usuario
        Si is_valid_user(nombre de usuario, contraseña):
            generate_session_token(nombre de usuario)
            return True
        más:
            return Falso
    

    Compare esto con el siguiente ejemplo, donde introdujimos un estilo de codificación inconsistente y mal nombramos nuestra función.

    
    def rndpwd(l):
    

    En lugar de sugerir código, GitHub Copilot generó un comentario que decía: “El código va aquí”.

    
    def rndpwd(l):
        # El código va aquí
    

    Mantente inteligente

    Los LLM detrás de las herramientas generativas de codificación de IA están diseñados para encontrar y extrapolar patrones de sus datos de entrenamiento, aplicar esos patrones al lenguaje existente y luego producir código que siga esos patrones. Dada la gran escala de estos modelos, podrían generar una secuencia de código que ni siquiera existe todavía. Al igual que revisaría el código de un colega, siempre debe evaluar, analizar y validar el código generado por IA.

    Un ejemplo 👩🏽 💻 de práctica

    Intenta pedirle a GitHub Copilot que cree una extensión del navegador.

    Para comenzar, deberás tener GitHub Copilot instalado y abierto en tu IDE. También tenemos acceso a una vista previa temprana del chat de GitHub Copilot, que es lo que hemos estado usando cuando tenemos preguntas sobre nuestro código. Si no tienes el chat de GitHub Copilot, regístrate en la lista de espera. Hasta entonces, puede emparejar GitHub Copilot con ChatGPT.

    Guías de elaboración de avisos de IA más generativas

  • Una guía para principiantes sobre ingeniería rápida con GitHub Copilot
  • Ingeniería rápida para IA
  • Cómo GitHub Copilot está mejorando en la comprensión de tu código


  • Generative AI coding tools are transforming the way developers approach daily coding tasks. From documenting our codebases to generating unit tests, these tools are helping to accelerate our workflows. However, just like with any emerging tech, there’s always a learning curve. As a result, developers—beginners and experienced alike— sometimes feel frustrated when AI-powered coding assistants don’t generate the output they want. (Feel familiar?)

    For example, when asking GitHub Copilot to draw an ice cream cone 🍦using p5.js, a JavaScript library for creative coding, we kept receiving irrelevant suggestions—or sometimes no suggestions at all. But when we learned more about the way that GitHub Copilot processes information, we realized that we had to adjust the way we communicated with it.

    Here’s an example of GitHub Copilot generating an irrelevant solution:

    When we wrote this prompt to GitHub Copilot,

    When we adjusted our prompt, we were able to generate more accurate results:

    When we wrote this prompt to GitHub Copilot,

    We’re both developers and AI enthusiasts ourselves. I, Rizel, have used GitHub Copilot to build a browser extension, rock, paper, scissors game, and to send a Tweet. And I, Michelle, launched an AI company in 2016. We’re both developer advocates at GitHub and love to share our top tips for working with GitHub Copilot.

    In this guide for GitHub Copilot, we’ll cover:

    Progress over perfection

    Even with our experience using AI, we recognize that everyone is in a trial and error phase with generative AI technology. We also know the challenge of providing generalized prompt-crafting tips because models vary, as do the individual problems that developers are working on. This isn’t an end-all, be-all guide. Instead, we’re sharing what we’ve learned about prompt crafting to accelerate collective learning during this new age of software development.

    What’s a prompt and what is prompt engineering?

    It depends on who you talk to.

    In the context of generative AI coding tools, a prompt can mean different things, depending on whether you’re asking machine learning (ML) researchers who are building and fine-tuning these tools, or developers who are using them in their IDEs.

    For this guide, we’ll define the terms from the point of view of a developer who’s using a generative AI coding tool in the IDE. But to give you the full picture, we also added the ML researcher definitions below in our chart.

    Prompts Prompt engineering Context
    Developer Code blocks, individual lines of code, or natural language comments a developer writes to generate a specific suggestion from GitHub Copilot Providing instructions or comments in the IDE to generate specific coding suggestions Details that are provided by a developer to specify the desired output from a generative AI coding tool
    ML researcher Compilation of IDE code and relevant context (IDE comments, code in open files, etc.) that is continuously generated by algorithms and sent to the model of a generative AI coding tool Creating algorithms that will generate prompts (compilations of IDE code and context) for a large language model Details (like data from your open files and code you’ve written before and after the cursor) that algorithms send to a large language model (LLM) as additional information about the code

    3 best practices for prompt crafting with GitHub Copilot

    1. Set the stage with a high-level goal. 🖼

    This is most helpful if you have a blank file or empty codebase. In other words, if GitHub Copilot has zero context of what you want to build or accomplish, setting the stage for the AI pair programmer can be really useful. It helps to prime GitHub Copilot with a big picture description of what you want it to generate—before you jump in with the details.

    When prompting GitHub Copilot, think of the process as having a conversation with someone: How should I break down the problem so we can solve it together? How would I approach pair programming with this person?

    For example, when building a markdown editor in Next.jst, we could write a comment like this

    /*
    Create a basic markdown editor in Next.js with the following features:
    - Use react hooks
    - Create state for markdown with default text "type markdown here"
    - A text area where users can write markdown 
    - Show a live preview of the markdown text as I type
    - Support for basic markdown syntax like headers, bold, italics 
    - Use React markdown npm package 
    - The markdown text and resulting HTML should be saved in the component's state and updated in real time 
    */
    

    This will prompt GitHub Copilot to generate the following code and produce a very simple, unstyled but functional markdown editor in less than 30 seconds. We can use the remaining time to style the component:

    We used this prompt to build a markdown editor in Next.jst using GitHub Copilot:
- Use react hooks
- Create state for markdown with default text

    Note: this level of detail helps you to create a more desired output, but the results may still be non-deterministic. For example, in the comment, we prompted GitHub Copilot to create default text that says “type markdown here” but instead it generated “markdown preview” as the default words.

    2. Make your ask simple and specific. Aim to receive a short output from GitHub Copilot. 🗨

    Once you communicate your main goal to the AI pair programmer, articulate the logic and steps it needs to follow for achieving that goal. GitHub Copilot better understands your goal when you break things down. (Imagine you’re writing a recipe. You’d break the cooking process down into discrete steps–not write a paragraph describing the dish you want to make.)

    Let GitHub Copilot generate the code after each step, rather than asking it to generate a bunch of code all at once.

    Here’s an example of us providing GitHub Copilot with step-by-step instructions for reversing a function:

    We prompted GitHub Copilot to reverse a sentence by writing six prompts one at a time. This allowed GitHub Copilot to generate a suggestion for one prompt before moving onto the text. It also gave us the chance to tweak the suggested code before moving onto the next step. The six prompts we used were: First, let's make the first letter of the sentence lower case if it's not an 'I.' Next, let's split the sentence into an array of words. Then, let's take out the punctuation marks from the sentence. Now, let's remove the punctuation marks from the sentence. Let's reverse the sentence and join it back together. Finally, let's make the first letter of the sentence capital and add the punctuation marks.

    3. Give GitHub Copilot an example or two. ✍

    Learning from examples is not only useful for humans, but also for your AI pair programmer. For instance, we wanted to extract the names from the array of data below and store it in a new array:

    const data = [
      [
        { name: 'John', age: 25 },
        { name: 'Jane', age: 30 }
      ],
      [
        { name: 'Bob', age: 40 }
      ]
    ];
    

    When we didn’t show GitHub Copilot an example …

    // Map through an array of arrays of objects to transform data
    const data = [
      [
        { name: 'John', age: 25 },
        { name: 'Jane', age: 30 }
      ],
      [
        { name: 'Bob', age: 40 }
      ]
    ];
    
    const mappedData = data.map(x => [x.name](http://x.name/));
    
    console.log(mappedData);
    
    // Results: [undefined, undefined]
    

    It generated an incorrect usage of map:

    const mappedData = data.map(x => [x.name](http://x.name/));
    
    console.log(mappedData);
    
    // Results: [undefined, undefined]
    

    By contrast, when we did provide an example …

    // Map through an array of arrays of objects
    // Example: Extract names from the data array
    // Desired outcome: ['John', 'Jane', 'Bob']
    const data = [
      [{ name: 'John', age: 25 }, { name: 'Jane', age: 30 }],
      [{ name: 'Bob', age: 40 }]
    ];
    
    
    const mappedData = data.flatMap(sublist => sublist.map(person => person.name));
    
    console.log(mappedData);
    

    We received our desired outcome.

    const mappedData = data.flatMap(sublist => sublist.map(person => person.name));
    
    console.log(mappedData);
    // Results: ['John', 'Jane', 'Bob']
    

    Read more about common approaches to AI training, such as zero-shot, one-shot, and few-shot learning.

    Three additional tips for prompt crafting with GitHub Copilot

    Here are three additional tips to help guide your conversation with GitHub Copilot.

    1. Experiment with your prompts.

    Just how conversation is more of an art than a science, so is prompt crafting. So, if you don’t receive what you want on the first try, recraft your prompt by following the best practices above.

    For example, the prompt below is vague. It doesn’t provide any context or boundaries for GitHub Copilot to generate relevant suggestions.

    # Write some code for grades.py  
    

    We iterated on the prompt to be more specific, but we still didn’t get the exact result we were looking for. This is a good reminder that adding specificity to your prompt is harder than it sounds. It’s difficult to know, from the start, which details you should include about your goal to generate the most useful suggestions from GitHub Copilot. That’s why we encourage experimentation.

    The version of the prompt below is more specific than the one above, but it doesn’t clearly define the input and output requirements.

    # Implement a function in grades.py to calculate the average grade
    

    We experimented with the prompt once more by setting boundaries and outlining what we wanted the function to do. We also rephrased the comment so the function was more clear (giving GitHub Copilot a clear intention to verify against).

    This time, we got the results we were looking for.

    # Implement the function calculate_average_grade in grades.py that takes a list of grades as input and returns the average grade as a floating-point number
    

    2. Keep a couple of relevant tabs open.

    We don’t have an exact number of tabs that you should keep open to help GitHub Copilot contextualize your code, but from our experience, we’ve found that one or two is helpful.

    GitHub Copilot uses a technique called neighboring tabs that allows the AI pair programmer to contextualize your code by processing all of the files open in your IDE instead of just the single file you’re working on. However, it’s not guaranteed that GItHub Copilot will deem all open files as necessary context for your code.

    3. Use good coding practices.

    That includes providing descriptive variable names and functions, and following consistent coding styles and patterns. We’ve found that working with GitHub Copilot encourages us to follow good coding practices we’ve learned throughout our careers.

    For example, here we used a descriptive function name and followed the codebase’s patterns of leveraging snake case.

    def authenticate_user(username, password):
    

    As a result, GitHub Copilot generated a relevant code suggestion:

    def authenticate_user(username, password):
        # Code for authenticating the user
        if is_valid_user(username, password):
            generate_session_token(username)
            return True
        else:
            return False
    

    Compare this to the example below, where we introduced an inconsistent coding style and poorly named our function.

    def rndpwd(l):
    

    Instead of suggesting code, GitHub Copilot generated a comment that said, “Code goes here.”

    def rndpwd(l):
        # Code goes here
    

    Stay smart

    The LLMs behind generative AI coding tools are designed to find and extrapolate patterns from their training data, apply those patterns to existing language, and then produce code that follows those patterns. Given the sheer scale of these models, they might generate a code sequence that doesn’t even exist yet. Just as you would review a colleague’s code, you should always assess, analyze, and validate AI-generated code.

    A practice example 👩🏽‍💻

    Try your hand at prompting GitHub Copilot to build a browser extension.

    To get started, you’ll need to have GitHub Copilot installed and open in your IDE. We also have access to an early preview of GitHub Copilot chat, which is what we’ve been using when we have questions about our code. If you don’t have GitHub Copilot chat, sign up for the waitlist. Until then you can pair GitHub Copilot with ChatGPT.

    More generative AI prompt crafting guides

    GitHub Availability Report: May 2023

    Post Syndicated from Jakub Oleksy original https://github.blog/2023-06-14-github-availability-report-may-2023/

    In May, we experienced four incidents that resulted in degraded performance across GitHub services. This report also sheds light into three April incidents that resulted in degraded performance across GitHub services.

    April 26 23:11 UTC (lasting 51 minutes)

    On April 25 at 23:11 UTC, a subset of users began to see a degraded experience with GitHub Copilot code completions. We publicly statused GitHub Copilot to yellow at 23:26 UTC, and to red at 23:41 UTC. As engineers identified the impact to be a subset of requests, we statused back to yellow at 23:48 UTC. The incident was fully resolved on April 26 at 00:02 UTC, and we publicly statused green at 00:30 UTC.

    The degradation consisted of a rolling partial outage across all three GitHub Copilot regions: US Central, US East, and Switzerland North. Each of these regions experienced approximately 15-20 minutes of degraded service during the global incident. At the peak, 6% of GitHub Copilot code completion requests failed.

    We identified the root cause to be a faulty configuration change by an automated maintenance process. The process was initiated across all regions sequentially, and placed a subset of faulty nodes in service before the rollout was halted by operators. Automated traffic rollover from the failed nodes and regions helped to mitigate the issue.

    Our efforts to prevent a similar incident in the future include both reducing the batch size and iteration speed of the automated maintenance process, and lowering our time to detection by adjusting our alerting thresholds.

    April 27 08:59 UTC (lasting 57 minutes)

    On April 26 at 08:59 UTC, our internal monitors notified us of degraded availability with GitHub Packages. Users would have noticed slow or failed GitHub Packages upload and download requests. Our investigation revealed a spike in connection errors to our primary database node. We quickly took action to resolve the issue by manually restarting the database. At 09:56 UTC, all errors were cleared and users experienced a complete recovery of the GitHub Packages service. A planned migration of GitHub Packages database to a more robust platform was completed on May 2, 2023 to prevent this issue from recurring.

    April 28 12:26 UTC (lasting 19 minutes)

    On April 28 at 12:26 UTC, we were notified of degraded availability for GitHub Codespaces. Users in the East US region experienced failures when creating and resuming codespaces. At 12:45 UTC, we used regional failover to redirect East US codespace creates and resumes to the nearest healthy region, East US 2, and users experienced a complete and nearly immediate recovery of GitHub Codespaces.

    Our investigation indicated our cloud provider had experienced an outage in the East US region, with virtual machines in that region experiencing internal operation errors. Virtual machines in the East US 2 region (and all other regions) were healthy, which enabled us to use regional failover to successfully recover GitHub Codespaces for our East US users. When our cloud provider’s outage was resolved, we were able to seamlessly direct all of our East US GitHub Codespaces uses back with no downtime.

    Long-term mitigation is focused on reducing our time to detection for outages such as this by improving our monitors and alerts, as well as reducing our time to mitigate by making our regional failover tooling and documentation more accessible.

    May 4th 15:53 UTC (lasting 30 minutes)

    On May 4th at 15:23 UTC, our monitors detected degraded performance for Git Operations, GitHub APIs, GitHub Issues, GitHub Pull Requests, GitHub Webhooks, GitHub Actions, GitHub Pages, GitHub Codespaces, and GitHub Copilot. After troubleshooting we were able to mitigate the issue by performing a primary failover on our repositories database cluster. Further investigation indicated the root cause was connection pool exhaustion on our proxy layer. Prior updates to this configuration were inconsistently applied. We audited and fixed our proxy layer connection pool configurations during this incident, and updated our configuration automation to dynamically apply config changes without disruption to ensure consistent configuration of database proxies moving forward.

    May 09 11:27 UTC (lasting 10 hours and 44 minutes)

    On May 9 at 11:27 UTC, users began to see failures to read or write Git data. These failures continued until 12:33 UTC, affecting Git Operations, GitHub Issues, GitHub Actions, GitHub Codespaces, GitHub Pull Requests, GitHub Web Hooks, and GitHub APIs. Repositories and GitHub Pull Requests required additional time to fully recover job results and search capabilities, with recovery completing at 21:20 UTC. On May 11 at 13:33 UTC, similar failures occurred affecting the same services until 14:40 UTC. Again, GitHub Pull Requests required additional time to fully recover search capabilities, with recovery completing at 18:54 UTC. We discussed both of these events in a previous blog post and can confirm they share the same root cause.

    Based on our investigation we determined that the cause of this crash is due to a bug in the database version we are running, and the conditions causing this bug were more likely to happen in a custom configuration on this data cluster. We updated our configuration to match the rest of our database clusters, and this cluster is no longer vulnerable to this kind of failover.

    The bug has since been reported to the database maintainers, accepted as a private bug, and fixed. The fix is slated for a release expected in July.

    There have been several directions of work in response to these incidents to avoid reoccurrence. We have focused on removing special case configurations of our database clusters to avoid unpredictable behavior from custom configurations. Across feature areas, we have also expanded tooling around graceful degradation of web pages when dependencies are unavailable.

    May 10 12:38 UTC (lasting 11 hours and 56 minutes)

    On May 10 at 12:38 UTC, issuance of auth tokens for GitHub Apps started failing, impacting GitHub Actions, GitHub API Requests, GitHub Codespaces, Git Operations, GitHub Pages, and GitHub Pull Requests. We identified the cause of these failures to be a significant increase in write latency on a shared permissions database cluster. First responders mitigated the incident by identifying the data shape in new API calls that was causing very expensive database write transactions and timeouts in a loop and blocking the source. We shared additional details on this incident in a previous blog post, but we wanted to share an update on our follow-up actions. Beyond the immediate work to address the expensive query pattern that caused this incident, we completed an audit of other endpoints to identify and correct any similar patterns. We completed improvements to the observability of API errors and have further work in progress to improve diagnosis of unhealthy MySQL write patterns. We also completed improvements to tools, documentation and playbooks, and training for both the technical diagnosis and our general incident response to address issues encountered while mitigating this issue and to reduce the time to mitigate similar incidents in the future.

    May 16 21:07 UTC (lasting 25 minutes)

    On May 16 at 21:08 UTC, we were alerted to degradation of multiple services. GitHub Issues, GitHub Pull Requests, and Git Ops were unavailable while GitHub API, GitHub Actions, GitHub Pages, and GitHub Codespaces were all partially unavailable. Alerts indicated that the primary database of a cluster supporting key-value data had experienced a hardware crash. The cluster was left in such a state that our failover automation was unable to select a new primary to promote due to the risk of data loss. Our first responder evaluated the cluster, determined it was safe to proceed, and then manually triggered a failover to a new primary host 11 minutes after the server crash. We aspire to reduce our response time moving forward and are looking into improving our alerting for cases like this. Long-term mitigation is focused on reducing dependency on this cluster as a single point of failure for much of the site.


    Please follow our status page for real-time updates on status changes. To learn more about what we’re working on, check out the GitHub Engineering Blog.

    Survey reveals AI’s impact on the developer experience

    Post Syndicated from Inbal Shani original https://github.blog/2023-06-13-survey-reveals-ais-impact-on-the-developer-experience/


    Developers today do more than just write and ship code—they’re expected to navigate a number of tools, environments, and technologies, including the new frontier of generative artificial intelligence (AI) coding tools. But the most important thing for developers isn’t story points or the speed of deployments. It’s the developer experience, which determines how efficiently and productively developers can exceed standards, enter a flow state, and drive impact.

    I say this not only as GitHub’s chief product officer, but as a long-time developer who has worked across every part of the stack. Decades ago, when I earned my master’s in mechanical engineering, I became one of the first technologists to apply AI in the lab. Back then, it would take our models five days to process our larger datasets—which is striking considering the speed of today’s AI models. I yearned for tools that would make me more efficient and shorten my time to production. This is why I’m passionate about developer experience (DevEx) and have made it my focus as GitHub’s chief product officer.

    Amid the rapid advancements in generative AI, we wanted to get a better understanding from developers about how new tools—and current workflows—are impacting the overall developer experience. As a starting point, we focused on some of the biggest components of the developer experience: developer productivity, team collaboration, AI, and how developers think they can best drive impact in enterprise environments.

    To do so, we partnered with Wakefield Research to survey 500 U.S.-based developers at enterprise companies. In the following report, we’ll show how organizations can remove barriers to help enterprise engineering teams drive innovation and impact in this new age of software development. Ultimately, the way to innovate at scale is to empower developers by improving their productivity, increasing their satisfaction, and enabling them to do their best work—every day. After all, there can be no progress without developers who are empowered to drive impact.

    Inbal Shani
    Chief Product Officer // GitHub

    Learn how generative AI is changing the developer experience

    Discover how generative AI is changing software development in a pre-recorded session from GitHub.

    Watch the video >

    Why developer experience matters

    At GitHub, we’re aware there’s often a significant gap between the day-to-day reality for most developers and “conversations about ‘what developers want.’”

    With this survey, we wanted to better understand the typical experience for developers—and identify key ways companies can empower their developers and achieve greater success.

    One big takeaway: It starts with investing in a great developer experience. And collaboration, as we learned from our research, is at the core of how developers want to work and what makes them most productive, satisfied, and impactful.

    A diagram of a formula behind the developer experience that accounts for productivity, impact, satisfaction, and collaboration.
    C = Collaboration, the multiplier across the entire developer experience.

    DevEx is a formula that takes into account:

    • How simple and fast it is for a developer to implement a change on a codebase—or be productive.
    • How frictionless it is to move from idea through production to impact.
    • How positively or negatively the work environment, workflows, and tools affect developer satisfaction.

    For leaders, developer experience is about creating a collaborative environment where developers can be their most productive, impactful, and satisfied at work. For developers, collaboration is one of the most important parts of the equation.

    Current performance metrics fall short of developer expectations

    Developers say performance metrics don’t meet expectations

    The way developers are currently evaluated doesn’t align with how they think their performance should be measured.

    • For instance, the developers we surveyed say they’re currently measured by the number of incidents they resolve. But developers believe that how they handle those bugs and issues is more important to performance. This aligns with the belief that code quality over code quantity should remain a top performance metric.
    • Developers also believe collaboration and communication should be just as important as code quality in terms of performance measures. Their ability to collaborate and communicate with others is essential to their job, but only 33% of developers report that their companies use it as a performance metric.
    Key survey findings showing what developer say their managers use to measure their performance and what developers think will matter more when they start using AI coding tools.
    Metrics currently used to measure performance, compared with metrics developers think should be used to measure their performance.
    More than output quantity and efficiency, code quality and collaboration are the most
    important performance metrics, according to the developers we surveyed.
    Twitter logo LinkedIn logo
    A chart showing what developers say their teams spend the most time doing at work.
    The top ranked responses that developers say their teams are working the most on including writing code and finding and fixing security vulnerabilities.

    Developers want more opportunities to upskill and drive impact

    When developers are asked about what makes a positive impact on their workday, they rank learning new skills (43%), getting feedback from end users (39%), and automated tests (38%), and designing solutions to novel problems (36%) as top contenders.

    A ranked list of the tasks 500 U.S.-based developers say have the most positive impact on their workdays.
    The top tasks developers say positively impact their workdays.

    But developers say they’re spending most of their time writing code and tests, then waiting for that code to be reviewed or builds and tests to be executed.

    On a typical day, the enterprise developers we surveyed report their teams are busy with a variety of tasks, including writing code, fixing security vulnerabilities, and getting feedback from end users, among other things. Developers also report that they spend a similar amount of time across these tasks, indicating that they’re stretched thin throughout the day.

    A ranked list of the top tasks developers and software engineers say they spend the most time working on each day.
    The tasks developers say they spend the most time working on each day.

    Notably, developers say they spend the same amount of time waiting for builds and tests as they do writing new code.

    • This suggests that wait times for builds and tests are still a persistent problem despite investments in DevOps tools over the past decade.
    • Developers also continue to face obstacles, such as waiting on code review, builds, and test runs, which can hinder their ability to learn new skills and design solutions to novel problems, and our research suggests that these factors can have the biggest impact on their overall satisfaction.

    Developers want feedback from end users, but face challenges

    Developers say getting feedback from end users (39%) is the second-most important thing that positively impacts their workdays—but it’s often challenging for development teams to get that feedback directly.

    • Product managers and marketing teams often act as intermediaries, making it difficult for developers to directly receive end-user feedback.
    • Developers would ideally receive feedback from automated and validation tests to improve their work, but sometimes these tests are sent to other teams before being handed off to engineering teams.

    The top two daily tasks for development teams include writing code (32%) and finding and fixing security vulnerabilities (31%).

    • This shows the increased importance developers have placed on security and underscores how companies are prioritizing security.
    • It also demonstrates the critical role that enterprise development teams play in meeting policy and board edicts around security.

    The bottom line
    Developers want to upskill, design solutions, get feedback from end users, and be evaluated on their communication skills. However, wait times on builds and tests, as well as the current performance metrics they’re evaluated on, are getting in the way.

    Collaboration is the cornerstone of the developer experience

    Developers thrive in collaborative environments

    In our survey of enterprise engineers, developers say they work with an average of 21 other developers on a typical project—and 52% report working with other teams daily or weekly. Notably, they rank regular touchpoints as the most important factor for effective collaboration.

    A survey finding that developers at enterprise companies often work with an average of 21 developers on other projects and often work on a daily or weekly basis with colleagues.
    Developers in enterprise settings often work with an average of 21 other developers on a daily or weekly cadence.

    But developers also have a holistic view of collaboration—it’s defined not only by talking and meeting with others, but also by uninterrupted work time, access to fully configured developer environments, and formal mentor-mentee relationships.

    • Specified blocks with no team communication give developers the time and space to write code and work towards team goals.
    • Access to fully configured developer environments promotes consistency throughout the development process. It also helps developers collaborate faster and avoid hearing the infamous line, “But it worked on my machine.”
    • Mentorships can help developers upskill and build interpersonal skills that are essential in a collaborative work environment.

    It’s important to note these factors can also negatively impact a developer’s work day—which suggests that ineffective meetings can serve to distract rather than help developers (something we’ve found in previous research).

    The key factors developers in a survey say contribute most highly to effective team collaboration including meetings, dedicated time for individual work, and access to fully configured dev environments.

    Our survey indicates the factors most important to effective collaboration are so critical that when they’re not done effectively, they have a noticeable, negative impact on a developer’s work.

    A ranked list of the top tasks developers in a survey reported as having a negative impact on their overall workday experience.
    The tasks developers say most often have a negative impact on their workday experience.
    Developers work with an average of 21 people on any given project. They need the time and tools for success—including regular touchpoints, heads-down time, access to fully-configured dev environments, and formal mentor-mentee relationships.
    Twitter logo LinkedIn logo

    We wanted to learn more about how developers collaborate

    So, we sourced some answers from our followers on Twitter. We asked developers what tips they have for effective collaboration. Here’s what one developer had to say:

    Twitter user Colby Ray had multiple points in response to our prompt. Click the image to read his tweet.

    We also asked what makes for a productive and valuable meeting:

    Twitter user kettenaito had several points in response to our prompt. Click the image to read on Twitter.

    Twitter user Mateus Feira had several points in response to our prompt. Click the image to read on Twitter.

    Effective collaboration improves code quality

    As developer experience continues to be defined, so, too, will successful developer collaboration. Too many pings and messages can affect flow, but there’s still a need to stay in touch. In our survey, developers say effective collaboration results in improved test coverage and faster, cleaner, more secure code writing—which are best practices for any development team. This shows that when developers work effectively with others, they believe they build better and more secure software.

    Developers in a survey report that collaboration positively impacts how they write code, how fast they can ship it, and more.
    Developers widely view effective collaboration as helping to improve what they ship and how often they ship it.

    Developers we surveyed believe collaboration and communication—along with code quality—should be the top priority for evaluation.

    • From DevOps to agile methodologies, developers and the greater business world have been talking about the importance of collaboration for a long time.
    • But developers are still not being measured on it.
    Developers in a survey respond to a question about what metrics they believe their companies should use to measure their performance and productivity.
    The metrics that developers think their managers should use to evaluate their performance and productivity.

    We asked developers to share their ideas for measuring how well they collaborate. Here’s what one developer had to say:

    Twitter user Andrew DiMola had several points in response to our prompt. Click to read on Twitter.

    • The takeaway: Companies and engineering managers should encourage regular team communication, and set time to check in–especially in remote environments–but respect developers’ need to work and focus.
    Developers think regular touchpoints with their teams including meetings, asynchronous communication, and innersource practices help organizations collaborate at scale.
    Developers believe that effective and regular touchpoints with their colleagues are critical for effective team collaboration.

    4 tips for engineering managers to improve collaboration

    At GitHub, our researchers, developers, product teams, and analysts are dedicated to studying and improving developer productivity and satisfaction. Here are their tips for engineering leaders who want to improve collaboration among developers:

    1. Make collaboration a goal in performance objectives. This builds the space and expectation that people will collaborate. This could be in the form of lunch and learns, joint projects, etc.
    2. Define and scope what collaboration looks like in your organization. Let people know when they’re being informed about something vs. being consulted about something. A matrix outlining roles and responsibilities helps define each person’s role and is something GitHub teams have implemented.
    3. Give developers time to converse and get to know one another. In particular, remote or hybrid organizations need to dedicate a portion of a developer’s time and virtual space to building relationships. Check out the GitHub guides to remote work.
    4. Identify principal and distinguished engineers. Academic research supports the positive impact of change agents in organizations—and how they should be the people who are exceptionally great at collaboration. It’s a matter of identifying your distinguished engineers and elevating them to a place where they can model desired behaviors.

    The bottom line
    Effective developer collaboration improves code quality and should be a performance measure. Regular touchpoints, heads-down time, access to fully configured dev environments, and formal mentor-mentee relationships result in improved test coverage and faster, cleaner, more secure code writing.

    AI improves individual performance and team collaboration

    Developers are already using AI coding tools at work

    A staggering 92% of U.S.-based developers working in large companies report using an AI coding tool either at work or in their personal time—and 70% say they see significant benefits to using these tools.

    • AI is here to stay—and it’s already transforming how developers approach their day-to-day work. That makes it critical for businesses and engineering leaders to adopt enterprise-grade AI tools to avoid their developers using non-approved applications. Companies should also establish governance standards for using AI tools to ensure that they are used ethically and effectively.
    92% of developers in a survey say they're already using AI coding tools at work.
    Almost all developers are already using AI coding tools at and outside of work.

    70% of developers see a benefit to using AI coding tools at work.

    Almost all (92%) developers use AI coding tools at work—and a majority (67%) have used these tools in both a work setting and during their personal time. Curiously, only 6% of developers in our survey say they solely use these tools outside of work.
    Twitter logo LinkedIn logo

    Developers believe AI coding tools will enhance their performance

    With most developers experimenting with AI tools in the workplace, our survey results suggest it’s not just idle interest leading developers to use AI. Rather, it’s a recognition that AI coding tools will help them meet performance standards.

    • In our survey, developers say AI coding tools can help them meet existing performance standards with improved code quality, faster outputs, and fewer production-level incidents. They also believe that these metrics should be used to measure their performance beyond code quantity.
    The metrics developers say their managers use to measure their productivity vs. the metrics developers think their managers should use to measure their productivity if they use AI coding tools.
    Developers widely think that AI coding tools will layer into their existing workflows and bring greater efficiencies—but they do not think AI will change how software is made.

    Around one-third of developers report that their managers currently assess their performance based on the volume of code they produce—and an equal number anticipate that this will persist when they start using AI-based coding tools.

    • Notably, the quantity of code a developer produces may not necessarily correspond to its business value.
    • Stay smart. With the increase of AI tooling being used in software development—which often contributes to code volume—engineering leaders will need to ask whether measuring code volume is still the best way to measure productivity and output.

    Developers think AI coding tools will lead to greater team collaboration

    Beyond improving individual performance, more than 4 in 5 developers surveyed (81%) say AI coding tools will help increase collaboration within their teams and organizations.

    • In fact, security reviews, planning, and pair programming are the most significant points of collaboration and the tasks that development teams are expected to, and should, work on with the help of AI coding tools. This also indicates that code and security reviews will remain important as developers increase their use of AI coding tools in the workplace.
    Developers believe that AI coding tools will make engineering teams more collaborative as the quality of code produced becomes ever more important.
    Developers think their teams will need to become more collaborative as they start using AI coding tools.
    Sometimes, developers can do the same thing with one line or multiple lines of code. Even still, one-third of developers in our survey say their managers measure their performance based on how much code they produce.
    Twitter logo LinkedIn logo

    Notably, developers believe AI coding tools will give them more time to focus on solution design. This has direct organizational benefits and means developers believe they’ll spend more time designing new features and products with AI instead of writing boilerplate code.

    • Developers are already using generative AI coding tools to automate parts of their workflow, which frees up time for more collaborative projects like security reviews, planning, and pair programming.
    Developers think AI coding tools will help them upskill, become more productive, and focus on higher-value problem solving.
    Developers believe that AI coding tools will help them focus on higher-value problem solving.

    Developers think AI increases productivity and prevents burnout

    Not only can AI coding tools help improve overall productivity, but they can also provide upskilling opportunities to help create a smarter workforce according to the developers we surveyed.

    • 57% of developers believe AI coding tools help them improve their coding language skills—which is the top benefit they see. Beyond the prospect of acting as an upskilling aid, developers also say AI coding tools can also help with reducing cognitive effort, and since mental capacity and time are both finite resources, 41% of developers believe that AI coding tools can help with preventing burnout.
    • In previous research we conducted, 87% of developers reported that the AI coding tool GitHub Copilot helped them preserve mental effort while completing more repetitive tasks. This shows that AI coding tools allow developers to preserve cognitive effort and focus on more challenging and innovative aspects of software development or research and development.
    • AI coding tools help developers upskill while they work. Across our survey, developers consistently rank learning new skills as the number one contributor to a positive workday. But 30% also say learning and development can have a negative impact on their overall workday, which suggests some developers view learning and development as adding more work to their workdays. Notably, developers say the top benefit of AI coding tools is learning new skills—and these tools can help developers learn while they work, instead of making learning and development an additional task.
    Developers are already using generative AI coding tools to automate parts of their workflow, which frees up time for more collaborative projects like security reviews, planning, and pair programming.
    Twitter logo LinkedIn logo

    AI is improving the developer experience across the board

    Developers in our survey suggest they can better meet standards around code quality, completion time, and the number of incidents when using AI coding tools—all of which are measures developers believe are key areas for evaluating their performance.

    AI coding tools can also help reduce the likelihood of coding errors and improve the accuracy of code—which ultimately leads to more reliable software, increased application performance, and better performance numbers for developers. As AI technology continues to advance, it is likely that these coding tools will have an even greater impact on developer performance and upskilling.

    AI coding tools are layering into existing developer workflows and creating greater efficiencies

    Developers believe that AI coding tools will increase their productivity—but our survey suggests that developers don’t think these tools are fundamentally altering the software development lifecycle. Instead, developers suggest they’re bringing greater efficiencies to it.

    • The use of automation and AI has been a part of the developer workflow for a considerable amount of time, with developers already utilizing a range of automated and AI-powered tools, such as machine learning-based security checks and CI/CD pipelines.
    • Rather than completely overhauling operations, these tools create greater efficiencies within existing workflows, and that frees up more time for developers to concentrate on developing solutions.

    The bottom line
    Almost all developers (92%) are using AI coding at work—and they say these tools not only improve day-to-day tasks but enable upskilling opportunities, too. Developers see material benefits to using AI tools including improved performance and coding skills, as well as increased team collaboration.

    The path forward

    Developer satisfaction, productivity, and organizational impact are all positioned to get a boost from AI coding tools—and that will have a material impact on the overall developer experience.

    92% of developers already saying they use AI coding tools at work and in their personal time, which makes it clear AI is here to stay. 70% of the developers we surveyed say they already see significant benefits when using AI coding tools, and 81% of the developers we surveyed expect AI coding tools to make their teams more collaborative—which is a net benefit for companies looking to improve both developer velocity and the developer experience.

    Notably, 57% of developers believe that AI could help them upskill—and hold the potential to build learning and development into their daily workflow. With all of this in mind, technical leaders should start exploring AI as a solution to improve satisfaction, productivity, and the overall developer experience.

    In addition to exploring AI tools, here are three takeaways engineering and business leaders should consider to improve the developer experience:

    1. Help your developers enter a flow state with tools, processes, and practices that help them be productive, drive impact, and do creative and meaningful work.
    2. Empower collaboration by breaking down organizational silos and providing developers with the opportunity to communicate efficiently.
    3. Make room for upskilling within developer workflows through key investments in AI to help your organization experiment and innovate for the future.

    Methodology

    This report draws on a survey conducted online by Wakefield Research on behalf of GitHub from March 14, 2023 through March 29, 2023 among 500 non-student, U.S.-based developers who are not managers and work at companies with 1,000-plus employees. For a complete survey methodology, please contact [email protected].

    Developer experience: What is it and why should you care?

    Post Syndicated from Gwen Davis original https://github.blog/2023-06-08-developer-experience-what-is-it-and-why-should-you-care/


    Developer experience examines how people, processes, and tools affect developers’ ability to work efficiently. Learn more about what developers want in our developer experience survey >

    What do building software and vacuuming your house have in common?

    Jonathan Carter, technical advisor of the CEO at GitHub, used to hate vacuuming. That’s because his vacuum was located on the first floor of his home and bringing it upstairs to the main floor was tedious. But when he realized he could simply keep the vacuum where he needed it, the task wasn’t that hard. Now he vacuums every other day.

    “The same is true with building software,” he says. “When we construct the experience to empower the desired behavior naturally and effortlessly, we get a great outcome.”

    This is what developer experience (DevEx) is about. DevEx—sometimes called DevX or DX—examines how the juxtaposition of developers, processes, and tools positively or negatively affects software development. In this article, we’ll explore the key components of DevEx and how its optimization is integral for business success.

    Let’s jump in.

    Are you a visual learner? 😎 We’ve got you covered.
    Learn about DevEx in our What is DevEx? video.

    What is developer experience?

    DevEx refers to the systems, technology, process, and culture that influence the effectiveness of software development. It looks at all components of a developer’s ecosystem—from environment to workflows to tools—and asks how they are contributing to developer productivity, satisfaction, and operational impact.

    “Building software is like having a giant house of cards in our brains,” says Idan Gazit, senior director of research at GitHub. “Tiny distractions can knock it over in an instant. DevEx is ultimately about how we contend with that house of cards.”

    With DevEx, every aspect of a developer’s journey is questioned.

    “Is the tool making my job harder or easier?” Gazit asks. “Is the environment helping me focus? Is the process eliminating ways in which I can make mistakes? Is the system keeping me in my flow—and confidently enabling me to stack my cards ever higher?”

    Additionally, how developers subjectively feel makes all the difference—which can be gauged by user testing, surveys, and feedback.

    “DevEx puts developers at the center and works to understand how they feel and think about the work that they do,” says Eirini Kalliamvakou, staff researcher at GitHub. Developer sentiment can uncover points of friction and provide the opportunity to find appropriate fixes.

    “You can’t improve the developer experience with developers out of the loop,” she says.

    Importantly, collaboration is the multiplier across the entire DevEx. Developers need to be able to easily communicate and share with each other to do their best work.

    What is the history of developer experience?

    While DevEx might seem like a logical strategy to improve software development, the industry has been slow to apply it.

    Over the past few decades, developers have witnessed an explosion of technologies, open source libraries, package managers, languages, and services—with more tools, APIs, and integrations arriving by the day. The result is an ecosystem where nearly everything developers could want or need is at their fingertips.

    But as the analyst firm RedMonk notes, while developers have access to an exponential amount of technology and DevOps tooling—which has produced a large degree of innovation and competition—they’re on their own figuring out how it all works together. This has led to a fragmented DevEx. It also puts pressure on developers to constantly learn about the latest products (or even just how to connect to the newest API).

    “We need a holistic view of what makes up developers’ workflow,” GitHub’s Kalliamvakou says. “And once we have that, we need to make sure that the experience is collaborative and smooth every step of the way.”

    Why is developer experience important?

    In short, a good DevEx is important because it enables developers to build with more confidence, drive greater impact, and feel satisfied.

    Greg Mondello, director of product at GitHub, says it’s no surprise that DevEx has seen a significant increase in investment over the past five years.

    “In most contexts, software development capacity is the limiting factor for innovation,” he says. “Therefore, improvements to the effectiveness of software development are inherently valuable.”

    Moreover, development is only becoming more complex. Building software today involves many tools, technologies, and services across different providers, which requires developers to manage far more intricate environments.

    At its best, a well-conceived DevEx provides greater consistency across environments, processes, and workflows, while automating the more tedious and manual processes.

    “This enables companies with better DevEx to outperform their competitors, regardless of vertical,” Mondello says.

    The research backs this up.

    According to a report from McKinsey, a better DevEx can lead to extensive benefits for organizations, such as improved employee attraction and retention, enhanced security, and increased developer productivity. As such, DevEx is important for all companies—and not just tech.

    “It doesn’t matter what industry you’re part of or what geography you’re in,” Mondello says. “With better DevEx, you’ll have better business results.”

    And the importance of DevEx will only continue to grow.

    According to a Forrester opportunity snapshot, teams can reduce time to market and grow revenue by creating an easier way for developers to write code, build software, and ship updates to customers. As a result of improving DevEx:

    • 74% of survey respondents said they can drive developer productivity
    • 77% can shorten time to market
    • 85% can impact revenue growth
    • 75% can better attract and retain customers
    • 82% can increase customer satisfaction

    “I find it fascinating how anxious people get sitting at a stoplight,” GitHub’s Carter says. “They’re not there for very long. Yes, it’s a psychological thing that humans don’t like to wait.”

    The same goes for building software.

    “Great DevEx shortens the distance between intention and reality,” he says.

    What makes a good developer experience?

    A good DevEx is where developers “have the info they need and can pivot between focus and collaboration,” Kalliamvakou says. “They can complete tasks with minimal delay.”

    Low friction is important.

    “Or ideally, no friction at all,” she notes.

    Developers experience many types of friction during their end-to-end workflow, especially if they’re using multiple tools. From meetings to requests to many other types of disruptions, developers often have to piece together context from fragmented, out-of-date sources, which hinders their ability to be productive and write high-quality code.

    In the end, collaboration is king.

    “Without collaboration, a good DevEx isn’t possible,” Kalliamvakou says.

    What are key developer experience metrics?

    Unfortunately, there are currently no standardized industry metrics to measure DevEx. However, Mondello says the DevOps Research and Assessment (DORA) framework, which measures an organization’s DevOps performance, can be helpful. Key metrics include:

    • Deployment frequency (DF): how frequently an organization releases new software
    • Lead time for changes (LT): the time taken from when a change is requested or initiated to when it is deployed
    • Mean time to recovery (MTTR): the average time it takes to recover from a failure
    • Change failure rate (CFR): the percentage of changes that result in a failure

    However, Carter thinks good metrics go beyond DORA. For instance, he believes a great DevEx metric is the time to first contribution for a new hire. A good time signifies that the new developer got all the context they needed plus feels empowered from creating value, which is what DevEx is all about.

    “No amount of moral boosting or being friendly makes up for the fact that people want to feel valuable,” Carter says. “Happier developers is the goal. There’s nobody in the world who feels great about opening a pull request that sits in an approval queue for two days.”

    Likewise, Carter says customer response time is a good metric. A strong response time indicates that the team has what they need to move quickly, while feeling empowered and helpful.

    “The more we can treat developer happiness as a goal, and measure thoughtful signals to make sure we’re doing that, the better,” he says. “This requires addressing culture, tooling, and policies to make sure teams have clarity and autonomy.”

    Kalliamvakou notes that measuring DevEx underscores the need to continually check in with developers and see how they’re feeling. While organizations already know how to capture system performance data to gauge how efficient processes are, most don’t collect developers’ opinions on the systems they’re using.

    “How can we improve developers’ experiences without checking in with developers about what their experience is?” she asks.

    Kalliamvakou says that running periodic surveys is critical. These surveys need to capture developers’ satisfaction—or dissatisfaction—with systems and what it’s like to work with them daily. “Without these surveys, even the most sophisticated telemetry is incomplete and potentially misleading,” she says.

    Kalliamvakou also warns that this work is not optional. “Organizations that are not surveying their developers on productivity, ease of work, etc. will fall behind,” she says.

    What are ways to improve developer experience?

    Companies and development teams should improve their DevEx the same way they improve other product spaces—by using a strategy that includes research, discovery, user testing, and other key design components.

    “Here at GitHub, we are constantly striving to reduce the time it takes for our developers to execute their workflows,” Mondello says, mentioning how GitHub’s invention of the pull request was a pivotal moment in DevEx history. “This means finding ways to make the build process more efficient, optimizing deployment, and tuning tests to execute more effectively.”

    He also adds that GitHub plays a leading role in the DevEx space: GitHub is a collaboration company, first and foremost, and collaboration is essential to DevEx. Especially in the age of AI. As time goes on, collaboration will become increasingly important, since it’s the only way to ensure that AI-generated code is solid.

    “If you improve your collaboration, you’ll inevitably improve your DevEx,” Mondello says.

    Kalliamvakou also notes that organizations need to understand their current DevEx and the most critical friction points.

    “Is the documentation scattered and do developers have to spend precious energy to understand context?” she asks. “Do the build systems take a long time? Or are they flaky, leaving your developers frustrated by the delays and inconsistent behavior? Worst of all, are your developers unable to focus?”

    Once an organization has done the work to identify friction, it needs to simplify, accelerate, or optimize existing systems and processes.

    “Careful though!” Kalliamvakou says. “Any change will involve tradeoffs, so companies need to monitor if DevEx is actually improving or if friction is actually introduced by an intervention.”

    Cutting down on the number of meetings, for instance, can seem like a great idea for leveling interruptions. But if developers start reporting that their collaboration is poor, you may end up in a worse place than when you started.

    “It’s a lot of work to approach DevEx holistically and effectively,” Kalliamvakou says. This is why many organizations create DevEx teams that are dedicated to understanding, improving, and monitoring it.

    What role does generative AI play in developer experience?

    There is no doubt that generative AI is the future of DevEx, as it enables developers to write high-quality code faster.

    “As models get better and more functionality is built around how developers work, we can expect AI to suggest whole workflows,” Kalliamvakou says, in addition to the code and pull request suggestions that they already provide. “AI could remove major disruptions, delays, and cognitive load that developers previously had to endure.”

    Mondello agrees.

    “Generative AI will unlock the potential for developers to leapfrog large amounts of the software development process,” he says. “Instead of merely focusing on eliminating toil or friction, DevEx will focus on finding ways to enable developers to make large strides in their development workflows.”

    However, with the enablement of faster code, companies will also need to determine ways to speed up their build and test processes and improve their overall pipelines to production.

    Mondello points to the impact that’s being made by GitHub’s generative AI product, GitHub Copilot.

    “We will build upon our success with GitHub Copilot as we shape GitHub Copilot X and bring generative AI to the entire software development lifecycle,” he says.

    The bottom line

    In today’s engineering environments, DevEx is one of the most important aspects to innovating quickly and achieving business goals. Developer happiness and empowerment are critical for software success, regardless of industry or niche—and will only continue to become more important over time.

    Learn more about what developers want in our developer experience survey >

    Highlights from Git 2.41

    Post Syndicated from Taylor Blau original https://github.blog/2023-06-01-highlights-from-git-2-41/

    The open source Git project just released Git 2.41 with features and bug fixes from over 95 contributors, 29 of them new. We last caught up with you on the latest in Git back when 2.40 was released.

    To celebrate this most recent release, here’s GitHub’s look at some of the most interesting features and changes introduced since last time.

    Improved handling of unreachable objects

    At the heart of every Git repository lies a set of objects. For the unfamiliar, you can learn about the intricacies of Git’s object model in this post. In general, objects are the building blocks of your repository. Blobs represent the contents of an individual file, and trees group many blobs (and other trees!) together, representing a directory. Commits tie everything together by pointing at a specific tree, representing the state of your repository at the time when the commit was written.

    Git objects can be in one of two states, either “reachable” or “unreachable.” An object is reachable when you can start at some branch or tag in your repository and “walk” along history, eventually ending up at that object. Walking merely means looking at an individual object, and seeing what other objects are immediately related to it. A commit has zero or more other commits which it refers to as parents. Conversely, trees point to many blobs or other trees that make up their contents.

    Objects are in the “unreachable” state when there is no branch or tag you could pick as a starting point where a walk like the one above would end up at that object. Every so often, Git decides to remove some of these unreachable objects in order to compress the size of your repository. If you’ve ever seen this message:

    Auto packing the repository in background for optimum performance.
    See "git help gc" for manual housekeeping.
    

    or run git gc directly, then you have almost certainly removed unreachable objects from your repository.

    But Git does not necessarily remove unreachable objects from your repository the first time git gc is run. Since removing objects from a live repository is inherently risky1, Git imposes a delay. An unreachable object won’t be eligible for deletion until it has not been written since a given (via the –prune argument) cutoff point. In other words, if you ran git gc --prune=2.weeks.ago, then:

    • All reachable objects will get collected together into a single pack.
    • Any unreachable objects which have been written in the last two weeks will be stored separately.
    • Any remaining unreachable objects will be discarded.

    Until Git 2.37, Git kept track of the last write time of unreachable objects by storing them as loose copies of themselves, and using the object file’s mtime as a proxy for when the object was last written. However, storing unreachable objects as loose until they age out can have a number of negative side-effects. If there are many unreachable objects, they could cause your repository to balloon in size, and/or exhaust the available inodes on your system.

    Git 2.37 introduced “cruft packs,” which store unreachable objects together in a packfile, and use an auxiliary *.mtimes file stored alongside the pack to keep track of object ages. By storing unreachable objects together, Git prevents inode exhaustion, and allows unreachable objects to be stored as deltas.

    Diagram of a cruft pack, along with its corresponding *.idx and *.mtimes file.

    The figure above shows a cruft pack, along with its corresponding *.idx and *.mtimes file. Storing unreachable objects together allows Git to store your unreachable data more efficiently, without worry that it will put strain on your system’s resources.

    In Git 2.41, cruft pack generation is now on by default, meaning that a normal git gc will generate a cruft pack in your repository. To learn more about cruft packs, you can check out our previous post, “Scaling Git’s garbage collection.”

    [source]

    On-disk reverse indexes by default

    Starting in Git 2.41, you may notice a new kind of file in your repository’s .git/objects/pack directory: the *.rev file.

    This new file stores information similar to what’s in a packfile index. If you’ve seen a file in the pack directory above ending in *.idx, that is where the pack index is stored.

    Pack indexes map between the positions of all objects in the corresponding pack among two orders. The first is name order, or the index at which you’d find a given object if you sorted those objects according to their object ID (OID). The other is pack order, or the index of a given object when sorting by its position within the packfile itself.

    Git needs to translate between these two orders frequently. For example, say you want Git to print out the contents of a particular object, maybe with git cat-file -p. To do this, Git will look at all *.idx files it knows about, and use a binary search to find the position of the given object in each packfile’s name order. When it finds a match, it uses the *.idx to quickly locate the object within the packfile itself, at which point it can dump its contents.

    But what about going the other way? How does Git take a position within a packfile and ask, “What object is this”? For this, it uses the reverse index, which maps objects from their pack order into the name order. True to its name, this data structure is the inverse of the packfile index mentioned above.

    representation of the reverse index

    The figure above shows a representation of the reverse index. To discover the lexical (index) position of, say, the yellow object, Git reads the corresponding entry in the reverse index, whose value is the lexical position. In this example, the yellow object is assumed to be the fourth object in the pack, so Git reads the fourth entry in the .rev file, whose value is 1. Reading the corresponding value in the *.idx file gives us back the yellow object.

    In previous versions of Git, this reverse index was built on-the-fly by storing a list of pairs (one for each object, each pair contains that object’s position in name and packfile order). This approach has a couple of drawbacks, most notably that it takes time and memory in order to materialize and store this structure.

    In Git 2.31, the on-disk reverse index was introduced. It stores the same contents as above, but generates it once and stores the result on disk alongside its corresponding packfile as a *.rev file. Pre-computing and storing reverse indexes can dramatically speed-up performance in large repositories, particularly for operations like pushing, or determining the on-disk size of an object.

    In Git 2.41, Git will now generate these reverse indexes by default. This means that the next time you run git gc on your repository after upgrading, you should notice things get a little faster. When testing the new default behavior, the CPU-intensive portion of a git push operation saw a 1.49x speed-up when pushing the last 30 commits in torvalds/linux. Trivial operations, like computing the size of a single object with git cat-file --batch='%(objectsize:disk)' saw an even greater speed-up of nearly 77x.

    To learn more about on-disk reverse indexes, you can check out another previous post, “Scaling monorepo maintenance,” which has a section on reverse indexes.

    [source]


    • You may be familiar with Git’s credential helper mechanism, which is used to provide the required credentials when accessing repositories stored behind a credential. Credential helpers implement support for translating between Git’s credential helper protocol and a specific credential store, like Keychain.app, or libsecret. This allows users to store credentials using their preferred mechanism, by allowing Git to communicate transparently with different credential helper implementations over a common protocol.Traditionally, Git supports password-based authentication. For services that wish to authenticate with OAuth, credential helpers typically employ workarounds like passing the bearer token through basic authorization instead of authenticating directly using bearer authorization.

      Credential helpers haven’t had a mechanism to understand additional information necessary to generate a credential, like OAuth scopes, which are typically passed over the WWW-Authenticate header.

      In Git 2.41, the credential helper protocol is extended to support passing WWW-Authenticate headers between credential helpers and the services that they are trying to authenticate with. This can be used to allow services to support more fine-grained access to Git repositories by letting users scope their requests.

      [source]

    • If you’ve looked at a repository’s branches page on GitHub, you may have noticed the indicators showing how many commits ahead and behind a branch is relative to the repository’s default branch. If you haven’t noticed, no problem: here’s a quick primer. A branch is “ahead” of another when it has commits that the other side doesn’t. The amount ahead it is depends on the number of unique such commits. Likewise, a branch is “behind” another when it is missing commits that are unique to the other side.

      Previous versions of Git allowed this comparison by running two reachability queries: git rev-list --count main..my-feature (to count the number of commits unique to my-feature) and git rev-list --count my-feature..main (the opposite). This works fine, but involves two separate queries, which can be awkward. If comparing many branches against a common base (like on the /branches page above), Git may end up walking over the same commits many times.

      In Git 2.41, you can now ask for this information directly via a new for-each-ref formatting atom, %(ahead-behind:<base>). Git will compute its output using only a single walk, making it far more efficient than in previous versions.

      For example, suppose I wanted to list my unmerged topic branches along with how far ahead and behind they are relative to upstream’s mainline. Before, I would have had to write something like:

      $ git for-each-ref --format='%(refname:short)' --no-merged=origin/HEAD \
        refs/heads/tb |
        while read ref
        do
          ahead="$(git rev-list --count origin/HEAD..$ref)"
          behind="$(git rev-list --count $ref..origin/HEAD)"
          printf "%s %d %d\n" "$ref" "$ahead" "$behind"
        done | column -t
      tb/cruft-extra-tips 2 96
      tb/for-each-ref--exclude 16 96
      tb/roaring-bitmaps 47 3
      

      which takes more than 500 milliseconds to produce its results. Above, I first ask git for-each-ref to list all of my unmerged branches. Then, I loop over the results, computing their ahead and behind values manually, and finally format the output.

      In Git 2.41, the same can be accomplished using a much simpler invocation:

      $ git for-each-ref --no-merged=origin/HEAD \
        --format='%(refname:short) %(ahead-behind:origin/HEAD)' \
        refs/heads/tb/ | column -t
      tb/cruft-extra-tips 2 96
      tb/for-each-ref--exclude 16 96
      tb/roaring-bitmaps 47 3
      [...]
      

      That produces the same output (with far less scripting!), and performs a single walk instead of many. By contrast to earlier versions, the above takes only 28 milliseconds to produce output, a more than 17-fold improvement.

      [source]

    • When fetching from a remote with git fetch, Git’s output will contain information about which references were updated from the remote, like:
      + 4aaf690730..8cebd90810 my-feature -> origin/my-feature (forced update)
      

      While convenient for a human to read, it can be much more difficult for a machine to parse. Git will shorten the reference names included in the update, doesn’t print the full before and after values of the reference being updated, and columnates its output, all of which make it more difficult to script around.

      In Git 2.41, git fetch can now take a new --porcelain option, which changes its output to a form that is much easier to script around. In general, the --porcelain output looks like:

      <flag> <old-object-id> <new-object-id> <local-reference>
      

      When invoked with --porcelain, git fetch does away with the conveniences of its default human readable output, and instead emits data that is much easier to parse. There are four fields, each separated by a single space character. This should make it much easier to script around the output of git fetch.

      [source, source]

    • Speaking of git fetch, Git 2.41 has another new feature that can improve its performance: fetch.hideRefs. Before we get into it, it’s helpful to recall our previous coverage of git rev-list’s --exclude-hidden option. If you’re new around here, don’t worry: this option was originally introduced to improve the performance of Git’s connectivity check, the process that checks that an incoming push is fully connected, and doesn’t reference any objects that the remote doesn’t already have, or are included in the push itself.

      Git 2.39 sped-up the connectivity check by ignoring parts of the repository that weren’t advertised to the pusher: its hidden references. Since these references weren’t advertised to the pusher, it’s unlikely that any of these objects will terminate the connectivity check, so keeping track of them is usually just extra bookkeeping.

      Git 2.41 introduces a similar option for git fetch on the client side. By setting fetch.hideRefs appropriately, you can exclude parts of the references in your local repository from the connectivity check that your client performs to make sure the server didn’t send you an incomplete set of objects.

      When checking the connectedness of a fetch, the search terminates at the branches and tags from any remote, not just the one you’re fetching from. If you have a large number of remotes, this can take a significant amount of time, especially on resource-constrained systems.

      In Git 2.41, you can narrow the endpoints of the connectivity check to focus just on the remote you’re fetching from. (Note that transfer.hideRefs values that start with ! are interpreted as un-hiding those references, and are applied in reverse order.) If you’re fetching from a remote called $remote, you can do this like so:

      $ git -c fetch.hideRefs=refs -c fetch.hideRefs=!refs/remotes/$remote \
      fetch $remote
      

      The above first hides every reference from the connectivity check (fetch.hideRefs=refs) and then un-hides just the ones pertaining to that specific remote (fetch.hideRefs=!refs/remotes/$remote). On a resource constrained machine with repositories that have many remote tracking references, this takes the time to complete a no-op fetch from 20 minutes to roughly 30 seconds.

      [source]

    • If you’ve ever been on the hunt for corruption in your repository, you are undoubtedly aware of git fsck. This tool is used to check that the objects in your repository are intact and connected. In other words, that your repository doesn’t have any corrupt or missing objects.git fsck can also check for more subtle forms of repository corruption, like malicious looking .gitattributes or .gitmodules files, along with malformed objects (like trees that are out of order, or commits with a missing author). The full suite of checks it performs can be found under the fsck. configuration.

      In Git 2.41, git fsck learned how to check for corruption in reachability bitmaps and on-disk reverse indexes. These checks detect and warn about incorrect trailing checksums, which indicate that the preceding data has been mangled. When examining on-disk reverse indexes, git fsck will also check that the *.rev file holds the correct values.

      To learn more about the new kinds of fsck checks implemented, see the git fsck documentation.

      [source, source]

    The whole shebang

    That’s just a sample of changes from the latest release. For more, check out the release notes for 2.41, or any previous version in the Git repository.

    Notes


    1. The risk is based on a number of factors, most notably that a concurrent writer will write an object that is either based on or refers to an unreachable object. This can happen when receiving push whose content depends on an object that git gc is about to remove. If a new object is written which references the deleted one, the repository can become corrupt. If you’re curious to learn more, this section is a good place to start.