This is the third blog post in our series of DevOps fundamentals. For a quick intro on what DevOps is, check out part one; for a primer on automation in DevOps, visit part two.
As businesses reorganize for DevOps, the responsibilities of teams throughout the software lifecycle inevitably shift. Operations teams that traditionally measure themselves on uptime and stability—often working in silos separate from business and development teams—become collaborators with new stakeholders throughout the software lifecycle. Development and operations teams begin to work closely together to build and continually improve their delivery and management processes. In this blog post, we’ll share more on what these evolving roles and responsibilities look like for IT teams today, and how operations help drive consistency and success across the entire organization.
The Ops role in DevOps compared to traditional IT operations
To better understand how DevOps changes the responsibilities of operations teams, it will help to recap the traditional, pre-DevOps role of operations. Let’s take a look at a typical organization’s software lifecycle: before DevOps, developers package an application with documentation, and then ship it to a QA team. The QA teams install and test the application, and then hand off to production operations teams. The operations teams are then responsible for deploying and managing the software with little-to-no direct interaction with the development teams.
These dev-to-ops handoffs are typically one-way, often limited to a few scheduled times in an application’s release cycle. Once in production, the operations team is then responsible for managing the service’s stability and uptime, as well as the infrastructure that hosts the code. If there are bugs in the code, the virtual assembly line of dev-to-qa-to-prod is revisited with a patch, with each team waiting on the other for next steps. This model typically requires pre-existing infrastructure that needs to be maintained, and comes with significant overhead. While many businesses continue to remain competitive with this model, the faster, more collaborative way of bridging the gap between development and operations is finding wide adoption in the form of DevOps.
Accelerating through public cloud adoption
Over the past decade, the maturation of the public cloud has added complexity to the responsibilities of operations teams. The ability to rent stable, secure infrastructure by the minute and provide everything as a service to customers has enabled organizations to deploy rapidly and frequently, often several times per day. Smaller, faster delivery cycles give organizations the critical capability of improving their customer experience through rapid feedback and automated deployments. Cloud technologies have made development velocity a fundamental part of delivering a competitive customer experience.
What the cloud, DevOps, and developer velocity mean for operations teams
Cloud technologies have transformed how we deliver and operate software, impacting how we do DevOps today. Developers now focus more on stability and uptime in addition to developer velocity, and operations teams now have a stake in developer velocity along with their traditional role of maintaining uptime. When it comes to the specific role of operations in DevOps, this often means:
Enabling self-service for developers. In order to support developer velocity—and minimize risks that stem from “shadow operations”, where developers seek their own solutions—operations teams work more closely with developers to provide on-demand access to secure, compliant tooling and environments.
Standardized tooling and processes across the business. The best way to enable a sustainable self-service model and empower teams to work more efficiently together is by standardizing on the tooling that is in use. Tools and processes that are shared across the business unit enable organizational unity and greater collaboration. In turn, this reduces the friction developers and operations teams experience when sharing responsibilities.
Bringing extensible automation to traditional operations tasks. As operations teams focus more on empowering other teams through self-service and collaboration, there is less time to handle other work. Traditional operations tasks like resolving incidents, updating systems, or scaling infrastructure still need to be addressed—only smarter. When development and operations unite under DevOps, operations teams turn to automation for more of the repeatable tasks and drive consistency across the organization. This also enables teams and business units to track and measure the results of their efforts.
Working and shipping like developers. As operations teams shift more towards greater automation, ‘X’ as code becomes the new normal. Like application source code, the code controlling operations systems needs to be stored, versioned, secured, and maintained. As a result, the development-operations relationship starts to feel more balanced on both sides: operations specialists become more like the developers and more familiar with their working models, and in some organizations, developers become more like operations, sharing in the responsibility of debugging problems with their own code in production.
Closing the development-operations gap
While it’s well understood that DevOps requires close collaboration between teams, we’re often asked “How are development and operations functions really coordinated in a DevOps model?” At GitHub, we’re fortunate to partner with thousands of businesses every year on improving their DevOps practices. Sometimes these organizations focus on the clearest target, asking developers and delivery teams to go to market faster while paying less attention to the post-deployment operations teams.
However, we find the best results come through improving the practices of all the teams involved in the software lifecycle, together. Operations teams aren’t simply infrastructure and process owners for the organizations, but are also a critical part of the feedback loop for development. Try it out for yourself—a small pilot project that includes developers, release engineering, operations, and even InfoSec can give more teams the momentum they need. It can give them confidence to continue their work, establish best practices, and even train others within your organization along the way.
In our ongoing “Building GitHub” series, we talk about some of the projects we’re working on to improve how efficiently we build GitHub, as well as increase GitHub’s availability, stability, and resilience. We know how important the stability of our platform is for developers and enterprises, and it continues to be a priority area of investment across GitHub.
In that spirit, we want to share a change in how we make new feature releases available to our GitHub Enterprise Server customers. This change will take effect with our next release, and we hope this increases our collaboration with our GHES customers and improves our release process.
What are Release Candidates?
Release candidates, or RCs, are builds that allow our GitHub Enterprise Server customers to try the latest release early. These RCs are a way for us to work with our customers on bugs and issues that will be used to improve the quality of every release.
Working in the open like this is the best way for us to collaborate with our customers to improve GitHub Enterprise Server and ensure that we are delivering a product that meets and (hopefully) exceeds expectations.
The Release Candidate Process
What can I expect with this new process?
Customers can start testing an RC as soon as it’s available, and release notes will accompany each RC. We expect each feature release will have one or more RC versions (eg. 2.22.0.RC1, 2.22.0.RC2), with each new version adding bug fixes for issues found in prior versions. The number of RCs will be driven by customer feedback, and we’ll decide based on quality and customer feedback when to publish and make generally available a final production release.
RCs can be upgraded from any version and can upgrade to any version. They should be deployed on test or staging environments.
Customers that test RCs can raise issues with GitHub Support. Each RC is supported while live, but is not included in long-term support.
What does this mean for other releases?
Production releases will continue to be numbered as they are today (2.20, 2.21, etc.)
Patch releases will not be released as RCs
With this new RC process, testing and feedback from our customers will be critical. We’re confident this will help us improve GitHub Enterprise Server, together. We’ll have more to share about upcoming RCs at GitHub Universe next week. Make sure you tune in!
At Grab, we build a seamless user experience that addresses more and more of the daily lifestyle needs of people across South East Asia. We’re proud of our Grab rides, payments, and delivery services, and want to provide a unified experience across these offerings.
Here is couple of examples of what Grab does for millions of people across South East Asia every day:
Grab Service Offerings
The Grab Passenger application reached super app status more than a year ago and continues to provide hundreds of life-changing use cases in dozens of areas for millions of users.
With the big product scale, it brings with it even bigger technical challenges. Here are a couple of dimensions that can give you a sense of the scale we’re working with.
Engineering and product structure
Technical and product teams work in close collaboration to outserve our customers. These teams are combined into dedicated groups to form Tech Families and focus on similar use cases and areas.
Grab consists of many Tech Families who work on food, payments, transport, and other services, which are supported by hundreds of engineers. The diverse landscape makes the development process complicated and requires the industry’s best practices and approaches.
Codebase scale overview
The Passenger Applications (Android and iOS) contain more than 2.5 million lines of code each and it keeps growing. We have 1000+ modules in the Android App and 700+ targets in the iOS App. Hundreds of commits are merged by all the mobile engineers on a daily basis.
To maintain the health of the codebase and product stability, we run 40K+ unit tests on Android and 30K+ unit tests on iOS, as well as thousands of UI tests and hundreds of end-to-end tests on both platforms.
Build time challenges
The described complexity and scale do not come without challenges. A huge codebase propels the build process to the ultimate extreme- challenging the efficiency of build systems and hardware used to compile the super app, and creating out of the line challenges to be addressed.
Local build time
Local build time (the build on engineers’ laptop) is one of the most obvious challenges. More code goes in the application binary, hence the build system requires more time to compile it.
ADR local build time
The Android ecosystem provides a great out-of-the-box tool to build your project called Gradle. It’s flexible and user friendly, and provides huge capabilities for a reasonable cost. But is this always true? It appears to not be the case due to multiple reasons. Let’s unpack these reasons below.
Gradle performs well for medium sized projects with say 1 million line of code. Once the code surpasses that 1 million mark (or so), Gradle starts failing in giving engineers a reasonable build time for the given flexibility. And that’s exactly what we have observed in our Android application.
At some point in time, the Android local build became ridiculously long. We even encountered cases where engineers’ laptops simply failed to build the project due to hardware resources limits. Clean builds took by the hours, and incremental builds easily hit dozens of minutes.
iOS local build time
Xcode behaved a bit better compared to Gradle. The Xcode build cache was somehow bearable for incremental builds and didn’t exceed a couple of minutes. Clean builds still took dozens of minutes though. When Xcode failed to provide the valid cache, engineers had to rerun everything as a clean build, which killed the experience entirely.
CI pipeline time
Each time an engineer submits a Merge Request (MR), our CI kicks in running a wide variety of jobs to ensure the commit is valid and doesn’t introduce regression to the master branch. The feedback loop time is critical here as well, and the pipeline time tends to skyrocket alongside the code base growth. We found ourselves on the trend where the feedback loop came in by the hours, which again was just breaking the engineering experience, and prevented us from delivering the world’s best features to our customers.
As mentioned, we have a large number of unit tests (30K-40K+) and UI tests (700+) that we run on a pre-merge pipeline. This brings us to hours of execution time before we could actually allow MRs to land to the master branch.
The number of daily commits, which is by the hundreds, adds another stone to the basket of challenges.
All this clearly indicated the area of improvement. We were missing opportunities in terms of engineering productivity.
The extra mile
The biggest question for us to answer was how to put all this scale into a reasonable experience with minimal engineering idle time and fast feedback loop.
Build time critical path optimization
The most reasonable thing to do was to pay attention to the utilization of the hardware resources and make the build process optimal.
This literally boiled down to the simplest approach:
Decouple building blocks
Make building blocks as small as possible
This approach is valid for any build system and applies for both iOS and Android. The first thing we focused on was to understand what our build graph looked like, how dependencies were distributed, and which blocks were bottlenecks.
Given the scale of the apps, it’s practically not possible to manage a dependency tree manually, thus we created a tool to help us.
Critical path overview
We introduced the Critical Path concept:
The critical path is the longest (time) chain of sequential dependencies, which must be built one after the other.
Critical Path build
Even with an infinite number of parallel processors/cores, the total build time cannot be less than the critical path time.
We implemented the tool that parsed the dependency trees (for both Android and iOS), aggregated modules/target build time, and calculated the critical path.
The concept of the critical path introduced a number of action items, which we prioritized:
The critical path must be as short as possible.
Any huge module/target on the critical path must be split into smaller modules/targets.
Depend on interfaces/bridges rather than implementations to shorten the critical path.
The presence of other teams’ implementation modules/targets in the critical path of the given team is a red flag.
Stack representation of the Critical Path build time
Project’s scale factor
To implement the conceptually easy action items, we ran a Grab-wide program. The program has impacted almost every mobile team at Grab and involved 200+ engineers to some degree. The whole implementation took 6 months to complete.
During this period of time, we assigned engineers who were responsible to review the changes, provide support to the engineers across Grab, and monitor the results.
Results
Even though the overall plan seemed to be good on paper, the results were minimal – it just flattened the build time curve of the upcoming trend introduced by the growth of the codebase. The estimated impact was almost the same for both platforms and gave us about a 7%-10% cut in the CI and local build time.
Open source plan
The critical path tool proved to be effective to illustrate the projects’ bottlenecks in a dependency tree configuration. It is currently widely used by mobile teams at Grab to analyze their dependencies and cut out or limit an unnecessary impact on the respective scope.
The tool is currently considered to be open-sourced as we’d like to hear feedback from other external teams and see what can be built on top of it. We’ll provide more details on this in future posts.
Remote build
Another pillar of the build process is the hardware where the build runs. The solution is really straightforward – put more muscles on your build to get it stronger and to run faster.
Clearly, our engineers’ laptops could not be considered fast enough. To have a fast enough build we were looking at something with 20+ cores, ~200Gb of RAM. None of the desktop or laptop computers can reach those numbers within reasonable pricing. We hit a bottleneck in hardware. Further parallelization of the build process didn’t give any significant improvement as all the build tasks were just queueing and waiting for the resources to be released. And that’s where cloud computing came into the picture where a huge variety of available options is ready to be used.
ADR mainframer
We took advantage of the Mainframer tool. When the build must run, the code diff is pushed to the remote executor, gets compiled, and then the generated artifacts are pushed back to the local machine. An engineer might still benefit from indexing, debugging, and other features available in the IDE.
To make the infrastructure mature enough, we’ve introduced Kubernetes-based autoscaling based on the load. Currently, we have a stable infrastructure that accommodates 100+ Android engineers scaling up and down (saving costs).
This strategy gave us a 40-50% improvement in the local build time. Android builds finished, in the extreme case, x2 faster.
iOS
Given the success of the Android remote build infrastructure, we have immediately turned our attention to the iOS builds. It was an obvious move for us – we wanted the same infrastructure for iOS builds. The idea looked good on paper and was proven with Android infrastructure, but the reality was a bit different for our iOS builds.
Our very first roadblock was that Xcode is not that flexible and the process of delegating build to remote is way more complicated compared to Android. We tackled a series of blockers such as running indexing on a remote machine, sending and consuming build artifacts, and even running the remote build itself.
The reality was that the remote build was absolutely possible for iOS. There were minor tradeoffs impacting engineering experience alongside obvious gains from utilizing cloud computing resources. But the problem is that legally iOS builds are only allowed to be built on an Apple machine.
Even if we get the most powerful hardware – a macPro – the specs are still not ideal and are unfortunately not optimized for the build process. A 24 core, 194Gb RAM macPro could have given about x2 improvement on the build time, but when it had to run 3 builds simultaneously for different users, the build efficiency immediately dropped to the baseline value.
Android remote machines with the above same specs are capable of running up to 8 simultaneous builds. This allowed us to accommodate up to 30-35 engineers per machine, whereas iOS’ infrastructure would require to keep this balance at 5-6 engineers per machine. This solution didn’t seem to be scalable at all, causing us to abandon the idea of the remote builds for iOS at that moment.
Test impact analysis
The other battlefront was the CI pipeline time. Our efforts in dependency tree optimizations complemented with comparably powerful hardware played a good part in achieving a reasonable build time on CI.
CI validations also include the execution of unit and UI tests and may easily take 50%-60% of the pipeline time. The problem was getting worse as the number of tests was constantly growing. We were to face incredibly huge tests’ execution time in the near future. We could mitigate the problem by a muscle approach – throwing more runners and shredding tests – but it won’t make finance executives happy.
So the time for smart solutions came again. It’s a known fact that the simpler solution is more likely to be correct. The simplest solution was to stop running ALL tests. The idea was to run only those tests that were impacted by the codebase change introduced in the given MR.
Behind this simple idea, we’ve found a huge impact. Once the Test Impact Analysis was applied to the pre-merge pipelines, we’ve managed to cut down the total number of executed tests by up to 90% without any impact on the codebase quality or applications’ stability. As a result, we cut the pipeline for both platforms by more than 30%.
Today, the Test Impact Analysis is coupled with our codebase. We are looking to invest some effort to make it available for open sourcing. We are excited to be on this path.
The end of the Native Build Systems
One might say that our journey was long and we won the battle for the build time.
Today, we hit a limit to the native build systems’ efficiency and hardware for both Android and iOS. And it’s clear to us that in our current setup, we would not be able to scale up while delivering high engineering experience.
Let’s move to Bazel
To introduce another big improvement to the build time, we needed to make some ground-level changes. And this time, we focused on the build system itself.
Native build systems are designed to work well for small and medium-sized projects, however they have not been as successful in large scale projects such as the Grab Passenger applications.
With these assumptions, we considered options and found the Bazel build system to be a good contender. The deep comparison of build systems disclosed that Bazel was promising better results almost in all key areas:
Bazel enables remote builds out of box
Bazel provides sustainable cache capabilities (local and remote). This cache can be reused across all consumers – local builds, CI builds
Bazel was designed with the big codebase as a cornerstone requirement
The majority of the tooling may be reused across multiple platforms
Ways of adopting
On paper, Bazel was awesome and shining. All our playground investigations showed positive results:
Cache worked great
Incremental builds were incredibly fast
But the effort to shift to this new build system was huge. We made sure that we foresee all possible pitfalls and impediments. It took us about 5 months to estimate the impact and put together a sustainable proof of concept, which reflected the majority of our use cases.
Migration limitations
After those 5 months of investigation, we got the endless list of incompatible features and major blockers to be addressed. Those blockers touched even such obvious things as indexing and the jump to definition IDE feature, which we used to take for granted.
But the biggest challenge was the need to keep the pace of the product release. There was no compromise of stopping the product development even for a day. The way out appeared to be a hybrid build concept. We figured out how to marry native and Bazel build systems to live together in harmony. This move gave us a chance to start migrating target by target, project by project moving from the bottom to top of the dependency graph.
This approach was a valid enabler, however we were still faced with a challenge of our app’s scale. The codebase of over 2.5 million of LOC cannot be migrated overnight. The initial estimation was based on the idea of manually migrating the whole codebase, which would have required us to invest dozens of person-months.
Team capacity limitations
This approach was immediately pushed back by multiple teams arguing with the priority and concerns about the impact on their own product roadmap.
We were left with not much choice. On one hand, we had a pressingly long build time. And on the other hand, we were asking for a huge effort from teams. We clearly needed to get buy-ins from all of our stakeholders to push things forward.
Getting buy-in
To get all needed buy-ins, all stakeholders were grouped and addressed separately. We defined key factors for each group.
Key factors
C-level stakeholders:
Impact. The migration impact must be significant – at least a 40% decrease on the build time.
Costs. Migration costs must be paid back in a reasonable time and the positive impact is extended to the future.
Engineering experience. The user experience must not be compromised. All tools and features engineers used must be available during migration and even after.
Engineers:
Engineering experience. Similar to the criteria established at the C-level factor.
Early adopters engagement. A common core experience must be created across the mobile engineering community to support other engineers in the later stages.
Education. Awareness campaigns must be in place. Planned and conducted a series of tech talks and workshops to raise awareness among engineers and cut the learning curve. We wrote hundreds of pages of documentation and guidelines.
Product teams:
No roadmap impact. Migration must not affect the product roadmap.
Minimize the engineering effort. Migration must not increase the efforts from engineering.
Migration automation (separate talks)
The biggest concern for the majority of the stakeholders appeared to be the estimated migration effort, which impacted the cost, the product roadmap, and the engineering experience. It became evident that we needed to streamline the process and reduce the effort for migration.
Fortunately, the actual migration process was routine in nature, so we had opportunities for automation. We investigated ideas on automating the whole migration process.
The tools we’ve created
We found that it’s relatively easy to create a bunch of tools that read the native project structure and create an equivalent Bazel set up. This was a game changer.
Things moved pretty smoothly for both Android and iOS projects. We managed to roll out tooling to migrate the codebase in a single click/command (well with some exceptions as of now. Stay tuned for another blog post on this). With this tooling combined with the hybrid build concept, we addressed all the key buy-in factors:
Migration cost dropped by at least 50%.
Less engineers required for the actual migration. There was no need to engage the wide engineering community as a small group of people can manage the whole process.
There is no more impact on the product roadmap.
Where do we stand today
When we were in the middle of the actual migration, we decided to take a pragmatic path and migrate our applications in phases to ensure everything was under control and that there were no unforeseen issues.
The hybrid build time is racing alongside our migration progress. It has a linear dependency on the amount of the migrated code. The figures look positive and we are confident in achieving our impact goal of decreasing at least 40% of the build time.
Plans to open source
The automated migration tooling we’ve created is planned to be open sourced. We are doing a bit better on the Android side decoupling it from our applications’ implementation details and plan to open source it in the near future.
The iOS tooling is a bit behind, and we expect it to be available for open-sourcing by the end of Q1’2021.
Is it worth it all?
Bazel is not a silver bullet for the build time and your project. There are a lot of edge cases you’ll never know until it punches you straight in your face.
It’s far from industry standard and you might find yourself having difficulty hiring engineers with such knowledge. It has a steep learning curve as well. It’s absolutely an overhead for small to medium-sized projects, but it’s undeniably essential once you start playing in a high league of super apps.
If you were to ask whether we’d go this path again, the answer would come in a fast and correct way – yes, without any doubts.
Authored by Sergii Grechukha on behalf of the Passenger App team at Grab. Special thanks to Madushan Gamage, Mikhail Zinov, Nguyen Van Minh, Mihai Costiug, Arunkumar Sampathkumar, Maryna Shaposhnikova, Pavlo Stavytskyi, Michael Goletto, Nico Liu, and Omar Gawish for their contributions.
Join us
Grab is more than just the leading ride-hailing and mobile payments platform in Southeast Asia. We use data and technology to improve everything from transportation to payments and financial services across a region of more than 620 million people. We aspire to unlock the true potential of Southeast Asia and look for like-minded individuals to join us on this ride.
If you share our vision of driving South East Asia forward, apply to join our team today.
In November, we experienced two incidents resulting in significant impact and degraded state of availability for issues, pull requests, and GitHub Actions services.
November 2 12:00 UTC (lasting 32 minutes)
The SSL certificate for *.githubassets.com expired, impacting web requests for GitHub.com UI and services. There was an auto-generated issue indicating the certificate was within 30 days of expiration, but it was not addressed in time. Impact was reported, and the on-call engineer remediated it promptly.
We are using this occurrence to evaluate our current processes, as well as our tooling and automation, within this area to reduce the likelihood of such instances in the future.
November 27 16:04 UTC (lasting one hour and one minute)
Our service monitors detected abnormal levels of replication lag within one of our MySQL clusters affecting the GitHub Actions service.
Due to the recency of this incident, we are still investigating the contributing factors and will provide a more detailed update in next month’s report.
In summary
We place great importance in the reliability of our services along with the trust that our users place in us every day. We’ll continue to keep you updated on the progress we’re making to ensure this. To learn more about what we’re working on, visit the GitHub engineering blog.
An analysis of the Cloudflare API availability incident on 2020-11-02
When we review design documents at Cloudflare, we are always on the lookout for Single Points of Failure (SPOFs). Eliminating these is a necessary step in architecting a system you can be confident in. Ironically, when you’re designing a system with built-in redundancy, you spend most of your time thinking about how well it functions when that redundancy is lost.
On November 2, 2020, Cloudflare had an incident that impacted the availability of the API and dashboard for six hours and 33 minutes. During this incident, the success rate for queries to our API periodically dipped as low as 75%, and the dashboard experience was as much as 80 times slower than normal. While Cloudflare’s edge is massively distributed across the world (and kept working without a hitch), Cloudflare’s control plane (API & dashboard) is made up of a large number of microservices that are redundant across two regions. For most services, the databases backing those microservices are only writable in one region at a time.
Each of Cloudflare’s control plane data centers has multiple racks of servers. Each of those racks has two switches that operate as a pair—both are normally active, but either can handle the load if the other fails. Cloudflare survives rack-level failures by spreading the most critical services across racks. Every piece of hardware has two or more power supplies with different power feeds. Every server that stores critical data uses RAID 10 redundant disks or storage systems that replicate data across at least three machines in different racks, or both. Redundancy at each layer is something we review and require. So—how could things go wrong?
In this post we present a timeline of what happened, and how a difficult failure mode known as a Byzantine fault played a role in a cascading series of events.
2020-11-02 14:43 UTC: Partial Switch Failure
At 14:43, a network switch started misbehaving. Alerts began firing about the switch being unreachable to pings. The device was in a partially operating state: network control plane protocols such as LACP and BGP remained operational, while others, such as vPC, were not. The vPC link is used to synchronize ports across multiple switches, so that they appear as one large, aggregated switch to servers connected to them. At the same time, the data plane (or forwarding plane) was not processing and forwarding all the packets received from connected devices.
This failure scenario is completely invisible to the connected nodes, as each server only sees an issue for some of its traffic due to the load-balancing nature of LACP. Had the switch failed fully, all traffic would have failed over to the peer switch, as the connected links would’ve simply gone down, and the ports would’ve dropped out of the forwarding LACP bundles.
Six minutes later, the switch recovered without human intervention. But this odd failure mode led to further problems that lasted long after the switch had returned to normal operation.
2020-11-02 14:44 UTC: etcd Errors begin
The rack with the misbehaving switch included one server in our etcd cluster. We use etcd heavily in our core data centers whenever we need strongly consistent data storage that’s reliable across multiple nodes.
In the event that the cluster leader fails, etcd uses the RAFT protocol to maintain consistency and establish consensus to promote a new leader. In the RAFT protocol, cluster members are assumed to be either available or unavailable, and to provide accurate information or none at all. This works fine when a machine crashes, but is not always able to handle situations where different members of the cluster have conflicting information.
In this particular situation:
Network traffic between node 1 (in the affected rack) and node 3 (the leader) was being sent through the switch in the degraded state,
Network traffic between node 1 and node 2 were going through its working peer, and
Network traffic between node 2 and node 3 was unaffected.
This caused cluster members to have conflicting views of reality, known in distributed systems theory as a Byzantine fault. As a consequence of this conflicting information, node 1 repeatedly initiated leader elections, voting for itself, while node 2 repeatedly voted for node 3, which it could still connect to. This resulted in ties that did not promote a leader node 1 could reach. RAFT leader elections are disruptive, blocking all writes until they’re resolved, so this made the cluster read-only until the faulty switch recovered and node 1 could once again reach node 3.
2020-11-02 14:45 UTC: Database system promotes a new primary database
Cloudflare’s control plane services use relational databases hosted across multiple clusters within a data center. Each cluster is configured for high availability. The cluster setup includes a primary database, a synchronous replica, and one or more asynchronous replicas. This setup allows redundancy within a data center. For cross-datacenter redundancy, a similar high availability secondary cluster is set up and replicated in a geographically dispersed data center for disaster recovery. The cluster management system leverages etcd for cluster member discovery and coordination.
When etcd became read-only, two clusters were unable to communicate that they had a healthy primary database. This triggered the automatic promotion of a synchronous database replica to become the new primary. This process happened automatically and without error or data loss.
There was a defect in our cluster management system that requires a rebuild of all database replicas when a new primary database is promoted. So, although the new primary database was available instantly, the replicas would take considerable time to become available, depending on the size of the database. For one of the clusters, service was restored quickly. Synchronous and asynchronous database replicas were rebuilt and started replicating successfully from primary, and the impact was minimal.
For the other cluster, however, performant operation of that database required a replica to be online. Because this database handles authentication for API calls and dashboard activities, it takes a lot of reads, and one replica was heavily utilized to spare the primary the load. When this failover happened and no replicas were available, the primary was overloaded, as it had to take all of the load. This is when the main impact started.
Reduce Load, Leverage Redundancy
At this point we saw that our primary authentication database was overwhelmed and began shedding load from it. We dialed back the rate at which we push SSL certificates to the edge, send emails, and other features, to give it space to handle the additional load. Unfortunately, because of its size, we knew it would take several hours for a replica to be fully rebuilt.
A silver lining here is that every database cluster in our primary data center also has online replicas in our secondary data center. Those replicas are not part of the local failover process, and were online and available throughout the incident. The process of steering read-queries to those replicas was not yet automated, so we manually diverted API traffic that could leverage those read replicas to the secondary data center. This substantially improved our API availability.
The Dashboard
The Cloudflare dashboard, like most web applications, has the notion of a user session. When user sessions are created (each time a user logs in) we perform some database operations and keep data in a Redis cluster for the duration of that user’s session. Unlike our API calls, our user sessions cannot currently be moved across the ocean without disruption. As we took actions to improve the availability of our API calls, we were unfortunately making the user experience on the dashboard worse.
This is an area of the system that is currently designed to be able to fail over across data centers in the event of a disaster, but has not yet been designed to work in both data centers at the same time. After a first period in which users on the dashboard became increasingly frustrated, we failed the authentication calls fully back to our primary data center, and kept working on our primary database to ensure we could provide the best service levels possible in that degraded state.
2020-11-02 21:20 UTC Database Replica Rebuilt
The instant the first database replica rebuilt, it put itself back into service, and performance resumed to normal levels. We re-ramped all of the services that had been turned down, so all asynchronous processing could catch up, and after a period of monitoring marked the end of the incident.
Redundant Points of Failure
The cascade of failures in this incident was interesting because each system, on its face, had redundancy. Moreover, no system fully failed—each entered a degraded state. That combination meant the chain of events that transpired was considerably harder to model and anticipate. It was frustrating yet reassuring that some of the possible failure modes were already being addressed.
A team was already working on fixing the limitation that requires a database replica rebuild upon promotion. Our user sessions system was inflexible in scenarios where we’d like to steer traffic around, and redesigning that was already in progress.
This incident also led us to revisit the configuration parameters we put in place for things that auto-remediate. In previous years, promoting a database replica to primary took far longer than we liked, so getting that process automated and able to trigger on a minute’s notice was a point of pride. At the same time, for at least one of our databases, the cure may be worse than the disease, and in fact we may not want to invoke the promotion process so quickly. Immediately after this incident we adjusted that configuration accordingly.
Byzantine Fault Tolerance (BFT) is a hot research topic. Solutions have been known since 1982, but have had to choose between a variety of engineering tradeoffs, including security, performance, and algorithmic simplicity. Most general-purpose cluster management systems choose to forgo BFT entirely and use protocols based on PAXOS, or simplifications of PAXOS such as RAFT, that perform better and are easier to understand than BFT consensus protocols. In many cases, a simple protocol that is known to be vulnerable to a rare failure mode is safer than a complex protocol that is difficult to implement correctly or debug.
The first uses of BFT consensus were in safety-critical systems such as aircraft and spacecraft controls. These systems typically have hard real time latency constraints that require tightly coupling consensus with application logic in ways that make these implementations unsuitable for general-purpose services like etcd. Contemporary research on BFT consensus is mostly focused on applications that cross trust boundaries, which need to protect against malicious cluster members as well as malfunctioning cluster members. These designs are more suitable for implementing general-purpose services such as etcd, and we look forward to collaborating with researchers and the open source community to make them suitable for production cluster management.
We are very sorry for the difficulty the outage caused, and are continuing to improve as our systems grow. We’ve since fixed the bug in our cluster management system, and are continuing to tune each of the systems involved in this incident to be more resilient to failures of their dependencies. If you’re interested in helping solve these problems at scale, please visit cloudflare.com/careers.
From humble beginnings, Grab has expanded across different markets in the last couple of years. We’ve added a wide range of features to the Grab platform to continue to delight our customers and driver-partners. We had to incessantly find ways to improve our existing solutions to better support new features.
In this blog, we discuss how we built Fare Storage, Grab’s single source of truth fare data store, and how we overcame the challenges to make it more reliable and scalable to support our expanding features.
To set some context for this blog, let’s define some key terms before proceeding. A Fare is a dollar amount calculated to move someone or something from point A to point B. And, a Fee is a dollar amount added to or subtracted from the original fare amount for any additional service.
Now that you’re acquainted with the key concepts, let’s look take a look at the following image. It illustrates that features such as Destination Change Fee, Waiting Fee, Cancellation Fee, Tolls, Promos, Surcharges, and many others store additional fee breakdown along with the original fare. This set of information is crucial for generating receipts and debugging processes. However, our legacy storage system wasn’t designed to host massive quantities of information effectively.
In our legacy architecture, we stored all the booking and fare-related information in a single relational database table. Adding new fare fields and breakdowns required changes in our critical booking system, making iterations prohibitively expensive and hindering innovation.
The need to store the fare information and metadata for every additional feature along with other booking information resulted in a bloated booking entity. With millions of bookings created every day at Grab, this posed a scaling and stability threat to our booking service storage. Moreover, the legacy storage only tracked the latest value of fare and lacked a holistic view of all the modifications to the fare. So, debugging the fare was also a massive chore for our Engineering and Tech Operations teams.
Drafting a solution
The shortcomings of our legacy system led us to explore options for decoupling the fare and its metadata storage from the booking details. We wanted to build a platform that can store and provide access to both fare and its audit trail.
High-level functional requirements for the new fare store were:
Provide a platform to store and retrieve fare and associated breakdowns, with no tight coupling between services.
Act as a single source-of-truth for fare and associated fees in the Grab ecosystem.
Enable clients to access the metadata of fare change events in real-time, enabling the Product team to innovate freely.
Provide smooth access to a fare’s audit trail, improving the response time to our customers’ queries.
Non-functional requirements for the fare store were:
High availability for the read and write APIs, with few milliseconds latency.
Handle concurrent updates to the fare gracefully.
Detect duplicate events for a booking for the same transaction.
Storing change sequence with Event Sourcing
Our legacy storage solution used a defined schema and only stored the latest state of the fare. We needed an audit trail-based storage system with fast querying capabilities that can store and retrieve changes in chronological order.
The Event Sourcing pattern stood out as a flexible architectural pattern as it allowed us to store and query the sequence of changes in the order it occurred. In Martin Fowler’s blog, he described Event Sourcing as:
“The fundamental idea of Event Sourcing is to ensure that every change to the state of an application is captured in an event object and that these event objects are themselves stored in the sequence they were applied for the same lifetime as the application state itself.”
With the Event Sourcing pattern, we store all the fare changes as events in the order they occurred for a booking. We iterate through these events to retrieve a complete snapshot of the modifications to the fare.
A sample Fare Event looks like this:
messageEvent{// type of the event, ADD, SUB, SET, resilientEventTypetype=1;// value which was added, subtracted or modifieddoublevalue=2;// fare for the booking after applying discountdoublefare=3;...// description bytes generated by SDKbytesdescription=11;//transactionID for the EventTypestringtransactionID=12;}
The Event Sourcing pattern also enable us to use the Command Query Responsibility Segregation (CQRS) pattern to decouple the read responsibility for different use cases.
Clients of the fare life cycle read the current fare and create events to change the fare value as per their logic. Clients can also access fare events, when required. This pattern enable clients to modify fares independently, and give them visibility to the sequence for different business needs.
The diagram below describes the overall fare life cycle from creation, modification to display using the event store.
Architecture overview
Clients interact with the Fare LifeCycle service through an SDK. The SDK offers various features such as metadata serialization, deserialization, retries, and timeouts configurations, some of which are discussed later.
The Fare LifeCycle Store service uses DynamoDB as Event Store to persist and read the fare change events backed by a cache for eventually consistent reads. For further processing, such as archiving and generation of receipts, the successfully updated events are streamed out to a message queue system.
Ensuring the integrity of the fare sequence
Democratizing the responsibility of fare modification means that multiple services might try to update the fare in parallel without prior synchronization. Concurrent fare updates for the same booking might result in a race condition. Concurrency and consistency problems are always highlights of distributed storage systems.
Let’s understand why the ordering of fare updates are important. Business rules for different cities and countries regulate the pricing features based on local market conditions and prevailing laws. For example, in some scenarios, Tolls and Waiting Fees may not be eligible for discounts or promotions. The service applying discounts needs to consider this information while applying a discount. Therefore, updates to the fare are not independent of the previous fare events.
We needed a mechanism to detect race conditions and handle them appropriately to ensure the integrity of the fare. To handle race conditions based on our use case, we explored Pessimistic and Optimistic locking mechanisms.
All the expected fare change events happen based on certain conditions being true or false. For example, less than 1% of the bookings have a payment change request initiated by passengers during a ride. And, the probability of multiple similar changes happening on the same booking is rather low. Optimistic Locking offers both efficiency and correctness for our requirements where the chances of race conditions are low, and the records are independent of each other.
The logic to calculate the fare/surcharge is coupled with the business logic of the system that calculates the fare component or fees. So, handling data race conditions on the data store layer was not an acceptable option either. It made more sense to let the clients handle it and keep the storage system decoupled from the business logic to compute the fare.
To achieve Optimistic Locking, we store a fare version and increment it on every successful update. The client must pass the version they read to modify the fare. Should there be a version mismatch between the update query and the current fare, the update is rejected. On version mismatches, the clients read the updated checksum(version) and retry with the recalculated fare.
Idempotency of event updates
The next challenge we came across was how to handle client retries – ensuring that we do not duplicate the same event for the booking. Clients might encounter sporadic errors as a result of network-related issues, although the update was successful. Under such circumstances, clients retry to update the same event, resulting in duplicate events. Duplicate events not only result in an extra space requirement, but it also impairs the clients’ understanding on whether we’ve taken an action multiple times on the fare.
As discussed in the previous section, retrying with the same version would fail due to the version mismatch. If the previous attempt successfully modified the fare, it would also update the version.
However, clients might not know if their update modified the version or if any other clients updated the data. Relying on clients to check for event duplication makes the client-side complex and leaves a chance of error if the clients do not handle it correctly.
To handle the duplicate events, we associate each event with a unique UUID (transactionID) generated from the client-side using a UUID library from the Fare LifeCycle service SDK. We check whether the transactionID is already part of successful transaction IDs before updating the fare. If we identify a non-unique transactionID, we return duplicate event errors to the client.
For unique transactionIDs, we append it to the list of transactionIDs and save it to the Event Store along with the event.
Schema-less metadata
Metadata are the breakdowns associated with the fare. We require the metadata for specific fee/fare calculation for the generation of receipts and debugging purposes. Thus, for the storage system and multiple clients, they need not know the metadata definition of all events.
One goal for our data store was to give our clients the flexibility to add new fields to existing metadata or to define new metadata without changing the API. We adopted an SDK-based approach for metadata, where clients interact with the Fare LifeCycle service via SDK. The SDK has the following responsibilities for metadata:
Serialize the metadata into bytes before making an API call to the Fare LifeCycle service.
Deserialize the bytes metadata returned from the Fare LifeCycle service into a Go struct for client access.
Serializing and deserializing the metadata on the client-side decoupled it from the Fare LifeCycle Store API. This helped teams update the metadata without deploying the storage service each time.
For reading the breakdown, the clients pass the metadata bytes to the SDK along with the Event Type, and then it converts them back into the corresponding proto schema. With this approach, clients can update the metadata without changing the Data Store Service.
Conclusion
The Fare LifeCycle service enabled us to revolutionize the fare storage at scale for Grab’s ecosystem of services. Further benefits realized with the system are:
The feature agnostic platform helped us to reduce the time-to-market for our hyper-local features so that we can further outserve our customers and driver-partners.
Decoupling the fare information from the booking information also helped us to achieve a better separation of concerns between services.
Improve the overall reliability and scalability of the Grab platform by decoupling fare and booking information, allowing them to scale independently of each other.
Reduce unnecessary coupling between services to fetch fare related information and update fare.
The audit-trail of fare changes in the chronological order reduced the time to debug fare and improved our response to customers for fare-related queries.
We hope this post helped you to have a closer look at how we used the Event Source pattern for building a data store and how we handled a few caveats and challenges in the process.
Authored by Sourabh Suman on behalf of the Pricing team at Grab. Special thanks to Karthik Gandhi, Kurni Famili, ChandanKumar Agarwal, Adarsh Koyya, Niteesh Mehra, Sebastian Wong, Matthew Saw, Muhammad Muneer, and Vishal Sharma for their contributions.
Join us
Grab is more than just the leading ride-hailing and mobile payments platform in Southeast Asia. We use data and technology to improve everything from transportation to payments and financial services across a region of more than 620 million people. We aspire to unlock the true potential of Southeast Asia and look for like-minded individuals to join us on this ride.
If you share our vision of driving South East Asia forward, apply to join our team today.
At GitHub, we are deeply invested in democratizing software development. Part of this is accomplished by serving as the home of open source and providing tools to educators and students. We are also building features that lower the barrier to entry for software development, such as Codespaces. However, there is much work left to be done in order to make software development more approachable and to make it easier to employ best practices, such as continuous integration, distribution, and documentation of software.
This is why we decided to assist fastai in their development of a new, literate programming environment for Python, called nbdev. A discussion of the motivations behind nbdev as well as a primer on the history of literate programming can be found in this blog post. For the uninitiated, literate programming, as described by Donald Knuth, it is:
…a move away from writing computer programs in the manner and order imposed by the computer, and instead enables programmers to develop programs in the order demanded by the logic and flow of their thoughts.
While a subset of ideas from literate programming have shown up in tools, such as Swift Playgrounds, Jupyter, and Mathematica, there has been a lack of tools that encompass the entire software development life cycle. nbdev builds on top of Jupyter notebooks to fill these gaps and provides the following features, many of which are integrated with GitHub:
Automated generation of docs from Jupyter notebooks hosted on GitHub Pages. These docs are searchable and automatically hyperlinked to appropriate documentation pages by introspecting keywords you surround in backticks. An example of this documentation is the official fastai docs.
Continuous integration (CI) comes setup for you with GitHub Actions, which will run unit tests automatically for you. Even if you are not familiar with GitHub Actions, this starts working right away without any manual intervention.
The nbdev environment, which consists of a web server for previewing a docs site, a Jupyter server for writing code, and a series of CLI tools are set up to work with GitHub Codespaces, which makes getting started even easier. A detailed discussion of how CodeSpaces integrates with nbdev is discussed in this blog post.
As a teaser, this is a preview of this literate programming environment in Codespaces, which includes a notebook, a docs site and an IDE:
In addition to this GitHub integration, nbdev also offers the following features:
A robust, two-way sync between notebooks and source code, which allow you to use your IDE for code navigation or quick edits if desired.
The ability to write tests directly in notebooks without having to learn special APIs. These tests get executed in parallel with a single CLI command and also with GitHub Actions.
Tools for merge/conflict resolution with notebooks in a human readable format.
Utilities to automate the publishing of pypi and conda packages.
nbdev promotes software engineering best practices by allowing developers to write unit tests and documentation in the same context as source code, without having to learn special APIs or worry about web development. Similarly, GitHub Actions run unit tests automatically by default without requiring any prior experience with these tools. We believe removing friction from writing documentation and tests promotes higher quality software and makes software more inclusive.
Aside from using nbdev to create Python software, you can extend nbdev to build new types of tools. For example, we recently used nbdev to build fastpages, an easy to use blogging platform that allows developers to create blog posts directly with Jupyter notebooks. fastpages uses GitHub Actions and GitHub Pages to automate the conversion of notebooks to blog posts and offers a variety of other features to Python developers that democratize the sharing of knowledge. We have also used nbdev and fastpages to create covid19-dashboards, which demonstrates how to create interactive dashboards that automatically update with Jupyter notebooks.
We are excited about the potential of nbdev to make software engineering more inclusive, friendly, and robust. We are also hopeful that tools like nbdev can inspire the next generation of literate programming tools. To learn more about nbdev, please see the following resources:
Finally, If you are building any projects with nbdev or would like to have further discussions, please feel free to reach out on the nbdev forums or on GitHub.
To scale up to the needs of our customers, we’ve adopted ways to efficiently deliver our services through our everyday superapp – whether it’s through continuous process improvements or coding best practices. For one, libraries have made it possible for us to increase our development velocity. In the Passenger App Android team, we’ve a mix of libraries – from libraries that we’ve built in-house to open source ones.
Every week, we release a new version of our Passenger App. Each update contains on average between five to ten library updates. In this article, we will explain how we keep all libraries used by our app up to date, and the different actions we take to avoid defect leaks into production.
How many libraries are we using?
Before we add a new library to a project, it goes through a rigorous assessment process covering many parts, such as security issue detection and usability tests measuring the impact on the app size and app startup time. This process ensures that only libraries up to our standards are added.
In total, there are more than 170 libraries powering the SuperApp, including 55 AndroidX artifacts and 22 libraries used for the sole purpose of writing automation testing (Unit Testing or UI Testing).
Who is responsible for updating
While we do have an internal process on how to update the libraries, it doesn’t mention who and how often it should be done. In fact, it’s everyone’s responsibility to make sure our libraries are up to date. Each team should be aware of the libraries they’re using and whenever a new version is released.
However, this isn’t really the case. We’ve a few developers taking ownership of the libraries as a whole and trying to maintain it. With more than 170 external libraries, we surveyed the Android developer community on how they manage libraries in the company. The result can be summarized as follow:
Survey Results
While most developers are aware of updates, they don’t update a library because the risk of defects leaking into production is too high.
Risk management
The risk is to have a defect leaking into production. It can cause regressions on existing features or introduce new crashes in the app. In a worst case scenario, if this isn’t caught before publishing, it can force us to make a hotfix and a certain number of users will be impacted.
Before updating (bump) a library, we evaluate two metrics:
the usage of this library in the codebase.
the number of changes introduced in the library between the current version and the targeted version.
The risk needs to be assessed between the number of usages of a certain library and the size of the changes. The following chart illustrate this point.
Risk Assessment Radar
This arbitrary scale helps us in deciding if we will require additional signoff from the QA team. If the estimation places the item on the bottom-left corner, the update will be less risky while if it’s on the top-right corner, it means we should follow extra verification to reduce the risk.
A good practice to reduce the risks of updating a library is to update it frequently, decreasing the diffs hence reducing the scope of impact.
Reducing the risk
The first thing we’re doing to reduce the risk is to update our libraries on a weekly basis. As described above, small changes are always less risky than large changes even if the usage of this partial library is wide. By following incremental updates, we avoid accumulating potential issues over a longer period of time.
For example, the Android Jetpack and Firebase libraries follow a two-week release train. So every two weeks, we check for new updates, read the changelogs, and proceed with the update.
In case of a defect detected, we can easily revert the change until we figure out a proper solution or raise the issue to the library owner.
Automation
To reduce risk on any merge request (not limited to library update), we’ve spent a tremendous amount of effort on automating tests. For each new feature we’ve a set of test cases written in Gherkin syntax.
Automation is implemented as UI tests that run on continuous integration (CI) for every merge request. If those tests fail, we won’t be able to merge any changes.
To further elaborate, let’s take this example: Team A developed a lot of features and now has a total of 1,000 test cases. During regression testing before each release, only a subset of those are executed manually based on the impacted area. With automation in place, team A now has 60% of those tests executed as part of CI. So, when all the tests successfully pass, we’re already 60% confident that no defect is detected. This tremendously increases our confidence level while reducing manual testing.
QA signoff
When the update is in the risk threshold area and the automation tests are insufficient, the developer works with QA engineers on analyzing impacted areas. They would then execute test cases related to the impacted area.
For example, if we’re updating Facebook library, the impacted area would be the “Login with Facebook” functionality. QA engineers would then run test cases related to social login.
A single or multiple team can be involved. In some cases, QA signoff can be required by all the teams if they’re all affected by the update.
This process requires a lot of effort from different teams and can affect the current roadmap. To avoid falling into this category, we refine the impacted area analysis to be as specific as possible.
Update before it becomes mandatory
Google updates the Google Play requirements regularly to ensure that published apps are fully compatible with the latest Android version.
For example, starting 1st November 2020 all apps must target API 29. This change causes behavior changes for some API. New behavior has to be supported and verified for our code, but also for all the libraries we use. Libraries bundled inside our app are also affected if they’re using Android API. However, the support for newer API is done by each library maintainer. By keeping our libraries up to date, we ensure compatibility with the latest Android API.
Key takeaways
Keep updating your libraries. If they’re following a release plan, try to match it so it won’t accumulate too many changes. For every new release at Grab, we ship a new version each week, which includes between 5 to 10 libraries bump.
For each update, identify the potential risks on your app and find the correct balance between risk and effort required to mitigate this. Don’t overestimate the risk, especially if the changes are minimal and only include some minor bug fixing. Some library updates don’t even change any single line of code and are only documentation updates.
Invest in robust automation testing to create a high confidence level when making changes, including potentially large changes like a huge library bump.
Authored by Lucas Nelaupe on behalf of the Grab Android Development team. Special thanks to Tridip Thrizu and Karen Kue for the design and copyediting contributions.
Join us
Grab is more than just the leading ride-hailing and mobile payments platform in Southeast Asia. We use data and technology to improve everything from transportation to payments and financial services across a region of more than 620 million people. We aspire to unlock the true potential of Southeast Asia and look for like-minded individuals to join us on this ride.
If you share our vision of driving South East Asia forward, apply to join our team today.
This is the second post in our series on DevOps fundamentals. For a guide to what DevOps is and answers to common DevOps myths check out part one.
What role does automation play in DevOps?
First things first—automation is one of the key principles for accelerating with DevOps. As noted in my last blog post, it enables consistency, reliability, and efficiency within the organization, making it easier for teams to discover and troubleshoot problems.
However, as we’ve worked with organizations, we’ve found not everyone knows where to get started, or which processes can and should be automated. In this post, we’ll discuss a few best practices and insights to get teams moving in the right direction.
A few helpful guidelines
The path to DevOps automation is continually evolving. Before we dive into best practices, there are a few common guidelines to keep in mind as you’re deciding what and how you automate.
Choose open standards. Your contributors and team may change, but that doesn’t mean your tooling has to. By maintaining tooling that follows common, open standards, you can simplify onboarding and save time on specialized training. Community-driven standards for packaging, runtime, configuration, and even networking and storage—like those found in Kubernetes—also become even more important as DevOps and deployments move toward the cloud.
Use dynamic variables. Prioritizing reusable code will reduce the amount of rework and duplication you have, both now and in the future. Whether in scripts or specialized tools, securely using externally-defined variables is an easy way to apply your automation to different environments without needing to change the code itself.
Use flexible tooling you can take with you. It’s not always possible to find a tool that fits every situation, but using a DevOps tool that allows you to change technologies also helps reduce rework when companies change direction. By choosing a solution with a wide ecosystem of partner integrations that works with any cloud, you’ll be able to define your unique set of best practices and reach your goals—without being restricted by your toolchain.
DevOps automation best practices
Now that our guidelines are in place, we can evaluate which sets of processes we need to automate. We’ve broken some best practices for DevOps automation into four categories to help you get started.
1. Continuous integration, continuous delivery, and continuous deployment
We often think of the term “DevOps” as being synonymous with “CI/CD”. At GitHub we recognize that DevOps includes so much more, from enabling contributors to build and run code (or deploy configurations) to improving developer productivity. In turn, this shortens the time it takes to build and deliver applications, helping teams add value and learn faster. While CI/CD and DevOps aren’t precisely the same, CI/CD is still a core component of DevOps automation.
Continuous integration (CI) is a process that implements testing on every change, enabling users to see if their changes break anything in the environment.
Continuous delivery (CD) is the practice of building software in a way that allows you to deploy any successful release candidate to production at any time.
Continuous deployment (CD) takes continuous delivery a step further. With continuous deployment, every successful change is automatically deployed to production. Since some industries and technologies can’t immediately release new changes to customers (think hardware and manufacturing), adopting continuous deployment depends on your organization and product.
Together, continuous integration and continuous delivery (commonly referred to as CI/CD) create a collaborative process for people to work on projects through shared ownership. At the same time, teams can maintain quality control through automation and bring new features to users with continuous deployment.
2. Change management
Change management is often a critical part of business processes. Like the automation guidelines, there are some common principles and tooling that development and operations teams can use to create consistency.
Version control: The practice of using version control has a long history rooted in helping people revert changes and learn from past decisions. From RCS to SVN, CVS to Perforce, ClearCase to Git, version control is a staple for enabling teams to collaborate by providing a common workflow and code base for individuals to work with.
Change control: Along with maintaining your code’s version history, having a system in place to coordinate and facilitate changes helps to maintain product direction, reduces the probability of harmful changes to your code, and encourages a collaborative process.
Configuration management: Configuration management makes it easier for everyone to manage complex deployments through templates and manage changes at scale with proper controls and approvals.
3. ‘X’ as code
By now, you also may have heard of “infrastructure as code,” “configuration as code,” “policy as code,” or some of the other “as code” models. These models provide a declarative framework for managing different aspects of your operating environments through high level abstractions. Stated another way, you provide variables to a tool and the output is consistently the same, allowing you to recreate your resources consistently. DevOps implements the “as code” principle with several goals, including: an auditable change trail for compliance, collaborative change process via version control, a consistent, testable and reliable way of deploying resources, and as a way to lower the learning curve for new team members.
Infrastructure as code (IaC) provides a declarative model for creating immutable infrastructure using the same versioning and workflow that developers use for source code. As changes are introduced to your infrastructure requirements, new infrastructure is defined, tested, and deployed with new configurations through automated declarative pipelines.
Platform as code (PaC) provides a declarative model for services similar to how infrastructure as code provides a framework for recreating the same infrastructure—allowing you to rapidly deploy services to existing infrastructure with high-level abstractions.
Configuration as code (CaC) brings the next level of declarative pipelining by defining the configuration of your applications as versioned resources.
Policy as code brings versioning and the DevOps workflow to security and policy management.
4. Continuous monitoring
Operational insights are an invaluable component of any production environment. In order to understand the behaviors of your software in production, you need to have information about how it operates. Continuous monitoring—the processes and technology that monitor performance and stability of applications and infrastructure throughout the software lifecycle—provides operations teams with data to help troubleshoot, and development teams the information needed to debug and patch. This also leads into an important aspect of security, where DevSecOps takes on these principles with a security focus. Choosing the right monitoring tools can be the difference between a slight service interruption and a major outage. When it comes to gaining operational insights, there are some important considerations:
Logging gives you a continuous stream of data about your business’ critical components. Application logs, infrastructure logs, and audit logs all provide important data that helps teams learn and improve products.
Monitoring provides a level of intelligence and interpretation to the raw data provided in logs and metrics. With advanced tooling, monitoring can provide teams with correlated insights beyond what the raw data provides.
Alerting provides proactive notifications to respective teams to help them stay ahead of major issues. When effectively implemented, these alerts not only let you know when something has gone wrong, but can also provide teams with critical debugging information to help solve the problem quickly.
Tracing takes logging a step further, providing a deeper level of application performance and behavioral insights that can greatly impact the stability and scalability of applications in production environments.
Putting DevOps automation into action
At this point, we’ve talked much about automation in the DevOps space, so is DevOps all about automation? Put simply, no. Automation is an important means to accomplishing this work efficiently between teams. Whether you’re new to DevOps or migrating from another set of automation solutions, testing new tooling with a small project or process is a great place to start. It will lay the foundation for scaling and standardizing automation across your entire organization, including how to measure effectiveness and progression toward your goals.
Regardless of which toolset you choose to automate your DevOps workflow, evaluating your teams’ current workflows and the information you need to do your work will help guide you to your tool and platform selection, and set the stage for success. Here are a few more resources to help you along the way:
Welcome to the first deep dive of the Building GitHub blog series, providing a look at how teams across the GitHub engineering organization identify and address opportunities to improve our internal development tooling and infrastructure.
At GitHub, we use the Four Key Metrics of high performing software development to help frame our engineering fundamentals effort. As we measured Lead Time for Changes—the time it takes for code to be successfully running in production—we identified that developers waited an average of 45 minutes for a successful run of our continuous integration suite to complete before merging any change. This 45-minute lead time was repeated once more before deploying a merge branch. In a perfect scenario, a developer waited almost two hours after checking in code before the change went live on GitHub.com. This 45-minute CI now takes only 15 minutes to run! Here is a deep dive on how we made GitHub’s CI workflow 3x faster.
Analyzing the problem
At this moment the monumental Ruby monolith that powers millions of developers on GitHub.com, has over 7,000 test suites and over 5,000 test files. Every commit to a pull request triggers 25 CI jobs and requires 15 of those CI jobs to complete before merging a pull request. This meant that a developer at GitHub spent approximately 45 minutes and 600 cores of computing resources for every commit. That’s a lot of developer-hours and machine-hours that could be spent creating value for our customers.
Analyzing the types of CI jobs, we identified four categories: unit testing, linting/performance, integration testing, builds/deployments. All jobs except two of the integration testing jobs took less than 13 minutes to run. The two integration testing jobs were the bottleneck in our Lead Time for Changes. As it is true for most DevOps cycles, several test suites were also flaky. Although this blog post isn’t going to share how we solved for the flakiness of our tests, spoiler alert, a future post in this series will explain that process. Apart from being flaky, the two integration testing jobs increased developer friction and reduced productivity at GitHub.
Engineering decision
GitHub Enterprise Server, the on-premise offering of GitHub used by our enterprise customers, ships a new patch release every two weeks and a major release every quarter. The two long running test suites were added to the CI workflow to ensure a pull request did not break the GitHub experience for our Enterprise Server customers. It was also clear that these 45-minute test suites did not provide additional value blocking GitHub.com deployments that happen continuously throughout the day. Driven by customer obsession and developer satisfaction, we developed the deferred compliance tool.
Deferred compliance
The deferred compliance tool integrated along with our CI workflow system aims to strike a critical balance between improving Lead Time for Change in deploying GitHub.com and creating accountability for the quality of Enterprise Server. The long running CI jobs are no longer required to pass before a pull request is merged but the deferred compliance tool is monitoring for any test failure.
If a CI job fails, a GitHub issue with a deferred compliance label is created and the pull request author and code segment’s code owners are tagged. A warning message is sent on Slack to the developer and a 72-hour timer is kicked off. The developer now has 72 hours to fix the build, push a change or revert the pull request. A successful run of the CI job automatically closes the compliance issue and the 72-hour timer is turned off. If the CI job remains broken for more than 72 hours, all deployments to GitHub.com are halted, barring any exceptional situations, until the integration tests for Enterprise Server are fixed. This creates accountability and ownership for all our developers to build features that work flawlessly on GitHub.com and Enterprise Server. The 72-hour timer is customizable but our analysis showed that with a global team of developers, 72 hours reduced the possibility that a change merged by a developer in San Francisco on a Friday afternoon did not unintentionally block deployments for a developer in Sydney on Monday morning. Deferred compliance can be used for any long running CI run that does not need to block deployments while creating a call for action for CI run failures.
Key Takeaways
Internal engineering tooling is a powerful resource to support developers and at the same time provide guardrails for product consistency.
Focusing on a key metric allows us to identify bottlenecks and develop simple and creative solutions.
Comprehending historical context for past decisions and being customer obsessed provides us an opportunity to build a more thoughtful engineering design.
Overall, this project is a testimony that a simple solution can significantly improve developer productivity and that can have long-term positive implications to an engineering organization. And of course, since numbers matter, we made our CI 3x faster.
Here at GitHub, we pride ourselves on providing a first-class developer experience to you, our customers. We’re developers, too, and we love that the features that we build for GitHub.com make your day easier — and make ours easier, too. We also know that the more we invest in the infrastructure and tooling that powers GitHub, the faster we can deliver those features, and we’ll have a more delightful experience to boot.
In addition to investing in the infrastructure, we also want to shine a light on all the hard work we do behind the scenes to make GitHub better, specifically focusing on our internal development tooling and infrastructure. And, today, we’re excited to introduce the Building GitHub blog series, providing deep-dives on how teams across the engineering organization have been banding together to identify and address opportunities that would provide us an even smoother internal development experience, up our technical excellence, and improve system reliability in the process. From running the latest and greatest Ruby version, to dramatically decreasing our application boot time, to smoother and more reliable progressive deploys, these efforts paid off greatly and decreased our cycle times.
To help frame our efforts for potential investments, we revisited the Four Key Metrics of high performing software delivery, as our very own Dr. Nicole Forsgren found in her research and outlined by DevOps Research and Assessment. These include:
Deploy Frequency. How frequently is the team deploying?
Lead Time for Changes. How long does it take to get code successfully running in production?
Time to Restore Service. How long does it take to recover from an incident?
Change Fail Rate. What percentage of changes to production result in degraded service?
Ideally, any investment we make in our development tooling would move the needle in at least one of these areas. We’ve had teams across the organization join together to tackle these, sometimes diving into areas of our internal systems that they weren’t previously familiar with. This approach provides the opportunity to explore new solutions, and collaborate cross-team and cross-discipline. The excitement of engineers involved in each of these efforts is palpable — not only are we thrilled when we notice a dramatic shift in boot time or introduce new tooling that makes monitoring and debugging even easier, but teams enjoy working more closely with engineers in other parts of the org.
Continue reading along with us in the Building GitHub blog series, where we’ll share specific goals and lessons, the impact of our work, and how we did it. To continue this journey, we’ll start the series with a deep dive on faster CI and we hope to share more soon.
This is our second post on cloud deployment with containers. Looking for more? Join our upcoming GitHub Actions webcast with Sarah, Solutions Engineer Pavan Ravipati, and Senior Product Manager Kayla Ngan on October 22.
In the past few years, businesses have moved towards cloud-native operating models to help streamline operations and move away from costly infrastructure. When running applications in dynamic environments with Docker, Kubernetes, and other tooling, a container becomes the tool of choice as a consistent, atomic unit of packaging, deployment, and application management. This sounds straightforward: build a new application, package it into containers, and scale elastically across the infrastructure of your choice. Then you can automatically update with new images as needed and focus more on solving problems for your end users and customers.
However, organizations don’t work in vacuums. They’re part of a larger ecosystem of customers, partners, and open source communities, with unique cultures, existing processes, applications, and tooling investments in place. This adds new challenges and complexity for adopting cloud native tools such as containers, Kubernetes, and other container schedulers.
Challenges for adopting container-based strategies in organizations
At GitHub, we’re fortunate to work with many customers on their container and DevOps strategy. When it comes to adopting containers, there are a few consistent challenges we see across organizations.
Containerizing and maintaining applications: Most organizations have existing applications and need to make the decision about whether to keep them as-is, or to place them in containers for an easier transition to the cloud. Even then, teams need to determine whether a single container for the application is appropriate (in a lift-and-shift motion to the cloud), or if more extensive work is needed to break it down into multiple services, delivered as a set of containers.
Efficiently configuring and managing permissions: Adopting containers often translates to better collaboration for everyone in your organization. DevOps is now more than just core developers and IT operators. It includes release and infosec engineers, data scientists, QA, project managers, and other roles. But collaborating across multiple teams introduces new needs for configuring and managing permissions for code, along with the automation to support it.
Standardizing best practices across the organization: Containers help teams scale and integrate quickly, but may also require updating your CI/CD practices to match. You have to validate they work well for existing applications, while incorporating the correct user and package permissions and policies.. The best practices you set have to be flexible for others too. Individual teams—who are transitioning to new ways of working—need to be able to optimize for their own goals.
Connecting teams and cloud-native tools with GitHub
Despite the few challenges of adopting containers and leveraging Kubernetes, more and more organizations continue to use them. Stepping over those hurdles allows enterprises to automate and streamline their operations, here with a few examples of how enterprises make it work successfully with support from package managers and CI/CD tools. At GitHub, we’ve introduced container support in GitHub Packages, CI/CD through GitHub Actions, and partnered within the ecosystem to simplify cloud-native workflows. Finding the right container tools should mean less work, not more—easily integrating alongside other tools, projects, and processes your organization already uses.
See container best practices in action
Want to simplify container deployments in your organization? Join me, Solutions Engineer Pavan Ravipati, and Senior Product Manager Kayla Ngan on October 22 to learn more about successfully adopting containers. We’ll walk through how to use them in the real world and demo best practices for deploying an application to Azure with GitHub Container Registry.
Earlier this year, we took you on a journey on how we built and deployed our event sourcing and stream processing framework at Grab. We’re happy to share that we’re able to reliably maintain our uptime and continue to service close to 400 billion events a week. We haven’t stopped there though. To ensure that we can scale our framework as the Grab business continuously grows, we have spent efforts optimizing our infrastructure.
In this article, we will dive deeper into our Kubernetes infrastructure setup for our stream processing framework. We will cover why and how we focus on optimal scalability and availability of our infrastructure.
Quick Architecture Recap
The Coban platform provides lightweight Golang plugin architecture-based data processing pipelines running in Kubernetes. These are essentially Kafka consumer pods that consume data, process it, and then materialize the results into various sinks (RDMS, other Kafka topics).
Anatomy of a Processing Pod
Each stream processing pod (the smallest unit of a pipeline’s deployment) has three top level components:
Trigger: An interface that connects directly to the source of the data and converts it into an event channel.
Runtime: This is the app’s entry point and the orchestrator of the pod. It manages the worker pools, triggers, event channels, and lifecycle events.
Pipeline plugin: This is provided by the user, and conforms to a contract that the platform team publishes. It contains the domain logic for the pipeline and houses the pipeline orchestration defined by a user based on our Stream Processing Framework.
Optimal Scaling
We initially architected our Kubernetes setup around horizontal pod autoscaling (HPA), which scales the number of pods per deployment based on CPU and memory usage. HPA keeps CPU and memory per pod specified in the deployment manifest and scales horizontally as the load changes.
These were the areas of application wastage we observed on our platform:
As Grab’s traffic is uneven, we’d always have to provision for peak traffic. As users would not (or could not) always account for ramps, they would be fairly liberal with setting limit values (CPU and memory), leading to resource wastage.
Pods often had uneven traffic distribution despite fairly even partition load distribution in Kafka. The Stream Processing Framework(SPF) is essentially Kafka consumers consuming from Kafka topics, hence the number of pods scaling in and out resulted in unequal partition load per pod.
Vertically Scaling with Fixed Number of Pods
We initially kept the number of pods for a pipeline equal to the number of partitions in the topic the pipeline consumes from. This ensured even distribution of partitions to each pod providing balanced consumption. In order to abstract this from the end user, we automated the application deployment process to directly call the Kafka API to fetch the number of partitions during runtime.
After achieving a fixed number of pods for the pipeline, we wanted to move away from HPA. We wanted our pods to scale up and down as the load increases or decreases without any manual intervention. Vertical pod autoscaling (VPA) solves this problem as it relieves us from any manual operation for setting up resources for our deployment.
We just deploy the application and let VPA handle the resources required for its operation. It’s known to not be very susceptible to quick load changes as it trains its model to monitor the deployment’s load trend over a period of time before recommending an optimal resource. This process ensures the optimal resource allocation for our pipelines considering the historic trends on throughput.
We saw a ~45% reduction in our total resource usage vs resource requested after moving to VPA with a fixed number of pods from HPA.
Managing Availability
We broadly classify our workloads as latency sensitive (critical) and latency tolerant (non-critical). As a result, we could optimize scheduling and cost efficiency using priority classes and overprovisioning on heterogeneous node types on AWS.
Kubernetes Priority Classes
The main cost of running EKS in AWS is attributed to the EC2 machines that form the worker nodes for the Kubernetes cluster. Running On-Demand brings all the guarantees of instance availability but it is definitely very expensive. Hence, our first action to drive cost optimisation was to include Spot instances in our worker node group.
With the uncertainty of losing a spot instance, we started assigning priority to our various applications. We then let the user choose the priority of their pipeline depending on their use case. Different priorities would result in different node affinity to different kinds of instance groups (On-Demand/Spot). For example, Critical pipelines (latency sensitive) run on On-Demand worker node groups and Non-critical pipelines (latency tolerant) on Spot instance worker node groups.
We use priority class as a method of preemption, as well as a node affinity that chooses a certain priority pipeline for the node group to deploy to.
Overprovisioning
With spot instances running we realised a need to make our cluster quickly respond to failures. We wanted to achieve quick rescheduling of evicted pods, hence we added overprovisioning to our cluster. This means we keep some noop pods occupying free space running in our worker node groups for the quick scheduling of evicted or deploying pods.
The overprovisioned pods are the lowest priority pods, thus can be preempted by any pod waiting in the queue for scheduling. We used cluster proportional autoscaler to decide the right number of these overprovisioned pods, which scales up and down proportionally to cluster size (i.e number of nodes and CPU in worker node group). This relieves us from tuning the number of these noop pods as the cluster scales up or down over the period keeping the free space proportional to current cluster capacity.
Lastly, overprovisioning also helped improve the deployment time because there is no dependency on the time required for Auto Scaling Groups (ASG) to add a new node to the cluster every time we want to deploy a new application.
Future Improvements
Evolution is an ongoing process. In the next few months, we plan to work on custom resources for combining VPA and fixed deployment size. Our current architecture setup works fine for now, but we would like to create a more tuneable in-house CRD(Custom Resource Definition) for VPA that incorporates rightsizing our Kubernetes deployment horizontally.
Authored By Shubham Badkur on behalf of the Coban team at Grab – Ryan Ooi, Karan Kamath, Hui Yang, Yuguang Xiao, Jump Char, Jason Cusick, Shrinand Thakkar, Dean Barlan, Shivam Dixit, Andy Nguyen, and Ravi Tandon.
Join us
Grab is more than just the leading ride-hailing and mobile payments platform in Southeast Asia. We use data and technology to improve everything from transportation to payments and financial services across a region of more than 620 million people. We aspire to unlock the true potential of Southeast Asia and look for like-minded individuals to join us on this ride.
If you share our vision of driving South East Asia forward, apply to join our team today.
What makes a project successful? For developers building cloud-native applications, successful projects thrive on transparent, consistent, and rigorous collaboration. That collaboration is one of the reasons that many open source projects, like Docker containers and Kubernetes, grow to become standards for how we build, deliver, and operate software. Our Open Source Guides and Introduction to innersourcing are great first steps to setting up and encouraging these best practices in your own projects.
However, a common challenge that application developers face is manually testing against inconsistent environments. Accurately testing Kubernetes applications can differ from one developer’s environment to another, and implementing a rigorous and consistent environment for end-to-end testing isn’t easy. It can also be very time consuming to spin up and down Kubernetes clusters. The inconsistencies between environments and the time required to spin up new Kubernetes clusters can negatively impact the speed and quality of cloud-native applications.
Building a transparent CI process
On GitHub, integration and testing becomes a little easier by combining GitHub Actions with open source tools. You can treat Actions as the native continuous integration and continuous delivery (CI/CD) tool for your project, and customize your Actions workflow to include automation and validation as next steps.
Since Actions can be triggered based on nearly any GitHub event, it’s also possible to build in accountability for updating tests and fixing bugs. For example, when a developer creates a pull request, Actions status checks can automatically block the merge if the test fails.
Here are a few more examples:
Branch protection rules in the repository help enforce certain workflows, such as requiring more than one pull request review or requiring certain status checks to pass before allowing a pull request to merge.
GitHub Actions are natively configured to act as status checks when they’re set up to trigger `on: [pull_request]`.
Continuous integration (CI) is extremely valuable as it allows you to run tests before each pull request is merged into production code. In turn, this will reduce the number of bugs that are pushed into production and increases confidence that newly introduced changes will not break existing functionality.
But transparency remains key: Requiring CI status checks on protected branches provides a clearly-defined, transparent way to let code reviewers know if the commits meet the conditions set for the repository—right in the pull request view.
Using community-powered workflows
Now that we’ve thought through the simple CI policies, automated workflows are next. Think of an Actions workflow as a set of “plug and play” open sourced, automated steps contributed by the community. You can use them as they are, or customize and make them your own. Once you’ve found the right one, open sourced Actions can be plugged into your workflow with the`- uses: repo/action-name` field.
You might ask, “So how do I find available Actions that suit my needs?”
As you’re building automation and CI pipelines, take advantage of Marketplace to find pre-built Actions provided by the community. Examples of pre-built Actions span from a Docker publish and the kubectl CLI installation to container scans and cloud deployments. When it comes to cloud-native Actions, the list keeps growing as container-based development continues to expand.
Testing with kind
Testing is a critical part of any CI/CD pipeline, but running tests in Kubernetes can absorb the extra time that automation saves. Enter kind. kind stands for “Kubernetes in Docker.” It’s an open source project from the Kubernetes special interest group (SIGs) community, and a tool for running local Kubernetes clusters using Docker container “nodes.” Creating a kind cluster is a simple way to run Kubernetes cluster and application testing—without having to spin up a complete Kubernetes environment.
As the number of Kubernetes users pushing critical applications to production grows, so does the need for a repeatable, reliable, and rigorous testing process. This can be accomplished by combining the creation of a homogenous Kubernetes testing environment with kind, the community-powered Marketplace, and the native and transparent Actions CI process.
Bringing it all together with kind and Actions
Come see kind and Actions at work during our next GitHub Demo Day live stream on October 16, 2020 at 11am PT. I’ll walk you through how to easily set up automated and consistent tests per pull request, including how to use kind with Actions to automatically run end-to-end tests across a common Kubernetes environment.
This blog post is a two-part presentation of the effort that went into improving the continuous delivery processes for backend services at Grab in the past two years. In the first part, we take stock of where we started two years ago and describe the software and tools we created while introducing some of the integrations we’ve done to automate our software delivery in our staging environment.
Continuous Delivery is the principle of delivering software often, every day.
As a backend engineer at Grab, nothing matters more than the ability to innovate quickly and safely. Around the end of 2018, Grab’s transportation and deliveries backend architecture consisted of roughly 270 services (the majority being microservices). The deployment process was lengthy, required careful inputs and clear communication. The care needed to push changes in production and the risk associated with manual operations led to the introduction of a Slack bot to coordinate deployments. The bot ensures that deployments occur only during off-peak and within work hours:
Overview of the Grab Delivery Process
Once the build was completed, engineers who desired to deploy their software to the Staging environment would copy release versions from the build logs, and paste them in a Jenkins job’s parameter. Tests needed to be manually triggered from another dedicated Jenkins job.
Prior to production deployments, engineers would generate their release notes via a script and update them manually in a wiki document. Deployments would be scheduled through interactions with a Slack bot that controls release notes and deployment windows. Production deployments were made once again by pasting the correct parameters into two dedicated Jenkins jobs, one for the canary (a.k.a. one-box) deployment and the other for the full deployment, spread one hour apart. During the monitoring phase, engineers would continuously observe metrics reported on our dashboards.
In spite of the fragmented process and risky manual operations impacting our velocity and stability, around 614 builds were running each business day and changes were deployed on our staging environment at an average rate of 300 new code releases per business day, while production changes averaged a rate of 28 new code releases per business day.
Our Deployment Funnel, Towards the End of 2018
These figures meant that, on average, it took 10 business days between each service update in production, and only 10% of the staging deployments were eventually promoted to production.
Automating Continuous Deployments at Grab
With an increased focus on Engineering efficiency, in 2018 we started an internal initiative to address frictions in deployments that became known as Conveyor. To build Conveyor with a small team of engineers, we had to rely on an already mature platform which exhibited properties that are desirable to us to achieve our mission.
Hands-off deployments
Deployments should be an afterthought. Engineers should be as removed from the process as possible, and whenever possible, decisions should be taken early, during the code review process. The machine will do the heavy lifting, and only when it can’t decide for itself, should the engineer be involved. Notifications can be leveraged to ensure that engineers are only informed when something goes wrong and a human decision is required.
Hands-off Deployment Principle
Confidence in Deployments
Grab’s focus on gathering internal Engineering NPS feedback helped us collect valuable metrics. One of the metrics we cared about was our engineers’ confidence in their production deployments. A team’s entire deployment process to production could last for more than a day and may extend up to a week for teams with large infrastructures running critical services. The possibility of losing progress in deployments when individual steps may last for hours is detrimental to the improvement of Engineering efficiency in the organisation. The deployment automation platform is the bedrock of that confidence. If the platform itself fails regularly or does provide a path of upgrade that is transparent to end-users, any features built on top of it would suffer from these downtimes and ultimately erode confidence in deployments.
Tailored To Most But Extensible For The Few
Our backend engineering teams are working on diverse stacks, and so are their deployment processes. Right from the start, we wanted our product to benefit the largest population of engineers that had adopted the same process, so as to maximize returns on our investments. To ease adoption, we decided to tailor a deployment pipeline such that:
It would model the exact sequence of manual processes followed by this population of engineers.
Switching to use that pipeline should require as little work as possible by service teams.
However, in cases where this model would not fit a team’s specific process, our deployment platform should be open and extensible and support new customizations even when they are not originally supported by the product’s ecosystem.
Cloud-Agnosticity
While we were going to target a specific process and team, to ensure that our solution would stand the test of time, we needed to ensure that our solution would support the variety of environments currently used in production. This variety was also likely to increase, and we wanted a platform that would mature together with the rest of our ecosystem.
Overview Of Conveyor
Setting Sail With Spinnaker
Conveyor is based on Spinnaker, an open-source, multi-cloud continuous delivery platform. We’ve chosen Spinnaker over other platforms because it is a mature deployment platform with no single point of failure, supports complex workflows (referred to as pipelines in Spinnaker), and already supports a large array of cloud providers. Since Spinnaker is open-source and extensible, it allowed us to add the features we needed for the specificity of our ecosystem.
To further ease adoption within our organization, we built a tailored user interface and created our own domain-specific language (DSL) to manage its pipelines as code.
Outline of Conveyor’s Architecture
Onboarding To A Simpler Interface
Spinnaker comes with its own interface, it has all the features an engineer would want from an advanced continuous delivery system. However, Spinnaker interface is vastly different from Jenkins and makes for a steep learning curve.
To reduce our barrier to adoption, we decided early on to create a simple interface for our users. In this interface, deployment pipelines take the center stage of our application. Pipelines are objects managed by Spinnaker, they model the different steps in the workflow of each deployment. Each pipeline is made up of stages that can be assembled like lego-bricks to form the final pipeline. An instance of a pipeline is called an execution.
Conveyor Dashboard
With this interface, each engineer can focus on what matters to them immediately: the pipeline they have started, or those started by other teammates working on the same services as they are. Conveyor also provides a search bar (on the top) and filters (on the left) that work in concert to explore all pipelines executed at Grab.
We adopted a consistent set of colours to model all information in our interface:
blue: represent stages that are currently running;
red: stages that have failed or important information;
yellow: stages that require human interaction;
and finally, in green: stages that were successfully completed.
Conveyor also provides a task and notifications area, where all stages requiring human intervention are listed in one location. Manual interactions are often no more than just YES or NO questions:
Conveyor Tasks
Finally, in addition to supporting automated deployments, we greatly simplified the start of manual deployments. Instead of being required to copy/paste information, each parameter can be selected on the interface from a set of predefined items, sorted chronologically, and presented with contextual information to help engineers in their decision.
Several parameters are required for our deployments and their values are selected from the UI to ensure correctness.
Simplified Manual Deployments
Ease Of Adoption With Our Pipeline-As-Code DSL
Ease of adoption for the team is not simply about the learning curve of the new tools. We needed to make it easy for teams to configure their services to deploy with Conveyor. Since we focused on automating tasks that were already performed manually, we needed only to configure the layer that would enable the integration.
We set on creating a pipeline-as-code implementation when none were widely being developed in the Spinnaker community. It’s interesting to see that two years on, this idea has grown in parallel in the community, with the birth of other pipeline-as-code implementations. Our pipeline-as-code is referred to as the Pipeline DSL, and its configuration is located inside each team’s repository. Artificer is the name of our Pipeline DSL interpreter and it runs with every change inside our monorepository:
Artificer: Our Pipeline DSL
Pipelines are being updated at every commit if necessary.
Creating a conveyor.jsonnet file inside with the service’s directory of our monorepository with the few lines below is all that’s required for Artificer to do its work and get the benefits of automation provided by Conveyor’s pipeline:
Sample minimal conveyor.jsonnet configuration to onboard services.
In this file, engineers simply specify the name of their service and the group that a user should belong to, to have deployment rights for the service.
Once the build is completed, teams can log in to Conveyor and start manual deployments of their services with our pipelines. Three pipelines are provided by default: the integration pipeline used for tests and developments, the staging pipeline used for pre-production tests, and the production pipeline for production deployment.
Thanks to the simplicity of this minimal configuration file, we were able to generate these configuration files for all existing services of our monorepository. This resulted in the automatic onboarding of a large number of teams and was a major contributing factor to the adoption of Conveyor throughout our organisation.
Our Journey To Engineering Efficiency (for backend services)
The sections below relate some of the improvements in engineering efficiency we’ve delivered since Conveyor’s inception. They were not made precisely in this order but for readability, they have been mapped to each step of the software development lifecycle.
Automate Deployments at Build Time
Continuous Integration Job
Continuous delivery begins with a pushed code commit in our trunk-based development flow. Whenever a developer pushes changes onto their development branch or onto the trunk, a continuous integration job is triggered on Jenkins. The products of this job (binaries, docker images, etc) are all uploaded into our artefact repositories. We’ve made two additions to our continuous integration process.
The first modification happens at the step “Upload & Register artefacts”. At this step, each artefact created is now registered in Conveyor with its associated metadata. When and if an engineer needs to trigger a deployment manually, Conveyor can display the list of versions to choose from, eliminating the need for error-prone manual inputs:
Staging
Each selectable version shows contextual information: title, author, version and link to the code change where it originated. During registration, the commit time is also recorded and used to order entries chronologically in the interface. To ensure this integration is not a single point of failure for deployments, manual input is still available optionally.
The second modification implements one of the essential feature continuous delivery: your deployments should happen often, automatically. Engineers are now given the possibility to start automatic deployments once continuous integration has successfully completed, by simply modifying their project’s continuous integration settings:
Sample settings needed to trigger auto-deployments. ‘Diff’ refers to code review submissions, and ‘Land’ refers to merged code changes.
Staging Pipeline
Before deploying a new artefact to a service in production, changes are validated on the staging environment. During the staging deployment, we verify that canary (one-box) deployments and full deployments with automated smoke and functional tests suites.
Staging Pipeline
We start by acquiring a deployment lock for this service and this environment. This prevents another deployment of the same service on the same environment to happen concurrently, other deployments will be waiting in a FIFO queue until the lock is released.
The stage “Compute Changeset” ensures that the deployment is not a rollback. It verifies that the new version deployed does not correspond to a rollback by comparing the ancestry of the commits provided during the artefact registration at build time: since we automate deployments after the build process has completed, cases of rollback may occur when two changes are created in quick succession and the latest build completes earlier than the older one.
After the stage “Deploy Canary” has completed, smoke test run. There are three kinds of tests executed at different stages of the pipeline: smoke, functional and security tests. Smoke tests directly reach the canary instance’s endpoint, by-passing load-balancers. If the smoke tests fail, the canary is immediately rolled back and this deployment is terminated.
All tests are generated from the same builds as the artefact being tested and their versions must match during testing. To ensure that the right version of the test run and distinguish between the different kind of tests to perform, we provide additional metadata that will be passed by Conveyor to the tests system, known internally as Gandalf:
Sample conveyor.jsonnet configuration with integration tests added.
Additionally, in parallel to the execution of the smoke tests, the canary is also being monitored from the moment its deployment has completed and for a predetermined duration. We leverage our integration with Datadog to allow engineers to select the alerts to monitor. If an alert is triggered during the monitoring period, and while the tests are executed, the canary is again rolled back, and the pipeline is terminated. Engineers can specify the alerts by adding them to the conveyor.jsonnet configuration file together with the monitoring duration:
Sample conveyor.jsonnet configuration with alerts in staging added.
When the smoke tests and monitor pass and the deployment of new artefacts is completed, the pipeline execution triggers functional and security tests. Unlike smoke tests, functional & security tests run only after that step, as they communicate with the cluster through load-balancers, impersonating other services.
Before releasing the lock, release notes are generated to inform engineers of the delta of changes between the version they just released and the one currently running in production. Once the lock is released, the stage “Check Policies” verifies that the parameters and variable of the deployment obeys a specific set of criteria, for example: if its service metadata is up-to-date in our service inventory, or if the base image used during deployment is sufficiently recent.
Here’s how the policy stage, the engine, and the providers interact with each other:
Check Policy Stage
In Spinnaker, each event of a pipeline’s execution updates the pipeline’s state in the database. The current state of the pipeline can be fetched by its API as a single JSON document, describing all information related to its execution: including its parameters, the contextual information related to each stage or even the response from the various interfacing components. The role of our “Policy Check” stage is to query this JSON representation of the pipeline, to extract and transform the variables which are forwarded to our policy engine for validation. Our policy engine gathers judgements passed by different policy providers. If the validation by the policy engine fails, the deployment is not rolled back this time; however, promotion to production is not possible and the pipeline is immediately terminated.
The journey through staging deployment finally ends with the stage “Register Deployment”. This stage registers that a successful deployment was made in our staging environment as an artefact. Similarly to the policy check above, certain parameters of the deployment are picked up and consolidated into this document. We use this kind of artefact as proof for upcoming production deployment.
Continuing Our Journey to Engineering Efficiency
With the advancements made in continuous integration and deployment to staging, Conveyor has reduced the efforts needed by our engineers to just three clicks in its interface, when automated deployment is used. Even when the deployment is triggered manually, Conveyor gives the assurance that the parameters selected are valid and it does away with copy/pasting and human interactions across heterogeneous tools.
In the sequel to this blog post, we’ll dive into the improvements that we’ve made to our production deployments and introduce a crucial concept that led to the creation of our proof for successful staging deployment. Finally, we’ll cover the impact that Conveyor had on the continuous delivery of our backend services, by comparing our deployment velocity when we started two years ago versus where we are today.
All these improvements in efficiency for our engineers would never have been possible without the hard work of all team members involved in the project, past and present: Evan Sebastian, Tanun Chalermsinsuwan, Aufar Gilbran, Deepak Ramakrishnaiah, Repon Kumar Roy (Kowshik), Su Han, Voislav Dimitrijevikj, Qijia Wang, Oscar Ng, Jacob Sunny, Subhodip Mandal, and many others who have contributed and collaborated with them.
Join us
Grab is more than just the leading ride-hailing and mobile payments platform in Southeast Asia. We use data and technology to improve everything from transportation to payments and financial services across a region of more than 620 million people. We aspire to unlock the true potential of Southeast Asia and look for like-minded individuals to join us on this ride.
If you share our vision of driving South East Asia forward, apply to join our team today.
Uncovering the truth behind Lua and Redis data consistency
Our team at Grab uses Redis as one of our message queues. The Redis server is deployed in a master/replica setup. Quite recently, we have been noticing a spike in the CPU usage of the Redis replicas every time we deploy our service, even when the replicas are not in use and when there’s no read traffic to it. However, the issue is resolved once we reboot the replica.
Because a reboot of the replica fixes the issue every time, we thought that it might be due to some Elasticache replication issues and didn’t pursue further. However, a recent Redis failover brought this to our attention again. After the failover, the problematic replica becomes the new master and its CPU immediately goes to 100% with the read traffic, which essentially means the cluster is not functional after the failover. And this time we investigated the issue with new vigour. What we found in our investigation led us to deep dive into the details of Redis replication and its implementation of Hash.
Did you know that Redis master/replica can become inconsistent in certain scenarios?
Did you know the encoding of Hash objects on the master and the replica are different even if the writing operations are exactly the same and in the same order? Read on to find out why.
The problem
The following graph shows the CPU utilization of the master vs. the replica immediately after our service is deployed.
CPU Utilization
From the graph, you can see the following CPU usage trends. Replica’s CPU usage:
Increases immediately after our service is deployed.
Spikes higher than the master after a certain time.
Get’s back to normal after a reboot.
Cursory investigation
Because the spike occurs only when we deploy our service, we scrutinised all the scripts that were triggered immediately after the deployment. Lua monitor script was identified as a possible suspect. The script redistributes inactive service instances’ messages in the queue to active service instances so that messages can be processed by other healthy instances.
We ran a few experiments related to the Lua monitor script using the Redis monitor command to compare the script’s behaviour on master and the replica. A side note, because this command causes performance degradation, use it with discretion. Coming back to the script, we were surprised to note that the monitor script behaves differently between the master and the replica:
Redis executes the script separately on the master and the replica. We expected the script to execute only on master and the resulting changes to be replicated to the secondary.
The Redis command HGETALL used in the script returns the hash keys in a different order on master compared to the replica.
Due to the above reasons, the script causes data inconsistencies between the master and its replica. From that point on, the data between the master and the replica keeps diverging till they become completely distinct. Due to the inconsistency, the data on the secondary does not get deleted correctly thereby growing into an extremely large dataset. Any further operations on the large dataset requires a higher CPU usage, which explains why the replica’s CPU usage is higher than the master.
During replica reboots, the data gets synced and consistent again, which is why the CPU usage gets to normal values after rebooting.
Diving deeper on HGETALL
We knew that the keys of a hash are not ordered and we should not rely on the order. But it still puzzled us that the order is different even when the writing sequence is the same between the master and the replica. Plus the fact that the orders are always the same in our local environment with a similar setup made us even more curious.
So to better understand the underlying magic of Redis and to avoid similar bugs in the future, we decided to hammer on and read the Redis source code to get more details.
HGETALL command handling code
The HGETALL command is handled by the function genericHgetallCommand and it further calls hashTypeNext to iterate through the Hash object. A snippet of the code is shown as follows:
/* Move to the next entry in the hash. Return C_OK when the next entry
 * could be found and C_ERR when the iterator reaches the end. */
int hashTypeNext(hashTypeIterator *hi) {
    if (hi->encoding == OBJ_ENCODING_ZIPLIST) {
        // call zipListNext
    } else if (hi->encoding == OBJ_ENCODING_HT) {
        // call dictNext
    } else {
        serverPanic("Unknown hash encoding");
    }
    return C_OK;
}
From the code snippet, you can see that the Redis Hash object actually has two underlying representations:
ZIPLIST
HASHTABLE (dict)
A bit of research online helped us understand that, to save memory, Redis chooses between the two hash representations based on the following limits:
By default, Redis stores the Hash object as a zipped list when the hash has less than 512 entries and when each element’s size is smaller than 64 bytes.
If either limit is exceeded, Redis converts the list to a hashtable, and this is irreversible. That is, Redis won’t convert the hashtable back to a list again, even if the entries/size falls below the limit.
Eureka moment
Based on this understanding, we checked the encoding of the problematic hash in staging.
To our surprise, the encodings of the Hash object on the master and its replica were different. Which means if we add or delete elements in the hash, the sequence of the keys won’t be the same due to hashtable operation vs. list operation!
Now that we have identified the root cause, we were still curious about the difference in encoding between the master and the replica.
How could the underlying representations be different?
We reasoned, “If the master and its replica’s writing operations are exactly the same and in the same order, why are the underlying representations still different?”
To answer this, we further looked through the Redis source to find all the possible places that a Hash object’s representation could be changed and soon found the following code snippet:
/* Load a Redis object of the specified type from the specified file.
 * On success a newly allocated object is returned, otherwise NULL. */
robj *rdbLoadObject(int rdbtype, rio *rdb) {
  //...
  if (rdbtype == RDB_TYPE_HASH) {
    //...
    o = createHashObject();  // ziplist

    /* Too many entries? Use a hash table. */
    if (len > server.hash_max_ziplist_entries)
        hashTypeConvert(o, OBJ_ENCODING_HT);

    //...
  }
}
Reading through the code we understand the following behaviour:
When restoring from an RDB file, Redis creates a ziplist first for Hash objects.
Only when the size of the Hash object is greater than the hash_max_ziplist_entries, the ziplist is converted to a hashtable.
So, if you have a Redis Hash object encoded as a hashtable with its length less than hash_max_ziplist_entries(512) in the master, when you set up a replica, it is encoded as a ziplist.
We were able to verify this behaviour in our local setup as well.
How did we fix it?
We could use the following two approaches to address this issue:
Enable script effect replication mode. This tells Redis to replicate the commands generated by the script instead of running the whole script on the replica. One disadvantage to using this approach is that it adds network traffic between the master and the replica.
Ensure the behaviour of the Lua monitor script is deterministic. In our case, we can do this by sorting the outputs of HKEYS/HGETALL.
We chose the latter approach because:
The Hash object is pretty small ( < 30 elements) so the sorting overhead is low, less than 1ms for 100 elements based on our tests.
Replicating our script effect would end up replicating thousands of Redis writing commands on the secondary causing a much higher overhead compared to replicating just the script.
After the fix, the CPU usage of the replica remained in range after each deployment. This also prevented the Redis cluster from being destroyed in the event of a master failover.
Key takeaways
In addition to writing clear and maintainable code, it’s equally important to understand the underlying storage layer that you are dealing with to produce efficient and bug-free code.
The following are some of the key learnings on Redis:
Redis does not guarantee the consistency between master and its replica nodes when Lua scripts are used. You have to ensure that the behaviour of the scripts are deterministic to avoid data inconsistency.
Redis replicates the whole Lua script instead of the resulting commands to the replica. However, this is the default behaviour and you can disable it.
To save memory, Redis uses different representations for Hash. Your Hash object could be stored as a list in memory or a hashtable. This is not guaranteed to be the same across the master and its replicas.
Join us
Grab is more than just the leading ride-hailing and mobile payments platform in Southeast Asia. We use data and technology to improve everything from transportation to payments and financial services across a region of more than 620 million people. We aspire to unlock the true potential of Southeast Asia and look for like-minded individuals to join us on this ride.
If you share our vision of driving South East Asia forward, apply to join our team today.
In August, we experienced no incidents resulting in service downtime. This month’s GitHub Availability Report will dive into updates to the GitHub Status Page and provide follow-up details on how we’ve addressed the incident mentioned in July’s report.
Status page refresh
At GitHub, we are always striving to be more transparent and clear with our users. We know our customers trust us to communicate the current availability of our services and we are now making that more clear for everyone to see. Previously, our status page shared a 90-day history of GitHub’s availability by service, but this history can distract users from what’s happening actively, which during an incident is the most important piece of information. Starting today, the status page will display our current availability and inform users of any degradation in service with real-time updates from the team. The history view will continue to be available and can be found under the “incident history” link. As a reminder, if you want to receive updates on any status changes, you can subscribe to get notifications whenever GitHub creates, updates, or resolves an incident.
Since the incident mentioned in July’s GitHub Availability Report, we’ve worked on a number of improvements to both our deployment tooling and to the way we configure our Kubernetes deployments, with the goal of improving the reliability posture of our systems.
First, we audited all the Kubernetes deployments used in production to remove all usages of the ImagePullPolicy of Always configuration.
Our philosophy when dealing with Kubernetes configuration is to make it easy for internal users to ship their code to production while continuing to follow best practices. For this reason, we implemented a change that automatically replaces the ImagePullPolicy of Always setting in all our Kubernetes-deployed applications, while still allowing experienced users with particular needs to opt out of this automation.
Second, we implemented a mechanism equivalent to the one of Kubernetes mutating admission controllers that we use to inject the latest version of sidecar containers, identified by the SHA256 digest of the image.
These changes allowed us to remove the strong coupling between Kubernetes Pods and the availability of our Docker registry in case of container restarts. We have more improvements in the pipeline that will help further increase the resilience of our Kubernetes deployments and we plan to share more information about those in the future.
In Summary
We’re excited to be able to share these updates with you and look forward to future updates as we continue our efforts in making GitHub more resilient every day.
After many months of work, we deployed GitHub to production using Ruby 2.7 in July. For those who aren’t familiar with GitHub’s stack, we’ve been running on Ruby since the beginning. Many years ago, we ran GitHub on a fork of Ruby (and Rails!) and while that hasn’t been the case for some time, that experience taught us how important it is to keep up with new releases.
Ruby 2.7 is a unique upgrade because the Ruby Core team has deprecated how keyword arguments behave. With this release, future versions of Ruby will no longer accept passing an options hash when a method expects keyword arguments. At GitHub, we’re committed to running deprecation-free on both Ruby and Rails to prevent falling behind on future upgrades. It’s important to identify major changes early so we can evolve the application when necessary.
In order to run Ruby 2.7 deprecation-free, we had to fix over 11k warnings. Fixing that many warnings, some of which were coming from external libraries, takes a lot of coordination and teamwork. In order to be successful we needed a solid strategy for sharing the work.
Strategy
Just like we did with our Rails upgrade, we set up our application to be dual-bootable in both Ruby 2.6 and Ruby 2.7 by using an environment variable. This made it easy for us to make backwards compatible changes, merge those to the main branch, and avoid maintaining a long running branch for our upgrade. It also made it easier for other engineering teams who needed to make changes to get their system running with the new Ruby version. Due to how large our application is (over 400k lines!) and how many changes go in daily (100’s of PRs!), this drastically simplifies our upgrade process.
Once we had the build running, we weren’t quite yet ready to ask other teams to help fix warnings. Since Ruby warnings are simply strings in the test output we needed to capture the deprecations and turn them into lists for each team to fix.
To accomplish this we monkey patched the Warning module in Ruby. Here’s a simplified version of our monkey patch:
module Warning
  def self.warn(warning)
    root = ENV["RAILS_ROOT"].to_s + "/"
    warning = warning.gsub(root, "")

    line = caller_locations.find do |location|
      location.path.end_with?("_test.rb")
    end

    origin = line&.path&.gsub(root, "")

    WarningsCollector.instance << [warning.chomp, origin]

    STDERR.print(message)
  end
end
The patch stores the deprecation warning and the test path that caused the warning in a WarningCollector object which writes the warnings to a file and then processes them:
class WarningsCollector < ParallelCollector
  def process
    filename = "warnings.txt"
    path = File.join(dir, filename)

    File.open(path, "a") do |f|
      @data.each do |message, origin|
        f.puts [message, origin].join("*^.^*") # ascii art so we can split on it later.
      end
    end

    script = File.absolute_path("../../../script/process-ruby-warnings", __FILE__)
    system(script, dir)
  end
end
The WarningCollector#process method stores all the warnings in a file called warnings.txt. We then parse warnings using CODEOWNERS and turn them into files that correspond to each owning team.
Once we had all the warnings processed, we opened issues for those teams with easy-to-follow directions for booting the application in the new Ruby version. Our warning reports included the file emitting the warning, the warning itself, and the test suites that triggered the warnings. They looked like this:
- [x] `app/jobs/delete_job.rb`
  - **warnings**
    - Line 16: warning: Using the last argument as keyword parameters is deprecated; maybe ** should be added to the call
  - **test suites that trigger these warnings**
    - test/jobs/delete_job.rb
This process helped us avoid duplicating work across teams and made it simple to determine ownership and status of each warning.
We tracked warning counts in the Ruby 2.7 CI build to ensure that new code wasn’t introducing new warnings. After a few months, coordinating with 40 teams, 30+ gem upgrades, and 11k warnings our CI build was 100% warning-free. Gems that were unmaintained were replaced with maintained gems. Once we had fixed the warnings, we altered our monkey patch to raise errors in Ruby 2.7 which ensured that all new code going into the GitHub codebase was warning-free.
Benefits of Upgrading to 2.7
You may be reading this and wondering why it’s worth doing all this work and investing the engineering resources and time in the Ruby upgrade. If you’ve been writing Ruby for a while you’re likely aware of the difficulty with this particular upgrade. It’s been the topic of conversation in the Ruby community since before the release in December. Regardless of how hard this upgrade was, we saw an impressive improvement in performance. The Ruby Core team is well on their way to fulfilling the promise of Ruby 3.0 being 3x faster.
First, we saw a drop in the amount of time it takes the application to boot in production mode. In production (this is when the entire application is eager loaded) we saw our boot time drop from an average of ~90 seconds to ~70 seconds. That’s a 20-second drop. Here’s a graph:
This faster boot time means faster deploys which means you get our features, bug fixes, and performance improvements faster as well!
In addition to an improvement in boot time, we saw a decrease in object allocations which went from ~780k allocations to ~668k allocations. Object allocations affect available memory so it’s important to lower these numbers whenever possible.
Aside from the performance benefits of upgrading, ensuring you stay on the most recent version of your languages and frameworks helps keep your application healthy. Through this process we found a lot of unowned code that was no longer used in the application and deleted it. We also took this opportunity to remove or replace unmaintained gems in our application.
For gems that were maintained we gave back to the community by sending patches for any gems that were emitting warnings in our application including Rails, rails-controller-testing, capybara, factory_bot, view_component, posix-spawn, github-ds, ruby-kafka, and many others. GitHub believes strongly in supporting the open source community and upgrades are one of many ways that we do so directly.
Deployment
There are risks to deploying any major upgrade, but at GitHub we’ve designed processes that reduce this risk drastically.
For Ruby and Rails upgrades, we run in dual-builds until we’re sure all the tests are passing and code is stable. In addition, we have all teams that work on the core product click test their area of the codebase in a staging environment to ensure there are no obvious issues with the new version.
Rolling out the upgrade is a big deal, so we do it carefully by increasing the percentage of traffic running on the new version and verifying each deployment is error-free in Sentry and regression-free in Datadog. For this deploy, we rolled out to 2% of traffic and quickly saw a new frozen string exception. Due to our process we were able to rollback quickly and less than 10 users saw an error in one endpoint.
Once we had a fix for the frozen string exception, we restarted the rollout process and again deployed to 2% of traffic. We let this one sit for 15 minutes before going to the next percentage: 30% of Kubernetes partitions. Again we waited about 15 minutes and after verifying there was no regression we deployed to another 30% to total 60% of Kubernetes partitions.
Finally, we deployed to 30% of our non-Kubernetes deployment partitions. These deploys take longer because they need to compile Ruby. It’s a bit nerve-wracking waiting 15 minutes for Ruby to compile, but everything went smoothly. From there we did a full-production deploy and merged the upgrade after 30 minutes. Overall the entire deploy took about 2 hours.
At GitHub, we’ve invested in building out processes for deploying Ruby and Rails upgrades so that we can be confident they are the lowest possible risk. We had no downtime while deploying the Ruby upgrade and our customer impact was almost zero.
Was it worth it?
For any companies that are wondering if this upgrade is worth it the answer is: 100%. Even without the performance improvements, falling behind on Ruby upgrades has drastic negative effects on the stability of your codebase. Upgrading Ruby supports your application health, improves performance, fixes language and framework bugs, and guides the future of the language!
At GitHub, not only do we believe in the open source community, we believe that a strong foundation is the first step to a stable, resilient, and functioning application. Running on the most recent version Ruby helps us do just that. We’re looking forward to Ruby 3.0 and beyond. Happy upgrading!
Data is the lifeblood of Grab and the insights we gain from it drive all the most critical business decisions made by Grabbers and our leaders every day.
Grab’s Data Engineering (DE) team is responsible for maintaining the data platform, which consists of data pipelines, job schedulers, and the query/computation engines that are the key components for generating insights from data. SQL is the core language for analytics at Grab and as of early 2020, our Presto platform serves about 200 user groups that add up to 500 users who run 350,000 queries every day. These queries span across 10,000 tables that process up to 1PB of data daily.
In 2016, we started the DataGateway project to enable us to manage data access for the hundreds of Grabbers who needed access to Presto for their work. Since then, DataGateway has grown to become much more than just an access control mechanism for Presto. In this blog, we want to share what we’ve achieved since the initial launch of the project.
The problems we wanted to solve
As we were reviewing the key challenges around data access in Grab and assessing possible solutions, we came up with this prioritized list of user requirements we wanted to work on:
Use a single endpoint to serve everyone.
Manage user access to clusters, schemas, tables, and fields.
Provide seamless user experience when presto clusters are scaled up/down, in/out, or provisioned/decommissioned.
Capture audit trail of user activities.
To provide Grabbers with the critical need of interactive querying, as well as performing extract, transform, load (ETL) jobs, we evaluated several technologies. Presto was among the ones we evaluated, and was what we eventually chose although it didn’t meet all of our requirements out of the box. In order to address these gaps, we came up with the idea of a security gateway for the Presto compute engine that could also act as a load balancer/proxy, this is how we ended up creating the DataGateway.
DataGateway is a service that sits between clients and Presto clusters. It is essentially a smart HTTP proxy server that is an abstraction layer on top of the Presto clusters that handles the following actions:
Parse incoming SQL statements to get requested schemas, tables, and fields.
Manage user Access Control List (ACL) to limit users’ data access by checking against the SQL parsing results.
Manage users’ cluster access.
Redirect users’ traffic to the authorized clusters.
Show meaningful error messages to users whenever the query is rejected or exceptions from clusters are encountered.
Anatomy of DataGateway
The DataGateway’s key components are as follows:
API Service
SQL Parser
Auth framework
Administration UI
We leveraged Kubernetes to run all these components as microservices.
Figure 1. DataGateway Key Components
API Service
This is the component that manages all users and cluster-facing processes. We integrated this service with the Presto API, which means it appears to be the same as a Presto cluster to a client. It accepts query requests from clients, gets the parsing result and runs authorization from the SQL Parser and the Auth Framework.
If everything is good to go, the API Service forwards queries to the assigned clusters and continues the entire query process.
Auth Framework
This handles both authentication and authorization requests. It stores the ACL of users and communicates with the API Service and the SQL Parser to run the entire authentication process. But why is it a microservice instead of a module in API Service, you ask? It’s because we keep evolving the security checks at Grab to ensure that everything is compliant with our security requirements, especially when dealing with data.
We wanted to make it flexible to fulfill ad-hoc requests from the security team without affecting the API Service. Furthermore, there are different authentication methods out there that we might need to deal with (OAuth2, SSO, you name it). The API Service supports multiple authentication frameworks that enable different authentication methods for different users.
SQL Parser
This is a SQL parsing engine to get schema, tables, and fields by reading SQL statements. Since Presto SQL parsing works differently in each version, we would compile multiple SQL Parsers that are identical to the Presto clusters we run. The SQL Parser becomes the single source of truth.
Admin UI
This is a UI for Presto administrators to manage clusters and user access, as well as to select an authentication framework, making it easier for the administrators to deal with the entire ecosystem.
How we deployed DataGateway using Kubernetes
In the past couple of years, we’ve had significant growth in workloads from analysts and data scientists. As we were very enthusiastic about Kubernetes, DataGateway was chosen as one of the earliest services for deployment in Kubernetes. DataGateway in Kubernetes is known to be highly available and fully scalable to handle traffic from users and systems.
We also tested the HPA feature of Kubernetes, which is a dynamic scaling feature to scale in or out the number of pods based on actual traffic and resource consumption.
Figure 2. DataGateway deployment using Kubernetes
Functionality of DataGateway
This section highlights some of the ways we use DataGateway to manage our Presto ecosystem efficiently.
Restrict users based on Schema/Table level access
In a setup where a Presto cluster is deployed on AWS Amazon Elastic MapReduce (EMR) or Elastic Kubernetes Service (EKS), we configure an IAM role and attach it to the EMR or EKS nodes. The IAM role is set to limit the access to S3 storage. However, the IAM only provides bucket-level and file-level control; it doesn’t meet our requirements to have schema, table, and column-level ACLs. That’s how DataGateway is found useful in such scenarios.
One of the DataGateway services is an SQL Parser. As previously covered, this is a service that parses and digs out schemas and tables involved in a query. The API service receives the parsing result and checks against the ACL of users, and decides whether to allow or reject the query. This is a remarkable improvement in our security control since we now have another layer to restrict access, on top of the S3 storage. We’ve implemented an SQL-based access control down to table level.
As shown in the Figure 3, user A is trying run a SQL statement select * from locations.cities. The SQL Parser reads the statement and tells the API service that user A is trying to read data from the table cities in the schema locations. Then, the API service checks against the ACL of user A. The service finds that user A has only read access to table countries in schema locations. Eventually, the API service denies this attempt because user A doesn’t have read access to table cities in the schema locations.
Figure 3. An example of how to check user access to run SQL statements
The above flow shows an access denied result because the user doesn’t have the appropriate permissions.
Seamless User Experience during the EMR migration
We use AWS EMR to deploy Presto as an SQL query engine since deployment is really easy. However, without DataGateway, any EMR operations such as terminations, new cluster deployment, config changes, and version upgrades, would require quite a bit of user involvement. We would sometimes need users to make changes on their side. For example, request users to change the endpoints to connect to suitable clusters.
With DataGateway, ACLs exist for each of the user accounts. The ACL includes the list of EMR clusters that users are allowed to access. As a Presto access management platform, here the DataGateway redirects user traffics to an appropriate cluster based on the ACL, like a proxy. Users always connect to the same endpoint we offer, which is the DataGateway. To switch over from one cluster to another, we just need to edit the cluster ACL and everything is handled seamlessly.
Figure 4. Cluster switching using DataGateway
Figure 4 highlights the case when we’re switching EMR from one cluster to another. No changes are required from users.
We executed the migration of our entire Presto platform from an AWS EMR instance to another AWS EMR instance using the same methodology. The migrations were executed with little to no disruption for our users. We were able to move 40 clusters with hundreds of users. They were able to issue millions of queries daily in a few phases over a couple of months.
In most cases, users didn’t have to make any changes on their end, they just continued using Presto as usual while we made the changes in the background.
Multi-Cloud Data Lake/Presto Cluster maintenance
Recently, we started to build and maintain data lakes not just in one cloud, but two – in AWS and Azure. Since most end-users are AWS-based, and each team has their own AWS sub-account to run their services and workloads, it would be a nightmare to bridge all the connections and access routes between these two clouds from end-to-end, sub-account by sub-account.
Here, the DataGateway plays the role of the multi-cloud gateway. Since all end-users’ AWS sub-accounts have peered to DataGateway’s network, everything becomes much easier to handle.
For end-users, they retain the same Presto connection profile. The DE team then handles the connection setup from DataGateway to Azure, and also the deployment of Presto clusters in Azure.
When all is set, end-users use the same endpoint to DataGateway. We offer a feature called Cluster Switch that allows users to switch between AWS Presto cluster and Azure Presto Cluster on the fly by filling in parameters on the connection string. This feature allows users to switch to their target Presto cluster without any endpoint changes. The switch works instantly whenever they do the change. That means users can run different queries in different clusters based on their requirements.
This feature has helped the DE team to maintain Presto Cluster easily. We can spin up different Presto clusters for different teams, so that each team has their own query engine to run their queries with dedicated resources.
Figure 5. Sub-account connections and Queries
Figure 5 shows an example of how sub-accounts connect to DataGateway and run queries on resources in different clouds and clusters.
Figure 6. Sample scenario without DataGateway
Figure 6 shows a scenario of what would happen if DataGatway doesn’t exist. Each of the accounts would have to maintain its own connections, Virtual Private Cloud (VPC) peering, and express link to connect to our Presto resources.
Summary
DataGateway is playing a key role in Grab’s entire Presto ecosystem. It helps us manage user access and cluster selections on a single endpoint, ensuring that everyone is running their Presto queries on the same place. It also helps distribute workload to different types and versions of Presto clusters.
When we started to deploy the DataGateway on Kubernetes, our vision for the Presto ecosystem underwent an epic change as it further motivated us to continuously improve. Since then, we’ve had new ideas on deployment method/pipeline, microservice implementations, scaling strategy, resource control, we even made use of Kubernetes and designed an on-demand, container-based Presto cluster provisioning engine. We’ll share this in another engineering blog, so do stay tuned!.
We also made crucial enhancements on data access control as we extended Presto’s access controls down to the schema/table-level.
In day-to-day operations, especially when we started to implement data lake in multiple clouds, DataGateway solved a lot of implementation issues. DataGateway made it simpler to switch a user’s Presto cluster from one cloud to another or allow a user to use a different Presto cluster using parameters. DataGateway allowed us to provide a seamless experience to our users.
Looking forward, we’ve more and more ideas for our Presto ecosystem, such Spark DataGateway or AWS Athena integrations, to keep our data safe at any time and to provide our users with a smoother experience when dealing with data used for analysis or research.
Authored by Vinnson Lee on behalf of the Presto Development Team at Grab – Edwin Law, Qui Hieu Nguyen, Rahul Penti, Wenli Wan, Wang Hui and the Data Engineering Team.
Join us
Grab is more than just the leading ride-hailing and mobile payments platform in Southeast Asia. We use data and technology to improve everything from transportation to payments and financial services across a region of more than 620 million people. We aspire to unlock the true potential of Southeast Asia and look for like-minded individuals to join us on this ride.
If you share our vision of driving South East Asia forward, apply to join our team today.
By Mohit Goenka, Gnanavel Shanmugam, and Lance Welsh
At Yahoo Mail, we’re constantly striving to upgrade our product experience. We do this not only by adding new features based on our members’ feedback, but also by providing the best technical solutions to power the most engaging experiences. As such, we’ve recently introduced a number of novel and unique revisions to the way in which we use Redux that have resulted in significant stability and performance improvements. Developers may find our methods useful in achieving similar results in their apps.
Improvements to product metrics
Last year Yahoo Mail implemented a brand new architecture using Redux. Since then, we have transformed the overall architecture to reduce latencies in various operations, reduce JavaScript exceptions, and better synchronized states. As a result, the product is much faster and more stable.
Stability improvements:
when checking for new emails – 20%
when reading emails – 30%
when sending emails – 20%
Performance improvements:
10% improvement in page load performance
40% improvement in frame rendering time
We have also reduced API calls by approximately 20%.
How we use Redux in Yahoo Mail
Redux architecture is reliant on one large store that represents the application state. In a Redux cycle, action creators dispatch actions to change the state of the store. React Components then respond to those state changes. We’ve made some modifications on top of this architecture that are atypical in the React-Redux community.
For instance, when fetching data over the network, the traditional methodology is to use Thunk middleware. Yahoo Mail fetches data over the network from our API. Thunks would create an unnecessary and undesirable dependency between the action creators and our API. If and when the API changes, the action creators must then also change. To keep these concerns separate we dispatch the action payload from the action creator to store them in the Redux state for later processing by “action syncers”. Action syncers use the payload information from the store to make requests to the API and process responses. In other words, the action syncers form an API layer by interacting with the store. An additional benefit to keeping the concerns separate is that the API layer can change as the backend changes, thereby preventing such changes from bubbling back up into the action creators and components. This also allowed us to optimize the API calls by batching, deduping, and processing the requests only when the network is available. We applied similar strategies for handling other side effects like route handling and instrumentation. Overall, action syncers helped us to reduce our API calls by ~20% and bring down API errors by 20-30%.
Another change to the normal Redux architecture was made to avoid unnecessary props. The React-Redux community has learned to avoid passing unnecessary props from high-level components through multiple layers down to lower-level components (prop drilling) for rendering. We have introduced action enhancers middleware to avoid passing additional unnecessary props that are purely used when dispatching actions. Action enhancers add data to the action payload so that data does not have to come from the component when dispatching the action. This avoids the component from having to receive that data through props and has improved frame rendering by ~40%. The use of action enhancers also avoids writing utility functions to add commonly-used data to each action from action creators.
In our new architecture, the store reducers accept the dispatched action via action enhancers to update the state. The store then updates the UI, completing the action cycle. Action syncers then initiate the call to the backend APIs to synchronize local changes.
Conclusion
Our novel use of Redux in Yahoo Mail has led to significant user-facing benefits through a more performant application. It has also reduced development cycles for new features due to its simplified architecture. We’re excited to share our work with the community and would love to hear from anyone interested in learning more.
The collective thoughts of the interwebz
Manage Consent
To provide the best experiences, we use technologies like cookies to store and/or access device information. Consenting to these technologies will allow us to process data such as browsing behavior or unique IDs on this site. Not consenting or withdrawing consent, may adversely affect certain features and functions.
Functional
Always active
The technical storage or access is strictly necessary for the legitimate purpose of enabling the use of a specific service explicitly requested by the subscriber or user, or for the sole purpose of carrying out the transmission of a communication over an electronic communications network.
Preferences
The technical storage or access is necessary for the legitimate purpose of storing preferences that are not requested by the subscriber or user.
Statistics
The technical storage or access that is used exclusively for statistical purposes.The technical storage or access that is used exclusively for anonymous statistical purposes. Without a subpoena, voluntary compliance on the part of your Internet Service Provider, or additional records from a third party, information stored or retrieved for this purpose alone cannot usually be used to identify you.
Marketing
The technical storage or access is required to create user profiles to send advertising, or to track the user on a website or across several websites for similar marketing purposes.

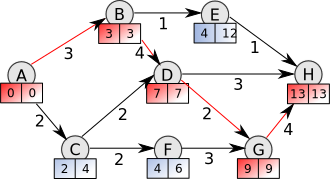
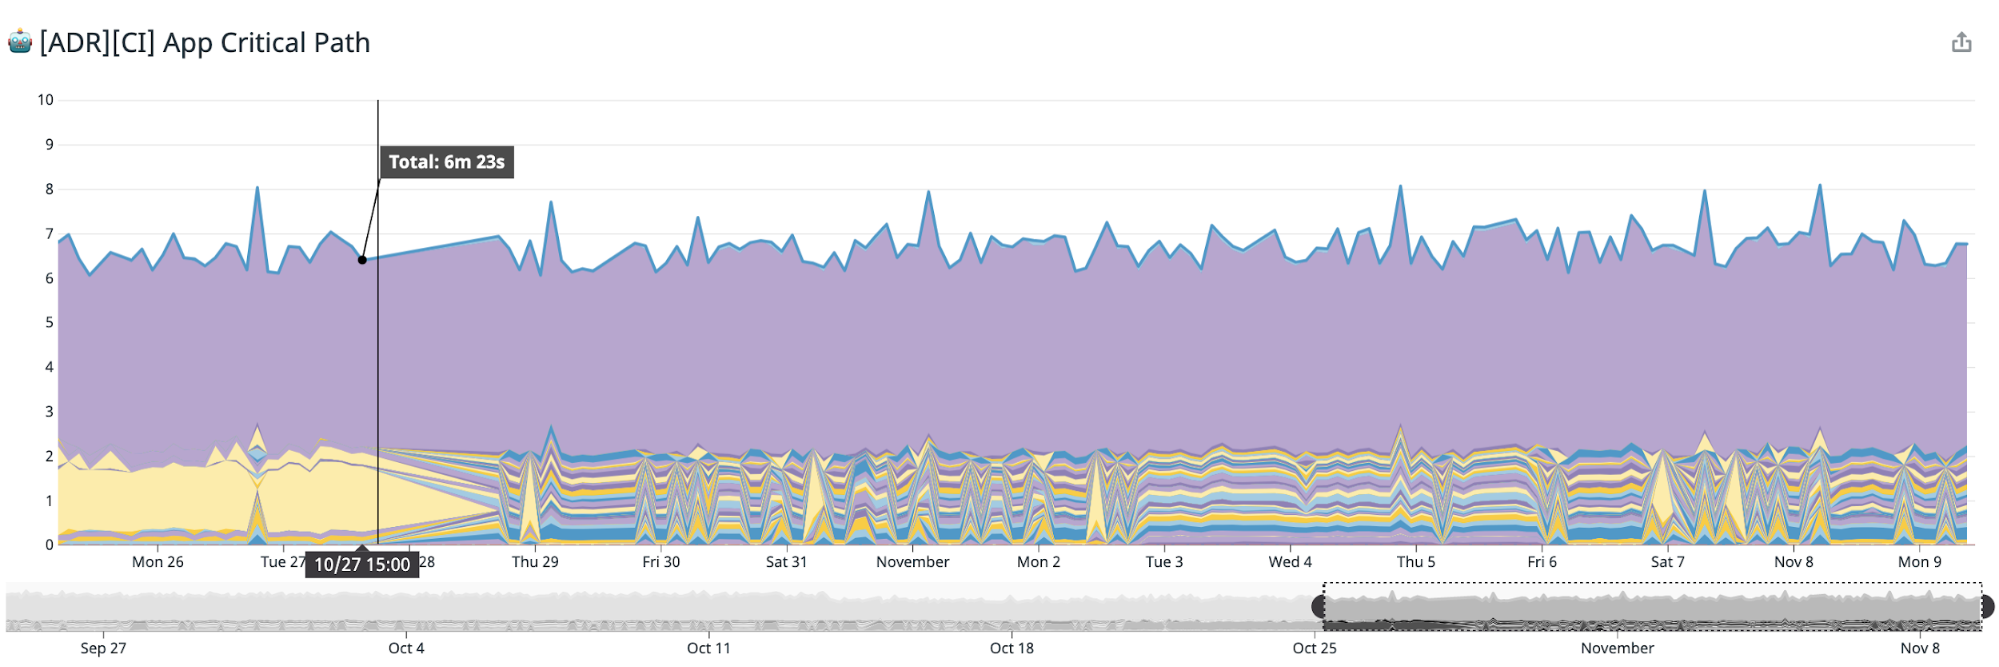
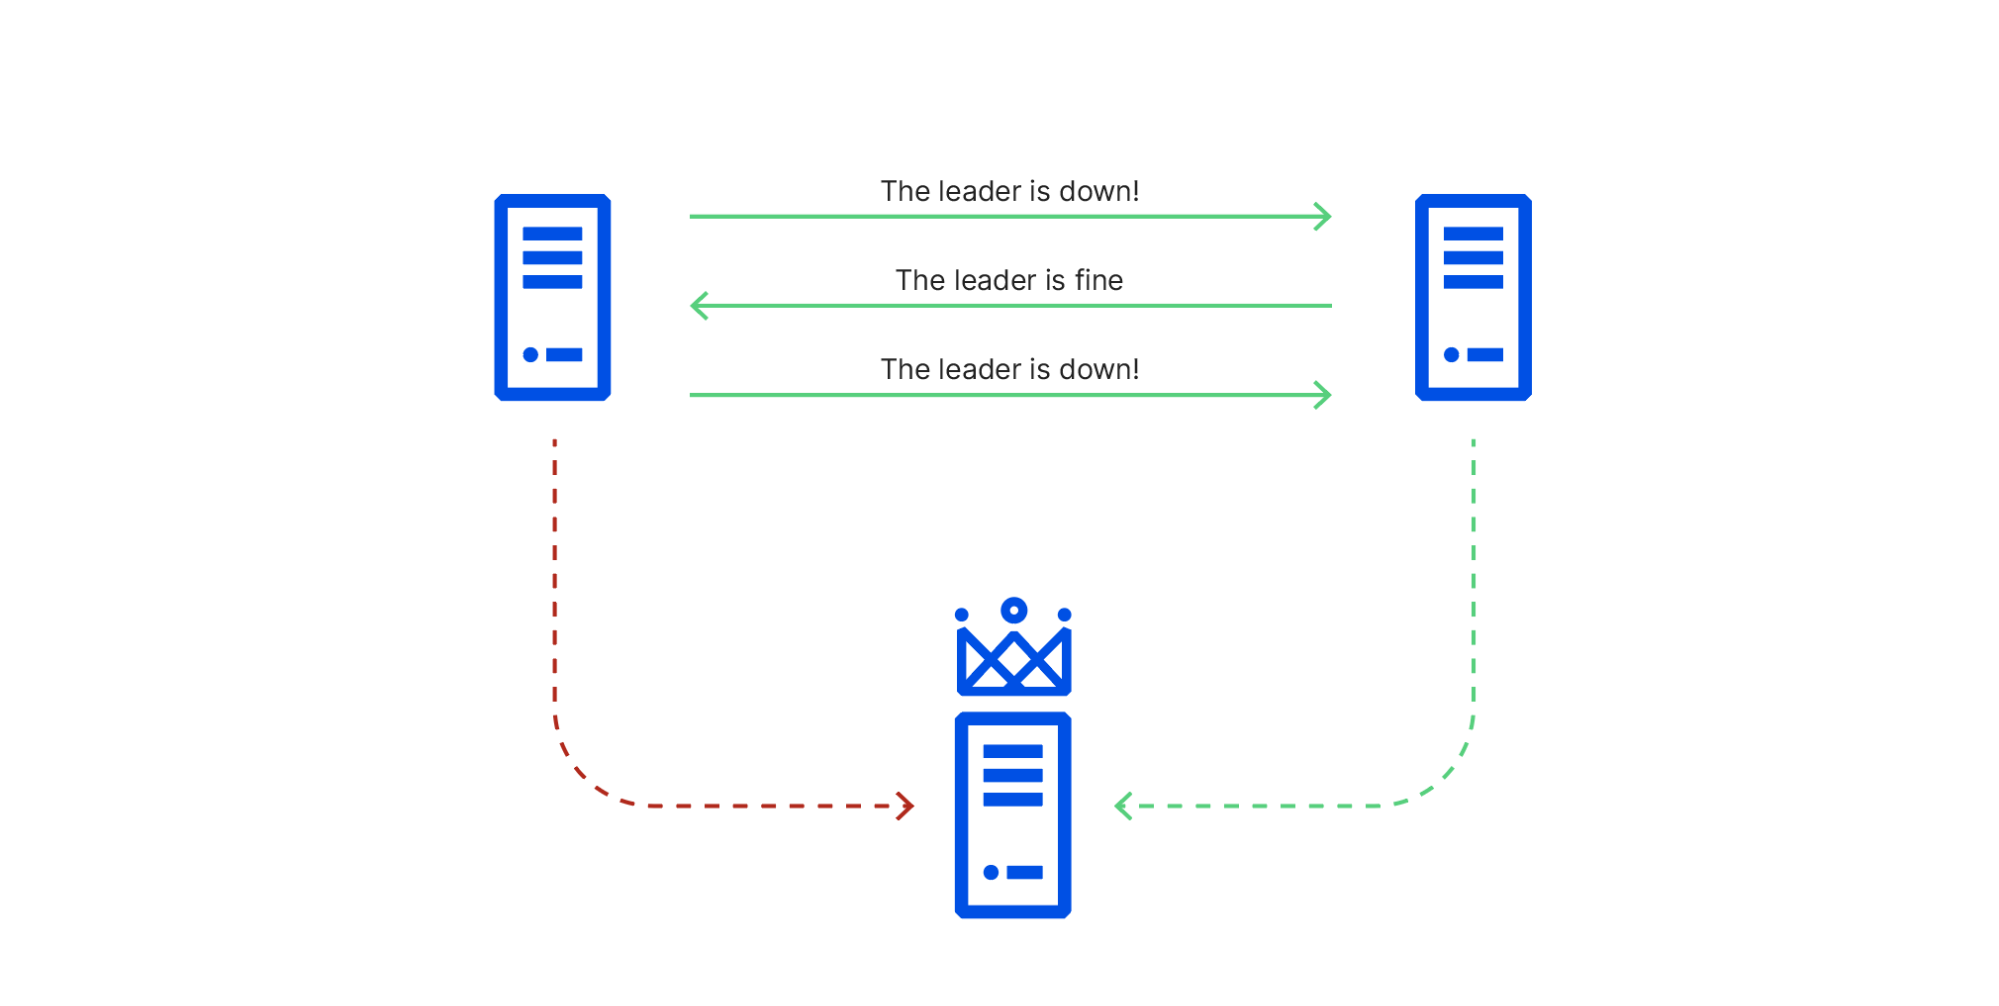
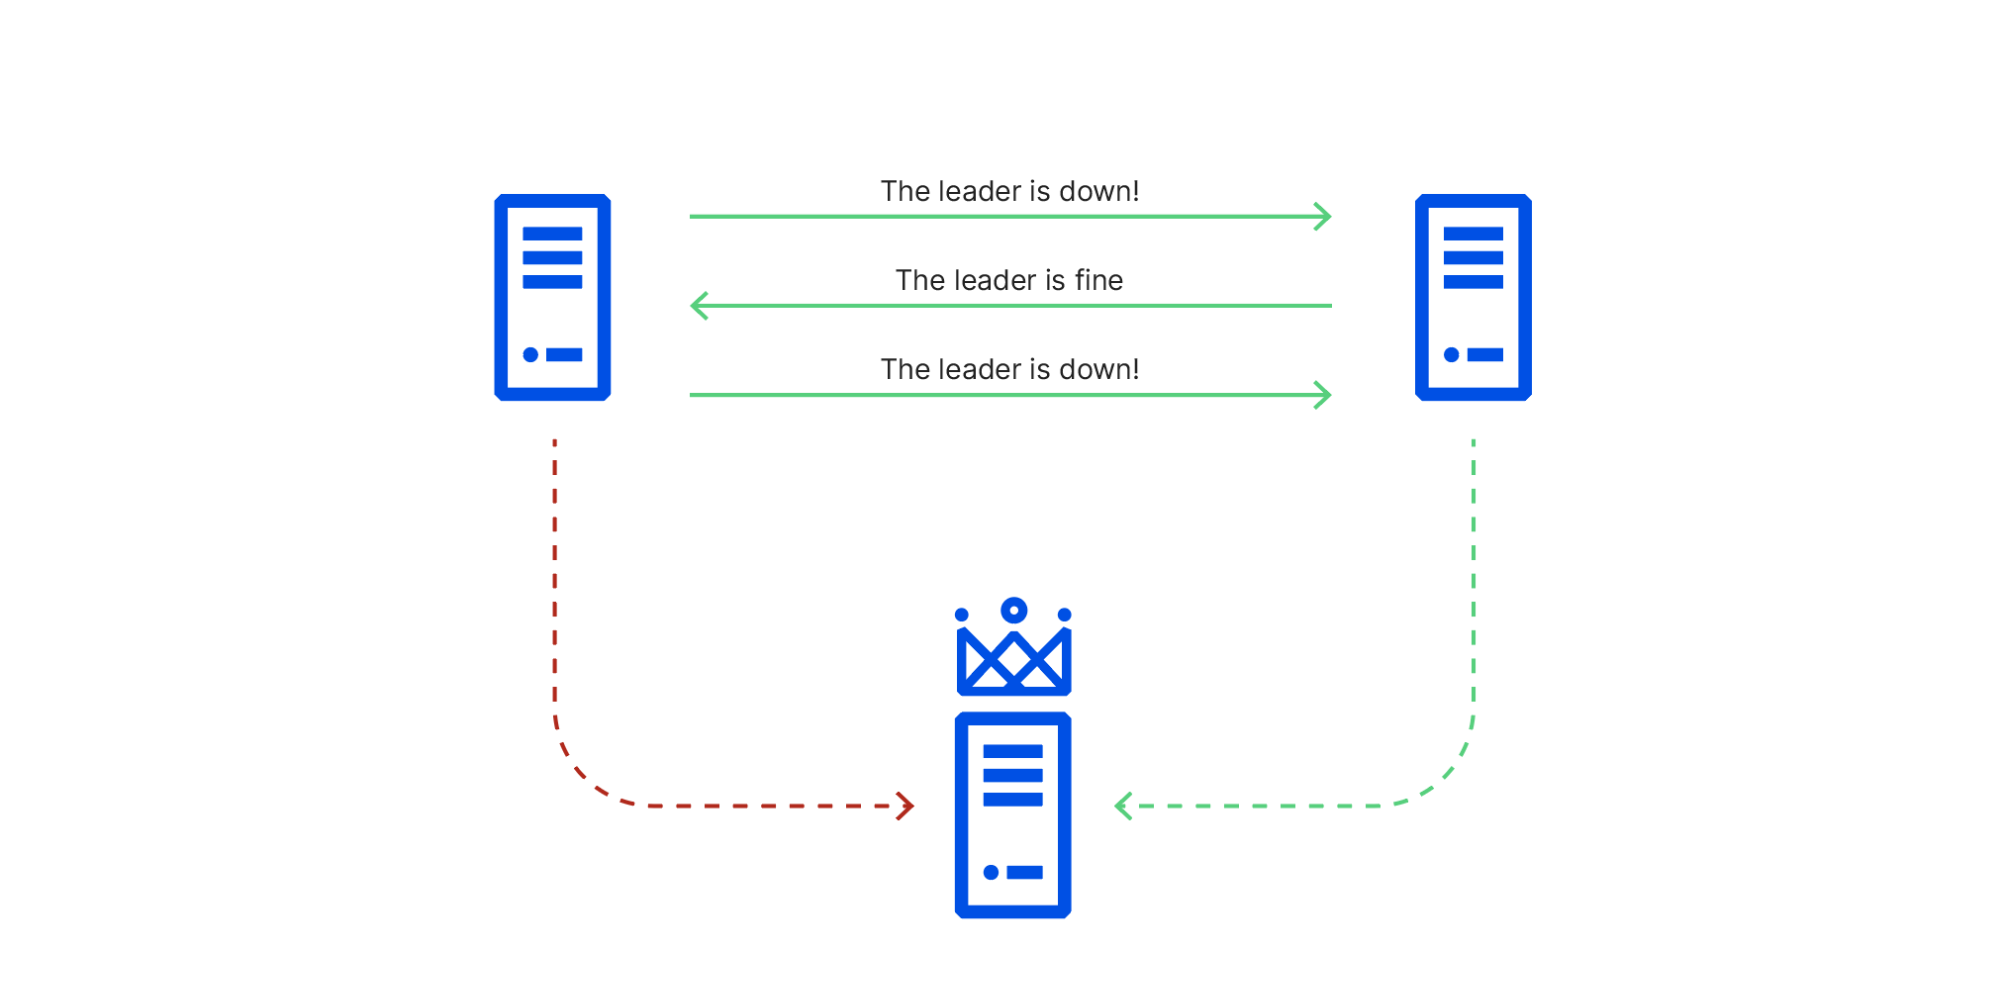


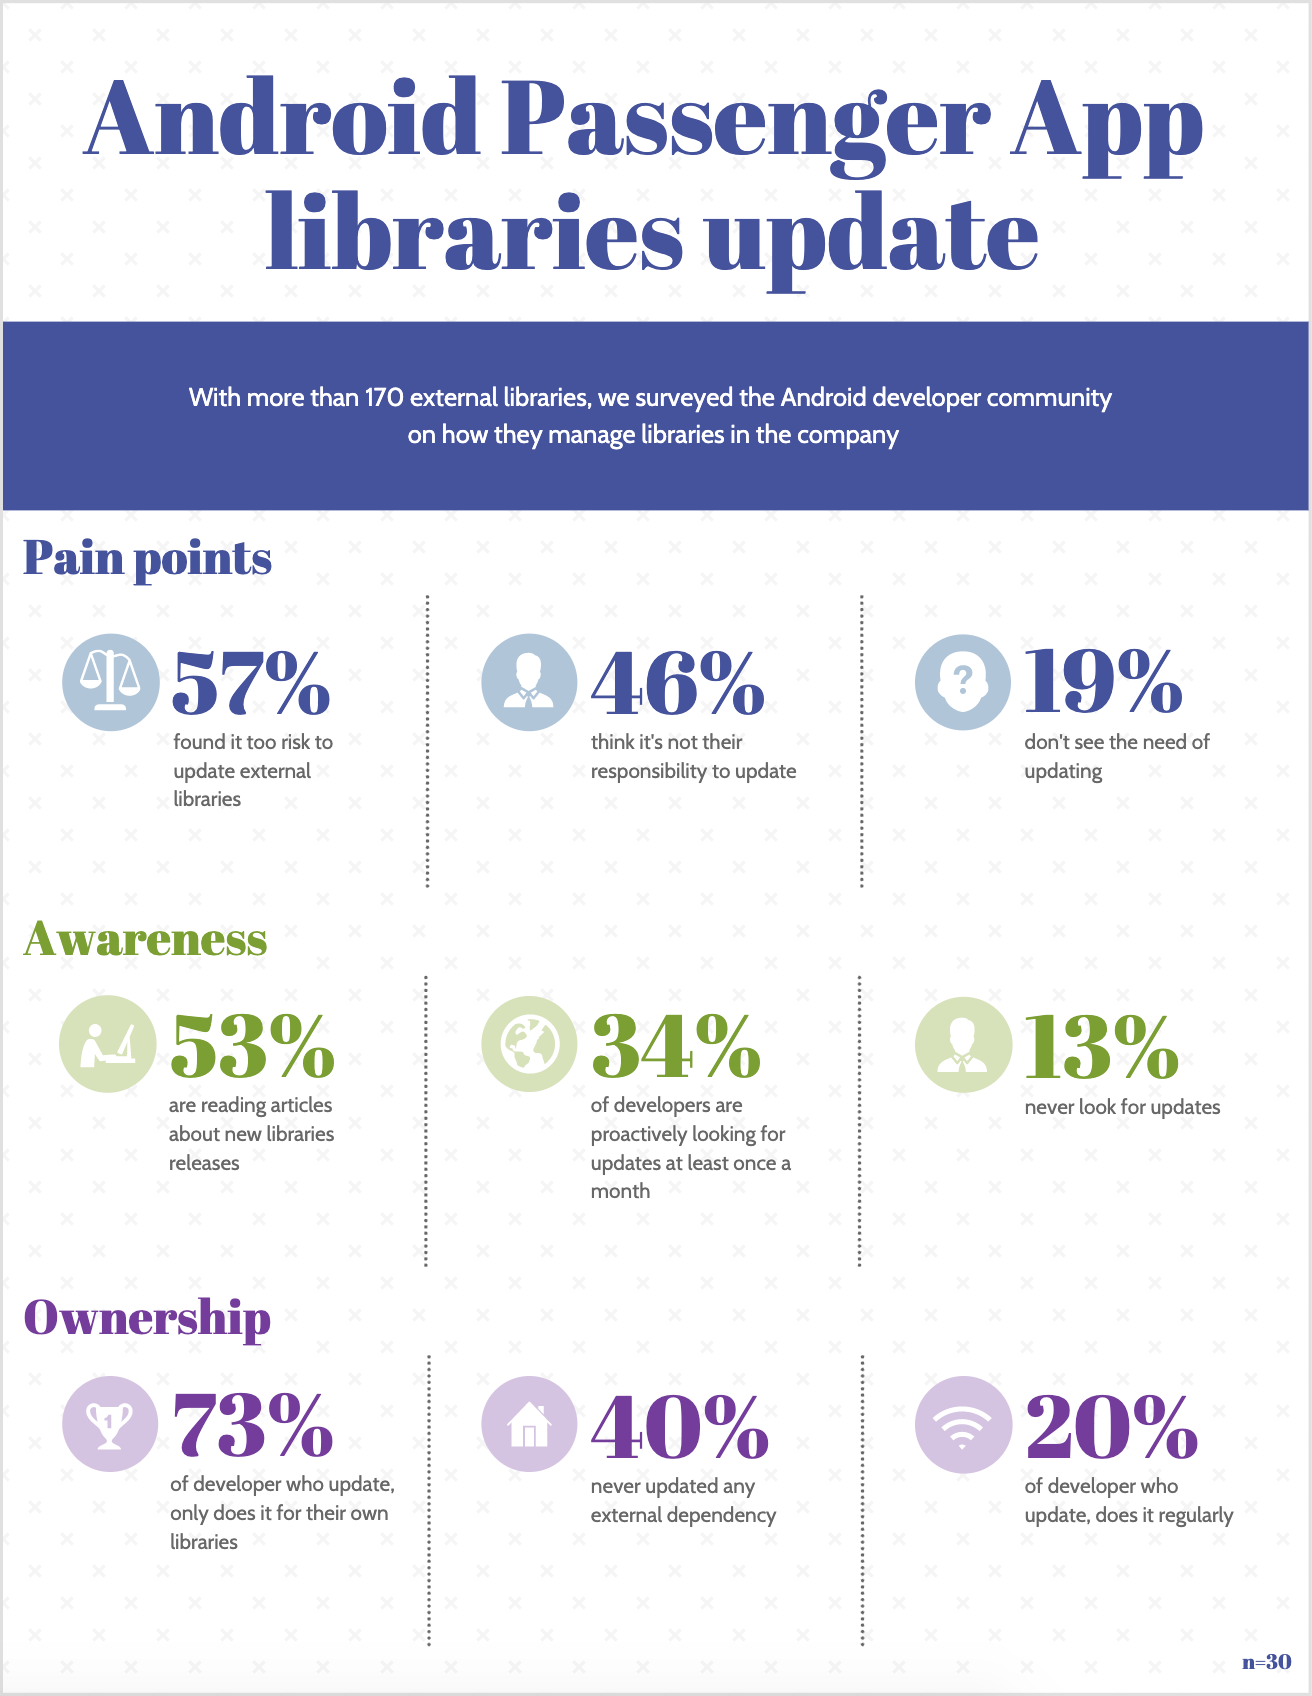
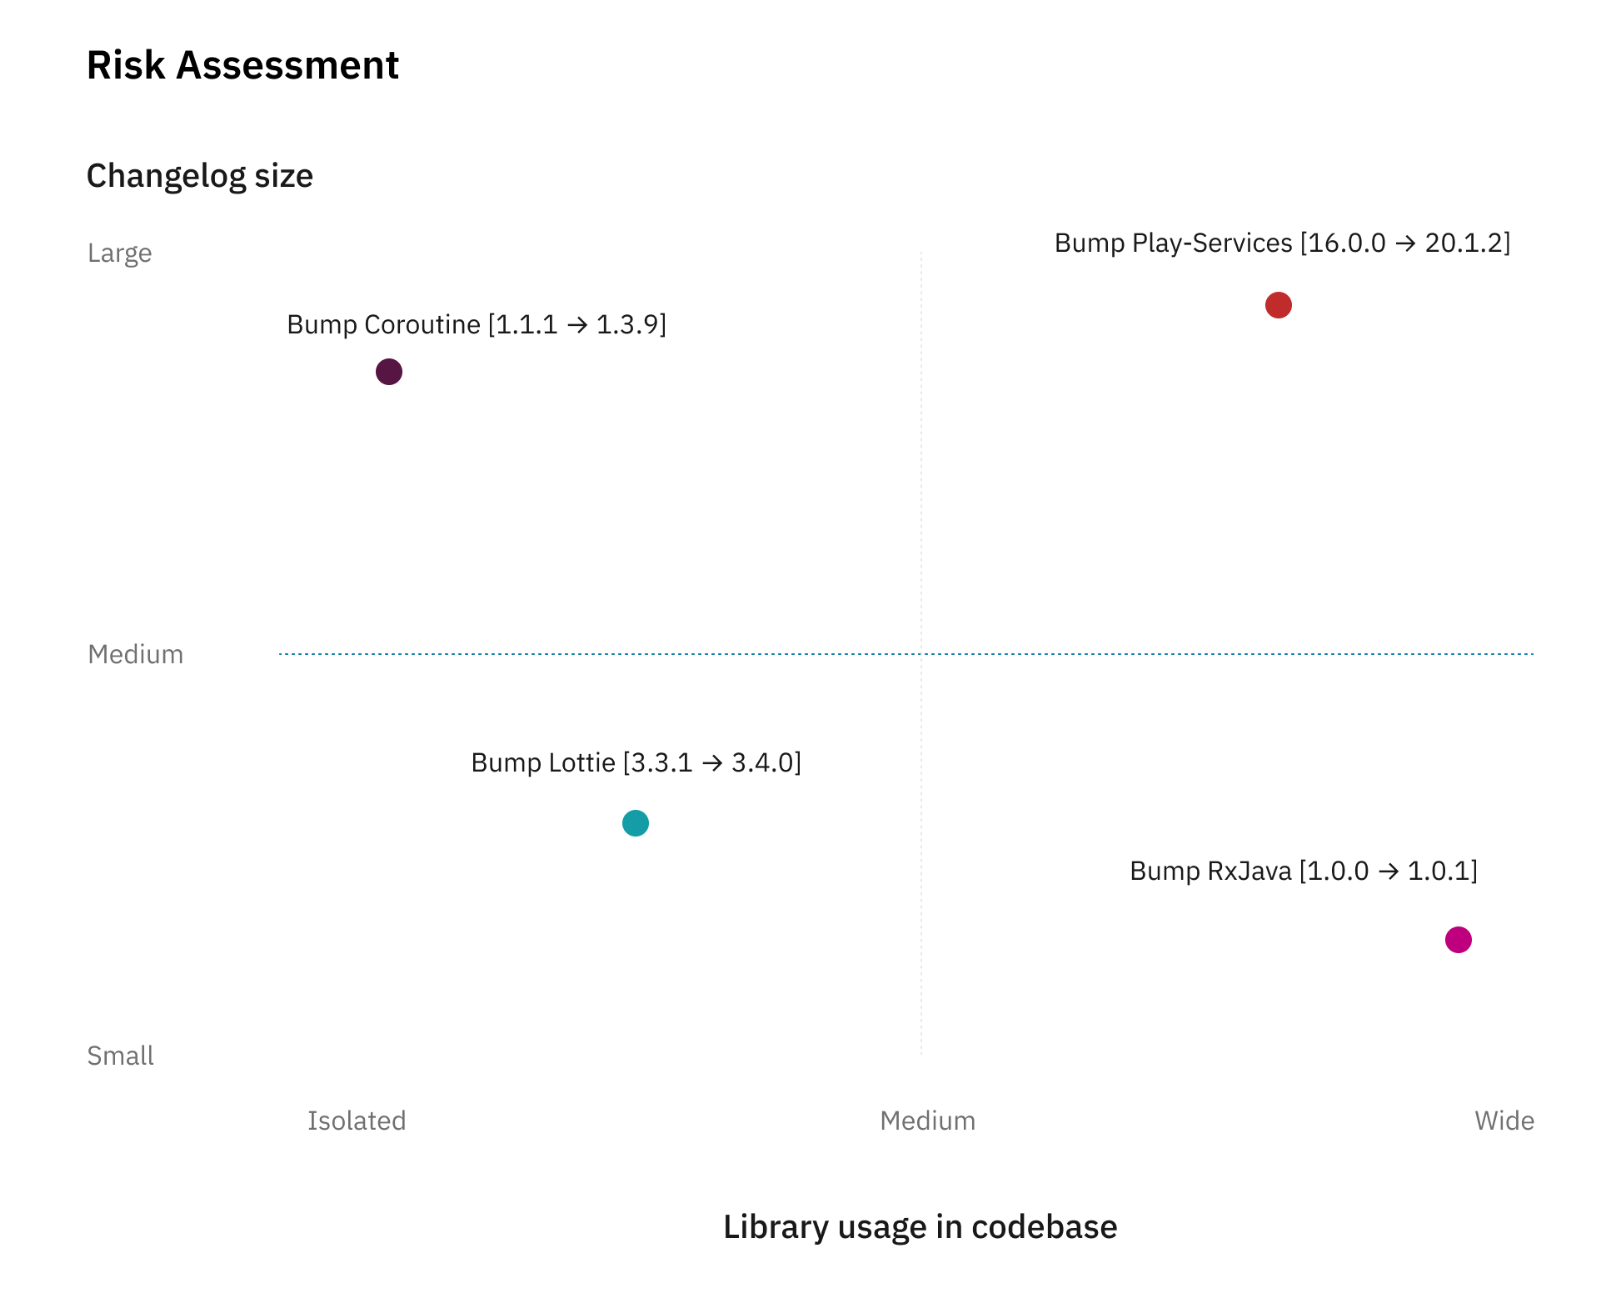

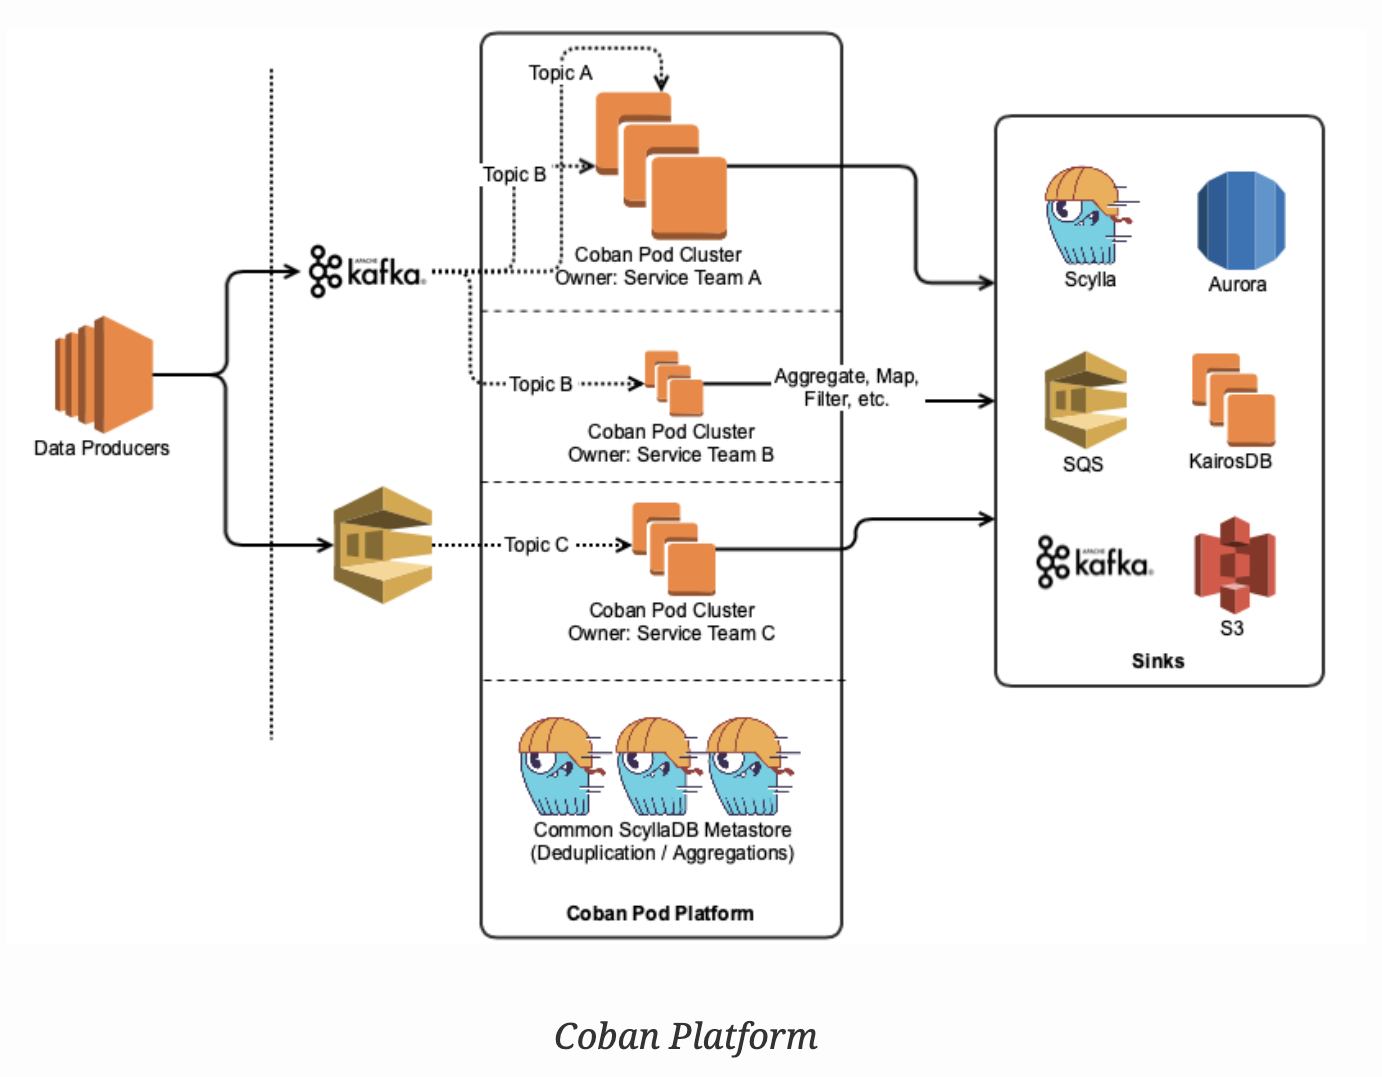
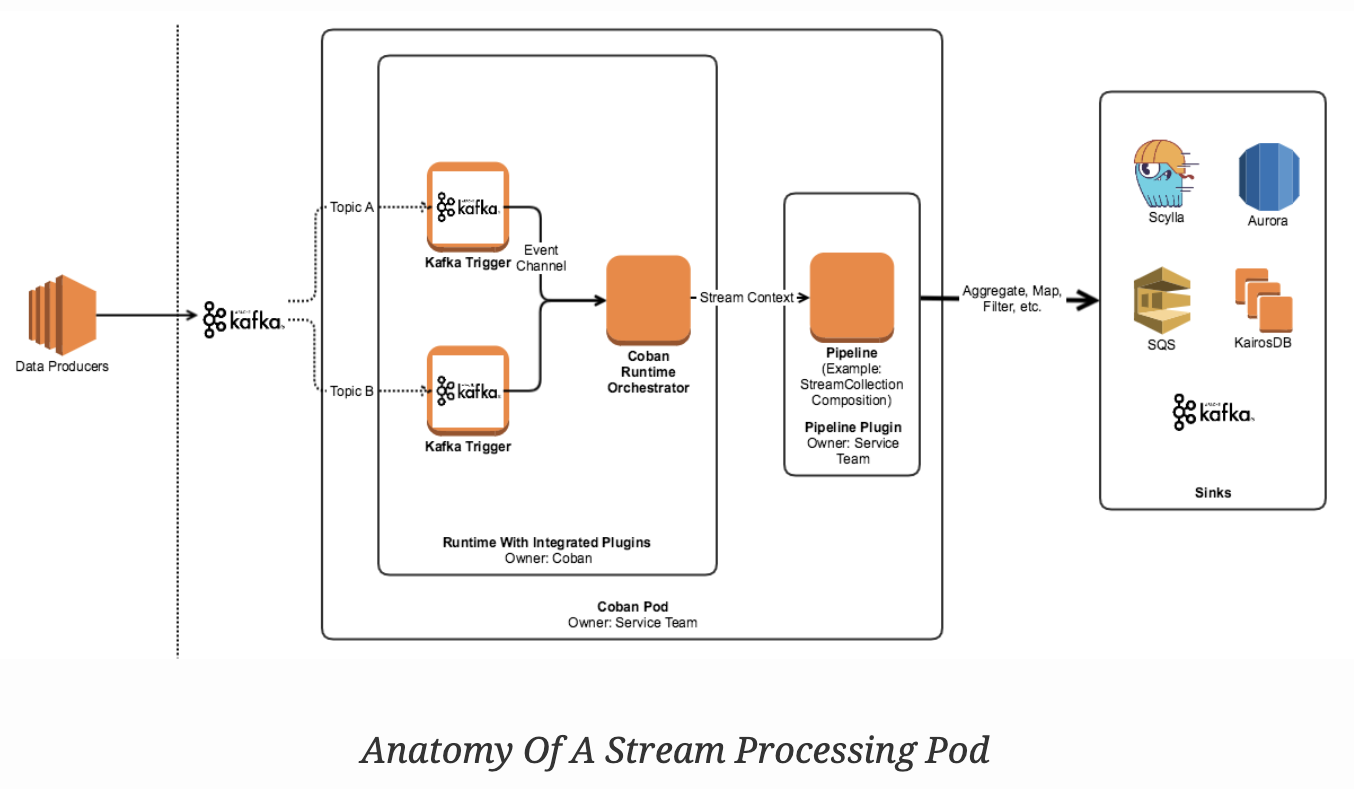
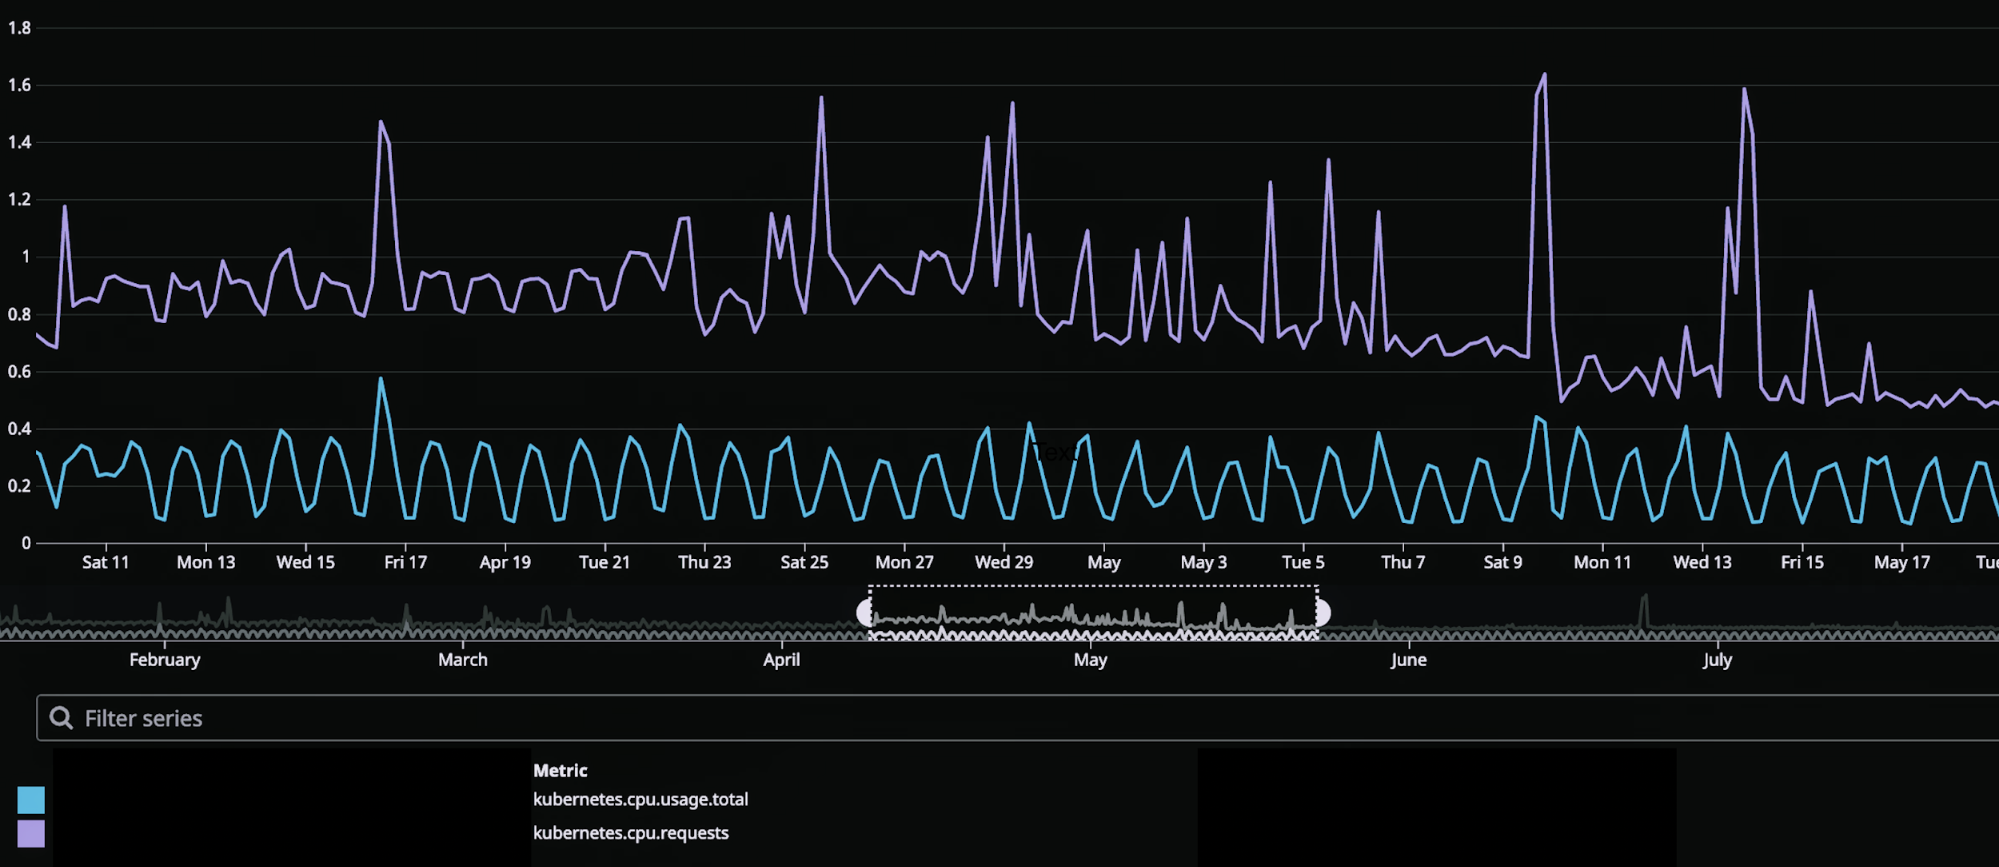
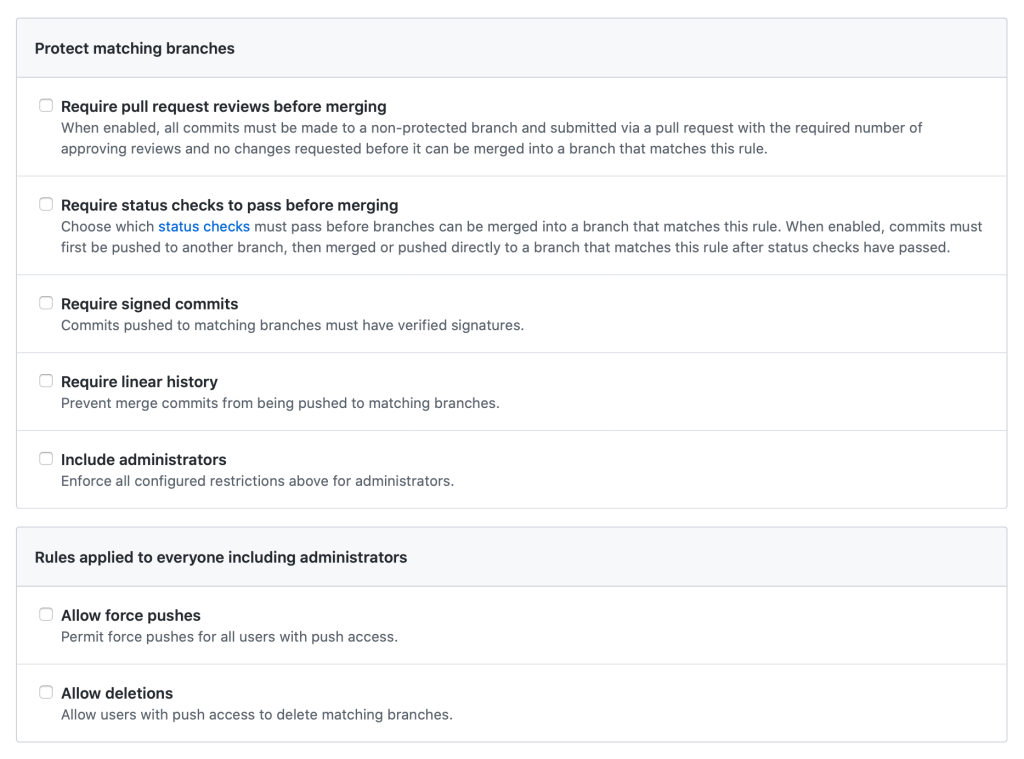
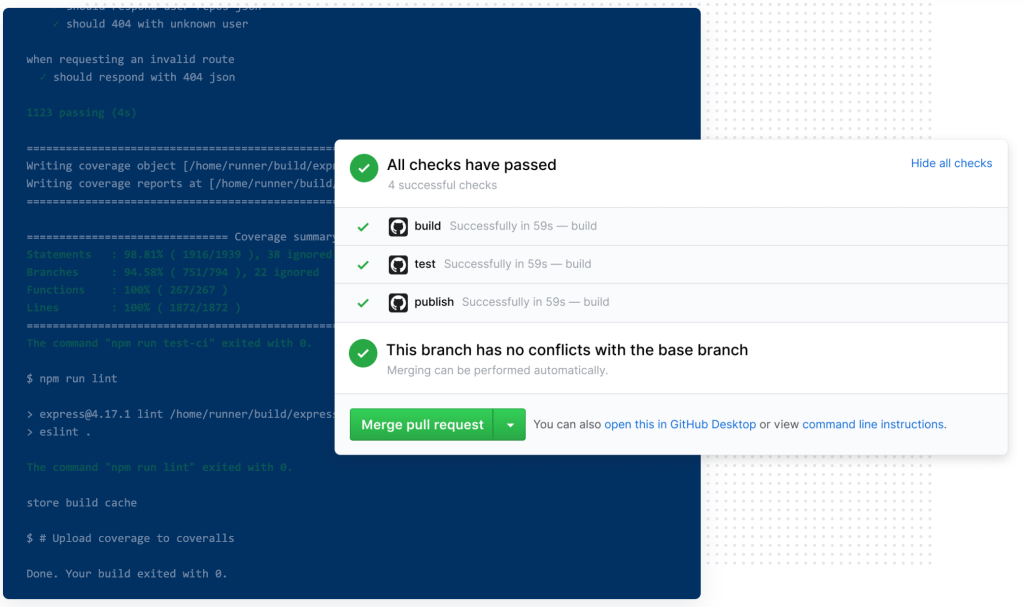
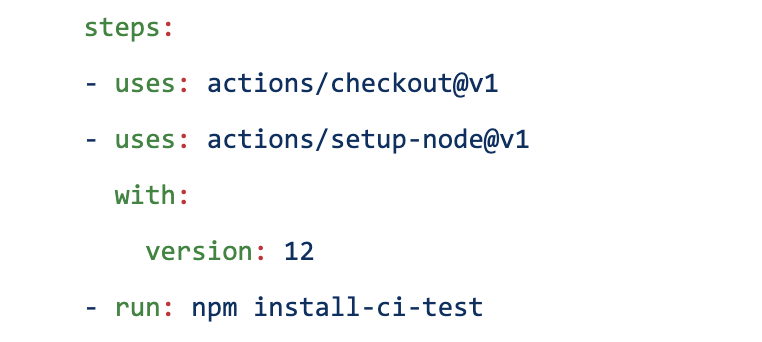
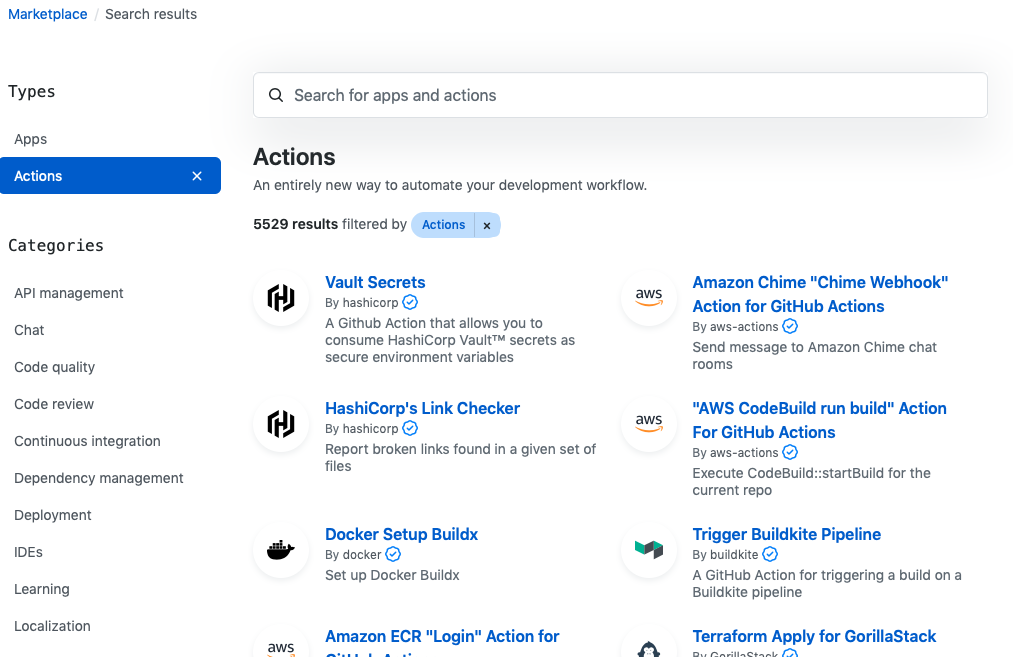
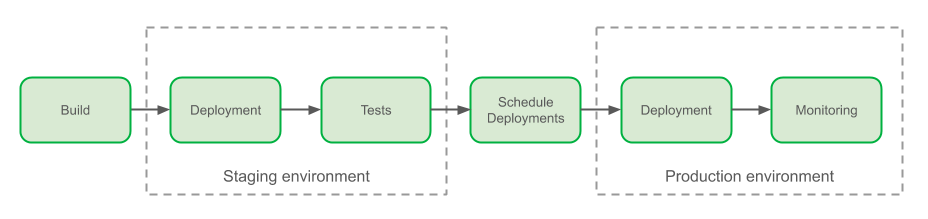
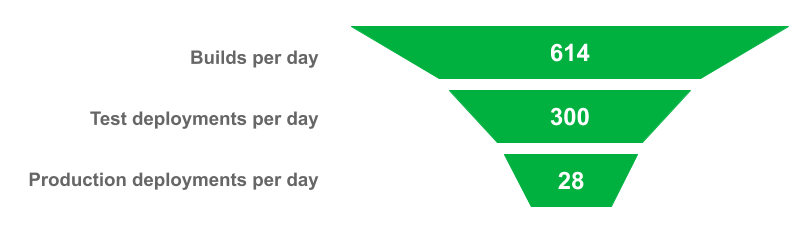
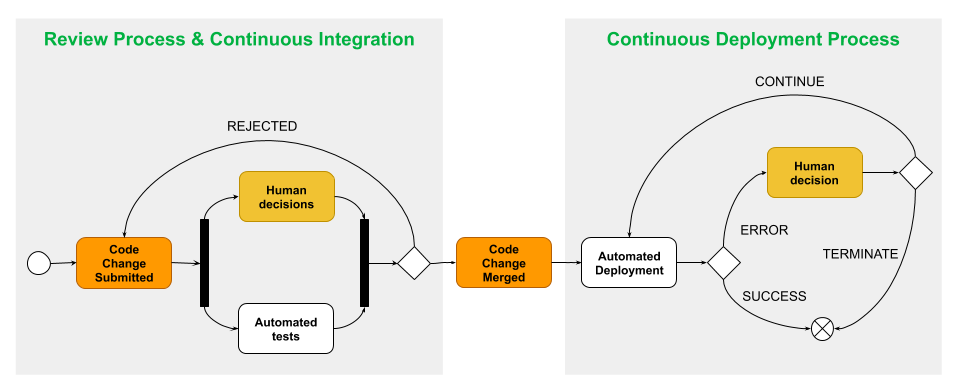
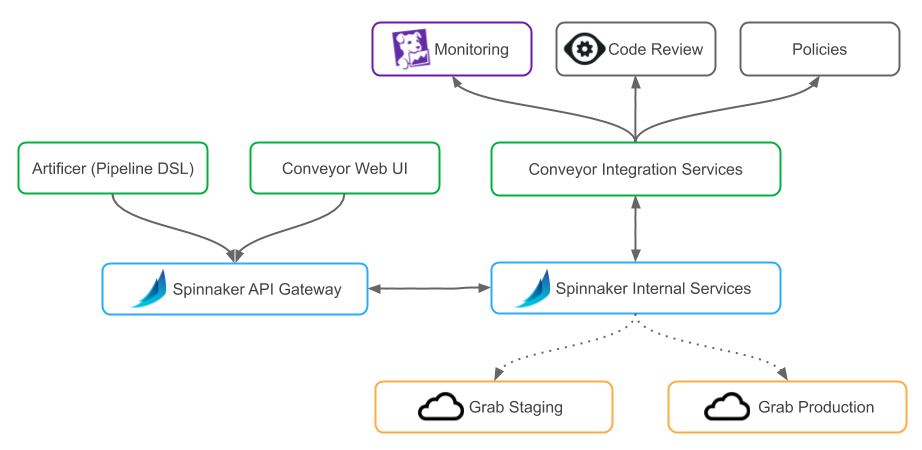

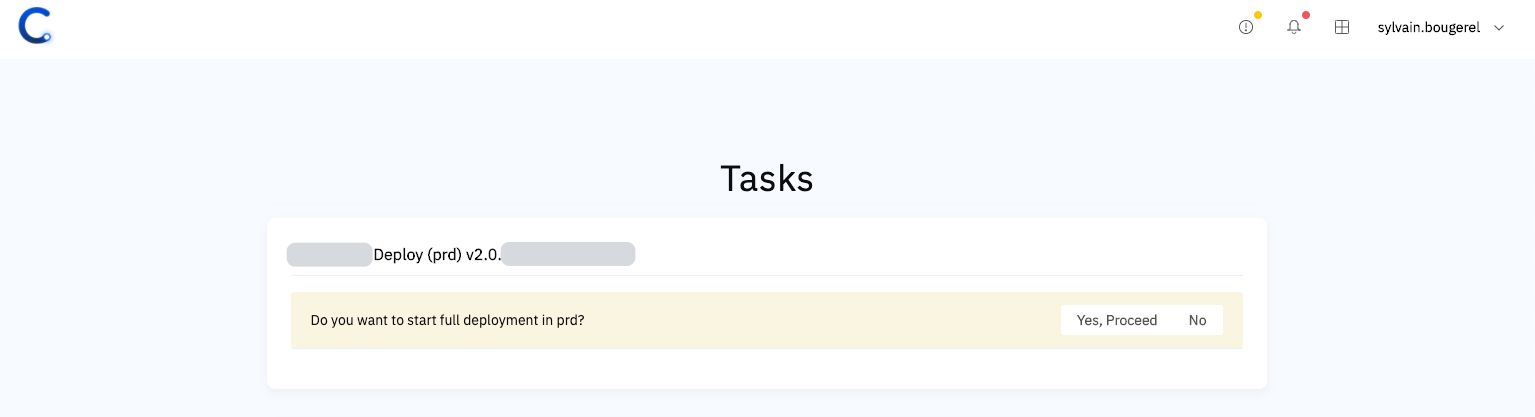
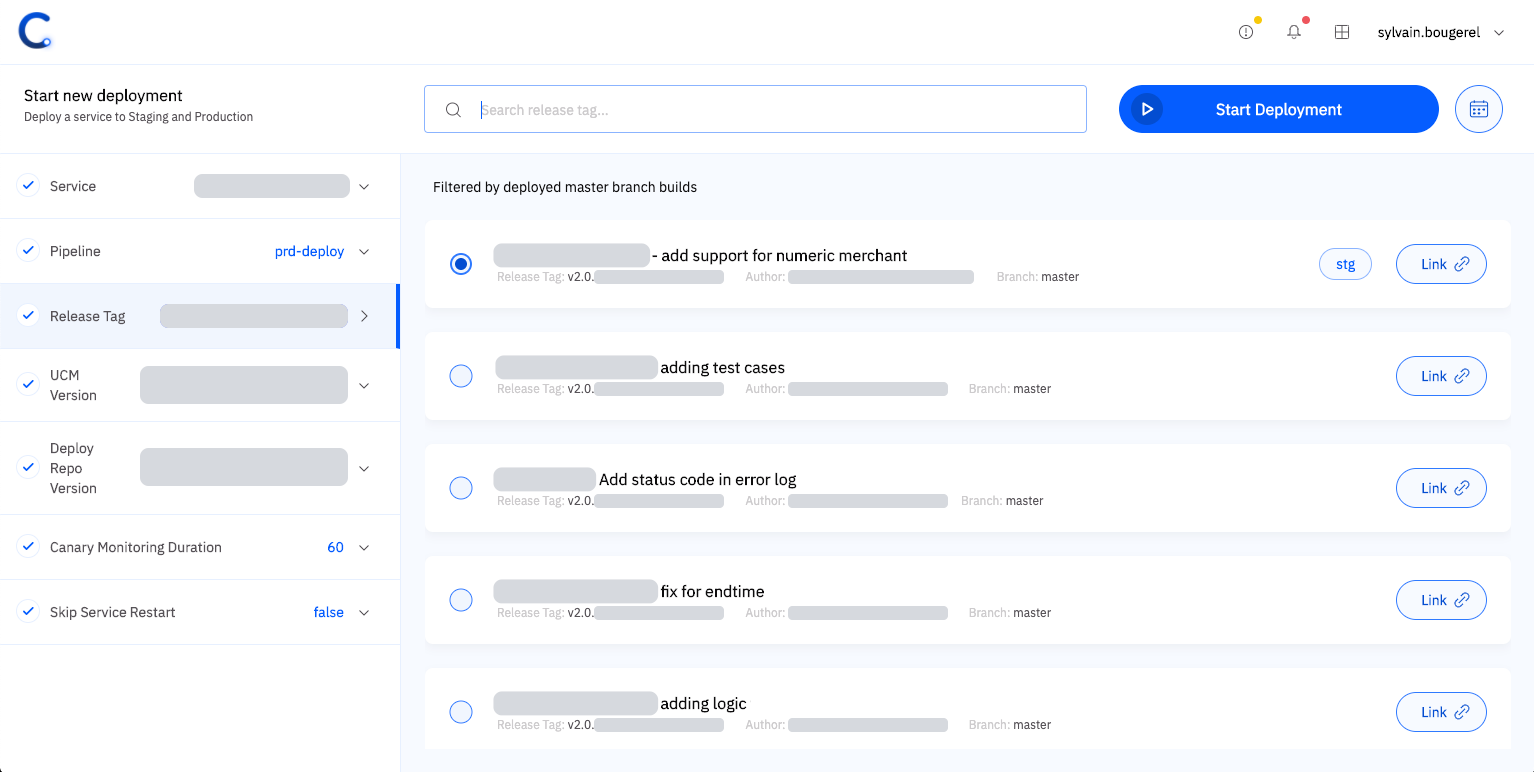
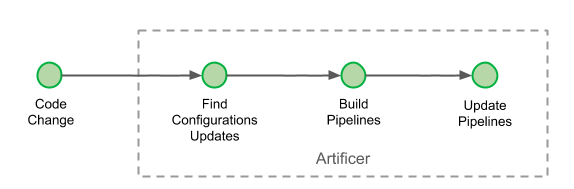
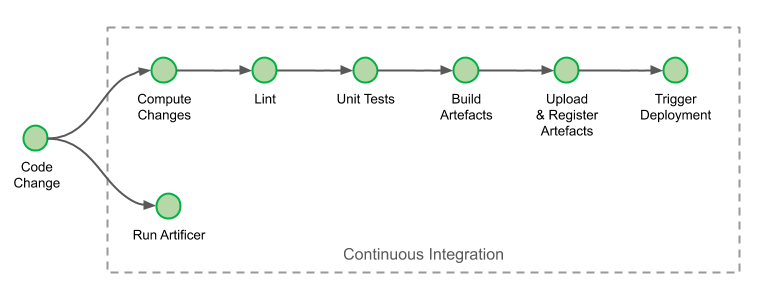
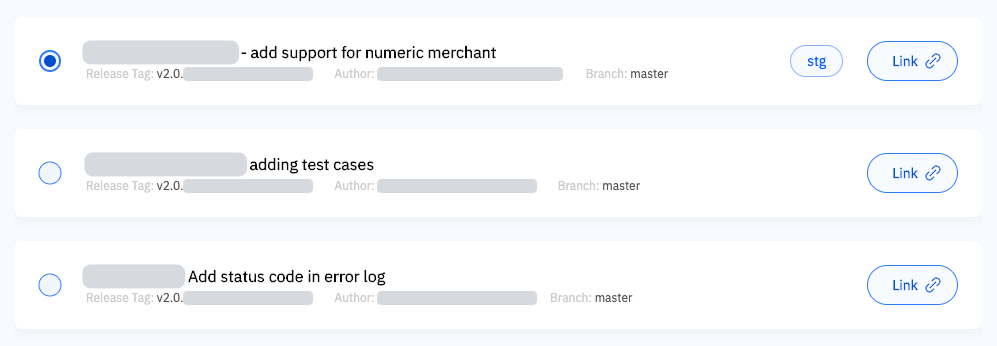
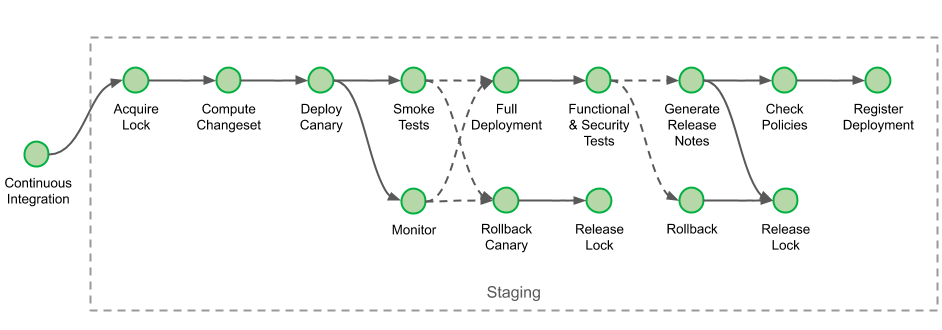
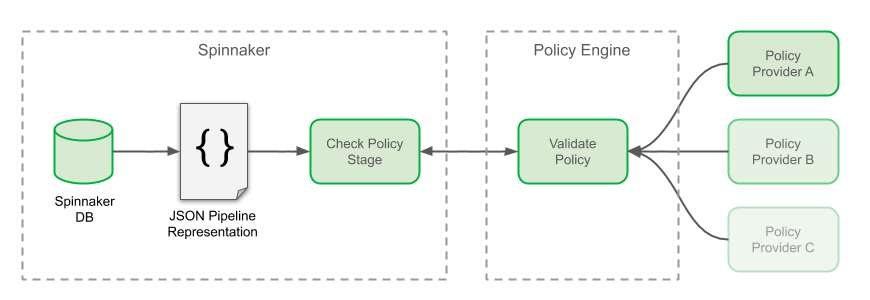
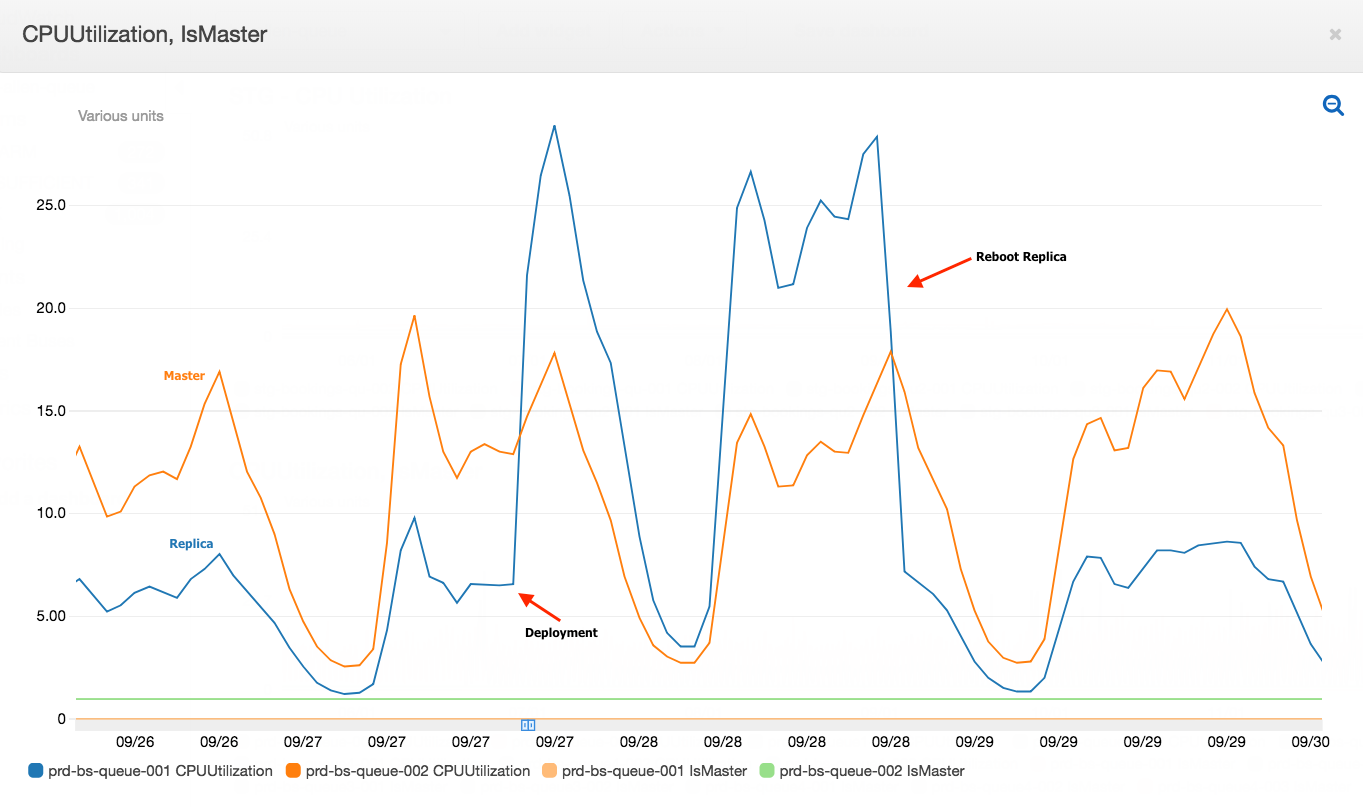
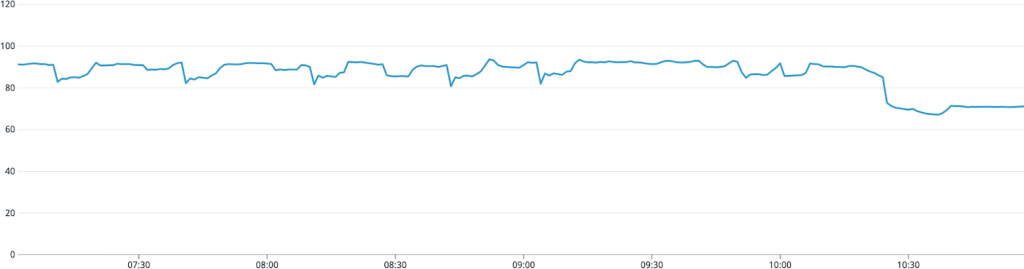

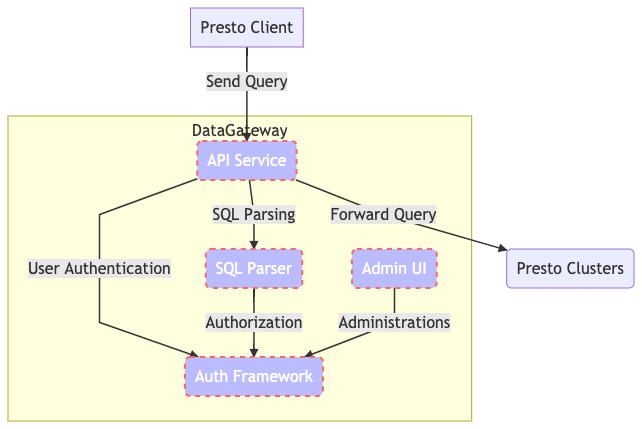
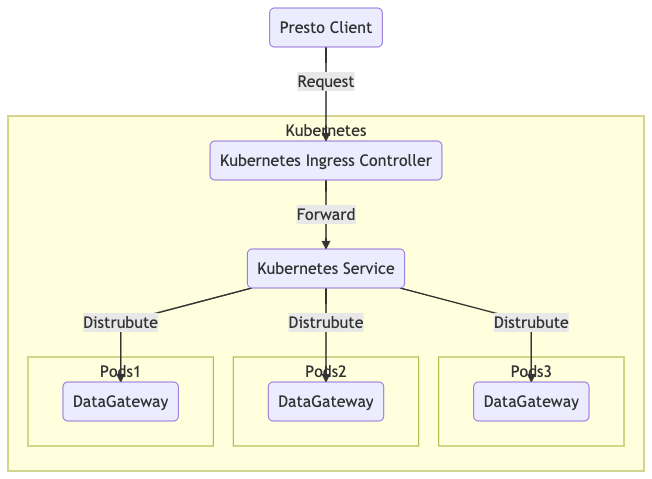
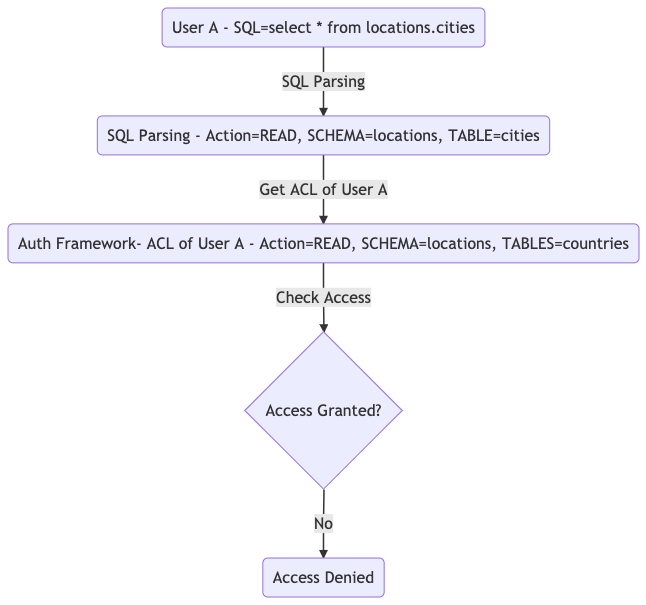
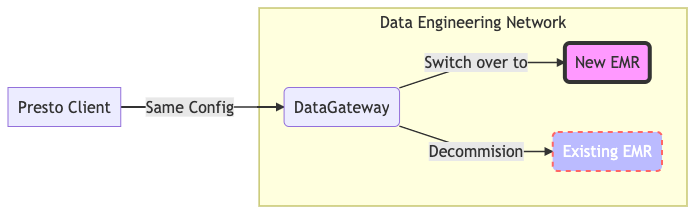
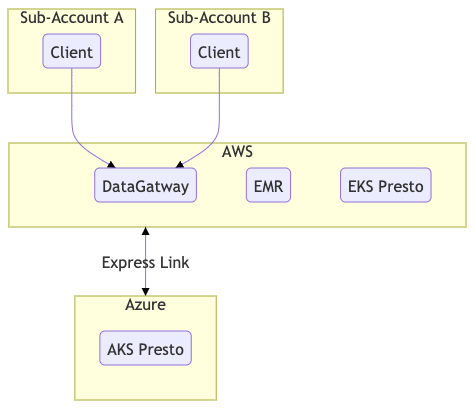
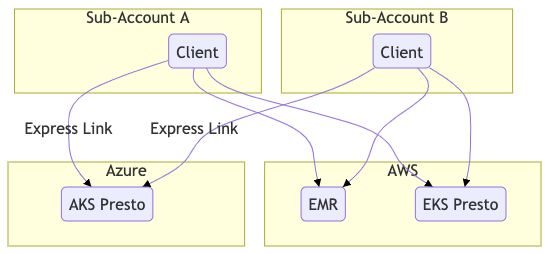
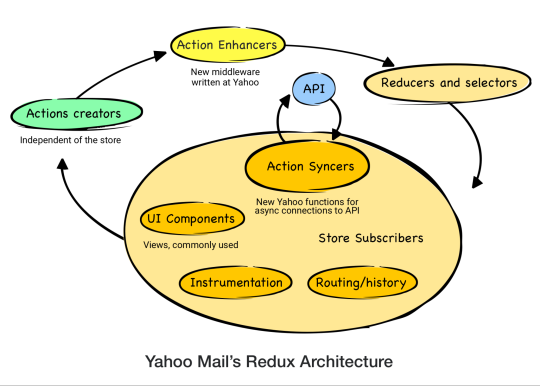
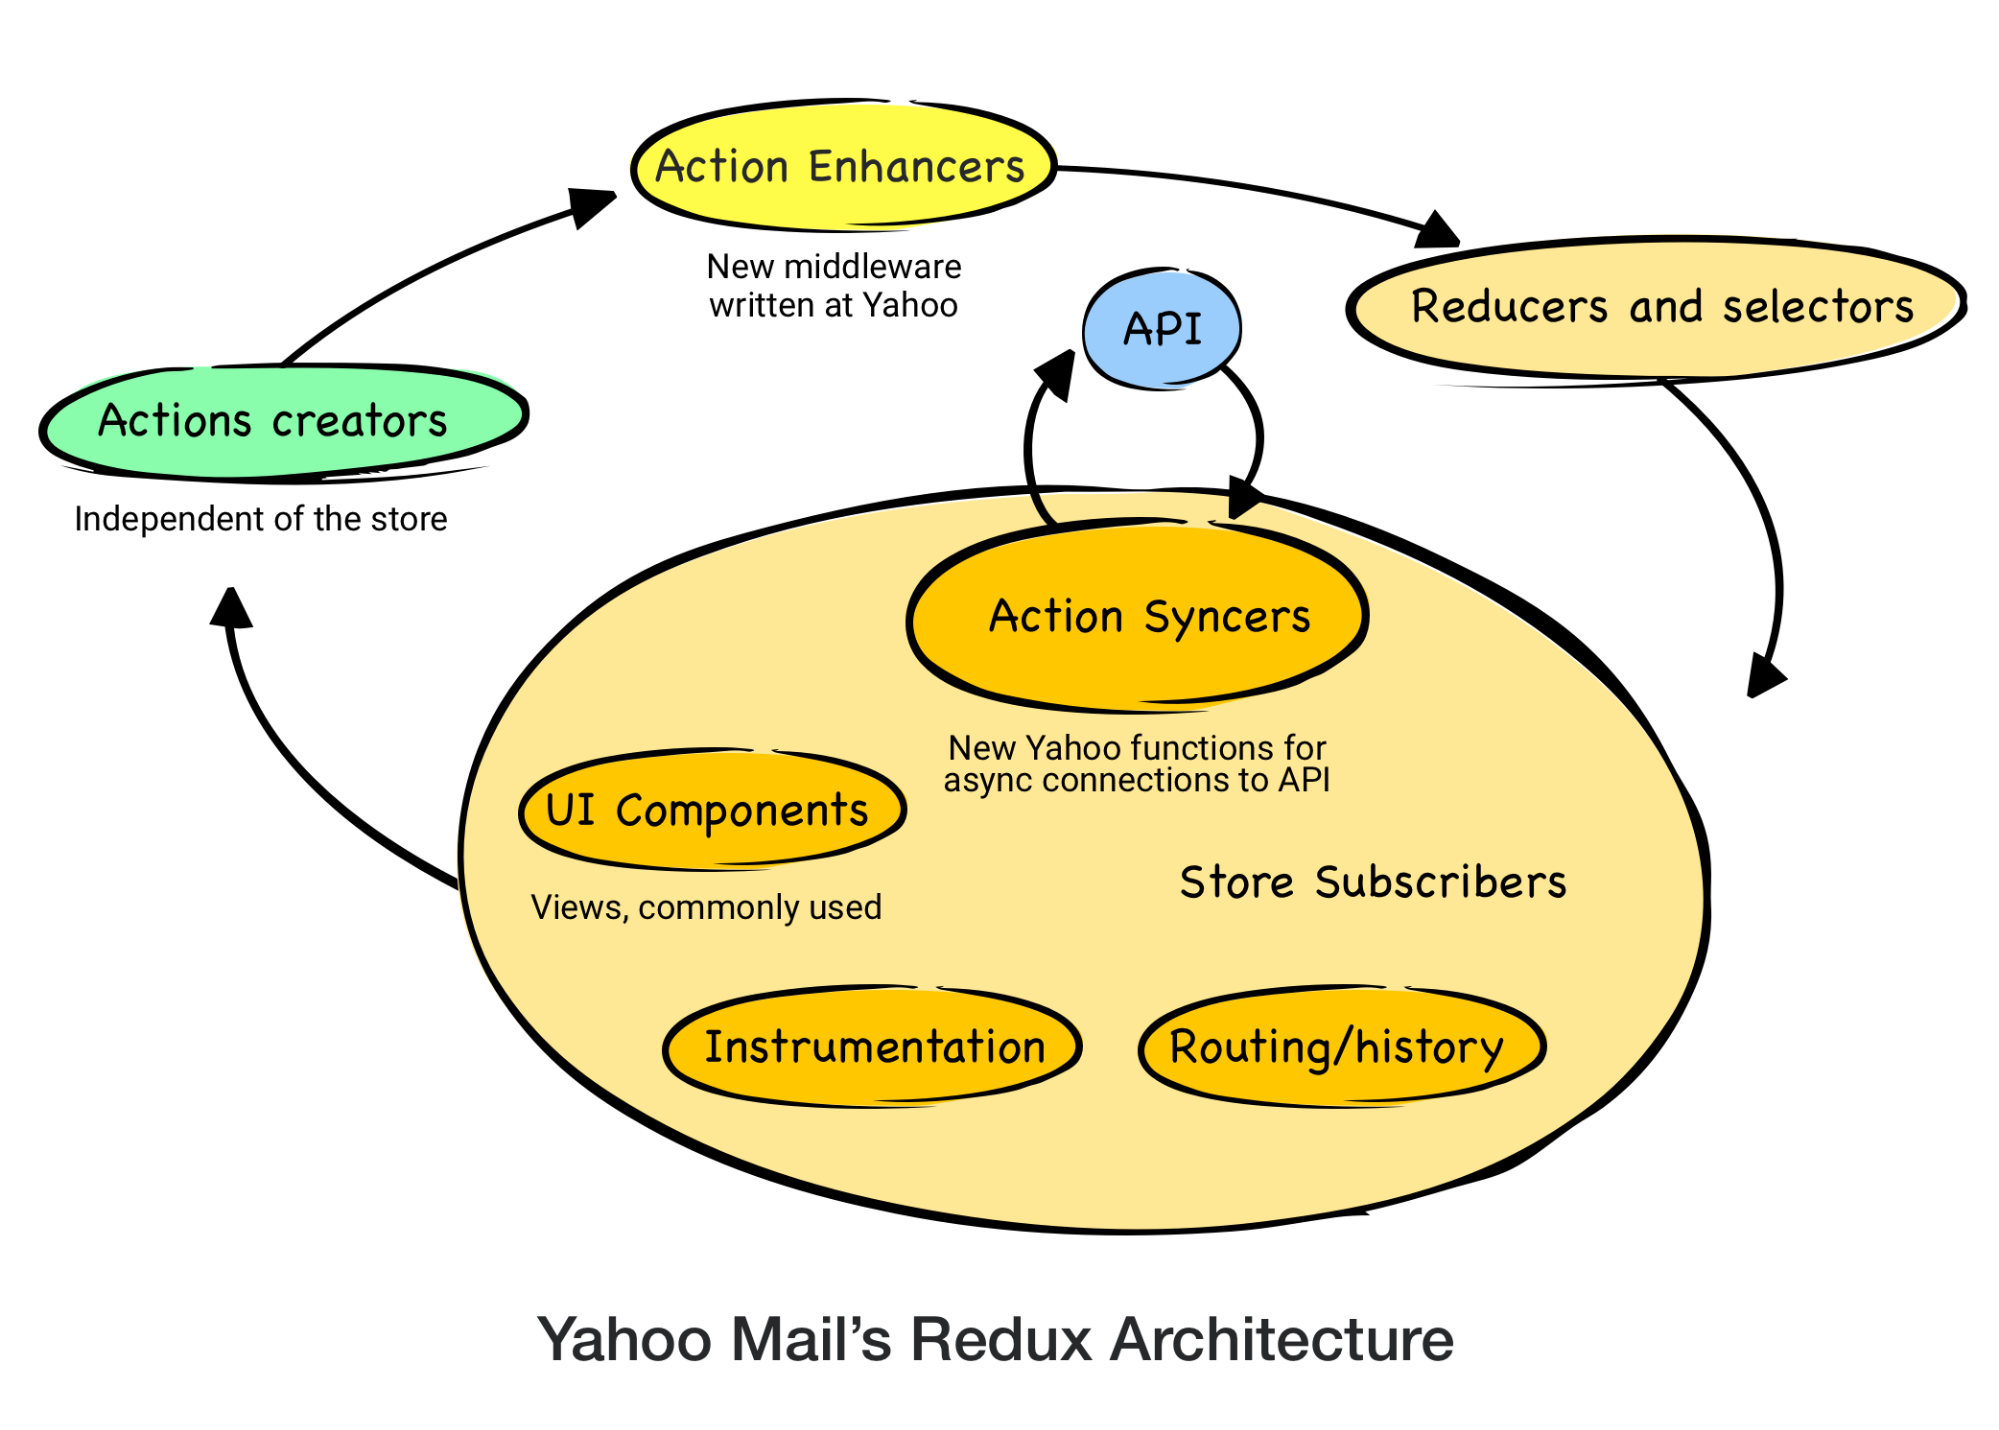