Post Syndicated from Grab Tech original https://engineering.grab.com/pii-masking
At Grab, data engineers work with large sets of data on a daily basis. They design and build advanced machine learning models that provide strategic insights using all of the data that flow through the Grab Platform. This enables us to provide a better experience to our users, for example by increasing the supply of drivers in areas where our predictive models indicate a surge in demand in a timely fashion.
Grab has a mature privacy programme that complies with applicable privacy laws and regulations and we use tools to help identify, assess, and appropriately manage our privacy risks. To ensure that our users’ data are well-protected and avoid any human-related errors, we always take extra measures to secure this data.
However, data engineers will still require access to actual production data in order to tune effective machine learning models and ensure the models work as intended in production.
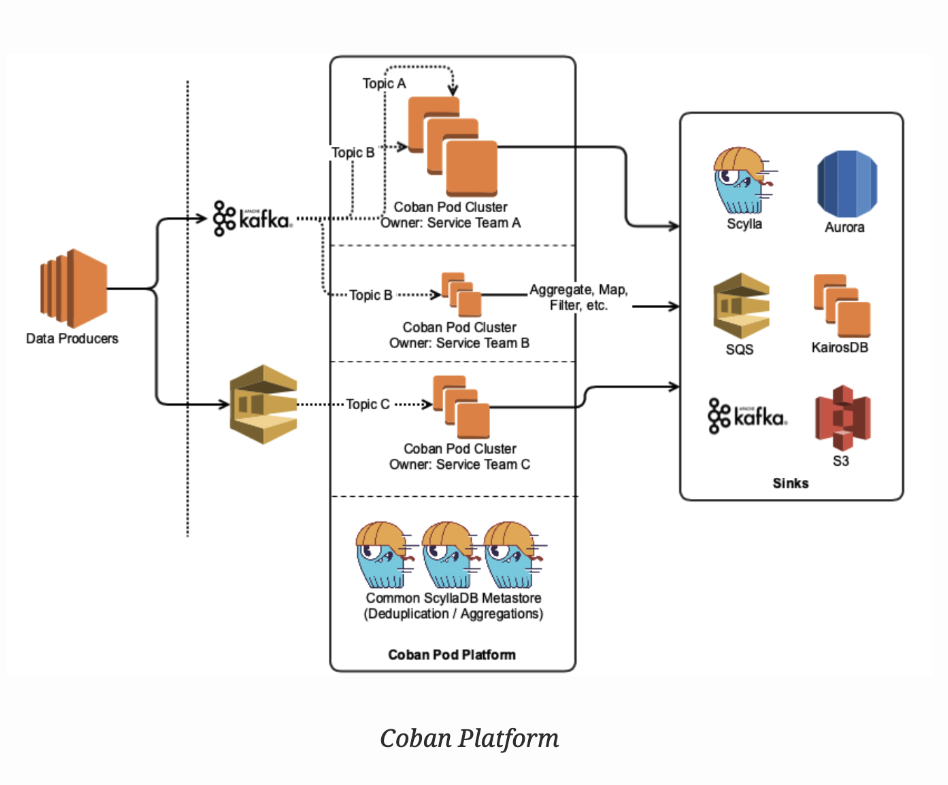
In this article, we will describe how the Grab’s data streaming team (Coban), along with the data platform and user teams, have enforced Personally Identifiable Information (PII) masking on machine learning data streaming pipelines. This ensures that we uphold a high standard and embody a privacy by design culture, while enabling data engineers to refine their models with sanitised production data.
PII tagging
Data streaming at Grab leverages the Protocol Buffers (protobuf) data format to structure in-transit data. When creating a new stream, developers must describe its fields in a protobuf schema that is then used for serialising the data wherever it is sent over the wire, and deserialising it wherever it is consumed.
A fictional example schema looks like this (the indexes are arbitrary, but commonly created in sequence):
message Booking {
  string bookingID = 1;
  int64 creationTime = 2;
  int64 passengerID = 3;
  string passengerName = 4;
  ... truncated output ...
}
Over here, the fourth field passengerName involves a PII and the data pertaining to that field should never be accessible by any data engineer. Therefore, developers owning the stream must tag that field with a PII label like this:
import "streams/coban/options/v1/pii.proto";

message Booking {
  string bookingID = 1;
  int64 creationTime = 2;
  int64 passengerID = 3;
  string passengerName = 4 [(streams.coban.options.v1.pii_type) = PII_TYPE_NAME];
  ... truncated output ...
}
The imported pii.proto library defines the tags for all possible types of PII. In the example above, the passengerName field has not only been flagged as PII, but is also marked as PII_TYPE_NAME – a specific type of PII that conveys the names of individuals. This high-level typing enables more flexible PII masking methods, which we will explain later.
Once the PII fields have been properly identified and tagged, developers need to publish the schema of their new stream into Coban’s Git repository. A Continuous Integration (CI) pipeline described below ensures that all fields describing PII are correctly tagged.
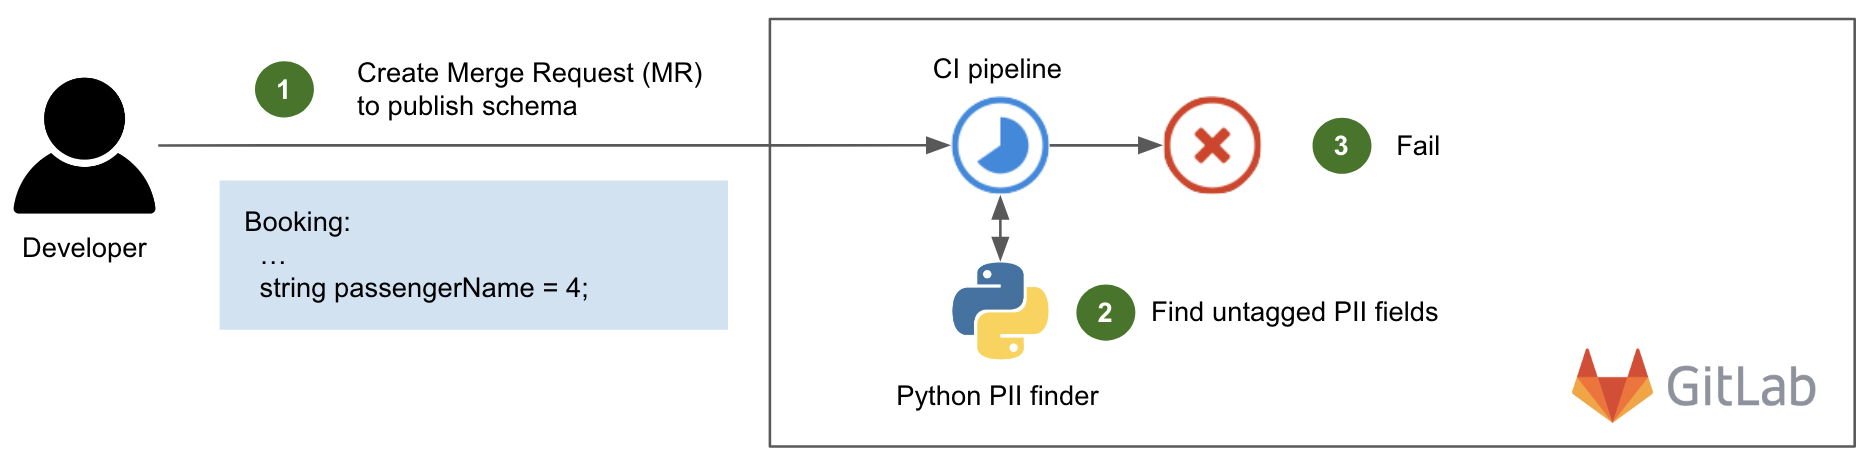
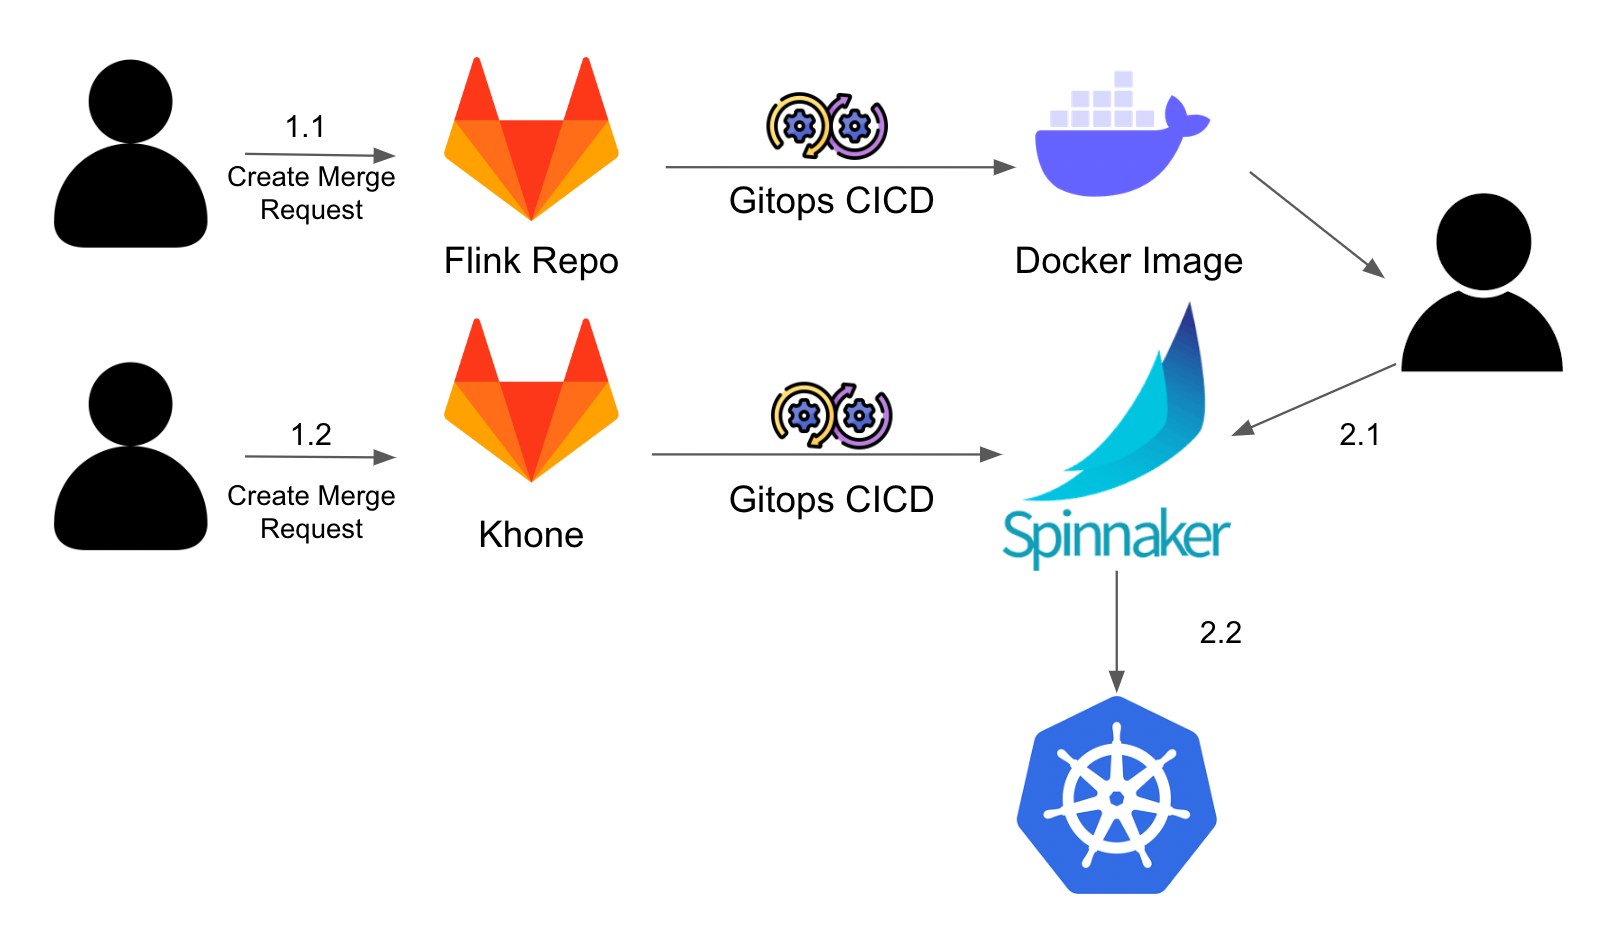
The following diagram shows this CI pipeline in action.
When a developer creates a Merge Request (MR) or pushes a new commit to create or update a schema (step 1), the CI pipeline is triggered. It runs an in-house Python script that scans each variable name of the committed schema and tests it against an extensive list of PII keywords that is regularly updated, such as name, address, email, phone, etc (step 2). If there is a match and the variable is not tagged with the expected PII label, the pipeline fails (step 3) with an explicit error message in the CI pipeline’s output, similar to this:
Field name [Booking.passengerName] should have been marked with type streams.coban.options.v1.pii_type = PII_TYPE_NAME
There are cases where a variable name in the schema is a partial match against a PII keyword but is legitimately not a PII – for example, carModelName is a partial match against name but does not contain PII data. In this case, the developer can choose to add it to a whitelist to pass the CI.
However, modifying the whitelist requires approval from the Coban team for verification purposes. Apart from this particular case, the requesting team can autonomously approve their MR in a self-service fashion.
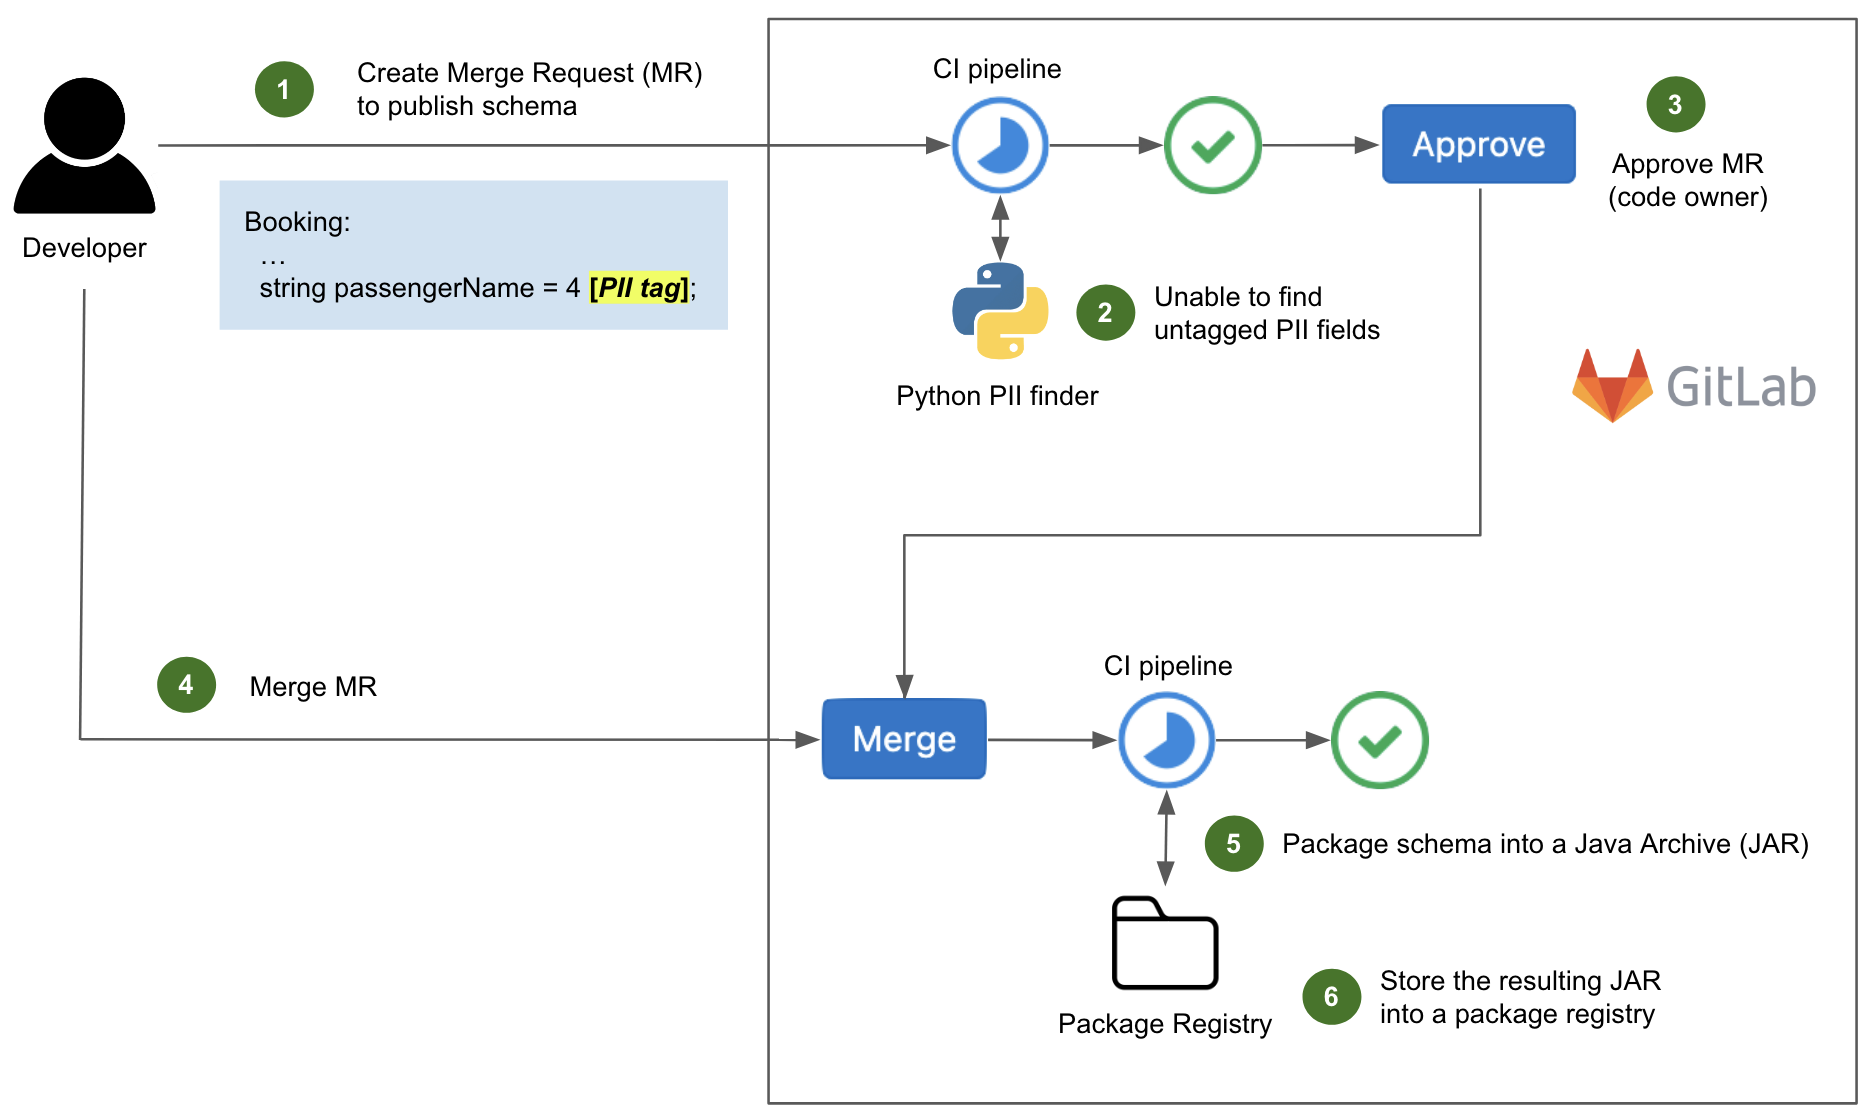
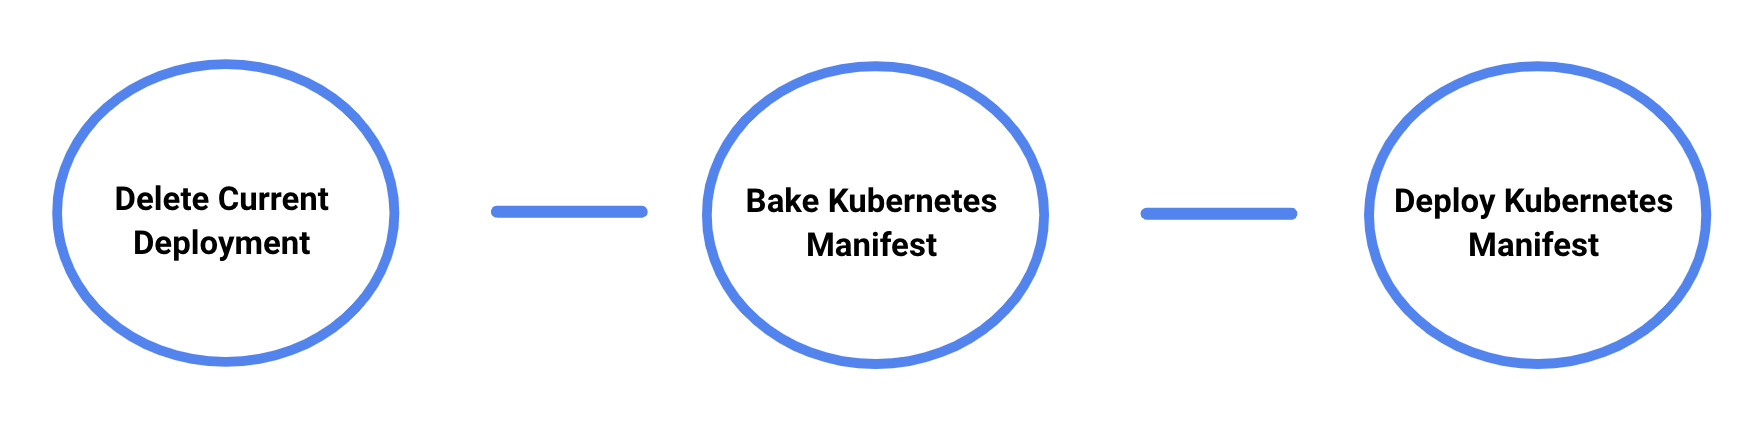
Now let us look at an example of a successful CI pipeline execution.
In Fig. 2, the committed schema (step 1) is properly tagged so our in-house Python script is unable to find any untagged PII fields (step 2). The MR is approved by a code owner (step 3), then merged to the master branch of the repository (step 4).
Upon merging, another CI pipeline is triggered to package the protobuf schema in a Java Archive (JAR) of Scala classes (step 5), which in turn is stored into a package registry (step 6). We will explain the reason for this in a later section.
Production environment
With the schemas published and all of their PII fields properly tagged, we can now take a look at the data streaming pipelines.
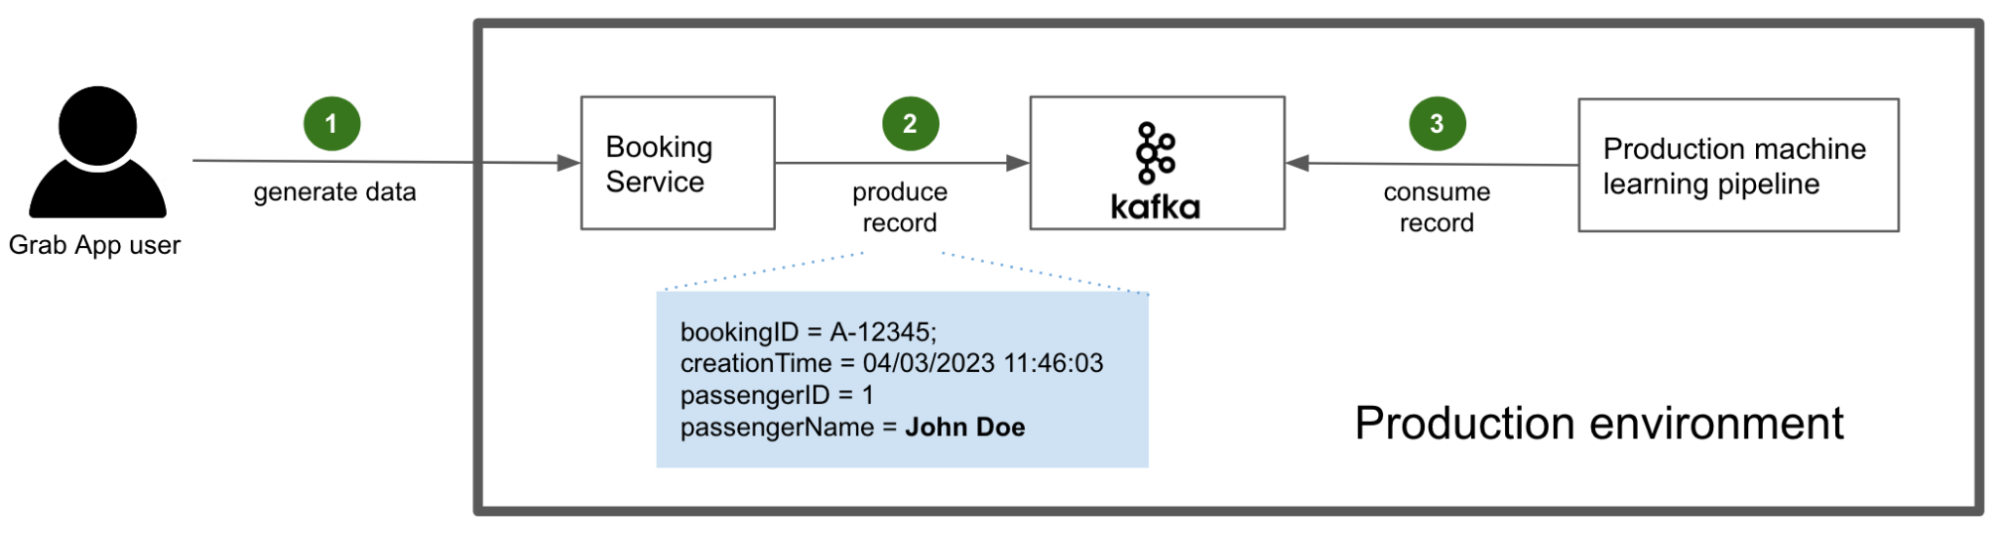
In this example, the user generates data by interacting with the Grab superapp and making a booking (step 1). The booking service, compiled with the stream’s schema definition, generates and produces Kafka records for other services to consume (step 2). Among those consuming services are the production machine learning pipelines that are of interest to this article (step 3).
PII is not masked in this process because it is actually required by the consuming services. For example, the driver app needs to display the passenger’s actual name, so the driver can confirm their identity easily.
At this part of the process, this is not much of a concern because access to the sacrosanct production environment is highly restricted and monitored by Grab.
PII masking
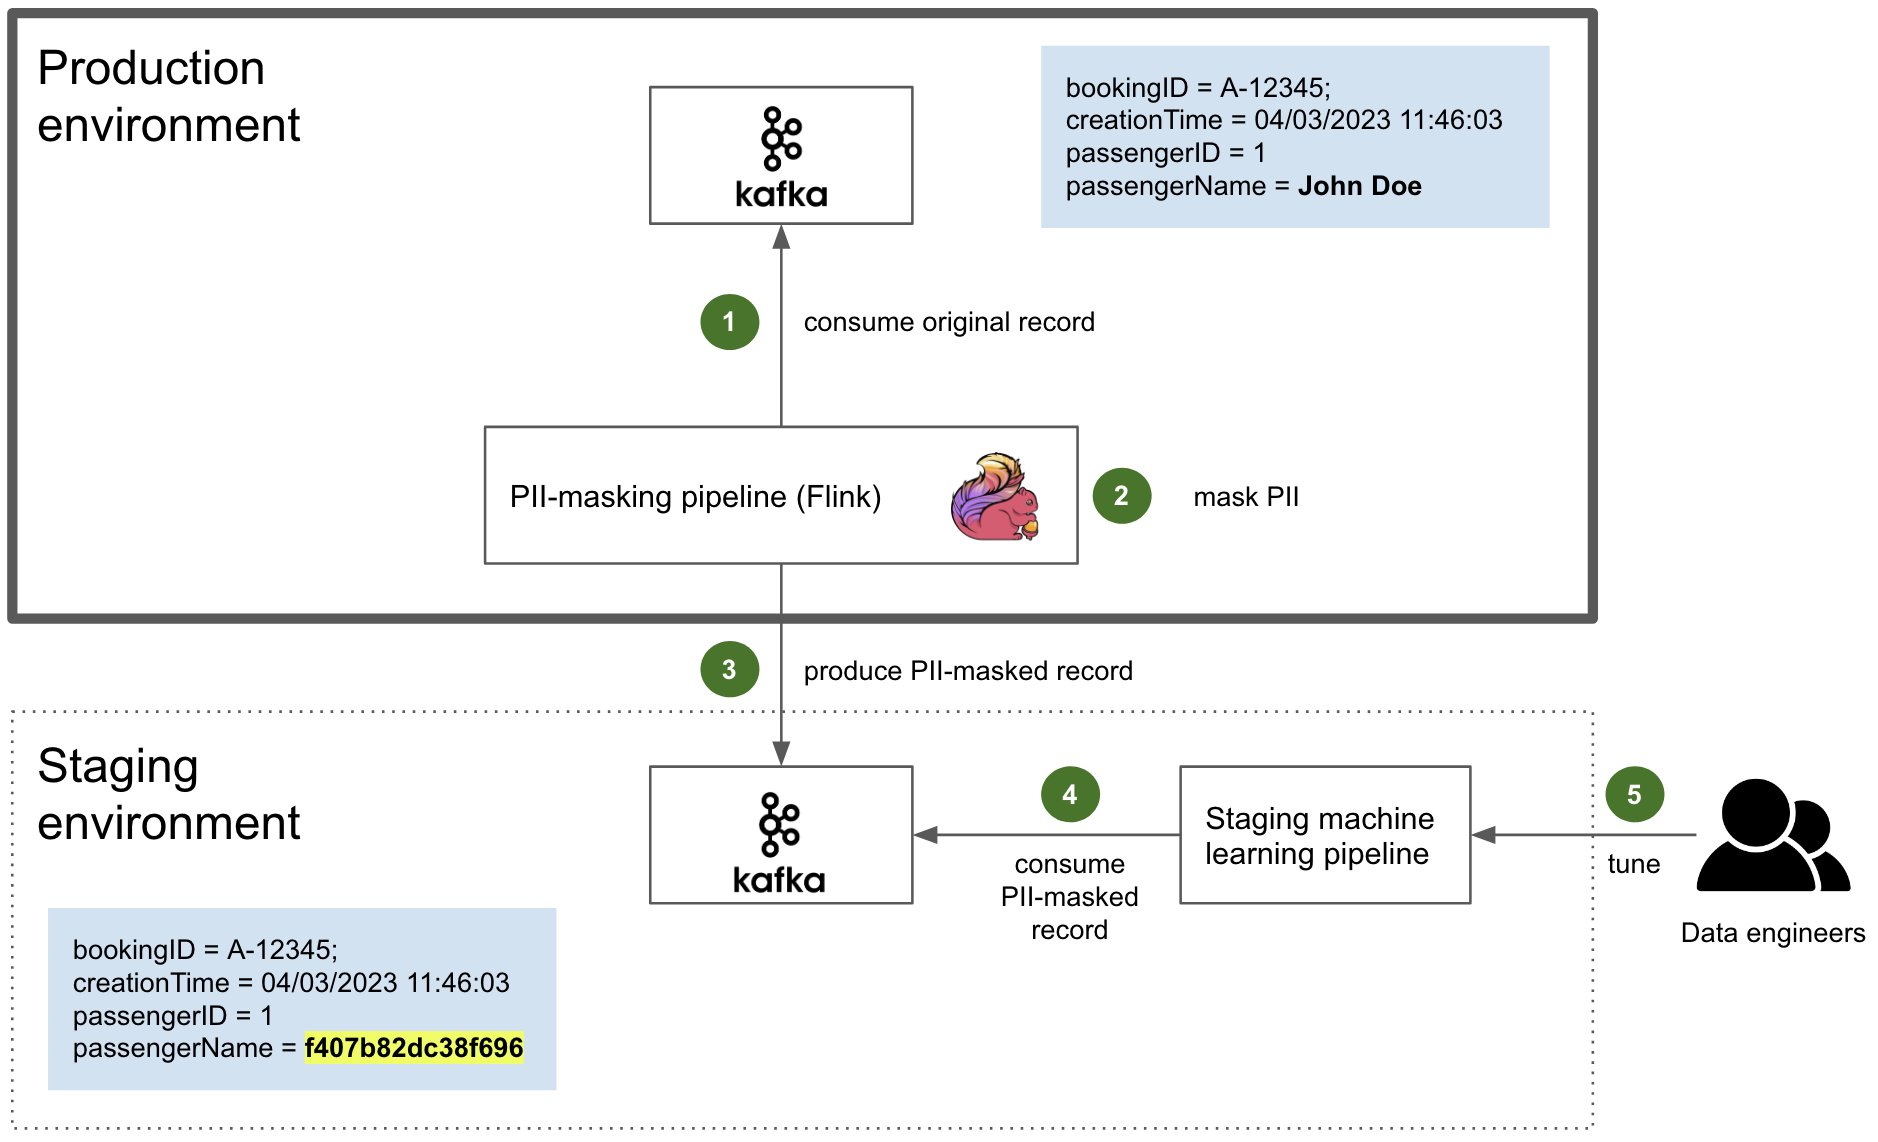
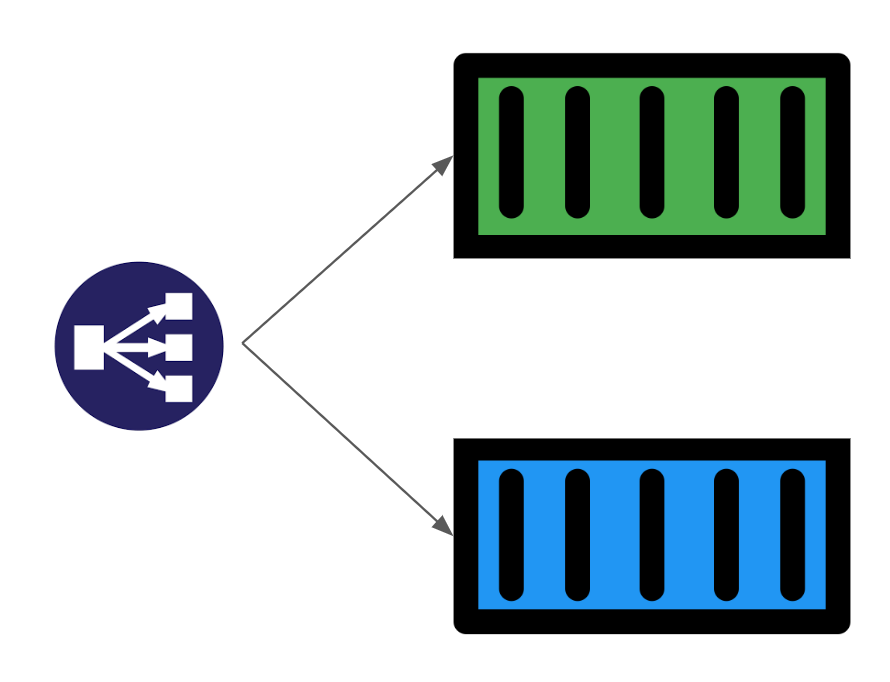
To ensure the security, stability, and privacy of our users, data engineers who need to tune their new machine learning models based on production data are not granted access to the production environment. Instead, they have access to the staging environment, where production data is mirrored and PII is masked.
The actual PII masking is performed by an in-house Flink application that resides in the production environment. Flink is a reference framework for data streaming that we use extensively. It is also fault tolerant, with the ability to restart from a checkpoint.
The Flink application is compiled along with the JAR containing the schema as Scala classes previously mentioned. Therefore, it is able to consume the original data as a regular Kafka consumer (step 1). It then dynamically masks the PII of the consumed data stream, based on the PII tags of the schema (step 2). Ultimately, it produces the sanitised data to the Kafka cluster in the staging environment as a normal Kafka producer (step 3).
Depending on the kind of PII, there are several methods of masking such as:
- Names and strings of characters: They are replaced by consistent HMAC (Hash-based message authentication code). A HMAC is a digest produced by a one-way cryptographic hash function that takes a secret key as a parameter. Leveraging a secret key here is a defence against chosen plaintext attacks, i.e. computing the digest of a particular plaintext, like a targeted individual’s name.
- Numbers and dates: Similarly, they are transformed in a consistent manner, by leveraging a random generator that takes the unmasked value as a seed, so that the same PII input consistently produces the same masked output.
Note that consistency is a recurring pattern. This is because it is a key requirement for certain machine learning models.
This sanitised data produced to the Kafka cluster in the staging environment is then consumed by the staging machine learning pipelines (step 4). There, it is used by data engineers to tune their models effectively with near real-time production data (step 5).
The Kafka cluster in the staging environment is secured with authorisation and authentication (see Zero Trust with Kafka). This is an extra layer of security in case some PII data inadvertently fall through the cracks of PII tagging, following the defence in depth principle.
Finally, whenever a new PII-tagged field is added to a schema, the PII masking Flink application needs to be compiled and deployed again. If the schema is not updated, the Flink pipeline is unable to decode this new field when deserialising the stream. Thus, the added field is just dropped and the new PII data does not make it to the staging environment.
What’s next?
For the immediate next steps, we are going to enhance this design with an in-house product based on AWS Macie to automatically detect the PII that would have fallen through the cracks. Caspian, Grab’s data lake team and one of Coban’s sister teams, has built a service that is already able to detect PII data in relational databases and data lake tables. It is currently being adapted for data streaming.
In the longer run, we are committed to taking our privacy by design posture to the next level. Indeed, the PII masking described in this article does not prevent a bad actor from retrieving the consistent hash of a particular individual based on their non-PII data. For example, the target might be identifiable by a signature in the masked data set, such as unique food or transportation habits.
A possible counter-measure could be one or a combination of the following techniques, ordered by difficulty of implementation:
- Data minimisation: Non-essential fields in the data stream should not be mirrored at all. E.g. fields of the data stream that are not required by the data engineers to tune their models. We can introduce a dedicated tag in the schema to flag those fields and instruct the mirroring pipeline to drop them. This is the most straightforward approach.
- Differential privacy: The mirroring pipeline could introduce some noise in the mirrored data, in a way that would obfuscate the signatures of particular individuals while still preserving the essential statistical properties of the dataset required for machine learning. It happens that Flink is a suitable framework to do so, as it can split a stream into multiple windows and apply computation over those windows. Designing and generalising a logic that meets the objective is challenging though.
- PII encryption at source: PII could be encrypted by the producing services (like the booking service), and dynamically decrypted where plaintext values are required. However, key management and performance are two tremendous challenges of this approach.
We will explore these techniques further to find the solution that works best for Grab and ensures the highest level of privacy for our users.
Join us
Grab is the leading superapp platform in Southeast Asia, providing everyday services that matter to consumers. More than just a ride-hailing and food delivery app, Grab offers a wide range of on-demand services in the region, including mobility, food, package and grocery delivery services, mobile payments, and financial services across 428 cities in eight countries.
Powered by technology and driven by heart, our mission is to drive Southeast Asia forward by creating economic empowerment for everyone. If this mission speaks to you, join our team today!


 .
.
 and the responses from GitHub Copilot
  .
. 


 (@yavorsky_)


.](https://github.blog/wp-content/uploads/2023/04/image3.gif)
 האדם-החושב on wikipedia](https://github.blog/wp-content/uploads/2023/04/image4-1.png?w=1024&fit=1024%2C1024)
 using VAEs trained on the CelebA dataset.](https://github.blog/wp-content/uploads/2023/04/image6.jpg?w=539&fit=1024%2C1024)
 ) by generating new characters, storylines, design components, and more. Case in point: The developer behind the game,
  ). Artists and designers alike are using these AI tools as a source of inspiration. For example, architects can quickly create 3D models of objects or environments and artists can breathe new life into their portraits by using AI to apply different styles, like adding a Cubist style to their original image. Need proof? Designers are already starting to use AI image generators, such as