Rapid7 is thrilled to announce that the 2nd annual VeloCON: Digging Deeper Together virtual summit will be held this September 13th at 9 am ET. Once again, the conference will be online and completely free!
VeloCON is a one-day event focused on the Velociraptor community. It’s a place to share experiences in using and developing Velociraptor to address the needs of the wider DFIR community and an opportunity to take a look ahead at the future of our platform.
This year’s event calls for even more of the stimulating and informative content that made last year’s VeloCON so much fun. Don’t miss your chance at being a part of the marquee event of the open-source DFIR calendar.
Registration is now OPEN! Click here to register and get event updates and start time reminders.
Last year’s event was a tremendous success, with over 500 unique participants enjoying fascinating discussions, tech talks and the opportunity to get to know real members of our own community.
Leading Edge Panel
Rapid7 and the Velociraptor team have invited industry leading DFIR professionals, community advocates and thought leaders to host an exciting presentation panel. Proposals underwent a thorough review process to select presentations of maximum interest to VeloCON attendees and the wider Velociraptor community.
VeloCON focuses on work that pushes the envelope of what is currently possible using Velociraptor. Potential topics to be addressed by the panel include, but are not limited to:
Use cases of Velociraptor in real investigations
Novel deployment modes to cater for specific requirements
Contributions to Velociraptor to address new capabilities
Potential future ideas and features that Velociraptor
Integration of Velociraptor with other tools/frameworks
Analysis and acquisition on novel Forensic Artifacts
Register Today
Please register for VeloCON 2023 by following this link. You’ll be able to preview panelist bios as well as receive email confirmations and reminders as we get closer to the event.
Learn more about Velociraptor by visiting any of our web and social media channels below:
While I enjoyed a few days off in California to get a dose of vitamin sea, a lot has happened in the AWS universe. Let’s take a look together!
Last Week’s Launches Here are some launches that got my attention:
Amazon MWAA now supports Apache Airflow version 2.6 – Amazon Managed Workflows for Apache Airflow (Amazon MWAA) is a managed orchestration service for Apache Airflow that you can use to set up and operate end-to-end data pipelines in the cloud. Apache Airflow version 2.6 introduces important security updates and bug fixes that enhance the security and reliability of your workflows. If you’re currently running Apache Airflow version 2.x, you can now seamlessly upgrade to version 2.6.3. Check out this AWS Big Data Blog post to learn more.
Amazon EMR Studio adds support for AWS Lake Formation fine-grained access control – Amazon EMR Studio is a web-based integrated development environment (IDE) for fully managed Jupyter notebooks that run on Amazon EMR clusters. When you connect to EMR clusters from EMR Studio workspaces, you can now choose the AWS Identity and Access Management (IAM) role that you want to connect with. Apache Spark interactive notebooks will access only the data and resources permitted by policies attached to this runtime IAM role. When data is accessed from data lakes managed with AWS Lake Formation, you can enforce table and column-level access using policies attached to this runtime role. For more details, have a look at the Amazon EMR documentation.
Other AWS News Here are some additional blog posts and news items that you might find interesting:
AWS recognized as a Leader in 2023 Gartner Magic Quadrant for Contact Center as a Service with Amazon Connect – AWS was named a Leader for the first time since Amazon Connect, our flexible, AI-powered cloud contact center, was launched in 2017. Read the full story here.
Generate creative advertising using generative AI – This AWS Machine Learning Blog post shows how to generate captivating and innovative advertisements at scale using generative AI. It discusses the technique of inpainting and how to seamlessly create image backgrounds, visually stunning and engaging content, and reducing unwanted image artifacts.
AWS open-source news and updates – My colleague Ricardo writes this weekly open-source newsletter in which he highlights new open-source projects, tools, and demos from the AWS Community.
Upcoming AWS Events Check your calendars and sign up for these AWS events:
Build On Generative AI – Your favorite weekly Twitch show about all things generative AI is back for season 2 today! Every Monday, 9:00 US PT, my colleagues Emily and Darko look at new technical and scientific patterns on AWS, inviting guest speakers to demo their work and show us how they built something new to improve the state of generative AI.
AWS NLP Conference 2023 – Join this in-person event on September 13–14 in London to hear about the latest trends, ground-breaking research, and innovative applications that leverage natural language processing (NLP) capabilities on AWS. This year, the conference will primarily focus on large language models (LLMs), as they form the backbone of many generative AI applications and use cases. Register here.
AWS Global Summits – The 2023 AWS Summits season is almost coming to an end with the last two in-person events in Mexico City (August 30) and Johannesburg (September 26).
AWS Community Days – Join a community-led conference run by AWS user group leaders in your region: West Africa (August 19), Taiwan (August 26), Aotearoa (September 6), Lebanon (September 9), and Munich (September 14).
AWS re:Invent (November 27 – December 1) – Join us to hear the latest from AWS, learn from experts, and connect with the global cloud community. Registration is now open.
P.S. We’re focused on improving our content to provide a better customer experience, and we need your feedback to do so. Take this quick survey to share insights on your experience with the AWS Blog. Note that this survey is hosted by an external company, so the link doesn’t lead to our website. AWS handles your information as described in the AWS Privacy Notice.
Another significant milestone has been achieved by the AWS User Group Philippines. They just celebrated their tenth anniversary by running 2 days of AWS Community Day Philippines. Here are a few photos from the event, including Jeff Barr sharing his experiences attending AWS User Group meetup, in Manila, Philippines 10 years ago.
Big congratulations to AWS Community Heroes, AWS Community Builders, AWS User Group leaders and all volunteers who organized and delivered AWS Community Days! Also, thank you to everyone who attended and help support our AWS communities.
Last Week’s Launches We had interesting launches last week, including from AWS Summit, New York. Here are some of my personal highlights:
(Preview) Agents for Amazon Bedrock – You can now create managed agents for Amazon Bedrock to handle tasks using API calls to company systems, understand user requests, break down complex tasks into steps, hold conversations to gather more information, and take actions to fulfill requests.
(Coming Soon) New LLM Capabilities in Amazon QuickSight Q – We are expanding the innovation in QuickSight Q by introducing new LLM capabilities through Amazon Bedrock. These Generative BI capabilities will allow organizations to easily explore data, uncover insights, and facilitate sharing of insights.
AWS Glue Studio support for Amazon CodeWhisperer – You can now write specific tasks in natural language (English) as comments in the Glue Studio notebook, and Amazon CodeWhisperer provides code recommendations for you.
(Preview) Vector Engine for Amazon OpenSearch Serverless – This capability empowers you to create modern ML-augmented search experiences and generative AI applications without the need to handle the complexities of managing the underlying vector database infrastructure.
Last week, Amazon SageMaker Canvas also released a set of new capabilities:
AWS Open-Source Updates As always, my colleague Ricardo has curated the latest updates for open-source news at AWS. Here are some of the highlights.
cdk-aws-observability-accelerator is a set of opinionated modules to help you set up observability for your AWS environments with AWS native services and AWS-managed observability services such as Amazon Managed Service for Prometheus, Amazon Managed Grafana, AWS Distro for OpenTelemetry (ADOT) and Amazon CloudWatch.
iac-devtools-cli-for-cdk is a command line interface tool that automates many of the tedious tasks of building, adding to, documenting, and extending AWS CDK applications.
Upcoming AWS Events There are upcoming events that you can join to learn. Let’s start with AWS events:
Open for Registration for AWS re:Invent We want to be sure you know that AWS re:Invent registration is now open!
This learning conference hosted by AWS for the global cloud computing community will be held from November 27 to December 1, 2023, in Las Vegas.
Pro-tip: You can use information on the Justify Your Trip page to prove the value of your trip to AWS re:Invent trip.
Give Us Your Feedback We’re focused on improving our content to provide a better customer experience, and we need your feedback to do so. Please take this quick survey to share insights on your experience with the AWS Blog. Note that this survey is hosted by an external company, so the link does not lead to our website. AWS handles your information as described in the AWS Privacy Notice.
That’s all for this week. Check back next Monday for another Week in Review.
P.S. We’re focused on improving our content to provide a better customer experience, and we need your feedback to do so. Please take this quick survey to share insights on your experience with the AWS Blog. Note that this survey is hosted by an external company, so the link does not lead to our website. AWS handles your information as described in the AWS Privacy Notice.
At GitHub, we perform a lot of merges and rebases in the background. For example, when you’re ready to merge your pull request, we already have the resulting merge assembled. Speeding up merge and rebase performance saves both user-visible time and backend resources. Git has recently learned some new tricks which we’re using at scale across GitHub. This post walks through what’s changed and how the experience has improved.
Our requirements for a merge strategy
There are a few non-negotiable parts of any merge strategy we want to employ:
It has to be fast. At GitHub’s scale, even a small slowdown is multiplied by the millions of activities going on in repositories we host each day.
It has to be correct. For merge strategies, what’s “correct” is occasionally a matter of debate. In those cases, we try to match what users expect (which is often whatever the Git command line does).
It can’t check out the repository. There are both scalability and security implications to having a working directory, so we simply don’t.
Previously, we used libgit2 to tick these boxes: it was faster than Git’s default merge strategy and it didn’t require a working directory. On the correctness front, we either performed the merge or reported a merge conflict and halted. However, because of additional code related to merge base selection, sometimes a user’s local Git could easily merge what our implementation could not. This led to a steady stream of support tickets asking why the GitHub web UI couldn’t merge two files when the local command line could. We weren’t meeting those users’ expectations, so from their perspective, we weren’t correct.
A new strategy emerges
Two years ago, Git learned a new merge strategy, merge-ort. As the author details on the mailing list, merge-ort is fast, correct, and addresses many shortcomings of the older default strategy. Even better, unlike merge-recursive, it doesn’t need a working directory. merge-ort is much faster even than our optimized, libgit2-based strategy. What’s more, merge-ort has since become Git’s default. That meant our strategy would fall even further behind on correctness.
It was clear that GitHub needed to upgrade to merge-ort. We split this effort into two parts: first deploy merge-ort for merges, then deploy it for rebases.
merge-ort for merges
Last September, we announced that we’re using merge-ort for merge commits. We used Scientist to run both code paths in production so we can compare timing, correctness, etc. without risking much. The customer still gets the result of the old code path, while the GitHub feature team gets to compare and contrast the behavior of the new code path. Our process was:
Create and enable a Scientist experiment with the new code path.
Roll it out to a fraction of traffic. In our case, we started with some GitHub-internal repositories first before moving to a percentage-based rollout across all of production.
Measure gains, check correctness, and fix bugs iteratively.
We saw dramatic speedups across the board, especially on large, heavily-trafficked repositories. For our own github/github monolith, we saw a 10x speedup in both the average and P99 case. Across the entire experiment, our P50 saw the same 10x speedup and P99 case got nearly a 5x boost.
merge-ort for rebases
Like merges, we also do a huge number of rebases. Customers may choose rebase workflows in their pull requests. We also perform test rebases and other “behind the scenes” operations, so we also brought merge-ort to rebases.
This time around, we powered rebases using a new Git subcommand: git-replay. git replay was written by the original author of merge-ort, Elijah Newren (a prolific Git contributor). With this tool, we could perform rebases using merge-ort and without needing a worktree. Once again, the path was pretty similar:
Merge git-replay into our fork of Git. (We were running the experiment with Git 2.39, which didn’t include the git-replay feature.)
Before shipping, leverage our test suite to detect discrepancies between the old and the new implementations.
Write automation to flush out bugs by performing test rebases of all open pull requests in github/github and comparing the results.
Set up a Scientist experiment to measure the performance delta between libgit2-powered rebases and monitor for unexpected mismatches in behavior.
Measure gains, check correctness, and fix bugs iteratively.
Once again, we were amazed at the results. The following is a great anecdote from testing, as relayed by @wincent (one of the GitHub engineers on this project):
Another way to think of this is in terms of resource usage. We ran the experiment over 730k times. In that interval, our computers spent 2.56 hours performing rebases with libgit2, but under 10 minutes doing the same work with merge-ort. And this was running the experiment for 0.5% of actors. Extrapolating those numbers out to 100%, if we had done all rebases during that interval with merge-ort, it would have taken us 2,000 minutes, or about 33 hours. That same work done with libgit2 would have taken 512 hours!
What’s next
While we’ve covered the most common uses, this is not the end of the story for merge-ort at GitHub. There are still other places in which we can leverage its superpowers to bring better performance, greater accuracy, and improved availability. Squashing and reverting are on our radar for the future, as well as considering what new product features it could unlock down the road.
Appreciation
Many thanks to all the GitHub folks who worked on these two projects. Also, GitHub continues to be grateful for the hundreds of volunteer contributors to the Git open source project, including Elijah Newren for designing, implementing, and continually improving merge-ort.
At GitHub, we believe that data-driven insights are the keys to success for any software development project. Understanding the health and progress of your issues, pull requests, and discussions is crucial for effective collaboration, maintainership, and project management.
That is why we’re excited to announce the release of the Issue Metrics GitHub Action, a powerful tool that empowers developers and teams to measure key metrics and gain valuable insights into their projects.
With the new Issue Metrics GitHub Action, you can now easily track and monitor important metrics related to issues, pull requests, and discussions, such as time to first response, time to close, and more for any given time period.
Whether you’re an individual developer, a small team, or a large organization, these metrics will help you gauge the overall health, progress, and engagement of your projects.
Sample report
Common use cases
Maintainers: ensuring proper attention
As a maintainer, it is essential to give reasonable attention to the issues and pull requests in the repositories you maintain. With the Issue Metrics GitHub Action, you can track metrics, such as the number of open issues, closed issues, open pull requests, and merged pull requests.
These metrics can provide you with a clear overview of the workload for a project over a given week, month, or even year. The action can also allow you to consider how you or your team prioritize time and attention effectively while also highlighting potentially overlooked requests in need of attention.
First responders: timely user contact
As a first responder in a repository, it’s part of the job description to ensure that users receive contact in a reasonable amount of time. By utilizing the Issue Metrics GitHub Action, you can keep track of metrics like the number of discussions awaiting replies, unresolved issues, or pull requests waiting for reviews. These metrics enable you to maintain a high level of responsiveness, fostering a positive user experience and timely problem resolution. These can be used to build a to-do list or retrospectively to reflect on how long users had to wait for a response during a given time period.
Open Source Program Office (OSPO): streamlining open source requests
An important part of what OSPOs do is making the open source release process easy and efficient while adhering to company policy. This process usually involves employees opening an issue, pull request, or discussion. With the Issue Metrics GitHub Action, OSPOs can gain valuable insights into the number of requests, the ratio of open to closed requests, and metrics related to the time it takes to navigate the open-source process to completion.
These metrics empower you to streamline your workflows, optimize response times, and ensure a smooth open-source collaboration experience. Optimizing the open source release process encourages employees to continue to produce open source projects on the organization’s behalf.
Product development teams: optimizing pull request reviews
Product development teams rely heavily on the code review process to collaborate and build high-quality software. By leveraging the Issue Metrics GitHub Action, teams can measure metrics such as the time it takes to get pull request reviews. These insights allow you to reflect on the data during retrospectives, identify areas for improvement, and optimize the review process to enhance team collaboration and accelerate development cycles.
Certain aspects of efficiency and flow may be hard to measure but often it is possible to spot and remove inefficiencies in the value stream.
– Forsgren et al. 2021
Setup and workflow integration
Setting up the Issue Metrics GitHub Action takes a few minutes, compared to the few hours it takes to calculate these metrics manually. You also only need to set up the action once, and it will run on a regular basis of your own choosing. It integrates into your existing GitHub Actions workflow or you can create a new workflow specifically for metrics tracking.
The action provides a wide range of customizable options, allowing you to tailor the issues, pull requests, and discussions measured by utilizing GitHub’s powerful search filtering. Ready to use configurations have been tested and used internally at GitHub and are now available for you to try out as well.
Here is one such example that runs monthly to report on metrics for issues created last month:
name: Monthly issue metrics
on:
  workflow_dispatch:
  schedule:
    - cron: '3 2 1 * *'

jobs:
  build:
    name: issue metrics
    runs-on: ubuntu-latest

    steps:

    - name: Get dates for last month
      shell: bash
      run: |
        # Get the current date
        current_date=$(date +'%Y-%m-%d')

        # Calculate the previous month
        previous_date=$(date -d "$current_date -1 month" +'%Y-%m-%d')

        # Extract the year and month from the previous date
        previous_year=$(date -d "$previous_date" +'%Y')
        previous_month=$(date -d "$previous_date" +'%m')

        # Calculate the first day of the previous month
        first_day=$(date -d "$previous_year-$previous_month-01" +'%Y-%m-%d')

        # Calculate the last day of the previous month
        last_day=$(date -d "$first_day +1 month -1 day" +'%Y-%m-%d')

        echo "$first_day..$last_day"
        echo "last_month=$first_day..$last_day" >> "$GITHUB_ENV"

    - name: Run issue-metrics tool
      uses: github/issue-metrics@v2
      env:
        GH_TOKEN: ${{ secrets.GH_TOKEN }}
        SEARCH_QUERY: 'repo:owner/repo is:issue created:${{ env.last_month }} -reason:"not planned"'

    - name: Create issue
      uses: peter-evans/create-issue-from-file@v4
      with:
        title: Monthly issue metrics report
        content-filepath: ./issue_metrics.md
        assignees: <YOUR_GITHUB_HANDLE_HERE>
Ready to start leveling up your GitHub project management?
Head over to the Issue Metrics GitHub Action repository to explore the documentation, installation instructions, and examples. The repository provides a comprehensive README file that guides you through the setup process and showcases the wide range of metrics you can measure. If you need additional help, feel free to open an issue in the repository.
GitHub is committed to providing developers with the best tools to enhance collaboration and productivity. The Issue Metrics GitHub Action is a significant step towards empowering teams to measure key metrics related to issues, pull requests, and discussions. By gaining valuable insights into the pulse of your projects, you can drive continuous improvement and deliver exceptional software. We are using this in several places internally across GitHub to help us continually improve and hope this action can help you as well. Happy coding!
Effective planning and tracking is essential for developer teams of all shapes and sizes. Last year, we announced the general availability of GitHub Projects, connecting your planning directly to the work your teams are doing in GitHub. Today, we’re making GitHub Projects faster and more powerful. The projectcommand for the gh CLI is now generally available!
In this blog, we’ll take a look at how to get started with the new command, share some examples you can try on the command line and in GitHub Actions, and list the steps to upgrade from the archived gh-projects extension. Let’s take a look at how you can conveniently manage and collaborate on GitHub Projects from the command line.
The components of GitHub Projects
Let’s start by familiarizing ourselves with the key components of GitHub Projects. A project is made up of three components—the Project, Project field(s), and Project item(s).
A Project belongs to an owner (which can be either a user or an organization), and is identified by a project number. As an example, the GitHub public roadmap project is number 4247 in the github organization. We’ll use this project in some of our examples later on.
Project fields belong to a Project and have a type such as Status, Assignee, or Number, while field values are set on an item. See understanding fields for more details.
Project items are one of type draft issue, issue, or pull request. An item of type draft issue belongs to a single Project, while items of type issue and pull request can be added to multiple projects.
These three components make up the subcommands of gh project, for example:
Project subcommands include: create, copy, list, and view.
Project field subcommands include: field-create, field-list , and field-delete.
Project item subcommands include: item-add, item-edit, item-archive, and item-list.
For the full list of project commands, check out the manual.
Permissions check
In order to get started with the new command, you’ll need to ensure you have the right permissions. The project command requires the project auth scope, which isn’t part of the default scopes of the gh auth token.
In your terminal, you can check your current scopes with this command:
$ gh auth status
github.com
✓ Logged in to github.com as mntlty (keyring)
✓ Git operations for github.com configured to use https protocol.
✓ Token: gho_************************************
✓ Token scopes: gist, read:org, repo, workflow
If you don’t see project in the list of token scopes, you can add it by following the interactive prompts from this command:
$ gh auth refresh -s project
In GitHub Actions, you must choose one of the options from the documentation to make a token with the project scope available.
Running project commands
Now that you have the permissions you need, let’s look at some examples of running project commands using my user and the GitHub public roadmap project, which you can adapt to your team’s use cases.
List the projects owned by the current user (note that no --owner flag is set):
$ gh project list
NUMBER TITLE STATE ID
1 my first project open PVT_kwxxx
2 @mntlty's second project open PVT_kwxxx
$ gh project view --owner github 4247

Title

GitHub public roadmap

## Description

--

## Visibility

Public

## URL

<https://github.com/orgs/github/projects/4247>

## Item count

208

## Readme

--

## Field Name (Field Type)

Title (ProjectV2Field)

Assignees (ProjectV2Field)

Status (ProjectV2SingleSelectField)

Labels (ProjectV2Field)

Repository (ProjectV2Field)

Milestone (ProjectV2Field)

Linked pull requests (ProjectV2Field)

Reviewers (ProjectV2Field)

Tracks (ProjectV2Field)

Tracked by (ProjectV2Field)
List the items in the GitHub public roadmap project:
$ gh project item-list --owner github 4247

TYPE TITLE NUMBER REPOSITORY ID
Issue Kotlin security analysis support in CodeQL code scanning
(public beta) 207 github/roadmap
PVTI_lADNJr_NE13OAALQgw
Issue Swift security analysis support in CodeQL code scanning
(beta) 206 github/roadmap
PVTI_lADNJr_NE13OAALQhA
Issue Fine-grained PATs (v2 PATs) - [Public Beta]
184 github/roadmap PVTI_lADNJr_NE13OAALQmw
Copy the GitHub public roadmap project structure to a new project owned by mntlty:
Note that if you are using a TTY and do not pass a --owner flag or the project number argument to a command which requires those values, an interactive prompt will be shown from which you can select those values.
JSON format
Now, let’s look at how to format the command output in JSON, which displays more information for use in scripting, automation, and piping into other commands. Every project subcommand supports outputting to JSON format by setting the --format=json flag:
Combining JSON formatted output with a tool such as jq enables you to unlock even more capabilities. For example, you can create a list of the URLs from all of the Issues on the GitHub public roadmap project that have status “Future”:
You can also level up your team’s usage of GitHub Projects with project commands in your GitHub Actions workflows to enhance automation, generate on demand reports, and react to events such as when a project item is modified. For example, you can create a workflow which is triggered by a workflow_dispatch event and will close all projects that are owned by mntlty and which have no items:
The latest version of gh is automatically available in the GitHub Actions environment. For more information on using GitHub Actions, see https://docs.github.com/en/actions.
Upgrading from the gh-projects extension
Now that the project command is officially part of the CLI, the gh-projectsextension repository has been archived. If you’re currently using the extension, you don’t need to change anything. You can continue installing and using the gh-projects extension; however, it won’t receive any future enhancements. Fortunately, it’s very simple to make the transition from the gh-project extension to the project command:
Upgrade to the latest version of gh.
Replace flags for --user and --org with --owner in project commands. owner is the login of the project owner, which is either a user or an organization.
Replace gh projects with gh project.
To avoid confusion, I also recommend removing the extension by running the following command:
$ gh ext remove gh-projects
Thank you to the community, @mislav, @samcoe, and @vilmibm for providing invaluable feedback and support on gh-projects!
Get started with GitHub CLI project command today
If you’re interested in learning more or giving us feedback, check out these links:
A couple of months ago we announced that you can test the online text-based Code Editor we’re building to help young people aged 7 and older learn to write code. Now we’ve made the code for the Editor open source so people can repurpose and contribute to it.
How can you use the Code Editor?
You and your learners can try out the Code Editor in the first two projects of our ‘Intro to Python’ path. We’ve included a feedback form for you to let us know what you think about the Editor.
The Editor lets you run code straight in the browser, with no setup required.
It makes getting started with text-based coding easier thanks to its simple and intuitive interface.
If you’re logged into your Raspberry Pi Foundation account, your code in the Editor is automatically saved.
If you’re not logged in, your code changes persist for the session, so you can refresh or close the tab without losing your work.
You can download your code to your computer too.
Since the Editor lets learners save their code using their Raspberry Pi Foundation account, it’s easy for them to build on projects they’ve started in the classroom or at home, or bring a project they’ve started at home to their coding club.
Putting ease of use and accessibility front and centre
We know that starting out with new programming tools can be tricky and add to the cognitive load of learning new subject matter itself. That’s why our Editor has a simple and accessible user interface and design:
You can easily find key functions, such as how to write and run code, how to save or download your code, and how to check your code.
You can switch between dark and light mode.
You can enlarge or reduce the text size in input and output, which is especially useful for people with visual impairments and for educators and volunteers who want to demonstrate something to a group of learners.
We’ll expand the Editor’s functionalities as we go. For example, at the moment we’re looking at how to improve the Editor’s user interface (UI) for better mobile support.
If there’s a feature you think would help the Editor become more accessible and more suitable for young learners, or make it better for your classroom or club, please let us know via the feedback form.
The open-source code for the Code Editor
Our vision is that every young person develops the knowledge, skills, and confidence to use digital technologies effectively, and to be able to critically evaluate these technologies and confidently engage with technological change. We’re part of a global community that shares that vision, so we’ve made the Editor available as an open-source project. That means other projects and organisations focussed on helping people learn about coding and digital technologies can benefit from the work.
How did we build the Editor? An overview
To support the widest possible range of learners, we’ve designed the Code Editor application to work well on constrained devices and low-bandwidth connections. Safeguarding, accessibility, and data privacy are also key considerations when we build digital products at the Foundation. That’s why we decided to design the front end of the Editor to work in a standalone capacity, with Python executed through Skulpt, an entirely in-browser implementation of Python, and code changes persisted in local storage by default. Learners have the option of using a Raspberry Pi Foundation account to save their work, with changes then persisted via calls to a back end application programming interface (API).
As safeguarding is always at the core of what we do, we only make features available that comply with our safeguarding policies as well as the ICO’s age-appropriate design code. We considered supporting functionality such as image uploads and code sharing, but at the time of writing have decided to not add these features given that, without proper moderation, they present risks to safeguarding.
There’s an amazing community developing a wealth of open-source libraries. We chose to build our text-editor interface using CodeMirror, which has out-of-the-box mobile and tablet support and includes various useful features such as syntax highlighting and keyboard shortcuts. This has enabled us to focus on building the best experience for learners, rather than reinventing the wheel.
Diving a bit more into the technical details:
The UI front end is built in React and deployed using Cloudflare Pages
The API back end is built in Ruby on Rails
The text-editor panel uses CodeMirror, which has best-in-class accessibility through mobile device and screen-reader support, and includes functionality such as syntax highlighting, keyboard shortcuts, and autocompletion
Python functionality is built using Skulpt to enable in-browser execution of code, with custom extensions built to support our learning content
Project code is persisted through calls to our back end API using a mix of REST and GraphQL endpoints
Data is stored in PostgreSQL, which is hosted on Heroku along with our back end API
Accessing the open-source code
You can find out more about our Editor’s code for both the UI front end and API back end in our GitHub readme and contributions documentation. These kick-starter docs will help you get up and running faster:
The Editor’s front end is licensed as permissively as possible under the Apache Licence 2.0, and we’ve chosen to license the back end under the copyleft AGPL V3 licence. Copyleft licences mean derived works must be licensed under the same terms, including making any derived projects also available to the community.
We’d greatly appreciate your support with developing the Editor further, which you can give by:
Providing feedback on our code or raising a bug as a GitHub Issue in the relevant repository.
Submitting contributions by raising a pull request against the relevant repository.
On the back end repository we’ll ask you to allow the Raspberry Pi Foundation to reserve the right to re-use your contribution.
You’ll retain the copyright for any contributions on either repository.
Sharing feedback on using the Editor itself through the feedback form.
Our work to develop and publish the Code Editor as an open-source project has been funded by Endless. We thank them for their generous support.
If you are interested in partnering with us to fund this key work, or you are part of an organisation that would like to make use of the Code Editor, please reach out to us via email.
The US celebrated Independence Day last week on July 4 with fireworks and barbecues across the country. But fireworks weren’t the only thing that launched last week. Let’s have a look!
Last Week’s Launches Here are some launches that got my attention:
AWS Glue – AWS Glue Crawlers now supports Apache Iceberg tables. Apache Iceberg is an open-source table format for data stored in data lakes. You can now automatically register Apache Iceberg tables into AWS Glue Data Catalog by running the Glue Crawler. You can then query Glue Catalog Iceberg tables across various analytics engines and apply AWS Lake Formation fine-grained permissions when querying from Amazon Athena. Check out the AWS Glue Crawler documentation to learn more.
In addition, Amazon RDS for PostgreSQL Multi-AZ Deployments with two readable standbys now supports logical replication. With logical replication, you can stream data changes from Amazon RDS for PostgreSQL to other databases for use cases such as data consolidation for analytical applications, change data capture (CDC), replicating select tables rather than the entire database, or for replicating data between different major versions of PostgreSQL. Check out the Amazon RDS User Guide for more details.
Amazon CloudWatch – Amazon CloudWatch now supports Service Quotas in cross-account observability. With this, you can track and visualize resource utilization and limits across various AWS services from multiple AWS accounts within a region using a central monitoring account. You no longer have to track the quotas by logging in to individual accounts, instead from a central monitoring account, you can create dashboards and alarms for the AWS service quota usage across all your source accounts from a central monitoring account. Setup CloudWatch cross-account observability to get started.
Amazon SageMaker – You can now associate a SageMaker Model Card with a specific model version in SageMaker Model Registry. This lets you establish a single source of truth for your registered model versions, with comprehensive, centralized, and standardized documentation across all stages of the model’s journey on SageMaker, facilitating discoverability and promoting governance, compliance, and accountability throughout the model lifecycle. Learn more about SageMaker Model Cards in the developer guide.
Other AWS News Here are some additional blog posts and news items that you might find interesting:
Building generative AI applications for your startup – In this AWS Startups Blog post, Hrushikesh explains various approaches to build generative AI applications, and reviews their key component. Read the full post for the details.
Components of the generative AI landscape.
How Alexa learned to speak with an Irish accent – If you’re curious how Amazon researchers used voice conversation to generate Irish-accented training data in Alexa’s own voice, check out this Amazon Science Blog post.
AWS open-source news and updates – My colleague Ricardo writes this weekly open-source newsletter in which he highlights new open-source projects, tools, and demos from the AWS Community.
Upcoming AWS Events Check your calendars and sign up for these AWS events:
AWS Global Summits – Check your calendars and sign up for the AWS Summit close to where you live or work: Hong Kong (July 20), New York City (July 26), Taiwan (August 2-3), São Paulo (August 3), and Mexico City (August 30).
AWS Community Days – Join a community-led conference run by AWS user group leaders in your region: Malaysia (July 22), Philippines (July 29-30), Colombia (August 12), and West Africa (August 19).
AWS re:Invent (November 27 – December 1) – Join us to hear the latest from AWS, learn from experts, and connect with the global cloud community. Registration is now open.
We brought you a Let’s Architect!blog post about open-source on AWS that covered some technologies with development led by AWS/Amazon, as well as well-known solutions available on managed AWS services. Today, we’re following the same approach to share more insights about the process itself for developing open-source. That’s why the first topic we discuss in this post is a re:Invent talk from Heitor Lessa, Principal Solutions Architect at AWS, explaining some interesting approaches for developing and scaling successful open-source projects.
This edition of Let’s Architect! also touches on observability with Open Telemetry, Apache Kafka on AWS, and Infrastructure as Code with an hands-on workshop on AWS Cloud Development Kit (AWS CDK).
Powertools for AWS Lambda is an open-source library to help engineering teams implement serverless best practices. In two years, Powertools went from an initial prototype to a fast-growing project in the open-source world. Rapid growth along with support from a wide community led to challenges from balancing new features with operational excellence to triaging bug reports and RFCs and scaling and redesigning documentation.
In this session, you can learn about Powertools for AWS Lambda to understand what it is and the problems it solves. Moreover, there are many valuable lessons to learn how to create and scale a successful open-source project. From managing the trade-off between releasing new features and achieving operational stability to measuring the impact of the project, there are many challenges in open-source projects that require careful thought.
Heitor Lessa describing one of the key lessons: development and releasing new features should be as important as the other activities (governance, operational excellence, and more).
The recent blog post Let’s Architect! Monitoring production systems at scale talks about the importance of monitoring. Setting up observability is critical to maintain application and infrastructure health, but instrumenting applications to collect monitoring signals such as metrics and logs can be challenging when using vendor-specific SDKs.
This video introduces you to OpenTelemetry, an open-source observability framework. OpenTelemetry provides a flexible, single vendor-agnostic SDK based on open-source specifications that developers can use to instrument and collect signals from applications. This resource explains how it works in practice and how to monitor microservice-based applications with the OpenTelemetry SDK.
Apache Kafka is an open-source streaming data store that decouples applications producing streaming data (producers) into its data store from applications consuming streaming data (consumers) from its data store. Amazon Managed Streaming for Apache Kafka (Amazon MSK) allows you to use the open-source version of Apache Kafka with the service managing infrastructure and operations for you.
This blog post explains how the underlying infrastructure configuration can affect Apache Kafka performance. You can learn strategies on how to size the clusters to meet the desired throughput, availability, and latency requirements. This resource helps you discover strategies to find the optimal sizing for your resources, and learn the mental models adopted to conduct the investigation and derive the conclusions.
AWS Cloud Development Kit (AWS CDK) is an open-source software development framework that allows you to provision cloud resources programmatically (Infrastructure as Code or IaC) by using familiar programming languages such as Python, Typescript, Javascript, Java, Go, and C#/.Net.
CDK allows you to create reusable template and assets, test your infrastructure, make deployments repeatable, and make your cloud environment stable by removing manual (and error-prone) operations. This workshop introduces you to CDK, where you can learn how to provision an initial simple application as well as become familiar with more advanced concepts like CDK constructs.
This construct can be attached to any Lambda function that is used as an API Gateway backend. It counts how many requests were issued to each URL.
See you next time!
Thanks for joining our conversation! To find all the blogs from this series, you can check out the Let’s Architect! list of content on the AWS Architecture Blog.
A modern data architecture enables companies to ingest virtually any type of data through automated pipelines into a data lake, which provides highly durable and cost-effective object storage at petabyte or exabyte scale. This data is then projected into analytics services such as data warehouses, search systems, stream processors, query editors, notebooks, and machine learning (ML) models through direct access, real-time, and batch workflows. Data in customers’ data lakes is used to fulfil a multitude of use cases, from real-time fraud detection for financial services companies, inventory and real-time marketing campaigns for retailers, or flight and hotel room availability for the hospitality industry. Across all use cases, permissions, data governance, and data protection are table stakes, and customers require a high level of control over data security, encryption, and lifecycle management.
This post shows how open-source transactional table formats (or open table formats) can help you solve advanced use cases around performance, cost, governance, and privacy in your data lakes. We also provide insights into the features and capabilities of the most common open table formats available to support various use cases.
You can use this post for guidance when looking to select an open table format for your data lake workloads, facilitating the decision-making process and potentially narrowing down the available options. The content of this post is based on the latest open-source releases of the reviewed formats at the time of writing: Apache Hudi v0.13.0, Apache Iceberg 1.2.0, and Delta Lake 2.3.0.
Data lakes offer one of the best options for cost, scalability, and flexibility to store data, allowing you to retain large volumes of structured and unstructured data at a low cost, and to use this data for different types of analytics workloads—from business intelligence reporting to big data processing, real-time analytics, and ML—to help guide better decisions.
Despite these capabilities, data lakes are not databases, and object storage does not provide support for ACID processing semantics, which you may require to effectively optimize and manage your data at scale across hundreds or thousands of users using a multitude of different technologies. For example:
Performing efficient record-level updates and deletes as data changes in your business
Managing query performance as tables grow to millions of files and hundreds of thousands of partitions
Ensuring data consistency across multiple concurrent writers and readers
Preventing data corruption from write operations failing partway through
Evolving table schemas over time without (partially) rewriting datasets
These challenges have become particularly prevalent in use cases such as CDC (change data capture) from relational database sources, privacy regulations requiring deletion of data, and streaming data ingestion, which can result in many small files. Typical data lake file formats such as CSV, JSON, Parquet, or Orc only allow for writes of entire files, making the aforementioned requirements hard to implement, time consuming, and costly.
To help overcome these challenges, open table formats provide additional database-like functionality that simplifies the optimization and management overhead of data lakes, while still supporting storage on cost-effective systems like Amazon Simple Storage Service (Amazon S3). These features include:
ACID transactions – Allowing a write to completely succeed or be rolled back in its entirety
Record-level operations – Allowing for single rows to be inserted, updated, or deleted
Indexes – Improving performance in addition to data lake techniques like partitioning
Concurrency control – Allowing for multiple processes to read and write the same data at the same time
Schema evolution – Allowing for columns of a table to be added or modified over the life of a table
Time travel – Enabling you to query data as of a point in time in the past
In general, open table formats implement these features by storing multiple versions of a single record across many underlying files, and use a tracking and indexing mechanism that allows an analytics engine to see or modify the correct version of the records they are accessing. When records are updated or deleted, the changed information is stored in new files, and the files for a given record are retrieved during an operation, which is then reconciled by the open table format software. This is a powerful architecture that is used in many transactional systems, but in data lakes, this can have some side effects that have to be addressed to help you align with performance and compliance requirements. For instance, when data is deleted from an open table format, in some cases only a delete marker is stored, with the original data retained until a compaction or vacuum operation is performed, which performs a hard deletion. For updates, previous versions of the old values of a record may be retained until a similar process is run. This can mean that data that should be deleted isn’t, or that you store a significantly larger number of files than you intend to, increasing storage cost and slowing down read performance. Regular compaction and vacuuming must be run, either as part of the way the open table format works, or separately as a maintenance procedure.
The three most common and prevalent open table formats are Apache Hudi, Apache Iceberg, and Delta Lake. AWS supports all three of these open table formats, and in this post, we review the features and capabilities of each, how they can be used to implement the most common transactional data lake use cases, and which features and capabilities are available in AWS’s analytics services. Innovation around these table formats is happening at an extremely rapid pace, and there are likely preview or beta features available in these file formats that aren’t covered here. All due care has been taken to provide the correct information as of time of writing, but we also expect this information to change quickly, and we’ll update this post frequently to contain the most accurate information. Also, this post focuses only on the open-source versions of the covered table formats, and doesn’t speak to extensions or proprietary features available from individual third-party vendors.
How to use this post
We encourage you to use the high-level guidance in this post with the mapping of functional fit and supported integrations for your use cases. Combine both aspects to identify what table format is likely a good fit for a specific use case, and then prioritize your proof of concept efforts accordingly. Most organizations have a variety of workloads that can benefit from an open table format, but today no single table format is a “one size fits all.” You may wish to select a specific open table format on a case-by-case basis to get the best performance and features for your requirements, or you may wish to standardize on a single format and understand the trade-offs that you may encounter as your use cases evolve.
This post doesn’t promote a single table format for any given use case. The functional evaluations are only intended to help speed up your decision-making process by highlighting key features and attention points for each table format with each use case. It is crucial that you perform testing to ensure that a table format meets your specific use case requirements.
This post is not intended to provide detailed technical guidance (e.g. best practices) or benchmarking of each of the specific file formats, which are available in AWS Technical Guides and benchmarks from the open-source community respectively.
Choosing an open table format
When choosing an open table format for your data lake, we believe that there are two critical aspects that should be evaluated:
Functional fit – Does the table format offer the features required to efficiently implement your use case with the required performance? Although they all offer common features, each table format has a different underlying technical design and may support unique features. Each format can handle a range of use cases, but they also offer specific advantages or trade-offs, and may be more efficient in certain scenarios as a result of its design.
Supported integrations – Does the table format integrate seamlessly with your data environment? When evaluating a table format, it’s important to consider supported engine integrations on dimensions such as support for reads/writes, data catalog integration, supported access control tools, and so on that you have in your organization. This applies to both integration with AWS services and with third-party tools.
General features and considerations
The following table summarizes general features and considerations for each file format that you may want to take into account, regardless of your use case. In addition to this, it is also important to take into account other aspects such as the complexity of the table format and in-house skills.
Extensive configuration options for customizing read/write behavior (such as index type or merge logic) and automatically performed maintenance and optimizations (such as file sizing, compaction, and cleaning)
Medium configurability:
Configuration options for basic read/write behavior (Merge On Read or Copy On Write operation modes)
Savepoints allow you to restore tables to a previous version without having to retain the entire history of files
Iceberg supports S3 Access Points in Spark, allowing you to implement failover across AWS Regions using a combination of S3 access points, S3 cross-Region replication, and the Iceberg Register Table API
Shallow clones allow you to efficiently run tests or experiments on Delta tables in production, without creating copies of the dataset or affecting the original table.
* For table format support in third-party tools, consult the official documentation for the respective tool. † Amazon Redshift only supports Delta Symlink tables (see Creating external tables for data managed in Delta Lake for more information). ‡ Refer to Working with other AWS services in the Lake Formation documentation for an overview of table format support when using Lake Formation with other AWS services.
Functional fit for common use cases
Now let’s dive deep into specific use cases to understand the capabilities of each open table format.
Getting data into your data lake
In this section, we discuss the capabilities of each open table format for streaming ingestion, batch load and change data capture (CDC) use cases.
Streaming ingestion
Streaming ingestion allows you to write changes from a queue, topic, or stream into your data lake. Although your specific requirements may vary based on the type of use case, streaming data ingestion typically requires the following features:
Low-latency writes – Supporting record-level inserts, updates, and deletes, for example to support late-arriving data
File size management – Enabling you to create files that are sized for optimal read performance (rather than creating one or more files per streaming batch, which can result in millions of tiny files)
Support for concurrent readers and writers – Including schema changes and table maintenance
Automatic table management services – Enabling you to maintain consistent read performance
In this section, we talk about streaming ingestion where records are just inserted into files, and you aren’t trying to update or delete previous records based on changes. A typical example of this is time series data (for example sensor readings), where each event is added as a new record to the dataset. The following table summarizes the features.
.
Apache Hudi
Apache Iceberg
Delta Lake
Functional fit
Hudi supports append-only streaming using an insert operation providing fast writes.
Hudi’s default configurations are tailored for upserts, and need to be tuned for append-only streaming workloads. For example, Hudi’s automatic file sizing in the writer minimizes operational effort/complexity required to maintain read performance over time, but can add a performance overhead at write time. If write speed is of critical importance, it can be beneficial to turn off Hudi’s file sizing, write new data files for each batch (or micro-batch), then run clustering later to create better sized files for read performance (using a similar approach as Iceberg or Delta).
Iceberg doesn’t optimize file sizes or run automatic table services (for example, compaction or clustering) when writing, so streaming ingestion will create many small data and metadata files. Frequent table maintenance needs to be performed to prevent read performance from degrading over time.
Delta doesn’t optimize file sizes or run automatic table services (for example, compaction or clustering) when writing, so streaming ingestion will create many small data and metadata files. Frequent table maintenance needs to be performed to prevent read performance from degrading over time.
Good functional fit for all append-only streaming when configuration tuning for append-only workloads is acceptable.
Good fit for append-only streaming with larger micro-batch windows, and when operational overhead of table management is acceptable.
Good fit for append-only streaming with larger micro-batch windows, and when operational overhead of table management is acceptable.
When streaming data with updates and deletes into a data lake, a key priority is to have fast upserts and deletes by being able to efficiently identify impacted files to be updated.
.
Apache Hudi
Apache Iceberg
Delta Lake
Functional fit
Merge On Read table type manages both read and write performance.
Indexes are used to perform fast upserts, with several different index types that can be chosen based on workload patterns to obtain optimal performance.
Offers different query types, allowing to prioritize data freshness (Snapshot Query) or read performance (Read Optimized Query).
Iceberg offers a Merge On Read strategy to enable fast writes.
Streaming upserts into Iceberg tables are natively supported with Flink, and Spark can implement streaming ingestion with updates and deletes using a micro-batch approach with MERGE INTO.
Using column statistics, Iceberg offers efficient updates on tables that are sorted on a “key” column.
Streaming ingestion with updates and deletes into OSS Delta Lake tables can be implemented using a micro-batch approach with MERGE INTO.
Using data skipping with column statistics, Delta offers efficient updates on tables that are sorted on a “key” column.
Considerations
Hudi’s automatic optimizations in the writer (for example, file sizing) add performance overhead at write time.
Reading from Merge On Read tables is generally slower than Copy On Write tables due to log files. Frequent compaction can be used to optimize read performance.
Iceberg uses a MERGE INTO approach (a join) for upserting data. This is more resource intensive and less performant for streaming data ingestion with frequent commits on (large unsorted) tables, because full table or partition scans would be performed on unsorted tables.
Iceberg does not optimize file sizes or run automatic table services (for example, compaction) when writing, so streaming ingestion will create many small data and metadata files. Frequent table maintenance needs to be performed to prevent read performance from degrading over time.
Reading from tables using the Merge On Read approach is generally slower than tables using only the Copy On Write approach due to delete files. Frequent compaction can be used to optimize read performance.
Iceberg Merge On Read currently does not support dynamic file pruning using its column statistics during merges and updates. This has impact on write performance, resulting in full table joins.
Delta uses a Copy On Write strategy that is not optimized for fast (streaming) writes, as it rewrites entire files for record updates.
Delta uses a MERGE INTO approach (a join). This is more resource intensive (less performant) and not suited for streaming data ingestion with frequent commits on large unsorted tables, because full table or partition scans would be performed on unsorted tables.
No auto file sizing is performed; separate table management processes are required (which can impact writes).
Good fit for lower-latency streaming with updates and deletes thanks to native support for streaming upserts, indexes for upserts, and automatic file sizing and compaction.
Good fit for streaming with larger micro-batch windows and when the operational overhead of table management is acceptable.
Can be used for streaming data ingestion with updates/deletes if latency is not a concern, because a Copy-On-Write strategy may not deliver the write performance required by low latency streaming use cases.
Change data capture
Change data capture (CDC) refers to the process of identifying and capturing changes made to data in a database and then delivering those changes in real time to a downstream process or system—in this case, delivering CDC data from databases into Amazon S3.
In addition to the aforementioned general streaming requirements, the following are key requirements for efficient CDC processing:
Efficient record-level updates and deletes – With the ability to efficiently identify files to be modified (which is important to support late-arriving data).
Native support for CDC – With the following options:
CDC record support in the table format – The table format understands how to process CDC-generated records and no custom preprocessing is required for writing CDC records to the table.
CDC tools natively supporting the table format – CDC tools understand how to process CDC-generated records and apply them to the target tables. In this case, the CDC engine writes to the target table without another engine in between.
Without support for the two CDC options, processing and applying CDC records correctly into a target table will require custom code. With a CDC engine, each tool likely has its own CDC record format (or payload). For example, Debezium and AWS Database Migration Service (AWS DMS) each have their own specific record formats, and need to be transformed differently. This must be considered when you are operating CDC at scale across many tables.
All three table formats allow you to implement CDC from a source database into a target table. The difference for CDC with each format lies mainly in the ease of implementing CDC pipelines and supported integrations.
.
Apache Hudi
Apache Iceberg
Delta Lake
Functional fit
Hudi’s DeltaStreamer utility provides a no-code/low-code option to efficiently ingest CDC records from different sources into Hudi tables.
Upserts using indexes allow you to quickly identify the target files for updates, without having to perform a full table join.
Unique record keys and deduplication natively enforce source databases’ primary keys and prevent duplicates in the data lake.
Native support (through record payload formats) is offered for CDC formats like AWS DMS and Debezium, eliminating the need to write custom CDC preprocessing logic in the writer application to correctly interpret and apply CDC records to the target table. Writing CDC records to Hudi tables is as simple as writing any other records to a Hudi table.
Partial updates are supported, so the CDC payload format does not need to include all record columns.
Flink CDC is the most convenient way to set up CDC from downstream data sources into Iceberg tables. It supports upsert mode and can interpret CDC formats such as Debezium natively.
Using column statistics, Iceberg offers efficient updates on tables that are sorted on a “key” column.
CDC into Delta tables can be implemented using third-party tools or using Spark with custom processing logic.
Using data skipping with column statistics, Delta offers efficient updates on tables that are sorted on a “key” column.
Considerations
Natively supported payload formats can be found in the Hudi code repo. For other formats, consider creating a custom payload or adding custom logic to the writer application to correctly process and apply CDC records of that format to target Hudi tables.
Iceberg uses a MERGE INTO approach (a join) for upserting data. This is more resource intensive and less performant, particularly on large unsorted tables where a MERGE INTO operation could require a full table scan.
Regular compaction should be implemented to maintain sort order over time in order to prevent MERGE INTO performance degrading.
Iceberg has no native support for CDC payload formats (for example, AWS DMS or Debezium). When using other engines than Flink CDC (such as Spark), custom logic needs to be added to the writer application in order to correctly process and apply CDC records to target Iceberg tables (for example, deduplication or ordering based on operation).
Deduplication to enforce primary key constraints needs to be handled in the Iceberg writer application.
No support for out of order records handling.
Delta does not use indexes for upserts, but uses a MERGE INTO approach instead (a join). This is more resource intensive and less performant on large unsorted tables because those would require full table or partition scans.
Regular clustering should be implemented to maintain sort order over time in order to prevent MERGE INTO performance degrading.
Delta Lake has no native support for CDC payload formats (for example, AWS DMS or Debezium). When using Spark for ingestion, custom logic needs to be added to the writer application in order to correctly process and apply CDC records to target Delta tables (for example, deduplication or ordering based on operation).
Record updates on unsorted Delta tables results in full table or partition scans
No support for out of order records handling.
Natively supported CDC formats
AWS DMS
Debezium
None
None
CDC tool integrations
DeltaStreamer
Flink CDC
Debezium
Flink CDC
Debezium
Debezium
Conclusion
All three formats can implement CDC workloads. Apache Hudi offers the best overall technical fit for CDC workloads as well as the most options for efficient CDC pipeline design: no-code/low-code with DeltaStreamer, third-party CDC tools offering native Hudi integration, or a Spark/Flink engine using CDC record payloads offered in Hudi.
Batch loads
If your use case requires only periodic writes but frequent reads, you may want to use batch loads and optimize for read performance.
Batch loading data with updates and deletes is perhaps the simplest use case to implement with any of the three table formats. Batch loads typically don’t require low latency, allowing them to benefit from the operational simplicity of a Copy On Write strategy. With Copy On Write, data files are rewritten to apply updates and add new records, minimizing the complexity of having to run compaction or optimization table services on the table.
.
Apache Hudi
Apache Iceberg
Delta Lake
Functional fit
Copy On Write is supported.
Automatic file sizing while writing is supported, including optimizing previously written small files by adding new records to them.
Multiple index types are provided to optimize update performance for different workload patterns.
Copy On Write is supported.
File size management is performed within each incoming data batch (but it is not possible to optimize previously written data files by adding new records to them).
Copy On Write is supported.
File size can be indirectly managed within each data batch by setting the max number of records per file (but it is not possible to optimize previously written data files by adding new records to them).
Considerations
Configuring Hudi according to your workload pattern is imperative for good performance (see Apache Hudi on AWS for guidance).
Data deduplication needs to be handled in the writer application.
If a single data batch does not contain sufficient data to reach a target file size, compaction can be performed to merge smaller files together afterwards.
Ensuring data is sorted on a “key” column is imperative for good update performance. Regular sorting compaction should be considered to maintain sorted data over time.
Data deduplication needs to be handled in the writer application.
If a single data batch does not contain sufficient data to reach a target file size, compaction can be performed to merge smaller files together afterwards.
Ensuring data is sorted on a “key” column is imperative for good update performance. Regular clustering should be considered to maintain sorted data over time.
Supported AWS integrations
Amazon EMR (Spark)
AWS Glue (Spark)
Amazon EMR (Spark, Presto, Trino, Hive)
AWS Glue (Spark)
Amazon Athena (SQL)
Amazon EMR (Spark, Trino)
AWS Glue (Spark)
Conclusion
All three formats are well suited for batch loads. Apache Hudi supports the most configuration options and may increase the effort to get started, but provides lower operational effort due to automatic table management. On the other hand, Iceberg and Delta are simpler to get started with, but require some operational overhead for table maintenance.
Working with open table formats
In this section, we discuss the capabilities of each open table format for common use cases when working with open table formats: optimizing read performance, incremental data processing and processing deletes to comply with privacy regulations.
Optimizing read performance
The preceding sections primarily focused on write performance for specific use cases. Now let’s explore how each open table format can support optimal read performance. Although there are some cases where data is optimized purely for writes, read performance is typically a very important dimension on which you should evaluate an open table format.
Open table format features that improve query performance include the following:
Indexes, (column) statistics, and other metadata – Improves query planning and file pruning, resulting in reduced data scanned
Data colocation (through clustering) according to query patterns – Reduces the amount of data scanned by queries
.
Apache Hudi
Apache Iceberg
Delta Lake
Functional fit
Auto file sizing when writing results in good file sizes for read performance. On Merge On Read tables, automatic compaction and clustering improves read performance.
Metadata tables eliminate slow S3 file listing operations. Column statistics in the metadata table can be used for better file pruning in query planning (data skipping feature).
Clustering data for better data colocation with hierarchical sorting or z-ordering.
Hidden partitioning prevents unintentional full table scans by users, without requiring them to specify partition columns explicitly.
Column and partition statistics in manifest files speed up query planning and file pruning, and eliminate S3 file listing operations.
Clustering data for better data colocation with hierarchical sorting or z-ordering.
File size can be indirectly managed within each data batch by setting the max number of records per file (but not optimizing previously written data files by adding new records to existing files).
Clustering data for better data colocation using z-ordering.
Considerations
Data skipping using metadata column stats has to be supported in the query engine (currently only in Apache Spark).
Snapshot queries on Merge On Read tables have higher query latencies than on Copy On Write tables. This latency impact can be reduced by increasing the compaction frequency.
Separate table maintenance needs to be performed to maintain read performance over time.
Reading from tables using a Merge On Read approach is generally slower than tables using only a Copy On Write approach due to delete files. Frequent compaction can be used to optimize read performance.
Currently, only Apache Spark can use data skipping.
Separate table maintenance needs to be performed to maintain read performance over time.
Optimization & Maintenance Processes
Compaction of log files in Merge On Read tables can be run as part of the writing application or as a separate job using Spark on Amazon EMR or AWS Glue. Compaction does not interfere with other jobs or queries.
Clustering runs as part of the writing application or in a separate job using Spark on Amazon EMR or AWS Glue because clustering can interfere with other transactions.
For achieving good read performance, it’s important that your query engine supports the optimization features offered by the table formats. When using Spark, all three formats provide good read performance when properly configured. When using Trino (and therefore Athena as well), Iceberg will likely provide better query performance because the data skipping feature of Hudi and Delta is not supported in the Trino engine. Make sure to evaluate this feature support for your query engine of choice.
Incremental processing of data on the data lake
At a high level, incremental data processing is the movement of new or fresh data from a source to a destination. To implement incremental extract, transform, and load (ETL) workloads efficiently, we need to be able to retrieve only the data records that have been changed or added since a certain point in time (incrementally) so we don’t need to reprocess unnecessary data (such as entire partitions). When your data source is an open table format table, we can take advantage of incremental queries to facilitate more efficient reads in these table formats.
.
Apache Hudi
Apache Iceberg
Delta Lake
Functional fit
Full incremental pipelines can be built using Hudi’s incremental queries, which capture record-level changes on a Hudi table (including updates and deletes) without the need to store and manage change data records.
Iceberg incremental queries can only read new records (no updates) from upstream Iceberg tables and replicate to downstream tables.
Incremental pipelines with record-level changes (including updates and deletes) can be implemented using the changelog view procedure.
Full incremental pipelines can be built using Delta’s Change Data Feed (CDF) feature, which captures record-level changes (including updates and deletes) using change data records.
Considerations
ETL engine used needs to support Hudi’s incremental query type.
A view has to be created to incrementally read data between two table snapshots containing updates and deletes.
A new view has to be created (or recreated) for reading changes from new snapshots.
Record-level changes can only be captured from the moment CDF is turned on.
CDF stores change data records on storage, so a storage overhead is incurred and lifecycle management and cleaning of change data records is required.
Best functional fit for incremental ETL pipelines using a variety of engines, without any storage overhead.
Good fit for implementing incremental pipelines using Spark if the overhead of creating views is acceptable.
Good fit for implementing incremental pipelines using Spark if the additional storage overhead is acceptable.
Processing deletes to comply with privacy regulations
Due to privacy regulations like the General Data Protection Regulation (GDPR) and California Consumer Privacy Act (CCPA), companies across many industries need to perform record-level deletes on their data lake for “right to be forgotten” or to correctly store changes to consent on how their customers’ data can be used.
The ability to perform record-level deletes without rewriting entire (or large parts of) datasets is the main requirement for this use case. For compliance regulations, it’s important to perform hard deletes (deleting records from the table and physically removing them from Amazon S3).
.
Apache Hudi
Apache Iceberg
Delta Lake
Functional fit
Hard deletes are performed by Hudi’s automatic cleaner service.
Hard deletes can be implemented as a separate process.
Hard deletes can be implemented as a separate process.
Considerations
Hudi cleaner needs to be configured according to compliance requirements to automatically remove older file versions in time (within a compliance window), otherwise time travel or rollback operations could recover deleted records.
Previous snapshots need to be (manually) expired after the delete operation, otherwise time travel operations could recover deleted records.
The vacuum operation needs to be run after the delete, otherwise time travel operations could recover deleted records.
Conclusion
This use case can be implemented using all three formats, and in each case, you must ensure that your configuration or background pipelines implement the cleanup procedures required to meet your data retention requirements.
Conclusion
Today, no single table format is the best fit for all use cases, and each format has its own unique strengths for specific requirements. It’s important to determine which requirements and use cases are most crucial and select the table format that best meets those needs.
To speed up the selection process of the right table format for your workload, we recommend the following actions:
Identify what table format is likely a good fit for your workload using the high-level guidance provided in this post
Perform a proof of concept with the identified table format from the previous step to validate its fit for your specific workload and requirements
Keep in mind that these open table formats are open source and rapidly evolve with new features and enhanced or new integrations, so it can be valuable to also take into consideration product roadmaps when deciding on the format for your workloads.
AWS will continue to innovate on behalf of our customers to support these powerful file formats and to help you be successful with your advanced use cases for analytics in the cloud. For more support on building transactional data lakes on AWS, get in touch with your AWS Account Team, AWS Support, or review the following resources:
Shana Schipers is an Analytics Specialist Solutions Architect at AWS, focusing on big data. She supports customers worldwide in building transactional data lakes using open table formats like Apache Hudi, Apache Iceberg and Delta Lake on AWS.
Ian Meyers is a Director of Product Management for AWS Analytics Services. He works with many of AWS largest customers on emerging technology needs, and leads several data and analytics initiatives within AWS including support for Data Mesh.
Carlos Rodrigues is a Big Data Specialist Solutions Architect at AWS. He helps customers worldwide building transactional data lakes on AWS using open table formats like Apache Hudi and Apache Iceberg.
Rapid7 is very excited to announce version 0.6.9 of Velociraptor is now LIVE and available for download. Much of what went into this release was about expanding capabilities and improving workflows.
We’ll now explore some of the interesting new features in detail.
GUI Improvements
The GUI was updated in this release to improve user workflow and accessibility.
Table Filtering and Sorting Previously, table filtering and sorting required a separate dialog. In this release, the filtering controls were moved to the header of each column making it more natural to use.
Filtering tables
VFS GUI Improvements
The VFS GUI allows the user to collect files from the endpoint in a familiar tree-based user interface. In previous versions, it was only possible to schedule a single download at a time. This proved problematic when the client was offline or transferring a large file, because the user had no way to kick off the next download until the first file was fully fetched.
In this release, the GUI was revamped to support multiple file downloads at the same time. Additionally it is now possible to schedule a file download by right clicking the download column in the file table and selecting “Download from client”.
Initiating file download in the VFS. Note multiple files can be scheduled at the same time, and the bottom details pane can be closed
Hex Viewer and File Previewer GUI
In release 0.6.9, a new hex viewer was introduced. This viewer makes it possible to quickly triage uploaded files from the GUI itself, implementing some common features:
The file can be viewed as a hex dump or a strings-style output.
The viewer can go to an arbitrary offset within the file, or page forward or backwards.
The viewer can search forward or backwards in the file for a Regular Expression, String, or a Hex String.The hex viewer is available for artifacts that define a column of type preview_uploads including the File Upload table within the flow GUI.
The hex viewer UI can be used to quickly inspect an uploaded file
Artifact Pack Import GUI Improvements
Velociraptor allows uploading an artifact pack – a simple Zip file containing artifact definitions. For example, the artifact exchange is simply a zip file with artifact definitions.
Previously, artifact packs could only be uploaded in their entirety and always had an “Exchange” prefix prepended. However, in this release the GUI was revamped to allow only some artifacts to be imported from the pack and to customize the prefix.
It is now possible to import specific artifacts in a pack
Direct SMB Support
Windows file sharing is implemented over the SMB protocol. Within the OS, accessing remote file shares happens transparently, for example by mapping the remote share to a drive using the net use command or accessing a file name starting with a UNC path (e.g. \\ServerName\Share\File.exe).
While Velociraptor can technically also access UNC shares by using the usual file APIs and providing a UNC path, in reality this does not work because Velociraptor is running as the local System user. The system user normally does not have network credentials, so it can not map remote shares.
This limitation is problematic, because sometimes we need to access remote shares (e.g. to verify hashes, perform YARA scans etc). Until this release, the only workaround for this limitation was to install the Velociraptor user as a domain user account with credentials.
As of the 0.6.9 release, SMB is supported directly within the Velociraptor binary as an accessor. This means that all plugins that normally operate on files can also operate on a remote SMB share transparently.
Velociraptor does not rely on the OS to provide credentials to the remote share, instead credentials can be passed directly to the smb accessor to access the relevant smb server.
The new accessor can be used in any VQL that needs to use a file, but to make it easier there is a new artifact called Windows.Search.SMBFileFinder that allows for flexible file searches on an SMB share.
Searching a remote SMB share
Using SMB For Distributing Tools
Velociraptor can manage third-party tools within its collected artifacts by instructing the endpoint to download the tool from an external server or the velociraptor server itself.
It is sometimes convenient to download external tools from an external server (e.g. a cloud bucket) due to bandwidth considerations.
Previously, this server could only be a HTTP server, but in many deployments it is actually simpler to download external tools from an SMB share.
In this release, Velociraptor accepts an SMB URL as the Serve URL parameter within the tool configuration screen.
You can configure the remote share with read-only permissions (read these instructions for more details on configuring SMB).
Serving a third-party tool from an SMB server
The Offline Collector
The offline collector is a popular mode of running Velociraptor. In this mode, the artifacts to collect are pre-programmed into the collector, which stores the results in a zip file. The offline collector can be pre-configured to encrypt and upload the collection automatically to a remote server without user interaction, making it ideal for using remote agents or people to manually run the collector without needing further training.
In this release, the Velociraptor offline collector adds two more upload targets. It is now possible to upload to an SMB server and to Azure Blob Storage.
SMB Server Uploads Because the offline collector is typically used to collect large volumes of data, it is beneficial to upload the data to a networked server close to the collected machine. This avoids cloud network costs and bandwidth limitations. It works very well in air gapped networks, as well.
You can now simply create a new share on any machine, by adding a local Windows user with password credentials, exporting a directory as a share, and adjusting the upload user’s permissions to only be able to write on the share and not read from it. It is now safe to embed these credentials in the offline collector, which can upload data but cannot read or delete other data.
Azure Blob Storage Service Velociraptor can now upload collections to an Amazon S3 or Google Cloud Storage bucket. Many users requested direct support for Azure blob storage, which is now in 0.6.9.
Read about how to configure Azure for safe uploads. Similar to the other methods, credentials embedded in the offline collector can only be used to upload data and not read or delete data in the storage account.
Debugging VQL Queries
One of the points of feedback we received from our annual user survey was that although VQL is an extremely powerful language, users struggle with debugging and understanding how the query proceeds.
Unlike a more traditional programming language (e.g. Python), there is no debugger that allows users to pause execution and inspect variables, or add print statements to see what data is passed between parts of the query.
We took this feedback to heart and in release 0.6.9 the EXPLAIN keyword was introduced. The EXPLAIN keyword can be added before any SELECT in the VQL statement to place that SELECT statement into tracing mode.
As a recap, the general syntax of the VQL statement is:
SELECT vql_fun(X=1, Y=2), Foo, Bar
FROM plugin(A=1, B=2)
WHERE X = 1
When a query is in tracing mode:
All rows emitted from the plugin are logged with their types
All parameters into any function are also logged
When a row is filtered because it did not pass the WHERE clause this is also logged
This additional tracing information can be used to understand how data flows throughout the query.
Explaining a query reveals details information on how the VQL engine handles data flows
You can use the EXPLAIN statement in a notebook or within an artifact as collected from the endpoint (although be aware that it can lead to extremely verbose logging).
Inspect the details by clicking on the logs button
For example in the above query we can see:
The clients() plugin generates a row
The timestamp() function received the last_seen_at value
The WHERE condition rejected the row because the last_seen_at time was more than 60 seconds ago
Locking Down The Server
Another concern raised in our survey was the perceived risk of having Velociraptor permanently installed due to its high privilege and efficient scaling.
While this risk is not higher than any other domain-wide administration tool, in some deployment scenarios, Velociraptor does not need this level of access all the time. While in an incident response situation, however, it is necessary to promote Velociraptor’s level of access easily.
In the 0.6.9 release, Velociraptor has introduced lock down mode. When a server is locked down certain permissions are removed (even from administrators). The lockdown is set in the config file, helping to mitigate the risk of a Velociraptor server admin account compromise.
After initial deployment and configuration, the administrator can set the server in lockdown by adding the following configuration directive to the server.config.yaml and restarting the server:
lockdown: true
After the server is restarted the following permissions will be denied:
ARTIFACT_WRITER
SERVER_ARTIFACT_WRITER
COLLECT_CLIENT
COLLECT_SERVER
EXECVE
SERVER_ADMIN
FILESYSTEM_WRITE
FILESYSTEM_READ
MACHINE_STATE
Therefore it will still be possible to read existing collections, and continue collecting client monitoring data, but it will not be possible to edit artifacts or start new hunts or collections.
During an active IR, the server may be taken out of lockdown by removing the directive from the configuration file and restarting the service. Usually, the configuration file is only writable by root and the Velociraptor server process is running as a low privilege account that can not write to the config file. This combination makes it difficult for a compromised Velociraptor administrator account to remove the lockdown and use Velociraptor as a lateral movement vehicle.
Audit Events
Velociraptor maintains a number of log files over its operation, normally stored in the <filestore>/logs directory. While the logs are rotated and separated into different levels, the most important log type is the audit log which records auditable events. Within Velociraptor auditable events are security critical events such as:
Starting a new collection from a client
Creating a new hunt
Modifying an artifact
Updating the client monitoring configuration
Previous versions of Velociraptor simply wrote those events to the logging directory. However, the logging directory can be deleted if the server becomes compromised.
In 0.6.9 there are two ways to forward auditable events off the server
Uploading to external log management systems e.g. Opensearch/Elastic using the Elastic.Events.Upload artifact.Additionally, auditable events are now emitted as part of the Server.Audit.Logs artifact so they can be viewed or searched in the GUI by any user.
The server’s audit log is linked from the Welcome pageInspecting user activity through the audit log
Because audit events are available now as part of the server monitoring artifact, it is possible for users to develop custom VQL server monitoring artifacts to forward or respond to auditable events just like any other event on the client or the server. This makes it possible to forward events (e.g. to Slack or Discord) as demonstrated by the `Elastic.Events.Upload` artifact above.
Tool Definitions Can Now Specify An Expected Hash
Velociraptor supports pushing tools to external endpoints. A Velociraptor artifact can define an external tool, allowing the server to automatically fetch the tool and upload it to the endpoint.
Previously, the artifact could only specify the URL where the tool should be downloaded from. However, in this release, it is also possible to declare the expected hash of the tool. This prevents potential substitution attacks effectively by pinning the third-party binary hash.
While sometimes the upstream file may legitimately change (e.g. due to a patch), Velociraptor will not automatically accept the new file when the hash does not match the expected hash.
Mismatched hash
In the above example we modified the expected hash to be slightly different from the real tool hash. Velociraptor refuses to import the binary but provides a button allowing the user to accept this new hash instead. This should only be performed if the administrator is convinced the tool hash was legitimately updated.
Conclusions
There are many more new features and bug fixes in the 0.6.9 release. If you’re interested in any of these new features, we welcome you to take Velociraptor for a spin by downloading it from our release page. It’s available for free on GitHub under an open-source license.
As always, please file bugs on the GitHub issue tracker or submit questions to our mailing list by emailing [email protected]. You can also chat with us directly on our Discord server.
Learn more about Velociraptor by visiting any of our web and social media channels below:
If you want to master Velociraptor, consider joining us at a week-long Velociraptor training course held this year at the BlackHat USA 2023 Conference and delivered by the Velociraptor developers themselves.Details are here: https://docs.velociraptor.app/announcements/2023-trainings/
In February, Meta released its large language model: LLaMA. Unlike OpenAI and its ChatGPT, Meta didn’t just give the world a chat window to play with. Instead, it released the code into the open-source community, and shortly thereafter the model itself was leaked. Researchers and programmers immediately started modifying it, improving it, and getting it to do things no one else anticipated. And their results have been immediate, innovative, and an indication of how the future of this technology is going to play out. Training speeds have hugely increased, and the size of the models themselves has shrunk to the point that you can create and run them on a laptop. The world of AI research has dramatically changed.
This development hasn’t made the same splash as other corporate announcements, but its effects will be much greater. It will wrest power from the large tech corporations, resulting in both much more innovation and a much more challenging regulatory landscape. The large corporations that had controlled these models warn that this free-for-all will lead to potentially dangerous developments, and problematic uses of the open technology have already been documented. But those who are working on the open models counter that a more democratic research environment is better than having this powerful technology controlled by a small number of corporations.
The power shift comes from simplification. The LLMs built by OpenAI and Google rely on massive data sets, measured in the tens of billions of bytes, computed on by tens of thousands of powerful specialized processors producing models with billions of parameters. The received wisdom is that bigger data, bigger processing, and larger parameter sets were all needed to make a better model. Producing such a model requires the resources of a corporation with the money and computing power of a Google or Microsoft or Meta.
But building on public models like Meta’s LLaMa, the open-source community has innovated in ways that allow results nearly as good as the huge models—but run on home machines with common data sets. What was once the reserve of the resource-rich has become a playground for anyone with curiosity, coding skills, and a good laptop. Bigger may be better, but the open-source community is showing that smaller is often good enough. This opens the door to more efficient, accessible, and resource-friendly LLMs.
More importantly, these smaller and faster LLMs are much more accessible and easier to experiment with. Rather than needing tens of thousands of machines and millions of dollars to train a new model, an existing model can now be customized on a mid-priced laptop in a few hours. This fosters rapid innovation.
It also takes control away from large companies like Google and OpenAI. By providing access to the underlying code and encouraging collaboration, open-source initiatives empower a diverse range of developers, researchers, and organizations to shape the technology. This diversification of control helps prevent undue influence, and ensures that the development and deployment of AI technologies align with a broader set of values and priorities. Much of the modern internet was built on open-source technologies from the LAMP (Linux, Apache, mySQL, and PHP/PERL/Python) stack—a suite of applications often used in web development. This enabled sophisticated websites to be easily constructed, all with open-source tools that were built by enthusiasts, not companies looking for profit. Facebook itself was originally built using open-source PHP.
But being open-source also means that there is no one to hold responsible for misuse of the technology. When vulnerabilities are discovered in obscure bits of open-source technology critical to the functioning of the internet, often there is no entity responsible for fixing the bug. Open-source communities span countries and cultures, making it difficult to ensure that any country’s laws will be respected by the community. And having the technology open-sourced means that those who wish to use it for unintended, illegal, or nefarious purposes have the same access to the technology as anyone else.
This, in turn, has significant implications for those who are looking to regulate this new and powerful technology. Now that the open-source community is remixing LLMs, it’s no longer possible to regulate the technology by dictating what research and development can be done; there are simply too many researchers doing too many different things in too many different countries. The only governance mechanism available to governments now is to regulate usage (and only for those who pay attention to the law), or to offer incentives to those (including startups, individuals, and small companies) who are now the drivers of innovation in the arena. Incentives for these communities could take the form of rewards for the production of particular uses of the technology, or hackathons to develop particularly useful applications. Sticks are hard to use—instead, we need appealing carrots.
It is important to remember that the open-source community is not always motivated by profit. The members of this community are often driven by curiosity, the desire to experiment, or the simple joys of building. While there are companies that profit from supporting software produced by open-source projects like Linux, Python, or the Apache web server, those communities are not profit driven.
And there are many open-source models to choose from. Alpaca, Cerebras-GPT, Dolly, HuggingChat, and StableLM have all been released in the past few months. Most of them are built on top of LLaMA, but some have other pedigrees. More are on their way.
The large tech monopolies that have been developing and fielding LLMs—Google, Microsoft, and Meta—are not ready for this. A few weeks ago, a Google employee leaked a memo in which an engineer tried to explain to his superiors what an open-source LLM means for their own proprietary tech. The memo concluded that the open-source community has lapped the major corporations and has an overwhelming lead on them.
This isn’t the first time companies have ignored the power of the open-source community. Sun never understood Linux. Netscape never understood the Apache web server. Open source isn’t very good at original innovations, but once an innovation is seen and picked up, the community can be a pretty overwhelming thing. The large companies may respond by trying to retrench and pulling their models back from the open-source community.
But it’s too late. We have entered an era of LLM democratization. By showing that smaller models can be highly effective, enabling easy experimentation, diversifying control, and providing incentives that are not profit motivated, open-source initiatives are moving us into a more dynamic and inclusive AI landscape. This doesn’t mean that some of these models won’t be biased, or wrong, or used to generate disinformation or abuse. But it does mean that controlling this technology is going to take an entirely different approach than regulating the large players.
This essay was written with Jim Waldo, and previously appeared on Slate.com.
The open source Git project just released Git 2.41 with features and bug fixes from over 95 contributors, 29 of them new. We last caught up with you on the latest in Git back when 2.40 was released.
To celebrate this most recent release, here’s GitHub’s look at some of the most interesting features and changes introduced since last time.
Improved handling of unreachable objects
At the heart of every Git repository lies a set of objects. For the unfamiliar, you can learn about the intricacies of Git’s object model in this post. In general, objects are the building blocks of your repository. Blobs represent the contents of an individual file, and trees group many blobs (and other trees!) together, representing a directory. Commits tie everything together by pointing at a specific tree, representing the state of your repository at the time when the commit was written.
Git objects can be in one of two states, either “reachable” or “unreachable.” An object is reachable when you can start at some branch or tag in your repository and “walk” along history, eventually ending up at that object. Walking merely means looking at an individual object, and seeing what other objects are immediately related to it. A commit has zero or more other commits which it refers to as parents. Conversely, trees point to many blobs or other trees that make up their contents.
Objects are in the “unreachable” state when there is no branch or tag you could pick as a starting point where a walk like the one above would end up at that object. Every so often, Git decides to remove some of these unreachable objects in order to compress the size of your repository. If you’ve ever seen this message:
Auto packing the repository in background for optimum performance.
See "git help gc" for manual housekeeping.
or run git gc directly, then you have almost certainly removed unreachable objects from your repository.
But Git does not necessarily remove unreachable objects from your repository the first time git gc is run. Since removing objects from a live repository is inherently risky1, Git imposes a delay. An unreachable object won’t be eligible for deletion until it has not been written since a given (via the –prune argument) cutoff point. In other words, if you ran git gc --prune=2.weeks.ago, then:
All reachable objects will get collected together into a single pack.
Any unreachable objects which have been written in the last two weeks will be stored separately.
Any remaining unreachable objects will be discarded.
Until Git 2.37, Git kept track of the last write time of unreachable objects by storing them as loose copies of themselves, and using the object file’s mtime as a proxy for when the object was last written. However, storing unreachable objects as loose until they age out can have a number of negative side-effects. If there are many unreachable objects, they could cause your repository to balloon in size, and/or exhaust the available inodes on your system.
Git 2.37 introduced “cruft packs,” which store unreachable objects together in a packfile, and use an auxiliary *.mtimes file stored alongside the pack to keep track of object ages. By storing unreachable objects together, Git prevents inode exhaustion, and allows unreachable objects to be stored as deltas.
The figure above shows a cruft pack, along with its corresponding *.idx and *.mtimes file. Storing unreachable objects together allows Git to store your unreachable data more efficiently, without worry that it will put strain on your system’s resources.
In Git 2.41, cruft pack generation is now on by default, meaning that a normal git gc will generate a cruft pack in your repository. To learn more about cruft packs, you can check out our previous post, “Scaling Git’s garbage collection.”
Starting in Git 2.41, you may notice a new kind of file in your repository’s .git/objects/pack directory: the *.rev file.
This new file stores information similar to what’s in a packfile index. If you’ve seen a file in the pack directory above ending in *.idx, that is where the pack index is stored.
Pack indexes map between the positions of all objects in the corresponding pack among two orders. The first is name order, or the index at which you’d find a given object if you sorted those objects according to their object ID (OID). The other is pack order, or the index of a given object when sorting by its position within the packfile itself.
Git needs to translate between these two orders frequently. For example, say you want Git to print out the contents of a particular object, maybe with git cat-file -p. To do this, Git will look at all *.idx files it knows about, and use a binary search to find the position of the given object in each packfile’s name order. When it finds a match, it uses the *.idx to quickly locate the object within the packfile itself, at which point it can dump its contents.
But what about going the other way? How does Git take a position within a packfile and ask, “What object is this”? For this, it uses the reverse index, which maps objects from their pack order into the name order. True to its name, this data structure is the inverse of the packfile index mentioned above.
The figure above shows a representation of the reverse index. To discover the lexical (index) position of, say, the yellow object, Git reads the corresponding entry in the reverse index, whose value is the lexical position. In this example, the yellow object is assumed to be the fourth object in the pack, so Git reads the fourth entry in the .rev file, whose value is 1. Reading the corresponding value in the *.idx file gives us back the yellow object.
In previous versions of Git, this reverse index was built on-the-fly by storing a list of pairs (one for each object, each pair contains that object’s position in name and packfile order). This approach has a couple of drawbacks, most notably that it takes time and memory in order to materialize and store this structure.
In Git 2.31, the on-disk reverse index was introduced. It stores the same contents as above, but generates it once and stores the result on disk alongside its corresponding packfile as a *.rev file. Pre-computing and storing reverse indexes can dramatically speed-up performance in large repositories, particularly for operations like pushing, or determining the on-disk size of an object.
In Git 2.41, Git will now generate these reverse indexes by default. This means that the next time you run git gc on your repository after upgrading, you should notice things get a little faster. When testing the new default behavior, the CPU-intensive portion of a git push operation saw a 1.49x speed-up when pushing the last 30 commits in torvalds/linux. Trivial operations, like computing the size of a single object with git cat-file --batch='%(objectsize:disk)' saw an even greater speed-up of nearly 77x.
You may be familiar with Git’s credential helper mechanism, which is used to provide the required credentials when accessing repositories stored behind a credential. Credential helpers implement support for translating between Git’s credential helper protocol and a specific credential store, like Keychain.app, or libsecret. This allows users to store credentials using their preferred mechanism, by allowing Git to communicate transparently with different credential helper implementations over a common protocol.Traditionally, Git supports password-based authentication. For services that wish to authenticate with OAuth, credential helpers typically employ workarounds like passing the bearer token through basic authorization instead of authenticating directly using bearer authorization.
Credential helpers haven’t had a mechanism to understand additional information necessary to generate a credential, like OAuth scopes, which are typically passed over the WWW-Authenticate header.
In Git 2.41, the credential helper protocol is extended to support passing WWW-Authenticate headers between credential helpers and the services that they are trying to authenticate with. This can be used to allow services to support more fine-grained access to Git repositories by letting users scope their requests.
If you’ve looked at a repository’s branches page on GitHub, you may have noticed the indicators showing how many commits ahead and behind a branch is relative to the repository’s default branch. If you haven’t noticed, no problem: here’s a quick primer. A branch is “ahead” of another when it has commits that the other side doesn’t. The amount ahead it is depends on the number of unique such commits. Likewise, a branch is “behind” another when it is missing commits that are unique to the other side.
Previous versions of Git allowed this comparison by running two reachability queries: git rev-list --count main..my-feature (to count the number of commits unique to my-feature) and git rev-list --count my-feature..main (the opposite). This works fine, but involves two separate queries, which can be awkward. If comparing many branches against a common base (like on the /branches page above), Git may end up walking over the same commits many times.
In Git 2.41, you can now ask for this information directly via a new for-each-ref formatting atom, %(ahead-behind:<base>). Git will compute its output using only a single walk, making it far more efficient than in previous versions.
For example, suppose I wanted to list my unmerged topic branches along with how far ahead and behind they are relative to upstream’s mainline. Before, I would have had to write something like:
which takes more than 500 milliseconds to produce its results. Above, I first ask git for-each-ref to list all of my unmerged branches. Then, I loop over the results, computing their ahead and behind values manually, and finally format the output.
In Git 2.41, the same can be accomplished using a much simpler invocation:
That produces the same output (with far less scripting!), and performs a single walk instead of many. By contrast to earlier versions, the above takes only 28 milliseconds to produce output, a more than 17-fold improvement.
While convenient for a human to read, it can be much more difficult for a machine to parse. Git will shorten the reference names included in the update, doesn’t print the full before and after values of the reference being updated, and columnates its output, all of which make it more difficult to script around.
In Git 2.41, git fetch can now take a new --porcelain option, which changes its output to a form that is much easier to script around. In general, the --porcelain output looks like:
When invoked with --porcelain, git fetch does away with the conveniences of its default human readable output, and instead emits data that is much easier to parse. There are four fields, each separated by a single space character. This should make it much easier to script around the output of git fetch.
Speaking of git fetch, Git 2.41 has another new feature that can improve its performance: fetch.hideRefs. Before we get into it, it’s helpful to recall our previous coverage of git rev-list’s --exclude-hidden option. If you’re new around here, don’t worry: this option was originally introduced to improve the performance of Git’s connectivity check, the process that checks that an incoming push is fully connected, and doesn’t reference any objects that the remote doesn’t already have, or are included in the push itself.
Git 2.39 sped-up the connectivity check by ignoring parts of the repository that weren’t advertised to the pusher: its hidden references. Since these references weren’t advertised to the pusher, it’s unlikely that any of these objects will terminate the connectivity check, so keeping track of them is usually just extra bookkeeping.
Git 2.41 introduces a similar option for git fetch on the client side. By setting fetch.hideRefs appropriately, you can exclude parts of the references in your local repository from the connectivity check that your client performs to make sure the server didn’t send you an incomplete set of objects.
When checking the connectedness of a fetch, the search terminates at the branches and tags from any remote, not just the one you’re fetching from. If you have a large number of remotes, this can take a significant amount of time, especially on resource-constrained systems.
In Git 2.41, you can narrow the endpoints of the connectivity check to focus just on the remote you’re fetching from. (Note that transfer.hideRefs values that start with ! are interpreted as un-hiding those references, and are applied in reverse order.) If you’re fetching from a remote called $remote, you can do this like so:
The above first hides every reference from the connectivity check (fetch.hideRefs=refs) and then un-hides just the ones pertaining to that specific remote (fetch.hideRefs=!refs/remotes/$remote). On a resource constrained machine with repositories that have many remote tracking references, this takes the time to complete a no-op fetch from 20 minutes to roughly 30 seconds.
If you’ve ever been on the hunt for corruption in your repository, you are undoubtedly aware of git fsck. This tool is used to check that the objects in your repository are intact and connected. In other words, that your repository doesn’t have any corrupt or missing objects.git fsck can also check for more subtle forms of repository corruption, like malicious looking .gitattributes or .gitmodules files, along with malformed objects (like trees that are out of order, or commits with a missing author). The full suite of checks it performs can be found under the fsck. configuration.
In Git 2.41, git fsck learned how to check for corruption in reachability bitmaps and on-disk reverse indexes. These checks detect and warn about incorrect trailing checksums, which indicate that the preceding data has been mangled. When examining on-disk reverse indexes, git fsck will also check that the *.rev file holds the correct values.
The risk is based on a number of factors, most notably that a concurrent writer will write an object that is either based on or refers to an unreachable object. This can happen when receiving push whose content depends on an object that git gc is about to remove. If a new object is written which references the deleted one, the repository can become corrupt. If you’re curious to learn more, this section is a good place to start. ↩
This edition of Week in Review marks the end of the month of May. In addition, we just finished all of the in-person AWS Summits in Asia-Pacific and Japan starting from AWS Summit Sydney and AWS Summit Tokyo in April to AWS Summit ASEAN, AWS Summit Seoul, and AWS Summit Mumbai in May.
Thank you to everyone who attended our AWS Summits in APJ, especially the AWS Heroes, AWS Community Builders, and AWS User Group leaders, for your collaboration in supporting activities at AWS Summit events.
Last Week’s Launches Here are some launches that caught my attention last week:
AWS Wickr is now HIPAA eligible — AWS Wickr is an end-to-end encrypted enterprise messaging and collaboration tool that enables one-to-one and group messaging, voice and video calling, file sharing, screen sharing, and location sharing, without increasing organizational risk. With this announcement, you can now use AWS Wickr for workloads that are within the scope of HIPAA. Visit AWS Wickr to get started.
Amazon Redshift announces support for auto-commit statements in stored procedure — If you’re using stored procedures in Amazon Redshift, you now have enhanced transaction controls that enable you to automatically commit the statements inside the procedure. This new NONATOMIC mode can be used to handle exceptions inside a stored procedure. You can also use the new PL/pgSQL statement RAISE to programmatically raise the exception, which helps prevent disruptions in applications due to an error inside a stored procedure. For more information on using this feature, refer to Managing transactions.
AWS Chatbot supports access to Amazon CloudWatch dashboards and logs insights in chat channels — With this launch, you now can receive Amazon CloudWatch alarm notifications for an incident directly in your chat channel, analyze the diagnostic data from the dashboards, and remediate directly from the chat channel without switching context. Visit the AWS Chatbot page to learn more.
AWS Open Source Updates As always, my colleague Ricardo has curated the latest updates for open source news at AWS. Here are some of the highlights:
OpenEMR on AWS Fargate — OpenEMR is a popular Electronic Health and Medical Practice management solution. If you’re looking to deploy OpenEMR on AWS, then this repo will help you to get your OpenEMR up and running on AWS Fargate using Amazon ECS.
Cloud-Radar — If you’re working with AWS Cloudformation and looking for performing unit tests, then you might want to try Cloud-Radar. You can also perform functional testing with Cloud-Radar as this tool also acts a wrapper around Taskcat.
Amazon and Generative AI Using generative AI to improve extreme multilabel classification — In their research on extreme multilabel classification (XMC), Amazon scientists explored a generative approach, in which a model generates a sequence of labels for input sequences of words. The generative models with clustering consistently outperformed them. This demonstrates the effectiveness of incorporating hierarchical clustering in improving XMC performance.
Upcoming AWS Events Don’t miss upcoming AWS-led events happening soon:
Rapid7 is thrilled to announce that the 2nd annual VeloCON virtual summit will be held this September (date TBD), with times oriented to the continental USA time zones. Once again, the conference will be online and completely free!
VeloCON is a one-day event focused on the Velociraptor community. It’s a place to share experiences in using and developing Velociraptor to address the needs of the wider DFIR community and an opportunity to take a look ahead at the future of our platform.
This year’s event calls for even more of the stimulating and informative content that made last year’s VeloCON so much fun. Don’t miss your chance at being a part of this year’s marquee event of the open-source DFIR calendar.
The call for presentations closes Monday, July 17, 2023 (see details below).
Last year’s event was a tremendous success, with over 500 unique participants enjoying our lineup of fascinating discussions, tech talks and the opportunity to get to know real members of our own community.
Call for presentations (CFP)
VeloCON invites contributions in the form of a 30-45 minute presentation. We require a brief proposal (~500 words; not a paper). These proposals undergo a review process to select presentations of maximum interest to VeloCON attendees and the wider Velociraptor community and to filter out sales pitches.
VeloCON focuses on work that pushes the envelope of what is currently possible using Velociraptor. Potential topics to be addressed by submissions include, but are not limited to:
Use cases of Velociraptor in real investigations
Novel deployment modes to cater for specific requirements
Contributions to Velociraptor to address new capabilities
Potential future ideas and features that Velociraptor
Integration of Velociraptor with other tools/frameworks
Analysis and acquisition on novel Forensic Artifacts
Submission process
Please email your submission to [email protected] and include the following details:
Your name and email address (if different from the sending email)
Company/affiliation and title to be included on the agenda
Presentation title
A short abstract (~500 words) to be included in the agenda
Deadline
Submissions are due Monday, July 17, 2023 and a decision will be announced shortly afterwards.
A new week has begun. Last week, there was a lot of news related to AWS. I have compiled a few announcements you need to know. Let’s get started right away!
Last Week’s Launches Let’s take a look at some launches from the last week that I want to remind you of:
New Amazon EC2 I4g Instances – Powered by AWS Graviton2 processors, Amazon Elastic Compute Cloud (Amazon EC2) I4g instances improve real-time storage performance up to 2x compared to prior generation storage-optimized instances. Based on AWS Nitro SSDs that are custom-built by AWS and reduce both latency and latency variability, I4g instances are optimized for workloads that perform a high mix of random read/write and require very low I/O latency, such as transactional databases and real-time analytics. To learn more, see Jeff’s post.
Amazon Aurora I/O-Optimized – You can now choose between two storage configurations for Amazon Aurora DB clusters: Aurora Standard or Aurora I/O-Optimized. For applications with low-to-moderate I/Os, Aurora Standard is a cost-effective option.
For applications with high I/Os, Aurora I/O-Optimized provides improved price performance, predictable pricing, and up to 40 percent costs savings. To learn more, see my full blog post.
AWS Management Console Private Access – This is a new security feature that allows you to limit access to the AWS Management Console from your Virtual Private Cloud (VPC) or connected networks to a set of trusted AWS accounts and organizations. It is built on VPC endpoints, which use AWS PrivateLink to establish a private connection between your VPC and the console.
AWS Management Console Private Access is useful when you want to prevent users from signing in to unexpected AWS accounts from within your network. To learn more, see the AWS Management Console getting started guide.
One-Click Security Protection on the Amazon CloudFront Console – You can now secure your web applications and APIs with AWS WAF with a single click on the Amazon CloudFront console. CloudFront handles creating and configuring AWS WAF for you with out-of-the-box protections recommended by AWS and this simple and convenient way to protect applications at the time you create or edit your distribution.
You may continue to select a preconfigured AWS WAF web access control list (ACL) when you prefer to use an existing web ACL. To learn more, see Using AWS WAF to control access to your content in the AWS documentation.
Tracing AWS Lambda SnapStart Functions with AWS X-Ray – You can use AWS X-Ray traces to gain deeper visibility into your function’s performance and execution lifecycle, helping you identify errors and performance bottlenecks for your latency-sensitive Java applications built using SnapStart-enabled functions.
With X-Ray support for SnapStart-enabled functions, you can now see trace data about the restoration of the execution environment and execution of your function code. You can enable X-Ray for Java-based SnapStart-enabled Lambda functions running on Amazon Corretto 11 or 17. To learn more about X-Ray for SnapStart-enabled functions, visit the Lambda Developer Guide or read Marcia’s blog post.
For a full list of AWS announcements, be sure to keep an eye on the What’s New at AWS page.
Open Source Updates Last week, we introduced new open-source projects and significant roadmap contributions to the Jupyter community.
Snapchange – Snapchange is a new open-source project to make fuzzing of a memory snapshot easier using KVM written by Rust. Snapchange enables a target binary to be fuzzed with minimal modifications, providing useful introspection that aids in fuzzing. Snapchange utilizes the features of the Linux kernel’s built-in virtual machine manager known as kernel virtual machine or KVM. To learn more, see the announcement post and GitHub repository.
Cedar – Cedar is a new open-source language for defining permissions as policies, which describes who should have access to what, and evaluating those policies. You can use Cedar to control access to resources such as photos in a photo-sharing app, compute nodes in a microservices cluster, or components in a workflow automation system. Cedar is also authorization-policy language used by the Amazon Verified Permissions, a scalable, fine-grained permissions management and authorization service for custom applications and AWS Verified Access managed services to validate each application request before granting access. To learn more, see the announcement post , Amazon Science blog post and Cedar playground to test sample policies.
Jupyter Community Contributions – We announced new contributions to Jupyter community to democratize generative artificial intelligence (AI) and scale machine learning (ML) workloads. We contributed two Jupyter extensions – Jupyter AI to bring generative AI to Jupyter notebooks and Amazon CodeWhisperer Jupyter extension to generate code suggestions for Python notebooks in JupyterLab. We also contributed three new capabilities to help you scale ML development faster: notebooks scheduling, SageMaker open-source distribution, and Amazon CodeGuru Jupyter extension. To learn more, see the announcement post and Jupyter on AWS.
Upcoming AWS Events Check your calendars and sign up for these AWS-led events:
AWS Serverless Innovation Day on May 17 – Join us for a free full-day virtual event to learn about AWS Serverless technologies and event-driven architectures from customers, experts, and leaders. Marcia outlined the agenda and main topics of this event in her post. You can register on the event page.
AWS Data Insights Day on May 24 – Join us for another virtual event to discover ways to innovate faster and more cost-effectively with data. Whether your data is stored in operational data stores, data lakes, streaming engines, or within your data warehouse, Amazon Redshift helps you achieve the best performance with the lowest spend. This event focuses on customer voices, deep-dive sessions, and best practices of Amazon Redshift. You can register on the event page.
AWS Silicon Innovation Day on June 21 – Join AWS leaders and experts showcasing AWS innovations in custom-designed EC2 chips built for high performance and scale in the cloud. AWS has designed and developed purpose-built silicon specifically for the cloud. You can understand AWS Silicons and how they can use AWS’s unique EC2 chip offerings to their benefit. You can register on the event page.
AWS re:Inforce 2023 – You can still register for AWS re:Inforce, in Anaheim, California, June 13–14.
AWS Community Day – Join community-led conferences driven by AWS user group leaders closest to your city: Chicago (June 15), and Philippines (June 29–30).
A while ago we shared how we replaced NGINX with our in-house proxy, Pingora. We promised to share more technical details as well as our open sourcing plan. This blog post will be the first of a series that shares both the code libraries that power Pingora and the ideas behind them.
Today, we take a look at one of Pingora’s libraries: pingora-limits.
pingora-limits provides the functionality to count inflight events and estimate the rate of events over time. These functions are commonly used to protect infrastructure and services from being overwhelmed by certain types of malicious or misbehaving requests.
For example, when an origin server becomes slow or unresponsive, requests will accumulate on our servers, which adds pressure on both our servers and our customers’ servers. With this library, we are able to identify which origins have issues, so that action can be taken without affecting other traffic.
The problem can be abstracted in a very simple way. The input is a (never ending) stream of different types of events. At any point, the system should be able to tell the number of appearances (or the rate) of a certain type of event.
In a simple example, colors are used as the type of event. The following is one possible example of a sequence of events:
In this example, the system should report that “red” appears three times.
The corresponding algorithms are straightforward to design. One obvious answer is to use a hash table, where the keys are the colors and the values are their corresponding appearances. Whenever a new event appears, the algorithm looks up the hash table and increases the appearance counter. It is not hard to tell that this algorithm’s time complexity is O(1) (per event) and the space complexity O(n) where n is the number of the types of events.
How Pingora does it
The hash table solution is fine in common scenarios, but we believe there are a few things that can be improved.
We observe traffic to millions of different servers when the misbehaving ones are only a few at a given time. It seems a bit wasteful to require space (memory) that holds the counter for all the keys.
Concurrently updating the hash table (especially when adding new keys) requires a lock. This behavior potentially forces all concurrent event processing to go through our system serialized. In other words, when lock contention is severe, the lock slows down the system.
The motivation to improve the above algorithm is even stronger considering such algorithms need to be deployed at scale. This algorithm operates on tens of thousands of machines. It handles more than twenty million requests per second. The benefits of efficiency improvement can be significant.
pingora-limits adopts a different approach: count–min sketch (CM sketch) estimation. CM sketch estimates the counts of events in O(1) (per event) but only using O(log(n)) of space (polylogarithmic, to be precise, more details here). Because of the simplicity of this algorithm, which we will discuss in a bit, it can be implemented without locks. Therefore, pingora-limits runs much faster and more efficiently compared to the hash table approach discussed earlier.
CM sketch
The idea of a CM sketch is similar to a Bloom filter. The mathematical details of the CM sketch can be found in this paper. In this section, we will just illustrate how it works.
A CM sketch data structure takes two parameters, H: number of hashes (rows) and N number of counters (columns) per hash (row). The rows and columns form a matrix. The space they take is H*N. Each row has its own independent hash function (hash_i()).
For this example, we use H=3 and N=4:
0
0
0
0
0
0
0
0
0
0
0
0
When an event, "red", arrives, it is counted by every row independently. Each row will use its own hashing function ( hash_i(“red”) ) to choose a column. The counter of the column is increased without worrying about collisions (see the end of this section).
The table below illustrates a possible state of the matrix after a single “red” event:
0
1
0
0
0
0
1
0
1
0
0
0
Then, let’s assume the event "blue" arrives, and we assume it collides with "red" at row 2: both hash to the third slot:
1
1
0
0
0
0
2
0
1
0
0
1
Let’s say after another series of events, “blue, red, red, red, blue, red”, So far the algorithm observed 5 “red”s and 3 “blue”s in total. Following the algorithm, the estimator eventually becomes:
3
5
0
0
0
0
8
0
5
0
0
3
Now, let’s see how the matrix reports the occurrence of each event. In order to retrieve the count of keys, the estimator just returns the minimal value of all the columns to which that key belongs. So the count of red is min(5, 8, 5) = 5 and blue is min(3, 8, 3) = 3.
This algorithm chooses the cells with the least collisions (via the min() operations). Therefore, collisions between events in single cells are acceptable because as long as there are collision free cells for a given type of event, the counting for that event is accurate.
The estimator can overestimate when two (or more) keys collide on all slots. Assuming there are only two keys, the probability of their total collision is 1/ N^H (1/64 in this example). On the other hand, it never underestimates because it never loses count of any events.
Practical implementation
Because the algorithm only requires hashing, array index and counter increment, it can be implemented in a few lines of code and lock-free.
The following is a code snippet of how it is implemented in Rust.
pub struct Estimator {
    estimator: Box<[(Box<[AtomicIsize]>, RandomState)]>,
}

impl Estimator {
    /// Increment `key` by the value given. Return the new estimated value as a result.
    pub fn incr<T: Hash>(&self, key: T, value: isize) -> isize {
        let mut min = isize::MAX;
        for (slot, hasher) in self.estimator.iter() {
            let hash = hash(&key, hasher) as usize;
            let counter = &slot[hash % slot.len()];
            let current = counter.fetch_add(value, Ordering::Relaxed);
            min = std::cmp::min(min, current + value);
        }
        min
    }
}
Performance
We compare the design above with the two hash table based approaches.
naive: Mutex<HashMap<u32, usize>>. This approach references the simple hash table approach mentioned above. This design requires a lock on every operation.
optimized: DashMap<u32, AtomicUsize>. DashMap leverages multiple hash tables in order to shard the keys to reduce contentions across different keys. We also use atomic counters here so that counting existing keys won't need a write lock.
We have two test cases, one that is single threaded and another that is multi-threaded. In both cases, we have one million keys. We generate 100 million events from the keys. The keys are uniformly distributed among the events.
The results below are performed on Debian VM running on M1 MacBook Pro.
Speed Per event (the incr() function above) timing, lower is better:
pingora-limits
naive
optimized
Single thread
10ns
51ns
43ns
Eight threads
212ns
1505ns
212ns
In the single thread case, where there is no lock contention, our approach is 5x faster than the naive one and 4x faster than the optimized one. With multiple threads, there is a high amount of contention. Our approach is similar to the optimized version. Both are 7x faster than the naive one. The reason the performance of pingora-limits and the optimized hash table are similar is because in both approaches the hot path is just updating the atomic counter.
Memory consumption Lower is better. The numbers are collected only from the single threaded test cases for simplicity.
peak memory bytes
total allocations
total allocated bytes
pingora-limits
26,184
9
26,184
naive
53,477,392
20
71,303,260
optimized
36,211,208
491
71,307,722
Pingora-limits at peak requires 1/2000 of the memory compared to the naive one and 1/1300 of the memory of the optimized one.
From the data above, pingora-limits is both CPU and memory efficient.
The estimator provided by Pingora-limits is a biased estimator because it is possible for it to overestimate the appearance of events.
In the case of accurate counting, where false positives are absolutely unacceptable, pingora-limits can still be very useful. It can work as a first stage filter where only the events beyond a certain threshold are fed to a hash table to perform accurate counting. In this case, the majority of low frequency event types are filtered out by the filter so that the hash table also consumes little memory without losing any accuracy.
How it is used in production
In production, pingora uses this library in a few places. The most common one is the connection limit feature. When our servers try to establish too many connections to a single origin server, in order to protect the server and our infrastructure from becoming overloaded, this feature will start rejecting new requests with 503 errors.
In this feature every incoming request increases a counter, shared by all other requests with the same customer ID, server IP and the server hostname. When the request finishes, the counter decreases accordingly. If the value of the counter is beyond a certain threshold, the request is rejected with a 503 error response. In our production environment we choose the parameters of the library so that a theoretical collision chance between two unrelated customers is about 1 / 2 ^ 52. Additionally, the rejection threshold is significantly higher than what a healthy customer’s traffic would reach. Therefore, even if multiple customers’ counters collide, it is not likely that the overestimated value would reach the threshold. So a false positive on the connection limit is not likely to happen.
Conclusion
Pingora-limits crate is available now on GitHub. Both the core functionality and the performance benchmark performed above can be found there.
In this blog post, we introduced pingora-limits, a library that counts events efficiently. We explained the core idea, which is based on a probabilistic data structure. We also showed through a performance benchmark that the pingora-limits implementation is fast and very efficient for memory consumption.
Not only that, but we will continue introducing and open sourcing Pingora components and libraries because we believe that sharing the idea behind the code is equally important as sharing the code itself.
Interested in joining us to help build a better Internet? Our engineering teams are hiring.
While it’s still in its infancy, generative AI coding tools are already changing the way developers and companies build software. Generative AI can boost developer and business productivity by automating tasks, improving communication and collaboration, and providing insights that can inform better decision-making.
In this post, we’ll explore the full story of how companies are adopting generative AI to ship software faster, including:
Generative AI refers to a class of artificial intelligence (AI) systems designed to create new content similar to what humans produce. These systems are trained on large datasets of content that include text, images, audio, music, or code.
Generative AI is an extension of traditional machine learning, which trains models to predict or classify data based on existing patterns. But instead of simply predicting the outcome, generative AI models are designed to identify underlying patterns and structures of the data, and then use that knowledge to quickly generate new content. However, the main difference between the two is one of magnitude and the size of the prediction or generation. Machine learning typically predicts the next word. Generative AI can generate the next paragraph.
AI-generated image from Shutterstack of a developer using a generative AI tool to code faster.
Generative AI tools have attracted particular interest in the business world. From marketing to software development, organizational leaders are increasingly curious about the benefits of the new generative AI applications and products.
“I do think that all companies will adopt generative AI tools in the near future, at least indirectly,” said Albert Ziegler, principal machine learning engineer at GitHub. “The bakery around the corner might have a logo that the designer made using a generative transformer. The neighbor selling knitted socks might have asked Bing where to buy a certain kind of wool. My taxi driver might do their taxes with a certain Excel plugin. This adoption will only increase over time.”
What are some business uses of generative AI tools?
Software development: generative AI tools can assist engineers with building, editing, and testing code.
Content creation: writers can use generative AI tools to help personalize product descriptions and write ad copy.
Design creation: from generating layouts to assisting with graphics, generative AI design tools can help designers create entirely new designs.
Video creation: generative AI tools can help videographers with building, editing, or enhancing videos and images.
Language translation: translators can use generative AI tools to create communications in different languages.
Personalization: generative AI tools can assist businesses with personalizing products and services to meet the needs of individual customers.
Operations: from supply chain management to pricing, generative AI tools can help operations professionals drive efficiency.
How generative AI coding tools are changing the developer experience
Generative AI has big implications for developers, as the tools can enable them to code and ship software faster.
How is generative AI affecting software development?
Check out our guide to learn what generative AI coding tools are, what developers are using them for, and how they’re impacting the future of development.
GitHub Copilot is only continuing to improve. When the tool was first launched for individuals in June 2022, more than 27% of developers’ code was generated by GitHub Copilot, on average. Today, that number is 46% across all programming languages—and in Java, that jumps to 61%.
How can generative AI tools help you build software?
These tools can help:
Write boilerplate code for various programming languages and frameworks.
Find information in documentation to understand what the code does.
Identify security vulnerabilities and implement fixes.
Streamline code reviews before merging new or edited code.
Like all technologies, responsibility and ethics are important with generative AI.
In February 2023, a group of 10 companies including OpenAI, Adobe, the BBC, and others agreed upon a new set of recommendations on how to use generative AI content in a responsible way.
The recommendations were put together by the Partnership on AI (PAI), an AI research nonprofit, in consultation with more than 50 organizations. The guidelines call for creators and distributors of generative AI to be transparent about what the technology can and can’t do and disclose when users might be interacting with this type of content (by using watermarks, disclaimers, or traceable elements in an AI model’s training data).
Businesses should be aware that while generative AI tools can speed up the creation of content, they should not be solely relied upon as a source of truth. A recent study suggests that people can identify whether AI-generated content is real or fake only 50% of the time. Here at GitHub, we named our generative AI tool “GitHub Copilot” to signify just this—the tool can help, but at the end of the day, it’s just a copilot. The developer needs to take responsibility for ensuring that the finished code is accurate and complete.
How companies are using generative AI
Even as generative AI models and tools continue to rapidly advance, businesses are already exploring how to incorporate these into their day-to-day operations.
This is particularly true for software development teams.
“Going forward, tech companies that don’t adopt generative AI tools will have a significant productivity disadvantage,” Ziegler said. “Given how much faster this technology can help developers build, organizations that don’t adopt these tools or create their own will have a harder time in the marketplace.”
3 primary generative AI business models for organizations
Enterprises all over the world are using generative AI tools to transform how work gets done. Three of the business models organizations use include:
Model as a Service (MaaS): Companies access generative AI models through the cloud and use them to create new content. OpenAI employs this model, which licenses its GPT-3 AI model, the platform behind ChatGPT. This option offers low-risk, low-cost access to generative AI, with limited upfront investment and high flexibility.
Built-in apps: Companies build new—or existing—apps on top of generative AI models to create new experiences. GitHub Copilot uses this model, which relies on Codex to analyze the context of the code to provide intelligent suggestions on how to complete it. This option offers high customization and specialized solutions with scalability.
Vertical integration: Vertical integration leverages existing systems to enhance the offerings. For instance, companies may use generative AI models to analyze large amounts of data and make predictions about prices or improve the accuracy of their services.
Duolingo, one of the largest language-learning apps in the world, is one company that recently adopted generative AI capabilities. They chose GitHub’s generative AI tool, GitHub Copilot, to help their developers write and ship code faster, while improving test coverage. Duolingo’s CTO Severin Hacker said GitHub Copilot delivered immediate benefits to the team, enabling them to code quickly and deliver their best work.
”[The tool] stops you from getting distracted when you’re doing deep work that requires a lot of your brain power,” Hacker noted. “You spend less time on routine work and more time on the hard stuff. With GitHub Copilot, our developers stay in the flow state and keep momentum instead of clawing through code libraries or documentation.”
After adopting GitHub Copilot and the GitHub platform, Duolingo saw a:
25% increase in developer speed for those who are new to working with a specific repository
10% increase in developer speed for those who are familiar with the respective codebase
67% decrease in median code review turnaround time
“I don’t know of anything available today that’s remotely close to what we can get with GitHub Copilot,” Hacker said.
Looking forward
Generative AI is changing the world of software development. And it’s just getting started. The technology is quickly improving and more use cases are being identified across the software development lifecycle. With the announcement of GitHub Copilot X, our vision for the future of AI-powered software development, we’re committed to installing AI capabilities into every step of the developer workflow. There’s no better time to get started with generative AI at your company.
I could almost title this blog post the “AWS AI/ML Week in Review.” This past week, we announced several new innovations and tools for building with generative AI on AWS. Let’s dive right into it.
Last Week’s Launches Here are some launches that got my attention during the previous week:
Announcing Amazon Bedrock and Amazon Titan models – Amazon Bedrock is a new service to accelerate your development of generative AI applications using foundation models through an API without managing infrastructure. You can choose from a wide range of foundation models built by leading AI startups and Amazon. The new Amazon Titan foundation models are pre-trained on large datasets, making them powerful, general-purpose models. You can use them as-is or privately to customize them with your own data for a particular task without annotating large volumes of data. Amazon Bedrock is currently in limited preview. Sign up here to learn more.
Amazon EC2 Trn1n and Inf2 instances are now generally available – Trn1n instances, powered by AWS Trainium accelerators, double the network bandwidth (compared to Trn1 instances) to 1,600 Gbps of Elastic Fabric Adapter (EFAv2). The increased bandwidth delivers even higher performance for training network-intensive generative AI models such as large language models (LLMs) and mixture of experts (MoE). Inf2 instances, powered by AWS Inferentia2 accelerators, deliver high performance at the lowest cost in Amazon EC2 for generative AI models, including LLMs and vision transformers. They are the first inference-optimized instances in Amazon EC2 to support scale-out distributed inference with ultra-high-speed connectivity between accelerators. Compared to Inf1 instances, Inf2 instances deliver up to 4x higher throughput and up to 10x lower latency. Check out my blog posts on Trn1 instances and Inf2 instances for more details.
Amazon CodeWhisperer, free for individual use, is now generally available – Amazon CodeWhisperer is an AI coding companion that generates real-time single-line or full-function code suggestions in your IDE to help you build applications faster. With GA, we introduce two tiers: CodeWhisperer Individual and CodeWhisperer Professional. CodeWhisperer Individual is free to use for generating code. You can sign up with an AWS Builder ID based on your email address. The Individual Tier provides code recommendations, reference tracking, and security scans. CodeWhisperer Professional—priced at $19 per user, per month—offers additional enterprise administration capabilities. Steve’s blog post has all the details.
Amazon GameLift adds support for Unreal Engine 5 – Amazon GameLift is a fully managed solution that allows you to manage and scale dedicated game servers for session-based multiplayer games. The latest version of the Amazon GameLift Server SDK 5.0 lets you integrate your Unreal 5-based game servers with the Amazon GameLift service. In addition, the latest Amazon GameLift Server SDK with Unreal 5 plugin is built to work with Amazon GameLift Anywhere so that you can test and iterate Unreal game builds faster and manage game sessions across any server hosting infrastructure. Check out the release notes to learn more.
Amazon Rekognition launches Face Liveness to deter fraud in facial verification – Face Liveness verifies that only real users, not bad actors using spoofs, can access your services. Amazon Rekognition Face Liveness analyzes a short selfie video to detect spoofs presented to the camera, such as printed photos, digital photos, digital videos, or 3D masks, as well as spoofs that bypass the camera, such as pre-recorded or deepfake videos. This AWS Machine Learning Blog post walks you through the details and shows how you can add Face Liveness to your web and mobile applications.
Other AWS News Here are some additional news items and blog posts that you may find interesting:
Updates to the AWS Well-Architected Framework – The most recent content updates and improvements focus on providing expanded guidance across the AWS service portfolio to help you make more informed decisions when developing implementation plans. Services that were added or expanded in coverage include AWS Elastic Disaster Recovery, AWS Trusted Advisor, AWS Resilience Hub, AWS Config, AWS Security Hub, Amazon GuardDuty, AWS Organizations, AWS Control Tower, AWS Compute Optimizer, AWS Budgets, Amazon CodeWhisperer, and Amazon CodeGuru. This AWS Architecture Blog post has all the details.
Amazon releases largest dataset for training “pick and place” robots – In an effort to improve the performance of robots that pick, sort, and pack products in warehouses, Amazon has publicly released the largest dataset of images captured in an industrial product-sorting setting. Where the largest previous dataset of industrial images featured on the order of 100 objects, the Amazon dataset, called ARMBench, features more than 190,000 objects. Check out this Amazon Science Blog post to learn more.
AWS open-source news and updates – My colleague Ricardo writes this weekly open-source newsletter in which he highlights new open-source projects, tools, and demos from the AWS Community. Read edition #153 here.
Upcoming AWS Events Check your calendars and sign up for these AWS events:
#BuildOn Generative AI – Join our weekly live Build On Generative AI Twitch show. Every Monday morning, 9:00 US PT, my colleagues Emily and Darko take a look at aspects of generative AI. They host developers, scientists, startup founders, and AI leaders and discuss how to build generative AI applications on AWS.
In today’s episode, Emily walks us through the latest AWS generative AI announcements. You can watch the video here.
.NET Developer Day – .NET Enterprise Developer Day EMEA 2023 (April 25) is a free, one-day virtual event providing enterprise developers with the most relevant information to swiftly and efficiently migrate and modernize their .NET applications and workloads on AWS.
AWS Developer Innovation Day – AWS Developer Innovation Day (April 26) is a new, free, one-day virtual event designed to help developers and teams be productive and collaborate from discovery to delivery, to running software and building applications. Get a first look at exciting product updates, technical deep dives, and keynotes.
During a time when computers were solely used for computation, the engineer, Douglas Engelbart, gave the “mother of all demos,” where he reframed the computer as a collaboration tool capable of solving humanity’s most complex problems. At the start of his demo, he asked audience members how much value they would derive from a computer that could instantly respond to their actions.
You can ask the same question of generative AI models. If you had a highly responsive generative AI coding tool to brainstorm new ideas, break big ideas into smaller tasks, and suggest new solutions to problems, how much more creative and productive could you be?
This isn’t a hypothetical question. AI-assisted engineering workflows are quickly emerging with new generative AI coding tools that offer code suggestions and entire functions in response to natural language prompts and existing code. These tools, and what they can help developers accomplish, are changing fast. That makes it important for every developer to understand what’s happening now—and the implications for how software is and will be built.
In this article, we’ll give a rundown of what generative AI in software development looks like today by exploring:
The unique value generative AI brings to the developer workflow
AI and automation have been a part of the developer workflow for some time now. From machine learning-powered security checks to CI/CD pipelines, developers already use a variety of automation and AI tools, like CodeQL on GitHub, for example.
While there’s overlap between all of these categories, here’s what makes generative AI distinct from automation and other AI coding tools:
Automation: You know what needs to be done, and you know of a reliable way to get there every time.
Rules-based logic: You know the end goal, but there’s more than one way to achieve it.
Machine learning:
You know the end goal, but the amount of ways to achieve it scales exponentially.
Generative AI: You have big coding dreams, and want the freedom to bring them to life.
You want to make sure that any new code pushed to your repository follows formatting specifications before it’s merged to the main branch. Instead of manually validating the code, you use a CI/CD tool like GitHub Actions to trigger an automated workflow on the event of your choosing (like a commit or pull request).
You know some patterns of SQL injections, but it’s time consuming to manually scan for them in your code. A tool like Code QL uses a system of rules to sort through your code and find those patterns, so you don’t have to do it by hand.
You want to stay on top of security vulnerabilities, but the list of SQL injections continues to grow. A coding tool that uses a machine learning (ML) model, like Code QL, is trained to not only detect known injections, but also patterns similar to those injections in data it hasn’t seen before. This can help you increase recognition of confirmed vulnerabilities and predict new ones.
Generative AI coding tools leverage ML to generate novel answers and predict coding sequences. A tool like GitHub Copilot can reduce the amount of times you switch out of your IDE to look up boilerplate code or help you brainstorm coding solutions. Shifting your role from rote writing to strategic decision making, generative AI can help you reflect on your code at a higher, more abstract level—so you can focus more on what you want to build and spend less time worrying about how.
How are generative AI coding tools designed and built?
Building a generative AI coding tool requires training AI models on large amounts of code across programming languages via deep learning. (Deep learning is a way to train computers to process data like we do—by recognizing patterns, making connections, and drawing inferences with limited guidance.)
To emulate the way humans learn patterns, these AI models use vast networks of nodes, which process and weigh input data, and are designed to function like neurons. Once trained on large amounts of data and able to produce useful code, they’re built into tools and applications. The models can then be plugged into coding editors and IDEs where they respond to natural language prompts or code to suggest new code, functions, and phrases.
Before we talk about how generative AI coding tools are made, let’s define what they are first. It starts with LLMs, or large language models, which are sets of algorithms trained on large amounts of code and human language. Like we mentioned above, they can predict coding sequences and generate novel content using existing code or natural language prompts.
Today’s state-of-the-art LLMs are transformers. That means they use something called an attention mechanism to make flexible connections between different tokens in a user’s input and the output that the model has already generated. This allows them to provide responses that are more contextually relevant than previous AI models because they’re good at connecting the dots and big-picture thinking.
Here’s an example of how a transformer works. Let’s say you encounter the word log in your code. The transformer node at that place would use the attention mechanism to contextually predict what kind of log would come next in the sequence.
Let’s say, in the example below, you input the statement from math import log. A generative AI model would then infer you mean a logarithmic function.
And if you add the prompt from logging import log, it would infer that you’re using a logging function.
Though sometimes a log is just a log.
LLMs can be built using frameworks besides transformers. But LLMs using frameworks, like a recurrent neural network or long short-term memory, struggle with processing long sentences and paragraphs. They also typically require training on labeled data (making training a labor-intensive process). This limits the complexity and relevance of their outputs, and the data they can learn from.
Transformer LLMs, on the other hand, can train themselves on unlabeled data. Once they’re given basic learning objectives, LLMs take a part of the new input data and use it to practice their learning goals. Once they’ve achieved these goals on that portion of the input, they apply what they’ve learned to understand the rest of the input. This self-supervised learning process is what allows transformer LLMs to analyze massive amounts of unlabeled data—and the larger the dataset an LLM is trained on, the more they scale by processing that data.
Why should developers care about transformers and LLMs?
LLMs like OpenAI’s GPT-3, GPT-4, and Codex models are trained on an enormous amount of natural language data and publicly available source code. This is part of the reason why tools like ChatGPT and GitHub Copilot, which are built on these models, can produce contextually accurate outputs.
Here’s how GitHub Copilot produces coding suggestions:
All of the code you’ve written so far, or the code that comes before the cursor in an IDE, is fed to a series of algorithms that decide what parts of the code will be processed by GitHub Copilot.
Since it’s powered by a transformer-based LLM, GitHub Copilot will apply the patterns it’s abstracted from training data and apply those patterns to your input code.
The result: contextually relevant, original coding suggestions. GitHub Copilot will even filter out known security vulnerabilities, vulnerable code patterns, and code that matches other projects.
Keep in mind: creating new content such as text, code, and images is at the heart of generative AI. LLMs are adept at abstracting patterns from their training data, applying those patterns to existing language, and then producing language or a line of code that follows those patterns. Given the sheer scale of LLMs, they might generate a language or code sequence that doesn’t even exist yet. Just as you would review a colleague’s code, you should assess and validate AI-generated code, too.
Why context matters for AI coding tools
Developing good prompt crafting techniques is important because input code passes through something called a context window, which is present in all transformer-based LLMs. The context window represents the capacity of data an LLM can process. Though it can’t process an infinite amount of data, it can grow larger. Right now, the Codex model has a context window that allows it to process a couple of hundred lines of code, which has already advanced and accelerated coding tasks like code completion and code change summarization.
Developers use details from pull requests, a folder in a project, open issues—and the list goes on—to contextualize their code. So, when it comes to a coding tool with a limited context window, the challenge is to figure out what data, in addition to code, will lead to the best suggestions.
The order of the data also impacts a model’s contextual understanding. Recently, GitHub made updates to its pair programmer so that it considers not only the code immediately before the cursor, but also some of the code after the cursor. The paradigm—which is called Fill-In-the-Middle (FIM)—leaves a gap in the middle of the code for GitHub Copilot to fill, providing the tool with more context about the developer’s intended code and how it should align with the rest of the program. This helps produce higher quality code suggestions without any added latency.
Visuals can also contextualize code. Multimodal LLMs (MMLLMs) scale transformer LLMs so they process images and videos, as well as text. OpenAI recently released its new GPT-4 model—and Microsoft revealed its own MMLLM called Kosmos-1. These models are designed to respond to natural language and images, like alternating text and images, image-caption pairs, and text data.
GitHub’s senior developer advocate Christina Warren shares the latest on GPT-4 and the creative potential it holds for developers:
How developers are using generative AI coding tools
The field of generative AI is filled with experiments and explorations to uncover the technology’s full capabilities—and how they can enable effective developer workflows. Generative AI tools are already changing how developers write code and build software, from improving productivity to helping developers focus on bigger problems.
While generative AI applications in software development are still being actively defined, today, developers are using generative AI coding tools to:
Get a head start on complex code translation tasks. A study presented at the 2021 International Conference on Intelligent User Interfaces found that generative AI provided developers with a skeletal framework to translate legacy source code into Python. Even if the suggestions weren’t always correct, developers found it easier to assess and fix those mistakes than manually translate the source code from scratch. They also noted that this process of reviewing and correcting was similar to what they already do when working with code produced by their colleagues.
With GitHub Copilot Labs, developers can use the companion VS Code extension (that’s separate from but dependent on the GitHub Copilot extension) to translate code into different programming languages. Watch how GitHub Developer Advocate, Michelle Mannering, uses GitHub Copilot Labs to translate her Python code into Ruby in just a few steps.
Code more efficiently. While autocompletion has been in modern IDEs for years, LLMs can generate longer suggestions—sometimes multiple lines of code—that are often more relevant. A 2022 study published in the Proceedings of the Association for Computing Machinery on Programming Languages (PACMPL) observed 20 programmers who interacted with GitHub Copilot. They found that thanks to end-of-line suggestions for function calls and argument completions, developers were able to code faster and stay in the flow longer.
Our own research supports these findings, too. As we mentioned earlier, we found that developers who used GitHub Copilot coded up to 55% faster than those who didn’t. But productivity gains went beyond speed with 74% of developers reporting that they felt less frustrated when coding and were able to focus on more satisfying work.
Tackle new problems and get creative. The PACMPL study also found that developers used GitHub Copilot to find creative solutions when they were unsure of how to move forward. These developers searched for next possible steps and relied on the generative AI coding tool to assist with unfamiliar syntax, look up the right API, or discover the correct algorithm.
I was one of the developers who wrote GitHub Copilot, but prior to that work, I had never written a single line of TypeScript. That wasn’t a problem because I used the first prototype of GitHub Copilot to learn the language and, eventually, help ship the world’s first at-scale generative AI coding tool.
– Albert Ziegler, Principal Machine Learning Engineer // GitHub
Find answers without leaving their IDEs. Some participants in the PACMPL study also treated GitHub Copilot’s multi-suggestion pane like StackOverflow. Since they were able to describe their goals in natural language, participants could directly prompt GitHub Copilot to generate ideas for implementing their goals, and press Ctrl/Cmd + Enter to see a list of 10 suggestions. Even though this kind of exploration didn’t lead to deep knowledge, it helped one developer to effectively use an unfamiliar API.
Build better test coverage. Some generative AI coding tools excel in pattern recognition and completion. Developers are using these tools to build unit and functional tests—and even security tests—via natural language prompts. Some tools also offer security vulnerability filtering, so a developer will be alerted if they unknowingly introduce a vulnerability in their code.
Discover tricks and solutions they didn’t know they needed. Scarlett also wrote about eight unexpected ways developers can use GitHub Copilot—from prompting it to create a dictionary of two-letter ISO country codes and their contributing country name, to helping developers exit Vim, an editor with a sometimes finicky closing process. Want to learn more? Check out the full guide >
The bottom line
Generative AI provides humans with a new mode of interaction—and it doesn’t just alleviate the tedious parts of software development. It also inspires developers to be more creative, feel empowered to tackle big problems, and model large, complex solutions in ways they couldn’t before. From increasing productivity and offering alternative solutions, to helping you build new skills—like learning a new language or framework, or even writing clear comments and documentation—there are so many reasons to be excited about the next wave of software development. This is only the beginning.
To provide the best experiences, we use technologies like cookies to store and/or access device information. Consenting to these technologies will allow us to process data such as browsing behavior or unique IDs on this site. Not consenting or withdrawing consent, may adversely affect certain features and functions.
Functional
Always active
The technical storage or access is strictly necessary for the legitimate purpose of enabling the use of a specific service explicitly requested by the subscriber or user, or for the sole purpose of carrying out the transmission of a communication over an electronic communications network.
Preferences
The technical storage or access is necessary for the legitimate purpose of storing preferences that are not requested by the subscriber or user.
Statistics
The technical storage or access that is used exclusively for statistical purposes.The technical storage or access that is used exclusively for anonymous statistical purposes. Without a subpoena, voluntary compliance on the part of your Internet Service Provider, or additional records from a third party, information stored or retrieved for this purpose alone cannot usually be used to identify you.
Marketing
The technical storage or access is required to create user profiles to send advertising, or to track the user on a website or across several websites for similar marketing purposes.


 AWS Global Summits – The 2023 AWS Summits season is almost coming to an end with the last two in-person events in
 AWS Community Days – Join a community-led conference run by AWS user group leaders in your region:
 AWS re:Invent (November 27 – December 1) – Join us to hear the latest from AWS, learn from experts, and connect with the global cloud community.


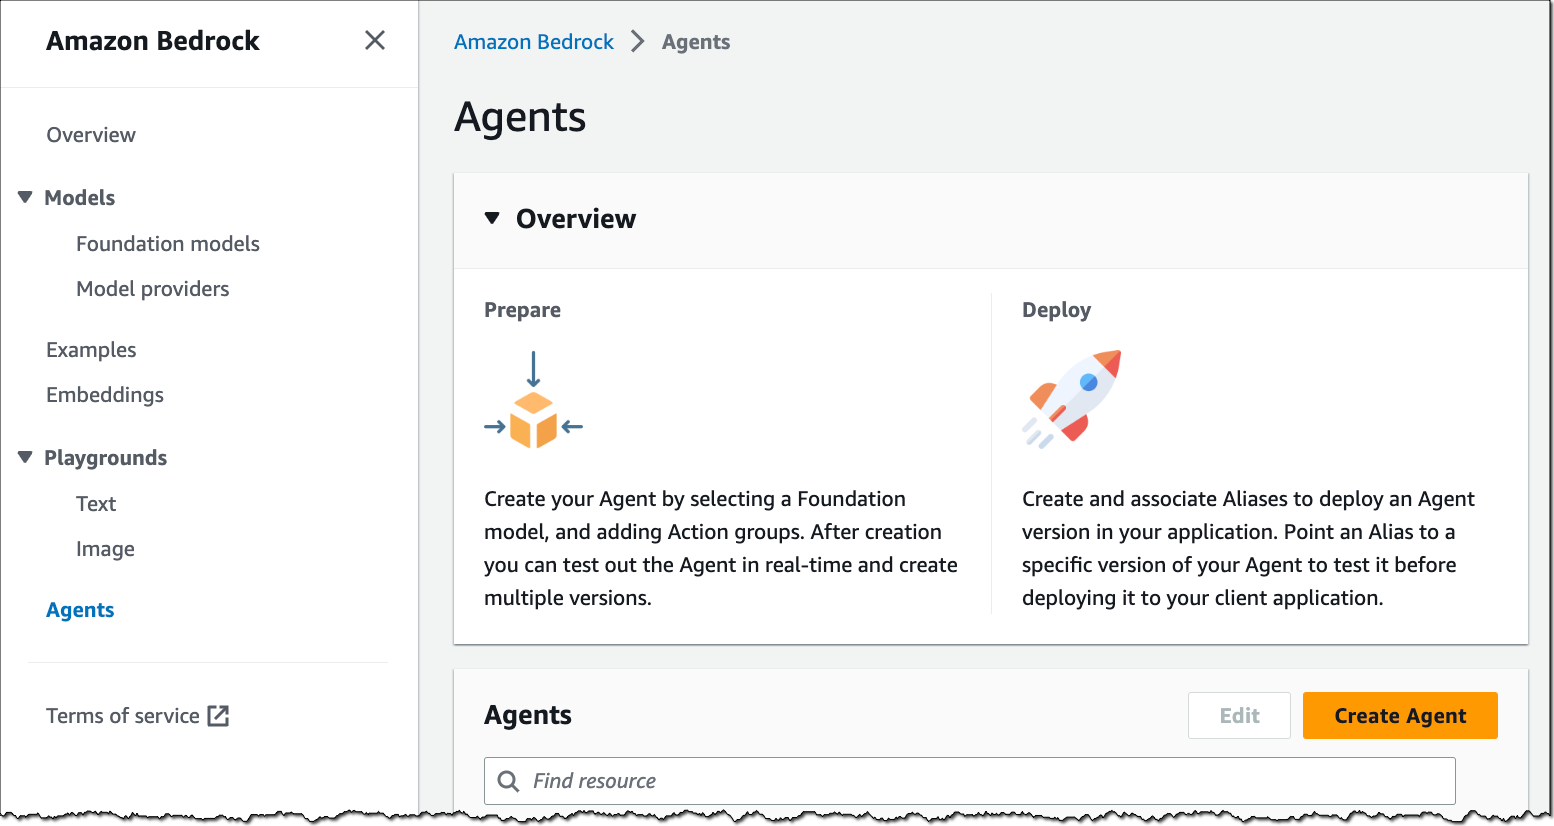
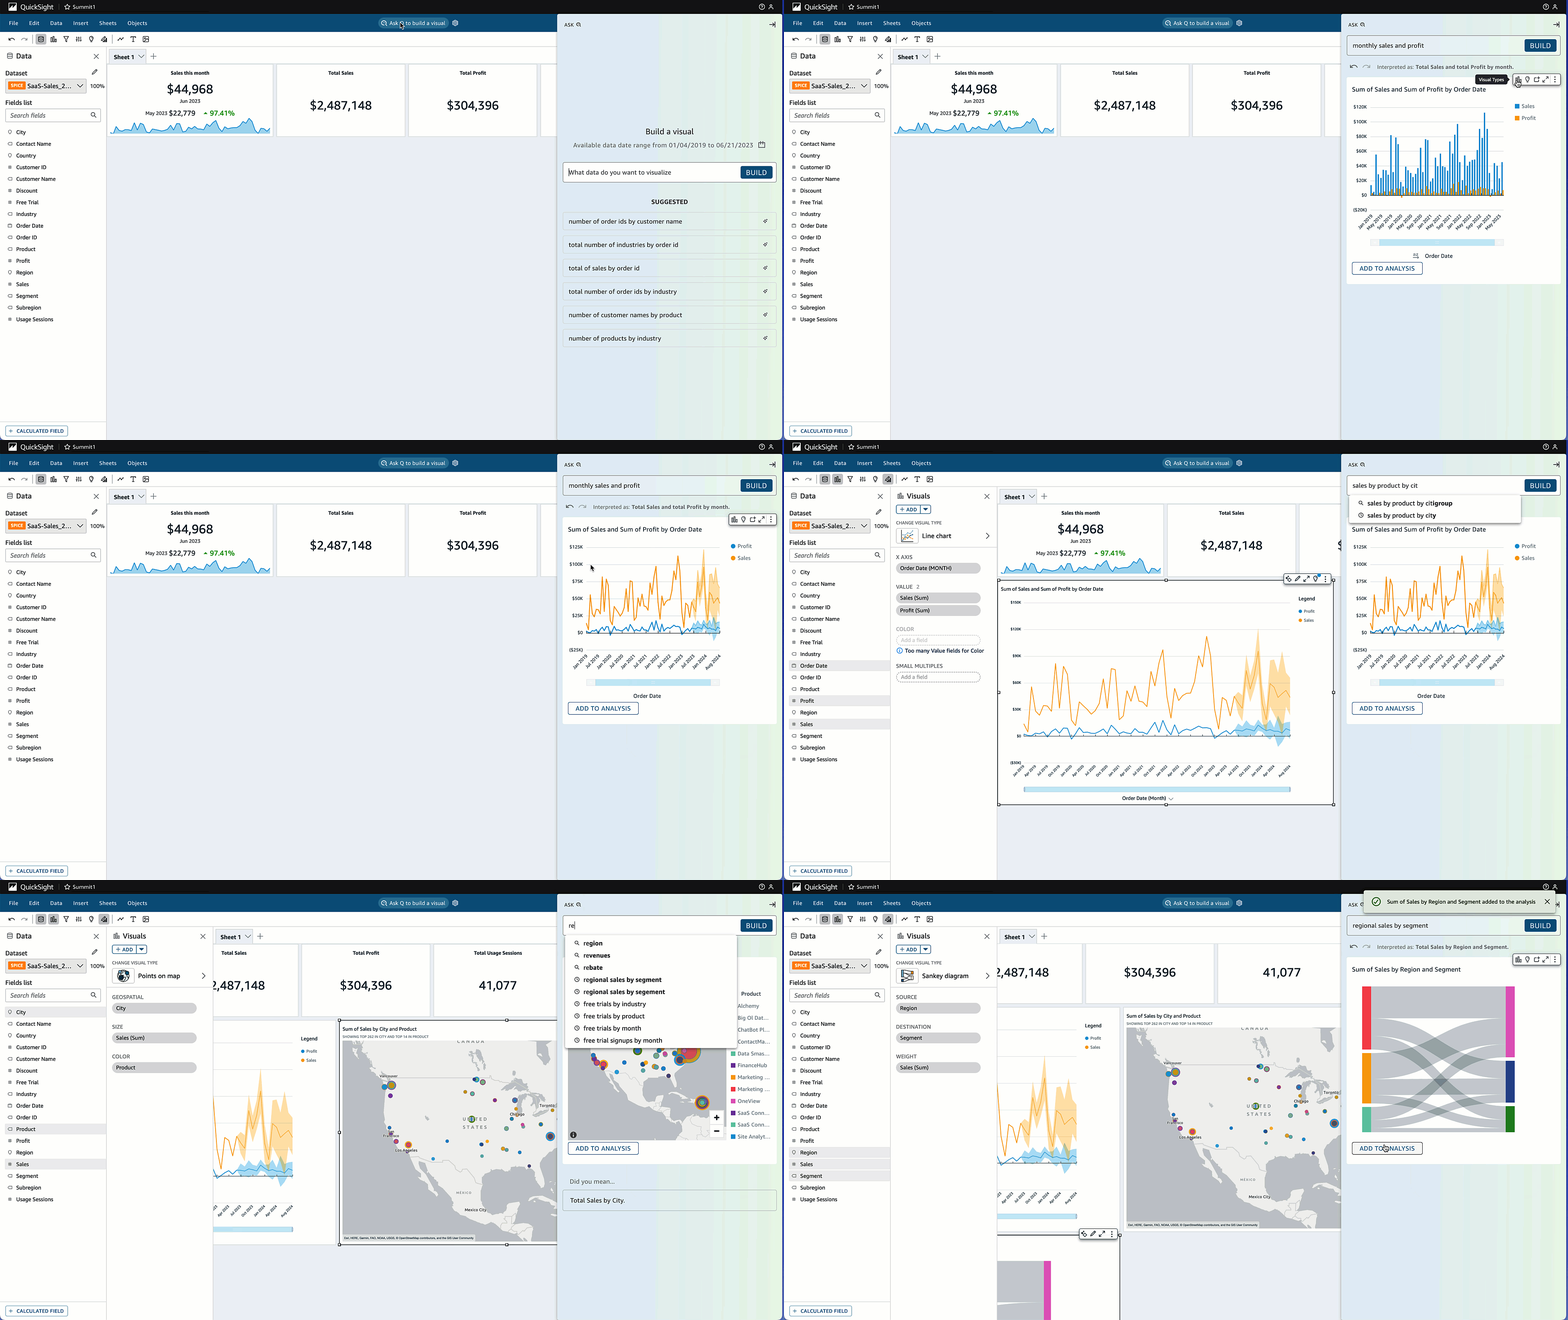

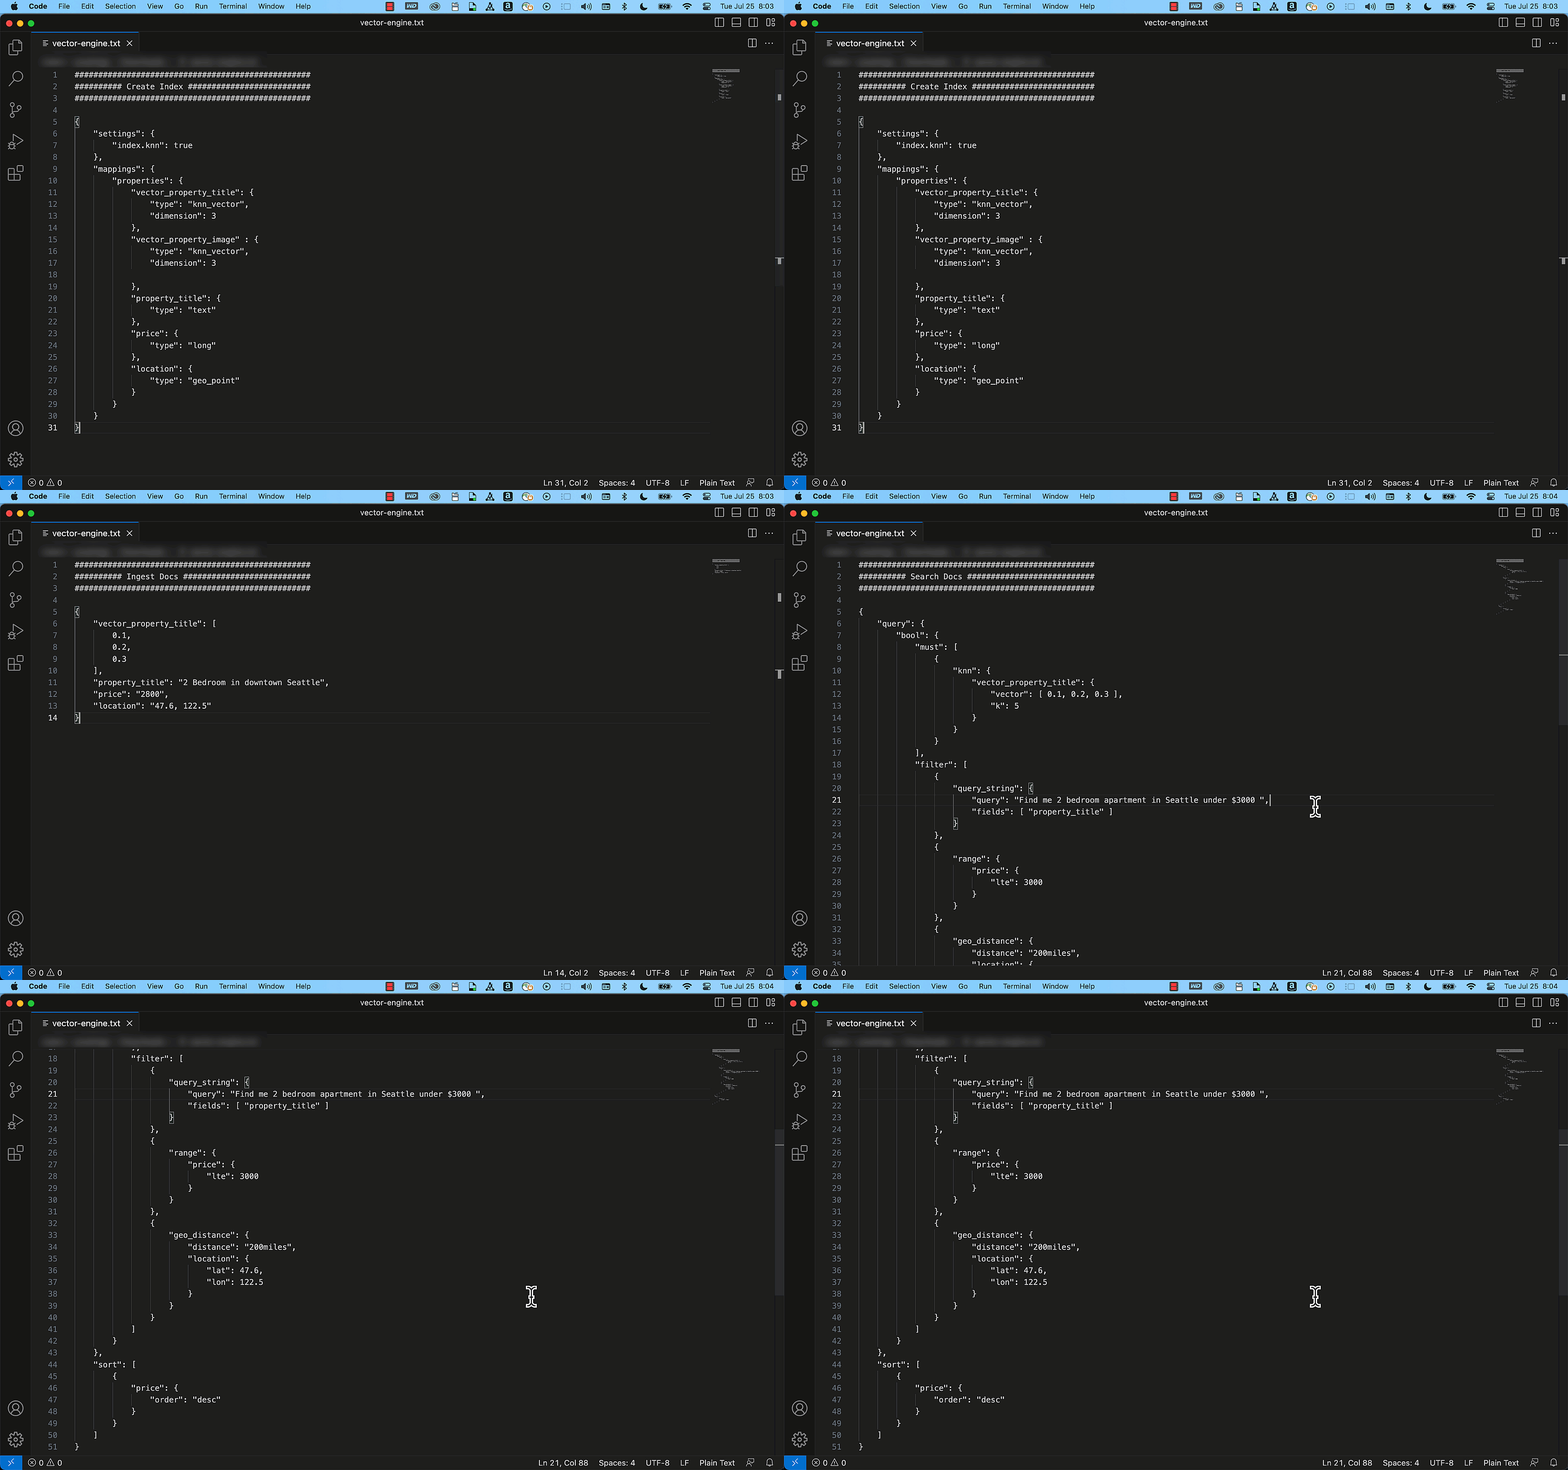
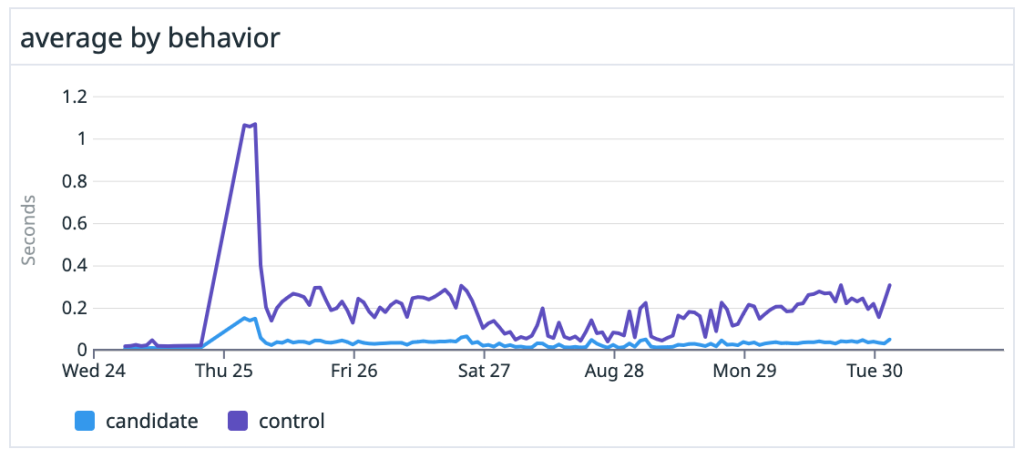
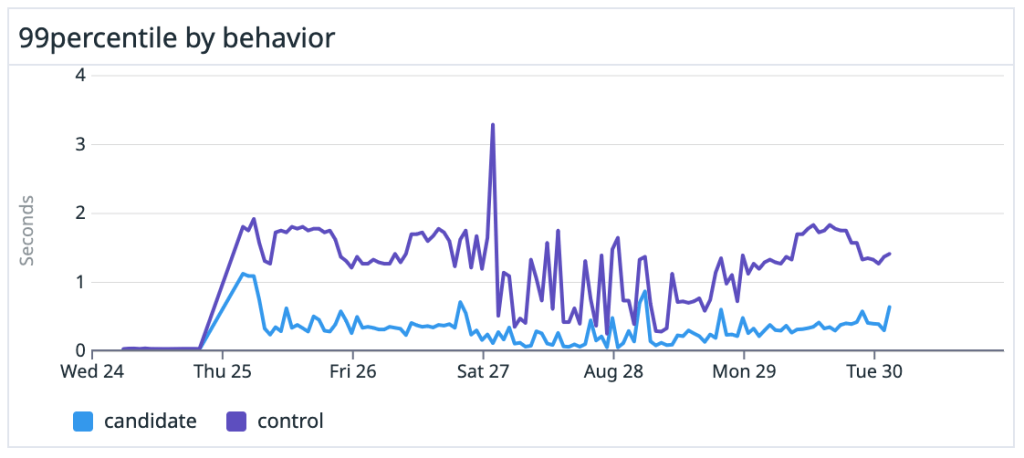
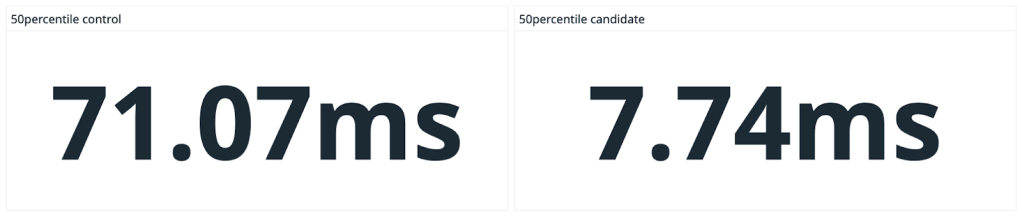
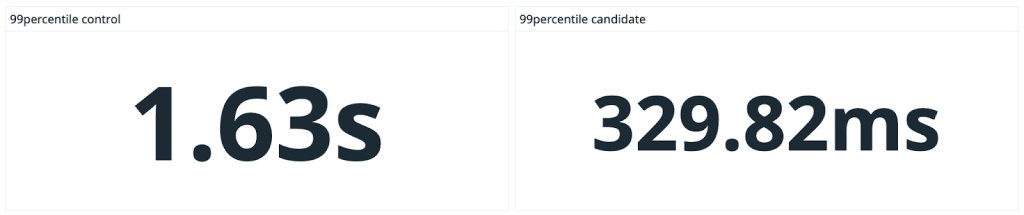

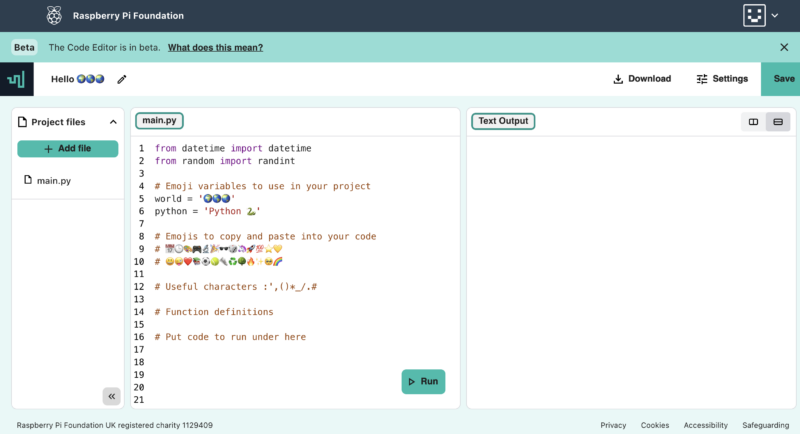

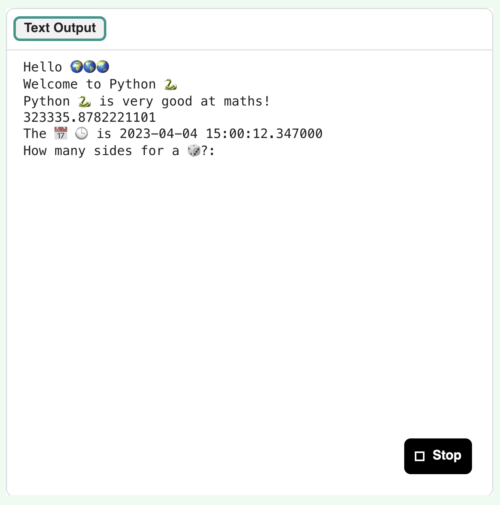




 Shana Schipers is an Analytics Specialist Solutions Architect at AWS, focusing on big data. She supports customers worldwide in building transactional data lakes using open table formats like Apache Hudi, Apache Iceberg and Delta Lake on AWS.
 Ian Meyers is a Director of Product Management for AWS Analytics Services. He works with many of AWS largest customers on emerging technology needs, and leads several data and analytics initiatives within AWS including support for Data Mesh.


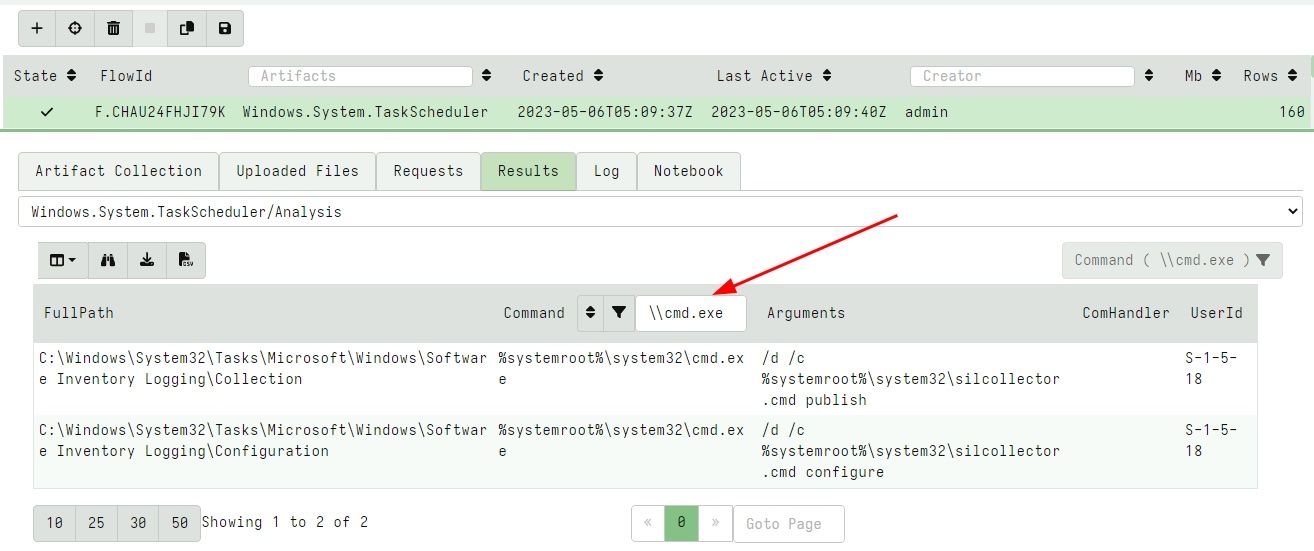
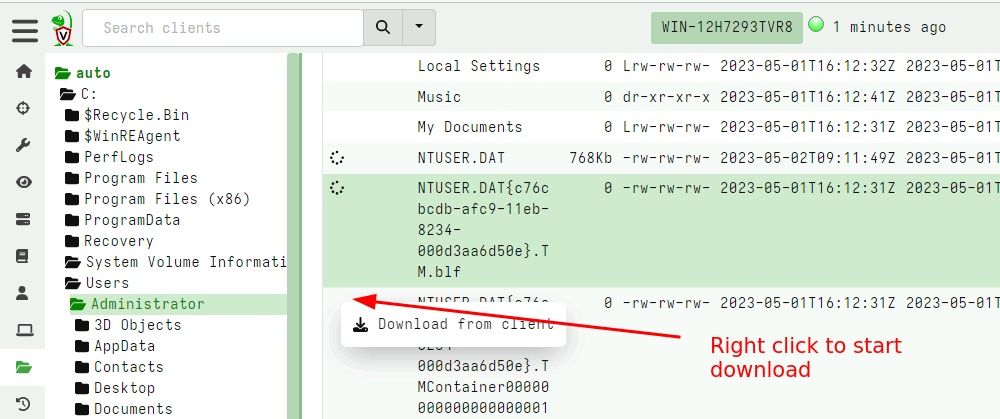
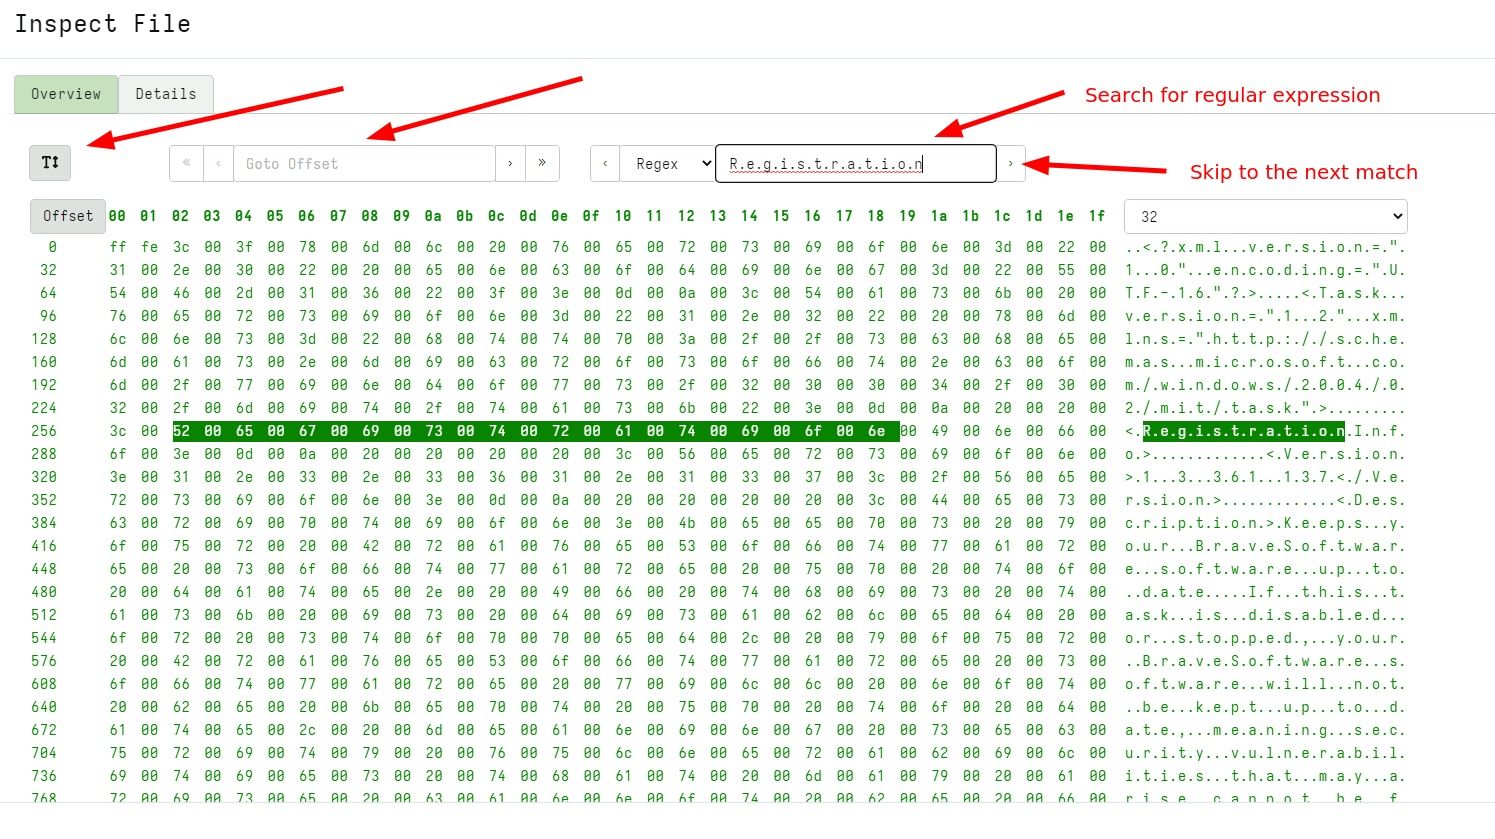
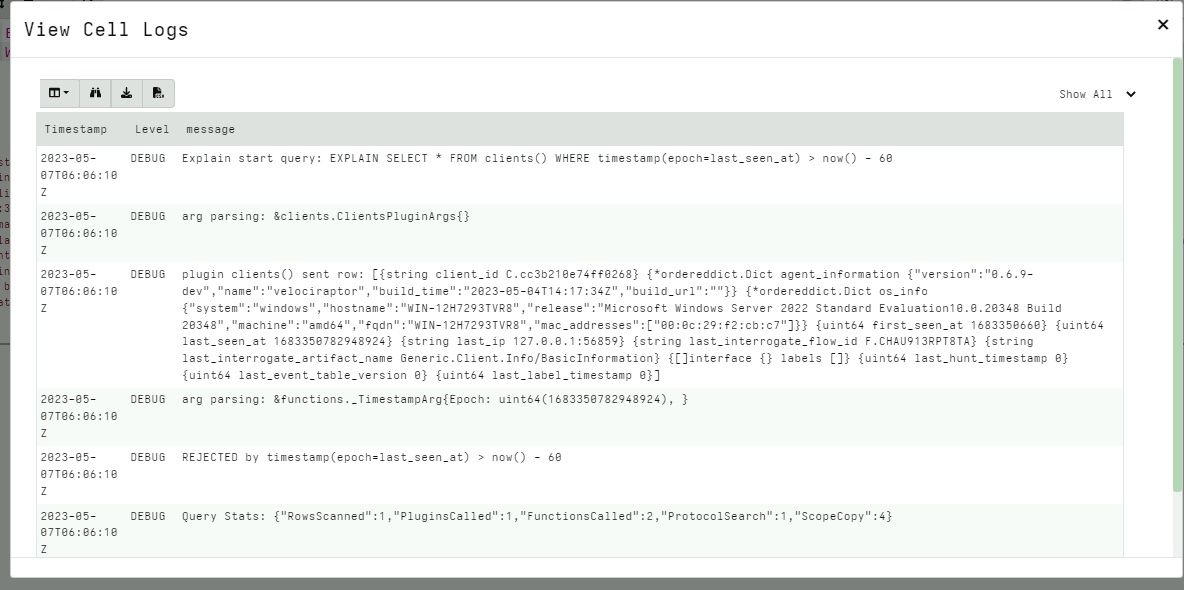
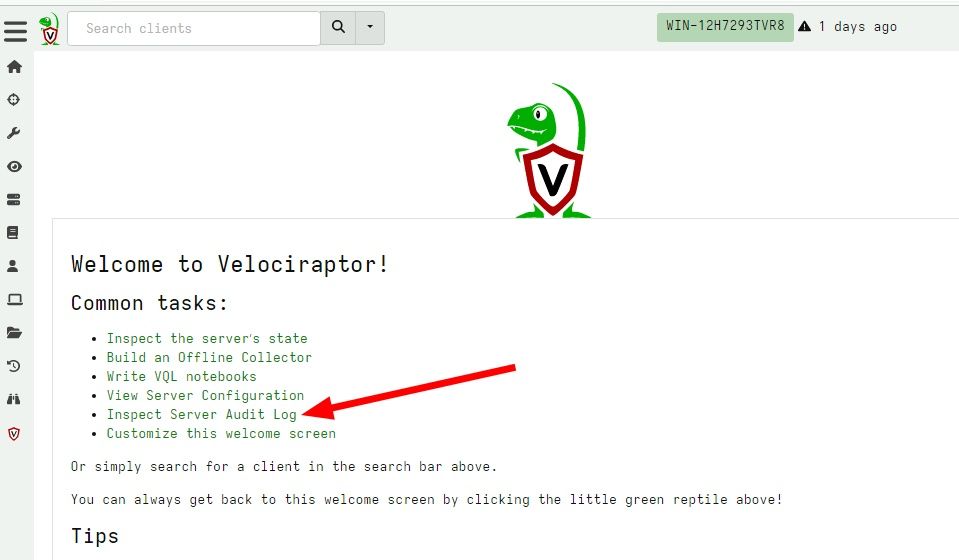
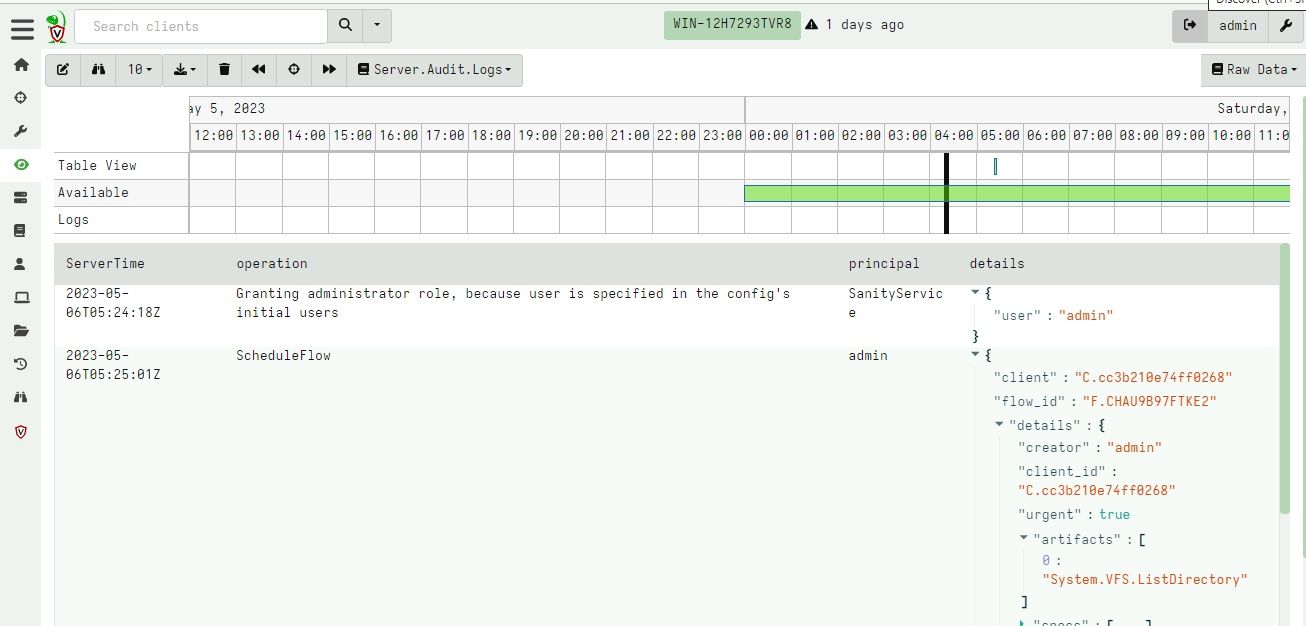
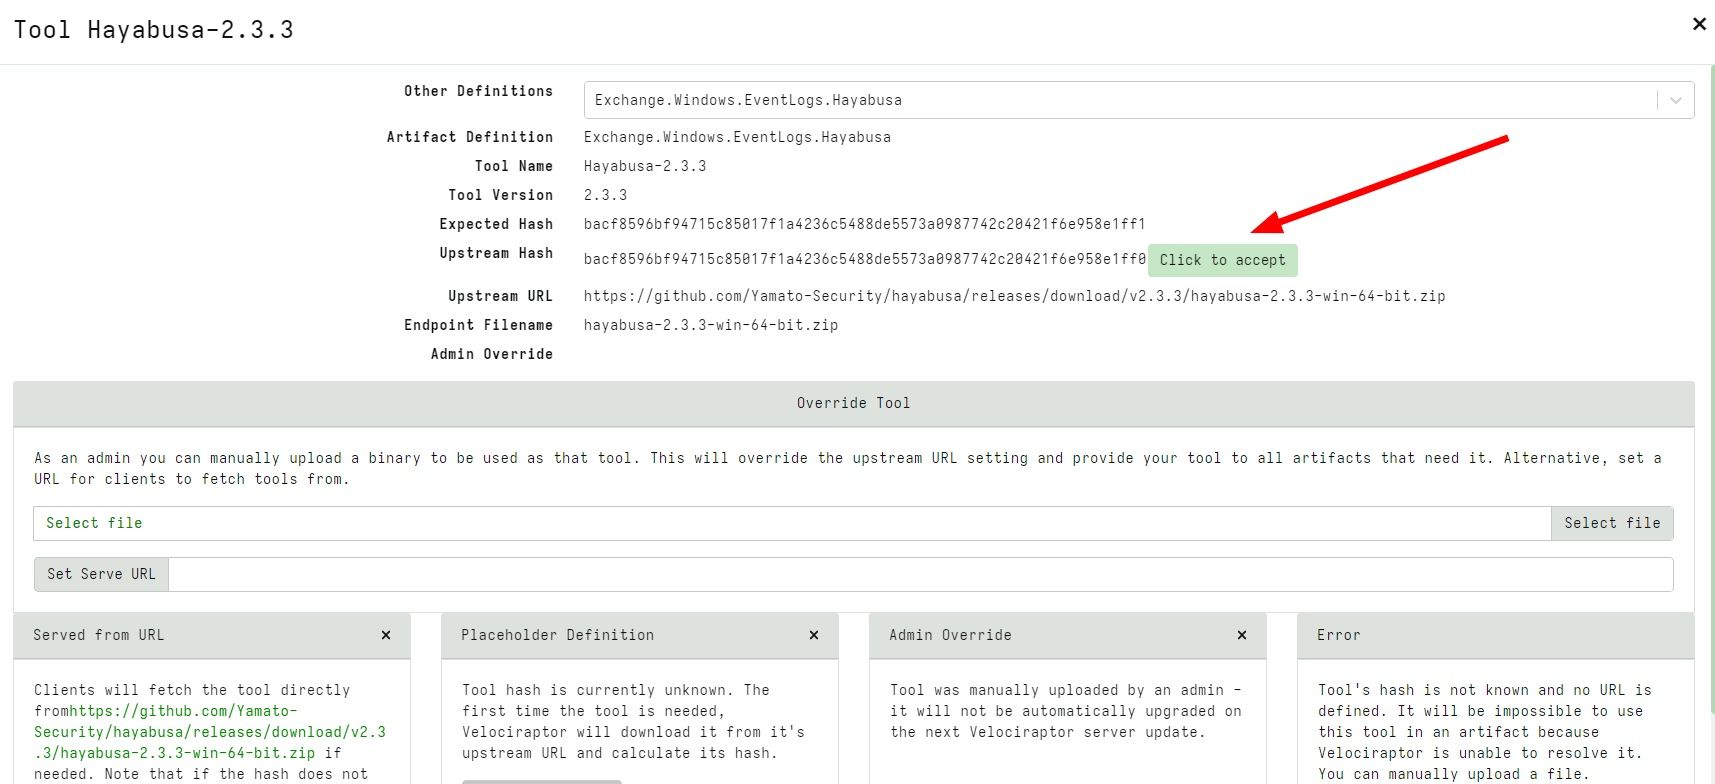
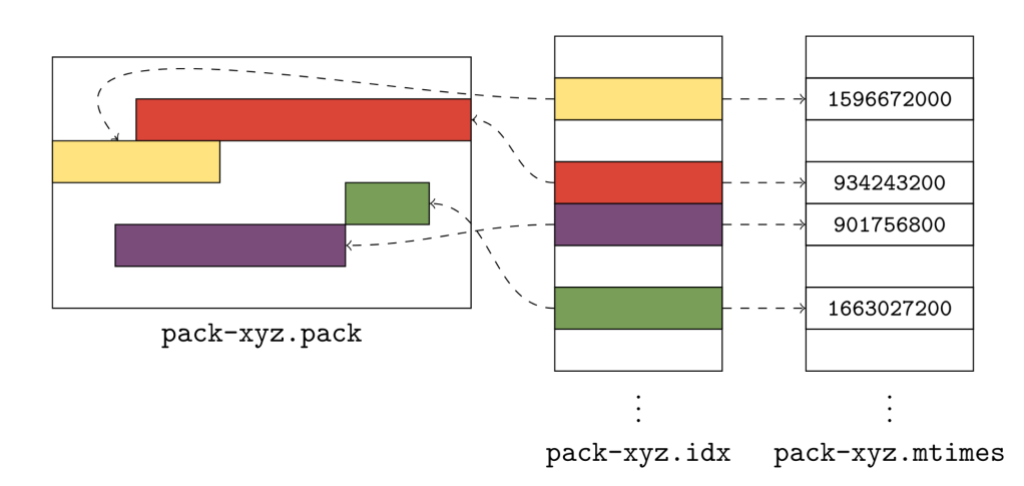
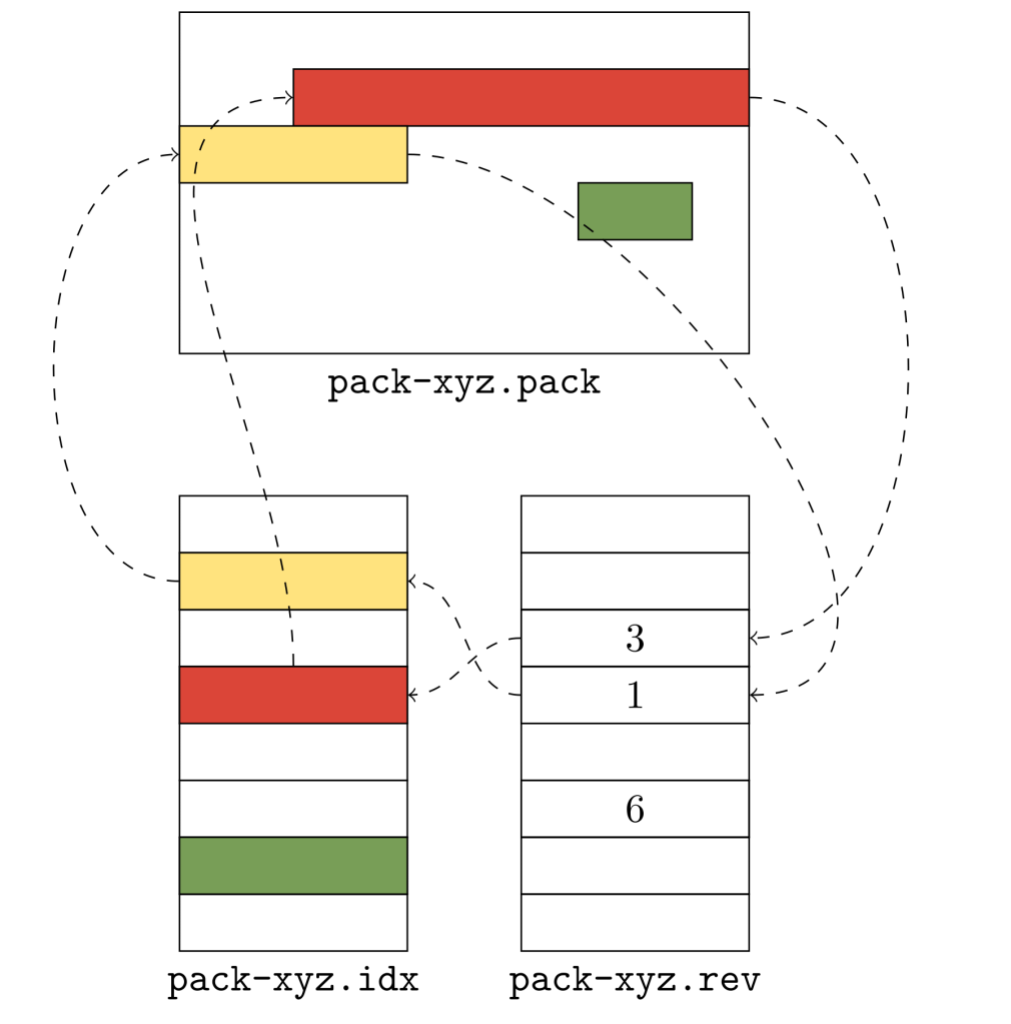





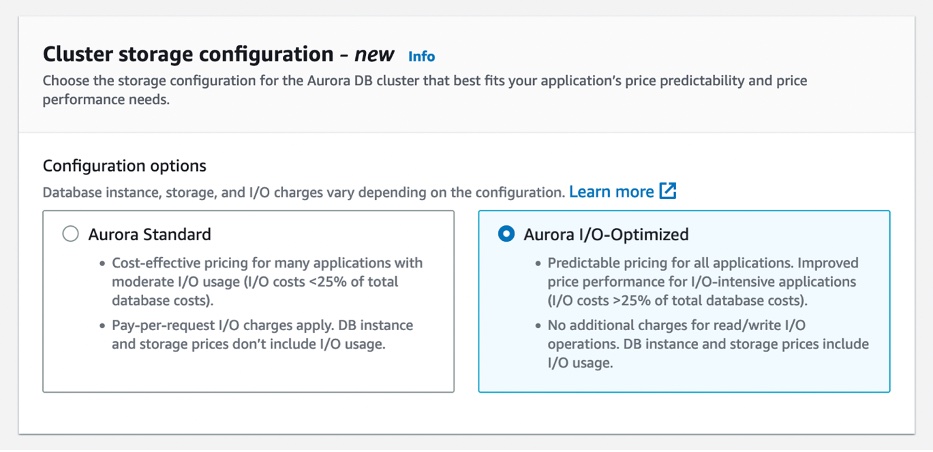

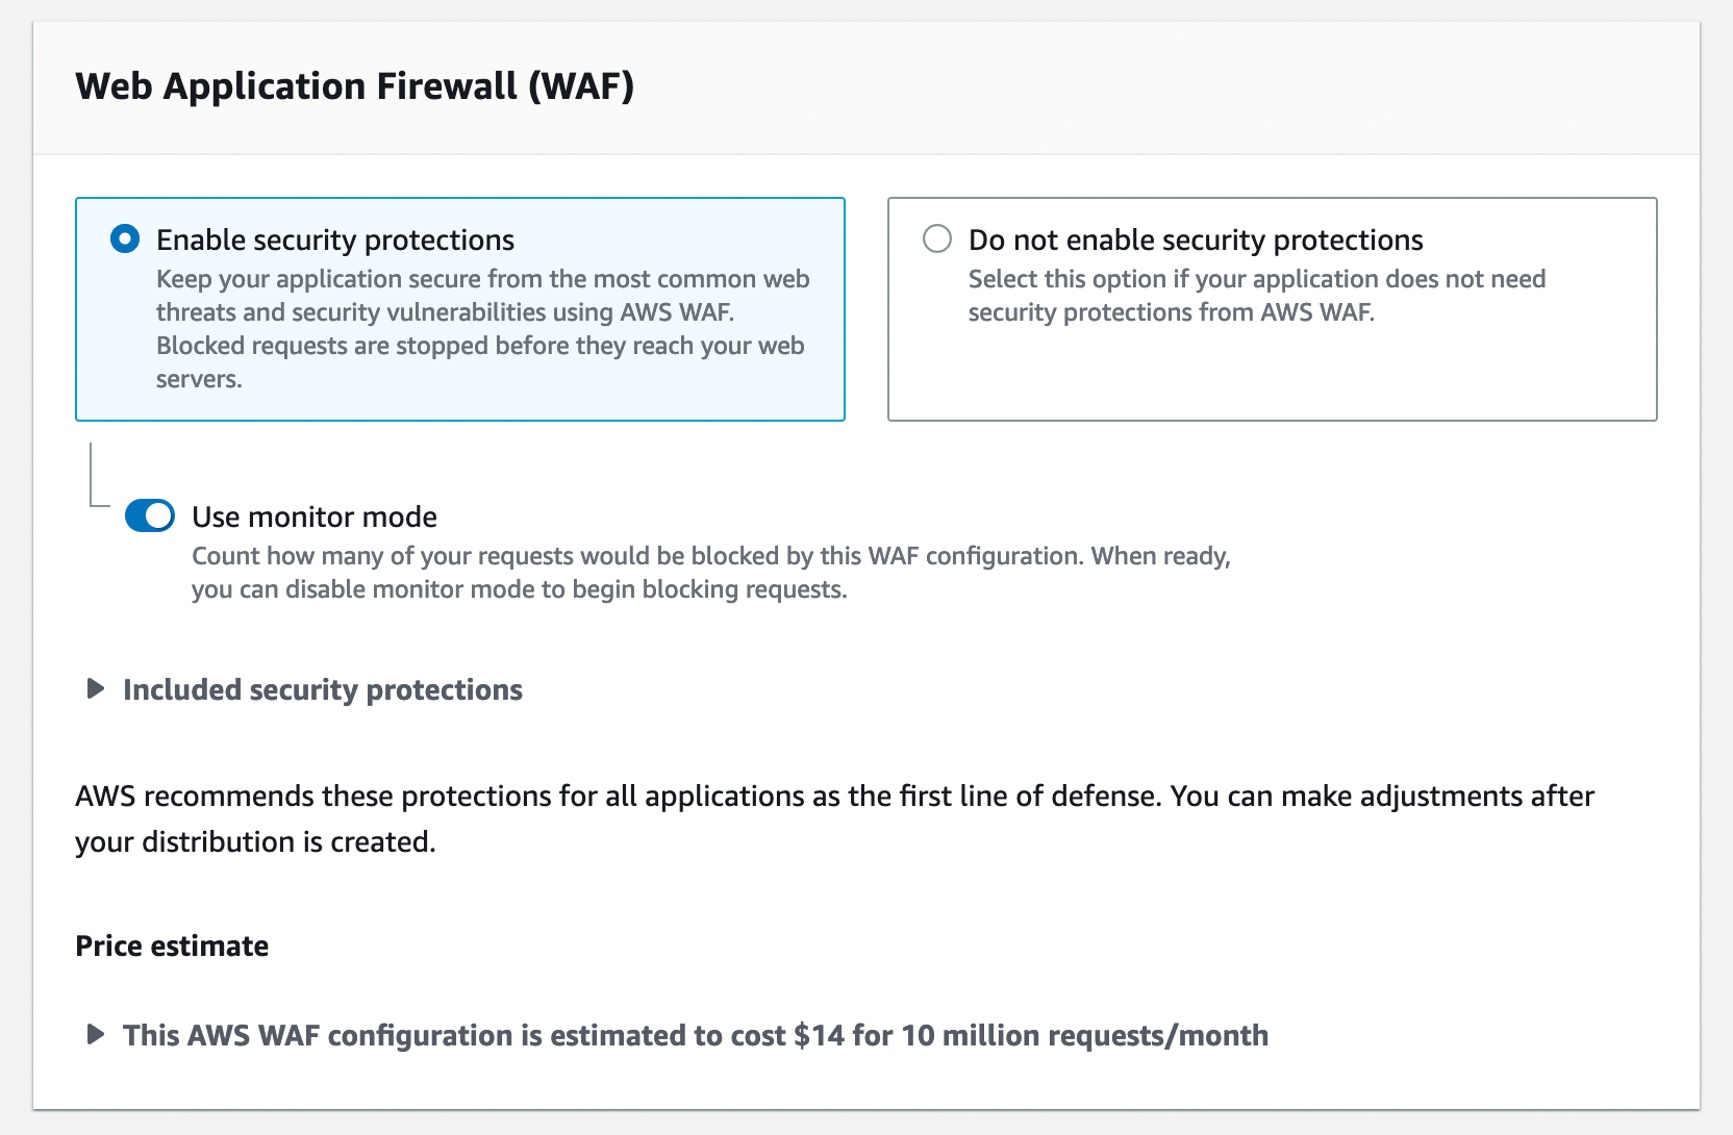
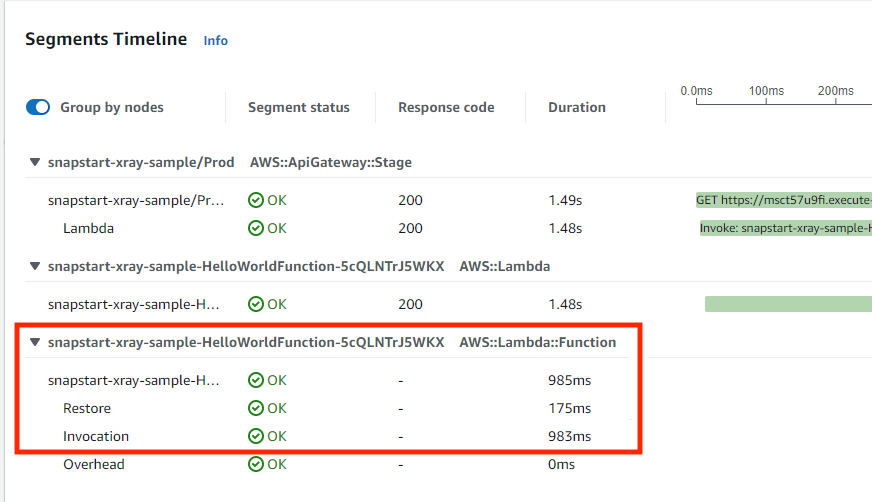


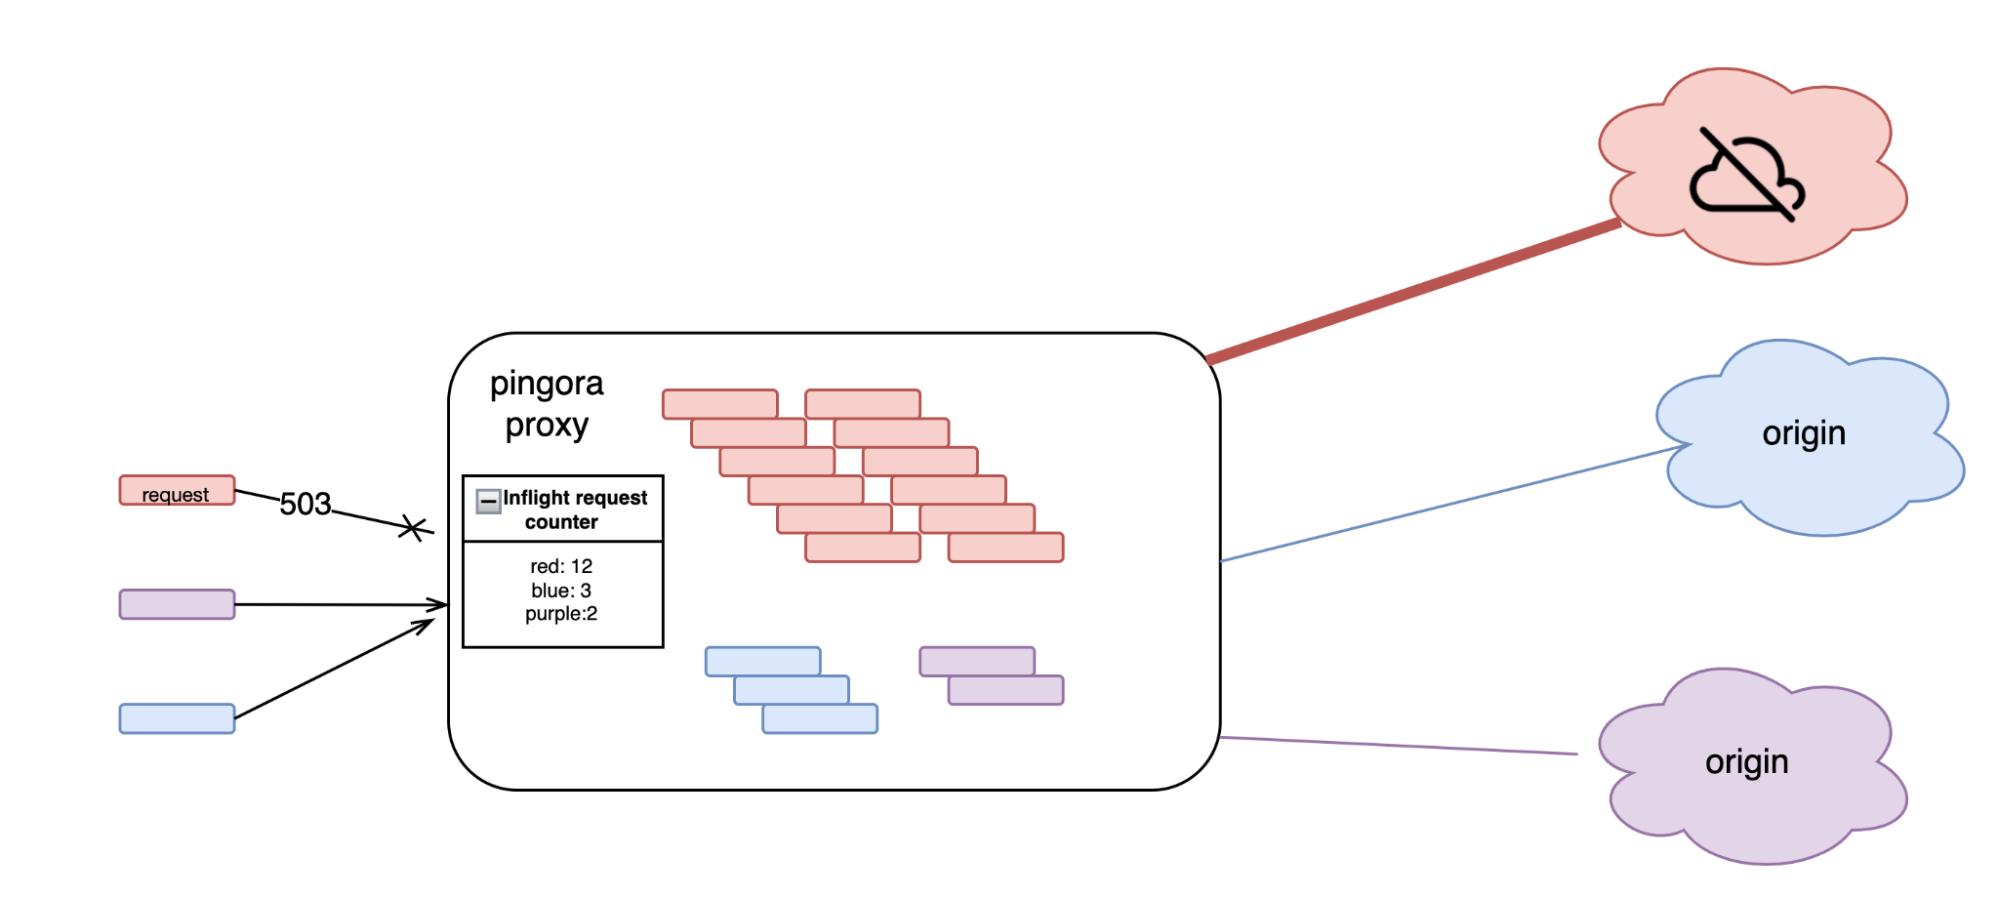




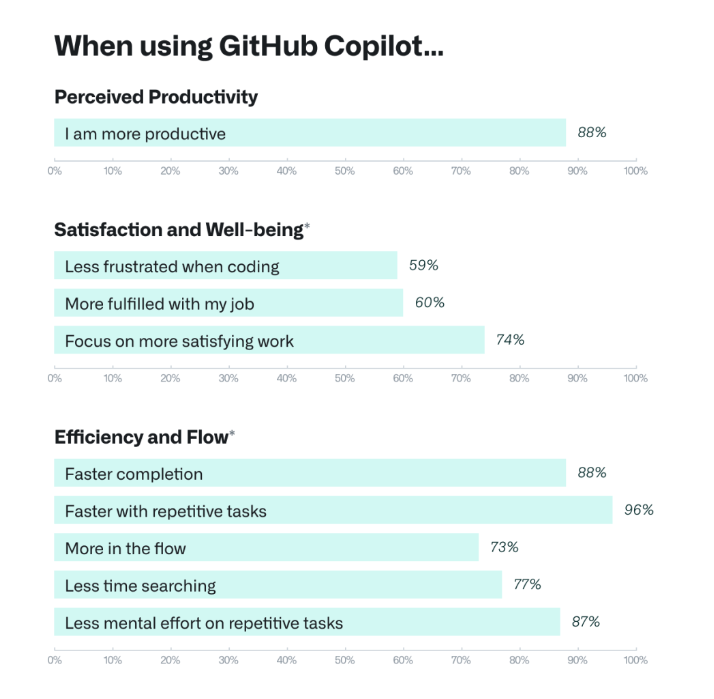


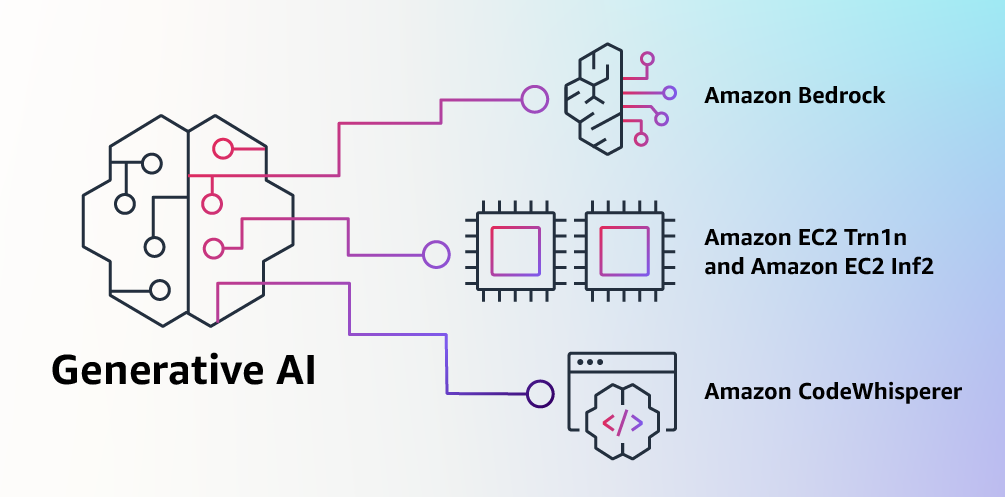
 .NET Developer Day –