Tag Archives: Technical How-to

Introducing Amazon MWAA Serverless

Post Syndicated from John Jackson original https://aws.amazon.com/blogs/big-data/introducing-amazon-mwaa-serverless/

Today, AWS announced Amazon Managed Workflows for Apache Airflow (MWAA) Serverless. This is a new deployment option for MWAA that eliminates the operational overhead of managing Apache Airflow environments while optimizing costs through serverless scaling. This new offering addresses key challenges that data engineers and DevOps teams face when orchestrating workflows: operational scalability, cost optimization, and access management.

With MWAA Serverless you can focus on your workflow logic rather than monitoring for provisioned capacity. You can now submit your Airflow workflows for execution on a schedule or on demand, paying only for the actual compute time used during each task’s execution. The service automatically handles all infrastructure scaling so that your workflows run efficiently regardless of load.

Beyond simplified operations, MWAA Serverless introduces an updated security model for granular control through AWS Identity and Access Management (IAM). Each workflow can now have its own IAM permissions, running on a VPC of your choosing so you can implement precise security controls without creating separate Airflow environments. This approach significantly reduces security management overhead while strengthening your security posture.

In this post, we demonstrate how to use MWAA Serverless to build and deploy scalable workflow automation solutions. We walk through practical examples of creating and deploying workflows, setting up observability through Amazon CloudWatch, and converting existing Apache Airflow DAGs (Directed Acyclic Graphs) to the serverless format. We also explore best practices for managing serverless workflows and show you how to implement monitoring and logging.

How does MWAA Serverless work?

MWAA Serverless processes your workflow definitions and executes them efficiently in service-managed Airflow environments, automatically scaling resources based on workflow demands. MWAA Serverless uses the Amazon Elastic Container Service (Amazon ECS) executor to run each individual task on its own ECS Fargate container, on either your VPC or a service-managed VPC. Those containers then communicate back to their assigned Airflow cluster using the Airflow 3 Task API.


Figure 1: Amazon MWAA Architecture

MWAA Serverless uses declarative YAML configuration files based on the popular open source DAG Factory format to enhance security through task isolation. You have two options for creating these workflow definitions:

This declarative approach provides two key benefits. First, since MWAA Serverless reads workflow definitions from YAML it can determine task scheduling without running any workflow code. Second, this allows MWAA Serverless to grant execution permissions only when tasks run, rather than requiring broad permissions at the workflow level. The result is a more secure environment where task permissions are precisely scoped and time limited.

Service considerations for MWAA Serverless

MWAA Serverless has the following limitations that you should consider when deciding between serverless and provisioned MWAA deployments:

  • Operator support
    • MWAA Serverless only supports operators from the Amazon Provider Package.
    • To execute custom code or scripts, you’ll need to use AWS services, such as:
  • User interface
    • MWAA Serverless operates without using the Airflow web interface.
    • For workflow monitoring and management, we provide integration with Amazon CloudWatch and AWS CloudTrail.

Working with MWAA Serverless

Complete the following prerequisites and steps to use MWAA Serverless.

Prerequisites

Before you begin, verify you have the following requirements in place:

  • Access and permissions
    • An AWS account
    • AWS Command Line Interface (AWS CLI) version 2.31.38 or later installed and configured
    • The appropriate permissions to create and modify IAM roles and policies, including the following required IAM permissions:
      • airflow-serverless:CreateWorkflow
      • airflow-serverless:DeleteWorkflow
      • airflow-serverless:GetTaskInstance
      • airflow-serverless:GetWorkflowRun
      • airflow-serverless:ListTaskInstances
      • airflow-serverless:ListWorkflowRuns
      • airflow-serverless:ListWorkflows
      • airflow-serverless:StartWorkflowRun
      • airflow-serverless:UpdateWorkflow
      • iam:CreateRole
      • iam:DeleteRole
      • iam:DeleteRolePolicy
      • iam:GetRole
      • iam:PutRolePolicy
      • iam:UpdateAssumeRolePolicy
      • logs:CreateLogGroup
      • logs:CreateLogStream
      • logs:PutLogEvents
      • airflow:GetEnvironment
      • airflow:ListEnvironments
      • s3:DeleteObject
      • s3:GetObject
      • s3:ListBucket
      • s3:PutObject
      • s3:Sync
    • Access to an Amazon Virtual Private Cloud (VPC) with internet connectivity
  • Required AWS services – In addition to MWAA Serverless you will need access to the following AWS services:
    • Amazon MWAA to access your existing Airflow environment(s)
    • Amazon CloudWatch to view logs
    • Amazon S3 for DAG and YAML file management
    • AWS IAM to control permissions
  • Development environment
  • Additional requirements
    • Basic familiarity with Apache Airflow concepts
    • Understanding of YAML syntax
    • Knowledge of AWS CLI commands

Note: Throughout this post, we use example values that you’ll need to replace with your own:

  • Replace amzn-s3-demo-bucket with your S3 bucket name
  • Replace 111122223333 with your AWS account number
  • Replace us-east-2 with your AWS Region. MWAA Serverless is available in multiple AWS Regions. Check the List of AWS Services Available by Region for current availability.

Creating your first serverless workflow

Let’s start by defining a simple workflow that gets a list of S3 objects and writes that list to a file in the same bucket. Create a new file called simple_s3_test.yaml with the following content:

simples3test:
  dag_id: simples3test
  schedule: 0 0 * * *
  tasks:
    list_objects:
      operator: airflow.providers.amazon.aws.operators.s3.S3ListOperator
      bucket: 'amzn-s3-demo-bucket'
      prefix: ''
      retries: 0
    create_object_list:
      operator: airflow.providers.amazon.aws.operators.s3.S3CreateObjectOperator
      data: '{{ ti.xcom_pull(task_ids="list_objects", key="return_value") }}'
      s3_bucket: 'amzn-s3-demo-bucket'
      s3_key: 'filelist.txt'
      dependencies: [list_objects]

For this workflow to run, you must create an Execution role that has permissions to list and write to the above bucket. The role also needs to be assumable from MWAA Serverless. The following CLI commands create this role and its associated policy:

aws iam create-role \
--role-name mwaa-serverless-access-role \
--assume-role-policy-document '{
    "Version": "2012-10-17",
    "Statement": [
      {
        "Effect": "Allow",
        "Principal": {
          "Service": [
            "airflow-serverless.amazonaws.com"
          ]
        },
        "Action": "sts:AssumeRole"
      },
      {
        "Sid": "AllowAirflowServerlessAssumeRole",
        "Effect": "Allow",
        "Principal": {
          "Service": "airflow-serverless.amazonaws.com"
        },
        "Action": "sts:AssumeRole",
        "Condition": {
          "StringEquals": {
            "aws:SourceAccount": "${aws:PrincipalAccount}"
          },
          "ArnLike": {
            "aws:SourceArn": "arn:aws:*:*:${aws:PrincipalAccount}:workflow/*"
          }
        }
      }
    ]
  }'

aws iam put-role-policy \
  --role-name mwaa-serverless-access-role \
  --policy-name mwaa-serverless-policy   \
  --policy-document '{
	"Version": "2012-10-17",
	"Statement": [
		{
			"Sid": "CloudWatchLogsAccess",
			"Effect": "Allow",
			"Action": [
				"logs:CreateLogGroup",
				"logs:CreateLogStream",
				"logs:PutLogEvents"
			],
			"Resource": "*"
		},
		{
			"Sid": "S3DataAccess",
			"Effect": "Allow",
			"Action": [
				"s3:ListBucket",
				"s3:GetObject",
				"s3:PutObject"
			],
			"Resource": [
				"arn:aws:s3:::amzn-s3-demo-bucket",
				"arn:aws:s3:::amzn-s3-demo-bucket/*"
			]
		}
	]
}'

You then copy your YAML DAG to the same S3 bucket, and create your workflow based upon the Arn response from the above function.

aws s3 cp "simple_s3_test.yaml" \
s3://amzn-s3-demo-bucket/yaml/simple_s3_test.yaml

aws mwaa-serverless create-workflow \
--name simple_s3_test \
--definition-s3-location '{ "Bucket": "amzn-s3-demo-bucket", "ObjectKey": "yaml/simple_s3_test.yaml" }' \
--role-arn arn:aws:iam::111122223333:role/mwaa-serverless-access-role \
--region us-east-2

The output of the last command returns a WorkflowARN value, which you then use to run the workflow:

aws mwaa-serverless start-workflow-run \
--workflow-arn arn:aws:airflow-serverless:us-east-2:111122223333:workflow/simple_s3_test-abc1234def \
--region us-east-2

The output returns a RunId value, which you then use to check the status of the workflow run that you just executed.

aws mwaa-serverless get-workflow-run \
--workflow-arn arn:aws:airflow-serverless:us-east-2:111122223333:workflow/simple_s3_test-abc1234def \
--run-id ABC123456789def \
--region us-east-2

If you need to make a change to your YAML, you can copy back to S3 and run the update-workflow command.

aws s3 cp "simple_s3_test.yaml" \
s3://amzn-s3-demo-bucket/yaml/simple_s3_test.yaml

aws mwaa-serverless update-workflow \
--workflow-arn arn:aws:airflow-serverless:us-east-2:111122223333:workflow/simple_s3_test-abc1234def \
--definition-s3-location '{ "Bucket": "amzn-s3-demo-bucket", "ObjectKey": "yaml/simple_s3_test.yaml" }' \
--role-arn arn:aws:iam::111122223333:role/mwaa-serverless-access-role \
--region us-east-2

Converting Python DAGs to YAML format

AWS has published a conversion tool that uses the open-source Airflow DAG processor to serialize Python DAGs into YAML DAG factory format. To install, you run the following:

pip3 install python-to-yaml-dag-converter-mwaa-serverless
dag-converter convert source_dag.py --output output_yaml_folder

For example, create the following DAG and name it create_s3_objects.py:

from datetime import datetime
from airflow import DAG
from airflow.models.param import Param
from airflow.providers.amazon.aws.operators.s3 import S3CreateObjectOperator

default_args = {
    'start_date': datetime(2024, 1, 1),
    'retries': 0,
}

dag = DAG(
    'create_s3_objects',
    default_args=default_args,
    description='Create multiple S3 objects in a loop',
    schedule=None
)

# Set number of files to create
LOOP_COUNT = 3
s3_bucket = 'md-workflows-mwaa-bucket'
s3_prefix = 'test-files'

# Create multiple S3 objects using loop
last_task=None
for i in range(1, LOOP_COUNT + 1):  
    create_object = S3CreateObjectOperator(
        task_id=f'create_object_{i}',
        s3_bucket=s3_bucket,
        s3_key=f'{s3_prefix}/{i}.txt',
        data='{{ ds_nodash }}-{{ ts_nodash | lower }}',
        replace=True,
        dag=dag
    )
    if last_task:
        last_task >> create_object
    last_task = create_object

Once you have installed python-to-yaml-dag-converter-mwaa-serverless, you run:

dag-converter convert "/path_to/create_s3_objects.py" --output "/path_to/yaml/"

Where the output will end with:

YAML validation successful, no errors found

YAML written to /path_to/yaml/create_s3_objects.yaml

And resulting YAML will look like:

create_s3_objects:
  dag_id: create_s3_objects
  params: {}
  default_args:
    start_date: '2024-01-01'
    retries: 0
  schedule: None
  tasks:
    create_object_1:
      operator: airflow.providers.amazon.aws.operators.s3.S3CreateObjectOperator
      aws_conn_id: aws_default
      data: '{{ ds_nodash }}-{{ ts_nodash | lower }}'
      encrypt: false
      outlets: []
      params: {}
      priority_weight: 1
      replace: true
      retries: 0
      retry_delay: 300.0
      retry_exponential_backoff: false
      s3_bucket: md-workflows-mwaa-bucket
      s3_key: test-files/1.txt
      task_id: create_object_1
      trigger_rule: all_success
      wait_for_downstream: false
      dependencies: []
    create_object_2:
      operator: airflow.providers.amazon.aws.operators.s3.S3CreateObjectOperator
      aws_conn_id: aws_default
      data: '{{ ds_nodash }}-{{ ts_nodash | lower }}'
      encrypt: false
      outlets: []
      params: {}
      priority_weight: 1
      replace: true
      retries: 0
      retry_delay: 300.0
      retry_exponential_backoff: false
      s3_bucket: md-workflows-mwaa-bucket
      s3_key: test-files/2.txt
      task_id: create_object_2
      trigger_rule: all_success
      wait_for_downstream: false
      dependencies: [create_object_1]
    create_object_3:
      operator: airflow.providers.amazon.aws.operators.s3.S3CreateObjectOperator
      aws_conn_id: aws_default
      data: '{{ ds_nodash }}-{{ ts_nodash | lower }}'
      encrypt: false
      outlets: []
      params: {}
      priority_weight: 1
      replace: true
      retries: 0
      retry_delay: 300.0
      retry_exponential_backoff: false
      s3_bucket: md-workflows-mwaa-bucket
      s3_key: test-files/3.txt
      task_id: create_object_3
      trigger_rule: all_success
      wait_for_downstream: false
      dependencies: [create_object_2]
  catchup: false
  description: Create multiple S3 objects in a loop
  max_active_runs: 16
  max_active_tasks: 16
  max_consecutive_failed_dag_runs: 0

Note that, because the YAML conversion is done after the DAG parsing, the loop that creates the tasks is run first and the resulting static list of tasks is written to the YAML document with their dependencies.

Migrating an MWAA environment’s DAGs to MWAA Serverless

You can take advantage of a provisioned MWAA environment to develop and test your workflows and then move them to serverless to run efficiently at scale. Further, if your MWAA environment is using compatible MWAA Serverless operators, then you can convert all of the environment’s DAGs at once. The first step is to allow MWAA Serverless to assume the MWAA Execution role via a trust relationship. This is a one-time operation for each MWAA Execution role, and can be performed manually in the IAM console or using an AWS CLI command as follows:

MWAA_ENVIRONMENT_NAME="MyAirflowEnvironment"
MWAA_REGION=us-east-2

MWAA_EXECUTION_ROLE_ARN=$(aws mwaa get-environment --region $MWAA_REGION --name $MWAA_ENVIRONMENT_NAME --query 'Environment.ExecutionRoleArn' --output text )
MWAA_EXECUTION_ROLE_NAME=$(echo $MWAA_EXECUTION_ROLE_ARN | xargs basename) 
MWAA_EXECUTION_ROLE_POLICY=$(aws iam get-role --role-name $MWAA_EXECUTION_ROLE_NAME --query 'Role.AssumeRolePolicyDocument' --output json | jq '.Statement[0].Principal.Service += ["airflow-serverless.amazonaws.com"] | .Statement[0].Principal.Service |= unique | .Statement += [{"Sid": "AllowAirflowServerlessAssumeRole", "Effect": "Allow", "Principal": {"Service": "airflow-serverless.amazonaws.com"}, "Action": "sts:AssumeRole", "Condition": {"StringEquals": {"aws:SourceAccount": "${aws:PrincipalAccount}"}, "ArnLike": {"aws:SourceArn": "arn:aws:*:*:${aws:PrincipalAccount}:workflow/*"}}}]')

aws iam update-assume-role-policy --role-name $MWAA_EXECUTION_ROLE_NAME --policy-document "$MWAA_EXECUTION_ROLE_POLICY"

Now we can loop through each successfully converted DAG and create serverless workflows for each.

S3_BUCKET=$(aws mwaa get-environment --name $MWAA_ENVIRONMENT_NAME --query 'Environment.SourceBucketArn' --output text --region us-east-2 | cut -d':' -f6)

for file in /tmp/yaml/*.yaml; do MWAA_WORKFLOW_NAME=$(basename "$file" .yaml); \
      aws s3 cp "$file" s3://$S3_BUCKET/yaml/$MWAA_WORKFLOW_NAME.yaml --region us-east-2; \
      aws mwaa-serverless create-workflow --name $MWAA_WORKFLOW_NAME \
      --definition-s3-location "{\"Bucket\": \"$S3_BUCKET\", \"ObjectKey\": \"yaml/$MWAA_WORKFLOW_NAME.yaml\"}" --role-arn $MWAA_EXECUTION_ROLE_ARN  \
      --region us-east-2  
      done

To see a list of your created workflows, run:

aws mwaa-serverless list-workflows --region us-east-2

Monitoring and observability

MWAA Serverless workflow execution status is returned via the GetWorkflowRun function. The results from that will return details for that particular run. If there are errors in the workflow definition, they are returned under RunDetail in the ErrorMessage field as in the following example:

{
  "WorkflowVersion": "7bcd36ce4d42f5cf23bfee67a0f816c6",
  "RunId": "d58cxqdClpTVjeN",
  "RunType": "SCHEDULE",
  "RunDetail": {
    "ModifiedAt": "2025-11-03T08:02:47.625851+00:00",
    "ErrorMessage": "expected token ',', got 'create_test_table'",
    "TaskInstances": [],
    "RunState": "FAILED"
  }
}

Workflows that are properly defined, but whose tasks fail, will return "ErrorMessage": "Workflow execution failed":

{
  "WorkflowVersion": "0ad517eb5e33deca45a2514c0569079d",
  "RunId": "ABC123456789def",
  "RunType": "SCHEDULE",
  "RunDetail": {
    "StartedOn": "2025-11-03T13:12:09.904466+00:00",
    "CompletedOn": "2025-11-03T13:13:57.620605+00:00",
    "ModifiedAt": "2025-11-03T13:16:08.888182+00:00",
    "Duration": 107,
    "ErrorMessage": "Workflow execution failed",
    "TaskInstances": [
      "ex_5496697b-900d-4008-8d6f-5e43767d6e36_create_bucket_1"
    ],
    "RunState": "FAILED"
  },
}

MWAA Serverless task logs are stored in the CloudWatch log group /aws/mwaa-serverless/<workflow id>/ (where /<workflow id> is the same string as the unique workflow id in the ARN of the workflow). For specific task log streams, you will need to list the tasks for the workflow run and then get each task’s information. You can combine these operations into a single CLI command.

aws mwaa-serverless list-task-instances \
  --workflow-arn arn:aws:airflow-serverless:us-east-2:111122223333:workflow/simple_s3_test-abc1234def \
  --run-id ABC123456789def \
  --region us-east-2 \
  --query 'TaskInstances[].TaskInstanceId' \
  --output text | xargs -n 1 -I {} aws mwaa-serverless get-task-instance \
  --workflow-arn arn:aws:airflow-serverless:us-east-2:111122223333:workflow/simple_s3_test-abc1234def \
  --run-id ABC123456789def \
  --task-instance-id {} \
  --region us-east-2 \
  --query '{Status: Status, StartedAt: StartedAt, LogStream: LogStream}'

Which would result in the following:

{
    "Status": "SUCCESS",
    "StartedAt": "2025-10-28T21:21:31.753447+00:00",
    "LogStream": "//aws/mwaa-serverless/simple_s3_test_3-abc1234def//workflow_id=simple_s3_test-abc1234def/run_id=ABC123456789def/task_id=list_objects/attempt=1.log"
}
{
    "Status": "FAILED",
    "StartedAt": "2025-10-28T21:23:13.446256+00:00",
    "LogStream": "//aws/mwaa-serverless/simple_s3_test_3-abc1234def//workflow_id=simple_s3_test-abc1234def/run_id=ABC123456789def/task_id=create_object_list/attempt=1.log"
}

At which point, you would use the CloudWatch LogStream output to debug your workflow.

You may view and manage your workflows in the Amazon MWAA Serverless console:

For an example that creates detailed metrics and monitoring dashboard using AWS Lambda, Amazon CloudWatch, Amazon DynamoDB, and Amazon EventBridge, review the example in this GitHub repository.

Clean up resources

To avoid incurring ongoing charges, follow these steps to clean up all resources created during this tutorial:

  1. Delete MWAA Serverless workflows – Run this AWS CLI command to delete all workflows:
    aws mwaa-serverless list-workflows --query 'Workflows[*].WorkflowArn' --output text | while read -r workflow; do aws mwaa-serverless delete-workflow --workflow-arn $workflow done

  2. Remove the IAM roles and policies created for this tutorial:
    aws iam delete-role-policy --role-name mwaa-serverless-access-role --policy-name mwaa-serverless-policy

  3. Remove the YAML workflow definitions from your S3 bucket:
    aws s3 rm s3://amzn-s3-demo-bucket/yaml/ --recursive

After completing these steps, verify in the AWS Management Console that all resources have been properly removed. Remember that CloudWatch Logs are retained by default and may need to be deleted separately if you want to remove all traces of your workflow executions.

If you encounter any errors during cleanup, verify you have the necessary permissions and that resources exist before attempting to delete them. Some resources may have dependencies that require them to be deleted in a specific order.

Conclusion

In this post, we explored Amazon MWAA Serverless, a new deployment option that simplifies Apache Airflow workflow management. We demonstrated how to create workflows using YAML definitions, convert existing Python DAGs to the serverless format, and monitor your workflows.

MWAA Serverless offers several key advantages:

  • No provisioning overhead
  • Pay-per-use pricing model
  • Automatic scaling based on workflow demands
  • Enhanced security through granular IAM permissions
  • Simplified workflow definitions using YAML

To learn more MWAA Serverless, review the documentation.


About the authors

John Jackson

John Jackson

John has over 25 years of software experience as a developer, systems architect, and product manager in both startups and large corporations and is the AWS Principal Product Manager responsible for Amazon MWAA.

Handle unpredictable processing times with operational consistency when integrating asynchronous AWS services with an AWS Step Functions state machine

Post Syndicated from Philip Whiteside original https://aws.amazon.com/blogs/compute/handle-unpredictable-processing-times-with-operational-consistency-when-integrating-asynchronous-aws-services-with-an-aws-step-functions-state-machine/

Integrating asynchronous AWS services with an AWS Step Functions state machine, presents a challenge when building serverless applications on Amazon Web Services (AWS). Services such as Amazon Translate, Amazon Macie, and Amazon Bedrock Data Automation (BDA) excel at handling long-running operations that can take more than 10 minutes to complete because of their asynchronous nature. Asynchronous services return an immediate 200 OK response, indicating that the request has succeeded, upon job submission (see the API response syntax of StartTextTranslationJob in Amazon Translate, CreateClassificationJob in Macie, and InvokeDataAutomationAsync in BDA), rather than waiting for the actual task completion and results.

In this post, we explore using AWS Step Function state machine with asynchronous AWS services, look at some scenarios where the processing time can be unpredictable, explain when traditional solutions such as polling (periodically check) fall short, and demonstrate how to implement a generalized callback pattern to handle asynchronous operations into a more manageable synchronous flow. We cover the related architecture, technical implementation, and best practices, and we provide a real-world examples that uses the AWS Cloud Development Kit (AWS CDK). Services used in this generalized callback pattern include Amazon DynamoDB, Amazon EventBridge and AWS Step Functions.

Understanding the issue this solution addresses

Asynchronous operations are designed to handle long-running operations without blocking resources, a design followed by many AWS services. However, these services create challenges in Step Functions workflows by returning immediate 200 OK responses rather than confirming task completion. This breaks the Step Functions execution model, which expects each step to be complete before advancing. Developers often attempt to address this issue through polling loops to repeatedly check the status of operations, an approach that works for containerized applications and Amazon Elastic Compute Cloud (Amazon EC2). For these services, compute resources are already provisioned, but compute resources become problematic in serverless architectures when AWS Lambda functions have a 15-minute execution limit, making them unsuitable for long-running polls.

Step Functions supports Run a Job (.sync) to call a service and have Step Functions wait for a job to complete, but this works only for selected optimized integrations. However, this functionality is limited to specific AWS services such as AWS Glue. Amazon Translate, Macie, and other services are not optimized integrations. If your operation is not listed as working with .sync, it can benefit from the generalized callback pattern covered in this post.

For these non-optimized integrations, an option is to use polling (periodically check). However, polling can lead to additional latency in response because polling times are unlikely to align with job completion. This is shown in the following figure.

Timeline diagram showing alternating 'Job' blocks and 'Delay' blocks, with 'Poll' markers indicated at regular intervals along the time axis. The diagram illustrates a sequential process of job execution and delay periods.

Figure 1: A job processing and delay timeline diagram

The Step Functions generalized callback pattern can solve this latency issue by pausing execution for up to one year while waiting for task completion (this does not incur additional cost). When such an asynchronous operation finishes, a callback mechanism resumes the workflow where it left off. This generalized callback pattern transforms asynchronous operations into synchronous ones, and it maintains cost efficiency and operational agility.

Scenarios

To help us see where this generalized callback pattern could be applied, let’s look at a few scenarios. Each of these scenarios makes use of AWS Step Functions state machines to run the applications’ workflows.

Scenario 1: Document translation with personally identifiable information compliance

Organizations must manage personally identifiable information (PII) when translating documents because PII can be duplicated across language outputs. For example, when translating a document containing “Jane Doe,” that name appears in both the original and translated versions, creating multiple instances of sensitive data that need compliance measures. Amazon Translate batch translation has a default concurrency of 10, meaning that translations could take more than 10 minutes or be queued for longer periods. Additionally, the Amazon Translate batch translation operation is asynchronous, holding the translation request in a queue until completed. The generalized callback pattern in this post makes sure that Step Functions state machine workflows resume appropriately to apply consistent PII handling across all outputs. In this scenario the design makes use of tagging Amazon Simple Storage Service (Amazon S3) files as containing PII or not, which in turn associates S3 lifecycle policies for specific retention periods to those S3 objects.

Workflow diagram showing five connected steps: 1) Start, 2) StartTextTranslationJob, 3) Wait for Translate result, 4) Tag all files, 5) ending with End state.

Figure 2: A text translation workflow diagram

Scenario 2: Using concurrent execution to pause the state machine until processes have completed

Continuing from scenario 1, Macie and Amazon Translate can run in parallel (each approximately 10 minutes) rather than sequentially (approximately 20 minutes) for a better user experience. Similarly to Amazon Translate batch translation operations being asynchronous, the Macie create classification operation is also asynchronous. Step Functions state machines enable concurrent execution of both service requests. The generalized callback pattern enables the state machine to pause each parallel workflow and resume only when the asynchronous services have completed their jobs. Without this pattern, both services would immediately return 200 OK responses, causing the workflow to continue prematurely before translations or classification results are available. If the classification results are not available later in the workflow, then the appropriate PII tags will not be applied and therefore the appropriate lifecycle retention policy will also not be applied, resulting in not adhering to PII handling practices.

Figure 3: A parallel classification and translation workflow diagram

Scenario 3: Intelligent document processing

Organizations that use Bedrock Data Automation for intelligent document processing must take into consideration Regional concurrency limits. BDA has Regional concurrency limits “Max number of concurrent jobs” of 25 jobs in the us-east-1 and us-west-2 Regions. Also, BDA has a concurrency limit of only five jobs in other supported Regions, so large document batches could be queued for extended periods resulting in long processing wait times for the user. This service functionality is handled asynchronously as the duration of the request could be many minutes. The generalized callback pattern makes sure that workflows resume appropriately as soon as a job finishes rather than waiting an arbitrary time to check if the job has been completed. For example, the generalized callback pattern for BDA can be used to enhance the solution outlined in the blog post, Scalable intelligent document processing using Amazon Bedrock Data Automation.

Figure 4: A data automation workflow diagram

Solution architecture

The following architecture diagram shows the generalized callback pattern (the blue section on the right side) integrated with your existing application (the grey section on the left side).

Figure 5: The Step Functions generalized callback architecture

Key components of this post’s solution architecture

This generalized callback pattern architecture consists of four essential components working together. Each component plays a specific role while maintaining cost efficiency and operational reliability. The following components form the foundation of this pattern:

  • Step Functions task: Implements the “Wait for Callback” task state generating unique task tokens for workflow resumption.
  • EventBridge rule: Monitors asynchronous service completion events and is customizable for different service patterns. AWS services make use of an event bus to route service event notifications to other services, such as job completions.
  • DynamoDB: Provides persistent storage correlating job IDs with task tokens for quick lookup.
  • Step Functions state machine: Manages the resume process and makes sure of proper cleanup of stored tokens.

Solution process

This generalized callback pattern operates through a coordinated sequence of four key steps. Each step builds upon the previous one. The following process demonstrates how the pattern manages workflow execution. The diagram above shows more detailed steps following these key steps.

  1. Start the asynchronous operation for which you want to wait for completion. The asynchronous service responds with success (200 OK) and the state machine continues. Initiating an Amazon Translate batch translation operation is one example of such an asynchronous operation.
  2. Trigger the generalized callback pattern with the “Wait for Callback” capability. Pair the task token with the jobId in DynamoDB using the unique jobId as the primary key. Example:
    {
        id    = translationJobId,
        token = stepFunctionTaskToken
    }
  3. Monitor for completion: When the asynchronous service completes the requested job, such as translation of documents, an event is created in EventBridge that contains the jobId and status. Example:
    {
        jobId  = translationJobId,
        status = complete
    }
    
  4. Resume workflow: The EventBridge rule triggers the workflow to resume, which looks up the task token using the jobId, resumes the paused Step Functions execution, and cleans up the database entry.

Not every service creates events for every action, so validate that your service operation generates the expected events. For example, Macie does not create events when no findings are discovered. In these cases, implement more event generation mechanisms through Amazon CloudWatch Logs subscriptions that trigger Lambda functions to create custom events.

Technical implementation of the solution

For rapid deployment of this post’s solution, AWS CDK users can use this sample CDK pattern with all key components. Alternatively, you can implement the individual components yourself by using the following steps, with each component customizable to your requirements.

Some of the JSON-based snippets below are Amazon States Language (ASL) snippets, which is the language that defines an AWS Step Functions state machine. State machines can be built in the AWS Console using the drag and drop visual builder, or with ASL. The visual builder generates this ASL and you can toggle to view/edit the workflow code (ASL).

Use a Step Functions task that supports “WaitForCallback” to store task token in DynamoDB

Use a Step Functions task that supports ”WaitForCallback” to store the task token in DynamoDB alongside the job ID from the asynchronous service.

AWS services generate a unique ID for that service which refers to that job/request/action. DynamoDB holds the mappings between job IDs and task tokens, supporting multiple state machines paused in parallel with concurrent execution. To prevent clashes when different asynchronous services generate overlapping IDs (for example, if Service A and Service B both generate ID “12345”), use separate DynamoDB tables for each service to maintain ID uniqueness. The sample AWS CDK pattern demonstrates this approach by providing dedicated DynamoDB tables and Step Functions state machines for each service integration. This ID-token structure allows for quick lookups for workflow resumption and cleanup.

The following ASL accomplishes this by using a DynamoDB PutItem task:

"DynamoDB PutItem": {
    "Type": "Task",
    "Resource": "arn:aws:states:::dynamodb:putItem",
    "Parameters": {
        "TableName": "resumeTokenSessionTable",
        "Item": {
            "id":    { "S.$": "$.JobId" },
            "token": { "S.$": "$$.Task.Token" },
            "ttl":   { "S.$": "$.ttl" }
        },
        "ConditionExpression": "attribute_not_exists(id)"
    },
    "Next": "XXXX"
}

In this example, the Item object stores three values: the job ID ($.JobId), the task token ($$.Task.Token), and a TTL value ($.ttl). The ttl field configures Time to Live for automatic cleanup based on your service’s expected completion time. Since this stores only three small string values, data usage per entry is minimal. The primary consideration is the number of concurrent operations, as each active asynchronous job requires one DynamoDB entry until completion or TTL expiration.

The DynamoDB table uses “id” as the primary key and includes a “token” attribute. These fields are essential for the “WaitForCallback” pattern: the “id” (job ID) allows your asynchronous service to look up the correct entry, while the “token” (Step Functions task token) is what your service sends back to Step Functions to resume the paused workflow. The following JSON shows an example of these values:

{
    "id":    { "S": "xxxxxxxx-yyyy-zzzz-aaaa-bbbbbbbbbbbb" },
    "token": { "S": "11111111-2222-3333-4444-555555555555" },
    "ttl":   { "S": "1480550400" }
}

When your asynchronous service completes its work, it retrieves the task token using the job ID, then calls Step Functions with that token to resume execution from where it paused.

The task token acts as a unique identifier for resuming execution at the exact pause point. To prevent overriding an existing record when a duplicate id is used, you can specify a “ConditionExpression”. This ASL shows just the ConditionExpression.

“ConditionExpression”: “attribute_not_exists(id)”

Create an EventBridge rule to monitor event patterns from your asynchronous service

EventBridge integration forms the heart of the event-driven resumption mechanism. You can create EventBridge rules to monitor specific event patterns from asynchronous AWS services. Most AWS services automatically publish completion events to default EventBridge at no cost, and you can use the EventBridge rule wizard to identify correct event patterns. For services that do not publish events—such as Macie that creates no events when no findings are discovered—implement shims by using Amazon CloudWatch Logs to trigger Lambda functions that generate custom events. This JSON shows the EventBridge Rule pattern definition.

"EventPattern": {
    "source": [
        "aws.translate"
    ],
    "detail-type": [
        "Translate TextTranslationJob State Change"
    ],
    "detail": {
        "jobStatus": [
            "COMPLETED"
        ],
    }
}

Resume the workflow

At this point, you know the operation has completed, so you can safely resume the workflow. Using the job ID, call the DynamoDB GetItem operation to receive the task token. This ASL shows the task definition to get the task token for a given job ID retrieved from the event notification.

"getResumeToken": {
    "Next": "sendTaskSuccess",
    "Type": "Task",
    "ResultPath": "$.getResumeToken",
    "Resource": "arn:aws:states:::dynamodb:getItem",
    "Parameters": {
        "Key": {
            "id": { "S.$": "$.id" }
        },
        "TableName": "resumeTokenSessionTable"
    }
}

Use the task token to resume the workflow and then delete the DynamoDB entry for cleanup. This ASL shows the task definition to use the task token to resume the state machine at the point where it was paused at.

"sendTaskSuccess": {
    "Next": "deleteResumeToken",
    "Type": "Task",
    "ResultPath": "$.sendTaskSuccess",
    "Resource": "arn:aws:states:::aws-sdk:sfn:sendTaskSuccess",
    "Parameters": {
        "TaskToken.$": "$.getResumeToken.Item.token.S",
        "Output": {
            "status": "resume"
        }
    }
}

This ASL shows the task definition to clean up the DynamoDB to remove the used task token.

"deleteResumeToken": {
    "End": true,
    "Type": "Task",
    "Resource": "arn:aws:states:::dynamodb:deleteItem",
    "Parameters": {
        "Key": {
            "id": { "S.$": "$.id" }
        },
        "TableName": "resumeTokenSessionTable"
    }
}

This completes the technical implementation of our solution. With all components in place—the WaitForCallback task, EventBridge rules, workflow resumption logic, and DynamoDB storage—you now have a fully functional generalized callback pattern implementation that eliminates polling and efficiently manages asynchronous operations.

Now that we’ve established how to implement the generalized callback pattern technically, let’s explore the best practices and important considerations that will help you optimize and secure your implementation.

Best practices and considerations

When implementing the generalized callback pattern in AWS Step Functions, it’s essential to understand and apply best practices that optimize costs, enhance security, and ensure efficient operation. This section outlines key considerations and recommendations for implementing the pattern effectively, focusing on cost optimization strategies and security measures that help maintain a robust and secure serverless workflow. By following these guidelines, you can maximise the benefits of the generalized callback pattern while minimising potential risks and unnecessary expenses.

Optimize costs by using this post’s generalized callback pattern

Managing costs for long-running asynchronous operations can present challenges. Traditional polling accumulates unnecessary expenses through repeated state transitions and execution time, but this post’s generalized callback pattern is an event-driven approach that significantly reduces operational costs.

Eliminate polling costs and minimize execution time

The generalized callback pattern reduces costs by eliminating polling transitions and pausing execution during wait periods. For standard workflows billed at $0.000025 per state transition, using just two transitions instead of continuous polling achieves approximately an 87% cost reduction. A 15-minute translation job polling every minute would need 15 transitions as opposed to two with the generalized callback pattern. For express workflows billed at $0.000001 per request and $0.00001667 per GB-second, the pattern delivers significant savings through reduced request count and minimal execution time. Traditional polling keeps workflows active during the entire operation, accumulating execution time charges. By contrast, the generalized callback pattern eliminates execution time charges during the wait period. In the translation job example mentioned previously in this paragraph, this could reduce the execution time from more than 15 minutes to just the seconds needed to start jobs and complete processes.

Increase resource efficiency

The callback pattern increases resource efficiency by removing constant polling, resulting in substantial reduction in CloudWatch logging and associated monitoring costs. This creates a more cost-effective solution with a reduced AWS resource footprint.

Further cost-optimize the callback pattern

Enhance cost efficiency through DynamoDB optimizations. Choose on-demand mode for unpredictable workloads or provisioned mode with auto scaling for consistent patterns, configure auto scaling settings based on usage, and implement TTL to automatically remove expired items without consuming write capacity.

Security considerations for the callback pattern

The callback pattern involves storing task tokens, processing events, and managing workflow resumption across multiple AWS services. Implementing proper access controls is essential to protect the integrity of your workflows and prevent unauthorized access or manipulation of the pattern’s components.

This section outlines the security considerations for the callback pattern, focusing on access controls for data storage and event processing.

Data storage security

Enable DynamoDB encryption at rest by using AWS owned or user managed AWS Key Management Service (AWS KMS) keys. Implement identity-based policies by defining the Step Functions AWS Identity and Access Management (IAM) role actions (such as PutItem, GetItem, and DeleteItem) and resource-based policies that specify which IAM principals can access the table. Together, these help ensure that only authorized state machines access token storage and operations are limited to minimum permissions. Also, configure TTL to automatically remove expired tokens so that these tokens do not accidentally get reused, which can result in errors with resuming the relevant AWS Step Function workflows.

Event processing security

Scope EventBridge rules precisely to match only specific necessary events. For Amazon Translate job completion, rules should explicitly match only translation job completion events, thus preventing unauthorized triggers. IAM roles should follow least-privilege principles so that only specific actions can cause workflows to resume.

Conclusion

The callback pattern presented in this post provides a solution for managing long-running asynchronous operations in serverless architectures. You can use the Step Functions “Wait for Callback” task state with EventBridge and DynamoDB to transform asynchronous services into synchronous workflows without the overhead of polling. This pattern reduces costs, improves efficiency through event-driven architecture, and maintains security through proper access controls. You can use the provided CDK implementation to implement this pattern and adapt it to your specific needs while following recommended security and cost optimization practices. 


About the authors

Maria John is a Senior Solutions Architect at Amazon Web Services, helping customers build solutions on AWS.

Philip Whiteside is a Senior Solutions Architect at Amazon Web Services. Philip is passionate about overcoming barriers by utilizing technology.

Analyzing Amazon EC2 Spot instance interruptions by using event-driven architecture

Post Syndicated from Shekhar Shrinivasan original https://aws.amazon.com/blogs/big-data/analyzing-amazon-ec2-spot-instance-interruptions-by-using-event-driven-architecture/

Amazon Elastic Compute Cloud (Amazon EC2) Spot Instances offer significant cost savings of up to 90% compared to On-Demand pricing, making them attractive for cost-conscious workloads. However, when using Spot Instances within AWS Auto Scaling Groups (ASGs), their unpredictable interruptions create operational challenges. Without proper visibility into interruption patterns, teams struggle to optimize capacity planning, implement effective fallback mechanisms, and make informed decisions about workload placement across availability zones and instance types.

This challenge can be addressed through a custom event-driven monitoring and analytics dashboard that provides near real-time visibility into Spot Instance interruptions specifically for ASG-managed instances. For the remainder of this document, we’ll refer to this custom solution as “Spot Interruption Insights” for Auto Scaling Groups.

In this post, you’ll learn how to build this comprehensive monitoring solution step-by-step. You’ll gain practical experience designing an event-driven pipeline, implementing data processing workflows, and creating insightful dashboards that help you track interruption trends, optimize ASG configurations, and improve the resilience of your Spot Instance workloads.

Solution overview

The architecture uses an event-driven approach utilizing AWS native services for robust spot instance interruption monitoring.

The solution uses Amazon EventBridge to capture interruption events, Amazon Simple Queue Service (Amazon SQS) for reliable message queuing, AWS Lambda for data processing, and Amazon OpenSearch Service for storage and visualization of interruption patterns.

  1. EC2 Spot interruption notices are captured via an Amazon EventBridge rule.
  2. The notices are routed to an SQS queue for reliable message handling.
  3. A Lambda function processes the events, fetching EC2 instance metadata and AWS Auto Scaling Group (ASG) details by making optimized batch calls to the EC2 and Auto Scaling APIs. This design minimizes throttling risks on the control plane APIs, ensuring scalability. The Lambda function is configured with batching and concurrency limits to prevent overwhelming the API endpoints and the OpenSearch Service bulk indexing process.
  4. After processing, events are bulk-indexed into Amazon OpenSearch Service, enabling near real-time visibility and analytics.

A Dead Letter Queue (DLQ) ensures no data is lost in case of failures, while AWS Identity and Access Management (IAM) roles enforce least-privilege access between all components.

The OpenSearch Service domain is deployed within the private subnets of an Amazon VPC, ensuring it is not publicly accessible.

  1. Access to OpenSearch Dashboards is routed through an Application Load Balancer (ALB) configured with an HTTPS listener,
  2. ALB forwards traffic to an NGINX proxy running on EC2 instances in an Auto Scaling group. This setup provides secure and scalable access.
  3. Authentication and authorization are enforced using OpenSearch Service’s internal user database, ensuring that only authorized users can access the dashboards.

OpenSearch Dashboards visualize interruption metrics, delivering actionable insights to support effective capacity planning and workload placement.

Extensibility and alternative analytics tools

While this solution uses Amazon OpenSearch Service for storing and visualizing Spot Interruption data, the architecture is flexible and can be extended to support other analytics and observability platforms. You can modify the Lambda function to forward data to tools such as Amazon Quick Sight, Amazon Timestream, Amazon Redshift, or external services depending on your analytics and compliance needs. This enables teams to use their preferred tooling for building visualizations, setting alerts, or integrating with existing dashboards.

What you’ll build

By the end of this post, you’ll have a complete Spot Interruption monitoring system as seen in the following screenshot that automatically captures EC2 Spot Instance interruption events from your Auto Scaling Groups and presents them through interactive dashboards. Your solution will include real-time visualizations showing interruption patterns by availability zone, instance types, and time periods, along with ASG-specific metrics that help you identify optimization opportunities.

The sections of this post walk you through the step-by-step implementation of this solution, from deployment to setting up the event-driven architecture to configuring the analytics dashboards. Remember that you can deploy and customize this solution for your environment.

Prerequisites

You must have access to an AWS account with enough privileges to create and manage the AWS resources discussed in this blog post.You must also have the following software/components installed on your device:

Note: This application utilizes multiple AWS services, and there are associated costs beyond the Free Tier usage. Refer to the AWS Pricing page for specific details. You are accountable for any incurred AWS costs. This example solution does not imply any warranty.

Deployment instructions

Create a new directory, navigate to that directory in a terminal and clone the GitHub repository:

git clone https://github.com/aws-samples/sample-spot-interruption-insights

Change directory to the solution directory:

cd sample-spot-interruption-insights

Checklist for deployment

This section lists the setup and configurations that are required before you deploy the solution stack by using AWS SAM.

If you don’t have a VPC, Subnets, NAT Gateway already created and configured you can follow the steps mentioned in the Amazon VPC documentation to create the necessary resources.

  1. VPC Created – Ensure a VPC exists with DNS hostnames and DNS resolution enabled. You will need the VPC ID during deployment
  2. Public Subnets (2 or more) – Configure two or more public subnet IDs from different Availability Zones.
  3. Private Subnets (2 or more) – Configure two or more private subnet IDs from different Availability Zones.
  4. Outbound Internet Access for Private Subnets – Ensure NAT Gateway access as nginx proxy will be installed on EC2 instance in private subnet. Refer to Example: VPC with servers in private subnets and NAT for more information on setting up NAT for instances in private subnets.
  5. ALB Access – CIDR IP range allowed to access ALB (such as, `1.2.3.4/32`). This is for accessing the dashboard.
  6. Certificate ARN for ALB HTTPS Listener – To configure HTTPS listener. Certificate (can be self-signed) for HTTPS port of the load balancer. Refer to Prerequisites for importing ACM certificates for more information on importing self-signed certificate into AWS Certificate Manager (ACM)
  7. OpenSearch Service-Linked Role – Before deploying this template, ensure the AWS OpenSearch service-linked role exists in your account by running:
    aws iam create-service-linked-role --aws-service-name es.amazonaws.com

    Note:

    • This command only needs to be run once per AWS account.
    • If the role already exists, you’ll see an error message that can be safely ignored.
    • This role allows Amazon OpenSearch Service to manage network interfaces in your VPC.
    • Without this role, deployments that place OpenSearch Service domains in a VPC will fail with the error: “Before you can proceed, you must enable a service-linked role to give Amazon OpenSearch Service permissions to access your VPC.”
    • The service-linked role is named "AWSServiceRoleForAmazonOpenSearchService" and is managed by AWS.
  8. AMIId – Valid EC2 AMI ID for the region. Note:- This solution is designed to work exclusively with AMIs that use the DNF package manager. Use the latest Amazon Linux 2023 AMI for optimal compatibility and security.

    The following AMIs are confirmed compatible with this solution:

    • Amazon Linux 2023
    • Fedora (35 and newer)
    • RHEL 8 and newer
    • CentOS Stream 8 and newer
    • Oracle Linux 8 and newer

Build and deploy the solution – From the command line, use AWS SAM to build and deploy the AWS resources as specified in the template.yml file.

sam build
sam deploy --guided

During the prompts: Fill-out the following parameters:

  • Stack Name: {Enter your preferred stack name}
  • AWS Region: {Enter your preferred region code}
  • Parameter DomainName: {Enter the name for your new OpenSearch Service domain where the index will be created and data will be pushed for analytics. This will create a new OpenSearch domain with the name you specify – Preferably keep short domain name}
  • MasterUsername: {Admin username to login to the OpenSearch dashboard}
  • MasterUserPassword: { Must contain lowercase, uppercase, numbers, and special characters (!@#$%^&*). Minimum 12 characters recommended. Avoid common passwords (Password123!, Admin@2024 and more) as these may cause deployment failures due to security validation checks.}
  • IndexName: {OpenSearch Index name where Spot interrupted instance related data will be pushed}
  • EventRuleName: {Amazon EventBridge rule name to capture EC2 Spot interruption notices}
  • CustomEventRuleName: {Amazon EventBridge custom rule name to capture EC2 Spot interruption notices. This will be used for verifying the solution}
  • TargetQueueName: {EventBridge Rule target SQS name}
  • SQSDLQQueueName: {Target SQS Dead Letter Queue name}
  • LambdaDLQQueueName: {Lambda Dead Letter Queue name}
  • VPCId: {Enter the VPCId where the resources will be deployed}
  • PublicSubnetIds: {Enter 2 or more Public SubnetIDs separated by comma}
  • PrivateSubnetIds: {Enter 2 or more Private SubnetIDs separated by comma}
  • RestrictedIPCidr: {IP address/CIDR for restricting ALB access in CIDR format (such as 10.2.3.4/32)}
  • CertificateArn: {Certificate ARN for configuring ALB HTTPS Listener}
  • AMIId: {Valid EC2 AMI ID for the region}
  • Confirm changes before deploy: Y
  • Allow SAM CLI IAM role creation: Y
  • Disable rollback: N
  • Save arguments to configuration file: Y
  • SAM configuration file: {Press enter to use default name}
  • SAM configuration environment: {Press enter to use default name}

Note: The complete solution may take approximately 15-20 minutes to deploy. After the deployment is complete, there are a few manual steps that need to be performed to ensure the solution functions as expected.

Post deployment instructions

The following steps need to be performed in OpenSearch Dashboards after logging in. Get the DNS Name of the Application Load Balancer endpoint from the deployment output section of the CloudFormation stack or the ALB console. Access the OpenSearch dashboards using the ALB DNS name as follows –

https://[ALB-DNS-NAME]/_dashboards

You will be redirected to the OpenSearch Dashboards login page. Log in using the MasterUsername and MasterUserPassword you specified during deployment.

If this is the first time you are logging in then you may see a Welcome screen.

  1. Choose ‘Explore on my own’ on the Welcome screen.
  2. Choose ‘Dismiss’ on the next screen.
  3. If the ‘Select your tenant’ dialog appears with ‘Global’ preselected, Choose ‘Confirm’. Otherwise, select ‘Global’ first and then and choose ‘Confirm’.

Create index and attribute mapping

This section lists the required steps to create the index and attribute mapping.

  1. On the Home screen select the Hamburger Menu icon () on the top left
  2. Select ‘Dev Tools’ at the bottom of the menu.
  3. On the dev tools console, paste the following PUT command and execute the request by choosing ‘Click to send request’.

    Note The index name should match what you entered during the deployment. Change the index name accordingly before creating the index.

    PUT /<YOUR-INDEX-NAME-SPECIFIED-DURING-DEPLOYMENT>
            {
                "mappings": {
                    "properties": {
                    "instance_id": {
                        "type": "keyword"
                    },
                    "instance_name": {
                        "type": "keyword"
                    },
                    "instance_type": {
                        "type": "keyword"
                    },
                    "asg_name": {
                        "type": "keyword"
                    },
                    "timestamp": {
                        "type": "date"
                    },
                    "region": {
                        "type": "keyword"
                    },
                    "availability_zone": {
                        "type": "keyword"
                    },
                    "private_ip": {
                        "type": "ip"
                    },
                    "public_ip": {
                        "type": "ip"
                    }
                    }
                }
            }

    The following is a screenshot of this command in Dev Tools.

  4. Confirm that the index was created successfully.

Create index pattern

This section lists the required steps to create the index pattern

  1. Access the Hamburger Menu icon on the top left.
  2. Select ‘Dashboard Management’ from the bottom of the menu.
  3. Choose ‘Index Patterns’
  4. Choose “Create Index Pattern”
  5. Enter the Index pattern name and choose “Next step”.
    The index pattern name should be the index name you entered during the deployment followed by an asterisk. See the following screenshot for reference.

  6. Select ‘timestamp’ in primary Time field and choose ‘Create index pattern’
  7. Choose the star icon to make the index pattern default

Configure Lambda with required access for new index

In this section you will create a role in OpenSearch Service dashboards and will map Lambda execution role to the same to perform operations on the new index.

  1. Navigate to the Lambda console
  2. Search for the function beginning with your OpenSearch Service domain name.
  3. In the function details, go to Configuration > Permissions
  4. Choose the Role Name in the Execution Role section.
  5. Copy the Lambda execution role ARN from this function which handles Spot interruption events.
  6. Access the Hamburger Menu icon on the top left and select ‘Security’ from the bottom of the menu.
  7. Now select the ‘Roles’ menu option under ‘Security’ menu and then select ‘Create Role’
    • Enter a role name and set Cluster Permissions to “cluster_composite_ops_ro“.
    • For Index Permissions, select the index pattern name created during deployment.

    See the following screenshot for reference.

  8. Set the Tenant Permissions to “global_tenant” as seen in the image and Choose “Create”.

  9. After the role is created, on the same screen, select the ‘Mapped Users’ tab and choose ‘Manage Mapping’

  10. Choose ‘Manage Mapping’
  11. In the ‘Backend roles’ add the Lambda execution role ARN copied earlier and Choose ‘Map’

You can create more users in the internal database and grant appropriate access to the visualisations and dashboards. The following steps show how to create a read only role and to create an internal user and grant read only access.

Manage users and roles

In this section you will create a new user and a role with read-only access, then assign the role to the user to grant them read-only access to the Spot Interruption dashboard and visualizations.

  1. Access the Hamburger Menu icon on the top left
  2. Select ‘Security’ from the bottom of the menu
  3. Select ‘Internal Users’ and then select ‘Create Internal user’
  4. Enter username and set a Password, then choose “Create”.

  5. Now select the ‘Roles’ menu option under ‘Security’ menu and then select ‘Create Role’
    • Enter the role name and set Cluster Permissions to “cluster_composite_ops_ro“.
    • For Index Permissions, select the index pattern name created during deployment.

    See the following screenshot for reference.

  6. Set the Tenant Permissions to “global_tenant” as seen in the image and Choose “Create”.

  7. After the role is created, on the same screen, select the ‘Mapped Users’ tab and choose ‘Manage Mapping’

  8. Select the user created above in ‘Users’ and choose ‘Map’

Configure and deploy sample visualisations and dashboard

Sample visualizations and a starter dashboard are provided under the data folder of the git repo you cloned earlier. Look for the file named spot-interruption-dashboard-visualisations.ndjson.To import the visualizations:

  1. Navigate to Saved Objects under Dashboard Management in OpenSearch Dashboards.
  2. Import the spot-interruption-dashboard-visualisations.ndjson file.
  3. During the import, you may encounter index pattern conflicts. Select the index pattern you created from the dropdown and choose “Confirm all changes”.

Once imported, the sample visualizations and dashboard linked to your index pattern will be available under Dashboards in the left-side hamburger menu. You can view the Spot Interruption Dashboard, which includes visualizations based on Availability Zones, Regions, Instance Types, Auto Scaling Groups (ASGs), and Interruptions over time. You can further customize by creating your own visualizations using the attributes available in the index or by editing/creating new dashboards. The dashboard will display empty views until Spot interruption data is available to visualize.

Test the solution

A temporary event rule was created during deployment to simulate matching Amazon EC2 Spot interruption notices. The rule name is the name you specified during deployment for the CustomEventRuleName parameter.

To verify the solution, you can send sample events from the EventBridge console as depicted below. In the AWS console,

  • Open the Amazon EventBridge console
  • In the left menu under ‘Buses’ section choose ‘Event buses’
  • Choose the ‘default’ event bus
  • Choose the ‘Send events’ button
  • In the Send events page enter the following details:
    • Event bus: default
    • Event source: custom.spot.interruption.simulator
    • Detail type: EC2 Spot Instance Interruption Warning
    • Event detail: {"instance-id": "<instance-id>", "Instance-action": "terminate"}

    Replace the instance-id with an actual instance id that is associated with an Amazon EC2 Auto Scaling group. Refer to the following screenshot.

After the event is sent successfully, you can log in to OpenSearch Dashboards and view the Spot Interruption Dashboard, which has been prebuilt with the indexed event data. This dashboard provides insights across key dimensions such as Availability Zones, Regions, instance types, Auto Scaling groups, and interruption trends over time. Use the dashboard as a starting point to understand the kinds of insights possible and customize or create new visualizations based on your needs and the fields available in the index.

Alternatively, you can navigate to the Discover section in the menu to view the raw event details. Ensure that you select the index pattern you created earlier in this demonstration, and adjust the time range if necessary (such as the last 15 minutes) to view the latest data.

Security and cost optimizations

This solution is designed to be secure and cost-efficient by default, but there are some more optimizations you can apply to further reduce cost and enhance security:

Security best practices

  1. Amazon Cognito Authentication : Integrate Amazon Cognito with OpenSearch Dashboards to manage user authentication, enable Multi Factor Authentication, and avoid hardcoding admin credentials. More information Configuring Amazon Cognito authentication for OpenSearch Dashboards
  2. Lambda Layer Versioning: Ensure pinned versions of Lambda Layers are used to avoid unexpected changes. More information Managing Lambda dependencies with layers
  3. Logging and Threat Detection: Enable AWS CloudTrail and Amazon GuardDuty to monitor for unauthorized activity or anomalies. More information Monitoring Amazon OpenSearch Service API calls with AWS CloudTrail

Cost optimizations

  1. Bulk Indexing with Throttling Controls: Lambda processes batches and respects throttling limits to avoid excessive OpenSearch usage.
  2. Short Retention for CloudWatch Logs: Tune log retention periods to avoid unnecessary storage costs.
  3. Optimize Visualizations: Design saved visualizations to avoid expensive queries (like wide time ranges and large aggregations). More information Optimizing query performance for Amazon OpenSearch Service data sources
  4. Index State Management (ISM) : Configure ISM policies in OpenSearch to delete or archive older interruption data. More information Index State Management in Amazon OpenSearch Service

Cleanup

Run the following command to delete the resources deployed earlier.

sam delete

After deleting the stack, make sure to also remove any post-deployment configurations you may have created within the OpenSearch Service dashboards console. While these configurations won’t incur additional costs, it’s considered a best practice to clean up your environment by deleting any resources that are no longer needed. Take some time to review the OpenSearch Service dashboards and identify any custom settings, dashboards, or visualizations you set up during the deployment process. Then, delete these individual configurations to ensure your environment is fully cleaned up.

Conclusion

In this post, you learned how to build and deploy a comprehensive Spot Instance interruption monitoring solution for Auto Scaling groups by using EventBridge, Amazon SQS, Lambda, and OpenSearch Service. You implemented an event-driven pipeline to capture and process Amazon EC2 Spot Instance interruption events, created secure analytics dashboards, and established real-time visibility into interruption patterns across your Auto Scaling group–managed workloads.

This post’s solution empowers your teams with the visibility and agility needed to operate confidently with Amazon EC2 Spot Instances. By combining event-driven architecture with secure, scalable analytics, you can now proactively monitor interruption events, identify interruption trends, and optimize workload strategies for resilience and cost-efficiency.

With real-time data at your fingertips, you’re equipped to make smarter infrastructure decisions and maximize the benefits of Spot Instance capacity while minimizing disruption risks.


About the author

Shekhar Shrinivasan

Shekhar Shrinivasan

Shekhar is a Senior Technical consultant who specializes in cloud architecture design, migration strategies, and AWS workload optimization. He helps enterprise customers accelerate their digital transformation through best practices implementation, scalable infrastructure solutions, and strategic technical guidance to maximize their cloud return on investment.

AWS Lambda networking over IPv6

Post Syndicated from John Lee original https://aws.amazon.com/blogs/compute/aws-lambda-networking-over-ipv6/

IPv4 address exhaustion is a challenge in modern networking, as most IPv4 addresses have been depleted with the growth of the internet. Previously, AWS Lambda only supported inbound and outbound connectivity over IPv4, but it has since introduced support for dual-stack endpoints, so that you can transition from IPv4 to IPv6. AWS continues to add support for IPv6, recently announcing support for inbound IPv6 connectivity over AWS PrivateLink, and dual-stack endpoint support for Amazon API Gateway.

With these IPv6 capabilities now available in Lambda, you should understand how to use them effectively. This post examines the benefits of transitioning Lambda functions to IPv6, provides practical guidance for implementing dual-stack support in your Lambda environment, and considerations for maintaining compatibility with existing systems during migration.

Benefits of transitioning

You can transition to IPv6 to future-proof your overall architecture by preparing ahead of the broader transition to IPv6, and establish compatibility with IPv6 clients or services. IPv6 also eliminates the need for a NAT gateway when the Lambda functions need internet connectivity from a private subnet in your Amazon Virtual Private Cloud (Amazon VPC). Lambda functions can direct traffic to the egress-only internet gateway, potentially eliminating the NAT gateway and its associated charges and streamlining network design. This transition provides cost savings, as egress-only internet gateways are free to use, as opposed to NAT gateways that incurs an hourly charge. Furthermore, IPv6 offers improved network efficiency by eliminating NAT translation overhead, so that Lambda functions can establish direct connections with clients. IPv6 also has more advantages such as native Quality of Service (QoS), which streamlines header structure and reduces packet fragmentations.

Architectural implications

Lambda functions are often deployed inside of a VPC to access VPC resources. For VPC Lambda functions to access the internet, routing traffic through an NAT gateway is a common approach. For Lambda functions with IPv6 support, Lambda functions can now route traffic directly through the egress-only internet gateway, which eliminates the need for a NAT gateway and the extra hop, as shown in the following figures.

architecture diagram showing egress traffic in both ipv4 and ipv6 environments

Figure 1. Lambda internet connectivity through a NAT Gateway (IPv4) and Lambda internet connectivity through an egress-only internet gateway (IPv6).

Once the egress-only internet gateway is in place, you need to update the route table to reflect this. If you have used 0.0.0.0/0 as the default route for IPv4 traffic, you should add ::/0 as the default route for IPv6 traffic. The following image shows the updated route table.

ipv4 and ipv6 route tables

Figure 2. Lambda private subnet routing tables for an NAT Gateway (IPv4) as opposed to a dual-stack including an egress-only internet gateway (IPv6)

If you are using Lambda function URLs, no transition is needed. Lambda function URLs are inherently IPv6-capable and can be accessed by IPv6 clients without needing architectural changes or modifications. This IPv6 compatibility for function URLs operates independently of your Lambda function’s VPC configuration, and clients can reach your Lambda function URLs over IPv6 even when dual-stack is not enabled in your VPC.

For Lambda functions that interact exclusively with AWS services through internal traffic, IPv6 offers limited benefits. For example, in an architecture where a Lambda function processes requests from Amazon API Gateway and queries a database hosted on Amazon Relational Database Service (Amazon RDS), no architectural change is expected. Internal traffic routes using the RDS cluster endpoint and Lambda Amazon Resource Name (ARN), not IP addresses, as shown in the following figure.

architecture diagram showing traffic going through API GW, Lambda, and RDS

Figure 3. A common architecture pattern where Lambda processes events from API Gateway and reads/writes to Amazon RDS. You reference the Lambda function ARN and RDS cluster endpoint instead of IPv4/IPv6 addresses.

Transitioning from IPv4 to IPv6

By default, Lambda functions communicate over IPv4 to their destinations. For Lambda functions to communicate with IPv6 destinations, dual-stack VPC configuration is needed. This allows Lambda functions to communicate over both IPv4 and IPv6.

If your VPC does not have IPv6 support, then you need to first add IPv6 support for your VPC. You need to follow these steps to enable IPv6 traffic for a Lambda function:

  1. Assign IPv6 block to VPC: You need to edit the existing VPC CIDRs to add an IPv6 CIDR block. If you select the option of Amazon-provided IPv6 CIDR block, then you are assigned a /56 IPv6 CIDR block from the Amazon pool of IPv6 addresses. You also have the option to assign an Amazon VPC IP Address Manager allocated or your own IPv6 CIDR block.
  2. Assign IPv6 block to Subnets: After assigning an IPv6 CIDR block to the VPC, you must manually configure IPv6 CIDR blocks for each existing subnet, with each subnet receiving a portion of the VPC’s IPv6 address space.
  3. Update route tables: For your Lambda function’s IPv6 traffic to reach the internet, you need to add a route (::/0) to the egress-only internet gateway.
  4. Update security groups: By default, security groups allow all outbound traffic. To restrict outbound IPv6 traffic from your Lambda function, you must remove the default egress rule and add specific restrictive outbound rules. For inbound traffic, security group rules are needed when your Lambda function receives direct network connections, such as traffic through AWS PrivateLink connections.
  5. Enable IPv6 dual-stack on the Lambda function: When you assign IPv6 addresses for your Lambda function’s subnet, you can enable IPv6 dual-stack for the Lambda function. Then, Lambda creates new Elastic network interfaces (ENI) with IPv4 and IPv6 protocols with both IPv4 and IPv6 addresses. Although most updates to the Lambda function have zero downtime, enabling dual-stack may cause disruption in connectivity. To prevent downtime during the transition, we recommend using Lambda versions and aliases to implement a blue/green deployment strategy. You can publish your IPv6-enabled Lambda function as a new version while keeping the current version active and serve traffic through the alias. After testing the new IPv6 version, you can update the alias to switch the traffic. This approach provides a rollback capability, and you can revert the alias to point back to the previous version if needed.

When you have completed these steps, your Lambda function can support dual-stack networking and communicate over both IPv4 and IPv6.

Conclusion

In this post, we covered the benefits of transitioning your AWS Lambda functions from IPv4 to IPv6, the architectural implications, and steps for how you could make the transition.We recommend transitioning your Lambda functions to support both IPv4 and IPv6 traffic to gain its benefits. The Lambda IPv6 support helps address IPv4 exhaustion while providing cost savings and network clarification. Once organizations transition to supporting only IPv6 traffic, they can eliminate NAT gateways for Lambda functions needing internet access, thus reducing both costs and architectural complexity. As AWS expands IPv6 support across services, transitioning Lambda functions to dual-stack networking positions organizations for long-term compatibility while delivering immediate operational benefits.

For more information on how to enable IPv6 access for Lambda functions in dual-stack VPC, see the Lambda documentation. For more serverless learning resources, visit Serverless Land.

Migrating from Open Policy Agent to Amazon Verified Permissions

Post Syndicated from Samuel Folkes original https://aws.amazon.com/blogs/security/migrating-from-open-policy-agent-to-amazon-verified-permissions/

Application authorization is a critical component of modern software systems, determining what actions users can perform on specific resources. Many organizations have adopted Open Policy Agent (OPA) with its Rego policy language to implement fine-grained authorization controls across their applications and infrastructure. While OPA has proven effective for policy-as-code implementations, organizations are increasingly looking for more performant and managed services that reduce operational overhead while maintaining the flexibility and power of policy-based authorization.

Amazon Verified Permissions is a fully managed authorization service that uses the Cedar policy language to help you implement fine-grained permissions for your applications. Cedar is an open source policy language developed by AWS that provides many of the same capabilities as Rego while offering improved performance (42–60 times faster than Rego), straightforward policy authoring, and formal verification capabilities. By migrating from OPA to Verified Permissions, organizations can reduce the operational burden of managing authorization infrastructure while gaining access to a service designed specifically for scalable, secure authorization.

This migration offers several key benefits: reduced infrastructure management overhead, improved policy performance and validation, enhanced security through the AWS managed service model, and seamless integration with other AWS services. Additionally, Cedar’s syntax is designed to be more intuitive than Rego, reducing the effort needed to write, read, and maintain policies.

In this post, we explore the process of migrating from OPA and Rego to Verified Permissions and Cedar, including policy translation strategies, software development and testing approaches, and deployment considerations. We walk through practical examples that demonstrate how to convert common Rego policies to Cedar policies and integrate Verified Permissions into your existing applications.

Solution overview

The migration from OPA to Verified Permissions represents a shift from self-managed authorization infrastructure to a fully managed service. In a typical OPA setup, customers have OPA servers running either as sidecars, standalone services, or embedded libraries that evaluate Rego policies against incoming authorization requests. These servers pull policy bundles from storage systems and maintain their own performance and availability.

With Verified Permissions, AWS manages the entire authorization infrastructure. Applications make API calls to the Verified Permissions service which evaluates Cedar policies stored in managed policy stores. This removes the need to operate and maintain OPA servers, manage policy distribution, or handle service scaling and availability. This shift means that your team can concentrate on authorization logic rather than infrastructure management while gaining the benefits of the scale and reliability provided by AWS.

Understanding the differences: Comparing Rego with Cedar

It’s important to understand the fundamental differences between the Rego and Cedar policy languages before beginning your migration. These differences will shape how you approach translating your existing policies.

Policy structure and philosophy

Rego policies are built around rules that can be evaluated to produce sets of results. Rego uses a logic programming approach where you define conditions that must be satisfied for a rule to be true. Policies often involve complex queries, loops, and comprehensions to examine data structures.

Example Rego policy

package authz
default allow = false

# Rule 1: Allow users with the viewer role to read documents
allow {
	input.action == "read"
	input.resource.type == "document"
	input.user.role == "viewer"
}
# Rule 2: Allow users with the editor role to write documents
allow {
	input.action == "write"
	input.resource.type == "document"
	input.user.role == "editor"
}

Cedar takes a more declarative approach with explicit permit and forbid statements. Each Cedar policy is a standalone authorization decision that clearly states what is being allowed or denied. Cedar policies are designed to be human-readable and straightforward to audit.

Equivalent Cedar policies

// Policy 1: Allow principals with the viewer role to read documents 
permit (
	principal in UserRole::"viewer",
	action == Action::"read",
	resource in ResourceType::"document"
);
// Policy 2: Allow principals with the editor role to write documents
permit (
	principal in UserRole::"editor",
	action == Action::"write",
	resource in ResourceType::"document"
);

Data model differences

One of the most significant differences between the two evaluation engines is how they handle data. Rego works with arbitrary JSON input data, giving users complete flexibility in how they structure authorization requests. Users can access any field in your input data using Rego’s path notation.

Cedar allows for the creation of a defined schema with typed entities. This means that users need to model authorization data as entities with specific types, attributes, and relationships. While this requires more upfront planning, it provides superior validation, runtime performance, and tooling support.

Policy evaluation

Rego and Cedar differ fundamentally in their approaches to policy evaluation. Rego uses a logic programming model and, as a result, policy evaluation functions much like a logic puzzle solver. It starts with a question and searches backward through linked rules to find an answer. This approach allows for flexible policy composition but can often be slower, less predictable, and more difficult to audit.

Cedar, on the other hand, uses a simpler functional evaluation approach. It uses a straightforward evaluation model where each policy is checked independently against the authorization request. Policies use basic conditional logic to produce fast, deterministic allow or deny decisions. A policy either fully matches the authorization request (principal, action, resource, and all conditions), or it doesn’t apply. This is essential for high-performance authorization scenarios where predictable evaluation time and clear audit trails are essential. Cedar policy evaluation follows four core principles:

  • Default deny for access not explicitly granted
  • Forbid overrides permit for handling policy conflicts
  • Order-independent evaluation to prevent bugs
  • Deterministic outcomes for reliable results

Setting up Verified Permissions

Before you can begin migrating your authorization policies, you need to establish the foundational infrastructure in Verified Permissions.

Creating your policy store

To illustrate the migration process, you will use a fictional document management application that uses OPA and Rego for authorization. The first step in migrating to Verified Permissions is creating a policy store. A policy store is a container for your Cedar policies and schema. You can create multiple policy stores for different applications or environments.

When creating a policy store, you choose between two validation modes:

  • STRICT mode: Requires a schema against which policies are validated
  • OFF mode: Allows policies without a schema (useful for initial testing)

For production migrations, STRICT mode is recommended because it provides better validation compared to OFF mode and can enable optimizations that reduce the entity data needed for authorization requests. You can create a policy store through the AWS Management Console, AWS Command Line Interface (AWS CLI), or programmatically using AWS SDKs. The following example uses the AWS CLI:

aws verifiedpermissions create-policy-store \
	--region us-east-1 \
	--validation-settings mode=STRICT \
	--description "Migration from OPA to Amazon Verified Permissions"

If the request is successful, you should see a JSON encoded response that looks like the following:

{
	"policyStoreId": "PSEXAMPLEabcdefg012345",
	"arn": "arn:aws:verifiedpermissions:us-east-1:123456789012:policy-store/PSEXAMPLEabcdefg012345",
	"createdDate": "2025-09-15T10:30:45.123456+00:00",
	"lastUpdatedDate": "2025-09-15T10:30:45.123456+00:00"
}

Make note of the policyStoreId from the response—you will need it for subsequent operations.

Defining your schema

In STRICT mode, Verified Permissions requires a Cedar schema that defines the types of entities in an authorization system. This schema serves several important purposes, including validating policies at creation time, enabling entity slicing performance optimizations, enabling better tooling and IDE support, and documenting your authorization model. The schema should define:

  • Entity types: The kinds of objects in your system (for example, users, roles, documents, and so on.)
  • Attributes: Properties that entities can have (for example, department, classification, and createdDate)
  • Actions: Operations that can be performed (for example, read, write, and delete)
  • Relationships: How entities relate to each other (for example, user belongs to role, document owned by user)

When designing a schema, you should consider how your current OPA input data maps to Cedar entities. For example, if your Rego policies access input.user.department, you will need a User entity type with a department attribute. The following is an example Cedar schema for your document management application:

{
	"MyApp": {
		"entityTypes": {
			"User": {
				"shape": {
					"type": "Record",
					"attributes": {
						"department": {"type": "String"},
						"jobLevel": {"type": "Long"},
						"email": {"type": "String"}
					}
				}
			},
			"Role": {
				"shape": {
					"type": "Record",
					"attributes": {"name": {"type": "String"}}
				}
			},
			"Document": {
				"shape": {
					"type": "Record",
					"attributes": {
						"owner": {"type": "Entity", "name": "User"},
						"classification": {"type": "String"},
						"createdDate": {"type": "String"}
					}
				}
			}
		},
		"actions": {
			"read": {"appliesTo": {"principalTypes": ["User"], "resourceTypes": ["Document"]}},
			"write": {"appliesTo": {"principalTypes": ["User"], "resourceTypes": ["Document"]}},
			"delete": {"appliesTo": {"principalTypes": ["User"], "resourceTypes": ["Document"]}}
		}
	}
}

To apply this schema to the policy store you created earlier using the AWS CLI, you can run the following command:

aws verifiedpermissions put-schema \
	--region us-east-1 \
	--policy-store-id YOUR_POLICY_STORE_ID \
	--definition file://schema.json

Ensure that you replace YOUR_POLICY_STORE_ID with the policyStoreId that was returned when you created your policy store.

You can view the visualized policy schema (shown in Figure 1) in the Verified Permissions console by going to Policy Store and choosing Schema.

Figure 1: Verified Permissions policy schema visualization

Figure 1: Verified Permissions policy schema visualization

Policy migration patterns

With your policy store and schema in place, you can now begin translating your Rego policies into Cedar policies, following common authorization patterns.

Pattern 1: Role-based access control

Role-based access control (RBAC) is one of the most used authorization patterns. In RBAC systems, users are assigned roles, and roles are granted permissions to perform actions on resources.

In your current Rego implementation, you might check if a user has a specific role in their roles array, then allow certain actions based on that role. Your Rego policy might look something like the following:

package rbac

import future.keywords.if
import future.keywords.in

default allow := false

allow if {
	input.user.roles[_] == "admin"
}

allow if {
	input.user.roles[_] == "editor"
	input.action in ["read", "write"]
}

allow if {
	input.user.roles[_] == "viewer"
	input.action == "read"
}

When migrating to Cedar, you will model this using entity relationships where users belong to role entities.

// Admin users can perform any action on any resource
permit (
	principal in MyApp::Role::"admin",
	action,
	resource
);

// Editor users can read and write on every resource
permit (
	principal in MyApp::Role::"editor",
	action in [MyApp::Action::"read", MyApp::Action::"write"],
	resource
);

// Viewer users can only read on every resource
permit (
	principal in MyApp::Role::"viewer",
	action == MyApp::Action::"read",
	resource
);

Migration approach
To successfully migrate your RBAC policies from Rego to Cedar, follow these steps:

  1. Define User and Role entity types in your schema
  2. Create permit policies for each role-action combination
  3. Use the Cedar in operator to check role membership
  4. Consider creating role hierarchies if you have nested roles

Key differences
Understanding the fundamental differences between Rego and Cedar’s approach to RBAC will help you design more effective policies:

  • Cedar uses entity relationships instead of checking array membership
  • Each permission becomes a separate, explicit policy
  • Role hierarchies are modeled through entity parent-child relationships

Pattern 2: Attribute-based access control

Attribute-based access control (ABAC) makes authorization decisions based on attributes of the user, resource, action, and environment. This is often more flexible than RBAC but can be more complex to implement.

In Rego, you would access various attributes from the input data and use them in policy conditions:

package abac

default allow := false
# Anyone can read public documents
allow if {
	input.action == "read"
	input.resource.classification == "public"
}

# Users can read internal documents from their department
allow if {
	input.action == "read"
	input.resource.classification == "internal"
	input.user.department == input.resource.department
}

# Users can write to documents they own
allow if {
	input.action == "write"
	input.resource.owner == input.user.id
}

Cedar handles this through entity attributes and policy conditions using the when and unless clauses.

// Anyone can read public documents. Blank ‘principal’ and ‘resource’ entities are wildcards that match everything
permit (
	principal,
	action == MyApp::Action::"read",
	resource
) when {
	resource.classification == "public"
};

// Users can read internal documents from their department
permit (
	principal,
	action == MyApp::Action::"read",
	resource
) when {
	resource.classification == "internal" &&
	principal.department == resource.department
};

// Users can write to documents they own
permit (
	principal,
	action == MyApp::Action::"write",
	resource
) when {
	resource.owner == principal
};

Migration approach
Migrating ABAC policies requires careful mapping of attributes from your Rego input structure to Cedar’s entity model:

  1. Identify the attributes used in your current policies
  2. Map these attributes to entity attributes in your Cedar schema
  3. Use when clauses in Cedar policies to implement attribute-based conditions
  4. Consider using context for environment-specific attributes (time, IP address, and so on)

Key differences
Cedar’s schema-driven approach to attributes provides several advantages over Rego’s dynamic attribute access:

  • Cedar requires attributes to be defined in the schema
  • Cedar schema validation helps catch attribute access errors at policy creation time
  • Complex attribute logic might need to be split across multiple policies

Pattern 3: Relationship-based access control

Relationship-based access control (ReBAC) grants permissions based on properties of the resource being accessed or relationships between the user and the resource (such as ownership). In Rego, this might be expressed as follows:

package rebac

import future.keywords.if
import future.keywords.in

# Allow document owners to perform any action
allow if {
	input.resource.type == "document"
	input.resource.owner_id == input.user.id
}

# Alternative: checking ownership through a separate ownership data structure
allow if {
	input.resource.type == "document"
	ownership := data.ownerships[input.resource.id]
	ownership.owner_id == input.user.id
}

In the preceding example, ownership is checked by comparing the owner_id attribute on the resource with the user’s ID. You might access this from the input data directly or from a separate data source. In Cedar, relationships are first-class concepts. The resource.owner == principal syntax directly checks if the principal is the owner entity referenced by the resource. This is more natural and type-safe than string comparisons:

permit (
	principal,
	action,
	resource is MyApp::Document
) when {
	resource.owner == principal
};

Migration approach
Converting relationship-based policies requires modeling your data relationships as Cedar entity references:

  1. Model resources as Cedar entities with relevant attributes
  2. Use resource attributes in policy conditions
  3. Model ownership and other relationships through entity references
  4. Use Cedar’s attribute access syntax for resource properties

Pattern 4: Time and context-based access

Many authorization systems need to consider contextual information such as time of day, user location, or request characteristics (IP address, user-agent, and so on). Expressing this in Rego would look like the following example:

package temporal

import future.keywords.if

default allow := false
# Allow read access during business hours (9 AM to 5 PM UTC)
allow if {
	input.action == "read"
	current_hour := time.clock([time.now_ns(), "UTC"])[0]
	current_hour >= 9
	current_hour <= 17
}

In Cedar, the same policy logic can be expressed like the following:

// Allow read access during business hours (9 AM to 5 PM UTC)
permit (
	principal,
	action == MyApp::Action::"read",
	resource
) when {
	context.currentTime.hour >= 9 &&
	context.currentTime.hour <= 17
};

Migration approach
Context-based policies in Cedar use the context parameter passed with each authorization request:

  • Use Cedar’s context feature for environment information
  • Pass time-based information in the authorization request context
  • Create policies with time-based conditions using context attributes
  • Consider caching implications for time-sensitive policies

Application integration changes

After migrating your policies to Cedar, you need to update your application code to integrate with Verified Permissions.

Updating authorization calls

The most significant change in your application code will be replacing OPA API calls with Verified Permissions API calls. Understanding the differences between these systems will help you plan your integration work effectively. The sample code in this section is written in Python.

Request structure changes

When calling OPA, you typically send a single JSON payload containing the authorization data. For example, your current OPA request might look like the following:

opa_request = {
	"input": {
		"user": {
			"id": "user123",
			"department": "engineering",
			"role": "editor"
		},
		"resource": {
			"id": "doc456",
			"type": "document",
			"owner": "user123"
		},
		"action": "read"
	}
}

response = requests.post(
	"http://opa-server:8181/v1/data/authz/allow",
	json=opa_request
)
authorized = response.json()["result"]

Verified Permissions requires a more structured approach where principals, resources, and actions are explicitly typed entities.

import boto3
import json
from typing import Dict, Any, List

class AuthorizationService:
	def __init__(self, policy_store_id: str, region: str = 'us-east-1'):
		self.client = boto3.client('verifiedpermissions', region_name=region)
		self.policy_store_id = policy_store_id
	
	#Check if a principal is authorized to perform an action on a resource.
	def is_authorized(self, principal: Dict[str, Any], action: str,
				resource: Dict[str, Any], context: Dict[str, Any] = None) -> bool:
		try:
			# Convert to Cedar entity format
			principal_entity = self._to_cedar_entity(principal, "User")
			resource_entity = self._to_cedar_entity(resource, "Document")
			action_entity = {"actionType": "MyApp::Action", "actionId": action}

			request = {
				'policyStoreId': self.policy_store_id,
				'principal': principal_entity,
				'action': action_entity,
				'resource': resource_entity
			}

			if context:
				request['context'] = {'contextMap': context}
				
			response = self.client.is_authorized(**request)
			return response['decision'] == 'ALLOW'
		except Exception as e:
			print(f"Authorization error: {e}")
			return False

	def _to_cedar_entity(self, entity_data: Dict[str, Any], entity_type: str) -> Dict[str, Any]:
		# Convert application data to Cedar entity format
		return {
			'entityType': f'MyApp::{entity_type}',
			'entityId': str(entity_data.get('id', '')),
			'attributes': entity_data
		}

The key differences in this new structure are:

  • Entity type declarations: Each entity (principal, resource) must include an entityType that matches your Cedar schema
  • Entity IDs: Every entity requires a unique entityId for identification
  • Action format: Actions are specified with an actionType and actionId rather than as simple strings
  • Separate context: Environmental information like time, IP address, or user agent is passed in a separate context parameter

Response handling changes

OPA returns whatever your Rego policy outputs, which could be a Boolean, a set of allowed actions, or complex nested data structures. Regardless of the policy outputs, Verified Permissions returns a consistent authorization decision structure:

# Amazon Verified Permissions response structure
{
	'decision': 'ALLOW',# or 'DENY'
	'determiningPolicies': [...],# Which policies determined the decision
	'errors': [...]# Errors that occurred during evaluation
}

Your application logic becomes simpler because you need to check for only ALLOW or DENY:

# Example usage

def check_document_access():
	auth_service = AuthorizationService('YOUR_POLICY_STORE_ID')

	# Example principal (user)
	user = {
		'id': 'user123',
		'department': 'engineering',
		'jobLevel': 5,
		'email': '[email protected]'
	}

	# Example resource (document)
	document = {
		'id': 'doc456',
		'owner': 'user123',
		'classification': 'internal',
		'department': 'engineering'
	}

	# Example context
	context = {
		'currentHour': 14,# 2 PM
		'userAgent': 'MyApp/1.0'
	}

	# Check authorization
	can_read = auth_service.is_authorized(user, 'read', document, context)
	can_write = auth_service.is_authorized(user, 'write', document, context)

	print(f"User can read document: {can_read}")
	print(f"User can write document: {can_write}")

Error handling changes

OPA errors typically relate to policy evaluation issues or server connectivity problems. With Verified Permissions, you’ll encounter AWS-specific error types, as shown in the following example:

def is_authorized_with_error_handling(self, principal, action, resource, context=None):
	try:
		principal_entity = self._to_cedar_entity(principal, "User")
		resource_entity = self._to_cedar_entity(resource, "Document")
		action_entity = {"actionType": "MyApp::Action", "actionId": action}

		request = {
			'policyStoreId': self.policy_store_id,
			'principal': principal_entity,
			'action': action_entity,
			'resource': resource_entity
		}

		if context:
			request['context'] = {'contextMap': context}

		response = self.client.is_authorized(**request)
		return response['decision'] == 'ALLOW'
	except ClientError as e:
		error_code = e.response['Error']['Code']

		if error_code == 'ResourceNotFoundException':
			print(f"Policy store not found: {self.policy_store_id}")
		elif error_code == 'ValidationException':
			print(f"Invalid request: {e.response['Error']['Message']}")
		elif error_code == 'ThrottlingException':
			print("Request throttled - consider implementing exponential backoff")
		else:
			print(f"AWS error: {error_code}")

		# Fail closed - deny access on error
		return False

	except BotoCoreError as e:
		print(f"SDK error: {e}")
		return False

	except Exception as e:
		print(f"Unexpected error: {e}")
		return False

It’s important to note that the AWS SDK provides built-in retry logic for transient failures. The following is an example of how you can enable this feature:

# Configure retry behavior
config = Config(
	retries={
		'max_attempts': 3,
		'mode': 'adaptive'# Automatically adjusts retry behavior
	},
	connect_timeout=5,
	read_timeout=10
)

self.client = boto3.client(
	'verifiedpermissions',
	region_name=region,
	config=config
)

Data transformation

Your current authorization data needs to be transformed into Cedar’s entity format. This transformation happens in the _to_cedar_entity method shown in the error handling changes example, but let’s break down what’s involved.

Extracting entity information
Identify which parts of your current OPA input represent the principal, resource, and action. In most OPA implementations, this mapping is straightforward:

# Current OPA structure
opa_input = {
	"user": {...},# This becomes the principal
	"resource": {...},# This becomes the resource
	"action": "read"# This becomes the action
}

# Map to Cedar structure
principal = opa_input["user"]
resource = opa_input["resource"]
action = opa_input["action"]

Adding type information
Cedar requires explicit type declarations for all entities. You’ll need to determine the appropriate entity type based on your schema:

def _determine_entity_type(self, entity_data: Dict[str, Any]) -> str:
	# Determine the Cedar entity type based on entity data. This logic will be specific to your application.
	# Example: determine type based on entity structure or type field
	if 'role' in entity_data:
		return 'User'
	elif 'document_type' in entity_data:
		return 'Document'
	elif 'name' in entity_data and 'member_count' in entity_data:
		return 'Team'
	else:
		raise ValueError(f"Cannot determine entity type for: {entity_data}")

def _to_cedar_entity(self, entity_data: Dict[str, Any], entity_type: str = None) -> Dict[str, Any]:
	# Convert application data to Cedar entity format.
	if entity_type is None:
		entity_type = self._determine_entity_type(entity_data)

	return {
		'entityType': f'MyApp::{entity_type}',
		'entityId': str(entity_data.get('id', '')),
		'attributes': entity_data
	}

Structuring attributes
Cedar attributes must match your schema definition, so you might need to transform attribute names or values. This is also a chance to iterate and improve on naming. The following example demonstrates a code pattern to convert attribute names and values in code.

def _prepare_attributes(self, entity_data: Dict[str, Any], entity_type: str) -> Dict[str, Any]:
	#Prepare entity attributes according to Cedar schema requirements.
	attributes = {}

	if entity_type == 'User':
		# Map OPA field names to Cedar schema field names
		attributes = {
			'department': entity_data.get('dept', entity_data.get('department')),
			'jobLevel': int(entity_data.get('job_level', entity_data.get('jobLevel', 0))),
			'email': entity_data.get('email', entity_data.get('email_address'))
		}
	elif entity_type == 'Document':
		attributes = {
			'classification': entity_data.get('classification','internal'),
			'department': entity_data.get('department'),
			'owner': entity_data.get('owner', entity_data.get('owner_id'))
		}

	# Remove None values
	return {k: v for k, v in attributes.items() if v is not None}

Handling context
Separate environmental information from entity data. Context information should not be part of entity attributes.

def prepare_authorization_request(self, user_data, resource_data, action,
						request_metadata=None):

	# Entity data only includes intrinsic properties
	principal = {
		'id': user_data['id'],
		'department': user_data['department'],
		'jobLevel': user_data['job_level']
	}

	resource = {
		'id': resource_data['id'],
		'classification': resource_data['classification'],
		'owner': resource_data['owner']
	}

	# Context includes environmental and request-specific data
	context = {}
	if request_metadata:
		context = {
			'currentHour': request_metadata.get('hour'),
			'ipAddress': request_metadata.get('ip_address'),
			'userAgent': request_metadata.get('user_agent'),
			'requestTime': request_metadata.get('timestamp')
		}
	return self.is_authorized(principal, action, resource, context)

Testing your migration

The most critical aspect of migration testing is verifying that you have correctly migrated your authorization logic from Rego to Cedar. This requires systematic testing with comprehensive test cases.

Test case development

  1. Inventory current policies: Document your current Rego policies, including their decision logic, input data requirements, and expected outcomes for key test scenarios
  2. Create test scenarios: Develop test cases covering all policy branches and edge cases
  3. Capture current behavior: Run your test cases against OPA to establish baseline results
  4. Test Cedar policies: Run the same test cases against your Cedar policies
  5. Analyze differences: Investigate mismatches and adjust policies accordingly

When testing your policies, start with basic, straightforward policies before tackling complex ones. Test both positive cases (should be allowed) and negative cases (should be denied) and include edge cases and boundary conditions. Additionally, test with real production data (anonymized if necessary) to verify that your policies will work effectively when implemented in production.

It’s also important to compare the performance characteristics of your OPA setup with Verified Permissions across several key metrics. These metrics should include average response time for authorization requests, throughput (requests per second), and error rates under normal and stress conditions. During testing, test from the actual deployment environment used by your application and account for network latency to AWS services.

Finally, you should test the complete integration between your application and Verified Permissions across several critical areas. Your integration testing should cover authentication and AWS credential handling, request/response data transformation, error handling and fallback scenarios, connection pooling and resource management, and logging and monitoring integration to help ensure that the components work together seamlessly.

Deployment strategy

A successful migration from OPA to Verified Permissions requires careful planning and a risk-managed deployment approach that minimizes disruption to your production systems.

Phased migration approach

Rather than switching entirely to Verified Permissions in a single step, implement a phased migration to reduce risk.

  1. Parallel deployment: Deploy Verified Permissions alongside your existing OPA infrastructure and route a small percentage of authorization requests to the new system. Log and compare results between both systems, focusing on non-critical operations initially to minimize risk during the transition process.
  2. Gradual traffic shift: Gradually increase the percentage of requests routed to Verified Permissions while monitoring system performance, error rates, and authorization accuracy. Implement circuit breaker patterns to fall back to OPA if needed and expand to more critical operations as your confidence grows in the reliability and performance of the new system.
  3. Full migration: Route all traffic to Verified Permissions but keep OPA infrastructure running temporarily. Monitor system behavior under full production load and decommission OPA infrastructure after stability is confirmed and you are confident in the performance of the new system.

Feature flag implementation

Use feature flags to control the migration process through various flag types. These include percentage-based rollout to route a specific percentage of requests to the new system, user-based rollout to route specific users or user groups to the new system, operation-based rollout to route specific types of operations to the new system, and environment-based rollout to use different systems in different environments. Feature flags provide several benefits, including instant rollback capability if issues arise, granular control over migration scope, A/B testing of authorization decisions, and safe experimentation with new policies.

Troubleshooting common migration issues

When migrating from Rego to Cedar, you might encounter several common issues. In this section, you’ll find a troubleshooting guide.

Complex Rego logic translation

Some Rego policies use complex logic that doesn’t directly translate to Cedar. For example:

# Complex Rego policy with loops and comprehensions
allow {
	some i # The i variable is used to iterate over the items in the input.user.permissions array
		input.user.permissions[i].resource == input.resource.id
		input.user.permissions[i].actions[_] == input.action # The wildcard _ is used to iterate over the items in the actions array
}

In these scenarios, you should restructure your data model to work better with Cedar’s entity-based approach. For example, Cedar provides the in operator for improved performance and readability, as shown in the following example:

permit (
	principal,
	action,
	resource
) when {
	principal has permission &&
	resource in principal.permission.resources &&
	action in principal.permission.actions
};

Schema validation errors

Cedar requires strict schema compliance. Common errors include:

  • Undefined entity types
  • Missing required attributes
  • Type mismatches

You can use the schema validation tools provided by Verified Permissions to triage these issues.

Best practices and recommendations

Adhering to the following recommendations and best practices will help you build a maintainable, secure, and performant authorization system with Verified Permissions.

Policy design best practices

Well-designed policies are the foundation of a reliable authorization system and directly impact maintainability and security:

  • Schema-first design: Start with a comprehensive schema design before writing policies. A well-designed schema makes policy authoring more maintainable.
  • Basic, explicit policies: Favor multiple basic policies over complex monolithic ones. Cedar’s explicit permit/forbid model works best with clear, straightforward policy statements.
  • Meaningful naming: Use descriptive names for entity types, attributes, and policy descriptions. This improves understandability and maintainability of polices.
  • Documentation: Document your authorization model, including entity relationships, policy intentions, and business rules.

Migration strategy recommendations

Successfully migrating your authorization system requires balancing speed with safety through deliberate, incremental steps:

  • Incremental approach Don’t attempt to migrate everything at once. Start with basic, low-risk policies and gradually move to more complex scenarios.
  • Start in audit mode: Calculate and log the policy decisions for both systems. This will help you to compare results without impacting runtime authorization.
  • Comprehensive testing: Invest heavily in testing during migration. The cost of thorough testing is much less than the cost of authorization failures in production.
  • Parallel operations: Run both systems in parallel during migration to validate policy behavior and build confidence in the new system.
  • Team training: Ensure your team understands Cedar’s policy model and syntax. The conceptual differences from Rego require a learning investment.

Operational excellence

Maintaining a production authorization system requires ongoing attention to operational concerns beyond the initial migration:

  • Version control: Treat policies as code with proper version control, code review, and deployment processes.
  • Monitoring and alerting: Implement comprehensive monitoring from day one. Authorization issues can have significant business impact.
  • Regular audits: Periodically review and audit policies to verify that they still meet business requirements and security standards.
  • Performance optimization: Continuously monitor and optimize performance, particularly around caching strategies and policy efficiency.

Conclusion

Migrating from Open Policy Agent to Amazon Verified Permissions represents a significant step toward reducing operational overhead, improving runtime authorization performance and enhancing governance while maintaining robust authorization capabilities. The migration journey from OPA to Verified Permissions isn’t only about changing technologies, it’s an opportunity to improve your authorization architecture, enhance security practices, and build a more scalable foundation for your application’s access control needs.

Thank you for reading this post. If you have comments or questions about migrating from OPA to Verified Permissions, leave them in the comments section below.

Additional resources

The following links provide resources for further reading on the topics covered in this blog post:


If you have feedback about this post, submit comments in the Comments section below. If you have questions about this post, contact AWS Support.

Samuel Folkes

Samuel Folkes
Samuel is a Senior Security Solutions Architect at Amazon Web Services with more than 18 years of experience in software architecture, networking, and cybersecurity. Prior to AWS, he worked as a software engineer and led engineering teams across multiple industries. Samuel specializes in identity and access management and is passionate about using emerging technologies to drive business value.

A Guide to Sending International SMS with US Toll-Free Numbers and AWS End User Messaging

Post Syndicated from Brett Ezell original https://aws.amazon.com/blogs/messaging-and-targeting/a-guide-to-sending-international-sms-with-us-toll-free-numbers-and-aws-end-user-messaging/

AWS End User Messaging now supports international SMS capabilities for US Toll-Free Numbers (TFNs). This new feature allows businesses to use a single US TFN to send SMS messages to over 150 countries, simplifying global outreach. It primarily benefits customers who need to send one-way transactional alerts—like one-time passwords (OTPs) or shipping notifications—and businesses that want to rapidly prototype and test their messaging strategy in new international markets without the overhead of procuring country-specific numbers.

This guide will walk you through the pros and cons of this feature and show you how to enable it and when to use it versus traditional, country-specific sending methods.

What Are International US Toll-Free Numbers?

An International US Toll-Free Number is a standard US TFN that has been enabled with the capability to send SMS messages to destinations outside of the United States. This feature is backward compatible, meaning you can enable it on any new or existing US TFNs in your account.

How to Enable International Sending

There are three primary ways to enable this feature for your US Toll-Free Numbers:

  • Enable international sending when registering a new number in the console.
  • Enable international sending for an existing number in the console.
  • Enable international sending for an existing number via the AWS CLI.

1. Enable When Registering a New US Toll-Free Number (Console)

  • From the AWS End User Messaging console, navigate to Manage SMS
  • From the AWS End User Messaging console, navigate to Configurations > Phone numbers > and select Request originator
  • Step 1: Select country, select the United States (US) as your destination country
  • Under Step 2: Define use case, configure the various options listed for your intended Messaging use case, and select Yes to enable International sending, prior to clicking Next
  • For Step 3: Select originator type, select Toll-free, validate your Resource policy choices, select Next
  • In Step 4: Review and request: Verify the information you entered is correct and select Request. Please note: US Toll-Free Number registration requests can take approximately 15 business days to be approved.

For more information, see Request a phone number in AWS End User Messaging SMS

2. Enable for an Existing US Toll-Free Number (Console or CLI)

If you have already acquired a TFN, you can enable the international sending feature at any time.

Using the AWS Management Console:

  • Navigate to Configurations > Phone numbers > and select an existing Toll-free number
  • Locate the International sending tab and choose Edit settings
  • Check the Enable international sending capability box in your phone number details
    • Save Changes

Using the AWS CLI

The update-phone-number command allows you to modify a phone number’s capabilities, while the describe-phone-numbers command allows you to verify its status.

1. To Enable International Sending:

Use the --international-sending-enabled flag

aws pinpoint-sms-voice-v2 update-phone-number \
    --phone-number-id "phone-a1b2c3d4e5f67890" \
    --international-sending-enabled \
    --region us-east-1

Note: Replace "phone-a1b2c3d4e5f67890" with your actual phone number’s ID

2. To Disable International Sending:

Use the --no-international-sending-enabled flag

aws pinpoint-sms-voice-v2 update-phone-number \
    --phone-number-id "phone-a1b2c3d4e5f67890" \
    --no-international-sending-enabled \
    --region us-east-1

Expected Response (for update-phone-number):

A successful command returns the full JSON object for the phone number. Confirm the change by checking that the InternationalSendingEnabled value is true

{
    "PhoneNumberArn": "arn:aws:sms-voice:us-east-1:111122223333:phone-number/phone-a1b2c3d4e5f67890",
    "PhoneNumberId": "phone-a1b2c3d4e5f67890",
    "PhoneNumber": "+18005550199",
    "Status": "ACTIVE",
    "IsoCountryCode": "US",
    "MessageType": "TRANSACTIONAL",
    "NumberCapabilities": [
        "SMS"
    ],
    "NumberType": "TOLL_FREE",
    "MonthlyLeasingPrice": "2.00",
    "TwoWayEnabled": true,
    "InternationalSendingEnabled": true,
    "CreatedTimestamp": "2025-08-15T10:30:00.123Z"
}

3. To Verify the Current Status:

Use the describe-phone-numbers command with your Phone Number ID to check its current configuration at any time.

aws pinpoint-sms-voice-v2 describe-phone-numbers \
    --phone-number-ids "phone-a1b2c3d4e5f67890" \
    --region us-east-1

Benefits and Limitations

This feature offers a powerful new way to reach a global audience, but it’s important to understand where it shines and what its limitations are.

Benefits (Advantages)

  • Global Reach with a Single Number: Send SMS to over 150 countries using a single, existing US TFN.
  • Simplified Management: Avoid the operational overhead and cost of purchasing and managing a fleet of country-specific phone numbers.
  • Rapid Prototyping and Testing: Quickly test messaging campaigns in new international markets before committing to the best practice approach of acquiring dedicated in-country numbers.
  • Cost Optimization for One-Way Alerts: Provides a cost-effective method for sending high-volume, one-way transactional messages like OTPs, appointment reminders, and shipping notifications globally.

Limitations & Technical Considerations

  • Two-Way SMS is Limited to the US and Canada: Reliable, two-way SMS conversations are only supported for recipients in the United States and Canada.
  • One-Way Only for All Other Countries: For all other destinations, this is a one-way only.
  • Best-Effort Deliverability: Sending outside of the US and Canada is on a “best-effort” basis. The phone number that appears on the recipient’s device may be replaced with a local number or Sender ID, which is why two-way messaging will not work for these destinations. For more details on maximizing delivery, please read A Guide to Optimizing SMS Delivery and Best Practices.
  • Managed Opt-Out is Not Guaranteed Internationally: The automatic STOP reply functionality does not work for destinations outside of the US and Canada. For international recipients, you must provide an alternative opt-out method.
  • Standard Throughput (3 MPS): International TFNs have a default throughput of 3 Message Parts Per Second (MPS). For high-volume, high-throughput campaigns, dedicated country-specific numbers (like short codes) are the recommended best practice.

Understanding the Cost

The pricing for this feature is straightforward:

  • No Additional Monthly Fees: There is no extra charge to enable the international sending capability on your US TFN. You only pay the standard monthly lease for the number itself.
  • Pay-Per-Use Messaging: You are billed for each outbound SMS message at the standard, per-message rate for the destination country.

For a complete and up-to-date list of prices by country, please visit the AWS End User Messaging Pricing page.

When to Use This vs. Country-Specific Numbers

Choosing the right tool depends on your use case. Here’s a simple comparison:

Considerations and Next Steps

Once you have enabled your international sending over US Toll-Free Numbers, you can enhance your messaging strategy by considering resilience, monitoring, and scalability. The following resources provide best practices for enhancing your sending.

Conclusion

International SMS for US Toll-Free Numbers is a powerful strategic tool for businesses looking to simplify their global messaging. It excels at enabling rapid testing in new markets and efficiently delivering one-way transactional alerts across the globe from a single number.

However, it is not a replacement for the best practice of using dedicated, in-country phone numbers when reliable two-way conversations and guaranteed branding are critical to your campaign’s success. By understanding its benefits and limitations, you can strategically use this feature to get going quickly while planning a long-term move towards country-specific codes for your most important markets.

Orchestrating big data processing with AWS Step Functions Distributed Map

Post Syndicated from Biswanath Mukherjee original https://aws.amazon.com/blogs/compute/orchestrating-big-data-processing-with-aws-step-functions-distributed-map/

Developers seek to process and enrich semi-structured big data datasets with durably orchestrated network-based workflows. For example, during quarterly earnings season, finance organizations run thousands of market simulations simultaneously to provide timely insights for scenario planning or risk management—these workloads require coordination between raw datasets and on-premise servers to provide the latest market information.

AWS Step Functions is a visual workflow service capable of orchestrating over 14,000 API actions from over 220 AWS services to build distributed applications. Now, Step Functions Distributed Map streamlines big data dataset transformation by processing Amazon Athena data manifest and Parquet files directly. Using its Distributed Map feature, you can process large scale datasets by running concurrent iterations across data entries in parallel. In Distributed mode, the Map state processes the items in the dataset in iterations called child workflow executions. You can specify the number of child workflow executions that can run in parallel. Each child workflow execution has its own, separate execution history from that of the parent workflow. By default, Step Functions runs 10,000 parallel child workflow executions in parallel.

Distributed Map can process AWS Athena data manifest and Parquet files directly, eliminating the need for custom pre-processing. You also now have visibility into your Distributed Map usage with new Amazon CloudWatch metrics: Approximate Open Map Runs Count, Open Map Run Limit, and Approximate Map Runs Backlog Size.

In this post, you’ll learn how to use AWS Step Functions Distributed Map to process Athena data manifest and Parquet files through a step-by-step demonstration.

This post is part of a series of post about AWS Step Functions Distributed Map:

Use case: IoT sensor data processing

You’ll build a sample application that demonstrates processing IoT sensor data in Parquet format using Step Functions Distributed Map. These Parquet data files and a manifest file containing the list of the data files are exported from Athena. The data temperature, humidity, and lbattery level from different devices. The following table shows sample of sensor data:

Example IoT sensor data

Example IoT sensor data

Your objective is to use the Athena data manifest file, get the list of Parquet files, and iterate over the data in the files to detect anomalies and also stream the processed data through Amazon Kinesis Data Firehose to an Amazon S3 bucket for further analytics using Athena queries. Following is the criteria to detect anomaly:

  • Low battery conditions: less than 20%
  • Humidity anomalies: more than 95% or less than 5%
  • Temperature spikes: more than 35°C or less than -10°C

The following diagram represents the AWS Step Functions state machine:

Parquet files processing workflow

Parquet files processing workflow

  1. The Distributed Map runs an Athena query which generates Parquet data files and an Athena manifest file (csv). The manifest file contains the list of Parquet data files.
  2. Distributed Map processes these Parquet data files in parallel using child workflow executions. You can control the number of child workflow executions that can run in parallel using MaxConcurrency parameter. See Step Functions service quotas to learn more about concurrency limits.
  3. Each child workflow execution invokes an AWS Lambda function to process the respective Parquet file. The Lambda function processes individual sensor readings and detects anomalies according to the preceeding logic and returns a processed sensor data summary response.
  4. The child workflow sends the summary response record to Amazon Kinesis firehose stream which stores the results in a specified Amazon S3 results bucket.

The following Athena Start QueryExecution state runs an UNLOAD query to generate data files in Parquet format and a manifest file in CSV. The output will be stored in the S3 bucket specified in the UNLOAD query and the manifest file will be stored in the S3 bucket configured for the Athena workgroup.

{
  "QueryLanguage": "JSONata",
  "States": {
	   "Athena StartQueryExecution": {
	    "Type": "Task",
	        "Resource": "arn:aws:states:::athena:startQueryExecution.sync",
	        "Arguments": {
		"QueryString": "UNLOAD (WRITE_YOUR_SELECT_QUERY_HERE) TO 'S3_URI_FOR_STORING_DATA_OBJECT' WITH (format = 'JSON')",
		"WorkGroup": "primary"
	},
	"Output": {
	"ManifestObjectKey": "{% $join([$states.result.QueryExecution.ResultConfiguration.OutputLocation, '-manifest.csv']) %}"
},
“Next”: “Next State”
…
}

The following ItemReader is configured to use a manifest type of “ATHENA_DATA” with “PARQUET” data input.

{
  "QueryLanguage": "JSONata",
  "States": {
    ...
    "Map": {
        ...
        "ItemReader": {
        	"Resource": "arn:aws:states:::s3:getObject",
   	"ReaderConfig": {
      		"ManifestType": "ATHENA_DATA",
      		"InputType": "PARQUET"
   	},
   	"Arguments": {
      		"Bucket":"Bucket": "{% $split($substringAfter($states.input.ManifestObjectKey, 's3://'), '/')[0] %}",,
      		"Key": "{% $substringAfter($substringAfter($states.input.ManifestObjectKey, 's3://'), '/') %}"
   	}
	    },
        ...
    }
}

Additional supported InputType options are CSV and JSONL. All objects referenced in a single manifest file must have the same InputType format. You specify the Amazon S3 bucket location of Athena manifest CSV file under Arguments.

The context object contains information in a JSON structure about your state machine and execution. Your workflows can reference the context object in a JSONata expression with $states.context.

Within a Map state, the Context object includes the following data:

"Map": {
   "Item": {
      "Index" : Number,
      "Key"   : "String", // Only valid for JSON objects
      "Value" : "String",
      "Source": "String"
   }
}

For each Map state iteration, Index contains the index number for the array item that is being currently processed, Key is available only when iterating over JSON objects, Value contains the array item being processed, and Source contains one of the following:

  • For state input, the value will be : STATE_DATA
  • For Amazon S3 LIST_OBJECTS_V2 with Transformation=NONE, the value will show the S3 URI for the bucket. For example: S3://amzn-s3-demo-bucket.
  • For all the other input types, the value will be the Amazon S3 URI. For example: S3://amzn-s3-demo-bucket/object-key.

Using this newly introduced Source field in the context object, you can connect the child executions with the source object.

Prerequisites

Set up the state machine and sample data

Run the following steps to deploy the Step Functions state machine.

  1. Clone the GitHub repository in a new folder and navigate to the project root folder.
    git clone https://github.com/aws-samples/sample-stepfunctions-athena-manifest-parquet-file-processor.git
    cd sample-stepfunctions-athena-manifest-parquet-file-processor

  2. Run the following command to install required Python dependencies for the Lambda function.
    python3 -m venv .venv
    source .venv/bin/activate
    python3 -m pip install -r requirements.txt

  3. Build the application.
    sam build

  4. Deploy the application
    sam deploy --guided

  5. Enter the following details:
    • Stack name: The CloudFormation stack name (for example, sfn-parquet-file-processor)
    • AWS Region: A supported AWS Region (for example, us-east-1)
    • Keep rest of the components to default values.

    Note the outputs from the AWS SAM deploy. You will use them in the subsequent steps.

  6. Run the following command to generate sample data in csv format and upload it to an S3 bucket. Replace <IoTDataBucketName> with the value from sam deploy ouptut.
    python3 scripts/generate_sample_data.py <IoTDataBucketName>

Create the Athena database and tables

Before you can run queries, you must set up an Athena database and table for your data.

  1. From Amazon Athena console, navigate to workgoups, select the workgroup named “primary”. Select Edit from Actions. In the query result configuration section, select the options as follows:
    1. Management of query results – select customer managed
    2. Location of query results – enter s3://<IoTDataBucketName>. Replace <IoTDataBucketName> with the value from sam deploy output.
    3. Choose Save to save the changes to the workgroup
  2. Select Query editor tab and run the following commands to create database and tables
    CREATE DATABASE `iotsensordata`;

  3. Create an Athena table in database iotsensordata that references the S3 bucket containing the raw sensor data. In this case it will be <IoTDataBucketName>. Replace <IoTDataBucketName> with the value from sam deploy output.
    CREATE EXTERNAL TABLE IF NOT EXISTS `iotsensordata`.`iotsensordata` 
    (`deviceid` string, 
    `timestamp` string,
    `temperature` double,
    `humidity` double,
    `batterylevel` double,
    `latitude` double,
    `longitude` double
    )
    ROW FORMAT SERDE 'org.apache.hadoop.hive.serde2.lazy.LazySimpleSerDe'
    WITH SERDEPROPERTIES ('field.delim' = ',')
    STORED AS INPUTFORMAT 'org.apache.hadoop.mapred.TextInputFormat' OUTPUTFORMAT 'org.apache.hadoop.hive.ql.io.HiveIgnoreKeyTextOutputFormat'
    LOCATION 's3://<IoTDataBucketName>/daily-data/'
    TBLPROPERTIES (
     'classification' = 'csv',
     'skip.header.line.count' = '1'
    );

  4. Create an Athena table in database iotsensordata that references the S3 bucket having the analytics results streamed from Kinesis Data Firehose. Replace <IoTAnalyticsResultsBucket> with value from sam deploy output. And replace <year> with the current year (e.g 2025).
    CREATE EXTERNAL TABLE IF NOT EXISTS iotsensordata.iotsensordataanalytics (deviceid string, analysisDate string, readingTimestamp string, readingsCount int, metrics struct< temperature: double, humidity: double, batterylevel: double, latitude: double, longitude: double >, anomalies array <string>, anomalyCount int, healthStatus string, timestamp string )
    ROW FORMAT SERDE 'org.openx.data.jsonserde.JsonSerDe'
    WITH SERDEPROPERTIES ( 'ignore.malformed.json' = 'FALSE', 'dots.in.keys' = 'FALSE', 'case.insensitive' = 'TRUE'
    )
    STORED AS INPUTFORMAT 'org.apache.hadoop.mapred.TextInputFormat' OUTPUTFORMAT 'org.apache.hadoop.hive.ql.io.HiveIgnoreKeyTextOutputFormat'
    LOCATION 's3://<IoTAnalyticsResultsBucket>/<year>/'
    TBLPROPERTIES ('classification' = 'json', 'typeOfData'='file');

Start your state machine

Now that you have data ready and Athena set up for queries, start your state machine to retrieve and process the data.

  1. Run the following command to start execution of the Step Functions. Replace the <StateMachineArn> and <IoTDataBucketName> with the value from sam deploy output..
    aws stepfunctions start-execution \
      --state-machine-arn <StateMachineArn> \
      --input '{ "IoTDataBucketName": "<IoTDataBucketName>"}'

    The Step Functions state machine has the Athena StartQueryExecution state which has an UNLOAD query that generates the sensor data files in a parquet format and a manifest file in CSV format. The manifest will have 5 rows referencing the 5 parquet files. The state machine will process these 5 parquet files in one map run.

  2. Run the following command to get the details of the execution. Replace the executionArn from the previous command.
    aws stepfunctions describe-execution --execution-arn <executionArn>

  3. After you see the status SUCCEEDED, run the following command from Athena query editor to check the processed output from Kinesis Data Firehose that was streamed to S3 bucket referenced by the Athena table created in step 4 of the preceding section.
    SELECT * FROM iotsensordata.iotsensordataanalytics WHERE anomalycount = 1;

If any of the sensor data exceeds the thresholds, the healthstatus attribute will be set to “anomalies_detected”. The workflow produced a summary table of metadata which you can now query for reporting.

Output from Athena Query Editor

Review workflow performance

Using the following observability metrics, you can review key performance behavior of your data processing workflow.
The AWS/States namespace includes the following new metrics for all Step Functions Map Runs.

  • OpenMapRunLimit: This is the maximum number of open Map Runs allowed in the AWS account. The default value is 1,000 runs and is a hard limit. For more information, see Quotas related to accounts.
  • ApproximateOpenMapRunCount: This metric tracks the approximate number of Map Runs currently in progress within an account. Configuring an alarm on this metric using the Maximum statistic with a threshold of 900 or higher can help you take proactive action before reaching the OpenMapRunLimit of 1,000. This metric enables operational teams to implement preventive measures, such as staggering new executions or optimizing workflow concurrency, to maintain system stability and prevent backlog accumulation.
  • ApproximateMapRunBacklogSize: This metric shows up when the ApproximateOpenMapRunCount has reached 1,000 and there are backlogged Map Runs waiting to be executed. Backlogged Map Runs wait at the MapRunStarted event until the total number of open Map Runs is less than the quota.

The following graph shows an example of these new metrics. Use the maximum statistic to visualize these metrics. ApproximateMapRunBacklogSize metrics appear after accounts start getting throttled on the OpenMapRunLimit limit. The OpenMapRun (orange line) is the account hard limit of 1,000 shown as a static line. The ApproximateOpenMapRunCount (violet line) is the current number of active OpenMap runs. The ApproximateMapRunBacklogSize (green line) indicates the map runs waiting in backlog to be processed. When the ApproximateOpenMapRunCount is lower than 1000 (OpenMapRun limit) there are no map runs in backlog. However, when the count reaches the OpenMapRun limit, the backlog of map runs starts to build up. After the active runs complete, the backlog will start to drain out and new runs will begin execution.

Graphed metrics from Amazon CloudWatch

Graphed metrics from Amazon CloudWatch

Clean up

To avoid costs, remove all resources created for this post once you’re done. From the Athena query editor, run the following commands:

DROP TABLE `iotsensordata`.`iotsensordata`;
DROP TABLE `iotsensordata`.`iotsensordataanalytics`;
DROP DATABASE `iotsensordata`;

Run the following commands from the AWS CLI after replacing the <placeholder> variable to delete the resources you deployed for this post’s solution:

aws s3 rm s3://<IoTDataBucketName> --recursive
aws s3 rm s3://<IoTAnalyticsResultsBucketName> --recursive
sam delete

Conclusion

With this update, Distributed Map now supports additional data inputs, so you can orchestrate large-scale analytics and ETL workflows. You can now process Amazon Athena data manifest and Parquet files directly, eliminating the need for custom pre-processing. You also now have visibility into your Distributed Map usage with the following metrics: Approximate Open Map Runs Count, Open Map Run Limit, and Approximate Map Runs Backlog Size.

New input sources for Distributed Map are available in all commercial AWS Regions where AWS Step Functions is available. For a complete list of AWS Regions where Step Functions is available, see the AWS Region Table. The improved observability of your Distributed Map usage with new metrics is available in all AWS Regions. To get started, you can use the Distributed Map mode today in the AWS Step Functions console. To learn more, visit the Step Functions developer guide.

For more serverless learning resources, visit Serverless Land.

Optimizing nested JSON array processing using AWS Step Functions Distributed Map

Post Syndicated from Biswanath Mukherjee original https://aws.amazon.com/blogs/compute/optimizing-nested-json-array-processing-using-aws-step-functions-distributed-map/

When you’re working with large datasets, you’ve likely encountered the challenge of processing complex JSON structures in your automated workflows. You need to preprocess arrays within nested JSON objects before you can run parallel processing on them. Extracting data used to require custom code and extra processing steps, delaying you from building your core application logic.

With AWS Step Functions Distributed Map, you can process large datasets with concurrent iterations of workflow steps across data entries. Using the enhanced ItemsPointer feature of Distributed Maps, you can extract array data directly from JSON objects stored in Amazon S3. Alternatively, for JSON object as state input, you can use Items (JSONata) or ItemsPath (JSONPath). With this enhancement you can point directly to arrays nested within JSON structures, eliminating the need for custom preprocessing of your data. With ItemsPointer, Items, and ItemsPath you can select the nested array data and simplify your workflows.

In this post, we explore how to optimize processing array data embedded within complex JSON structures using AWS Step Functions Distributed Map. You’ll learn how to use ItemsPointer to reduce the complexity of your state machine definitions, create more flexible workflow designs, and streamline your data processing pipelines—all without writing additional transformation code or AWS Lambda functions.

This post is part of a series of post about AWS Step Functions Distributed Map:

Use case: e-commerce product data enrichment

In this e-commerce use case example, you’ll build a sample application that demonstrates processing of product inventory data for an e-commerce application using AWS Step Functions Distributed Map. The application receives a JSON file from an upstream application containing an array of product information. The Step Functions workflow reads the JSON file containing product data from an S3 bucket and iterates over the array to enrich each product data in the array.

The following diagram presents the AWS Step Functions state machine.

JSON array processing workflow

JSON array processing workflow

The JSON array is processed using the following workflow:

  1. The state machine reads the product-updates.json file from an input S3 bucket. The file contains a JSON array of products.
  2. The Distributed Map state in the state machine, selects the JSON array node using ItemsPointer and iterates over the JSON array.
  3. For each of the items within the array, the state machine invokes a Lambda function for data enrichment. The Lambda function adds product stock and price information to the product data.
  4. The state machine saves the updated product data in an Amazon DynamoDB table.
  5. Finally, the state machine uploads the execution metadata into an output S3 bucket. See limits related to state machine executions and task executions.

MaxConcurrency can be configured to specify the number of child workflow executions in a Distributed Map that can run in parallel. If not specified, then Step Functions doesn’t limit concurrency and runs 10,000 parallel child workflow executions.

You can read a JSON file from a S3 bucket using ItemReader and its sub-fields. If the JSON file, from the S3 bucket, contains a nested object structure, you can select the specific node with your data set with an ItemsPointer. For example, the following input JSON file:

{
  "version": "2024.1",
  "timestamp": "2025-09-26T10:49:36.646197",
  "productUpdates": {
    "items": [
      {
        "productId": "PROD-001",
        "name": "Wireless Headphones",
        "price": 79.99,
        "stock": 150,
        "category": "Electronics"
      },
      {
        "productId": "PROD-002",
        "name": "Smart Watch",
        "category": "Electronics"
      },
      …
    ]
  }
}

The following JSONata-based workflow configuration extracts a nested list of products from productUpdates/items:

"ItemReader": {
   "Resource": "arn:aws:states:::s3:getObject",
   "ReaderConfig": {
      "InputType": "JSON",
      "ItemsPointer": "/productUpdates/items"
   },
   "Arguments": {
      "Bucket": "amzn-s3-demo-bucket",
      "Key": "updates/product-updates.json"
   }
}

For JSONPath-based workflow note that Arguments is replaced with Parameters:

"ItemReader": {
   "Resource": "arn:aws:states:::s3:getObject",
   "ReaderConfig": {
      "InputType": "JSON",
      "ItemsPointer": "/productUpdates/items"
   },
   "Arguments": {
      "Bucket": "amzn-s3-demo-bucket",
      "Key": "updates/product-updates.json"
   }
}

The ItemReader field is not needed when your dataset is JSON data from a previous step. ItemsPointer is only applicable when the input JSON objects read from an S3 bucket. If you are using JSON as state input to a Distributed Map, then you can use the ItemsPath (for JSONPath) or Items (for JSONata) field to specify a location in the input that points to JSON array or object used for iterations.

Prerequisite

To use Step Functions Distributed Map, verify you have:

Set up and run the workflow

Run the following steps to deploy the Step Functions state machine.

  1. Clone the GitHub repository in a new folder and navigate to the project folder.
    git clone https://github.com/aws-samples/sample-stepfunctions-json-array-processor.git
    cd sample-stepfunctions-json-array-processor

  2. Run the following commands to deploy the application.
    sam deploy --guided

    Enter the following details:

    • Stack name: Stack name for CloudFormation (for example, stepfunctions-json-array-processor)
    • AWS Region: A supported AWS Region (for example, us-east-1)
    • Accept all other default values.

    The outputs from the sam deploy will be used in the subsequent steps.

  3. Run the following command to generate product-updates.json file containing a nested JSON array of sample products and upload the product-updates.json file to the input S3 bucket. Replace InputBucketName with the value from sam deploy output.
    python3 scripts/generate_sample_data.py <InputBucketName>

  4. Run the following command to start execution of the Step Functions workflow. Replace the StateMachineArn with the value from sam deploy output.
    aws stepfunctions start-execution \
      --state-machine-arn <StateMachineArn> \
      --input '{}'

    The state machine reads the input product-updates.json file and invokes a Lambda function to update the database for every product in the array after adding price and stock information. The execution metadata is also uploaded into the results bucket.

Monitor and verify results

Run the following steps to monitor and verify the test results.

  1. Run the following command to get the details of the execution. Replace executionArn with your state machine ARN.
    aws stepfunctions describe-execution --execution-arn <executionArn>

    Wait until the status shows SUCCEEDED.

  2. Run the following commands to validate the processed output from ProductCatalogTableName DynamoDB table. Replace the value ProductCatalogTableName with the value from sam deploy output.
    aws dynamodb scan --table-name <ProductCatalogTableName>

  3. Check that the DynamoDB table contains the enriched product data including price and stock attributes. Example output:
    {
        "Items": [
            {
                "ProductId": {
                    "S": "PROD-005"
                },
                "lastUpdated": {
                    "S": "2025-10-07T20:33:34.507Z"
                },
                "stock": {
                    "N": "129"
                },
                "price": {
                    "N": "139.25"
                }
            },
            {
                "ProductId": {
                    "S": "PROD-003"
                },
                "lastUpdated": {
                    "S": "2025-10-07T20:33:34.576Z"
                },
                "stock": {
                    "N": "471"
                },
                "price": {
                    "N": "40.92"
                }
            },
    	      …
        ],
        "Count": 5,
        "ScannedCount": 5,
        "ConsumedCapacity": null
    }

Clean up

To avoid costs, remove all resources you’ve created while following along with this post.

Run the following command after replacing the <placeholder> variable to delete the resources you deployed for this post’s solution:

aws s3 rm s3://<InputBucketName> --recursive
aws s3 rm s3://<ResultBucketName> --recursive
sam delete

Conclusion

In this post, you learned how to use Step Functions Distributed Map for extracting array data natively from JSON objects stored in a S3 bucket. By removing custom data extraction code, you can simplify the processing of your large-scale parallel workloads. With ItemsPointer you can extract array data within JSON files stored in a S3 bucket , and with Items(JSONata) or ItemsPath (JSONPath), you can extract arrays from complex JSON state input, adding flexibility to your workflow designs.

New input sources for Distributed Map are available in all commercial AWS Regions where AWS Step Functions is available. For a complete list of AWS Regions where Step Functions is available, see the AWS Region Table. To get started, you can use the Distributed Map mode today in the AWS Step Functions console. To learn more, visit the Step Functions developer guide.

For more serverless learning resources, visit Serverless Land.

Enhanced search with match highlights and explanations in Amazon SageMaker

Post Syndicated from Ramesh H Singh original https://aws.amazon.com/blogs/big-data/enhanced-search-with-match-highlights-and-explanations-in-amazon-sagemaker/

Amazon SageMaker now enhances search results in Amazon SageMaker Unified Studio with additional context that improves transparency and interpretability. Users can see which metadata fields matched their query and understand why each result appears, increasing clarity and trust in data discovery. The capability introduces inline highlighting for matched terms and an explanation panel that details where and how each match occurred across metadata fields such as name, description, glossary, and schema. Enhanced search results reduces time spent evaluating irrelevant assets by presenting match evidence directly in search results. Users can quickly validate relevance without analyzing individual assets.

In this post, we demonstrate how to use enhanced search in Amazon SageMaker.

Search results with context

Text matches include keyword match, begins with, synonyms, and semantically related text. Enhanced search displays search result text matches in these locations:

  • Search result: Text matches in each search result’s name, description, and glossary terms are highlighted.
  • About this result panel: A new About this result panel is displayed to the right of the highlighted search result. The panel displays the text matches for the result item’s searchable content including name, description, glossary terms, metadata, business names, and table schema. The list of unique text match values is displayed at the top of the panel for quick reference.

Data catalogs contain thousands of datasets, models, and projects. Without transparency, users can’t tell why certain results appear or trust the ordering. Users need evidence for search relevance and understandability.

Enhanced search with match explanations improves catalog search in four key ways:
1) transparency is increased because users can see why a result appeared and gain trust,
2) efficiency improves since highlights and explanations reduce time spent opening irrelevant assets,
3) governance is supported by showing where and how terms matched, aiding audit and compliance processes, and
4) consistency is reinforced by revealing glossary and semantic relationships, which reduces misunderstanding and improves collaboration across teams.

How enhanced search works

When a user enters a query, the system searches across multiple fields like name, description, glossary terms, metadata, business names and table schema. With enhanced search transparency, each search result includes the list of text matches that were the basis for including the result, including the field that contained the text match, and a portion of the field’s text value before and after the text match, to provide context. The UI uses this information to display the returned text with the text match highlighted.

For example, a steward searches for “revenue forecasting,” and an asset is returned with the name “Sales Forecasting Dataset Q2” and a description that contains “projected sales figures.” The word sales is highlighted in the name and description, in both the search result and the text matches panel, because sales is a synonym for revenue. The About this result panel also shows that forecast was matched in the schema field name sales_forecast_q2.

Solution overview

In this section we demonstrate how to use the enhanced search features. In this example, we will be demonstrating the use in a marketing campaign where we need user preference data. While we have multiple datasets on users, we will demonstrate how enhanced search simplifies the discovery experience.

Prerequisites

To test this solution you should have an Amazon SageMaker Unified Studio domain set up with a domain owner or domain unit owner privileges. You should also have an existing project to publish assets and catalog assets. For instructions to create these assets, see the Getting started guide.

In this example we created a project named Data_publish and loaded data from the Amazon Redshift sample database. To ingest the sample data to SageMaker Catalog and generate business metadata, see Create an Amazon SageMaker Unified Studio data source for Amazon Redshift in the project catalog.

Asset discovery with explainable search

To find assets with explainable search:

  1. Log in to SageMaker Unified Studio.
  2. Enter the search text user-data. While we get the search results in this view, we want to get further details on each of these datasets. Press enter to go to full search.
  3. In full search, search results are returned when there are text matches based on keyword search, starts with, synonym, and semantic search. Text matches are highlighted within the searchable content that is shown for each result: in the name, description, and glossary terms.
  4. To further enhance the discovery experience and find the right asset, you can look at the About this result panel on the right and see the other text matches, for example, in the summary, table name, data source database name, or column business name, to better understand why the result was included.
  5. After examining the search results and text match explanations, we identified the asset named Media Audience Preferences and Engagement as the right asset for the campaign and selected it for analysis.

Conclusion

Enhanced search transparency in Amazon SageMaker Unified Studio transforms data discovery by providing clear visibility into why assets appear in search results. The inline highlighting and detailed match explanations help users quickly identify relevant datasets while building trust in the data catalog. By showing exactly which metadata fields matched their queries, users spend less time evaluating irrelevant assets and more time analyzing the right data for their projects.

Enhanced search is now available in AWS Regions where Amazon SageMaker is supported.

To learn more about Amazon SageMaker, see the Amazon SageMaker documentation.


About the authors

Ramesh H Singh

Ramesh H Singh

Ramesh is a Senior Product Manager Technical (External Services) at AWS in Seattle, Washington, currently with the Amazon DataZone team. He is passionate about building high-performance ML/AI and analytics products that enable enterprise customers to achieve their critical goals using cutting-edge technology.

Pradeep Misra

Pradeep Misra

Pradeep is a Principal Analytics and Applied AI Solutions Architect at AWS. He is passionate about solving customer challenges using data, analytics, and AI/ML. Outside of work, Pradeep likes exploring new places, trying new cuisines, and playing board games with his family. He also likes doing science experiments, building LEGOs and watching anime with his daughters.

Ron Kyker

Ron Kyker

Ron is a Principal Engineer with Amazon DataZone at AWS, where he helps drive innovation, solve complex problems, and set the bar for engineering excellence for his team. Outside of work, he enjoys board gaming with friends and family, movies, and wine tasting.

Rajat Mathur

Rajat Mathur

Rajat is a Software Development Manager at AWS, leading the Amazon DataZone and SageMaker Unified Studio engineering teams. His team designs, builds, and operates services which make it faster and straightforward for customers to catalog, discover, share, and govern data. With deep expertise in building distributed data systems at scale, Rajat plays a key role in advancing the data analytics and AI/ML capabilities of AWS.

Kyle Wong

Kyle Wong

Kyle is a Software Engineer at AWS based in San Francisco, where he works on the Amazon DataZone and SageMaker Unified Studio team. His work has been primarily at the intersection of data, analytics, and artificial intelligence, and he is passionate about developing AI-powered solutions that address real-world customer challenges.

Use trusted identity propagation for Apache Spark interactive sessions in Amazon SageMaker Unified Studio

Post Syndicated from Aarthi Srinivasan original https://aws.amazon.com/blogs/big-data/use-trusted-identity-propagation-for-apache-spark-interactive-sessions-in-amazon-sagemaker-unified-studio/

Amazon SageMaker Unified Studio introduces support for running interactive Apache Spark sessions with your corporate identities through trusted identity propagation. These Spark interactive sessions are available using Amazon EMR, Amazon EMR Serverless, and AWS Glue. Enterprises with their workforce corporate identity provider (IdP) integrated with AWS IAM Identity Center can now use their IAM Identity Center user and group identity seamlessly with SageMaker Unified Studio to access AWS Glue Data Catalog databases and tables.

Administrators of AWS services can use trusted identity propagation in IAM Identity Center to grant permissions based on user attributes, such as user ID or group associations. With trusted identity propagation, identity context is added to an IAM role to identify the user requesting access to AWS resources and is further propagated to other AWS services when requests are made. Until now, Spark sessions in SageMaker Unified Studio used the project IAM role for managing data access permissions for all members of the project. This provided fine-grained access control at the project IAM role level and not at the user level. Now, with the trusted identity propagation enabled in the SageMaker Unified Studio domain, the data access can be fine-grained at the user or group level.

The trusted identity propagation support for Spark interactive sessions makes the SageMaker Unified Studio a holistic offering for enterprise data users. Enabling trusted identity propagation in SageMaker Unified Studio saves time by avoiding the repeated permission grants to new project IAM roles and enhances security auditing with the IAM Identity Center user or group ID in the AWS CloudTrail logs.

The following are some of the use cases for trusted identity propagation in Spark sessions for SageMaker Unified Studio:

  • Single sign-on experience with AWS analytics – For customers using enterprise data mesh built using AWS Lake Formation, single sign-on experience with trusted identity propagation is available for Spark applications through EMR Studio attached with Amazon EMR on EC2 and SQL experience through Amazon Athena query editor inside EMR Studio. With the addition of EMR Serverless, Amazon EMR on EC2, and AWS Glue for Spark sessions with trusted identity propagation enabled in SageMaker Unified Studio, the single sign-on experience is expanded to provide easier options for the data scientists and developers.
  • Fine-grained access control based on user identity or group membership– Use a single project within the SageMaker Unified Studio domain across multiple data scientists, with the fine-grained permissions of AWS Lake Formation. When a data scientist accesses the AWS Glue Data Catalog table, the session is now enabled by their IAM Identity Center user or group permissions. Further, each can use their preferred tool, such as EMR Serverless, AWS Glue, or Amazon EMR on Amazon Elastic Compute Cloud (Amazon EC2), for the Spark sessions inside SageMaker Unified Studio.
  • Isolated user sessions – The Spark interactive sessions in SageMaker Unified Studio are securely isolated for each IAM Identity Center user. With secure sessions, data teams can focus more on business data exploration and faster development cycles, rather than building guardrails.
  • Auditing and reporting – Customers in regulated industries need strict compliance reports showing fine-grained details of their data access. CloudTrail logs provide the additionalContext field with the details of IAM Identity Center user ID or group ID and the analytics engine that accessed the Data Catalog tables from SageMaker Unified Studio.
  • Expand and scale with unified governance model – Customers who are already using Amazon Redshift, Amazon QuickSight and AWS Lake Formation permissions integrated with IAM Identity Center can now expand their ML and data analytics platform to include Spark sessions with EMR Serverless and AWS Glue options in SageMaker Unified Studio. They don’t have to maintain IAM role-based policy permissions. Trusted identity propagation for Spark sessions in SageMaker Unified Studio scales the existing permissions mechanism to a wider community of data scientists and developers.

In this post, we provide step-by-step instructions to set up Amazon EMR on EC2, EMR Serverless, and AWS Glue within SageMaker Unified Studio, enabled with trusted identity propagation. We use the setup to illustrate how different IAM Identity Center users can run their Spark sessions, using each compute setup, within the same project in SageMaker Unified Studio. We show how each user will see only tables or part of tables that they’re granted access to in Lake Formation.

Solution overview

A financial services company processes data from millions of retail banking transactions per day, pooled into their centralized data lake and accessed by traditional corporate identities. Their machine learning (ML) platform team would like to enable thousands of their data scientists, working across different teams, with the right dataset and tools in a secure, scalable and auditable fashion. The platform team chooses to use SageMaker Unified Studio, integrate their IdP with IAM Identity Center, and manage access for their data scientists on the data lake tables using fine-grained Lake Formation permissions.

In our sample implementation, we show how to enable three different data scientists—Arnav, Maria, and Wei—belonging to two different teams, to access the same datasets, but with different levels of access. We use Lake Formation tags to grant column restricted access and have the three data scientists run their Spark sessions within the same SageMaker Unified Studio project. When the individual users sign in to the SageMaker Unified Studio project, their IDC user or group identity context is added to the SageMaker Unified Studio project execution role, and their fine-grained permissions from Lake Formation on the catalog tables are effective. We show how their data exploration is isolated and unique.

The following diagram shows an instance of how an enterprise workforce IdP, integrated with IAM Identity Center, would make the users and groups available for use by AWS services. Here, Lake Formation and SageMaker Unified Studio domain are integrated with IAM Identity Center and trusted identity propagation is enabled. In this setup, (a) data permissions are granted to the IDC user or group identities directly instead of IAM roles (b) the user identity context is available end-to-end (c) data access control is centralized in Lake Formation no matter which analytics service the user uses.

Prerequisites

Working with IAM Identity Center and the AWS services that integrate with IAM Identity Center requires several steps. In this post we use one AWS account with IAM Identity Center enabled and a SageMaker Unified Studio domain created. We recommend that you use a test account to follow along the blog.

You need the following prerequisites:

  • An AWS account setup with an IAM administrator role that has permissions to work with IAM Identity Center, Lake Formation, Amazon Simple Storage Service (Amazon S3), CloudTrail, SageMaker Unified Studio, Amazon EMR on EC2, EMR Serverless, and AWS Glue.
  • Enable IAM Identity Center in the account. For details, refer to Enable IAM Identity Center.
    1. Three IAM Identity Center users (Arnav, Maria, and Wei) and two groups (DataScientists and MarketAnalytics). For instructions on creating IAM Identity Center users, refer to Add users to your Identity Center directory. For instructions on creating groups, refer to Add groups to your Identity Center directory.
    2. Add Arnav and Maria to the DataScientists group and add Wei to the MarketAnalytics group. For instructions on adding users to groups, refer to Add users to groups.

    The following screenshot shows users Maria and Arnav in the DataScientists group.

    following screenshot shows user Wei in the MarketAnalytics group.

  • Configure Lake Formation. For detailed instructions, refer to Data lake administrator permissions and Set up AWS Lake Formation in the Lake Formation documentation.
    1. Integrate Lake Formation with the IAM Identity Center instance. For instructions, refer to Integrating IAM Identity Center.
  • A database and a table created in AWS Glue Data Catalog, with the table data in an S3 bucket.
    1. For the sample dataset and table used in this post, refer to Appendix A.
  • Lake Formation tag-based permissions for the three IAM Identity Center users on the Data Catalog table.
    1. For creating and assigning LF-Tags to Data Catalog tables, refer to Creating LF-Tags, and Assigning LF-Tags to Data Catalog resources.
    2. For granting permissions using LF-Tags, refer to Granting data lake permissions using the LF-TBAC method.
    3. We have shown the sample LF-Tags and permissions for the IAM Identity Center users in Appendix B.
  • A SageMaker Unified Studio domain domain-tip-smus-blog. For instructions to create a SageMaker Unified Studio domain, refer to the quick setup guide in the SageMaker Unified Studio documentation.
    1. The domain should be enabled with trusted identity propagation, following the instructions in Trusted identity propagation.
    2. The domain’s project profile should be enabled with Amazon EMR on EC2. You can choose either General purpose or Memory-Optimized profile. You will have to provide a value for certificateLocation, as shown in the following screenshot. For detailed instructions, refer to Specify PEM certificate for EmrOnEc2 blueprint. For this post, you can use OpenSSL to generate a self-signed X.509 certificate with a 2048-bit RSA private key. Detailed instructions for creating one are at the bottom of Create keys and certificates for data encryption with Amazon EMR.
    3. The two IAM Identity Center groups (DataScientists and MarketAnalytics) should be added to the domain as users. For instructions, refer to Managing users in Amazon SageMaker Unified Studio.

Create a project in SageMaker Unified Studio

Now that DataScientists and MarketAnalytics groups are granted access to the domain, IAM Identity Center users belonging to those two groups can sign in to the SageMaker Unified Studio portal for the next steps. Follow these steps:

  1. Sign in to the SageMaker Unified Studio portal as single sign-on user Arnav.
  2. Create a project blogproject_tip_enabled under the domain, as shown in the following screenshot. For details, follow the instructions in Create a project.
  3. Select All capabilities for Project profile, as shown in the following screenshot. Leave the other parameters to default values.

Arnav would like to collaborate with other team members. After creating the project, he grants access on the project to additional IAM Identity Center groups. He adds the two IAM Identity Center groups, DataScientists and MarketAnalytics, as Members of type Contributor to the project, as shown in the following screenshot.

So far, you’ve set up IAM Identity Center, created users and groups, created a SageMaker Unified Studio domain and project, and added the IAM Identity Center groups as users to the domain and the project. In the rest of the sections, we set up the three types of computes for Spark interactive session and enter a query on the Lake Formation managed tables as individual IAM Identity Center users Arnav, Maria, and Wei.

Set up EMR Serverless

In this section, we set up an EMR Serverless compute and run a Spark interactive session as Arnav.

  1. Sign in to the SageMaker Unified Studio domain as the single sign-on user Arnav. Refer to the domain’s detail page to get the URL.
  2. After signing in as Arnav, select the project blogproject_tip_enabled. From the left navigation pane, choose Compute. On the Data processing tab, choose Add compute.
  3. Under Add compute, choose Create new compute resources, as shown in the following screenshot.
  4. Choose EMR Serverless.
  5. Under Release label, choose minimum version 7.8.0 and choose Fine-grained.
  6. After the EMR Serverless compute is in Created status, on the Actions dropdown list, choose Open JupyterLab IDE. This will open a Jupyter Notebook session.
  7. When the Jupyter notebook opens, you will see a banner to update the SageMaker Distribution image to version 2.9. Follow the instructions in Editing a space and update the space to use version 2.9. Save the space and restart after update.
  8. Open the space after it finishes updating. This will open the Jupyter notebook.

    Now, your environment is ready, and you can run Spark queries and test your access to the table bankdata_icebergtbl.
  9. On the Launcher window, under Notebook, choose Python 3(ipykernel).
  10. On the top part of the notebook cell, choose PySpark from the kernel dropdown list and emr-s.blog_tipspark_emrserverless from the Compute dropdown list.
  11. Run the following query:
    spark.sql(“select * from bankdata_db.bankdata_icebergtbl limit 10”).show()

Because Arnav is part of the DataScientists group, he should see all columns of the table, as shown in the following screenshot.

This verifies LF-Tags based access for Arnav on the bankdata_db.bankdata_icebergtbl using a Spark session in EMR Serverless compute.

Set up AWS Glue 5.0

In this section, we set up AWS Glue compute and run a Spark interactive session as Maria.

  1. Sign in to the SageMaker Unified Studio domain as the single sign-on user Maria.
  2. Choose the project blogproject_tip_enabled. From the left navigation pane, choose Compute. On Data processing tab, you should see two computes created by default in Active status (project.spark.compatibility and project.spark.fineGrained) with Type Glue ETL. For additional details on these compute types, refer to AWS Glue ETL in Amazon SageMaker Unified Studio.
  3. Select the project.spark.fineGrained and launch the Jupyter notebook with the PySpark kernel.
  4. For the notebook cell, choose pySpark for kernel and project.spark.fineGrained for compute. Enter the following query:
    sspark.sql(“select * from bankdata_db.bankdata_icebergtbl limit 10”).show()

Because Maria is part of the DataScientists group, she should see all columns of the table, as shown in the following screenshot.

This verifies LF-Tags based access to Maria on the bankdata_db.bankdata_icebergtbl using Spark session in AWS Glue fine-grained access control (FGAC) compute.

To verify what access Wei has using EMR Serverless and AWS Glue, you can sign out and sign in as user Wei. Enter the Spark SELECT queries on the same table. Wei shouldn’t see the three personally identifiable information (PII) columns transaction_id, bank_account_number, and initiator_name, which were tagged as transactions=secured.

The following screenshot shows the same table for Wei using EMR Serverless.

The following screenshot shows the same table for Wei using AWS Glue FGAC mode.

Set up Amazon EMR on EC2

In this section, we set up an Amazon EMR on EC2 compute and run a Spark interactive session as Wei.

  1. Sign in to the SageMaker Unified Studio domain as the single sign-on user Wei.
  2. Create Amazon EMR on EC2 compute using the steps for EMR Serverless in Setup EMR serverless but choose EMR on EC2 cluster instead of EMR Serverless. For the EMR configuration, choose the MemoryOptimized or GeneralPurpose configuration, depending on which one you chose to upload your PEM certificates to in the project profiles blueprint in the Prerequisites section. Choose an Amazon EMR release label greater than or equal to 7.8.0.
  3. After the cluster is provisioned, locate the instance profile role name in the compute details page, as shown in the following screenshot.
  4. As an admin user who can edit IAM policies in your account, add the following inline policy to the instance profile role. A manual intervention outside SageMaker Unified Studio is required currently to perform this step. This will be addressed in the future.
    {
        "Version": "2012-10-17",
        "Statement": [
            {
                "Sid": "IdCPermissions",
                "Effect": "Allow",
                "Action": [
                    "sso-oauth:CreateTokenWithIAM",
                    "sso-oauth:IntrospectTokenWithIAM",
                    "sso-oauth:RevokeTokenWithIAM"
                ],
                "Resource": "*"
            },
            {
                "Sid": "AllowAssumeRole",
                "Effect": "Allow",
                "Action": [
                    "sts:AssumeRole"
                ],
                "Resource": [
                    "<instance profile role ARN>"
                ]
            }
        ]
    }

  5. After updating the role’s policy, you can use the Amazon EMR on EC2 connection to initiate an interactive Spark session. Similar to how you launched a notebook as Arnav and Maria, do the same steps to launch the notebook as user Wei.
    1. On the Build tab, choose JupyterNotebook from the project home page. Choose Python3(ipykernel) to launch the notebook. Choose Configure space to update to version 2.9. Refresh the notebook browser.
    2. Inside the notebook, on top of the cell, choose PySpark for kernel and emr.blog_tip_emronec2 that you launched for the compute.
  6. Enter a select query on the table as follows:
    spark.sql(“select * from bankdata_db.bankdata_icebergtbl limit 10”).show()

This verifies that Wei, as part of the MarketAnalytics group, sees all columns of the table with LF-Tags transactions=accessible but doesn’t have access to the three columns that were overwritten with LF-Tags transactions=secured (transaction_id, bank_account_number, and initiator_name).

You can trace the user access of the table in the CloudTrail logs for EventName=GetDataAccess. In the relevant CloudTrail log shown below, we notice that the UserID for Wei is provided under additionalEventData field, whereas requestParameters has the tableARN.

The user ID for Wei is available in the IAM Identity Center console under General information.

Thus, we were able to sign in as an individual IAM Identity Center user to the SageMaker Unified Studio domain and query the Data Catalog tables using Amazon EMR and AWS Glue compute. These IAM Identity Center users were able to query the tables that they were granted access to, instead of the SageMaker Unified Studio project’s IAM role.

Cleanup

To avoid incurring costs, it’s important to delete the resources launched for this walkthrough. Clean up the resources as follows:

  1. SageMaker Unified Studio by default shuts down idle resources such as JupyterLab after 1 hour. If you’ve created a SageMaker Unified Studio domain for this post, remember to delete the domain.
  2. If you’ve created IAM Identity Center users and groups, delete the users and delete the groups. Further, if you’ve created an IAM Identity Center instance only for this post, delete your IAM Identity Center instance.
  3. Delete the database bankdata_db from Lake Formation. This will also delete the tables and all associated permissions. Delete the LF-Tag transactions and its values.
  4. Delete the table’s corresponding data from your S3 bucket two subfolders bankdata-csv and bankdata-iceberg.

Conclusion

In this post, we walked through how to enable a SageMaker Unified Studio domain with IAM Identity Center trusted identity propagation and query Lake Formation managed tables in Data Catalog using Apache Spark interactive sessions with EMR Serverless, AWS Glue, and Amazon EMR on EC2. We also verified in CloudTrail logs the IAM Identity Center user ID accessing the table.

Amazon SageMaker Unified Studio with trusted identity propagation provides the following benefits.

Business benefits

  • Enhanced data security
  • Improved workforce data access and insights

Technical capabilities

  • Enables data access based on workforce identity
  • Provides unified governance through Lake Formation for Data Catalog tables when accessed through SMUS
  • Ensures isolated and secure sessions for each IAM Identity Center user
  • Supports multiple analytics options:
    • Spark sessions via EMR Serverless, EMR on EC2, and AWS Glue
    • SQL analytics through Athena and Redshift Spectrum

Organizational advantages

  • Direct use of corporate identities for enterprise data access
  • Simplified access to data platforms and meshes built on Data Catalog and Lake Formation
  • Enables various user roles to work with their preferred AWS analytics services
  • Reduces data exploration time for Spark-familiar data scientists

To learn more, refer to the following resources:

We encourage you to check out the new trusted identity propagation enabled SageMaker Unified Studio for Spark sessions. Reach out to us through your AWS account teams or using the comments section.

Acknowledgment: A special thanks to everyone who contributed to the development and launch of this feature: Palani Nagarajan, Karthik Seshadri, Vikrant Kumar, Yijie Yan, Radhika Ravirala and Jerica Nicholls.

APPENDIX A – Table creation in Data Catalog

  1. We’ve created a synthetic bank transactions dataset with 100 rows in CSV format. Download the dataset dummy_bank_transaction_data.csv
  2. In your S3 bucket, create two subfolders: bankdata-csv and bankdata-iceberg and upload the dataset to bankdata-csv.
  3. Open the Athena console, navigate to query editor, and enter the following statements in sequence:
    -- Create database for the blog
    CREATE DATABASE bankdata_db;
    
    -- Create external table from the CSV file. Provide your S3 bucket name for the table location
    
    CREATE EXTERNAL TABLE bankdata_db.bankdata_csvtbl(
     `transaction_id` string, 
      `transaction_date` date, 
      `transaction_type` string,
      `bank_account_number` string,
      `initiator_name` string,
      `transaction_country` string, 
      `transaction_amount` double, 
      `merchant_name` string)
    ROW FORMAT DELIMITED FIELDS TERMINATED BY ',' 
    STORED AS INPUTFORMAT 'org.apache.hadoop.mapred.TextInputFormat' 
    OUTPUTFORMAT 'org.apache.hadoop.hive.ql.io.HiveIgnoreKeyTextOutputFormat'
    LOCATION 's3://<your-bucket-name>/bankdata-csv/'
    TBLPROPERTIES (
      'areColumnsQuoted'='false', 
      'classification'='csv', 
      'skip.header.line.count'='1',
      'columnsOrdered'='true', 
      'compressionType'='none', 
      'delimiter'=',', 
      'typeOfData'='file');
     
    -- Create Iceberg table for the blog use. Provide your S3 bucket name for the table location
    
    CREATE TABLE bankdata_db.bankdata_icebergtbl WITH (
      table_type='ICEBERG',
      format='parquet',
      write_compression = 'SNAPPY',
      is_external = false,
      partitioning=ARRAY['transaction_type'],
      location='s3://<your-bucket-name>/bankdata-iceberg/'
    ) AS SELECT * FROM bankdata_db.bankdata_csvtbl;

  4. Enter a preview and verify the table data:
    SELECT * FROM bankdata_db.bankdata_icebergtbl limit 10;

APPENDIX B – Creating LF-Tags, attaching tags to the table from Appendix A, and granting permissions to IAM Identity Center users.

We create a Lake Formation tag with Keyname = transactions and Values = secured, accessible. We associate the tag to the table and overwrite a few columns as summarized in the table.

Resource

LF-Tag association

Database

bankdata_db

transactions = accessible

Table

bankdata_icebergtbl

transactions = accessible
Columns transaction_id transactions = secured
bank_account_number transactions = secured
initiator_name transactions = secured

We then grant Lake Formation permissions to the two IAM Identity Center groups using these LF-Tags as follows:

IAM Identity Center group

LF-Tags

Permission

DataScientists

transactions = accessible AND transactions = secured

Database DESCRIBE, Table SELECT

MarketAnalytics

transactions = accessible

Database DESCRIBE, Table SELECT
  1. Sign in to the Lake Formation console and navigate to LF-Tags and permissions. Create an LF-Tag with Keyname = transactions and Values = secured, accessible.
  2. Select the database bankdata_db and associate the LF-Tag transactions=accessible.
  3. Select bankdata_icebergtbl and verify that the LF-Tag transactions=accessible is inherited by the table.
  4. Edit the schema of the table and change the LF-Tag value on the columns transaction_id, bank_account_number, and initiator_name to transactions=secured. After changing, choose Save as new version.


  5. Navigate to the Data permissions page on the Lake Formation console. Choose Grant to grant permissions.
  6. Select the IAM Identity Center group DataScientists for Principals. Select LF-Tags transactions and both the values accessible, secured. Choose Database DESCRIBE and Tables SELECT permissions. Choose Grant.
  7. On the Data permissions page on the Lake Formation console, choose Grant again.
  8. Select the IAM Identity Center group MarketAnalytics for Principals. Select LF-Tags transactions and only one of the values, accessible. Select Database DESCRIBE and Tables SELECT permissions. Choose Grant.
  9. Also grant DESCRIBE permission on the default database to both the IDC groups.
  10. Verify the granted permissions in the Data permissions page, by filtering with expression Principal type = IAM Identity Center group.

Thus, we’ve granted all column access on the table bankdata_icebergtbl to the DataScientists group while securing three PII columns from the MarketAnalytics group.


About the Authors

Aarthi Srinivasan

Aarthi Srinivasan

Aarthi is a Senior Big Data Architect at Amazon Web Services (AWS). She works with AWS customers and partners to architect data lake solutions, enhance product features, and establish best practices for data governance.

Palani Nagarajan

Palani Nagarajan

Palani is a Senior Software Development Engineer with Amazon SageMaker Unified Studio. In his free time, he enjoys playing board games, traveling to new cities, and hiking scenic trails.

Federate access to SageMaker Unified Studio with AWS IAM Identity Center and Okta

Post Syndicated from Raghavarao Sodabathina original https://aws.amazon.com/blogs/big-data/federate-access-to-sagemaker-unified-studio-with-aws-iam-identity-center-and-okta/

Many organizations are using an external identity provider to manage user identities. With an identity provider (IdP), you can manage your user identities outside of AWS and give these external user identities permissions to use AWS resources in your AWS accounts. External identity providers (IdP), such as Okta Universal Directory, can integrate with AWS IAM Identity Center to be the source of truth for Amazon SageMaker Unified Studio.

Amazon SageMaker Unified Studio supports a single sign-on (SSO) experience with AWS IAM Identity Center authentication. Users can access Amazon SageMaker Unified Studio with their existing corporate credentials. AWS IAM Identity Center enables administrators to connect their existing external identity providers and allows them to manage users and groups in their existing identity systems such as Okta which can then be synchronized with AWS IAM Identity Center using SCIM (System for Cross-domain Identity Management).

This post shows step-by-step guidance to setup workforce access to Amazon SageMaker Unified Studio using Okta as an external Identity provider with AWS IAM Identity Center.

Prerequisites

Before you start , make sure you have:

  1. An AWS account with AWS IAM Identity Center enabled . It is recommended to use an organization-level AWS IAM Identity Center instance for best practices and centralized identity management across your AWS organization.
  2. Okta account with users and a group
  3. A browser with network connectivity to Okta and Amazon SageMaker Unified Studio

Solution Overview

The steps in this post are structured into the following sections:

  1. Enable AWS IAM Identity Center
  2. Create an Amazon SageMaker domain
  3. Setup Okta users and groups
  4. Configure SAML in Okta for AWS IAM Identity Center
  5. Configure Okta as an identity provider in AWS IAM Identity Center
  6. Connect AWS IAM Identity Center to Okta
  7. Set up automatic provisioning of users and groups in AWS IAM Identity Center
  8. Complete Okta Configuration
  9. Configure Amazon SageMaker Unified Studio for SSO
  10. Test the setup
  11. Cleanup

Enable AWS IAM Identity Center

To enable AWS IAM Identity Center, follow the instructions in Enable IAM Identity Center in the AWS IAM Identity Center User Guide.

Create an Amazon SageMaker domain

  1. Sign into the AWS Management console and navigate to the Amazon SageMaker console. To create a new Amazon SageMaker Unified Studio domain follow the instructions in Create a Amazon SageMaker Unified Studio domain – manual setup
  2. From the Amazon SageMaker domain Summary page, copy the Domain ARN and save the value as shown Figure 1 for later use.

Screenshot of Amazon SageMaker domain summary page showing Domain ARN field
Figure 1: Amazon SageMaker Domain

Setup Okta users and groups

Step 1: Sign up for an Okta account

  • Sign up for an Okta account, then choose the Sign up button to complete your account setup.
  • If you already have an account with Okta, login to your Okta account.

Step 2: Create Groups in Okta

  • Choose Directory in the left menu and choose Groups to proceed.
  • Click on Add Group and enter name as unifiedstudio. Then choose the Save button.

Screenshot of Okta group creation interface with unifiedstudio group name entered
Figure 2. Creating a group in Okta

Step 3: Create users in Okta

  • Choose People in left menu under Directory section and choose +Add Person.
  • Provide First name, Last name, username (email ID), and primary email. Then select I will set password and choose first time password. Use the Save button to create your user.
  • Add more users as needed.

Step 4: Assign Groups to users

  • Choose Groups from the left menu, then choose the unifiedstudio group created in Step 2.
  • Use Assign People to add users to the sagemaker group. Next, use + for each user you want to add.

Configure SAML In Okta

  1. Login to your okta domain and choose Applications from the left menu. Choose Applications, then choose Browse App Catalog
  2. In the search box, enter AWS IAM Identity Center, then choose the app to add the AWS IAM Identity Center app and then, choose + Add Integration button.
    The following image shows the SAML app integration setup:
    Screenshot of Okta application catalog showing AWS IAM Identity Center app selection
    Figure 3. Creating a SAML app integration in Okta
  3. For this example, we are creating an application called “unifiedstudio”. Under General Settings: Required enter the following
    • Application label = Replace IAM Identity Center with unifiedstudio and then, choose Save
  4. Under Sign on menu. Copy Metadata URL under SAML 2.0 section and then, open Metadata URL in a new browser window to download the Okta identity provider metadata and save it as metadata.xml. You will use this for the SAML configuration in AWS IAM Identity Center to setup Okta as an Identity Provider.The following image shows where to find the metadata URL:

    Screenshot of Okta SAML settings showing metadata URL
    Figure 4: Downloading Okta identity provider metadata for SAML configuration

  5. Choose More details and copy Sign on URL into text file; you will use this for the SAML configuration in Amazon SageMaker Unified Studio.

You are now ready to move to the AWS IAM Identity Center console to create an identity provider integration for your Okta instance.

Configure Okta as an identity provider in AWS IAM Identity Center

  1. Sign in to the AWS IAM Identity Center console as a user with administrative privileges
  2. In the left navigation menu, choose Settings and then, open the Identity source tab, choose Change Identity source from Actions dropdown as shown in Figure 5
    Screenshot of AWS IAM Identity Center settings page showing Change Identity source option
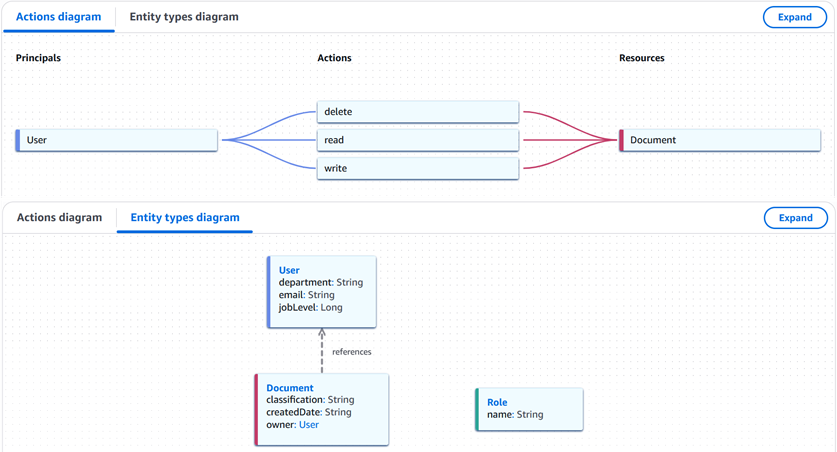
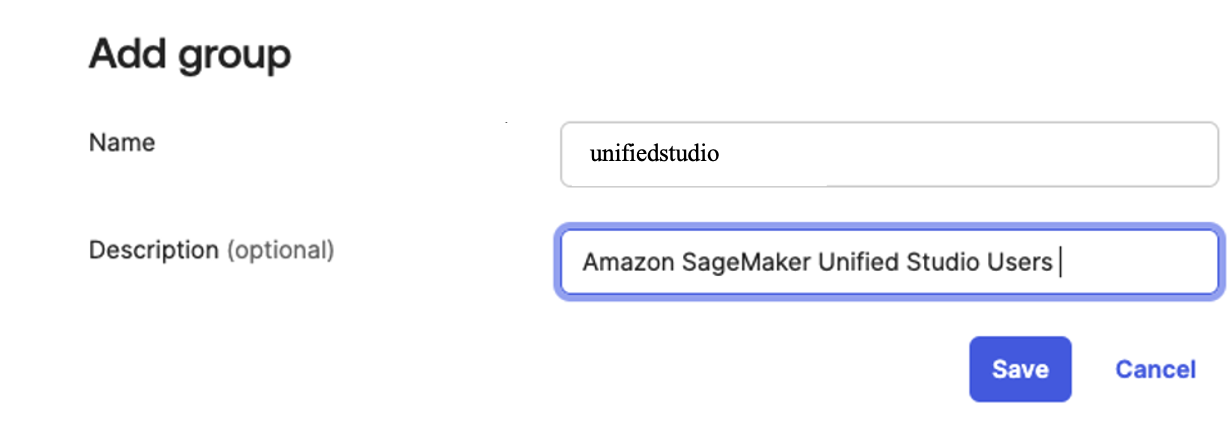
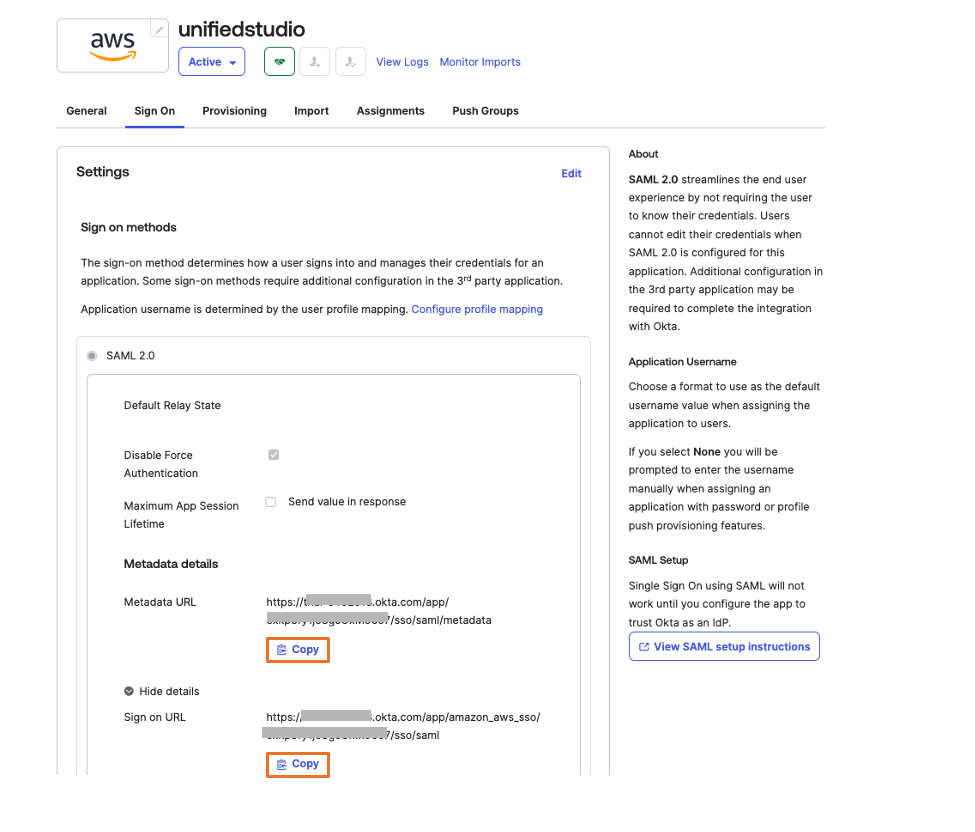
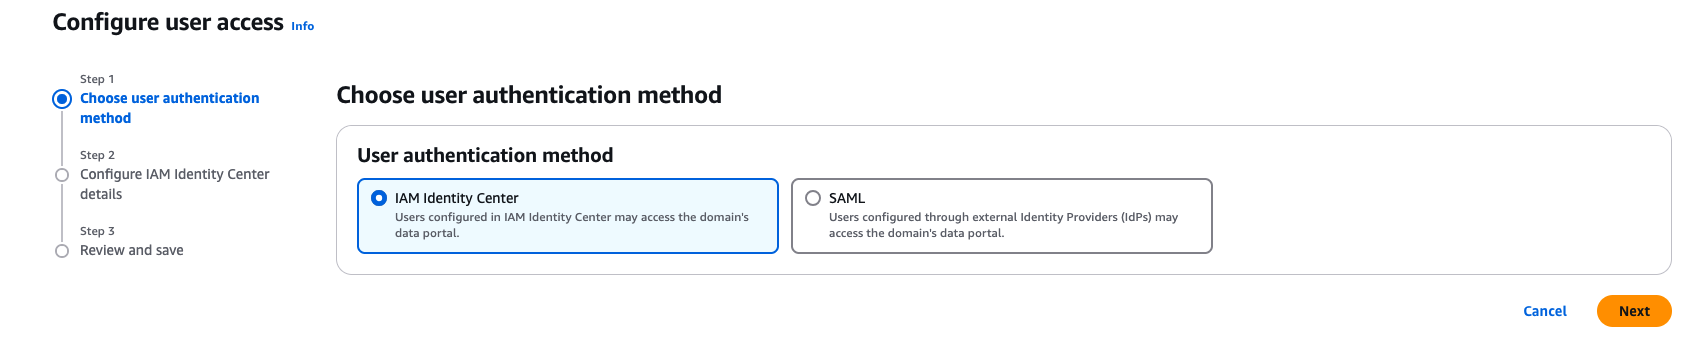
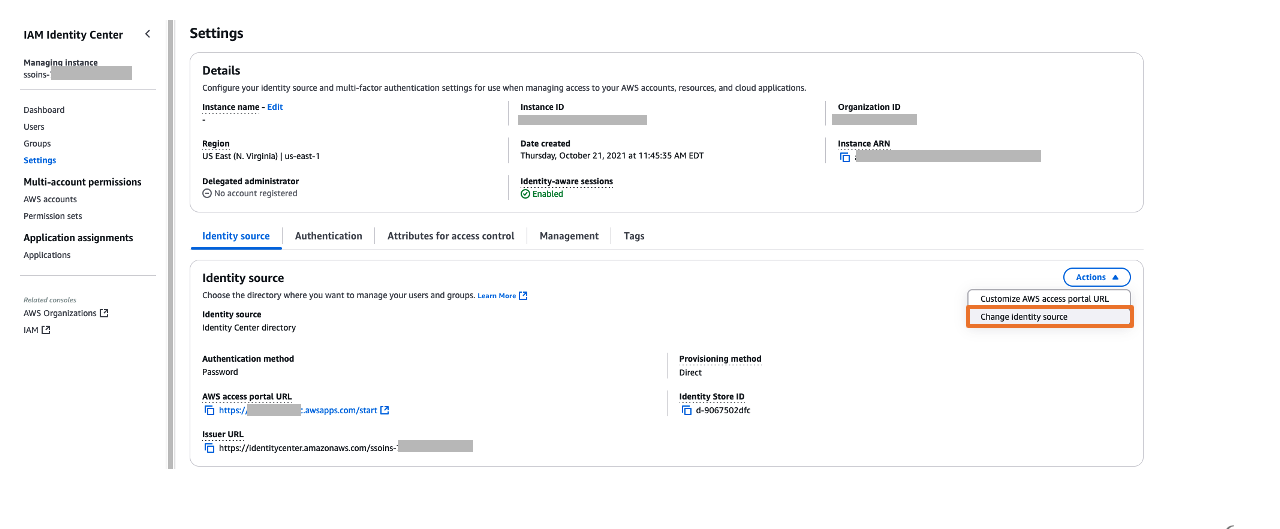
Figure 5: Selecting identity source in AWS IAM Identity Center
  3. From Under Identity source, choose External Identity provider as shown in Figure 6
    Screenshot showing External Identity provider selection in AWS IAM Identity Center
    Figure 6: Choosing External Identity provider in AWS IAM Identity Center
  4. You’ll need these configuration parameters for the next step. In Configure external identity provider section, under Service Provider metadata, do the following:
    • Choose Download metadata file to download the AWS IAM Identity Center metadata file and save it on your system
    • Copy these Service Provider metadata into a text file
      1. IAM Identity Center Assertion Consumer Service (ACS) URL
      2. IAM Identity Center issuer URL
  5. In Identity provider metadata section, under Idp SAML metadata, click on choose file and upload the metadata.xml file which you downloaded from okta in the previous step and then, choose Next as shown in Figure 7

    Screenshot of AWS IAM Identity Center external identity provider configuration showing metadata file upload

    Figure 7. Configuring okta as Identity Provider in AWS IAM Identity Center

  6. After you read the disclaimer and are ready to proceed, enter ACCEPT and then choose Change identity source to complete Okta as an Identity Provider in IAM Identity Center.

Connect AWS IAM Identity Center to Okta

  1. Sign into Okta and go to the admin console.
  2. In the left navigation pane, choose Applications, and then choose the Okta application called unifiedstudio which you created in the previous section
  3. In Sign On, choose Edit to complete SAML configuration. Under Advanced Sign-on Settings enter the following and then, choose Save to complete configuration as shown Figure 8.
    1. For the AWS SSO ACS URL, enter IAM Identity Center Assertion Consumer Service (ACS) URL
    2. For the AWS SSO issuer URL, enter IAM Identity Center issuer URL
    3. For the Application username format, choose Okta username from dropdown

Screenshot of Okta advanced sign-on settings showing AWS SSO configuration fields
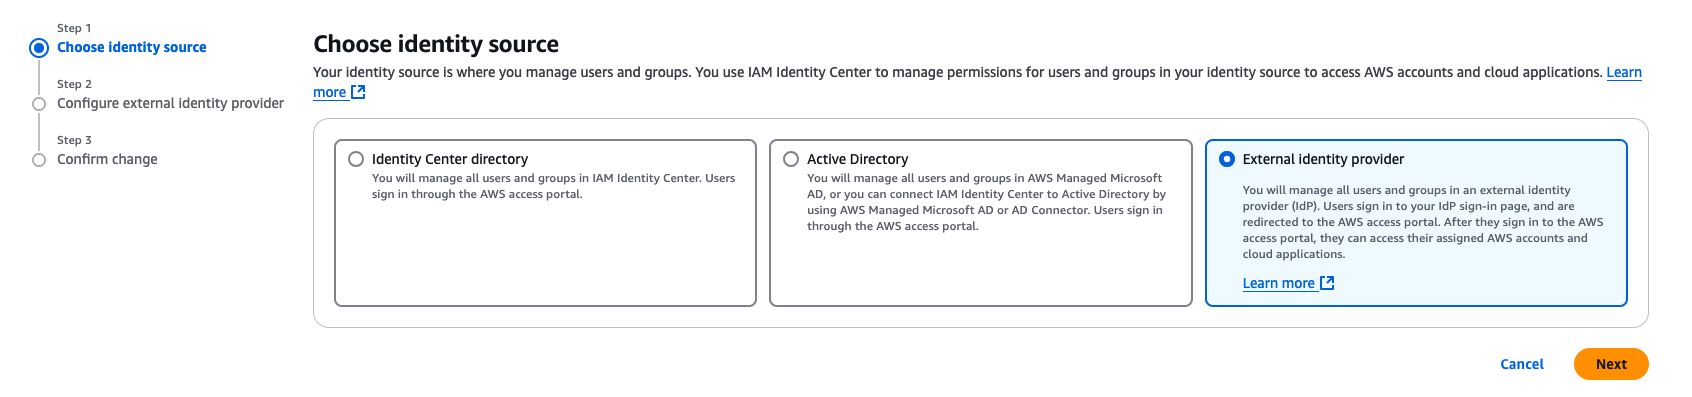
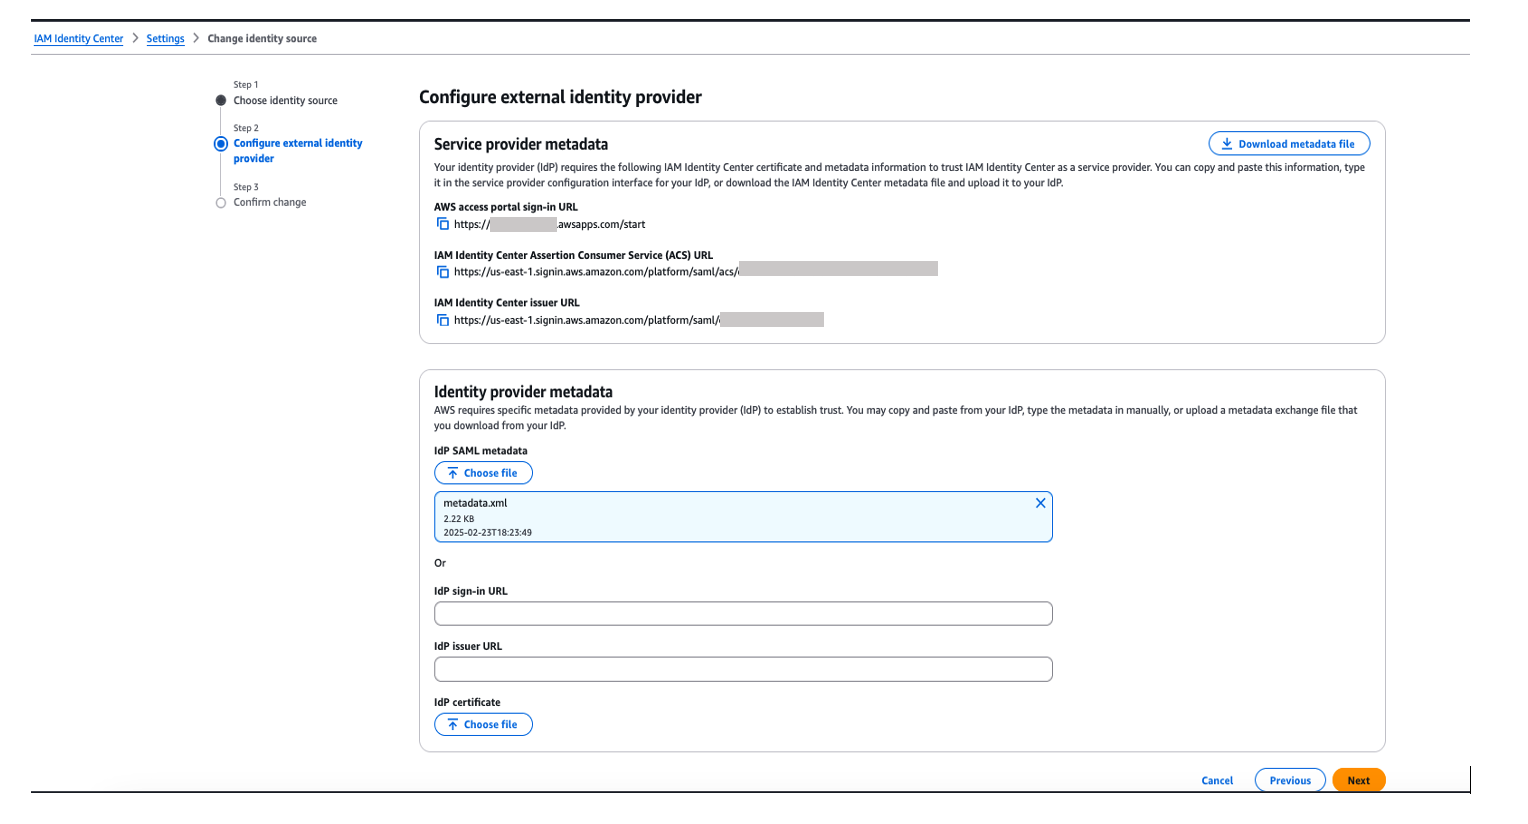
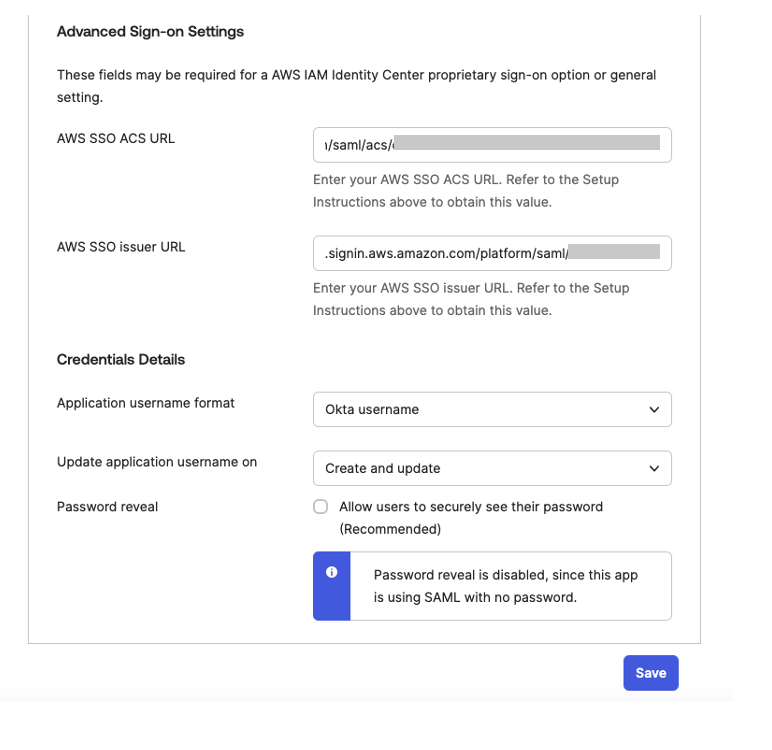
Figure 8. Configuring okta sign-on settings

Set up automatic provisioning of users and groups

In the AWS IAM Identity Center console, on the Settings page, locate the Automatic provisioning information box, and then choose Enable as shown in Figure 9. Copy these values to enable automatic provisioning.

Screenshot of AWS IAM Identity Center automatic provisioning enable option

Figure 9. Enabling automatic provisioning in AWS IAM Identity Center

In the Inbound automatic provisioning dialog box, copy each of the values for the following options as shown in Figure 10 and then, choose Close

    • SCIM endpoint
    • Access token

You will use these values to configure provisioning in Okta in the next step.

Screenshot of AWS IAM Identity Center inbound automatic provisioning dialog showing SCIM endpoint and access token
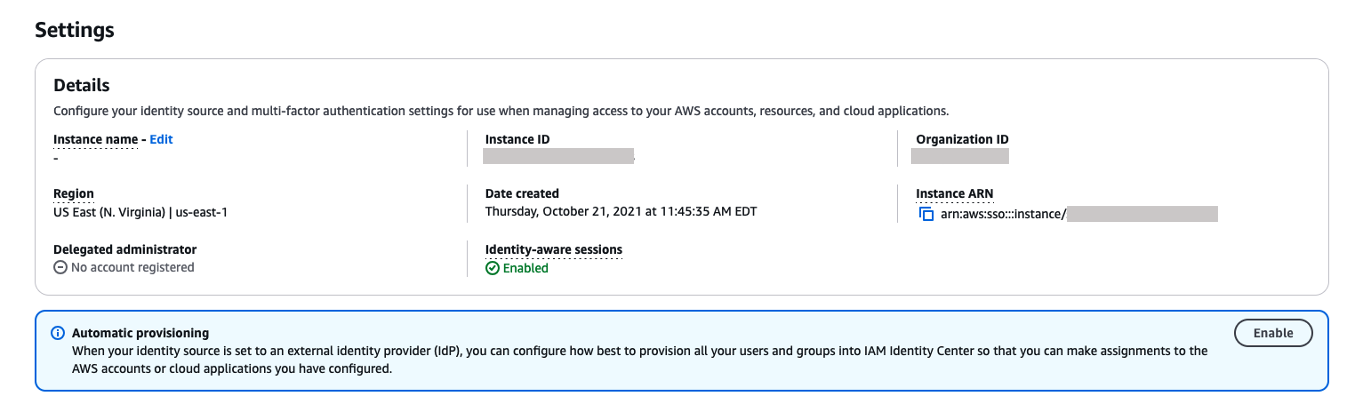
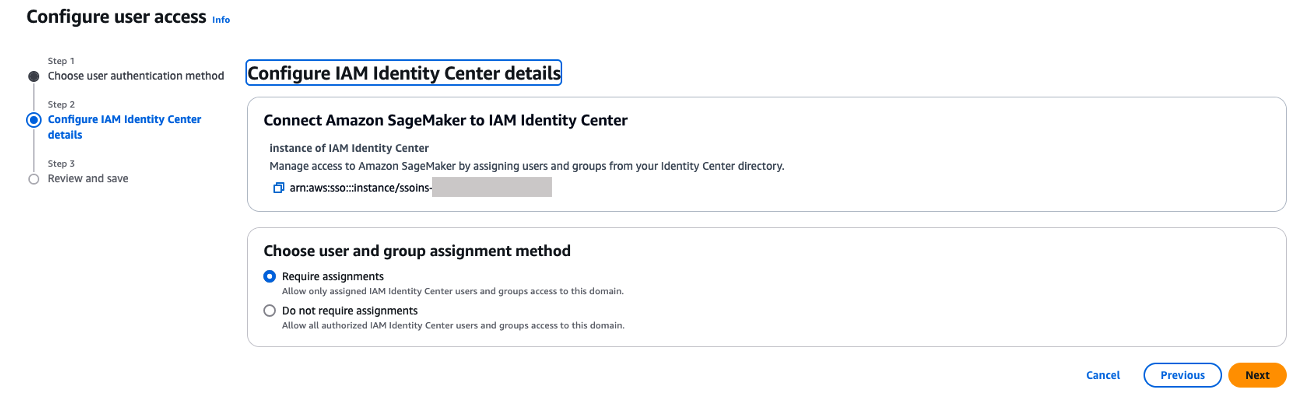
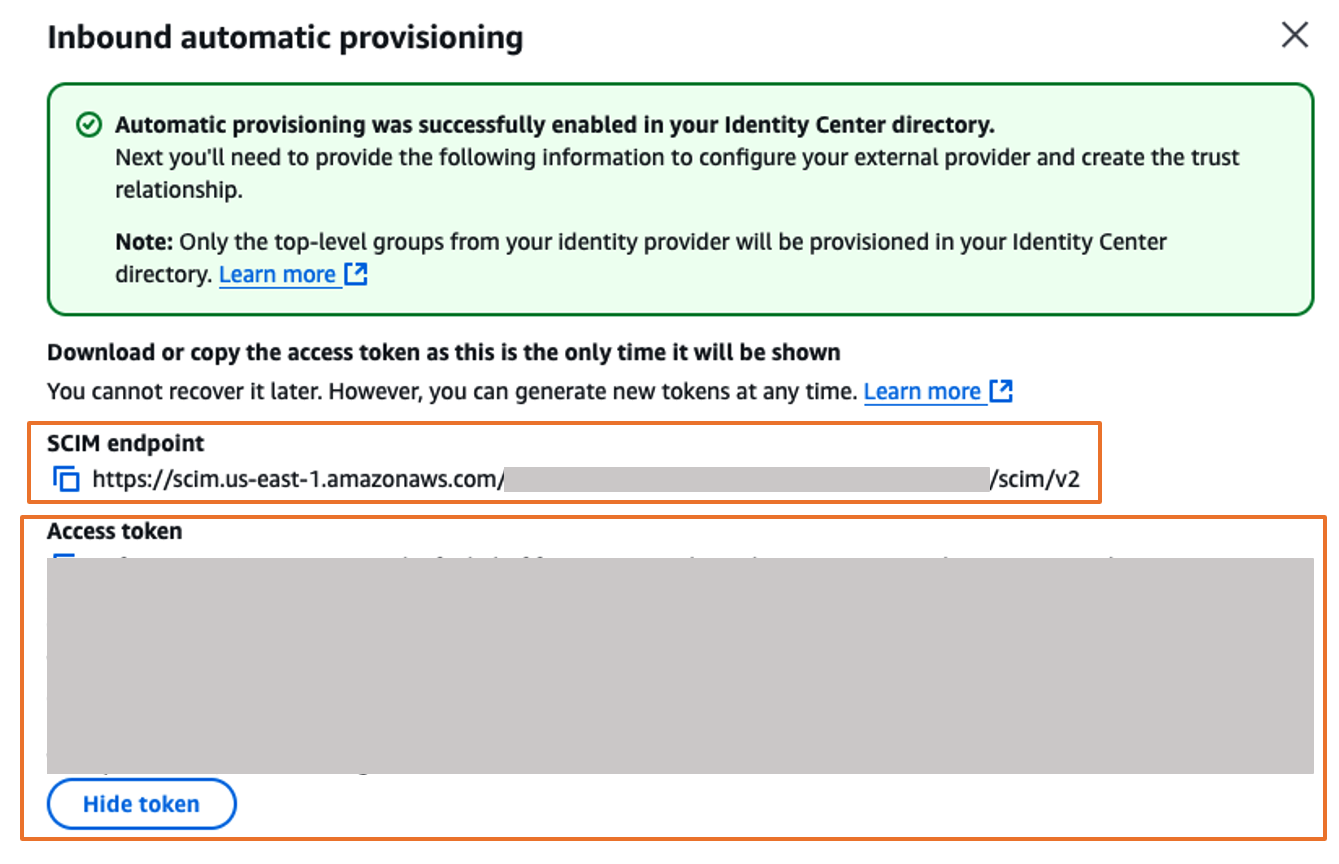
Figure 10. Automatic provisioning configuration parameters in AWS IAM Identity Center

Complete the Okta integration

  1. Sign into Okta and go to the admin console.
  2. In the left navigation pane, choose Applications, and then choose the Okta application called unifiedstudio which you created earlier.
  3. In Provisioning tab, choose Edit to complete auto provisioning between okta and AWS IAM Identity Center.
    • Under Settings, choose Integration and then, choose Configure API integration and then, select Enable API integration to enable provisioning and enter the following using the SCIM provisioning values from AWS IAM Identity Center that you copied from the previous step as shown in Figure 11

      For the Base URL, enter SCIM endpoint from IAM Identity Center
      For the API Token, enter Access token from IAM Identity Center
      For Import Groups, select Import groups option

    And then, choose Test API Credentials to validate the SCIM provision and then, choose Save.

    Screenshot of Okta provisioning settings showing API integration configuration with SCIM endpoint and token fields

    Figure 11: Automatic provisioning configuration in Okta

  4. In the Provisioning tab, in the navigation pane under Settings, choose To App in the left navigation. Choose Edit, to Enable all options such as Create Users , Update User Attributes , Deactivate Users as shown in Figure 12 and then, choose Save.

    Screenshot of Okta provisioning To App settings showing user management options

    Figure 12: Enabling Automatic provisioning configuration in Okta

  5. In the Assignments tab, choose Assign, and then Assign to Groups.
    • Select the unifiedstudio group, choose Assign, and then, leave it to defaults on popup and then, choose Done to complete the Group assignment, as shown in Figure 13.

    Screenshot of Okta group assignment interface showing unifiedstudio group selection
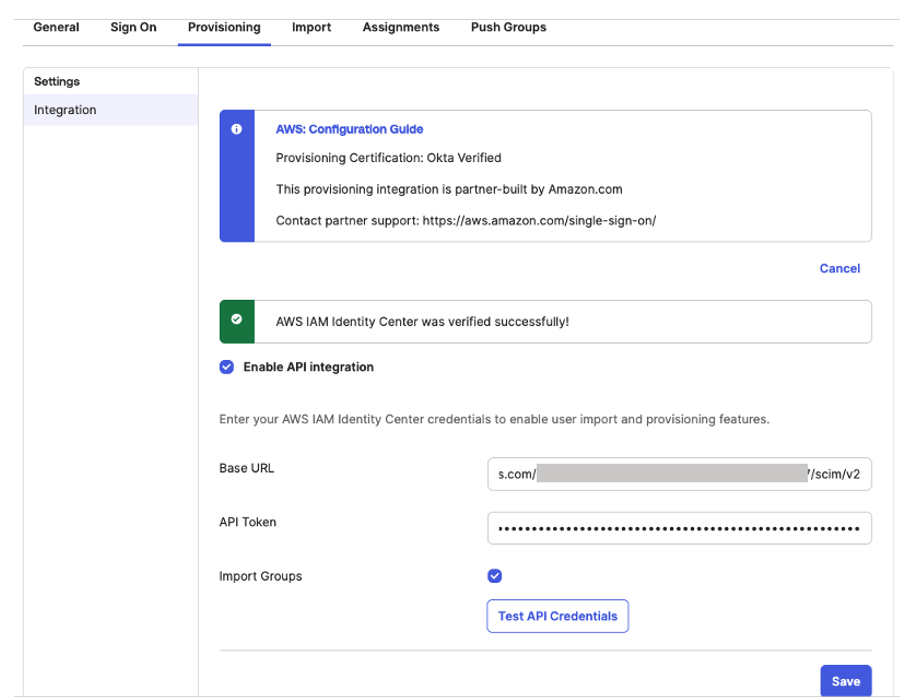
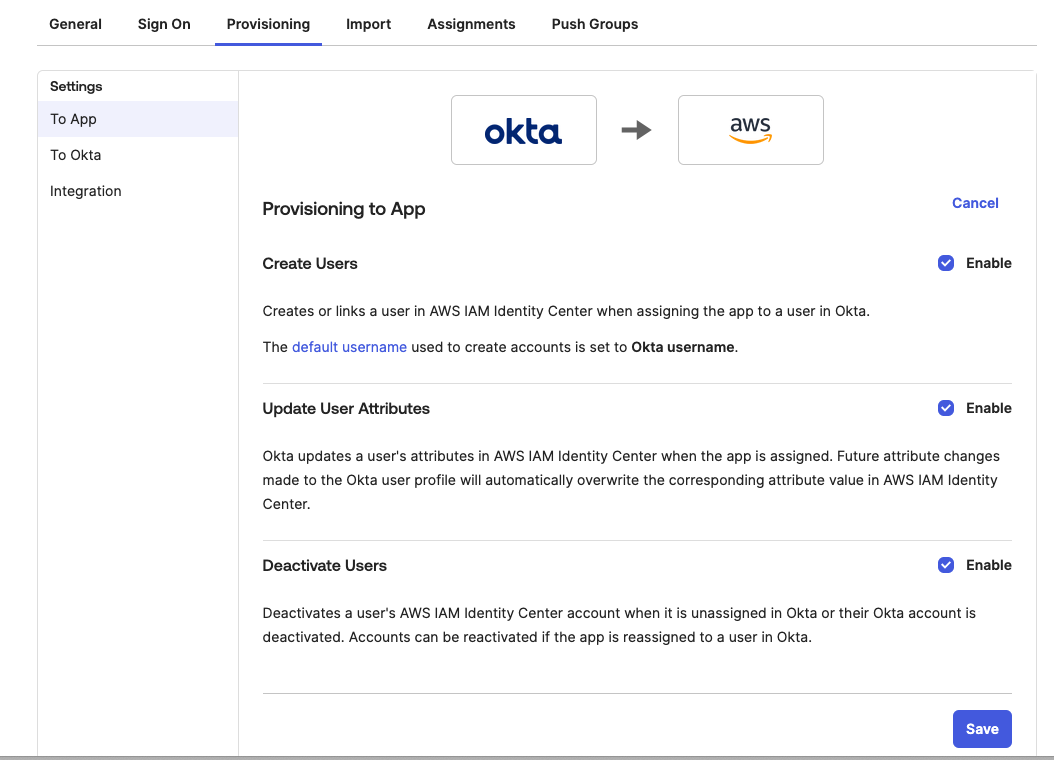
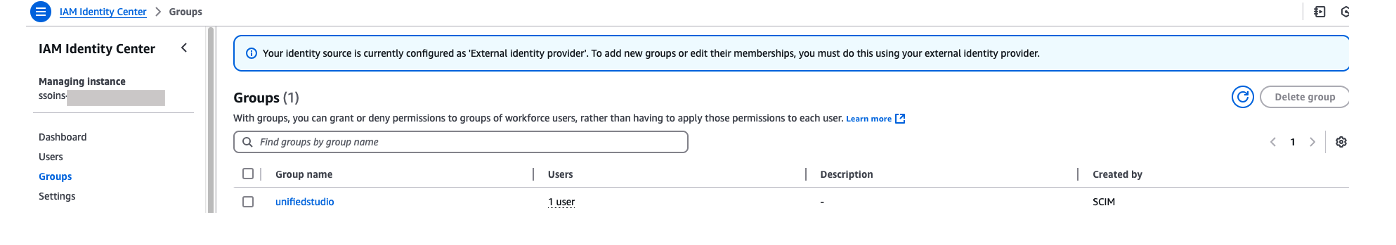
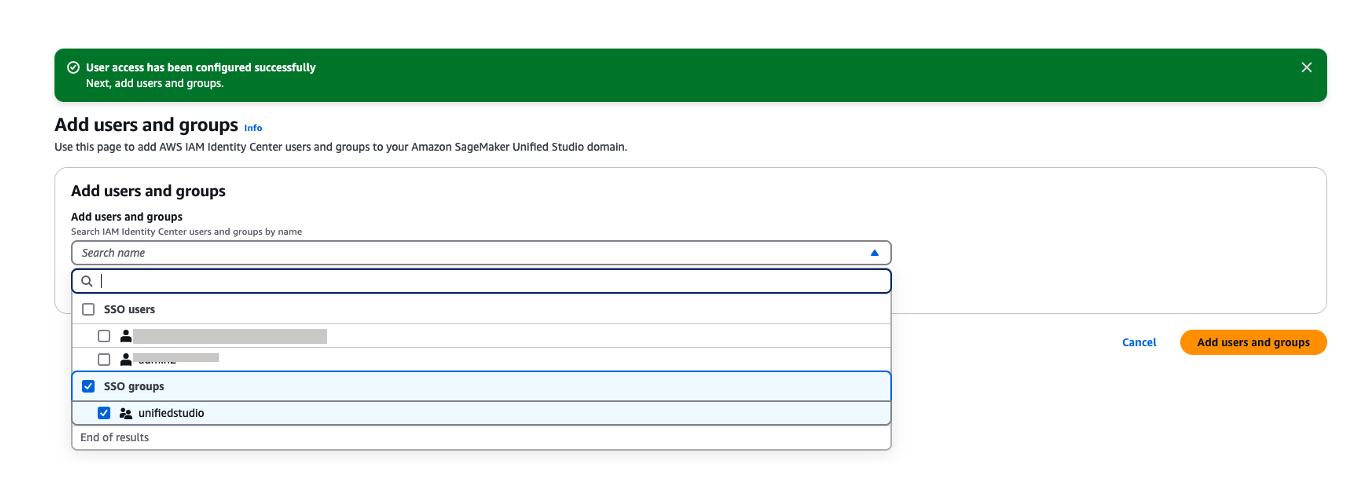
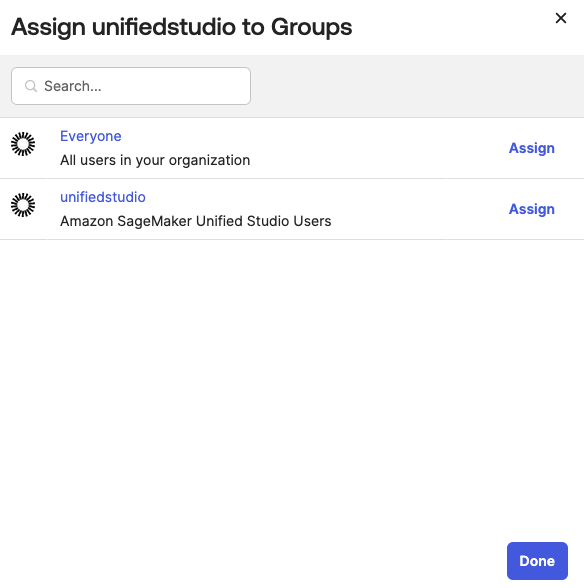
Figure 13: Assigning unifiedstudio group to SAML application called unifiedstudio

  6. In the Push Groups tab, under Push Groups drop-down list, select Find groups by name as shown in Figure 14.

    Screenshot of Okta Push Groups interface showing Find groups by name option

    Figure 14: Choosing okta groups to push them to AWS IAM Identity Center

    • Select the unifiedstudio group, leave Push group memberships immediately default option and then, choose Save as shown in Figure 15.

    Screenshot of Okta push groups settings showing unifiedstudio group configuration

    Figure 15: Pushing okta groups to AWS IAM Identity Center

Return to AWS IAM Identity Center, and you should be able to see Okta group and Okta users in AWS IAM Identity Center groups and users as shown In Figure 16.

Screenshot of AWS IAM Identity Center showing Okta users and groups synchronized from external identity provider

Figure 16: Okta user groups in AWS IAM Identity Center

Configure SageMaker Unified Studio for SSO

In this step, you will configure SSO user access to Amazon SageMaker Unified Studio for your Amazon SageMaker platform domain.

  1. Navigate to the Amazon SageMaker management console.
  2. In the left navigation menu, select Domains.
  3. Choose the Domain from the list for which you want to configure SAML user access.
  4. On the domain’s details page, choose Configure next to the Configure SSO user access.
    Screenshot of Amazon SageMaker domain details page showing Configure SSO user access option
    Figure 17: Amazon SageMaker Unified Studio SSO configuration
  5. On the Choose user authentication method page, choose IAM Identity Center. With IAM Identity Center, users configured through external Identity Providers (IdPs) get to access the domain’s Amazon SageMaker Unified Studio. Choose Next.
    Screenshot of SageMaker authentication method selection showing IAM Identity Center option
    Figure 18: Choosing authentication
  6. You can choose either Require assignments – which means you explicitly select users/groups that can access the domain or Do not require assignments – which allows all authorized Okta users and groups access to this domain.
    1. You have two options to configure how your users will access to Amazon SageMaker Unified studio with AWS IAM Identity Center federation with Okta
      • Do not required Assignments – The access will be provided to Amazon SageMaker Unified Studio based on your Okta SAML application assignments either through Group assignments or Individual user assignments. For this example, when you choose Do not required assignments option, all the users within unifiedstudio Okta group will have access to Amazon SageMaker Unified Studio as we have assigned unifiedstudio Okta user group to unifiedstudio SAML application in Okta.
      • Require Assignments – You need to add either Okta users or Okta group to Amazon SageMaker domain as shown in step 8. In step 8, you’ll add unifiedstudio Okta group into Amazon SageMaker domain so that all unifiedstudio Okta group users will get access to Amazon SageMaker Unified Studio. You can also provide an Individual Okta group users access to Amazon SageMaker unified studio through Amazon SageMaker domain console by adding SSO (okta user) user into the domain.
    2. Note that either an Individual user or group within Okta must be assigned to the AWS Identity center application (AWS IAM Identity Center from Okta application catalog. We renamed application label as unifiedstudio for this example) for both Do not require Assignments and Require Assignments options.

    Screenshot of SageMaker Unified Studio SAML configuration showing assignment options

    Figure 19. Amazon SageMaker Unified Studio SAML configuration

  7. On the Review and save page, review your choices and then choose Save. Note that these settings are permanent once saved.

    Screenshot of SageMaker SAML configuration review and save page

    Figure 20. Review and confirm SAML configuration

  8. If you’ve chosen to require assignments, use the Add users and groups to add SAML users and groups to your domain.

    Screenshot of SageMaker domain showing Add users and groups interface for Okta group assignment

    Figure 21. Adding okta group into Amazon Sagemaker domain

  9. Now, users will be able to access the Amazon SageMaker Unified Studio using the Domain URL with their SSO credentials.
  10. You can explore different projects for your users and assign those projects based on your SAML user groups for fine-grained access controls. For example, you can create different SAML user groups based on their job function in Okta, assign those Okta groups to AWS IAM Identity Center app in Okta and then, assign those Okta SAML groups to respective project profiles in Amazon SageMaker Unified Studio. To perform project profiles assignments to respective groups, choose project profiles tab, click on respective project profiles like SQL analytics, choose Authorized users and groups tab and then, choose Add and pick SSO groups from drop down as shown in Figure 22. Finally choose Add users and groups to complete project profile assignment.

    Screenshot of SageMaker Unified Studio project profile assignment interface showing SSO groups selection

    Figure 22. Assigning a project profile to okta group

Test the setup

  1. The Amazon SageMaker Unified Studio URL can be found on the domain details page as shown in Figure 23. The first access to Amazon SageMaker Unified Studio URL redirects you to the Okta login screen.
    Screenshot of SageMaker domain details page showing the Unified Studio URL for user access

    Figure 23. Validating Okta user access with Amazon SageMaker Unified Studio

  2. Copy and paste the Amazon SageMaker Unified Studio URL in your browser and enter the user credentials.
  3. After successful login, you will be redirected to the Amazon SageMaker Unified Studio home page.

    Screenshot of Amazon SageMaker Unified Studio home page after successful SAML authentication

    SAML authenticated Amazon SageMaker Unified Studio

    Figure 24. SAML authenticated Amazon SageMaker Unified Studio

  4. Once logged into Amazon SageMaker Unified Studio, you can assign authorization policies based on your requirements. Choose Govern and then choose, Domain units and choose your SageMaker domain to select suitable authorization policies. For this example, we are choosing project creation policy as shown in Figure 25.

    Amazon SageMaker unified studio authorization policies

    Screenshot of SageMaker Unified Studio authorization policies interface showing project creation policy selection
    Figure 25. Amazon SageMaker unified studio authorization policies

  5. Choose Project membership policy and then choose ADD POLICY GRANT option to assign user groups or users to respective project. For this example, we are choosing project membership policy as shown in Figure 26.

    Amazon SageMaker unified studio authorization policies assignment

    Screenshot of SageMaker Unified Studio policy grant assignment interface for project membership

    Figure 26. Amazon SageMaker unified studio authorization policies assignment

You’ve now successfully configured single sign-on for Amazon SageMaker Unified Studio using Okta credentials through AWS IAM Identity Center.

Clean up

To avoid ongoing charges, delete the resources you created:

Conclusion

In this post, we showed you how to set up Okta as an identity provider using SAML authentication for Amazon SageMaker Unified Studio access through AWS IAM Identity Center federation. This setup allows your users to access SageMaker Unified Studio with their existing corporate credentials, eliminating the need for separate AWS accounts.

Get started by checking the Amazon SageMaker Unified Studio Developer Guide, which provides guidance on how to build data and AI applications using Amazon SageMaker platform


About the authors

Raghavarao Sodabathina

Raghavarao Sodabathina

Raghavarao is a principal solutions architect at AWS, focusing on data analytics, AI/ML, and cloud security. He engages with customers to create innovative solutions that address customer business problems and accelerate the adoption of AWS services. In his spare time, Raghavarao enjoys spending time with his family, reading books, and watching movies.

Matt Nispel

Matt Nispel

Matt is an Enterprise Solutions Architect at AWS. He has more than 10 years of experience building cloud architectures for large enterprise companies. At AWS, Matt helps customers rearchitect their applications to take full advantage of the cloud. Matt lives in Minneapolis, Minnesota, and in his free time enjoys spending time with friends and family.

Nicholaus Lawson

Nicholaus Lawson

Nicholaus is a Solution Architect at AWS and part of the AIML specialty group. He has a background in software engineering and AI research. Outside of work, Nicholaus is often coding, learning something new, or woodworking.

Jacob Grant

Jacob Grant

Jacob is a Solutions Architect at AWS, based in Atlanta, Georgia, with over four years of AWS experience. He is currently focused on helping HCLS customers build innovative solutions. Jacob has a passion for building solutions in the Machine Learning and Artificial Intelligence domain and has helped customers integrate agentic features into their workloads. Outside of work, Jacob enjoys spending time with his wife and their two young daughters, embracing family adventures whenever possible.

Processing Amazon S3 objects at scale with AWS Step Functions Distributed Map S3 prefix

Post Syndicated from Biswanath Mukherjee original https://aws.amazon.com/blogs/compute/processing-amazon-s3-objects-at-scale-with-aws-step-functions-distributed-map-s3-prefix/

If you’re building large scale enterprise applications, you’ve likely faced the complexities of processing large volumes of data files. Whether you’re analyzing your application logs, processing customer data files, or transforming machine learning datasets, you know the complexity involved in orchestrating workflows. You’ve probably written nested workflows and additional custom code to process objects from Amazon Simple Storage Service (Amazon S3) buckets.

With AWS Step Functions Distributed Map, you can process large scale datasets by running concurrent iterations of workflow steps across data entries in parallel, achieving massive scale with simplified management.

With the new prefix-based iteration feature and LOAD_AND_FLATTEN transformation parameter for Distributed Map, your workflows can now iterate over S3 objects under a specified prefix using S3ListObjectsV2 to process their contents in a single Map state, avoiding nested workflows and reducing operational complexity.

In this post, you’ll learn how to process Amazon S3 objects at scale with the new AWS Step Functions Distributed Map S3 prefix and transformation capabilities.

Use case: Application log processing and summarization

You’ll build a sample Step Functions state machine that demonstrates processing of all the log files from the given S3 prefix using a Distributed Map. You’ll analyze all the log files to build a summary INFO, WARNING and ERROR messages in the log file on hourly basis. The following diagram presents the AWS Step Functions state machine:

Log files processing workflow

Log files processing workflow

  1. The state machine iterates over all the log files from the specified S3 prefix using S3 ListObjectsV2 and process them using AWS Step Functions Distributed Map.
  2. For each log file entry, the state machine puts hourly ErrorCount metric into Amazon CloudWatch.
  3. The state machine then stores hourly metrics count in a Amazon DynamoDB table.
  4. The state machine then invokes an AWS Lambda function to perform metrics aggregation.

The following is an example of the parameters in an ItemReader configured to iterate over the content of S3 objects using S3 ListObjectsV2.

{
  "QueryLanguage": "JSONata",
  "States": {
    ...
    "Map": {
        ...
        "ItemReader": {
            "Resource": "arn:aws:states:::s3:listObjectsV2",
            "ReaderConfig": {
                // InputType is required if Transformation is LOAD_AND_FLATTEN. Use one of the given values
                "InputType": "CSV | JSON | JSONL | PARQUET",
                // Transformation is OPTIONAL and defaults to NONE if not present
                "Transformation": "NONE | LOAD_AND_FLATTEN" 
            },
            "Arguments": {
                "Bucket": "amzn-s3-demo-bucket1",
                "Prefix": "{% $states.input.PrefixKey %}"
            }
        },
        ...
    }
}

With the LOAD_AND_FLATTEN option, your state machine will do the following:

  1. Read the actual content of each object listed by the Amazon S3 ListObjectsV2 call.
  2. Parse the content based on InputType (CSV, JSON, JSONL, Parquet).
  3. Create items from the file contents (rows/records) rather than metadata.

We recommend including a trailing slash on your prefix. For example, if you select data with a prefix of folder1, your state machine will process both folder1/myData.csv and folder10/myData.csv. Using folder1/ will strictly process only one folder. All of the objects listed by prefix need to be in the same data format. For example, if you are selecting InputType as JSONL, your S3 prefix should contain only JSONL files and not a mix of other types.

The context object is an internal JSON structure that is available during an execution. The context object contains information about your state machine and execution. Your workflows can reference the context object in a JSONata expression with $states.context.

Within a Map state, the context object includes the following data:

"Map": {
   "Item": {
      "Index" : Number,
      "Key"   : "String", // Only valid for JSON objects
      "Value" : "String",
      "Source": "String"
   }
}

For each Map iteration, the Index contains the index number for the array item that is being currently processed.

A Key is only available when iterating over JSON objects. Value contains the array item being processed. For example, for the following input JSON object, Names will be assigned to Key and {"Bob", "Cat"} will be assigned to Value.

{
	"Names": {"Bob", "Cat"}
} 

Source contains one of the following:

  • For state input: STATE_DATA
  • For Amazon S3 LIST_OBJECTS_V2 with Transformation=NONE, the value will show the S3 URI for the bucket. For example: S3://amzn-s3-demo-bucket1
  • For all the other input types, the value will be the Amazon S3 URI. For example: S3://amzn-s3-demo-bucket1/object-key

Using LOAD_AND_FLATTEN and the Source field, you can connect child executions to their sources.

Prerequisites

Set up and run the workflow

Run the following steps to deploy and test the Step Functions state machine.

  1. Clone the GitHub repository in a new folder and navigate to the project folder.
    git clone https://github.com/aws-samples/sample-stepfunctions-s3-prefix-processor.git
    cd sample-stepfunctions-s3-prefix-processor

  2. Run the following commands to deploy the application.
    sam deploy --guided

  3. Enter the following details:
    • Stack name: Stack name for CloudFormation (for example, stepfunctions-s3-prefix-processor)
    • AWS Region: A supported AWS Region (for example, us-east-1)
    • Accept all other default values.

    The outputs from the AWS SAM deploy will be used in the subsequent steps.

  4. Run the following command to generate sample log files.
    python3 scripts/generate_logs.py

  5. Run the following to upload the log files to the S3 bucket with the /logs/daily prefix. Replace amzn-s3-demo-bucket1 with the value from the sam deploy output.
    aws s3 sync logs/ s3://amzn-s3-demo-bucket1/logs/ --exclude '*' --include '*.log'

  6. Run the following command to execute the Step Functions workflow. Replace the StateMachineArn with the value from the sam deploy output.
    aws stepfunctions start-execution \
      --state-machine-arn <StateMachineArn> \
      --input '{}'

    The Step Function state machine iterates over all the log files with the S3 prefix /logs/daily and processes them in parallel. The workflow updates the metrics in CloudWatch, stores hourly metrics count in DynamoDB, then invokes an AWS Lambda function to aggregate the metrics.

Monitor and verify results

Run the following steps to monitor and verify the test results.

  1. Run the following command to get the details of the execution. Replace executionArn with your state machine ARN.
    aws stepfunctions describe-execution --execution-arn <executionArn>

  2. When the status shows SUCCEEDED, run the following commands to check the processed output from the LogAnalyticsSummaryTableName DynamoDB table. Replace the value LogAnalyticsSummaryTableName with the value from the sam deploy output.
    aws dynamodb scan --table-name <LogAnalyticsSummaryTableName>

  3. Check that hourly ERROR, WARN, and INFO logs statistics are saved in the DynamoDB table. The following is a sample output:
    {
        "Items": [
            {
                "ProcessingTime": {
                    "S": "2025-10-07T23:45:10.790Z"
                },
                "WarningCount": {
                    "N": "2"
                },
                "HourOfDay": {
                    "S": "13"
                },
                "TotalRecords": {
                    "N": "5"
                },
                "ErrorCount": {
                    "N": "3"
                },
                "InfoCount": {
                    "N": "0"
                },
                "HourKey": {
                    "S": "2025-10-08 13"
                }
            },
            {
                "ProcessingTime": {
                    "S": "2025-10-07T23:45:07.456Z"
                },
                "WarningCount": {
                    "N": "3"
                },
                "HourOfDay": {
                    "S": "09"
                },
                "TotalRecords": {
                    "N": "6"
                },
                "ErrorCount": {
                    "N": "2"
                },
                "InfoCount": {
                    "N": "1"
                },
                "HourKey": {
                    "S": "2025-10-08 09"
                }
            },
            …
    ],
        "Count": 24,
        "ScannedCount": 24,
        "ConsumedCapacity": null
    }

  4. Run the following command to check the output of the Step Functions state machine execution output.
    aws stepfunctions describe-execution --execution-arn <executionArn> --query 'output' --output text

    The following is a sample output:

    {
      "Summary": {
        "date": "2025-10-08",
        "totalErrors": 50,
        "totalWarnings": 41,
        "totalRecords": 133,
        "hourlyBreakdown": {
          "00": {
            "errors": 1,
            "warnings": 3,
            "records": 5
          },
          "01": {
            "errors": 1,
            "warnings": 1,
            "records": 5
          },
          "02": {
            "errors": 2,
            "warnings": 3,
            "records": 5
          },
          "03": {
            "errors": 3,
            "warnings": 2,
            "records": 7
          },
    …
    …
        "generatedAt": "2025-10-08T05:19:05.603889"
      }
    }

    The output of the Step Functions state machine shows the daily summary insights of the log files created by the Lambda function.

Clean up

To avoid costs, remove all resources created for this post once you’re done. Run the following command after replacing amzn-s3-demo-bucket1 with your own bucket name to delete the resources you deployed for this post’s solution:

aws s3 rm s3://amzn-s3-demo-bucket1 --recursive
sam delete
rm -rf logs/

Conclusion

In this post, you learned how AWS Step Functions Distributed Map can use prefix-based iteration with LOAD_AND_FLATTEN transformation to read and process multiple data objects from Amazon S3 buckets directly. You no longer need one step to process object metadata and another to load the data objects. Loading and flatting in one step is particularly valuable for data processing pipelines, batch operations, and event-driven architectures where objects are continually added to S3 locations. By eliminating the need to maintain object manifests, you can build more resilient, dynamic data processing workflows with less code and fewer moving parts.

New input sources for Distributed Map are available in all commercial AWS Regions where AWS Step Functions is available. To get started, you can use the Distributed Map mode today in the AWS Step Functions console. To learn more, visit the Step Functions developer guide.

For more serverless learning resources, visit Serverless Land.

Accelerate data governance with custom subscription workflows in Amazon SageMaker

Post Syndicated from Nira Jaiswal original https://aws.amazon.com/blogs/big-data/accelerate-data-governance-with-custom-subscription-workflows-in-amazon-sagemaker/

Amazon SageMaker provides a single data and AI development environment to discover and build with your data. This unified platform integrates functionality from existing AWS Analytics and Artificial Intelligence and Machine Learning (AI/ML) services, including Amazon EMR, AWS Glue, Amazon Athena, Amazon Redshift, and Amazon Bedrock.

Organizations need to efficiently manage data assets while maintaining governance controls in their data marketplaces. Although manual approval workflows remain important for sensitive datasets and production systems, there’s an increasing need for automated approval processes with less sensitive datasets. In this post, we show you how to automate subscription request approvals within SageMaker, accelerating data access for data consumers.

Prerequisites

For this walkthrough, you must have the following prerequisites:

  • An AWS account – If you don’t have an account, you can create one. The account should have permission to do the following:
    • Create and manage SageMaker domains
    • Create and manage IAM roles
    • Create and invoke Lambda functions
  • SageMaker domain – For instructions to create a domain, refer to Create an Amazon SageMaker Unified Studio domain – quick setup.
  • A demo project – Create a demo project in your SageMaker domain. For instructions, see Create a project. For this example, we choose All capabilities in the project profile section.
  • SageMaker domain ID, project ID, and project role ARN – These will be used in later steps to provide permissions for existing datasets and resources, and automatic subscription approval code. To retrieve this information, go to the Project details tab on the project details page on the SageMaker console.
  • AWS CLI installed – You must have the AWS Command Line Interface (AWS CLI) version 2.11 or later.
  • Python installed – You must have Python version 3.8 or later.
  • IAM permissions – Sign in as the user with administrative access
  • Lambda permissions – Configure the appropriate IAM permissions for the Lambda execution role. The following code is a sample role used for testing this solution. Before implementing this IAM policy in your environment, provide the values for your specific AWS Region and account ID. Adjust them based on the principle of least privilege. To learn more about creating Lambda execution roles, refer to Defining Lambda function permissions with an execution role.
    {
        "Version": "2012-10-17",
        "Statement": [
            {
                "Effect": "Allow",
                "Action": [
                    "datazone:ListSubscriptionRequests",
                    "datazone:AcceptSubscriptionRequest",
                    "datazone:GetSubscriptionRequestDetails",
                    "datazone:GetDomain",
                    "datazone:ListProjects"
                ],
                "Resource": "<<Domain-ARN>>"
            },
            {
                "Effect": "Allow",
                "Action": "sts:AssumeRole",
                "Resource": "<<Domain-ARN>>",
                "Condition": {
                    "StringEquals": {
                        "aws:PrincipalArn": "<<Lambda ARN>>"
                    }
                }
            },
            {
                "Effect": "Allow",
                "Action": "sns:Publish",
                "Resource": "<<SNS-ARN>>"
            },
            {
                "Effect": "Allow",
                "Action": [
                    "logs:CreateLogGroup",
                    "logs:CreateLogStream",
                    "logs:PutLogEvents"
                ],
                "Resource": [
                    "arn:aws:logs:${AWS::Region}:${AWS::AccountId}:log-group:/aws/lambda/*",
                    "arn:aws:logs:${AWS::Region}:${AWS::AccountId}:log-group:/aws/lambda/*:*"
                ]
            }
        ]
    }

Solution overview

Understanding the subscription and approval workflow in Amazon SageMaker is important before diving deep into custom workflow solution. After an asset is published to the SageMaker catalog, data consumers can discover assets. When a data consumer discovers assets in SageMaker catalog, they request access to the asset, by submitting a subscription request with business justification and intended use case. The request enters a pending state and notifies the data producer or asset owner for review. The data producer evaluates the request based on governance policies, consumer credentials, and business context. The data producer can accept, reject, or request additional information from the data consumer. Upon acceptance, SageMaker triggers the AcceptSubscriptionRequest event and begins automated access provisioning. After a subscription is accepted, a subscription fulfilment process gets kicked off to facilitate access to the asset, for the data producer. SageMaker integrates deeply with AWS Lake Formation to manage fine-grained permissions. When a subscription is approved, SageMaker automatically calls Lake Formation APIs to grant specific database, table, and column-level permissions to the subscriber’s IAM role. Lake Formation acts as the central permission engine, translating subscription approvals into actual data access rights without manual intervention. The system provisions and updates resource-based policies on data sources. Once the provisioning completes, the data consumer can immediately access subscribed data through query engines like Athena, Redshift, or EMR, with Lake Formation enforcing permissions at query time.

By default, subscription requests to a published asset require manual approval by a data owner. However, Amazon SageMaker supports automatic approval of subscription requests at asset level: when publishing a data asset, you can choose to not require subscription approval. In this case, all incoming subscription requests to that asset are automatically approved. Let’s first outline the step-by-step process for disabling automatic approval at the asset level.

Configure automatic approval at asset level:

To configure automatic approval, data producers can follow the steps below.

  1. Log in to SageMaker Unified Studio portal as data producer. Navigate to Assets and select the target asset
  2. Choose Assets → Pick the asset, which you would like to configure for automatic approval.
  3. On the asset details page, locate Edit Subscription settings in the right pane.
  4. Choose Edit next to Subscription Required
    1. Select Not Required in the dialogue box
    2. Confirm your selection

Customize SageMaker’s subscription workflow:

While manual approval workflow remains essential for production environments and sensitive data handling, organizations seek to streamline and automate approvals for lower-risk environments and non-sensitive datasets. To achieve this project-level automation, we can enhance SageMaker’s native approval workflow through a custom event-driven solution. This solution leverages AWS’s serverless architecture, combining using AWS Lambda, Amazon EventBridge rules, and Amazon Simple Notification Service (Amazon SNS) to create an automated approval workflow. This customization allows organizations to maintain governance while reducing administrative overhead and accelerating the development cycle in non-critical environments. The event-driven approach ensures real-time processing of approval requests, maintains audit trails, and can be configured to apply different approval rules based on project characteristics and data sensitivity levels.

The custom workflow consists of the following steps:

  1. The data consumer submits a subscription request for a published data asset.
  2. SageMaker detects the request and generates a subscription event, which is automatically sent to EventBridge.
  3. EventBridge triggers the designated Lambda function.
  4. The Lambda function sends an AcceptSubscriptionRequest API call to SageMaker.
  5. The function also sends a notification through Amazon SNS.
  6. AWS Lake Formation processes the approved subscription and updates the relevant access control lists (ACLs) and permission sets.
  7. Lake Formation grants access permissions to the data consumer’s project AWS Identity and Access Management (IAM) role.
  8. The data consumer now has authorized access to the requested data asset and can begin working with the subscribed data.

The following diagram illustrates the high-level architecture of the solution.

Key benefits

This solution uses AWS Lambda and Amazon EventBridge to automate SageMaker subscription requests approvals, delivering the following benefits for organizations and end-users:

  • Scalability – Automatically handles high volumes of subscription requests
  • Cost-efficiency – Pay-as-you-go approach with no idle resource costs
  • Minimal maintenance – Serverless components require no infrastructure management
  • Flexible triggering – Supports event-driven, scheduled, and manual invocation modes
  • Audit compliance – Comprehensive logging and traceability through AWS CloudTrail

Step-by-step procedure

This section outlines the detailed process for implementing a custom subscription request approval workflow in Amazon SageMaker

Create Lambda function

Complete the following steps to create your Lambda function:

  1. On the Lambda console, choose Functions in the navigation pane.
  2. Choose Create function.
  3. Select Author from scratch.
  4. For Function name, enter a name for the function.
  5. For Runtime, choose your runtime (for this post, we use Python version 3.9 or later).
  6. Choose Create function.
  7. On the Lambda function page, choose the Configuration tab and then choose Permissions.
  8. Note the execution role to use when configuring the SageMaker project.

Create SNS topic

For this solution, we create SNS topic. Complete the following steps to create the SNS topic for automatic approvals:

  1. On the Amazon SNS console, choose Topics in the navigation pane.
  2. Choose Create topic.
  3. For Type, select Standard.
  4. For Name, enter a name for the topic.
  5. Choose Create topic.
  6. On the SNS topic details page, note the SNS topic Amazon Resource Name (ARN) to use later in the Lambda function.
  7. On Subscription tab, choose Create Subscription.
  8. For Protocol, choose Email.
  9. For Endpoint, enter email address of Data consumers.

Create EventBridge rule

Complete the following steps to create an EventBridge rule to capture subscription request events:

  1. On the EventBridge console, choose Rules in the navigation pane.
  2. Choose Create rule.
  3. For Name, enter a name for the rule.
  4. For Rule type, select Rule with event pattern.
    This option enables the automatic subscription approval workflow to be triggered when a subscription request is initiated. Alternatively, you can select Schedule to schedule the rule to trigger on a regular basis. Refer to Creating a rule that runs on a schedule in Amazon EventBridge to learn more.
  5. Choose Next.
  6. For Event source, select AWS events or EventBridge partner events.
  7. For Creation method, select Use pattern form
  8. For Event source, select AWS services
  9. For AWS service, select DataZone.
  10. For Event type, select Subscription Request Created.
  11. Configure your target to route events to both the Lambda function and SNS topic.
  12. Choose Next.
  13. For this post, skip configuring tags and choose Next.
  14. Review the settings and choose Create rule.

Configure automation workflow

Complete the following steps to configure the automation workflow:

  1. On the Lambda console, go to the function you created.
  2. Configure the EventBridge rule to trigger the Lambda function
  3. Configure the destination as SNS topic for event notification.

Configure code in Lambda function

Complete the following steps to configure your Lambda function:

  1. On the Lambda console, go to the function you created.
  2. Add the following code to your function. Provide the domain ID, project ID, and SNS topic ARN that you noted earlier.
    import boto3
    import json
    import logging
    import os
    from botocore.exceptions import ClientError
    
    # Configure logging
    logger = logging.getLogger()
    logger.setLevel(logging.INFO)
    
    def lambda_handler(event, context):
        """Lambda function to auto-approve subscription requests in Amazon SageMaker"""
        try:
            # Initialize clients
            datazone_client = boto3.client('datazone')
            sns_client = boto3.client('sns')
            
            # Get configuration from environment variables or use hardcoded values
            domain_id = os.environ.get('DOMAIN_ID', '<domain_id>')
            project_id = os.environ.get('PROJECT_ID', '<project_id>')
            sns_topic_arn = os.environ.get('SNS_TOPIC_ARN', '<sns_topic_arn>')
            
            # Get pending subscription requests
            pending_requests = get_pending_requests(datazone_client, domain_id, project_id)
            
            if not pending_requests:
                logger.info("No pending subscription requests found")
                return
            
            # Process requests
            for request in pending_requests:
                approve_request(datazone_client, sns_client, domain_id, request, sns_topic_arn)
                
        except Exception as e:
            logger.error(f"Error: {str(e)}")
    
    def get_pending_requests(client, domain_id, project_id):
        """Get all pending subscription requests"""
        requests = []
        next_token = None
        
        try:
            while True:
                params = {
                    'domainIdentifier': domain_id,
                    'status': 'PENDING',
                    'approverProjectId': project_id
                }
                
                if next_token:
                    params['nextToken'] = next_token
                
                response = client.list_subscription_requests(**params)
                
                if 'items' in response:
                    requests.extend(response['items'])
                
                next_token = response.get('nextToken')
                if not next_token:
                    break
                    
            logger.info(f"Found {len(requests)} pending requests")
            return requests
            
        except ClientError as e:
            logger.error(f"Error listing requests: {e}")
            return []
    
    def approve_request(datazone_client, sns_client, domain_id, request, sns_topic_arn):
        """Approve a subscription request and send notification"""
        request_id = request.get('id')
        if not request_id:
            return
            
        try:
            # Approve the request
            datazone_client.accept_subscription_request(
                domainIdentifier=domain_id,
                identifier=request_id,
                decisionComment="Subscription request is auto-approved by Lambda"
            )
            
            # Send notification
            asset_name = request.get('assetName', 'Unknown asset')
            
            message = f"Your subscription request has been auto-approved by Lambda. You can now access this asset."
            
            sns_client.publish(
                TopicArn=sns_topic_arn,
                Subject=f"Subscription Request is auto-approved by Lambda",
                Message=message
            )
            
            logger.info(f"Approved request {request_id} for {asset_name}")
            
        except Exception as e:
            logger.error(f"Error processing request {request_id}: {e}")

  3. Choose Test to test the Lambda function code. To learn more about testing Lambda code, refer to Testing Lambda functions in the console.
  4. Choose Deploy to deploy the code.

Configure Lambda and project execution roles in SageMaker

Complete the following steps:

  1. In SageMaker Unified Studio, go to your publishing project.
  2. Choose Members in the navigation pane.
  3. Choose Add members.
  4. Add the Lambda execution role and project execution roles as Contributor.

Test the solution

Complete the following steps to test the solution:

  1. In SageMaker Unified Studio, navigate to the data catalog and choose Subscribe on the configured asset to initiate a subscription request.
  2. Choose Subscription requests in the navigation pane to view the outgoing requests and choose the Approved tab to verify automatic approval.
  3. Choose View subscription to confirm the approver appears as the Lambda execution role with “Auto-approved by Lambda” as the reason.
  4. On the CloudTrail console, choose Event history to view the event you created and review the automated approval audit trail.

Clean up

To avoid incurring future charges, clean up the resources you created during this walkthrough. The following steps use the AWS Management Console, but you can also use the AWS CLI.

  1. Delete the SageMaker domain. To use the AWS CLI, run the following commands:
    aws sagemaker delete-project --project-name <project-name>
    aws datazone delete-domain –identifier <domain_identifier>

  2. Delete the SNS topics. To use the AWS CLI, run the following command:
    aws sns delete-topic --topic-arn <topic-arn>

  3. Delete the Lambda function. To use the AWS CLI, run the following command:
    aws lambda delete-function --function-name <Lambda function name>

Conclusion

Combining an event-driven architecture with SageMaker creates an automated, cost-effective solution for data governance challenges. This serverless approach automatically handles data access requests while maintaining compliance, so organizations can scale efficiently as their data grows. The solution discussed in this post can help data teams access insights faster with minimal operational costs, making it an excellent choice for businesses that need quick, compliant data access while keeping their systems lean and efficient.

To learn more, visit the Amazon SageMaker Unified Studio page.


About the authors

Nira Jaiswal

Nira Jaiswal

Nira is a Principal Data Solutions Architect at AWS. Nira works with strategic customers to architect and deploy innovative data and analytics solutions. She excels at designing scalable, cloud-based platforms that help organizations maximize the value of their data investments. Nira is passionate about combining analytics, AI/ML, and storytelling to transform complex information into actionable insights that deliver measurable business value.

Ajit Tandale

Ajit Tandale

Ajit is a Senior Solutions Architect at AWS, specializing in data and analytics. He partners with strategic customers to architect secure, scalable data systems using AWS services and open-source technologies. His expertise includes designing data lakes, implementing data pipelines, and optimizing big data processing workflows to help organizations modernize their data architecture. Outside of work, he’s an avid reader and science fiction movie enthusiast.

Implement fine-grained access control for Iceberg tables using Amazon EMR on EKS integrated with AWS Lake Formation

Post Syndicated from Tejal Patel original https://aws.amazon.com/blogs/big-data/implement-fine-grained-access-control-for-iceberg-tables-using-amazon-emr-on-eks-integrated-with-aws-lake-formation/

The rise of distributed data processing frameworks such as Apache Spark has revolutionized the way organizations manage and analyze large-scale data. However, as the volume and complexity of data continue to grow, the need for fine-grained access control (FGAC) has become increasingly important. This is particularly true in scenarios where sensitive or proprietary data must be shared across multiple teams or organizations, such as in the case of open data initiatives. Implementing robust access control mechanisms is crucial to maintain secure and controlled access to data stored in Open Table Format (OTF) within a modern data lake.

One approach to addressing this challenge is by using Amazon EMR on Amazon Elastic Kubernetes Service (Amazon EKS) and incorporating FGAC mechanisms. With Amazon EMR on EKS, you can run open source big data frameworks such as Spark on Amazon EKS. This integration provides the scalability and flexibility of Kubernetes, while also using the data processing capabilities of Amazon EMR.

On February 6th 2025, AWS introduced fine-grained access control based on AWS Lake Formation for EMR on EKS from Amazon EMR 7.7 and higher version. You can now significantly enhance your data governance and security frameworks using this feature.

In this post, we demonstrate how to implement FGAC on Apache Iceberg tables using EMR on EKS with Lake Formation.

Data mesh use case

With FGAC in a data mesh architecture, domain owners can manage access to their data products at a granular level. This decentralized approach allows for greater agility and control, making sure data is accessible only to authorized users and services within or across domains. Policies can be tailored to specific data products, considering factors like data sensitivity, user roles, and intended use. This localized control enhances security and compliance while supporting the self-service nature of the data mesh.

FGAC is especially useful in business domains that deal with sensitive data, such as healthcare, finance, legal, human resources, and others. In this post, we focus on examples from the healthcare domain, showcasing how we can achieve the following:

  • Share patient data securely – Data mesh enables different departments within a hospital to manage their own patient data as independent domains. FGAC makes sure only authorized personnel can access specific patient records or data elements based on their roles and need-to-know basis.
  • Facilitate research and collaboration – Researchers can access de-identified patient data from various hospital domains through the data mesh architecture, enabling collaboration between multidisciplinary teams across different healthcare institutions, fostering knowledge sharing, and accelerating research and discovery. FGAC supports compliance with privacy regulations (such as HIPAA) by restricting access to sensitive data elements or allowing access only to aggregated, anonymized datasets.
  • Improve operational efficiency – Data mesh can streamline data sharing between hospitals and insurance companies, simplifying billing and claims processing. FGAC makes sure only authorized personnel within each organization can access the necessary data, protecting sensitive financial information.

Solution overview

In this post, we explore how to implement FGAC on Iceberg tables within an EMR on EKS application, using the capabilities of Lake Formation. For details on how to implement FGAC on Amazon EMR on EC2, refer to Fine-grained access control in Amazon EMR Serverless with AWS Lake Formation.

The following components play critical roles in this solution design:

  • Apache Iceberg OTF:
    • High-performance table format for large-scale analytics
    • Supports schema evolution, ACID transactions, and time travel
    • Compatible with Spark, Trino, Presto, and Flink
    • Amazon S3 Tables fully managed Iceberg tables for analytics workload
  • AWS Lake Formation:
    • FGAC for data lakes
    • Column-, row-, and cell-level security controls
  • Data mesh producers and consumers:
    • Producers: Create and serve domain-specific data products
    • Consumers: Access and integrate data products
    • Enables self-service data consumption

To demonstrate how you can use Lake Formation to implement cross-account FGAC within an EMR on EKS environment, we create tables in the AWS Glue Data Catalog in a central AWS account acting as producer and provision different user personas to reflect various roles and access levels in a separate AWS account acting as multiple consumers. Consumers can be spread across multiple accounts in real-world scenarios.

The following diagram illustrates the high-level solution architecture.

AWS Healthcare Data Architecture: FGAC using Lake Formation Integration with EMR on EKS

Figure 1: High Level Solution Architecture

To demonstrate the cross-account data sharing and data filtering with Lake Formation FGAC, the solution deploys two different Iceberg tables with varied access for different consumers. The permission mapping for consumers are with cross-account table shares and data cell filters.

It has two different teams with different levels of Lake Formation permissions to access Patients and Claims Iceberg tables. The following table summarizes the solution’s user personas.

Persona/Table Name Patients Claims

Patients Care Team

(team1 job execution role)

  • Exclude a column ssn
  • Include rows only from Texas and New York states
Full table access

Claims Care Team

(team2 job execution role)

No access Full table access

Prerequisites

This solution requires an AWS account with an AWS Identity and Access Management (IAM) power user role that can create and interact with AWS services, including Amazon EMR, Amazon EKS, AWS Glue, Lake Formation, and Amazon Simple Storage Service (Amazon S3). Additional specific requirements for each account are detailed in the relevant sections.

Clone the project

To get started, download the project either to your computer or the AWS CloudShell console:

git clone https://github.com/aws-samples/sample-emr-on-eks-fgac-iceberg
 cd sample-emr-on-eks-fgac-iceberg

Set up infrastructure in producer account

To set up the infrastructure in the producer account, you must have the following additional resources:

The setup script deploys the following infrastructure:

  • An S3 bucket to store sample data in Iceberg table format, registered as a data location in Lake Formation
  • An AWS Glue database named healthcare_db
  • Two AWS Glue tables: Patients and Claims Iceberg tables
  • A Lake Formation data access IAM role
  • Cross-account permissions enabled for the consumer account:
    • Allow the consumer to describe the database healthcare_db in the producer account
    • Allow to access the Patients table using a data cell filter, based on row-level selected state, and exclude column ssn
    • Allow full table access to the Claims table

Run the following producer_iceberg_datalake_setup.sh script to create a development environment in the producer account. Update its parameters according to your requirements:

export AWS_REGION=us-west-2
export PRODUCER_AWS_ACCOUNT=<YOUR_PRODUCER_AWS_ACCOUNT_ID> 
export CONSUMER_AWS_ACCOUNT=<YOUR_CONSUMER_AWS_ACCOUNT_ID> 
./producer_iceberg_datalake_setup.sh 
# run the clean-up script before re-run the setup if needed
./producer_clean_up.sh

Enable cross-account Lake Formation access in producer account

A consumer account ID and an EMR on EKS Engine session tag must set in the producer’s environment. It allows the consumer to access the producer’s AWS Glue tables governed by Lake Formation. Complete the following steps to enable cross-account access:

  1. Open the Lake Formation console in the producer account.
  2. Choose Application integration settings under Administration in the navigation pane.
  3. Select Allow external engines to filter data in Amazon S3 locations registered with Lake Formation.
  4. For Session tag values, enter EMR on EKS Engine.
  5. For AWS account IDs, enter your consumer account ID.
  6. Choose Save.
Comprehensive AWS Lake Formation application integration settings interface for managing third-party data access.

Figure 2: Producer Account – Lake Formation third-party engine configuration screen with session tags, account IDs, and data access permissions.

Validate FGAC setup in producer environment

To validate the FGAC setup in the producer account, check the Iceberg tables, data filter, and FGAC permission settings.

Iceberg tables

Two AWS Glue tables in Iceberg format were created by producer_iceberg_datalake_setup.sh. On the Lake Formation console, choose Tables under Data Catalog in the navigation pane to see the tables listed.

AWS Lake Formation Tables interface showing a success message for updated external data filtering settings, with a table list displaying healthcare database tables in Apache Iceberg format.

Figure 3: Lake Formation interface displaying claims and patients tables from healthcare_db with Apache Iceberg format.

The following screenshot shows an example of the patients table data.

Patients table data

Figure 4: Patients table data

The following screenshot shows an example of the claims table data.

claims table data

Figure 5: Claims table data

Data cell filter against patients table

After successfully running the producer_iceberg_datalake_setup.sh script, a new data cell filter named patients_column_row_filter was created in Lake Formation. This filter performs two functions:

  • Exclude the ssn column from the patients table data
  • Include rows where the state is Texas or New York

To view the data cell filter, choose Data filters under Data Catalog in the navigation pane of the Lake Formation console, and open the filter. Choose View permission to view the permission details.

Data cell filter

Figure 6: Column and Row level filter configuration for patients table

FGAC permissions allowing cross-account access

To view all the FGAC permissions, choose Data permissions under Permissions in the navigation pane of the Lake Formation console, and filter by the database name healthcare_db.

Make sure to revoke data permissions with the IAMAllowedPrincipals principal associated to the healthcare_db tables, because it will cause cross-account data sharing to fail, particularly with AWS Resource Access Manager (AWS RAM).

Data permissions overview

Figure 7: Lake Formation data permissions interface displaying filtered healthcare database resources with granular access controls

The following table summarizes the overall FGAC setup.

Resource Type Resource Permissions Grant Permissions
Database
healthcare_db

Describe Describe
Data Cell Filter
patients_column_row_filter

Select Select
Table
Claims

Select, Describe Select, Describe

Set up infrastructure in consumer account

To set up the infrastructure in the consumer account, you must have the following additional resources:

  • eksctl and kubectl packages must be installed
  • An IAM role in the consumer account must be a Lake Formation administrator to run consumer_emr_on_eks_setup.sh script
  • The Lake Formation admin must accept the AWS RAM resource share invites using the AWS RAM console, if the consumer account is outside of the producer’s organizational unit
RAM resource share screen

Figure 8: Consumer account – Cross-account RAM share for Lake Formation resource

The setup script deploys the following infrastructure:

  • An EKS cluster called fgac-blog with two namespaces:
    • User namespace: lf-fgac-user
    • System namespace:lf-fgac-secure
  • An EMR on EKS virtual cluster emr-on-eks-fgac-blog:
    • Set up with a security configuration emr-on-eks-fgac-sec-conifg
    • Two EMR on EKS job execution IAM roles:
      • Role for the Patients Care Team (team1): emr_on_eks_fgac_job_team1_execution_role
      • Role for Claims Care Team (team2): emr_on_eks_fgac_job_team2_execution_role
    • A query engine IAM role used by FGAC secure space: emr_on_eks_fgac_query_execution_role
  • An S3 bucket to store PySpark job scripts and logs
  • An AWS Glue local database named consumer_healthcare_db
  • Two resource links to cross-account shared AWS Glue tables: rl_patients and rl_claims
  • Lake Formation permission on Amazon EMR IAM roles

Run the following consumer_emr_on_eks_setup.sh script to set up a development environment in the consumer account. Update the parameters according to your use case:

export AWS_REGION=us-west-2 
export PRODUCER_AWS_ACCOUNT=<YOUR_PRODUCER_AWS_ACCOUNT_ID> 
export EKSCLUSTER_NAME=fgac-blog 
./consumer_emr_on_eks_setup.sh 
# run the clean-up script before re-run the setup if needed
./consumer_clean_up.sh

Enable cross-account Lake Formation access in consumer account

The consumer account must add the consumer account ID with an EMR on EKS Engine session tag in Lake Formation. This session tag will be used by EMR on EKS job execution IAM roles to access Lake Formation tables. Complete the following steps:

  1. Open the Lake Formation console in the consumer account.
  2. Choose Application integration settings under Administration in the navigation pane.
  3. Select Allow external engines to filter data in Amazon S3 locations registered with Lake Formation.
  4. For Session tag values, enter EMR on EKS Engine.
  5. For AWS account IDs, enter your consumer account ID.
  6. Choose Save.

Figure 9: Consumer Account – Lake Formation third-party engine configuration screen with session tags, account IDs, and data access permissions

Validate FGAC setup in consumer environment

To validate the FGAC setup in the producer account, check the EKS cluster, namespaces, and Spark job scripts to test data permissions.

EKS cluster

On the Amazon EKS console, choose Clusters in the navigation pane and confirm the EKS cluster fgac-blog is listed.

EKS Cluster view page

Figure 10: Consumer Account – EKS Cluster console page

Namespaces in Amazon EKS

Kubernetes uses namespaces as logical partitioning system for organizing objects such as Pods and Deployments. Namespaces also operate as a privilege boundary in the Kubernetes role-based access control (RBAC) system. Multi-tenant workloads in Amazon EKS can be secured using namespaces.

This solution creates two namespaces:

  • lf-fgac-user
  • lf-fgac-secure

The StartJobRun API uses the backend workflows to submit a Spark job’s UserComponents (JobRunner, Driver, Executors) in the user namespace, and the corresponding system components in the system namespace to accomplish the desired FGAC behaviors.

You can verify the namespaces with the following command:kubectl get namespaceThe following screenshot shows an example of the expected output.

Namespace summary page

Figure 11: EKS Cluster namespaces

Spark job script to test Patients Care Team’s data permissions

Starting with Amazon EMR version 6.6.0, you can use Spark on EMR on EKS with the Iceberg table format. For more information on how Iceberg works in an immutable data lake, see Build a high-performance, ACID compliant, evolving data lake using Apache Iceberg on Amazon EMR.

The following script is a snippet of the PySpark job that retrieves filtered data for the Claims and Patient tables:

    print("Patient Care Team PySpark job running on EMR on EKS! to query Patients and Claims tables!")
    print("This job queries Patients and Claims tables!")
    df1 = spark.sql('SELECT * FROM dev.${CONSUMER_DATABASE}.${rl_patients}')
    print("Patients tables data:")
    print("Note: Patients table is filtered on SSN column and it shows records only for Texas and New York states")
    df1.show(20)
    df2 = spark.sql('SELECT p.state,
                            c.claim_id,
                            c.claim_date, 
                            p.patient_name, 
                            c.diagnosis_code, 
                            c.procedure_code, 
                            c.amount, 
                            c.status, 
                            c.provider_id 
                    FROM dev.${CONSUMER_DATABASE}.${rl_claims} c 
                    JOIN dev.${CONSUMER_DATABASE}.${rl_patients} p
                   ON c.patient_id = p.patient_id 
                   ORDER BY p.state, c.claim_date')
    print("Show only relevant Claims data for Patients selected from Texas and New York state:")
    df2.show(20)
    print("Job Complete")
....	

Spark job script to test Claims Care Team’s data permissions

The following script is a snippet of the PySpark job that retrieves data from the Claims table:

    print("Claims Team PySpark job running on EMR on EKS to query Claims table!")
    print("Note: Claims Team has full access to Claims table!")
    df = spark.sql('SELECT * FROM     dev.${CONSUMER_DATABASE}.${rl_claims}')
    df.show(20)
....

Validate job execution roles for EMR on EKS

The Patients Care Team uses the emr_on_eks_fgac_job_team1_execution_role IAM role to execute a PySpark job on EMR on EKS. The job execution role has permission to query both the Patients and Claims tables.

The Claims Care Team uses the emr_on_eks_fgac_job_team2_execution_role IAM role to execute jobs on EMR on EKS. The job execution role only has permission to access Claims data.

Both IAM job execution roles have the following permissions:

{
    "Version": "2012-10-17",
    "Statement": [
        {
            "Sid": "EmrGetCertificate",
            "Effect": "Allow",
            "Action": "emr-containers:CreateCertificate",
            "Resource": "*"
        },
        {
            "Sid": "LakeFormationManagedAccess",
            "Effect": "Allow",
            "Action": [
                "lakeformation:GetDataAccess",
                "glue:GetTable",
                "glue:GetCatalog",
                "glue:Create*",
                "glue:Update*"
            ],
            "Resource": "*"
        },
        {
            "Sid": "EmrSparkJobAccess",
            "Effect": "Allow",
            "Action": [
                "s3:PutObject",
                "s3:GetObject",
                "s3:DeleteObject",
                "s3:ListBucket"
            ],
            "Resource": [
                "arn:aws:s3:::${S3_BUCKET}*"
            ]
        }
        }
    ]
}

The following code is the job execution IAM role trust policy:

{
    "Version": "2012-10-17",
    "Statement": [
        {
            "Sid": "TrustQueryEngineRoleToAssume",
            "Effect": "Allow",
            "Principal": {
                "AWS": "arn:aws:iam::$CONSUMER_ACCOUNT:role/$query_engine_role"
            },
            "Action": [
                "sts:AssumeRole",
                "sts:TagSession"
            ],
            "Condition": {
                "StringLike": {
                    "aws:RequestTag/LakeFormationAuthorizedCaller": "EMR on EKS Engine"
                }
            }
        },
        {
            "Sid": "TrustQueryEngineRoleToAssumeRoleOnly",
            "Effect": "Allow",
            "Principal": {
                "AWS": "arn:aws:iam::$CONSUMER_ACCOUNT:role/$query_engine_role"
            },
            "Action": "sts:AssumeRole"
        },
        {
            "Effect": "Allow",
            "Principal": {
                "Federated": "arn:aws:iam::$CONSUMER_ACCOUNT oidc-provider/oidc.eks.$AWS_REGION.amazonaws.com/id/xxxxx"
            },
            "Action": "sts:AssumeRoleWithWebIdentity",
            "Condition": {
                "StringLike": {
                    "oidc.eks.$AWS_REGION.amazonaws.com/id/xxxxx:sub": "system:serviceaccount:lf-fgac-user:emr-containers-sa-*-*-$CONSUMER_ACCOUNT-<hash36ofiamrole>"
                }
            }
        }
    ]
}

The following code is the query engine IAM role policy (emr_on_eks_fgac_query_execution_role-policy):

{
    "Version": "2012-10-17",
    "Statement": [
        {
            "Sid": "AssumeJobExecutionRole",
            "Effect": "Allow",
            "Action": [
                "sts:AssumeRole",
                "sts:TagSession"
            ],
            "Resource": ["arn:aws:iam::$CONSUMER_ACCOUNT:role/emr_on_eks_fgac_job_team1_execution_role",
                "arn:aws:iam::$CONSUMER_ACCOUNT:role/emr_on_eks_fgac_job_team2_execution_role"],
            "Condition": {
                "StringLike": {
                    "aws:RequestTag/LakeFormationAuthorizedCaller": "EMR on EKS Engine"
                }
            }
        },
        {
            "Sid": "AssumeJobExecutionRoleOnly",
            "Effect": "Allow",
            "Action": [
                "sts:AssumeRole"
            ],
            "Resource": [
                "arn:aws:iam::$CONSUMER_ACCOUNT:role/emr_on_eks_fgac_job_team1_execution_role",
                "arn:aws:iam::$CONSUMER_ACCOUNT:role/emr_on_eks_fgac_job_team2_execution_role"
            ]
    ]
}

The following code is the query engine IAM role trust policy:

{
    "Version": "2012-10-17",
    "Statement": [
        {
            "Effect": "Allow",
            "Principal": {
                "AWS": "arn:aws:iam::$CONSUMER_ACCOUNT:root"
            },
            "Action": "sts:AssumeRole",
            "Condition": {}
        },
        {
            "Effect": "Allow",
            "Principal": {
                "Federated": "arn:aws:iam::$CONSUMER_ACCOUNT:oidc-provider/xxxxx"
            },
            "Action": "sts:AssumeRoleWithWebIdentity",
            "Condition": {
                "StringLike": {
                    "xxxxxx:sub": "system:serviceaccount:lf-fgac-secure:emr-containers-sa-*-*-$CONSUMER_ACCOUNT-<hash36ofiamrole>"
                }
            }
        }
    ]
}

Run PySpark jobs on EMR on EKS with FGAC

For more details about how to work with Iceberg tables in EMR on EKS jobs, refer to Using Apache Iceberg with Amazon EMR on EKS. Complete the following steps to run the PySpark jobs on EMR on EKS with FGAC:

  1. Run the following commands to run the patients and claims jobs:
bash /tmp/submit-patients-job.sh
bash /tmp/submit-claims-job.sh
  1. Watch the application logs from the Spark driver pod:

kubectl logs drive-pod-name -c spark-kubernetes-driver -n lf-fgac-user -f

Alternatively, you can navigate to the Amazon EMR console, open your virtual cluster, and choose the open icon next to the job to open the Spark UI and monitor the job progress.

Spark UI navigation

Figure 12: EMR on EKS job runs

View PySpark jobs output on EMR on EKS with FGAC

In Amazon S3, navigate to the Spark output logs folder:

s3://blog-emr-eks-fgac-test-<acct-id>-us-west-2-dev/spark-logs/<emr-on-eks-cluster-id>/jobs/<patients-job-id>/containers/spark-xxxxxx/spark-xxxxx-driver/stdout.gz
S3 path to view logs

Figure 13: EMR on EKS job’s stdout.gz location on S3 Bucket

The Patients Care Team PySpark job has query access to the Patients and Claims tables. The Patients table has filtered out the SSN column and only shows records for Texas and New York claim records, as specified in our FGAC setup.

The following screenshot shows the Claims table for only Texas and New York.

Claims data in consumer view

Figure 14: EMR on EKS Spark job output

The following screenshot shows the Patients table without the SSN column.

Patients data in consumer view

Figure 15: EMR on EKS Spark job output

Similarly, navigate to the Spark output log folder for the Claims Care Team job:

s3://blog-emr-eks-fgac-test-<acct-id>-us-west-2-dev/spark-logs/<emr-on-eks-cluster-id>/jobs/<claims-job-id>/containers/spark-xxxxxx/spark-xxxxx-driver/stdout.gz

As shown in the following screenshot, the Claims Care Team only has access to the Claims table, so when the job tried to access the Patients table, it received an access denied error.

Access denied for Claims team

Figure 16: EMR on EKS Spark job output

Considerations and limitations

Although the approach discussed in this post provides valuable insights and practical implementation strategies, it’s important to recognize the key considerations and limitations before you start using this feature. To learn more about using EMR on EKS with Lake Formation, refer to How Amazon EMR on EKS works with AWS Lake Formation.

Clean up

To avoid incurring future charges, delete the resources generated if you don’t need the solution anymore. Run the following cleanup scripts (change the AWS Region if necessary).Run the following script in the consumer account:

export AWS_REGION=us-west-2
export PRODUCER_AWS_ACCOUNT=<YOUR_PRODUCER_AWS_ACCOUNT_ID>
export EKSCLUSTER_NAME=fgac-blog
./consumer_clean_up.sh

Run the following script in the producer account:

export AWS_REGION=us-west-2
export PRODUCER_AWS_ACCOUNT=<YOUR_PRODUCER_AWS_ACCOUNT_ID>
export CONSUMER_AWS_ACCOUNT=<YOUR_CONSUMER_AWS_ACCOUNT_ID>
./producer_clean_up.sh

Conclusion

In this post, we demonstrated how to integrate Lake Formation with EMR on EKS to implement fine-grained access control on Iceberg tables. This integration offers organizations a modern approach to enforcing detailed data permissions within a multi-account open data lake environment. By centralizing data management in a primary account and carefully regulating user access in secondary accounts, this strategy can simplify governance and enhance security.

For more information about Amazon EMR 7.7 in reference to EMR on EKS, see Amazon EMR on EKS 7.7.0 releases. To learn more about using Lake Formation with EMR on EKS, see Enable Lake Formation with Amazon EMR on EKS.

We encourage you to explore this solution for your specific use cases and share your feedback and questions in the comments section.


About the authors

Janakiraman Shanmugam

Janakiraman Shanmugam

Janakiraman is a Senior Data Architect at Amazon Web Services . He has a focus in Data & Analytics and enjoys helping customers to solve Big data & machine learning problems. Outside of the office, he loves to be with his friends and family and spend time outdoors.

Tejal Patel

Tejal Patel

Tejal is Sr. Delivery Consultant from AWS Professional Services team, specializing in Data Analytics and ML solutions. She helps customers design scalable and innovative solutions with the AWS Cloud. Outside of her professional life, Tejal enjoys spending time with her family and friends.

Prabhakaran Thatchinamoorthy

Prabhakaran Thatchinamoorthy

Prabhakaran is a Software Engineer at Amazon Web Services, working on the EMR on EKS service. He specializes in building and operating multi-tenant data processing platforms on Kubernetes at scale. His areas of interest include open-source batch and streaming frameworks, data tooling, and DataOps.

Upgrade from Amazon Redshift DC2 node type to Amazon Redshift Serverless

Post Syndicated from Nita Shah original https://aws.amazon.com/blogs/big-data/upgrade-from-amazon-redshift-dc2-node-type-to-amazon-redshift-serverless/

Amazon Redshift is a fully managed, petabyte-scale, cloud data warehouse service. You can use Amazon Redshift to run complex queries against petabytes of structured and semi-structured data quickly and efficiently, integrating seamlessly with other AWS services.

Amazon Redshift Serverless helps you run and scale analytics in seconds without having to set up, manage, or scale data warehouse infrastructure. It automatically provisions data warehouse capacity and intelligently scales the underlying resources to deliver fast performance for demanding workloads and you pay only for the compute capacity you use. Additionally, with Amazon Redshift managed storage, you can further optimize your data warehouse by scaling storage and compute independently and you pay only for the storage you use.

Upgrading your data warehouse from Amazon Redshift dense compute (DC2) instances to Amazon Redshift Serverless unlocks these advantages and provides an enhanced user experience and simplified operations, offering a more efficient, scalable solution for data analytics.

In this post, we show you the upgrade process from DC2 instances to Amazon Redshift Serverless. We’ll cover:

  1. Assessing your current setup and determining if an upgrade is right for you
  2. Planning and preparing for the upgrade
  3. Step-by-step instructions for the upgrade process
  4. Post-upgrade optimization and best practices

Why upgrade to Amazon Redshift Serverless

By using Amazon Redshift Serverless, you can run and scale analytics without managing data warehouse infrastructure. When you upgrade from DC2 instances to Amazon Redshift Serverless, you get the following benefits:

  • Simplified operations: Access and analyze data without needing to set up, tune, and manage compute clusters.
  • Automatic performance optimization: Deliver consistently high performance and simplified operations for demanding and volatile workloads with automatic scaling and AI driven scaling and optimization.
  • Pay-as-you-go pricing: The flexible pricing structure charges you only during active usage; you pay only for what you use.
  • Online maintenance: Amazon Redshift Serverless automatically manages system updates and patches without requiring maintenance windows, helping to facilitate seamless operation of your data warehouse.
  • Decoupled storage and compute: Control costs by scaling and paying for compute and storage separately with Amazon Redshift managed storage.
  • Access to new capabilities: Use advanced features including data sharing writes, Redshift Streaming Ingestion, zero-ETL, and other capabilities.

Sizing guidance

To upgrade from DC2 to Amazon Redshift Serverless, you need to understand the size equivalency. The following table shows suggested sizing configurations when upgrading from the DC2 node type.

Note that availability of Redshift Processing Unit (RPU) configurations varies by AWS Region.

Existing node type Existing number of nodes Amazon Redshift Serverless upgrade
DC2.large 1–4 Start with 4 RPUs
DC2.large 5–7 Start with 8 RPUs
DC2.large 8–32 Add 8 RPUs per 8 nodes of DC2.large
DC2.8xlarge 2–32 Add 16 RPUs per node (up to a maximum of 1,024 RPUs)

These sizing estimates provide a flexible starting point tailored to help you make the most of Amazon Redshift Serverless. The ideal configuration for your needs will depend on factors such as your desired balance of cost and performance and the specific latency and throughput requirements of your workload. To further optimize the sizing based on your specific requirements, you can use one or more of following approaches:

  • Test your workload beforehand: Before migrating to Amazon Redshift Serverless, evaluate your workload’s performance requirements in a non-production environment. The Amazon Redshift Test Drive utility simplifies this process by simulating your production workloads across different serverless configurations. You can use the results to help identify the optimal balance between performance and cost and make informed decisions about your configuration. For step-by-step guidance on using the Test Drive utility for DC2 to Serverless upgrades, see the Amazon Redshift Migration Workshop. Running these performance tests before migration helps you to identify any necessary adjustments to your configuration before deploying to production
  • Monitor in production: After you’ve deployed your workload, closely monitor the performance and resource utilization for over a period of time that represents your typical workloads. Based on the observed metrics, you can then scale the resources up or down as needed to achieve the best balance of performance and cost.
  • AI-driven scaling and optimization: Consider using Amazon Redshift Serverless with AI-driven scaling and optimization to automatically size Amazon Redshift Serverless for your workload needs.

A methodical approach to sizing validation, combining both pre-production testing and ongoing production monitoring, helps ensure your Amazon Redshift Serverless configuration aligns with your workload.

Upgrade to Amazon Redshift Serverless

To upgrade to Amazon Redshift Serverless, you can use a snapshot restore to move directly from Amazon Redshift to Amazon Redshift Serverless, as shown in the following figure. A snapshot restore restores data and objects in addition to users and their associated permissions, configurations, and schema structures. By using snapshot restore for migration, you can validate the target Amazon Redshift Serverless warehouses without impacting your production Amazon Redshift DC2 cluster. You can also use snapshot restore to migrate your Amazon Redshift DC2 workloads to different Regions or Availability Zones.

Prerequisites to migrate using a snapshot restore

  1. Create an Amazon Redshift Serverless workgroup with a namespace. For more information, see creating workgroup with a namespace.
  2. Amazon Redshift Serverless is encrypted by default. Amazon Redshift Serverless also supports changing the AWS KMS key for the namespace so you can adhere to your organization’s security policies.
  3. Verify that the Amazon Redshift Serverless namespace you’re trying to restore to is attached to an Amazon Redshift Serverless workgroup.
  4. To restore from a provisioned Amazon Redshift cluster to Amazon Redshift Serverless, the AWS Identity and Access Management (IAM) user or role must have the following permissions: redshift-serverless:RestoreFromSnapshot, CreateNamespace, and CreateWorkgroup. For more information, see Amazon Redshift Serverless restore.

Upgrade using the console

Use the following steps in the AWS Management Console for Amazon Redshift to upgrade your DC2 cluster to Amazon Redshift Serverless using the snapshot restore method.

  1. On the Redshift console, choose Clusters in the navigation pane. Select your cluster and then choose Maintenance.
  2. Choose Create snapshot to create a manual snapshot of the existing Amazon Redshift provisioned cluster.
  3. Enter a snapshot identifier, select the snapshot retention period, and then choose Create snapshot.
  4. Select the snapshot you want to restore to Amazon Redshift Serverless from the list and then choose Restore snapshot and select Restore to serverless namespace.
  5. Under Select namespace, select your target serverless namespace from the dropdown list and then choose Restore.
  6. The restoration time will vary based on your data volume.
  7. After the restoration completes, verify your data migration by connecting to your Amazon Redshift Serverless workspace using either the Amazon Redshift Query Editor v2 or your preferred SQL client.

For more information, see Creating a snapshot of your provisioned cluster.

Upgrade using the AWS CLI

Use the following steps in the AWS Command Line Interface (AWS CLI) to upgrade your DC2 cluster to Amazon Redshift Serverless using the snapshot restore method.

  1. Create a snapshot from the source cluster:
    aws redshift create-cluster-snapshot --cluster-identifier <your-dc2-cluster-id>  --snapshot-identifier <your-snapshot-name>

  2. Verify that the snapshot exists:
    aws redshift describe-cluster-snapshots --snapshot-identifier <your-snapshot-name>

  3. Restore the snapshot to your Amazon Redshift Serverless namespace:
    aws redshift-serverless restore-from-snapshot --snapshot-arn "arn:aws:redshift:<your-region>:<your-account-number>:snapshot:<source-cluster-id>/<your-snapshot-name>" --namespace-name <your-serverless-namespace> --workgroup-name <your-serverless-workgroup> --region <your-region>

For more information, see Restore from cluster snapshot using AWS CLI.

Best practices for upgrading to Amazon Redshift Serverless

The following are recommended best practices when upgrading from Amazon Redshift to Amazon Redshift Serverless.

  • Pre-upgrade:
  • Post-upgrade:
    • Update existing connections: When you migrate to Amazon Redshift Serverless, a new endpoint will be created. Update any existing connections to business intelligence and other reporting tools.
    • Observability and monitoring: If you have any data monitoring tools using systems views, verify that there are no open or empty transactions. It’s important as a best practice to end transactions. If you don’t end or roll back open transactions, Amazon Redshift Serverless will continue to use RPUs for those transactions.
    • Access: When using IAM authentication with dbUser and dbGroups, your applications can access the database using the GetCredentials API. For more information, see Connecting using IAM.
    • System views: Review the list of unified system views available in Amazon Redshift Serverless.

If your workloads aren’t suited for Amazon Redshift Serverless because of their nature or any of the considerations listed in Considerations when using Amazon Redshift Serverless, you can upgrade to Amazon Redshift RA3 instances by following the RA3 sizing guidance.

Cost considerations

In this section, we provide information to help you understand and manage your Amazon Redshift Serverless costs.

  • You can reduce your serverless computing costs by reserving capacity in advance when you have predictable usage patterns.
  • Amazon Redshift Serverless automatically adjusts capacity based on workload. By setting a maximum RPU limit, you can control costs by capping how much the system can scale up.
  • Amazon Redshift Serverless uses RPUs as a compute unit. While it starts with a default of 128 RPUs, you can adjust the base RPU anywhere from 4 to 1,024 RPUs to match your specific workload needs and SLA requirement. For more information, see Billing for Amazon Redshift Serverless.
  • Amazon Redshift Serverless automatically creates recovery points every 30 minutes or whenever 5 GB of data changes per node occur, whichever happens first. The minimum interval between recovery points is 15 minutes. All recovery points are retained for 24 hours by default.

If you need to preserve backups for a longer period, you can create manual backups. Manual backups will incur additional storage costs.

Clean up

To avoid incurring future charges, delete the Amazon Redshift Serverless instance or provisioned data warehouse cluster created as part of the prerequisite steps. For more information, see Deleting a workgroup and Shutting down and deleting a cluster.

Conclusion

In this post, we discussed the benefits of upgrading Amazon Redshift DC2 instances to Amazon Redshift Serverless, in addition to the various options for upgrading and some best practices. It is essential to determine the target Amazon Redshift Serverless configuration and validate it using Amazon Redshift Test Drive utility in test and development environments before upgrading.

Get started upgrading to Amazon Redshift Serverless today by implementing the guidance in this post. If you have questions or need assistance, contact AWS Support forarchitectural and design guidance, in addition to support for proofs of concept and implementation.


About the authors

Nita Shah

Nita Shah

Nita is a Senior Analytics Specialist Solutions Architect at AWS based out of New York. She has been building data warehouse solutions for over 20 years and specializes in Amazon Redshift. She is focused on helping customers design and build enterprise-scale well-architected analytics and decision support platforms.

Ricardo Serafim

Ricardo Serafim

Ricardo is a Senior Analytics Specialist Solutions Architect at AWS. He has been helping companies with Data Warehouse solutions since 2007.

Bryan Cottle

Bryan Cottle

Bryan is a Senior Technical Product Manager at Amazon Web Services. He’s passionate about analytical databases, specializing in Amazon Redshift where he helps customers optimize costs, navigate pricing strategies, and successfully manage their database migrations

Enhance email security using VPC endpoints with Amazon SES

Post Syndicated from Mamadou Ba original https://aws.amazon.com/blogs/messaging-and-targeting/enhance-email-security-using-vpc-endpoints-with-amazon-ses/

Email’s universal adoption and accessibility make Amazon Simple Email Service (Amazon SES) an ideal platform for delivering critical business communications, such as customer notifications or password resets. However, the ubiquity of email also invites bad actors who seek to actively exploit email’s ubiquity to launch sophisticated attacks. Business email transmissions traverse a complex network with potential vulnerabilities, making email systems prime targets for these malicious actors. Common threats include message interception, email spoofing, unauthorized access to sending services, and service disruption attacks.

Amazon SES handles millions of sensitive communications daily. For example, healthcare providers transmit patient data, financial institutions send transaction alerts, and businesses exchange confidential information. Securing this critical infrastructure requires deep expertise in email systems, threat detection, and advanced security protocols to provide message integrity and confidentiality.

In this post, we discuss and guide you in enhancing your email security by using VPC endpoints with Amazon SES.

Common security challenges customers face sending email with Amazon SES

Consider the challenges faced by a large healthcare provider seeking to send automated appointment reminders and confidential lab results. Although Amazon SES meets their email delivery needs, the IT team must implement strict security measures to satisfy industry, government, and internal requirements. These likely include secure SMTP connections, identity-based access controls, and network isolation to safeguard sensitive patient information.

These common security requirements seek to address two critical concerns. First, they aim to prevent unauthorized access to the organization’s Amazon SES accounts, thereby safeguarding sensitive communications from potential breaches. Second, these measures mitigate the risks of bad actors co-opting their Amazon SES accounts to launch sophisticated email spoofing and phishing attacks.

Either breach could compromise trusted domains, undermining the security of the healthcare provider’s email communications and damaging their reputation.

For organizations with specific network security requirements or compliance mandates, Amazon SES offers VPC endpoint integration to provide additional network-level controls. This approach is particularly valuable for customers who prefer to avoid API calls traversing the public internet or need to ensure email processing workflows remain within private network boundaries.

VPC endpoints create a direct connection between your applications and Amazon SES, offering the following capabilities:

  • Enhanced network isolation: Keeps email traffic within your private network infrastructure
  • Compliance alignment: Supports regulatory frameworks like HIPAA and GDPR that may require additional network controls
  • Network-based access controls: Restricts SES access to authorized IP ranges and subnets
  • Simplified hybrid connectivity: Leverages existing VPN or Direct Connect infrastructure for seamless integration
  • Defense-in-depth architecture: Adds an additional layer of network security to your email infrastructure

Amazon SES VPC endpoints are enabled by AWS PrivateLink for SMTP message traffic. With these VPC endpoints, you can route SMTP email traffic privately within the AWS network between your sending applications, optionally with encryption, and Amazon SES. When using a VPC endpoint, traffic to Amazon SES doesn’t transmit over the internet and never leaves the Amazon network to securely connect your VPC to Amazon SES without availability risks or bandwidth constraints on your network traffic.

At the time of writing, Amazon SES VPC endpoints don’t support API-based email sending (such as SendEmail, SendRawEmail, or SDKs). Amazon SES API traffic should be encrypted and routed using a VPC through a NAT gateway or over the public internet.

Solution overview

Our solution can help you secure your SMTP message traffic by using the following components:

The following diagram illustrates the solution architecture. The architecture assumes you already have connectivity from your on-premises network to your VPC. For instructions to connect your on-premises network to AWS, refer to Hybrid network connections.

For testing purposes, we use connectivity within AWS. The same concept applies if you’re connecting from an on-premises network that is connected to your VPC either through a Virtual Private Network (VPN) or Direct Connect (DX).

The solution workflow consists of the following steps:

  1. Your SMTP sending applications and services are located on premises or in your data center using two subnets:
    1. Subnet A (IP range: 10.10.10.50)
    2. Subnet B (IP range: 10.90.120.50)
  2. Secure connections are transmitted using AWS Direct Connect or VPN connection to a VPC in the same AWS Region as your Amazon SES account.
  3. The SMTP message traffic, optionally encrypted, is sent to the Amazon SES VPC endpoints configured to restrict network connections from the VPC to only specific subnets:
    1. Traffic on approved subnet A (10.10.10.50) is sent to Amazon SES.
    2. Traffic on denied subnet B (10.90.120.50) is dropped (not sent to Amazon SES).
  4. SMTP traffic from only the allowed subnet A is further restricted to an IAM policy with valid SMTP credentials.
  5. Messages that conform to the traffic and authentication policies are passed to Amazon SES for final delivery to recipients.

Prerequisites

To implement this solution, you must have the following prerequisites:

  • Amazon SES, configured with at least one verified identity, in the same Region as the VPC.
  • An existing VPC in the same Region as Amazon SES. This can be the default VPC. For more information, see Plan your VPC.
  • An SMTP sending application (optionally supporting TLS encryption) located in one of the following options:
    • On premises or in a data center that is connected to the VPC through a private network connection (such as Direct Connect or VPN). For more details about private network connections to AWS, refer to Network-to-Amazon VPC connectivity options.
    • In the VPC running on a compute resource such as Amazon Elastic Compute Cloud (Amazon EC2) or AWS Lambda. For this post, we use an EC2 instance in the VPC and connect to Amazon SES through the VPC endpoint on port 587 with TLS enabled. Note that AWS blocks outbound SMTP traffic on port 25 across most AWS services. Use an alternative TCP port, such as 465, 587, 2465, or 2587. Request port 25 exemption by submitting a request to AWS Support from your AWS account using the “Request to remove email sending limitations” form. This can take upwards of 7 business days to be reviewed; approval is not guaranteed. Amazon SES uses an opportunistic TLS policy by default for encrypting messages when the receiving host supports it. You should use encryption whenever it is available.
  • For testing, you can use one of the following options:
  • DNS resolution for resources in the VPC with the Amazon SES VPC endpoints in the source network. To learn more, see Resolving DNS queries between VPCs and your network.

Create security group

The first step is to create a security group with inbound rules that only allow a specific IP range on the appropriate port (host-permitting, 25, 465, 587, 2465, or 2587). In our example, we only allow subnet A (IP range: 10.10.10.50) on port 587. Complete the following steps to create the security group:

  1. In the navigation pane of the Amazon EC2 console, under Network & Security, choose Security groups.
  2. Choose Create security group.
  3. For Security group name, enter a unique name that identifies the security group (we use ses-vpce-sec-group).
  4. For Description, enter the purpose of the security group.
  5. For VPC, choose the VPC in which you will host the application that will use Amazon SES.
  6. Under Inbound rules, choose Add rule.
  7. For Type, choose Custom TCP.
  8. For Port range, enter the port number that you want to use to send email. You can choose from 465, 587, 2465, or 2587. For this post, we use 587.
  9. For Source type, choose Custom.
  10. Enter the private IP CIDR range for subnet A (IP range: 10.10.10.50), which contains the resources that will use the VPC endpoint to communicate with Amazon SES.
  11. Choose Create security group.

Create VPC endpoint to connect the VPC to Amazon SES

Complete the following steps to create your VPC endpoint:

  1. On the Amazon VPC console, in the navigation pane, under PrivateLink and Lattice, choose Endpoints.
  2. Choose Create endpoint.
  3. Optionally, under Endpoint settings, create a tag in the Name tag field.
  4. For Service category, select AWS services.
  5. For Services, filter for and select smtp.
  6. For VPC, choose a VPC (for more details, see Prerequisites).
  7. For Subnets, select Availability Zones and Subnet IDs.
    Amazon SES doesn’t support VPC endpoints in the following Availability Zones: use1-az2, use1-az3, use1-az5, usw1-az2, usw2-az4, apne2-az4, cac1-az3, and cac1-az4.
  1. For Security groups, choose the security group you created earlier.
  2. Optionally, for Tags, create one or more tags.
  3. Choose Create endpoint.
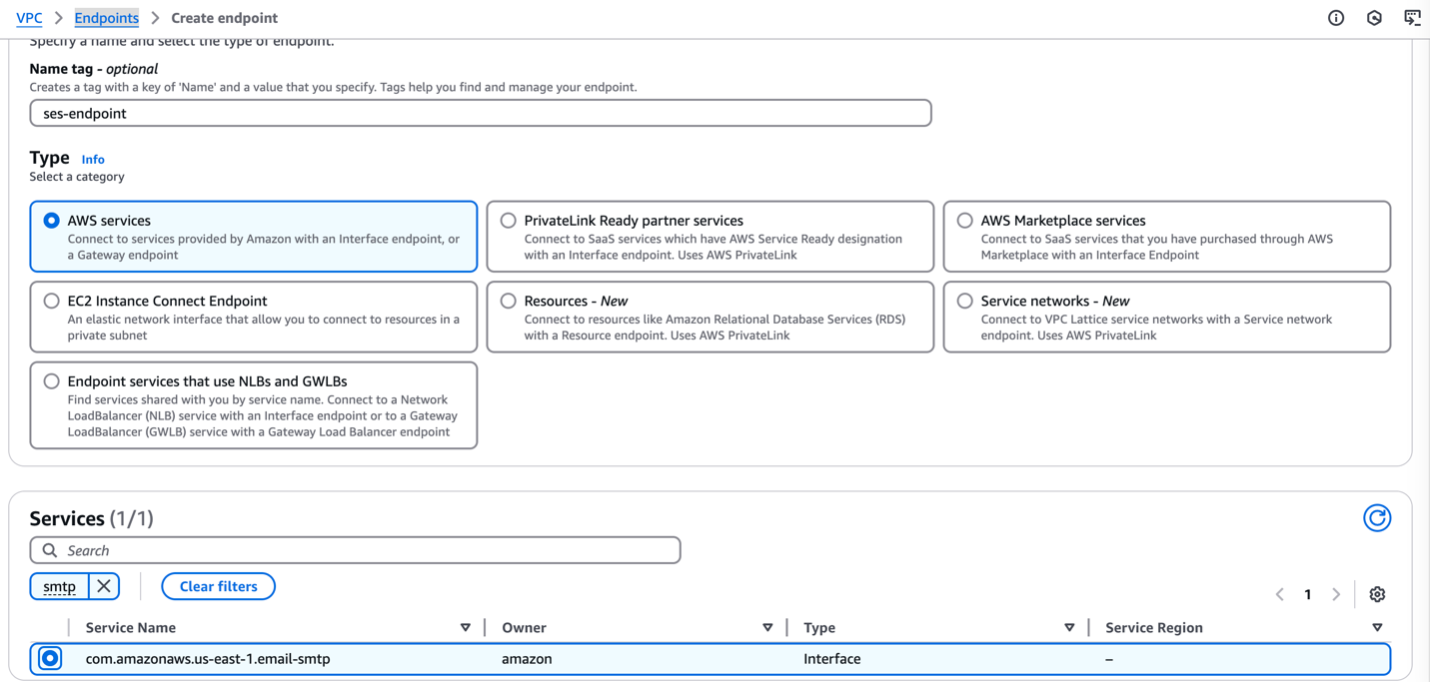
    Wait approximately 5 minutes while Amazon VPC creates the endpoint. When the endpoint is ready to use, the value in the Status column changes to Available.
  4. Copy the VPC endpoint ID to your clipboard to use in the next step.

Optionally, you can test the connection to make sure the VPC endpoint is configured properly by using command line tools to send a test email using the Amazon SES SMTP interface from an EC2 instance in the same VPC where you just created the email-smtp VPC endpoint. For more information, see Using the Amazon SES SMTP interface to send email.

Create SMTP credentials in Amazon SES that will be used by sender applications to authenticate

Complete the following steps to create SMTP credentials:

  1. On the Amazon SES console, choose SMTP Settings in the navigation pane.
  2. Choose Create SMTP credentials.
  3. Enter your preferred user name and choose Create user.
  4. Download the user’s SMTP credentials or copy the credentials to AWS Secrets Manager. (we will use these SMTP credentials in the next step).
  5. Return to the SES console.

Limit traffic to the Amazon SES VPC endpoint using IAM

In this step, we limit traffic to the Amazon SES VPC endpoint using an IAM policy. The IAM policy has a condition that restricts access to aws:SourceVpce. Complete the following steps:

  1. On the Amazon SES console, choose SMTP Settings in the navigation pane.
  2. Choose Manage my existing SMTP credentials.
  3. Choose the user you created earlier, then choose Permissions.
  4. Choose the policy name AmazonSesSendingAccess to go to the IAM policy editor.
  5. Replace the policy content in JSON view with the following policy, which adds the conditions for traffic to come from the Amazon SES VPC endpoint:
{
  "Version": "2012-10-17",
  "Statement": [
    {
      "Sid": "SESSendPermissions",
      "Effect": "Allow",
      "Action": [
        "ses:SendEmail",
        "ses:SendCustomVerificationEmail",
        "ses:SendRawEmail",
        "ses:SendBulkEmail"
      ],
      "Resource": "*",
      "Condition": {
        "StringEquals": {
          "aws:SourceVpce": ""
        }
      }
    }
  ]
}
  1. Choose Next.
  2. Choose Save changes.

As a best practice, rotate your SMTP credentials on a periodic basis and whenever there is concern over the confidentiality of the credentials. For more information, see Automate the Creation & Rotation of Amazon Simple Email Service SMTP Credentials.

Test permissions and connectivity

To test permissions and connectivity by sending a test email, complete the following steps to create an EC2 instance in your VPC:

  1. On the Amazon EC2 console, create a new EC2 instance.
  2. Make sure to specify your VPC and subnet. The subnet must be the same as the one selected in previous steps.
  3. Use the SMTP script in the Amazon SES documentation for testing.

This screenshot shows the test result using the SMTP VPC Endpoint URL.

This configuration allows Amazon SES to only accept SMTP message traffic from applications from allowed on-premises subnets with connectivity to AWS and in the VPC that originates from the permitted SMTP IAM identity policy. This design follows the AWS least privilege access approach to security. To learn more, refer to Strategies for achieving least privilege at scale.

Clean up

After testing, if you don’t want to keep these configurations you should delete the EC2 instance, the VPC endpoint, the SMTP credential, and the IAM user.

Conclusion

In this post, we demonstrated how to implement a secure Amazon SES environment by combining multiple AWS security controls. By using Amazon SES VPC endpoints, security groups, and IAM policies, you can create a robust security architecture that restricts email sending capabilities to authorized networks only.

This multi-layered approach addresses critical security challenges by avoiding public internet exposure for SMTP traffic, enabling comprehensive traffic monitoring through VPC flow logs, and establishing defined network boundaries that satisfy strict compliance requirements.

The solution provides significant security benefits while maintaining the scalability and reliability that Amazon SES customers expect. Organizations can effectively protect sensitive email communications, prevent unauthorized access, and maintain compliance with industry regulations like HIPAA and GDPR. This becomes increasingly important as email-based threats continue to evolve and regulatory requirements become more stringent.

Start implementing these security controls today:

  • Deploy this solution in your development environment first, testing each component thoroughly
  • Review the security best practices for Amazon SES and VPC endpoints
  • Validate your implementation against your organization’s security requirements
  • Create a detailed migration plan for your production environment
  • Monitor and audit your email infrastructure regularly using VPC Flow Logs and Amazon CloudWatch

For additional guidance, consult the Amazon SES documentation, explore the AWS Security Blog for related articles, or engage with AWS Support. Remember to periodically review and update your security configurations as new features and best practices emerge.


About the authors

Automate email notifications for governance teams working with Amazon SageMaker Catalog

Post Syndicated from Himanshu Sahni original https://aws.amazon.com/blogs/big-data/automate-email-notifications-for-governance-teams-working-with-amazon-sagemaker-catalog/

Amazon SageMaker Catalog simplifies the discovery, governance, and collaboration for data and AI across Data Lakehouse, AI models, and applications. With Amazon SageMaker Catalog, you can securely discover and access approved data and models using semantic search with generative AI–created metadata or could just ask Amazon Q Developer with natural language to find their data.

Large enterprise customers have multiple lines of businesses who produce and consume data using a central SageMaker Data Catalog. Many customers have a central data governance team that is responsible for creating, publishing, and maintaining data governance standards and best practices across the firm. As the customer’s data platform scales, it becomes challenging for the central governance team to maintain the standards across all data producers and consumers. Because of this, many governance teams need to monitor user activity in Amazon SageMaker Catalog to ensure data assets are published according to established organizational governance standards and best practices. In this scenario, there is a need for automation where the central governance teams can be notified when critical events happen in Amazon SageMaker Catalog.

In this post, we show you how to create custom notifications for events occurring in SageMaker Catalog using Amazon EventBridge, AWS Lambda, and Amazon Simple Notification Service (Amazon SNS). You can expand this solution to automatically integrate SageMaker Catalog with in-house enterprise workflow tools like ServiceNow and Helix.

Solution overview

The following solution architecture shows how SageMaker Catalog integrates with other AWS services like AWS IAM Identity Center, Amazon EventBridge, Amazon SQS, AWS Lambda, and Amazon SNS to generate automated notifications to capture critical events in the enterprise catalog.

  1. A SageMaker Catalog user logs into Amazon SageMaker Unified Studio using IAM Identity center. This could be a data scientist, machine learning engineer, or analyst looking for published data sets in the firm. AWS IAM Identity center ensures that only authorized personnel can access the cataloged assets and ML resources.
  2. User performs an activity within SageMaker Catalog. Example user creates a new project or user searches for a data asset and creates a subscription request to access the asset.
  3. User events from SageMaker Catalog are captured in Amazon EventBridge. Amazon EventBridge is a fully managed, serverless event bus service designed to help you build scalable, event-driven applications across AWS, SaaS, and custom applications. Amazon EventBridge provides the ability to filter events and allow users to take action on specific events.The following example event pattern in EventBridge filters DataZone create project events.
    {
      "source": [
        "aws.datazone"
      ],
      "detail": {
        "eventSource": [
          "datazone.amazonaws.com"
        ],
        "eventName": [
          "CreateProject"
        ]
      }
    }

  4. Amazon EventBridge sends the filtered events to Amazon SQS. Routing events to an SQS queue improves reliability and durability. Amazon SQS acts as a buffer between Amazon EventBridge and AWS Lambda, decoupling event producers from consumers. This allows your Lambda functions to process messages at their own pace, preventing overload during traffic spikes or when downstream resources are temporarily slow or unavailable. Amazon SQS provides durable, persistent storage for events. If Lambda service is unavailable or throttled, messages remain in the queue until they can be successfully processed, reducing the risk of data loss. There is a Dead Letter Queue (DLQ) attached to the main SQS queue. Attaching a DLQ to SQS ensures that any messages that can’t be processed after multiple attempts are safely captured for inspection and troubleshooting, preventing them from blocking or endlessly circulating in the main queue.
  5. AWS Lambda function reads the messages from SQS queue. Lambda function formats the notification based on your needs.
  6. AWS Lambda publishes the message to Amazon SNS. End users and Central Governance team can subscribe to the SNS topic to receive email alerts when an event happens in SageMaker catalog.
  7. Amazon CloudWatch integrates with AWS Lambda to monitor performance, logs events, and can trigger alarms if anything goes awry, ensuring your workflows run smoothly.

Prerequisites

You need to setup the following prerequisite resources:

  • An AWS account with a configured Amazon Amazon Virtual Private Cloud (Amazon VPC) and base network.
  • An existing SageMaker Unified Studio domain (follow instructions on Setting up Amazon SageMaker Unified Studio).
  • Grant Lambda Access in SageMaker Unified Studio (required for Publishing the assets)
    • Add the Lambda execution role as an IAM role in SageMaker Unified Studio.
    • Assign the Lambda execution role to your project within the SageMaker Unified Studio portal.

This configuration ensures that Lambda function has the required authorization to access Data Zone resources and successfully publish assets from your SageMaker Unified Studio projects.

Code Deployment

Review the instructions on our GitHub repository to deploy the framework in your AWS account using AWS CDK. The CDK provisions an event-driven notification architecture for Amazon SageMaker Unified Studio, focusing on project creation and asset publishing events.

Core AWS Resources Deployed – The following are the core AWS resourced deployed:

  1. EventBridge Rules
    • DataZoneCreateProjectRule: Captures DataZone project creation events (CreateProject).
    • DataZonePublishAssetRule: Captures DataZone asset publishing events (CreateListingChangeSet with PUBLISH action for ASSET entity type).
  2. SQS Queue
    • DataZoneEventQueue: Buffers DataZone events from EventBridge before processing.
    • Queue Policy: Allows EventBridge to send messages to the SQS queue.
  3. Lambda Function
    • ProjectNotificationLambda: Processes messages from the SQS queue, retrieves event details from DataZone, and sends notifications to an SNS topic.
      • IAM Role: Grants permissions to access SQS, SNS, CloudWatch Logs, and DataZone services.
      • Event Source Mapping: Triggers the Lambda function for each SQS message.
  4. SNS Topic
    • LambdaSNSTopic: Receives notifications from the Lambda function.
      • Email Subscriptions: Two email endpoints are subscribed to receive notifications.
    • Add your email ID to the SNS topic. You’ll receive an email to request for subscription, click on ‘Confirm Subscription’
  5. Permissions
    • Amazon EventBridge sends events to SQS (requiring SQS permissions), Lambda poll reads messages from Amazon SQS (requiring Lambda role in SQS permissions), and Lambda publishes to Amazon SNS (requiring SNS permissions).
    • IAM Policies: Lambda execution role has necessary permissions for SQS, SNS, logging, and Data Zone operations.

Outputs Provided (CloudFormation Output)

  • Amazon SNS Topic ARN: For notification publishing.
  • Amazon SQS Queue ARN: For event buffering.
  • AWS Lambda Function ARN: For event processing.
  • Amazon EventBridge Rule ARNs: For both asset publishing and project creation events.

Project Creation Notification

Execute the following steps to login to SageMaker Unified Studio and create a project.

  1. Login to SageMaker Unified Studio Console. This takes you to Amazon SageMaker Unified Studio domain login screen (SSO and IAM sign-in options).
    SageMaker Unified Studio Login
  2. Choose Create Project on SageMaker Unified Studio login page.
    Create Project
  3. Choose a project name of your choice, such as ‘My_Demo_Project’. In Project profile, select ‘All-Capabilities’.
    Demo Project
  4. Choose Continue. Keep everything as default.
  5. Choose Continue. On next page, create on ‘Create project’.
  6. Project creation final screen
  7. Email Notification. Once project creation is successful, you should see an email notification sent by the above deployed automation.

Asset Publish Notification

To publish a sample asset in SageMaker Unified Studio.

  1. Lambda Permissions
    After the CDK Stack creates the Lambda execution role ‘DatazoneStack-LambdaExecutionRole’, use the following procedure to integrate this role into your SageMaker Studio project. This integration enables Lambda functions to interact with DataZone API in SageMaker Unified Studio project.

    1. Login to SageMaker Unified studio using SSO, click on Members, Add members.
    2. Find the role ‘DatazoneStack-LambdaExecutionRole’ and add as a ‘Contributor’

      The LambdaExecutionRole (<cf-stack-name>-LambdaExecutionRole) has been added as a member to a project in SageMaker Unified Studio.

  2. Create Asset
    1. In your project ‘My_Demo_Project’, click on Data. Choose the plus sign to add a data set.

    2. Upload your CSV file using the sample ‘Product_v6.csv’ found in the checkout folder of the ‘sample-sagemaker-unified-studio-governance-notifications’ GitHub repository.

    3. Use table type as S3/external table.

    4. Review and confirm that the column/attribute names in the uploaded CSV file.

    5. Check the Glue database(glue_db_<unique_id>) to confirm that the table has been created and properly imported
  3. Publish Asset
    1. Select the asset, choose Actions and Publish to Catalog.

    2. View the published asset below.

    3. In the Project Catalog’s Assets section, locate the highlighted entry and verify the published table’s name

    4. Choose the asset name to display additional details and properties about the table/asset.
  4. Email Alerts
    1. Once the asset is published to SageMaker Unified studio, you’ll receive an email alert sent with details of the published asset. Central governance teams can use this alert to review the published asset to ensure it aligns with the enterprise standards.

      Email alerts are sent to notify users when assets have been published

Cleanup

To clean up your resources, complete the following steps:

cdk destroy --profile <PIPELINE-PROFILE>

Conclusion

In this post, you learned how to build an automated notification system for Amazon SageMaker Unified Studio using AWS services. Specifically, we covered:

  • How to set up event-driven notifications from Amazon SageMaker Unified Studio leveraging Amazon EventBridge, AWS Lambda, and Amazon SNS
  • The step-by-step process of deploying the solution using AWS CDK
  • Practical examples of monitoring critical events like project creation and asset publishing
  • How to integrate AWS Lambda permissions with SageMaker Unified Studio for secure operations
  • Best practices for implementing governance controls through automated notifications

Amazon SageMaker Catalog helps governance teams stay informed of catalog activities in real-time, enabling them to maintain organizational standards as their Data and ML platforms scale. The architecture is flexible and can be extended to integrate with enterprise workflow tools like ServiceNow or to monitor additional event types based on your organization’s needs.

We look forward to hearing how you adapt this solution for your organization’s governance needs. Fork the CDK code from our repository and share your implementation experience in the comments below


About the Authors

Himanshu Sahni

Himanshu Sahni

Himanshu is a Senior Data and AI Architect in AWS Professional Services. Himanshu specializes in building Data and Analytics solutions for enterprise customers using AWS tools and services. He is an expert in AI/ ML and Big Data tools like Spark, AWS Glue and Amazon EMR. Outside of work, Himanshu likes playing chess and tennis.

Rajiv Upadhyay

Rajiv Upadhyay

Rajiv is a Data Architect at AWS, specialized in building Data and Analytics solutions for enterprise customers using AWS tools and services. He guides organizations through their digital transformation journey, with expertise in data lakes, data governance, and AI/ML solutions.

Jitesh Kumar

Jitesh Kumar

Jitesh is a Senior Customer Solutions Manager at Amazon Web Services (AWS), where he helps organizations realize the full potential of cloud technologies. Passionate about driving digital innovation, Jitesh combines deep technical knowledge with a customer-first mindset to guide enterprises through their cloud transformation journeys and deliver measurable business outcomes.

Track OTP success with AWS End User Messaging SMS feedback

Post Syndicated from Rommel Sunga original https://aws.amazon.com/blogs/messaging-and-targeting/track-otp-success-with-aws-end-user-messaging-sms-feedback/

In this post, we show how to implement message feedback for SMS one-time passwords (OTPs) using AWS End User Messaging. OTP verification through SMS is a fundamental component of modern authentication systems. Although sending OTPs follows an established pattern, tracking their delivery and usage presents several challenges. This post shows how to implement the AWS End User Messaging Message Feedback API to monitor OTP delivery and conversion rates effectively. This post highlights the Message Feedback API in an OTP use case; for practical examples and detailed guidance on building a secure OTP architecture, see Build a Secure One-Time Password Architecture with AWS.

Challenges with OTP tracking

Organizations commonly face these key challenges with OTP tracking:

  • Relying solely on Delivery Receipt (DLR) data for confirming message delivery, which is third-party carrier data that can be subject to interpretation by carriers or message providers, whereas conversion tracking through message feedback provides first-party data that can more accurately reflect actual message delivery and usage
  • Measuring accurate user authentication success rates
  • Identifying OTP verification issues across different geographic regions, carriers and delivery paths

To address these challenges, you can use the AWS End User Messaging Message Feedback API to track delivery and conversion rates, providing first-party data for more accurate insights into message delivery and usage patterns. Although OTP use cases are the most common and serve as our example implementation of message feedback, the same tracking logic can also be applied to other types of SMS conversions, such as promotional link clicks, shopping cart additions, account activations, appointment confirmations, and delivery notifications.

Solution overview

The OTP message flow consists of two main phases. Let’s first examine how the system handles the initial OTP request.

Phase 1: OTP request flow

When a customer initiates an OTP request, your system begins a carefully orchestrated process. First, your application receives this request and generates a unique OTP. With the OTP generated, your system prepares to send it through the AWS End User Messaging API, specifically enabling message feedback tracking by setting the MessageFeedbackEnabled parameter to true when calling SendTextMessage.

Upon successful sending, it returns a unique message ID, which your system must store alongside the generated OTP. This message ID serves as a crucial tracking identifier for the entire verification process. The message is then dispatched to the customer’s device, and your system enters a waiting state, ready to process the verification attempt.

The following diagram illustrates the OTP request flow.

OTP Request Flow Diagram

Phase 2: OTP verification flow

The verification process begins when the customer receives the OTP through SMS and submits it back to your system. Upon receiving the submission, your system first validates the OTP against the stored value. This verification step is critical, because its outcome determines how you will update the message feedback status.

If the customer successfully verifies the OTP, your system calls the PutMessageFeedback API with the stored message ID and sets the status to "RECEIVED", indicating successful delivery and usage of the OTP. However, if the verification fails or the customer doesn’t respond within the timeout period, your system sets the status to "FAILED".

If your system doesn’t explicitly update the feedback status within 1 hour, AWS automatically sets it to "FAILED".

The following diagram illustrates the OTP verification flow.

Prerequisites

Before you begin implementing OTP message feedback, make sure you have the following components and permissions in place:

Send SMS with message feedback enabled

You can enable message feedback in two ways. The first method is to use the MessageFeedbackEnabled parameter when sending an SMS, the second is to send a message with a configuration set with message feedback already enabled. Using a configuration set is often more convenient for bulk implementations because you don’t need to specify message feedback settings in each API call.

To send an SMS with message feedback enabled directly, you can use the following function:

import boto3

# Initialize the End User Messaging client
client = boto3.client('pinpoint-sms-voice-v2')

def send_otp_with_feedback():
    # Generate a unique OTP
    otp = generate_otp()  
    
    # Send SMS with feedback enabled
    response = client.send_text_message(
        DestinationPhoneNumber='+15555550123',  # Replace with your destination phone number
        OriginationIdentity='+14255550120',  # Replace with your origination identity
        MessageBody=f'Your verification code is: {otp}',
        MessageFeedbackEnabled=True
    )
    
    # Store OTP details for verification
    store_otp_details(response['MessageId'], otp)
    return response['MessageId']

The function uses the following details:

  • store_otp_details() is a placeholder function where you store the OTP details in a database for later retrieval
  • generate_otp() is a placeholder function where you generate your OTPs to send using SMS

If you prefer to use a configuration set with message feedback enabled, you can use the following alternative function:

def send_otp_with_feedback_using_configuration_set():
    # Initialize the End User Messaging client
    client = boto3.client('pinpoint-sms-voice-v2')
    
    # Generate OTP
    otp = generate_otp()
    
    # Send SMS using configuration set
    response = client.send_text_message(
        DestinationPhoneNumber='+15555550123',  # Replace with your destination phone number
        OriginationIdentity='pool-201d59fffd554bdfbaf9ee8aEXAMPLE',  # Replace with your origination identity
        MessageBody=f'Your verification code is: {otp}',
        ConfigurationSetName='example-us-east-configuration-set'  # Replace with your configuration set name
    )
    
    # Store OTP details for later verification
    store_otp_details(response['MessageId'], otp)
    
    return response['MessageId']

Your configuration set must have message feedback enabled to use this option. You can enable it using the AWS Command Line Interface (AWS CLI) with the following command:

aws pinpoint-sms-voice-v2 set-default-message-feedback-enabled \
--configuration-set-name "YourConfigSetName" \
--message-feedback-enabled

Another option is to use the AWS End User Messaging console, where you can enable message feedback under Set Settings for the desired configuration set.

Update feedback

After you send a message, you can update the message status to indicate whether a user has successfully completed an action, such as entering the OTP on your application or webpage:

def update_message_feedback(message_id: str, status: str) -> dict:
    try:
        # Initialize the End User Messaging client
        client = boto3.client('pinpoint-sms-voice-v2')
        
        # Update the message feedback status
        response = client.put_message_feedback(
            MessageId=message_id,
            MessageFeedbackStatus=status
        )
        
        return response
        
    except Exception as e:
        print(f"Error updating message feedback: {str(e)}")
        raise

# Example usage
message_id = "a1b2c3d4-5678-90ab-cdef-EXAMPLE11111"  # Replace with your message ID
status = "RECEIVED"  # Use "FAILED" for unsuccessful verifications

result = update_message_feedback(message_id, status)
print(f"Feedback status updated: {result}")

Verify feedback metrics

The AWS End User Messaging dashboard provides comprehensive metrics to help you monitor your OTP performance. The following metrics are available for customizable time periods:

  • Number of messages with feedback completion
  • Percentage of messages with feedback completion
  • Number of SMS with feedback completion by country

To review your application’s overall message feedback metrics, choose Dashboard in the AWS End User Messaging console navigation pane, then choose Message Feedback Metrics.

The dashboard presents three key metrics:

  • Number of messages with feedback completion – The count of SMS and MMS messages where the message feedback record is set to RECEIVED
  • Percentage of messages with feedback completion – The percentage of SMS and MMS messages where the message feedback record is set to RECEIVED
  • Number of SMS with feedback completion by country – The count of message feedback received by country

The progression to 100% completion indicates optimal system performance, where all sent OTPs were successfully received and verified by users, and the message feedback record is set to RECEIVED within the expected timeframe. This high completion rate suggests effective message delivery and a smooth user verification experience. Variations in completion rates across countries can help identify potential regional delivery challenges or user behavior patterns.

The 30% conversion starting point shown in this example is used for illustration purposes only, demonstrating messages that were intentionally left unconverted during testing.

Best practices for OTP implementation

For a secure and reliable OTP implementation, follow these best practices to balance security with user experience:

  • Include rate limiting to prevent abuse
  • Implement proper timeout mechanisms for OTPs
  • Make sure error handling provides clear feedback to users
  • Maintain comprehensive logging for security audits

Conclusion

By implementing the Message Feedback API for OTP tracking, you can gain valuable insights into your authentication system’s effectiveness in real time. This approach helps you monitor successful OTP usage and identify potential delivery issues that might affect user authentication, with granular metrics broken down by geographic regions. The data collected through message feedback offers a more accurate picture of actual user interactions compared to carrier-provided delivery receipts, helping you make data-driven decisions about your authentication system.

To build upon this foundation, consider implementing Amazon CloudWatch alerts for your conversion metrics, and optimizing your message templates based on performance data. The combination of real-time feedback, detailed analytics, and proactive monitoring can help make sure your OTP system remains both secure and efficient.

For additional implementation guidance and best practices, refer to the following resources:


About the authors

Configure seamless single sign-on with SQL analytics in Amazon SageMaker Unified Studio

Post Syndicated from Arun A K original https://aws.amazon.com/blogs/big-data/configure-seamless-single-sign-on-with-sql-analytics-in-amazon-sagemaker-unified-studio/

Amazon SageMaker Unified Studio provides a unified experience for using data, analytics, and AI capabilities. SageMaker Unified Studio now supports trusted identity propagation (TIP) for SQL workloads, enabling fine-grained data access control based on individual user identities. Organizations can use this integration to manage data permissions through AWS Lake Formation while using their existing single sign-on (SSO) infrastructure.

Organizations already using Amazon Redshift with TIP can extend their existing Lake Formation permissions to SageMaker Unified Studio. Users simply log in through SSO and access their authorized data using the SQL editor, maintaining consistent security controls across their analytics environment.

This post demonstrates how to configure SageMaker Unified Studio with SSO, set up projects and user onboarding, and access data securely using integrated analytics tools.

Solution overview

For our use case, a retail corporation is planning to implement sales analytics to identify sales patterns and product categories that are doing well. This will help the sales team improve on sales planning with targeted promotions and help the finance team plan budgeting with better inventory management. The corporation stores a customer table in an Amazon Simple Storage Service (Amazon S3) data lake and a store_sales table in a Redshift cluster.

The corporation uses SageMaker Unified Studio as the UI, with users onboarded from their identity provider (IdP) to AWS IAM Identity Center with TIP. Amazon SageMaker Lakehouse centralizes data from Amazon S3 and Amazon Redshift, and Lake Formation provides fine-grained access control based on user identity. For our example use case, we explore two different users. The following table summarizes their roles, the tools they use, and their data access.

User Group Tool Data Access
Ethan (Data Analyst) Sales Amazon Athena for interactive SQL analysis Non-sensitive customer data (id, c_country, birth_year) and store_sales full table access
Frank (BI Analyst) Finance Amazon Redshift for reports and visualization US customer data (c_country='US')

The following diagram illustrates the solution architecture.

SageMaker Unified Studio with IAM Identity Center simplifies the user journey from authentication to data analysis. The workflow consists of the following steps:

  1. Users sign in with organizational SSO credentials through their IdP and are redirected to SageMaker Unified Studio.
  2. Users configure IAM Identity Center authentication for Amazon Redshift, linking identity management with data access.
  3. Users access the query editor for Amazon Redshift or SageMaker Lakehouse, triggering IAM Identity Center federation to generate session and access tokens.
  4. SageMaker Unified Studio retrieves user authorization details and group membership using the session token.
  5. Users are authenticated as IAM Identity Center users, ready to explore and analyze data using Amazon Redshift and Amazon Athena.

To implement our solution, we walk through the following high-level steps:

  1. Set up SageMaker Lakehouse resources.
  2. Create a SageMaker Unified Studio domain with SSO and TIP enabled.
  3. Configure Amazon Redshift for TIP and validate access.
  4. Validate data access using Amazon Athena.

Prerequisites

Before you begin implementing the solution, you must have the following in place:

  1. If you don’t have an AWS account, you can sign up for one.
  2. We provide utility scripts to help set up various sections of the post. To use them:
    1. Right-click this link and save the utility scripts zip file.
    2. Unzip the file to a terminal that has the AWS Command Line Interface (AWS CLI) configured. You can also use AWS CloudShell.
    3. Run the scripts only when prompted in the relevant sections.
    Note: The utility scripts are configured for
    us-east-1 region. If you prefer another region, edit the region in the scripts before running them.
  3. To deploy the infrastructure, right-click this link and select ‘Save Link As’ to save it as sagemaker-unified-studio-infrastructure.yaml. Then upload the file when creating a new stack in the AWS CloudFormation console, which will create the following resources:
    1. An S3 bucket to hold the customer data used in this post.
    2. An AWS Identity and Access Management (IAM) role called DataTransferRole with permissions as defined in Prerequisites for managing Amazon Redshift namespaces in the AWS Glue Data Catalog.
    3. An IAM role called IAMIDCRedshiftRole, which will be used later to set up the IAM Identity Center Redshift application.
    4. An IAM role called LakeFormationRegistrationRole, following the instructions in Requirements for roles used to register locations, and necessary IAM policies.
  4. If you don’t have a Lake Formation user, you can create one. For this post, we use an admin user. For instructions, see Create a data lake administrator.
  5. If IAM Identity Center is not enabled, refer to Enabling AWS IAM Identity Center for instructions to enable it.
    1. If you need to migrate existing Redshift users and groups, use the IAM Identity Center Redshift migration utility.
    2. For a quick way to test the feature and familiarize yourself with the process, we provide a script to generate mock users and groups. Run the setup-idc.sh script, which is provided in Step 2, to create test users and groups in IAM Identity Center for demonstration purposes.
  6. Integrate IAM Identity Center with Lake Formation. For instructions, see Connecting Lake Formation with IAM Identity Center.
  7. Register the S3 bucket as a data lake location:
    1. On the Lake Formation console, choose Data lake locations in the navigation pane.
    2. Choose Register location.
    3. For the role, use LakeFormationRegistrationRole.
  8. Create an IAM Identity Center Redshift application, as detailed in our previous post:
    1. On the Amazon Redshift console, choose IAM Identity Center connections in the navigation pane and choose Create application.
    2. For both the display name and application name, enter redshift-idc-app.
    3. Set the IdP namespace to awsidc.
    4. Choose IAMIDCRedshiftRole as the IAM role.
    5. Choose Next to create the application.
    6. Take note of the application Amazon Resource Name (ARN) to use in subsequent steps. The ARN format is arn:aws:sso::<ACCOUNT_NUMBER>:application/ssoins-<RANDOM_STRING>/apl-<RANDOM_STRING>.
  9. If you don’t have existing Redshift tables to work with, run the script setup-producer-redshift.sh, which is provided in Step 2, to create a producer namespace and workgroup, set up a sample sales database, and generate necessary tables with test data.
  10. The post also uses simulated customer data stored in the AWS Glue Data Catalog. To set up this data and configure the necessary Lake Formation permissions, run the setup-glue-tables-and-access.sh script provided in Step 2.

Set up SageMaker Lakehouse resources

In this section, we configure the foundational lakehouse resources required for SageMaker to access and analyze data across multiple storage systems. We’ll register the Redshift instance to the AWS Glue Data Catalog to make warehouse data discoverable and establish Lake Formation permissions on lakehouse resources for user identities to ensure secure, governed access to both data lake and data warehouse resources from within SageMaker environments.

Register Redshift instance to the Data Catalog

In this step, we use the store_sales data, which we created earlier using the setup-producer-redshift.sh script. You can register entire clusters to the Data Catalog and create catalogs managed by AWS Glue. To register a cluster to the Data Catalog, complete the following steps:

  1. On the Lake Formation console, choose Administrative roles and tasks in the navigation pane.
  2. Under Data lake administrators, choose Add.
  3. Choose Read-only administrator, then choose AWSServiceRoleForRedshift.
  4. On the Amazon Redshift console, open your namespace.
  5. On the Actions dropdown menu, chose Register with AWS Glue Data Catalog, then choose Register.
  6. Sign in to the Lake Formation console as the data lake administrator and choose Catalogs in the navigation pane.
  7. Under Pending catalog invitations, select the namespace and accept the invitation by choosing Approve and create catalog.
  8. Provide the name for the catalog as salescatalog.
  9. Select Access this catalog from Apache Iceberg compatible engines, choose DataTransferRole for the IAM role, then choose Next.
  10. Choose Add permissions and choose the admin IAM role under IAM users and roles.
  11. Select Super user for catalog permissions and choose Add.
  12. Choose Next.
  13. Choose Create catalog.

Set up Lake Formation permission on lakehouse resources for user identities

In this section, we configure Lake Formation permissions to enable secure access to lakehouse resources for federated user identities. Lake Formation provides fine-grained access control that works seamlessly with IAM Identity Center, allowing you to manage permissions centrally while maintaining security boundaries.

We’ll focus on granting database access to IAM Identity Center groups in Lake Formation and setting table-level permissions for federated Redshift catalog tables. These permissions form the security foundation for our federated query architecture, enabling users to seamlessly access both S3 data lake and Redshift data warehouse resources through a unified interface.

Grant database access to IAM Identity Center groups in Lake Formation

After you share your Redshift catalog with the Data Catalog and integrate with Lake Formation, you must grant appropriate database access. Follow these steps to set up permissions on your data lake resources for corporate identities:

  1. On the Lake Formation console, under Permissions in the navigation pane, choose Data permissions.
  2. Choose Grant.
  3. Select Principals for Principal type.
  4. Under Principals, select IAM Identity Center and choose Add.
  5. In the pop-up window, if this is your first time assigning users and groups, choose Get started.
  6. Search for and select the IAM Identity Center groups awssso-sales and awssso-finance.
  7. Choose Assign.
  8. Under LF-Tags or catalog resources, choose Named Data Catalog resources.
    1. Choose <accountid>:salescatalog/dev for Catalogs.
    2. Choose sales_schema for Database.
  9. Under Database permissions, select Describe.
  10. Choose Grant to apply the permissions.

Grant table-level permissions for federated Redshift catalog tables

Complete the following steps to grant table permissions to the IAM Identity Center groups:

  1. On the Lake Formation console, under Permissions in the navigation pane, choose Data permissions.
  2. Choose Grant.
  3. Select Principals for Principal type.
  4. Under Principals, select IAM Identity Center and choose Add.
  5. In the pop-up window, if this is your first time assigning users and groups, choose Get started.
  6. Search for and select the IAM Identity Center group awssso-sales.
  7. Choose Assign.
  8. Under LF-Tags or catalog resources, choose Named Data Catalog resources.
    1. Choose <accountid>:salescatalog/dev for Catalogs.
    2. Choose sales_schema for Database.
    3. Choose store_sales for Table.
  9. Select Select and Describe for Table permissions.
  10. Choose Grant to apply the permissions.

Create a SageMaker Unified Studio domain with SSO and TIP enabled

For instructions to create a SageMaker Unified Studio domain, refer to Create an Amazon SageMaker Unified Studio domain – quick setup. Because your IAM Identity Center integration is already complete, you can specify an IAM Identity Center user in the domain configuration settings.

Enable TIP in SageMaker Unified Studio

Complete the following steps to enable TIP in SageMaker Unified Studio:

  1. On the SageMaker console, use the AWS Region selector in the top navigation bar to choose the appropriate Region.
  2. Choose View domains and choose the domain’s name from the list.
  3. On the domain’s details page, on the Project profiles tab, choose a project profile, for example, SQL analytics.
  4. Select SQL analytics and choose Edit.
  5. In the Blueprint parameters section, select enableTrustedIdentityPropagationPermissions and choose Edit.
  6. Update the value as true.
  7. To enforce authorization-based on TIP, the SageMaker Unified Studio admin can make this parameter non-editable.
  8. Choose Save.

Enable user access for SageMaker Unified Studio domain

Complete the following steps to enable user access for the SageMaker Unified Studio domain:

  1. Open the SageMaker console in the appropriate Region and choose Domains in the navigation pane.
  2. Choose an existing SageMaker Unified Studio domain where you want to add SSO user access.
  3. On the domain’s details page, on the User management tab, in the Users section, choose Add and Add SSO users and groups.
  4. Choose the user (for this post, we add the user Frank) from the dropdown list and choose Add users and groups.

Add project members

SageMaker Unified Studio projects facilitate team collaboration for different business initiatives. As the project owner, Ethan now can add Frank as a team member to enable their collaboration. To add members to an existing project, complete the following steps:

  1. Sign in to the SageMaker Unified Studio console using the SSO credentials of who owns the project (for this post, Ethan).
  2. Choose Select a project.
  3. Choose the project you want to edit.
  4. On the Project overview page, expand Actions and choose Manage members.
  5. Choose Add members.
  6. Enter the name of the user or group you want to add (for this post, we add Frank).
  7. Select Contributor if you want to add the project member as a contributor.
  8. (Optional) Repeat these steps to add more project members. You can add up to eight project members at a time.
  9. Choose Add members.

Create a SQL analytics project in Unified Studio

In this step, we federate into SageMaker Unified Studio and create a project using SQL analytics. Complete the following steps:

  1. Federate into SageMaker Unified Studio using your IAM Identity Center credentials:
    1. On the SageMaker console, choose Domains in the navigation pane.
    2. Copy the SageMaker Unified Studio URL for your domain and enter it into a new browser window.
    3. Choose Sign in with SSO.
    4. A browser pop-up will redirect you to your preferred IdP login page, where you enter your IdP credentials.
    5. If authentication if successful, you will be redirected to SageMaker Unified Studio.
  2. After logging in, choose Create project.
  3. Enter a name for your project. This project name is final and can’t be changed later.
  4. (Optional) Enter a description for your project. You can edit this later.
  5. Choose a project profile. For this demo, we choose the SQL analytics profile from the available templates.
  6. Leave the default values as they are or modify them according to your use case, then choose Continue.
  7. Choose Create project to finalize the project and initialize your SQL analytics workspace.

For more detailed information and advanced configurations, refer to Create a project.

Configure Amazon Redshift for TIP and validate access

Run the setup-consumer-redshift.sh script (provided in the prerequisites). This script will create a new namespace and workgroup and add the required tags, which you will use later to integrate with SageMaker Unified Studio compute.

If you are creating the cluster manually, add one of the following tags to the Redshift cluster or workgroup that you want to add to SageMaker Unified Studio:

  • Option 1 – Add a tag to allow only a specific SageMaker Unified Studio project to access it: AmazonDataZoneProject=<projectID>
  • Option 2 – Add a tag to allow all SageMaker Unified Studio projects in this account to access it: for-use-with-all-datazone-projects=true

Create compute using IAM Identity Center authentication

After you set up your project, the next step is to establish a compute resource connection on the SageMaker Unified Studio console. Follow these steps to add either Amazon Redshift Serverless or a provisioned cluster to your project environment:

  1. Go to the Compute section of your project in SageMaker Unified Studio.
  2. On the Data warehouse tab, choose Add compute.
  3. You can create a new compute resource or choose an existing one. For this post, we choose Connect to existing compute resources, then choose Next.
  4. Choose the type of compute resource you want to add, then choose Next. For this post, we choose Redshift Serverless.
  5. Under Connection properties, provide the JDBC URL or the compute you want to add, which is integrated with IAM Identity Center. If the compute resource is in the same account as your SageMaker Unified Studio project, you can select the compute resource from the dropdown menu. In our example, we use the consumer account that was just provisioned.
  6. Under Authentication, select IAM Identity Center.
  7. For Name, enter the name of the Redshift Serverless or provisioned cluster you want to add.
  8. For Description, enter a description of the compute resource.
  9. Choose Add compute.

The SageMaker Unified Studio Project Compute and Data pages will now display information for that resource.

If everything is configured correctly, your compute will be created using IAM Identity Center. Because your IdP credentials are already cached while you’re logged in to SageMaker Unified Studio, it uses the same credentials and creates the compute.

Test data access using Amazon Redshift

When Ethan logs in to SageMaker Unified Studio using IAM Identity Center authentication, he successfully federates and can access customer data from all countries but only for non-sensitive columns. Let’s connect to Amazon Redshift in SageMaker Unified Studio by following these steps:

  1. Choose Actions and choose Open Query editor.
  2. Choose Redshift in the Data explorer pane.
  3. Run the customer sales calculation query to observe that user Ethan (a data analyst) can access customer data from all countries but only non-sensitive columns (id, birth_country, product_id):
    select current_user, c.*, sum(s.sales_amount) as total_sales
    from "awsdatacatalog"."customerdb"."customer" c
    join "dev@salescatalog"."sales_schema"."store_sales" s 
    on c.id=s.id
    group by all;

You have successfully configured Redshift to use IAM Identity Center authentication in SageMaker Unified Studio.

Validate data access using Amazon Athena

When Frank logs in to SageMaker Unified Studio using IAM Identity Center authentication, he successfully federates and can access customer data only for the United States. To query with Athena, complete the following steps:

  1. Choose Actions and choose Open Query editor.
  2. Choose Lakehouse in the Data explorer pane.
  3. Explore AwsDataCatalog, expand the database, choose the respective table, and on the options menu (three dots), choose Preview data.

The following demonstration illustrates how user Frank, a BI analyst, can perform SQL analysis using Athena. Due to row-level filtering implemented through Lake Formation, Frank’s access is restricted to customer data from the United States only. Additionally, you can observe that in the Data explorer pane, Frank can only view the customerdb database. The dev@salescatalog database is not visible to Frank because no access has been granted to his respective group from Lake Formation.

The IAM Identity Center authentication integration is complete; you can use both Amazon Redshift and Athena through SageMaker Unified Studio in a simplified, all-in-one interface.Note that, at the time of writing, Athena doesn’t work with Redshift Managed Storage (RMS).

Clean up

Complete the following steps to clean up the resources you created as part of this post:

  1. Delete the data from the S3 bucket.
  2. Delete the Data Catalog objects.
  3. Delete the Lake Formation resources and Athena account.
  4. Delete the SageMaker Unified Studio project and associated domain.
  5. If you created new Redshift cluster for testing this solution, delete the cluster.

Conclusion

In this post, we provided a comprehensive guide to enabling trusted identity propagation within SageMaker Unified Studio. We covered the setup of a SageMaker Unified Studio domain with SSO, the creation of tailored projects, efficient user onboarding with appropriate permissions, and the management of AWS Glue and Amazon Redshift managed catalog permissions using Lake Formation. Through practical examples, we demonstrated how to use both Amazon Redshift and Athena within SageMaker Unified Studio, showcasing secure data access and analysis capabilities. This approach helps organizations maintain strict identity controls while helping data scientists and analysts derive valuable insights from both data lake and data warehouse environments, supporting both security and productivity in machine learning workflows.

For more information on this integration, refer to Trusted identity propagation.


About the authors

Maneesh Sharma

Maneesh Sharma

Maneesh is a Sr. Architect at AWS with 15 years of experience designing and implementing large-scale data warehouse and analytics solutions. He works closely with customers to help them modernize their legacy applications to AWS cloud-based platforms.

Srividya Parthasarathy

Srividya Parthasarathy

Srividya is a Senior Big Data Architect with Amazon SageMaker Lakehouse. She works with the product team and customers to build robust features and solutions for their analytical data platform. She enjoys building data mesh solutions and sharing them with the community.

Arun A K

Arun A K

Arun is a Senior Big Data Specialist Solutions Architect at Amazon Web Services. He helps customers design and scale data platforms that power innovation through analytics and AI. Arun is passionate about exploring how data and emerging technologies can solve real-world problems. Outside of work, he enjoys sharing knowledge with the tech community and spending time with his family.

Zero downtime blue/green deployments with Amazon API Gateway

Post Syndicated from Biswanath Mukherjee original https://aws.amazon.com/blogs/compute/zero-downtime-blue-green-deployments-with-amazon-api-gateway/

Modern applications require deployment strategies that minimize downtime and reduce risk. Blue/green deployment is a strategy that reduces downtime and risk by running two identical production environments called “blue” and “green”. At any given time, only one environment serves live production traffic while the other remains idle. This strategy provides immediate fallback to the previous stable version if issues arise after the new deployment. Let’s say a company is deploying a new version of its application. The following diagram shows the blue/green deployment strategy they are using.

Complete blue/green deployment strategy, including testing, monitoring, and conditional rollback procedures

As shown in the preceding diagram, current production traffic is served by the blue environment. During deployment of the new version of the application, the following sequence of activities happens:

  1. Deploy the new version of the application: Deploy the new version to the green environment.
  2. Test thoroughly: Test the new version in the green environment by invoking the API invoke URL from API Gateway. This does not affect production traffic, which continues to be served by the blue environment.
  3. Switch traffic: After you have thoroughly tested the green environment, redirect all production traffic from the blue to the green environment.
  4. Monitor and take any necessary action: Continue to monitor the green environment as it serves production traffic. Keep the blue environment ready for immediate rollback to the previous stable version, in case any issues arise in the green environment. At this point, one of two possible outcomes happens:
    1. If you identify any issues with the green environment in production, roll back to the previous stable version of the blue environment and fix the green environment before retrying.
    2. If you observe no issues with the green environment, decommission the blue environment. The green environment is now the new blue environment, the environment with stable production version of the application serving live traffic.

In this post, you learn how to implement blue/green deployments by using Amazon API Gateway for your APIs. For this post, we use AWS Lambda functions on the backend. However, you can follow the same strategy for other backend implementations of the APIs. All the required infrastructure is deployed by using AWS Serverless Application Model (AWS SAM).

Solution overview

As you follow along with this post, you will implement the following blue/green deployment architecture by using API Gateway custom domain API mapping. You use API mappings to connect API stages to a custom domain name. After you create a domain name and configure DNS records, you use API mappings to send traffic to your APIs through your custom domain name.

AWS serverless architecture showing blue /green deployment using Amazon API Gateway custom domain

As shown in the preceding diagram, the blue/green deployment architecture includes four primary AWS services – Amazon Route 53, Amazon API Gateway, AWS Lambda functions, and AWS Certificate Manager (ACM). When you send a request to the API, the Route 53 resolves the domain to the API Gateway custom domain. API Gateway handles HTTPS termination by using a configured ACM certificate. API Gateway examines the incoming request path and headers to route the request to the active environment.

You first set up the blue environment along with the Route 53 DNS configuration, API Gateway custom domain mapping, ACM and test it with Route 53 URL. This is your production environment serving live traffic. After that, deploy a new version of the application in the green environment and test it by invoking the API invoke URL from API Gateway while live traffic is still being served from the blue environment. Then, switch the traffic from the blue environment to the green environment by using API Gateway custom domain API mapping. This ensures that there is no change in the external (client-facing) API custom domain URL. Live traffic is now served by the green environment. If you observe any issues during this time, you can quickly roll back to the blue environment and fix the green environment. If the green environment is stable, you can decommission the blue environment.

This post uses two separate regional API endpoints to simulate blue/green environments and traffic routing between them but you can this same architectural pattern using single API endpoint with two stages representing blue and green environments.

Prerequisites

Complete the following prerequisites before you start setting up the solution:

Set up and test the solution

Note that this is a sample project to understand the concept and not for direct usage in production. The sample project contains three APIs.

  • Health GET API to know the current health of the environment and which environment the request was served from.
  • Pets GET API to get the list of available pets.
  • Order POST API to place a pet order.

Follow the steps below to setup blue/green deployment and test it.

  1. Clone the repository and navigate to the directory (all commands run from here)
    Clone the GitHub repository in a new folder and navigate to the stacks folder.

    git clone https://github.com/aws-samples/sample-blue-green-deployment-with-api-gateway.git
    cd sample-blue-green-deployment-with-api-gateway/stacks

  2. Deploy the blue environment
    You will first setup the blue environment. Run the following commands to deploy the blue environment:

    sam build -t blue-stack.yaml
    sam deploy -g -t blue-stack.yaml

    Enter the following details:

    • Stack name: The CloudFormation stack name (for example, blue-green-api-blue)
    • AWS Region: A supported AWS Region (for example, us-east-1)
    • BlueLambdaFunction has no authentication. Is this okay?: y
    • SAM configuration file: blue-samconfig.toml

    Keep everything else set to their default values. You will use the SAM deploy output for the subsequent steps. Going forward, you can run the following command to deploy the blue environment resources:

    sam build -t blue-stack.yaml
    sam deploy -t blue-stack.yaml --config-file blue-samconfig.toml

  3. Test the blue environment

    Run the following commands to test the blue environment after replacing ApiEndpoint with BlueApiEndpoint from the SAM deploy output in each case. First, test Health check API to know the health of the environment. Run the following command.

    curl --request GET \ 
    --url https://<ApiEndpoint>/health

    Sample response:

    {
      "status": "healthy", 
      "environment": "blue", 
      "version": "v1.0.0", 
      "timestamp": "2025-09-05T13:11:11.248267Z"
    }

    Second, test the pets GET API request to get the list of available pets. Run the following command.

    curl --request GET \ 
    --url https://<ApiEndpoint>/pets

    Sample response:

    {
      "environment": "blue",
      "version": "v1.0.0",
      "pets": [
        {
          "id": 1,
          "name": "Buddy",
          "category": "dog",
          "status": "available"
        },
        {
          "id": 2,
          "name": "Whiskers",
          "category": "cat",
          "status": "available"
        },
        {
          "id": 3,
          "name": "Charlie",
          "category": "bird",
          "status": "pending"
        }
      ]
    }

    Now, test create order POST API to place an order for a pet:

    curl --request POST \
      --url https://<ApiEndpoint>/orders \
      --header 'content-type: application/json' \
      --data '{
      "id": 1,
      "name": "Buddy"
    }'

    Expected response:

    {
      "confirmationNumber": "ORD-3251C0F4", 
      "environment": "blue",
      "version": "v1.0.0",
      "timestamp": "2025-09-05T13:16:04.703666Z", 
      "data": 
      {
        "id": 1, 
        "name": "Buddy", 
        "status": "ordered"
      }
    }
    

    Check that the response contains the environment attribute set to blue and the version attribute set to v1.0.0

  4. Deploy API Gateway custom domain pointing to the blue environment

    Run the following commands to deploy Amazon API Gateway custom domain with API mapping pointing to the blue environment created in the previous step.

    sam build -t custom-domain-stack.yaml
    sam deploy -g -t custom-domain-stack.yaml

    Enter the following details:

    • Stack name: (for example, blue-green-api-custom-domain)
    • AWS Region: A supported AWS Region (for example, us-east-1)
    • PublicHostedZoneId: The Route 53 public hosted zone ID (for example, ABXXXXXXXXXXXXXXXXXYZ)
    • CustomDomainName: The Route 53 domain name (for example, api.example.com)
    • CertificateArn: The ACM certificate ARN (for example, arn:aws:acm:us-east-1:123456789012:certificate/abc123)
    • ActiveApiId: The value of the BlueApiId output from the blue-stack deployment
    • ActiveApiStage: The value of the BlueApiStage output from the blue-stack deployment
    • SAM configuration file: custom-domain-samconfig.toml

    Keep everything else to their default values. You will use the SAM deploy output for the subsequent steps. At this point the production (live) traffic is routed to blue environment.

  5. Test the production (live) traffic which is routed to blue environment

    Follow the test method mentioned in step 3 to test the production environment, but replace ApiEndpoint with CustomDomainUrl. Check that the production environment response contains the environment attribute set to blue and the version attribute set to v1.0.0

  6. Deploy the green environment

    You will now deploy the v2.0.0 of the application on green environment. Run the following commands to deploy the green environment:

    sam build -t green-stack.yaml
    sam deploy -g -t green-stack.yaml

    Enter the following details:

    • Stack name: (for example, blue-green-api-green)
    • AWS Region: Select the same Region as the blue environment (for example, us-east-1)
    • GreenLambdaFunction has no authentication. Is this okay?: y
    • SAM configuration file: green-samconfig.toml

    Keep everything else to default values. You will use the SAM deploy output for the subsequent steps. Going forward, you can run the following commands to deploy the green environment.

    sam build -t green-stack.yaml
    sam deploy -t green-stack.yaml --config-file green-samconfig.toml
    

  7. Test the green environment
    Follow the test method shown in step 3 to test the production environment, but replace ApiEndpoint with GreenApiEndpoint. Validate that the response contains the environment attribute set to green and the version attribute set to v2.0.0
  8. Switch the live traffic to the green environment
    Run the following command to switch live traffic to the green environment:

    sam deploy -g -t custom-domain-stack.yaml  --config-file custom-domain-samconfig.toml

    Enter the following details:

    • Stack name: Keep it as it is.
    • AWS Region: Keep it as it is.
    • PublicHostedZoneId: Keep it as it is.
    • CustomDomainName: Keep it as it is.
    • CertificateArn: Keep it as it is.
    • ActiveApiId: The value of GreenApiEndpoint output from the green-stack deployment
    • ActiveApiStage: The value of GreenApiStage output from the green-stack deployment
    • SAM configuration file: Keep it as it is.

    Keep everything else at their default values.

  9. Test the production environment (now green) again

    Follow the test method shown in step 3 to test the production environment (now green) again, and be sure to replace ApiEndpoint with CustomDomainUrl from SAM deploy output. Validate that the response now contains the environment attribute set to green and the version attribute set to v2.0.0. Note that it may take a minute or two for the change to be seen due to local DNS caching, during this time some of the traffic may be still served from the blue environment. After switching the live traffic to the green environment, if there is an issue, you can switch the live traffic back to the blue environment and fix the green environment. Depending on whether you need to roll back to the previous stable blue environment or decommission the blue environment when you no longer need it, follow either step 10 or 11.

  10. (Option 1) Roll back to the blue environment, if necessary
    Run the following command to roll back to the blue environment, if necessary.

    sam deploy -g -t custom-domain-stack.yaml  --config-file custom-domain-samconfig.toml

    Enter the following details:

    • Stack name: Keep it as it is.
    • AWS Region: Keep it as it is.
    • PublicHostedZoneId: Keep it as it is.
    • CustomDomainName: Keep it as it is.
    • CertificateArn: Keep it as it is.
    • ActiveApiId: Value of BlueApiEndpoint output from the blue-stack deployment.
    • ActiveApiStage: The value of BlueApiStage output from the blue-stack deployment.
    • SAM configuration file: Keep it as it is.

    Keep everything else to their default values. Live traffic is switched to the blue environment. You can confirm that by following step 3.

  11. (Option 2) Decommission the blue environment when you no longer need it
    Run the following command to decommission (delete) the blue environment when you no longer need it. Replace blue-stack-name with your blue deployment stack name:

    sam delete --stack-name <blue-stack-name> --no-prompts

Clean up

To avoid costs, remove all resources created along this post once you’re done.

Run the following command after replacing the <placeholder> variables to delete the resources you deployed for this post’s solution:

# Delete all stacks (in reverse order)
# Delete custom domain
sam delete --stack-name <api-custom-domain-stack-name> --no-prompts
# Delete green stack
sam delete --stack-name <green-stack-name> --no-prompts
# Delete blue stack, if already not deleted in step 10
sam delete --stack-name <blue-stack-name> --no-prompts

Conclusion

Blue/green deployments with API Gateway provide a robust, scalable solution for zero-downtime deployments that deliver significant technical and operational advantages. This post’s solution architecture enables traffic switching at the API Gateway level while maintaining complete isolation between the blue and green environments to prevent interference. The solution offers immediate rollback capabilities for quick issue resolution and supports comprehensive testing through production-like validation before any traffic switching occurs.

Following this solution you can build a solid foundation for production blue/green deployments for your serverless microservice architecture that maintains the flexibility to adapt to your specific requirements while ensuring reliability, scalability, and operational excellence. To learn more about serverless architectures see Serverless Land.