Post Syndicated from The History Guy: History Deserves to Be Remembered original https://www.youtube.com/watch?v=70rcQ5MhRfA
Yearly Archives: 2024
Introducing Netflix’s Key-Value Data Abstraction Layer
Post Syndicated from Netflix Technology Blog original https://netflixtechblog.com/introducing-netflixs-key-value-data-abstraction-layer-1ea8a0a11b30
Vidhya Arvind, Rajasekhar Ummadisetty, Joey Lynch, Vinay Chella
Introduction
At Netflix our ability to deliver seamless, high-quality, streaming experiences to millions of users hinges on robust, global backend infrastructure. Central to this infrastructure is our use of multiple online distributed databases such as Apache Cassandra, a NoSQL database known for its high availability and scalability. Cassandra serves as the backbone for a diverse array of use cases within Netflix, ranging from user sign-ups and storing viewing histories to supporting real-time analytics and live streaming.
Over time as new key-value databases were introduced and service owners launched new use cases, we encountered numerous challenges with datastore misuse. Firstly, developers struggled to reason about consistency, durability and performance in this complex global deployment across multiple stores. Second, developers had to constantly re-learn new data modeling practices and common yet critical data access patterns. These include challenges with tail latency and idempotency, managing “wide” partitions with many rows, handling single large “fat” columns, and slow response pagination. Additionally, the tight coupling with multiple native database APIs — APIs that continually evolve and sometimes introduce backward-incompatible changes — resulted in org-wide engineering efforts to maintain and optimize our microservice’s data access.
To overcome these challenges, we developed a holistic approach that builds upon our Data Gateway Platform. This approach led to the creation of several foundational abstraction services, the most mature of which is our Key-Value (KV) Data Abstraction Layer (DAL). This abstraction simplifies data access, enhances the reliability of our infrastructure, and enables us to support the broad spectrum of use cases that Netflix demands with minimal developer effort.
In this post, we dive deep into how Netflix’s KV abstraction works, the architectural principles guiding its design, the challenges we faced in scaling diverse use cases, and the technical innovations that have allowed us to achieve the performance and reliability required by Netflix’s global operations.
The Key-Value Service
The KV data abstraction service was introduced to solve the persistent challenges we faced with data access patterns in our distributed databases. Our goal was to build a versatile and efficient data storage solution that could handle a wide variety of use cases, ranging from the simplest hashmaps to more complex data structures, all while ensuring high availability, tunable consistency, and low latency.
Data Model
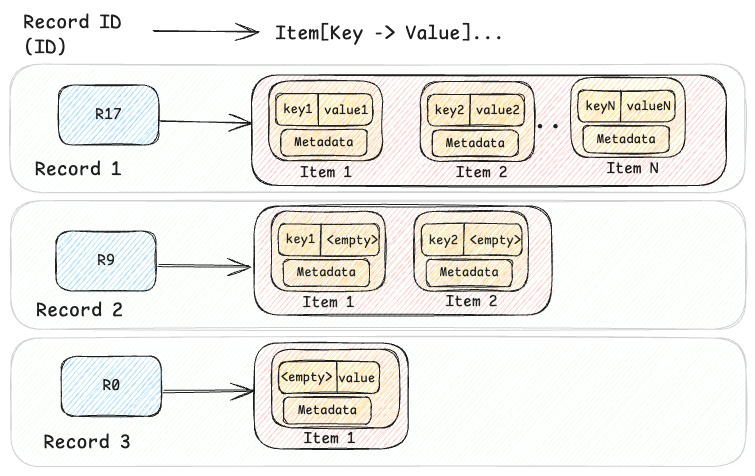
At its core, the KV abstraction is built around a two-level map architecture. The first level is a hashed string ID (the primary key), and the second level is a sorted map of a key-value pair of bytes. This model supports both simple and complex data models, balancing flexibility and efficiency.
HashMap<String, SortedMap<Bytes, Bytes>>
For complex data models such as structured Records or time-ordered Events, this two-level approach handles hierarchical structures effectively, allowing related data to be retrieved together. For simpler use cases, it also represents flat key-value Maps (e.g. id → {"" → value}) or named Sets (e.g.id → {key → ""}). This adaptability allows the KV abstraction to be used in hundreds of diverse use cases, making it a versatile solution for managing both simple and complex data models in large-scale infrastructures like Netflix.
The KV data can be visualized at a high level, as shown in the diagram below, where three records are shown.
message Item (
  Bytes    key,
  Bytes    value,
  Metadata metadata,
  Integer  chunk
)
Database Agnostic Abstraction
The KV abstraction is designed to hide the implementation details of the underlying database, offering a consistent interface to application developers regardless of the optimal storage system for that use case. While Cassandra is one example, the abstraction works with multiple data stores like EVCache, DynamoDB, RocksDB, etc…
For example, when implemented with Cassandra, the abstraction leverages Cassandra’s partitioning and clustering capabilities. The record ID acts as the partition key, and the item key as the clustering column:

The corresponding Data Definition Language (DDL) for this structure in Cassandra is:
CREATE TABLE IF NOT EXISTS <ns>.<table> (
  id             text,
  key            blob,
  value          blob,
  value_metadata blob,

PRIMARY KEY (id, key))
WITH CLUSTERING ORDER BY (key <ASC|DESC>)
Namespace: Logical and Physical Configuration
A namespace defines where and how data is stored, providing logical and physical separation while abstracting the underlying storage systems. It also serves as central configuration of access patterns such as consistency or latency targets. Each namespace may use different backends: Cassandra, EVCache, or combinations of multiple. This flexibility allows our Data Platform to route different use cases to the most suitable storage system based on performance, durability, and consistency needs. Developers just provide their data problem rather than a database solution!
In this example configuration, the ngsegment namespace is backed by both a Cassandra cluster and an EVCache caching layer, allowing for highly durable persistent storage and lower-latency point reads.
"persistence_configuration":[
  {
    "id":"PRIMARY_STORAGE",
    "physical_storage": {
      "type":"CASSANDRA",
      "cluster":"cassandra_kv_ngsegment",
      "dataset":"ngsegment",
      "table":"ngsegment",
      "regions": ["us-east-1"],
      "config": {
        "consistency_scope": "LOCAL",
        "consistency_target": "READ_YOUR_WRITES"
      }
    }
  },
  {
    "id":"CACHE",
    "physical_storage": {
      "type":"CACHE",
      "cluster":"evcache_kv_ngsegment"
     },
     "config": {
       "default_cache_ttl": 180s
     }
  }
]
Key APIs of the KV Abstraction
To support diverse use-cases, the KV abstraction provides four basic CRUD APIs:
PutItems — Write one or more Items to a Record
The PutItems API is an upsert operation, it can insert new data or update existing data in the two-level map structure.
message PutItemRequest (
  IdempotencyToken idempotency_token,
  string           namespace,
  string           id,
  List<Item>       items
)
As you can see, the request includes the namespace, Record ID, one or more items, and an idempotency token to ensure retries of the same write are safe. Chunked data can be written by staging chunks and then committing them with appropriate metadata (e.g. number of chunks).
GetItems — Read one or more Items from a Record
The GetItemsAPI provides a structured and adaptive way to fetch data using ID, predicates, and selection mechanisms. This approach balances the need to retrieve large volumes of data while meeting stringent Service Level Objectives (SLOs) for performance and reliability.
message GetItemsRequest (
  String              namespace,
  String              id,
  Predicate           predicate,
  Selection           selection,
  Map<String, Struct> signals
)
The GetItemsRequest includes several key parameters:
- Namespace: Specifies the logical dataset or table
- Id: Identifies the entry in the top-level HashMap
- Predicate: Filters the matching items and can retrieve all items (match_all), specific items (match_keys), or a range (match_range)
- Selection: Narrows returned responses for example page_size_bytes for pagination, item_limit for limiting the total number of items across pages and include/exclude to include or exclude large values from responses
- Signals: Provides in-band signaling to indicate client capabilities, such as supporting client compression or chunking.
The GetItemResponse message contains the matching data:
message GetItemResponse (
  List<Item>       items,
  Optional<String> next_page_token
)
- Items: A list of retrieved items based on the Predicate and Selection defined in the request.
- Next Page Token: An optional token indicating the position for subsequent reads if needed, essential for handling large data sets across multiple requests. Pagination is a critical component for efficiently managing data retrieval, especially when dealing with large datasets that could exceed typical response size limits.
DeleteItems — Delete one or more Items from a Record
The DeleteItems API provides flexible options for removing data, including record-level, item-level, and range deletes — all while supporting idempotency.
message DeleteItemsRequest (
  IdempotencyToken idempotency_token,
  String           namespace,
  String           id,
  Predicate        predicate
)
Just like in the GetItems API, the Predicate allows one or more Items to be addressed at once:
- Record-Level Deletes (match_all): Removes the entire record in constant latency regardless of the number of items in the record.
- Item-Range Deletes (match_range): This deletes a range of items within a Record. Useful for keeping “n-newest” or prefix path deletion.
- Item-Level Deletes (match_keys): Deletes one or more individual items.
Some storage engines (any store which defers true deletion) such as Cassandra struggle with high volumes of deletes due to tombstone and compaction overhead. Key-Value optimizes both record and range deletes to generate a single tombstone for the operation — you can learn more about tombstones in About Deletes and Tombstones.
Item-level deletes create many tombstones but KV hides that storage engine complexity via TTL-based deletes with jitter. Instead of immediate deletion, item metadata is updated as expired with randomly jittered TTL applied to stagger deletions. This technique maintains read pagination protections. While this doesn’t completely solve the problem it reduces load spikes and helps maintain consistent performance while compaction catches up. These strategies help maintain system performance, reduce read overhead, and meet SLOs by minimizing the impact of deletes.
Complex Mutate and Scan APIs
Beyond simple CRUD on single Records, KV also supports complex multi-item and multi-record mutations and scans via MutateItems and ScanItems APIs. PutItems also supports atomic writes of large blob data within a single Item via a chunked protocol. These complex APIs require careful consideration to ensure predictable linear low-latency and we will share details on their implementation in a future post.
Design Philosophies for reliable and predictable performance
Idempotency to fight tail latencies
To ensure data integrity the PutItems and DeleteItems APIs use idempotency tokens, which uniquely identify each mutative operation and guarantee that operations are logically executed in order, even when hedged or retried for latency reasons. This is especially crucial in last-write-wins databases like Cassandra, where ensuring the correct order and de-duplication of requests is vital.
In the Key-Value abstraction, idempotency tokens contain a generation timestamp and random nonce token. Either or both may be required by backing storage engines to de-duplicate mutations.
message IdempotencyToken (
  Timestamp generation_time,
  String    token
)
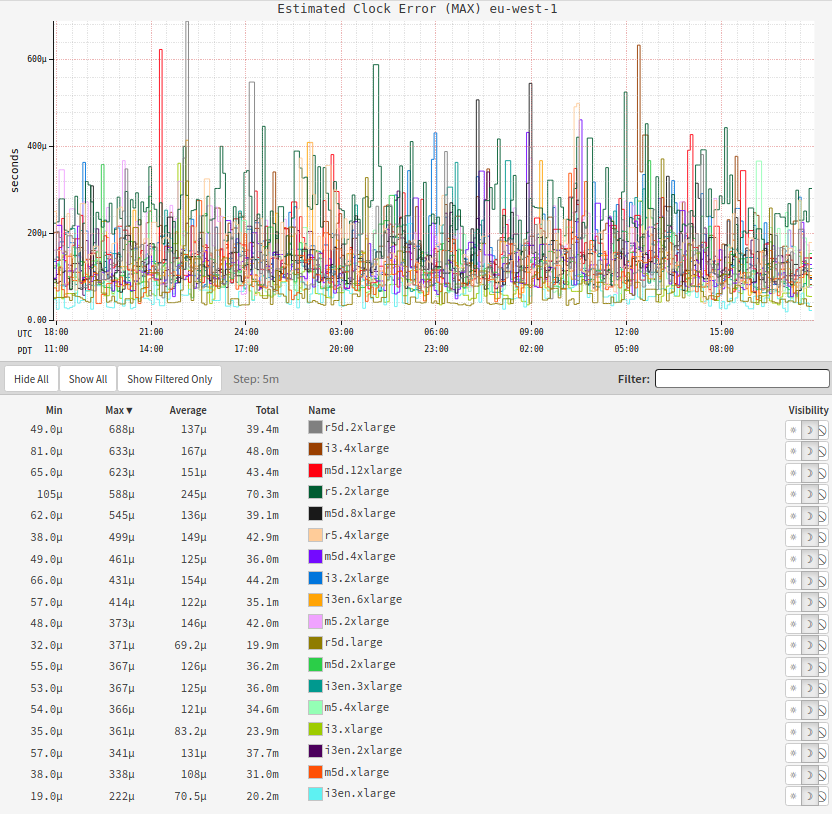
At Netflix, client-generated monotonic tokens are preferred due to their reliability, especially in environments where network delays could impact server-side token generation. This combines a client provided monotonic generation_time timestamp with a 128 bit random UUID token. Although clock-based token generation can suffer from clock skew, our tests on EC2 Nitro instances show drift is minimal (under 1 millisecond). In some cases that require stronger ordering, regionally unique tokens can be generated using tools like Zookeeper, or globally unique tokens such as a transaction IDs can be used.
The following graphs illustrate the observed clock skew on our Cassandra fleet, suggesting the safety of this technique on modern cloud VMs with direct access to high-quality clocks. To further maintain safety, KV servers reject writes bearing tokens with large drift both preventing silent write discard (write has timestamp far in past) and immutable doomstones (write has a timestamp far in future) in storage engines vulnerable to those.
Handling Large Data through Chunking
Key-Value is also designed to efficiently handle large blobs, a common challenge for traditional key-value stores. Databases often face limitations on the amount of data that can be stored per key or partition. To address these constraints, KV uses transparent chunking to manage large data efficiently.
For items smaller than 1 MiB, data is stored directly in the main backing storage (e.g. Cassandra), ensuring fast and efficient access. However, for larger items, only the id, key, and metadata are stored in the primary storage, while the actual data is split into smaller chunks and stored separately in chunk storage. This chunk storage can also be Cassandra but with a different partitioning scheme optimized for handling large values. The idempotency token ties all these writes together into one atomic operation.
By splitting large items into chunks, we ensure that latency scales linearly with the size of the data, making the system both predictable and efficient. A future blog post will describe the chunking architecture in more detail, including its intricacies and optimization strategies.
Client-Side Compression
The KV abstraction leverages client-side payload compression to optimize performance, especially for large data transfers. While many databases offer server-side compression, handling compression on the client side reduces expensive server CPU usage, network bandwidth, and disk I/O. In one of our deployments, which helps power Netflix’s search, enabling client-side compression reduced payload sizes by 75%, significantly improving cost efficiency.
Smarter Pagination
We chose payload size in bytes as the limit per response page rather than the number of items because it allows us to provide predictable operation SLOs. For instance, we can provide a single-digit millisecond SLO on a 2 MiB page read. Conversely, using the number of items per page as the limit would result in unpredictable latencies due to significant variations in item size. A request for 10 items per page could result in vastly different latencies if each item was 1 KiB versus 1 MiB.
Using bytes as a limit poses challenges as few backing stores support byte-based pagination; most data stores use the number of results e.g. DynamoDB and Cassandra limit by number of items or rows. To address this, we use a static limit for the initial queries to the backing store, query with this limit, and process the results. If more data is needed to meet the byte limit, additional queries are executed until the limit is met, the excess result is discarded and a page token is generated.
This static limit can lead to inefficiencies, one large item in the result may cause us to discard many results, while small items may require multiple iterations to fill a page, resulting in read amplification. To mitigate these issues, we implemented adaptive pagination which dynamically tunes the limits based on observed data.
Adaptive Pagination
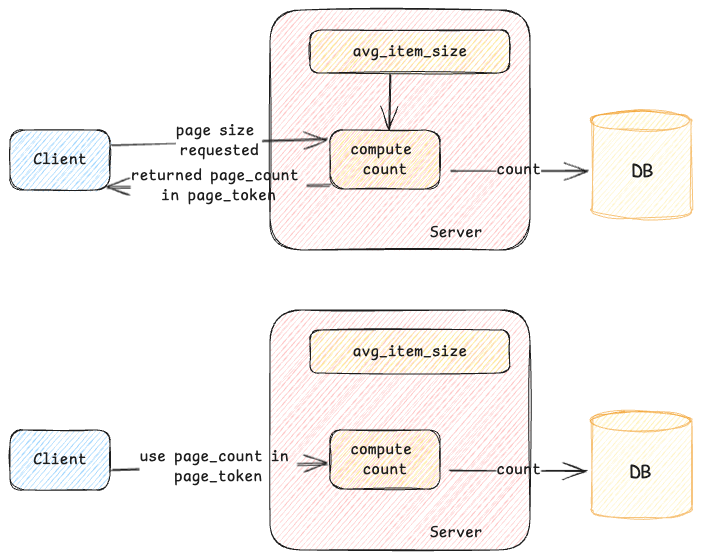
When an initial request is made, a query is executed in the storage engine, and the results are retrieved. As the consumer processes these results, the system tracks the number of items consumed and the total size used. This data helps calculate an approximate item size, which is stored in the page token. For subsequent page requests, this stored information allows the server to apply the appropriate limits to the underlying storage, reducing unnecessary work and minimizing read amplification.
While this method is effective for follow-up page requests, what happens with the initial request? In addition to storing item size information in the page token, the server also estimates the average item size for a given namespace and caches it locally. This cached estimate helps the server set a more optimal limit on the backing store for the initial request, improving efficiency. The server continuously adjusts this limit based on recent query patterns or other factors to keep it accurate. For subsequent pages, the server uses both the cached data and the information in the page token to fine-tune the limits.
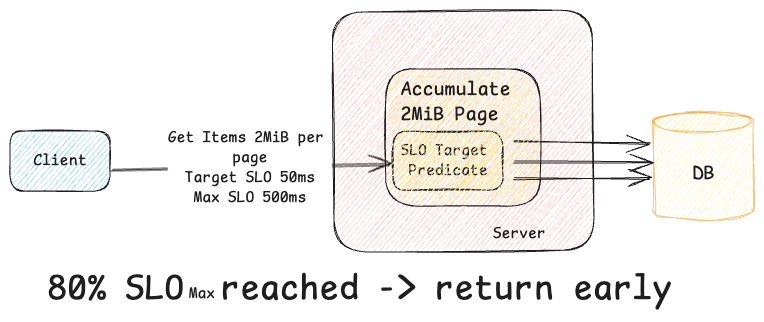
In addition to adaptive pagination, a mechanism is in place to send a response early if the server detects that processing the request is at risk of exceeding the request’s latency SLO.
For example, let us assume a client submits a GetItems request with a per-page limit of 2 MiB and a maximum end-to-end latency limit of 500ms. While processing this request, the server retrieves data from the backing store. This particular record has thousands of small items so it would normally take longer than the 500ms SLO to gather the full page of data. If this happens, the client would receive an SLO violation error, causing the request to fail even though there is nothing exceptional. To prevent this, the server tracks the elapsed time while fetching data. If it determines that continuing to retrieve more data might breach the SLO, the server will stop processing further results and return a response with a pagination token.
This approach ensures that requests are processed within the SLO, even if the full page size isn’t met, giving clients predictable progress. Furthermore, if the client is a gRPC server with proper deadlines, the client is smart enough not to issue further requests, reducing useless work.
If you want to know more, the How Netflix Ensures Highly-Reliable Online Stateful Systems article talks in further detail about these and many other techniques.
Signaling
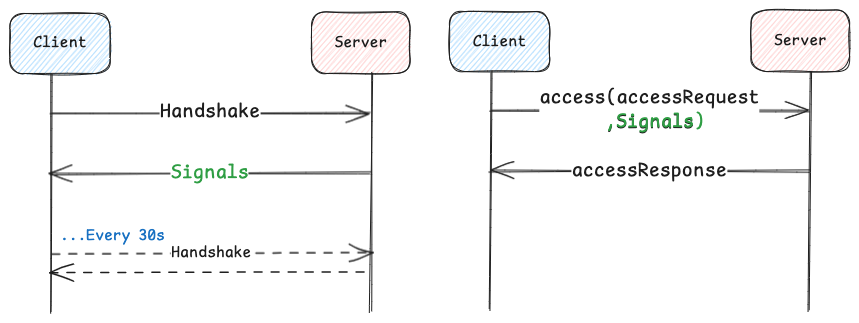
KV uses in-band messaging we call signaling that allows the dynamic configuration of the client and enables it to communicate its capabilities to the server. This ensures that configuration settings and tuning parameters can be exchanged seamlessly between the client and server. Without signaling, the client would need static configuration — requiring a redeployment for each change — or, with dynamic configuration, would require coordination with the client team.
For server-side signals, when the client is initialized, it sends a handshake to the server. The server responds back with signals, such as target or max latency SLOs, allowing the client to dynamically adjust timeouts and hedging policies. Handshakes are then made periodically in the background to keep the configuration current. For client-communicated signals, the client, along with each request, communicates its capabilities, such as whether it can handle compression, chunking, and other features.
KV Usage @ Netflix
The KV abstraction powers several key Netflix use cases, including:
- Streaming Metadata: High-throughput, low-latency access to streaming metadata, ensuring personalized content delivery in real-time.
- User Profiles: Efficient storage and retrieval of user preferences and history, enabling seamless, personalized experiences across devices.
- Messaging: Storage and retrieval of push registry for messaging needs, enabling the millions of requests to flow through.
- Real-Time Analytics: This persists large-scale impression and provides insights into user behavior and system performance, moving data from offline to online and vice versa.
Future Enhancements
Looking forward, we plan to enhance the KV abstraction with:
- Lifecycle Management: Fine-grained control over data retention and deletion.
- Summarization: Techniques to improve retrieval efficiency by summarizing records with many items into fewer backing rows.
- New Storage Engines: Integration with more storage systems to support new use cases.
- Dictionary Compression: Further reducing data size while maintaining performance.
Conclusion
The Key-Value service at Netflix is a flexible, cost-effective solution that supports a wide range of data patterns and use cases, from low to high traffic scenarios, including critical Netflix streaming use-cases. The simple yet robust design allows it to handle diverse data models like HashMaps, Sets, Event storage, Lists, and Graphs. It abstracts the complexity of the underlying databases from our developers, which enables our application engineers to focus on solving business problems instead of becoming experts in every storage engine and their distributed consistency models. As Netflix continues to innovate in online datastores, the KV abstraction remains a central component in managing data efficiently and reliably at scale, ensuring a solid foundation for future growth.
Acknowledgments: Special thanks to our stunning colleagues who contributed to Key Value’s success: William Schor, Mengqing Wang, Chandrasekhar Thumuluru, John Lu, George Cambell, Ammar Khaku, Jordan West, Chris Lohfink, Matt Lehman, and the whole online datastores team (ODS, f.k.a CDE).
![]()
Introducing Netflix’s Key-Value Data Abstraction Layer was originally published in Netflix TechBlog on Medium, where people are continuing the conversation by highlighting and responding to this story.
Now available: Graviton4-powered memory-optimized Amazon EC2 X8g instances
Post Syndicated from Jeff Barr original https://aws.amazon.com/blogs/aws/now-available-graviton4-powered-memory-optimized-amazon-ec2-x8g-instances/
 Graviton-4-powered, memory-optimized X8g instances are now available in ten virtual sizes and two bare metal sizes, with up to 3 TiB of DDR5 memory and up to 192 vCPUs. The X8g instances are our most energy efficient to date, with the best price performance and scale-up capability of any comparable EC2 Graviton instance to date. With a 16 to 1 ratio of memory to vCPU, these instances are designed for Electronic Design Automation, in-memory databases & caches, relational databases, real-time analytics, and memory-constrained microservices. The instances fully encrypt all high-speed physical hardware interfaces and also include additional AWS Nitro System and Graviton4 security features.
Over 50K AWS customers already make use of the existing roster of over 150 Graviton-powered instances. They run a wide variety of applications including Valkey, Redis, Apache Spark, Apache Hadoop, PostgreSQL, MariaDB, MySQL, and SAP HANA Cloud. Because they are available in twelve sizes, the new X8g instances are an even better host for these applications by allowing you to choose between scaling up (using a bigger instance) and scaling out (using more instances), while also providing additional flexibility for existing memory-bound workloads that are currently running on distinct instances.
The Instances
When compared to the previous generation (X2gd) instances, the X8g instances offer 3x more memory, 3x more vCPUs, more than twice as much EBS bandwidth (40 Gbps vs 19 Gbps), and twice as much network bandwidth (50 Gbps vs 25 Gbps).
The Graviton4 processors inside the X8g instances have twice as much L2 cache per core as the Graviton2 processors in the X2gd instances (2 MiB vs 1 MiB) along with 160% higher memory bandwidth, and can deliver up to 60% better compute performance.
The X8g instances are built using the 5th generation of AWS Nitro System and Graviton4 processors, which incorporates additional security features including Branch Target Identification (BTI) which provides protection against low-level attacks that attempt to disrupt control flow at the instruction level. To learn more about this and Graviton4’s other security features, read How Amazon’s New CPU Fights Cybersecurity Threats and watch the re:Invent 2023 AWS Graviton session.
Here are the specs:
| Instance Name | vCPUs |
Memory (DDR5) |
EBS Bandwidth |
Network Bandwidth |
| x8g.medium | 1 | 16 GiB | Up to 10 Gbps | Up to 12.5 Gbps |
| x8g.large | 2 | 32 GiB | Up to 10 Gbps | Up to 12.5 Gbps |
| x8g.xlarge | 4 | 64 GiB | Up to 10 Gbps | Up to 12.5 Gbps |
| x8g.2xlarge | 8 | 128 GiB | Up to 10 Gbps | Up to 15 Gbps |
| x8g.4xlarge | 16 | 256 GiB | Up to 10 Gbps | Up to 15 Gbps |
| x8g.8xlarge | 32 | 512 GiB | 10 Gbps | 15 Gbps |
| x8g.12xlarge | 48 | 768 GiB | 15 Gbps | 22.5 Gbps |
| x8g.16xlarge | 64 | 1,024 GiB | 20 Gbps | 30 Gbps |
| x8g.24xlarge | 96 | 1,536 GiB | 30 Gbps | 40 Gbps |
| x8g.48xlarge | 192 | 3,072 GiB | 40 Gbps | 50 Gbps |
| x8g.metal-24xl | 96 | 1,536 GiB | 30 Gbps | 40 Gbps |
| x8g.metal-48xl | 192 | 3,072 GiB | 40 Gbps | 50 Gbps |
The instances support ENA, ENA Express, and EFA Enhanced Networking. As you can see from the table above they provide a generous amount of EBS bandwidth, and support all EBS volume types including io2 Block Express, EBS General Purpose SSD, and EBS Provisioned IOPS SSD.
X8g Instances in Action
Let’s take a look at some applications and use cases that can make use of 16 GiB of memory per vCPU and/or up to 3 TiB per instance:
Databases – X8g instances allow SAP HANA and SAP Data Analytics Cloud to handle larger and more ambitious workloads than before. Running on Graviton4 powered instances, SAP has measured up to 25% better performance for analytical workloads and up to 40% better performance for transactional workloads in comparison to the same workloads running on Graviton3 instances. X8g instances allow SAP to expand their Graviton-based usage to even larger memory bound solutions.
Electronic Design Automation – EDA workloads are central to the process of designing, testing, verifying, and taping out new generations of chips, including Graviton, Trainium, Inferentia, and those that form the building blocks for the Nitro System. AWS and many other chip makers have adopted the AWS Cloud for these workloads, taking advantage of scale and elasticity to supply each phase of the design process with the appropriate amount of compute power. This allows engineers to innovate faster because they are not waiting for results. Here’s a long-term snapshot from one of the clusters that was used to support development of Graviton4 in late 2022 and early 2023. As you can see this cluster runs at massive scale, with peaks as high as 5x normal usage:

You can see bursts of daily and weekly activity, and then a jump in overall usage during the tape-out phase. The instances in the cluster are on the large end of the size spectrum so the peaks represent several hundred thousand cores running concurrently. This ability to spin up compute when we need it and down when we don’t gives us access to unprecedented scale without a dedicated investment in hardware.
The new X8g instances will allow us and our EDA customers to run even more workloads on Graviton processors, reducing costs and decreasing energy consumption, while also helping to get new products to market faster than ever.
Available Now
X8g instances are available today in the US East (N. Virginia), US West (Oregon), and Europe (Frankfurt) AWS Regions in On Demand, Spot, Reserved Instance, Savings Plan, Dedicated Instance, and Dedicated Host form. To learn more, visit the X8g page.
Refine unused access using IAM Access Analyzer recommendations
Post Syndicated from Stéphanie Mbappe original https://aws.amazon.com/blogs/security/refine-unused-access-using-iam-access-analyzer-recommendations/
As a security team lead, your goal is to manage security for your organization at scale and ensure that your team follows AWS Identity and Access Management (IAM) security best practices, such as the principle of least privilege. As your developers build on AWS, you need visibility across your organization to make sure that teams are working with only the required privileges. Now, AWS Identity and Access Management Analyzer offers prescriptive recommendations with actionable guidance that you can share with your developers to quickly refine unused access.
In this post, we show you how to use IAM Access Analyzer recommendations to refine unused access. To do this, we start by focusing on the recommendations to refine unused permissions and show you how to generate the recommendations and the actions you can take. For example, we show you how to filter unused permissions findings, generate recommendations, and remediate issues. Now, with IAM Access Analyzer, you can include step-by-step recommendations to help developers refine unused permissions quickly.
Unused access recommendations
IAM Access Analyzer continuously analyzes your accounts to identify unused access and consolidates findings in a centralized dashboard. The dashboard helps review findings and prioritize accounts based on the volume of findings. The findings highlight unused IAM roles and unused access keys and passwords for IAM users. For active IAM roles and users, the findings provide visibility into unused services and actions. You can learn more about unused access analysis through the IAM Access Analyzer documentation.
For unused IAM roles, access keys, and passwords, IAM Access Analyzer provides quick links in the console to help you delete them. You can use the quick links to act on the recommendations or use export to share the details with the AWS account owner. For overly permissive IAM roles and users, IAM Access Analyzer provides policy recommendations with actionable steps that guide you to refine unused permissions. The recommended policies retain resource and condition context from existing policies, helping you update your policies iteratively.
Throughout this post, we use an IAM role in an AWS account and configure the permissions by doing the following:
- Attaching the AWS managed policy AmazonBedrockReadOnly.
- Attaching the AWS managed policy AmazonS3ReadOnlyAccess.
- Embedding an inline policy with the permissions described in the following code and named InlinePolicyListLambda.
Content of inline policy InlinePolicyListLambda:
We use an inline policy to demonstrate that IAM Access Analyzer unused access recommendations are applicable for that use case. The recommendations are also applicable when using AWS managed policies and customer managed policies.
In your AWS account, after you have configured an unused access analyzer, you can select an IAM role that you have used recently and see if there are unused access permissions findings and recommendations.
Prerequisites
Before you get started, you must create an unused access analyzer for your organization or account. Follow the instructions in IAM Access Analyzer simplifies inspection of unused access in your organization to create an unused access analyzer.
Generate recommendations for unused permissions
In this post we explore three options for generating recommendations for IAM Access Analyzer unused permissions findings: the console, AWS CLI, and AWS API.
Generate recommendations for unused permissions using the console
After you have created an unused access analyzer as described in the prerequisites, wait a few minutes to see the analysis results. Then use the AWS Management Console to view the proposed recommendations for the unused permissions.
To list unused permissions findings
- Go to the IAM console and under Access Analyzer, choose Unused access from the navigation pane.
- Search for active findings with the type Unused permissions in the search box.
- Select Active from the Status drop-down list.
- In the search box, select Findings type under Properties.
- Select Equals as Operators.
- Select Findings Type = Unused permissions.
- This list shows the active findings for IAM resources with unused permissions.

Figure 1: Filter on unused permissions in the IAM console
- Select a finding to learn more about the unused permissions granted to a given role or user.

To obtain recommendations for unused permissions
- On the findings detail page, you will see a list of the unused permissions under Unused permissions.
- Following that, there is a new section called Recommendations. The Recommendations section presents two steps to remediate the finding:
- Review the existing permissions on the resource.
- Create new policies with the suggested refined permissions and detach the existing policies.

Figure 2: Recommendations section
- The generation of recommendations is on-demand and is done in the background when you’re using the console. The message Analysis in progress indicates that recommendations are being generated. The recommendations exclude the unused actions from the recommended policies.
- When an IAM principal, such as an IAM role or user, has multiple permissions policies attached, an analysis of unused permissions is made for each of permissions policies:
- If no permissions have been used, the recommended action is to detach the existing permissions policy.
- If some permissions have been used, only the used permissions are kept in the recommended policy, helping you apply the principle of least privilege.
- The recommendations are presented for each existing policy in the column Recommended policy. In this example, the existing policies are:
- AmazonBedrockReadOnly
- AmazonS3ReadOnlyAccess
- InlinePolicyListLambda
And the recommended policies are:
- None
- AmazonS3ReadOnlyAccess-recommended
- InlinePolicyListLambda-recommended
Figure 3: Recommended policies
- There is no recommended policy for
AmazonBedrockReadOnlybecause the recommended action is to detach it. When hovering over None, the following message is displayed: There are no recommended policies to create for the existing permissions policy. AmazonS3ReadOnlyAccessandInlinePolicyListLambdaand their associated recommended policy can be previewed by choosing Preview policy.


To preview a recommended policy
IAM Access Analyzer has proposed two recommended policies based on the unused actions.
- To preview each recommended policy, choose Preview policy for that policy to see a comparison between the existing and recommended permissions.
- Choose Preview policy for AmazonS3ReadOnlyAccess-recommended.
- The existing policy has been analyzed and the broad permissions—
s3:Get*ands3:List*—have been scoped down to detailed permissions in the recommended policy. - The permissions
s3:Describe*,s3-object-lambda:Get*, ands3-object-lambda:List*can be removed because they weren’t used.

Figure 4: Preview of the recommended policy for AmazonS3ReadOnlyAccess
- The existing policy has been analyzed and the broad permissions—
- Choose Preview policy for InlinePolicyListLambda-recommended to see a comparison between the existing inline policy
InlinePolicyListLambdaand its recommended version.- The existing permissions,
lambda:ListFunctionsandlambda:ListLayers, are kept in the recommended policy, as well as the existing condition. - The permissions in
lambda:ListAliasesandlambda:ListFunctionUrlConfigscan be removed because they weren’t used.
Figure 5: Preview the recommended policy for the existing inline policy InlinePolicyListLambda
- The existing permissions,
- Choose Preview policy for AmazonS3ReadOnlyAccess-recommended.


To download the recommended policies file
- Choose Download JSON to download the suggested recommendations locally.
Figure 6: Download the recommended policies
- A .zip file that contains the recommended policies in JSON format will be downloaded.

Figure 7: Downloaded recommended policies as JSON files
- The content of the
AmazonS3ReadOnlyAccess-recommended-1-2024-07-22T20/08/44.793Z.jsonfile the same as the recommended policy shown in Figure 4.


Generate recommendations for unused permissions using AWS CLI
In this section, you will see how to generate recommendations for unused permissions using AWS Command Line Interface (AWS CLI).
To list unused permissions findings
- Use the following code to refine the results by filtering on the type UnusedPermission and selecting only the active findings. Copy the Amazon Resource Name (ARN) of your unused access analyzer and use it to replace the ARN in the following code:
- You will obtain results similar to the following.
To generate unused permissions finding recommendations
After you have a list of findings for unused permissions, you can generate finding recommendations.
- Run the following, replacing the analyzer ARN and the finding ID to generate the suggested recommendations.
- You will get an empty response if your command ran successfully. The process is running in the background.
To obtain the generated recommendations
After the recommendations are generated, you need to make a separate API call to view the recommendations details.
- The following command returns the recommended remediation.
- This command provides the following results. For more information about the meaning and structure of the recommendations, see Anatomy of a recommendation later in this post.
Note: The recommendations consider AWS managed policies, customer managed policies, and inline policies. The IAM conditions in the initial policy are maintained in the recommendations if the actions they’re related to are used.
The remediations suggested are to do the following:
- Detach
AmazonBedrockReadOnlypolicy because it is unused: DETACH_POLICY - Create a new recommended policy with scoped down permissions from the managed policy
AmazonS3ReadOnlyAccess:CREATE_POLICY - Detach
AmazonS3ReadOnlyAccess:DETACH_POLICY - Embed a new recommended policy with scoped down permissions from the inline policy: CREATE_POLICY
- Delete the inline policy.
- Detach
Generate recommendations for unused permissions using EventBridge and AWS API
We have described how to use AWS CLI and the console to find unused permissions findings and to generate recommendations.
In this section, we show you how to use an Amazon EventBridge rule to find the active unused permissions findings from IAM Access Analyzer. Then we show you how to generate recommendations using two IAM Access Analyzer APIs to generate the finding recommendations and get the finding recommendations.
To create an EventBridge rule to detect unused permissions findings
Create an EventBridge rule to detect new unused permissions findings from IAM Access Analyzer.
- Go to the Amazon EventBridge console.
- Choose Rules, and then choose Create rule.
- Enter a name for your rule. Leave the Event bus value as the default.
- Under Rule type, select Rule with an event pattern.
- In the Event Source section, select AWS events or EventBridge partner events.
- For Creation method, select Use pattern form.
- Under Event pattern:
- For Event source, select AWS services.
- For AWS service, select Access Analyzer.
- For Event type, select Unused Access Finding for IAM entities.
Note: There is no event for generated recommendations, only for unused access findings.
Figure 8: Listing unused permissions by filtering events using an EventBridge rule
- Configure the Event pattern by changing the default values to the following:
resources: Enter the ARN of your unused access analyzer.status: ACTIVE indicates that you are only looking for active findings.findingType: UnusedPermission.
- You can select a target Amazon Simple Notification Service (Amazon SNS) to be notified of new active findings for a specific analyzer for unused permissions.

To generate recommendations for unused permissions using the IAM Access Analyzer API
The findings are generated on-demand. For that purpose, IAM Access Analyzer API GenerateFindingRecommendation can be called with two parameters: the ARN of the analyzer and the finding ID.
- You can use AWS Software Development Kit (SDK) for Python(boto3) for the API call.
- Run the call as follows:
To obtain the finding recommendations
- After the recommendations are generated, they can be obtained by calling the API GetFindingRecommendation with the same parameters: the ARN of the analyzer and the finding ID.
- Use AWS SDK for Python (boto3) for the API call as follows:
Remediate based on the generated recommendations
The recommendations are generated as actionable guidance that you can follow. They propose new IAM policies that exclude the unused actions, helping you rightsize your permissions.
Anatomy of a recommendation
The recommendations are usually presented in the following way:
- Date and time:
startedAt, completedAt. Respectively when the API call was made and when the analysis was completed and the results were provided. - Resource ARN: The ARN of the resource being analyzed.
- Recommended steps: The recommended steps, such as creating a new policy based on the actions used and detaching the existing policy.
- Recommendation type: UNUSED_PERMISSION_RECOMMENDATION.
- Status: The status of retrieving the finding recommendation. The status values include SUCCEEDED, FAILED, and IN_PROGRESS.
For more information about the structure of recommendations, see the output section of get-finding-recommendation.
Recommended policy review
You must review the recommended policy. The recommended actions depend on the original policy. The original policy will be one of the following:
- An AWS managed policy: You need to create a new IAM policy using
recommendedPolicy. Attach this newly created policy to your IAM role. Then detach the former policy. - A customer managed policy or an inline policy: Review the policy, verify its scope, consider how often it’s attached to other principals (customer managed policy only), and when you are confident to proceed, use the recommended policy to create a new policy and detach the former policy.
Use cases to consider when reviewing recommendations
During your review process, keep in mind that the unused actions are determined based on the time defined in your tracking period. The following are some use cases you might have where a necessary role or action might be identified as unused (this is not an exhaustive list of use cases). It’s important to review the recommendations based on your business needs. You can also archive some findings related to the use cases such as the ones that follow:
- Backup activities: If your tracking period is 28 days and you have a specific role for your backup activities running at the end of each month, you might discover that after 29 days some of the permissions for that backup role are identified as unused.
- IAM permissions associated to an infrastructure as code deployment pipeline: You should also consider the permissions associated to specific IAM roles such an IAM for infrastructure as code (IaC) deployment pipeline. Your pipeline can be used to deploy Amazon Simple Storage Service (Amazon S3) buckets based on your internal guidelines. After deployment is complete, the pipeline permissions can become unused after your tracking period, but removing those unused permissions can prevent you from updating your S3 buckets configuration or from deleting it.
- IAM roles associated with disaster recovery activities: While it’s recommended to have a disaster recovery plan, the IAM roles used to perform those activities might be flagged by IAM Access Analyzer for having unused permissions or being unused roles.
To apply the suggested recommendations
Of the three original policies attached to IAMRole_IA2_Blog_EC2Role, AmazonBedrockReadOnly can be detached and AmazonS3ReadOnlyAccess and InlinePolicyListLambda can be refined.
- Detach
AmazonBedrockReadOnlyNo permissions are used in this policy, and the recommended action is to detach it from your IAM role. To detach it, you can use the IAM console, the AWS CLI, or the AWS API.
- Create a new policy called
AmazonS3ReadOnlyAccess-recommendedand detachAmazonS3ReadOnlyAccess.The unused access analyzer has identified unused permissions in the managed policy AmazonS3ReadOnlyAccess and proposed a new policy
AmazonS3ReadOnlyAccess-recommendedthat contains only the used actions. This is a step towards least privilege because the unused actions can be removed by using the recommended policy.- Create a new IAM policy named AmazonS3ReadOnlyAccess-recommended that contains only the following recommended policy or one based on the downloaded JSON file.
- Detach the managed policy
AmazonS3ReadOnlyAccess.
- Embed a new inline policy
InlinePolicyListLambda-recommendedand deleteInlinePolicyListLambda. This inline policy lists AWS Lambda aliases, functions, layers, and function URLs only when coming from a specific source IP address.- Embed the recommended inline policy.
The recommended policy follows. You can embed an inline policy for the IAM role using the console, AWS CLI, or the AWS API PutRolePolicy.
- Delete the inline policy.
- Embed the recommended inline policy.
- After updating the policies based on the Recommended policy proposed, the finding Status will change from Active to Resolved.
Figure 9: The finding is resolved

Pricing
There is no additional pricing for using the prescriptive recommendations after you have enabled unused access findings.
Conclusion
As a developer writing policies, you can use the actionable guidance provided in recommendations to continually rightsize your policies to include only the roles and actions you need. You can export the recommendations through the console or set up automated workflows to notify your developers about new IAM Access Analyzer findings.
This new IAM Access Analyzer unused access recommendations feature streamlines the process towards least privilege by selecting the permissions that are used and retaining the resource and condition context from existing policies. It saves an impressive amount of time by the actions used by your principals and guiding you to refine them.
By using the IAM Access Analyzer findings and access recommendations, you can quickly see how to refine the permissions granted. We have shown in this blog post how to generate prescriptive recommendations with actionable guidance for unused permissions using AWS CLI, API calls, and the console.
- To learn more about IAM Access Analyzer Unused Access, see Findings for external and unused access.
- To learn about the creation of unused access findings, see IAM Access Analyzer simplifies inspection of unused access in your organization.
- To learn about the strategies for achieving least privilege at scale, see Strategies for achieving least privilege at scale Part 1 and Part 2.
- To practice, use the Refining IAM Permissions Like A Pro the workshop.
If you have feedback about this post, submit comments in the Comments section below. If you have questions about this post, contact AWS Support.
Data engineering professional certificate: New hands-on specialization by DeepLearning.AI and AWS
Post Syndicated from Betty Zheng (郑予彬) original https://aws.amazon.com/blogs/aws/data-engineering-professional-certificate-new-hands-on-specialization-by-deeplearning-ai-and-aws/
Data engineers play a crucial role in the modern data-driven landscape, managing essential tasks from data ingestion and processing to transformation and serving. Their expertise is particularly valuable in the era of generative AI, where harnessing the value of vast datasets is paramount.
To empower aspiring and experienced data professionals, DeepLearning.AI and Amazon Web Services (AWS) have partnered to launch the Data Engineering Specialization, an advanced professional certificate on Coursera. This comprehensive program covers a wide range of data engineering concepts, tools, and techniques relevant to modern organizations. It’s designed for learners with some experience working with data who are interested in learning the fundamentals of data engineering. The specialization comprises four hands-on courses, each culminating in a Coursera course certificate upon completion.

Specialization overview
This Data Engineering Specialization is a joint initiative by AWS and DeepLearning.AI, a leading provider of world-class AI education founded by renowned machine learning (ML) pioneer Andrew Ng.
Joe Reis, a prominent figure in data engineering and coauthor of the bestselling book Fundamentals of Data Engineering, leads the program as a primary instructor. By providing a foundational framework, the curriculum ensures learners gain a holistic understanding of the data engineering lifecycle, while covering key aspect such as data architecture, orchestration, DataOps, and data management.
Further enhancing the learning experience, the program features hands-on labs and technical assessments hosted on the AWS Cloud. These practical, cloud-based exercises were designed in partnership with AWS technical experts, including Gal Heyne, Navnit Shukla, and Morgan Willis. Learners will apply theoretical concepts using AWS services and tools, such as Amazon Kinesis, AWS Glue, Amazon Simple Storage Service (Amazon S3), and Amazon Redshift, equipping them with hands-on skill and experience.
Specialization highlights
Participants will be introduced to several key learning opportunities.
Acquisition of core skills and strategies
The specialization equips data engineers with the ability to design data engineering solutions for various use cases, select the right technologies for their data architecture, and circumvent potential pitfalls. The skills gained universally apply across various platforms and technologies, offering learners a program that is versatile.
Unparalleled approach to data engineering education
Unlike conventional courses focused on specific technologies, this specialization provides a comprehensive understanding of data engineering fundamentals. It emphasizes the importance of aligning data engineering strategies with broader business goals, fostering a more integrated and effective approach to building and maintaining data solutions.
Holistic understanding of data engineering
By using the insights from the Fundamentals of Data Engineering book, the curriculum offers a well-rounded education that prepares professionals for success in the data-driven focused industries.
Practical skills through AWS cloud labs
The hands-on labs hosted by AWS Partner Vocareum let learners apply the techniques directly in an AWS environment provided with the course. This practical experience is crucial for mastering the intricacies of data engineering and developing the skills needed to excel in the industry.
Why choose this specialization?
- Structured learning path–The specification is thoughtfully structured to provide a step-by-step learning journey, from foundational concepts to advanced applications.
- Expert insights–Gain insights from the authors of Fundamentals of Data Engineering and other industry experts. Learn how to apply practical knowledge to build modern data architecture on the cloud, using cloud services for data engineering.
- Hands-on experience–Engage in hands-on labs in the AWS Cloud, where you not only learn but also apply the knowledge in real-world scenarios.
- Comprehensive curriculum–This program encompasses all aspects of the data engineering lifecycle, including data generation in source systems, ingestion, transformation, storage, and serving. It also addresses key undercurrents of data engineering, such as security, data management, and orchestration.
At the end of this specialization, learners will be well-equipped with the necessary skills and expertise to embark on a career in data engineering, an in-demand role at the core of any organization that is looking to use data to create value. Data-centric ML and analytics would not be possible without the foundation of data engineering.
Course modules
The Data Engineering Specialization comprises four courses:
- Course 1–Introduction to Data Engineering–This foundational module explores the collaborative nature of data engineering, identifying key stakeholders and understanding their requirements. The course delves into a mental framework for building data engineering solutions, emphasizing holistic ecosystem understanding, critical factors like data quality and scalability, and effective requirements gathering. The course then examines the data engineering lifecycle, illustrating interconnections between stages. By showcasing the AWS data engineering stack, the course teaches how to use the right technologies. By the end of this course, learners will have the skills and mindset to tackle data engineering challenges and make informed decisions.
- Course 2–Source Systems, Data Ingestion, and Pipelines–In this course, data engineers dive deep into the practical aspects of working with diverse data sources, ingestion patterns, and pipeline construction. Learners explore the characteristics of different data formats and the appropriate source systems for generating each type of data, equipping them with the knowledge to design effective data pipelines. The course covers the fundamentals of relational and NoSQL databases, including ACID compliance and CRUD operations, so that engineers learn to interact with a wide range of data source systems. The course covers the significance of cloud networking, resolving database connection issues, and using message queues and streaming platforms—crucial skills for creating strong and scalable data architectures. By mastering the concepts in this course, data engineers will be able to automate data ingestion processes, optimize connectivity, and establish the foundation for successful data engineering projects.
- Course 3–Data Storage and Queries–This course equips data engineers with principles and best practices for designing robust, efficient data storage and querying solutions. Learners explore the data lake house concept, implementing a medallion-like architecture and using open table formats to build transactional data lakes. The course enhances SQL proficiency by teaching advanced queries, such as aggregations and joins on streaming data, while also exploring data warehouse and data lake capabilities. Learners compare storage performance and discover optimization strategies, like indexing. Data engineers can achieve high performance and scalability in data services by comprehending query execution and processing.
- Course 4–Data Modeling, Transformation, and Serving–In this capstone course, data engineers explore advanced data modeling techniques, including data vault and star schemas. Learners differentiate between modeling approaches like Inmon and Kimball, gaining the ability to transform data and structure it for optimal analytical and ML use cases. The course equips data engineers with preprocessing skills for textual, image, and tabular data. Learners understand the distinctions between supervised and unsupervised learning, as well as classification and regression tasks, empowering them to design data solutions supporting a range of predictive applications. By mastering these data modeling, transformation, and serving concepts, data engineers can build robust, scalable, and business-aligned data architectures to deliver maximum value.
Enrollment
Whether you’re new to data engineering or looking to enhance your skills, this specialization provides a balanced mix of theory and hands-on experience through 4 courses, each culminating in a Coursera course certificate.
Embark on your data engineering journey from here:
- Introduction to Data Engineering
- Source Systems, Data Ingestion, and Pipelines
- Data Storage and Queries
- Data Modeling, Transformation, and Serving
By enrolling in these courses, you’ll also earn the DeepLearning.AI Data Engineering Professional Certificate upon completing all four courses.
Enroll now and take the first step towards mastering data engineering with this comprehensive and practical program, built on the foundation of Fundamentals of Data Engineering and powered by AWS.
Three stable kernel updates for Wednesday
Post Syndicated from jzb original https://lwn.net/Articles/990766/
The 6.10.11, 6.6.52, and 6.1.111 stable kernel updates have all
been released. As usual, they contain important fixes throughout the
tree. Users of those kernels should upgrade.
БОЕЦ: Сарафов “изпра” Пеевски за кражба на 50 млн. лв. от ББР
Post Syndicated from Николай Марченко original https://bivol.bg/boets-peevski-bbr.html
сряда 18 септември 2024

След два дни преговори за среща, ГД “България Обединена с Една Цел” (БОЕЦ) най-накрая обсъдиха с изпълнителния директор на държавната Българска банка за развитие (ББР) Илия Караниколов скандалната кредитна линия…
Hybrid Cloud Journey using Amazon Outposts and AWS Local Zones
Post Syndicated from Arun Chellappa Ganesan original https://aws.amazon.com/blogs/architecture/hybrid-cloud-journey-using-amazon-outposts-and-aws-local-zones/
This post was co-written with Amy Flanagan, Vice President of Architecture and leader of the Virtual Architecture Team (VAT) at athenahealth, and Anusha Dharmalingam, Executive Director and Senior Architect at athenahealth.
athenahealth has embarked on an ambitious journey to modernize its technology stack by leveraging AWS’s hybrid cloud solutions. This transformation aims to enhance scalability, performance, and developer productivity, ultimately improving the quality of care provided to its patients.
athenahealth’s core products, including revenue cycle management, electronic health records, and patient engagement portals, have been built and refined over 25 years. The company initially deployed its Perl-based web application stack centrally in data centers, allowing it to scale horizontally to meet the growing demands of healthcare providers. However, as the company expanded, it encountered significant scaling and operational challenges in maintaining legal applications due to its monolithic architecture and tightly coupled codebase.
The need for modernization
With a legacy system acting as a multi-purpose database, athenahealth faced issues with developer productivity and operational efficiency. The monolithic architecture led to complex dependencies and made it difficult to implement new features. Realizing the need to modernize, athenahealth decided to refactor its applications and move to the cloud, taking advantage of AWS’s robust infrastructure and services.
Decomposing monoliths to microservices
athenahealth adopted the strangler fig pattern to decompose its monolithic applications into microservices. Starting with peripheral services, they gradually moved to core services, using containers and modern development practices. 80% of athenahealth’s AWS footprint are containerized workloads deployed on Amazon Elastic Container Service (Amazon ECS). Java became the primary language for these microservices, with purpose-built databases like Amazon DynamoDB, Amazon RDS for PostgreSQL, and Amazon OpenSearch.
Event-driven communication between services was facilitated through Amazon EventBridge, Amazon Managed Streaming for Apache Kafka (Amazon MSK), and Amazon Simple Queue Service (Amazon SQS). A data lake was established on Amazon Simple Storage Service (Amazon S3), fed by change data capture from relational databases. Despite progress, refactoring core services proved time-consuming and challenging.
Introducing AWS Outposts and AWS Local Zones
To address these challenges, athenahealth leveraged AWS Local Zones and AWS Outposts, extending AWS infrastructure and services to their on-premises data centers. This hybrid cloud approach allowed athenahealth to deploy modernized code while maintaining low-latency access to existing databases. Deployment across both AWS Local Zones close to the datacenter and AWS Outposts in the datacenter enabled athenahealth to get a highly available hybrid architecture. Local Zones offers additional elasticity, making it suitable for specific use cases. Additionally, the combination of deployment solutions enables optimal access to athenahealth on-premises services and AWS Regional services.
Benefits of AWS Outposts and AWS Local Zones
- Scalability and performance: Outposts and Local Zones enabled athenahealth to curb the growth of their monolithic codebase, allowing for seamless integration of modern microservices with existing systems.
- Developer productivity: Developers were able to focus on container-based workloads, using familiar tools and environments, thereby reducing context switching and improving efficiency.
- Operational efficiency: By running containerized applications on Outposts and Local Zones, athenahealth achieved consistent performance and reliability, crucial for healthcare applications.
Hybrid cloud architecture
athenahealth’s hybrid cloud architecture includes two data centers geographically distributed for high availability and disaster recovery. As shown in Figure 1, the company operates two data centers that are geographically distributed, each housing two Outposts and connecting to two Local Zones. This configuration not only supports geo-proximity-based traffic distribution for optimal performance but also establishes a primary and standby setup for disaster recovery purposes. By connecting these Outposts to separate AWS Regions, athenahealth achieves additional redundancy, enhancing their system’s resilience and ensuring continuous operation. In addition, within a single Region the deployment across Outpost and Local Zone provides high availability for the applications. This hybrid setup enables athenahealth to seamlessly integrate their legacy monolithic application with modernized microservices. By using AWS Outposts and AWS Local Zones as an extension of their data centers, athenahealth can run containerized applications with low-latency access to on-premises databases. This architecture supports the company’s goals of curbing the growth of their monolithic codebase and improving developer productivity by allowing for consistent performance and reliability across their infrastructure. With two Outposts and two Local Zones deployed, athenahealth ensures that their critical healthcare services remain available and reliable, meeting the stringent demands of the industry.

Figure 1. AWS Outposts and AWS Local Zones at athenahealth
Application deployment
athenahealth’s hybrid cloud architecture is designed to optimize the deployment of containerized workloads while ensuring efficient use of AWS Outposts’ capacity and elastic AWS Local Zone capacity. By leveraging Amazon Elastic Kubernetes Service (EKS), athenahealth deploys application containers on Outposts and AWS Local Zones, enabling low-latency access to on-premises databases. The control plane for these applications is managed in the AWS Region, while the worker nodes run locally on the Outposts and Local Zones. This setup ensures that critical applications requiring immediate data access can operate with minimal latency, thereby maintaining high performance and reliability.
To further optimize the use of AWS resources, athenahealth deploys non-latency-sensitive services, such as logging, monitoring, and CI/CD, directly in AWS Regions, as shown in Figure 2. These services do not require direct access to on-premises databases, allowing athenahealth to preserve the limited capacity of Outposts for applications that truly benefit from low-latency access. By strategically dividing the deployment of applications between Outposts and Local Zones and AWS Regions, athenahealth achieves a balanced, efficient, and scalable hybrid cloud environment that supports the company’s ongoing modernization efforts.

Figure 2. Amazon EKS on Amazon Outposts
Primary use cases
athenahealth’s primary use cases for their hybrid cloud architecture focus on curbing the growth of their monolithic codebase while facilitating modernization and cloud migration. By leveraging AWS Outposts and AWS Local Zones, they supported two key use cases:
- Enabling microservices running in AWS Regions to access on-premises databases with low latency
- Offloading certain features of their monolithic application to Outposts and Local Zones, as shown in Figure 3
This approach reduces the load on legacy systems and enhances service delivery. These strategies allow athenahealth to maintain efficient operations and accelerate their transition to a hybrid cloud-based infrastructure.

Figure 3. Microservices running in AWS Regions interact with on-premises databases through Outposts and Local Zones, ensuring low-latency data access
Conclusion
This technology transformation is a significant step forward, enabling athenahealth to be more agile, efficient, and responsive to the evolving needs of its vast network of healthcare providers and patients. athenahealth’s journey to AWS hybrid cloud showcases the transformative power of modernizing legacy systems. With increased scalability, improved application performance, and streamlined developer workflows, the company can now focus even more on its core mission of delivering innovative, patient-centric solutions that improve health outcomes. As athenahealth progresses, it will continue to refine its hybrid cloud strategy, ensuring the delivery of high-quality healthcare services to clinicians and patients alike.
Further reading
Using Amazon Detective for IAM investigations
Post Syndicated from Ahmed Adekunle original https://aws.amazon.com/blogs/security/using-amazon-detective-for-iam-investigations/
Uncovering AWS Identity and Access Management (IAM) users and roles potentially involved in a security event can be a complex task, requiring security analysts to gather and analyze data from various sources, and determine the full scope of affected resources.
Amazon Detective includes Detective Investigation, a feature that you can use to investigate IAM users and roles to help you determine if a resource is involved in a security event and obtain an in-depth analysis. It automatically analyzes resources in your Amazon Web Services (AWS) environment using machine learning and threat intelligence to identify potential indicators of compromise (IoCs) or suspicious activity. This allows analysts to identify patterns and identify which resources are impacted by security events, offering a proactive approach to threat identification and mitigation. Detective Investigation can help determine if IAM entities have potentially been compromised or involved in known tactics, techniques, and procedures (TTPs) from the MITRE ATT&CK framework, a well adopted framework for security and threat detection. MITRE TTPs are the terms used to describe the behaviors, processes, actions, and strategies used by threat actors engaged in cyberattacks.
In this post, I show you how to use Detective Investigation and how to interpret and use the information provided from an IAM investigation.
Prerequisites
The following are the prerequisites to follow along with this post:
- Access to the AWS Management Console with an active AWS account.
- Amazon Detective and Amazon GuardDuty enabled in the same AWS account and AWS Region.
Use Detective Investigation to investigate IAM users and roles
To get started with an investigation, sign in to the console. The walkthrough uses three scenarios:
- Automated investigations
- Investigator persona
- Threat hunter persona
In addition to Detective, some of these scenarios also use Amazon GuardDuty, which is an intelligent threat detection service.
Scenario 1: Automated investigations
Automatic investigations are available in Detective. Detective only displays investigation information when you’re running an investigation. You can use the Detective console to see the number of IAM roles and users that were impacted by security events over a set period. In addition to the console, you can use the StartInvestigation API to initiate a remediation workflow or collect information about IAM entities involved or AWS resources compromised.
The Detective summary dashboard, shown in Figure 1, automatically shows you the number of critical investigations, high investigations, and the number of IAM roles and users found in suspicious activities over a period of time. Detective Investigation uses machine learning models and threat intelligence to surface only the most critical issues, allowing you to focus on high-level investigations. It automatically analyzes resources in your AWS environment to identify potential indicators of compromise or suspicious activity.
To get to the dashboard using the Detective console, choose Summary from the navigation pane.
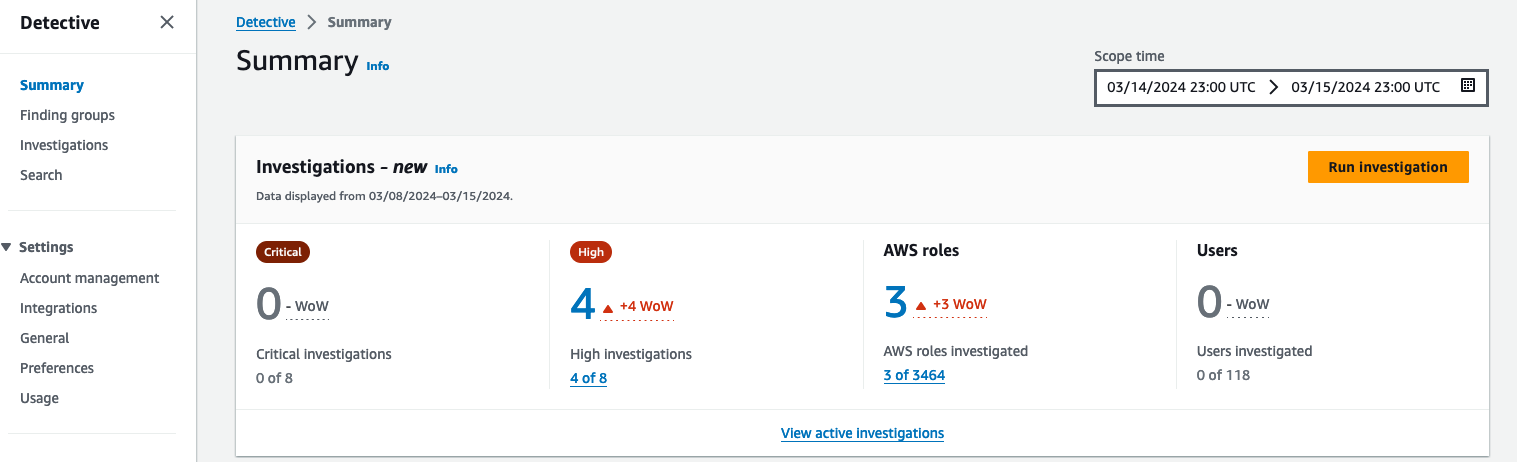
Figure 1: AWS roles and users impacted by a security event
Note: If you don’t have automatic investigations listed in Detective, the View active investigations link won’t display any information. To run a manual investigation, follow the steps in Running a Detective Investigation using the console or API.
If you have an active automatic investigation, choose View active investigations on the Summary dashboard to go to the Investigations page (shown in Figure 2), which shows potential security events identified by Detective. You can select a specific investigation to view additional details in the investigations report summary.
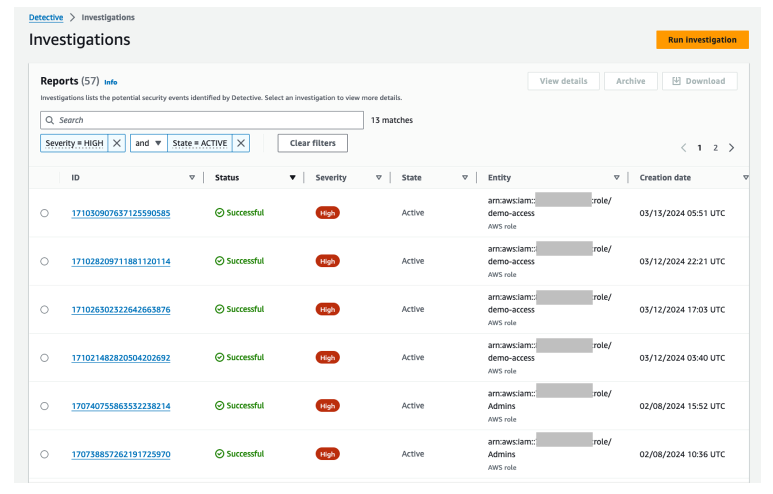
Figure 2: Active investigations that are related to IAM entities
Select a report ID to view its details. Figure 3 shows the details of the selected event under Indicators of compromise along with the AWS role that was involved, period of time, role name, and the recommended mitigation action. The indicators of compromise list includes observed tactics from the MITRE ATT&CK framework, flagged IP addresses involved in potential compromise (if any), impossible travel under the indicators, and the finding group. You can continue your investigation by selecting and reviewing the details of each item from the list of indicators of compromise.
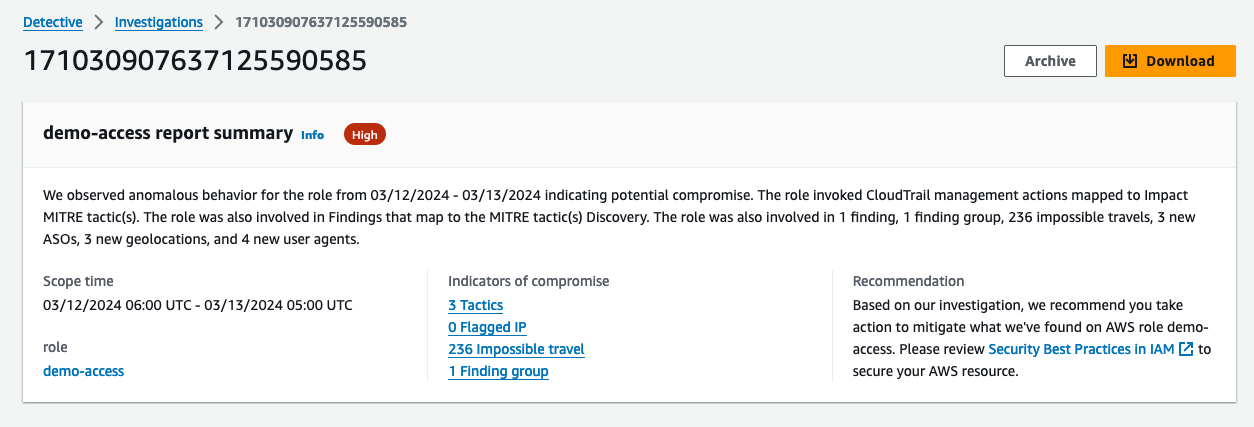
Figure 3: Summary of the selected investigation
Figure 4 shows the lower portion of the selected investigation. Detective maps the investigations to TTPs from the MITRE ATT&CK framework. TTPs are classified according to their severity. The console shows the techniques and actions used. When selecting a specific TTP, you can see the details in the right pane. In this example, the valid cloud credential has IP addresses involved in 34 successful API call attempts.
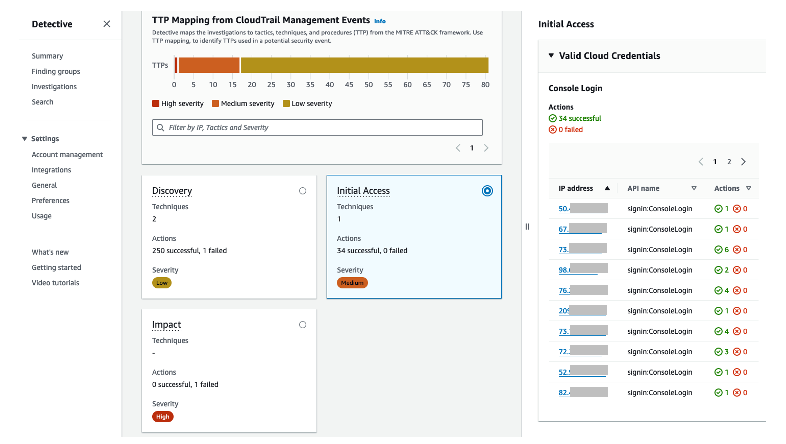
Figure 4: TTP mappings
Scenario 2: Investigator persona
For this scenario, you have triaged the resources associated with a GuardDuty finding informing you that an IAM user or role has been identified in an anomalous behavior. You need to investigate and analyze the impact this security issue might have had on other resources and ensure that nothing else needs to be remediated.
The example for this use case starts by going to the GuardDuty console and choosing Findings from the navigation pane, selecting a GuardDuty IAM finding, and then choosing the Investigate with Detective link.
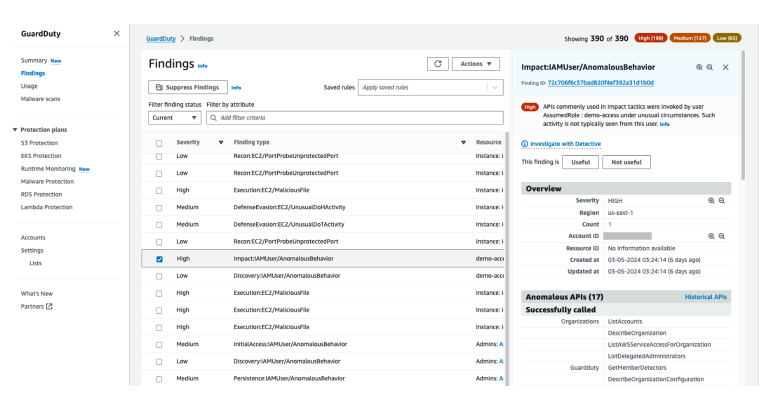
Figure 5: List of findings in GuardDuty
Let’s now investigate an IAM user associated with the GuardDuty finding. As shown in Figure 6, you have multiple options for pivoting to Detective, such as the GuardDuty finding itself, the AWS account, the role session, and the internal and external IP addresses.
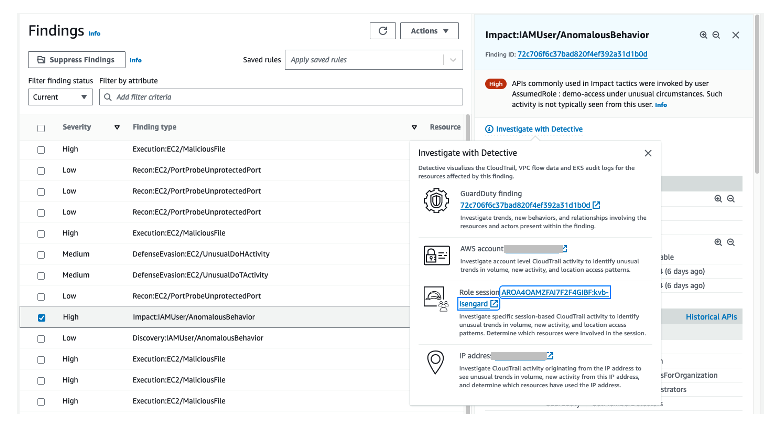
Figure 6: Options for pivoting to Detective
From the list of Detective options, you can choose Role session, which will help you investigate the IAM role session that was in use when the GuardDuty finding was created. Figure 7 shows the IAM role session page.
Before moving on to the next section, you would scroll down to Resources affected in the GuardDuty finding details panel on the right side of the screen and take note of the Principal ID.
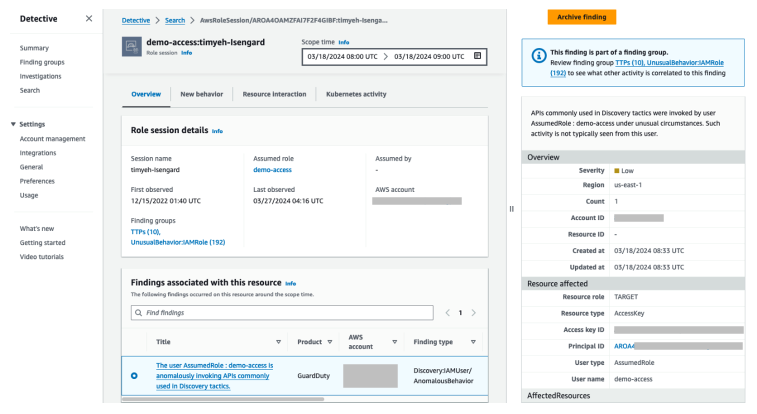
Figure 7: IAM role session page in Detective
A role session consists of an instantiation of an IAM role and the associated set of short-term credentials. A role session involves the following:
- The role that is assumed
- The entity—IAM user or role, federated user, or Amazon Elastic Compute Cloud (Amazon EC2) instance—that assumes the role
When investigating a role session, consider the following questions:
- How long has the role been active?
- Is the role routinely used?
- Has activity changed over that use?
- Was the role assumed by multiple users?
- Was it assumed by a large number of users? A narrowly used role session might guide your investigation differently from a role session with overlapping use.
You can use the principal ID to get more in-depth details using the Detective search function. Figure 8 shows the search results of an IAM role’s details. To use the search function, choose Search from the navigation pane, select Role session as the type, and enter an exact identifier or identifier with wildcard characters to search for. Note that the search is case sensitive.
When you select the assumed role link, additional information about the IAM role will be displayed, helping to verify if the role has been involved in suspicious activities.
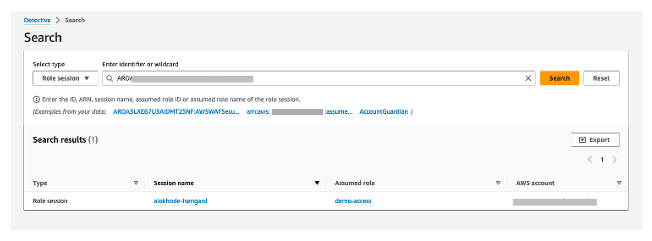
Figure 8: Results of an IAM role details search
Figure 9 shows other findings related to the role. This information is displayed by choosing the Assumed Role link in the search results.
Now you should see a new screen with information specific to the role entity that you selected. Look through the role information and gather evidence that would be important to you if you were investigating this security issue.
Were there other findings associated to the role? Was there newly observed activity during this time in terms of new behavior? Were there resource interaction associated with the role? What permissions did this role have?
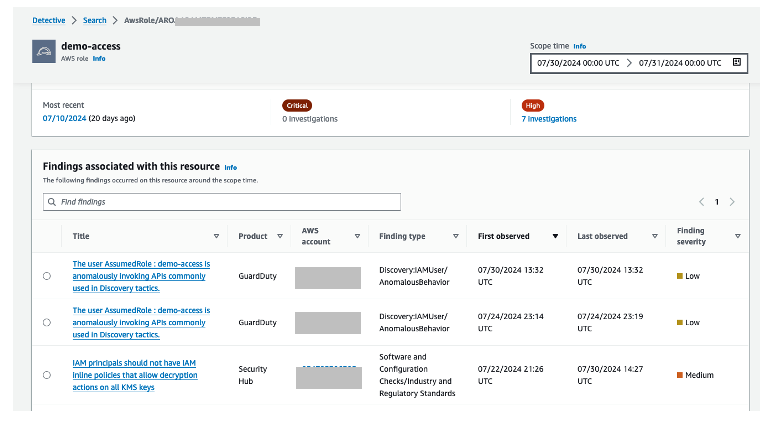
Figure 9: Other findings related to the role
In this scenario, you used Detective to investigate an IAM role session. The information that you have gathered about the security findings will help give you a better understanding of other resources that need to be remediated, how to remediate, permissions that need to be scoped down, and root cause analysis insight to include in your action reports.
Scenario 3: Threat hunter persona
Another use case is to aid in threat hunting (searching) activities. In this scenario, suspicious activity has been detected in your organization and you need to find out what resources (that is, what IAM entities) have been communicating with a command-and-control IP address. You can check from the Detective summary page for roles and users with the highest API call volume, which automatically lists the IAM roles and users that were impacted by security events over a set time scope, as shown in Figure 10.
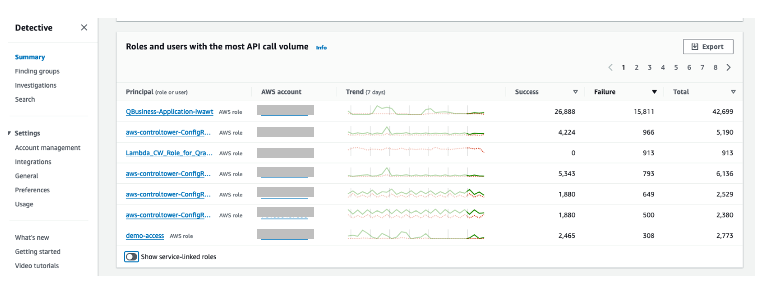
Figure 10: Roles and users with the highest API call volume
From the list of Principal (role or user) options, choose the user or role that you find interesting based on the data presented. Things to consider when choosing the role or user to examine:
- Is there a role with a large amount of failed API calls?
- Is there a role with an unusual data trend?
After choosing a role from the DetectiveSummary page, you’re taken to the role overview page. Scroll down to the Overall API call volume section to view the overall volume of API calls issued by the resource during the scope time. Detective presents this information to you in a graphical interface without the need to create complex queries.
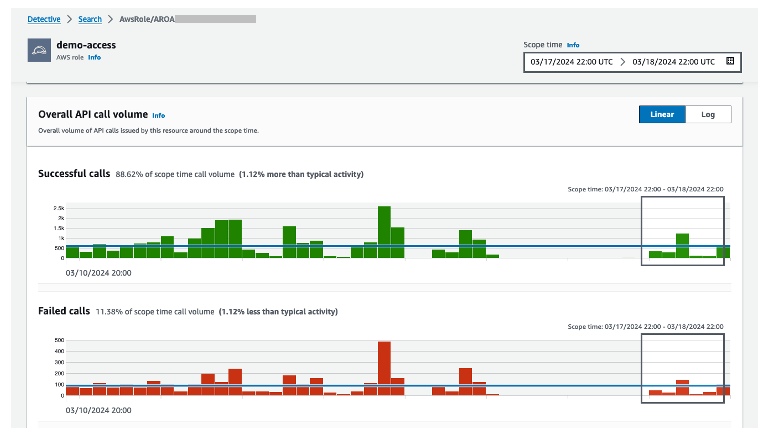
Figure 11: Graph showing API call volume
In the Overall API call volume, choose the display details for time scope button at the bottom of the section to search through the observed IP addresses, API method by service, and resource.
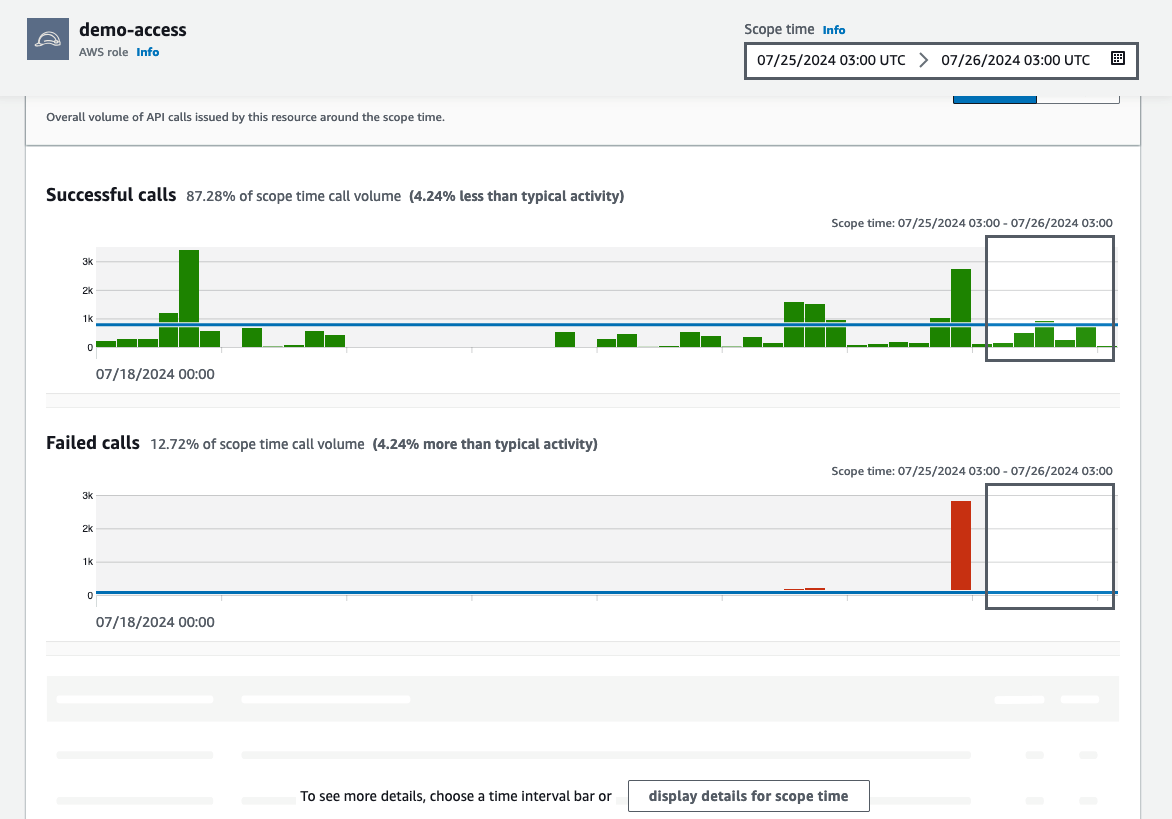 Figure 12: Overall API call volume during the specified scope time
To see the details for a specific IP address, use the Overall API call volume panel to search through different locations and to determine where the failed API calls came from. Select an IP address to get more granular details (as shown in Figure 13). When looking through this information, think about what this might tell you in your own environment.
- Do you know who normally uses this role?
- What is this role used for?
- Should this role be making calls from various geolocations?
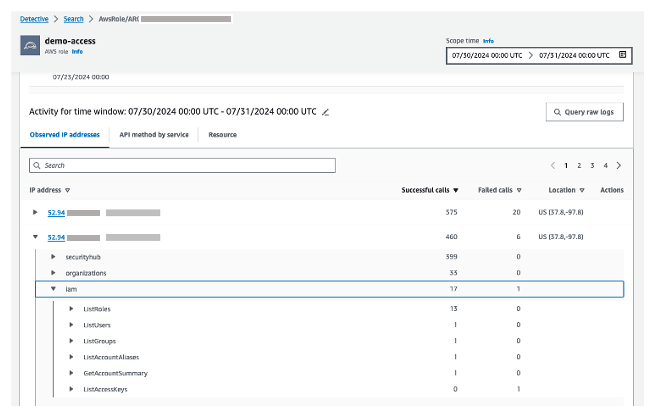
Figure 13: Granular details for the selected IP address
In this scenario, you used Detective to review potentially suspicious activity in your environment related to information assumed to be malicious. If adversaries have assumed the same role with different session names, this gives you more information about how this IAM role was used. If you find information related to the suspicious resources in question, you should conduct a formal search according to your internal incident response playbooks.
Conclusion
In this blog post, I walked you through how to investigate IAM entities (IAM users or rules) using Amazon Detective. You saw different scenarios on how to investigate IAM entities involved in a security event. You also learned about the Detective investigations for IAM feature, which you can use to automatically investigate IAM entities for indicators of compromise (IOCs), helping security analysts determine whether IAM entities have potentially been compromised or involved in known TTPs from the MITRE ATT&CK framework.
There’s no additional charge for this capability, and it’s available today for existing and new Detective customers in AWS Regions that support Detective. If you don’t currently use Detective, you can start a free 30-day trial. For more information about Detective investigations, see Detective Investigation.
If you have feedback about this post, submit comments in the Comments section below. If you have questions about this post, contact AWS Support.
Swift 6 released
Post Syndicated from jzb original https://lwn.net/Articles/990753/
Version
6.0 of the Swift programming language has been released. Notable
changes include new low-level programming features,
expanded Linux support, and a preview release of the Embedded
Swift language subset for embedded software development with a
toolchain for Arm and RISC-V targets. See the CHANGELOG
for full details of changes in 6.0.
Haiku R1/beta5 has been released
Post Syndicated from jzb original https://lwn.net/Articles/990735/
Version
R1/beta5 for the Haiku
project, an open-source “spiritual successor to BeOS
“, has been released. Notable
changes in this release include a TUN/TAP network driver, basic
support for USB audio devices, TCP throughput improvements, a
rewritten driver for the FAT filesystem, read-only support for
Unix File System 2 (UFS2), as well as hundreds of bug fixes and
performance improvements since the last release in
December 2022. Thanks to Paul Wise for the tip.
How useful do teachers find error message explanations generated by AI? Pilot research results
Post Syndicated from Veronica Cucuiat original https://www.raspberrypi.org/blog/error-message-explanations-large-language-models-teachers-views/
As discussions of how artificial intelligence (AI) will impact teaching, learning, and assessment proliferate, I was thrilled to be able to add one of my own research projects to the mix. As a research scientist at the Raspberry Pi Foundation, I’ve been working on a pilot research study in collaboration with Jane Waite to explore the topic of program error messages (PEMs).

PEMs can be a significant barrier to learning for novice coders, as they are often confusing and difficult to understand. This can hinder troubleshooting and progress in coding, and lead to frustration.
Recently, various teams have been exploring how generative AI, specifically large language models (LLMs), can be used to help learners understand PEMs. My research in this area specifically explores secondary teachers’ views of the explanations of PEMs generated by a LLM, as an aid for learning and teaching programming, and I presented some of my results in our ongoing seminar series.
Understanding program error messages is hard at the start
I started the seminar by setting the scene and describing the current background of research on novices’ difficulty in using PEMs to fix their code, and the efforts made to date to improve these. The three main points I made were that:
- PEMs are often difficult to decipher, especially by novices, and there’s a whole research area dedicated to identifying ways to improve them.
- Recent studies have employed LLMs as a way of enhancing PEMs. However, the evidence on what makes an ‘effective’ PEM for learning is limited, variable, and contradictory.
- There is limited research in the context of K–12 programming education, as well as research conducted in collaboration with teachers to better understand the practical and pedagogical implications of integrating LLMs into the classroom more generally.
My pilot study aims to fill this gap directly, by reporting K–12 teachers’ views of the potential use of LLM-generated explanations of PEMs in the classroom, and how their views fit into the wider theoretical paradigm of feedback literacy.
What did the teachers say?
To conduct the study, I interviewed eight expert secondary computing educators. The interviews were semi-structured activity-based interviews, where the educators got to experiment with a prototype version of the Foundation’s publicly available Code Editor. This version of the Code Editor was adapted to generate LLM explanations when the question mark next to the standard error message is clicked (see Figure 1 for an example of a LLM-generated explanation). The Code Editor version called the OpenAI GPT-3.5 interface to generate explanations based on the following prompt: “You are a teacher talking to a 12-year-old child. Explain the error {error} in the following Python code: {code}”.
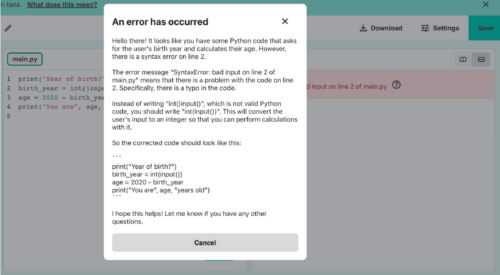
Fifteen themes were derived from the educators’ responses and these were split into five groups (Figure 2). Overall, the educators’ views of the LLM feedback were that, for the most part, a sensible explanation of the error messages was produced. However, all educators experienced at least one example of invalid content (LLM “hallucination”). Also, despite not being explicitly requested in the LLM prompt, a possible code solution was always included in the explanation.
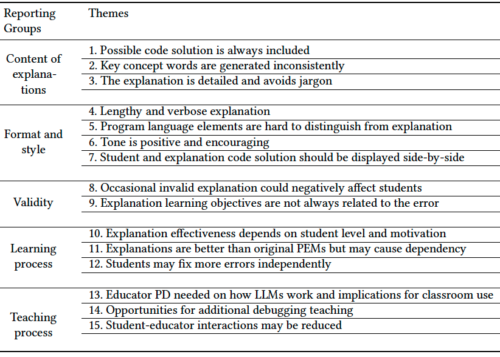
Matching the themes to PEM guidelines
Next, I investigated how the teachers’ views correlated to the research conducted to date on enhanced PEMs. I used the guidelines proposed by Brett Becker and colleagues, which consolidate a lot of the research done in this area into ten design guidelines. The guidelines offer best practices on how to enhance PEMs based on cognitive science and educational theory empirical research. For example, they outline that enhanced PEMs should provide scaffolding for the user, increase readability, reduce cognitive load, use a positive tone, and provide context to the error.
Out of the 15 themes identified in my study, 10 of these correlated closely to the guidelines. However, the 10 themes that correlated well were, for the most part, the themes related to the content of the explanations, presentation, and validity (Figure 3). On the other hand, the themes concerning the teaching and learning process did not fit as well to the guidelines.
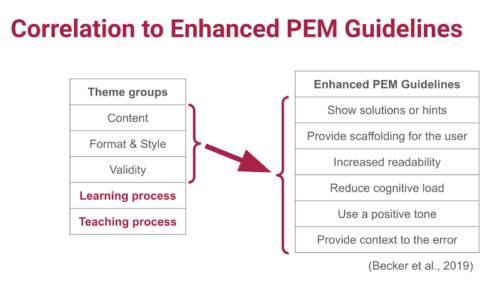
Does feedback literacy theory fit better?
However, when I looked at feedback literacy theory, I was able to correlate all fifteen themes — the theory fits.
Feedback literacy theory positions the feedback process (which includes explanations) as a social interaction, and accounts for the actors involved in the interaction — the student and the teacher — as well as the relationships between the student, the teacher, and the feedback. We can explain feedback literacy theory using three constructs: feedback types, student feedback literacy, and teacher feedback literacy (Figure 4).
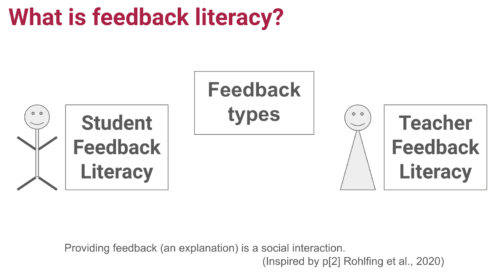
From the feedback literacy perspective, feedback can be grouped into four types: telling, guiding, developing understanding, and opening up new perspectives. The feedback type depends on the role of the student and teacher when engaging with the feedback (Figure 5).
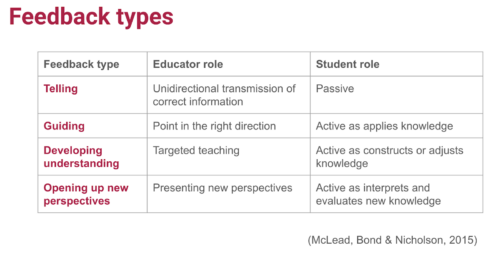
From the student perspective, the competencies and dispositions students need in order to use feedback effectively can be stated as: appreciating the feedback processes, making judgements, taking action, and managing affect. Finally, from a teacher perspective, teachers apply their feedback literacy skills across three dimensions: design, relational, and pragmatic.
In short, according to feedback literacy theory, effective feedback processes entail well-designed feedback with a clear pedagogical purpose, as well as the competencies students and teachers need in order to make sense of the feedback and use it effectively.

This theory therefore provided a promising lens for analysing the educators’ perspectives in my study. When the educators’ views were correlated to feedback literacy theory, I found that:
- Educators prefer the LLM explanations to fulfil a guiding and developing understanding role, rather than telling. For example, educators prefer to either remove or delay the code solution from the explanation, and they like the explanations to include keywords based on concepts they are teaching in the classroom to guide and develop students’ understanding rather than tell.
- Related to students’ feedback literacy, educators talked about the ways in which the LLM explanations help or hinder students to make judgements and action the feedback in the explanations. For example, they talked about how detailed, jargon-free explanations can help students make judgments about the feedback, but invalid explanations can hinder this process. Therefore, teachers talked about the need for ways to manage such invalid instances. However, for the most part, the educators didn’t talk about eradicating them altogether. They talked about ways of flagging them, using them as counter-examples, and having visibility of them to be able to address them with students.
- Finally, from a teacher feedback literacy perspective, educators discussed the need for professional development to manage feedback processes inclusive of LLM feedback (design) and address issues resulting from reduced opportunities to interact with students (relational and pragmatic). For example, if using LLM explanations results in a reduction in the time teachers spend helping students debug syntax errors from a pragmatic time-saving perspective, then what does that mean for the relationship they have with their students?
Conclusion from the study
By correlating educators’ views to feedback literacy theory as well as enhanced PEM guidelines, we can take a broader perspective on how LLMs might not only shape the content of the explanations, but the whole social interaction around giving and receiving feedback. Investigating ways of supporting students and teachers to practise their feedback literacy skills matters just as much, if not more, than focusing on the content of PEM explanations.
This study was a first-step exploration of eight educators’ views on the potential impact of using LLM explanations of PEMs in the classroom. Exactly what the findings of this study mean for classroom practice remains to be investigated, and we also need to examine students’ views on the feedback and its impact on their journey of learning to program.
If you want to hear more, you can watch my seminar:
You can also read the associated paper, or find out more about the research instruments on this project website.
If any of these ideas resonated with you as an educator, student, or researcher, do reach out — we’d love to hear from you. You can contact me directly at [email protected] or drop us a line in the comments below.
Join our next seminar
The focus of our ongoing seminar series is on teaching programming with or without AI. Check out the schedule of our upcoming seminars.
To take part in the next seminar, click the button below to sign up, and we will send you information about how to join. We hope to see you there.
You can also catch up on past seminars on our blog and on the previous seminars and recordings page.
The post How useful do teachers find error message explanations generated by AI? Pilot research results appeared first on Raspberry Pi Foundation.
[$] Kernel developers at Cauldron
Post Syndicated from corbet original https://lwn.net/Articles/990379/
A Linux system is made up of a large number of interdependent components,
all of which must support each other well. It can thus be surprising that,
it seems, the developers working on those components do not often speak
with each other. In the hope of improving that situation, efforts have
been made in recent years to attract toolchain developers to the
kernel-heavy Linux Plumbers Conference. This year, though, the opposite
happened as well: the 2024
GNU Tools Cauldron hosted a discussion where kernel developers were
invited to discuss their needs.
Mammotion Robot Mower – Luba 2 vs Yuka : The Truth About the Loser
Post Syndicated from digiblur DIY original https://www.youtube.com/watch?v=X_KaZWv0r4A
LLVM 19.1.0 released
Post Syndicated from jzb original https://lwn.net/Articles/990706/
Version
19.1.0 of the LLVM compiler suite has been released:
This is the first release in the LLVM 19.x series and represents 6
months of work the LLVM community. During this period 1502 unique
authors contributed 18925 commits (3605729 lines added and 1665792
lines removed) to LLVM.
As usual, there is a long list of changes; see the release notes
for LLVM,
Libc++,
lld,
Clang,
and Extra
Clang Tools for changes to each.
Security updates for Wednesday
Post Syndicated from jzb original https://lwn.net/Articles/990731/
Security updates have been issued by AlmaLinux (pcs), Debian (expat, galera-4, libreoffice, mariadb-10.5, and php-twig), Fedora (chromium), Red Hat (ghostscript and git), SUSE (gstreamer-plugins-bad, gstreamer-plugins-bad, libvpl, python-dnspython, python3, and python36), and Ubuntu (expat, frr, libxmltok, linux-xilinx-zynqmp, openssl, and quagga).
Get to know Amazon GuardDuty Runtime Monitoring for Amazon EC2
Post Syndicated from Scott Ward original https://aws.amazon.com/blogs/security/get-to-know-amazon-guardduty-runtime-monitoring-for-amazon-ec2/
In this blog post, I take you on a deep dive into Amazon GuardDuty Runtime Monitoring for EC2 instances and key capabilities that are part of the feature. Throughout the post, I provide insights around deployment strategies for Runtime Monitoring and detail how it can deliver security value by detecting threats against your Amazon Elastic Compute Cloud (Amazon EC2) instances and the workloads you run on them. This post builds on the post by Channy Yun that outlines how to enable Runtime Monitoring, how to view the findings that it produces, and how to view the coverage it provides across your EC2 instances.
Amazon Web Services (AWS) launched Amazon GuardDuty at re:Invent 2017 with a focus on providing customers managed threat detection capabilities for their AWS accounts and workloads. When enabled, GuardDuty takes care of consuming and processing the necessary log data. Since its launch, GuardDuty has continued to expand its threat detection capabilities. This expansion has included identifying new threat types that can impact customer environments, identifying new threat tactics and techniques within existing threat types and expanding the log sources consumed by GuardDuty to detect threats across AWS resources. Examples of this expansion include the ability to detect EC2 instance credentials being used to invoke APIs from an IP address that’s owned by a different AWS account than the one that the associated EC2 instance is running in, and the ability to identify threats to Amazon Elastic Kubernetes Services (Amazon EKS) clusters by analyzing Kubernetes audit logs.
GuardDuty has continued to expand its threat detection capabilities beyond AWS log sources, providing a more comprehensive coverage of customers’ AWS resources. Specifically, customers needed more visibility around threats that might occur at the operating system level of their container and compute instances. To address this customer need, GuardDuty released the Runtime Monitoring feature, beginning with support on Amazon Elastic Kubernetes Service (Amazon EKS) workloads. Runtime Monitoring provides operating system insight for GuardDuty to use in detecting potential threats to workloads running on AWS and enabled the operating system visibility that customers were asking for. At re:Invent 2023, GuardDuty expanded Runtime Monitoring to include Amazon Elastic Container Service (Amazon ECS)—including serverless workloads running on AWS Fargate, and previewed support for Amazon EC2, which became generally available earlier this year. The release of EC2 Runtime Monitoring enables comprehensive compute coverage for GuardDuty across containers and EC2 instances, delivering breadth and depth for threat detection in these areas.
Features and functions
GuardDuty EC2 Runtime Monitoring relies on a lightweight security agent that collects operating system events—such as file access, processes, command line arguments, and network connections—from your EC2 instance and sends them to GuardDuty. After the operating system events are received by GuardDuty, they’re evaluated to identify potential threats related to the EC2 instance. In this section, we explore how GuardDuty is evaluating the runtime events it receives and how GuardDuty presents identified threat information.
Command arguments and event correlation
The runtime security agent enables GuardDuty to create findings that can’t be created using the foundational data sources of VPC Flow Logs, DNS logs, and CloudTrail logs. The security agent can collect detailed information about what’s happening at the instance operating system level that the foundational data sources don’t contain.
With the release of EC2 Runtime Monitoring, additional capabilities have been added to the runtime agent and to GuardDuty. The additional capabilities include collecting command arguments and correlation of events for an EC2 instance. These new capabilities help to rule out benign events and more accurately generate findings that are related to activities that are associated with a potential threat to your EC2 instance.
Command arguments
The GuardDuty security agent collects information on operating system runtime commands (curl, systemctl, cron, and so on) and uses this information to generate findings. The security agent now also collects the command arguments that were used as part of running a command. This additional information gives GuardDuty more capabilities to detect threats because of the additional context related to running a command.
For example, the agent will not only identify that systemctl (which is used to manage services on your Linux instance) was run but also which parameters the command was run with (stop, start, disable, and so on) and for which service the command was run. This level of detail helps identify that a threat actor might be changing security or monitoring services to evade detection.
Event correlation
GuardDuty can now also correlate multiple events collected using the runtime agent to identify scenarios that present themselves as a threat to your environment. There might be events that happen on your instance that, on their own, don’t present themselves as a clear threat. These are referred to as weak signals. However, when these weak signals are considered together and the sequence of commands aligns to malicious activity, GuardDuty uses that information to generate a finding. For example, a download of a file would present itself as a weak signal. If that download of a file is then piped to a shell command and the shell command begins to interact with additional operating system files or network configurations, or run known malware executables, then the correlation of all these events together can lead to a GuardDuty finding.
GuardDuty finding types
GuardDuty Runtime Monitoring currently supports 41 finding types to indicate potential threats based on the operating system-level behavior from the hosts and containers in your Amazon EKS clusters on Amazon EC2, Amazon ECS on Fargate and Amazon EC2, and EC2 instances. These findings are based on the event types that the security agent collects and sends to the GuardDuty service.
Five of these finding types take advantage of the new capabilities of the runtime agent and GuardDuty, which were discussed in the previous section of this post. These five new finding types are the following:
- Execution:Runtime/SuspiciousTool
- Execution:Runtime/SuspiciousCommand
- DefenseEvasion:Runtime/SuspiciousCommand
- DefenseEvasion:Runtime/PtraceAntiDebugging
- Execution:Runtime/MaliciousFileExecuted
Each GuardDuty finding begins with a threat purpose, which is aligned with MITRE ATT&CK tactics. The Execution finding types are focused on observed threats to the actual running of commands or processes that align to malicious activity. The DefenseEvasion finding types are focused on situations where commands are run that are trying to disable defense mechanisms on the instance, which would normally be used to identify or help prevent the activity of a malicious actor on your instance.
In the following sections, I go into more detail about the new Runtime Monitoring finding types and the types of malicious activities that they are identifying.
Identifying suspicious tools and commands
The SuspiciousTool, SuspiciousCommand, and PtraceAntiDebugging finding types are focused on suspicious activities, or those that are used to evade detection. The approach to identify these types of activities is similar. The SuspiciousTool finding type is focused on tools such as backdoor tools, network scanners, and network sniffers. GuardDuty helps to identify the cases where malicious activities related to these tools are occurring on your instance.
The SuspiciousCommand finding type identifies suspicious commands with the threat purposes of DefenseEvasion or Execution. The DefenseEvasion findings are an indicator of an unauthorized user trying to hide their actions. These actions could include disabling a local firewall, modifying local IP tables, or removing crontab entries. The Execution findings identify when a suspicious command has been run on your EC2 instance. The findings related to Execution could be for a single suspicious command or a series of commands, which, when combined with a series of other commands along with additional context, becomes a clearer indicator of suspicious activity. An example of an Execution finding related to combining multiple commands could be when a file is downloaded and is then run in a series of steps that align with a known malicious pattern.
For the PtraceAntiDebugging finding, GuardDuty is looking for cases where a process on your instance has used the ptrace system call with the PTRACE_TRACEME option, which causes an attached debugger to detach from the running process. This is a suspicious activity because it allows a process to evade debugging using ptrace and is a known technique that malware uses to evade detection.
Identifying running malicious files
The updated GuardDuty security agent can also identify when malicious files are run. With the MaliciousFileExecuted finding type, GuardDuty can identify when known malicious files might have been run on your EC2 instance, providing a strong indicator that malware is present on your instance. This capability is especially important because it allows you to identify known malware that might have been introduced since your last malware scan.
Finding details
All of the findings mentioned so far are consumable through the AWS Management Console for GuardDuty, through the GuardDuty APIs, as Amazon EventBridge messages, or through AWS Security Hub. The findings that GuardDuty generates are meant to not only tell you that a suspicious event has been observed on your instance, but also give you enough context to formulate a response to the finding.
The GuardDuty security agent collects a variety of events from the operating system to use for threat detection. When GuardDuty generates a finding based on observed runtime activities, it will include the details of these observed events, which can help with confirmation on what the threat is and provide you a path for possible remediation steps based on the reported threat. The information provided in a GuardDuty runtime finding can be broken down into three main categories:
- Information about the impacted AWS resource
- Information about the observed processes that were involved in the activity
- Context related to the runtime events that were observed
Impacted AWS resources
In each finding that GuardDuty produces, information about the impacted AWS resource will be included. For EC2 Runtime Monitoring, the key information included will be information about the EC2 instance (such as name, instance type, AMI, and AWS Region), tags that are assigned to the instance, network interfaces, and security groups. This information will help guide your response and investigation to the specific instance that’s identified for the observed threat. It’s also useful in assessing key network configurations of the instance that could assist with confirming whether the network configuration of the instance is correct or assessing how the network configuration might factor into the response.
Process details
For each runtime finding, GuardDuty includes the details that were observed about the process attributed to the threat that the finding is for. Common items that you should expect to see include the name of the executable and the path to the executable that resulted in the finding being created, the ID of the operating system process, when the process started, and which operating system user ran the process. Additionally, process lineage is included in the finding. Process lineage helps identify operating system processes that are related to each other and provides insight into the parent processes that were run leading up to the identified process. Understanding this lineage can give you valuable insight into what the root cause of the malicious process identified in the finding might be; for example, being able to identify which other commands were run that ultimately led to the activation of the executable or command identified in the finding. If the process attributed to the finding is running inside a container, the finding also provides container details such as the container ID and image.
Runtime context
Runtime context provides insight on things such as file system type, flags that were used to control the behavior of the event, name of the potentially suspicious tool, path to the script that generated the finding, and the name of the security service that was disabled. The context information in the finding is intended to help you further understand the runtime activity that was identified as a threat and determine its potential impact and what your response might be. For example, a command that is detected by using the systemctl command to disable the apparmor utility would report the process information related to running the systemctl command, and then the runtime context would contain the name of the actual service that was impacted by the systemctl command call and the options used with the command.
See Runtime Monitoring finding details for a full list of the process and context details that might be present in your runtime findings.
Responding to runtime findings
With GuardDuty findings, it’s a best practice to enable an event-based response that can be invoked as soon as the runtime finding is generated. This approach holds true for runtime related findings as well. For every runtime finding that GuardDuty generates, a copy of the finding is sent to EventBridge. If you use Security Hub, a copy of the finding is sent to Security Hub as well. With EventBridge, you can define a rule with a pattern that matches the finding attributes you want to prioritize and respond to. This pattern could be very broad in looking for all runtime-related findings. Or, it could be more specific, only looking for certain finding types, findings of a certain severity, or even certain attributes related to the process or runtime context of a finding.
After the rule pattern is established, you can define a target that the finding should be sent to. This target can be one of over 20 AWS services, which gives you lots of flexibility in routing the finding into the operational tools or processes that are used by your company. The target could be an AWS Lambda function that’s responsible for evaluating the finding, adding some additional data to the finding, and then sending it to a ticketing or chat tool. The target could be an AWS Systems Manager runbook, which would be used on the actual operating system to perform additional forensics or to isolate or disable any processes that are identified in the finding.
Many customers take a stepped approach in their response to GuardDuty findings. The first step might be to make sure that the finding is enriched with as many supporting details as possible and sent to the right individual or team. This helps whoever’s investigating the finding to confirm that the finding is a true positive, further informing the decision on what action to take.
In addition to having an event-based response to GuardDuty findings, you can investigate each GuardDuty runtime finding in the GuardDuty or Security Hub console. Through the console, you can research the details of the finding and use the information to inform the next steps to respond to or remediate the finding.
Speed to detection
With its close proximity to your workloads, the GuardDuty security agent can produce findings more quickly when compared to processing log sources such as VPC Flow Logs and DNS logs. The security agent collects operating system events and forwards them directly to the GuardDuty service, examining events and generating findings more quickly. This helps you to formulate a response sooner so that you can isolate and stop identified threats to your EC2 instances.
Let’s examine a finding type that can be detected by both the runtime security agent and by the foundational log sources of AWS CloudTrail, VPC Flow Logs, and DNS logs. Backdoor:EC2/C&CActivity.B!DNS and Backdoor:Runtime/C&CActivity.B!DNS are the same finding with one coming from DNS logs and one coming from the runtime security agent. While GuardDuty doesn’t have a service-level agreement (SLA) on the time it takes to consume the findings for a log source or the security agent, testing for these finding types reveals that the runtime finding is generated in just a few minutes. Log file-based findings will take around 15 minutes to produce because of the latency of log file delivery and processing. In the end, these two findings mean the same thing, but the runtime finding will arrive faster and with additional process and context information, helping you implement a response to the threat sooner and improve your ability to isolate, contain, and stop the threat.
Runtime data and flow logs data
When exploring the Runtime Monitoring feature and its usefulness for your organization, a key item to understand is the foundational level of protection for your account and workloads. When you enable GuardDuty the foundational data sources of VPC Flow Logs, DNS logs, and CloudTrail logs are also enabled, and those sources cannot be turned off without fully disabling GuardDuty. Runtime Monitoring provides contextual information that allows for more precise findings that can help with targeted remediation compared to the information provided in VPC Flow Logs. When the Runtime Monitoring agent is deployed onto an instance, the GuardDuty service still processes the VPC Flow Logs and DNS logs for that instance. If, at any point in time, an unauthorized user tampers with your security agent or an instance is deployed without the security agent, GuardDuty will continue to use VPC Flow Logs and DNS logs data to monitor for potential threats and suspicious activity, providing you defense in depth to help ensure you have visibility and coverage for detecting threats.
Note: GuardDuty doesn’t charge you for processing VPC Flow Logs while the Runtime Monitoring agent is active on an instance.
Deployment strategies
There are multiple strategies that you can use to install the GuardDuty security agent on an EC2 instance, and it’s important to use the one that fits best based on how you deploy and maintain instances in your environment. The following are agent installation options that cover managed installation, tag-based installation, and manual installation techniques. The managed installation approach is a good fit for most customers, but the manual options are potentially better if you have existing processes that you want to maintain or you want the more fine-grained features provided by agent installation compared to the managed approach.
Note: GuardDuty requires that each VPC, with EC2 instances running the GuardDuty agent, has a VPC endpoint that allows the agent to communicate with the GuardDuty service. You aren’t charged for the cost of these VPC endpoints. When you’re using the GuardDuty managed agent feature, GuardDuty will automatically create and operate these VPC endpoints for you. For the other agent deployment options listed in this section, or other approaches that you take, you must manually configure the VPC endpoint for each VPC where you have EC2 instances that will run the GuardDuty agent. See Creating VPC endpoint manually for additional details.
GuardDuty-managed installation
If you want to use security agents to monitor runtime activity on your EC2 instances but don’t want to manage the installation and lifecycle of the agent on specific instances, then Automated agent configuration is the option for you. For GuardDuty to successfully manage agent installation, each EC2 instance must meet the operating system architectural requirements of the security agent. Additionally, each instance must have the Systems Manager agent installed and configured with the minimal instance permissions that System Manager requires.
In addition to making sure that your instances are configured correctly, you also need to enable automated agent configuration for your EC2 instances in the Runtime Monitoring section of the GuardDuty console. Figure 1 shows what this step looks like.

Figure 1: Enable GuardDuty automated agent configuration for Amazon EC2
After you have enabled automated agent configuration and have your instances correctly configured, GuardDuty will install and manage the security agent for every instance that is configured.
GuardDuty-managed with explicit tagging
If you want to selectively manage installation of the GuardDuty agent but still want automated deployment and updates, you can use inclusion or exclusion tags to control which instances the agent is installed to.
- Inclusion tags allow you to specify which EC2 instances the GuardDuty security agent should be installed to without having to enable automated agent configuration. To use inclusion tags, each instance where the security agent should be installed needs to have a key-value pair of
GuardDutyManaged/true. While you don’t need to turn on automated agent configuration to use inclusion tags, each instance that you tag for agent installation needs to have the Systems Manager agent installed and the appropriate permissions attached to the instance using an instance role. - Exclusion tags allow you to enable automated agent configuration, and then selectively manage which instances the agent shouldn’t be deployed to. To use exclusion tags, each instance that shouldn’t have an instance installed needs to have a key-value pair of
GuardDutyManaged/false.
You can use selective installation for a variety of use cases. If you’re doing a proof of concept with EC2 Runtime Monitoring, you might want to deploy the solution to a subset of your instances and then gradually onboard additional instances. At times, you might want to limit agent installation to instances that are deployed into certain environments or applications that are a priority for runtime monitoring. Tagging resources associated with these workloads helps ensure that monitoring is in place for resources that you want to prioritize for runtime monitoring. This strategy gives you more fine-grained control but also requires more work and planning to help ensure that the strategy is implemented correctly.
With a tag-based strategy it is important to understand who is allowed to add or remove tags to your EC2 instances as this influences when security controls are enabled or disabled. A review of your IAM roles and policies for tagging permissions is recommended to help ensure that the appropriate principals have access to this tagging capability. This IAM document provides an example of how you may limit tagging capabilities within a policy. The approach you take will depend on how you are using policies within your environment.
Manual agent installation options
If you don’t want to run the Systems Manager agent that powers the automated agent configuration, or if you have your own strategy to install and configure software on your EC2 instances, there are other deployment options that are better suited for your situation. The following are multiple approaches that you can use to manually install the GuardDuty agent for Runtime Monitoring. See Installing the security agent manually for general pointers on the recommended manual installation steps. With manual installation, you’re responsible for updating the GuardDuty security agent when new versions of the agent are released. Updating the agent can often be performed using the same techniques as installing the agent.
EC2 Image Builder
Your EC2 deployment strategy might be to build custom Amazon EC2 machine images that are then used as the approved machine images for your organization’s workloads. One option for installing the GuardDuty runtime agent as part of a machine image build is to use EC2 Image Builder. Image Builder simplifies the building, testing, and deployment of virtual machine and container images for use on AWS. With Image Builder, you define an image pipeline that includes a recipe with a build component for installing the GuardDuty Runtime Monitoring RPM. This approach with Image Builder helps ensure that your pre-built machine image includes the necessary components for EC2 Runtime Monitoring so that the necessary security monitoring is in place as soon as your instances are launched.
Bootstrap
Some customers prefer to configure their EC2 instances as they’re launched. This is commonly done through the user data field of an EC2 instance definition. For EC2 Runtime Monitoring agent installation, you would add the steps related to download and install of the runtime RPM as part of your user data script. The steps that you would add to your user data script are outlined in the Linux Package Managers method of Installing the security agent manually.
Other tools
In addition to the preceding steps, there are other tools that you can use when you want to incorporate the installation of the GuardDuty runtime monitoring agent. Tools such as Packer for building EC2 images, and Ansible, Chef, and Puppet for instance automation can be used to run the necessary steps to install the runtime agent onto the necessary EC2 instances. See Installing the security agent manually for guidance on the installation commands you would use with these tools.
Conclusion
Through customer feedback, GuardDuty has enhanced its threat detection capabilities with the Runtime Monitoring feature and you can now use it to deploy the same security agent across different compute services in AWS for runtime threat detection. Runtime monitoring provides an additional level of visibility that helps you achieve your security goals for your AWS workloads.
This post outlined the GuardDuty EC2 Runtime Monitoring feature, how you can implement the feature on your EC2 instances, and the security value that the feature provides. The insight provided in this post is intended to help you better understand how EC2 Runtime Monitoring can benefit you in achieving your security goals related to identifying and responding to threats.
To learn more about GuardDuty and its Runtime Monitoring capabilities, see Runtime Monitoring in GuardDuty.
If you have feedback about this post, submit comments in the Comments section below. If you have questions about this post, contact AWS Support.
HPE ProLiant DL145 Server Launched Edge AMD EPYC 8004 Server
Post Syndicated from Cliff Robinson original https://www.servethehome.com/hpe-proliant-dl145-server-launched-edge-amd-epyc-8004-server/
The HPE ProLiant DL145 Gen11 is a 2U edge server that sports the AMD EPYC 8004 Siena procesor line for efficient computing
The post HPE ProLiant DL145 Server Launched Edge AMD EPYC 8004 Server appeared first on ServeTheHome.
The Weird History of Grapefruit
Post Syndicated from The History Guy: History Deserves to Be Remembered original https://www.youtube.com/watch?v=aSTEpS2CYrY
We’re Allowed to Be Here
Post Syndicated from The Atlantic original https://www.youtube.com/watch?v=7Ktat6o6Pq0