Post Syndicated from João Tomé original https://blog.cloudflare.com/paris-2024-olympics-recap

The Paris 2024 Summer Olympics wrapped up on August 11, 2024, with the Olympic flag being lowered in the Stade de France after 16 days of competitions. With 329 events across 32 sports, over 10,000 athletes from 204 nations participated in the pursuit of medals and glory, creating some viral online moments along the way. In this post, we turn our attention to the closing ceremony, the impact of various Olympic moments on Internet traffic, and the cyber attacks faced by sponsors. We also examine email trends related to the Olympics, including mentions of Simone Biles, Snoop Dogg, and Imane Khelif.
Cloudflare has a global presence with data centers in over 330 cities, supporting millions of customers with different tools and products, which provides a global view of what’s happening on the Internet. This is helpful for improving security, privacy, efficiency, and speed, but also for observing Internet disruptions and traffic trends.
In our previous blog post about the opening ceremony and the early days of the event, we showed how France was impacted by the Olympics, with clear drops in traffic during the main events. The opening ceremony caused the most significant drop—traffic decreased by as much as 20% compared to the previous week. Other countries were also less online during that time, spending more time on broadcast TV.
Closing ceremony impact in France

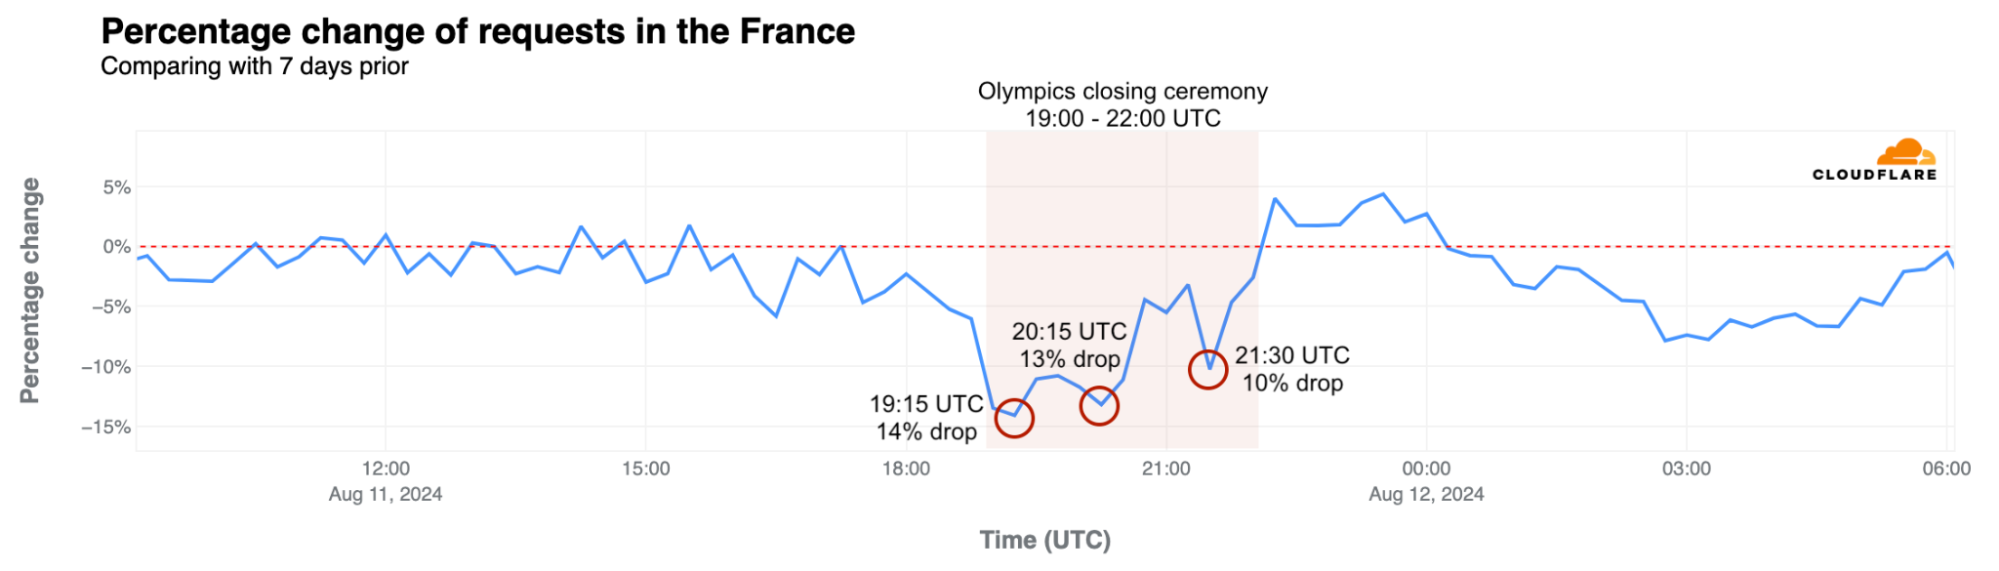
More than two weeks after the Summer Olympics began, the 3-hour closing ceremony on August 11, 2024, had a similar impact as the opening ceremony did on Internet traffic in France, although less pronounced. Internet traffic dropped by as much as 14% compared to the previous week at the start of the ceremony, around 19:15 UTC. Here is a breakdown of the top three traffic drops compared to the previous week during the ceremony, detailing the events occurring at those times. Our data provides insights with 15-minute granularity.
Moments of the closing ceremony by traffic drop in France
| Time of drop (UTC) | Drop % | Events at the time | |
|---|---|---|---|
| #1 | ~19:15 | -14% | Léon Marchand, France’s swimming star, carried a lantern from the Cauldron at the Jardins des Tuileries to the Stade de France. Flags of all National Olympic Committees entered the stadium, followed by the athletes. |
| #2 | ~20:15 | -13% | A Golden Voyager, inspired by French history, descended from the sky, followed by Nike, the Goddess of Victory. In the stands, LED bracelets—similar to those used at Taylor Swift concerts—created images of athletes, doves of peace, and the Olympic Rings. |
| #3 | ~21:30 | -10% | Californian artist H.E.R. performed the U.S. national anthem and introduced Tom Cruise, who performed Mission Impossible stunts to transport the Olympic flag from Paris to Los Angeles. |
During the closing ceremony, from 19:00 to 22:00 UTC, traffic in France was significantly lower than the previous week, down between 3% – 14%. The decreases were less pronounced during the middle and end of the event. Internet requests increased during band performances and the official closing speeches. Traffic also rose during Yseult’s finale, singing a rendition of Frank Sinatra’s “My Way,” contrasting with the significant drop during Celine Dion’s performance at the end of the opening ceremony.
In exploring traffic trends for other countries, we found that the closing ceremony didn’t have as clear an impact as the opening event did.
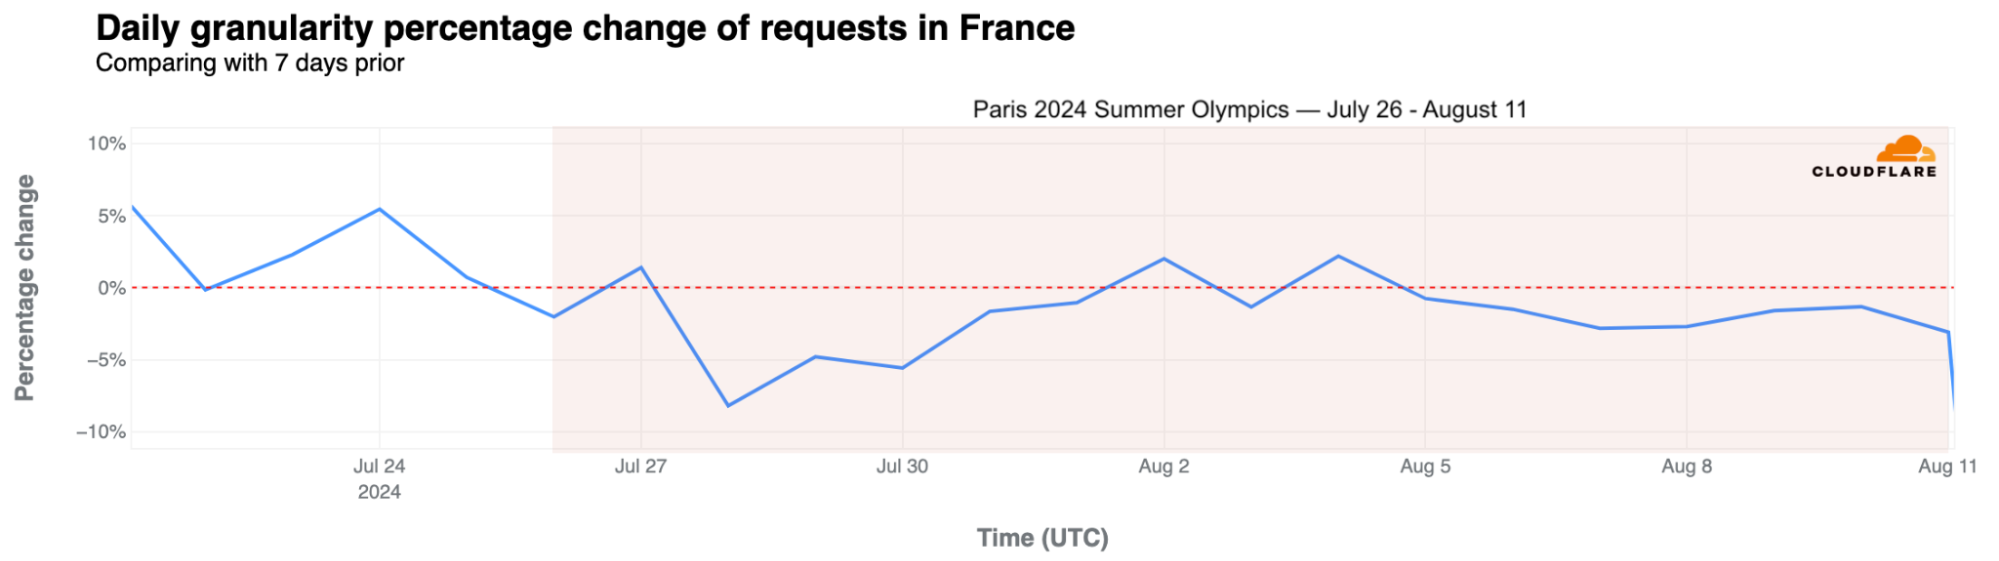
Taking a broader look at traffic in France during the entire Olympic period, daily traffic dropped by as much as 8% on July 28 but remained fairly stable afterward, with a 3% drop on August 8.
Mobile device use rose in France
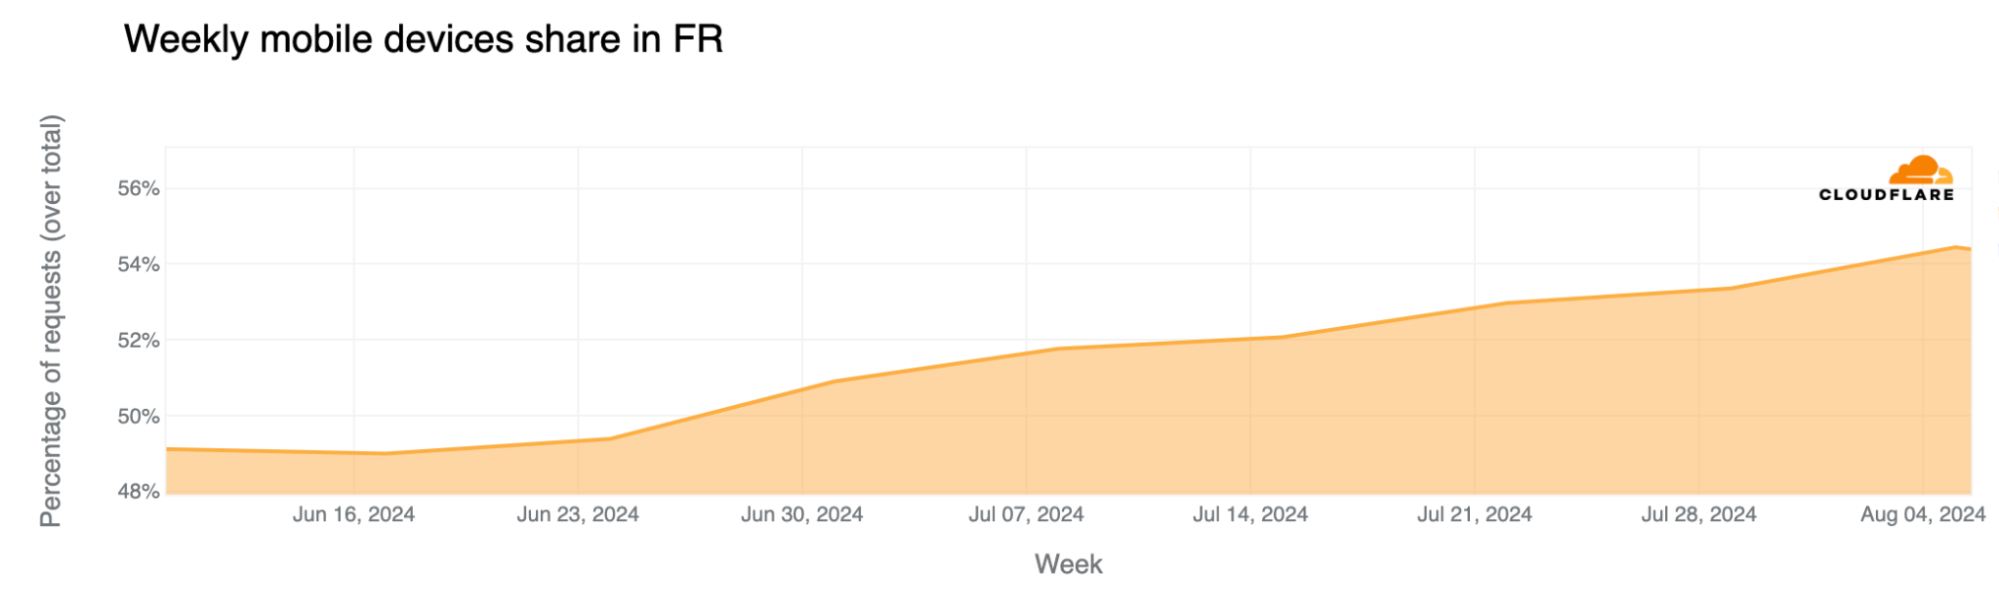
Mobile device traffic share continued to grow during the event, with more people using mobile devices to access the Internet. This trend of more mobile use in France aligns not only with more tourists and visitors in the country during the Olympics – visitors more typically use mobile devices to access the Internet – but also with French people taking vacations and working less during this time. Weekly mobile device traffic share in France in mid-June was 49%, and since the Olympics started, it has increased to between 53% and 54%.
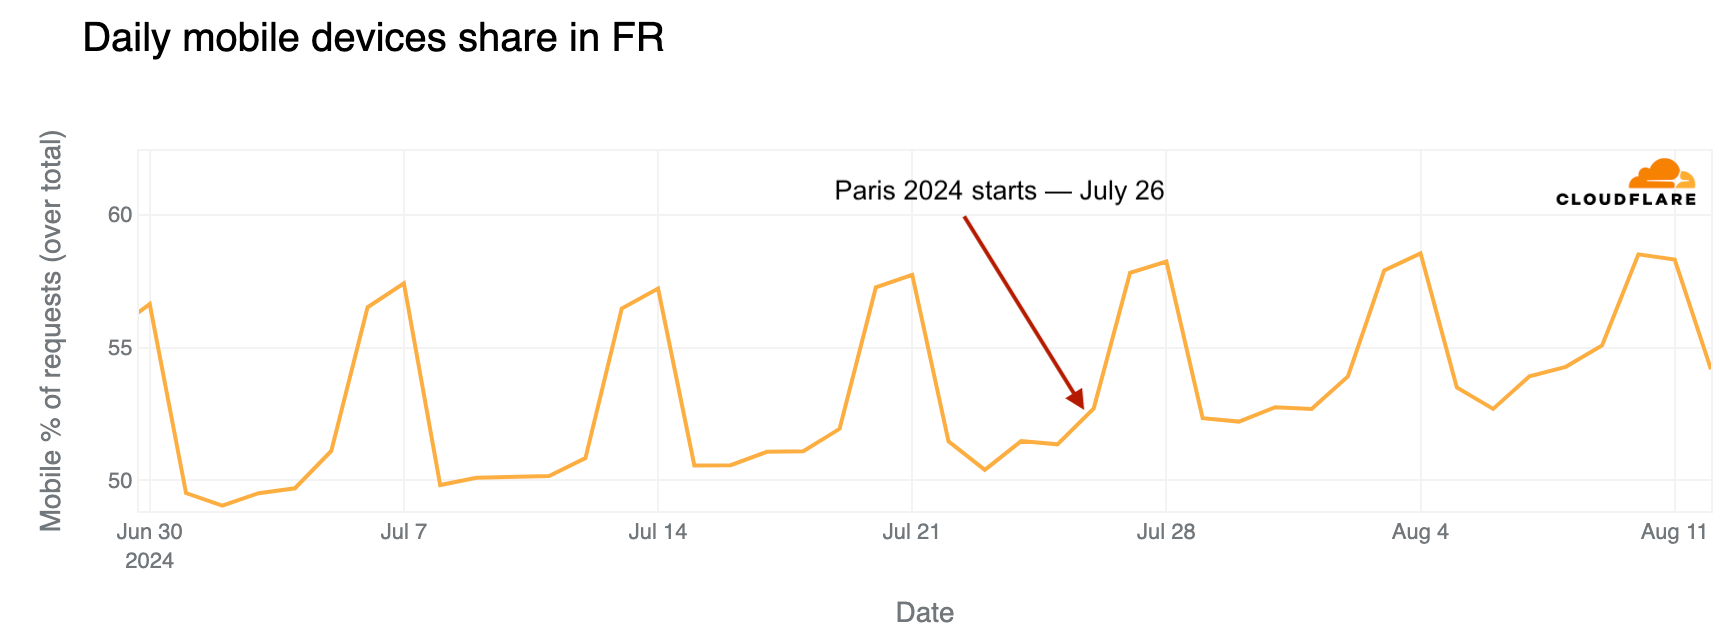
In France, mobile device use is higher on weekends. However, looking at daily trends, mobile traffic share on weekdays was clearly higher after July 26, when the Olympics began.
Parisians left, Olympic tourists arrived
We’ve seen before that Parisians appeared to left town (and the region) just before the Olympics. In the Paris region of Île-de-France, with the Olympics, traffic during the first week of the event dropped as much as 6% on July 30, compared to the previous week. Traffic picked up a bit on the second weekend of the Olympics but dropped even more during the second and final week.
The chart below illustrates daily traffic to the Île-de-France region, with a noticeable decline visible during the weekend before the Olympics that was more pronounced during the event.
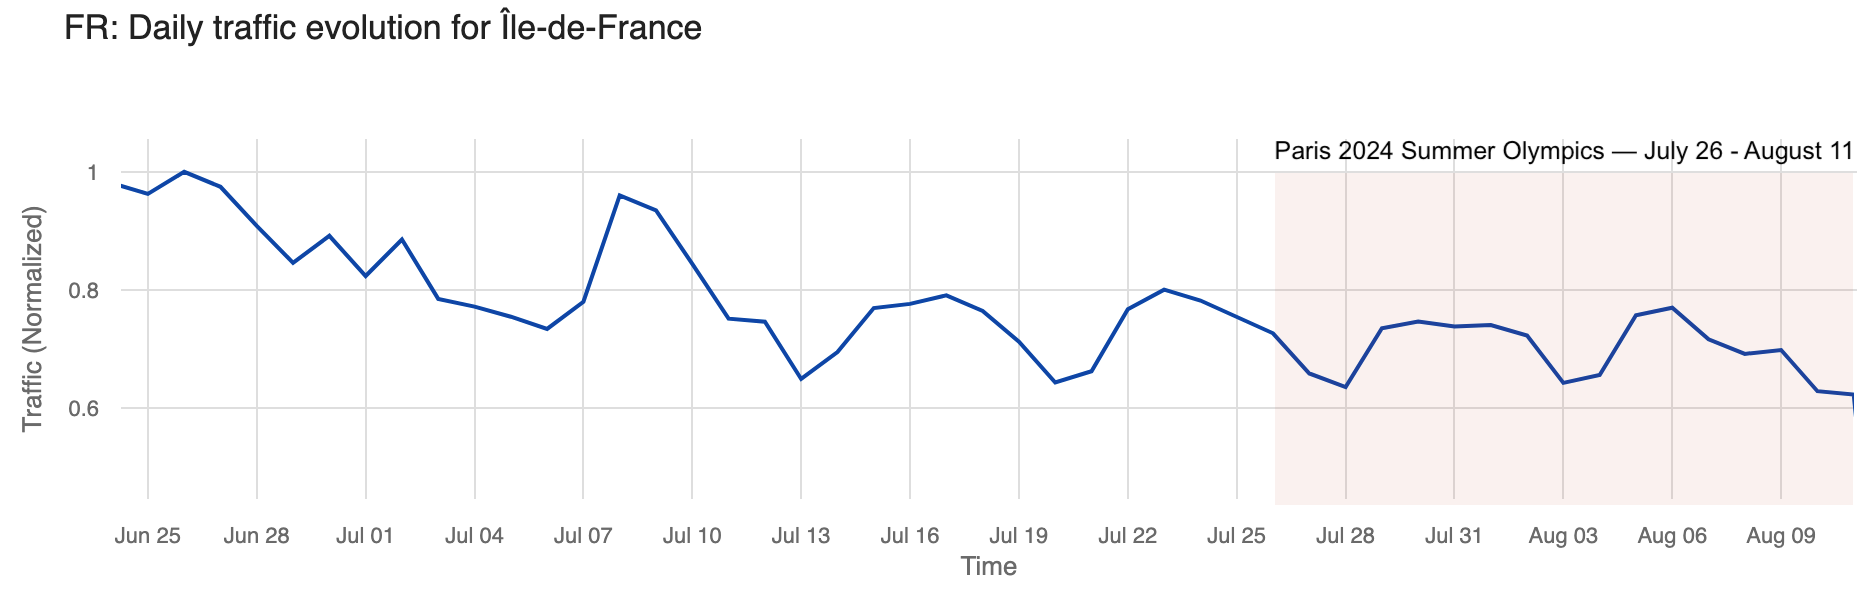
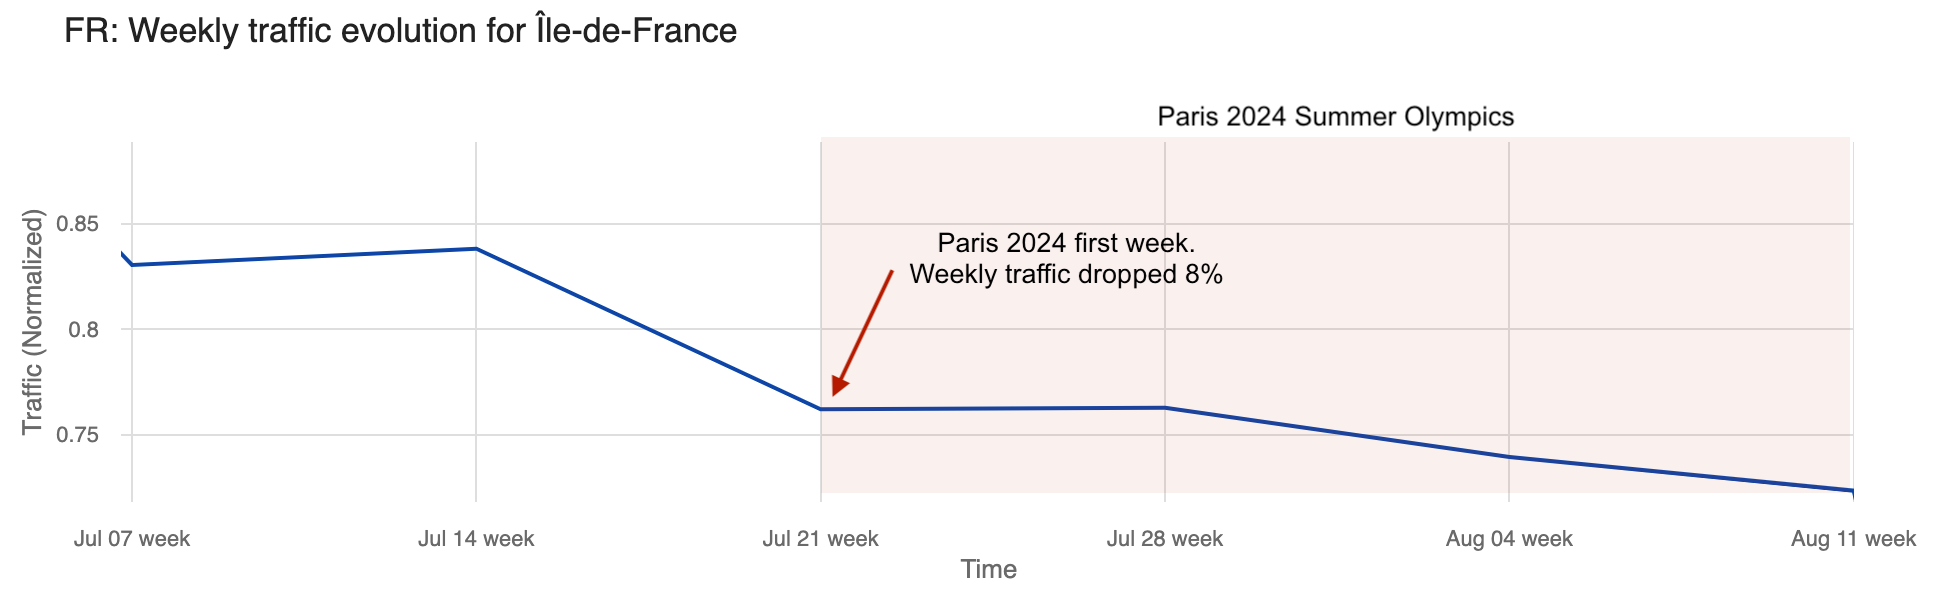
Weekly traffic dropped 8% the week the Olympics started and remained stable the following week. Even so, by August 4, the last week of the Olympics, traffic was 23% lower in the Île-de-France region than in the week of June 30, when it was at its highest in recent weeks.
Significant moments: from Simone Biles to breakdancing debut
Below, we highlight specific Olympic events affecting Internet traffic that we were able to observe in our data from different locations (ordered by the numbers of medals in the event), starting from the first full competition day on Saturday, July 27, 2024.
Host nation France was clearly the one with more significant impacts to Internet traffic during relevant moments of the Olympics.
United States: The artistic gymnastics competition featuring four-time Olympic gold medalist Simone Biles had a greater impact on U.S. Internet traffic than the opening ceremony. On July 26-28, traffic dipped most significantly during Biles’ events. On the 28th, at 10:00 UTC, during her beam routine, traffic was already 4% lower than the previous week. It dropped by 6% at 10:45 UTC during her floor and vault routines.
On July 29, at 19:30 UTC, traffic dropped 4% during the swimming event where Ryan Murphy won the bronze medal in the men’s 100 m backstroke final.
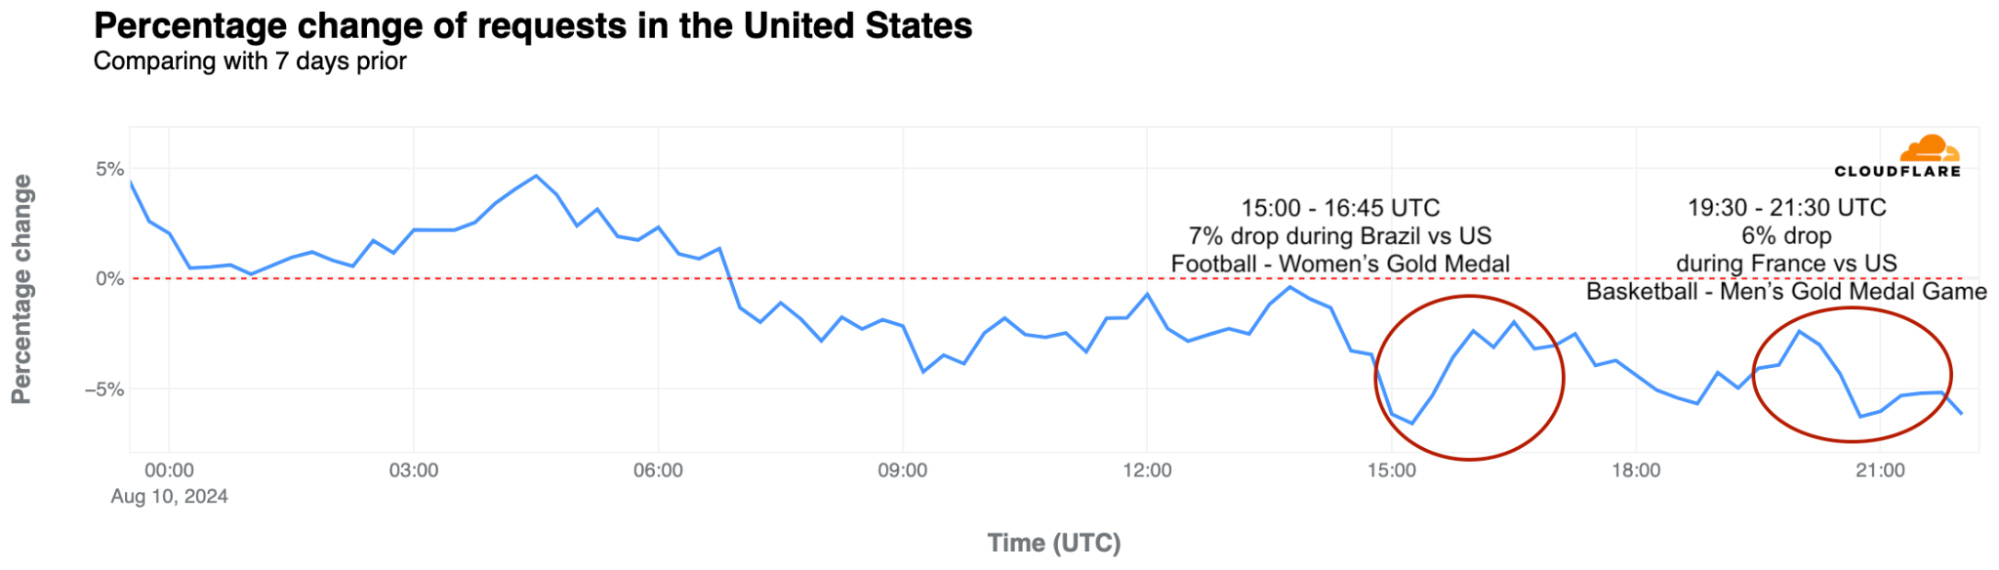
Another notable drop occurred on August 10, with a 7% decrease around 15:00 UTC during the women’s football gold medal match between Brazil and the USA. Later that day, during the men’s basketball gold medal game between France and the USA, traffic dropped by as much as 6%.
Great Britain: The first weekend of the Olympics saw clear drops in traffic, with a 10% decrease compared to the previous week around 15:00 UTC on July 28, 2024. British athletes participated in several events during those busy days. Traffic the following weekend was slightly higher than in the first Olympic weekend but dropped again on the final day, August 11.
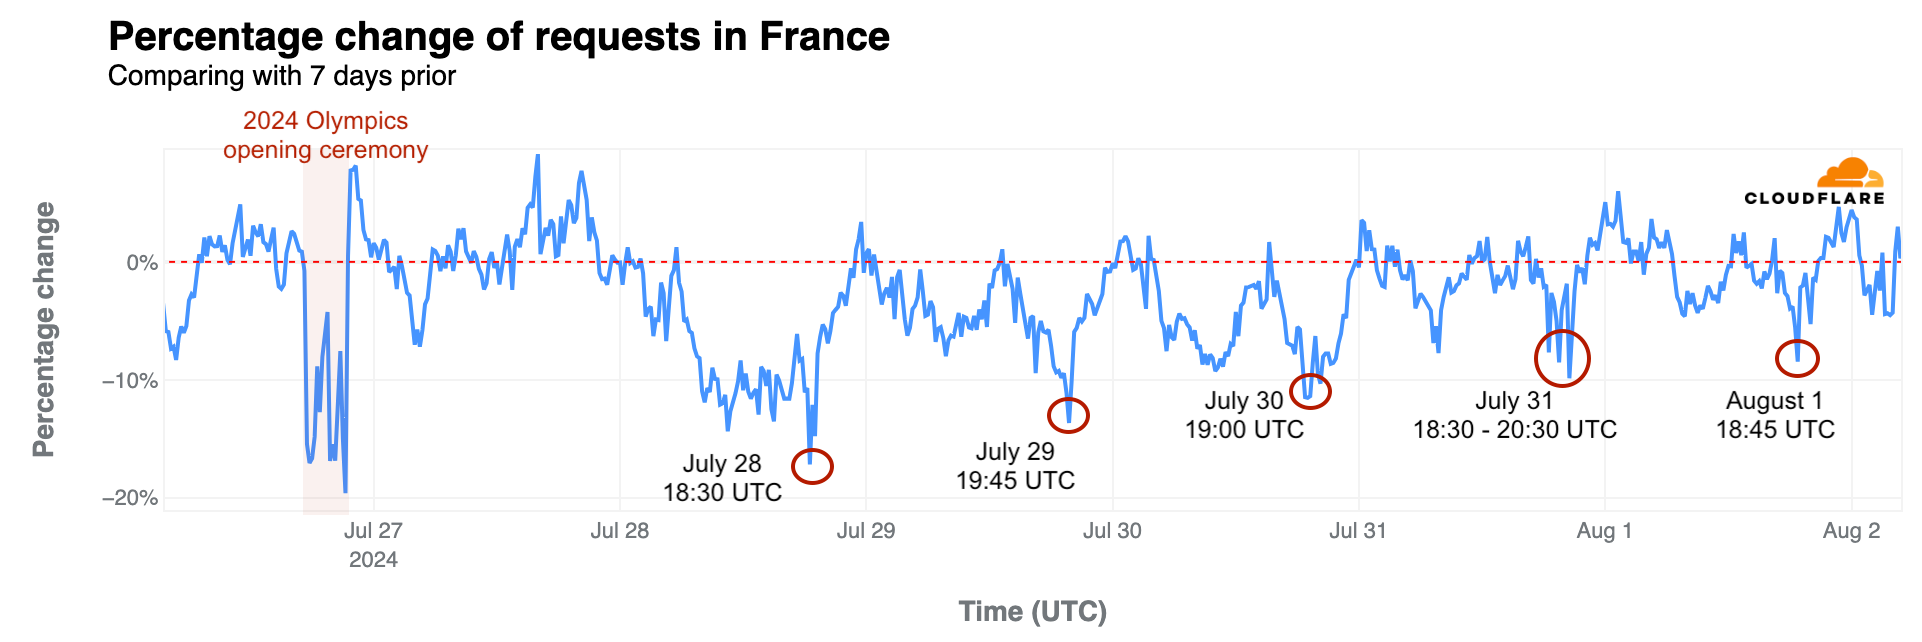
France: As previously noted, French swimmer Léon Marchand’s gold medal and Olympic record in the men’s 400-meter individual medley on July 28 had the most significant impact on French traffic during the Olympics, aside from the 20% drop seen during the opening ceremony. Traffic fell by 17% at 18:30 UTC during his event—the same level of drop seen during the closing ceremony. Similar impacts occurred during other swimming events:
- July 29, 19:45 UTC, 14% drop during the Women’s 100 m Backstroke Semifinals featuring Yohann Ndoye-Brouard.
- July 30, 19:00 UTC, 12% drop during the Men’s 200 m Butterfly Semifinals with Léon Marchand.
- July 31, 18:30-20:30 UTC, 7% to 10% drop during the Men’s 200 m Butterfly final with Léon Marchand.
- August 1, 18:45 UTC, 8% drop during swimming semifinals and finals.
Other notable drops include breakdancing:
- August 9, 14:30 UTC, 10% drop during the Breaking dance debut with France’s participation.
- August 10, 18:45-21:00 UTC, 7% drop during the Breaking B-Boys gold medal battle and the men’s basketball gold medal game, France vs USA.
- August 11, 07:00 UTC, 8% drop during the women’s marathon.
Australia: During Mollie O’Callaghan’s victory in the women’s 200 m freestyle on July 29, at around 20:00 UTC, Australian traffic was 5% lower than the previous week, a larger drop than during the opening ceremony, which saw a 2% decrease.
On August 1, at around 18:45 UTC, traffic was 10% lower than the previous week during swimming events that led to Australia’s gold in the women’s 4x200m freestyle relay. And on August 11, at around 07:00 UTC, traffic dropped 7% compared to the previous week during the women’s marathon with Australian participants.
Japan: One of the most significant drops in traffic in Japan during the Olympics occurred on August 6, around the time Fumita Kenichiro from Japan won gold in the men’s Greco-Roman wrestling 60 kg final, followed by artistic swimming and the women’s table tennis competition, with traffic dropping 12% at 18:15 UTC.
On August 10, for several hours after 17:30 UTC, traffic in Japan was also lower than usual, with a drop of as much as 14%. This coincided with Japan’s gold medal win in the women’s javelin throw and the men’s breaking quarterfinals and semifinals.
Italy: During the event that gave Italy its first ever gold medal in artistic gymnastics, won by Alice D’Amato in the women’s balance beam event, traffic dropped 5% at around 10:45 UTC.
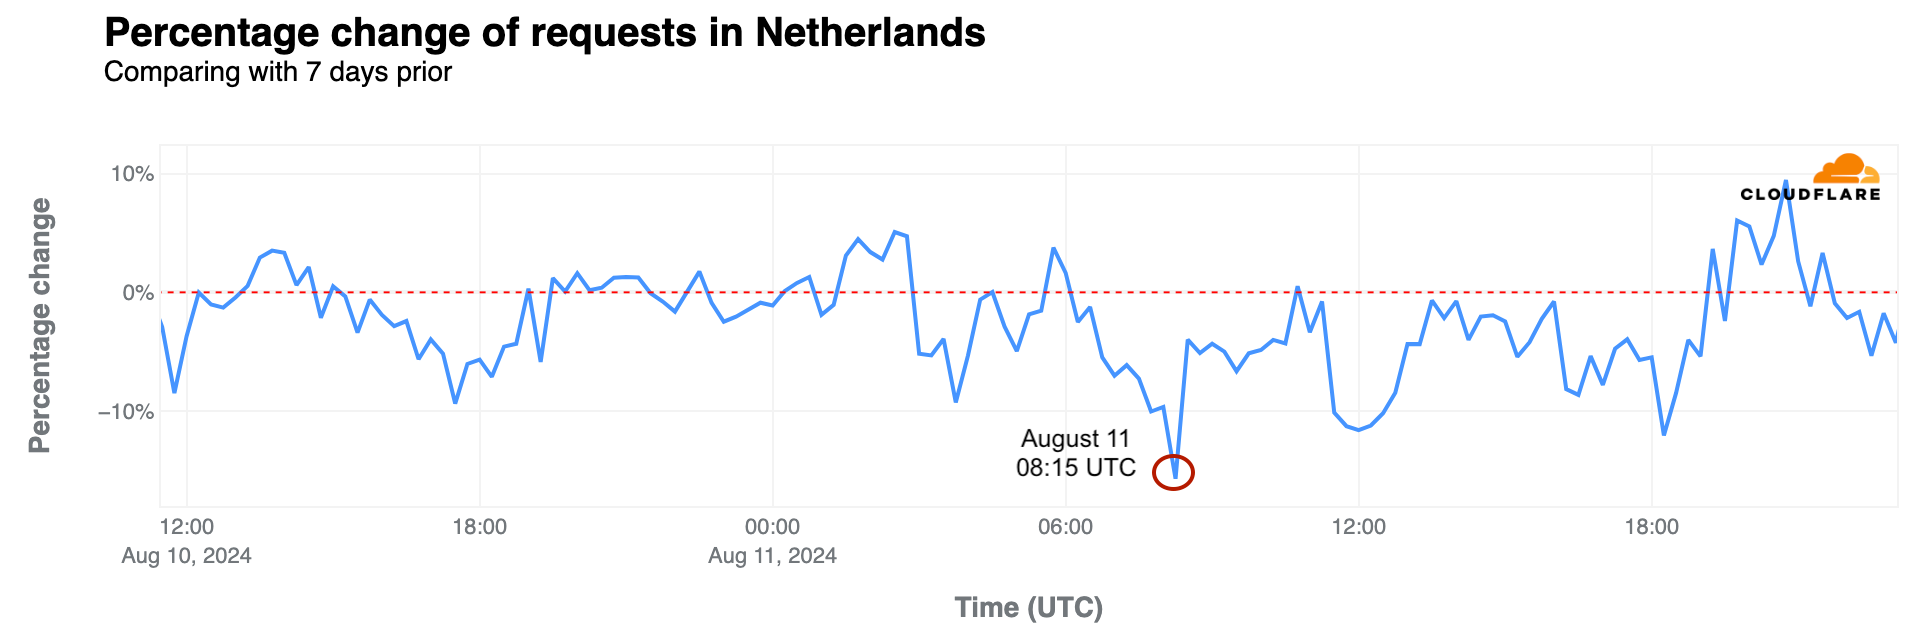
Netherlands: On the morning of July 28, the second full day of the Olympics, traffic in the Netherlands dropped by as much as 20% compared to the previous week, with Dutch athletes participating in several competitions.
On August 11, traffic dropped between 06:30 and 09:30 UTC, and by as much as 16% at 08:15 UTC, when Dutch runner Sifan Hassan won the gold medal in the women’s marathon.
South Korea: The Korean women’s archery team’s gold medal win on July 28 at 15:30 UTC led to an 8% drop in traffic, the most significant decrease noted in the country between July 26 and July 29.
On August 7, at 19:45 UTC, traffic was 9% lower during the Taekwondo gold medal event for Park Taejoon in the men’s -58 kg (under 58 kg) competition.
Brazil: Traffic in Brazil was 15% lower than the previous week on July 27 at around 19:30 UTC, surpassing the impact of the opening ceremony. This occurred as Brazilian swimmers Guilherme Costa and Maria Fernanda Costa competed in the men’s and women’s 400 m freestyle events.
On August 2, traffic in Brazil was 5% lower at around 00:30 UTC during the men’s surfing quarterfinals with Gabriel Medina and was 8% lower at around 01:00 UTC during the women’s surfing quarterfinals with Tatiana Weston-Webb.
Cape Verde: David Pina won the first Olympic medal in boxing for this archipelago nation off the western coast of Africa. On August 4, the amateur boxer took the bronze medal, with traffic dropping 12% in the country at around 15:00 UTC during the match.
DNS trends for official Olympic websites by country
On July 22, before the Olympics began, we reported on the heightened interest in official Olympic websites based on request data from our 1.1.1.1 DNS resolver. France initially dominated with 24% of DNS traffic, followed by the UK (20%) and the US (17%). However, when the Olympics started, the US took the lead, maintaining it throughout the event.
The following chart summarizes the highest shares of DNS request traffic by country during the Paris 2024 Summer Olympics. There was a shift in percentages that indicates a broader spread of interest across countries as the Olympics progressed, visible in the dynamic version of the map by day of the event that is available in our Paris 2024 Olympics report.
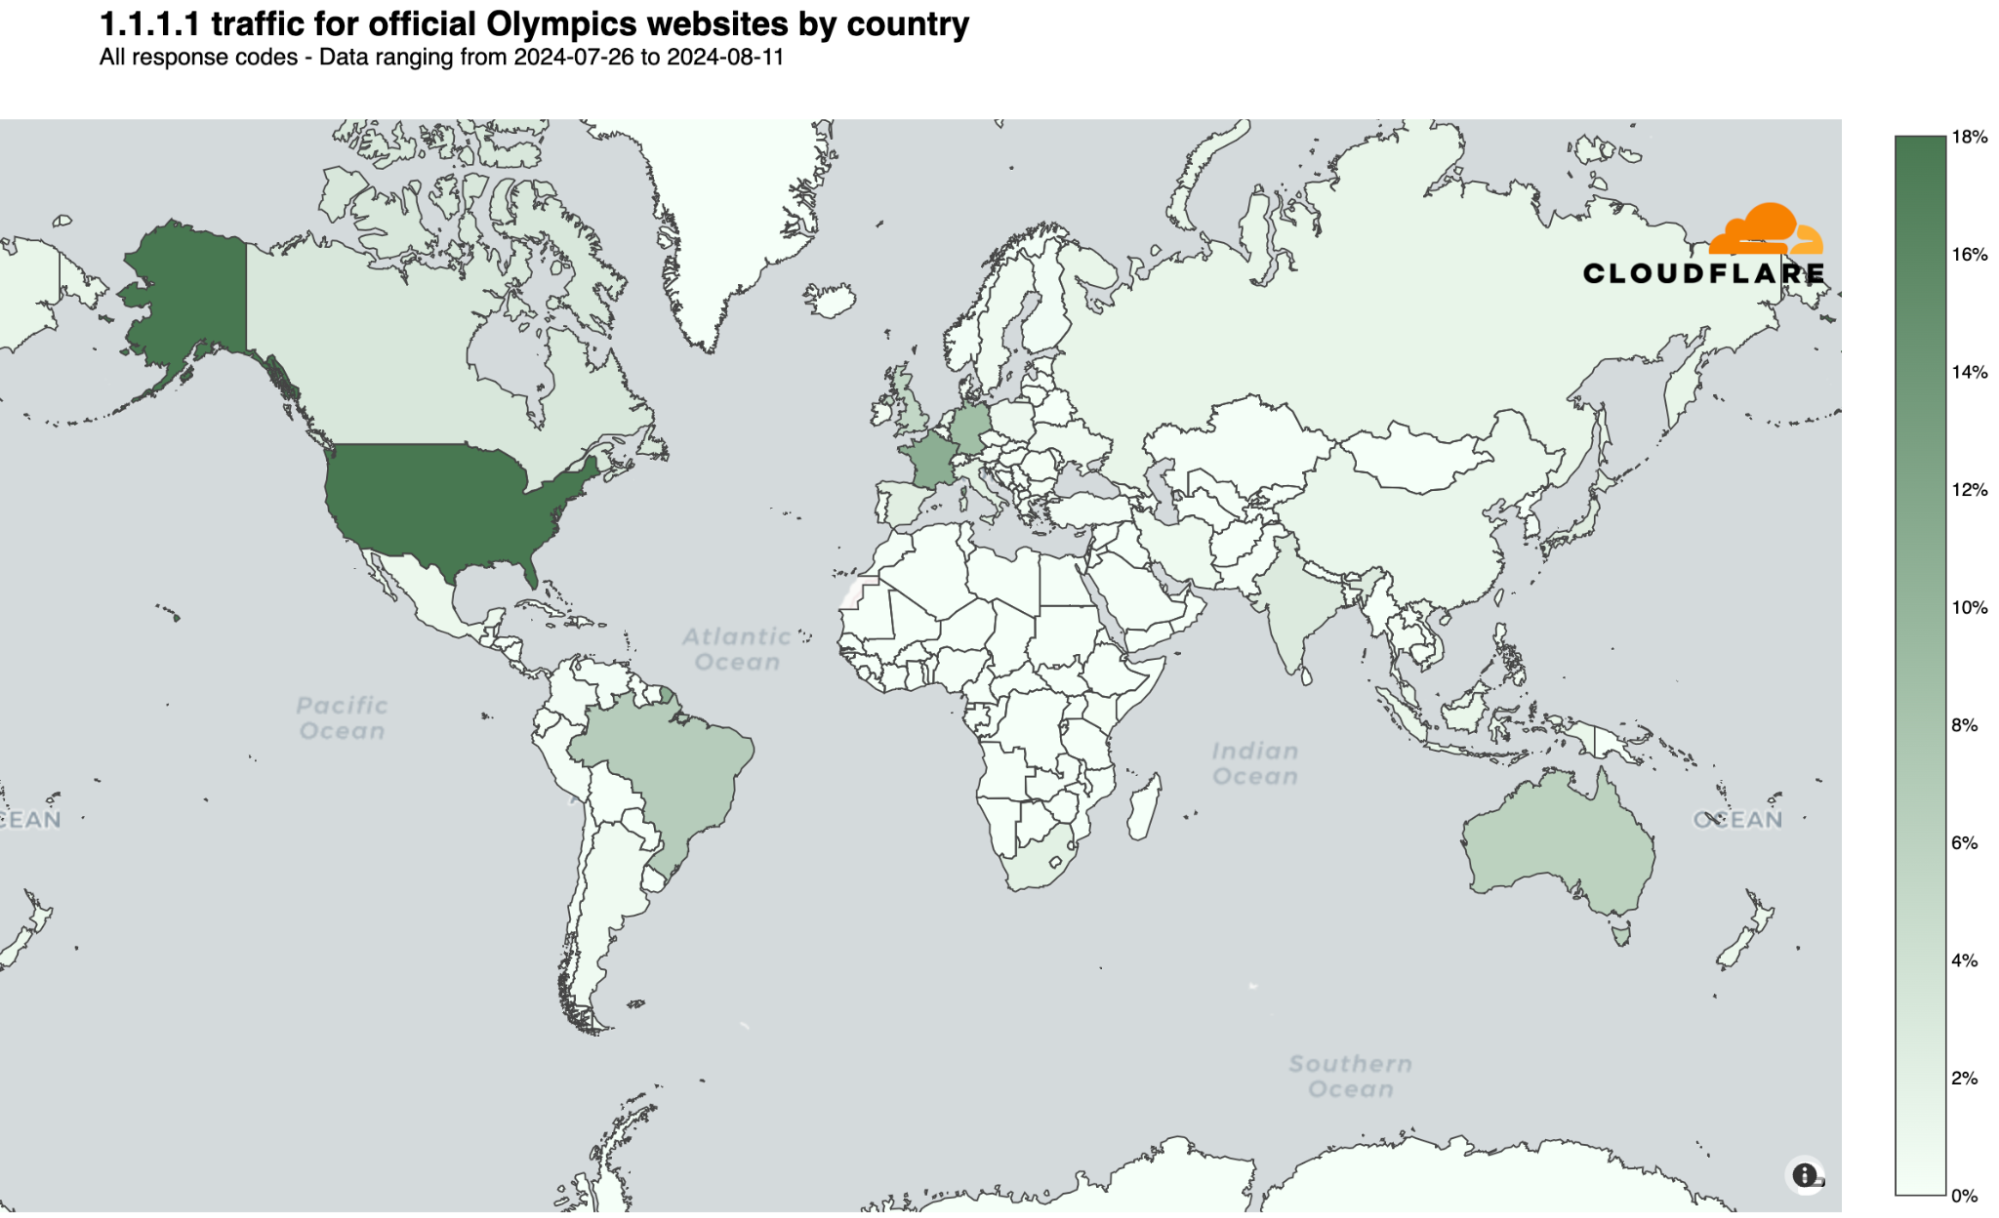
Here are the top 10 countries that during the event had more DNS traffic for Olympics official websites. The US took the “gold,” France the “silver,” and the UK the “bronze”:
- United States: 18%
- France: 16%
- United Kingdom: 10%
- Germany: 7%
- Brazil: 6%
- Australia: 5%
- Canada: 2%
- Japan: 2%
- India: 2%
- Russian Federation: 2%
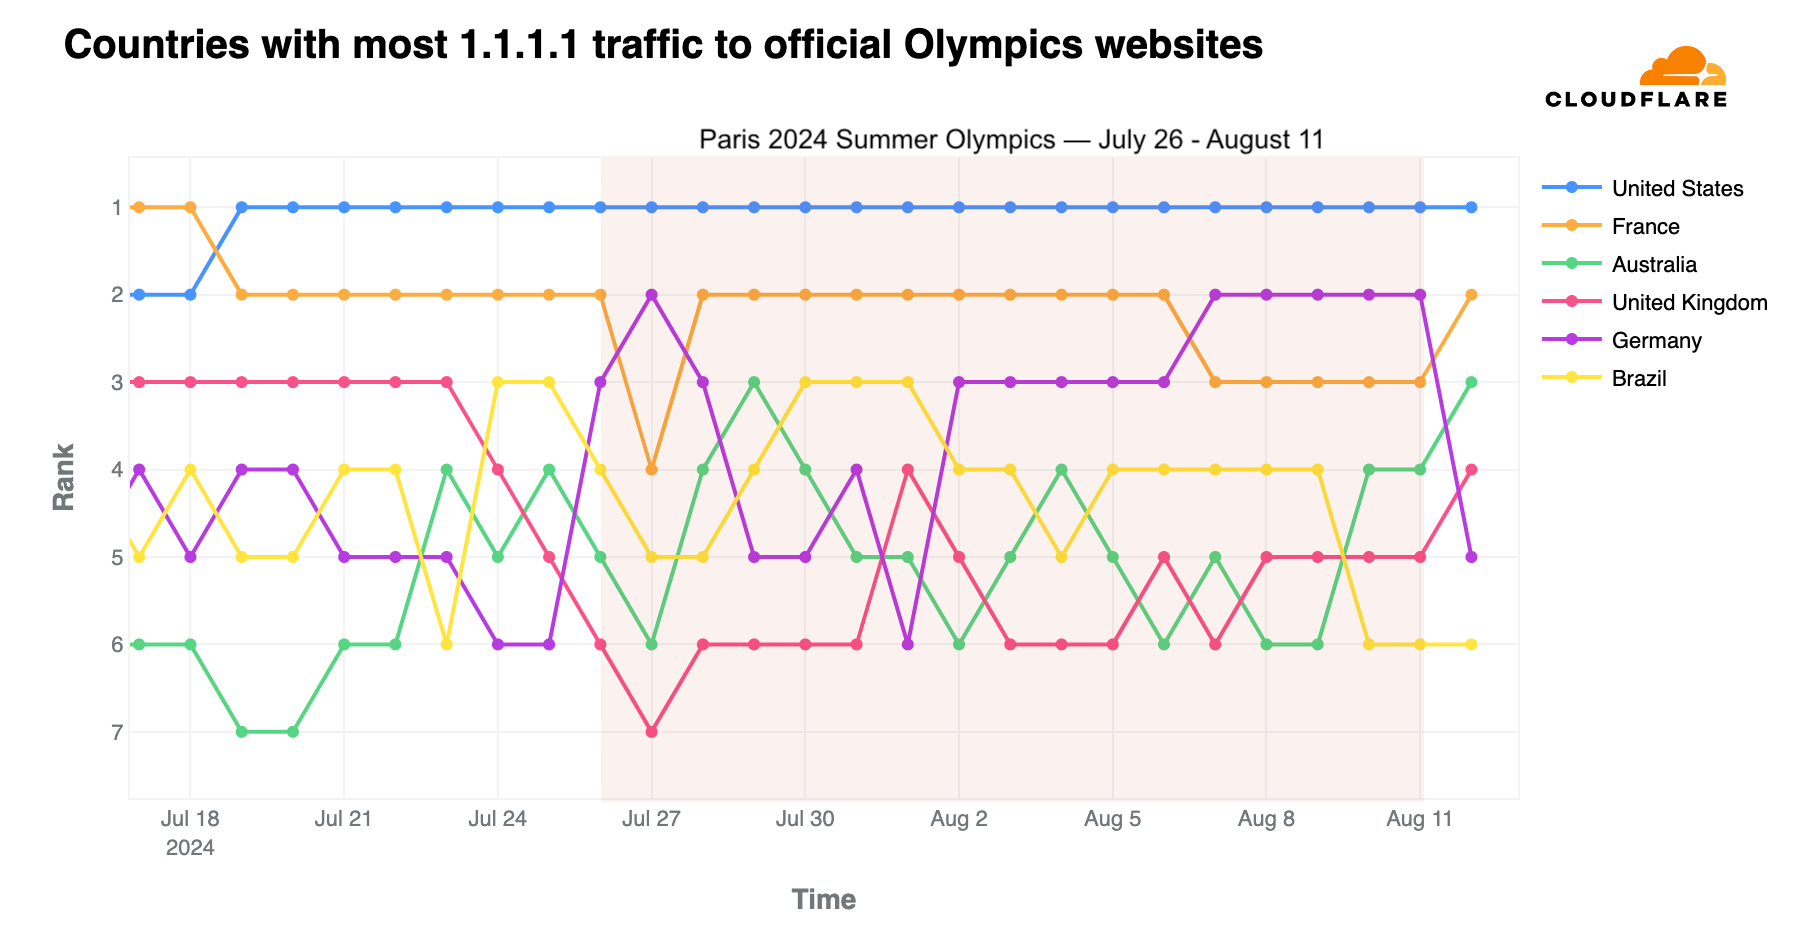
We observed that the US overtook France for the #1 spot a few days before the event began. France also dropped to third place behind Germany on July 27, the first full day of competitions, and again after August 2, though interestingly, it returned to #2 the day after the Olympics ended.
As shown in the following daily ranking chart, the UK was #3 before the event began but dropped to #4 on August 1. Australia’s highest ranking was #3 on July 29, and #4 on August 10 and 11. Brazil’s best days, ranking #3, were on July 24-25, and on July 30, 31, and August 1.
In terms of volume of DNS traffic to our 1.1.1.1 resolver, the first full week of Olympic events saw the highest volume of requests related to official Olympic websites, with a 637% increase compared to the week before the Olympics began. This trend of peak traffic during the first week was consistent across most countries, except for Germany, Spain, India, Italy, and Russia, where the final week generated more DNS resolver traffic.
On a daily basis, worldwide DNS traffic to official Olympics domains peaked on August 2, followed by August 4 and August 5, marking the start of the second and final week of the event. Below are the top 3 days with the highest DNS traffic to official Olympic websites in the top 3 countries by traffic volume:
- United States: July 30 (when the US women’s team won gold in artistic gymnastics and several medals were won in swimming), July 29, and August 5.
- France: July 31 (when swimmer Léon Marchand won gold in the men’s 200 m butterfly final), July 29, and August 1.
- Germany: July 27 (when swimmer Lukas Maertens won gold in the men’s 400 m freestyle final), August 8, and August 7.
Sports news sites
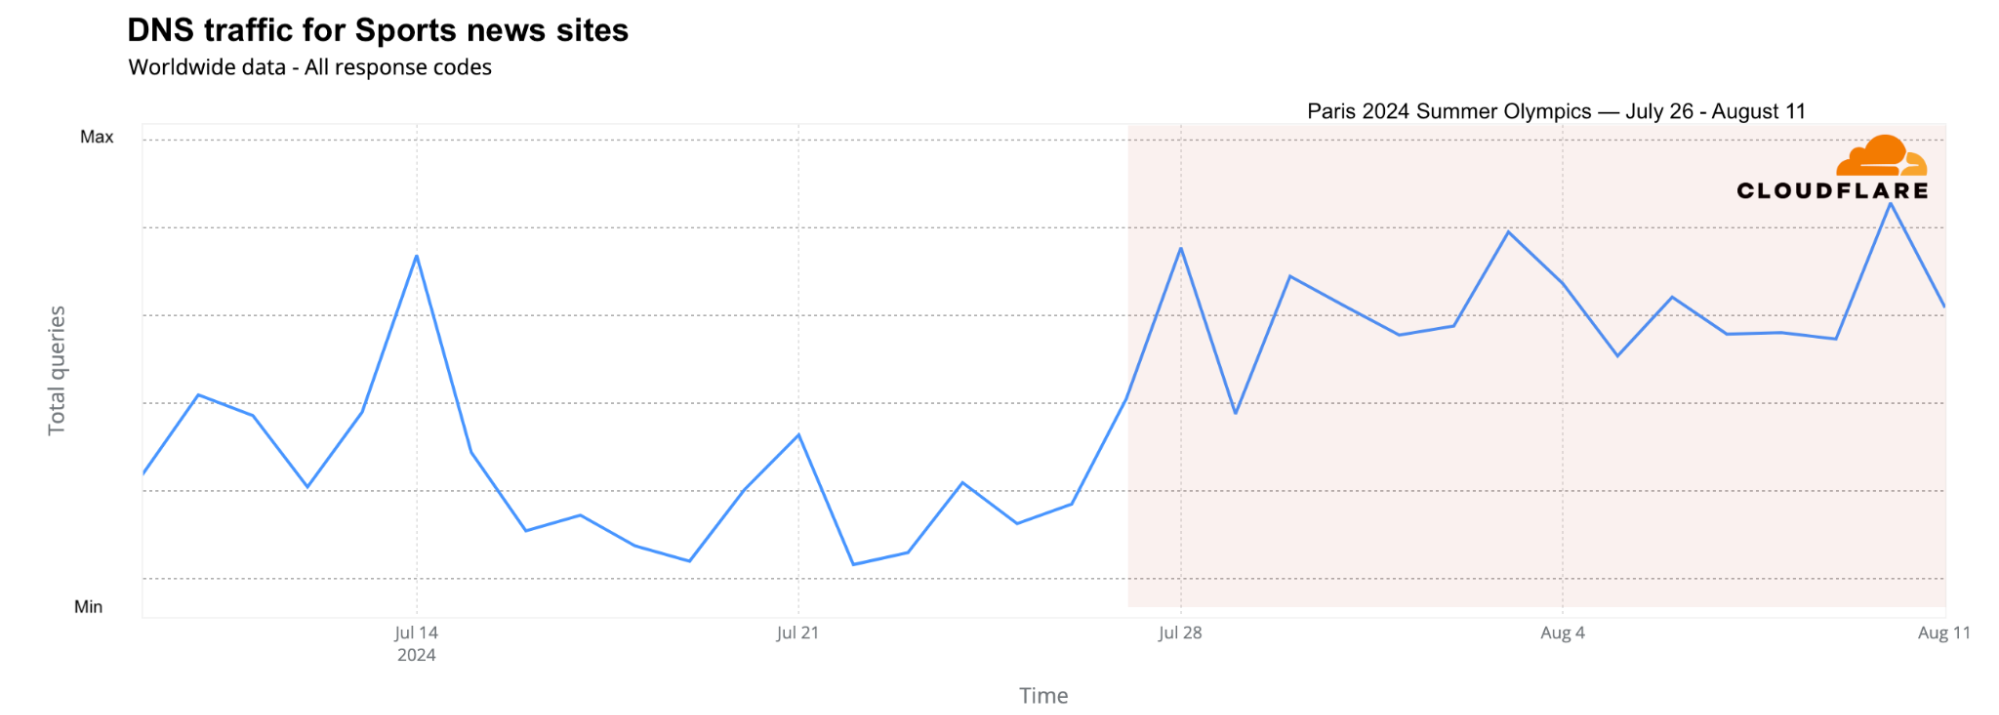
Looking at DNS traffic for sports news sites across different countries, the two weeks of the Olympics brought more traffic than any other week since June, including during the major football event, UEFA Euro 2024, held between June 14 and July 14. The Olympic weeks saw 17% more traffic than the week before the Olympics and 4% more DNS traffic than the best week of Euro 2024 (June 22-29).
From a daily perspective, the days with the highest traffic to sports news sites were August 10, August 3, July 28, and July 14 (related to the Euro 2024 final).
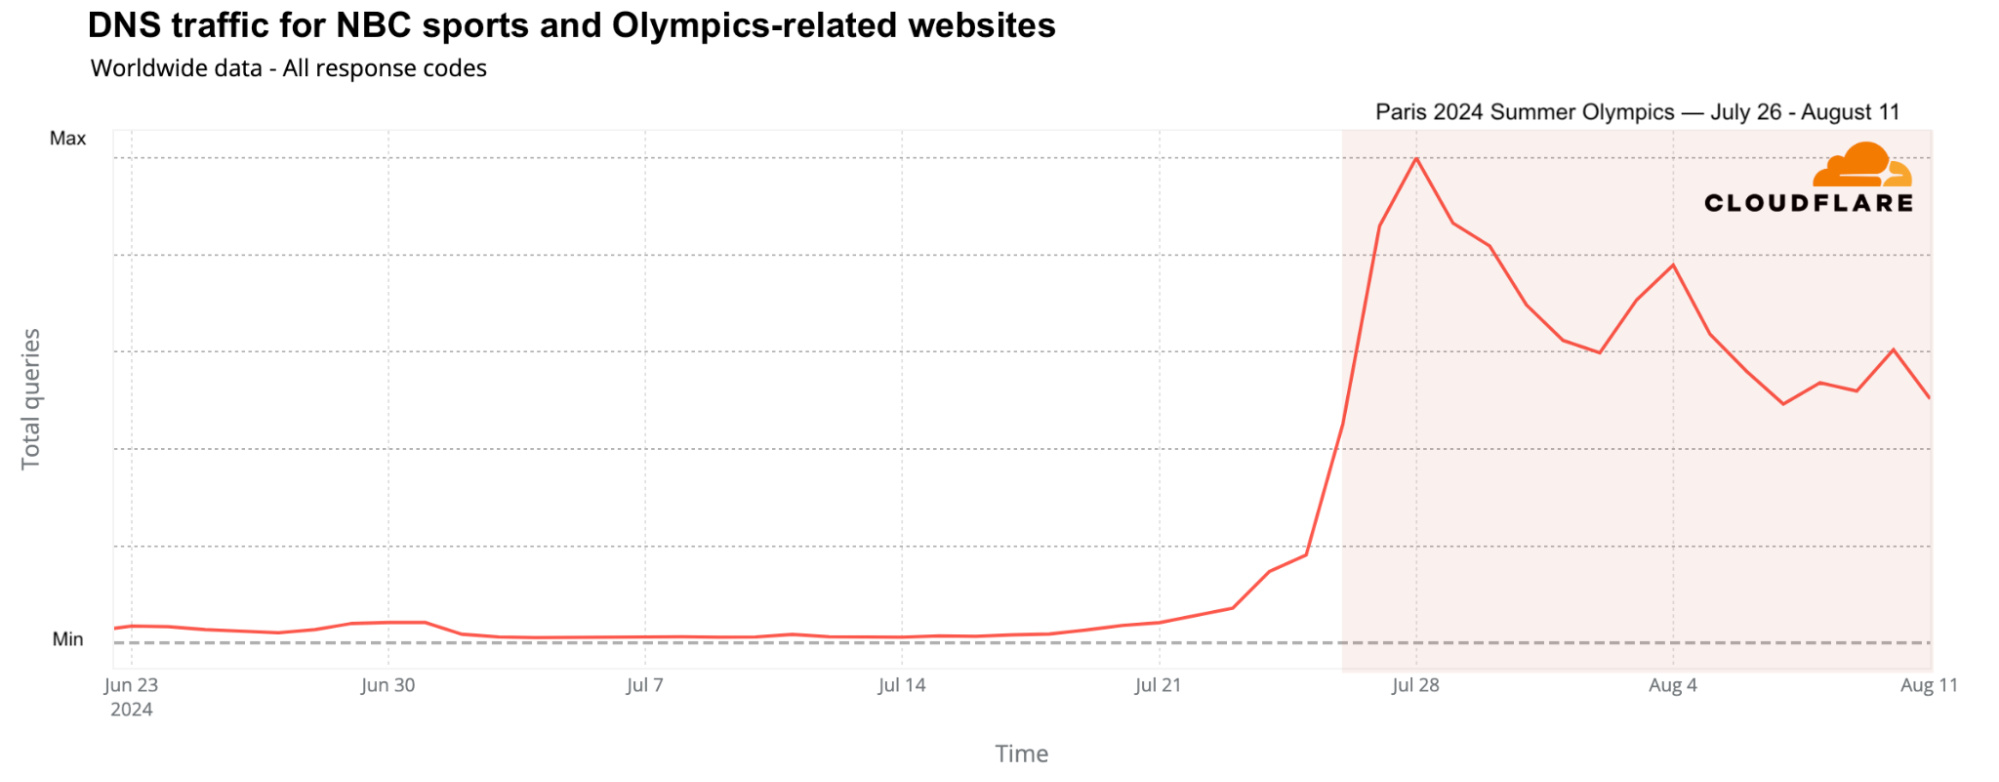
In the United States, NBC was not only the official broadcaster of the Olympics, but also created a dedicated website. NBC’s sports and NBC Olympics websites saw a significant rise in global DNS traffic, increasing up to 1,640% on July 28 compared to the previous week.
From official streaming services to Olympic sponsors
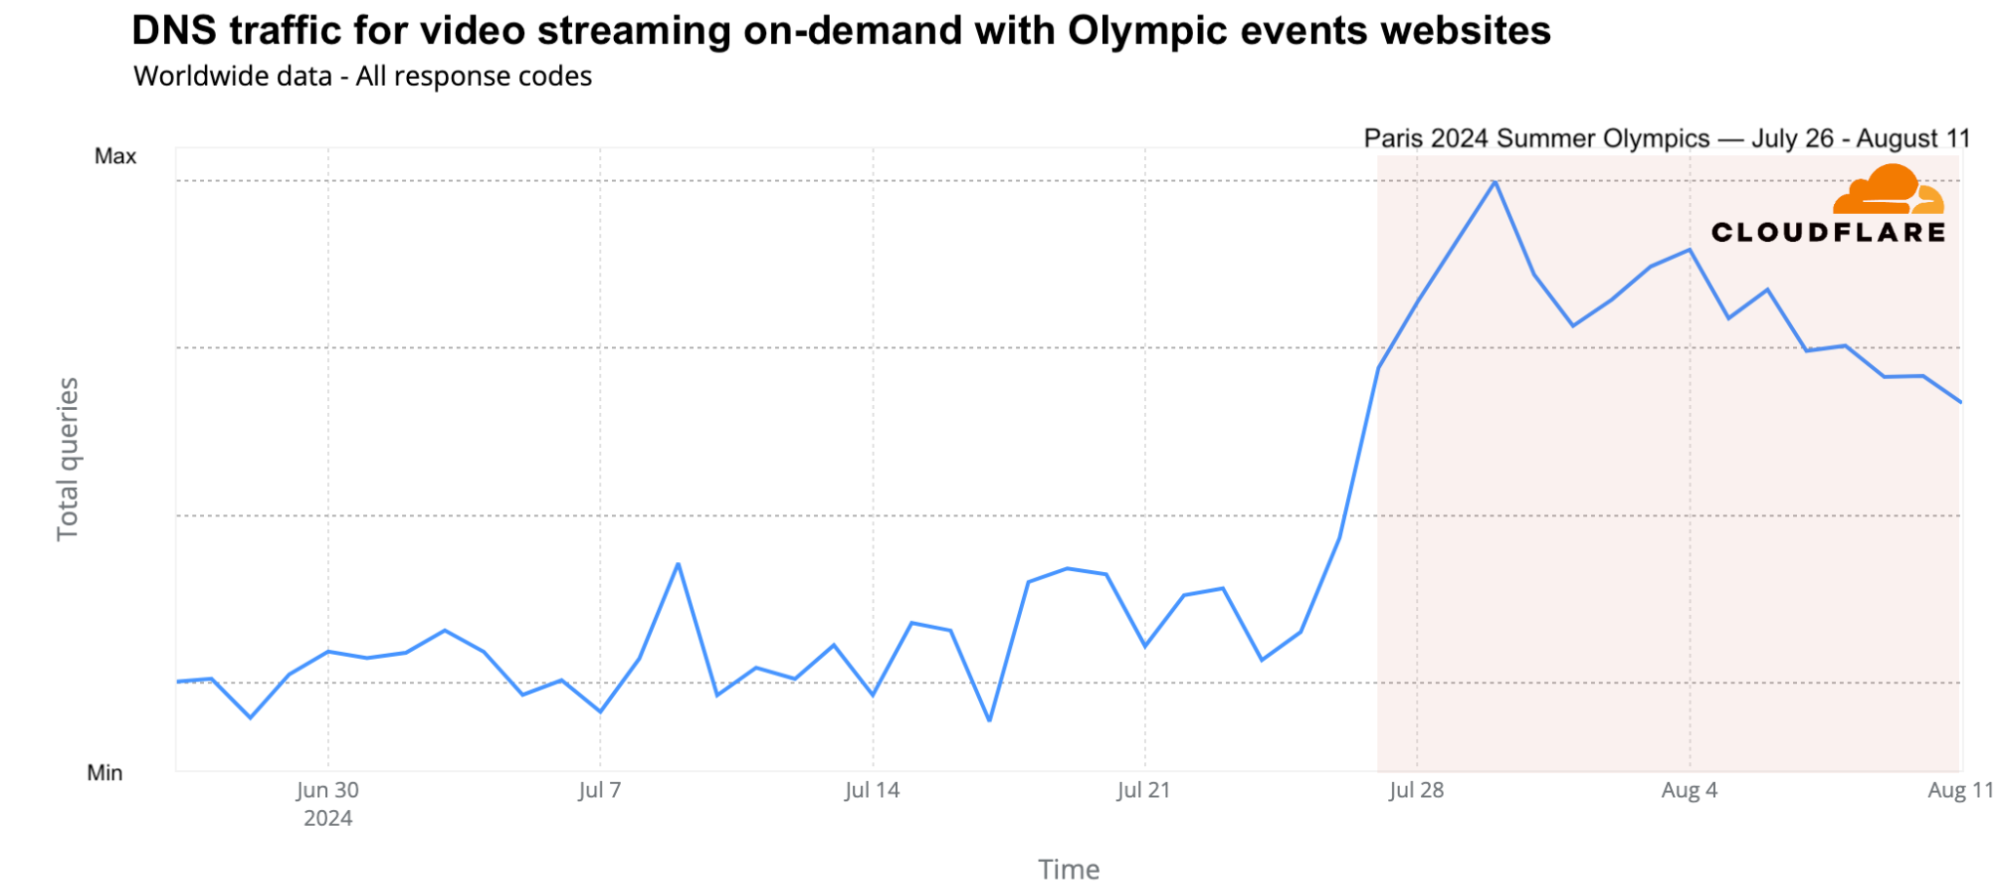
While the Olympics were still broadcast on several traditional national TV networks, streaming also played a key role, with Peacock TV (in the US and Canada) and Max (from Warner Bros. Discovery) in Europe offering several hours of Olympic content daily. The global traffic growth to these platforms was evident. On a weekly basis, DNS request traffic for streaming platforms featuring Olympic events grew by as much as 65%. Daily traffic peaked on July 30 (68% higher than the previous week), followed by July 29 and August 4. Peacock TV led over Max in terms of traffic.
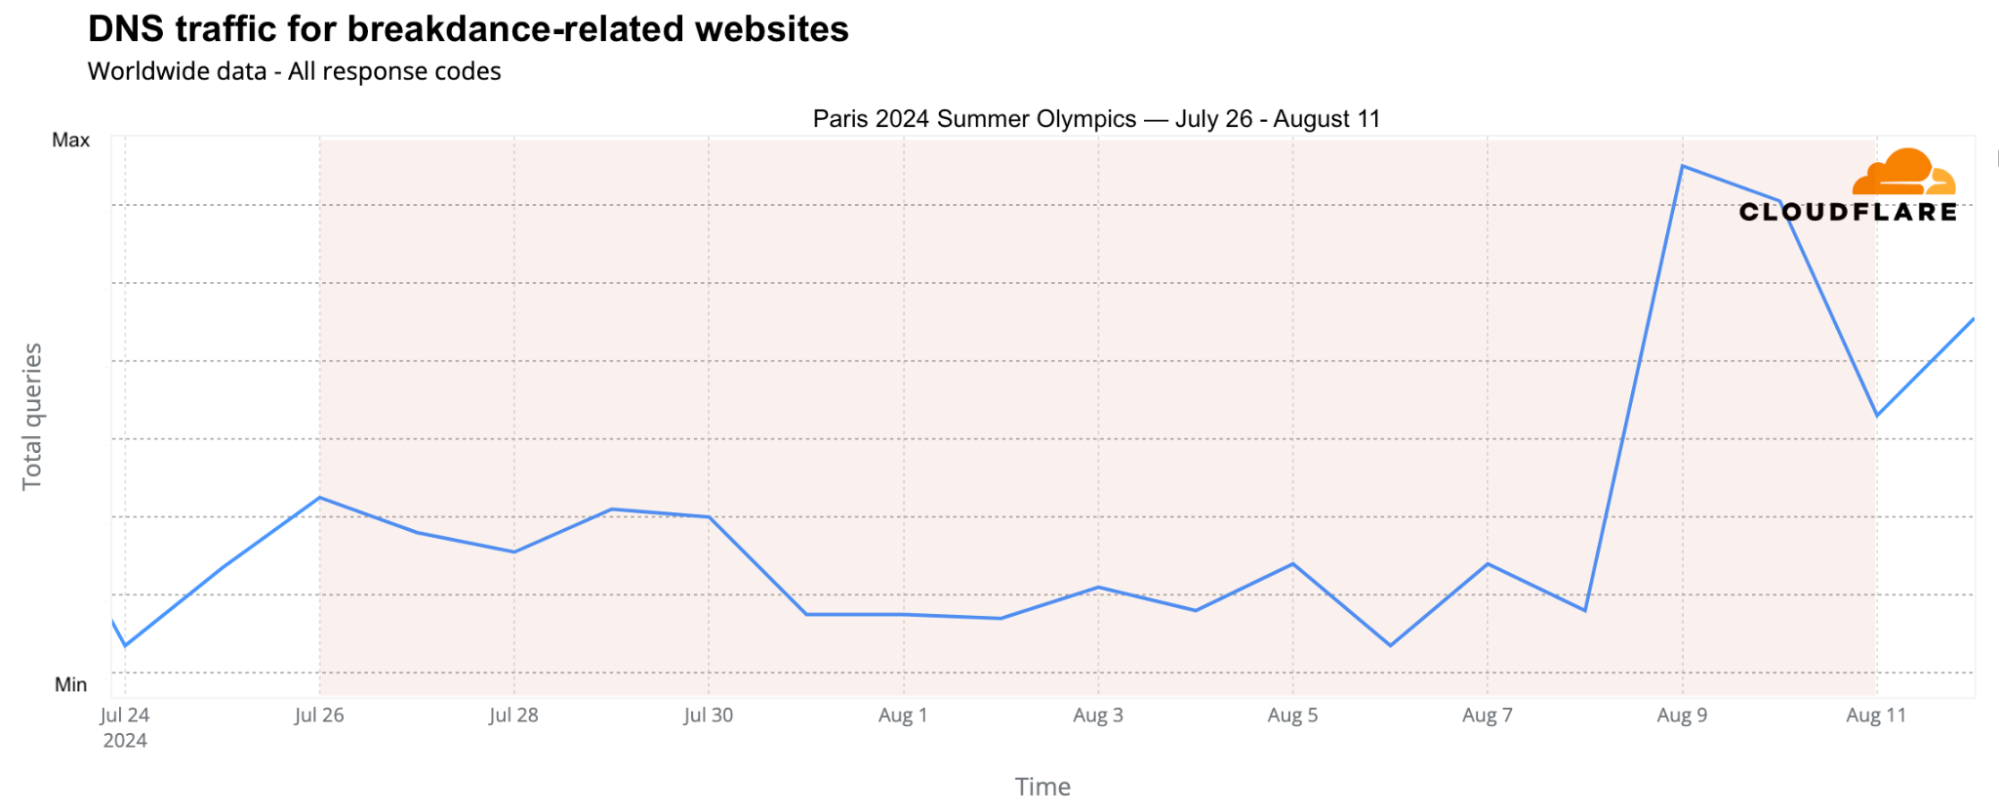
Breakdancing, or “breaking,” made its first appearance in the 2024 Summer Olympics, leading to a surge in DNS traffic to breaking-related websites, particularly on August 9 and 10. Traffic peaked on August 9, with a 215% increase compared to the previous week, driven by viral moments like Australian Rachael Gunn’s performance.
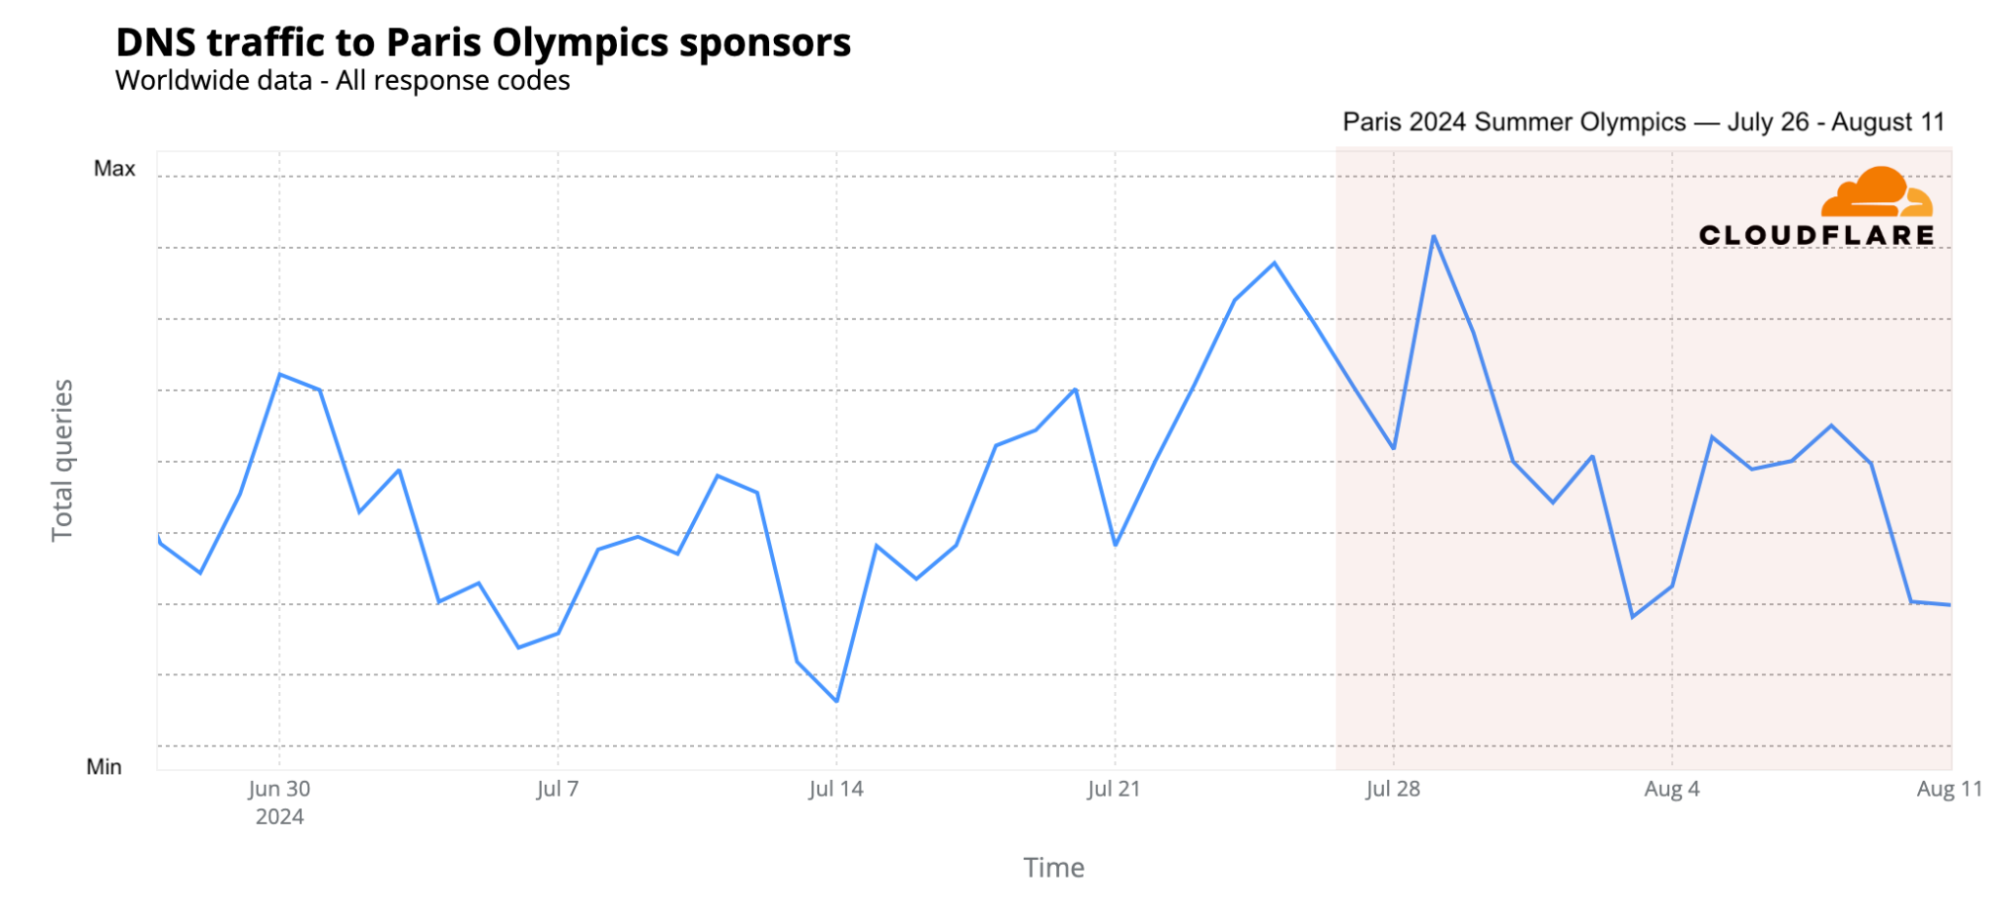
How about the Paris Olympics sponsors? DNS traffic also increased, particularly in the early days of the event and the days leading up to it, with peak traffic on July 29 (15% higher than the previous week), followed by July 25 and 24 (the two days before the opening ceremony). Samsung saw the most significant impact during the early days of the Olympics, while Airbnb experienced a surge in traffic just before the opening ceremony (July 25).
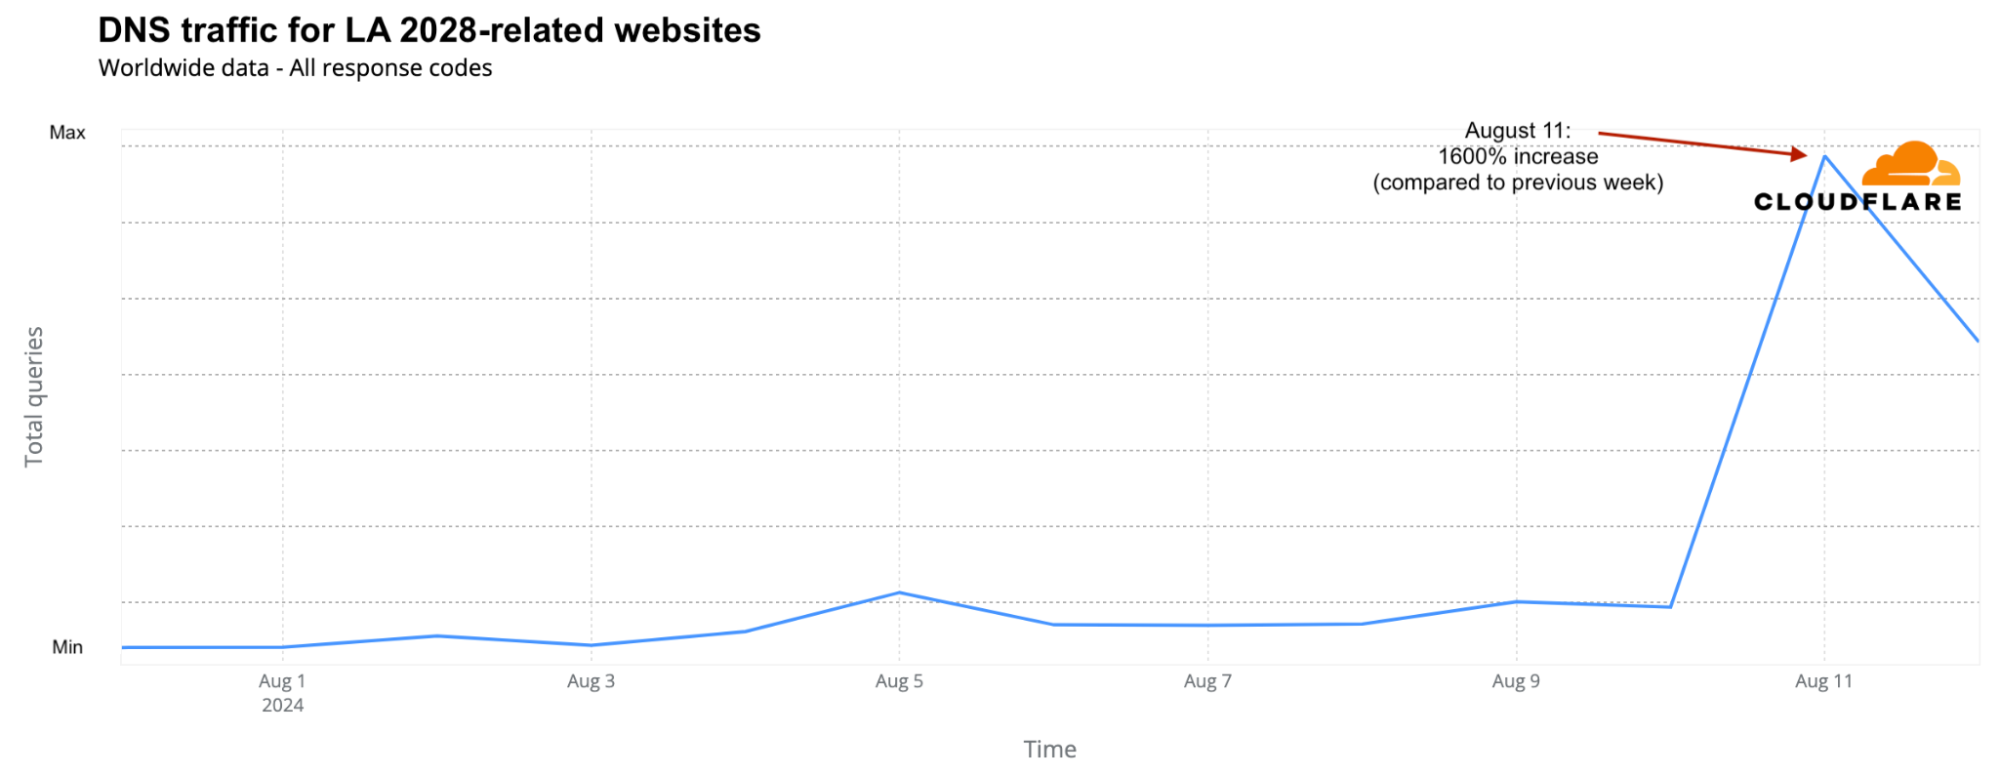
Next stop: LA 2028
The closing ceremony concluded with a symbolic passing of the torch from Paris 2024 to Los Angeles 2028. Simone Biles handed the Olympic flag to Tom Cruise, who transported it Mission Impossible-style from Paris to a Venice Beach concert in LA featuring acts including the Red Hot Chili Peppers and Billie Eilish. Unsurprisingly, the official LA 2028 Olympics website saw a 1600% surge in DNS traffic on August 11 compared to the previous week.
DDoS attacks targeting Olympic-related and sponsor websites
As we observed during the 2024 elections, including the French elections, political parties are not the only targets of DDoS (Distributed Denial of Service) attacks during significant events. Attackers are aware of large global events. In a previous related blog post, we discussed attacks targeting French transportation and government websites. Below, let’s focus on Olympic-related and sponsor organizations.
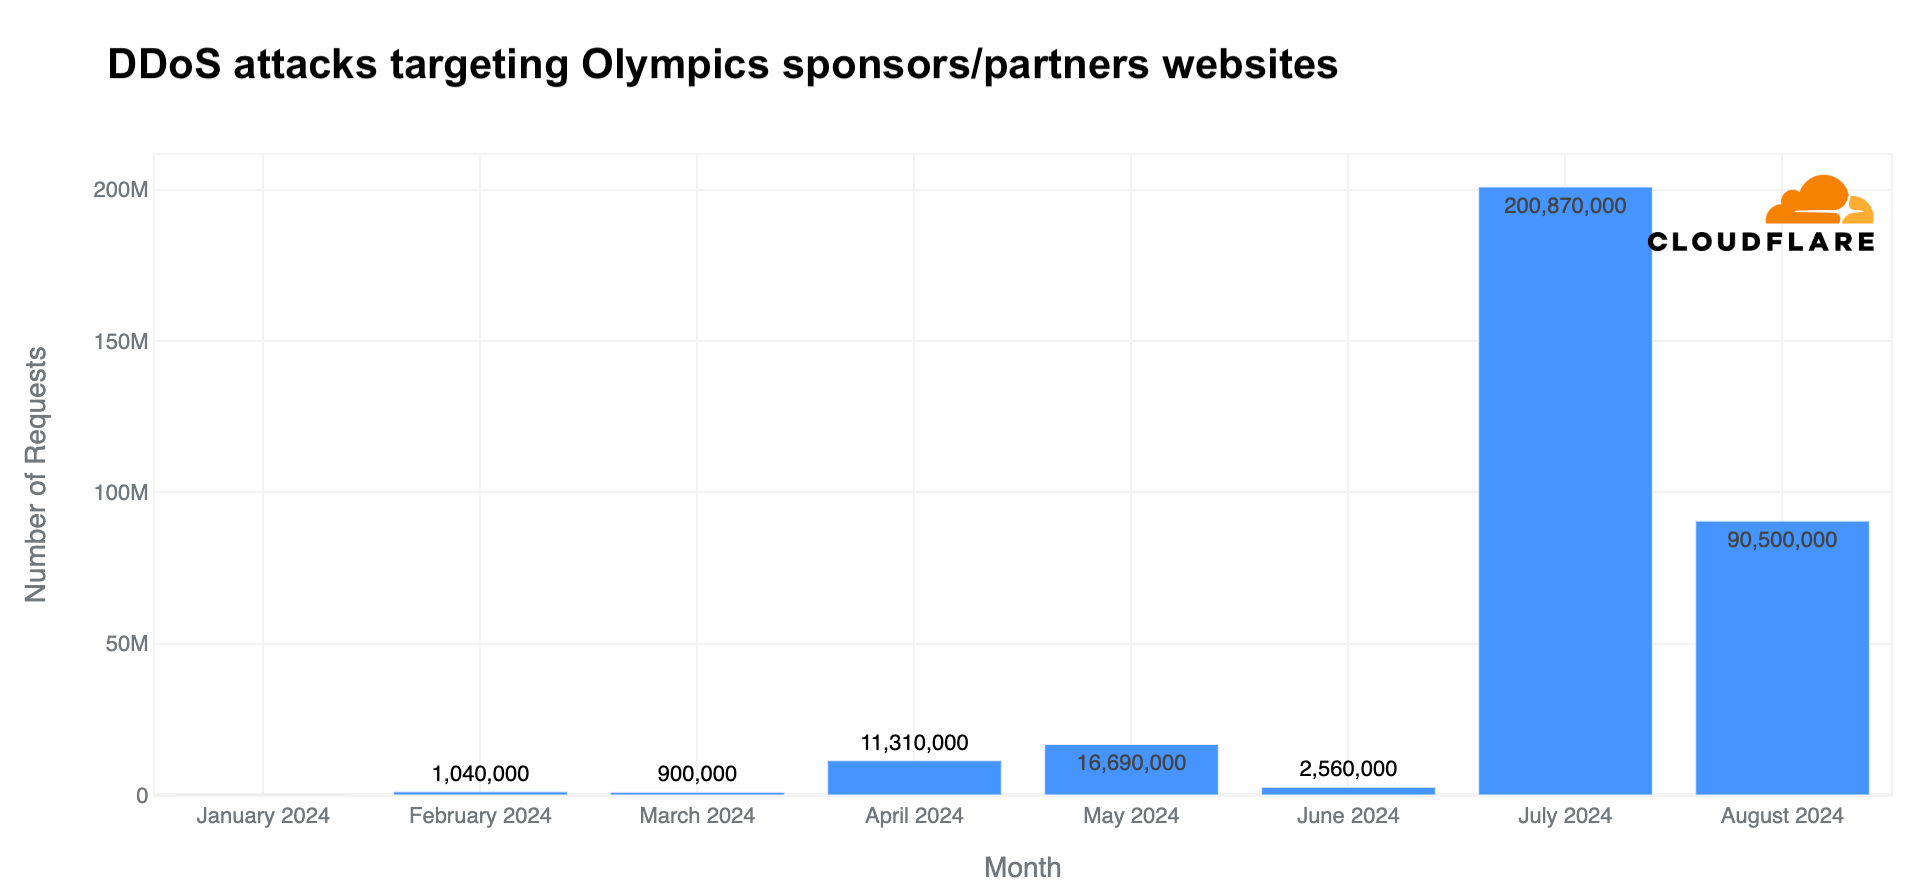
In July, Cloudflare blocked a surge in DDoS attacks on Olympic partner websites – higher than in any other month of 2024. Daily DDoS attack requests jumped to 200 million, and in just 11 days of August, more DDoS requests (90 million) were blocked than in any full month in 2024 before the Olympics.
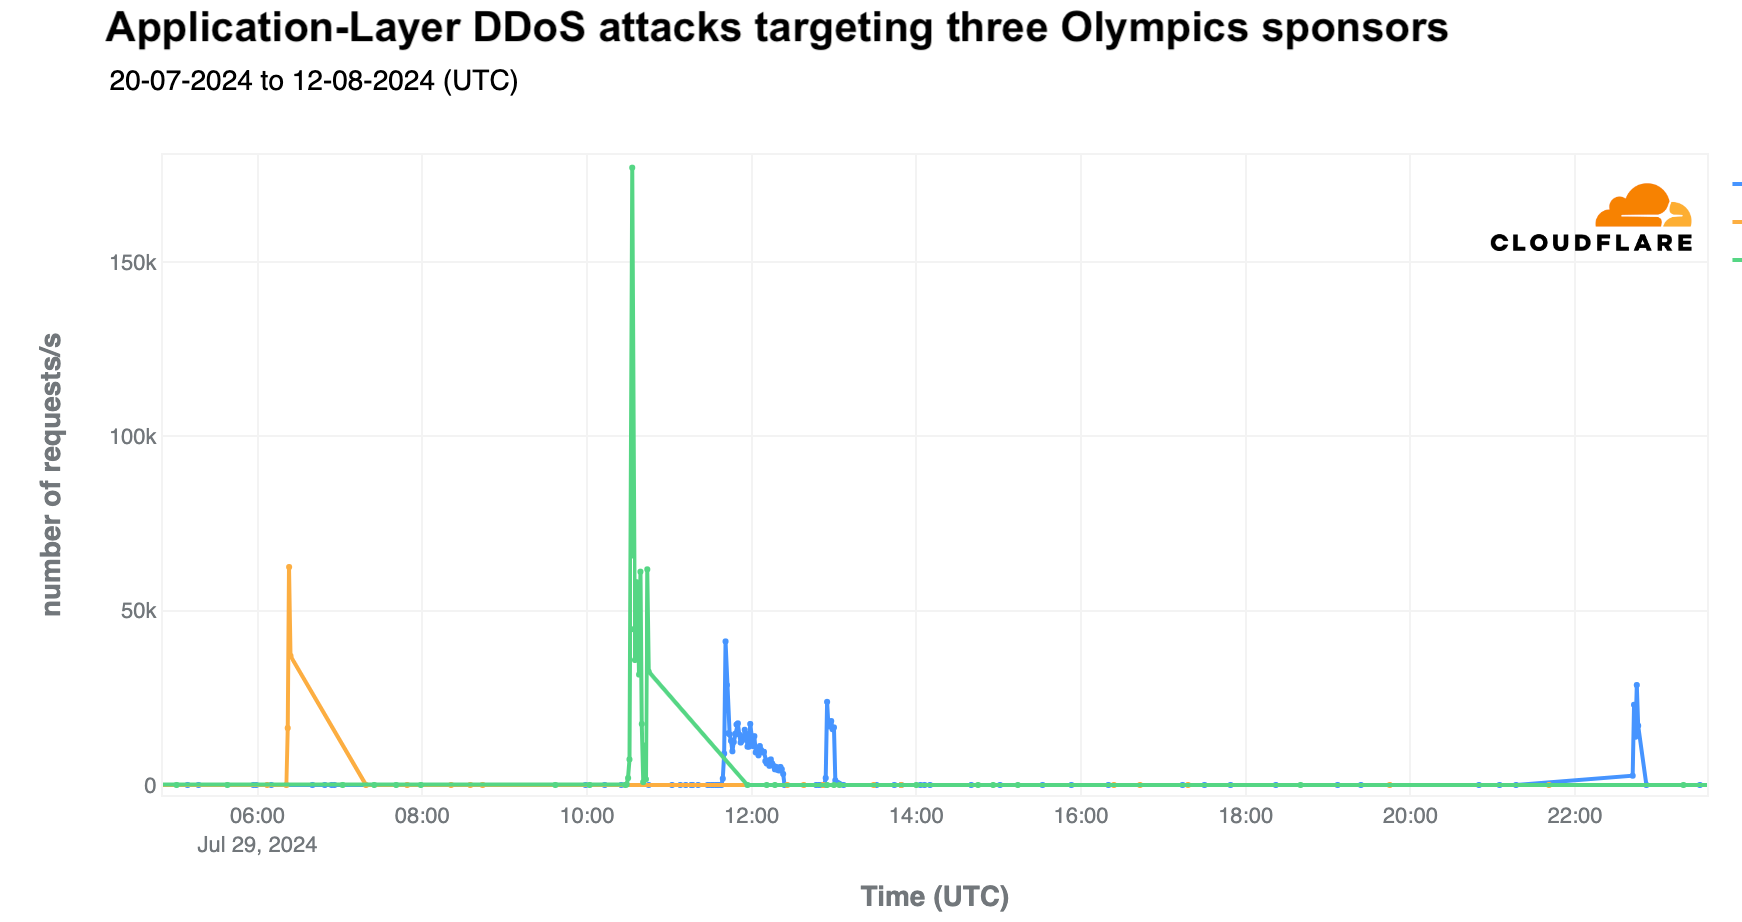
The largest spike in attacks occurred on July 29, targeting three sponsor websites simultaneously, with 84 million DDoS-related requests in a single day. The most intense DDoS attack peaked at 190,000 requests per second at 10:20 UTC.
The most significant specific attack was on the last day of the event, August 11, targeting a French transportation site. It lasted four minutes and peaked at over 500,000 requests per second at 05:09 UTC.
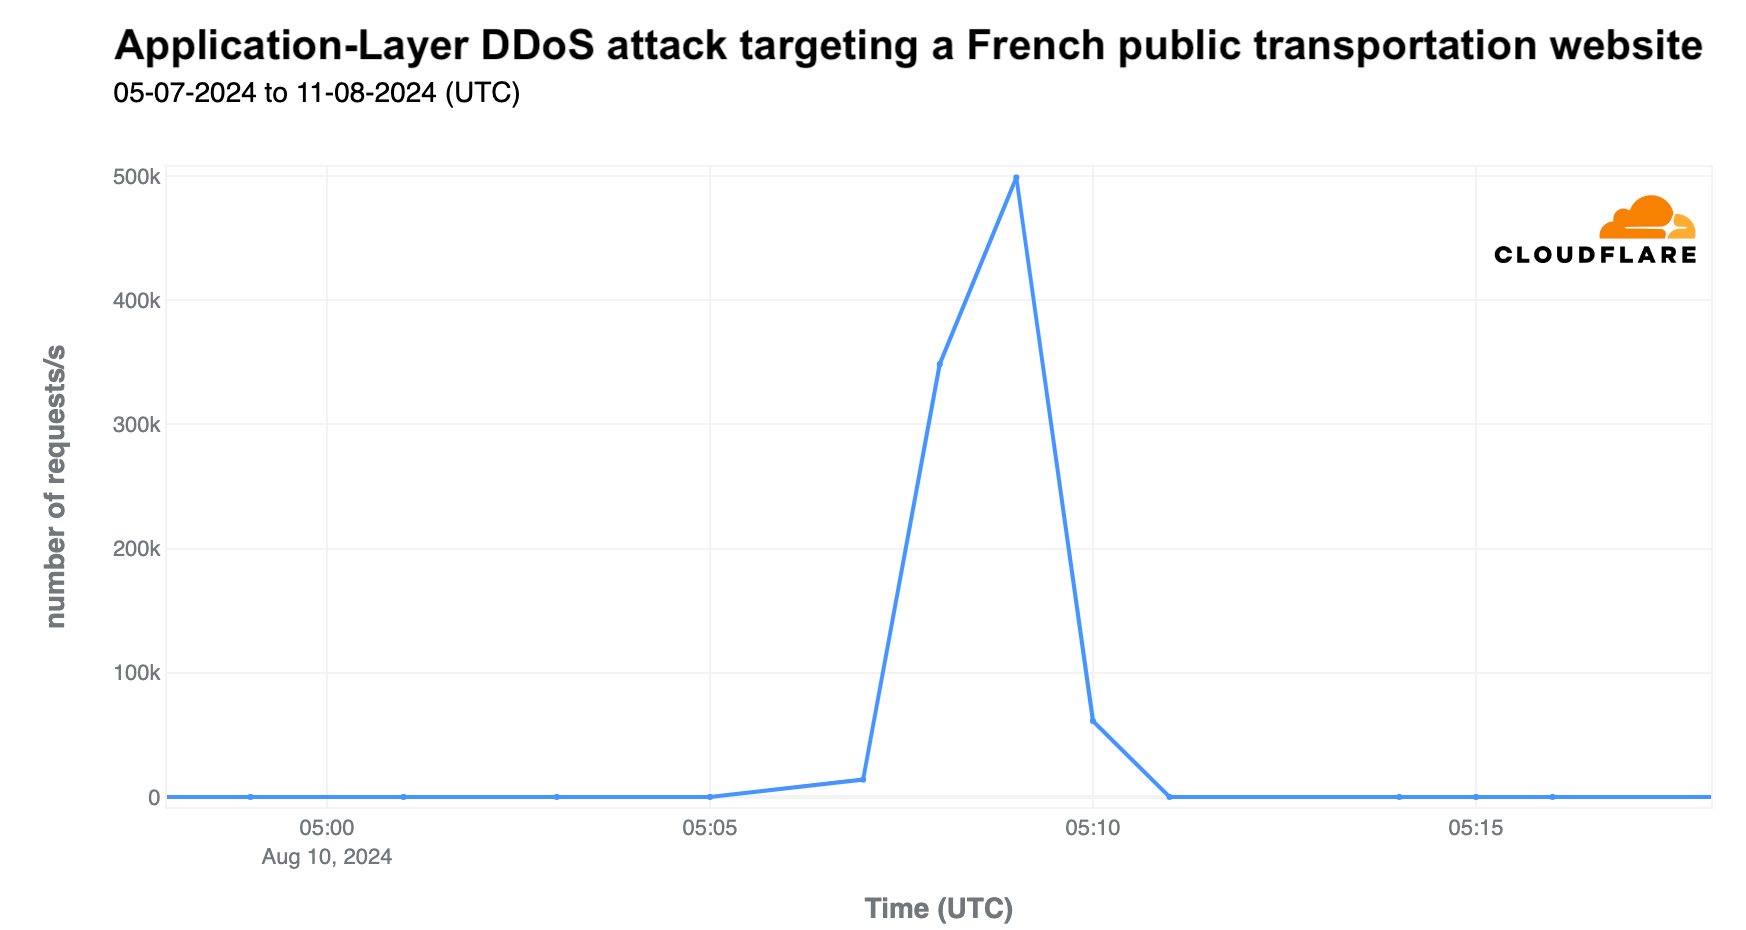
As highlighted in our Q2 DDoS report, most DDoS attacks are short-lived, as seen in the two mentioned attacks. While a 500,000 request per second (rps) attack is not large for Cloudflare, it can be devastating for websites not equipped to handle such traffic levels.
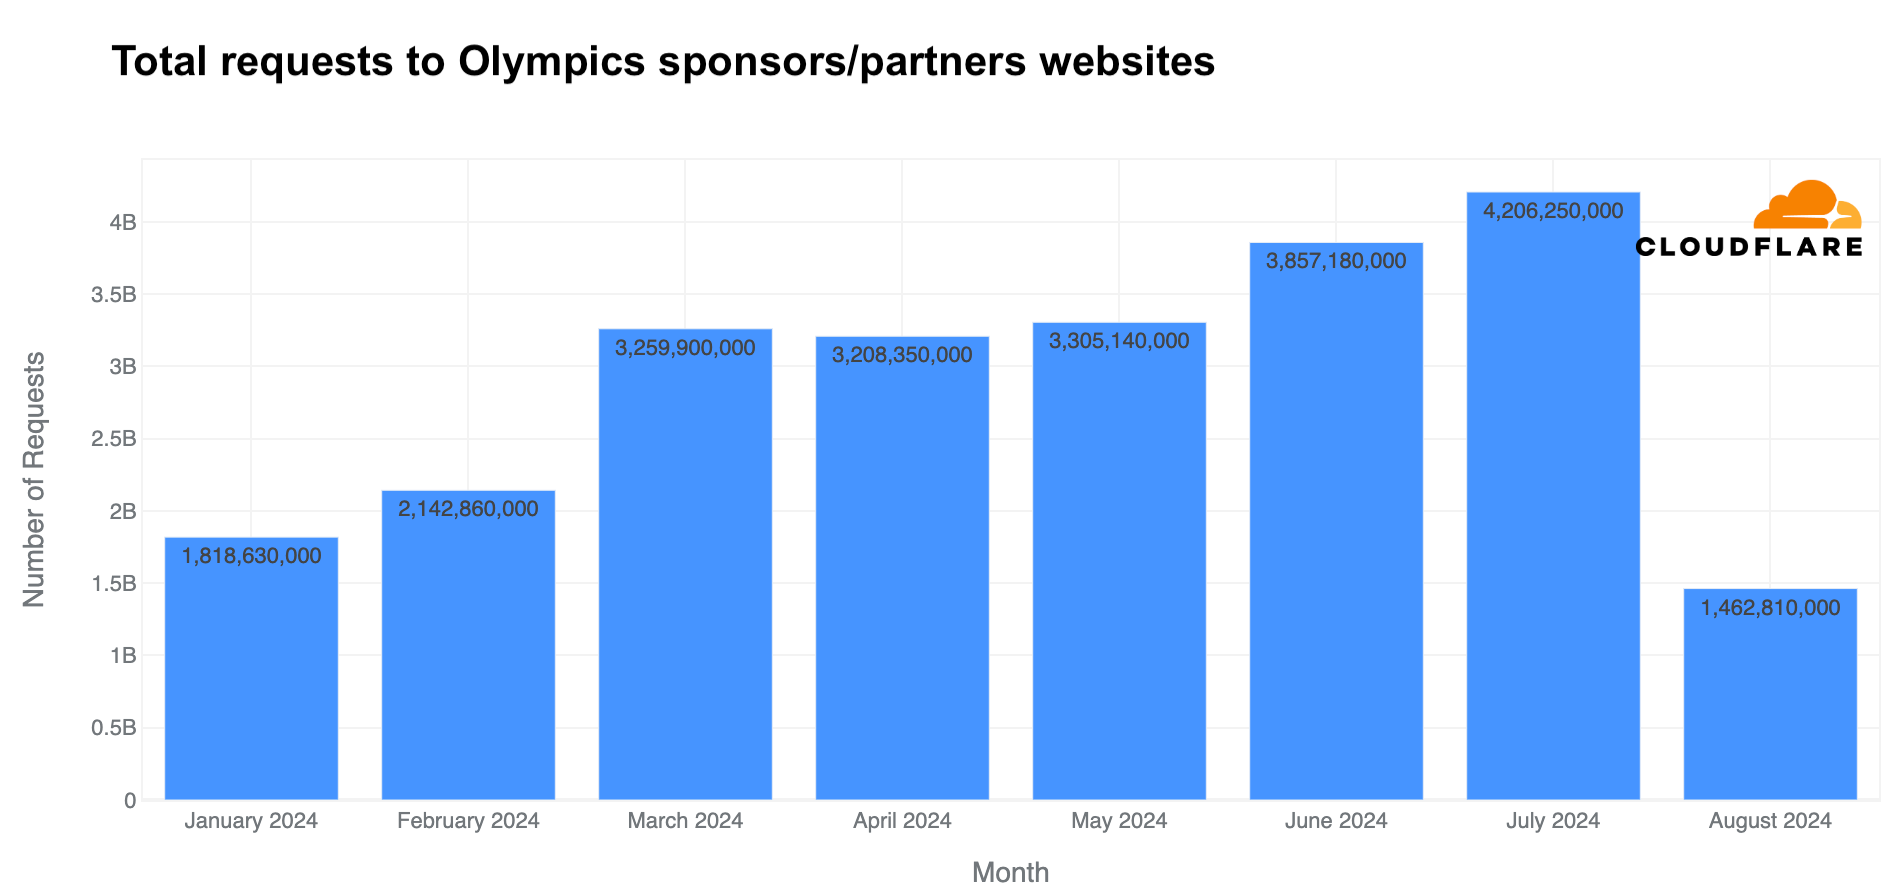
Analyzing the same pool of Olympic partner websites that use Cloudflare, total requests (including legitimate traffic and attacks) rose in July, reaching 4.2 billion—27% more than in May and 11% more than in June.
Rise in “Olympics” and “Paris 2024” emails
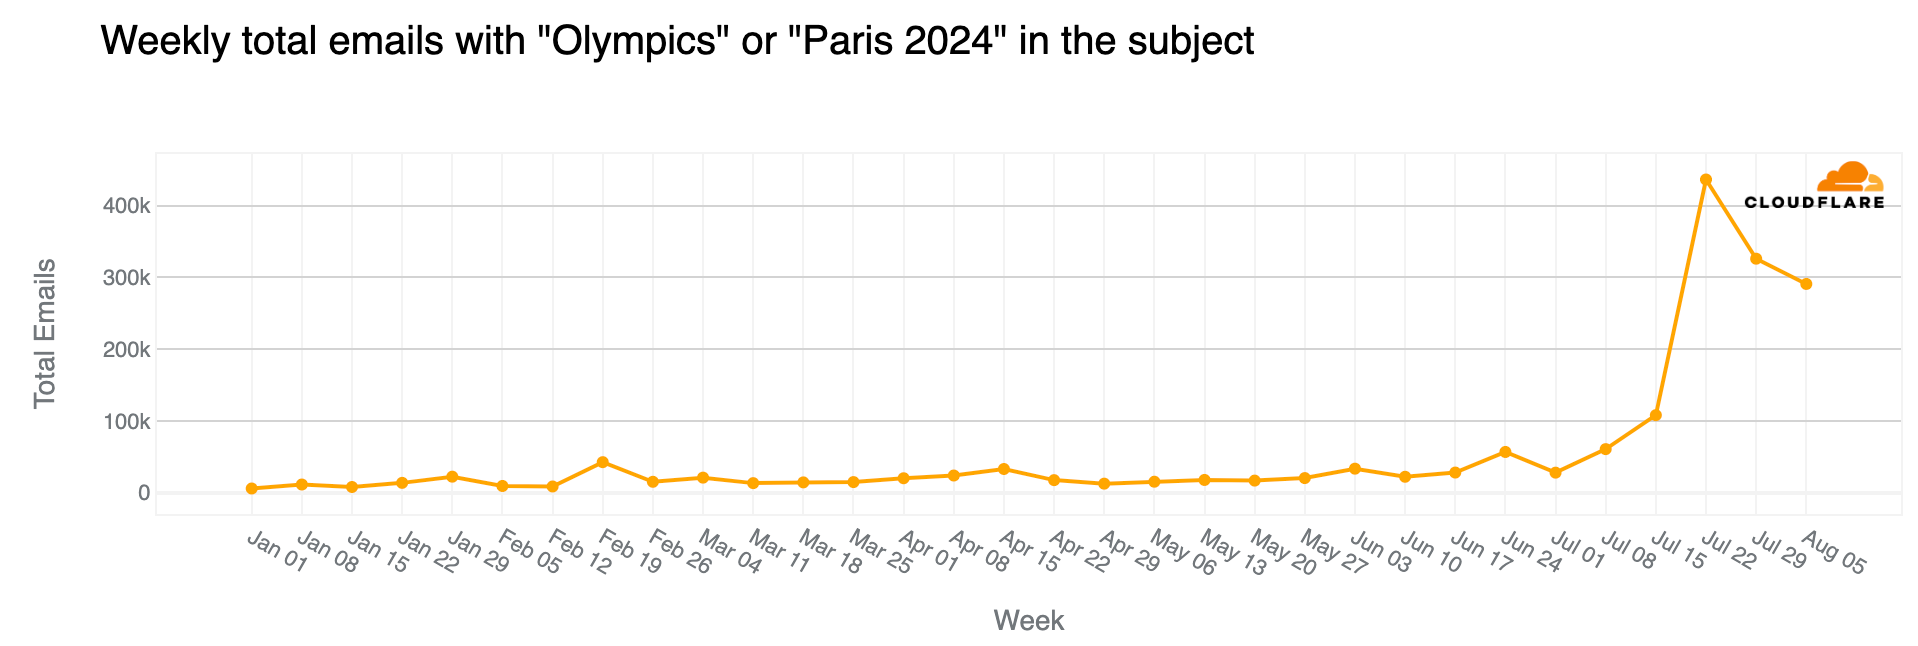
Major events often attract attention in the email realm, including spam and malicious emails, and the Olympics were no exception. From January 2024 through August 11, Cloudflare’s Cloud Email Security service processed over 1.7 million emails containing “Olympics” or “Paris 2024” in the subject. More than half of these emails (890,000) were sent during the Olympics (July 26 to August 11), with the highest volume (150,000 messages) on July 26, the day of the opening ceremony.
The week of July 22-28, coinciding with the first few days of the Olympics, saw a 304% increase in such emails compared to the previous week, and an astonishing 3111% increase compared to the busiest week in January.
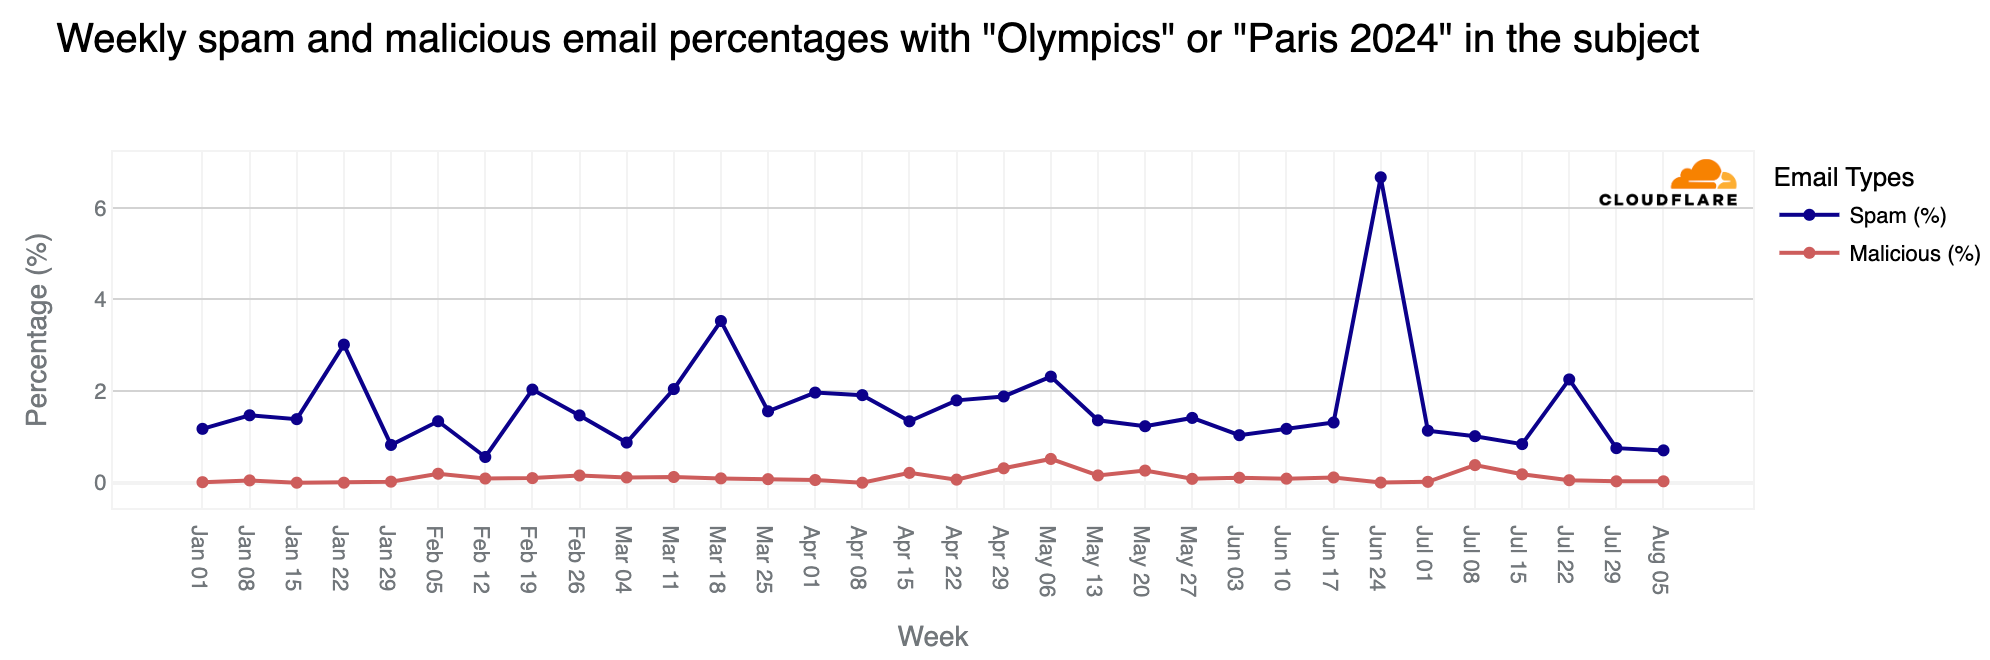
Although the Olympics period (July 26 – August 11) was busy in terms of related emails, the percentages of spam and malicious messages were lower than before. However, over 6,200 emails were classified as spam (0.7%), and just 248 were identified as malicious or phishing (0.07%).
As noted in a previous blog post, since January 1, 2024, spam accounted for 1.3% of all emails with “Olympics” or “Paris 2024” in the subject, while malicious emails made up 0.1%. In a sample of 1,000 emails, roughly 13 would be spam and 1 would be malicious. The peak for malicious Olympic-related emails occurred during the week of May 6, with 0.6% classified as malicious. Although there was a decline after this peak, rates increased slightly in July, reaching 0.4% on July 8. Despite the surge in volume during the week of July 22, only 0.05% of emails were malicious.
Simone Biles and Snoop Dogg popular via email
Famous individuals are often used by attackers for email phishing. Among the athletes shining at the event, Simone Biles generated the most emails, but very few of them were spam or malicious. Biles led other popular names during the event, including those named below, ordered by number of email messages: Katie Ledecky (US), Imane Khelif (Algeria), Novak Djokovic (Serbia), Steph Curry (US), and Léon Marchand (France).
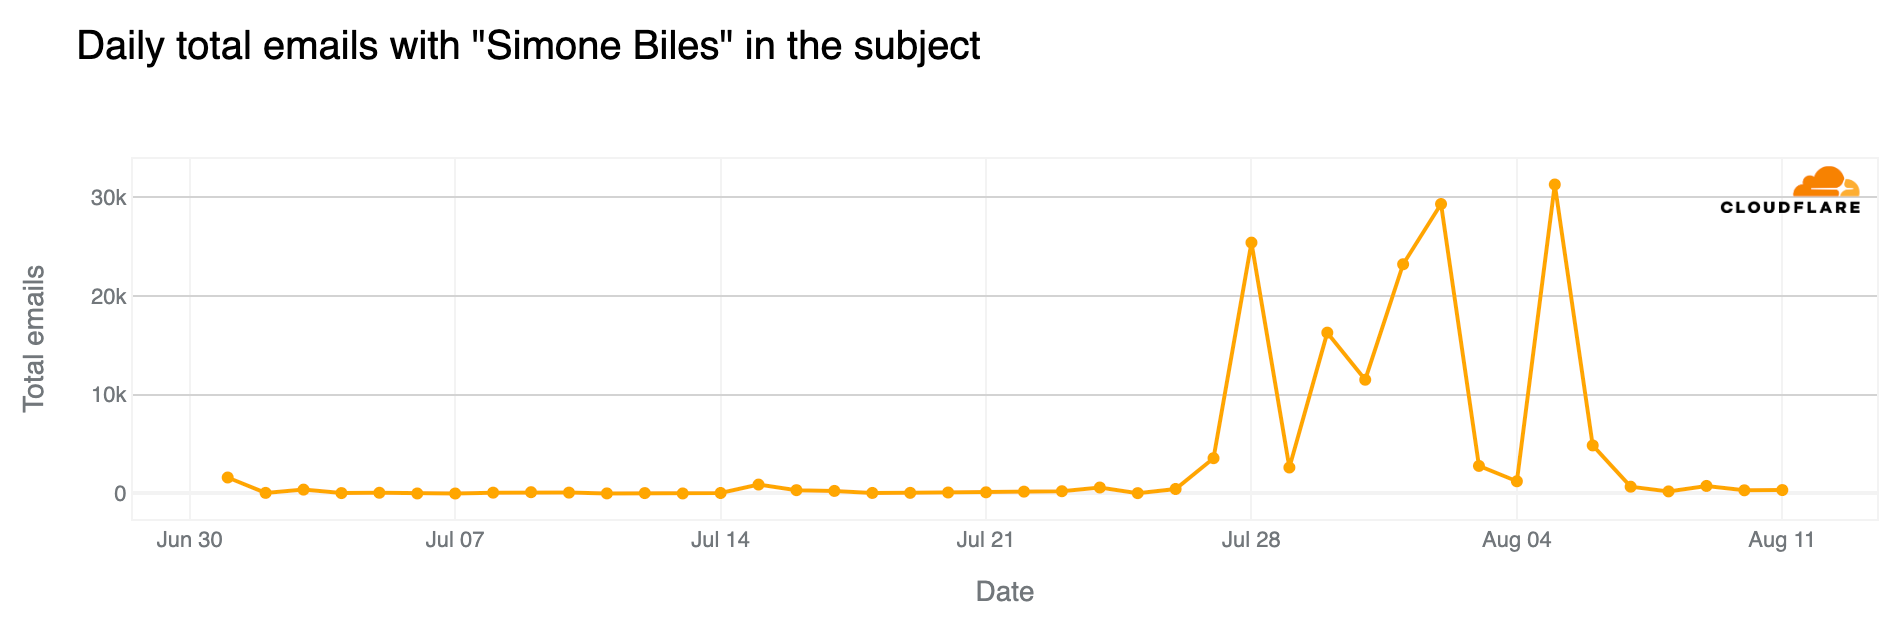
Since July 1, over 160,000 emails processed by Cloudflare’s Cloud Email Security service have included “Simone Biles” or “Biles” in the subject, with only 0.5% considered spam and 0.01% classified as malicious. (And 97% of those 160,000 emails were sent since the Olympics started on July 26.) The most emails were sent on August 5, followed by August 2 and July 28. Spam percentage peaked on July 24, with 5% of all emails considered spam.
Among famous attendees, Snoop Dogg topped the list ahead of other US team supporters like Martha Stewart, Flava Flav, and Jason Kelce. Since July, there have been over 6,600 emails with “Snoop Dogg” in the subject, with 40 classified as spam (0.6%) and 4 as malicious (0.06%).
Conclusion: from Paris to Los Angeles
The Paris 2024 Summer Olympics not only captivated millions worldwide with thrilling sports competitions, but also had a significant impact on global Internet traffic. Our data shows noticeable drops in Internet activity during key Olympic events, particularly in France, as viewers shifted from online activities to watching the games live. This trend underscores the enduring power of broadcast media during major global events, even in an increasingly digital age.
Additionally, the increase in DNS traffic for official Olympic websites and the surge in DNS traffic for streaming platforms covering the event indicates strong interest in online coverage, especially among certain audiences, complementing traditional TV viewership broadcast by national networks worldwide.
Finally, the heightened cybersecurity threats, including DDoS attacks on sponsor sites and the rise in Olympic-related emails (including spam and malicious ones), emphasize both the marketing impact of this global event and its vulnerabilities.
And after the Paris 2024 Summer Olympics, the 2024 Summer Paralympics are just around the corner (August 28-September 8), and in four years, it will be time for LA 2028.
As we’ve observed throughout the Paris 2024 Olympics, the Olympic spirit continues to capture interest and remains relevant across different media. This spirit, present for 2,800 years since Ancient Greece (dating back to 776 BC), still attracts and inspires humanity.
(Jorge Pacheco from the Cloudflare Radar team contributed to this blog post)


 David Victoria is a Senior Technical Product Manager with Amazon DataZone at AWS. He focuses on improving administration and governance capabilities needed for customers to support their analytics systems. He is passionate about helping customers realize the most value from their data in a secure, governed manner. Outside of work, he enjoys hiking, traveling, and making his newborn baby laugh.
 Nora O Sullivan is a Senior Solutions Architect at AWS. She focuses on helping HCLS customers choose the right AWS services for their data and analytics needs so they can derive value from their data. Outside of work, she enjoys golfing and discovering new wines and authors.
 Navneet Srivastava, a Principal Specialist and Analytics Strategy Leader, develops strategic plans for building an end-to-end analytical strategy for large biopharma, healthcare, and life sciences organizations. Navneet is responsible for helping life sciences organizations and healthcare companies deploy data governance and analytical applications, electronic medical records, devices, and AI/ML-based applications while educating customers about how to build secure, scalable, and cost-effective AWS solutions. His expertise spans across data analytics, data governance, AI, ML, big data, and healthcare-related technologies.


 Sean Bjurstrom is a Technical Account Manager in ISV accounts at Amazon Web Services, where he specializes in Analytics technologies and draws on his background in consulting to support customers on their analytics and cloud journeys. Sean is passionate about helping businesses harness the power of data to drive innovation and growth. Outside of work, he enjoys running and has participated in several marathons.
 Seun Akinyosoye is a Sr. Technical Account Manager supporting public sector customer at Amazon Web Services. Seun has a background in analytics, data engineering which he uses to help customers achieve their outcomes and goals. Outside of work Seun enjoys spending time with his family, reading, traveling and supporting his favorite sports teams.
 Vinod Jayendra is a Enterprise Support Lead in ISV accounts at Amazon Web Services, where he helps customers in solving their architectural, operational, and cost optimization challenges. With a particular focus on Serverless technologies, he draws from his extensive background in application development to deliver top-tier solutions. Beyond work, he finds joy in quality family time, embarking on biking adventures, and coaching youth sports team.
 Kamen Sharlandjiev is a Sr. Big Data and ETL Solutions Architect, MWAA and AWS Glue ETL expert. He’s on a mission to make life easier for customers who are facing complex data integration and orchestration challenges. His secret weapon? Fully managed AWS services that can get the job done with minimal effort. Follow Kamen on
  Chris Scull is a Solutions Architect dealing in orchestration tools and modern cloud technologies. With two years of experience at AWS, Chris has developed an interest in Amazon Managed Workflows for Apache Airflow, which allows for efficient data processing and workflow management. Additionally, he is passionate about exploring the capabilities of GenAI with Bedrock, a platform for building generative AI applications on AWS.
 Shengjie Luo is a Big data architect of Amazon Cloud Technology professional service team. Responsible for solutions consulting, architecture and delivery of AWS based data warehouse and data lake, and good at server-less computing, data migration, cloud data integration, data warehouse planning, data service architecture design and implementation.
 Qiushuang Feng is a Solutions Architect at AWS, responsible for Enterprise customers’ technical architecture design, consulting, and design optimization on AWS Cloud services. Before joining AWS, Qiushuang worked in IT companies such as IBM and Oracle, and accumulated rich practical experience in development and analytics.
