Post Syndicated from Explosm.net original https://explosm.net/comics/anime-figure
New Cyanide and Happiness Comic
Post Syndicated from Explosm.net original https://explosm.net/comics/anime-figure
New Cyanide and Happiness Comic
Post Syndicated from xkcd.com original https://xkcd.com/2966/

Post Syndicated from Curious Droid original https://www.youtube.com/watch?v=GTHY68S4Wxo
Post Syndicated from digiblur DIY original https://www.youtube.com/watch?v=YgmoxtwqbZk
Post Syndicated from jake original https://lwn.net/Articles/983105/
At the 2024 Linux
Storage, Filesystem, Memory Management, and BPF Summit, John Groves led
a session on famfs, which is a filesystem he has developed that uses the
kernel’s direct-access (DAX)
mechanism to access memory that is shareable between hosts. The discussion
was aimed at whether a different approach should be taken and, in
particular, whether FUSE should be used instead of implementing as an
in-kernel filesystem. As noted in the thread about his
proposal for an LSFMM+BPF session, and the mailing-list discussions on the first and second
version of his patch set, there is some skepticism that a new in-kernel
filesystem is warranted for the use case.
Post Syndicated from João Tomé original https://blog.cloudflare.com/paris-2024-summer-olympics-impacted-internet-traffic
The Paris 2024 Summer Olympics, themed “Games Wide Open” (“Ouvrons grand les Jeux”), kicked off on Friday, July 26, 2024, and will run until August 11. A total of 10,714 athletes from 204 nations, including individual and refugee teams, will compete in 329 events across 32 sports. This blog post focuses on the opening ceremony and the initial days of the event, examining associated impact on Internet traffic, especially in France, the popularity of Olympic websites by country, and the rise in Olympics-related spam and malicious emails.
Cloudflare has a global presence with data centers in over 320 cities, supporting millions of customers, which provides a global view of what’s happening on the Internet. This is helpful for improving security, privacy, efficiency, and speed, but also for observing Internet disruptions and traffic trends.
We are closely monitoring the event through our 2024 Olympics report on Cloudflare Radar and will provide updates on significant Internet trends as they develop.
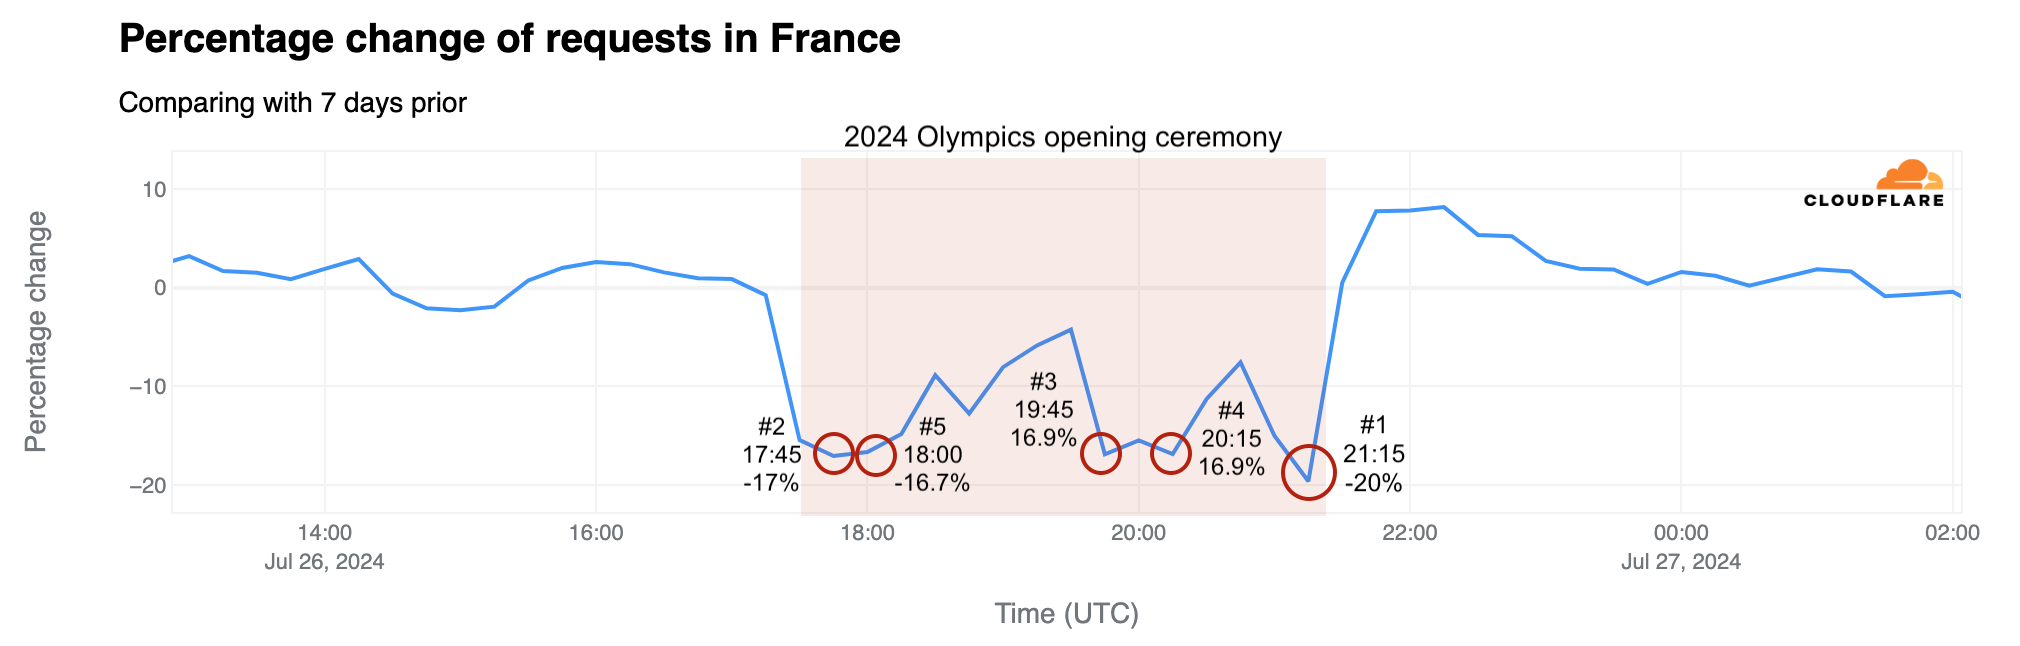
For the first time in modern Olympic history, the opening ceremony was held outside a stadium, lasting nearly four hours and clearly impacting Internet traffic in France. The nation’s engagement was evident during the TV broadcast, leading to noticeable traffic drops similar to those observed during Euro 2024 – we’ve seen that national TV broadcast events usually come with drops in Internet traffic.
The Olympics are more than just sporting events – they are filled with inspiring moments and stories that capture global attention in real time, and create stories that live on. Significant traffic dips during the ceremony coincided with performances by Celine Dion and Lady Gaga, the lighting of the Olympic cauldron, and John Lennon’s “Imagine” performed by Juliette Armanet. Here is a breakdown of the top five traffic drops compared to the previous week that occurred during the ceremony, detailing the events occurring at those times. Our data provides insights with 15-minute granularity.
|
Time of drop (UTC) |
Drop % |
Events at the time |
|
|
#1 |
~21:15 |
-20% |
The Olympic cauldron is lit and floats into the Paris sky via air balloon; Celine Dion serenades Paris from the Eiffel Tower. |
|
#2 |
~17:45 |
-17% |
Lady Gaga sings the French classic “Mon truc en plumes” by Zizi Jeanmaire. |
|
#3 |
~19:45 |
-16.9% |
Team USA boat takes to the river, followed by Team France – the last boat en route to the Eiffel Tower. |
|
#4 |
~20:15 |
-16.9% |
Dionysus performs the song “Naked” (Philippe Katerine); John Lennon’s “Imagine” is sung from the middle of the Seine by Juliette Armanet; a metal horse rides down the river. |
|
#5 |
~18:00 |
-16.7% |
As the boats continue along the Seine, around 80 artists from the Moulin Rouge perform the famous French cabaret dance, the can-can. |
During the opening ceremony on July 26, between 17:30 to 21:20 UTC, traffic in France was noticeably lower than the previous week, with losses between 15% and 20%. However, there were moments with smaller drops. For example, at 19:30 UTC, traffic only fell by 4% during the middle of the boat parade of athletes on the Seine River. Right after the event, at 21:45 UTC, traffic increased by as much as 8% compared to the previous week.
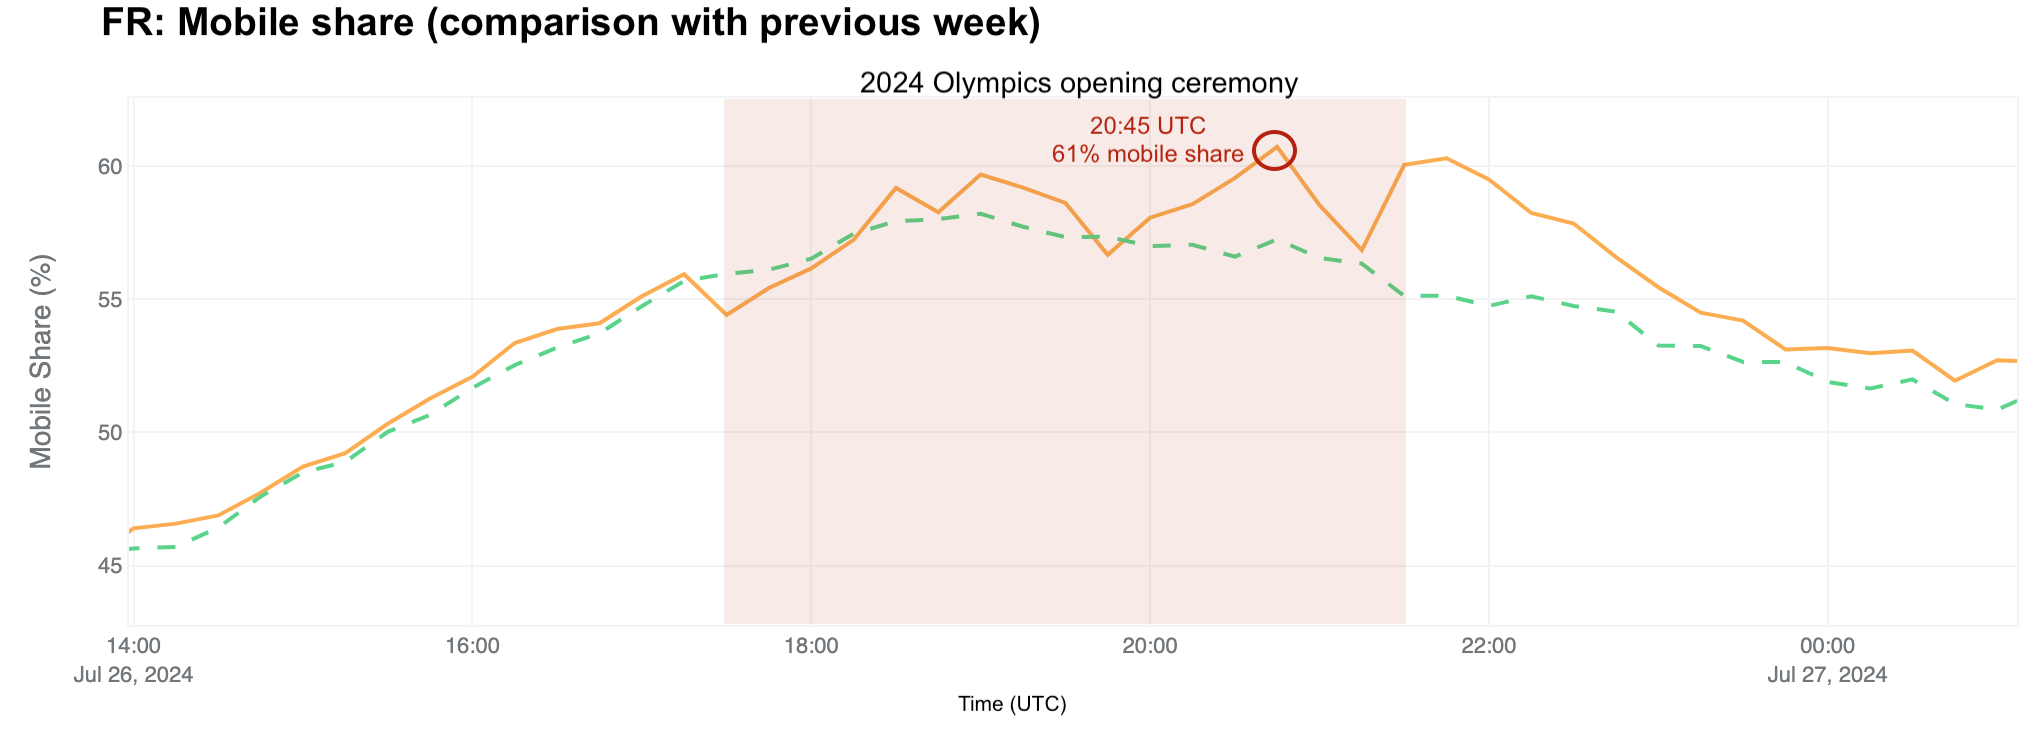
The opening ceremony also resulted in a higher mobile share of traffic than usual in France. At 20:45 UTC, close to the end of the ceremony, the mobile share of Internet traffic was 61%, up from 57% the previous week.
With the Olympics in Paris, many locals left the city, either for vacations or quieter places, while tourists arrived for the games. Our data shows that two French regions, Île-de-France, where Paris is located, and Grand Est, east of Paris, experienced the most significant traffic drops. The chart below illustrates daily traffic to these regions, with a noticeable decline visible during the weekend before the Olympics in Île-de-France.
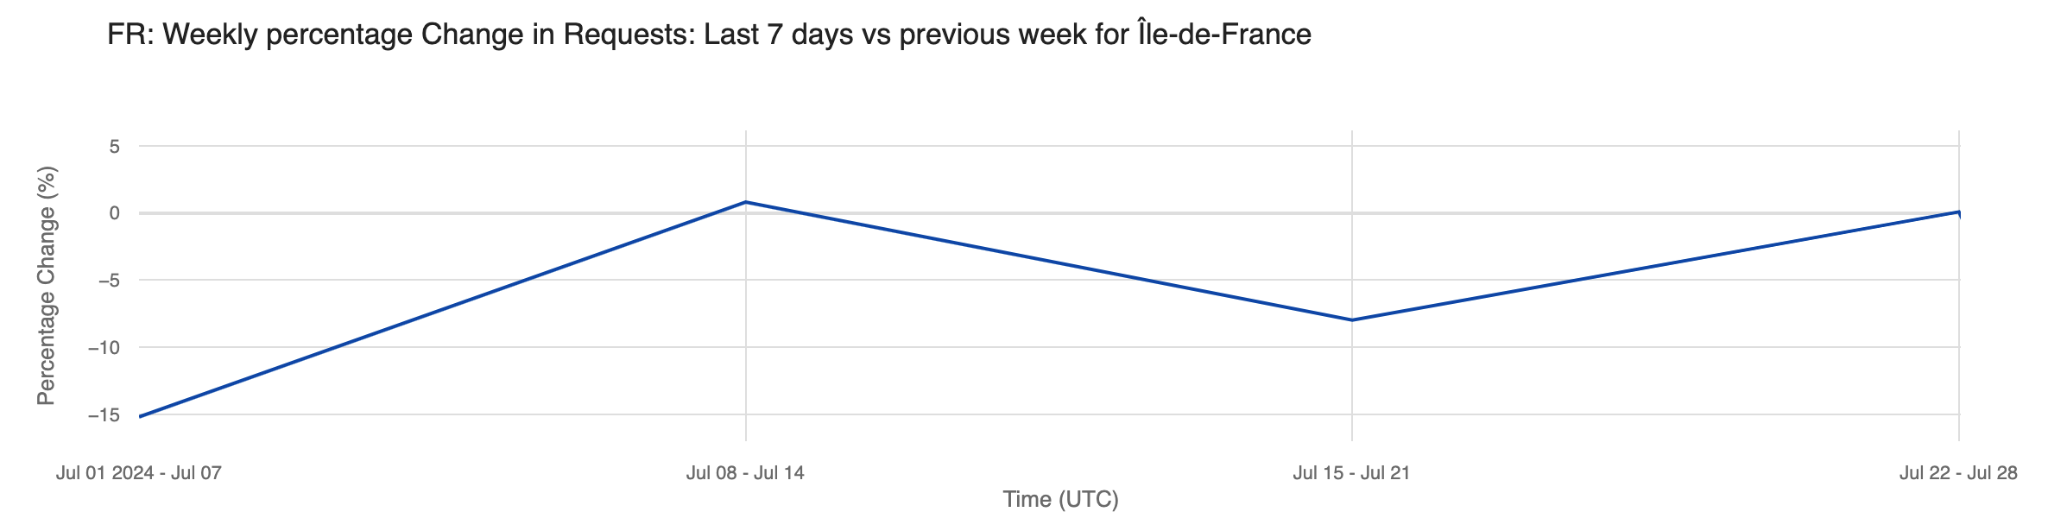
Analyzing the percentage change in request traffic from the previous week, Île-de-France saw its largest drops in the first week of July (July 1-7), with a 15% decrease, and the week before the Olympics started, with an 8% decrease. Interestingly, there was no percentage change in traffic during the week of the Olympics (July 22-28) – that was also the week when most visitors for the Olympics started to arrive.
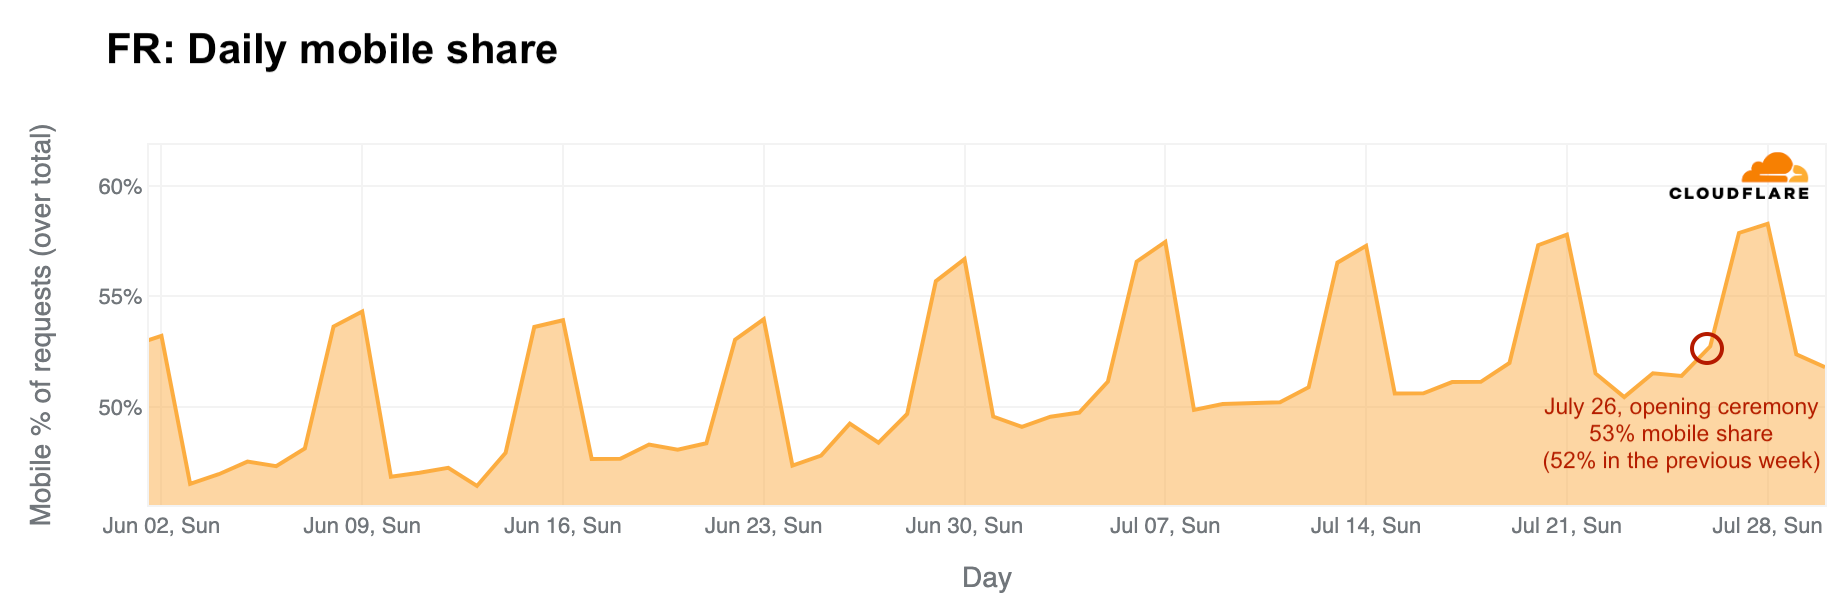
The daily share of mobile device traffic from France also reveals shifts in typical patterns, with increases noted especially after the June 30 weekend, indicative of vacation periods and leisure Internet use. Mobile device traffic peaked during the first Olympic weekend, reaching 53% on July 26, the day of the opening ceremony – higher than any previous Friday since June. On Sunday, July 28, mobile device traffic peaked at 58%, the highest since June.
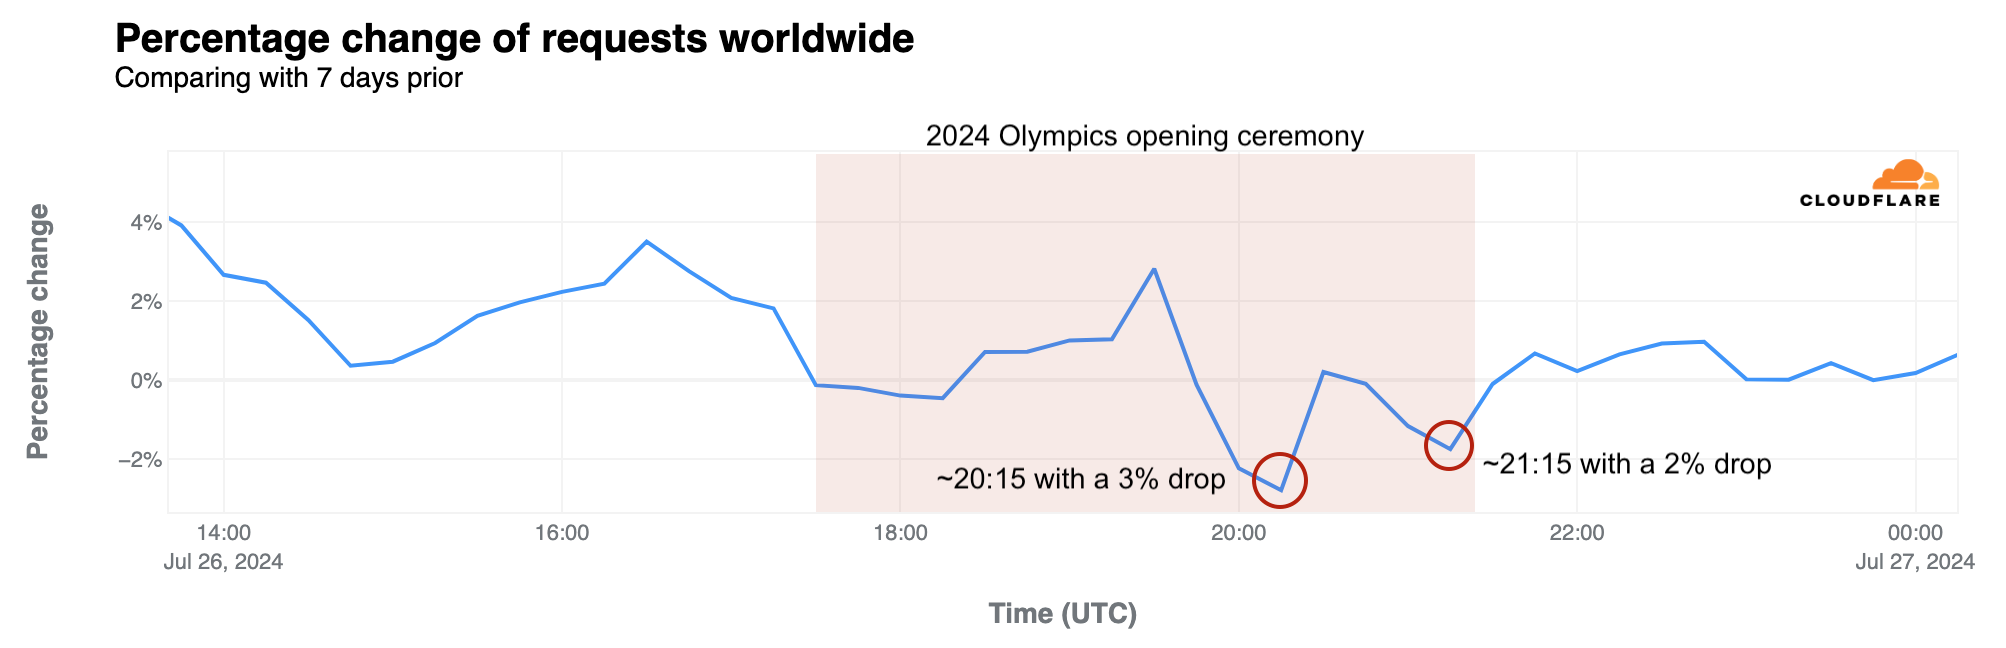
Globally, Internet traffic variations were less pronounced than in France. However, on July 26, the day of the opening ceremony, a noticeable global drop occurred during the event. This was particularly evident during two key moments previously highlighted: during song performances at 20:15 UTC, traffic dropped 3% compared to the previous week, and around the end of the ceremony, at 21:15 UTC, it dropped 2%.
Expanding our view to other countries, moments of significant drops in traffic during the opening ceremony were clearly visible. Below is a summary list of 30 countries selected based on their tally of Summer Olympic medals.
|
Country |
Drop in traffic (%) |
Time of drop (UTC) |
|
United States |
-4% |
20:15 |
|
Great Britain |
-8% |
20:15 |
|
France |
-20% |
21:15 |
|
Germany |
-4% |
20:15 |
|
China |
-4% |
21:00 |
|
Italy |
-11% |
18:15 |
|
Australia |
-2% |
20:00 |
|
Hungary |
-5% |
21:15 |
|
Sweden |
-4% |
21:15 |
|
Japan |
-12% |
21:15 |
|
Russia |
-7% |
19:45 |
|
Canada |
-3% |
20:15 |
|
Netherlands |
-6% |
21:15 |
|
Romania |
-12% |
20:00 |
|
Finland |
-12% |
17:30 |
|
Poland |
-5% |
21:15 |
|
South Korea |
-4% |
20:15 |
|
Cuba |
-3% |
19:00 |
|
Bulgaria |
-6% |
21:15 |
|
Switzerland |
-10% |
18:15 |
|
Denmark |
-2% |
21:15 |
|
Spain |
-8% |
18:15 |
|
Norway |
-2% |
21:15 |
|
Belgium |
-5% |
21:15 |
|
Brazil |
-3% |
18:15 |
|
Czech Republic |
-10% |
18:00 |
|
Slovakia |
-11% |
20:15 |
|
Ukraine |
-2% |
20:45 |
|
New Zealand |
-9% |
21:15 |
|
Greece |
-11% |
18:00 |
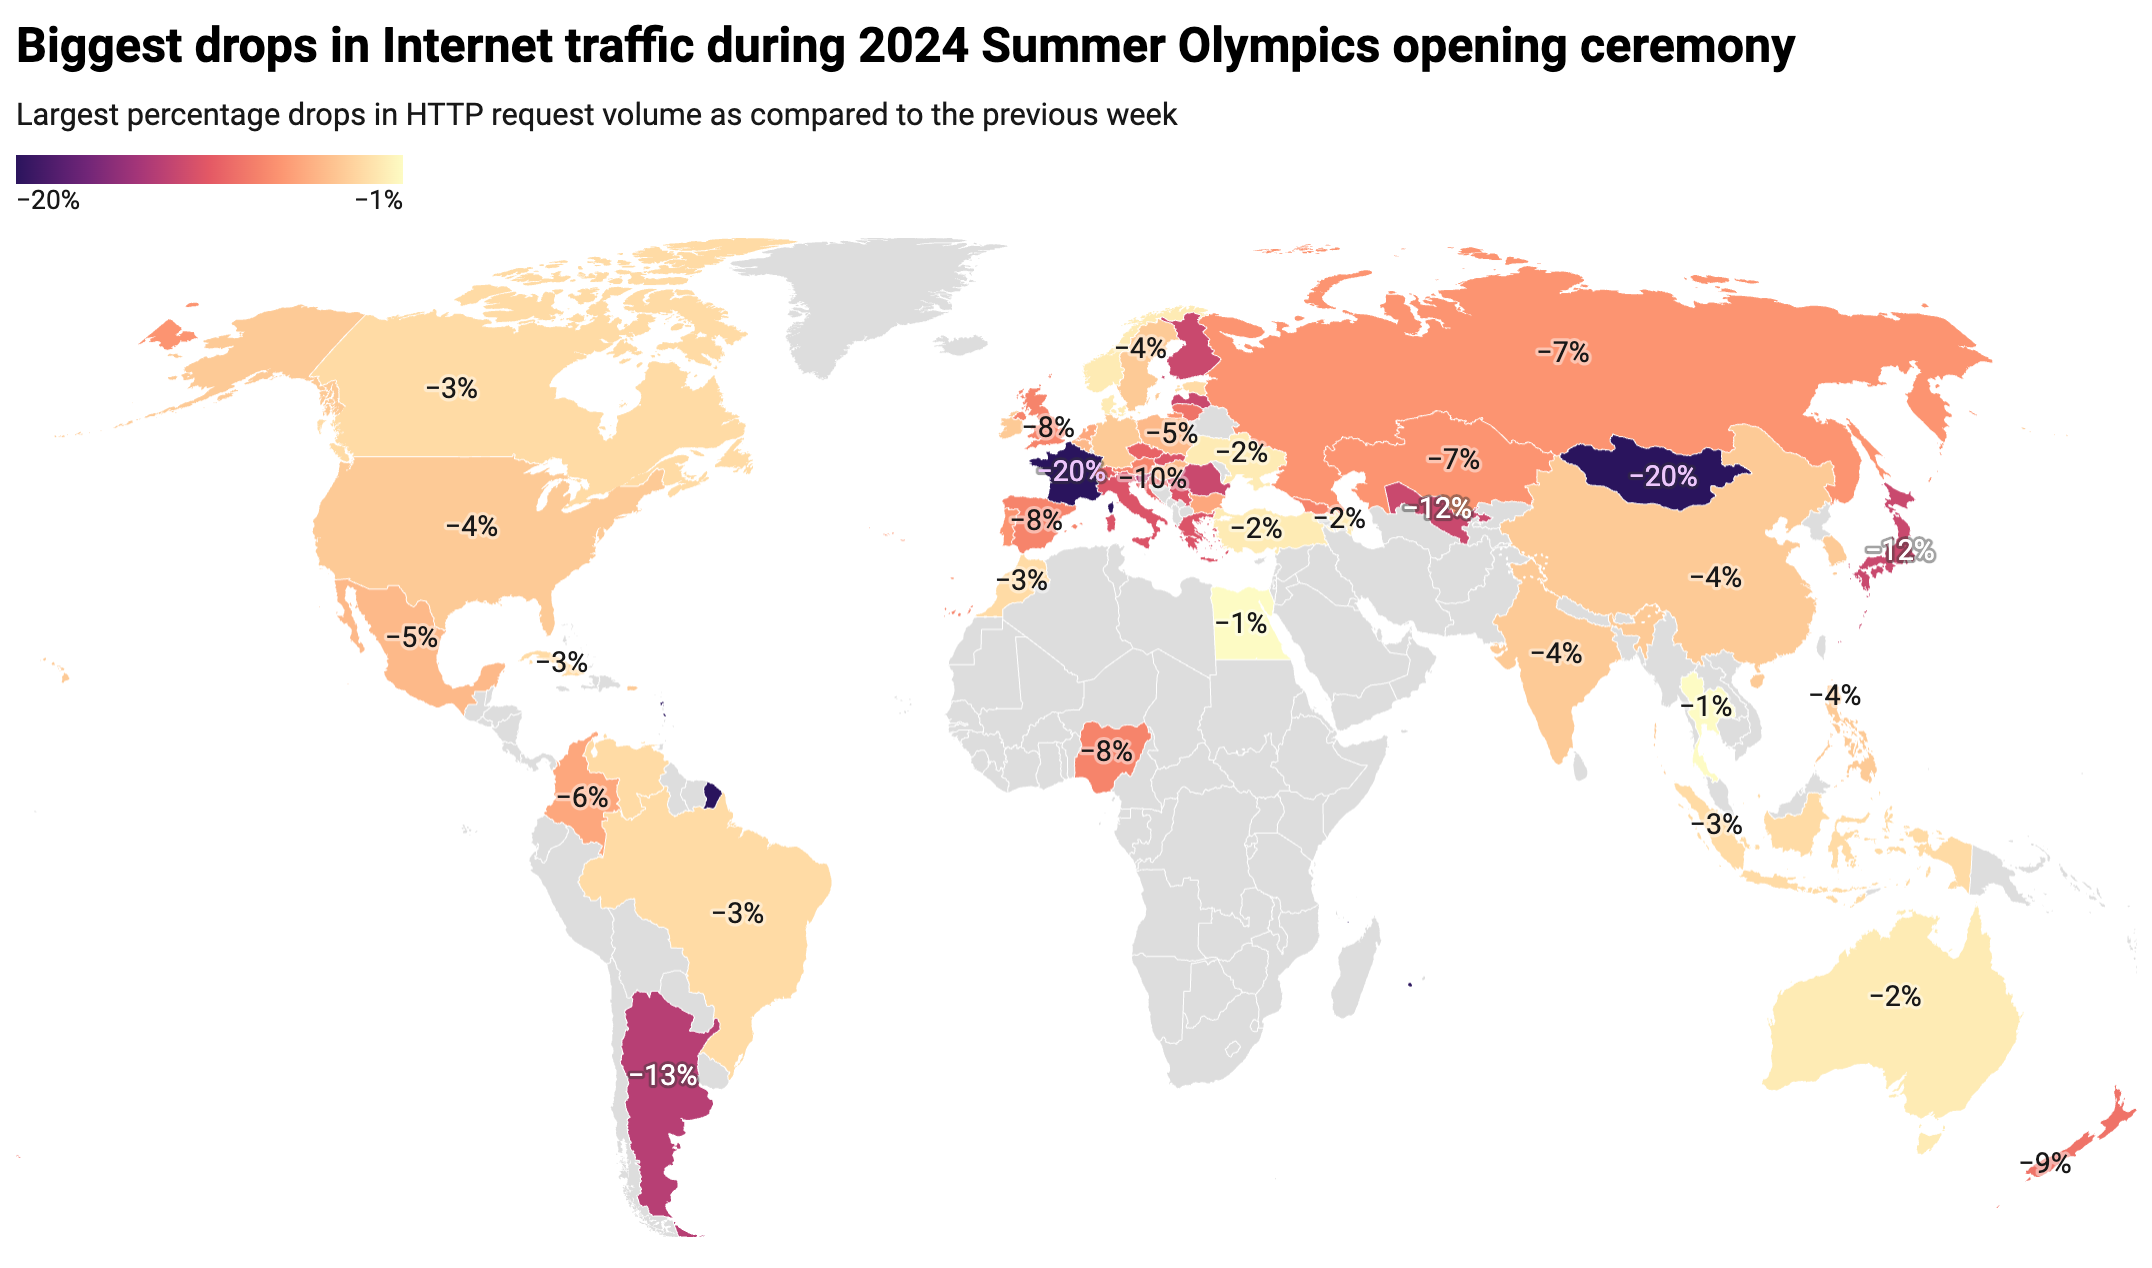
Additionally, the world map below highlights the countries that experienced notable Internet traffic impacts during the opening ceremony.
(Source: Cloudflare; created with Datawrapper)
Outside Europe, the countries with the most substantial drops were New Zealand (-9%), Uzbekistan (-12%), Argentina (-13%), and Mongolia -(20%), all experiencing greater declines than those in Europe.
Below, we highlight specific Olympic events affecting Internet traffic, starting from the first full competition day on Saturday, July 27, 2024.
United States: The artistic gymnastics competition featuring four-time Olympic gold medalist Simone Biles notably impacted US Internet traffic more than the opening ceremony. On July 26-28, traffic dipped most significantly during Biles’ events. At 10:00 UTC, concurrent with her beam routine, traffic was already 4% lower than the previous week. It dropped by 6% at 10:45 UTC during her floor and vault routines.
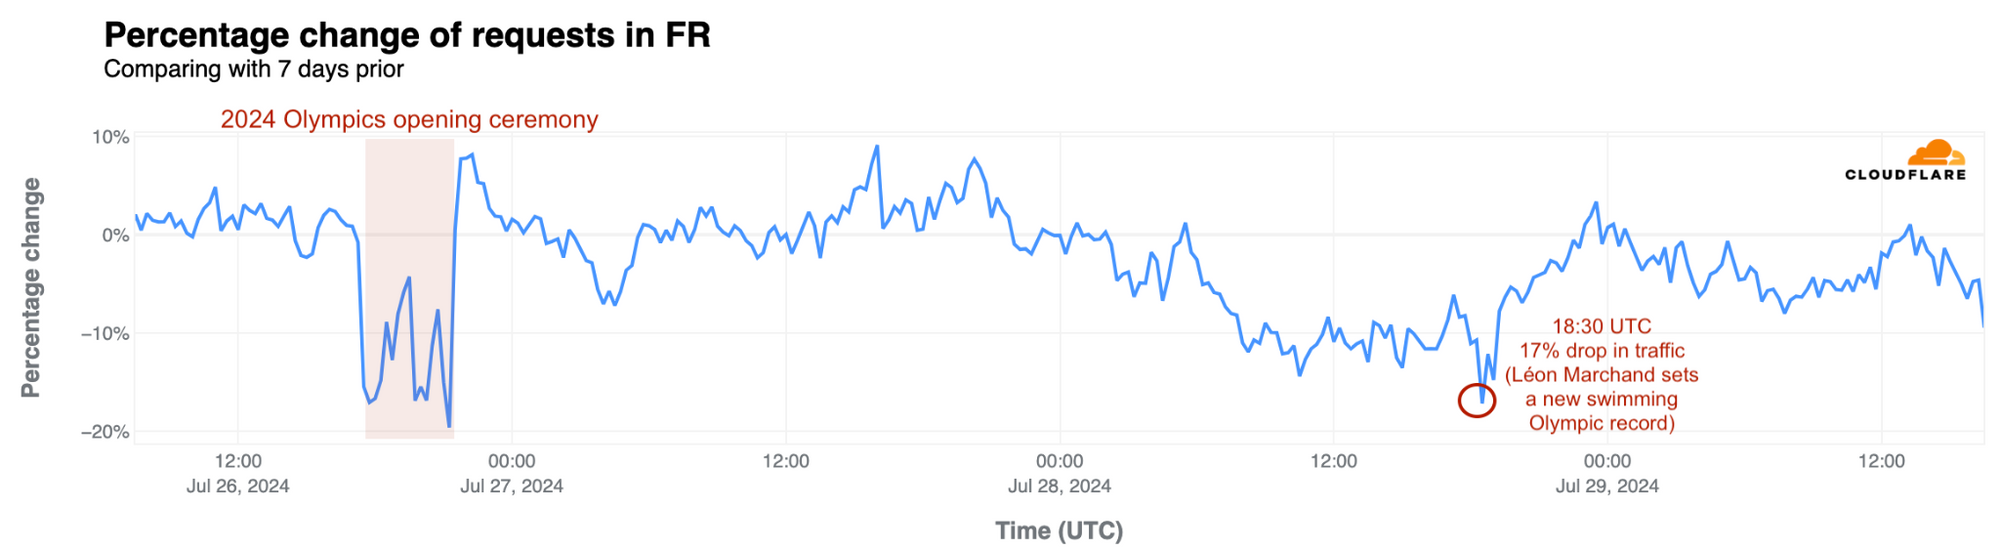
France: French swimmer Léon Marchand’s gold medal and Olympic record-setting performance in the men’s 400-meter individual medley on July 28 had the most significant impact in the host nation. Traffic fell by 17% at 18:30 UTC during his event. However, as we noted above, the opening ceremony drove a bigger drop in traffic.
Australia: During Mollie O’Callaghan’s victory in the women’s 200m freestyle on July 29, at around 20:00 UTC, Australian traffic was 5% lower than the previous week This was larger than during the opening ceremony, which saw a 2% drop.
South Korea: The Korean women’s archery team’s gold medal win on July 28 at 15:30 UTC led to an 8% drop in traffic, the most significant decrease noted in the country from July 26 to July 29.
Brazil: Traffic in Brazil was15% lower than the previous week on July 27 at around 19:30 UTC, surpassing the opening ceremony’s impact. This occurred as Brazilian swimmers Guilherme Costa and Maria Fernanda Costa competed in the men’s and women’s 400 m freestyle events.
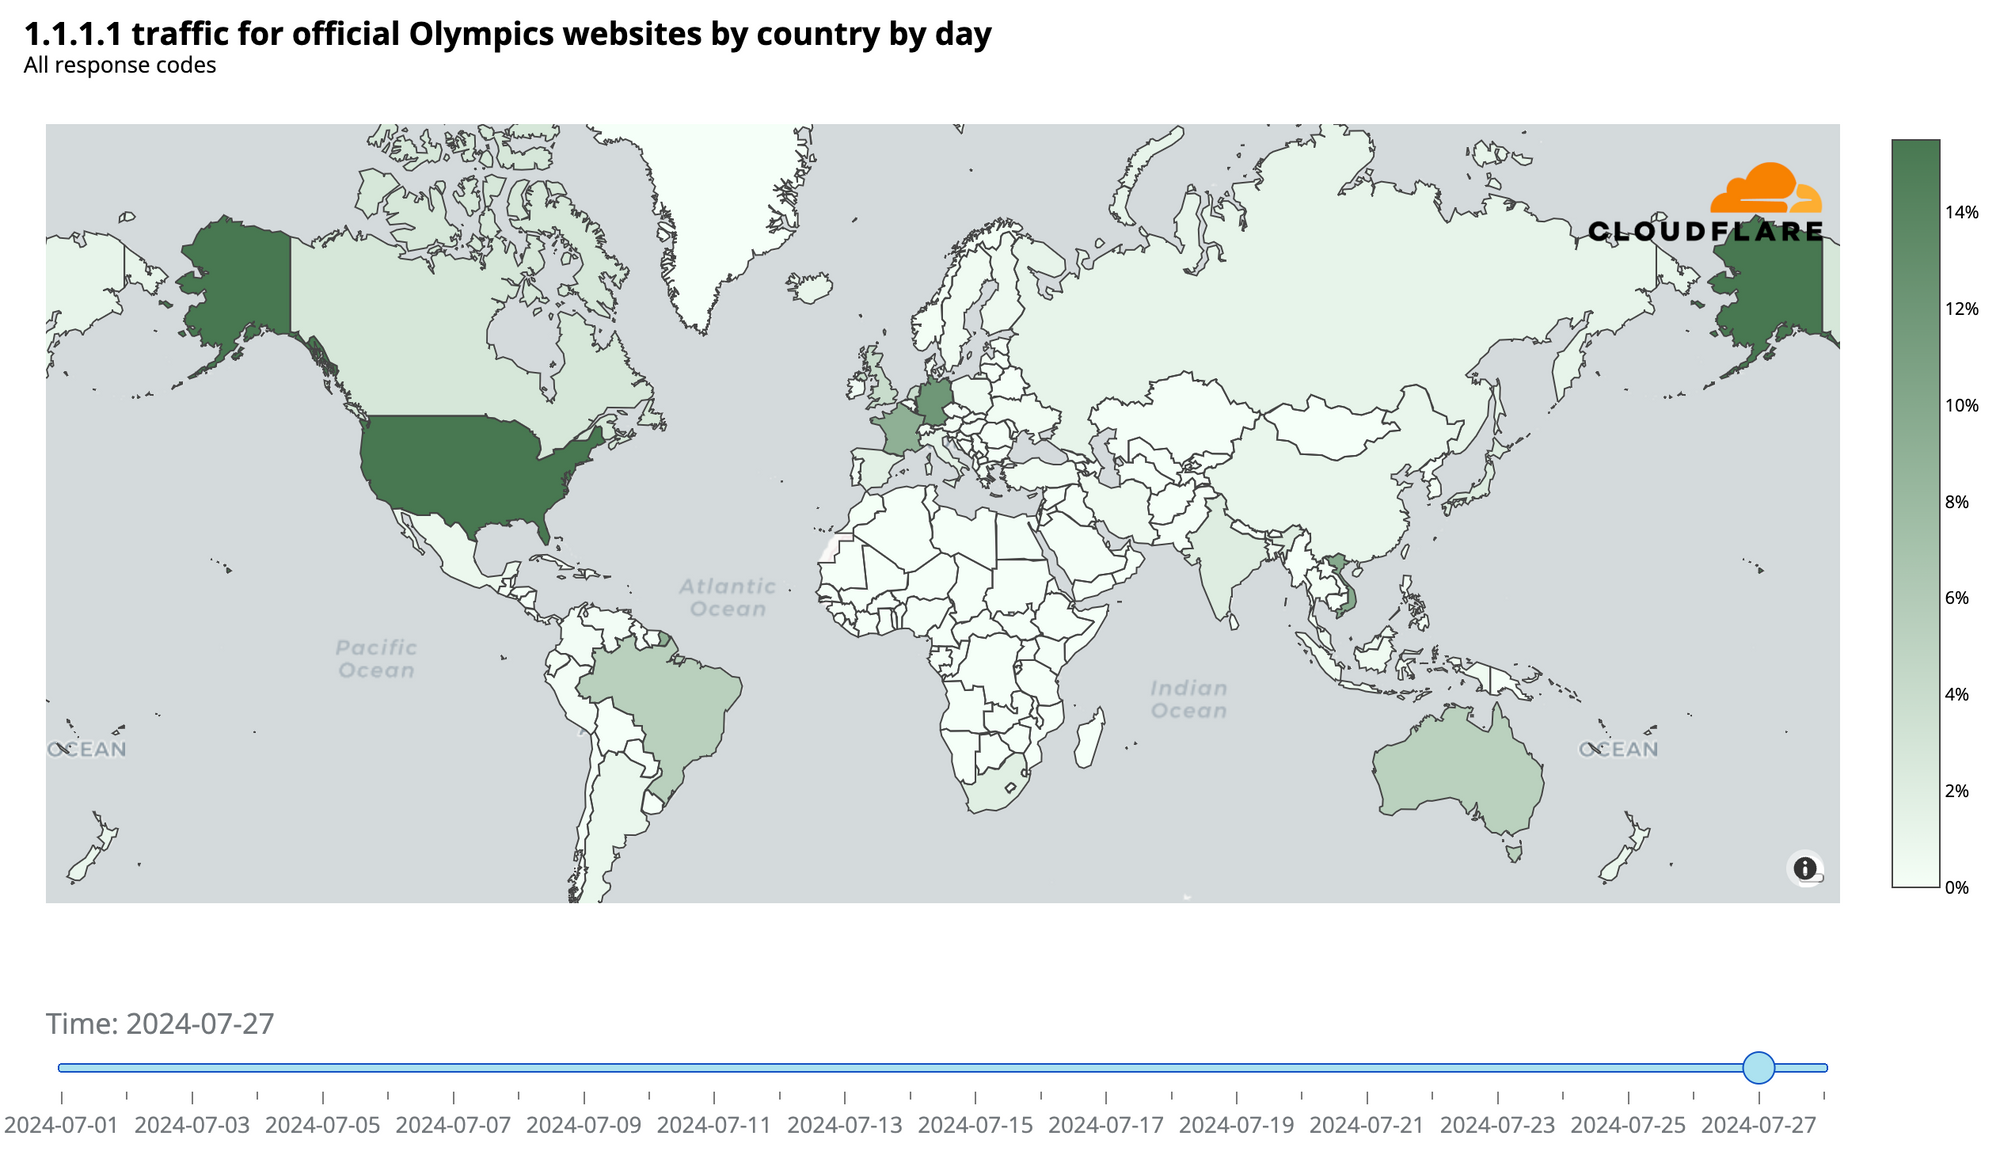
On July 22, before the Olympics started, we reported on the heightened interest in official Olympic websites based on request data from our 1.1.1.1 DNS resolver. We noted France’s dominance with 24% of DNS traffic to official Olympic websites, followed by the UK (20%) and the US (17%). However, the start of the Olympics marked a shift, with the US taking the lead.
On the first full day of competitions, July 27, the US led with 16% of all DNS request traffic to official Olympic sites. This change indicates a broader spread of interest across countries during the Olympics. A dynamic version of the map below is available in our Paris 2024 Olympics report.
Here are the top 10 countries with the highest shares of DNS request traffic for the first full day of competitions, July 27, to Olympic sites (percentages rounded):
United States: 16%
Germany: 12%
France: 9%
Vietnam: 9%
Brazil: 5%
Australia: 5%
United Kingdom: 4%
Netherlands: 4%
Canada: 3%
South Africa: 2%
Global daily DNS request traffic to official Olympic websites began climbing to the highest levels seen year to date starting on July 23, showing a steady increase. It peaked on July 28, the second full day of events, with a fivefold (509%) increase from the previous week. On the opening ceremony day, traffic was already 110% higher than the previous week.
Country-specific peaks included the US, where traffic to Olympic sites surged 719% on July 28, coinciding with Simone Biles’ first competition day. In France, traffic peaked on the same day with a 391% increase, and in Germany, it skyrocketed by 2300% on July 27.
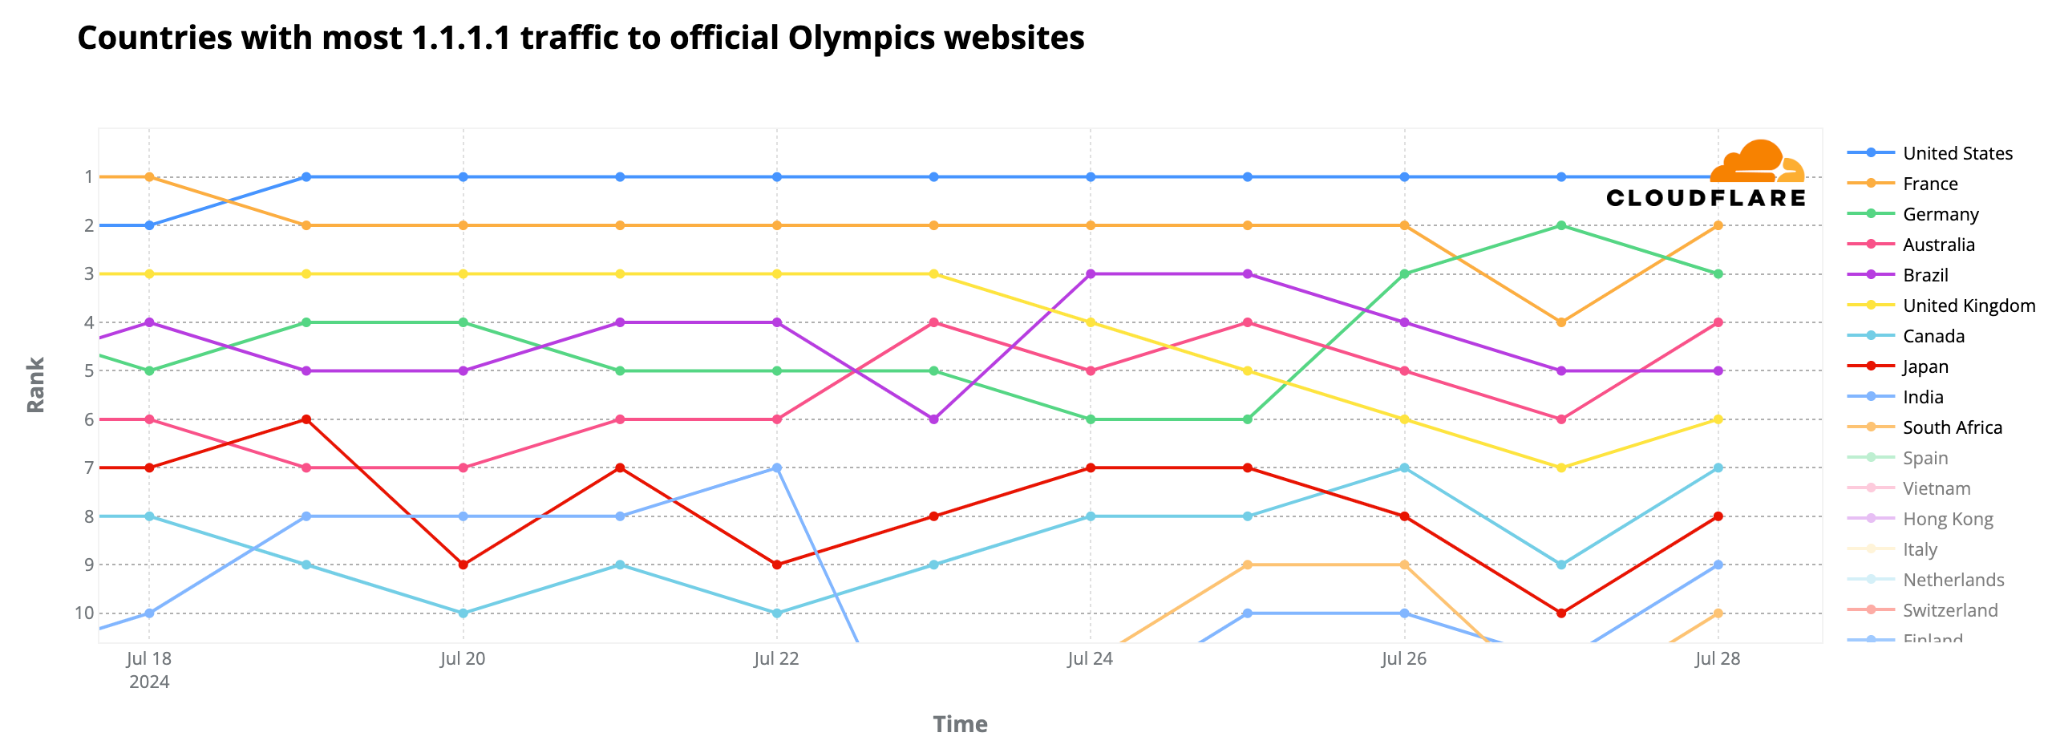
The evolving DNS ranking of Olympic site traffic by country reveals that from July 19, the US overtook France. Also, Germany ascended to the #2 spot on July 27, the first full day of competitions, while Australia climbed to #4 on July 28, and Canada’s peak day was also July 28.
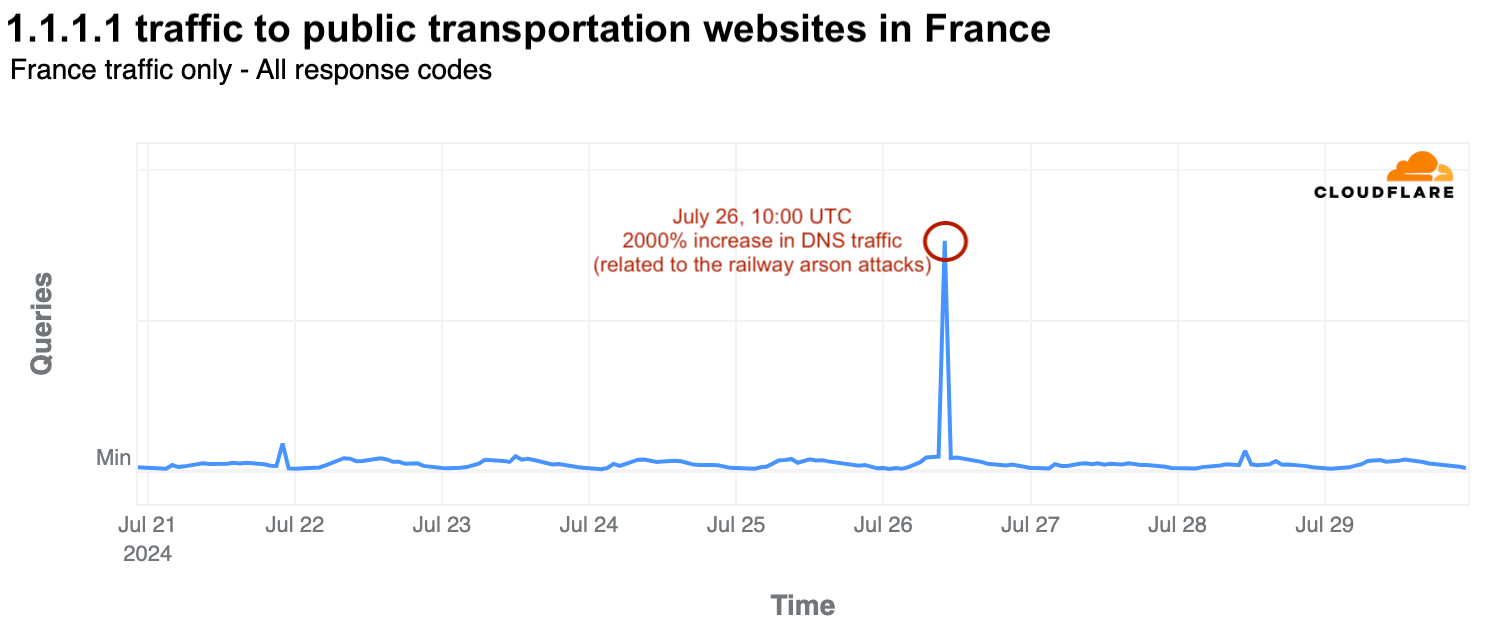
The opening ceremony day, July 26, was also disrupted by railway arson attacks in France, affecting the 800,000 passengers on the high-speed railway system. At 10:00 UTC, there was a significant surge in DNS traffic to public transportation websites, including high-speed railway services. Traffic spiked by 2000% compared to the previous week as users accessed websites to check updates.
As we’ve observed with elections in 2024, including the French elections, political parties are not the only targets of DDoS (Distributed Denial of Service) attacks during significant events. While we haven’t seen any coordinated flow of major DDoS attacks targeting services potentially used during the Olympics in France, we have observed a few incidents.
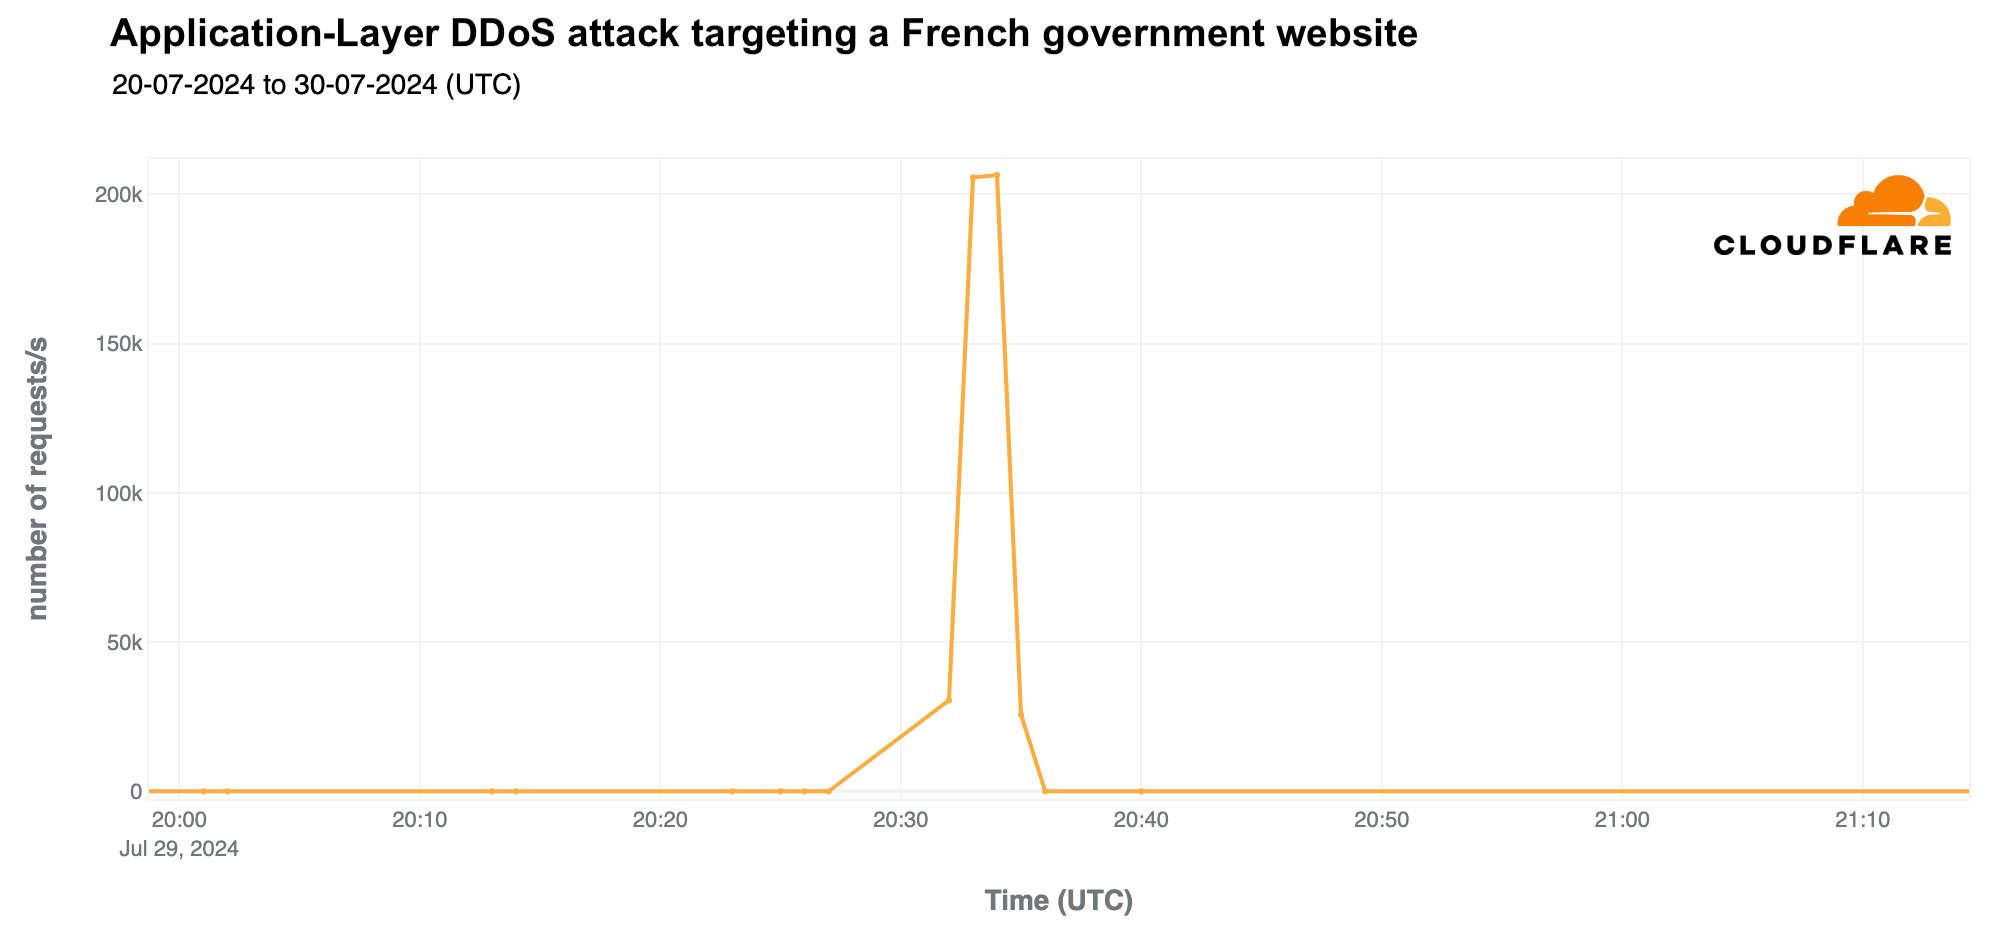
A generally used French government website was targeted by a DDoS attack on July 29, 2024, lasting nine minutes and peaked at 207,000 requests per second at 20:34 UTC.
Before the Olympics began, a national transportation website was also targeted by a smaller DDoS attack, lasting only a couple of minutes and peaking at 10,000 requests per second on July 21 at 10:20 UTC.
As highlighted in our Q2 DDoS report, most DDoS attacks are short-lived, as exemplified by the two mentioned attacks. Also, 81% of HTTP DDoS attacks peak at under 50,000 requests per second (rps), and only 7% reach between 100,000 and 250,000 rps. While a 10,000 rps attack might seem minor to Cloudflare, it can be devastating for websites not equipped to handle such high levels of traffic.
From another cybersecurity perspective, major events often attract phishing and spam, and the Olympics are no exception. From January 2024 through late July, Cloudflare’s Cloud Email Security service processed over a million emails containing “Olympics” or “Paris 2024” in the subject. During the week of July 22-28, coinciding with the first few days of the Olympics, there was a 304% increase in such emails compared to the previous week and a staggering 3111% increase compared to the busiest week in January.
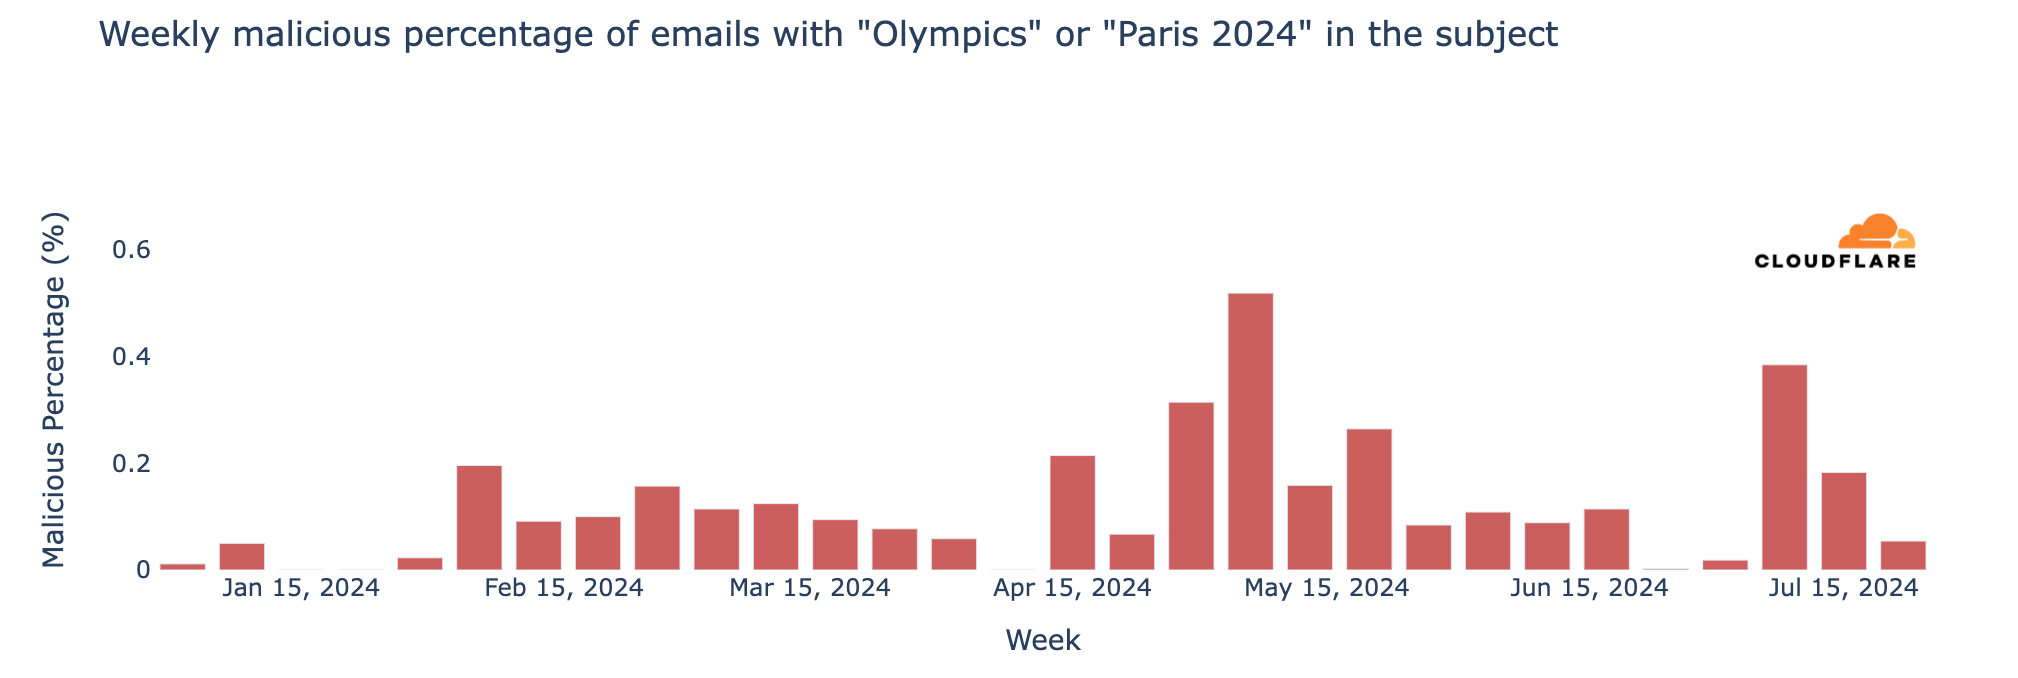
Regarding unwanted messages, spam accounted for 1.5% of all emails with “Olympics” or “Paris 2024” in the subject, while malicious emails made up 0.1% since January 2024. This means that in a sample of 1000 emails, roughly 15 would be spam and 1 would be malicious. The peak for malicious Olympic-related emails occurred the week of May 6, with 0.6% classified as malicious. Although there was a decline after this peak, rates increased slightly in July, reaching 0.4% on July 8. Despite the surge in volume during the week of July 22, only 0.05% of emails were malicious.
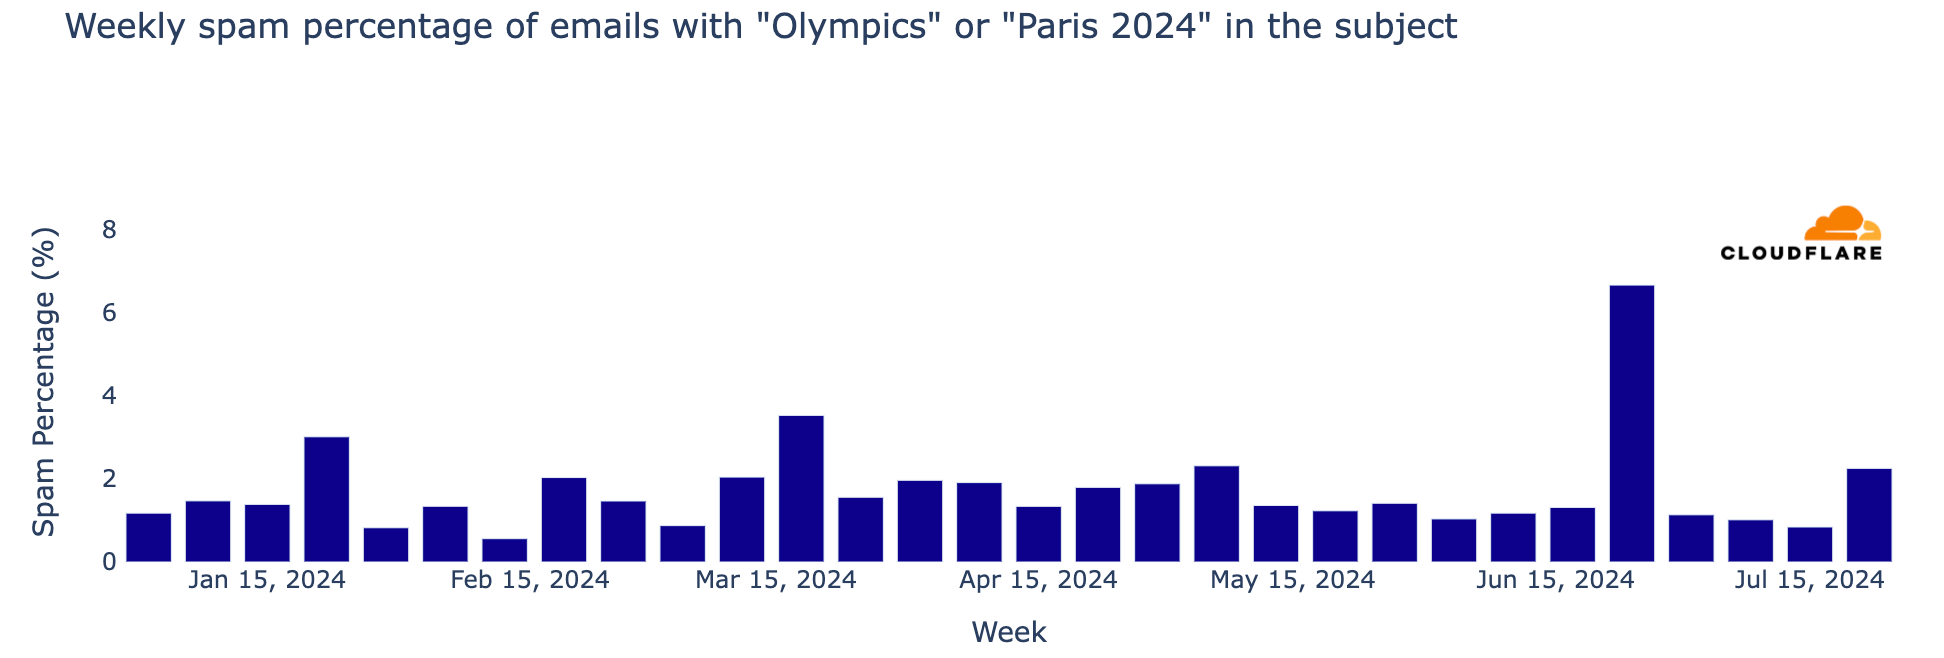
That same week, when the Olympics started, also saw an increase in spam emails to over 2%, the highest since the 7% peak the week of June 24.
The Paris 2024 Olympics started on July 26, with a clear impact on Internet traffic in different countries, most notably in France, the host nation. The significant traffic drops during key moments of the opening ceremony, and the reactive spikes following major events highlight the ever-present interplay between physical events and the way humans interact with the online world. Not many events take the focus away from the Internet, and in this case, into TV broadcast.
We’ve also observed how the interest in official Olympic websites surged, with clear increases in DNS traffic after the event started, in different countries, with the US ultimately taking the gold.
Regarding the July 29, 2024 sabotage of French fiber optic cables, we did not observe any notable disruptions of Internet traffic in France or its cities during the day.
As the games continue, we will maintain a Paris 2024 Olympics report on Cloudflare Radar, updating it as significant Internet trends related to the event emerge.
Post Syndicated from João Tomé original https://blog.cloudflare.com/paris-2024-summer-olympics-impacted-internet-traffic

The Paris 2024 Summer Olympics, themed “Games Wide Open” (“Ouvrons grand les Jeux”), kicked off on Friday, July 26, 2024, and will run until August 11. A total of 10,714 athletes from 204 nations, including individual and refugee teams, will compete in 329 events across 32 sports. This blog post focuses on the opening ceremony and the initial days of the event, examining associated impact on Internet traffic, especially in France, the popularity of Olympic websites by country, and the rise in Olympics-related spam and malicious emails.
Cloudflare has a global presence with data centers in over 320 cities, supporting millions of customers, which provides a global view of what’s happening on the Internet. This is helpful for improving security, privacy, efficiency, and speed, but also for observing Internet disruptions and traffic trends.
We are closely monitoring the event through our 2024 Olympics report on Cloudflare Radar and will provide updates on significant Internet trends as they develop.
For the first time in modern Olympic history, the opening ceremony was held outside a stadium, lasting nearly four hours and clearly impacting Internet traffic in France. The nation’s engagement was evident during the TV broadcast, leading to noticeable traffic drops similar to those observed during Euro 2024 – we’ve seen that national TV broadcast events usually come with drops in Internet traffic.
The Olympics are more than just sporting events – they are filled with inspiring moments and stories that capture global attention in real time, and create stories that live on. Significant traffic dips during the ceremony coincided with performances by Celine Dion and Lady Gaga, the lighting of the Olympic cauldron, and John Lennon’s “Imagine” performed by Juliette Armanet. Here is a breakdown of the top five traffic drops compared to the previous week that occurred during the ceremony, detailing the events occurring at those times. Our data provides insights with 15-minute granularity.
Moments of the ceremony by traffic drop
|
Time of drop (UTC) |
Drop % |
Events at the time |
|
|
#1 |
~21:15 |
-20% |
The Olympic cauldron is lit and floats into the Paris sky via air balloon; Celine Dion serenades Paris from the Eiffel Tower. |
|
#2 |
~17:45 |
-17% |
Lady Gaga sings the French classic “Mon truc en plumes” by Zizi Jeanmaire. |
|
#3 |
~19:45 |
-16.9% |
Team USA boat takes to the river, followed by Team France – the last boat en route to the Eiffel Tower. |
|
#4 |
~20:15 |
-16.9% |
Dionysus performs the song “Naked” (Philippe Katerine); John Lennon’s “Imagine” is sung from the middle of the Seine by Juliette Armanet; a metal horse rides down the river. |
|
#5 |
~18:00 |
-16.7% |
As the boats continue along the Seine, around 80 artists from the Moulin Rouge perform the famous French cabaret dance, the can-can. |
During the opening ceremony on July 26, between 17:30 to 21:20 UTC, traffic in France was noticeably lower than the previous week, with losses between 15% and 20%. However, there were moments with smaller drops. For example, at 19:30 UTC, traffic only fell by 4% during the middle of the boat parade of athletes on the Seine River. Right after the event, at 21:45 UTC, traffic increased by as much as 8% compared to the previous week.
The opening ceremony also resulted in a higher mobile share of traffic than usual in France. At 20:45 UTC, close to the end of the ceremony, the mobile share of Internet traffic was 61%, up from 57% the previous week.
With the Olympics in Paris, many locals left the city, either for vacations or quieter places, while tourists arrived for the games. Our data shows that two French regions, Île-de-France, where Paris is located, and Grand Est, east of Paris, experienced the most significant traffic drops. The chart below illustrates daily traffic to these regions, with a noticeable decline visible during the weekend before the Olympics in Île-de-France.
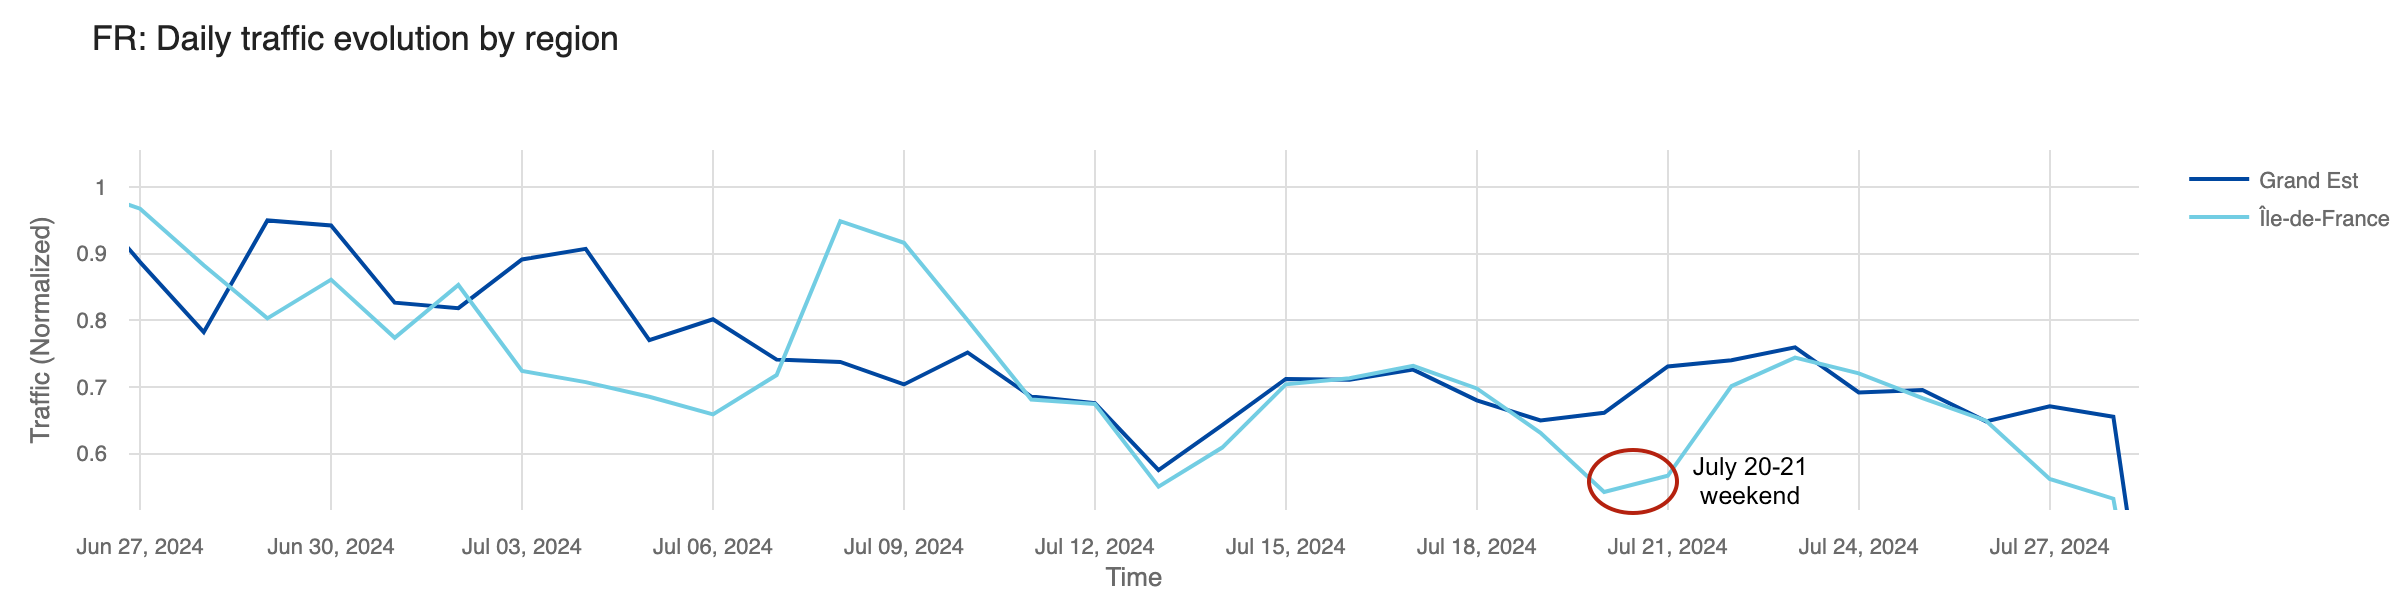
Analyzing the percentage change in request traffic from the previous week, Île-de-France saw its largest drops in the first week of July (July 1-7), with a 15% decrease, and the week before the Olympics started, with an 8% decrease. Interestingly, there was no percentage change in traffic during the week of the Olympics (July 22-28) – that was also the week when most visitors for the Olympics started to arrive.
The daily share of mobile device traffic from France also reveals shifts in typical patterns, with increases noted especially after the June 30 weekend, indicative of vacation periods and leisure Internet use. Mobile device traffic peaked during the first Olympic weekend, reaching 53% on July 26, the day of the opening ceremony – higher than any previous Friday since June. On Sunday, July 28, mobile device traffic peaked at 58%, the highest since June.
Globally, Internet traffic variations were less pronounced than in France. However, on July 26, the day of the opening ceremony, a noticeable global drop occurred during the event. This was particularly evident during two key moments previously highlighted: during song performances at 20:15 UTC, traffic dropped 3% compared to the previous week, and around the end of the ceremony, at 21:15 UTC, it dropped 2%.
Expanding our view to other countries, moments of significant drops in traffic during the opening ceremony were clearly visible. Below is a summary list of 30 countries selected based on their tally of Summer Olympic medals.
|
Country |
Drop in traffic (%) |
Time of drop (UTC) |
|
United States |
-4% |
20:15 |
|
Great Britain |
-8% |
20:15 |
|
France |
-20% |
21:15 |
|
Germany |
-4% |
20:15 |
|
China |
-4% |
21:00 |
|
Italy |
-11% |
18:15 |
|
Australia |
-2% |
20:00 |
|
Hungary |
-5% |
21:15 |
|
Sweden |
-4% |
21:15 |
|
Japan |
-12% |
21:15 |
|
Russia |
-7% |
19:45 |
|
Canada |
-3% |
20:15 |
|
Netherlands |
-6% |
21:15 |
|
Romania |
-12% |
20:00 |
|
Finland |
-12% |
17:30 |
|
Poland |
-5% |
21:15 |
|
South Korea |
-4% |
20:15 |
|
Cuba |
-3% |
19:00 |
|
Bulgaria |
-6% |
21:15 |
|
Switzerland |
-10% |
18:15 |
|
Denmark |
-2% |
21:15 |
|
Spain |
-8% |
18:15 |
|
Norway |
-2% |
21:15 |
|
Belgium |
-5% |
21:15 |
|
Brazil |
-3% |
18:15 |
|
Czech Republic |
-10% |
18:00 |
|
Slovakia |
-11% |
20:15 |
|
Ukraine |
-2% |
20:45 |
|
New Zealand |
-9% |
21:15 |
|
Greece |
-11% |
18:00 |
Additionally, the world map below highlights the countries that experienced notable Internet traffic impacts during the opening ceremony.
(Source: Cloudflare; created with Datawrapper)
Outside Europe, the countries with the most substantial drops were New Zealand (-9%), Uzbekistan (-12%), Argentina (-13%), and Mongolia -(20%), all experiencing greater declines than those in Europe.
Below, we highlight specific Olympic events affecting Internet traffic, starting from the first full competition day on Saturday, July 27, 2024.
United States: The artistic gymnastics competition featuring four-time Olympic gold medalist Simone Biles notably impacted US Internet traffic more than the opening ceremony. On July 26-28, traffic dipped most significantly during Biles’ events. At 10:00 UTC, concurrent with her beam routine, traffic was already 4% lower than the previous week. It dropped by 6% at 10:45 UTC during her floor and vault routines.
France: French swimmer Léon Marchand’s gold medal and Olympic record-setting performance in the men’s 400-meter individual medley on July 28 had the most significant impact in the host nation. Traffic fell by 17% at 18:30 UTC during his event. However, as we noted above, the opening ceremony drove a bigger drop in traffic.
Australia: During Mollie O’Callaghan’s victory in the women’s 200m freestyle on July 29, at around 20:00 UTC, Australian traffic was 5% lower than the previous week This was larger than during the opening ceremony, which saw a 2% drop.
South Korea: The Korean women’s archery team’s gold medal win on July 28 at 15:30 UTC led to an 8% drop in traffic, the most significant decrease noted in the country from July 26 to July 29.
Brazil: Traffic in Brazil was15% lower than the previous week on July 27 at around 19:30 UTC, surpassing the opening ceremony’s impact. This occurred as Brazilian swimmers Guilherme Costa and Maria Fernanda Costa competed in the men’s and women’s 400 m freestyle events.
On July 22, before the Olympics started, we reported on the heightened interest in official Olympic websites based on request data from our 1.1.1.1 DNS resolver. We noted France’s dominance with 24% of DNS traffic to official Olympic websites, followed by the UK (20%) and the US (17%). However, the start of the Olympics marked a shift, with the US taking the lead.
On the first full day of competitions, July 27, the US led with 16% of all DNS request traffic to official Olympic sites. This change indicates a broader spread of interest across countries during the Olympics. A dynamic version of the map below is available in our Paris 2024 Olympics report.
Here are the top 10 countries with the highest shares of DNS request traffic for the first full day of competitions, July 27, to Olympic sites (percentages rounded):
Global daily DNS request traffic to official Olympic websites began climbing to the highest levels seen year to date starting on July 23, showing a steady increase. It peaked on July 28, the second full day of events, with a fivefold (509%) increase from the previous week. On the opening ceremony day, traffic was already 110% higher than the previous week.
Country-specific peaks included the US, where traffic to Olympic sites surged 719% on July 28, coinciding with Simone Biles’ first competition day. In France, traffic peaked on the same day with a 391% increase, and in Germany, it skyrocketed by 2300% on July 27.
The evolving DNS ranking of Olympic site traffic by country reveals that from July 19, the US overtook France. Also, Germany ascended to the #2 spot on July 27, the first full day of competitions, while Australia climbed to #4 on July 28, and Canada’s peak day was also July 28.
The opening ceremony day, July 26, was also disrupted by railway arson attacks in France, affecting the 800,000 passengers on the high-speed railway system. At 10:00 UTC, there was a significant surge in DNS traffic to public transportation websites, including high-speed railway services. Traffic spiked by 2000% compared to the previous week as users accessed websites to check updates.
As we’ve observed with elections in 2024, including the French elections, political parties are not the only targets of DDoS (Distributed Denial of Service) attacks during significant events. While we haven’t seen any coordinated flow of major DDoS attacks targeting services potentially used during the Olympics in France, we have observed a few incidents.
A generally used French government website was targeted by a DDoS attack on July 29, 2024, lasting nine minutes and peaked at 207,000 requests per second at 20:34 UTC.
Before the Olympics began, a national transportation website was also targeted by a smaller DDoS attack, lasting only a couple of minutes and peaking at 10,000 requests per second on July 21 at 10:20 UTC.
As highlighted in our Q2 DDoS report, most DDoS attacks are short-lived, as exemplified by the two mentioned attacks. Also, 81% of HTTP DDoS attacks peak at under 50,000 requests per second (rps), and only 7% reach between 100,000 and 250,000 rps. While a 10,000 rps attack might seem minor to Cloudflare, it can be devastating for websites not equipped to handle such high levels of traffic.
From another cybersecurity perspective, major events often attract phishing and spam, and the Olympics are no exception. From January 2024 through late July, Cloudflare’s Cloud Email Security service processed over a million emails containing “Olympics” or “Paris 2024” in the subject. During the week of July 22-28, coinciding with the first few days of the Olympics, there was a 304% increase in such emails compared to the previous week and a staggering 3111% increase compared to the busiest week in January.
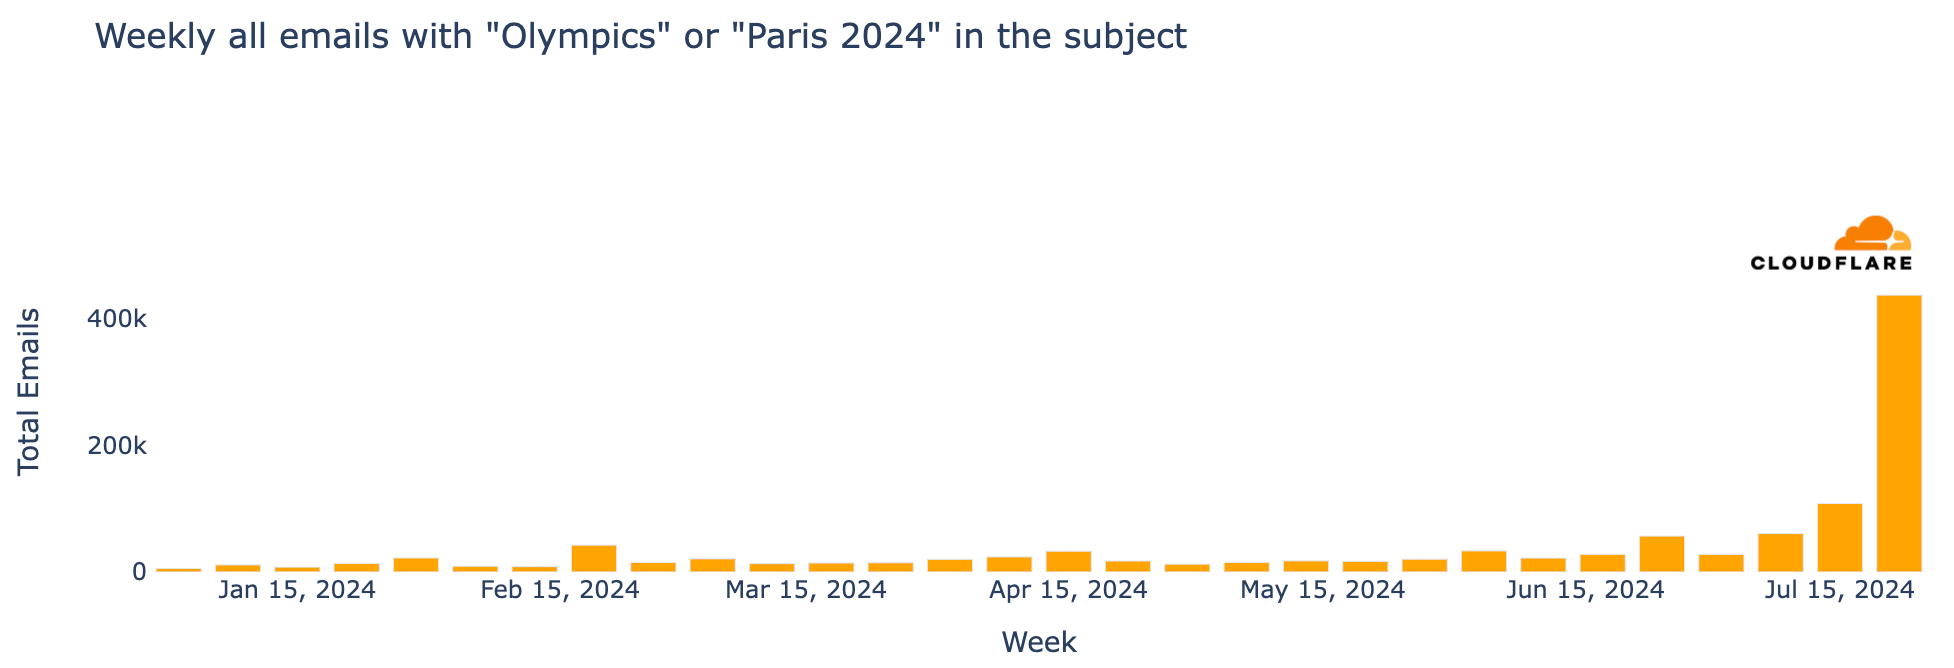
Regarding unwanted messages, spam accounted for 1.5% of all emails with “Olympics” or “Paris 2024” in the subject, while malicious emails made up 0.1% since January 2024. This means that in a sample of 1000 emails, roughly 15 would be spam and 1 would be malicious. The peak for malicious Olympic-related emails occurred the week of May 6, with 0.6% classified as malicious. Although there was a decline after this peak, rates increased slightly in July, reaching 0.4% on July 8. Despite the surge in volume during the week of July 22, only 0.05% of emails were malicious.
That same week, when the Olympics started, also saw an increase in spam emails to over 2%, the highest since the 7% peak the week of June 24.
The Paris 2024 Olympics started on July 26, with a clear impact on Internet traffic in different countries, most notably in France, the host nation. The significant traffic drops during key moments of the opening ceremony, and the reactive spikes following major events highlight the ever-present interplay between physical events and the way humans interact with the online world. Not many events take the focus away from the Internet, and in this case, into TV broadcast.
We’ve also observed how the interest in official Olympic websites surged, with clear increases in DNS traffic after the event started, in different countries, with the US ultimately taking the gold.
Regarding the July 29, 2024 sabotage of French fiber optic cables, we did not observe any notable disruptions of Internet traffic in France or its cities during the day.
As the games continue, we will maintain a Paris 2024 Olympics report on Cloudflare Radar, updating it as significant Internet trends related to the event emerge.
Post Syndicated from Rohit Kumar original https://www.servethehome.com/mikrotik-crs520-4xs-16xq-rm-review-mikrotik-scales-up-100gbe-marvell-annapurna-arm/
We review the MikroTik CRS520-4XS-16XQ-RM, the company’s first 16-port 100GbE switch with a big Arm CPU, a low price, and easy management
The post MikroTik CRS520-4XS-16XQ-RM Review MikroTik Scales Up 100GbE appeared first on ServeTheHome.
Post Syndicated from Satya Chikkala original https://aws.amazon.com/blogs/big-data/integrate-amazon-mwaa-with-microsoft-entra-id-using-saml-authentication/
Amazon Managed Workflows for Apache Airflow (Amazon MWAA) provides a fully managed solution for orchestrating and automating complex workflows in the cloud. Amazon MWAA offers two network access modes for accessing the Apache Airflow web UI in your environments: public and private. Customers often deploy Amazon MWAA in private mode and want to use existing login authentication mechanisms and single sign-on (SSO) features to have seamless integration with the corporate Active Directory (AD). Also, the end-users don’t need to log in to the AWS Management Console to access the Airflow UI.
In this post, we illustrate how to configure an Amazon MWAA environment deployed in private network access mode with customer managed VPC endpoints and authenticate users using SAML federated identity using Microsoft Entra ID and Application Load Balancer (ALB). Users can seamlessly log in to the Airflow UI with their corporate credentials and access the DAGs. This solution can be modified for Amazon MWAA public network access mode as well.
The architectural components involved in authenticating the Amazon MWAA environment using SAML SSO are depicted in the following diagram. The infrastructure components include two public subnets and three private subnets. The public subnets are required for the internet-facing ALB. Two private subnets are used to set up the Amazon MWAA environment, and the third private subnet is used to host the AWS Lambda authorizer function. This subnet will have a NAT gateway attached to it, because the function needs to verify the signer to confirm the JWT header has the expected LoadBalancer ARN.

The workflow consists of the following steps:
The following are the high-level steps to deploy the solution:
Before you get started, make sure you have the following prerequisites:
In this step, we create an S3 bucket to store your Airflow DAGs, custom plugins in a plugins.zip file, and Python dependencies in a requirements.txt file. This bucket is used by the Amazon MWAA environment to fetch DAGs and dependency files.


ACM is integrated with Elastic Load Balancing (ALB). In this step, you can request a public certificate using ACM or import a certificate into ACM. To import organization certificates linked to a custom DNS into ACM, you must provide the certificate and its private key. To import a certificate signed by a non-AWS Certificate Authority (CA), you must also include the private and public keys of the certificate.

After the import is successful, the status of the imported certificate will show as Issued.

For the SSO integration with Azure, an enterprise application is required, which acts as the IdP for the SAML flow. We add relevant users and groups to the application and configure the SP (Amazon Cognito) details.
Airflow comes with five default roles: Public, Admin, Op, User, Viewer. In this post, we focus on three: Admin , User and Viewer. We create three roles and three corresponding users and assign memberships appropriately.


Repeat these steps to add the users to each group.
Navigate to your application and choose Assign users and groups.
Choose Add user/group.

For this solution, we provide two CloudFormation templates that set up the services illustrated in the architecture. Deploying the CloudFormation stacks in your account incurs AWS usage charges.
For Stack name, enter a name (for example, sso-blog-mwaa-infra-stack).
Enter the following parameters:
For MWAAEnvironmentName, enter the environment name.
For MwaaS3Bucket, enter the S3 artifacts bucket you created.
For VpcCIDR, enter the specify IP range (CIDR notation) for this VPC.
For PrivateSubnet1CIDR, enter the IP range (CIDR notation) for the private subnet in the first Availability Zone.
For PrivateSubnet2CIDR, enter the IP range (CIDR notation) for the private subnet in the second Availability Zone.
For PrivateSubnet3CIDR, enter the IP range (CIDR notation) for the private subnet in the third Availability Zone.
For PublicSubnet1CIDR, enter the IP range (CIDR notation) for the public subnet in the first Availability Zone.
For PublicSubnet2CIDR, enter the IP range (CIDR notation) for the public subnet in the second Availability Zone.

After the stack is deployed successfully, you can view the resources on the stack’s Outputs tab on the AWS CloudFormation console. Note the ALB URL, Amazon Cognito user pool ID, and domain.
Next, you configure the SAML configuration in the enterprise application by adding the SP details and redirect URLs (in this case, the Amazon Cognito details and ALB URL).


When the SAML configuration is complete on the Azure end, the IdP details have to be configured in Amazon Cognito. When users access the ALB URL, they will be authenticated against the corporate identity using SAML through Amazon Cognito. After they’re authenticated, they’re redirected to the Lambda function for authorization against the group they belong to. The user’s group is then validated against matching IAM role. If it’s valid, the Lambda function adds the web login token to the URL, and the user will gain access to the Amazon MWAA environment.
This CloudFormation stack creates the following resources:
Deploy the stack by completing the following steps:
For Stack name, enter a name (for example, sso-blog-mwaa-alb-stack).
Enter the following parameters:
For MWAAEnvironmentName, enter your environment name.
For ALBCertificateArn, enter the certificate ARN required for ALB.
For AzureAdminGroupID, enter the group name for the Azure Admin persona.
For AzureUserGroupID, enter the group name for the Azure User persona.
For AzureViewerGroupID, enter the group name for the Azure Viewer persona.
For EntraIDLoginURL, enter the Azure IdP URI.
For AppFederationMetadataURL, enter the URL of the metadata file for the SAML provider.

Now that the SAML configuration and relevant AWS services are created, it’s time to access the Amazon MWAA environment.


When you’re done experimenting with this solution, it’s essential to clean up your resources to avoid incurring AWS charges.
In this post, we demonstrated how to integrate Amazon MWAA with organization Azure AD services. We walked through the solution that solves this problem using infrastructure as code. This solution allows different end-user personas in your organization to access the Amazon MWAA Airflow UI using SAML SSO.
For additional details and code examples for Amazon MWAA, visit the Amazon MWAA User Guide and the Amazon MWAA examples GitHub repo.
 Satya Chikkala is a Solutions Architect at Amazon Web Services. Based in Melbourne, Australia, he works closely with enterprise customers to accelerate their cloud journey. Beyond work, he is very passionate about nature and photography.
 Vijay Velpula is a Data Lake Architect with AWS Professional Services. He assists customers in building modern data platforms by implementing big data and analytics solutions. Outside of his professional responsibilities, Velpula enjoys spending quality time with his family, as well as indulging in travel, hiking, and biking activities.
Post Syndicated from jzb original https://lwn.net/Articles/983977/
Daniel Robbins, founder of the Gentoo Linux distribution and its
spinoff Funtoo Linux, has
announced
that he has decided to end the Funtoo project:
Funtoo started as a philosophy to create a fun
community of contributors building something great together. For me,
it’s no longer that so I need to move on to other things. There is not
a successor BDFL for Funtoo nor am I interested in trying to find one,
or hand the project off to someone else. You can expect the project to
wind down through August. If you have a Funtoo
container, it will continue to be online through the end of August
so you have time to find another hosting solution if you need one.
Post Syndicated from Patrick Kennedy original https://www.servethehome.com/everyone-reading-sth-get-excited-marvell-structera-cxl-memory-with-arm-neoverse-v2/
Marvell Structera CXL Memory Expansion modules accept DDR4 or DDR5. The line also has a 16-core Arm Neoverse V2 accelerated memory expander
The post Get Excited Marvell Structera CXL Memory with Arm Neoverse V2 appeared first on ServeTheHome.
Post Syndicated from Carlos Gallegos original https://aws.amazon.com/blogs/big-data/federating-access-to-amazon-datazone-with-aws-iam-identity-center-and-okta/
Many customers rely today on Okta or other identity providers (IdPs) to federate access to their technology stack and tools. With federation, security teams can centralize user management in a single place, which helps simplify and brings agility to their day-to-day operations while keeping highest security standards.
To help develop a data-driven culture, everyone inside an organization can use Amazon DataZone. To realize the benefits of using Amazon DataZone for governing data and making it discoverable and available across different teams for collaboration, customers integrate it with their current technology stack. Handling access through their identity provider and preserving a familiar single sign-on (SSO) experience enables customers to extend the use of Amazon DataZone to users across teams in the organization without any friction while keeping centralized control.
Amazon DataZone is a fully managed data management service that makes it faster and simpler for customers to catalog, discover, share, and govern data stored across Amazon Web Services (AWS), on premises, and third-party sources. It also makes it simpler for data producers, analysts, and business users to access data throughout an organization so that they can discover, use, and collaborate to derive data-driven insights.
You can use AWS IAM Identity Center to securely create and manage identities for your organization’s workforce, or sync and use identities that are already set up and available in Okta or other identity provider, to keep centralized control of them. With IAM Identity Center you can also manage the SSO experience of your organization centrally, across your AWS accounts and applications.
This post guides you through the process of setting up Okta as an identity provider for signing in users to Amazon DataZone. The process uses IAM Identity Center and its native integration with Amazon DataZone to integrate with external identity providers. Note that, even though this post focuses on Okta, the presented pattern relies on the SAML 2.0 standard and so can be replicated with other identity providers.
To build the solution presented in this post, you must have:
Throughout this post you’ll follow these high-level steps:
This guide follows the steps in Configure SAML and SCIM with Okta and IAM Identity Center.
Before you get started, review the following items in your Okta setup:

Now, let’s establish a SAML connection between Okta and AWS IAM Identity Center. First, you’ll create an application in Okta to establish the connection:
AWS IAM Identity Center, then select the app to add the IAM Identity Center app.

<md:EntityDescriptor> to </md:EntityDescriptor> and copy it to a text file.metadata.xml.
Leave the Okta admin dashboard open, you will continue using it in the later steps.
Second, you’re going to set up Okta as an external identity provider in IAM Identity Center:


accept.
Leave the AWS console open, because you will use it in the next procedure.

You are now able to set up automatic provisioning of users from Okta into IAM Identity Center. Leave the Okta admin dashboard open and return to the IAM Identity Center console for the next step.

You will use these values to configure provisioning in Okta later.


By default, no groups nor users are assigned to your Okta IAM Identity Center app. Complete the following steps to synchronize users with IAM Identity Center.


AWS SSO Rule as rule name and starts with awssso as a group name condition. This condition can be different depending on the name of the group you want to sync.


Congratulations! You have successfully set up a SAML connection between Okta and AWS and have verified that automatic provisioning is working.
OPTIONAL: If you need to provide Amazon DataZone console access to the Okta users and groups, you can manage these permissions through the IAM Identity Center console.


Now, you can test your user access into the console and Amazon DataZone portal using the Okta external identity application.


Amazon DataZone service and open it.Note: In this post, we followed the default IAM Identity Center for Amazon DataZone configuration, which has implicit user assignment mode enabled. With this option, any user added to your Identity Center directory can access your Amazon DataZone domain automatically. If you opt for using explicit user assignment instead, remember that you need to manually add users to your Amazon DataZone domain in the Amazon DataZone console for them to have access.
To learn more about how to manage user access to an Amazon DataZone domain, see Manage users in the Amazon DataZone console.


Congratulations! Now you’re signed in to the Amazon DataZone data portal using your user that’s managed by Okta.

After you have access to the Amazon DataZone portal, you can work with projects, the data assets within, environments, and other constructs that are specific to Amazon DataZone. A project is the overarching construct that brings together people, data, and analytics tools. A project has two roles: owner and contributor. Next, you’ll learn how a user can be made an owner or contributor of existing projects.
These steps must be completed by the existing project owner in the Amazon DataZone portal:


You can also manage SSO user and group access to the Amazon DataZone data portal from the console. See Manage users in the Amazon DataZone console for additional details.
To ensure a seamless experience and avoid any future charges, we kindly request that you follow these steps:
By following these steps, you can effectively clean up the resources utilized in this blog post and prevent any unnecessary charges from accruing.
In this post, you followed a step-by-step guide to set up and use Okta to federate access to Amazon DataZone with AWS IAM Identity Center. You also learned how to group users and manage their permission in Amazon DataZone. As a final thought, now that you’re familiar with the elements involved in the integration of an external identity provider such as Okta to federate access to Amazon DataZone, you’re ready to try it with other identity providers.
To learn more about, see Managing Amazon DataZone domains and user access.
 Carlos Gallegos is a Senior Analytics Specialist Solutions Architect at AWS. Based in Austin, TX, US. He’s an experienced and motivated professional with a proven track record of delivering results worldwide. He specializes in architecture, design, migrations, and modernization strategies for complex data and analytics solutions, both on-premises and on the AWS Cloud. Carlos helps customers accelerate their data journey by providing expertise in these areas. Connect with him on LinkedIn.
 Jose Romero is a Senior Solutions Architect for Startups at AWS. Based in Austin, TX, US. He’s passionate about helping customers architect modern platforms at scale for data, AI, and ML. As a former senior architect in AWS Professional Services, he enjoys building and sharing solutions for common complex problems so that customers can accelerate their cloud journey and adopt best practices. Connect with him on LinkedIn.
 Arun Pradeep Selvaraj is a Senior Solutions Architect at AWS. Arun is passionate about working with his customers and stakeholders on digital transformations and innovation in the cloud while continuing to learn, build, and reinvent. He is creative, fast-paced, deeply customer-obsessed and uses the working backwards process to build modern architectures to help customers solve their unique challenges. Connect with him on LinkedIn.
Post Syndicated from Kevin Low original https://aws.amazon.com/blogs/security/how-to-deploy-an-amazon-opensearch-cluster-to-ingest-logs-from-amazon-security-lake/
January 30, 2025: This post was republished to make the instructions clearer and compatible with OCSF 1.1.
Customers often require multiple log sources across their AWS environment to empower their teams to respond and investigate security events. In part one of this two-part blog post, I show you how you can use Amazon OpenSearch Service to ingest logs collected by Amazon Security Lake to facilitate near real-time monitoring.
Many customers use Security Lake to automatically centralize security data from Amazon Web Services (AWS) environments, software as a service (SaaS) providers, on-premises workloads, and cloud sources into a purpose-built data lake in their AWS environment. OpenSearch Service is a managed service that customers can use to deploy, operate, and scale OpenSearch clusters in the AWS Cloud. It natively integrates with Security Lake to enable customers to perform interactive log analytics and searches across large datasets, create enterprise visualization and dashboards, and perform analysis across disparate applications and logs. With Amazon OpenSearch Security Analytics, customers can also gain visibility into the security posture of their organization’s infrastructure, monitor for anomalous activity, detect potential security threats in near real time, and initiate alerts to pre-configured destinations.
Without using Amazon OpenSearch Service, customers would need to build, deploy and manage infrastructure for an analytics solution, such as an ELK stack.
Security Lake should already be deployed. For details on how to deploy Security Lake, see Getting started with Amazon Security Lake. You will need AWS Identity and Access Management (IAM) permissions to manage Security Lake, OpenSearch Service, Amazon Cognito, AWS Secrets Manager, and Amazon Elastic Compute Cloud (Amazon EC2), and to create IAM roles to follow along with this post. The solution can be deployed in any AWS Region that has at least 3 Availability Zones, supports Security Lake, OpenSearch, and OpenSearch Ingestion.
The architecture diagram in Figure 1 shows the completed architecture of the solution.
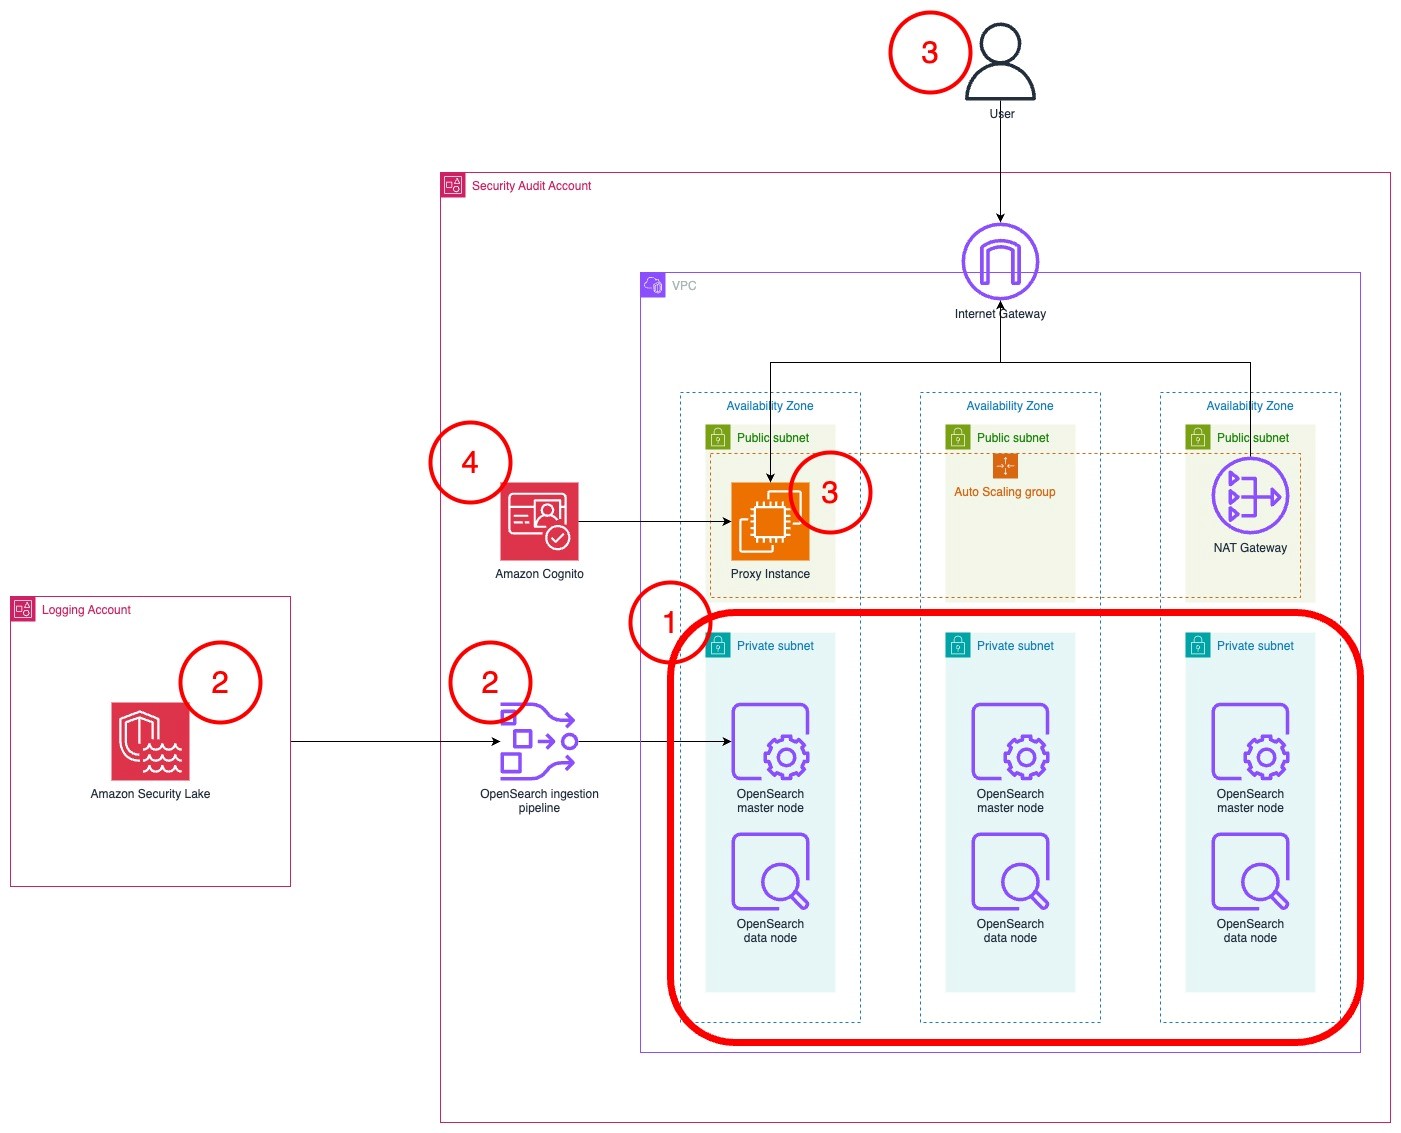
Figure 1: Solution architecture
This section will help you plan your OpenSearch service deployment, including what nodes you should choose, the amount of storage to allocate, and where to deploy the cluster.
First, determine what instance type to use for the master and data nodes. If your workload generates less than 100 GB of Security Lake logs per day, we recommend using three m6g.large.search master nodes and three r6g.large.search data nodes. You can start small and scale up or scale out later. For more information about deciding the size and number of instances, see Get started with Amazon OpenSearch Service. Note the instance types that you have selected on a text editor because you will use this as an input for the AWS CloudFormation template that you will deploy later.
To optimize your storage costs, you need to plan your data strategy. In this architecture, Security Lake is used for long-term log storage. Because Security Lake uses Amazon Simple Storage Service (Amazon S3), you can optimize long-term storage costs. You can configure OpenSearch Service to ingest priority logs based on the recent data that you can use for near-real time detection and alerting. Your team can query logs in Security Lake using its Zero-ETL integration with OpenSearch Service to analyze older logs.
Therefore, Security Lake should serve as your primary long-term log storage, with OpenSearch Service storing only the most recent logs.
The number of days of logs in OpenSearch Service will depend on how many days’ worth of data you need to investigate at a given time. I recommend storing 15 days of data in OpenSearch Service. This allows you to react to and investigate the most immediate security events while optimizing storage costs for older logs.
The next step is to determine the volume of logs generated by Security Lake.
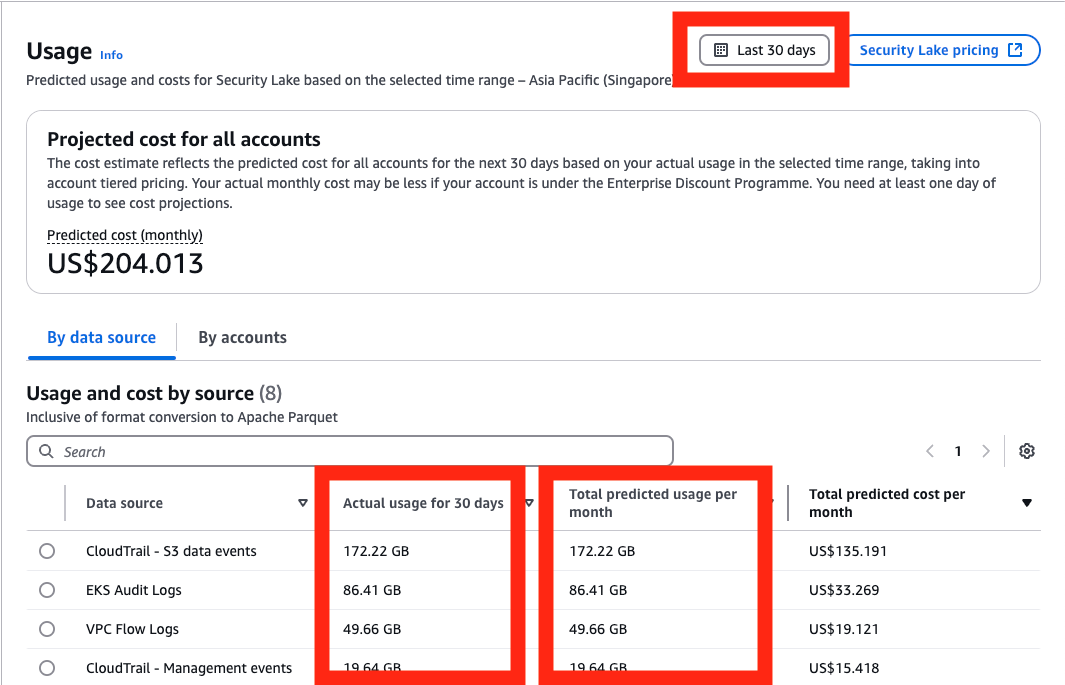
Figure 2: Select range of usage
To determine the total storage needed, multiply the data generated by Security Lake per day by the retention period you chose, then by 1.1 to account for the indexes, then multiply that number by 1.15 for overhead storage. For more information about calculating storage, see Get started with Amazon OpenSearch Service.
To determine the amount of Amazon Elastic Block Store (Amazon EBS) storage that you need per node, take the total amount of storage and divide it by the number of nodes that you have. Round that number up to the nearest whole number. You can increase the amount of storage after deployment when you have a better understanding of your workload. Make a note of this number in a text editor because you’ll use it as an input in the CloudFormation template later.
Example 1: 10 GB of Security Lake logs generated per day, stored for 30 days in OpenSearch Service in three nodes
Example 2: 200 GB of Security Lake logs generated per day, stored for 15 days in OpenSearch Service across six nodes
If you have an AWS Control Tower deployment or have a deployment modelled after the AWS Security Reference Architecture (AWS SRA), Security Lake should be deployed in the Log Archive account. Because security best practices recommend that the Log Archive account should not be frequently accessed, the OpenSearch Service cluster should be deployed into your Audit account or Security Tooling account.
You need to deploy your Security Lake subscriber in the same Region as your Security Lake roll-up Region. If you have more than one roll-up Region, choose the Region that collects logs from the Regions you want to monitor.
Your cluster needs to be deployed in the same Region as your Security Lake subscriber be able to access data.
Before deploying the solution, create a Security Lake subscriber in your Security Lake roll-up Region so that OpenSearch Service can access data from Amazon Security Lake.
OpenSearch-subscriber.OpenSearchIngestion-<AWS account ID> under External ID.

Figure 3: Configuring the Security Lake subscriber
After the subscriber has been created, you will need to collect information to facilitate the deployment.
To gather necessary information:
arn:aws:s3:::<bucket name>. The bucket name should look like aws-security-data-lake-<region>-xxxxx.

Figure 4: Derive the S3 bucket name from the Subscriber details page
AmazonSecurityLake-xxxxxxxxx-Main-Queue. Note the queue’s ARN and URL in your text editor.

Figure 5: Relevant details from the SQS queue
To deploy the solution in your Security Tooling account, use a CloudFormation template. This template deploys the OpenSearch Service cluster, OpenSearch Ingestion pipeline, and an AWS Lambda function to initialize the cluster.
To deploy the OpenSearch cluster:
![]()
os-stack-<day>-<month> can help you keep track of deployments.0.0.0/0 if you want to expose it to the public internet.

Figure 6: Add stack parameters
CREATE_COMPLETE status before proceeding to the next step.Note: If you encounter failures while deployment, you can download the CloudFormation file here and select Preserve successfully provisioned resources under Stack failure options while deploying. This will allow you to troubleshoot the stack deployment.

Figure 7: The stacks in the CREATE_COMPLETE state with the outputs panel shown
Note: Because the proxy relies on a self-signed certificate, you will get an insecure certificate warning. You can safely ignore this warning and proceed. For a production workload, you should issue a trusted private certificate from your internal public key infrastructure or use AWS Private Certificate Authority.
administrator as the username.

Figure 8: The Cognito password in Secrets Manager

Figure 9: Retrieve the secret value

Figure 10: Select and confirm your tenant
To initialize the OpenSearch cluster:

Figure 11: Navigating to the Security page in the OpenSearch console
all_access role and select it.

Figure 12: Mapping the role on the Security page in the OpenSearch console

Figure 13: Creating the test event in the Lambda console

Figure 14: Invoking the Lambda function in the Lambda console
To set up the pipeline

Figure 15: Mapping the OpenSearch Ingestion role
aws-security-data-lake-region-xxxxxxxxxx.Principal with the ARN of the PipelineRole and the name of your Security Lake bucket in the Resource section.

Figure 16: The modified S3 bucket access policy
To upload the index patterns and dashboards
Security-lake-objects.ndjson file by right-clicking on this link and selecting Save link as.

Figure 17: Import saved objects
Security-lake-objects.ndjson file that you downloaded previously.

Figure 18: The Discover page displaying ingested logs
To avoid unwanted charges, delete the main CloudFormation template, named os-stack-<day>-<month> (not the nested stacks).
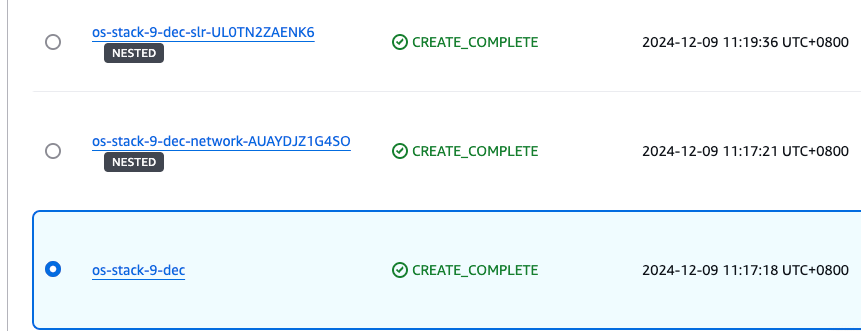
Figure 19: Select the main stack in the CloudFormation console
Modify the Security Lake bucket policy in the logging account to remove the section you added that trusted the PipelineRole. Be careful not to modify the rest of the policy because it could impact the functioning of Security Lake and other subscribers.
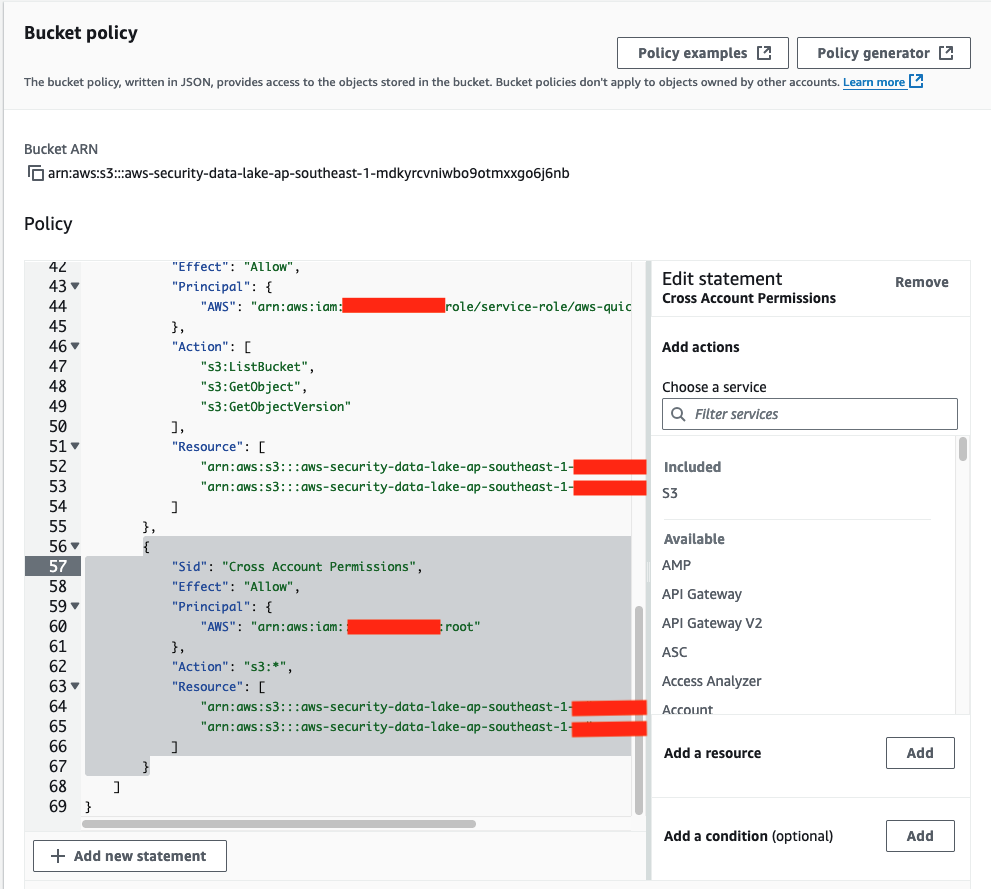
Figure 20: The S3 bucket policy with the relevant sections that needed to be deleted
In this post, you learned how to plan an OpenSearch deployment with Amazon OpenSearch Service to ingest logs from Amazon Security Lake. With this solution, you’re able to aggregate and manage logs with Security Lake and visualize and monitor those logs with OpenSearch Service. After deployment, monitor the OpenSearch Service metrics to determine if you need to scale this up or out for improved performance. In part 2, I will show you how to set up the Security Analytics detector to generate alerts to security findings in near-real time.
If you have feedback about this post, submit comments in the Comments section below. If you have questions about this post, contact AWS Support.
Post Syndicated from Talks at Google original https://www.youtube.com/watch?v=gF4vKaOqVj4
Post Syndicated from Stephanie Doyle original https://www.backblaze.com/blog/how-to-future-proof-your-archives-file-formats-that-stand-the-test-of-time/

You may have heard us talk about backup a time or two, and hopefully our love has been clear. So, when Wired gave us a shoutout in their recent, astute article about archiving, allow us to say we were flattered.
As both a tribute and a collaboration, we’re happy to build on their article’s premise about choosing the correct file type for archiving purposes, and we’ll highlight a few tools to help you protect your files in the long term.
Archives are distinct from backups and have their own demands. Backups are intended to give you the ability to restore files or your whole environment—they need to be both in step with your current environment and flexible enough to respond to both a point in time restore of your whole system or a single file, depending on what you need. Archiving, on the other hand, is about preservation when you can’t depend on the continuity of devices or digital tools—those tools might look quite different (or not exist at all!) down the line. That said, backups are also an essential building block of digital archives.
Making something last long-term takes more work than you’d think. And, interestingly, digital archiving suffers from the opposite problem of “traditional” archiving. Whereas with books, magazines, and other paper-based media, you want to touch them as little as possible, with digital archives, you actually need to do some active maintenance to make sure you’re converting files to accessible formats that you can open well into the future.
Here’s an expert from the Wired report telling us about just one part of the practical concerns of digital archiving:
“Twenty years, in the digital realm, is ancient,” says Lance Stuchell, director of digital preservation services at the University of Michigan. His team is frequently tasked with recovering digital files from old computers and storage mediums. “We have a lab that can deal with old media—floppy drives, CDs, older computers. We can get that off of those types of media and move it into our preservation system while ensuring we don’t mess it up while we’re doing it.”
Wired goes on to report that the problem isn’t just having the correct device, but actually having the correct file type. Their biggest takeaways for making sure your files hold up over time?
Check out the rest of the article for details—it’s worth a read. And, thanks for the shoutout as a good option for folks looking to back up, Wired.
So, now that you’re all geared up to get your archive in order, here are some free, open source tools that will help you convert your files. One note when you’re using open source (and we’re big fans) is to make sure you’re using a tool you trust. And, some tools, especially web-based tools, may collect user data or can expose sensitive information.
With that in mind, here are a few to get you started:
Keep in mind that while we’re recommending many of these for conversion purposes, many are actually fully-fledged programs with some very cool features—and, some can even replace traditional paid tool options, if you’re the budget-conscious type.
Standard tech right now for storing archived files is on hard disk drives (HDDs) or solid state drives (SSDs), and you’ll even find DVDs that can keep your data stored for 1,000 years or more. All storage media types are known to degrade over time—when you’re storing long-term, you can’t just leave your drive disconnected from power forever, for instance.
That said, developing storage media types, while not as common, offer some interesting (if not yet widely practical) options. If you’re willing to drop some cash, DNA (yes, the biological kind) or ceramic might be for you. And, if you want to get super sci-fi with it, PhysicsWorld has reported on the “Superman memory crystal” that could keep data intact for millions of years.
When we ambitiously sent out messages to the (potential) sentient life in the universe almost 50 years ago, on golden records no less, we apparently thought it was enough to also include a phonograph needle and some symbolic instructions on how to play the record. In practice, we sent a message with no guarantees that someone could decode and play it.
That may be fine for our space-age time capsule, but for our everyday archives, we do want to do our best to make sure we’re able to open them in the future. While we can’t anticipate where technology will be in 20, 40, or 100 years, we can follow digital archiving best practices to give future generations the best chance of opening files. At least they’ll likely share a language with us, as opposed to our alien friends.
The post How to Future-Proof Your Archives: File Formats That Stand the Test of Time appeared first on Backblaze Blog | Cloud Storage & Cloud Backup
Post Syndicated from BeardedTinker original https://www.youtube.com/watch?v=UN2mtcmSOe4
Post Syndicated from jzb original https://lwn.net/Articles/983203/
At GUADEC
in Denver, Colorado on July 21, the GNOME Foundation held its annual
general meeting (AGM) to provide updates from the foundation’s board and committees.
Topics included work accomplished in the past year, challenges
facing the GNOME Foundation–including fundraising and finding a new
executive director–and some insight into plans for the next year. And
last, but not least, the awarding of the Pants of Thanks.
Post Syndicated from corbet original https://lwn.net/Articles/983935/
Security updates have been issued by Fedora (curl), Mageia (virtualbox), Oracle (squid), Red Hat (kernel), SUSE (apache2, bind, cdi-apiserver-container, cdi-cloner-container, cdi- controller-container, cdi-importer-container, cdi-operator-container, cdi- uploadproxy-container, cdi-uploadserver-container, devscripts, espeak-ng, freerdp, ghostscript, gnome-shell, gtk2, gtk3, java-11-openjdk, java-17-openjdk, kubevirt, libgit2, openssl-3, orc, p7zip, python-dnspython, and shadow), and Ubuntu (kernel, linux, linux-aws, linux-aws-hwe, linux-gcp, linux-gcp-4.15, linux-hwe, linux-kvm, linux-oracle, linux, linux-aws, linux-gcp, linux-gke, linux-ibm, linux-nvidia, linux-oem-6.8, linux-raspi, linux, linux-azure, linux-azure-5.4, linux-bluefield, linux-gcp, linux-gcp-5.4, linux-gkeop, linux-hwe-5.4, linux-ibm, linux-ibm-5.4, linux-iot, linux-kvm, linux-raspi, linux-xilinx-zynqmp, linux-aws, linux-aws-5.4, linux-aws-5.15, linux-ibm, linux-ibm-5.15, linux-raspi, linux-gcp-5.15, and linux-lowlatency).
Post Syndicated from Deral Heiland original https://blog.rapid7.com/2024/07/30/new-research-the-proliferation-of-cellular-in-iot/

Analysis of Cellular Based Internet of Things (IoT) Technology is a new whitepaper co-authored by Rapid7 principal security researcher Deral Heiland and Thermo Fisher Scientific lead product security researcher Carlota Bindner.
In this new research, the authors dive deep into the fairly recent uptick in the use of cellular communications in IoT-based devices like GPS trackers and certain types of medical equipment. Their main goal is to provide context into the pervasive nature of cellular technology embedded within modern devices all over the world.
They go on to demonstrate the importance of breaking open these IoT devices with the goal of penetration testing (pentesting) the strength of the security — or lack thereof — built into the onboard tech. Absent a Wi-Fi connection, they say, it’s critical these devices are able to leverage cellular as a back-up communications method, particularly in the category of potentially life-saving medical devices.
Indeed, 2022 saw shipments of IoT cellular modules grow a substantial 14% year-over-year, signalling the ubiquity of IoT in today’s devices as producers hope the daily-life conveniences the technology enables will continue to propel the significant growth of cellular module shipments.
When an industry is experiencing significant growth, it’s important that pentesting teams have the ability to appropriately test the technology for security vulnerabilities. This research helps the Rapid7 pentesting team and others continually examine the technology, test its boundaries, and learn how to keep it safe.
Let’s take a look at some key IoT security testing scenarios and takeaways from this whitepaper.
Cellular technologies for IoT are often high-priced, despite being extremely common in 2024. CAT-M and NB-IoT have helped to facilitate cellular communications for IoT devices, bringing down costs at scale. Their primary areas of focus are to provide low-power wide area network (LPWAN) signals that bolster radio communications used for IoT devices.
According to the paper, CAT-M and NB-IoT are complementary standards that excel in different use cases, each helping enable IoT direct-cloud communications via cellular services. There are several subsets of these technologies — such as CAT-M1, CAT-NB1/CAT-NB2 — and it’s made clear in the research why it’s critical to comprehend how each of these enable cellular-based IoT communications so that practitioners can better secure the devices and tech.
The whitepaper then gets into the nitty gritty of reviewing how the researchers deconstructed several cellular module devices to test how they function and communicate with each other.
From discovering module-based GPS trackers to examining cellular modules in smart camera systems, this highly technical process weaves between looking at the orientation of cellular modules on circuit boards to how manufacturers can implement their own proprietary commands for use with their own cellular modules.
To reiterate, it’s vital that pentesting professionals understand as much of this cellular technology as possible in order to effectively test devices that leverage these capabilities. In this way, security is put at the forefront of these marvelous little gadgets that aim to make all of our lives just a little easier.
Ready to learn more? Dive into the deep technical details contained in the whitepaper now.
Post Syndicated from Benyamine Elmahir original https://blog.zabbix.com/elevating-code-quality-real-time-insights-with-zabbix-and-sonarqube/28452/
The objective of this project was to establish a robust and integrated environment for the continuous monitoring of code quality and performance metrics. To achieve this, SonarQube, an open-source platform for the continuous inspection of code quality, was installed on AlmaLinux. Following its setup, SonarQube was seamlessly integrated with Zabbix, an enterprise-class open-source distributed monitoring solution, to enable the dynamic monitoring of various projects. This integration aimed to provide our team at Zen Networks with real-time visibility into key metrics such as bugs, vulnerabilities, and code smells for ongoing projects.
Table of Contents
Upon successful installation and configuration of SonarQube on the AlmaLinux server, the next phase involved setting up projects for code analysis. Five test projects were created to demonstrate the capabilities of SonarQube and serve as a baseline for quality assessment.
The integration of SonarQube with Zabbix was aimed at leveraging Zabbix’s robust monitoring capabilities to keep a close eye on the projects’ health status in terms of code quality.
Our team built a Zabbix template dedicated to interfacing with the SonarQube API and designed to auto-discover SonarQube projects and their key metrics. For integrating Zabbix with the SonarQube API and enabling the auto-discovery of projects and key metrics, the following API calls and configurations were used:
<discovery_rule>
<name>sonarqube_project_discovery</name>
<type>HTTP_AGENT</type>
<key>sonarqube.project.discovery</key>
<delay>1h</delay>
<lifetime>3d</lifetime>
<item_prototypes>
<item_prototype>
<name>{#PROJECTNAME}: Metrics</name>
<type>HTTP_AGENT</type>
<key>sonarqube.project.metrics['{#PROJECTNAME}']</key>
<delay>5m</delay>
<url>{$PROTO}://{HOST.IP}:{$PORT}/api/measures/component?
component={#PROJECTNAME}&metricKeys=bugs,vulnerabilities,
code_smells,ncloc,complexity,violations</url>
<headers>
<header>
<name>Authorization</name>
<value>Basic YOUR_BASE64_ENCODED_TOKEN</value>
</header>
</headers>
</item_prototype>
</item_prototypes>
</discovery_rule>
In addition, our team set up items within Zabbix to track the number of bugs, vulnerabilities, and code smells, as presented in the SonarQube dashboard. We also configured triggers within Zabbix to alert the team when certain thresholds were reached, facilitating prompt action to maintain code quality.
We enabled the dynamic discovery of projects in SonarQube, allowing for new projects to be automatically detected and monitored without manual intervention. To enable the dynamic discovery of projects in SonarQube and ensure they are automatically detected and monitored by Zabbix, we implemented the following configurations:

With the projects and metrics being actively monitored, the focus shifted to presenting the data effectively. A custom dashboard was created in Zabbix to aggregate and display the information gleaned from SonarQube.
We created a user-friendly dashboard to provide a quick overview of the status of all projects.

Widgets were customized for each key metric to enhance readability and instant understanding of the project statuses.
Visual indicators, such as color-coded status icons and progress bars, were incorporated to give a clear visual cue about the health of each project.
W configured the dashboard to refresh at regular intervals, providing real-time updates to the development team.
Ensured that the most current data was always available, enabling a proactive approach to quality assurance and code health.
The integration of SonarQube with Zabbix and the creation of a dedicated dashboard yielded significant benefits for development workflow and project management.
Special thanks to the team at Zen Networks (Oumaima Naami, Karim Chadil, and Fayçal Noushi) for their work on this project.
The post Elevating Code Quality: Real-Time Insights with Zabbix Integration and SonarQube appeared first on Zabbix Blog.