Може ли президентът Румен Радев и „Продължаваме промяната“ –„Демократична България“ (ПП–ДБ) да бъдат отново в един лагер четири години след протестите през лятото на 2020-та? Няма вечни врагове – нито пък вечни приятелства, но общият враг е добро начало за „отново“, макар и нетрайно, тъй като е ситуационно. Идеологическите и ценностните различия не са заличени. ПП–ДБ остават поддръжници на европейската политика за подкрепа на Украйна и санкции за Русия, а Радев – на противните позиции.
В предаването на Веселин Дремджиев тази седмица Ивайло Мирчев от ПП–ДБ поиска Румен Радев да отговори защо Националната служба за охрана пак охранява Пеевски, отказал се от услугите ѝ след десанта на Росенец от екипа на „Да, България“. Също така допусна, че има синхрон между Пеевски, Радев и Борисов по линия на службите и че бързи избори са изгодни за Пеевски заради близостта му с вътрешния министър Калин Стоянов. Но същият този Стоянов де факто е начело на МВР още от кабинета на ПП–ДБ с премиер Николай Денков, а оглавява ГДБОП при друг вътрешен министър от ПП – Бойко Рашков.
Нима тактически съюзи обаче не са възможни? Например ПП насърчи гласуването за Румен Радев, когато се кандидатира за втори президентски мандат. Независимо че неговите прокремълски пристрастия вече бяха явни, съпредседателят на ПП Кирил Петков излезе с видеообръщение:
За да имаме „Продължаваме промяната“, тази промяна трябваше да започне отнякъде. Човекът, който я започна, се казва Румен Радев. Това беше човекът, който излезе на площада, без да го е страх, и се опълчи срещу всички тези, които крадат от нашата република. Това е човекът, който обедини всички нас и ни даде възможност да повярваме, че промяната е възможна. Заедно с него, в следващите четири години, аз вярвам, че ще направим България да бъде тази, с която всички ние да се гордеем.
Деинсталиране
Доказателства, че е възможно обединение срещу общ враг, може да се намерят и в същите тези протести срещу мафията и задкулисието в политиката, олицетворени с портретите на лидера на ГЕРБ Бойко Борисов, олигарха (от ДПС) Делян Пеевски и тогавашния главен прокурор Иван Гешев. Същият този Гешев няколко години по-късно – през юни 2023 г., беше свален от поста с гласуване във ВСС, президентът бързо подписа указа за освобождаването му, а преди това ГЕРБ и ДПС поискаха оставката му като главен прокурор. На прощаване Гешев ги нарече „политически боклук“, а себе си – „жертва“.
Сега санкционираният за значима корупция от САЩ и Великобритания Пеевски най-вероятно ще сподели съдбата на някогашния си подопечен Гешев, макар и не с бързината, с която беше отстранен главният прокурор. От избухналото до колата му взривно устройство на 1 май м.г. до гласуването във Висшия съдебен съвет изминаха трийсетина дни. За Пеевски ще са необходими повече и едно заседание на Централния съвет на ДПС за начало.
Общ интерес
И за президента, и за ПП–ДБ от общ интерес е противопоставянето на (съ)председателя на ДПС Делян Пеевски и неутрализирането на влиянието му в съдебната система и службите. Вратите на този лагер са отворени и за партньори на Пеевски, на които почват да им тежат обвързаностите и искат да скъсат синджира. Такъв например е Бойко Борисов, в чиито премиерски мандати компании, свързвани с Пеевски, получаваха солидни обществени поръчки, медийната група на олигарха биеше по вразите на властта, а прокуратурата – по бизнесите им. Но готов ли е Борисов да хвърли оковите, или няма да посмее да счупи това най-модерно и тежко робство на политическите зависимости?
„Отборът“ срещу Пеевски също може да се нарече „сглобка“, тъй като играчите с неохота се събират, подобно на мнозинството за подкрепа на правителството „Денков–Габриел“. Но пък габаритите на противника изискват подобен фронт – главно за да бъде пресечена възможността му да презареди влиянието (на създателите си) в регулаторите и съдебната власт. А общата цел налага компромиси и готовност за сътрудничество.
Реформаторско
Така, от една страна, държавният глава си връща имиджа на реформатор и антикорупционер, заради който стана популярен и който се беше позагубил под напора на проруското му миротворчество в последните години. (Ако смята да опита с политически проект, слоганът за „чисти ръце“ ще му е от полза. През 2021 г., след като излезе първият списък със санкционирани по закона „Магнитски“ за корупция в България, Радев заяви, че „санкциите от САЩ са ясна диагноза за режима, който отгледа тази корупция“.)
Редно ли е зад океана да ни кажат, че тук се вършат престъпления, а прокуратурата да не ги вижда? Прокуратурата взе страна на статуквото. Няма кой отвън да разплете това.
Румен Радев през 2021 г.
Скандалът в ДПС и яростната конфронтация Пеевски–Доган е основна политическа тема и държавният глава даде да се разбере на чия страна е. Макар че изявлението му дойде, след като беше атакуван от Пеевски заради полета си с учебно-тренировъчния самолет от ново поколение РС-21 по повод 20-годишнината от приемането на самолетите Pilatus в състава на българските ВВС:
Държавата гори, а някои хора летят. Вчера наблюдавахте ли какво се случва? Рекламни полети на спасители. Някой харчи парите, вместо да въртят вертолетите да гасят. Той защо не е на пожарите, защо не върши работа, а лети? Да вземе да кацне, да вземе да даде този мандат, после да даде третия мандат.
И отговорът дойде от Великобритания, където Радев участва в Четвъртата среща на върха на Европейската политическа общност.
Инсталирането на тежко компрометирани фигури като г-н Пеевски и възможността те да си присвояват безпрепятствено правото да се обявяват за евроатлантици, да раздават правосъдие наляво и надясно, да се превръщат в морални стожери, показва, че нашата политическа система е тежко заболяла. Начинът да я възстановим е чрез радикална хирургия. […] Скалпелът е в ръцете на българските избиратели, когато и да има следващи избори.
Скалпел, моля
Но най-напред ще се наложи скалпел да използва почетният председател на ДПС, за да изреже Пеевски от тялото на Движението, след като го призова в декларация да напусне. На Доган му е необходимо повече време, за да отцепва и връща към „автентичното ДПС“ депутати от отбора на Пеевски и да си гарантира постепенно числено превъзходство за едно предстоящо заседание на Централния съвет. На поредна среща в София от отбора на Доган ще обмислят как да действат по-нататък. В момента парламентарната група на ДПС наброява 22-ма от общо 47 – останалите са „независимите“ начело с Джевдет Чакъров. И той, и Пеевски са избрани за съпредседатели на Национална конференция на ДПС и само тя би могла да ги/го отстрани.
Както беше отбелязано, бързи избори за 51-ви парламент работят за съпредседателя Пеевски и затова той грубо подканя президента да побърза. Насрочването им и времето, което ще отнемат танците с мандатите, зависят от държавния глава. Нови избори може да презаредят модела Пеевски, предупреди по БНТ наскоро съпредседателят на ДБ (в оставка) Христо Иванов.
Със сигурност Доган не би искал да реже живо месо от партията повече от необходимото, а бързи избори няма да донесат обнадеждаващи резултати за ДПС. След като президентът Радев обаче заяви, че август не е най-добрият месец за предизборна кампания, нито избори до средата на септември, а и партиите не го искат, поне два месеца са гарантирани.
Съюзници
Политическите сили в България са се обединявали срещу общи врагове за постигане на важни политически цели. Например протестите през 2013–2014 г., отключени след назначението на Пеевски за шеф на ДАНС, доведоха до обединение на различни политически и граждански групи срещу правителството на Пламен Орешарски. Същото се получи и с гражданското недоволство през 2020 г. – подкрепящите протестите тогава се оказаха в различни, често противостоящи политически лагери.
Но ГЕРБ, чиито активисти също протестираха през 2013–2014 г., сега има прекалено силни зависимости от Пеевски. Подвластни са му и от БСП – още от времената на тройната коалиция, въпреки че тогава той правеше първи стъпки в политиката, но пък какви стъпки. Назначен е за заместник-министър на държавната политика при бедствия и аварии в създаденото по идея на ДПС специално министерство и е от квотата на ДПС. При тройната коалиция започва да придобива влияние в медийния сектор и така разширява и уплътнява влиянието си.
За дезактивирането на Пеевски и изваждането му от ДПС ще са нужни обединени усилия. Но този процес не изчерпва антикорупционната битка, а е само едно добро начало. За продължението ѝ не Доган трябва да държи скалпела, а силата на правото.
Помогнете ни да научим какви са читателските ви възприятия и отношението ви към „Тоест“, като попълните нашата анкета.
The world of education is loud with discussions about the uses and risks of generative AI — tools for outputting human-seeming media content such as text, images, audio, and video. In answer, there’s a new practical guide on using generative AI aimed at Computing teachers (and others), written by a group of classroom teachers and researchers at the Raspberry Pi Computing Education Research Centre and Faculty of Education at the University of Cambridge.
Their new guide is a really useful overview for everyone who wants to:
Understand the issues generative AI tools present in the context of education
Find out how to help their schools and students navigate them
Discover ideas on how to make use of generative AI tools in their teaching
Since generative AI tools have become publicly available, issues around data privacy and plagiarism are at the front of educators’ minds. At the same time, many educators are coming up with creative ways to use generative AI tools to enhance teaching and learning. The Research Centre’s guide describes the areas where generative AI touches on education, and lays out what schools and teachers can do to use the technology beneficially and help their learners do the same.
It’s widely accepted that AI tools can bring benefits but can also be used in unhelpful or harmful ways. Basic knowledge of how AI and machine learning works is key to being able to get the best from them. The Research Centre’s guide shares recommended educational resources for teaching learners about AI.
One of the recommendations is Experience AI, a set of free classroom resources we’re creating. It includes a set of 6 lessons for providing 11- to 14-year-olds with a foundational understanding of AI systems, as well as a standalone lesson specifically for teaching about large language model-based AI tools, such as ChatGPT and Google Gemini. These materials are for teachers of any specialism, not just for Computing teachers.
You’ll find that even a brief introduction to how large language models work is likely to make students’ ideas about using these tools to do all their homework much less appealing. The guide outlines creative ways you can help students see some of generative AI’s pitfalls, such as asking students to generate outputs and compare them, paying particular attention to inaccuracies in the outputs.
Generative AI tools and teaching computing
We’re still learning about what the best ways to teach programming to novice learners are. Generative AI has the potential to change how young people learn text-based programming, as AI functionality is now integrated into many of the major programming environments, generating example solutions or helping to spot errors.
The Research Centre’s guide acknowledges that there’s more work to be done to understand how and when to support learners with programming tasks through generative AI tools. (You can follow our ongoing seminar series on the topic.) In the meantime, you may choose to support established programming pedagogies with generative AI tools, such as prompting an AI chatbot to generate a PRIMM activity on a particular programming concept.
As ethics and the impact of technology play an important part in any good Computing curriculum, the guide also shares ways to use generative AI tools as a focus for your classroom discussions about topics such as bias and inequality.
Using generative AI tools to support teaching and learning
Teachers have been using generative AI applications as productivity tools to support their teaching, and the Research Centre’s guide gives several examples you can try out yourself. Examples include creating summaries of textual materials for students, and creating sets of questions on particular topics. As the guide points out, when you use generative AI tools like this, it’s important to always check the accuracy of the generated materials before you give any of them to your students.
Putting a school-wide policy in place
Importantly, the Research Centre’s guide highlights the need for a school-wide acceptable use policy (AUP) that informs teachers, other school staff, and students on how they may use generative AI tools. This section of the guide suggests websites that offer sample AUPs that can be used as a starting point for your school. Your AUP should aim to keep users safe, covering e-safety, privacy, and security issues as well as offering guidance on being transparent about the use of generative tools.
It’s not uncommon that schools look to specialist Computing teachers to act as the experts on questions around use of digital tools. However, for developing trust in how generative AI tools are used in the school, it’s important to encourage as wide a range of stakeholders as possible to be consulted in the process of creating an AUP.
A source of support for teachers and schools
As the Research Centre’s guide recognises, the landscape of AI and our thinking about it might change. In this uncertain context, the document offers a sensible and detailed overview of where we are now in understanding the current impact of generative AI on Computing as a subject, and on education more broadly. The example use cases and thought-provoking next steps on how this technology can be used and what its known risks and concerns are should be helpful for all interested educators and schools.
I recommend that all Computing teachers read this new guide, and I hope you feel inspired about the key role that you can play in shaping the future of education affected by AI.
The sad news that Peter de Schrijver has passed away has just reached us. An obituary in Dutch relates that he passed in a Helsinki hospital on July 12. Mind Software Consulting, which he founded, has a message of condolences as well.
De Schrijver was a Debian Developer and a Linux kernel contributor; he will be missed.
OpenSearch is an open source, distributed search engine suitable for a wide array of use-cases such as ecommerce search, enterprise search (content management search, document search, knowledge management search, and so on), site search, application search, and semantic search. It’s also an analytics suite that you can use to perform interactive log analytics, real-time application monitoring, security analytics and more. Like Apache Solr, OpenSearch provides search across document sets. OpenSearch also includes capabilities to ingest and analyze data. Amazon OpenSearch Service is a fully managed service that you can use to deploy, scale, and monitor OpenSearch in the AWS Cloud.
Many organizations are migrating their Apache Solr based search solutions to OpenSearch. The main driving factors include lower total cost of ownership, scalability, stability, improved ingestion connectors (such as Data Prepper, Fluent Bit, and OpenSearch Ingestion), elimination of external cluster managers like Zookeeper, enhanced reporting, and rich visualizations with OpenSearch Dashboards.
We recommend approaching a Solr to OpenSearch migration with a full refactor of your search solution to optimize it for OpenSearch. While both Solr and OpenSearch use Apache Lucene for core indexing and query processing, the systems exhibit different characteristics. By planning and running a proof-of-concept, you can ensure the best results from OpenSearch. This blog post dives into the strategic considerations and steps involved in migrating from Solr to OpenSearch.
Key differences
Solr and OpenSearch Service share fundamental capabilities delivered through Apache Lucene. However, there are some key differences in terminology and functionality between the two:
Collectionandindex: In OpenSearch, a collection is called an index.
Shard andreplica: Both Solr and OpenSearch use the terms shard and replica.
API-driven Interactions: All interactions in OpenSearch are API-driven, eliminating the need for manual file changes or Zookeeper configurations. When creating an OpenSearch index, you define the mapping (equivalent to the schema) and the settings (equivalent to solrconfig) as part of the index creation API call.
Having set the stage with the basics, let’s dive into the four key components and how each of them can be migrated from Solr to OpenSearch.
Collection to index
A collection in Solr is called an index in OpenSearch. Like a Solr collection, an index in OpenSearch also has shards and replicas.
Although the shard and replica concept is similar in both the search engines, you can use this migration as a window to adopt a better sharding strategy. Size your OpenSearch shards, replicas, and index by following the shard strategy best practices.
As part of the migration, reconsider your data model. In examining your data model, you can find efficiencies that dramatically improve your search latencies and throughput. Poor data modeling doesn’t only result in search performance problems but extends to other areas. For example, you might find it challenging to construct an effective query to implement a particular feature. In such cases, the solution often involves modifying the data model.
Differences: Solr allows primary shard and replica shard collocation on the same node. OpenSearch doesn’t place the primary and replica on the same node. OpenSearch Service zone awareness can automatically ensure that shards are distributed to different Availability Zones (data centers) to further increase resiliency.
The OpenSearch and Solr notions of replica are different. In OpenSearch, you define a primary shard count using number_of_primaries that determines the partitioning of your data. You then set a replica count using number_of_replicas. Each replica is a copy of all the primary shards. So, if you set number_of_primaries to 5, and number_of_replicas to 1, you will have 10 shards (5 primary shards, and 5 replica shards). Setting replicationFactor=1 in Solr yields one copy of the data (the primary).
For example, the following creates a collection called test with one shard and no replicas.
In OpenSearch, the following creates an index called test with five shards and one replica
PUT test
{
  "settings": {
    "number_of_shards": 5,
    "number_of_replicas": 1
  }
}
Schema to mapping
In Solr schema.xml OR managed-schema has all the field definitions, dynamic fields, and copy fields along with field type (text analyzers, tokenizers, or filters). You use the schema API to manage schema. Or you can run in schema-less mode.
OpenSearch has dynamic mapping, which behaves like Solr in schema-less mode. It’s not necessary to create an index beforehand to ingest data. By indexing data with a new index name, you create the index with OpenSearch managed service default settings (for example: "number_of_shards": 5, "number_of_replicas": 1) and the mapping based on the data that’s indexed (dynamic mapping).
We strongly recommend you opt for a pre-defined strict mapping. OpenSearch sets the schema based on the first value it sees in a field. If a stray numeric value is the first value for what is really a string field, OpenSearch will incorrectly map the field as numeric (integer, for example). Subsequent indexing requests with string values for that field will fail with an incorrect mapping exception. You know your data, you know your field types, you will benefit from setting the mapping directly.
Tip: Consider performing a sample indexing to generate the initial mapping and then refine and tidy up the mapping to accurately define the actual index. This approach helps you avoid manually constructing the mapping from scratch.
For Observability workloads, you should consider using Simple Schema for Observability. Simple Schema for Observability (also known as ss4o) is a standard for conforming to a common and unified observability schema. With the schema in place, Observability tools can ingest, automatically extract, and aggregate data and create custom dashboards, making it easier to understand the system at a higher level.
Many of the field types (data types), tokenizers, and filters are the same in both Solr and OpenSearch. After all, both use Lucene’s Java search library at their core.
_id is always the uniqueKey and cannot be defined explicitly, because it’s always present.
Explicitly enabling multivalued isn’t necessary because any OpenSearch field can contain zero or more values.
The mapping and the analyzers are defined during index creation. New fields can be added and certain mapping parameters can be updated later. However, deleting a field isn’t possible. A handy ReIndex API can overcome this problem. You can use the Reindex API to index data from one index to another.
By default, analyzers are for both index and query time. For some less-common scenarios, you can change the query analyzer at search time (in the query itself), which will override the analyzer defined in the index mapping and settings.
Index templates are also a great way to initialize new indexes with predefined mappings and settings. For example, if you continuously index log data (or any time-series data), you can define an index template so that all the indices have the same number of shards and replicas. It can also be used for dynamic mapping control and component templates
Look for opportunities to optimize the search solution. For instance, if the analysis reveals that the city field is solely used for filtering rather than searching, consider changing its field type to keyword instead of text to eliminate unnecessary text processing. Another optimization could involve disabling doc_values for the user_token field if it’s only intended for display purposes. doc_values are disabled by default for the text datatype.
SolrConfig to settings
In Solr, solrconfig.xml carries the collection configuration. All sorts of configurations pertaining to everything from index location and formatting, caching, codec factory, circuit breaks, commits and tlogs all the way up to slow query config, request handlers, and update processing chain, and so on.
Both OpenSearch and Solr have BEST_SPEED codec as default (LZ4 compression algorithm). Both offer BEST_COMPRESSION as an alternative. Additionally OpenSearch offers zstd and zstd_no_dict. Benchmarking for different compression codecs is also available.
For near real-time search, refresh_interval needs to be set. The default is 1 second which is good enough for most use cases. We recommend increasing refresh_interval to 30 or 60 seconds to improve indexing speed and throughput, especially for batch indexing.
Max boolean clause is a static setting, set at node level using the indices.query.bool.max_clause_count setting.
You don’t need an explicit requestHandler. All searches use the _search or _msearch endpoint. If you’re used to using the requestHandler with default values then you can use search templates.
If you’re used to using /sql requestHandler, OpenSearch also lets you use SQL syntax for querying and has a Piped Processing Language.
Spellcheck, also known as Did-you-mean, QueryElevation (known as pinned_query in OpenSearch), and highlighting are all supported during query time. You don’t need to explicitly define search components.
Most API responses are limited to JSON format, with CAT APIs as the only exception. In cases where Velocity or XSLT is used in Solr, it must be managed on the application layer. CAT APIs respond in JSON, YAML, or CBOR formats.
For the updateRequestProcessorChain, OpenSearch provides the ingest pipeline, allowing the enrichment or transformation of data before indexing. Multiple processor stages can be chained to form a pipeline for data transformation. Processors include GrokProcessor, CSVParser, JSONProcessor, KeyValue, Rename, Split, HTMLStrip, Drop, ScriptProcessor, and more. However, it’s strongly recommended to do the data transformation outside OpenSearch. The ideal place to do that would be at OpenSearch Ingestion, which provides a proper framework and various out-of-the-box filters for data transformation. OpenSearch Ingestion is built on Data Prepper, which is a server-side data collector capable of filtering, enriching, transforming, normalizing, and aggregating data for downstream analytics and visualization.
OpenSearch also introduced search pipelines, similar to ingest pipelines but tailored for search time operations. Search pipelines make it easier for you to process search queries and search results within OpenSearch. Currently available search processors include filter query, neural query enricher, normalization, rename field, scriptProcessor, and personalize search ranking, with more to come.
The following image shows how to set refresh_interval and slowlog. It also shows you the other possible settings.
Slow logs can be set like the following image but with much more precision with separate thresholds for the query and fetch phases.
Before migrating every configuration setting, assess if the setting can be adjusted based on your current search system experience and best practices. For instance, in the preceding example, the slow logs threshold of 1 second might be intensive for logging, so that can be revisited. In the same example, max.booleanClauses might be another thing to look at and reduce.
Differences: Some settings are done at the cluster level or node level and not at the index level. Including settings such as max boolean clause, circuit breaker settings, cache settings, and so on.
Rewriting queries
Rewriting queries deserves its own blog post; however we want to at least showcase the autocomplete feature available in OpenSearch Dashboards, which helps ease query writing.
Similar to the Solr Admin UI, OpenSearch also features a UI called OpenSearch Dashboards. You can use OpenSearch Dashboards to manage and scale your OpenSearch clusters. Additionally, it provides capabilities for visualizing your OpenSearch data, exploring data, monitoring observability, running queries, and so on. The equivalent for the query tab on the Solr UI in OpenSearch Dashboard is Dev Tools. Dev Tools is a development environment that lets you set up your OpenSearch Dashboards environment, run queries, explore data, and debug problems.
Now, let’s construct a query to accomplish the following:
Search for shirt OR shoe in an index.
Create a facet query to find the number of unique customers. Facet queries are called aggregation queries in OpenSearch. Also known as aggs query.
The Solr query would look like this:
http://localhost:8983/solr/solr_sample_data_ecommerce/select?q=shirt OR shoe
  &facet=true
  &facet.field=customer_id
  &facet.limit=-1
  &facet.mincount=1
  &json.facet={
   unique_customer_count:"unique(customer_id)"
  }
The image below demonstrates how to re-write the above Solr query into an OpenSearch query DSL:
Conclusion
OpenSearch covers a wide variety of uses cases, including enterprise search, site search, application search, ecommerce search, semantic search, observability (log observability, security analytics (SIEM), anomaly detection, trace analytics), and analytics. Migration from Solr to OpenSearch is becoming a common pattern. This blog post is designed to be a starting point for teams seeking guidance on such migrations.
Aswath Srinivasan is a Senior Search Engine Architect at Amazon Web Services currently based in Munich, Germany. With over 17 years of experience in various search technologies, Aswath currently focuses on OpenSearch. He is a search and open-source enthusiast and helps customers and the search community with their search problems.
Jon Handler is a Senior Principal Solutions Architect at Amazon Web Services based in Palo Alto, CA. Jon works closely with OpenSearch and Amazon OpenSearch Service, providing help and guidance to a broad range of customers who have search and log analytics workloads that they want to move to the AWS Cloud. Prior to joining AWS, Jon’s career as a software developer included 4 years of coding a large-scale, ecommerce search engine. Jon holds a Bachelor of the Arts from the University of Pennsylvania, and a Master of Science and a PhD in Computer Science and Artificial Intelligence from Northwestern University.
От лятото на 2019 г. в блога ми стои чернова, която така и не публикувах. Идеята ми зад въпросната статия беше да разкажа как се появи разписанието на градския транспорт на Пловдив в Google Maps. Но това сега няма никакво значение, защото от тази седмица там вече няма такива данни.
Съвсем кратка предистория: Преди вече пет години трима приятели предложихме на Община Пловдив да свършим необходимото, за да се появят маршрутите и разписанията на градския транспорт в Google Maps. Напълно безвъзмездно. Речено – сторено. Общината не трябваше да прави нищо друго, освен от време на време да ни уведомява за промените в маршрутите и разписанията, за да поддържаме нещата актуални и коректни. Това обаче не се случи. В началото на 2022 г. се уморихме да се борим с вятърни мелници и преустановихме поддръжката, като маркирахме, че данните не са актуални и няма да се обновяват.
Преди няколко дни човек от екипа на Google Transit (така се нарича услугата, която добавя информация за обществения транспорт в Maps) се свърза с мен да провери защо вече две години не сме актуализирали данните за Пловдив. Отговорих му, че за съжаление, няма как да го направим, тъй като разчитахме да получаваме тези данни от Община Пловдив, но се оказва, че всеки път трябва да им се молим за данните или да си ги събираме, както намерим за добре. Което определено не е начинът, по който трябва да се прави това. Нито може да гарантира нужната прецизност. Колегата от Google сподели, че разбира ситуацията, и ще преценят как да постъпят. След още два дни ми писа, че са взели решение да прекратят услугата за Пловдив.
Днес в Общинския съвет е имало дискусия по темата, провокирана от публикация в „Капитал“. Журналистите от медията писаха и преди година по темата и дори заедно прогнозирахме това развитие, но тишината откъм Община Пловдив си остана все така оглушителна.
Пиша това, защото сегашната ресорна кметица, г-жа Савина Петкова, е казала пред общинските съветници няколко изречения, които от стремеж към акуратност не мога да отмина без коментар. Позовавам се на публикации в регионалната преса, тъй като не съм присъствал лично.
Започвам с нейното твърдение, че градският транспорт на Пловдив има далеч по-важни проблеми, с което няма как да не се съглася. Аз самият съм се питал какви данни се опитваме да събираме и предоставяме на хората, когато ситуацията с обществения транспорт в града е толкова безобразна.
Вярно е и че общината никога не е имала договор с Google Maps. Просто защото няма как да има договор. Google не подписва такива. Платформата предоставя напълно безплатно възможността да визуализира данни за обществен или частен транспорт, ако те са предоставени от достоверен източник и в изисквания от тях формат. Иначе казано, Община Пловдив може сама да обобщава такива данни и да ги изпраща към Google. Това могат да правят и самите транспортни фирми. И има няколко в България, чиито разписания са в Google Maps, включително и БДЖ.
Проблемите тук са два. Първо, Google да се довери, че източникът на данни е достоверен. И второ, тези данни да бъдат в изисквания от тях формат – което не е задача с грандиозна трудност, но не е и тривиално начинание. През 2019 г. се наложи част от информацията да събираме от сканирани PDF-и, MS Word документи с вградени в тях таблици, които всъщност бяха растерни картинки. А данните за маршрутите, по които се движат автобусите, рисувахме точка по точка на ръка, защото „Организация и контрол по транспорта“ (ОКТ) разполагаше с GPS координати на спирките, но не и на пътя, по който автобусите се движат между тези спирки. Имаше още купчина технически засади, за които не подозирахме и в най-песимистичните си очаквания. Но някак ги разрешихме.
Иначе по темата защо Google все пак реши да публикува данни за Пловдив, това стана възможно, след като не общината, а ние, доброволците, се ангажирахме да съберем всичко и да го подредим. За да направим нещо полезно за града и гостите му. И защото ни е грижа за средата, в която живеем.
Община Пловдив потвърди с официално писмо пред Google, че ние ще вършим тази работа с подреждането и преобразуването на данните от нейно име.
За последвалите две години и половина, през които поддържахме данните живи, само веднъж получихме актуализация от общината. След двукратни мои настоявания пред тогавашния ресорен кмет Тодор Чонов, на които и до днес нямам отговор, в крайна сметка просто загубих търпение, обадих се на колегите в ОКТ по телефона и си изпросих нови данни. Те, между другото, винаги са откликвали, но така и никой не им възложи да изпращат промените, когато има такива, или примерно веднъж на три или дори шест месеца. Това щеше да е повече от достатъчно.
Не отговаря на истината обаче твърдението на г-жа Петкова, че данните, които са показвани досега от Google, са идвали от системата на „Индра“. Те не бяха особено полезни, защото в тях имаше грешки и ги получихме едва след като вече се бяхме преборили с дигитализацията на множество „хартиени данни“, които впрочем също бяха само частично полезни. Единственото улеснение на двата комплекта данни беше, че можехме да ги съпоставим и така да проследим къде се разминават, което помогна да отстраним някакво количество грешки.
Би било чудесно, ако системата на „Индра“ изобщо работеше и имаше как да интегрираме данните от нея за информация в реално време с Google. Това беше в плановете ни за бъдещето, когато градският транспорт на Пловдив евентуално щеше да има адекватна информационна система.
А приложението, което г-жа Петкова съжалява, че не е достатъчно популярно, е ето това. Моля, проследете линка и ще си отговорите сами защо „не е достатъчно популярно“. То работи (слава богу, нещо работи!), но е кошмарно остаряло и е адски неудобно за ползване, особено в движение и от мобилен телефон. Честно, г-жо Петкова, Вие колко пъти сте го ползвала?
И в заключение: искрено се надявам, че колегите от „Тикси“, които правят поредната за Пловдив нова система за управление на градския транспорт, ще имат добрата воля да предоставят отворено API или друг публично достъпен и документиран начин за интеграция с външни системи. Това ще позволи не само нова и по-лесна интеграция с Google Maps (защо не и в реално време този път?), но и създаването на други мобилни приложения и дигитални удобства за Пловдив. Защото ние още продължаваме да живеем в този град и да ни пука за него.
От лятото на 2019 г. в блога ми стои чернова, която така и не публикувах. Идеята ми зад въпросната статия беше да разкажа как се появи разписанието на градския транспорт на Пловдив в Google Maps. Но това сега няма никакво значение, защото от тази седмица там вече няма такива данни.
Съвсем кратка предистория: Преди вече пет години трима приятели предложихме на Община Пловдив да свършим необходимото, за да се появят маршрутите и разписанията на градския транспорт в Google Maps. Напълно безвъзмездно. Речено – сторено. Общината не трябваше да прави нищо друго, освен от време на време да ни уведомява за промените в маршрутите и разписанията, за да поддържаме нещата актуални и коректни. Това обаче не се случи. В началото на 2022 г. се уморихме да се борим с вятърни мелници и преустановихме поддръжката, като маркирахме, че данните не са актуални и няма да се обновяват.
Преди няколко дни човек от екипа на Google Transit (така се нарича услугата, която добавя информация за обществения транспорт в Maps) се свърза с мен да провери защо вече две години не сме актуализирали данните за Пловдив. Отговорих му, че за съжаление, няма как да го направим, тъй като разчитахме да получаваме тези данни от Община Пловдив, но се оказва, че всеки път трябва да им се молим за това или да си ги събираме, както намерим за добре. Което определено не е начинът, по който трябва да се прави това. Нито може да гарантира нужната прецизност. Колегата от Google сподели, че разбира ситуацията, и ще преценят как да постъпят. След още два дни ми писа, че са взели решение да прекратят услугата за Пловдив.
Днес в Общинския съвет е имало дискусия по темата, провокирана от публикация в „Капитал“. Журналистите от медията писаха и преди година по темата и дори заедно прогнозирахме това развитие, но тишината откъм Община Пловдив си остана все така оглушителна.
Пиша това, защото сегашната ресорна кметица, г-жа Савина Петкова, е казала пред общинските съветници няколко изречения, които от стремеж към прецизност не мога да отмина без коментар. Позовавам се на публикации в регионалната преса, тъй като не съм присъствал лично.
Започвам с нейното твърдение, че градският транспорт на Пловдив има далеч по-важни проблеми, с което няма как да не се съглася. Аз самият съм се питал какви данни се опитваме да събираме и предоставяме на хората, когато ситуацията с обществения транспорт в града е толкова безобразна.
Вярно е и че общината никога не е имала договор с Google Maps. Просто защото няма как да има такъв договор. Google не подписва такива. Платформата предоставя напълно безплатно възможността да визуализира данни за обществен или частен транспорт, ако те са предоставени от достоверен източник и в изисквания от тях формат. Иначе казано, Община Пловдив може сама да обобщава такива данни и да ги изпраща към Google. Това могат да правят и самите транспортни фирми. И има няколко в България, чиито разписания са в Google Maps, включително и БДЖ.
Проблемите тук са два. Първо, Google да се довери, че източникът на данни е достоверен. И второ, тези данни да бъдат в изисквания от тях формат – което не е задача с грандиозна трудност, но не е и тривиално начинание. През 2019 г. се наложи част от информацията да събираме от сканирани PDF-и, MS Word документи с вградени в тях таблици, които всъщност бяха растерни картинки. А данните за маршрутите, по които се движат автобусите, рисувахме точка по точка на ръка, защото „Организация и контрол по транспорта“ (ОКТ) разполагаше с GPS координати на спирките, но не и на пътя, по който автобусите се движат между тези спирки. Имаше още купчина технически засади, за които не подозирахме и в най-песимистичните си очаквания. Но някак ги разрешихме.
Иначе по темата защо Google все пак реши да публикува данни за Пловдив, това стана възможно, след като не общината, а ние, доброволците, се ангажирахме да съберем всичко и да го подредим. За да направим нещо полезно за града и гостите му. И защото ни е грижа за средата, в която живеем.
Община Пловдив потвърди с официално писмо пред Google, че ние ще вършим тази работа с подреждането и преобразуването на данните от нейно име.
За последвалите две години и половина, през които поддържахме данните живи, само веднъж получихме актуализация от общината. След двукратни мои настоявания пред тогавашния ресорен кмет Тодор Чонов, на които и до днес нямам отговор, в крайна сметка просто загубих търпение, обадих се на колегите в ОКТ по телефона и си изпросих нови данни. Те, между другото, винаги са откликвали, но така и никой не им възложи да изпращат промените, когато има такива, или примерно веднъж на три или дори шест месеца. Това щеше да е повече от достатъчно.
Не отговаря на истината обаче твърдението на г-жа Петкова, че данните, които са показвани досега от Google, са идвали от системата на „Индра“. Те не бяха особено полезни, защото в тях имаше грешки и ги получихме едва след като вече се бяхме преборили с дигитализацията на множество „хартиени данни“, които впрочем също бяха само частично полезни. Единственото улеснение на двата комплекта данни беше, че можехме да ги съпоставим и така да проследим къде се разминават, което помогна да отстраним някакво количество грешки.
Би било чудесно, ако системата на „Индра“ изобщо работеше и имаше как да интегрираме данните от нея за информация в реално време с Google. Това беше в плановете ни за бъдещето, когато градският транспорт на Пловдив евентуално щеше да има адекватна информационна система.
А приложението, което г-жа Петкова съжалява, че не е достатъчно популярно, е ето това. Моля, проследете линка и ще си отговорите сами защо „не е достатъчно популярно“. То работи (слава богу, нещо работи!), но е кошмарно остаряло и е адски неудобно за ползване, особено в движение и от мобилен телефон. Честно, г-жо Петкова, Вие колко пъти сте го ползвала?
И в заключение: искрено се надявам, че колегите от „Тикси“, които правят поредната за Пловдив нова система за управление на градския транспорт, ще имат добрата воля да предоставят API или друг публично достъпен начин за интеграция с външни системи. Това ще позволи не само интеграция с Google Maps (защо не и в реално време този път?), но и създаването на други мобилни приложения и дигитални удобства за Пловдив. Защото ние още продължаваме да живеем в този град и да ни пука за него.
Over the years, organizations have invested in creating purpose-built, cloud-based data lakes that are siloed from one another. A major challenge is enabling cross-organization discovery and access to data across these multiple data lakes, each built on different technology stacks. A data mesh addresses these issues with four principles: domain-oriented decentralized data ownership and architecture, treating data as a product, providing self-serve data infrastructure as a platform, and implementing federated governance. Data mesh enables organizations to organize around data domains with a focus on delivering data as a product.
In 2019, Volkswagen AG (VW) and Amazon Web Services (AWS) formed a strategic partnership to co-develop the Digital Production Platform (DPP), aiming to enhance production and logistics efficiency by 30 percent while reducing production costs by the same margin. The DPP was developed to streamline access to data from shop-floor devices and manufacturing systems by handling integrations and providing standardized interfaces. However, as applications evolved on the platform, a significant challenge emerged: sharing data across applications stored in multiple isolated data lakes in Amazon Simple Storage Service (Amazon S3) buckets in individual AWS accounts without having to consolidate data into a central data lake. Another challenge is discovering available data stored across multiple data lakes and facilitating a workflow to request data access across business domains within each plant. The current method is largely manual, relying on emails and general communication, which not only increases overhead but also varies from one use case to another in terms of data governance. This blog post introduces Amazon DataZone and explores how VW used it to build their data mesh to enable streamlined data access across multiple data lakes. It focuses on the key aspect of the solution, which was enabling data providers to automatically publish data assets to Amazon DataZone, which served as the central data mesh for enhanced data discoverability. Additionally, the post provides code to guide you through the implementation.
Introduction to Amazon DataZone
Amazon DataZone is a data management service that makes it faster and easier for customers to catalog, discover, share, and govern data stored across AWS, on premises, and third-party sources. Key features of Amazon DataZone include a business data catalog that allows users to search for published data, request access, and start working on data in days instead of weeks. Amazon DataZone projects enable collaboration with teams through data assets and the ability to manage and monitor data assets across projects. It also includes the Amazon DataZone portal, which offers a personalized analytics experience for data assets through a web-based application or API. Lastly, Amazon DataZone governed data sharing ensures that the right data is accessed by the right user for the right purpose with a governed workflow.
Architecture for Data Management with Amazon DataZone
Figure 1: Data mesh pattern implementation on AWS using Amazon DataZone
The architecture diagram (Figure 1) represents a high-level design based on the data mesh pattern. It separates source systems, data domain producers (data publishers), data domain consumers (data subscribers), and central governance to highlight key aspects. This cross-account data mesh architecture aims to create a scalable foundation for data platforms, supporting producers and consumers with consistent governance.
A data domain producer resides in an AWS account and uses Amazon S3 buckets to store raw and transformed data. Producers ingest data into their S3 buckets through pipelines they manage, own, and operate. They are responsible for the full lifecycle of the data, from raw capture to a form suitable for external consumption.
A data domain producer maintains its own ETL stack using AWS Glue, AWS Lambda to process, AWS Glue Databrew to profile the data and prepare the data asset (data product) before cataloguing it into AWS Glue Data Catalog in their account.
A second pattern could be that a data domain producer prepares and stores the data asset as table within Amazon Redshift using AWS S3 Copy.
Data domain producers publish data assets using datasource run to Amazon DataZone in the Central Governance account. This populates the technical metadata in the business data catalog for each data asset. The business metadata, can be added by business users to provide business context, tags, and data classification for the datasets. Producers control what to share, for how long, and how consumers interact with it.
Producers can register and create catalog entries with AWS Glue from all their S3 buckets. The central governance account securely shares datasets between producers and consumers via metadata linking, with no data (except logs) existing in this account. Data ownership remains with the producer.
With Amazon DataZone, once data is cataloged and published into the DataZone domain, it can be shared with multiple consumer accounts.
The Amazon DataZone Data portal provides a personalized view for users to discover/search and submit requests for subscription of data assets using a web-based application. The data domain producer receives the notification of subscription requests in the Data portal and can approve/reject the requests.
Manual process to publish data assets to Amazon DataZone
To publish a data asset from the producer account, each asset must be registered in Amazon DataZone as a data source for consumer subscription. The Amazon DataZone User Guide provides detailed steps to achieve this. In the absence of an automated registration process, all required tasks must be completed manually for each data asset.
How to automate publishing data assets from AWS Glue Data Catalog from the producer account to Amazon DataZone
Using the automated registration workflow, the manual steps can be automated for any new data asset that needs to be published in an Amazon DataZone domain or when there’s a schema change in an already published data asset.
The automated solution reduces the repetitive manual steps to publish the data sources (AWS Glue tables) into an Amazon DataZone domain.
Architecture for automated data asset publish
Figure 2 Architecture for automated data publish to Amazon DataZone
To automate publishing data assets:
In the producer account (Account B), the data to be shared resides in an Amazon S3 bucket (Figure 2). An AWS Glue crawler is configured for the dataset to automatically create the schema using AWS Cloud Development Kit (AWS CDK).
Once configured, the AWS Glue crawler crawls the Amazon S3 bucket and updates the metadata in the AWS Glue Data Catalog. The successful completion of the AWS Glue crawler generates an event in the default event bus of Amazon EventBridge.
An EventBridge rule is configured to detect this event and invoke a dataset-registration AWS Lambda function.
The AWS Lambda function performs all the steps to automatically register and publish the dataset in Amazon Datazone.
Steps performed in the dataset-registration AWS Lambda function
The AWS Lambda function retrieves the AWS Glue database and Amazon S3 information for the dataset from the Amazon Eventbridge event triggered by the successful run of the AWS Glue crawler.
It obtains the Amazon DataZone Datalake blueprint ID from the producer account and the Amazon DataZone domain ID and project ID by assuming an IAM role in the central governance account where the Amazon Datazone domain exists.
It enables the Amazon DataZone Datalake blueprint in the producer account.
It registers the Amazon S3 location of the dataset in Lake Formation in the producer account.
The function creates a data source within the Amazon DataZone project and monitors the completion of the data source creation.
Finally, it checks whether the data source sync job in Amazon DataZone needs to be started. If new AWS Glue tables or metadata is created or updated, then it starts the data source sync job.
Prerequisites
As part of this solution, you will publish data assets from an existing AWS Glue database in a producer account into an Amazon DataZone domain for which the following prerequisites need to be performed.
One AWS account will act as the data domain producer account (Account B) which will contain the AWS Glue dataset to be shared.
The second AWS account is the central governance account (Account A), which will have the Amazon DataZone domain and project deployed. This is the Amazon DataZone account.
Ensure that both the AWS accounts belong to the same AWS Organization
Make sure in both AWS accounts that you have cleared the checkbox for Default permissions for newly created databases and tables under the Data Catalog settings in Lake Formation (Figure 3).
Figure 3: Clear default permissions in AWS Lake Formation
This IAM role is called dz-assumable-env-dataset-registration-role in this example. Adding this role will enable you to successfully run the dataset-registration Lambda function. Replace the account-region, account id, and DataZonekmsKey in the following policy with your information. These values correspond to where your Amazon DataZone domain is created and the AWS KMS key Amazon Resource Name (ARN) used to encrypt the Amazon DataZone domain.
Add the AWS account in the trust relationship of this role with the following trust relationship. Replace ProducerAccountId with the AWS account ID of Account B (data domain producer account).
After completing the pre-requisites, use the AWS CDK stack provided on GitHub to deploy the solution for automatic registration of data assets into DataZone domain
Clone the repository from GitHub to your preferred IDE using the following commands.
git clone https://github.com/aws-samples/automate-and-simplify-aws-glue-data-asset-publish-to-amazon-datazone.git

cd automate-and-simplify-aws-glue-data-asset-publish-to-amazon-datazone
At the base of the repository folder, run the following commands to build and deploy resources to AWS.
npm install
npm run lint
Sign in to the AWS account B (the data domain producer account) using AWS Command Line Interface (AWS CLI) with your profile name.
Bootstrap the CDK environment with the following commands at the base of the repository folder. Replace <PROFILE_NAME> with the profile name of your deployment account (Account B). Bootstrapping is a one-time activity and is not needed if your AWS account is already bootstrapped.
export AWS_PROFILE=<PROFILE_NAME>
npm run cdk bootstrap
Replace the placeholder parameters (marked with the suffix _PLACEHOLDER) in the file config/DataZoneConfig.ts (Figure 4).
Amazon DataZone domain and project name of your Amazon DataZone instance. Make sure all names are in lowercase.
The AWS account ID and Region.
The assumable IAM role from the prerequisites.
The deployment role starting with cfn-xxxxxx-cdk-exec-role-.
Figure 4: Edit the DataZoneConfig file
In the AWS Management Console for Lake Formation, select Administrative roles and tasks from the navigation pane (Figure 5) and make sure the IAM role for AWS CDK deployment that starts with cfn-xxxxxx-cdk-exec-role- is selected as an administrator in Data lake administrators. This IAM role needs permissions in Lake Formation to create resources, such as an AWS Glue database. Without these permissions, the AWS CDK stack deployment will fail.
Figure 5: Add cfn-xxxxxx-cdk-exec-role- as a Data Lake administrator
Use the following command in the base folder to deploy the AWS CDK solution
npm run cdk deploy --all
During deployment, enter y if you want to deploy the changes for some stacks when you see the prompt Do you wish to deploy these changes (y/n)?
After the deployment is complete, sign in to your AWS account B (producer account) and navigate to the AWS CloudFormation console to verify that the infrastructure deployed. You should see a list of the deployed CloudFormation stacks as shown in Figure 6.
Figure 6: Deployed CloudFormation stacks
Test automatic data registration to Amazon DataZone
Download the Online Retail.csv file from Kaggle dataset.
Login to AWS Account B (producer account) and navigate to the Amazon S3 console, find the DataZone-test-datasource S3 bucket, and upload the csv file there (Figure 7).
Figure 7: Upload the dataset CSV file
The AWS Glue crawler is scheduled to run at a specific time each day. However for testing, you can manually run the crawler by going to the AWS Glue console and selecting Crawlers from the navigation pane. Run the on-demand crawler starting with DataZone-. After the crawler has run, verify that a new table has been created.
Go to the Amazon DataZone console in AWS account A (central governance account) where you deployed the resources. Select Domains in the navigation pane (Figure 8), then Select and open your domain.
Figure 8: Amazon DataZone domains
After you open the Datazone Domain, you can find the Amazon Datazone data portal URL in the Summary section (Figure 9). Select and open data portal.
Figure 9: Amazon DataZone data portal URL
In the data portal find your project (Figure 10). Then select the Data tab at the top of the window.
Figure 10: Amazon DataZone Project overview
Select the section Data Sources (Figure 11) and find the newly created data source DataZone-testdata-db.
Figure 11: Select Data sources in the Amazon Datazone Domain Data portal
Verify that the data source has been successfully published (Figure 12).
Figure 12: The data sources are visible in the Published data section
Figure 13: Example data discovery in the Amazon DataZone portal
Clean up
Use the following steps to clean up the resources deployed through the CDK.
Empty the two S3 buckets that were created as part of this deployment.
Go to the Amazon DataZone domain portal and delete the published data assets that were created in the Amazon DataZone project by the dataset-registration Lambda function.
Delete the remaining resources created using the following command in the base folder:
npm run cdk destroy --all
Conclusion
By using AWS Glue and Amazon DataZone, organizations can make their data management easier and allow teams to share and collaborate on data smoothly. Automatically sending AWS Glue data to Amazon DataZone not only makes the process simple but also keeps the data consistent, secure, and well-governed. Simplify and standardize publishing data assets to Amazon DataZone and streamline data management with Amazon DataZone. For guidance on establishing your organization’s data mesh with Amazon DataZone, contact your AWS team today.
About the Authors
Bandana Das is a Senior Data Architect at Amazon Web Services and specializes in data and analytics. She builds event-driven data architectures to support customers in data management and data-driven decision-making. She is also passionate about enabling customers on their data management journey to the cloud.
Anirban Saha is a DevOps Architect at AWS, specializing in architecting and implementation of solutions for customer challenges in the automotive domain. He is passionate about well-architected infrastructures, automation, data-driven solutions and helping make the customer’s cloud journey as seamless as possible. Personally, he likes to keep himself engaged with reading, painting, language learning and traveling.
Chandana Keswarkar is a Senior Solutions Architect at AWS, who specializes in guiding automotive customers through their digital transformation journeys by using cloud technology. She helps organizations develop and refine their platform and product architectures and make well-informed design decisions. In her free time, she enjoys traveling, reading, and practicing yoga.
Sindi Cali is a ProServe Associate Consultant with AWS Professional Services. She supports customers in building data driven applications in AWS.
От лятото на 2019 г. в блога ми стои чернова, която така и не публикувах. Идеята ми зад въпросната статия беше да разкажа как се появи разписанието на градския транспорт на Пловдив в Google Maps. Но това сега няма никакво значение, защото от тази седмица там вече няма такива данни.
Съвсем кратка предистория: Преди вече пет години трима приятели предложихме на Община Пловдив да свършим необходимото, за да се появят маршрутите и разписанията на градския транспорт в Google Maps. Напълно безвъзмездно. Речено – сторено. Общината не трябваше да прави нищо друго, освен от време на време да ни уведомява за промените в маршрутите и разписанията, за да поддържаме нещата актуални и коректни. Това обаче не се случи. В началото на 2022 г. се уморихме да се борим с вятърни мелници и преустановихме поддръжката, като маркирахме, че данните не са актуални и няма да се обновяват.
Преди няколко дни човек от екипа на Google Transit (така се нарича услугата, която добавя информация за обществения транспорт в Maps) се свърза с мен да провери защо вече две години не сме актуализирали данните за Пловдив. Отговорих му, че за съжаление, няма как да го направим, тъй като разчитахме да получаваме тези данни от Община Пловдив, но се оказва, че всеки път трябва да им се молим за данните или да си ги събираме, както намерим за добре. Което определено не е начинът, по който трябва да се прави това. Нито може да гарантира нужната прецизност. Колегата от Google сподели, че разбира ситуацията, и ще преценят как да постъпят. След още два дни ми писа, че са взели решение да прекратят услугата за Пловдив.
Днес в Общинския съвет е имало дискусия по темата, провокирана от публикация в „Капитал“. Журналистите от медията писаха и преди година по темата и дори заедно прогнозирахме това развитие, но тишината откъм Община Пловдив си остана все така оглушителна.
Пиша това, защото сегашната ресорна кметица, г-жа Савина Петкова, е казала пред общинските съветници няколко изречения, които от стремеж към акуратност не мога да отмина без коментар. Позовавам се на публикации в регионалната преса, тъй като не съм присъствал лично.
Започвам с нейното твърдение, че градският транспорт на Пловдив има далеч по-важни проблеми, с което няма как да не се съглася. Аз самият съм се питал какви данни се опитваме да събираме и предоставяме на хората, когато ситуацията с обществения транспорт в града е толкова безобразна.
Вярно е и че общината никога не е имала договор с Google Maps. Просто защото няма как да има договор. Google не подписва такива. Платформата предоставя напълно безплатно възможността да визуализира данни за обществен или частен транспорт, ако те са предоставени от достоверен източник и в изисквания от тях формат. Иначе казано, Община Пловдив може сама да обобщава такива данни и да ги изпраща към Google. Това могат да правят и самите транспортни фирми. И има няколко в България, чиито разписания са в Google Maps, включително и БДЖ.
Проблемите тук са два. Първо, Google да се довери, че източникът на данни е достоверен. И второ, тези данни да бъдат в изисквания от тях формат – което не е задача с грандиозна трудност, но не е и тривиално начинание. През 2019 г. се наложи част от информацията да събираме от сканирани PDF-и, MS Word документи с вградени в тях таблици, които всъщност бяха растерни картинки. А данните за маршрутите, по които се движат автобусите, рисувахме точка по точка на ръка, защото „Организация и контрол по транспорта“ (ОКТ) разполагаше с GPS координати на спирките, но не и на пътя, по който автобусите се движат между тези спирки. Имаше още купчина технически засади, за които не подозирахме и в най-песимистичните си очаквания. Но някак ги разрешихме.
Иначе по темата защо Google все пак реши да публикува данни за Пловдив, това стана възможно, след като не общината, а ние, доброволците, се ангажирахме да съберем всичко и да го подредим. За да направим нещо полезно за града и гостите му. И защото ни е грижа за средата, в която живеем.
Община Пловдив потвърди с официално писмо пред Google, че ние ще вършим тази работа с подреждането и преобразуването на данните от нейно име.
За последвалите две години и половина, през които поддържахме данните живи, само веднъж получихме актуализация от общината. След двукратни мои настоявания пред тогавашния ресорен кмет Тодор Чонов, на които и до днес нямам отговор, в крайна сметка просто загубих търпение, обадих се на колегите в ОКТ по телефона и си изпросих нови данни. Те, между другото, винаги са откликвали, но така и никой не им възложи да изпращат промените, когато има такива, или примерно веднъж на три или дори шест месеца. Това щеше да е повече от достатъчно.
Не отговаря на истината обаче твърдението на г-жа Петкова, че данните, които са показвани досега от Google, са идвали от системата на „Индра“. Те не бяха особено полезни, защото в тях имаше грешки и ги получихме едва след като вече се бяхме преборили с дигитализацията на множество „хартиени данни“, които впрочем също бяха само частично полезни. Единственото улеснение на двата комплекта данни беше, че можехме да ги съпоставим и така да проследим къде се разминават, което помогна да отстраним някакво количество грешки.
Би било чудесно, ако системата на „Индра“ изобщо работеше и имаше как да интегрираме данните от нея за информация в реално време с Google. Това беше в плановете ни за бъдещето, когато градският транспорт на Пловдив евентуално щеше да има адекватна информационна система.
А приложението, което г-жа Петкова съжалява, че не е достатъчно популярно, е ето това. Моля, проследете линка и ще си отговорите сами защо „не е достатъчно популярно“. То работи (слава богу, нещо работи!), но е кошмарно остаряло и е адски неудобно за ползване, особено в движение и от мобилен телефон. Честно, г-жо Петкова, Вие колко пъти сте го ползвала?
И в заключение: искрено се надявам, че колегите от „Тикси“, които правят поредната за Пловдив нова система за управление на градския транспорт, ще имат добрата воля да предоставят отворено API или друг публично достъпен и документиран начин за интеграция с външни системи. Това ще позволи не само нова и по-лесна интеграция с Google Maps (защо не и в реално време този път?), но и създаването на други мобилни приложения и дигитални удобства за Пловдив. Защото ние още продължаваме да живеем в този град и да ни пука за него.
От лятото на 2019 г. в блога ми стои чернова, която така и не публикувах. Идеята ми зад въпросната статия беше да разкажа как се появи разписанието на градския транспорт на Пловдив в Google Maps. Но това сега няма никакво значение, защото от тази седмица там вече няма такива данни.
Съвсем кратка предистория: Преди вече пет години трима приятели предложихме на Община Пловдив да свършим необходимото, за да се появят маршрутите и разписанията на градския транспорт в Google Maps. Напълно безвъзмездно. Речено – сторено. Общината не трябваше да прави нищо друго, освен от време на време да ни уведомява за промените в маршрутите и разписанията, за да поддържаме нещата актуални и коректни. Това обаче не се случи. В началото на 2022 г. се уморихме да се борим с вятърни мелници и преустановихме поддръжката, като маркирахме, че данните не са актуални и няма да се обновяват.
Преди няколко дни човек от екипа на Google Transit (така се нарича услугата, която добавя информация за обществения транспорт в Maps) се свърза с мен да провери защо вече две години не сме актуализирали данните за Пловдив. Отговорих му, че за съжаление, няма как да го направим, тъй като разчитахме да получаваме тези данни от Община Пловдив, но се оказва, че всеки път трябва да им се молим за данните или да си ги събираме, както намерим за добре. Което определено не е начинът, по който трябва да се прави това. Нито може да гарантира нужната прецизност. Колегата от Google сподели, че разбира ситуацията, и ще преценят как да постъпят. След още два дни ми писа, че са взели решение да прекратят услугата за Пловдив.
Днес в Общинския съвет е имало дискусия по темата, провокирана от публикация в „Капитал“. Журналистите от медията писаха и преди година по темата и дори заедно прогнозирахме това развитие, но тишината откъм Община Пловдив си остана все така оглушителна.
Пиша това, защото сегашната ресорна кметица, г-жа Савина Петкова, е казала пред общинските съветници няколко изречения, които от стремеж към акуратност не мога да отмина без коментар. Позовавам се на публикации в регионалната преса, тъй като не съм присъствал лично.
Започвам с нейното твърдение, че градският транспорт на Пловдив има далеч по-важни проблеми, с което няма как да не се съглася. Аз самият съм се питал какви данни се опитваме да събираме и предоставяме на хората, когато ситуацията с обществения транспорт в града е толкова безобразна.
Вярно е и че общината никога не е имала договор с Google Maps. Просто защото няма как да има договор. Google не подписва такива. Платформата предоставя напълно безплатно възможността да визуализира данни за обществен или частен транспорт, ако те са предоставени от достоверен източник и в изисквания от тях формат. Иначе казано, Община Пловдив може сама да обобщава такива данни и да ги изпраща към Google. Това могат да правят и самите транспортни фирми. И има няколко в България, чиито разписания са в Google Maps, включително и БДЖ.
Проблемите тук са два. Първо, Google да се довери, че източникът на данни е достоверен. И второ, тези данни да бъдат в изисквания от тях формат – което не е задача с грандиозна трудност, но не е и тривиално начинание. През 2019 г. се наложи част от информацията да събираме от сканирани PDF-и, MS Word документи с вградени в тях таблици, които всъщност бяха растерни картинки. А данните за маршрутите, по които се движат автобусите, рисувахме точка по точка на ръка, защото „Организация и контрол по транспорта“ (ОКТ) разполагаше с GPS координати на спирките, но не и на пътя, по който автобусите се движат между тези спирки. Имаше още купчина технически засади, за които не подозирахме и в най-песимистичните си очаквания. Но някак ги разрешихме.
Иначе по темата защо Google все пак реши да публикува данни за Пловдив, това стана възможно, след като не общината, а ние, доброволците, се ангажирахме да съберем всичко и да го подредим. За да направим нещо полезно за града и гостите му. И защото ни е грижа за средата, в която живеем.
Община Пловдив потвърди с официално писмо пред Google, че ние ще вършим тази работа с подреждането и преобразуването на данните от нейно име.
За последвалите две години и половина, през които поддържахме данните живи, само веднъж получихме актуализация от общината. След двукратни мои настоявания пред тогавашния ресорен кмет Тодор Чонов, на които и до днес нямам отговор, в крайна сметка просто загубих търпение, обадих се на колегите в ОКТ по телефона и си изпросих нови данни. Те, между другото, винаги са откликвали, но така и никой не им възложи да изпращат промените, когато има такива, или примерно веднъж на три или дори шест месеца. Това щеше да е повече от достатъчно.
Не отговаря на истината обаче твърдението на г-жа Петкова, че данните, които са показвани досега от Google, са идвали от системата на „Индра“. Те не бяха особено полезни, защото в тях имаше грешки и ги получихме едва след като вече се бяхме преборили с дигитализацията на множество „хартиени данни“, които впрочем също бяха само частично полезни. Единственото улеснение на двата комплекта данни беше, че можехме да ги съпоставим и така да проследим къде се разминават, което помогна да отстраним някакво количество грешки.
Би било чудесно, ако системата на „Индра“ изобщо работеше и имаше как да интегрираме данните от нея за информация в реално време с Google. Това беше в плановете ни за бъдещето, когато градският транспорт на Пловдив евентуално щеше да има адекватна информационна система.
А приложението, което г-жа Петкова съжалява, че не е достатъчно популярно, е ето това. Моля, проследете линка и ще си отговорите сами защо „не е достатъчно популярно“. То работи (слава богу, нещо работи!), но е кошмарно остаряло и е адски неудобно за ползване, особено в движение и от мобилен телефон. Честно, г-жо Петкова, Вие колко пъти сте го ползвала?
И в заключение: искрено се надявам, че колегите от „Тикси“, които правят поредната за Пловдив нова система за управление на градския транспорт, ще имат добрата воля да предоставят отворено API или друг публично достъпен и документиран начин за интеграция с външни системи. Това ще позволи не само нова и по-лесна интеграция с Google Maps (защо не и в реално време този път?), но и създаването на други мобилни приложения и дигитални удобства за Пловдив. Защото ние още продължаваме да живеем в този град и да ни пука за него.
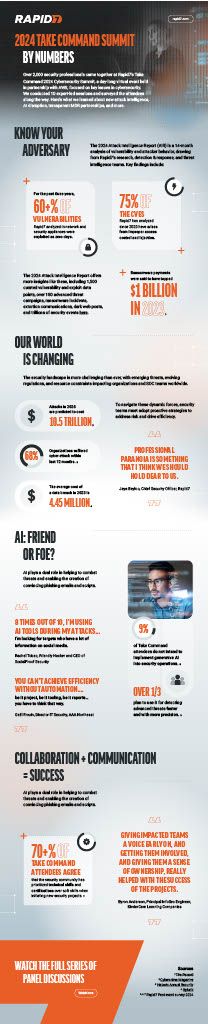
The 2024 Take Command Summit, held virtually in partnership with AWS, united over 2,000 security professionals to delve into critical cybersecurity issues. Our infographic captures the essence of the summit, showcasing expert insights from 10 sessions on topics like new attack intelligence, AI disruptions, and transparent MDR partnerships.
We also highlight attendees’ thoughts on various subject matters, from AI’s role in security to the importance of collaboration and communication. Check out the key highlights, stand out stats, and engaging stories can inform your security strategies and keep your organization ahead of emerging threats.
The Apache Software Foundation (ASF)
has announced
that it will be changing its logo to remove the feather that has been part
of its brand since 1997. ASF members will have input on the rebranding process and be
able to vote on the new logo, which will be unveiled at the Community Over Code conference in October.
The feather is a well-loved and iconic part of the ASF brand. We know of community members who have ASF feather tattoos. People love taking photos with the feather at our flagship event each year.
So why would we change it? As a non-Indigenous entity, we acknowledge that it is inappropriate for the Foundation to use Indigenous themes or language. We thank Natives in Tech and other members of the broader open source community for bringing this issue to the forefront. Today we are announcing we will be retiring the feather icon and logo and replacing it with a new logo that embodies the Foundation’s rich history of providing software for the public good.
There’s a lot that goes into building a user-friendly, robust backup utility. When Backblaze set out to create one back in 2007, our goal was to make sure that users of all skill levels would have automatic, nearly continuous backups that could be restored on command. There were plenty of design decisions to be made, and one of the biggest was whether to implement our client in native code.
You might have seen us talk about this on our website and elsewhere, and we felt it was high time to dive into what that decision meant for our development, how it affected the way the Backblaze client works, and why we think it was an important decision and inflection point for Backblaze Computer Backup and our customers.
What is native code?
Each kind of computer central processing unit (CPU), such as Intel/AMD or Apple Silicon, has its own “machine language,” which is the set of instructions the CPU can understand and follow. These instructions are encoded in binary, and aren’t something people can read or write without great effort. When folks talk about using native code, they’re typically talking about a computer program that’s written in machine language, so a computer’s CPU can “natively” understand what the program needs the CPU to do.
Compiled languages
To use a compiled language, developers write instructions into source code that’s easy for humans to read and edit. Then, they use a program aptly called a compiler to convert the source code into machine language for a particular kind of CPU. Examples of compiled languages are assembly (ASM), C, C++, Rust, Go, Swift, and Haskell.
Interpreted languages
Like with compiled languages, developers write programs in interpreted languages by writing instructions into source code files. But instead of converting those instructions into machine language, another program called an interpreter reads the source code and follows the instructions it contains without converting them to machine language. Common interpreted languages are things like Python, Ruby, BASIC, and PHP.
There is a bit of a slippery slope between a compiled vs. interpreted language. For example, some modern Java implementations mix an interpreter and a compiler. But, the difference when it comes to programming is about picking a language that’s suitable to a task’s requirements.
When and how do you use which type of code language(s)?
Well, pretty much anything anyone does on computers these days will take a combination of code languages. In some ways, the whole challenge of working with computers is bridging how humans communicate vs. how computers can process things.
If you were using a metaphor for the above, a compiled code language would represent someone who was raised to natively speak two languages, and could fluently curse in both languages.
By contrast, interpreted language is like this: You’ve moved to a country where you’re not fluent in the language, but someone needs a thorough dressing-down. An interpreted language would let you write in your native language, take your words and literally translate the idiom you were intending to use—then the computer would take your literal translation, and, executing the program, would be supplied with a dictionary to then give you an effective, similarly meaningful, insult. If you didn’t have your translator, your attempt at offense (in this metaphor, a program!), would likely fail because no one can understand you.
To wit: While they mean similar things, “when pigs fly,” and “quand les poules auront des dents,” do not literally translate.
What are the benefits of using native code in a backup application?
Using native code in a backup application is, in our opinion, better for several reasons.
Permissions
When you’re writing in native code, you’re plugging in your program at a lower level than most applications. That gives you access to the kinds of APIs the native operating system (OS) uses. Because you’re in that level of integration with the operating system, it means that users have to update permissions less frequently, have access to more robust build possibilities for your client, and their backup client can seamlessly run in the background.
Efficiency: Build once, run everywhere
By building our backup client lower in the chain of command, so to speak, it allows us to use the same work for different situations, and there are some interpreted languages that have been built for this purpose, like Java VM. Using those solutions, however, would sacrifice some of the other benefits we’re outlining in this article.
Being fully in control of our common code, we can do this without interpreted language and still have the other advantages listed here. So, we can use the same base code for both our Mac and Windows clients, but then add modifications to the code on top of each to refine the clients. There may be slight differences between the operating system (OS) environments, but coding at the level of a compiled language like C++ means that we can adjust for those differences effectively.
Performance
Running native code typically results in better performance. That’s because there are fewer steps (for your computer) between understanding a program and running a program.
Backup programs run all the time in the background, and have to keep track of a lot of information. Backblaze’s native code does that using half to a tenth of the computing resources that a backup program written in an interpreted language would use. So, Backblaze won’t slow down or interrupt the other activities you’re doing with your computer.
Reducing software bloat and size of software
Also, since you don’t have to install interpreters (you know, your insult dictionary), native code applications are usually leaner and more performant on the system.
Eliminating risky third-party dependencies
Since they’re software, computer language interpreters have bugs and get new features, so they’re frequently updated. Sometimes an updated interpreter won’t run programs written for an older version of the language, or will cause a program to behave differently in an unexpected (read: “buggy”) way. Also, vendors have even changed licensing terms and started charging money for interpreters that had been free. Backblaze’s native code doesn’t have those problems.
Platform-standard user interface
Operating system vendors like Microsoft and Apple strongly encourage developers to write programs that use a platform-standard user interface “look-and-feel.” Programs that do that help users feel comfortable, minimize surprises, and support accessibility features like text-to-speech.
The most effective way to ensure a program’s user interface matches a platform’s standard look-and-feel is to use features built into the operating system, and those are typically only available to native code like Backblaze’s client.
What are the challenges of using native code in a backup application?
Nothing is perfect. What are the downsides to this approach?
Industry preference moving towards interpreted language/web apps
Has anyone else noticed that the world of development has changed recently? (No need to qualify that statement—it will be true tomorrow, tomorrow, and tomorrow again.)
As with any industry, tech’s (and developers’) favorite strategies for creating things and solving problems have changed over time.
There are various players in this space, including platforms (Mac, Windows, Linux), software (Adobe, Office), applications (Slack, the latest mobile game, your headphone utility client), and frankly, many things that skirt the boundaries of the above buckets. Executing any program, and particularly third-party applications, is a negotiation between operating systems’ publishers and the program/application’s developers.
Over time, those who sell computers and manage OSes have grown to prefer the lightweight development of application ecosystems. It lets them have more control over their platforms, and it gives developers a shorter time to deployment—as long as they play within the sandbox the OS has made available. OS publishers are attempting to anticipate the needs of program and app developers, but there are some types of utilities—and backup is one of them—that justifiably break standard rules. Giving access to all your files by default, for example, isn’t something you’d do for a social media application. However, in order to get a full and complete backup, a program does justifiably require that level of access.
Limited dev libraries
Given the preference of developers to move to web applications and interpreted languages (for good reason in some cases), many OSes are releasing less detailed support and/or technical documentation for some of their deeper-level tools. If you’re implementing in native code in today’s environment, you need both historical knowledge and ingenuity in house. Which leads us to our next point…
Expertise
We’re on board with the evolution of development—innovation is at the heart of our company—but for aspects of our backup client, we need developers with a deep understanding of compiled code languages and our supported ecosystems. And luckily, in any sufficiently large tech company, you’ll find folks specializing in different code languages and parts of the tech stack. That means we can spend more time nurturing and developing our internal talent rather than seeking it externally.
Hybrid approaches?
Hey, we’ve spent a whole article telling you why native code matters. But, many folks agree that the future requires a hybrid approach, largely because of that gray area between compiled and interpreted languages we mentioned above. You can certainly see that in our style as well—our Mac client uses a combination of Objective C, SwiftUI and C++, for example.
The now and future Backblaze
The core functionality of our client depends on native code for very good design reasons, and they’re ultimately all about making things easier for our end users.
Overall, our design ideas are all centered on what it means to use Backblaze every day, regardless of an end user’s skill level. We want things to be simpler, and sometimes the questions we need to answer (how do I make sure the Backblaze client backs everything up?) are actually a tad more complicated upfront (the Backblaze client needs system permissions—and that means implementing it in native code), in that they require forethought and an investment of time and resources. But, we also prioritize the kind of thinking we can use over and over—so, even if we spend a little more time building native code, it’s an investment that has longevity. Put another way: Build once, run everywhere.
To provide the best experiences, we use technologies like cookies to store and/or access device information. Consenting to these technologies will allow us to process data such as browsing behavior or unique IDs on this site. Not consenting or withdrawing consent, may adversely affect certain features and functions.
Functional
Always active
The technical storage or access is strictly necessary for the legitimate purpose of enabling the use of a specific service explicitly requested by the subscriber or user, or for the sole purpose of carrying out the transmission of a communication over an electronic communications network.
Preferences
The technical storage or access is necessary for the legitimate purpose of storing preferences that are not requested by the subscriber or user.
Statistics
The technical storage or access that is used exclusively for statistical purposes.The technical storage or access that is used exclusively for anonymous statistical purposes. Without a subpoena, voluntary compliance on the part of your Internet Service Provider, or additional records from a third party, information stored or retrieved for this purpose alone cannot usually be used to identify you.
Marketing
The technical storage or access is required to create user profiles to send advertising, or to track the user on a website or across several websites for similar marketing purposes.


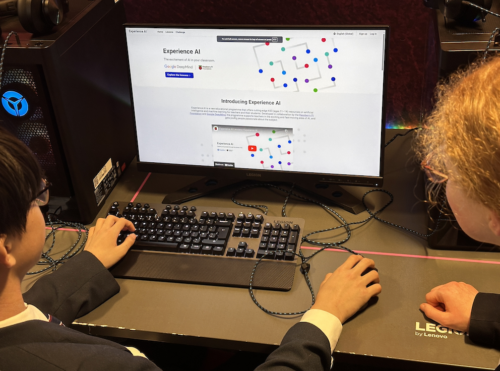
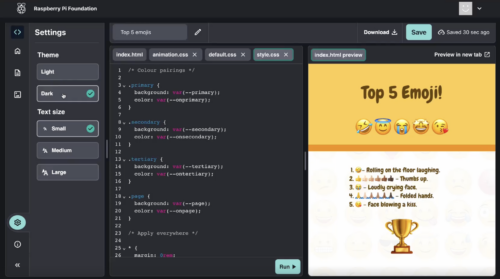


 Aswath Srinivasan is a Senior Search Engine Architect at Amazon Web Services currently based in Munich, Germany. With over 17 years of experience in various search technologies, Aswath currently focuses on OpenSearch. He is a search and open-source enthusiast and helps customers and the search community with their search problems.
 Jon Handler is a Senior Principal Solutions Architect at Amazon Web Services based in Palo Alto, CA. Jon works closely with OpenSearch and Amazon OpenSearch Service, providing help and guidance to a broad range of customers who have search and log analytics workloads that they want to move to the AWS Cloud. Prior to joining AWS, Jon’s career as a software developer included 4 years of coding a large-scale, ecommerce search engine. Jon holds a Bachelor of the Arts from the University of Pennsylvania, and a Master of Science and a PhD in Computer Science and Artificial Intelligence from Northwestern University.
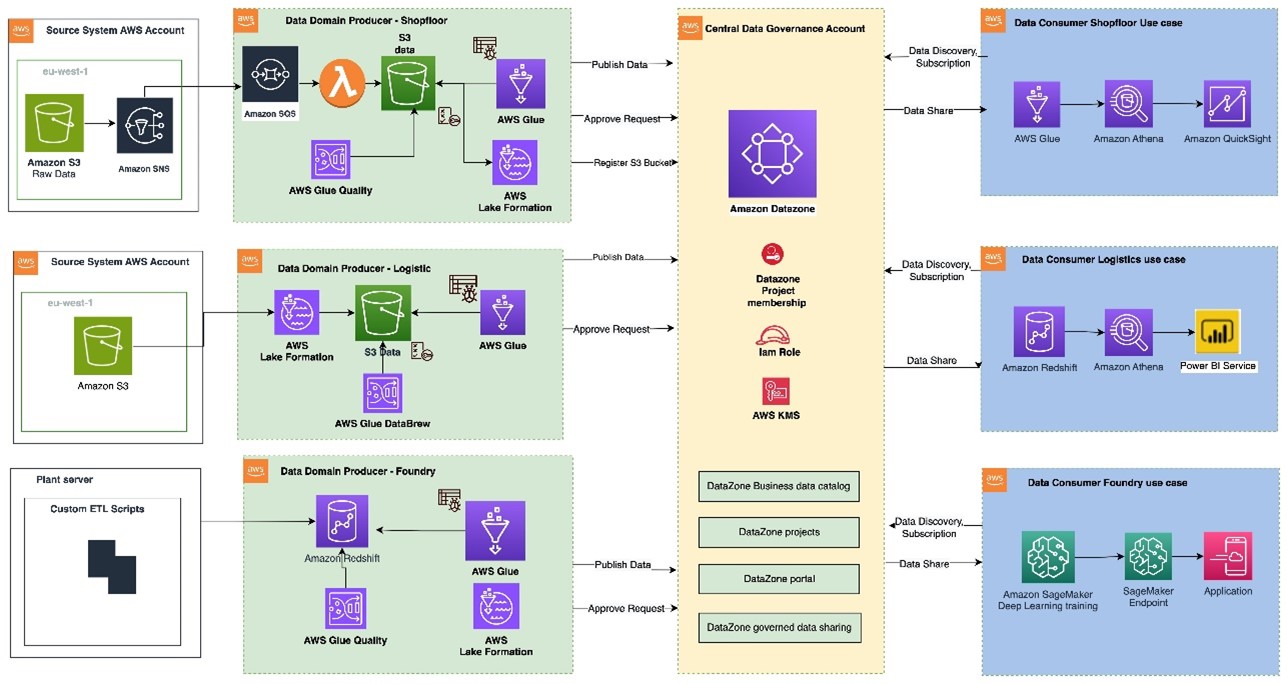
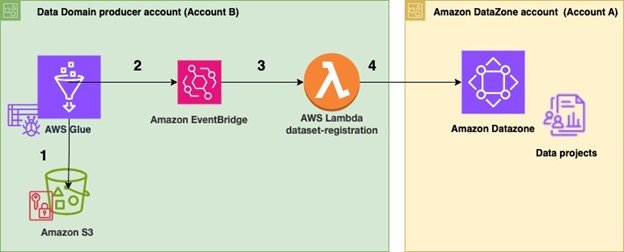
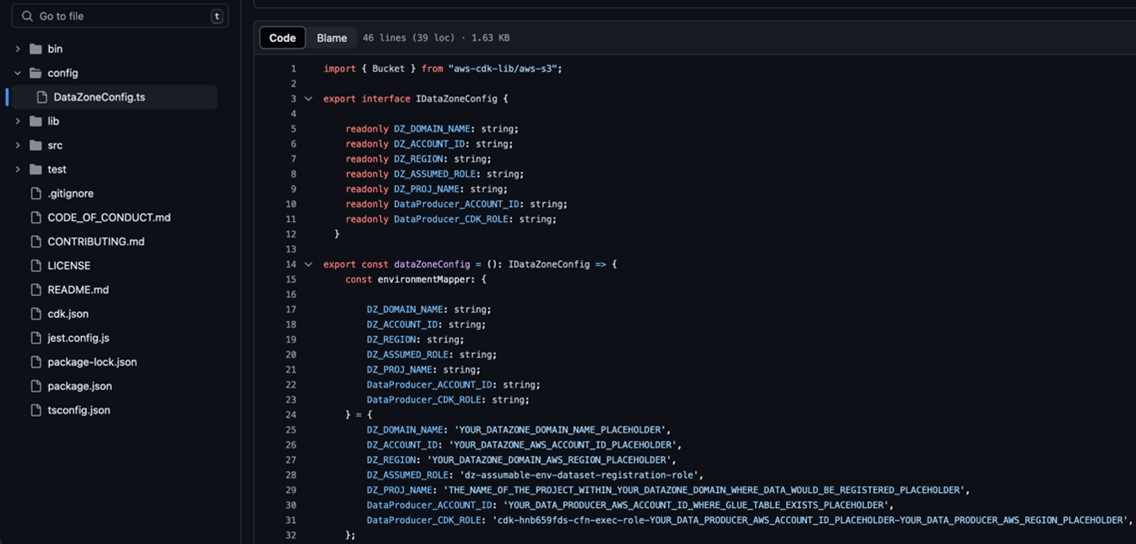
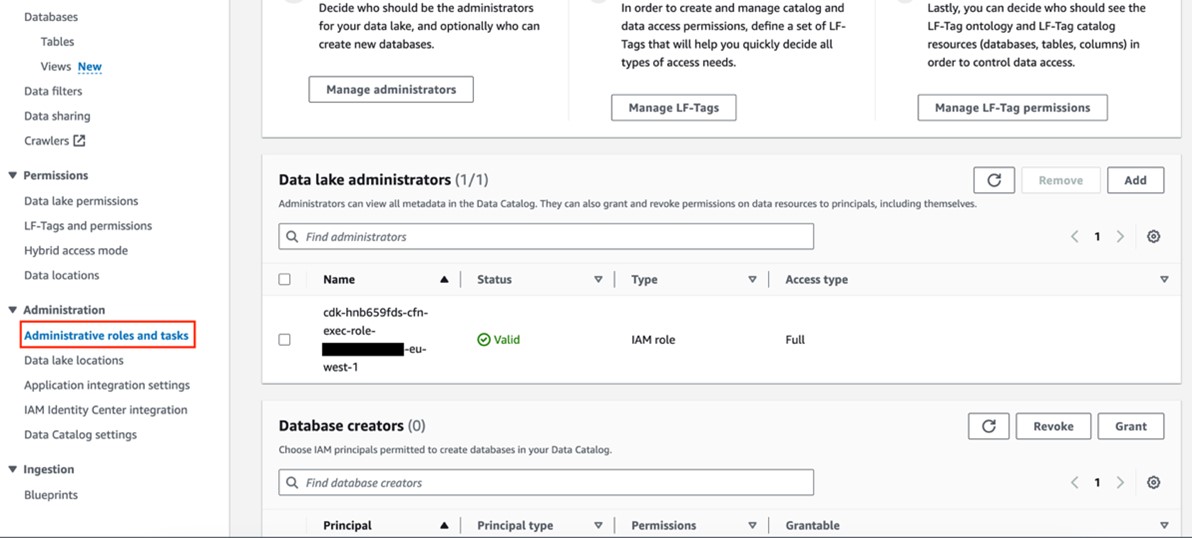
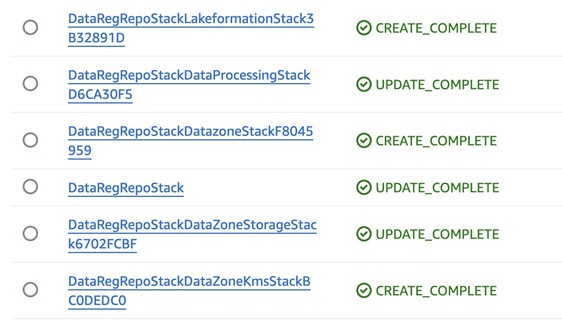
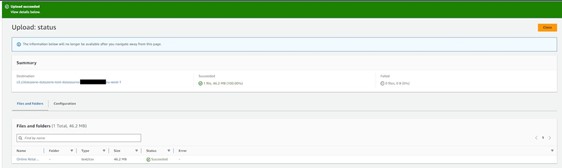


 Bandana Das is a Senior Data Architect at Amazon Web Services and specializes in data and analytics. She builds event-driven data architectures to support customers in data management and data-driven decision-making. She is also passionate about enabling customers on their data management journey to the cloud.
 Anirban Saha is a DevOps Architect at AWS, specializing in architecting and implementation of solutions for customer challenges in the automotive domain. He is passionate about well-architected infrastructures, automation, data-driven solutions and helping make the customer’s cloud journey as seamless as possible. Personally, he likes to keep himself engaged with reading, painting, language learning and traveling.
 Chandana Keswarkar is a Senior Solutions Architect at AWS, who specializes in guiding automotive customers through their digital transformation journeys by using cloud technology. She helps organizations develop and refine their platform and product architectures and make well-informed design decisions. In her free time, she enjoys traveling, reading, and practicing yoga.
 Sindi Cali is a ProServe Associate Consultant with AWS Professional Services. She supports customers in building data driven applications in AWS.