Post Syndicated from Explosm.net original https://explosm.net/comics/the-dillbert-rises
New Cyanide and Happiness Comic
Post Syndicated from Explosm.net original https://explosm.net/comics/the-dillbert-rises
New Cyanide and Happiness Comic
Post Syndicated from Sankar Sundaram original https://aws.amazon.com/blogs/big-data/build-incremental-data-pipelines-to-load-transactional-data-changes-using-aws-dms-delta-2-0-and-amazon-emr-serverless/
Building data lakes from continuously changing transactional data of databases and keeping data lakes up to date is a complex task and can be an operational challenge. A solution to this problem is to use AWS Database Migration Service (AWS DMS) for migrating historical and real-time transactional data into the data lake. You can then apply transformations and store data in Delta format for managing inserts, updates, and deletes.
Amazon EMR Serverless is a serverless option in Amazon EMR that makes it easy for data analysts and engineers to run open-source big data analytics frameworks without configuring, managing, and scaling clusters or servers. EMR Serverless automatically provisions and scales the compute and memory resources required by your applications, and you only pay for the resources that the applications use. EMR Serverless also provides you with more flexibility on overriding default Spark configurations, customizing EMR Serverless images, and customizing Spark driver and executor sizes to better suit specific workloads.
This post demonstrates how to implement a solution that uses AWS DMS to stream ongoing replication or change data capture (CDC) from an Amazon Aurora PostgreSQL-Compatible Edition database into Amazon Simple Storage Service (Amazon S3). We then apply transformations using Spark jobs on an EMR Serverless application and write transformed output into open-source Delta tables in Amazon S3. The Delta tables created by the EMR Serverless application are exposed through the AWS Glue Data Catalog and can be queried through Amazon Athena. Although this post uses an Aurora PostgreSQL database hosted on AWS as the data source, the solution can be extended to ingest data from any of the AWS DMS supported databases hosted on your data centers.
The following diagram shows the overall architecture of the solution that we implement in this post.

The solution consists of the following steps for implementing a full and incremental (CDC) data ingestion from a relational database:
The architecture has the following major features:
The following steps are performed to implement this solution:
We use a CloudFormation template to provision the AWS resources required for the solution. The CloudFormation template requires you to select an EC2 key pair. This key is configured on an EC2 instance that lives in the public subnet. We use this EC2 instance to connect to the Aurora PostgreSQL instance that lives in the private subnet. Make sure you have a key in the Region where you deploy the template. If you don’t have one, you can create a new key pair.
To walk through this post, we use Delta Lake version > 2.0.0, which is supported in Apache Spark 3.2.x. Choose the Delta Lake version compatible with your Spark version by visiting the Delta Lake releases page. We use an EMR Serverless application with version emr-6.9.0, which supports Spark version 3.3.0.
To provision the resources needed for the solution, complete the following steps:

emr-serverless-deltalake-blog.After the CloudFormation template is complete and the resources are created, the Outputs tab shows the information shown in the following screenshot.

The CloudFormation template creates all the resources needed for the solution workflow:
You can find the PySpark script in the raw S3 bucket on the Amazon S3 console as shown in the following screenshot. The bucket will have the naming structure <CloudFormation template name>-rawS3bucket-<random string>. Make a note of the S3 path to the emr_delta_cdc.py script; you need this information while submitting the Spark job via the EMR Serverless application.

The preceding task for creating the resources via CloudFormation assumes that AWS Lake Formation is not enabled in the Region (which we enable later in this post). If you already have Lake Formation enabled in the Region, make sure the IAM user or role used in the CloudFormation template has the necessary permissions to create a database in the AWS Glue Data Catalog.
Connect to the Aurora PostgreSQL endpoint using your preferred client. For this post, we use the PSQL command line tool. Note that the IP address of the client machine from which you’re connecting to the database must be updated in the Aurora PostgreSQL security group. This is done by the CloudFormation template based on the input parameter value for ClientIPCIDR. If you’re accessing the database from another machine, update the security group accordingly.


In this section, we walk through the steps to set up a data pipeline that loads data from Amazon Aurora PostgreSQL-Compatible Edition into Delta tables on Amazon S3 and then query the data using Athena.
To perform the full table load, complete the following steps:
emrdelta-postgres-s3-migration).The task starts the full load and ongoing replication of data from the source database to Amazon S3.

You can validate that the data has been migrated successfully checking the Load state column for the AWS DMS task.

<CloudFormation template name>-rawS3bucket-<random string>.delta_emr_source/travel_details in the raw S3 bucket. You can verify the S3 folder has Parquet data populated from the AWS DMS task.
We use EMR Studio to manage and submit jobs in an EMR Serverless application.
emr-delta-blog.

emr_delta_blog and then choose Start application. You can verify that the EMR application has started successfully on the Amazon EMR console, as shown in the following screenshot.
The application will move to Stopped status after a period of inactivity. When you submit the job to the application, it will start again and start the job. This provides cost savings because the jobs are run on demand as opposed to maintaining a running EMR cluster.
 Create a new job in the Job details page
emr-delta-load-job.emrserverless-execution-role.emr_delta_cdc.py is uploaded.["I","delta_emr_source","9999-12-31-01","travel_details","route_id"]. The script arguments provide the following details to the EMR Serverless application:
With arguments, you can group a set of tables and submit the job to an EMR Serverless application. You can provide multiple table names separated by semicolons and enter the partition keys for those tables also separated by semicolon. If a particular table doesn’t have a partition key, simply enter a semicolon alone. The number of semicolon-separated values should match the table and partition key arguments for the script to run successfully.
Also, if you want to capture additional tables as part of an existing EMR Serverless job, you need to create a new EMR Serverless job to capture full load separately (set the first argument as I along with the new table names) and then change the argument list of the existing EMR Serverless job to add those new tables to capture incremental data load going forward.
EMR Serverless version 6.9.0 comes pre-installed with Delta version 2.1.0. Refer to About Amazon EMR Releases for more details about pre-installed libraries and applications for a specific Amazon EMR release. Before this, we have to upload the Delta JAR files to an S3 bucket in your account and provide the JAR file path in the application configurations using the spark.jars option. In this walkthrough, we create an EMR Serverless 6.9.0 application and use the pre-installed Delta jars from Amazon EMR.
If you want to use a different version of Delta JAR files, you can replace the S3 path of the JAR files in these configuration options.


You can now use the Spark History Server UI to navigate to various tabs and analyze the job run in a detailed manner. For Spark error and output logs, you can navigate to the Executors tab and explore the driver or executor logs as required. This can help you to debug the job in case of failures by looking at the Spark logs.You can also choose Spark UI (Running jobs) to track the progress of the EMR Serverless Spark jobs while they are running.

The data load script is the same for initial and incremental data load because it can handle both the workflows through script arguments:
We can optionally monitor the EMR Serverless application using CloudWatch dashboards by installing the CloudFormation template from the EMR Serverless CloudWatch Dashboard GitHub repository.Follow the instructions on the Getting started section on the GitHub repository and deploy the CloudFormation template in your account.
You need to provide the EMR Serverless application ID as a parameter while deploying the CloudFormation stack, which can be obtained on the EMR Studio Applications page as shown in the following screenshot.

After the CloudFormation template is successfully deployed, navigate to the CloudWatch console to see a custom dashboard created for the EMR Serverless application ID that was provided to the CloudFormation template.

Choose the dashboard to see the different metrics for the EMR Serverless application in a single dashboard view.
You can see the available workers (one driver and two executors that were pre-initialized in the default configuration) and also the spike under successful job count that indicates the initial data load job that was completed successfully.

You could also monitor the CPU, memory, and storage allocated for the application, driver, and executor nodes separately.
The following image shows application metrics for three workers with 12 vCPUs (both driver and executor initialized with 4 vCPUs) and also the memory and storage usage. You can monitor the metrics from this dashboard and pre-initialize your application capacity that suits your specific workloads.

We can see the number of executors that were utilized for this job execution from the executor metrics section within the CloudWatch dashboard. We have used two executors and a driver for running this job.

Previously, Delta tables were accessed through Athena by generating the manifest files (which maintain the list of data files to read for querying a Delta table). With the newly launched support in Athena for reading native Delta tables, it’s no longer required to generate and update manifest files. The Athena SQL engine version 3 can directly query native Delta tables. If you’re using an older engine version, change the engine version.
Navigate to the Athena console and start querying the data. Run a SELECT query and fetch the first 10 records to verify the data:

The table (native Delta table) has been created and updated to the AWS Glue Data Catalog from the EMR Serverless application code. You can successfully query and explore the data through Athena or Spark applications, but the schema definitions for individual columns aren’t updated in Data Catalog with this approach.
The following screenshot shows the Delta table created through code has a single array column. Athena supports reading native Delta tables and therefore we can read the data successfully even though the Data Catalog shows only a single array column.

If you need the individual column-level metadata to be available in the Data Catalog, run an AWS Glue crawler periodically to keep the AWS Glue metadata updated. For more information, refer to Introducing native Delta Lake table support with AWS Glue crawlers.
In this section, we walk through the steps to run the data pipeline.
update delta_emr_source.travel_details set destination='Tucson' where destination='Miami';
call delta_emr_source.insert_records(200);
delete from delta_emr_source.travel_details where destination='Los Angeles';


You can also verify in the S3 raw bucket location that the files are created under hourly partitioned folders.

After the AWS DMS task has successfully loaded the incremental data, submit the Spark job on the EMR Serverless application to load the incremental data (CDC) with the following script arguments:
The partition path given here as 2022-10-25-21 should be changed as applicable in your use case. We use an example use case where the EMR Serverless job runs every hour, and the input data folder is partitioned on an hourly basis from AWS DMS. You can choose an appropriate partitioning strategy on the S3 raw bucket for your use case.

_delta_log folder, capturing the changes from the current run. Query the Delta tables through Athena to validate the merged data
Go to the Athena console to query the data and validate count to ensure that the table contains the most recent data:

If you also want to query this data from Amazon Redshift, you can create external tables in Redshift Spectrum for Delta tables. For more information, refer to Creating external tables for data managed in Delta Lake. Redshift Spectrum currently supports querying Delta tables through the manifest file option. A Delta table manifest contains a list of files that make up a consistent snapshot of the Delta table. The code snippet given in this post updates the manifest files every time new data is loaded in the Delta tables to ensure only the latest data is read from the Delta tables.
To avoid incurring ongoing charges, clean up your infrastructure by deleting the stack from the AWS CloudFormation console. Delete the EMR Serverless application and any other resources you created during this exercise.
In this post, we demonstrated how to create a transactional data lake with Delta table format using EMR Serverless and AWS DMS. With the flexibility provided by EMR Serverless, you can use the latest version of open-source Delta framework on EMR Serverless (with the latest version of Spark) in order to support a wider range of transactional data lake needs based on various use cases.
Now you can build a transactional data lake for your organization with Delta table format and access data using Athena and Redshift Spectrum for various analytical workloads. You could use this high-level architecture for any other use cases where you need to use the latest version of Spark on EMR Serverless.
 Sankar Sundaram is a Data Lab Architect at AWS, where he helps customers build and modernize data architectures and help them build secure, scalable, and performant data lake, database, and data warehouse solutions.
 Monjumi Sarma is a Data Lab Solutions Architect at AWS. She helps customers architect data analytics solutions, which gives them an accelerated path towards modernization initiatives.
Post Syndicated from Parag Doshi original https://aws.amazon.com/blogs/big-data/how-tricentis-unlocks-insights-across-the-software-development-lifecycle-at-speed-and-scale-using-amazon-redshift/
This is a guest post co-written with Parag Doshi, Guru Havanur, and Simon Guindon from Tricentis.
Tricentis is the global leader in continuous testing for DevOps, cloud, and enterprise applications. It has been well published since the State of DevOps 2019 DORA Metrics were published that with DevOps, companies can deploy software 208 times more often and 106 times faster, recover from incidents 2,604 times faster, and release 7 times fewer defects. Speed changes everything, and continuous testing across the entire CI/CD lifecycle is the key. However, speed is only realized when you have the confidence to release software on demand. Tricentis instills that confidence by providing software tools that enable Agile Continuous Testing (ACT) at scale. Whether exploratory or automated, functional or performance, API or UI, targeting mainframes, custom applications, packaged applications, or cloud-native applications, Tricentis provides a comprehensive suite of specialized continuous testing tools that help its customers achieve the confidence to release on demand.
The next phase of Tricentis’ journey is to unlock insights across all testing tools. Teams may struggle to have a unified view of software quality due to siloed testing across many disparate tools. For users that require a unified view of software quality, this is unacceptable. In this post, we share how the AWS Data Lab helped Tricentis to improve their software as a service (SaaS) Tricentis Analytics platform with insights powered by Amazon Redshift.
Tricentis provides SaaS and on-premises solutions to thousands of customers globally. Every change to software worth testing is tracked in test management tools such as Tricentis qTest, test automation tools such as Tosca or Testim, or performance testing tools such as Neoload. Although Tricentis has amassed such data over a decade, the data remains untapped for valuable insights. Each of these tools has its own reporting capabilities that make it difficult to combine the data for integrated and actionable business insights.
Additionally, the scale is significant because the multi-tenant data sources provide a continuous stream of testing activity, and our users require quick data refreshes as well as historical context for up to a decade due to compliance and regulatory demands.
Finally, data integrity is of paramount importance. Every event in the data source can be relevant, and our customers don’t tolerate data loss, poor data quality, or discrepancies between the source and Tricentis Analytics. While aggregating, summarizing, and aligning to a common information model, all transformations must not affect the integrity of data from its source.
Tricentis Analytics aims to address the challenges of high volume, near-real-time, and visually appealing reporting and analytics across the entire Tricentis product portfolio.
The initial customer objectives were:
Considering the multi-tenant data source, Tricentis and the AWS Data Lab team engineered for the following constraints:
Knowing that data will be unified across many sources deployed in any environment, the architecture called for an enterprise-grade analytics platform. The data pipeline consists of multiple layers:
Some customers will access the repository directly via an API with the proper guardrails for stability to combine their test data with other data sources in their enterprise, while other customers will use dashboards to gain insights on testing. Initially, Tricentis defines these dashboards and charts to enable insight on test runs, test traceability with requirements, and many other pre-defined use cases that can be valuable to customers. In the future, more capabilities will be provided to end-users to come up with their own analytics and insights.
Given the challenge of Tricentis Analytics with live customers in 6 weeks, Tricentis partnered with the AWS Data Lab. From detailed design to a beta release, Tricentis had customers expecting to consume data from a data lake specific to only their data, and all of the data that had been generated for over a decade. Customers also required their own repository, an Apache Parquet data lake, which would combine with other data in the customer environment to gather even greater insights.
The AWS account team proposed the AWS Data Lab Build Lab session to help Tricentis accelerate the process of designing and building their prototype. The Build Lab is a two-to-five-day intensive build by a team of customer builders with guidance from an AWS Data Lab Solutions Architect. During the Build Lab, the customer will construct a prototype in their environment, using their data, with guidance on real-world architectural patterns and anti-patterns, as well as strategies for building effective solutions, from AWS service experts. Including the pre-lab preparation work, the total engagement duration is 3–6 weeks and in the Tricentis case was 3 weeks: two for the pre-lab preparation work and one for the lab. The weeks that followed the lab included go-to-market activities with specific customers, documentation, hardening, security reviews, performance testing, data integrity testing, and automation activities.
The 2 weeks before the lab were used for the following:
For this solution, Tricentis and AWS built a data pipeline that consumes data from streaming, which was in place before the lab, and this streaming has the database transactions captured through CDC. In the streaming, the data from each table is separated by topic, and data from all the customers comes on the same topic (no isolation). Because of that, a pipeline was created to separate customers to create their tables isolated by the schema on the final destination at Amazon Redshift. The following diagram illustrates the solution architecture.
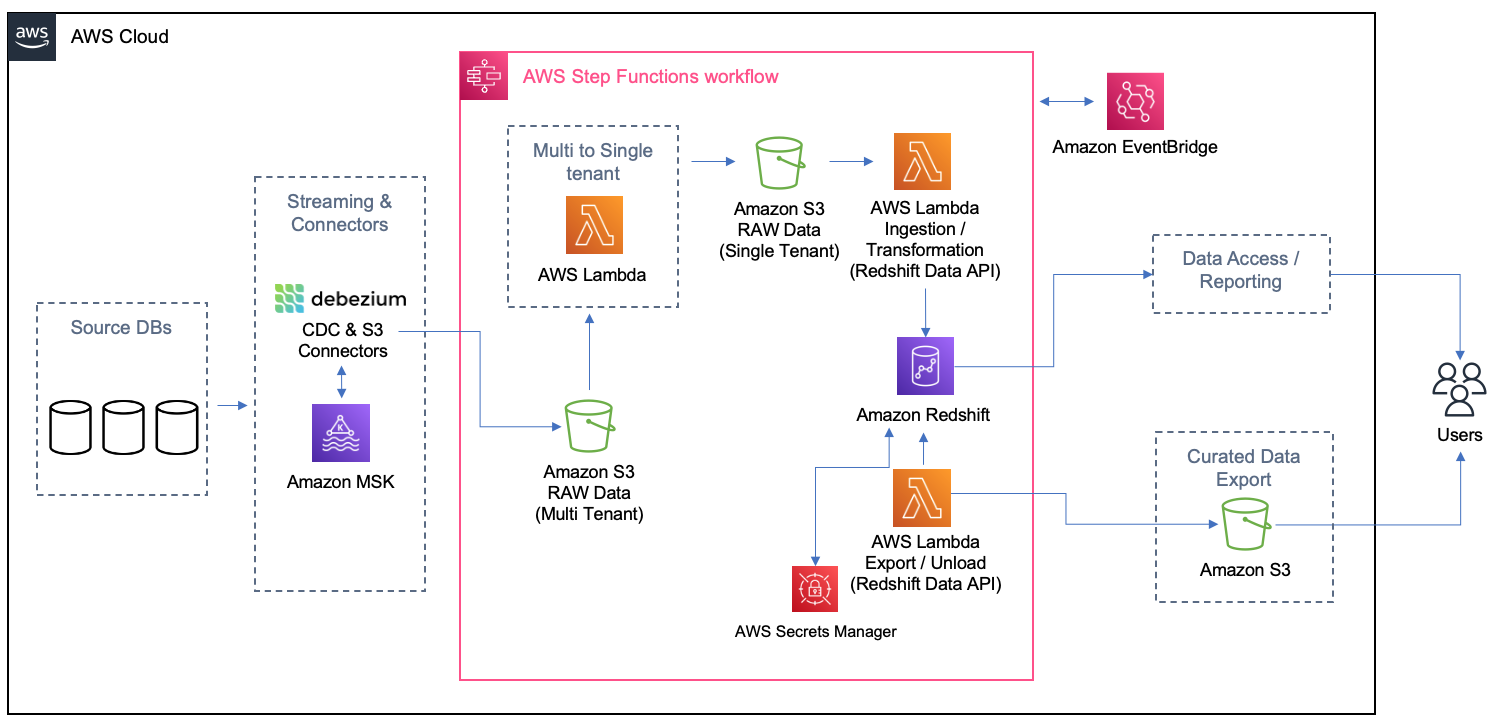
The main idea of this architecture is to be event-driven with eventual consistency. Any time new test cases or test results are created or modified, events trigger such that processing is immediate and new snapshot files are available via an API or data is pulled at the refresh frequency of the reporting or business intelligence (BI) tool. Every time the Amazon Simple Storage Service (Amazon S3) sink connector from Apache Kafka delivers a file on Amazon S3, Amazon EventBridge triggers an AWS Lambda function to transform the multi-tenant file into separated files, one per customer per table, and land it on specific folders on Amazon S3. As the files are created, another process is triggered to load the data from each customer on their schema or table on Amazon Redshift. On Amazon Redshift, materialized views were used to get the queries for the dashboards ready and easier to be returned to the Apache Superset. Also, the materialized views were configured to refresh automatically (with the autorefresh option), so Amazon Redshift updates the data automatically in the materialized views as soon as possible after base tables changes.
In the following sections, we detail specific implementation challenges and additional features required by customers discovered along the way.
As stated earlier, some customers want to get an export of their test data and create their data lake. For these customers, Tricentis provides incremental data as Apache Parquet files and will have the ability to filter on specific projects and specific date ranges. To ensure data integrity, Tricentis uses its technology known as Tosca DI (not part of the AWS Data Lab session).
The solution uses the following data security guardrails:
Tricentis’s objective is to pay for the compute and storage used and grow analytics infrastructure with linear cost scalability. To better manage storage costs in the data plane, Tricentis stores all raw and intermediate data in Amazon S3 storage in a compressed format. The Amazon MSK and Amazon Redshift is right-sized for Tricentis Analytics load and is allowed to scale up or down with no downtime based on future business needs. Data on all the stores, including Amazon MSK, Amazon Redshift, and Amazon S3, is subjected to tiered storage and retention policies per the customer data retention and archival requirements to reduce the cost further and provide linear cost scalability.
In the control plane, Debezium and Kafka Connect resources are turned on and off, so you only pay for what you use. Lambda triggers are triggered on an event or a schedule and turned off after completing tasks.
High data integrity is a fundamental design principle of Tricentis Analytics. Fortunately, Tricentis has a product called ToscaDI, which is used to automate the measurement of data integrity across many different data sources. The main idea is to use the machine-generated data type and log sequence number (LSN) to reflect the latest snapshot data from the change data capture (CDC) streams. Tricentis reached the data integrity automation milestone outside of the AWS Data Lab window by automatically triggering Tosca DI at various stages of the AWS serverless architecture (illustrated earlier), and because of that Tricentis was able to ensure expected record counts at every step, preventing data loss or inadvertent data manipulation. In future versions, Tricentis will have much deeper data integrity verification record counts and incorporate specific fields to ensure data quality (for example, nullness) and semantic or format validation. To date, the combination of CDC and data cleansing has resulted in ultra-high data integrity when comparing source data to the final Parquet file contents.
Performance was tuned for maximum throughput at three stages in the pipeline:
Tricentis worked within the default limit of 1,000 concurrent Lambda function runs by keeping track of available functions at any given time and firing only those many functions for which slots are available. For the 10 GB memory limit per function, Tricentis right-sized the Amazon S3 sink connector generated files and single-tenant S3 files to not exceed 4 GB in size. The Lambda function throttling can be prevented by requesting a higher limit of concurrent runs if that becomes necessary later.
Tricentis also experienced some Amazon Redshift connection limitations. Amazon Redshift has quotas and adjustable quotas that limit the use of server resources. To effectively manage Amazon Redshift limits of maximum connections, Tricentis used connection pools to ensure optimal consumption and stability.
The collaborative approach between Tricentis and the AWS Data Lab allowed considerable acceleration and the ability to meet timelines for establishing a big data solution that will benefit Tricentis customers for years. Since this writing, customer onboarding, observability and alerting, and security scanning were automated as part of a DevSecOps pipeline.
Within 6 weeks, the team was able to beta a data export service for one of Tricentis’ customers.
In the future, Tricentis anticipates adding multiple data sources, unify towards a common, ubiquitous language for testing data, and deliver richer insights so that our customers can have the correct data in a single view and increase confidence in their delivery of software at scale and speed.
In this post, we walked you through the journey the Tricentis team took with the AWS Data Lab during their participation in a Build Lab session. During the session, the Tricentis team and AWS Data Lab worked together to identify a best-fit architecture for their use cases and implement a prototype for delivering new insights for their customers.
To learn more about how the AWS Data Lab can help you turn your ideas into solutions, visit AWS Data Lab.
 Parag Doshi is Vice President of Engineering at Tricentis, where he continues to lead towards the vision of Innovation at the Speed of Imagination. He brings innovation to market by building world-class quality engineering SaaS such as qTest, the flagship test management product, and a new capability called Tricentis Analytics, which unlocks software development lifecycle insights across all types of testing. Prior to Tricentis, Parag was the founder of Anthem’s Cloud Platform Services, where he drove a hybrid cloud and DevSecOps capability and migrated 100 mission-critical applications. He enabled Anthem to build a new pharmacy benefits management business in AWS, resulting in $800 million in total operating gain for Anthem in 2020 per Forbes and CNBC. He also held posts at Hewlett-Packard, having multiple roles including Chief Technologist and head of architecture for DXC’s Virtual Private Cloud, and CTO for HP’s Application Services in the Americas region.
 Guru Havanur serves as a Principal, Big Data Engineering and Analytics team in Tricentis. Guru is responsible for data, analytics, development, integration with other products, security, and compliance activities. He strives to work with other Tricentis products and customers to improve data sharing, data quality, data integrity, and data compliance through the modern big data platform. With over 20 years of experience in data warehousing, a variety of databases, integration, architecture, and management, he thrives for excellence.
 Simon Guindon is an Architect at Tricentis. He has expertise in large-scale distributed systems and database consistency models, and works with teams in Tricentis around the world on scalability and high availability. You can follow his Twitter @simongui.
 Ricardo Serafim is a Senior AWS Data Lab Solutions Architect. With a focus on data pipelines, data lakes, and data warehouses, Ricardo helps customers create an end-to-end architecture and test an MVP as part of their path to production. Outside of work, Ricardo loves to travel with his family and watch soccer games, mainly from the “Timão” Sport Club Corinthians Paulista.
Post Syndicated from Peter Liu original https://www.servethehome.com/asrock-rack-w680d4u-2l2t-g5-motherboard-review-an-intel-core-server-platform/
In our ASRock Rack W680D4U-2L2T/G5 review, we see how this Intel W680-based 10GbE server platform lets Intel Core CPUs use ECC DDR5 in servers
The post ASRock Rack W680D4U-2L2T/G5 Motherboard Review An Intel Core Server Platform appeared first on ServeTheHome.
Post Syndicated from Talks at Google original https://www.youtube.com/watch?v=UdNE3QRFzkM
Post Syndicated from Bruce Schneier original https://www.schneier.com/blog/archives/2023/03/nick-weaver-on-regulating-cryptocurrency.html
Nicholas Weaver wrote an excellent paper on the problems of cryptocurrencies and the need to regulate the space—with all existing regulations. His conclusion:
Regulators, especially regulators in the United States, often fear accusations of stifling innovation. As such, the cryptocurrency space has grown over the past decade with very little regulatory oversight.
But fortunately for regulators, there is no actual innovation to stifle. Cryptocurrencies cannot revolutionize payments or finance, as the basic nature of all cryptocurrencies render them fundamentally unsuitable to revolutionize our financial system—which, by the way, already has decades of successful experience with digital payments and electronic money. The supposedly “decentralized” and “trustless” cryptocurrency systems, both technically and socially, fail to provide meaningful benefits to society—and indeed, necessarily also fail in their foundational claims of decentralization and trustlessness.
When regulating cryptocurrencies, the best starting point is history. Regulating various tokens is best done through the existing securities law framework, an area where the US has a near century of well-established law. It starts with regulating the issuance of new cryptocurrency tokens and related securities. This should substantially reduce the number of fraudulent offerings.
Similarly, active regulation of the cryptocurrency exchanges should offer substantial benefits, including eliminating significant consumer risk, blocking key money-laundering channels, and overall producing a far more regulated and far less manipulated market.
Finally, the stablecoins need basic regulation as money transmitters. Unless action is taken they risk becoming substantial conduits for money laundering, but requiring them to treat all users as customers should prevent this risk from developing further.
Read the whole thing.
Post Syndicated from original https://lwn.net/Articles/924577/
On March 7, 2003, a struggling company called The SCO Group filed a lawsuit against IBM, claiming that the
success of Linux was the result of a theft of SCO’s technology. Two
decades later, it is easy to look back on that incident as a somewhat
humorous side-story in the development of Linux. At the time, though, it
shook our community to its foundations. It is hard to overestimate how
much the community we find ourselves in now was shaped by a ridiculous
lawsuit 20 years ago.
Post Syndicated from original https://lwn.net/Articles/925068/
Thorsten Kukuk demonstrates
that we are not done with year-2038 problems yet.
The general statement so far has always been that on 64bit systems
with a 64bit time_t you are safe with respect to the Y2038
problem. But glibc uses for compatibility with 32bit userland
applications 32bit time_t in some places even on 64bit systems.
One of those places is the utmp file.
The post includes a proposal for solving the problem by getting rid of
utmp entirely.
Post Syndicated from LGR original https://www.youtube.com/watch?v=s2FMqsPnh5M
Post Syndicated from original https://lwn.net/Articles/925060/
Security updates have been issued by Debian (linux-5.10 and node-css-what), SUSE (gnutls, google-guest-agent, google-osconfig-agent, nodejs10, nodejs14, nodejs16, opera, pkgconf, python-cryptography, python-cryptography-vectors, rubygem-activesupport-4_2, thunderbird, and tpm2-0-tss), and Ubuntu (git, kernel, linux, linux-aws, linux-aws-5.15, linux-azure, linux-azure-5.15,
linux-azure-fde, linux-gcp, linux-gcp-5.15, linux-gke, linux-gke-5.15,
linux-hwe-5.15, linux-lowlatency, linux-lowlatency-hwe-5.15, linux-oracle,
linux-oracle-5.15, linux, linux-aws, linux-azure, linux-gcp, linux-hwe-5.19, linux-ibm,
linux-lowlatency, linux-oracle, linux-azure-fde, linux-oem-5.14, linux-oem-5.17, linux-oem-6.0, linux-oem-6.1, php7.0, python-pip, ruby-rack, spip, and sudo).
Post Syndicated from Lukasz Mierzwa original https://blog.cloudflare.com/how-cloudflare-runs-prometheus-at-scale/


We use Prometheus to gain insight into all the different pieces of hardware and software that make up our global network. Prometheus allows us to measure health & performance over time and, if there’s anything wrong with any service, let our team know before it becomes a problem.
At the moment of writing this post we run 916 Prometheus instances with a total of around 4.9 billion time series. Here’s a screenshot that shows exact numbers:
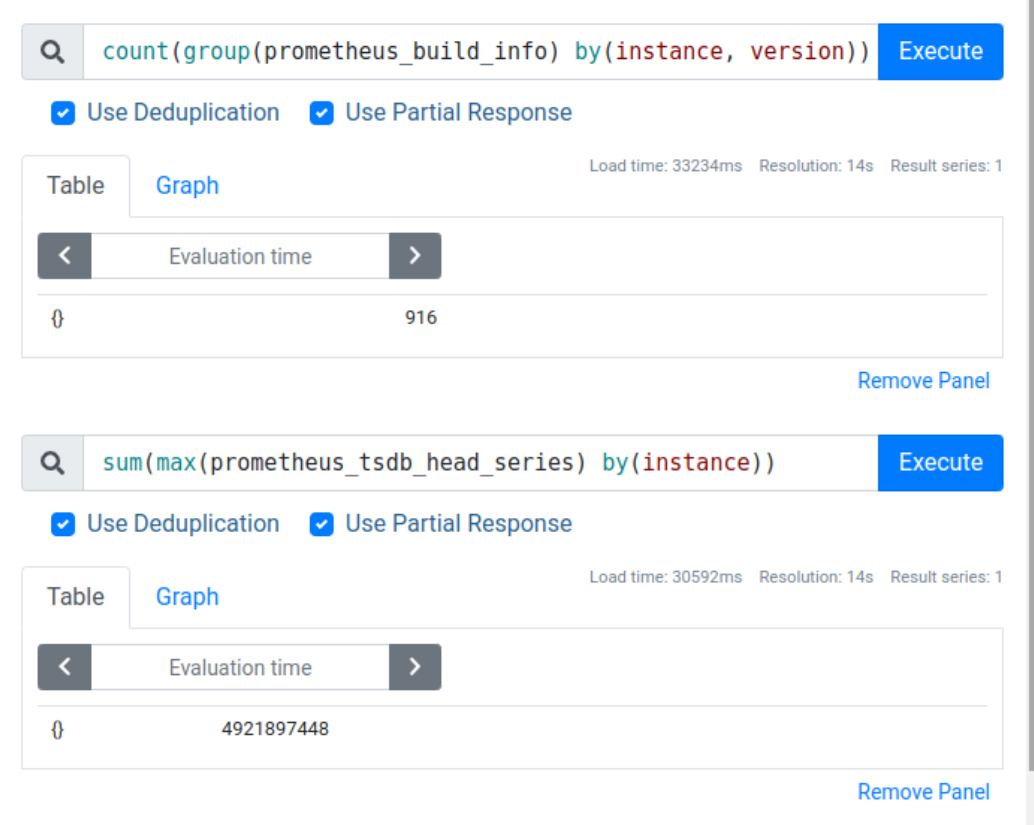
That’s an average of around 5 million time series per instance, but in reality we have a mixture of very tiny and very large instances, with the biggest instances storing around 30 million time series each.
Operating such a large Prometheus deployment doesn’t come without challenges. In this blog post we’ll cover some of the issues one might encounter when trying to collect many millions of time series per Prometheus instance.
One of the first problems you’re likely to hear about when you start running your own Prometheus instances is cardinality, with the most dramatic cases of this problem being referred to as “cardinality explosion”.
So let’s start by looking at what cardinality means from Prometheus’ perspective, when it can be a problem and some of the ways to deal with it.
Let’s say we have an application which we want to instrument, which means add some observable properties in the form of metrics that Prometheus can read from our application. A metric can be anything that you can express as a number, for example:
To create metrics inside our application we can use one of many Prometheus client libraries. Let’s pick client_python for simplicity, but the same concepts will apply regardless of the language you use.
from prometheus_client import Counter

# Declare our first metric.
# First argument is the name of the metric.
# Second argument is the description of it.
c = Counter(mugs_of_beverage_total, 'The total number of mugs drank.')

# Call inc() to increment our metric every time a mug was drank.
c.inc()
c.inc()
With this simple code Prometheus client library will create a single metric. For Prometheus to collect this metric we need our application to run an HTTP server and expose our metrics there. The simplest way of doing this is by using functionality provided with client_python itself – see documentation here.
When Prometheus sends an HTTP request to our application it will receive this response:
# HELP mugs_of_beverage_total The total number of mugs drank.
# TYPE mugs_of_beverage_total counter
mugs_of_beverage_total 2
This format and underlying data model are both covered extensively in Prometheus’ own documentation.
Please see data model and exposition format pages for more details.
We can add more metrics if we like and they will all appear in the HTTP response to the metrics endpoint.
Prometheus metrics can have extra dimensions in form of labels. We can use these to add more information to our metrics so that we can better understand what’s going on.
With our example metric we know how many mugs were consumed, but what if we also want to know what kind of beverage it was? Or maybe we want to know if it was a cold drink or a hot one? Adding labels is very easy and all we need to do is specify their names. Once we do that we need to pass label values (in the same order as label names were specified) when incrementing our counter to pass this extra information.
Let’s adjust the example code to do this.
from prometheus_client import Counter

c = Counter(mugs_of_beverage_total, 'The total number of mugs drank.', ['content', 'temperature'])

c.labels('coffee', 'hot').inc()
c.labels('coffee', 'hot').inc()
c.labels('coffee', 'cold').inc()
c.labels('tea', 'hot').inc()
Our HTTP response will now show more entries:
# HELP mugs_of_beverage_total The total number of mugs drank.
# TYPE mugs_of_beverage_total counter
mugs_of_beverage_total{content="coffee", temperature="hot"} 2
mugs_of_beverage_total{content="coffee", temperature="cold"} 1
mugs_of_beverage_total{content="tea", temperature="hot"} 1
As we can see we have an entry for each unique combination of labels.
And this brings us to the definition of cardinality in the context of metrics. Cardinality is the number of unique combinations of all labels. The more labels you have and the more values each label can take, the more unique combinations you can create and the higher the cardinality.
Now we should pause to make an important distinction between metrics and time series.
A metric is an observable property with some defined dimensions (labels). In our example case it’s a Counter class object.
A time series is an instance of that metric, with a unique combination of all the dimensions (labels), plus a series of timestamp & value pairs – hence the name “time series”. Names and labels tell us what is being observed, while timestamp & value pairs tell us how that observable property changed over time, allowing us to plot graphs using this data.
What this means is that a single metric will create one or more time series. The number of time series depends purely on the number of labels and the number of all possible values these labels can take.
Every time we add a new label to our metric we risk multiplying the number of time series that will be exported to Prometheus as the result.
In our example we have two labels, “content” and “temperature”, and both of them can have two different values. So the maximum number of time series we can end up creating is four (2*2). If we add another label that can also have two values then we can now export up to eight time series (2*2*2). The more labels we have or the more distinct values they can have the more time series as a result.
If all the label values are controlled by your application you will be able to count the number of all possible label combinations. But the real risk is when you create metrics with label values coming from the outside world.
If instead of beverages we tracked the number of HTTP requests to a web server, and we used the request path as one of the label values, then anyone making a huge number of random requests could force our application to create a huge number of time series. To avoid this it’s in general best to never accept label values from untrusted sources.
To make things more complicated you may also hear about “samples” when reading Prometheus documentation. A sample is something in between metric and time series – it’s a time series value for a specific timestamp. Timestamps here can be explicit or implicit. If a sample lacks any explicit timestamp then it means that the sample represents the most recent value – it’s the current value of a given time series, and the timestamp is simply the time you make your observation at.
If you look at the HTTP response of our example metric you’ll see that none of the returned entries have timestamps. There’s no timestamp anywhere actually. This is because the Prometheus server itself is responsible for timestamps. When Prometheus collects metrics it records the time it started each collection and then it will use it to write timestamp & value pairs for each time series.
That’s why what our application exports isn’t really metrics or time series – it’s samples.
Confusing? Let’s recap:
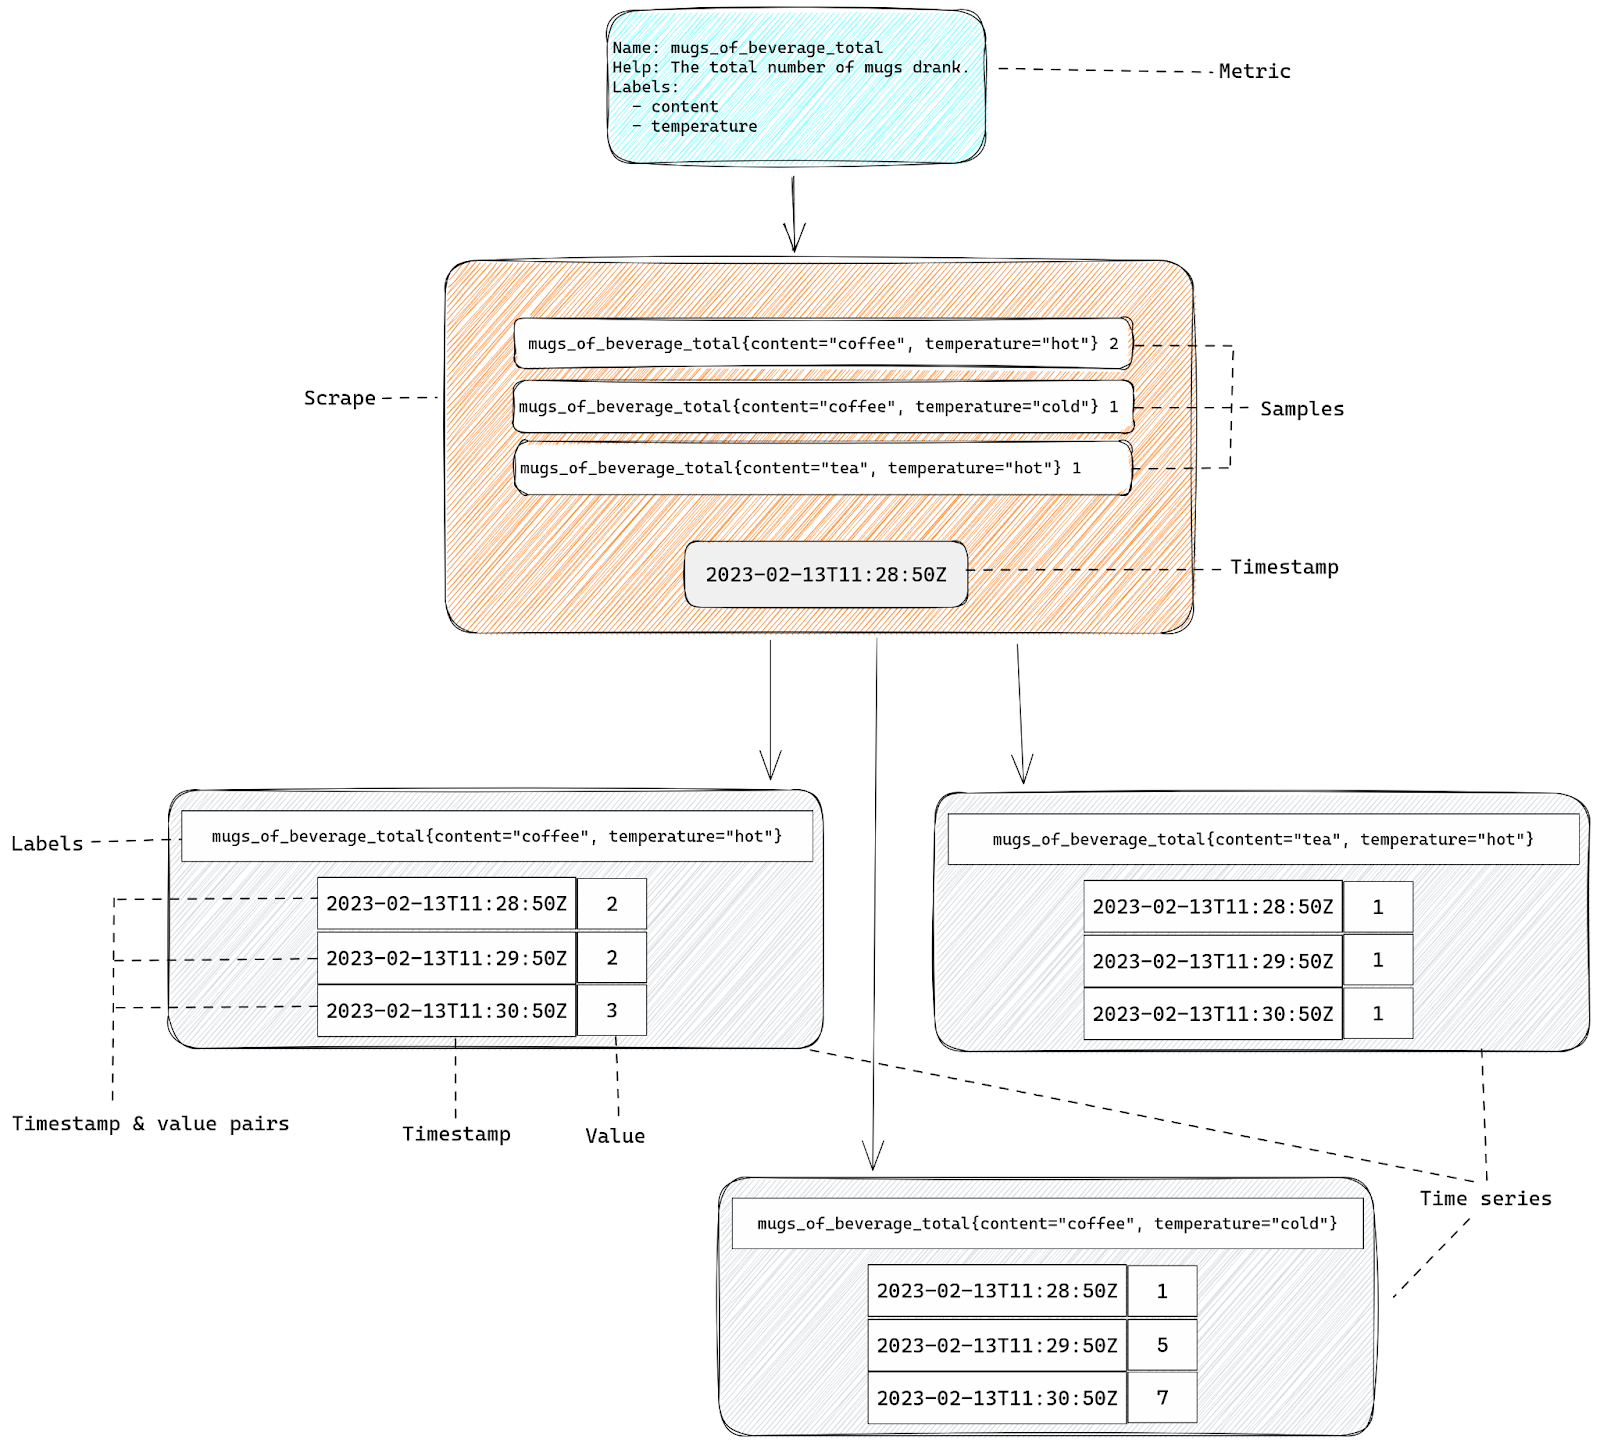
Each time series will cost us resources since it needs to be kept in memory, so the more time series we have, the more resources metrics will consume. This is true both for client libraries and Prometheus server, but it’s more of an issue for Prometheus itself, since a single Prometheus server usually collects metrics from many applications, while an application only keeps its own metrics.
Since we know that the more labels we have the more time series we end up with, you can see when this can become a problem. Simply adding a label with two distinct values to all our metrics might double the number of time series we have to deal with. Which in turn will double the memory usage of our Prometheus server. If we let Prometheus consume more memory than it can physically use then it will crash.
This scenario is often described as “cardinality explosion” – some metric suddenly adds a huge number of distinct label values, creates a huge number of time series, causes Prometheus to run out of memory and you lose all observability as a result.
To better handle problems with cardinality it’s best if we first get a better understanding of how Prometheus works and how time series consume memory.
For that let’s follow all the steps in the life of a time series inside Prometheus.
The process of sending HTTP requests from Prometheus to our application is called “scraping”. Inside the Prometheus configuration file we define a “scrape config” that tells Prometheus where to send the HTTP request, how often and, optionally, to apply extra processing to both requests and responses.
It will record the time it sends HTTP requests and use that later as the timestamp for all collected time series.
After sending a request it will parse the response looking for all the samples exposed there.
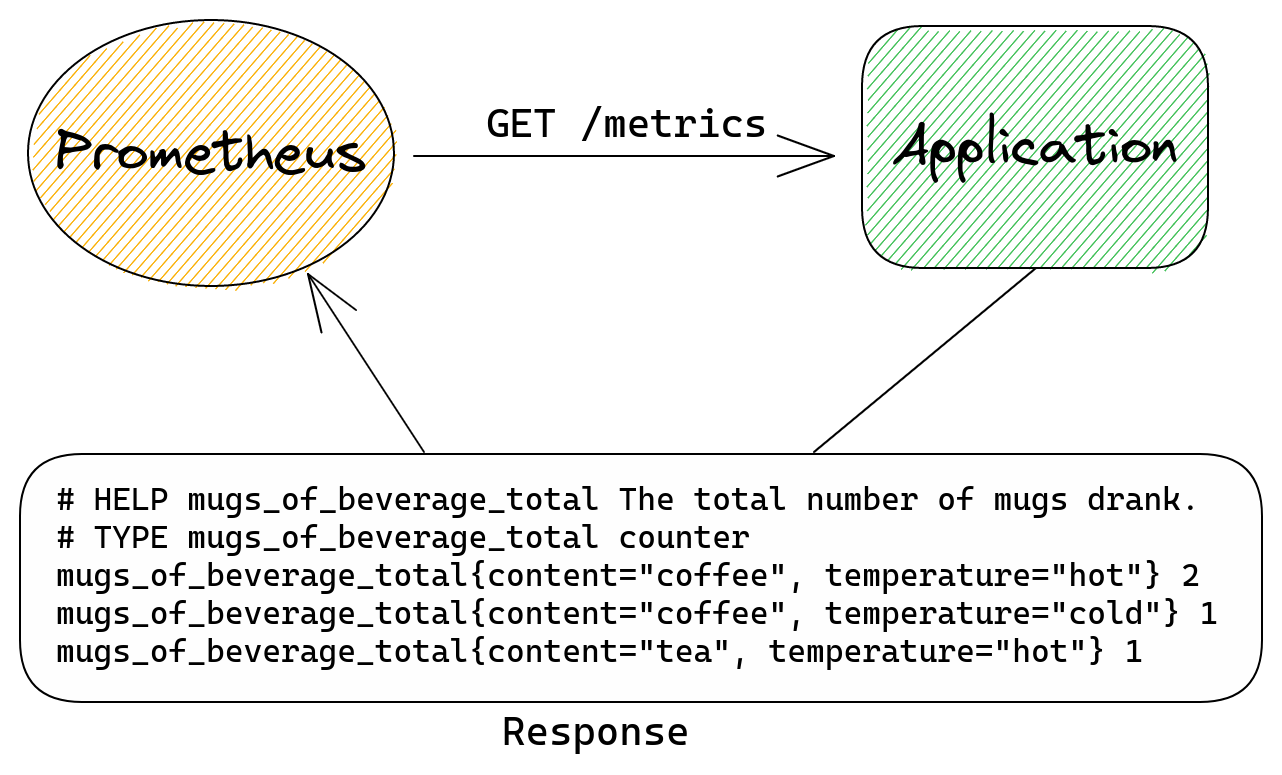
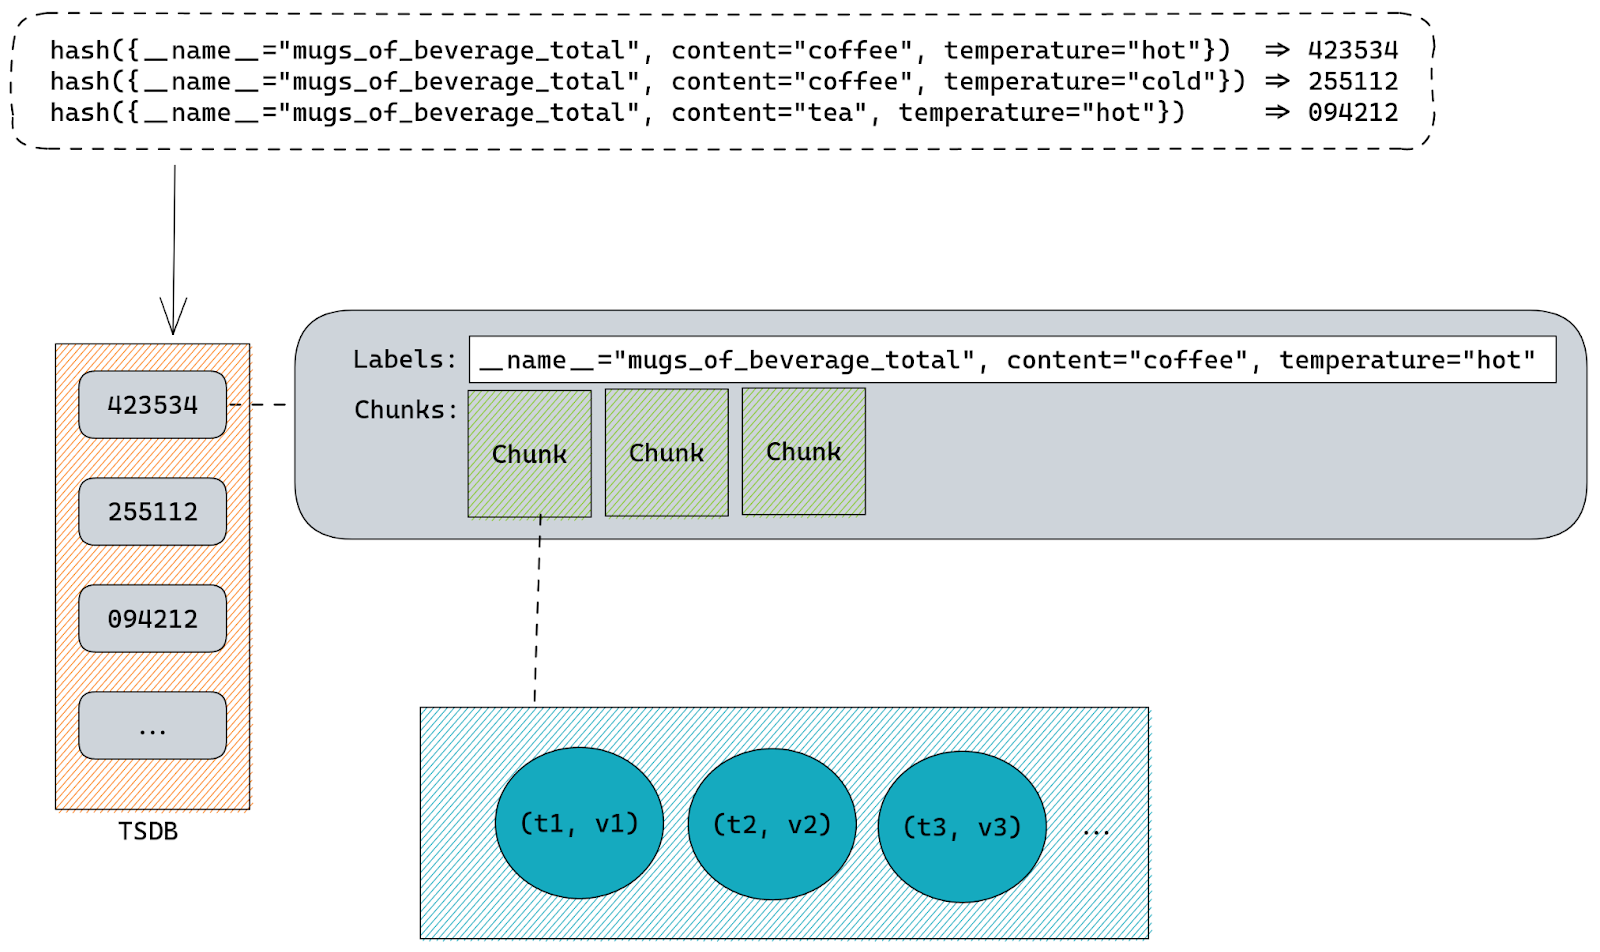
Once Prometheus has a list of samples collected from our application it will save it into TSDB – Time Series DataBase – the database in which Prometheus keeps all the time series.
But before doing that it needs to first check which of the samples belong to the time series that are already present inside TSDB and which are for completely new time series.
As we mentioned before a time series is generated from metrics. There is a single time series for each unique combination of metrics labels.
This means that Prometheus must check if there’s already a time series with identical name and exact same set of labels present. Internally time series names are just another label called __name__, so there is no practical distinction between name and labels. Both of the representations below are different ways of exporting the same time series:
mugs_of_beverage_total{content="tea", temperature="hot"} 1
{__name__="mugs_of_beverage_total", content="tea", temperature="hot"} 1
Since everything is a label Prometheus can simply hash all labels using sha256 or any other algorithm to come up with a single ID that is unique for each time series.
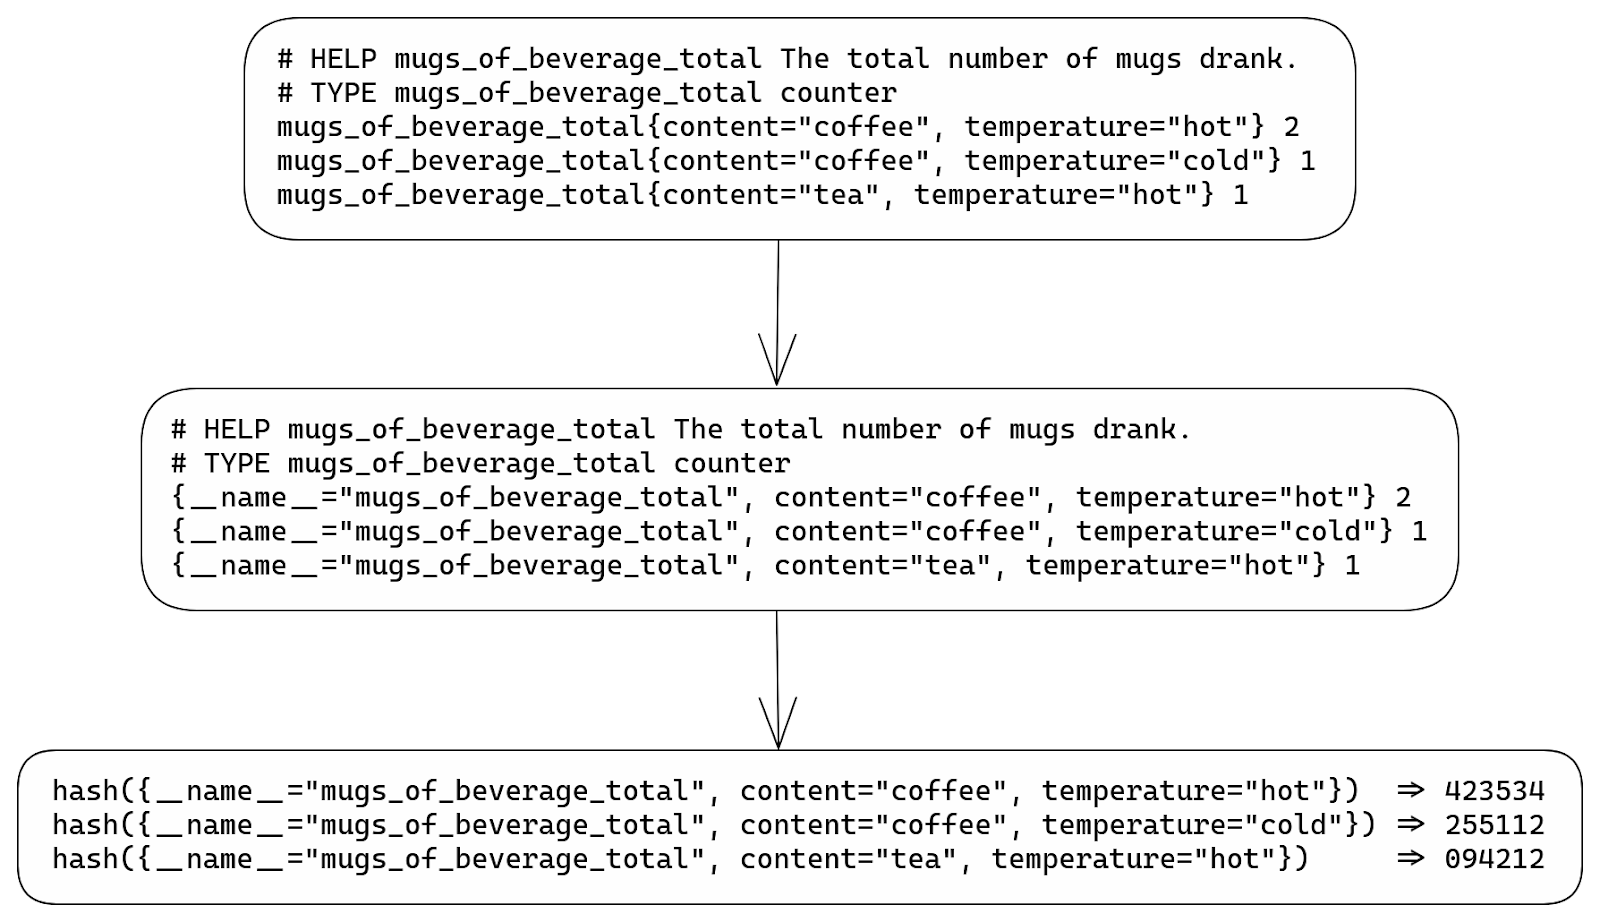
Knowing that it can quickly check if there are any time series already stored inside TSDB that have the same hashed value. Basically our labels hash is used as a primary key inside TSDB.
Once TSDB knows if it has to insert new time series or update existing ones it can start the real work.
Internally all time series are stored inside a map on a structure called Head. That map uses labels hashes as keys and a structure called memSeries as values. Those memSeries objects are storing all the time series information. The struct definition for memSeries is fairly big, but all we really need to know is that it has a copy of all the time series labels and chunks that hold all the samples (timestamp & value pairs).
Labels are stored once per each memSeries instance.
Samples are stored inside chunks using “varbit” encoding which is a lossless compression scheme optimized for time series data. Each chunk represents a series of samples for a specific time range. This helps Prometheus query data faster since all it needs to do is first locate the memSeries instance with labels matching our query and then find the chunks responsible for time range of the query.
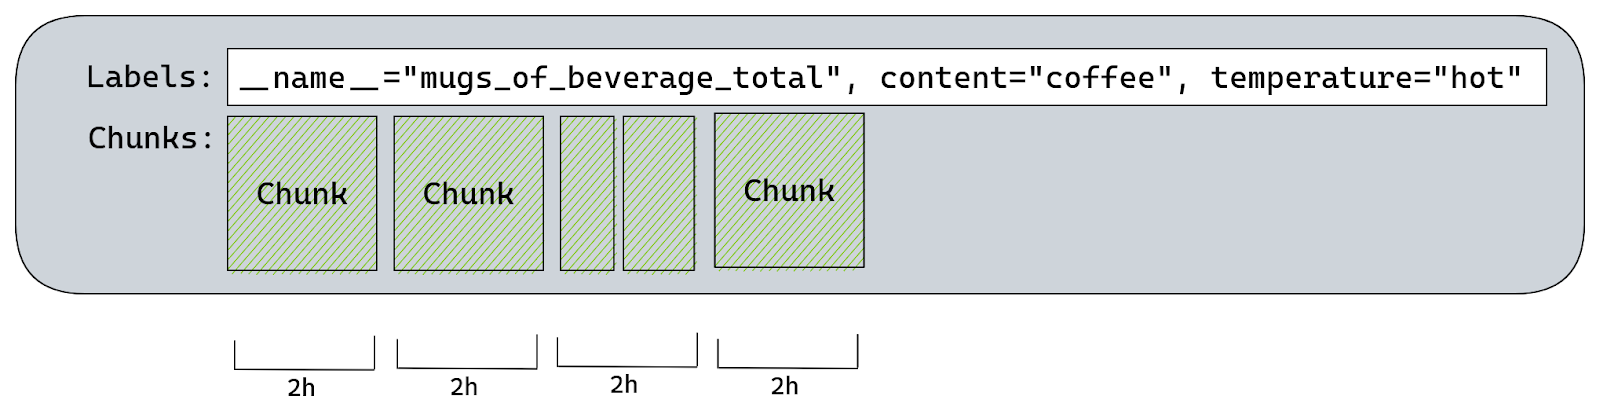
By default Prometheus will create a chunk per each two hours of wall clock. So there would be a chunk for: 00:00 – 01:59, 02:00 – 03:59, 04:00 – 05:59, …, 22:00 – 23:59.
There’s only one chunk that we can append to, it’s called the “Head Chunk”. It’s the chunk responsible for the most recent time range, including the time of our scrape. Any other chunk holds historical samples and therefore is read-only.
There is a maximum of 120 samples each chunk can hold. This is because once we have more than 120 samples on a chunk efficiency of “varbit” encoding drops. TSDB will try to estimate when a given chunk will reach 120 samples and it will set the maximum allowed time for current Head Chunk accordingly.
If we try to append a sample with a timestamp higher than the maximum allowed time for current Head Chunk, then TSDB will create a new Head Chunk and calculate a new maximum time for it based on the rate of appends.
All chunks must be aligned to those two hour slots of wall clock time, so if TSDB was building a chunk for 10:00-11:59 and it was already “full” at 11:30 then it would create an extra chunk for the 11:30-11:59 time range.
Since the default Prometheus scrape interval is one minute it would take two hours to reach 120 samples.
What this means is that using Prometheus defaults each memSeries should have a single chunk with 120 samples on it for every two hours of data.
Going back to our time series – at this point Prometheus either creates a new memSeries instance or uses already existing memSeries. Once it has a memSeries instance to work with it will append our sample to the Head Chunk. This might require Prometheus to create a new chunk if needed.
After a few hours of Prometheus running and scraping metrics we will likely have more than one chunk on our time series:
Since all these chunks are stored in memory Prometheus will try to reduce memory usage by writing them to disk and memory-mapping. The advantage of doing this is that memory-mapped chunks don’t use memory unless TSDB needs to read them.
The Head Chunk is never memory-mapped, it’s always stored in memory.
Up until now all time series are stored entirely in memory and the more time series you have, the higher Prometheus memory usage you’ll see. The only exception are memory-mapped chunks which are offloaded to disk, but will be read into memory if needed by queries.
This allows Prometheus to scrape and store thousands of samples per second, our biggest instances are appending 550k samples per second, while also allowing us to query all the metrics simultaneously.
But you can’t keep everything in memory forever, even with memory-mapping parts of data.
Every two hours Prometheus will persist chunks from memory onto the disk. This process is also aligned with the wall clock but shifted by one hour.
When using Prometheus defaults and assuming we have a single chunk for each two hours of wall clock we would see this:
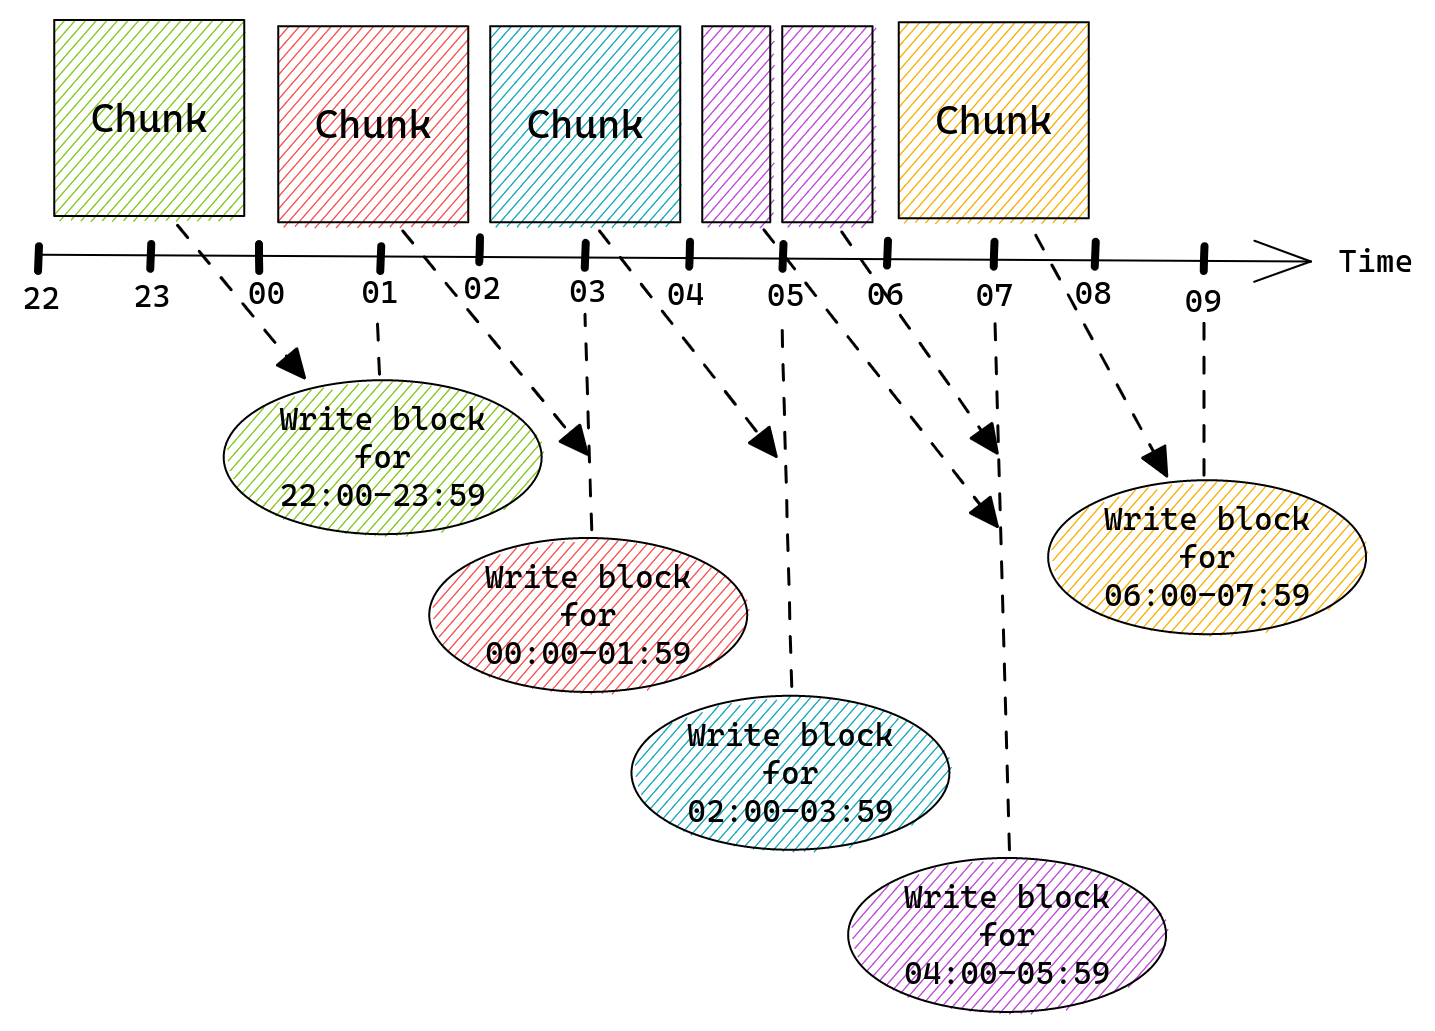
Once a chunk is written into a block it is removed from memSeries and thus from memory. Prometheus will keep each block on disk for the configured retention period.
Blocks will eventually be “compacted”, which means that Prometheus will take multiple blocks and merge them together to form a single block that covers a bigger time range. This process helps to reduce disk usage since each block has an index taking a good chunk of disk space. By merging multiple blocks together, big portions of that index can be reused, allowing Prometheus to store more data using the same amount of storage space.
After a chunk was written into a block and removed from memSeries we might end up with an instance of memSeries that has no chunks. This would happen if any time series was no longer being exposed by any application and therefore there was no scrape that would try to append more samples to it.
A common pattern is to export software versions as a build_info metric, Prometheus itself does this too:
prometheus_build_info{version="2.42.0"} 1
When Prometheus 2.43.0 is released this metric would be exported as:
prometheus_build_info{version="2.43.0"} 1
Which means that a time series with version=”2.42.0” label would no longer receive any new samples.
Once the last chunk for this time series is written into a block and removed from the memSeries instance we have no chunks left. This means that our memSeries still consumes some memory (mostly labels) but doesn’t really do anything.
To get rid of such time series Prometheus will run “head garbage collection” (remember that Head is the structure holding all memSeries) right after writing a block. This garbage collection, among other things, will look for any time series without a single chunk and remove it from memory.
Since this happens after writing a block, and writing a block happens in the middle of the chunk window (two hour slices aligned to the wall clock) the only memSeries this would find are the ones that are “orphaned” – they received samples before, but not anymore.
TSDB used in Prometheus is a special kind of database that was highly optimized for a very specific workload:
This means that Prometheus is most efficient when continuously scraping the same time series over and over again. It’s least efficient when it scrapes a time series just once and never again – doing so comes with a significant memory usage overhead when compared to the amount of information stored using that memory.
If we try to visualize how the perfect type of data Prometheus was designed for looks like we’ll end up with this:

A few continuous lines describing some observed properties.
If, on the other hand, we want to visualize the type of data that Prometheus is the least efficient when dealing with, we’ll end up with this instead:

Here we have single data points, each for a different property that we measure.
Although you can tweak some of Prometheus’ behavior and tweak it more for use with short lived time series, by passing one of the hidden flags, it’s generally discouraged to do so. These flags are only exposed for testing and might have a negative impact on other parts of Prometheus server.
To get a better understanding of the impact of a short lived time series on memory usage let’s take a look at another example.
Let’s see what happens if we start our application at 00:25, allow Prometheus to scrape it once while it exports:
prometheus_build_info{version="2.42.0"} 1
And then immediately after the first scrape we upgrade our application to a new version:
prometheus_build_info{version="2.43.0"} 1
At 00:25 Prometheus will create our memSeries, but we will have to wait until Prometheus writes a block that contains data for 00:00-01:59 and runs garbage collection before that memSeries is removed from memory, which will happen at 03:00.
This single sample (data point) will create a time series instance that will stay in memory for over two and a half hours using resources, just so that we have a single timestamp & value pair.
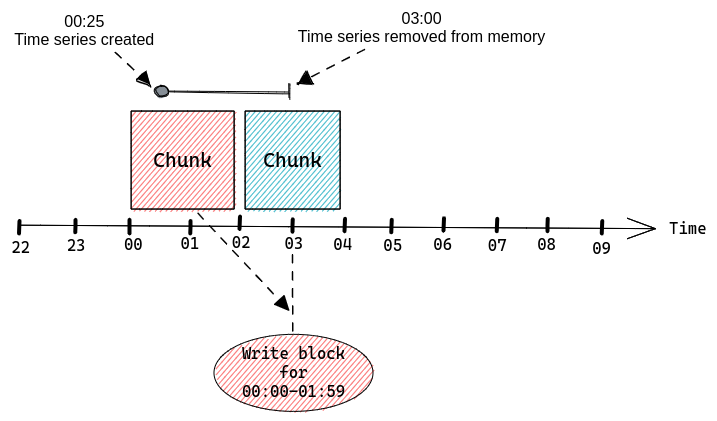
If we were to continuously scrape a lot of time series that only exist for a very brief period then we would be slowly accumulating a lot of memSeries in memory until the next garbage collection.
Looking at memory usage of such Prometheus server we would see this pattern repeating over time:
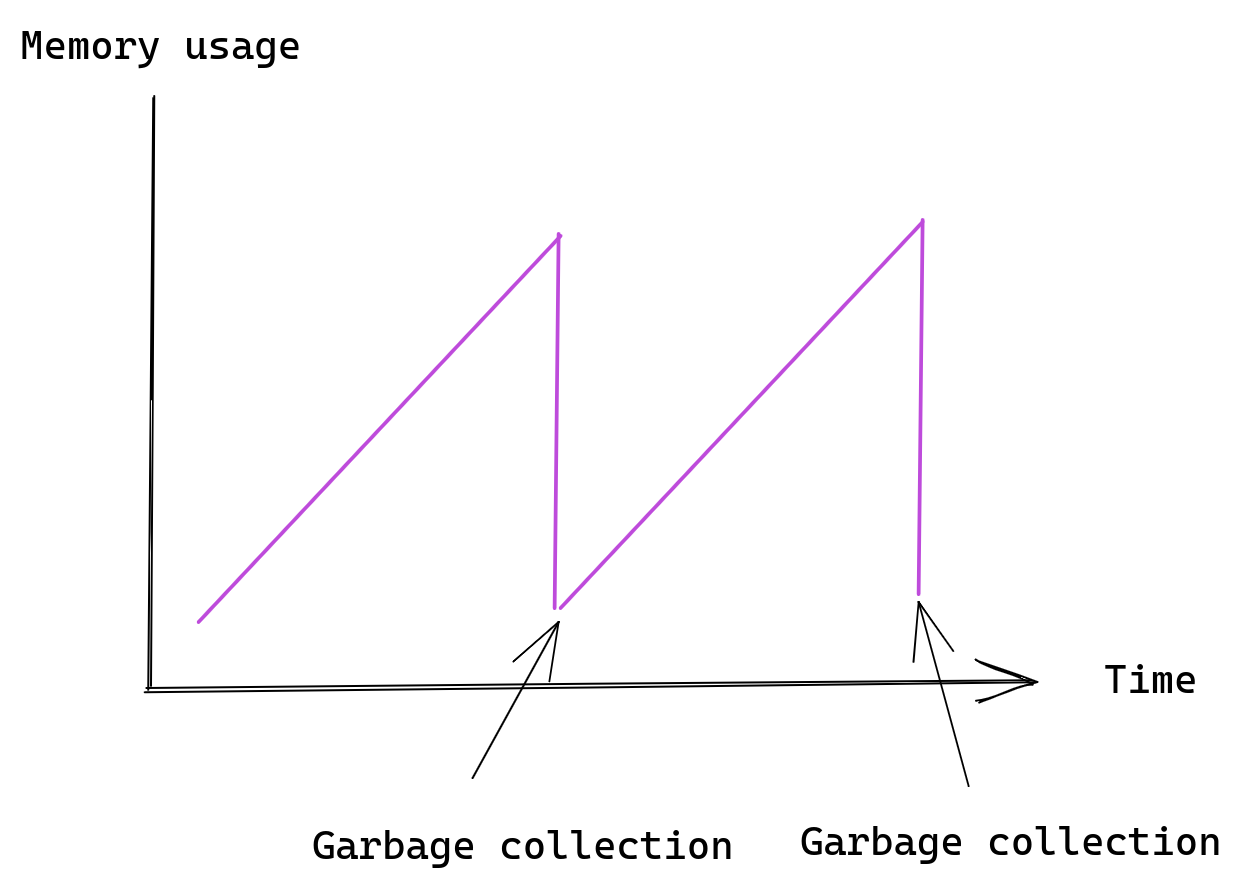
The important information here is that short lived time series are expensive. A time series that was only scraped once is guaranteed to live in Prometheus for one to three hours, depending on the exact time of that scrape.
At this point we should know a few things about Prometheus:
With all of that in mind we can now see the problem – a metric with high cardinality, especially one with label values that come from the outside world, can easily create a huge number of time series in a very short time, causing cardinality explosion. This would inflate Prometheus memory usage, which can cause Prometheus server to crash, if it uses all available physical memory.
To get a better idea of this problem let’s adjust our example metric to track HTTP requests.
Our metric will have a single label that stores the request path.
from prometheus_client import Counter

c = Counter(http_requests_total, 'The total number of HTTP requests.', ['path'])

# HTTP request handler our web server will call
def handle_request(path):
  c.labels(path).inc()
  ...
If we make a single request using the curl command:
> curl https://app.example.com/index.html
We should see these time series in our application:
# HELP http_requests_total The total number of HTTP requests.
# TYPE http_requests_total counter
http_requests_total{path="/index.html"} 1
But what happens if an evil hacker decides to send a bunch of random requests to our application?
> curl https://app.example.com/jdfhd5343
> curl https://app.example.com/3434jf833
> curl https://app.example.com/1333ds5
> curl https://app.example.com/aaaa43321
Extra time series would be created:
# HELP http_requests_total The total number of HTTP requests.
# TYPE http_requests_total counter
http_requests_total{path="/index.html"} 1
http_requests_total{path="/jdfhd5343"} 1
http_requests_total{path="/3434jf833"} 1
http_requests_total{path="/1333ds5"} 1
http_requests_total{path="/aaaa43321"} 1
With 1,000 random requests we would end up with 1,000 time series in Prometheus. If our metric had more labels and all of them were set based on the request payload (HTTP method name, IPs, headers, etc) we could easily end up with millions of time series.
Often it doesn’t require any malicious actor to cause cardinality related problems. A common class of mistakes is to have an error label on your metrics and pass raw error objects as values.
from prometheus_client import Counter

c = Counter(errors_total, 'The total number of errors.', [error])

def my_func:
  try:
    ...
  except Exception as err:
    c.labels(err).inc()
This works well if errors that need to be handled are generic, for example “Permission Denied”:
errors_total{error="Permission Denied"} 1
But if the error string contains some task specific information, for example the name of the file that our application didn’t have access to, or a TCP connection error, then we might easily end up with high cardinality metrics this way:
errors_total{error="file not found: /myfile.txt"} 1
errors_total{error="file not found: /other/file.txt"} 1
errors_total{error="read udp 127.0.0.1:12421->127.0.0.2:443: i/o timeout"} 1
errors_total{error="read udp 127.0.0.1:14743->127.0.0.2:443: i/o timeout"} 1
Once scraped all those time series will stay in memory for a minimum of one hour. It’s very easy to keep accumulating time series in Prometheus until you run out of memory.
Even Prometheus’ own client libraries had bugs that could expose you to problems like this.
Each time series stored inside Prometheus (as a memSeries instance) consists of:
The amount of memory needed for labels will depend on the number and length of these. The more labels you have, or the longer the names and values are, the more memory it will use.
The way labels are stored internally by Prometheus also matters, but that’s something the user has no control over. There is an open pull request which improves memory usage of labels by storing all labels as a single string.
Chunks will consume more memory as they slowly fill with more samples, after each scrape, and so the memory usage here will follow a cycle – we start with low memory usage when the first sample is appended, then memory usage slowly goes up until a new chunk is created and we start again.
You can calculate how much memory is needed for your time series by running this query on your Prometheus server:
go_memstats_alloc_bytes / prometheus_tsdb_head_series
Note that your Prometheus server must be configured to scrape itself for this to work.
Secondly this calculation is based on all memory used by Prometheus, not only time series data, so it’s just an approximation. Use it to get a rough idea of how much memory is used per time series and don’t assume it’s that exact number.
Thirdly Prometheus is written in Golang which is a language with garbage collection. The actual amount of physical memory needed by Prometheus will usually be higher as a result, since it will include unused (garbage) memory that needs to be freed by Go runtime.
Prometheus does offer some options for dealing with high cardinality problems. There are a number of options you can set in your scrape configuration block. Here is the extract of the relevant options from Prometheus documentation:
# An uncompressed response body larger than this many bytes will cause the
# scrape to fail. 0 means no limit. Example: 100MB.
# This is an experimental feature, this behaviour could
# change or be removed in the future.
[ body_size_limit: <size> | default = 0 ]
# Per-scrape limit on number of scraped samples that will be accepted.
# If more than this number of samples are present after metric relabeling
# the entire scrape will be treated as failed. 0 means no limit.
[ sample_limit: <int> | default = 0 ]

# Per-scrape limit on number of labels that will be accepted for a sample. If
# more than this number of labels are present post metric-relabeling, the
# entire scrape will be treated as failed. 0 means no limit.
[ label_limit: <int> | default = 0 ]

# Per-scrape limit on length of labels name that will be accepted for a sample.
# If a label name is longer than this number post metric-relabeling, the entire
# scrape will be treated as failed. 0 means no limit.
[ label_name_length_limit: <int> | default = 0 ]

# Per-scrape limit on length of labels value that will be accepted for a sample.
# If a label value is longer than this number post metric-relabeling, the
# entire scrape will be treated as failed. 0 means no limit.
[ label_value_length_limit: <int> | default = 0 ]

# Per-scrape config limit on number of unique targets that will be
# accepted. If more than this number of targets are present after target
# relabeling, Prometheus will mark the targets as failed without scraping them.
# 0 means no limit. This is an experimental feature, this behaviour could
# change in the future.
[ target_limit: <int> | default = 0 ]
Setting all the label length related limits allows you to avoid a situation where extremely long label names or values end up taking too much memory.
Going back to our metric with error labels we could imagine a scenario where some operation returns a huge error message, or even stack trace with hundreds of lines. If such a stack trace ended up as a label value it would take a lot more memory than other time series, potentially even megabytes. Since labels are copied around when Prometheus is handling queries this could cause significant memory usage increase.
Setting label_limit provides some cardinality protection, but even with just one label name and huge number of values we can see high cardinality. Passing sample_limit is the ultimate protection from high cardinality. It enables us to enforce a hard limit on the number of time series we can scrape from each application instance.
The downside of all these limits is that breaching any of them will cause an error for the entire scrape.
If we configure a sample_limit of 100 and our metrics response contains 101 samples, then Prometheus won’t scrape anything at all. This is a deliberate design decision made by Prometheus developers.
The main motivation seems to be that dealing with partially scraped metrics is difficult and you’re better off treating failed scrapes as incidents.
We have hundreds of data centers spread across the world, each with dedicated Prometheus servers responsible for scraping all metrics.
Each Prometheus is scraping a few hundred different applications, each running on a few hundred servers.
Combined that’s a lot of different metrics. It’s not difficult to accidentally cause cardinality problems and in the past we’ve dealt with a fair number of issues relating to it.
The most basic layer of protection that we deploy are scrape limits, which we enforce on all configured scrapes. These are the sane defaults that 99% of application exporting metrics would never exceed.
By default we allow up to 64 labels on each time series, which is way more than most metrics would use.
We also limit the length of label names and values to 128 and 512 characters, which again is more than enough for the vast majority of scrapes.
Finally we do, by default, set sample_limit to 200 – so each application can export up to 200 time series without any action.
What happens when somebody wants to export more time series or use longer labels? All they have to do is set it explicitly in their scrape configuration.
Those limits are there to catch accidents and also to make sure that if any application is exporting a high number of time series (more than 200) the team responsible for it knows about it. This helps us avoid a situation where applications are exporting thousands of times series that aren’t really needed. Once you cross the 200 time series mark, you should start thinking about your metrics more.
The next layer of protection is checks that run in CI (Continuous Integration) when someone makes a pull request to add new or modify existing scrape configuration for their application.
These checks are designed to ensure that we have enough capacity on all Prometheus servers to accommodate extra time series, if that change would result in extra time series being collected.
For example, if someone wants to modify sample_limit, let’s say by changing existing limit of 500 to 2,000, for a scrape with 10 targets, that’s an increase of 1,500 per target, with 10 targets that’s 10*1,500=15,000 extra time series that might be scraped. Our CI would check that all Prometheus servers have spare capacity for at least 15,000 time series before the pull request is allowed to be merged.
This gives us confidence that we won’t overload any Prometheus server after applying changes.
One of the most important layers of protection is a set of patches we maintain on top of Prometheus. There is an open pull request on the Prometheus repository. This patchset consists of two main elements.
First is the patch that allows us to enforce a limit on the total number of time series TSDB can store at any time. There is no equivalent functionality in a standard build of Prometheus, if any scrape produces some samples they will be appended to time series inside TSDB, creating new time series if needed.
This is the standard flow with a scrape that doesn’t set any sample_limit:
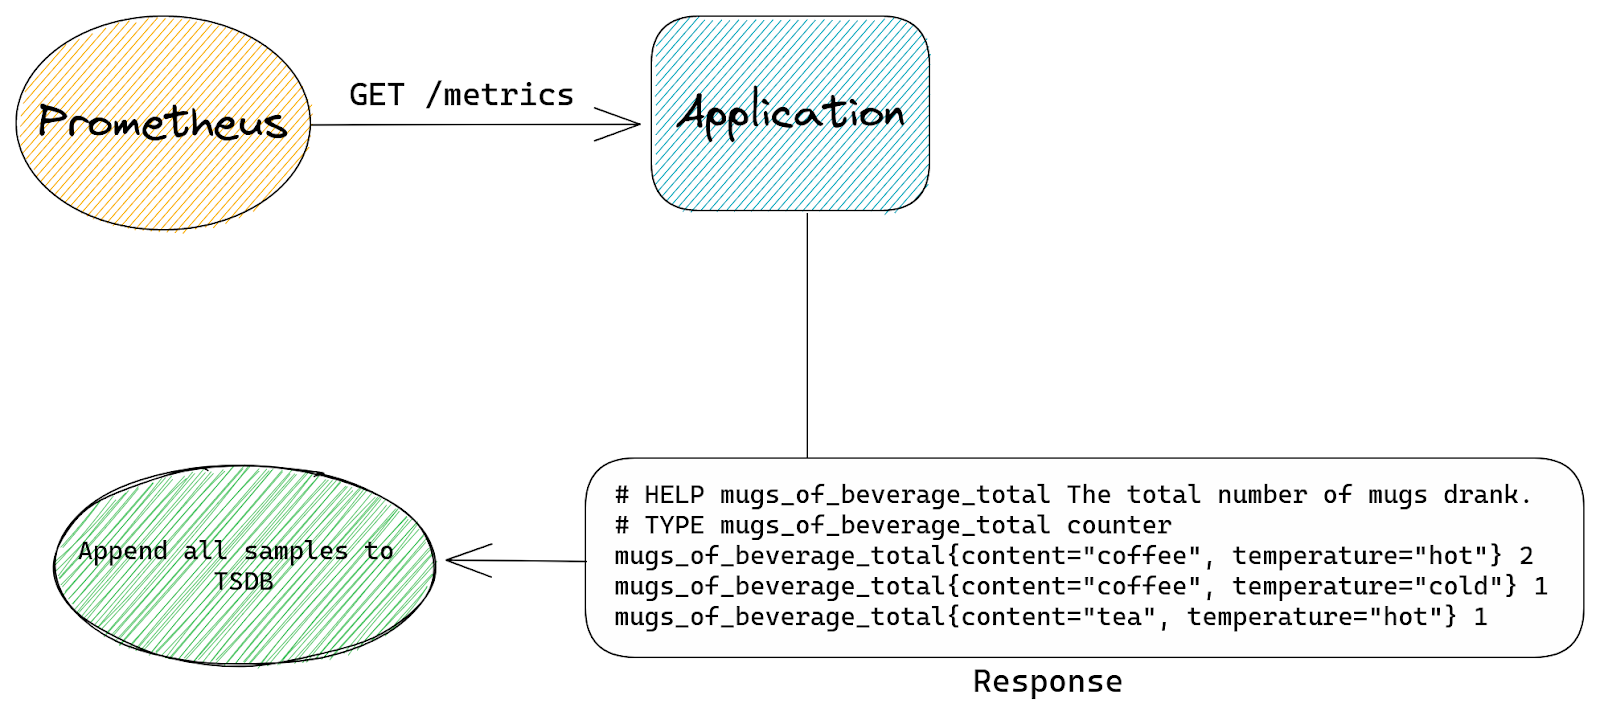
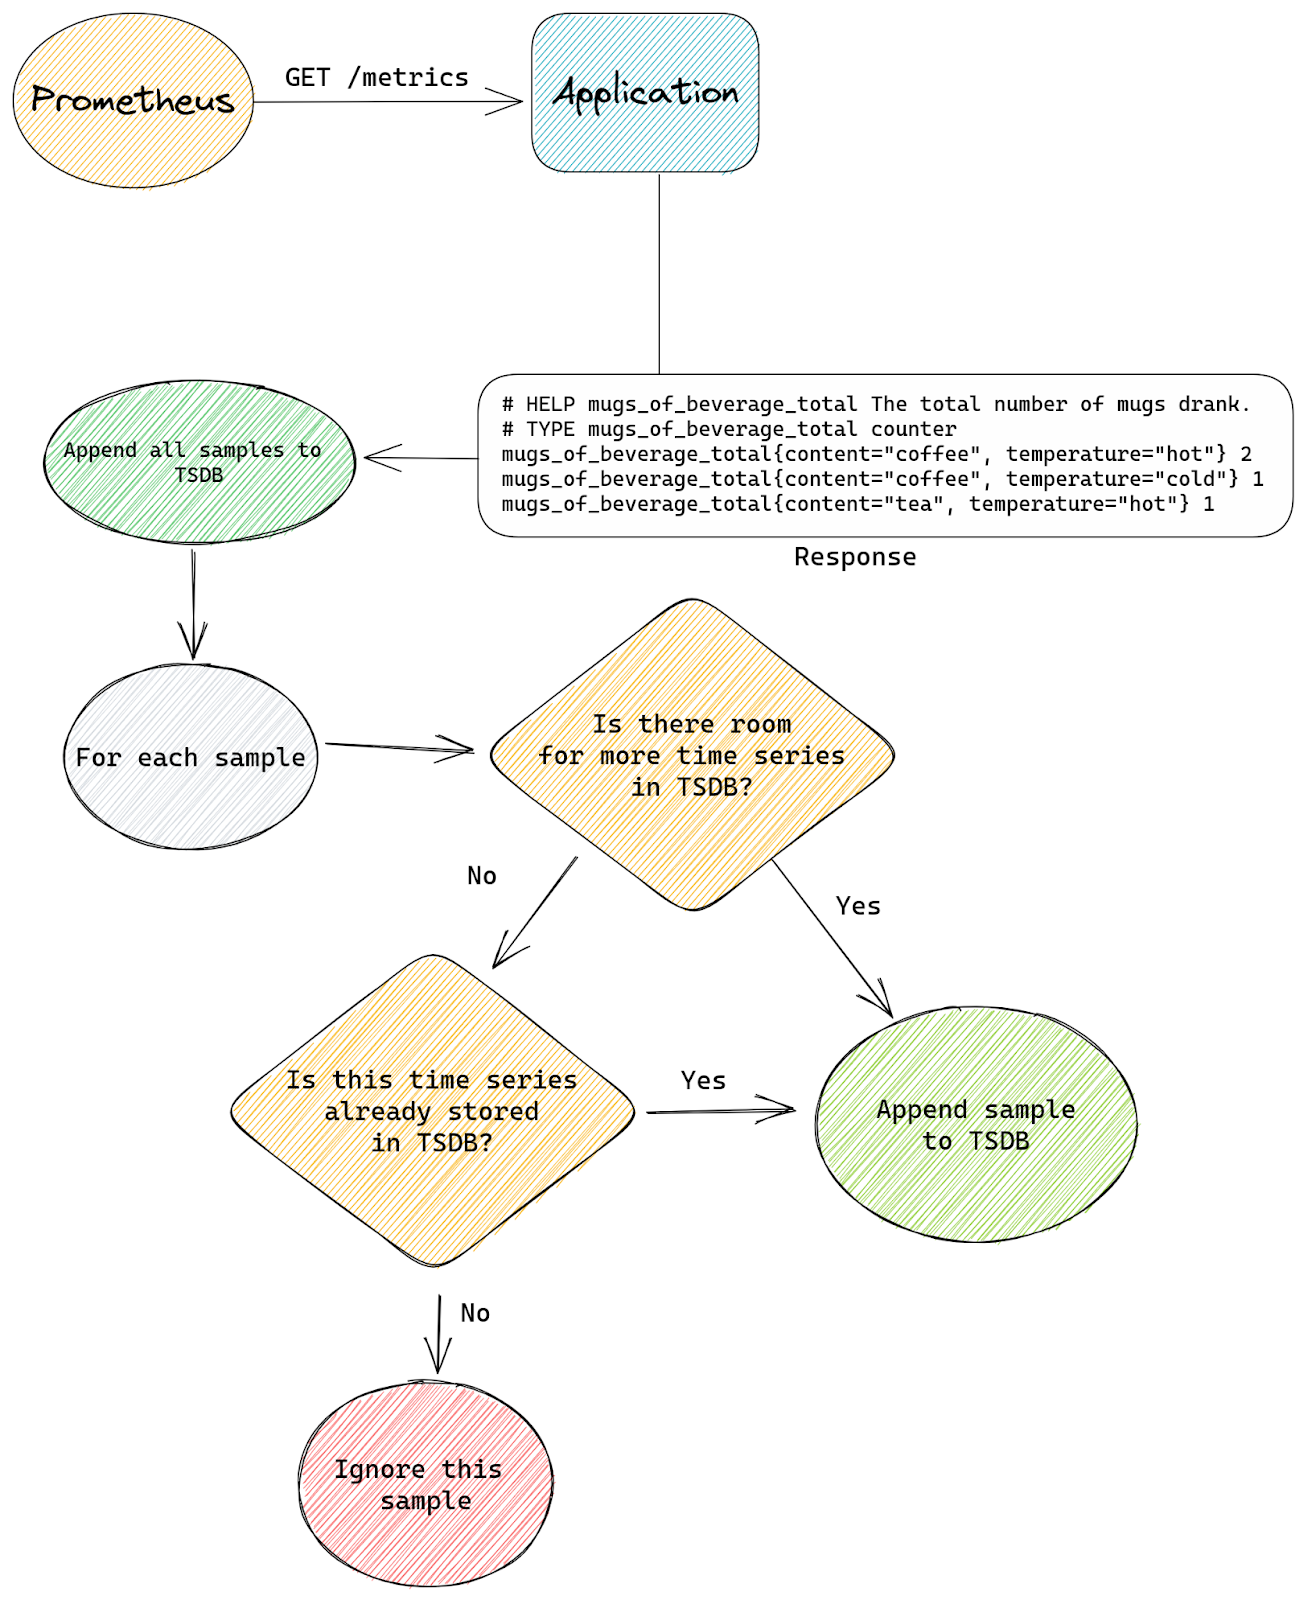
With our patch we tell TSDB that it’s allowed to store up to N time series in total, from all scrapes, at any time. So when TSDB is asked to append a new sample by any scrape, it will first check how many time series are already present.
If the total number of stored time series is below the configured limit then we append the sample as usual.
The difference with standard Prometheus starts when a new sample is about to be appended, but TSDB already stores the maximum number of time series it’s allowed to have. Our patched logic will then check if the sample we’re about to append belongs to a time series that’s already stored inside TSDB or is it a new time series that needs to be created.
If the time series already exists inside TSDB then we allow the append to continue. If the time series doesn’t exist yet and our append would create it (a new memSeries instance would be created) then we skip this sample. We will also signal back to the scrape logic that some samples were skipped.
This is the modified flow with our patch:
By running “go_memstats_alloc_bytes / prometheus_tsdb_head_series” query we know how much memory we need per single time series (on average), we also know how much physical memory we have available for Prometheus on each server, which means that we can easily calculate the rough number of time series we can store inside Prometheus, taking into account the fact the there’s garbage collection overhead since Prometheus is written in Go:
memory available to Prometheus / bytes per time series = our capacity
This doesn’t capture all complexities of Prometheus but gives us a rough estimate of how many time series we can expect to have capacity for.
By setting this limit on all our Prometheus servers we know that it will never scrape more time series than we have memory for. This is the last line of defense for us that avoids the risk of the Prometheus server crashing due to lack of memory.
The second patch modifies how Prometheus handles sample_limit – with our patch instead of failing the entire scrape it simply ignores excess time series. If we have a scrape with sample_limit set to 200 and the application exposes 201 time series, then all except one final time series will be accepted.
This is the standard Prometheus flow for a scrape that has the sample_limit option set:
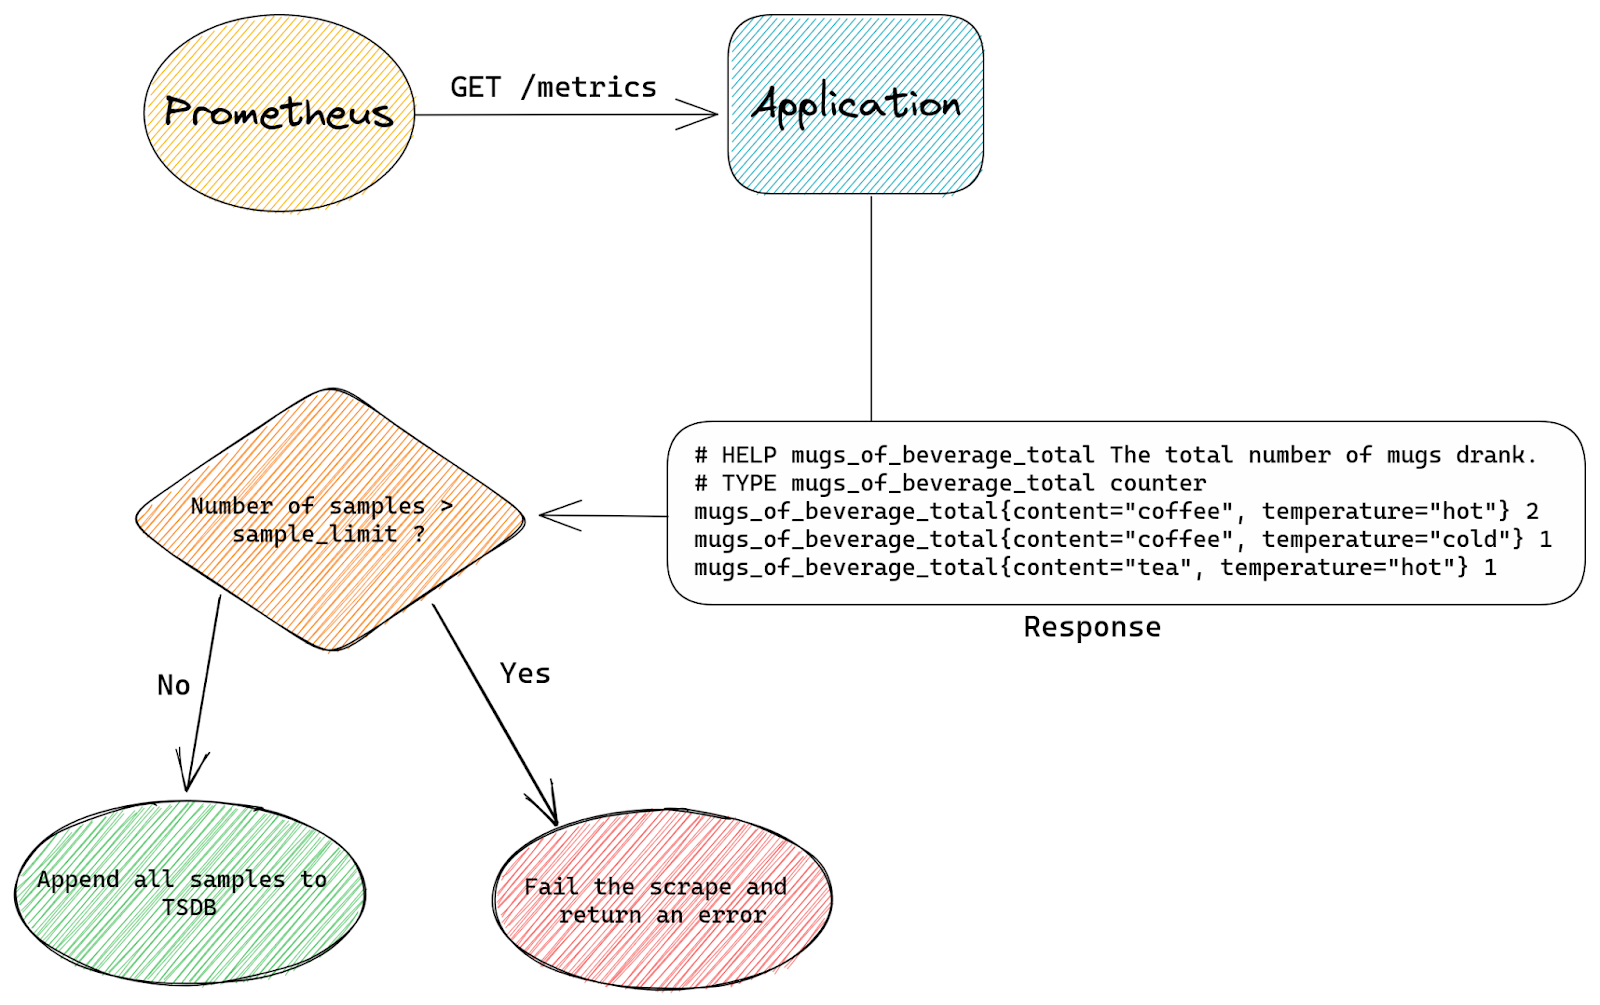
The entire scrape either succeeds or fails. Prometheus simply counts how many samples are there in a scrape and if that’s more than sample_limit allows it will fail the scrape.
With our custom patch we don’t care how many samples are in a scrape. Instead we count time series as we append them to TSDB. Once we appended sample_limit number of samples we start to be selective.
Any excess samples (after reaching sample_limit) will only be appended if they belong to time series that are already stored inside TSDB.
The reason why we still allow appends for some samples even after we’re above sample_limit is that appending samples to existing time series is cheap, it’s just adding an extra timestamp & value pair.
Creating new time series on the other hand is a lot more expensive – we need to allocate new memSeries instances with a copy of all labels and keep it in memory for at least an hour.
This is how our modified flow looks:
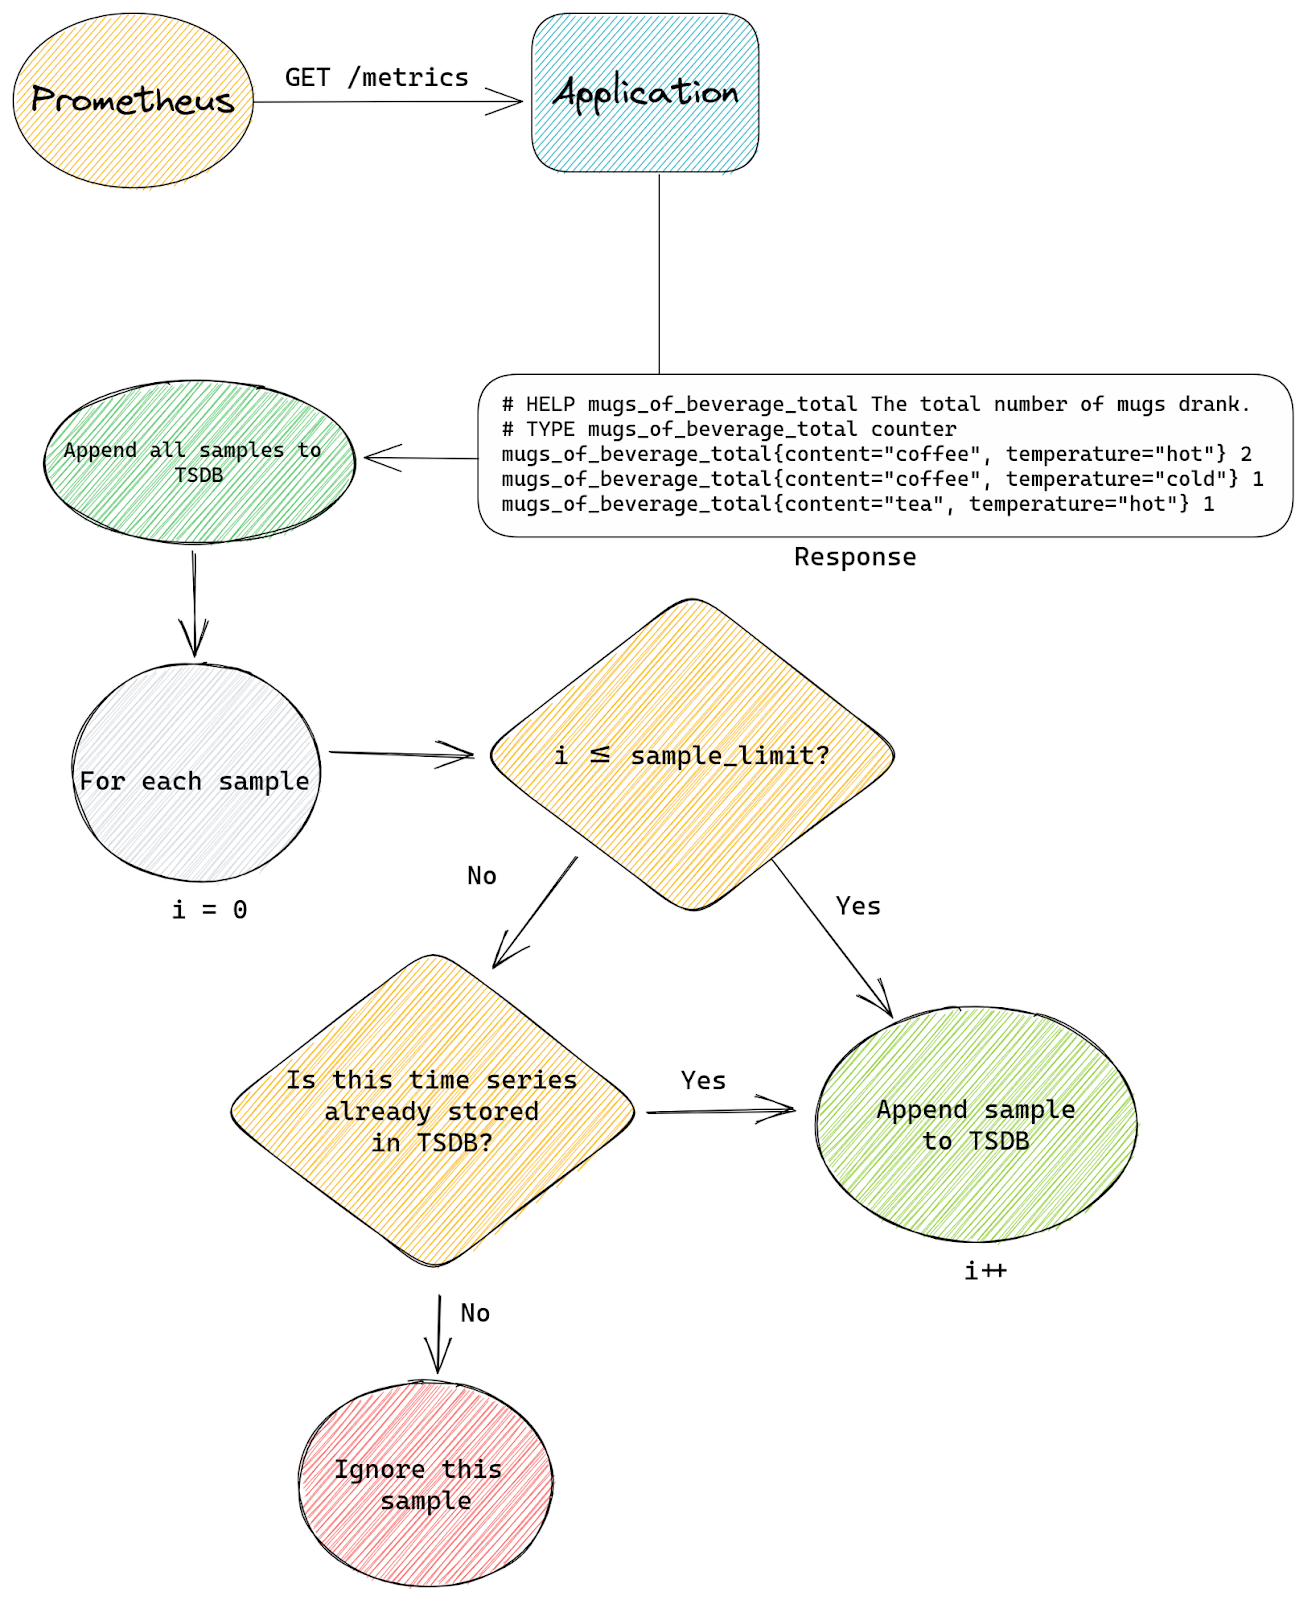
Both patches give us two levels of protection.
The TSDB limit patch protects the entire Prometheus from being overloaded by too many time series.
This is because the only way to stop time series from eating memory is to prevent them from being appended to TSDB. Once they’re in TSDB it’s already too late.
While the sample_limit patch stops individual scrapes from using too much Prometheus capacity, which could lead to creating too many time series in total and exhausting total Prometheus capacity (enforced by the first patch), which would in turn affect all other scrapes since some new time series would have to be ignored. At the same time our patch gives us graceful degradation by capping time series from each scrape to a certain level, rather than failing hard and dropping all time series from affected scrape, which would mean losing all observability of affected applications.
It’s also worth mentioning that without our TSDB total limit patch we could keep adding new scrapes to Prometheus and that alone could lead to exhausting all available capacity, even if each scrape had sample_limit set and scraped fewer time series than this limit allows.
Extra metrics exported by Prometheus itself tell us if any scrape is exceeding the limit and if that happens we alert the team responsible for it.
This also has the benefit of allowing us to self-serve capacity management – there’s no need for a team that signs off on your allocations, if CI checks are passing then we have the capacity you need for your applications.
The main reason why we prefer graceful degradation is that we want our engineers to be able to deploy applications and their metrics with confidence without being subject matter experts in Prometheus. That way even the most inexperienced engineers can start exporting metrics without constantly wondering “Will this cause an incident?”.
Another reason is that trying to stay on top of your usage can be a challenging task. It might seem simple on the surface, after all you just need to stop yourself from creating too many metrics, adding too many labels or setting label values from untrusted sources.
In reality though this is as simple as trying to ensure your application doesn’t use too many resources, like CPU or memory – you can achieve this by simply allocating less memory and doing fewer computations. It doesn’t get easier than that, until you actually try to do it. The more any application does for you, the more useful it is, the more resources it might need. Your needs or your customers’ needs will evolve over time and so you can’t just draw a line on how many bytes or cpu cycles it can consume. If you do that, the line will eventually be redrawn, many times over.
In general, having more labels on your metrics allows you to gain more insight, and so the more complicated the application you’re trying to monitor, the more need for extra labels.
In addition to that in most cases we don’t see all possible label values at the same time, it’s usually a small subset of all possible combinations. For example our errors_total metric, which we used in example before, might not be present at all until we start seeing some errors, and even then it might be just one or two errors that will be recorded. This holds true for a lot of labels that we see are being used by engineers.
This means that looking at how many time series an application could potentially export, and how many it actually exports, gives us two completely different numbers, which makes capacity planning a lot harder.
Especially when dealing with big applications maintained in part by multiple different teams, each exporting some metrics from their part of the stack.
For that reason we do tolerate some percentage of short lived time series even if they are not a perfect fit for Prometheus and cost us more memory.
Finally we maintain a set of internal documentation pages that try to guide engineers through the process of scraping and working with metrics, with a lot of information that’s specific to our environment.
Prometheus and PromQL (Prometheus Query Language) are conceptually very simple, but this means that all the complexity is hidden in the interactions between different elements of the whole metrics pipeline.
Managing the entire lifecycle of a metric from an engineering perspective is a complex process.
You must define your metrics in your application, with names and labels that will allow you to work with resulting time series easily. Then you must configure Prometheus scrapes in the correct way and deploy that to the right Prometheus server. Next you will likely need to create recording and/or alerting rules to make use of your time series. Finally you will want to create a dashboard to visualize all your metrics and be able to spot trends.
There will be traps and room for mistakes at all stages of this process. We covered some of the most basic pitfalls in our previous blog post on Prometheus – Monitoring our monitoring. In the same blog post we also mention one of the tools we use to help our engineers write valid Prometheus alerting rules.
Having good internal documentation that covers all of the basics specific for our environment and most common tasks is very important. Being able to answer “How do I X?” yourself without having to wait for a subject matter expert allows everyone to be more productive and move faster, while also avoiding Prometheus experts from answering the same questions over and over again.
Prometheus is a great and reliable tool, but dealing with high cardinality issues, especially in an environment where a lot of different applications are scraped by the same Prometheus server, can be challenging.
We had a fair share of problems with overloaded Prometheus instances in the past and developed a number of tools that help us deal with them, including custom patches.
But the key to tackling high cardinality was better understanding how Prometheus works and what kind of usage patterns will be problematic.
Having better insight into Prometheus internals allows us to maintain a fast and reliable observability platform without too much red tape, and the tooling we’ve developed around it, some of which is open sourced, helps our engineers avoid most common pitfalls and deploy with confidence.
Post Syndicated from arrohan original https://aws.amazon.com/blogs/messaging-and-targeting/how-to-send-web-push-notifications-using-amazon-pinpoint/
Web Push Notifications (also known as browser push notifications) are messages from a website you receive in your browser. These messages are intended to be rich, contextual, timely, personalized and best used to engage, re-engage, and retain website visitors. For instance, as a website owner you could use web push notifications to notify users about sales, important updates or new content on your website.
Push notifications are short messages that are displayed directly on the user’s screen sent via mobile applications, providing timely information and messages like order status, promotions, or relevant news in the application.
Web push notifications are simply push notifications sent via web browsers (the browser application on the device), and they work across platforms – Desktop, mobile and tablet. They are a newer channel than push notifications, and have now become a part of the modern marketing strategy alongside native app push notifications, emails and SMS.
In the case of mobile apps, the user must install the application to receive push notifications. In the case of web push, there is no need to download any software—it just takes one click on your website.
Let’s consider a real-world example. Suppose you are an e-commerce website where customers can purchase products. Once, the purchase has been made, customers would be interested in getting real time updates of where the package is in transit, when is it likely to be delivered, a confirmation that the shipment has been delivered and so on. Web push notifications can be an excellent way of providing such updates. Accessing email on mobile devices is often unwieldy, SMS messages cannot support images and are constrained in length (also they typically they cost more money to send!). Push notifications are perfect for such a use case. Till now, the major constraint was that it would require users to install your app on their device. Web push notifications gives website owners and customers the power of push notifications without any need for driving app installs.
Marketers in a variety of sectors like travel, publishing, restaurant & delivery, finance and insurance can use push notifications to improve their down-to-funnel conversions. From new content alerts to limited-time promotions to upcoming events, push messages are short, crisp and drive engagement, conversion, and retention. A short search on the AWS blogs website gives us a number of examples of businesses who have created value for their customers with the help of push notifications. Some of the key advantages of web push notifications are:
What is Amazon Pinpoint?
Amazon Pinpoint is an AWS service that provides scalable, targeted multichannel communications. Amazon Pinpoint enables companies to send messages to customers through SMS, push notifications, in-app notifications, email, and voice channels. To learn more about Amazon Pinpoint, visit the website and documentation.
Firebase uses cloud services for its notification services on Android, iOS & Web. Firebase Cloud Messaging or FCM run on basic principles of tokens, which is uniquely generated for each device & later used for sending messages to respective devices. There are two key advantages of using FCM for sending web push notifications:
Now at this point, you might be thinking, Web push notifications can go a long way towards delighting customers and FCM already abstracts the complexities of sending web push. So why do I need Amazon Pinpoint?
Well, integration with Amazon Pinpoint offers a number of advantages. Here are a few:
In this blog we will see how to send web push notifications using Amazon Pinpoint on a website built using AWS Amplify.
Enable web push by using FCM as an intermediary service and Pinpoint as an app server (map FCM tokens to actual users) and a push campaign management tool. Integrate web push protocol, FCM and Amazon Pinpoint.
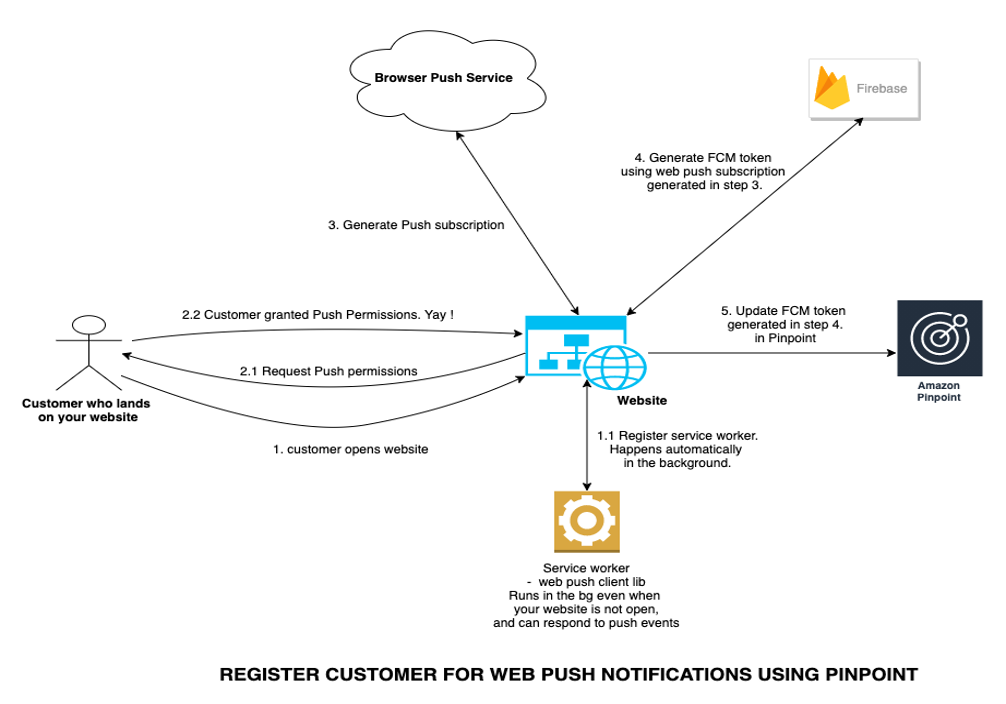
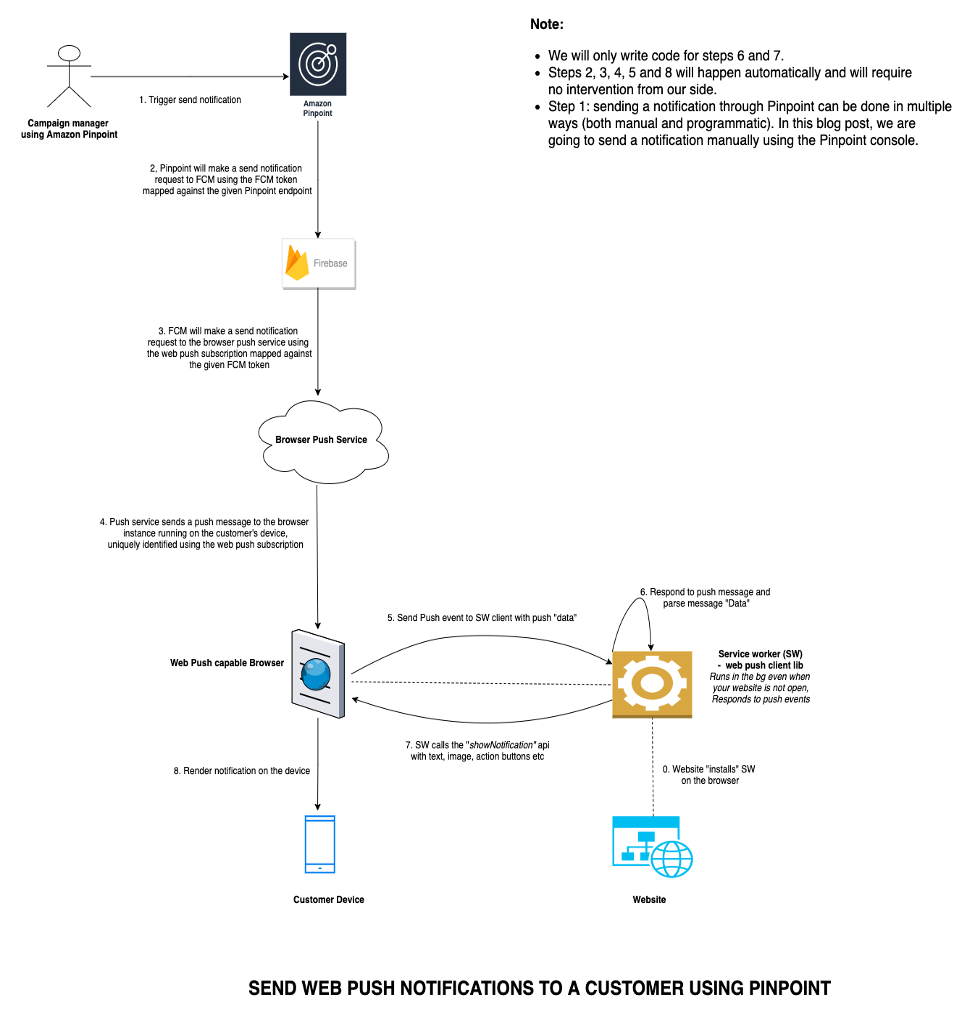
In this blog post, we will create a simple demo website using Amplify which can be used to create web push subscriptions and also receive web push messages. We will integrate this website with FCM js sdk and Amazon Pinpoint to store the FCM push tokens on Pinpoint. Later we will see how to send web push notifications using Amazon Pinpoint with FCM acting as an intermediary.
The above can be broken down into the below simple and independent steps:
You can see checkout my demo website here.
The source code for this demo website (and the blog) is available here.
For this walkthrough, you should have the following prerequisites:
In addition to the necessary prerequisites mentioned above, I would highly recommend readers to go through the below in order to derive maximum value from this blog post.
Let’s deploy the demo web app using AWS Amplify to see how all the parts come together.
git clone ssh://git.amazon.com/pkg/ArrohanWebPushPoc (branch: PinpointBlog) <github_link>
It is possible that Firebase may change the UI of the console in the future so the given screenshots may not be exactly reflective of the UI, but the broad steps would remain the same.
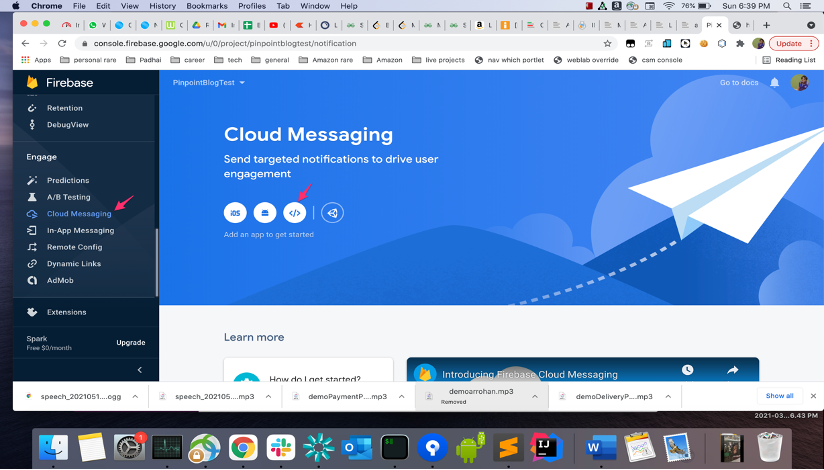
firebaseConfig main.js with the actual values for your project.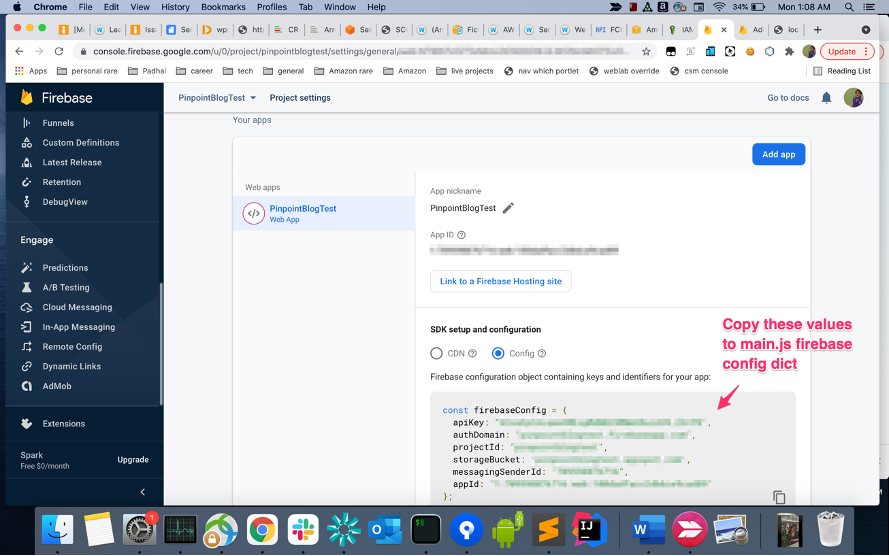
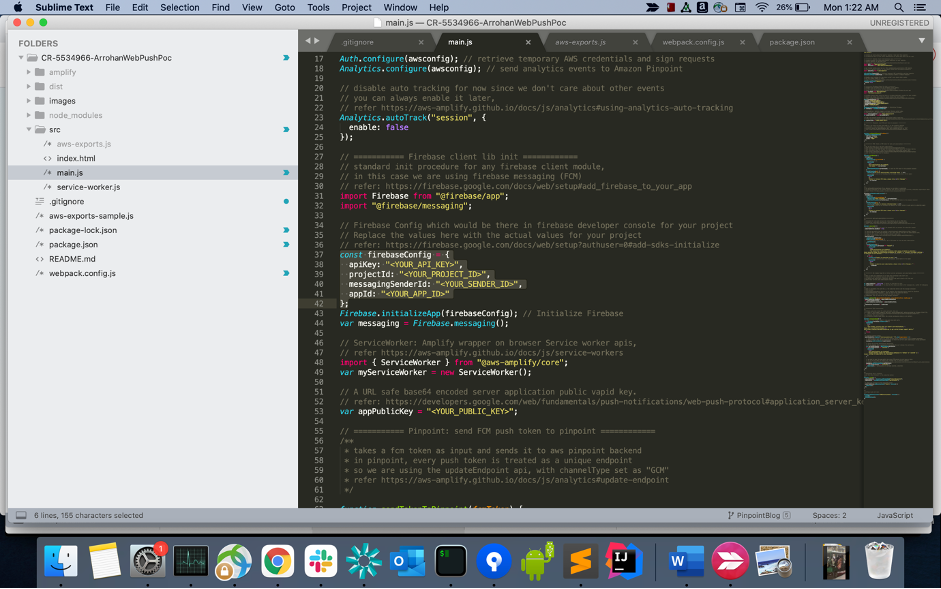
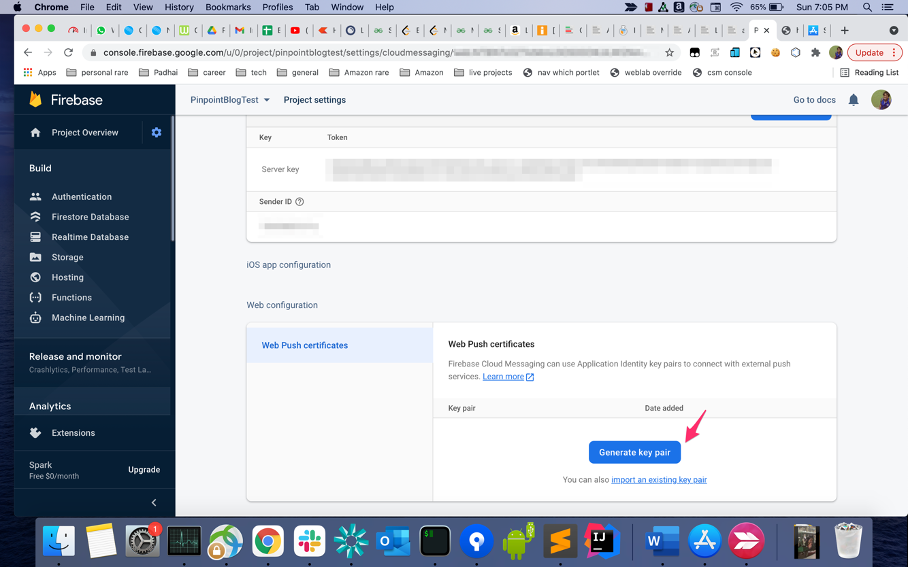
<YOUR PUBLIC KEY> in the file main.js in the source code with the vapid public key you generated in the previous step.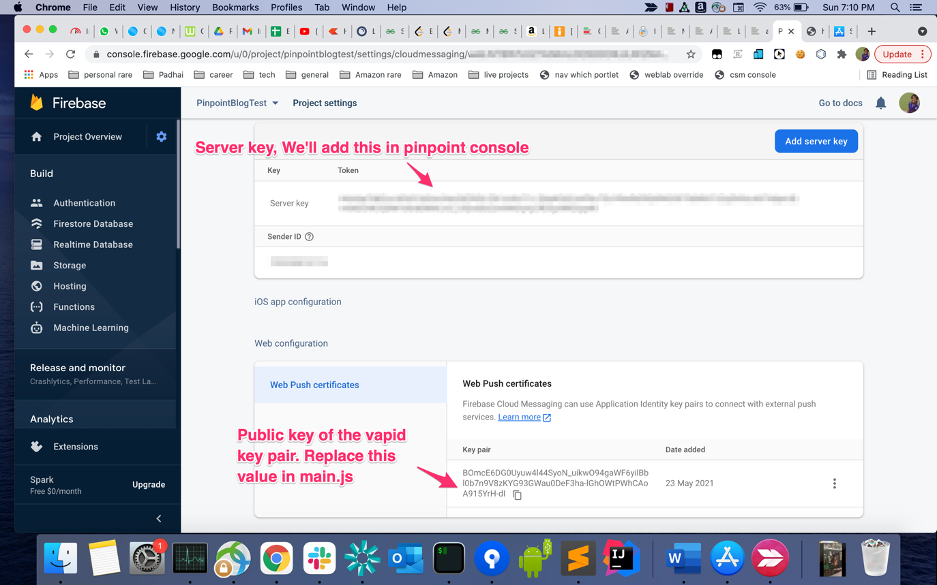
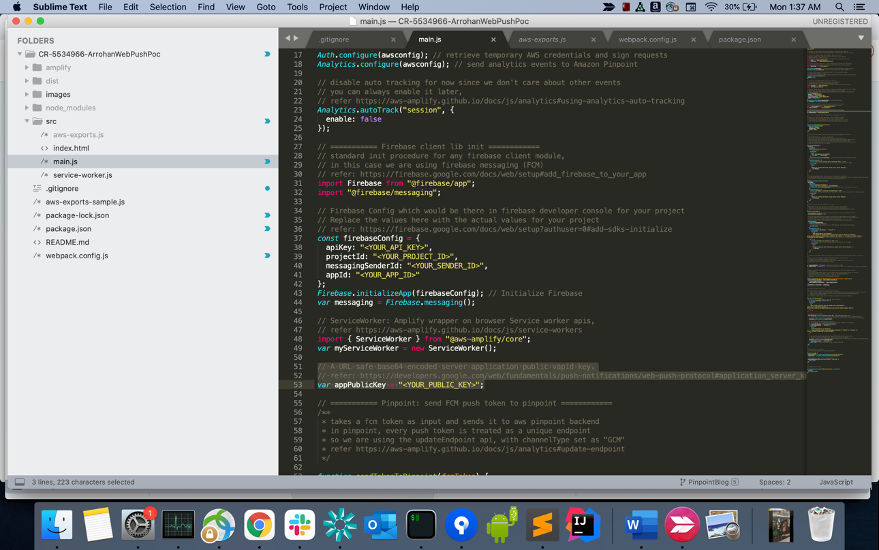
npm install.
amplify init. Enter the required details, the default config should work fine.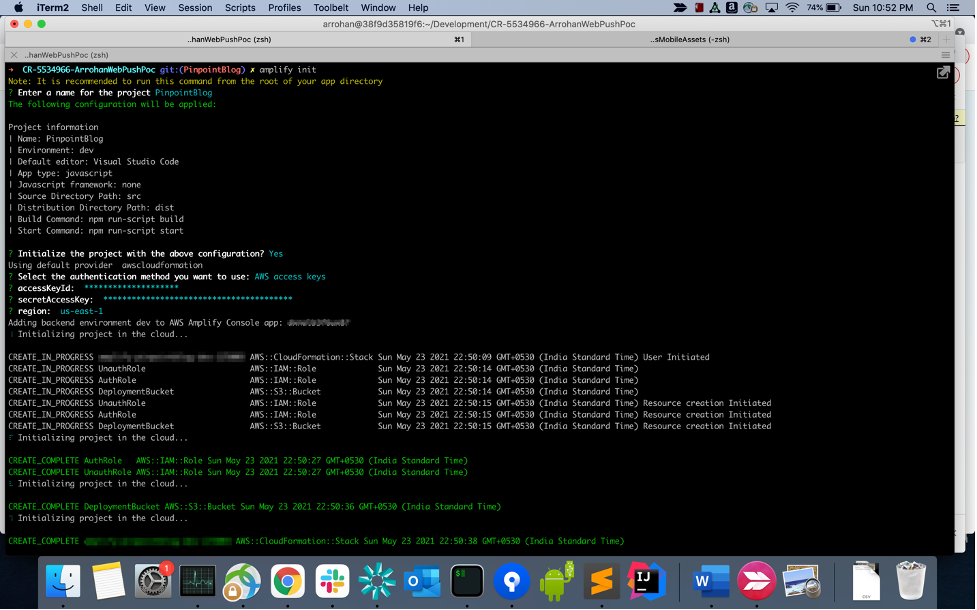
amplify add analytics. Choose Amazon Pinpoint as the analytics provider and accept all defaults.Yes when you get this.amplify push. A configuration file (aws-exports.js) will be added to the source directory. Notice, we are calling this file from our main.js file.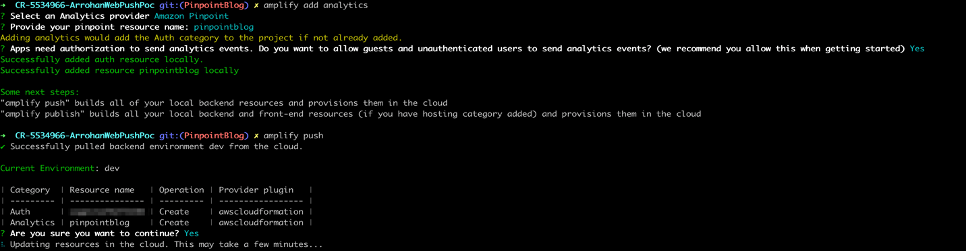
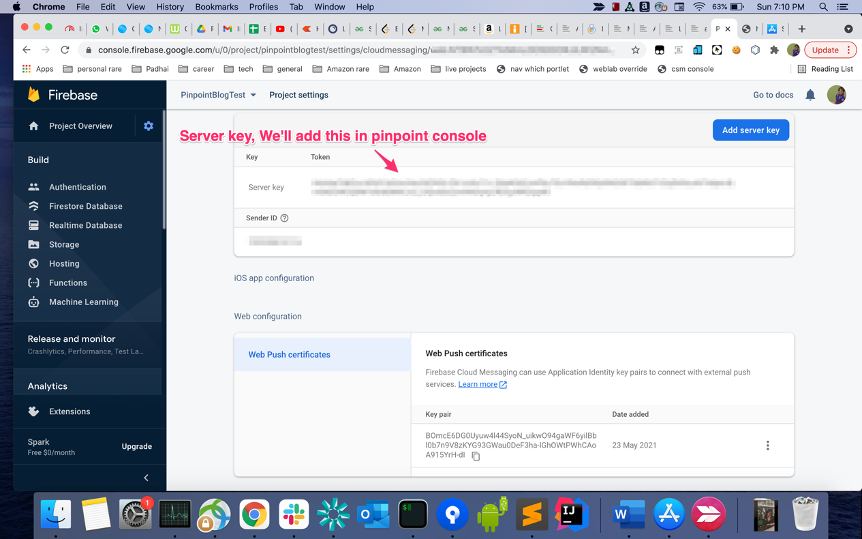
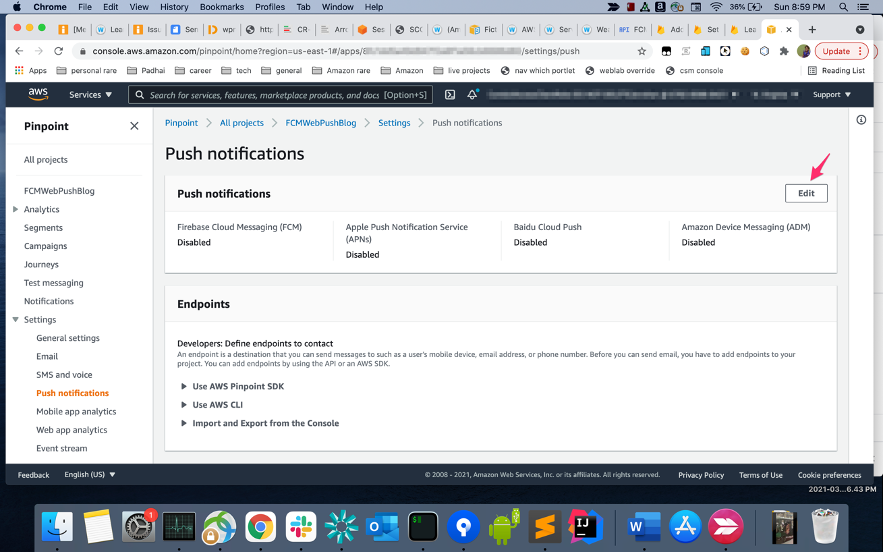
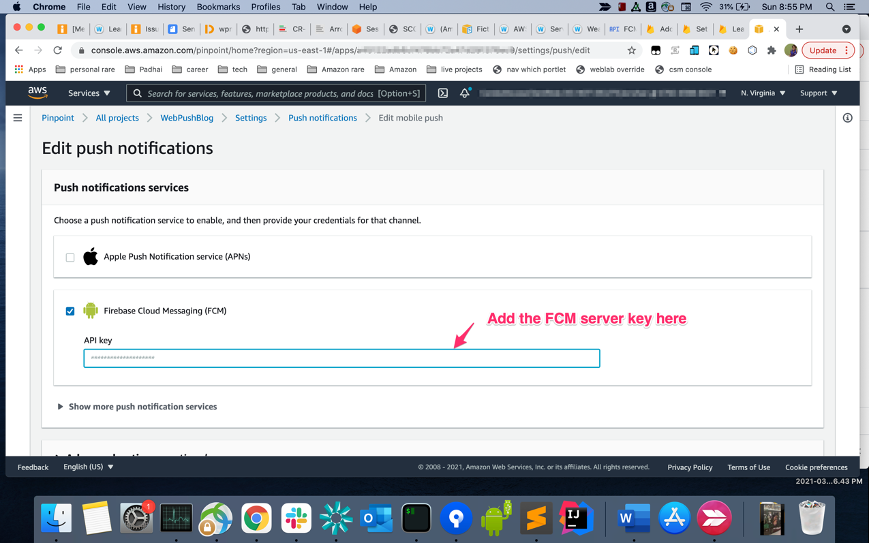
npm start, our web app will be running on http://localhost:8080/index.html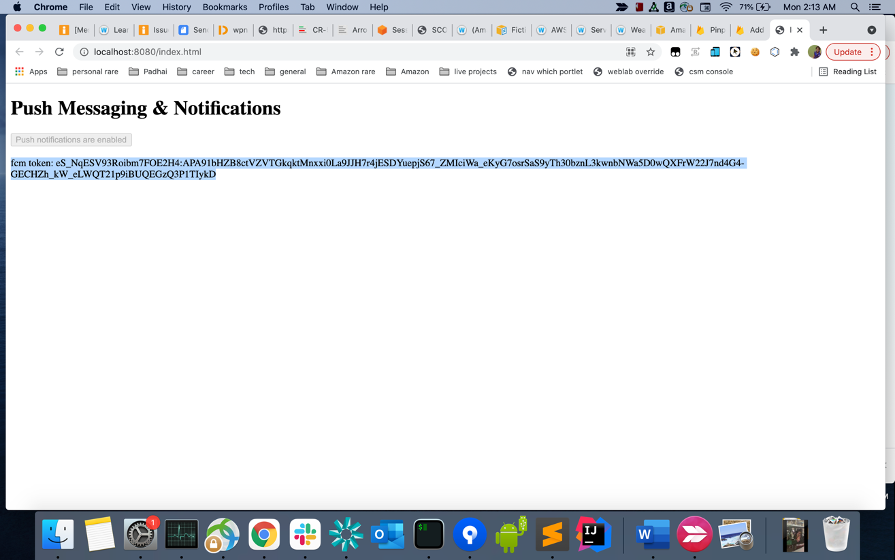
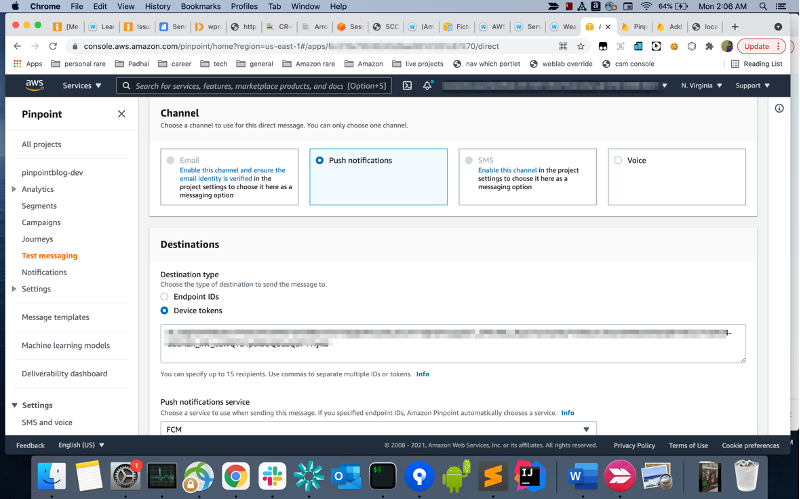
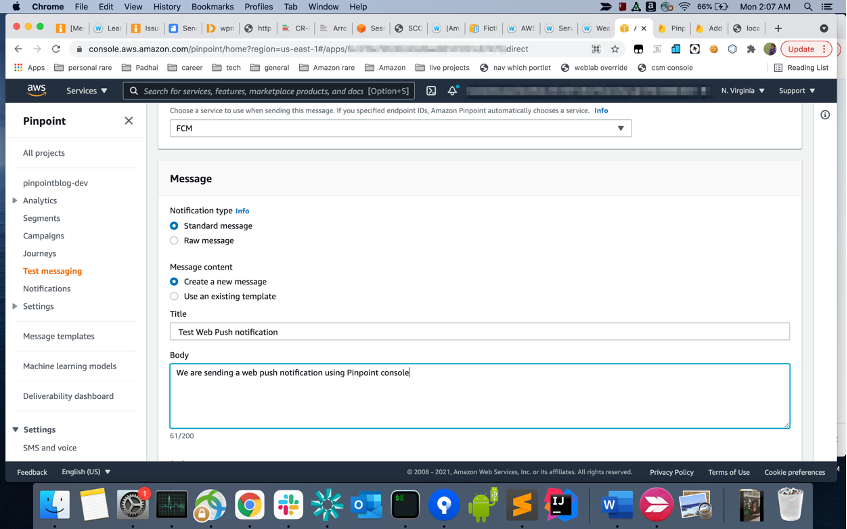
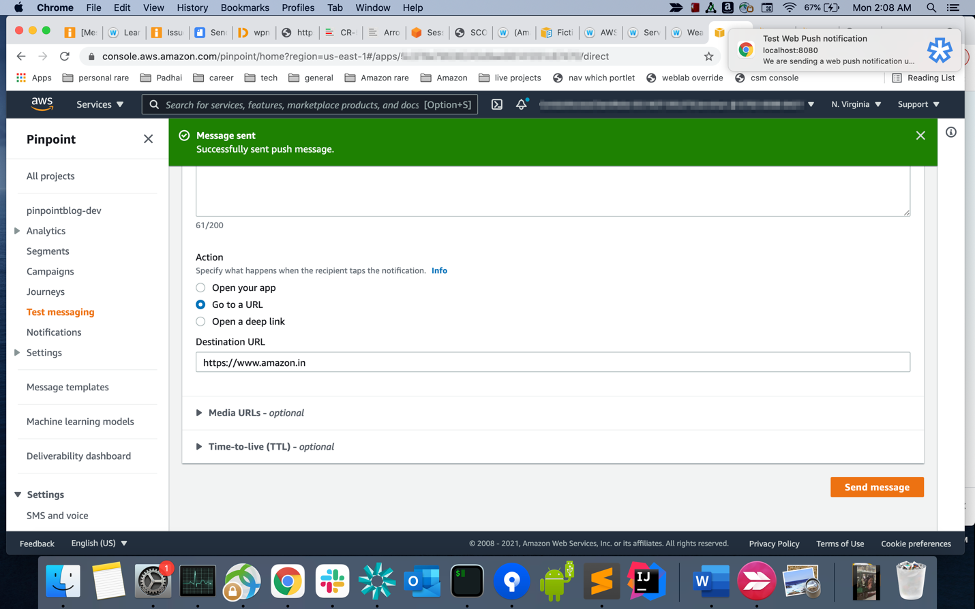
amplify add hosting followed by amplify publish. Remember that for web push (service workers) to work, your site should be https.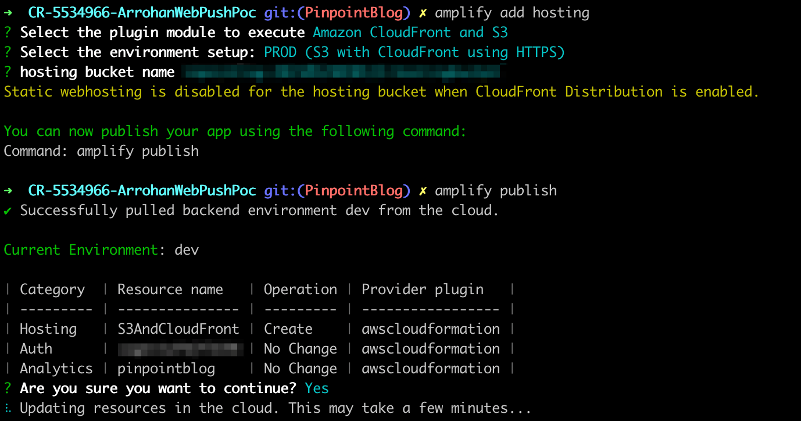
package.json.aws-exports.js: Auto generated configuration file created by Amplify cli. This file contains the configuration and endpoint metadata used to link your front end to your backend services. It will be structured similar to the sample config file.src: The folder which contains the source code for our web app. It contains:
This small demo shows how we can send web push notifications using Amazon Pinpoint. As next steps to come up with an actual production ready solution, you can look into the following:
pinpoint.notification.body“) field on the pinpoint console to send a custom json string.updateEndpoint api and pass optOut from ‘ALL’ as the argument.In this section we will quickly go over the steps to delete the resources we created for this demo to make sure that we do not incur any charges.
amplify delete from the project directory on your command line.Post Syndicated from Shibu Nair original https://aws.amazon.com/blogs/architecture/boosting-resiliency-with-an-ml-based-telemetry-analytics-architecture/
Data proliferation has become a norm and as organizations become more data driven, automating data pipelines that enable data ingestion, curation, and processing is vital. Since many organizations have thousands of time-bound, automated, complex pipelines, monitoring their telemetry information is critical. Keeping track of telemetry data helps businesses monitor and recover their pipelines faster which results in better customer experiences.
In our blog post, we explain how you can collect telemetry from your data pipeline jobs and use machine learning (ML) to build a lower- and upper-bound threshold to help operators identify anomalies in near-real time.
The applications of anomaly detection on telemetry data from job pipelines are wide-ranging, including these and more:
There are five key tenets of telemetry analytics, as in Figure 1.

Figure 1. Key tenets of telemetry analytics
The key tenets for near real-time telemetry analytics for data pipelines are:
This blog post describes how customers can easily implement these steps by using AWS native no-code, low-code (AWS LCNC) solutions.
The architecture defined here helps customers incrementally enable features with AWS LCNC solutions by leveraging AWS managed services to avoid the overhead of infrastructure provisioning. Most of the steps are configurations of the features provided by AWS services. This enables customers to make their applications resilient by tracking and resolving anomalies in near real time, as in Figure 2.
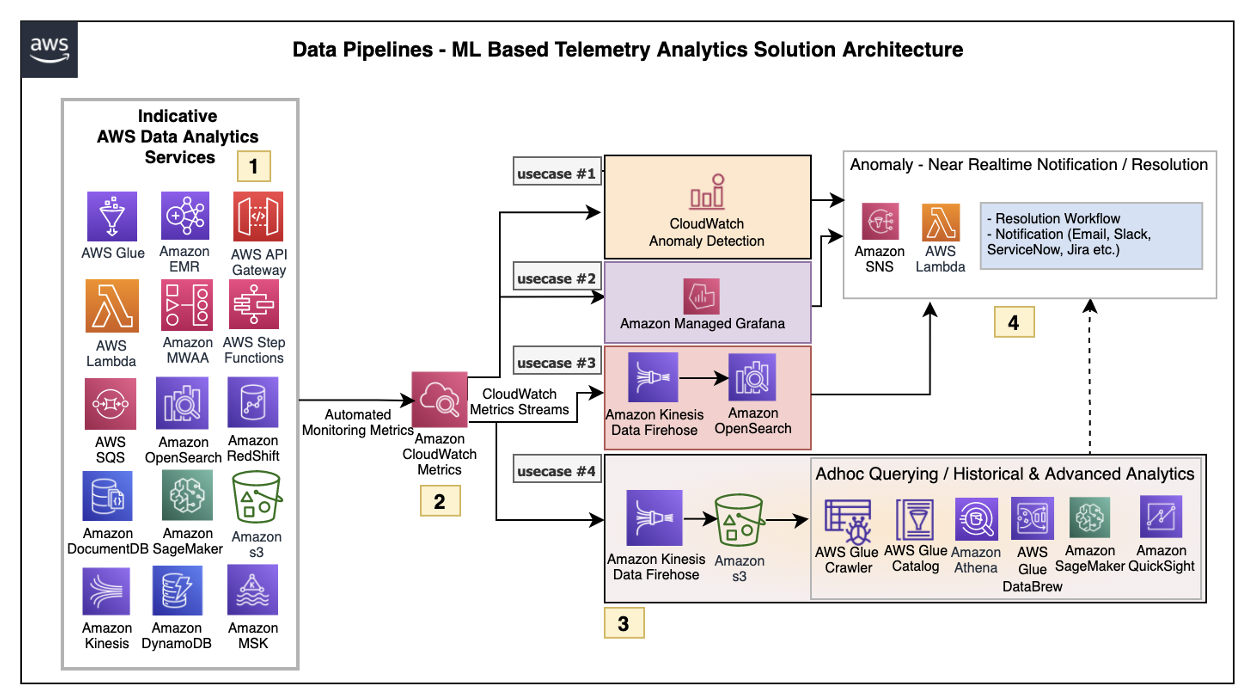
Figure 2. ML-based telemetry analytics solution architecture
Let’s explore each of the architecture steps in detail.
1. Indicative AWS data analytics services: Choose from a broad range of AWS analytics services, including data movement, data storage, data lakes, big data analytics, log analytics, and streaming analytics to business intelligence, ML, and beyond. This diagram shows a subset of these data analytics services. You may use one or a combination of many, depending on your use case.
2. Amazon CloudWatch metrics for telemetry analytics: Collecting and visualizing real-time logs, metrics, and event data is a key step in any process. CloudWatch helps you accomplish these tasks without any infrastructure provisioning. Almost every AWS data analytics service is integrated with CloudWatch to enable automatic capturing of the detailed metrics needed for telemetry analytics.
3. Near real-time use case examples: Step three presents practical, near real-time use cases that represent a range of real-world applications, one or more of which may apply to your own business needs.
Use case 1: Anomaly detection
CloudWatch provides the functionality to apply anomaly detection for a metric. The key business use case of this feature is to apply statistical and ML algorithms on a per-metrics basis of business critical applications to proactively identify issues and raise alarms.
The focus is on a single set of metrics that will be important for the application’s functioning—for example, AWS Lambda metrics of a 24/7 credit card company’s fraud monitoring application.
Use case 2: Unified metrics using Amazon Managed Grafana
For proper insights into telemetry data, it is important to unify metrics and collaboratively identify and troubleshoot issues in analytical systems. Amazon Managed Grafana helps to visualize, query, and corelate metrics from CloudWatch in near real-time.
For example, Amazon Managed Grafana can be used to monitor container metrics for Amazon EMR running on Amazon Elastic Kubernetes Service (Amazon EKS), which supports processing high-volume data from business critical Internet of Things (IoT) applications like connected factories, offsite refineries, wind farms, and more.
Use case 3: Combined business and metrics data using Amazon OpenSearch Service
Amazon OpenSearch Service provides the capability to perform near real-time, ML-based interactive log analytics, application monitoring, and search by combining business and telemetry data.
As an example, customers can combine AWS CloudTrail logs for AWS logins, Amazon Athena, and Amazon RedShift query access times with employee reference data to detect insider threats.
This log analytics use case architecture integrates into OpenSearch, as in Figure 3.

Figure 3. Log analytics use case architecture overview with OpenSearch
Use case 4: ML-based advanced analytics
Using Amazon Simple Storage Service (Amazon S3) as data storage, data lake customers can tap into AWS analytics services such as the AWS Glue Catalog, AWS Glue DataBrew, and Athena for preparing and transforming data, as well as build trend analysis using ML models in Amazon SageMaker. This mechanism helps with performing ML-based advanced analytics to identify and resolve recurring issues.
4. Anomaly resolution: When an alert is generated either by CloudWatch alarm, OpenSearch, or Amazon Managed Grafana, you have the option to act on the alert in near-real time. Amazon Simple Notification Service (Amazon SNS) and Lambda can help build workflows. Lambda also helps integrate with ServiceNow ticket creation, Slack channel notifications, or other ticketing systems.
Let’s explore another practical example using an architecture that demonstrates how AWS Step Functions orchestrates Lambda, AWS Glue jobs, and crawlers.
To report an anomaly on AWS Glue jobs based on total number of records processed, you can leverage the glue.driver.aggregate.recordsRead CloudWatch metric and set up a CloudWatch alarm based on anomaly detection, Amazon SNS topic for notifications, and Lambda for resolution, as in Figure 4.
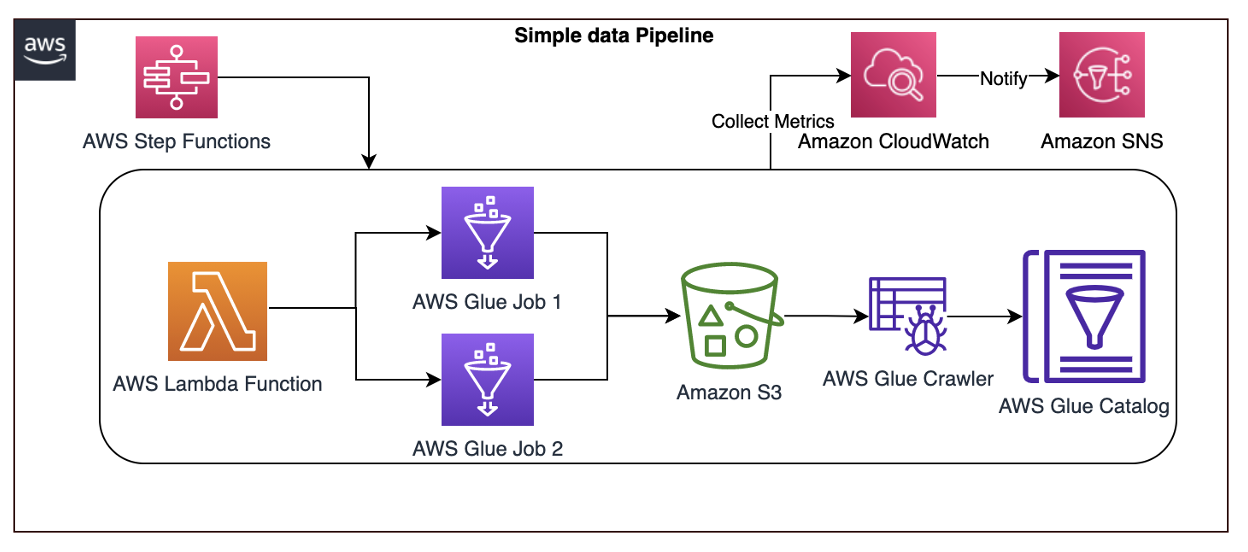
Figure 4. AWS Step Functions orchestrating Lamba, AWS Glue jobs, and crawlers
Here are the steps involved in the architecture proposed:
glue.driver.aggregate.recordsRead from AWS Glue jobs.glue.driver.aggregate.recordsRead metric and set a notification to Amazon SNS topic.In this blog post, we covered a recommended architecture to enable near-real time telemetry analytics for data pipelines, anomaly detection, notification, and resolution. This provides resiliency to the customer applications by proactively identifying and resolving issues.
Post Syndicated from Милва Цветкова original https://bivol.bg/milva_tsvetkova_goce_delchev.html

Този документален материал беше създаден, за да запечата градацията на случилото се в Скопие по време на честването на рождението на Гоце Делчев през 2023 г. Фактите и обстоятелствата, документирани…
Post Syndicated from The History Guy: History Deserves to Be Remembered original https://www.youtube.com/watch?v=U2eYrWwBN_0
Post Syndicated from Janne Pikkarainen original https://blog.zabbix.com/whats-up-home-follow-the-news/25497/
Can you follow the news with Zabbix? Of course, you can! By day, I am a lead site reliability engineer at a global cyber security company. By night, I monitor my home with Zabbix & Grafana and do some weird experiments with them. Welcome to my blog about the project.
A long time ago, before the dawn of social media, RSS (Really Simple Syndication) readers were all the rave. Instead of visiting each site you followed individually, you could add their RSS feeds to your RSS reader, which then would show you the latest news titles from as many sources as you wanted. Not only the titles, but depending on the news site you could also read a teaser or even the full news through your RSS reader without ever visiting the site itself.
This was all good for the end-users, but the beancounters at the news companies got worried, as of course without visits to news sites, the advertisement income would come down, too. RSS readers can still be useful, but…. oh, I’ll need to stop, this is not the scope of this blog post.
Instead, the underlying technology of RSS is what makes it interesting. It’s just XML, so easy to consume by whatever software. Even though RSS is not a media darling anymore, it’s useful for gathering info from various sources to be then utilized somewhere else — like in Zabbix.
So, how to follow the latest posts on this site through Zabbix? Easy, as this is just about parsing some XML.

Let’s begin with adding a new HTTP agent item.

With that in place, let’s add some dependent items, with the end result being this:

Each of those is just dependent items with some item pre-processing — the example below parses the first occurrence of title to the text.

In this case, I created a separate dashboard to show the latest blog post title, a link to it and the publication date. Wouldn’t be too hard to create a custom Zabbix module to make this fancier, but let’s leave it for another day. For now, by just using Item value widget types, we get this.

In the real world, there are plenty of actual use cases. Use it to alert you about the latest vulnerabilities, updates or other news about the stuff you have in your environment. Create a news dashboard for your security operations team or developers. If your own products do utilize RSS for something, this also can be very handy for end-to-end testing, as both Zabbix and your eyes can spot visually if something is not right. I’m sure you can come up with more and better ideas.
I have been working at Forcepoint since 2014 and never get tired of the news. — Janne Pikkarainen
This post was originally published on the author’s page.
Post Syndicated from Емилия Милчева original https://www.toest.bg/ima-li-koi-ima-li-kak-a-mogat-li/

Изборите така зачестиха, че партиите дори не си правят труда да предлагат нови послания и предизборни платформи. Че какво им е на старите – винаги и по всяко време се оферират справедлива държава, нов асфалт и европейски доходи.
В навечерието на поредните избори на 2 април няма лозунги за ред в хаоса, гонене на мутри и „всякая сволочь“, за пунически войни с корупцията и единство на нацията. След провалите в 48-мия парламент и предстоящия за две години пети вот политическата патетика би изглеждала по-скоро карнавална, отколкото нахъсваща и мобилизираща.
Проблемът с мигрантите заради охраната на българо-турската граница измести темата за Шенген. Провалът в подготовката за еврозоната отложи темата за еврото, но не и страховете, разпалвани от „Възраждане“, БСП и други проруски сили, за бум на цените и обедняване. Така две смислени и важни за българското бъдеще в ЕС цели изпаднаха от предизборната кампания.
Темата за корупцията започна да придобива по-ясни очертания с втория списък със санкции по Глобалния акт „Магнитски“, проверките на Европейската прокуратура на манипулациите с парникови емисии, свързани с империята на Христо Ковачки, и публично обявените разкрития на служебния кабинет, че асфалтът по Северната тангента е 14 см вместо 20. В строителството на 17-километровата магистрална отсечка за 220 млн. лв. са все предпочитани при управленията на ГЕРБ строители – консорциум ХПВС–ССТ, в който участват „Водстрой 98“, „Хидрострой“ АД, „Пътни строежи Велико Търново“ АД, „Пътинженерингстрой“ АД и „Пътстрой Бургас“. Прокурорите на Лаура Кьовеши проверяват още един спорен ремонт – този на „Графа“, и качеството на изпълнението му, предизвикало вълна от критики и сарказъм преди време. Изпълнител на ремонта на Зона 2 от центъра на София на стойност 20 113 417 лв. без ДДС е друг фаворит на ГЕРБ – „Джи Пи Груп“.
(Ако правителството на президента продължи да вади нови факти за най-свидното на Борисов – пътищата, значи ли, че краткият флирт между него и Радев е приключил?)
Няма обаче предложения за решения на най-тежкия за мнозина българи проблем – поскъпването на храните. За българските пенсионери, работещите бедни, уязвимите малцинствени групи това е жизненоважно.
Годишната инфлация на хранителните стоки е 24,5 % през януари, обяви на 2 март служебният земеделски министър Явор Гечев, като съобщи за „нелоялни търговски практики“, в т.ч. много големи маржове между цените на едро и дребно, достигащи до 90%. „Очеизвадно високи цени, които не са оправдани и водят до необосновано високи печалби“, както обясни Гечев по Нова телевизия. Как ще се справят политическите сили с овладяването на твърде скъпите храни в търговските вериги – служебният кабинет наблюдава и съобщава, ами редовният?
Остарелият Закон за защита на потребителите се нуждае от сериозни промени, както и този за защита на конкуренцията, а самата Комисия за защита на конкуренцията (КЗК) – от нов състав, който коалиционното правителство на „Промяната“ не свари да избере. Картелите са отдавнашен проблем на малкия български пазар, но доказването им е трудно и изисква, освен политическа воля, и по-прецизни нормативни разпоредби. Например да се даде възможност за внезапни проверки, тъй като сегашният закон изисква съдебно разрешение за инспекции на КЗК, а това означава и уведомяване на съответната компания от страна на съда. Тази законова разпоредба силно намалява вероятността да се намерят съответните доказателства.
Никоя от партиите с шанс за мандат за правителство в 49-тия парламент обаче не дава сигнали, че обмисля комплексни мерки за овладяване на високите цени на храните. Единствено БСП, която твърди, че е социална, обяви, че ще внесе незабавно в бъдещото Народно събрание законопроект за таван на цените на основните хранителни стоки. От новосформираната коалиция „Левицата“ веднага конкурираха с предложение за таван на надценките на 10 основни храни. ДПС, чиито избиратели са сред най-засегнатите от поскъпването, поставя инфлацията като основна тема в предизборната си кампания, без да назовава мерки за справяне, но слага на масата също и „дълбока конституционна реформа на съдебната система“, както каза Йордан Цонев.
Курс за такава реформа са обявили и ГЕРБ, и ПП, и ДБ. Известно е, че възгледите им се различават, независимо от заявката на Бойко Борисов в „Лице в лице“ по bTV, че този път ГЕРБ ще подкрепи законопроекта на служебния правосъден министър Крум Зарков за промени в Закона за съдебната власт, за да се въведе механизъм за разследване на главния прокурор. Но пък побърза да каже, че после трябва да се произнесе Конституционният съд.
ГЕРБ–СДС и „Продължаваме промяната – Демократична България“ са в схватка за първото място, ДПС и „Възраждане“ си оспорват третото, за БСП – каквото остане. „Български възход“, тази невзрачна политическа сила, която се запомни с поддакването си в 48-мия парламент, този път може и да не получи ударна инжекция гласове в последните часове на изборния ден, след като доскорошните ѝ партньори – Партията на зелените и Съюзът на свободните демократи – се оттеглиха от съвместно участие за 2 април.
Провалиха се и преговорите с ВМРО, а АБВ на Румен Петков, декларирала подкрепа за БВ на миналия вот, се вля в коалиция „Левицата“ заедно с други отломки от БСП. Но същинският удар дойде от проверката на Европейската прокуратура по енергийни предприятия, свързвани с Христо Ковачки, сочен и като спонсора за(д) „Български възход“.
„Има такъв народ“, която изпадна от 48-мия парламент, НДСВ, „Левицата“, новата коалиция „Заедно“ на бившите славитрифоновци Ива Митева и Любомир Каримански ще се борят ако не за парламент, за партийна субсидия.
Засега изглежда, че въпреки раздорите при сглобяването на листите, коалицията ПП–ДБ привлича разнородна подкрепа – от „Републиканци за България“, партията на някогашния Втори в ГЕРБ Цветан Цветанов, от БЗНС и „Обединени земеделци“.
Големият въпрос за 2 април и всички избори след войната в Украйна, която промени света, не е кой ще е първи и ще успее ли да състави редовно правителство. Въпросът на въпросите е какво бъдеще за държавата България и нейните граждани предлагат политическите сили.
На този въпрос не могат да отговорят. Разбира се, могат да измрънкат извинения като „нека видим резултатите“ или „зависи от…“. Същинската беда е, че нямат отговор, защото липсват визия и визионери, защото мислят в плиткия обхват на тяснопартийни цели, защото ги спъват лобистки интереси, защото не знаят как да се справят с големите и трайно нерешени проблеми в демографията, здравеопазването и образованието. Затова и ги избягват по време на управлението си – в замяна добавят по някоя и друга стратегия в килограмите празнословие и им наливат още милиони.
Ако партиите са неспособни да разкажат бъдещето, избирателите ще им разкажат играта.
Post Syndicated from Севда Семер original https://www.toest.bg/na-vtoro-chetene-edin-den-v-muzeya/

Докато четях „Един ден в музея“ – гид за най-известните музеи в София под формата на комикс, – си спомних за първия път, когато от училище организираха посещение на Националния исторически музей.
Тъкмо бяха открили метрото в София и учителите ни бяха решили да се възползват, за да ни заведат. От нас само едно дете беше пътувало, така че, след като обявиха новината за музея, въпросният съученик се провикна – искаше да ни съобщи важна информация. Ако не си внимателен и не си пазиш добре краката, предупреди той, метрото ще ти ги пореже.
До днес не знам откъде се появи тази история, но тогава я приех сериозно – и въображението ми взе да работи. С онази запазена за детството смесица от неописуем ужас и любопитство зачаках деня на посещението. Опитвах се да си представя как точно става порязването, и още помня всички сценарии, за които исках да бъда подготвена. Най-вероятно ми се струваше метрото да няма под – тоест трябваше да си държиш краката изправени, щом седнеш. За всеки случай тренирах след училище.
Щом денят настъпи, бях заета през цялото време да си отварям очите на четири, за да не пропусна точно къде и как се случва порязването. Помня и разочарованието, че нищо такова не видях. А пък от самия музей нямам абсолютно никакъв спомен.
Докато четях книгата на Зорница Христова и Тодор Петев с илюстрации от Сияна Захариева, се замислих каква организация е била направена в онзи отдавнашен ден – учителите безопасно да заведат двайсетина малки деца до сградата на музея, да планират какво точно да им покажат вътре, какво да им разкажат, като се погрижат всяко дете да получи храна, вода и внимание. А пък аз съм си представяла и предвкусвала нещо страшно и интересно, което до такава степен е занимавало въображението ми, че самото посещение в музея, заради което изобщо сме били в метрото, е потънало някъде в паметта ми.
Именно напасването на реалността с въображението е идейният център на книжката. Още с предговора тя се обръща едновременно и към децата, и към родителите, но с пълното съзнание, че малките читатели не обичат тези въвеждащи страници. Така че основното обяснение за това каква е книгата, е към родителя; на детето му се предлага да разгледа картинките и да реши къде иска да отиде. Това ми се стори много хубаво – да позволиш на детето да следва собствените си интереси, което веднага представя

„Един ден в музея“ е разделен на кратки глави, всяка от които – посветена на различен музей. Тук са „Квадрат 500“, Политехническият музей, дори Ботаническата градина – все интригуващи места. От всяко обаче са представени малък брой предмети, което може да изглежда странно – все пак нали това е хубавото на музея, разнообразието. Авторите обясняват, че
Затова тук основната нишка, скрепяваща всяка глава, са забавните и любопитни истории.
Водачи из различните музеи са необичайни герои – от учени до солници и други предмети и растения. Всяка глава приключва и с хубав списък от идеи как ученето да продължи. Всяко дете може да се почувства включено в разнообразни дейности: за някои би било интересно да направят експеримент, за други – да прочетат нещо допълнително, за трети – да идат в друг музей, където да открият свързани предмети. Авторите казват в предговора си, че са се опитали да активират всички сетива на децата, което много ми хареса – ученето все пак не е само интелектуална дейност, понякога трябва и да опиташ сам да си направиш сол.
Тази книга е една карта със съкровища, която може да отведе детето до всякакви дестинации. По този мил начин
Струва ми се, че немалко хора приемат музеите твърде сериозно – без да искам да звуча, сякаш обвинявам някого. Знам, че това идва от уважение, понякога към историята, друг път – към работата на онези, които са събрали експонатите.
Вярвам обаче, че най-хубавият начин да покажем уважение е да превърнем музея именно в площадка за игра. Важи и за възрастните. За мен беше страшно интересно да прочета напълно нови неща за любими музеи, в които съм била десетки пъти. Не използвам с лекота думата „вдъхновение“, но мисля, че в тази книга тя се изпълва със смисъл. Пътеводителят може да се използва дни наред, за да се посетят различни места. Полезно е, че се предлагат и по-общи инструменти за събуждане на любопитството – например описан е забавен начин да се четат картини, което е чудесно.
Може би най-важното от всичко е, че голяма част от въздействието на тази книга дава плодове във въображението на детето още преди то да стигне до музея. И малките посетители се превръщат в част от онова, което предстои да видят. Именно така се задейства магията на едно такова място: децата, застанали сред паметниците на културното наследство, създават лична връзка с тях. Връзка, която поражда спомени.


Красивите рисунки на Сияна Захариева също са превърнати в площадка за игра, например подканят детето да ги оцвети. Всичко в книгата е живо – от гаджета дървета до скелети, които се оплакват от домашното си. Хуморът е важна част, която също олекотява очакванията и изживяванията в музея. Съвсем позволено е, оказва се, да се смеем в тези сериозни и тихи зали.
Първата част спечели „Златен лъв“ за издателски проект с най-голяма обществена значимост. Лично аз се надявам поредицата да продължи, да се развива, даже да заеме цяла лавица. Все пак музеите са пълни с истории, а децата – с любопитство. Затова можеш да посещаваш любимата си зала или любимата си картина в различни възрасти, сезони, настроения, да гледаш как собственият ти поглед променя това, което виждаш, а то на свой ред променя теб самия. Независимо дали си малък, или голям. Защото музеите принадлежат на всички – поне за мен това е най-важното съобщение в тази книга.
Активните дарители на „Тоест“ получават постоянна отстъпка в размер на 20% от коричната цена на всички заглавия от каталога на „Точица“, както и на няколко други български издателства в рамките на партньорската програма Читателски клуб „Тоест“. За повече информация прочетете на toest.bg/club.
Никой от нас не чете единствено най-новите книги. Тогава защо само за тях се пише? „На второ четене“ е рубрика, в която отваряме списъците с книги, публикувани преди поне година, четем ги и препоръчваме любимите си от тях. Рубриката е част от партньорската програма Читателски клуб „Тоест“. Изборът на заглавия обаче е единствено на авторите – Стефан Иванов и Севда Семер, които биха ви препоръчали тези книги и ако имаше как веднъж на две седмици да се разходите с тях в книжарницата.
Post Syndicated from Crosstalk Solutions original https://www.youtube.com/watch?v=ZvIdFs3M5ic
