AWS Security Profiles: Jenny Brinkley, Director, AWS Security

Post Syndicated from Maddie Bacon original https://aws.amazon.com/blogs/security/aws-security-profiles-jenny-brinkley-director-aws-security/

AWS Security Profiles: Jenny Brinkley, Director, AWS Security
In the week leading up to AWS re:Invent 2021, we’ll share conversations we’ve had with people at AWS who will be presenting, and get a sneak peek at their work.


How long have you been at AWS, and what do you do in your current role?

I’ve been at AWS for 5½ years. I get to focus on the future of security and compliance. It gives me a lot of space to experiment and try new things, which is how I like to operate.

How did you get started in AWS Security?

I joined AWS through a startup acquisition, and I actually didn’t think I was going to go with the acquisition. I thought AWS would be way too big and move way too slow. I love being in environments where I get to move fast and be entrepreneurial. I started on the product side. I was able to learn what it takes to build and ship products at the scale of AWS – which is on another level and mind-blowing.

Then, like others at AWS, I was able to reinvent myself, find different passions, and experiment with new things. One of those areas for me was compliance. I started to get perspective on how that space was being defined by regulatory activity for the cloud, and it started opening my mind in different ways.

I started thinking, how do you make compliance easier for customers? How do you work with regulated entities to understand how to audit, and to understand the function of how the cloud operates? From there, my career has been about changing how to think about product, about how to make security easier. Layering in this compliance aspect, too, means I get to play in all these different worlds, work with internal and external customers, and work to simplify security, while also understanding where and how compliance fits in, without slowing down innovation.

How do you explain your job to non-tech friends?

I explain my work as removing the fear around security. You go see images of people in hoodies, with darkened faces, and binary code running behind them, and my job is to break that perception and walk in the light – yes, that’s my nod to Olivia Pope in Scandal. I love the idea of that gladiator mentality. You’re going in and solving the big problems, but you’re also creating more visibility and transparency around how security operates. And you’re doing this without making anyone afraid that they’re being watched or monitored, and without holding back innovation. My job is to provide that transparency and clarity, and give people prescriptive guidance on how to operate securely on AWS.

What are you currently working on that you’re excited about?

So much! That’s what I really love about my job – I get to play in a lot of spaces, and the context switching is something that really fuels me. One of the top projects I’m working on is something we just released in response to an ask from the White House, which I feel really privileged to work on. We released a new Cybersecurity Awareness training which is now available to everyone in the world. You can access this training right now, and you can share it with your grandparents or implement it in your corporation or small business. We were able to take a training product we built for all Amazon employees–and then externalize it. The size and the scope is something I’m really excited about. Making security easier for everybody is a big mission for us.

Another big area is up-skilling. You hear a lot about security jobs being the future, so we’re building everything from apprenticeships to new learning paths for anyone interested in security. We’re thinking about how we can build quick learning modules for people to listen to on the go. That’s something I get really excited about in this job – creating opportunities for people to understand that security jobs and opportunities are vast. If you’re curious and want to learn new things, AWS is endless.

You’re presenting at re:Invent this year – can you give readers a sneak peek at what you’re covering?

I am partnering with Eric Brandwine, AWS VP/Distinguished Engineer for a session called Introverts and extroverts collide: Build an inclusive workforce (SEC204). Eric and I are night and day in terms of how we work. In our talk we’ll touch on some of the challenges we had when we first started working together, but how we found value in our different approaches.

We’ll be discussing how he solves problems with technology and how I solve problems regarding people, and thinking about how that empathetic layer resonates between the two perspectives. Not every problem needs technology, and not every problem needs a people-focused solution. But, humans are behind any of those aspects of impact.

We’ll give prescriptive guidance to customers on how they should think about their security culture as it relates to people and as it relates to technology. We’ll talk about how those two worlds can blend together in a way that empowers an entire organization to prioritize security, and that they shouldn’t be afraid of it. We want to help bridge the gaps between the technologists and the empathetic individuals who think about how the technology lands in use cases across a business.

From your perspective, what’s the most important thing leaders can do to create an inclusive work environment?

Listening. Sitting back, getting the feedback, being vulnerable, asking the questions. So much of what we need to do now is practice that listening skill, really understand the motivations of our teams, and then try to create these safe working environments where people feel comfortable sharing their perspectives. It’s not that you’re going to act on everything everyone’s talking about, but at least you get diverse perspectives and points of view to help create an inclusive work environment that makes everyone want to show up, support each other, and do the best work possible.

What’s your favorite Leadership Principle at Amazon and why?

I have two. One is Learn and Be Curious because that is how I like to operate. I think, “what if…” or “why can’t we…”. Then Think Big pairs with “why can’t we…” The culture within AWS really supports that. On a daily basis, we can flip the script on how we think about our jobs and how we position the business.

If you’re entrepreneurial and like to create, this place is like a magic playground. Some people look at my job and they’re so confused with all the different things I get to do – but it goes back to that context switching. I believe that Learn and Be Curious and Think Big fit in that realm for me–I feel like I can be anything, I can do anything. I also had parents who told me as a kid that I could do anything and be anything, so I think that’s just who I am. Those two leadership principles help me to produce and do my best work.

What’s the thing you’re most proud of in your career?

That’s hard. It’s a couple of things. I’ve had a lot of incredible opportunities. One of which was being involved in a startup. We raised the money quickly, we worked with incredible customers, we solved really challenging business issues. The fact that I was able to bring that here to AWS, in a way that now hundreds of thousands of people get to see the kind of work we’re able to produce, is pretty cool.

But honestly, working with some of our new hires who are just getting into the workforce–especially with our diverse candidates–I’m at a place in my career where I want to create opportunities for others. I’m working to create safe spaces for people to operate and do their best work and really break down barriers for people who might not otherwise get those opportunities. That’s what I’m most excited about for the future, and also the most proud about–giving people opportunities to work in careers they never thought were available to them. I love that, and I get to do it daily.

If you had to pick any other job, what would you want to do?

Sports agent. I think I’d be so good at it. I would love to go work with young athletes, especially with the new NCAA ruling that college athletes can get paid for the use of their likeness. I would love to help them develop really interesting business plans.

If you have feedback about this post, submit comments in the Comments section below.

Want more AWS Security news? Follow us on Twitter.

Jenny Brinkley, Director, AWS Security

Jenny Brinkley

Jenny leads efforts for AWS Security to understand where compliance and security is headed. In her role as a Director, she helps teams understand how to consider security when building their services and deliverables. Prior to joining AWS, Jenny co-founded a security start-up, harvest.ai, that was acquired by AWS in April 2016.

Author

Maddie Bacon

Maddie (she/her) is a technical writer for AWS Security with a passion for creating meaningful content. She previously worked as a security reporter and editor at TechTarget and has a BA in Mathematics. In her spare time, she enjoys reading, traveling, and all things Harry Potter.

Volotea MRO Modernization in AWS

Post Syndicated from Albert Capdevila original https://aws.amazon.com/blogs/architecture/volotea-mro-modernization-in-aws/

Volotea is one of the fastest growing independent airlines in Europe, and has increased its fleet, routes, and number of available seats year over year. Volotea has already transported more than 30 million passengers across Europe since 2012, and has bases in 16 European capitals.

The maintenance, repair, and overhaul (MRO) application is a critical system for every airline. It’s used to manage the maintenance, repair, service, and inspection of aircraft. The main goal of an MRO application is to ensure the safety and airworthiness of the aircraft. Traditionally, those systems have been based on monolithic, packaged applications. However, these are difficult to scale and do not offer the benefit of elasticity to adapt to changing demand. Volotea migrated to Amazon Web Services (AWS) to modernize their MRO without refactoring the code. In this blog post, we’ll show you an architecture solution that can be applied to modernize an MRO (or similarly packaged monolithic application) without refactoring, and discuss some considerations.

The challenges with an on-premises MRO solution

Volotea’s MRO software previously ran in an on-premises data center. The system was based on Windows, an outdated database engine, and a virtual desktop system based on Citrix. Costs were fixed, yet MRO usage is typically seasonal. All the interfaces with other systems were based on an outdated communications protocol. This presented security concerns, especially considering that ransomware attacks are an increasing threat.

The main challenge for Volotea was adapting the MRO system to changing business requirements. Seasonal workloads and high impact projects, like changing fleets from Boeing to Airbus, require flexibility. The company also needed to adapt to the changing protocols necessitated by the COVID-19 pandemic, as airlines are one of the most impacted industries in Europe.

Volotea needed to modernize the operating system (OS) and database, simplify the end user application access, and increase the overall platform security, including integration with other applications.

Modernizing the MRO without refactoring

Following Volotea’s cloud strategy, the MRO system was migrated in 2 months to AWS to reduce technology costs and gain higher operational performance, availability, security, and flexibility. The migration was not simply based on a lift-and-shift approach, but used an existing AWS reference architecture for the MRO system. This reference architecture incorporates AWS managed services to modernize the application without incurring refactoring costs.

Figure 1. Volotea MRO deployment in a multi-account architecture

Figure 1. Volotea MRO deployment in a multi-account architecture

As shown in the high-level architecture in Figure 1:

  1. Volotea migrated their servers to Amazon EC2 instances based on Linux, to minimize the OS costs. The database management system is now using an open source engine. Those changes have permitted saving more than €10K yearly in licenses.
  2. The user access technology was migrated to Amazon AppStream 2.0. This is a managed service with increased security, elasticity, and flexibility compared to traditional virtual desktop infrastructure (VDI) solutions. Volotea aligned the cost with the real usage and decreased the TCO by configuring Auto Scaling fleets, reducing the workplace costs by 50%.
  3. AWS Transfer Family was used to centralize the information exchanged with third-party applications, while increasing the security of the communication channel. This managed service enabled the migration of the SFTP, FTPS, and FTP interfaces without the need to manage servers.
  4. To modernize the access of the MRO administrators, AWS Systems Manager Session Manager was used. This provided an ideal browser-based shell access without requiring bastion hosts or opening SSH ports in the Amazon EC2 instances.
  5. The AWS services were linked to Volotea’s user directory using AWS Single Sign-On. This allowed users to authenticate with their corporate credentials, decreasing maintenance costs, and increasing the security.

The application was deployed in Volotea’s AWS Landing Zone, which included the following services:

To make the systems management homogeneous, AWS Systems Manager and AWS Backup offered a single management point for the backup policies, system inventory, and patching.

Incorporating high availability to the MRO

Once this initial modernization is finished, Volotea will use the AWS reference architecture for high availability (HA) to increase resiliency. They’ll configure Amazon EC2 Auto Scaling with application failover to another Availability Zone and the DB native replication mechanisms. This will use Elastic IP addresses to remap the endpoints in a failover scenario. This architecture can be easily implemented in AWS to incorporate HA to applications that do not natively support horizontal scaling.

Conclusion

Volotea successfully modernized its MRO software, which has given them greater flexibility, elasticity, and the increased security of AWS services. They intend to continue with their digital transformation journey. Volotea is increasing its capacity to innovate faster to deliver new digital services more efficiently and with reduced IT costs. The AWS services and strategies discussed in this blog post can be applied to other similarly packaged applications to implement a first level of modernization with little effort and low migration risk.

References:

Improved, Automated Vulnerability Management for Cloud Workloads with a New Amazon Inspector

Post Syndicated from Steve Roberts original https://aws.amazon.com/blogs/aws/improved-automated-vulnerability-management-for-cloud-workloads-with-a-new-amazon-inspector/

Amazon Inspector is a service used by organizations of all sizes to automate security assessment and management at scale. Amazon Inspector helps organizations meet security and compliance requirements for workloads deployed to AWS, scanning for unintended network exposure, software vulnerabilities, and deviations from application security best practice.

Since the original launch of Amazon Inspector in 2015, vulnerability management for cloud customers has changed considerably. Over the last six years, the team delivered several new customer-requested features, including assessment reporting, support for proxy environments, and integration with Amazon CloudWatch Metrics. However, the team also recognized that there were new requirements to meet – enabling frictionless deployment at scale, support for an expanded set of resource types needing assessment, and a critical need to detect and remediate at speed. Today I’m happy to announce a new Amazon Inspector, able to meet these requirements with the following features:

  • Continual, automated assessment scans—replaces periodic, manual scanning.
  • Automated resource discovery – once enabled, the new Amazon Inspector automatically discovers all running Amazon Elastic Compute Cloud (Amazon EC2) instances and Amazon Elastic Container Registry repositories.
  • New support for container-based workloads—workloads are now assessed on both EC2 and container infrastructure.
  • Integration with AWS Organizations—allowing security and compliance teams to enable and take advantage of Amazon Inspector across all accounts in an organization.
  • Removal of the stand-alone Amazon Inspector scanning agent—assessment scanning now uses the widely deployed AWS Systems Manager agent, eliminating the need for a separate agent installation.
  • Improved risk scoring—a highly contextualized risk score is now generated for each finding by correlating Common Vulnerability and Exposures (CVE) metadata with environmental factors for resources, such as network accessibility. This makes it easier to identify the most critical vulnerabilities to address as a priority.
  • Integration with Amazon EventBridge—integrate with event management and workflow systems such as Splunk and Jira. And, you can trigger automated remediation, for example, system patching using Systems Manager or virtual machine image rebuilds using EC2 Image Builder.
  • Integration with AWS Security Hub—helping your teams to more easily identify those resources with critical vulnerabilities or deviations from security best practices.

Automatically Assessing your Workloads with Amazon Inspector
Tens of thousands of vulnerabilities exist, with new ones being discovered and made public on a regular basis. With this continually growing threat, manual assessment can lead to customers being unaware of an exposure and thus potentially vulnerable between assessments. Additionally, customers with manual processes for managing their inventories of applications resources, the deployment of stand-alone security agents on those resources, and the scheduling of periodic assessments may find the whole process to be a costly and time-consuming exercise. That’s before they have to then sift through the mass of assessment findings to determine the most critical issues to address.

With the new Amazon Inspector, all you need to do is enable the service. It will auto-discover and start continual assessment of your EC2 and your Amazon Elastic Container Registry-based container workloads to evaluate your security posture, even as the underlying resources change.

EC2 instances are discovered and assessed for unintended exposure to external networks and software vulnerabilities using the Systems Manager agent, already included by default in images provided by AWS for instance management, automated patching, and more. Container-based workloads are assessed as the images are pushed to Amazon Elastic Container Registry. Without needing additional software or agents, container images and EC2 instances are assessed in near real time when an event occurs.

Automated assessment is driven by changes in workload configuration and newly published vulnerabilities to ensure resources are only assessed when needed. The new Amazon Inspector collects events from over 50 vulnerability intelligence sources, including CVE, the National Vulnerability Database (NVD), and MITRE. Images that may be affected by a newly identified entry, for example, a new CVE notification, will be automatically rescanned. Image rescanning is enabled for 30 days from the date they are pushed to the registry. You can also enable an option to only scan on image push and not subsequently perform rescans.

Summary page for Amazon Inspector

Selecting either Accounts, Instances, or Repositories from your Dashboard page takes you to a detail summary for the selected resource. Below, I’m viewing summary data for EC2 instances across a couple of accounts.

Viewing instances scanned by Amazon Inspector across accounts

If vulnerabilities are found, you receive actionable assessment findings in a report. Starting today, these findings are summarized with enhanced risk scoring and improved resource detail to help you prioritize the most at-risk resources needing to be addressed. Also new today, the Amazon Inspector console has been redesigned to surface all findings and recommendations for remediation.

Vulnerabilities in container images are also sent to Amazon Elastic Container Registry to be summarized for the owner. And, as I noted earlier, new integrations with AWS Security Hub and Amazon EventBridge allow findings to be sent downstream for additional visibility and remediation by automated workflows. For example, automation can be created to isolate instances, trigger system patching, software image rebuilds, and more. The availability of multiple integration points makes it easier for security and application teams to collaborate to manage remediation. Below, I’m viewing findings from Amazon Inspector in the AWS Security Hub console.

Viewing findings from Amazon Inspector in the Security Hub console

Assessments can result in hundreds of thousands, or more, findings that need to be filtered and sifted to determine the most critical to action. Also available today, organizations can determine which of the findings they consider to be acceptable and mark those findings for temporary or permanent suppression. This helps reduce the volume of alerts, further assisting with prioritization and automated remediation. Suppression filters can be set from several screens. Rules specify one or more filters, such as Severity, that will cause findings that match the filters to be removed from display. When defining rules, a list is shown of the findings that will be suppressed, helping you fine-tune the filter values to match your specific needs.

Setting up suppression rules for Amazon Inspector findings

I mentioned earlier that the new Amazon Inspector implements a contextualized risk assessment score for findings. The screenshot below shows an example of Amazon Inspector‘s risk assessment score, compared to a generic Common Vulnerability Scoring System (CVSS) score. Contextual risk assessment takes into account additional factors such as accessibility to the internet and ease of exploitability to make the score more meaningful. In the image below, Amazon Inspector‘s risk assessment score is lower than the CVSS score because the attack vector requires network access. Amazon Inspector knows that the vulnerability identified in the GNOME Glib will be difficult to exploit because in this resource, there is no network access, and therefore it lowered the risk score.

Risk assessment score

Start a Free Trial with Amazon Inspector Today
The new Amazon Inspector is available now in the US East (Ohio), US East (N. Virginia), US West (Oregon), Asia Pacific (Hong Kong), Asia Pacific (Mumbai), Asia Pacific (Seoul), Asia Pacific (Singapore), Asia Pacific (Sydney), Asia Pacific (Tokyo), Canada (Central), Europe (Frankfurt), Europe (Ireland), Europe (London), Europe (Milan), Europe (Paris), Europe (Stockholm), Middle East (Bahrain), and South America (São Paulo) Regions.

Amazon Inspector offers a free 15-day trial, so you can put it to work to see how Amazon Inspector can help your security and compliance teams reduce operational complexity and cost associated with managing resource inventories, stand-alone security agents, and repetitive manual assessments.

— Steve

Announcing AWS Well-Architected Custom Lenses: Extend the Well-Architected Framework with Your Internal Best Practices

Post Syndicated from Alex Casalboni original https://aws.amazon.com/blogs/aws/well-architected-custom-lenses-internal-best-practices/

We launched the AWS Well-Architected Framework back in 2015 to help you review workloads against architectural best practices, and across pillars such as operational excellence, security, reliability, performance efficiency, and cost optimization. In 2017, we extended the framework with the concept of “lenses” to optimize specific workload types such as the Serverless Lens, the SaaS Lens, and the Foundational Technical Review (FTR) Lens for APN Partners. In 2018, we launched the AWS Well-Architected Tool, a self-service tool designed to help you review AWS workloads at any time, without the need for an AWS Solutions Architect.

Today, I’m happy to announce the general availability of AWS Well-Architected Custom Lenses, a new feature of the AWS Well-Architected Tool that lets you bring your own best practices to complement the existing framework based on your industry, operational plans, and internal processes. Custom Lenses provide a consolidated view and a consistent way to measure and improve your workloads on AWS without relying on external spreadsheets or third-party systems.

In addition to AWS Well-Architected Lenses, now you can create and share custom lenses and include them in your workload reviews, ultimately tailoring the review to your organizational needs. For example, you could define a custom lens to review your workloads against PCI compliance, SOC 2 compliance, or other national or industry regulations. As an AWS Partner, you might include ad-hoc best practices in your custom lenses when reviewing workloads with customers from different industries and segments, ultimately making the review process easier, faster, and more comprehensive.

How to Define a new Custom Lens
You author a new custom lens by editing a JSON preset template, where you define questions, choices, helpful resources, improvement plans, and risk rules.

Here’s how it works: download the template from the AWS Well-Architected Tool, work on it locally, and then re-upload it.

The JSON structure is composed of multiple pillars. Each pillar might contain multiple questions, each with its own choices and risk rules.

Your JSON file will look like this:

{
    "schemaVersion": "2021-11-01",
    "name": "My Test Lens",
    "description": "This is a description of my test lens.",
    "pillars": [
        {
            "id": "pillar_red",
            "name": "Red Pillar",
            "questions": [
                {
                    "id": "pillar_1_q1",
                    "title": "How do you get started with this pillar?",
                    "description": "Optional description.",
                    "choices": [
                        {
                            "id": "choice1",
                            "title": "Best practice #1",
                            "helpfulResource": {
                                "displayText": "This is helpful text for the first choice.",
                                "url": "https://aws.amazon.com"
                            },
                            "improvementPlan": {
                                "displayText": "This is text that will be shown for improvement of this choice."
                            }
                        },
                        {
                            "id": "choice2",
                            "title": "Best practice #2",
                            ...
                        }
                    ],
                    "riskRules": [
                        {
                            "condition": "choice1 && choice2",
                            "risk": "NO_RISK"
                        },
                        {
                            "condition": "choice1 && !choice2",
                            "risk": "MEDIUM_RISK"
                        },
                        {
                            "condition": "default",
                            "risk": "HIGH_RISK"
                        }
                    ]
                }
            ]
            ...
        },
        ...
    ]
}

Once you’re ready to submit your JSON file, proceed with the upload.

And don’t worry about making it perfect on the first try. You’ll be able to improve it and add new versions.

AWS Well-Architected Custom Lenses in Action
You find the list of custom lenses and their latest version in the new Custom Lenses section.

Each custom lens has an owner and can be shared with multiple AWS accounts too.

Before using this new custom lens in a workload review, you’ll need to publish it and assign it a version.

Select Publish lens and provide a version name such as 1.0.

Now you can create a new workload review and apply both AWS-owned lenses and your own custom lenses, in addition to the main framework.

During the workload review, you will go through each pillar and questions of the custom lens, using the same user interface provided by the AWS Well-Architected Tool.

Last but not least, you can share your custom lens with other AWS Identity and Access Management (IAM) principals such as AWS accounts, IAM users, and IAM roles.

Available Today at No Charge
Custom Lenses are available today in all AWS Regions where the AWS Well-Architected Tool is available, at no cost. You can define up to five custom lenses and share them across AWS Accounts, in addition to the existing Well-Architected Framework and AWS-owned Lenses.

Check out the technical documentation here.

We’re looking forward to hearing your feedback and iterating quickly to improve the authoring and sharing experience based on your needs.

Alex

Announcing Pull Through Cache Repositories for Amazon Elastic Container Registry

Post Syndicated from Steve Roberts original https://aws.amazon.com/blogs/aws/announcing-pull-through-cache-repositories-for-amazon-elastic-container-registry/

Organizations, development teams, and individual developers who have chosen to use containers to host their applications may prefer, or perhaps are required, to source all images from Amazon Elastic Container Registry to take advantage of its high availability and security. To satisfy those requirements, customers have needed to take on the burden of manually pulling images from public registries into their private Amazon Elastic Container Registry repositories, and then keeping them in sync. This adds operational complexity and maintenance costs, thereby impacting developer productivity. Additionally, some registries may have limitations or restrictions on how frequently images can be downloaded. When reached, those limitations then begin impacting developers and the release velocity of their business, due to build errors when image pulls are throttled, or even rejected.

Today, we have announced pull through cache repository support in Amazon Elastic Container Registry, for publicly accessible registries that do not require authentication. Pull through cache repositories offer developers the improved performance, security, and availability of Amazon Elastic Container Registry for container images that they source from public registries. Images in pull through cache repositories are automatically kept in sync with the upstream public registries, thereby eliminating the manual work of pulling images and periodically updating.

Pull through cache repositories provide the benefits of the built-in security capabilities in Amazon Elastic Container Registry, such as AWS PrivateLink enabling you to keep all of the network traffic private, image scanning to detect vulnerabilities, encryption with AWS Key Management Service (KMS) keys, cross-region replication, and lifecycle policies. When enabled, cross-region replication is designed to automatically distribute updated images to additional Regions. All you need to do is update the pull URL so that the image is downloaded from the relevant Region.

When consuming images from pull through cache repositories, download throttling is also no longer a problem for developers, as well as the build and deployment infrastructure that supports their applications. While Amazon Elastic Container Registry is designed to automatically keep the cache repository in sync, you can also manually sync a repository at any time. And, if you wish, the automatic sync can be turned off.

Getting Started with Amazon Elastic Container Registry Pull Through Cache Repositories
Setting up pull through cache repositories is a simple process. For the following example, I’m using Amazon Elastic Container Registry Public in the South America (São Paulo) Region as my upstream registry.

First, I must modify my private registry’s settings to add a rule that references the upstream, publicly accessible registry (multiple rules can be set if I need additional upstream registries). In the Amazon Elastic Container Registry console, I begin by selecting Private registry, and then select Edit in the Pull through cache panel to change settings. This takes me to the Pull through cache configuration page, where I select Add rule.

On the Create pull through cache rule page, I choose the upstream registry, which is ECR Public in this example. I also must set a namespace that I’ll use when referring to images in my pull commands. For this example, I’ll accept the suggested namespace, ecr-public.

Configuring ECR Public as the upstream registry

Selecting Save takes me back to the Pull through cache configuration page where my newly configured rule is listed. Now, I’m ready to utilize the cache repository when pulling images.

Newly configured rule for an upstream registry

To reference an image, I must specify the namespace that I chose in the pull URL, using the URL format <accountId>.dkr.ecr.<region>.amazonaws.com/<namespace>/<sourcerepo>:<tag>. When images are pulled, the cache repository associated with the namespace is checked for the image. In my case, the cache repository doesn’t exist yet, but I don’t have to create it myself. The image is fetched from the upstream repository in the public registry associated with the namespace, and then stored in a new cache repository that is created for me automatically.

In the command prompt session below, I first authenticate with my registry, and then pull an Amazon Linux 2 image from Amazon Elastic Container Registry Public into the cache:

C:\ aws ecr get-login-password --region sa-east-1 | docker login --username AWS --password-stdin 111122223333.dkr.ecr.sa-east-1.amazonaws.com/ecr-public
Login Succeeded
C:\ docker pull 111122223333.dkr.ecr.sa-east-1.amazonaws.com/ecr-public/amazonlinux/amazonlinux:latest
latest: Pulling from ecr-public/amazonlinux/amazonlinux
e11e8d46e102: Pull complete
Digest: sha256:916dbbb288948b54c94b5b9f0769085aa601d4468d099e90d8a7da5cfa551b50
Status: Downloaded newer image for 111122223333.dkr.ecr.sa-east-1.amazonaws.com/ecr-public/amazonlinux/amazonlinux:latest
111122223333.dkr.ecr.us-west-2.amazonaws.com/ecr-public/amazonlinux/amazonlinux:latest

In my Amazon Elastic Container Registry console, a check of the Repositories page shows that a new private repository has been created containing the image I pulled, together with an indication that a pull through cache is active.

Pulled image in the cache repository

Working with images and the pull through cache repository is just as straightforward in Dockerfiles. All I need do is reference the image I need using the namespace in the pull URL. If the image is not in the cache repository, then it will be pulled and stored there for me. Cached images are checked once per 24 hours to verify if the cached image is the latest version, with the timer based off the last pull time of the cached image.

Start using Pull through Cache Repositories Today
Pull through cache repositories for Amazon Elastic Container Registry are available for you to take advantage of today in all commercial AWS Regions. There is no charge for using pull through cache repositories, only standard Amazon Elastic Container Registry pricing for storage and data transfer charges applies. You can find more details on pricing at the Amazon Elastic Container Registry pricing page. Learn more about pull through cache repositories in the Amazon Elastic Container Registry User Guide, and get started today.

— Steve

Introducing Amazon Braket Hybrid Jobs – Set Up, Monitor, and Efficiently Run Hybrid Quantum-Classical Workloads

Post Syndicated from Danilo Poccia original https://aws.amazon.com/blogs/aws/introducing-amazon-braket-hybrid-jobs-set-up-monitor-and-efficiently-run-hybrid-quantum-classical-workloads/

I find quantum computing fascinating! At its simplest level, it extends the concept of bits, that have 0 or 1 values, with quantum bits, or qubits, that can have a combination of two different (quantum) states.

Two characteristics make qubits really interesting:

  • When you look at the value of a qubit, you get only one of the two possible states with a probability that depends on how its own states are combined.
  • Multiple qubits can be “connected” together (this is called quantum entanglement) so that by changing the state of one, even just by reading its value, you alter the states of the others.

These characteristics come from low-level properties described by quantum mechanics, a fundamental theory in physics that provides a description of the physical properties of nature at atomic and subatomic scales. Luckily, we don’t need a degree in quantum mechanics to use quantum computing in the same way we don’t need to be expert in semiconductors to use an ordinary computer.

Using qubits, researchers are designing new algorithms that have the potential to be much faster than what classical computers can achieve. To help speed up scientific research and software development for quantum computing, we introduced Amazon Braket at re:Invent 2019. A fully managed quantum computing service, Amazon Braket allows you to build, test, and run quantum algorithms on simulators and quantum computers.

Hybrid Algorithms and Quantum Processing Units (QPUs)
Quantum algorithms, which would be transformational in many different areas, require the execution of hundreds of thousands to millions of quantum gates. Unfortunately, the current generation of QPUs suffer from noise, creating errors that limit operations to only a few hundreds or thousands of gates before the errors take over.

To help solve this, we can take inspiration from machine learning: instead of using fixed quantum circuits, the logic that implements the algorithm, we let the algorithm “learn” by adjusting the parameters that tune the circuit to have a better chance of solving a given problem by adapting to the noise in a particular device (think of them as “self-learning quantum algorithms”).

This is similar to computer vision: instead of hand-crafting the features to distinguish a dog from a cat (which is notoriously difficult for a computer), machine learning algorithms “learn” the right features by iteratively adjusting parameters of a neural network.

A rapidly emerging area of research in quantum computing uses QPUs, the processors used by quantum computers, in the same way as GPUs are used in machine learning: Quantum circuits are parameterized, initialized with some values, and then run on the QPU. Like the weights in a neural network, these parameters are then iteratively adjusted based on the results of the computation. These so-called hybrid algorithms rely on rapid, iterative computations between classical computers and QPUs.

Architectural diagram.

To run hybrid algorithms, you need to manually set up a classical infrastructure, install the required software, and manage the interaction between your quantum and classical compute processes for the duration of your hybrid algorithm. You then need to build custom monitoring solutions to visualize the progress of your algorithm to make sure it converges to the solution as expected or intervene if necessary to adjust the parameters of the algorithm.

Another big challenge is that QPUs are shared, inelastic resources, and you compete with others for access. This can slow down the execution of your algorithm. A single large workload from another customer can bring the algorithm to a halt, potentially extending your total runtime for hours. This is not only inconvenient but also impacts the quality of the results because today’s QPUs need periodic re-calibration, which can invalidate the progress of a hybrid algorithm. In the worst case, the algorithm fails, wasting budget and time.

Introducing Amazon Braket Hybrid Jobs
Today, I am happy to introduce Amazon Braket Hybrid Jobs, a new capability of Amazon Braket that simplifies the process of setting up, monitoring, and efficiently executing hybrid quantum-classical algorithms. Jobs are fully managed so you can avoid extensive infrastructure and software management and confidently execute your algorithms quickly and predictably, with on-demand priority access to QPUs.

When you create a job, Amazon Braket spins up the job instance (providing a CPU environment based on an Amazon Elastic Compute Cloud (Amazon EC2) instance), executes the algorithm (using quantum hardware or simulators), and releases the resources once the job is completed so that you only pay for what you use. You can also define custom metrics for algorithms, which are automatically logged by Amazon CloudWatch and displayed in near real-time in the Amazon Braket console as the algorithm runs. This provides you with live insights into how your algorithm is progressing, creating the opportunity to adjust your algorithm as necessary and innovate more quickly.

Architectural diagram.

To run hybrid algorithms as jobs, you can define your algorithm using the Amazon Braket SDK or with PennyLane, an open-source library for hybrid quantum computing. Let’s see how that works in practice with a couple of examples.

Using Amazon Braket Hybrid Jobs
Before building a trainable quantum algorithm, let’s get started by running a series of fixed quantum operations, what we’ll refer to as quantum tasks. I use Python and the Amazon Braket SDK to define a circuit that constructs what is called a bell state, a state which has a fifty-fifty chance of resolving to each of two states. It’s the quantum computing equivalent of tossing a coin.

Here’s the content of the algorithm_script.py file:

import os

from braket.aws import AwsDevice
from braket.circuits import Circuit
from braket.jobs import save_job_result


def start_here():

    print("Test job started!")

    device = AwsDevice(os.environ["AMZN_BRAKET_DEVICE_ARN"])

    results = []
    
    bell = Circuit().h(0).cnot(0, 1)
    for count in range(5):
        task = device.run(bell, shots=100)
        print(task.result().measurement_counts)
        results.append(task.result().measurement_counts)

    save_job_result({ "measurement_counts": results })
    
    print("Test job completed!")

This script uses the environment variable AMZN_BRAKET_DEVICE_ARN to instantiate the device that I select when creating the job.

Quantum computing is probabilistic. For this reason, circuits need to be evaluated multiple times to get accurate results. A single run is called a shot. The higher the number of shots, the better the accuracy of the result. In this case, the circuit is run for 100 shots.

I use the save_job_result function to store the results of my job so that I can analyze them at the end.

In the Amazon Braket console, I choose Jobs on the left panel and then Create job. To start, I give the job a name.

Console screenshot.

Then, I pass the file with the algorithm. The CPU component of the hybrid algorithm runs in a container, and I can choose which container image to use. For example, I can use a pre-built container image that includes software my algorithm depends on, such as PennyLane, TensorFlow, or PyTorch, or bring my own custom image. I select the Base container image because I don’t have external dependencies.

I leave all other settings to their default value. In this way, I use the SV1 simulator, rather than quantum hardware, to run the quantum tasks.

After some time, the job has completed, and I follow the link to the Amazon Simple Storage Service (Amazon S3) console to download the result. As expected, for each of the five tasks, the results show that the proportion of the 00 and 11 states is roughly 50:50. The proportions vary slightly because of the probabilistic nature of quantum computing.

{
    "braketSchemaHeader": {
        "name": "braket.jobs_data.persisted_job_data",
        "version": "1"
    },
    "dataDictionary": {
        "measurement_counts": [
            {
                "00": 51,
                "11": 49
            },
            {
                "00": 44,
                "11": 56
            },
            {
                "11": 51,
                "00": 49
            },
            {
                "00": 56,
                "11": 44
            },
            {
                "00": 49,
                "11": 51
            }
        ]
    },
    "dataFormat": "plaintext"
}

This example is quite basic because I am not running any classical logic other than initiating tasks. To see the real value, let’s see how it works with a hybrid algorithm where we tweak the parameters of the quantum circuit iteratively from task to task.

Using Amazon Braket Hybrid Jobs with Hybrid Algorithms
For a more advanced example, I use a well-known example of an actual hybrid algorithm, called the quantum approximate optimization algorithm (QAOA), included in the examples provided by Amazon Braket when creating a notebook from the Braket console. QAOA is a quantum algorithm that produces approximate solutions for combinatorial optimization problems. You can also find the example in this GitHub repo.

In this case, I am using QAOA to solve the Max-Cut problem: when partitioning nodes of a graph in two, what is the maximum number of edges connecting nodes between the two parts? For example, in the figure below, there are six nodes connected by eight edges. The thick yellow line partitions the nodes into two sets by crossing six edges.

In the QAOA example, the tuning of parameters that are used to run the successive rounds of quantum tasks is optimized in a classical computing environment (such as an EC2 instance) using tools like TensorFlow or PyTorch. In one of the notebook cells, I can choose which interface to use to tune the parameters as well as the other hyperparameters in a similar way to what I’d do for machine learning training.

Braket jobs then coordinates running the classical and quantum computing parts of the algorithm and the exchange of parameters and results between them. I can just sit back and relax as I watch my algorithm converge, ready to retrieve my results from S3, as before, for deeper analysis.

Running Hybrid Algorithms in Local Mode
To test and debug hybrid algorithms quickly, the Amazon Braket SDK can run jobs in local mode. With local mode, Braket jobs are run locally on your machine (for example, your laptop). In this way, you can get fast feedback and iterate quickly during the development of your algorithms.

To run a job in local mode, you just need to replace AwsQuantumJob with LocalQuantumJob. Note that AwsQuantumJob is imported from braket.aws , while LocalQuantumJob is imported from braket.jobs.local.

Availability and Pricing
Amazon Braket Hybrid Jobs are available today in all AWS Regions where Amazon Braket is available. For more information, see the AWS Regional Services List.

With Amazon Braket Hybrid Jobs, you only pay for the resources you use. There is no need to deploy, configure, and manage classical infrastructure, making it easy to experiment and improve algorithms iteratively. For more information, see the Amazon Braket pricing page.

Instead of relying on theoretical studies, you can start to use quantum computers as the primary tool to understand and improve hybrid algorithms and test their applicability for industry and research use cases. In this way, you can focus on your research and not deal with setting up and coordinating these different compute resources for your experiments.

During the development of this new capability, we talked with customers and partners to understand their needs. “As application developers, Braket Hybrid Jobs gives us the opportunity to explore the potential of hybrid variational algorithms with our customers,” says Vic Putz head of engineering at QCWare. “We are excited to extend our integration with Amazon Braket and the ability to run our own proprietary algorithms libraries in custom containers means we can innovate quickly in a secure environment. The operational maturity of Amazon Braket and the convenience of priority access to different types of quantum hardware means we can build this new capability into our stack with confidence.”

Simplify running hybrid quantum-classical workloads with Amazon Braket Hybrid Jobs.

Danilo

New – Amazon EC2 M6a Instances Powered By 3rd Gen AMD EPYC Processors

Post Syndicated from Channy Yun original https://aws.amazon.com/blogs/aws/new-amazon-ec2-m6a-instances-powered-by-3rd-gen-amd-epyc-processors/

AWS and AMD have collaborated to give customers more choice and value in cloud computing, starting with the first generation AMD EPYC™ processors in 2018 such as M5a/R5a, M5ad/R5ad, and T3a instances. In 2020, we expanded the second generation AMD EPYC™ processors to include C5a/C5ad instances and recently G4ad instances, combining the power of both second-generation AMD EPYC™ processors and AMD Radeon Pro GPUs.

Today, I am happy to announce the general availability of Amazon EC2 M6a instances featuring the 3rd Gen AMD EPYC processors, running at frequencies up to 3.6 GHz to offer up to 35 percent price performance versus the previous generation M5a instances.

You can launch M6a instances today in ten sizes in the AWS US East (N. Virginia), US West (Oregon), and Europe (Ireland) Regions as On-Demand, Spot, and Reserved Instance or as part of a Savings Plan. Here are the specs:

Name vCPUs Memory
(GiB)
Network Bandwidth
(Gbps)
EBS Throughput
(Gbps)
m6a.large 2 8 Up to 12.5 Up to 6.6
m6a.xlarge 4 16 Up to 12.5 Up to 6.6
m6a.2xlarge 8 32 Up to 12.5 Up to 6.6
m6a.4xlarge 16 64 Up to 12.5 Up to 6.6
m6a.8xlarge 32 128 12.5 6.6
m6a.12xlarge 48 192 18.75 10
m6a.16xlarge 64 256 25 13.3
m6a.24xlarge 96 384 37.5 20
m6a.32xlarge 128 512 50 26.6
m6a.48xlarge 192 768 50 40

Compared to M5a instances, the new M6a instances offer:

  • Larger instance size with 48xlarge with up to 192 vCPUs and 768 GiB of memory, enabling you to consolidate more workloads on a single instance. M6a also offers Elastic Fabric Adapter (EFA) support for workloads that benefit from lower network latency and highly scalable inter-node communication, such as HPC and video processing.
  • Up to 35 percent higher price performance per vCPU versus comparable M5a instances, up to 50 Gbps of networking speed, and up to 40 Gbps bandwidth of Amazon EBS, more than twice that of M5a instances.
  • Always-on memory encryption and support for new AVX2 instructions for accelerating encryption and decryption algorithms

M6a instances expand the 6th generation general purpose instances portfolio and provide high-performance processing at 10 percent lower cost over comparable x86 instances. M6a instances are a good fit for running general-purpose workloads such as web servers,  application servers, and small data stores.

To learn more, visit the M6a instances page. Please send feedback to [email protected], AWS forum for EC2, or through your usual AWS Support contacts.

— Channy

New – Securely manage your AWS IoT Greengrass edge devices using AWS Systems Manager

Post Syndicated from Sean M. Tracey original https://aws.amazon.com/blogs/aws/new-securely-manage-your-aws-iot-greengrass-edge-devices-using-aws-systems-manager/

A header image with the text AWS IoT Greengrass announces AWS System Manager

In 2020, we launched AWS IoT Greengrass 2.0, an open-source edge runtime and cloud service for building, deploying, and managing device software and applications. Today, we’re very excited to announce the ability to securely manage your AWS IoT Greengrass edge devices using AWS Systems Manager (SSM).

Managing vast fleets of varying systems and applications remotely can be a challenge for administrators of edge devices. AWS IoT Greengrass was built to enable these administrators to manage their edge device application stack. While this addressed the needs of many typical edge device administrators, system software on these devices still needed to be updated and maintained through operational policies consistent with those of their broader IT organizations. To this end, administrators would typically have to build or integrate tools to create a centralized interface for managing their edge and IT device software stacks – from security updates, to remote access, and operating system patches.

Until today, IT administrators have had to build or integrate custom tools to make sure edge devices can be managed alongside EC2 and on-prem instances, through a consistent set of policies. At scale, managing device and systems software across a wide variety of edge and IT systems becomes a significant investment in time and money. This is time that could be better spent deploying, optimizing, and managing the very edge devices that they’re maintaining.

What’s New?
Today, we have integrated IoT Greengrass and Systems Manager to simplify the management and maintenance of system software for edge devices. When coupled with the AWS IoT Greengrass Client Software, edge device administrators now can remotely access and securely manage with the multitude of devices that they own – from OS patching, to application deployments. Additionally, regularly scheduled operations that maintain edge compute systems can be automated, all without the need for creating additional custom processes. For IT administrators, this release gives a complete overview of all of their devices through a centralized interface, and a consistent set of tools and policies with the AWS Systems Manager.

For customers new to the AWS IoT Greengrass platform, the integration with Systems Manager simplifies setup even further with a new on- boarding wizard that can reduce the time it takes to create operational management systems for edge devices from weeks to hours.

How is this achieved?
This new capability is enabled by the AWS Systems Manager (SSM) Agent. As of today, customers can deploy the AWS Systems Manager Agent, via the AWS IoT Greengrass console, to their existing edge devices. Once installed on each device, AWS Systems Manager will list all of the devices in the Systems Manager Console, thereby giving administrators and IoT stakeholders an overview of their entire fleet. When coupled with the AWS IoT Greengrass console, administrators can manage their newly configured devices remotely; patching or updating operating systems, troubleshooting remotely, and deploying new applications, all through a centralized, integrated user interface. Devices can be patched individually, or in groups organized by tags or resource groups.

Further information
These new features are now available in all regions where AWS Systems Manager and AWS IoT Greengrass are available. To get started, please visit the IoT Greengrass home page.

New – Real-User Monitoring for Amazon CloudWatch

Post Syndicated from Jeff Barr original https://aws.amazon.com/blogs/aws/cloudwatch-rum/

Way back in 2009 I wrote a blog post titled New Features for Amazon EC2: Elastic Load Balancing, Auto Scaling, and Amazon CloudWatch. In that post I talked about how Amazon CloudWatch helps you to build applications that are highly scalable and highly available, and noted that it gives you cost-effective real-time visibility into your metrics, with no deployment and no maintenance. Since that launch, we have added many new features to CloudWatch, all with that same goal in mind. For example, last year I showed you how you could Use CloudWatch Synthetics to Monitor Sites, API Endpoints, Web Workflows ,and More.

Real-User Monitoring (RUM)
The next big challenge (and the one that we are addressing today) is monitoring web applications with the goal of understanding performance and providing an optimal experience for your users. Because of the number of variables involved—browser type, browser configuration, user location, connectivity, and so forth—synthetic testing can only go so far. What really matters to your users is the experience that they receive, and that’s what we want to help you to deliver!

Amazon CloudWatch RUM will help you to collect the metrics that give you the insights that will help you to identity, understand, and improve this experience. You simply register your application, add a snippet of JavaScript to the header of each page, and deploy. The snippet runs when your users step through each page of your application, and sends the data to RUM for consolidation and analysis. You can use this tool on its own, and in conjunction with both Amazon CloudWatch ServiceLens and AWS X-Ray.

CloudWatch RUM in Action
To get started, I open the CloudWatch Console and navigate to RUM. Then I click Add app monitor:

I give my monitor a name and specify the domain that hosts my application:

Then I choose the events that I want to monitor & collect, and specify the percentage of sessions. My personal blog does not get a lot of traffic, so I will collect all of the sessions. I can also choose to store data in Amazon CloudWatch Logs in order to keep it around for more than the 30 days provided by CloudWatch RUM:

Finally, I opt to create a new Cognito identy pool, and add a tag. If I want to use CloudWatch ServiceLens and X-Ray, I can expand Active tracing and enable XRay. My app does not make any API requests, so I will not do that. I finish by clicking Add app monitor:

The console then shows me the JavaScript code snippet that I need to insert into the <head> element of my application:

I save the snippet, click Done, and then edit my application (my somewhat neglected personal blog in this case) to add the code snippet. I am using Jekyll, and added the snippet to my blog template:

Then I wait for some traffic to arrive. When I return to the RUM Console, I can see all of my app monitors. I click MonitorMyBlog to learn more:

Then I can explore the aggregated timing data and the other information that has been collected. There’s far more than I have space to show today, so feel free to try this out on your own and do a deeper dive. Each of the tabs contains multiple filters and options to help you to zoom in on areas of interest: specific pages, locations, browsers, user journeys, and so forth.

The Performance tab shows the vital signs for my application, followed by additional information:

The vital signs are apportioned into three levels (Positive, Tolerable, and Frustrating):

The screen above contains a metric (largest contentful paint) that was new to me. As Philip Walton explains it, “Largest Contentful Paint (LCP) is an important user-centered metric for measuring perceived load speed because it marks the point in the page load timeline when the page’s main content has likely loaded.”

I can also see the time consumed by the steps that the browser takes when loading a page:

And I can see average load time by time of day:

I can also see all of this information on a page-by-page basis:

The Browsers & Devices tab also shows a lot of interesting and helpful data. For example, I can learn more about the browsers that are used to access my blog, again with the page-by-page option:

I can also view the user journeys (page sequences) through my blog. Based on this information, it looks like I need to do a better job of leading users from one page to another:

As I noted earlier, there’s a lot of interesting and helpful information here, and you should check it out on your own.

Available Now
CloudWatch RUM is available now and you can start using it today in ten AWS Regions: US East (N. Virginia), US East (Ohio), US West (Oregon), Europe (Ireland), Europe (London), Europe (Frankfurt), Europe (Stockholm), Asia Pacific (Sydney), Asia Pacific (Tokyo), and Asia Pacific (Singapore). You pay $1 for every 100K events that are collected.

Jeff;

New – Amazon CloudWatch Evidently – Experiments and Feature Management

Post Syndicated from Sébastien Stormacq original https://aws.amazon.com/blogs/aws/cloudwatch-evidently/

As a developer, I am excited to announce the availability of Amazon CloudWatch Evidently. This is a new Amazon CloudWatch capability that makes it easy for developers to introduce experiments and feature management in their application code. CloudWatch Evidently may be used for two similar but distinct use-cases: implementing dark launches, also known as feature flags, and A/B testing.

Features flags is a software development technique that lets you enable or disable features without needing to deploy your code. It decouples the feature deployment from the release. Features in your code are deployed in advance of the actual release. They stay hidden behind if-then-else statements. At runtime, your application code queries a remote service. The service decides the percentage of users who are exposed to the new feature. You can also configure the application behavior for some specific customers, your beta testers for example.

When you use feature flags you can deploy new code in advance of your launch. Then, you can progressively introduce a new feature to a fraction of your customers. During the launch, you monitor your technical and business metrics. As long as all goes well, you may increase traffic to expose the new feature to additional users. In the case that something goes wrong, you may modify the server-side routing with just one click or API call to present only the old (and working) experience to your customers. This lets you revert back user experience without requiring rollback deployments.

A/B Testing shares many similarities with feature flags while still serving a different purpose. A/B tests consist of a randomized experiment with multiple variations. A/B testing lets you compare multiple versions of a single feature, typically by testing the response of a subject to variation A against variation B, and determining which of the two is more effective. For example, let’s imagine an e-commerce website (a scenario we know quite well at Amazon). You might want to experiment with different shapes, sizes, or colors for the checkout button, and then measure which variation has the most impact on revenue.

The infrastructure required to conduct A/B testing is similar to the one required by feature flags. You deploy multiple scenarios in your app, and you control how to route part of the customer traffic to one scenario or the other. Then, you perform deep dive statistical analysis to compare the impacts of variations. CloudWatch Evidently assists in interpreting and acting on experimental results without the need for advanced statistical knowledge. You can use the insights provided by Evidently’s statistical engine, such as anytime p-value and confidence intervals for decision-making while an experiment is in progress.

At Amazon, we use feature flags extensively to control our launches, and A/B testing to experiment with new ideas. We’ve acquired years of experience to build developers’ tools and libraries and maintain and operate experimentation services at scale. Now you can benefit from our experience.

CloudWatch Evidently uses the terms “launches” for feature flags and “experiments” for A/B testing, and so do I in the rest of this article.

Let’s see how it works from an application developer point of view.

Launches in Action
For this demo, I use a simple Guestbook web application. So far, the guest book page is read-only, and comments are entered from our back-end only. I developed a new feature to let customers enter their comments on the guestbook page. I want to launch this new feature progressively over a week and keep the ability to revert the change back if it impacts important technical or business metrics (such as p95 latency, customer engagement, page views, etc.). Users are authenticated, and I will segment users based on their user ID.

Before launch:
Evidently - experiment off
After launch:
Evidently - experiment on

Create a Project
Let’s start by configuring Evidently. I open the AWS Management Console and navigate to CloudWatch Evidently. Then, I select Create a project.

Evidently - create project


I enter a Project name and Description.

Evidently lets you optionally store events to CloudWatch logs or S3, so that you can move them to systems such as Amazon Redshift to perform analytical operations. For this demo, I choose not to store events. When done, I select Create project.

Evidently - create project second part

Add a Feature
Next, I create a feature for this project by selecting Add feature. I enter a Feature name and Feature description. Next, I define my Feature variations. In this example, there are two variations, and I use a Boolean type. true indicates the guestbook is editable and false indicates it is read only. Variations types might be boolean, double, long, or string.

Evidently - create featureI may define overrides. Overrides let me pre-define the variation for selected users. I want the user “seb”, my beta tester, to always receive the editable variation.

Evidently - Create feature - overridesThe console shares the JavaScript and Java code snippets to add into my application.

Evidently - code snippetTalking about code snippets, let’s look at the changes at the code level.

Instrument my Application Code
I use a simple web application for this demo. I coded this application using JavaScript. I use the AWS SDK for JavaScript and Webpack to package my code. I also use JQuery to manipulate the DOM to hide or show elements. I designed this application to use standard JavaScript and a minimum number of frameworks to make this example inclusive to all. Feel free to use higher level tools and frameworks, such as React or Angular for real-life projects.

I first initialize the Evidently client. Just like other AWS Services, I have to provide an access key and secret access key for authentication. Let’s leave the authentication part out for the moment. I added a note at the end of this article to discuss the options that you have. In this example, I use Amazon Cognito Identity Pools to receive temporary credentials.

// Initialize the Amazon CloudWatch Evidently client
const evidently = new AWS.Evidently({
    endpoint: EVIDENTLY_ENDPOINT,
    region: 'us-east-1',
    credentials: fromCognitoIdentityPool({
        client: new CognitoIdentityClient({ region: 'us-west-2' }),
        identityPoolId: IDENTITY_POOL_ID
    }),
});

Armed with this client, my code may invoke the EvaluateFeature API to make decisions about the variation to display to customers. The entityId is any string-based attribute to segment my customers. It might be a session ID, a customer ID, or even better, a hash of these. The featureName parameter contains the name of the feature to evaluate. In this example, I pass the value EditableGuestBook.

const evaluateFeature = async (entityId, featureName) => {

    // API request structure
    const evaluateFeatureRequest = {
        // entityId for calling evaluate feature API
        entityId: entityId,
        // Name of my feature
        feature: featureName,
        // Name of my project
        project: "AWSNewsBlog",
    };

    // Evaluate feature
    const response = await evidently.evaluateFeature(evaluateFeatureRequest).promise();
    console.log(response);
    return response;
}

The response contains the assignment decision from Evidently, as based on traffic rules defined on the server-side.

{
 details: {
   launch: "EditableGuestBook", group: "V2"},
   reason: "LAUNCH_RULE_MATCH", 
   value: {boolValue: false},
   variation: "readonly"
}}

The last part consists of hiding or displaying part of the user interface based on the value received above. Using basic JQuery DOM manipulation, it would be something like the following:

window.aws.evaluateFeature(entityId, 'EditableGuestbook').then((response, error) => {
    if (response.value.boolValue) {
        console.log('Feature Flag is on, showing guest book');
        $('div#guestbook-add').show();
    } else {
        console.log('Feature Flag is off, hiding guest book');
        $('div#guestbook-add').hide();
    }
});

Create a Launch
Now that the feature is defined on the server-side, and the client code is instrumented, I deploy the code and expose it to my customers. At a later stage, I may decide to launch the feature. I navigate back to the console, select my project, and select Create Launch. I choose a Launch name and a Launch description for my launch. Then, I select the feature I want to launch.

Evidently - create launchIn the Launch Configuration section, I configure how much traffic is sent to each variation. I may also schedule the launch with multiple steps. This lets me plan different steps of routing based on a schedule. For example, on the first day, I may choose to send 10% of the traffic to the new feature, and on the second day 20%, etc. In this example, I decide to split the traffic 50/50.

Evidently - launch configurationFinally, I may define up to three metrics to measure the performance of my variations. Metrics are defined by applying rules to data events.

Evidently - Custom MetricsAgain, I have to instrument my code to send these metrics with PutProjectEvents API from Evidently. Once my launch is created, the EvaluateFeature API returns different values for different values of entityId (users in this demo).

At any moment, I may change the routing configuration. Moreover, I also have access to a monitoring dashboard to observe the distribution of my variations and the metrics for each variation.

Evidently - launch monitoringI am confident that your real-life launch graph will get more data than mine did, as I just created it to write this post.

A/B Testing
Doing an A/B test is similar. I create a feature to test, and I create an Experiment. I configure the experiment to route part of the traffic to variation 1, and then the other part to variation 2. When I am ready to launch the experiment, I explicitly select Start experiment.

Evidently - start experiment

In this experiment, I am interested in sending custom metrics. For example:

// pageLoadTime custom metric
const timeSpendOnHomePageData = `{
   "details": {
      "timeSpendOnHomePage": ${timeSpendOnHomePageValue}
   },
   "userDetails": { "userId": "${randomizedID}", "sessionId": "${randomizedID}" }
}`;

const putProjectEventsRequest: PutProjectEventsRequest = {
   project: 'AWSNewsBlog',
   events: [
    {
        timestamp: new Date(),
        type: 'aws.evidently.custom',
        data: JSON.parse(timeSpendOnHomePageData)
    },
   ],
};

this.evidently.putProjectEvents(putProjectEventsRequest).promise().then(res =>{})

Switching to the Results page, I see raw values and graph data for Event Count, Total Value, Average, Improvement (with 95% confidence interval), and Statistical significance. The statistical significance describes how certain we are that the variation has an effect on the metric as compared to the baseline.

These results are generated throughout the experiment and the confidence intervals and the statistical significance are guaranteed to be valid anytime you want to view them. Additionally, at the end of the experiment, Evidently also generates a Bayesian perspective of the experiment that provides information about how likely it is that a difference between the variations exists.

The following two screenshots show graphs for the average value of two metrics over time, and the improvement for a metric within a 95% confidence interval.

Evidently - experiment monitoring - average valuesEvidently - experiment monitoring - improvement

Additional Thoughts
Before we wrap-up, I’d like to share some additional considerations.

First, it is important to understand that I choose to demo Evidently in the context of front-end application development. However, you may use Evidently with any application type: front-end web or mobile, back-end API, or even machine learning (ML). For example, you may use Evidently to deploy two different ML models and conduct experiments just like I showed above.

Second, just like with other AWS Services, Evidently API is available in all of our AWS SDK. This lets you use EvaluateFeature and other APIs from nine programing languages: C++, Go, Java, JavaScript (and Typescript), .Net, NodeJS, PHP, Python, and Ruby. AWS SDK for Rust and Swift are in the making.

Third, for a front-end application as I demoed here, it is important to consider how to authenticate calls to Evidently API. Hard coding access keys and secret access keys is not an option. For the front-end scenario, I suggest that you use Amazon Cognito Identity Pools to exchange user identity tokens for a temporary access and secret keys. User identity tokens may be obtained from Cognito User Pools, or third-party authentications systems, such as Active Directory, Login with Amazon, Login with Facebook, Login with Google, Signin with Apple, or any system compliant with OpenID Connect or SAML. Cognito Identity Pools also allows for anonymous access. No identity token is required. Cognito Identity Pools vends temporary tokens associated with IAM roles. You must Allow calls to the evidently:EvaluateFeature API in your policies.

Finally, when using feature flags, plan for code cleanup time during your sprints. Once a feature is launched, you might consider removing calls to EvaluateFeature API and the if-then-else logic used to initially hide the feature.

Pricing and Availability
Amazon Cloudwatch Evidently is generally available in nine AWS Regions: US East (N. Virginia), US East (Ohio), US West (Oregon), Asia Pacific (Singapore), Asia Pacific (Sydney), Asia Pacific (Tokyo), Europe (Ireland), Europe (Frankfurt), and Europe (Stockholm). As usual, we will gradually extend to other Regions in the coming months.

Pricing is pay-as-you-go with no minimum or recurring fees. CloudWatch Evidently charges your account based on Evidently events and Evidently analysis units. Evidently analysis units are generated from Evidently events, based on rules you have created in Evidently. For example, a user checkout event may produce two Evidently analysis units: checkout value and the number of items in cart. For more information about pricing, see Amazon CloudWatch Pricing.

Start experimenting with CloudWatch Evidently today!

— seb

New – Amazon EC2 G5g Instances Powered by AWS Graviton2 Processors and NVIDIA T4G Tensor Core GPUs

Post Syndicated from Channy Yun original https://aws.amazon.com/blogs/aws/new-amazon-ec2-g5g-instances-powered-by-aws-graviton2-processors-and-nvidia-t4g-tensor-core-gpus/

AWS Graviton2 processors are custom-designed by AWS to enable the best price performance in Amazon EC2. Thousands of customers are realizing significant price performance benefits for a wide variety of workloads with Graviton2-based instances.

Today, we are announcing the general availability of Amazon EC2 G5g instances that extend Graviton2 price-performance benefits to GPU-based workloads including graphics applications and machine learning inference. In addition to Graviton2 processors, G5g instances feature NVIDIA T4G Tensor Core GPUs to provide the best price performance for Android game streaming, with up to 25 Gbps of networking bandwidth and 19 Gbps of EBS bandwidth.

These instances provide up to 30 percent lower cost per stream per hour for Android game streaming than x86-based GPU instances. G5g instances are also ideal for machine learning developers who are looking for cost-effective inference, have ML models that are sensitive to CPU performance, and leverage NVIDIA’s AI libraries.

G5g instances are available in the six sizes as shown below.

Instance Name vCPUs Memory (GB) NVIDIA T4G Tensor Core GPU GPU Memory (GB) EBS Bandwidth (Gbps) Network Bandwidth (Gbps)
g5g.xlarge 4 8 1 16 Up to 3.5 Up to 10
g5g.2xlarge 8 16 1 16 Up to 3.5 Up to 10
g5g.4xlarge 16 32 1 16 Up to 3.5 Up to 10
g5g.8xlarge 32 64 1 16 9 12
g5g.16xlarge 64 128 2 32 19 25
g5g.metal 64 128 2 32 19 25

These instances are a great fit for many interesting types of workloads. Here are a few examples:

  • Streaming Android gaming—With G5g instances, Android game developers can build natively on Arm-based GPU instances without the need for cross-compilation or emulation on x86-based instances. They can encode the rendered graphics and stream the game over the network to a mobile device. This helps simplify development efforts and time and lowers the cost per stream per hour by up to 30 percent.
  • ML Inference —G5g instances are also ideal for machine learning developers who are looking for cost-effective inference, have ML models that are sensitive to CPU performance, and leverage NVIDIA’s AI If you don’t have any dependencies on NVIDIA software, you may use Inf1 instances, which deliver up to 70 percent lower cost-per-inference than G4dn instances.
  • Graphics rendering—G5g instances are the most cost-effective option for customers with rendering workloads and dependencies on NVIDIA libraries. These instances also support rendering applications and use cases that leverage industry-standard APIs such as OpenGL and Vulkan.
  • Autonomous Vehicle Simulations—Several of our customers are designing and simulating autonomous vehicles that include multiple real-time sensors. They can use ray tracing to simulate sensor input in real time.

The instances are compatible with a very long list of graphical and machine learning libraries on Linux, including NVENC, NVDEC, nvJPEG, OpenGL, Vulkan, CUDA, CuDNN, CuBLAS, and TensorRT.

Available Now
The new G5g instances are available now, and you can start using them today in the US East (N. Virginia), US West (Oregon), and Asia-Pacific (Seoul, Singapore and Tokyo) Regions in On-Demand, Spot, Savings Plan, and Reserved Instance form. To learn more, see the EC2 pricing page.

G5g instances are available now in AWS Deep Learning AMIs with NVIDIA drivers and popular ML frameworks, Amazon Elastic Container Service (Amazon ECS), or Amazon Elastic Kubernetes Service (Amazon EKS) clusters for containerized ML applications.

You can send feedback to the AWS forum for Amazon EC2 or through your usual AWS Support contacts.

Channy

New for AWS Compute Optimizer – Resource Efficiency Metrics to Estimate Savings Opportunities and Performance Risks

Post Syndicated from Danilo Poccia original https://aws.amazon.com/blogs/aws/new-for-aws-compute-optimizer-resource-efficiency-metrics-to-estimate-savings-opportunities-and-performance-risks/

By applying the knowledge drawn from Amazon’s experience running diverse workloads in the cloud, AWS Compute Optimizer identifies workload patterns and recommends optimal AWS resources.

Today, I am happy to share that AWS Compute Optimizer now delivers resource efficiency metrics alongside its recommendations to help you assess how efficiently you are using AWS resources:

  • A dashboard shows you savings and performance improvement opportunities at the account level. You can dive into resource types and individual resources from the dashboard.
  • The Estimated monthly savings (On-Demand) and Savings opportunity (%) columns estimate the possible savings for over-provisioned resources. You can sort your recommendations using these two columns to quickly find the resources on which to focus your optimization efforts.
  • The Current performance risk column estimates the bottleneck risk with the current configuration for under-provisioned resources.

These efficiency metrics are available for Amazon Elastic Compute Cloud (Amazon EC2), AWS Lambda, and Amazon Elastic Block Store (EBS) at the resource and AWS account levels.

For multi-account environments, Compute Optimizer continuously calculates resource efficiency metrics at individual account level in an AWS organization to help identify teams with low cost-efficiency or possible performance risks. This lets you to create goals and track progress over time. You can quickly understand just how resource-efficient teams and applications are, easily prioritize recommendation evaluation and adoption by engineering team, and establish a mechanism that drives a cost-aware culture and accountability across engineering teams.

Using Resource Efficiency Metrics in AWS Compute Optimizer
You can opt in using the AWS Management Console or the AWS Command Line Interface (CLI) to start using Compute Optimizer. You can enroll the account that you’re currently signed in to or all of the accounts within your organization. Depending on your choice, Compute Optimizer analyzes resources that are in your individual account or for each account in your organization, and then generates optimization recommendations for those resources.

To see your savings opportunity in Compute Optimizer, you should also opt in to AWS Cost Explorer and enable the rightsizing recommendations in the AWS Cost Explorer preferences page. For more details, see Getting started with rightsizing recommendations.

I already enrolled some time ago, and in the Compute Optimizer console I see the overall savings opportunity for my account.

Console screenshot.

Below that, I have a recap of the performance improvement opportunity. This includes an overview of the under-provisioned resources, as well as the performance risks that they pose by resource type.

Console screenshot.

Let’s dive into some of those savings. In the EC2 instances section, Compute Optimizer found 37 over-provisioned instances.

Console screenshot.

I follow the 37 instances link to get recommendations for those resources, and then sort the table by Estimated monthly savings (On-Demand) descending.

Console screenshot.

On the right, in the same table, I see which is the current instance type, the recommended instance type based on Computer Optimizer estimates, the difference in pricing, and if there are platform differences between the current and recommended instance types.

Console screenshot.

I can select each instance to further drill down into the metrics collected, as well as the other possible instance types suggested by Computer Optimizer.

Back to the Compute Optimizer Dashboard, in the Lambda functions section, I see that eight functions have under-provisioned memory.

Console screenshot.

Again, I follow the 8 functions link to get recommendations for those resources, and then sort the table by Current performance risk. In my case, the risk is always low, but different values can help prioritize your activities.

Console screenshot.

Here, I see the current and recommended configured memory for those Lambda functions. I can select each function to get a view of the metrics collected. Choosing the memory allocated to Lambda functions is an optimization process that balances speed (duration) and cost. See Profiling functions with AWS Lambda Power Tuning in the documentation for more information.

Availability and Pricing
You can use resource efficiency metrics with AWS Compute Optimizer in any AWS Region where it is offered. For more information, see the AWS Regional Services List. There is no additional charge for this new capability. See the AWS Compute Optimizer pricing page for more information.

This new feature lets you implement a periodic workflow to optimize your costs:

  • You can start by reviewing savings opportunities for all of your accounts to identify which accounts have the highest savings opportunity.
  • Then, you can drill into those accounts with the highest savings opportunity. You can refer to the estimated monthly savings to see which recommendations can drive the largest absolute cost impact.
  • Finally, you can communicate optimization opportunities and priority order to the teams using those accounts.

Start using AWS Compute Optimizer today to find and prioritize savings opportunities in your AWS account or organization.

Danilo

New for AWS Compute Optimizer – Enhanced Infrastructure Metrics to Extend the Look-Back Period to Three Months

Post Syndicated from Danilo Poccia original https://aws.amazon.com/blogs/aws/new-for-aws-compute-optimizer-enhanced-infrastructure-metrics-to-extend-the-look-back-period-to-three-months/

By using machine learning to analyze historical utilization metrics, AWS Compute Optimizer recommends optimal AWS resources for your workloads to reduce costs and improve performance. Over-provisioning resources can lead to unnecessary infrastructure costs, and under-provisioning resources can lead to poor application performance. Compute Optimizer helps you choose optimal configurations for three types of AWS resources: Amazon Elastic Compute Cloud (Amazon EC2) instances, Amazon Elastic Block Store (EBS) volumes, and AWS Lambda functions, based on your utilization data. Today, I am happy to share that AWS Compute Optimizer now supports recommendation preferences where you can opt in or out of features that enhance resource-specific recommendations.

For EC2 instances, AWS Compute Optimizer analyzes Amazon CloudWatch metrics from the past 14 days to generate recommendations. For this reason, recommendations weren’t relevant for a subset of workloads that had monthly or quarterly patterns. For those workloads, you had to look for unoptimized resources and determine the right resource configurations over a longer period of time. This can be time-consuming and requires deep cloud expertise, especially for large organizations.

With the launch of recommendation preferences, Compute Optimizer now offers enhanced infrastructure metrics, a new paid recommendation preference feature that enhances recommendation quality for EC2 instances and Auto Scaling groups. Activating it extends the metrics look-back period to three months. You can activate enhanced infrastructure metrics for individual resources or at the AWS account or AWS organization level.

Let’s see how that works in practice.

Using Enhanced Infrastructure Metrics with AWS Compute Optimizer
Here, I am using the management account of my AWS organization to see organization-level preferences. In the left pane of the Compute Optimizer console, I choose Accounts. Here, there is a new section to set up Organization level preferences for enhanced infrastructure metrics. The console warns me that this is a paid feature.

I want to activate enhanced infrastructure metrics for EC2 instances running in the US East (N. Virginia) Region for all accounts in my organization. I choose the Edit button. For Resource type, I select EC2 instances. For Region, I select US East (N. Virginia). I check that the flag is active and save.

Console screenshot.

If I select one of the AWS accounts on this page, I can choose View preferences and override the setting for that specific account. For example, I can disable accounts that I use for testing because EC2 instances there are created automatically by a CI/CD pipeline and are usually terminated within a few hours.

Console screenshot.

In the console Dashboard, I look at the overall recommendations for EC2 instances and Auto Scaling groups.

Console screenshot.

In the EC2 instances box, I choose View recommendations and then one of the instances. With the Edit button, I can activate or inactivate enhanced infrastructure metrics for this specific resource. Here, I can also see if, considering all settings at organization, account, and resource level, enhanced infrastructure metrics is actually active or not for this specific EC2 instance. I see Active (pending) here because I’ve just changed the setting and it may take a few hours for Compute Optimizer to consider my updated preferences in its recommendations.

Console screenshot.

Below, I see the recommended options for the instance. Considering the current workload, I should change instance type and size from c3.2xlarge to r5d.large and save some money.

Console screenshot.

In a few hours, Compute Optimizer updates its recommendations based on the latest three months of CloudWatch metrics. In this way, I get better suggestions for workloads that have monthly or quarterly activities.

Availability and Pricing
You can activate enhanced infrastructure metrics in the AWS Compute Optimizer account preferences page for all the accounts in your organization or for individual accounts. If you need more granular controls, you can activate (or deactivate) for an individual resource (Auto Scaling group or EC2 instance) in the resource detail page. You can also activate enhanced infrastructure metrics using the AWS Command Line Interface (CLI) or AWS SDKs.

Default preferences in Compute Optimizer (with 14-day look-back) are free. Enabling enhanced infrastructure metrics costs $0.0003360215 per resource per hour and is charged based on the number of hours per month the resource is running. For a resource running a full 31-day month, that’s $0.25. For more information, see the Compute Optimizer pricing page.

Use enhanced infrastructure metrics to generate recommendations with Compute Optimizer based on metrics from the past three months.

Danilo

New – AWS Migration Hub Refactor Spaces Helps to Incrementally Refactor Your Applications

Post Syndicated from Sébastien Stormacq original https://aws.amazon.com/blogs/aws/new-aws-migration-hub-refactor-spaces-helps-to-incrementally-refactor-your-applications/

I am excited to announce the preview of AWS Migration Hub Refactor Spaces, a new capability of AWS Migration Hub to let you refactor existing applications into distributed applications, typically based on microservices.

There are multiple reasons why you want to refactor existing applications. You might want to make your code more modular, use more modern frameworks, use different data storage, etc. In general, when refactoring, your objective is to make your application easier to maintain and evolve over time. Other benefits might include handling larger workloads, increasing resiliency, or lowering costs. But let’s face it, refactoring is hard. I usually compare refactoring to changing the engines, cabin seats, and entertainment system of a plane while keeping the plane in the air, fully loaded with passengers, and without having them notice any change.

When talking with customers who have successfully been through these refactoring projects, we noticed a common pattern: the Strangler Fig design pattern.

strangler fig

A strangler fig is a family of plants that grow their roots from the top of the trees that host them, eventually enveloping or replacing their host. Author Martin Fowler first coined the term to describe a migration design pattern. The idea is “to gradually create a new system around the edges of the old, letting it grow slowly over several years until the old system is strangled”.

How Can I Apply This Plant Behavior To My Application Migration?
Inspired by this family of plants, I might want to extract capabilities from a monolithic application and rewrite them as microservices. Then, I incrementally route traffic away from the old to the new. Over time, all of the requests are routed to microservices, and the existing application is retired.

While effective, this approach to application transformation creates hurdles. I must create the required infrastructure to separate the existing applications and the microservices. In the AWS cloud, this often involves creating multiple AWS accounts, so teams or services can more easily operate independently. Having multiple accounts is the most efficient way to separate concerns and billing across teams. When dealing with multiple AWS accounts, it is required to maintain networking infrastructure to connect my existing application and new services together. Furthermore, I must create a routing control system to route traffic gradually from the old application to the new services in different accounts. Creating and managing that infrastructure at scale is complex. It introduces additional risks and costs to the refactor project.

How Refactor Spaces Helps
AWS Migration Hub Refactor Spaces takes care of the heavy lifting for me. First, it lays down the networking infrastructure to enable connectivity between multiple AWS accounts. Second, it creates and manages a mechanism to route API calls away from my legacy application.

Let’s imagine I have a monolithic application that I want to refactor. The application is made of a web-based front-end using ReactJS. The front-end application is hosted on Amazon Simple Storage Service (Amazon S3) and distributed through Amazon CloudFront. The front-end makes API calls to a monolithic application developed in NodeJS or Python and deployed on several EC2 instances. The API uses a relational database, because this is how we store data since the company existed.

The architecture of this application is illustrated by the following diagram.

refactor spaces - monolith

Each API has a distinct URI. For example the /cart API handles the shopping basket, the /order API handles the ordering system, etc. I apply the strangler fig pattern and decide to extract the /cart capabilities to a set of new microservices. I create an AWS account for these microservices. I develop and deploy a set of AWS Lambda functions to implement the cart management functionalities. I chose to use Amazon DynamoDB for the shopping basket data storage because of its low latency at scale.

The schema of my new architecture is shown in the following diagram:

Refactor Space - target architectureBut now I have two challenges. First, I have to design, code, and deploy a routing mechanism to route API calls made by the front-end application to the correct back-end: either the monolith, or the new microservices. This service will likely be deployed into a distinct AWS account. Then, I have to configure network connectivity between these multiple AWS accounts.

This is where Refactor Spaces comes into the picture.

Introducing AWS Migration Hub Refactor Spaces
Refactor Spaces makes it easy to manage application refactoring by taking care of the two challenges I just described: the routing of the API calls and the network connectivity between AWS accounts. It is made of Environments, Services, and an Application proxy. Let’s see it in action.

I open the AWS Management Console, navigate to AWS Migration Hub, and select Refactor Spaces.

I first create a Refactor Spaces Environment. An Environment is a multi-account network fabric consisting of peered VPCs. This lets AWS resources in service VPCs added to the environment communicate directly across AWS accounts. It also provides a unified view of networking and services across accounts.

In Create environment, I give my environment a name and a description, and then select Next.

Refactor Spaces - Create environment

Then, I define my application. I give my application a name, and select the VPC where the proxy will be deployed.

An application is a services container. It has a proxy that defines routes. The proxy lets your front-end application use a single endpoint to contact multiple services. All of the traffic hits the single proxy endpoint, and then it’s sent to multiple services based on your rules.

Refactor Space - Create application

You may want to use multiple AWS accounts as explained before. Typically, an application is made of one AWS Account that hosts the Refactor Spaces Application proxy, one or multiple AWS accounts to host the legacy application, and one AWS account for the first microservice. Therefore, I invite the other AWS account owners to join this Refactor Spaces environment. I add one principal per AWS Account. Refactor Spaces doesn’t reinvent the wheel, but it leverages AWS Resource Access Manager (RAM) to do so.

This step is optional. Refactor Spaces may work within one AWS Account. It is possible to share the environments with other AWS accounts at a later stage.

I enter the AWS account IDs as Principals, and then select Next.

Refactor Space - Shared Accounts

Finally, I review my choices and select Create & share environment (not shown here).

Assuming that the microservices are ready to use, the next step is registering them as Refactor Spaces Services. Refactor Spaces Services are entities that provide business capabilities, typically microservices. These services are reachable through unique endpoints, and they can interoperate across accounts in a Refactor Spaces Environment. In this example, there are four services:

  • The monolithic app. This is the default service where Refactor Spaces routes all API calls initiated by the front-end.
  • Three microservices to implement the /cart capability. I decided to refactor this capability with three distinct sevices: AddItem, RemoveItem, and ListItems.

A Refactor Spaces Service may target any compute resource type: EC2, containers deployed on AWS Fargate, an Application Load Balancer, an AWS Lambda function, etc.

I select Create service from the left menu. The service configuration is in three steps. First, I select the Refactor Spaces Environment and Application where I want to define this service. Second, I give my service a name and a description. And third, I select the service endpoint: either an HTTP/HTTPS URL in a VPC, or a Lambda function.

The monolithic application is the default route where Refactor Spaces Application proxy routes all of the API calls, unless otherwise specified. I enter / as Source path and select Include child paths. Then, I make make sure Match all is selected for HTTP verbs.

When finished, I select Create service. I repeat this process for each of my microservices. For this demo, I create four Refactor Spaces Services in total.

AWS Migration Hub refactor Spaces - create service

The last step defines the routing rules for the Refactor Spaces Application proxy. When configured, the proxy becomes the new API endpoint for my front-end application. The sole change that I have to make in my front-end application is to point it at the Refactor Spaces Application proxy URI. The proxy routes API calls to Services, according to a route definition. An Application proxy supports routing to all compute platforms with public or private visibility. At the moment, private endpoints must be referred through a public DNS name or their private IP address. Each API call is run against the set of routes configured in the proxy. When a path matches a rule, the request is sent to the target service configured for that path. Proxies have a default route that forwards requests to a default service if they don’t match any of the path rules.

I select the service that I just created. Then, I enter the route Source path and the HTTP Verb to support. When my service expects subpaths (such as /cart/123), I make sure to select Include child paths, as well.

Refactor Spaces - Define route

I repeat this process for the GetItem and RemoveItem microservices. They are invoked for different HTTP verbs: GET and DELETE respectively.

Based on this configuration, Refactor Spaces creates and manages the following architecture for me. The Refactor Spaces Application proxy and network fabric are deployed in a separate AWS account. I might further configure the Amazon API Gateway based on the needs of my monolithic application or microservices.

Refactor Spaces - final architecture

The ultimate change is for the application front-end. I modify its configuration to point to the Refactor Spaces Application proxy endpoint, instead of the monolith’s endpoint. From now on, Refactor Spaces routes API calls to the monolith by default. It routes the /cart calls for GET, POST, and DELETE verbs to my new microservices implemented as Lambda functions.

Over time, I will repeat this process to move other capabilities out of the monolithic application, one-by-one, until the old monolith is strangled replaced by the new microservices architecture.

Pricing and Availaibility
AWS Migration Hub Refactor Spaces is available today in the ten following AWS Regions: US East (N. Virginia), US West (Oregon), US East (Ohio), Asia Pacific (Singapore) Asia Pacific (Sydney), Asia Pacific (Tokyo), Europe (Ireland), Europe (Frankfurt), Europe (London), and Europe (Stockholm). As per usual, we’re looking forward to expanding to additional Regions in the future.

This new capability is available today as an open preview, and no registration is necessary. You can start to use it today. There is no charge for using Refactor Space during the preview period. However, you may be charged for the resources that it provisions on your AWS accounts: Amazon API Gateway, AWS Transit Gateway, and Network Load Balancer. The pricing details are available on AWS Migration Hub’s pricing page. Billing will start when Refactor Spaces will be generally available.

Go and start refactoring your applications today!

— seb

Security updates for Monday

Post Syndicated from original https://lwn.net/Articles/877105/rss

Security updates have been issued by Debian (bluez, icu, libntlm, libvorbis, libvpx, opensc, roundcube, and tar), Fedora (kernel, kernel-headers, kernel-tools, puppet, slurm, stargz-snapshotter, and suricata), openSUSE (netcdf), Oracle (bluez, kernel, kernel-container, krb5, mailman:2.1, openssh, python3, and rpm), Red Hat (samba), and SUSE (xen).

re:Invent Session Preview – Under the Hood at Amazon Ads

Post Syndicated from Jeff Barr original https://aws.amazon.com/blogs/aws/reinvent-session-preview-under-the-hood-at-amazon-ads/

My colleagues have spent months creating, reviewing, and improving the content for their upcoming AWS re:Invent sessions. While I do my best not to play favorites, I would like to tell you about one that recently caught my eye!

Session ADM301 (Under the Hood at Amazon Ads) takes place on Tuesday, November 30th at 2 PM. In the session, my colleagues will introduce Amazon Ads, outline the challenges that come with building an advertising system at scale, and then show how they solved those challenges using multiple AWS services. I was able to review a near-final version of their presentation and this post is based on what I learned from that review.

Amazon Ads uses an omnichannel strategy with four elements: building awareness, increasing consideration, engaging shoppers, and driving purchases. Using the well-known “start from the customer and work backwards” model that we use at Amazon, they identified three distinct customer types and worked to design a system that would address their needs. The customer types were:

  • Advertisers running campaigns
  • Third-party partners who use Amazon Ads APIs to build tools & services
  • Shoppers on a purchase journey

Advertisers and third-party developers wanted an experience that spanned both UIs and programmatic interfaces, encompassing campaign management, budgeting, ad serving, a data lake for ad events, and machine learning to improve ad selection & relevance.

Scaling is a really interesting problem, with challenges around performance, storage, availability, cost, and effectiveness. In addition to handling hundreds of millions of ad requests per second (trillions of ads per day) within a latency budget of 120 ms, the ad server must be able to:

  • Track tens of billions of campaign objects, with overall storage measured in hundreds of petabytes
  • Deliver > 99.9999% availability
  • Handle peak events such as Prime Day automatically
  • Run economically and enforce advertiser budgets in near real-time
  • Deliver highly relevant ads using predictions from hundreds of machine learning models

As just one example of what it takes to handle a workload of this magnitude, they needed a caching system capable of handling 500 million requests per second!

As is often the case, the system went through multiple iterations before it reached its current form, and is still under active development. The presentation recaps the journey that the team went through, with architectural snapshots and performance metrics for each iteration.

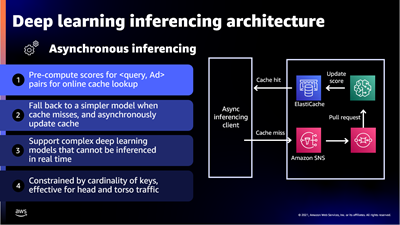
The presentation wraps up by discussing some of the ways that they were able to apply machine learning at scale. For example, to select the right ad for each request, Amazon Ads uses deep learning models to predict relevant ads to show shoppers, predict whether a shopper will click or purchase, and allocate and price an ad. In order to do this, they needed to be able to score thousands of ads per request within a 20 ms window at over 100K transactions per second, all across hundreds of models that each required different hardware and software optimizations.

To handle this workload they built a micro-service inferencing architecture on top of Amazon Elastic Container Service (Amazon ECS) and AWS App Mesh with specific hardware and software optimizations for each type of inference model. For low-latency inferencing the Ads team began with a CPU-based solution and then moved to GPUs to reduce prediction time even as complexity and the number of models grew.

This looks like a very interesting session and I hope that you will be able to attend in person or to watch it online as part of virtual re:Invent.

Jeff;

Пледирам невменяемост, дами и господа съдебни заседатели!

Post Syndicated from original https://bivol.bg/%D0%BF%D0%BB%D0%B5%D0%B4%D0%B8%D1%80%D0%B0%D0%BC-%D0%BD%D0%B5%D0%B2%D0%BC%D0%B5%D0%BD%D1%8F%D0%B5%D0%BC%D0%BE%D1%81%D1%82-%D0%B4%D0%B0%D0%BC%D0%B8-%D0%B8-%D0%B3%D0%BE%D1%81%D0%BF%D0%BE%D0%B4%D0%B0.html

понеделник 29 ноември 2021


Виждали ли сте невменяем човек? Дори и да мислите, че не сте, със сигурност сте виждали, макар и да не си давате сметка са това. Единственият начин да сте били…

The collective thoughts of the interwebz