Celebrating the community: Cian

Post Syndicated from Katie Gouskos original https://www.raspberrypi.org/blog/community-stories-cian-google-apprenticeship/

Today we bring you the sixth film in our series of inspirational community stories. It’s wonderful to share how people all across the world are getting creative with tech and solving problems that matter to them.

Cian Martin Bohan.

Our next community story comes from Drogheda, Ireland, where a group of programmers set up the second ever CoderDojo coding club for young people. One of that Dojo’s attendees was Cian Martin Bohan, whose story we’re sharing today.

“I can’t create anything I want in real life, but I can create anything I want on a computer.”

Cian Martin Bohan

Watch Cian’s video to find out how this keen programmer went from his first experience with coding at his local CoderDojo as an 11-year-old, to landing a Software Engineering apprenticeship at Google.

Cian, a boy at his first CoderDojo coding club session.
Cian at his very first CoderDojo session

Meet Cian

Cian (20) vividly remembers the first time he heard about CoderDojo as a shy 11-year-old: he initially told his dad he felt too nervous to attend. What Cian couldn’t have known back then was that attending CoderDojo would set him on an exciting journey of creative digital making and finding life-long friends.

Help us celebrate Cian by liking and sharing his story on Twitter, LinkedIn, and Facebook.

Right from the beginning, the CoderDojo gave Cian space to make friends and develop his coding skills and his curiosity about creating things with technology. He started to attend the Dojo regularly, and before long he had created his own website about the planets in our solar system with basic CSS and HTML.  

“I made a website that talked about the planets, and I thought that was the coolest thing ever. In fact, I actually still have that website.”

Cian Martin Bohan

In over 6 years of being part of his CoderDojo community, Cian was able to share his passion for programming with others and grow his confidence.

From meeting like-minded peers and developing apps and websites, to serving as a youth member on the Digital Youth Council, Cian embraced the many experiences that CoderDojo opened up for him. They were all of great benefit when he decided to apply for an apprenticeship at Google.

As someone who didn’t follow the university route of education, Cian’s time at CoderDojo and the mentors he met there had a profound impact on his life and his career path. His CoderDojo mentors always encouraged Cian to learn new skills and follow his interests, and in this way they not only helped him reach his current position at Google, but also instilled in him a steady desire to always keep learning.

The future is limitless for Cian, and we cannot wait to hear what he does next.

Help us celebrate Cian, and inspire other young people to discover coding and digital making as a passion, by liking and sharing his story on Twitter, LinkedIn, and Facebook.

The post Celebrating the community: Cian appeared first on Raspberry Pi.

Enforce customized data quality rules in AWS Glue DataBrew

Post Syndicated from Navnit Shukla original https://aws.amazon.com/blogs/big-data/enforce-customized-data-quality-rules-in-aws-glue-databrew/

GIGO (garbage in, garbage out) is a concept common to computer science and mathematics: the quality of the output is determined by the quality of the input. In modern data architecture, you bring data from different data sources, which creates challenges around volume, velocity, and veracity. You might write unit tests for applications, but it’s equally important to ensure the data veracity of these applications, because incoming data quality can make or break your application. Incorrect, missing, or malformed data can have a large impact on production systems. Examples of data quality issues include but are not limited to the following:

  • Missing or incorrect values can lead to failures in the production system that require non-null values
  • Changes in the distribution of data can lead to unexpected outputs of machine learning (ML) models
  • Aggregations of incorrect data can lead to wrong business decisions
  • Incorrect data types have a big impact on financial or scientific institutes

In this post, we introduce data quality rules in AWS Glue DataBrew. DataBrew is a visual data preparation tool that makes it easy to profile and prepare data for analytics and ML. We demonstrate how to use DataBrew to define a list of rules in a new entity called a ruleset. A ruleset is a set of rules that compare different data metrics against expected values.

The post describes the implementation process and provides a step-by-step guide to build data quality checks in DataBrew.

Solution overview

To illustrate our data quality use case, we use a human resources dataset. This dataset contains the following attributes:

Emp ID, Name Prefix, First Name, Middle Initial,Last Name,Gender,E Mail,Father's Name,Mother's Name,Mother's Maiden Name,Date of Birth,Time of Birth,Age in Yrs.,Weight in Kgs.,Date of Joining,Quarter of Joining,Half of Joining,Year of Joining,Month of Joining,Month Name of Joining,Short Month,Day of Joining,DOW of Joining,Short DOW,Age in Company (Years),Salary,Last % Hike,SSN,Phone No. ,Place Name,County,City,State,Zip,Region,User Name,Password

For this post, we downloaded data with 5 million records, but feel free to use a smaller dataset to follow along with this post.

The following diagram illustrates the architecture for our solution.

The steps in this solution are as follows:

  1. Create a sample dataset.
  2. Create a ruleset.
  3. Create data quality rules.
  4. Create a profile job.
  5. Inspect the data quality rules validation results.
  6. Clean the dataset.
  7. Create a DataBrew job.
  8. Validate the data quality check with the updated dataset.

Prerequisites

Before you get started, complete the following prerequisites:

  1. Have an AWS account.
  2. Download the sample dataset.
  3. Extract the CSV file.
  4. Create an Amazon Simple Storage Service (Amazon S3) bucket with three folders: input, output, and profile.
  5. Upload the sample data in input folder to your S3 bucket (for example, s3://<s3 bucket name>/input/).

Create a sample dataset

To create your dataset, complete the following steps:

  1. On the DataBrew console, in the navigation pane, choose Datasets.
  2. Choose Connect new dataset.
  3. For Dataset name, enter a name (for example, human-resource-dataset).
  4. Under Data lake/data store, choose Amazon S3 as your source.
  5. For Enter your source from Amazon S3, enter the S3 bucket location where you uploaded your sample files (for example, s3://<s3 bucket name>/input/).
  6. Under Additional configurations, keep the selected file type CSV and CSV delimiter comma (,).
  7. Scroll to the bottom of the page and choose Create dataset.

The dataset is now available on the Datasets page.

Create a ruleset

We now define data quality rulesets against the dataset created in the previous step.

  1. On the DataBrew console, in the navigation pane, choose DQ Rules.
  2. Choose Create data quality ruleset.
  3. For Ruleset name, enter a name (­for example, human-resource-dataquality-ruleset).
  4. Under Associated dataset, choose the dataset you created earlier.

Create data quality rules

To add data quality rules, you can use rules and add multiple rules, and within each rule, you can define multiple checks.

For this post, we create the following data quality rules and data quality checks within the rules:

  • Row count is correct
  • No duplicate rows
  • Employee ID, email address, and SSN are unique
  • Employee ID and phone number are not be null
  • Employee ID and employee age in years has no negative values
  • SSN data format is correct (123-45-6789)
  • Phone number for string length is correct
  • Region column only has the specified region
  • Employee ID is an integer

Row count is correct

To check the total row count, complete the following steps:

  1. Add a new rule.
  2. For Rule name, enter a name (for example, Check total record count).
  3. For Data quality check scope, choose Individual check for each column.
  4. For Rule success criteria, choose All data quality checks are met (AND).
  5. For Data quality checks¸ choose Number of rows.
  6. For Condition, choose Is equals.
  7. For Value, enter 5000000.

No duplicate rows

To check the dataset for duplicate rows, complete the following steps:

  1. Choose Add another rule.
  2. For Rule name, enter a name (for example, Check dataset for duplicate rows).
  3. For Data quality check scope, choose Individual check for each column.
  4. For Rule success criteria, choose All data quality checks are met (AND).
  5. Under Check 1, for Data quality check¸ choose Duplicate rows.
  6. For Condition, choose Is equals.
  7. For Value, enter 0 and choose rows on the drop-down menu.

Employee ID, email address, and SSN are unique

To check that the employee ID, email, and SSN are unique, complete the following steps:

  1. Choose Add another rule.
  2. For Rule name, enter a name (for example, Check dataset for Unique Values).
  3. For Data quality check scope, choose Common checks for selected columns.
  4. For Rule success criteria, choose All data quality checks are met (AND).
  5. For Selected columns, select Selected columns.
  6. Choose the columns Emp ID, e mail, and SSN.
  7. Under Check 1, for Data quality check, choose Unique values.
  8. For Condition, choose Is equals.
  9. For Value, enter 100 and choose %(percent) rows on the drop-down menu.

Employee ID and phone number are not be null

To check that employee IDs and phone numbers aren’t null, complete the following steps:

  1. Choose Add another rule.
  2. For Rule name, enter a name (for example, Check Dataset for NOT NULL).
  3. For Data quality check scope, choose Common checks for selected columns.
  4. For Rule success criteria, choose All data quality checks are met (AND).
  5. For Selected columns, select Selected columns.
  6. Choose the columns Emp ID and Phone No.
  7. Under Check 1, for Data quality check, choose Value is not missing.
  8. For Condition, choose Greater than equals.
  9. For Threshold, enter 100 and choose %(percent) rows on the drop-down menu.

Employee ID and age in years has no negative values

To check the employee ID and age for positive values, complete the following steps:

  1. Choose Add another rule.
  2. For Rule name, enter a name (for example, Check emp ID and age for positive values).
  3. For Data quality check scope, choose Individual check for each column.
  4. For Rule success criteria, choose All data quality checks are met (AND).
  5. Under Check 1, for Data quality check, choose Numeric values.
  6. Choose Emp ID on the drop-down menu.
  7. For Condition, choose Greater than equals.
  8. For Value, select Custom value and enter 0.
  9. Choose Add another quality check and repeat the same steps for age in years.

SSN data format is correct

To check the SSN data format, complete the following steps:

  1. Choose Add another rule.
  2. For Rule name, enter a name (for example, Check dataset format).
  3. For Data quality check scope, choose Individual check for each column.
  4. For Rule success criteria, choose All data quality checks are met (AND).
  5. Under Check 1, for Data quality check, choose String values.
  6. Choose SSN on the drop-down menu.
  7. For Condition, choose Matches (RegEx pattern).
  8. For RegEx value, enter ^[0-9]{3}-[0-9]{2}-[0-9]{4}$.

Phone number string length is correct

To check the length of the phone number, complete the following steps:

  1. Choose Add another rule.
  2. For Rule name, enter a name (for example, Check Dataset Phone no. for string length).
  3. For Data quality check scope, choose Individual check for each column.
  4. For Rule success criteria, choose All data quality checks are met (AND).
  5. Under Check 1, for Data quality check, choose Value string length.
  6. Choose Phone No on the drop-down menu.
  7. For Condition, choose Greater than equals.
  8. For Value, select Custom value and enter 9.
  9. Under Check 2, for Data quality check, choose Value string length.
  10. Choose Phone No on the drop-down menu.
  11. For Condition, choose Less than equals.
  12. For Value¸ select Custom value and enter 12.

Region column only has the specified region

To check the Region column, complete the following steps:

  1. Choose Add another rule.
  2. For Rule name, enter a name (for example, Check Region column only for specific region).
  3. For Data quality check scope, choose Individual check for each column.
  4. For Rule success criteria, choose All data quality checks are met (AND).
  5. Under Check 1, for Data quality check, choose Value is exactly.
  6. Choose Region on the drop-down menu.
  7. For Value, select Custom value.
  8. Choose the values Midwest, South, West, and Northeast.

Employee ID is an integer

To check that the employee ID is an integer, complete the following steps:

  1. Choose Add another rule.
  2. For Rule name, enter a name (for example, Validate Emp ID is an Integer).
  3. For Data quality check scope, choose Individual check for each column.
  4. For Rule success criteria, choose All data quality checks are met (AND).
  5. Under Check 1, for Data quality check, choose String values.
  6. Choose Emp ID on the drop-down menu.
  7. For Condition, choose Matches (RegEx pattern).
  8. For RegEx value, enter ^[0-9]+$.
  9. After you create all the rules, choose Create ruleset.

Your ruleset is now listed on the Data quality rulesets page.

Create a profile job

To create a profile job with your new ruleset, complete the following steps:

  1. On the Data quality rulesets page, select the ruleset you just created.
  2. Choose Create profile job with ruleset.
  3. For Job name, keep the prepopulated name or enter a new one.
  4. For Data sample, select Full dataset.

The default sample size is important for data quality rules validation, because it matters if you validate all the roles or a limited sample.

  1. Under Job output settings, for S3 location, enter the path to the profile bucket.

If you enter a new bucket name, the folder is created automatically.

  1. Keep the default settings for the remaining optional sections: Data profile configurations, Data quality rules, Advanced job settings, Associated schedules, and Tags.

The next step is to choose or create the AWS Identity and Access Management (IAM) role that grants DataBrew access to read from the input S3 bucket and write to the job output bucket.

  1. For Role name, choose an existing role or choose Create a new IAM role and enter an IAM role suffix.
  2. Choose Create and run job.

For more information about configuring and running DataBrew jobs, see Creating, running, and scheduling AWS Glue DataBrew jobs.

Inspect data quality rules validation results

To inspect the data quality rules, we need to let the profile job complete.

  1. On the Jobs page of the DataBrew console, choose the Profile jobs tab.
  2. Wait until the profile job status changes to Succeeded.
  3. When the job is complete, choose View data profile.

You’re redirected to the Data profile overview tab on the Datasets page.

  1. Choose the Data quality rules tab.

Here you can review the status to your data quality rules. As shown in the following screenshot, eight of the nine data quality rules defined were successful, and one rule failed.

Our failed data quality rule indicates that we found duplicate values for employee ID, SSN, and email.

  1. To confirm that the data has duplicate values, on the Column statistics tab, choose the Emp ID column.
  2. Scroll down to the section Top distinct values.

Similarly, you can check the E Mail and SSN columns to find that those columns also have duplicate values.

Now we have confirmed that our data has duplicate values. The next step is to clean up the dataset and rerun the quality rules validation.

Clean the dataset

To clean the dataset, we first need to create a project.

  1. On the DataBrew console, choose Projects.
  2. Choose Create project.
  3. For Project name, enter a name (for this post, human-resource-project-demo).
  4. For Select a dataset, select My datasets.
  5. Select the human-resource-dataset dataset.
  6. Keep the sampling size at its default.
  7. Under Permissions, for Role name, choose the IAM role that we created previously for our DataBrew profile job.
  8. Choose Create project.

The project takes a few minutes to open. When it’s complete, you can see your data.

Next, we delete the duplicate value from the Emp ID column.

  1. Choose the Emp ID column.
  2. Choose the more options icon (three dots) to view all the transforms available for this column.
  3. Choose Remove duplicate values.
  4. Repeat these steps for the SSN and E Mail columns.

You can now see the three applied steps in the Recipe pane.

Create a DataBrew job

The next step is to create a DataBrew job to run these transforms against the full dataset.

  1. On the project details page, choose Create job.
  2. For Job name, enter a name (for example, human-resource-after-dq-check).
  3. Under Job output settings¸ for File type, choose your final storage format to be CSV.
  4. For S3 location, enter your output S3 bucket location (for example, s3://<s3 bucket name>/output/).
  5. For Compression, choose None.
  6. Under Permissions, for Role name¸ choose the same IAM role we used previously.
  7. Choose Create and run job.
  8. Wait for job to complete; you can monitor the job on the Jobs page.

Validate the data quality check with the corrected dataset

To perform the data quality checks with the corrected dataset, complete the following steps:

  1. Follow the steps outlined earlier to create a new dataset, using the corrected data from the previous section.
  2. Choose the Amazon S3 location of the job output.
  3. Choose Create dataset.
  4. Choose DQ Rules and select the ruleset you created earlier.
  5. On the Actions menu, choose Duplicate.
  6. For Ruleset name, enter a name (for example, human-resource-dataquality-ruleset-on-corrected-dataset).
  7. Select the newly created dataset.
  8. Choose Create data quality ruleset.
  9. After the ruleset is created, select it and choose Create profile job with ruleset.
  10. Create a new profile job.
  11. Choose Create and run job.
  12. When the job is complete, repeat the steps from earlier to inspect the data quality rules validation results.

This time, under Data quality rules, all the rules are passed except Check total record count because you removed duplicate values.

On the Column statistics page, under Top distinct values for the Emp ID column, you can see the distinct values.

You can find similar results for the SSN and E Mail columns.

Clean up

To avoid incurring future charges, we recommend you delete the resources you created during this walkthrough.

Conclusion

As demonstrated in this post, you can use DataBrew to help create data quality rules, which can help you identify any discrepancies in your data. You can also use DataBrew to clean the data and validate it going forwards. You can learn more about AWS Glue DataBrew from here and learn around AWS Glue DataBrew pricing here.


About the Authors

Navnit Shukla is an AWS Specialist Solution Architect, Analytics, and is passionate about helping customers uncover insights from their data. He has been building solutions to help organizations make data-driven decisions.

Harsh Vardhan Singh Gaur is an AWS Solutions Architect, specializing in Analytics. He has over 5 years of experience working in the field of big data and data science. He is passionate about helping customers adopt best practices and discover insights from their data.

New – AWS Proton Supports Terraform and Git Repositories to Manage Templates

Post Syndicated from Marcia Villalba original https://aws.amazon.com/blogs/aws/new-aws-proton-supports-terraform-and-git-repositories-to-manage-templates/

Today we are announcing the launch of two features for AWS Proton. First, the most requested one in the AWS Proton open roadmap, to define and provision infrastructure using Terraform. Second, the capability to manage AWS Proton templates directly from Git repositories.

AWS Proton is a fully managed application delivery service for containers and serverless applications, announced during reinvent 2020. AWS Proton aims to help infrastructure teams automate and manage their infrastructure without impacting developer productivity. It allows developers to get the templates they need to deliver their applications without the need to involve the platform team.

When using AWS Proton, the infrastructure team needs to define the environment and the service templates. Learn more about the templates.

Template Sync
This new feature in AWS Proton enables the platform team to push, update, and publish templates directly from their Git repositories. Now when you create a new service or environment template, you can specify a remote Git repository containing the templates. AWS Proton will automatically sync those templates and make them available for use. When there are changes to the Git repository, AWS Proton will take care of the updates.

Create enviroment template

One important advantage of using repositories and syncing the templates is that it simplifies the process of the administrators for uploading, updating, and registering the templates. This process, when done manually, can be error-prone and inconvenient. Now you can automate the process of authoring and updating the templates. Also, you can add more validations using pull requests and track the changes to the templates.

Template sync allows collaboration between the platform team and the developers. By having all the templates in a Git repository, all the collaboration tooling available in platforms like GitHub becomes available to everybody. Now developers can see all the templates, and when they want to improve them, they can just create a pull request with the changes. In addition, tools like bug trackers and features requests can be used to manage the templates.

Configuring the Repository Link
To get started using template sync, you need to give AWS Proton permissions to access your repositories. For that, you need to create a link between AWS Proton and your repository.

To do this, first create a new source connection for your GitHub account. Then you need to create a new repository link from the AWS Proton. Go to the Repositories option in the side bar. Then in the Link new repository screen, use the GitHub connection that you just created and specify a repository name.

Create new link repository

AWS Proton supports Terraform
Until now, AWS CloudFormation was the only infrastructure as code (IaC) engine available in AWS Proton. Now you can define service and environment templates based on infrastructure defined using Terraform and through a pull-request-based mechanism, use Terraform to provision and keep your infrastructure updated.

Platforms teams author their IaC templates in HCL, the Terraform language, and then provision the infrastructure using Terraform Open Source. AWS Proton renders the ready-to-provision Terraform module and makes a pull request to your infrastructure repository, from where you can plan and apply the changes.

This operation is asynchronous, as AWS Proton is not the one managing the provision of infrastructure. Therefore it is important that in the process of provisioning the infrastructure, there is a step that notifies AWS Proton of the status of the deployment.

I want to show you a demo on how you can set up an environment using Terraform. For that, you will use GitHub actions to provision the Terraform infrastructure in your AWS account.

To get started with Terraform templates, first, configure the repository link as it was described before. Then you need to create a new role to give permissions to GitHub actions to perform some activities in your AWS account. You can find the AWS CloudFormation template for this role here.

Create an empty GitHub repository and create a folder .github/workflows/. Create a file called terraform.yml. In that file, you need to define the GitHub actions to plan and apply the infrastructure changes. Copy the template from the terraform example file.

This template configures your AWS credentials, configures Terraform, plans the whole infrastructure, and applies the changes in the infrastructure using Terraform, and then notifies AWS Proton on the status of this process.

In addition, you need to modify the file env_config.json, which is located inside that folder. In that file, you need to add the configuration for the environment you plan to create. You can append new environments to the JSON file. In the example, the environment is called tf-test. The role is the role you created previously, and the region is the region where you want to deploy this infrastructure. Look at the example file.

{
    “tf-test”: {
        “role”: “arn:aws:iam::123456789:role/TerraformGitHubActionsRole”,
        “region”: “us-west-2”
    }
}

For this example, you upload the Terraform project to Amazon S3. See an example of a Terraform project.

Now it is time to create a new environment template in AWS Proton. You can follow the instructions in the console.

When your environment template is ready, create a new environment using the template you just created. When configuring the environment, select Provision through pull request and then configure the repository with the correct parameters.

Configure new enviromentNow, in the Environment details, you can see the Deployment status to be In progress. This will stay like this until the GitHub action finishes.

Environment details

If you go to your repository, you should see a new pull request. Next to the pull request name, you will see a red cross, yellow dot, or green check. That icon depends on the status of the GitHub action. If you have a yellow dot, wait for it to turn red or green. If there is an error, you need to see what is going on inside the logs of the GitHub action.

If you see a green check on the pull request, it means that the GitHub actions has completed, and the pull request can be merged. After the pull request is merged, the infrastructure is provisioned. Go back to the Environment Details page. After a while, and once your infrastructure is provisioned, which can take some minutes depending on your template, you should see that the Deployment Status is Successful.

Github pull request

By the end of this demo, you have provisioned your infrastructure using AWS Proton to handle the environment templates and GitHub actions, and Terraform Open Source to provision the infrastructure in your AWS account.

Availability
Terraform support is available in public preview mode.

These new features are available in the regions where AWS Proton is available: US East (Ohio), US East (N. Virginia), US West (Oregon), Asia Pacific (Tokyo), and Europe (Ireland).

To learn more about these features, visit the AWS Proton service page.

Marcia

Using EC2 Auto Scaling predictive scaling policies with Blue/Green deployments

Post Syndicated from Pranaya Anshu original https://aws.amazon.com/blogs/compute/retaining-metrics-across-blue-green-deployment-for-predictive-scaling/

This post is written by Ankur Sethi, Product Manager for EC2.

Amazon EC2 Auto Scaling allows customers to realize the elasticity benefits of AWS by automatically launching and shutting down instances to match application demand. Earlier this year we introduced predictive scaling, a new EC2 Auto Scaling policy that predicts demand and proactively scales capacity, resulting in better availability of your applications (if you are new to predictive scaling, I suggest you read this blog post before proceeding). In this blog, I will walk you through how to use a new feature, predictive scaling custom metrics, to configure predictive scaling for an application that follows a Blue/Green deployment strategy.

Blue/Green Deployment using Auto Scaling groups

The fundamental idea behind Blue/Green deployment is to shift traffic between two environments that are running different versions of your application. The Blue environment represents your current application version serving production traffic. In parallel, the Green environment is staged running the newer version. After the Green environment is ready and tested, production traffic is redirected from Blue to Green either all at once or in increments, similar to canary deployments. At the end of the load transfer, you can either terminate the Blue Auto Scaling group or reuse it to stage the next version update. Irrespective of the approach, when a new Auto Scaling group is created as part of Blue/Green deployment, EC2 Auto Scaling, and in turn predictive scaling, does not know that this new Auto Scaling group is running the same application that the Blue one was. Predictive scaling needs a minimum of 24 hours of historical metric data and up to 14 days for the most accurate results, neither of which the new Auto Scaling group has when the Blue/Green deployment is initiated. This means that if you frequently conduct Blue/Green deployments, predictive scaling regularly pauses for at least 24 hours, and you may experience less optimal forecasts after each deployment.

In Blue/Green deployment you have two Auto Scaling groups - Blue Auto Scaling Group running the current version and Green Auto Scaling group staged with the updated version. Once you are ready to make the updated version live, you switch production traffic from Blue to Green through your load balancer or your DNS settings.

Figure 1. In Blue/Green deployment you have two Auto Scaling groups running different versions of an application. You switch production traffic from Blue to Green to make the updated version public.

How to retain your application load history using predictive scaling custom metrics

To make predictive scaling work for Blue/Green deployment scenarios, we need to aggregate load metrics from both Blue and Green environments before using it to forecast capacity as depicted in the following illustration. The key benefit of using the aggregated metric is that, throughout the Blue/Green deployment, predictive scaling can continue to forecast load correctly without a pause, and it can retain the entire 14 days of data to provide the best predictions. For example, if your application observes different patterns during a weekday vs. a weekend, predictive scaling will be able to retain knowledge of that pattern after the deployment.

The aggregated metrics of Blue and Green Auto Scaling groups give you the total load traffic of an application. Prior to Blue/Green deployment, Blue Auto Scaling group served the entire traffic while after the deployment, Green Auto Scaling group handles it. There can be a period of overlap where traffic is split between the two Auto Scaling groups. By adding the traffic on two Auto Scaling groups, you get a single time series which allows predictive scaling to generate forecasts based on complete set of 14 days of history.

Figure 2. The aggregated metrics of Blue and Green Auto Scaling groups give you the total load traffic of an application. Predictive scaling gives most accurate forecasts when based on last 14 days of history.

Example

Let’s explore this solution with an example. I created a sample application and load simulation infrastructure that you can use to follow along by deploying this example AWS CloudFormation Stack in your account. This example deploys two Auto Scaling groups: ASG-myapp-v1 (Blue) and ASG-myapp-v2 (Green) to run a sample application. Only ASG-myapp-v1 is attached to a load balancer and has recurring requests generated for its application. I have applied a target tracking policy and predictive scaling policy to maintain CPU utilization at 25%. You should keep this Auto Scaling group running for at least 24 hours before proceeding with the rest of the example to have enough load generated for predictive scaling to start forecasting.

ASG-myapp-v2 does not have any requests generated of its own. In the following sections, to highlight how metric aggregation works, I will apply a predictive scaling policy to it using Custom Metric configurations aggregating CPU Utilization metrics of both Auto Scaling groups. I’ll then verify if the forecasts are generated for ASG-myapp-v2 based on the aggregated metrics.

As part of your Blue/Green deployment approach, if you alternate between exactly two Auto Scaling groups, then you can use simple math expressions such as SUM (m1, m2) where m1 and m2 are metrics for each Auto Scaling group. However, if you create new Auto Scaling groups for each deployment, then you need to refer to the metrics of all the Auto Scaling groups that were used to run the application in the last 14 days. You can simplify this task by following a naming convention for your Auto Scaling groups and leveraging the Search expression to select the required metrics. The naming convention is ASG-myapp-vx where we name the new Auto Scaling group according to the version number (ASG-myapp-v1ASG-myapp-v2 and so on). Using SEARCH(‘ {Namespace, DimensionName1, DimensionName2} SearchTerm’, ‘Statistic’, Period) expression I can identify the metrics of all the Auto Scaling groups that follow the name according to the SearchTerm. I can then aggregate the metrics by appending another expression. The final expression should look like SUM(SEARCH(…).

Step 1: Apply predictive scaling policy to Green Auto Scaling group ASG-myapp-v2 with custom metrics

To generate forecasts, the predictive scaling algorithm needs three metrics as input: a load metric that represents total demand on an Auto Scaling group, the number of instances that represents the capacity of the Auto Scaling groups, and a scaling metric that represents the average utilization of the instances in the Auto Scaling groups.

Here is how it would work with CPU Utilization metrics. First, create a scaling configuration file where you define the metrics, target value, and the predictive scaling mode for your policy.

cat predictive-scaling-policy-cpu.json
{
        "MetricSpecifications": [
      {
            "TargetValue": 25,
           "CustomizedLoadMetricSpecification": {
        },
           "CustomizedCapacityMetricSpecification": {  
        },
           "CustomizedScalingMetricSpecification": {
        },
            }
    ],
        "Mode": “ForecastOnly”
}
EoF

I’ll elaborate on each of these metric specifications separately in the following sections. You can download the complete JSON file in GitHub.

Customized Load Metric Specification: You can aggregate the demand across your Auto Scaling groups by using the SUM expression. The demand forecasts are generated every hour, so this metric has to be aggregated with a time period of 3600 seconds.

"CustomizedLoadMetricSpecification": {
    "MetricDataQueries": [
        {
            "Id": "load_sum",
            "Expression": "SUM(SEARCH('{AWS/EC2,AutoScalingGroupName} MetricName=\"CPUUtilization\" ASG-myapp', 'Sum', 3600))"
        }
    ]
}

Customized Capacity Metric Specification: Your customized capacity metric represents the total number of instances across your Auto Scaling groups. Similar to the load metric, the aggregation across Auto Scaling groups is done by using the SUM expression. Note that this metric has to follow a 300 seconds interval period.

"CustomizedCapacityMetricSpecification": {
    "MetricDataQueries": [
        {
            "Id": "capacity_sum",
            "Expression": "SUM(SEARCH('{AWS/AutoScaling,AutoScalingGroupName} MetricName=\"GroupInServiceIntances\" ASG-myapp', 'Average', 300))"
        }
    ]
}

Customized Scaling Metric Specification: Your customized scaling metric represents the average utilization of the instances across your Auto Scaling groups. We cannot simply SUM the scaling metric of each Auto Scaling group as the utilization is an average metric that depends on the capacity and demand of the Auto Scaling group. Instead, we need to find the weighted average unit load (Load Metric/Capacity). To do so, we will use an expression: Sum(load)/Sum(capacity). Note that this metric also has to follow a 300 seconds interval period.

"CustomizedScalingMetricSpecification": {
    "MetricDataQueries": [
        {
            "Id": "capacity_sum",
            "Expression": "SUM(SEARCH('{AWS/AutoScaling,AutoScalingGroupName} MetricName=\"GroupInServiceIntances\" ASG-myapp', 'Average', 300))"
            “ReturnData”: “False”
        },
        {
            "Id": "load_sum",
            "Expression": "SUM(SEARCH('{AWS/EC2,AutoScalingGroupName} MetricName=\"CPUUtilization\" ASG-myapp', 'Sum', 300))"
            “ReturnData”: “False”
        },
        {
            "Id": "weighted_average",
            "Expression": "load_sum / capacity_sum”
       }
    ]
}

Once you have created the configuration file, you can run the following CLI command to add the predictive scaling policy to your Green Auto Scaling group.

aws autoscaling put-scaling-policy \
    --auto-scaling-group-name "ASG-myapp-v2" \
    --policy-name "CPUUtilizationpolicy" \
    --policy-type "PredictiveScaling" \
    --predictive-scaling-configuration file://predictive-scaling-policy-cpu.json

Instantaneously, the forecasts will be generated for the Green Auto Scaling group (My-ASG-v2) as if this new Auto Scaling group has been running the application. You can validate this using the predictive scaling forecasts API. You can also use the console to review forecasts by navigating to the Amazon EC2 Auto Scaling console, selecting the Auto Scaling group that you configured with predictive scaling, and viewing the predictive scaling policy located under the Automatic Scaling section of the Auto Scaling group details view.

EC2 Auto Scaling console shows you the capacity and load forecasts generated by your predictive scaling policies against the actual metric values. In this case, we are looking at the forecasts generated for Green Auto Scaling group. Since we aggregated metrics across Auto Scaling groups, the forecasts are generated as if this Auto Scaling group has been running the application from the beginning. You see the actual load and capacity values also aggregated for easier comparison of the forecasted and actual values.

Figure 3. EC2 Auto Scaling console showing capacity and load forecasts for Green Auto Scaling group. The forecasts are generated as if this Auto Scaling group has been running the application from the beginning.

Step 2: Terminate ASG-myapp-v1 and see predictive scaling forecasts continuing

Now complete the Blue/Green deployment pattern by terminating the Blue Auto Scaling group, and then go to the console to check if the forecasts are retained for the Green Auto Scaling group.

aws autoscaling delete-auto-scaling-group \
 --auto-scaling-group-name ASG-myapp-v1

You can quickly check the forecasts on the console for ASG-myapp-v2 to find that terminating the Blue Auto Scaling group has no impact on the forecasts of the Green one. The forecasts are all based on aggregated metrics. As you continue to do Blue/Green deployments in future, the history of all the prior Auto Scaling groups will persist, ensuring that our predictions are always based on the complete set of metric history. Before we conclude, remember to delete the resources you created. As part of this example, to avoid unnecessary costs, delete the CloudFormation stack.

Conclusion

Custom metrics give you the flexibility to base predictive scaling on metrics that most accurately represent the load on your Auto Scaling groups. This blog focused on the use case where we aggregated metrics from different Auto Scaling groups across Blue/Green deployments to get accurate forecasts from predictive scaling. You don’t have to wait for 24 hours to get the first set of forecasts or manually set capacity when the new Auto Scaling group is created to deploy an updated version of the application. You can read about other use cases of custom metrics and metric math in the public documentation such as scaling based on queue metrics.

Field Notes: Monitor IBM Db2 for Errors Using Amazon CloudWatch and Send Notifications Using Amazon SNS

Post Syndicated from Sai Parthasaradhi original https://aws.amazon.com/blogs/architecture/field-notes-monitor-ibm-db2-for-errors-using-amazon-cloudwatch-and-send-notifications-using-amazon-sns/

Monitoring a is crucial function to be able to detect any unanticipated or unknown access to your data in an IBM Db2 database running on AWS.  You also need to monitor any specific errors which might have an impact on the system stability and get notified immediately in case such an event occurs. Depending on the severity of the events, either manual or automatic intervention is needed to avoid issues.

While it is possible to access the database logs directly from the Amazon EC2 instances on which the database is running, you may need additional privilege to access the instance, in a production environment. Also, you need to write custom scripts to extract the required information from the logs and share with the relevant team members.

In this post, we use Amazon CloudWatch log Agent to export the logs to Amazon CloudWatch Logs and monitor the errors and activities in the Db2 database. We provide email notifications for the configured metric alerts which may need attention using Amazon Simple Notification Service (Amazon SNS).

Overview of solution

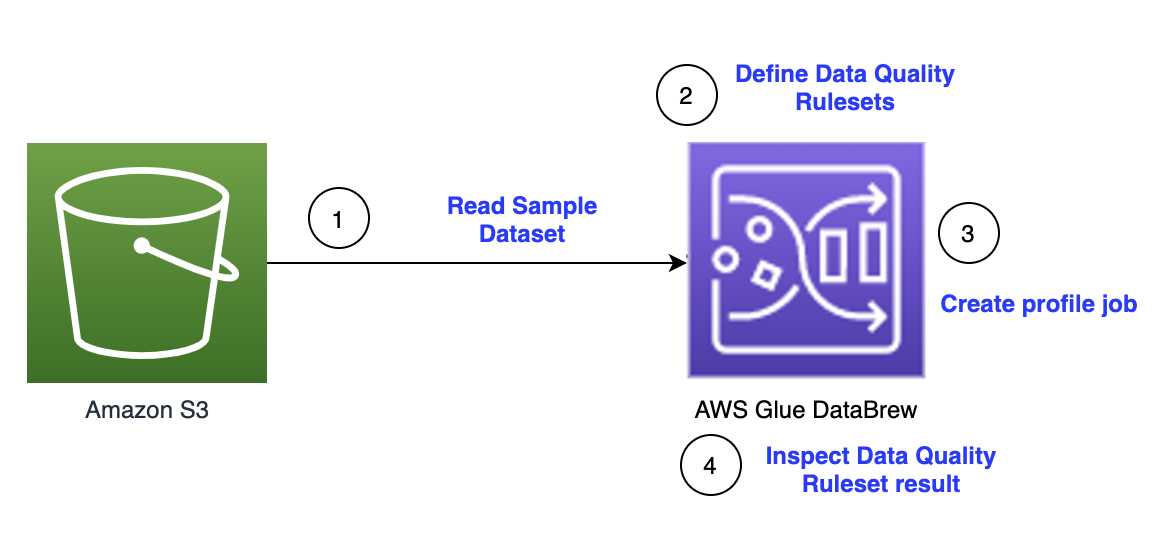
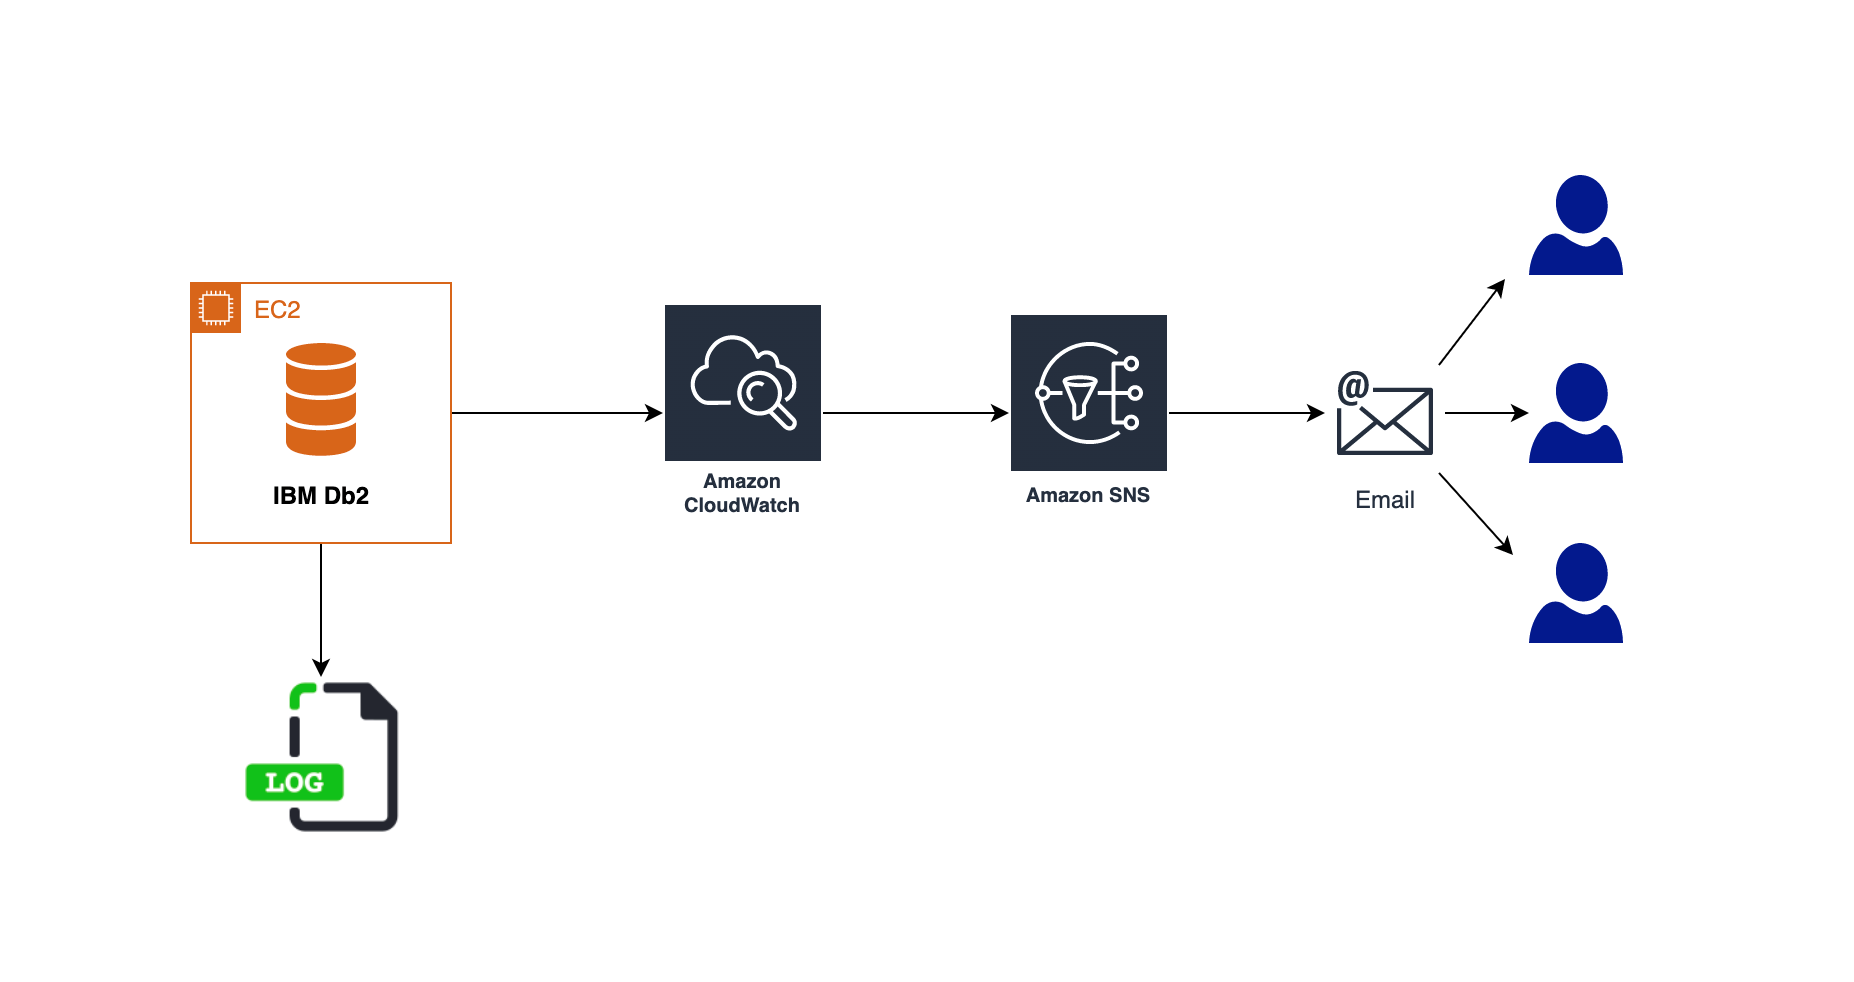
This solution covers the steps to configure a Db2 Audit policy on the database to capture the SQL statements which are being run on a particular table. This is followed by installing and configuring Amazon CloudWatch log Agent to export the logs to Amazon CloudWatch Logs. We set up metric filters to identify any suspicious activity on the table like unauthorized access from a user or permissions being granted on the table to any unauthorized user. We then use Amazon Simple Notification Service (Amazon SNS) to notify of events needing attention.

Similarly, we set up the notifications in case of any critical errors in the Db2 database by exporting the Db2 Diagnostics Logs to Amazon CloudWatch Logs.

Solution Architecture diagram

Figure 1 – Solution Architecture

Prerequisites

You should have the following prerequisites:

  • Ensure you have access to the AWS console and CloudWatch
  • Db2 database running on Amazon EC2 Linux instance. Refer to the Db2 Installation methods from the IBM documentation for more details.
  • A valid email address for notifications
  • A SQL client or Db2 Command Line Processor (CLP) to access the database
  • Amazon CloudWatch Logs agent installed on the EC2 instances

Refer to the Installing CloudWatch Agent documentation and install the agent. The setup shown in this post is based on a RedHat Linux operating system.  You can run the following commands as a root user to install the agent on the EC2 instance, if your OS is also based on the RedHat Linux operating system.

cd /tmp
wget https://s3.amazonaws.com/amazoncloudwatch-agent/redhat/amd64/latest/amazon-cloudwatch-agent.rpm
sudo rpm -U ./amazon-cloudwatch-agent.rpm
  • Create an IAM role with policy CloudWatchAgentServerPolicy.

This IAM role/policy is required to run CloudWatch agent on EC2 instance. Refer to the documentation CloudWatch Agent IAM Role for more details. Once the role is created, attach it to the EC2 instance profile.

Setting up a Database audit

In this section, we set up and activate the db2 audit at the database level. In order to run the db2audit command, the user running it needs SYSADM authority on the database.

First, let’s configure the path to store an active audit log where the main audit file will be created, and archive path where it will be archived using the following commands.

db2audit configure datapath /home/db2inst1/dbaudit/active/
db2audit configure archivepath /home/db2inst1/dbaudit/archive/

Now, let’s set up the static configuration audit_buf_sz size to write the audit records asynchronously in 64 4K pages. This will ensure that the statement generating the corresponding audit record does not wait until the record is written to disk.

db2 update dbm cfg using audit_buf_sz 64

Now, create an audit policy on the WORKER table, which contains sensitive employee data to log all the SQL statements being executed against the table and attach the policy to the table as follows.

db2 connect to testdb
db2 "create audit policy worktabpol categories execute status both error type audit"
db2 "audit table sample.worker using policy worktabpol"

Finally, create an audit policy to audit and log the SQL queries run by the admin user authorities. Attach this policy to dbadm, sysadm and secadm authorities as follows.

db2 "create audit policy adminpol categories execute status both,sysadmin status both error type audit"
db2 "audit dbadm,sysadm,secadm using policy adminpol"
db2 terminate

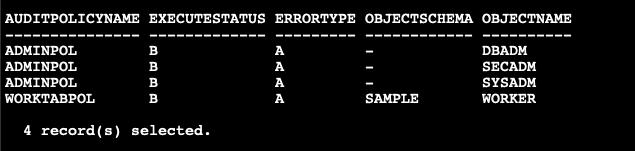
The following SQL statement can be issued to verify if the policies are created and attached to the WORKER table and the admin authorities properly.

db2 "select trim(substr(p.AUDITPOLICYNAME,1,10)) AUDITPOLICYNAME, EXECUTESTATUS, ERRORTYPE,substr(OBJECTSCHEMA,1,10) as OBJECTSCHEMA, substr(OBJECTNAME,1,10) as OBJECTNAME from SYSCAT.AUDITPOLICIES p,SYSCAT.AUDITUSE u where p.AUDITPOLICYNAME=u.AUDITPOLICYNAME and p.AUDITPOLICYNAME in ('WORKTABPOL','ADMINPOL')"
Figure 2. Audit policy setup in the database

Figure 2. Audit policy setup in the database

Once the audit setup is complete, you need to extract the details into a readable file. This contains all the execution logs whenever the WORKER table is accessed by any user from any SQL statement. You can run the following bash script periodically using CRON scheduler. This identifies events where the WORKER table is being accessed as part of any SQL statement by any user to populate worker_audit.log file which will be in a readable format.

#!/bin/bash
. /home/db2inst1/sqllib/db2profile
cd /home/db2inst1/dbaudit/archive
db2audit flush
db2audit archive database testdb
if ls db2audit.db.TESTDB.log* 1> /dev/null 2>&1; then
latest_audit=`ls db2audit.db.TESTDB.log* | tail -1`
db2audit extract file worker_audit.log from files $latest_audit
rm -f db2audit.db.TESTDB.log*
fi

Publish database audit and diagnostics Logs to CloudWatch Logs

The CloudWatch Log agent uses a JSON configuration file located at /opt/aws/amazon-cloudwatch-agent/bin/config.json. You can edit the JSON configuration as a root user and provide the following configuration details manually.  For more information, refer to the CloudWatch Agent configuration file documentation. Based on the setup in your environment, modify the file_path location in the following configuration along with any custom values for the log group and log stream names which you specify.

{
     "agent": {
         "run_as_user": "root"
     },
     "logs": {
         "logs_collected": {
             "files": {
                 "collect_list": [
                     {
                         "file_path": "/home/db2inst1/dbaudit/archive/worker_audit.log",
                         "log_group_name": "db2-db-worker-audit-log",
                         "log_stream_name": "Db2 - {instance_id}"
                     },
                   {
                       "file_path": "/home/db2inst1/sqllib/db2dump/DIAG0000/db2diag.log",
                       "log_group_name": "db2-diagnostics-logs",
                       "log_stream_name": "Db2 - {instance_id}"
                   }
                 ]
             }
         }
     }
 }

This configuration specifies the file path which needs to be published to CloudWatch Logs along with the CloudWatch Logs group and stream name details as provided in the file. We publish the audit log which was created earlier as well as the Db2 Diagnostics log which gets generated on the Db2 server, generally used to troubleshoot database issues. Based on the config file setup, we publish the worker audit log file with log group name db2-db-worker-audit-log and the Db2 diagnostics log with db2-diagnostics-logs log group name respectively.

You can now run the following command to start the CloudWatch Log agent which was installed on the EC2 instance as part of the Prerequisites.

sudo /opt/aws/amazon-cloudwatch-agent/bin/amazon-cloudwatch-agent-ctl -a fetch-config -m ec2 -c file:/opt/aws/amazon-cloudwatch-agent/bin/config.json -s

Create SNS Topic and subscription

To create an SNS topic, complete the following steps:

  • On the Amazon SNS console, choose Topics in the navigation pane.
  • Choose Create topic.
  • For Type, select Standard.
  • Provide the Topic name and other necessary details as per your requirements.
  • Choose Create topic.

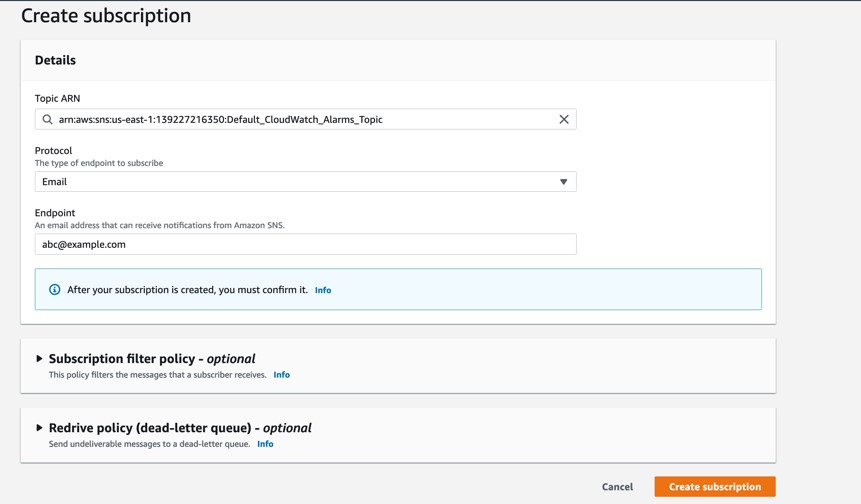
After you create your SNS topic, you can create a subscription. Following are the steps to create the subscription.

  • On the Amazon SNS console, choose Subscriptions in the navigation pane.
  • Choose Create subscription.
  • For Topic ARN, choose the SNS topic you created earlier.
  • For Protocol, choose Email. Other options are available, but for this post we create an email notification.
  • For Endpoint, enter the email address to receive event notifications.
  • Choose Create subscription. Refer to the following screenshot for an example:
Figure 3. Create SNS subscription

Figure 3. Create SNS subscription

Create metric filters and CloudWatch alarm

You can use a metric filter in CloudWatch to create a new metric in a custom namespace based on a filter pattern.  Create a metric filter for db2-db-worker-audit-log log using the following steps.

To create a metric filter for the db2-db-worker-audit-log log stream:

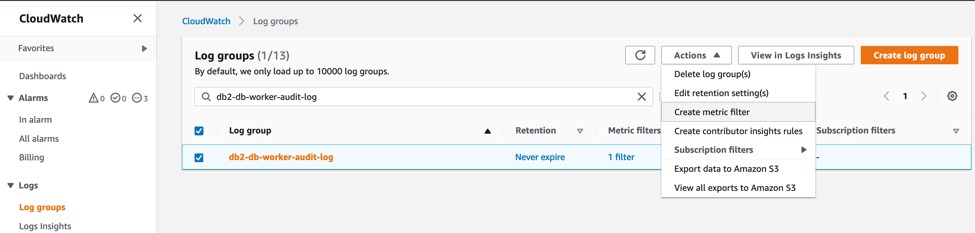
  • On the CloudWatch console, under CloudWatch Logs, choose Log groups.
  • Select the Log group db2-db-worker-audit-log.
  • Choose Create metric filter from the Actions drop down as shown in the following screenshot.
Figure 4. Create Metric filter

Figure 4. Create Metric filter

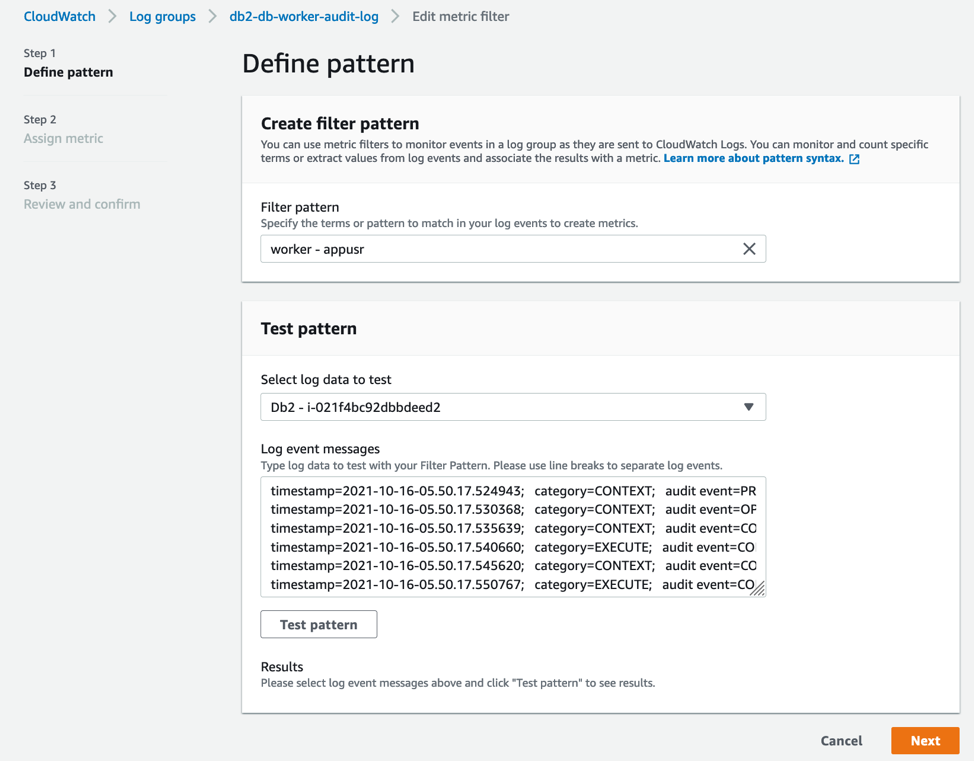
  • For Filter pattern, enter “worker – appusr” to filter any user access on the WORKER table in the database except the authorized user appusr.

This means that only appusr user is allowed to query WORKER table to access the data. If there is an attempt to grant permissions on the table to any other user or access is being attempted by any other user, these actions are monitored. Choose Next to navigate to Assign metric step as shown in the following screenshot.

Figure 5. Define Metric filter

Figure 5. Define Metric filter

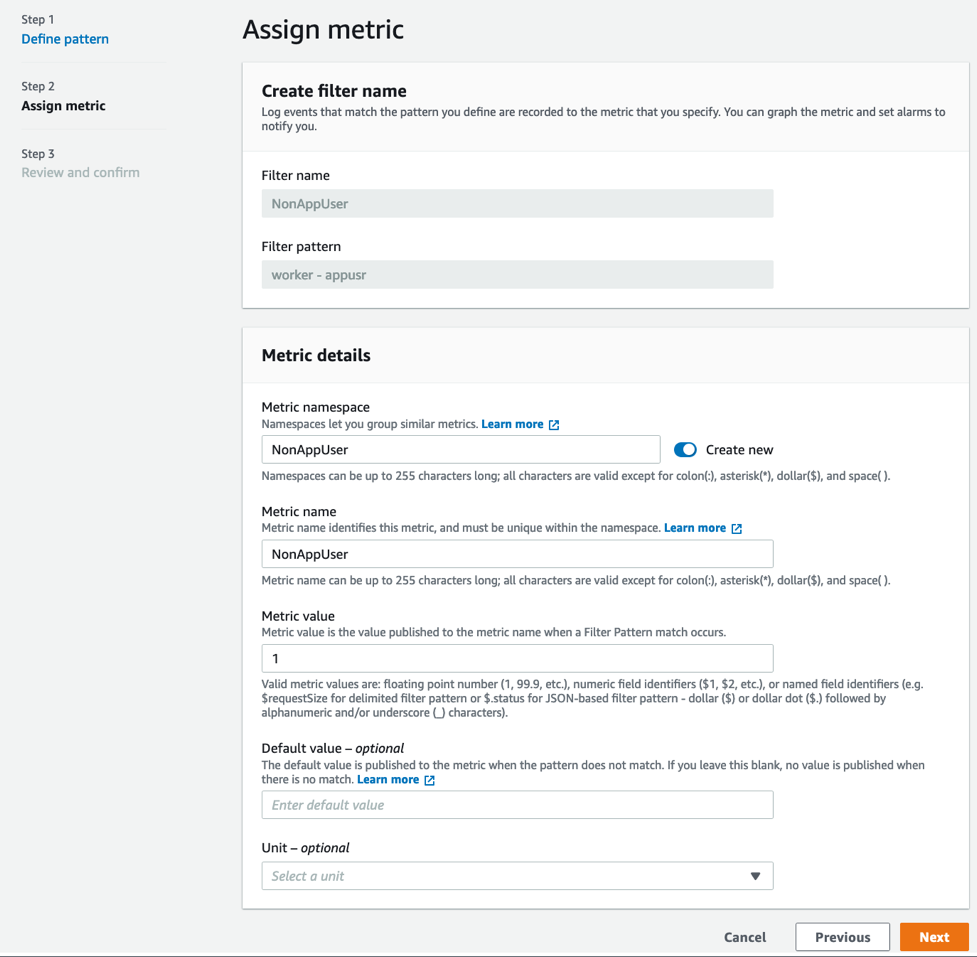
  • Enter Filter name, Metric namespace, Metric name and Metric value as provided and choose Next as shown in the following screenshot.
Figure 6. Assign Metric

Figure 6. Assign Metric

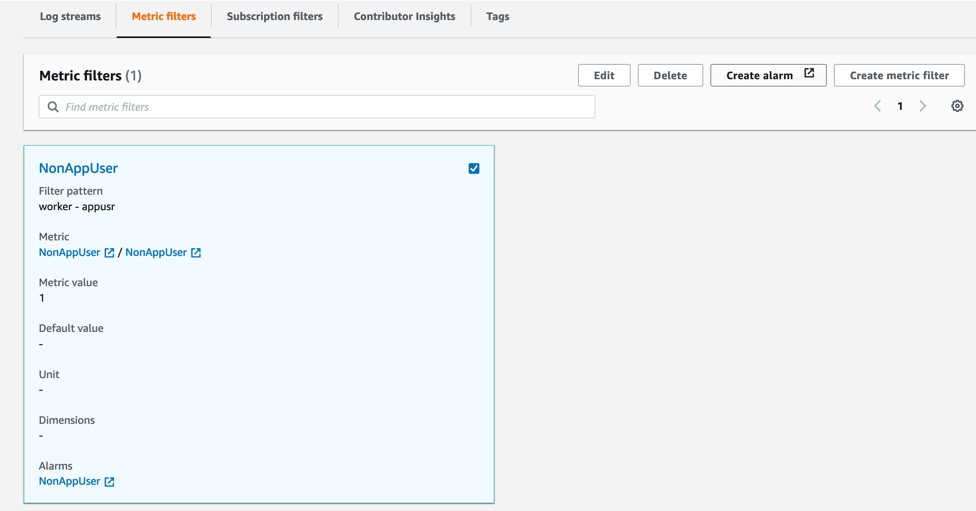
  • Choose Create Metric Filter from the next page.
  • Now, select the new Metric filter you just created from the Metric filters tab and choose Create alarm as shown in the following screenshot.
Figure 7. Create alarm

Figure 7. Create alarm

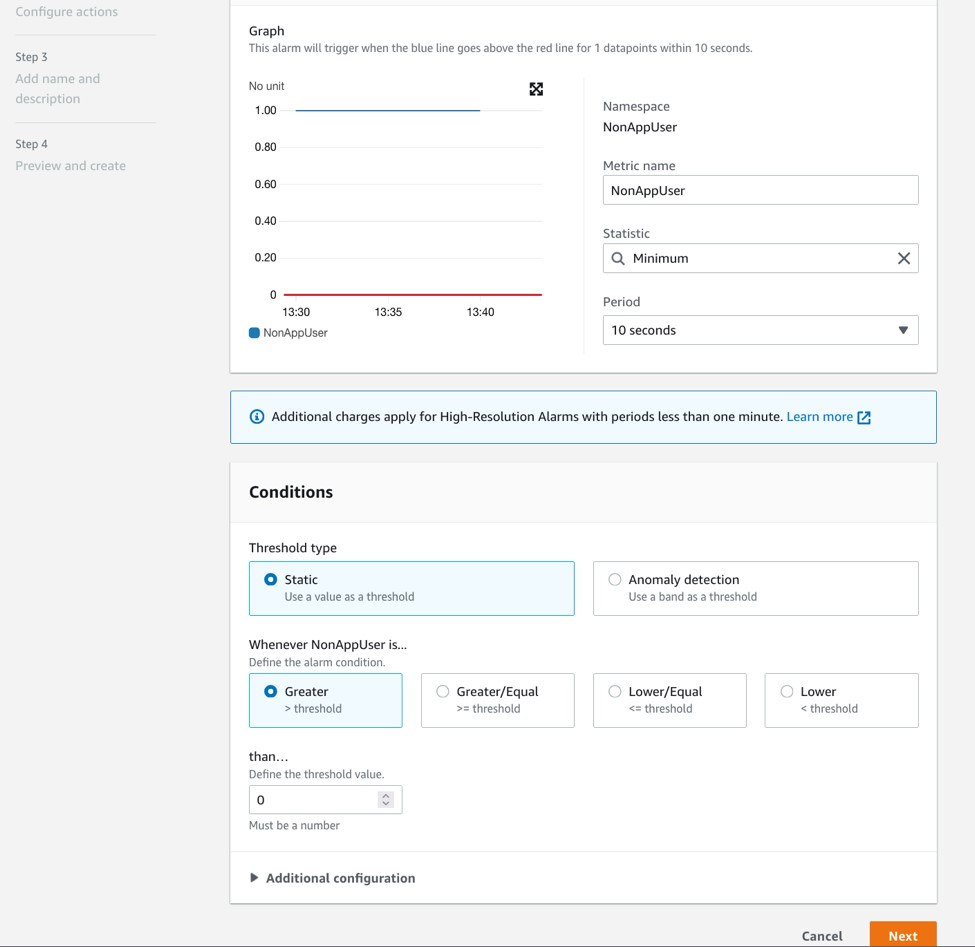
  • Choose Minimum under Statistic, Period as per your choice, say 10 seconds and Threshold value as 0 as shown in the following screenshot.
Figure 8. Configure actions

Figure 8. Configure actions

  • Choose Next and under Notification screen. select In Alarm under Alarm state trigger option.
  • Under Send a notification to search box, select the SNS Topic you have created earlier to send notifications and choose Next.
  • Enter the Filter name and choose Next and then finally choose Create alarm.

To create metric filter for db2-diagnostics-logs log stream:

Follow the same steps as earlier to create the Metric filter and alarm for the CloudWatch Log group db2-diagnostics-logs. While creating the Metric filter, enter the Filter pattern “?Error?Severe” to monitor Log level that are ‘Error’ or ‘Severe’ in nature from the diagnostics file and get notified during such events.

Testing the solution

Let’s test the solution by running a few commands and validate if notifications are being sent appropriately.

To test audit notifications, run the following grant statement against the WORKER table as system admin user or database admin user or the security admin user, depending on the user authorization setup in your environment. For this post, we use db2inst1 (system admin) to run the commands. Since the WORKER table has sensitive data, the DBA does not issue grants against the table to any other user apart from the authorized appusr user.

Alternatively, you can also issue a SELECT SQL statement against the WORKER table from any user other than appusr for testing.

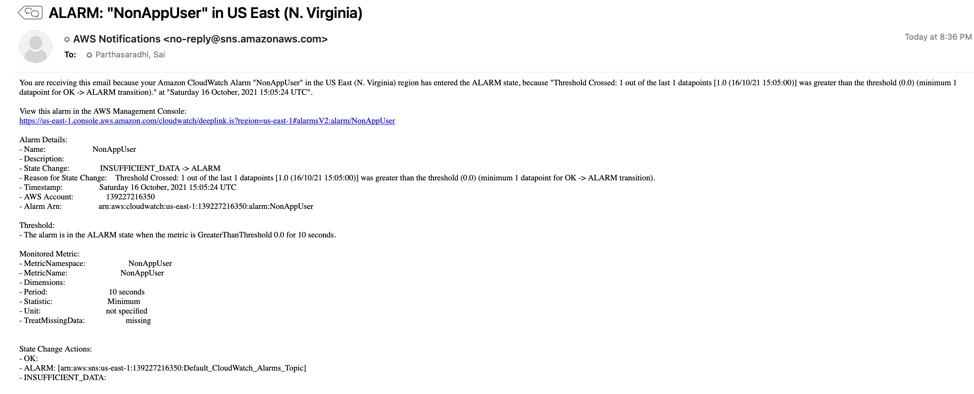
db2 "grant select on table sample.worker to user abcuser, role trole"
Figure 9. Email notification for audit monitoring

Figure 9. Email notification for audit monitoring

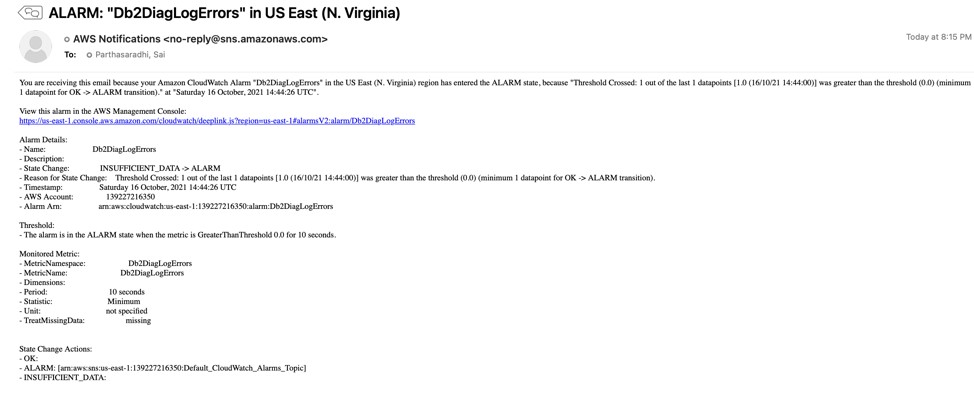
To test error notifications, we can simulate db2 database manager failure by issuing db2_kill from the instance owner login.

Figure 10. Issue db2_kill on the database server

Figure 10. Issue db2_kill on the database server

Figure 11. Email notification for error monitoring

Figure 11. Email notification for error monitoring

Clean up

Shut down the Amazon EC2 instance which was created as part of the setup outlined in this blog post to avoid any incurring future charges.

Conclusion

In this post, we showed you how to set up Db2 database auditing on AWS and set up metric alerts and alarms to get notified in case of any unknown access or unauthorized actions. We used the audit logs and monitor errors from Db2 diagnostics logs by publishing to CloudWatch Logs.

If you have a good understanding on specific error patterns in your system, you can use the solution to filter out specific errors and get notified to take the necessary action. Let us know if you have any comments or questions. We value your feedback!

Field Notes provides hands-on technical guidance from AWS Solutions Architects, consultants, and technical account managers, based on their experiences in the field solving real-world business problems for customers.

[Security Nation] Chris John Riley on Minimum Viable Secure Product (MVSP)

Post Syndicated from Rapid7 original https://blog.rapid7.com/2021/11/24/security-nation-chris-john-riley-on-minimum-viable-secure-product-mvsp/

[Security Nation] Chris John Riley on Minimum Viable Secure Product (MVSP)

In the final installment of Season 4 of Security Nation, Jen and Tod sit down with Chris John Riley, senior security engineer at Google and co-host of the First Impressions podcast (the one about cybersecurity, not Jane Austen). They chat about Minimum Viable Secure Product (MVSP), a set of controls Chris recently helped develop at Google that aim to provide a better baseline for security when evaluating vendor risk. They discuss the state of supply chain security for technology vendors and the challenges of establishing what really qualifies as “minimum” in terms of security protocols.

Stick around for our Rapid Rundown, where Tod and Jen talk about a recently disclosed DNS rebinding vulnerability in Sky routers that exposed them to takeover attacks over the course of a whopping 17 months.

Check back in with us for Season 5 of Security Nation in January. In the meantime, have a safe holiday and a happy New Year!​

Chris John Riley

[Security Nation] Chris John Riley on Minimum Viable Secure Product (MVSP)

Chris John Riley is a Senior Security Engineer at Google, where he is tech lead for the vendor reviews focus area.

In his spare time, Chris collects books (that he never finds time to read) and spends his weekend taking long romantic walks from the sofa to the kitchen (mostly for snacks).

Show notes

Interview links

Rapid Rundown links

Like the show? Want to keep Jen and Tod in the podcasting business? Feel free to rate and review with your favorite podcast purveyor, like Apple Podcasts.

Want More Inspiring Stories From the Security Community?

Subscribe to Security Nation Today

AWS Security Profiles: Megan O’Neil, Sr. Security Solutions Architect

Post Syndicated from Maddie Bacon original https://aws.amazon.com/blogs/security/aws-security-profiles-megan-oneil-sr-security-solutions-architect/

AWS Security Profiles: Megan O’Neil, Sr. Security Solutions Architect
In the week leading up to AWS re:Invent 2021, we’ll share conversations we’ve had with people at AWS who will be presenting, and get a sneak peek at their work.


How long have you been at Amazon Web Services (AWS), and what do you do in your current role?

I’ve been at AWS nearly 4 years, and in IT security over 15 years. I’m a solutions architect with a specialty in security. I work with commercial customers in North America, helping them solve security problems and build out secure foundations for their AWS workloads.

How did you get started in security?

I took part in a Boeing internship for three summers starting my junior year of high school. This internship gave me the opportunity to work with mechanical engineers at Boeing. The specific team I worked with were engineers responsible for building digital tools and robots for the 767-400 line at the Everett plant in Washington state. The purpose of these custom tools and robots was to help build the planes more efficiently and accurately. I had a lot of fun and learned a lot from my time working with them. I asked the group for career advice during lunch one day, and they all pointed me towards computer science (CS) instead of mechanical engineering. Because of their strong support for CS, I took the first course, Intro to Computer Science, and was excited that something that I previously thought was intimidating was actually approachable and a subject I really enjoyed.

During my sophomore year there was a new elective class offered called Digital Security, which piqued my interest and influenced my senior project. I built (coded) an intrusion detection program that identified nefarious network traffic. I also worked on campus during college in the sound services department and participated in the Dance Ensemble Program, where I met the IT manager for a local hospital in Washington state, Good Samaritan Hospital in Puyallup. He was helping mix music at the studio I worked in. After showing him my senior project, he told me about a job opening for a network security specialist at the hospital. No one else had applied for the role. I then interviewed with the team, which was made up of only three engineers including the manager. They were responsible for the all-backend systems including the hospital information system, patient telemetry and clinic systems, the hospital network, etc. The group of people I worked with at the hospital is still very special to me, we are all still friends.

How do you explain your job to non-tech friends?

I’m in tech, and I help companies protect their websites and their customers’ data.

What are you currently working on that you’re excited about?

I’m very excited about re:Invent. It’s the 10th anniversary, we’re back in person, and I’ve got quite a few sessions I’m delivering.

Speaking of AWS re:Invent 2021 – can you give readers a sneak peek at what you’re covering?

The first is a session I’m delivering is called Use AWS to improve your security posture against ransomware (SEC308) with Merritt Baer, Principal in the Office of the CISO. We’re discussing what AWS services and features you can use to help you protect your systems from ransomware.

The second is a chalk talk, Automating and evidencing key compliance security controls (STP211-R1 and STP211-R2), I’m delivering with Kristin Haught, Principal Security TPM, and we’re discussing strategies for automating, monitoring, and evidencing common controls required for multiple compliance standards.

The third session is a builder session called Grant least privilege temporary access securely at scale (WPS304). We’ll use AWS Secrets Manager, AWS Identity and Access Management (IAM), and the isolated compute functionality provided by AWS Nitro Enclaves to allow system administrators to request and retrieve narrowly scoped and limited-time access.

The fourth session is another builder session called Detecting security threats with Amazon GuardDuty (SEC213-R1 and SEC213-R2). It includes several simulated scenarios, representing just a small sample of the threats that GuardDuty can detect. We will review how to view and analyze GuardDuty findings, how to send alerts based on the findings, and, finally, how to remediate findings.

From your perspective, what’s the most important thing to know about ransomware?

Whenever we see a security event continue to make news, it’s a call to action and an opportunity for customers to analyze their security programs including operations and controls. There’s no silver bullet when it comes to protection from ransomware, but it’s time to level up your security operations and controls. This means minimize human access, translate security policies into code, build mechanism and measure them, streamline the use of environment and infrastructure, and use advanced data/database service features.

For example, we still see customers with large amounts of long-lived credentials; it’s time to take inventory and minimize or eliminate them. While there is a small subset of use cases where they may be required, such as on-premises to AWS access, I recommend the following:

  1. Inventory your long-lived credentials.
  2. Ensure the access is least privilege, absolutely no wildcard actions and/or resources.
  3. If the access is interactive, apply multi-factor authentication (MFA).
  4. Ask if you can architect a better option that doesn’t rely on static access keys.
  5. Rotate access keys on a regular, frequent basis.
  6. Enable alerts on login events.

For more information, check out Ransomware mitigation: Top 5 protections and recovery preparation actions and Ransomware Risk Management on AWS Using the NIST Cyber Security Framework (CSF).

What’s your favorite Leadership Principle at Amazon and why?

Learn and Be Curious! I am the most happy in my job and personal life when I’m learning new things. I also believe that this principle is a way of life for us technology folks. Learning new technology and finding better ways of implementing technology is our job. My favorite quote/laptop sticker is:

“I hate programming”

“I hate programming”

“I hate programming”

“IT WORKS! ”

“I love programming.”

It just makes me laugh because it’s so true. Of course we are only that frustrated when something is very new. It’s like solving a puzzle. When a project comes together, it’s absolutely worth it – the puzzle pieces now fit.

What’s the best career advice you’ve ever gotten?

Work with a mentor. This can be casual by finding projects where you can collaborate with folks who have more experience than you. Or it can be more formal by asking someone to be your mentor and setting up a regular cadence of meetings with them. I’ve done both, a simple example is by collaborating with Merritt and Kristen on upcoming re:Invent presentations, I’ve already learned a lot from both of them just through the preparation process and developing the content. Having a mentor by your side can be especially helpful when setting new goals. Sometimes we need someone to push us out of our comfort zone and believe that we can achieve bigger things than we would have thought and then can help devise a plan to help you achieve those goals. All it takes is someone else believing in us.

If you had to pick any other job, what would you want to do?

I’ve always been interested in naturopathic medicine and getting to the root cause of an issue. It’s somewhat similar to my job in that I’m solving puzzles and complex problems, but in technology, instead of the body.
 

If you have feedback about this post, submit comments in the Comments section below.

Want more AWS Security news? Follow us on Twitter.

Author

Megan O’Neil

Megan is a Senior Specialist Solutions Architect focused on threat detection and incident response. Megan and her team enable AWS customers to implement sophisticated, scalable, and secure solutions that solve their business challenges.

Author

Maddie Bacon

Maddie (she/her) is a technical writer for AWS Security with a passion for creating meaningful content. She previously worked as a security reporter and editor at TechTarget and has a BA in Mathematics. In her spare time, she enjoys reading, traveling, and all things Harry Potter.

Iterate confidently on Amazon QuickSight datasets with new Dataset Versions capability

Post Syndicated from Shailesh Chauhan original https://aws.amazon.com/blogs/big-data/iterate-confidently-on-amazon-quicksight-datasets-with-new-dataset-versions-capability/

Amazon QuickSight allows data owners and authors to create and model their data in QuickSight using datasets, which contain logical and semantic information about the data. Datasets can be created from a single or multiple data sources, and can be shared across the organization with strong controls around data access (object/row/column level security) and metadata included, and can be programmatically created or modified. QuickSight now supports dataset versioning, which allows dataset owners to see how a dataset has progressed, preview a version, or revert back to a stable working version in case something goes wrong. Dataset Versions gives you the confidence to experiment with your content, knowing that your older versions are available and you can easily revert back to it, if needed. For more details, see Dataset Versions.

In this post, we look at a use case of an author editing a dataset and how QuickSight makes it easy to iterate on your dataset definitions.

What is Dataset Versions?

Previously, changes made to a dataset weren’t tracked. Dataset authors would often make a change that would break the underlying dashboards, and they were often worried about the changes made to the dataset definitions. Dataset authors spent time figuring out how to fix the dataset, which could take significant time.

With Dataset Versions, each publish event associated with the dataset is tracked. Dataset authors can review previous versions of the dataset and how dataset has progressed. Each time someone publishes a dataset, QuickSight creates a new version, which becomes the active version. It makes the previous version the most recent version in the version list. With Dataset Versions, authors can restore back to a previous version if they encounter any issue with the current version.

To help you understand versions better, let’s take the following scenario. Imagine you have a dataset and have iterated on it by making changes over time. You have multiple dashboards based on this dataset. You just added a new table called regions to this dataset. QuickSight saves a new version, and dashboards dependent on it the dataset break due to the addition of this table. You realize that you added the wrong table—you were supposed to add the stateandcity table instead. Let’s see how the Dataset Versions feature comes to your rescue.

Access versions

To access your dataset versions, choose the Manage menu and Publishing History on the data prep page of the dataset.

A panel opens on the right for you to see all the versions. In the following screenshot, the current active version of the dataset is version 38—published on November 10, 2021. This is the version that is breaking your dependent dashboards.

See publishing history

As you make changes to the dataset and publish the changes, QuickSight creates a timeline of all the publishes. You see the publishing history with all the events tracked as a tile. You can choose the tile to preview a particular version and see the respective dataset definition at that time. You know that the dataset was working fine on October 18, 2021 (the previous version), and you choose Preview to verify the dataset definition.

Revert back

After you confirm the dataset definition, choose Revert to go back the previous stable version (published on October 18, 2021). QuickSight asks you to confirm, and you choose Publish. The dataset reverts back to the old working definition and the dependent dashboards are fixed.

Start a new version

Alternatively, as you’re previewing the previously published good version (version 37, published October 18, 2021), you can start fresh from that version. The previous version just had the retail_sales_new table, and you can add the correct table stateandcity to the dataset definition. When you choose Publish, a new version (version 39) is created, and all the dashboards have this new working version, thereby fixing them.

Conclusion

This post showed how the new Dataset Versions feature in QuickSight helps you easily iterate on your datasets, showing you how a dataset has progressed over time and allowing you to revert back to a specific version. Dataset Versions gives you the freedom to experiment with your content, knowing that your older versions are available and you can revert back to them, if required. Dataset Versions is now generally available in QuickSight Standard and Enterprise Editions in all QuickSight Regions. For further details, visit see Dataset Versions.


About the Authors

Shailesh Chauhan is a product manager for Amazon QuickSight, AWS’s cloud-native, fully managed SaaS BI service. Before QuickSight, Shailesh was global product lead at Uber for all data applications built from the ground up. Earlier, he was a founding team member at ThoughtSpot, where he created world’s first analytics search engine. Shailesh is passionate about building meaningful and impactful products from scratch. He looks forward to helping customers while working with people with a great mind and big heart.

Mayank Jain is a Software Development Manager at Amazon QuickSight. He leads the data preparation team that delivers an enterprise-ready platform to transform, define and organize data. Before QuickSight, he was Senior Software Engineer at Microsoft Bing where he developed core search experiences. Mayank is passionate about solving complex problems with simplistic user experience that can empower customer to be more productive.

Backblaze Holiday Gift Guide 2021

Post Syndicated from original https://www.backblaze.com/blog/backblaze-holiday-gift-guide-2021/

The holiday season is upon us, and here at Backblaze, we always love to see what cool, new things are out there for us to give to our friends and family. Every year, we ask our team members what gifts they’ll be giving (or treating themselves to) and share their ideas on our blog.

This year, our team’s gift ideas range from the latest in fitness trackers for the person who’s always on the go, to weighted blankets that keep you cozy, and helpful plant-rearing guides for blossoming green thumbs. Read on for some gift ideas that are sure to bring some holiday joy!

For Those Who Love Spending Time Outdoors

WHOOP

WHOOP is a fitness and health membership that offers a fitness tracker and an app that analyzes fitness, health, and sleep data as well as a way to connect with other WHOOP members. Their adjustable device can be worn with a range of garments or on their handy wristbands. And they’re stylish!

YETI Trailhead Camp Chair

Save yourself a seat wherever you are—the beach, the backyard, or the backcountry—with this lightweight camp chair.

ENO DoubleNest Printed Hammock

Don’t want to sit down after your hike? Lay down in this packable hammock instead!

Hidrate Spark 3 Smart Water Bottle

If you’re the type of person who needs to be reminded to drink water (me), this water bottle will glow when it’s time to hydrate. Luckily, it will not play obnoxious music.

And Those Who’d Rather Stay Home

Gravity Weighted Flannel Sherpa Blanket

Holiday season is also cozy season, and weighted blankets are arguably one of the best ways to enjoy it.

The New Plant Parent

If you or someone you know spent the early months of the pandemic transforming their home into a greenhouse (that also smelled of sourdough), this book provides all the houseplant tips and tricks they might need to keep their indoor garden thriving.

RENPHO Eye Massager

As many of us spend our days staring at screens that can strain our eyes over time, this eye massager is a great way to reduce tension and headaches. It even connects to your phone via Bluetooth so you can choose music to play as it works. Not to be confused with an
Oculus Quest 2.

TP-Link Kasa Smart Light Strip

Every kid will want one of these to decorate their room. You can light up your house with this multicolor light strip, which you can control from your phone.

For Your Foodie Friend

Anova Precision Cooker Pro

Treat the home chef in your life to this super precise and powerful sous vide tool that’s a fan favorite with over 100 million cooks.

Hot Ones 10 Pack Sauce Kit

Everything tastes better with hot sauce, and this kit includes the full lineup from season 16 of “Hot Ones.”

Koffie Inja

This small batch coffee roaster uses sustainable and ethically-sourced coffee beans and donates 20% of their proceeds to Muttville, a San Francisco-based senior dog rescue shelter.

Games and Game-related Accessories

Nintendo Game and Watch: The Legend of Zelda

Retro game fans will enjoy this collectible game and watch that includes three Legend of Zelda games.

Legendary Edition of Curse of Strahd

Strahd is a TTRPG favorite and this edition comes with bonus encounters, finger puppets, and lots more!

Glorious Modular Mechanical Keyboard

This is the world’s first RGB, modular mechanical keyboard. It’s easily customizable and needs no setup. For when you need your clanky keys to light up!

For the Practical Person

Wemo WiFi Smart Plug

This smart plug uses your home Wi-Fi connection to let you control plugged-in devices from your phone or tablet. Neat!

Tile Combo Pack

Have a friend or family member who’s constantly losing their keys or phone (or themselves)? Help them keep track of their items with this combo pack that works with Android or Apple devices.

Fuzzy Lined Crocs

Are they the most fashionable? Maybe not. But they might be the most comfortable, especially with the warm and fuzzy liner!

Give the Gift of Backblaze

Help your friends and family back up their data with Backblaze Computer Backup. They’ll thank you for helping make sure they never lose a file again.

Happy Gift-giving From Backblaze

We hope this gift guide has helped spark some ideas for your own holiday gift-giving! Comment below to tell us what gifts you’ll be giving your friends and family this year.

The post Backblaze Holiday Gift Guide 2021 appeared first on Backblaze Blog | Cloud Storage & Cloud Backup.

AWS Free Tier Data Transfer Expansion – 100 GB From Regions and 1 TB From Amazon CloudFront Per Month

Post Syndicated from Jeff Barr original https://aws.amazon.com/blogs/aws/aws-free-tier-data-transfer-expansion-100-gb-from-regions-and-1-tb-from-amazon-cloudfront-per-month/

The AWS Free Tier has been around since 2010 and allows you to use generous amounts of over 100 different AWS services. Some services offer free trials, others are free for the first 12 months after you sign up, and still others are always free, up to a per-service maximum. Our intent is to make it easy and cost-effective for you to gain experience with a wide variety of powerful services without having to pay any usage charges.

Free Tier Data Transfer Expansion
Today, as part of our long tradition of AWS price reductions, I am happy to share that we are expanding the Free Tier with additional data transfer out, as follows:

Data Transfer from AWS Regions to the Internet is now free for up to 100 GB of data per month (up from 1 GB per region). This includes Amazon EC2, Amazon S3, Elastic Load Balancing, and so forth. The expansion does not apply to the AWS GovCloud or AWS China Regions.

Data Transfer from Amazon CloudFront is now free for up to 1 TB of data per month (up from 50 GB), and is no longer limited to the first 12 months after signup. We are also raising the number of free HTTP and HTTPS requests from 2,000,000 to 10,000,000, and removing the 12 month limit on the 2,000,000 free CloudFront Function invocations per month. The expansion does not apply to data transfer from CloudFront PoPs in China.

This change is effective December 1, 2021 and takes effect with no effort on your part. As a result of this change, millions of AWS customers worldwide will no longer see a charge for these two categories of data transfer on their monthly AWS bill. Customers who go beyond one or both of these allocations will also see a reduction in their overall data transfer charges.

Your applications can run in any of 21 AWS Regions with a total of 69 Availability Zones (with more of both on the way), and can make use of the full range of CloudFront features (including SSL support and media streaming), and over 300 CloudFront PoPs, all connected across a dedicated network backbone. The network was designed with performance as a key driver, and is expanded continuously in order to meet the ever-growing needs of our customers. It is global, fully redundant, and built from parallel 100 GbE metro fibers linked via trans-oceanic cables across the Atlantic, Pacific, and Indian Oceans, as well as the Mediterranean, Red Sea, and South China Seas.

Jeff;

След сигнал на “Биволъ” Министърка не знае за кредитите на Пеевски и акциите на ПИБ. ГДНП, ДАНС, БНБ и Прокуратурата проверяват ББР

Post Syndicated from Николай Марченко original https://bivol.bg/%D0%BC%D0%B8%D0%BD%D0%B8%D1%81%D1%82%D1%8A%D1%80%D0%BA%D0%B0-%D0%BD%D0%B5-%D0%B7%D0%BD%D0%B0%D0%B5-%D0%B7%D0%B0-%D0%BA%D1%80%D0%B5%D0%B4%D0%B8%D1%82%D0%B8%D1%82%D0%B5-%D0%BD%D0%B0-%D0%BF%D0%B5%D0%B5.html

сряда 24 ноември 2021


От май 2021 г. насам или половин година продължава проверката на Българската банка за развитие (ББР) на кредитите към дружествата, свързани с депутата от ДПС Делян Славчев Пеевски. Докладът за…

Security updates for Wednesday

Post Syndicated from original https://lwn.net/Articles/876799/rss

Security updates have been issued by Debian (openjdk-17), Fedora (libxls, roundcubemail, and vim), openSUSE (bind, java-1_8_0-openjdk, and redis), Red Hat (kernel, kernel-rt, kpatch-patch, krb5, mailman:2.1, openssh, and rpm), Scientific Linux (kernel, krb5, openssh, and rpm), SUSE (bind, java-1_8_0-openjdk, redis, and webkit2gtk3), and Ubuntu (bluez).

Apple Sues NSO Group

Post Syndicated from Bruce Schneier original https://www.schneier.com/blog/archives/2021/11/apple-sues-nso-group.html

Piling more on NSO Group’s legal troubles, Apple is suing it:

The complaint provides new information on how NSO Group infected victims’ devices with its Pegasus spyware. To prevent further abuse and harm to its users, Apple is also seeking a permanent injunction to ban NSO Group from using any Apple software, services, or devices.

NSO Group’s Pegasus spyware is favored by totalitarian governments around the world, who use it to hack Apple phones and computers.

More news:

Apple’s legal complaint provides new information on NSO Group’s FORCEDENTRY, an exploit for a now-patched vulnerability previously used to break into a victim’s Apple device and install the latest version of NSO Group’s spyware product, Pegasus. The exploit was originally identified by the Citizen Lab, a research group at the University of Toronto.

The spyware was used to attack a small number of Apple users worldwide with dangerous malware and spyware. Apple’s lawsuit seeks to ban NSO Group from further harming individuals by using Apple’s products and services. The lawsuit also seeks redress for NSO Group’s flagrant violations of US federal and state law, arising out of its efforts to target and attack Apple and its users.

NSO Group and its clients devote the immense resources and capabilities of nation-states to conduct highly targeted cyberattacks, allowing them to access the microphone, camera, and other sensitive data on Apple and Android devices. To deliver FORCEDENTRY to Apple devices, attackers created Apple IDs to send malicious data to a victim’s device — allowing NSO Group or its clients to deliver and install Pegasus spyware without a victim’s knowledge. Though misused to deliver FORCEDENTRY, Apple servers were not hacked or compromised in the attacks.

This follows in the footsteps of Facebook, which is also suing NSO Group and demanding a similar prohibition. And while the idea of the intermediary suing the attacker, and not the victim, is somewhat novel, I think it makes a lot of sense. I have a law journal article about to be published with Jon Penney on the Facebook case.

Handy Tips #13: Automate inventory information collection with Zabbix

Post Syndicated from Arturs Lontons original https://blog.zabbix.com/handy-tips-13-automate-inventory-information-collection-with-zabbix/17367/

Metrics collected by Zabbix can be used not only for historic data analysis and problem detection but they can also be utilized to populate your host inventory.

Keeping track of your host inventory is a necessity in organizations of every size. Using another tool to do that can be costly and cause software bloat and sometimes we may have to resort to populating inventory data manually.

(more…)

The collective thoughts of the interwebz