Post Syndicated from David Tuber original https://blog.cloudflare.com/orpheus/

Cloudflare’s mission is to help build a better Internet for everyone. Building a better Internet means helping build more reliable and efficient services that everyone can use. To help realize this vision, we’re announcing the free distribution of two products, one old and one new:
- Tiered Caching is now available to all customers for free. Tiered Caching reduces origin data transfer and improves performance, making web properties cheaper and faster to operate. Tiered Cache was previously a paid addition to Free, Pro, and Business plans as part of Argo.
- Orpheus is now available to all customers for free. Orpheus routes around problems on the Internet to ensure that customer origin servers are reachable from everywhere, reducing the number of errors your visitors see.
Tiered Caching: improving website performance and economics for everyone
Tiered Cache uses the size of our network to reduce requests to customer origins by dramatically increasing cache hit ratios. With data centers around the world, Cloudflare caches content very close to end users, but if a piece of content is not in cache, the Cloudflare edge data centers must contact the origin server to receive the cacheable content. This can be slow and places load on an origin server compared to serving directly from cache.
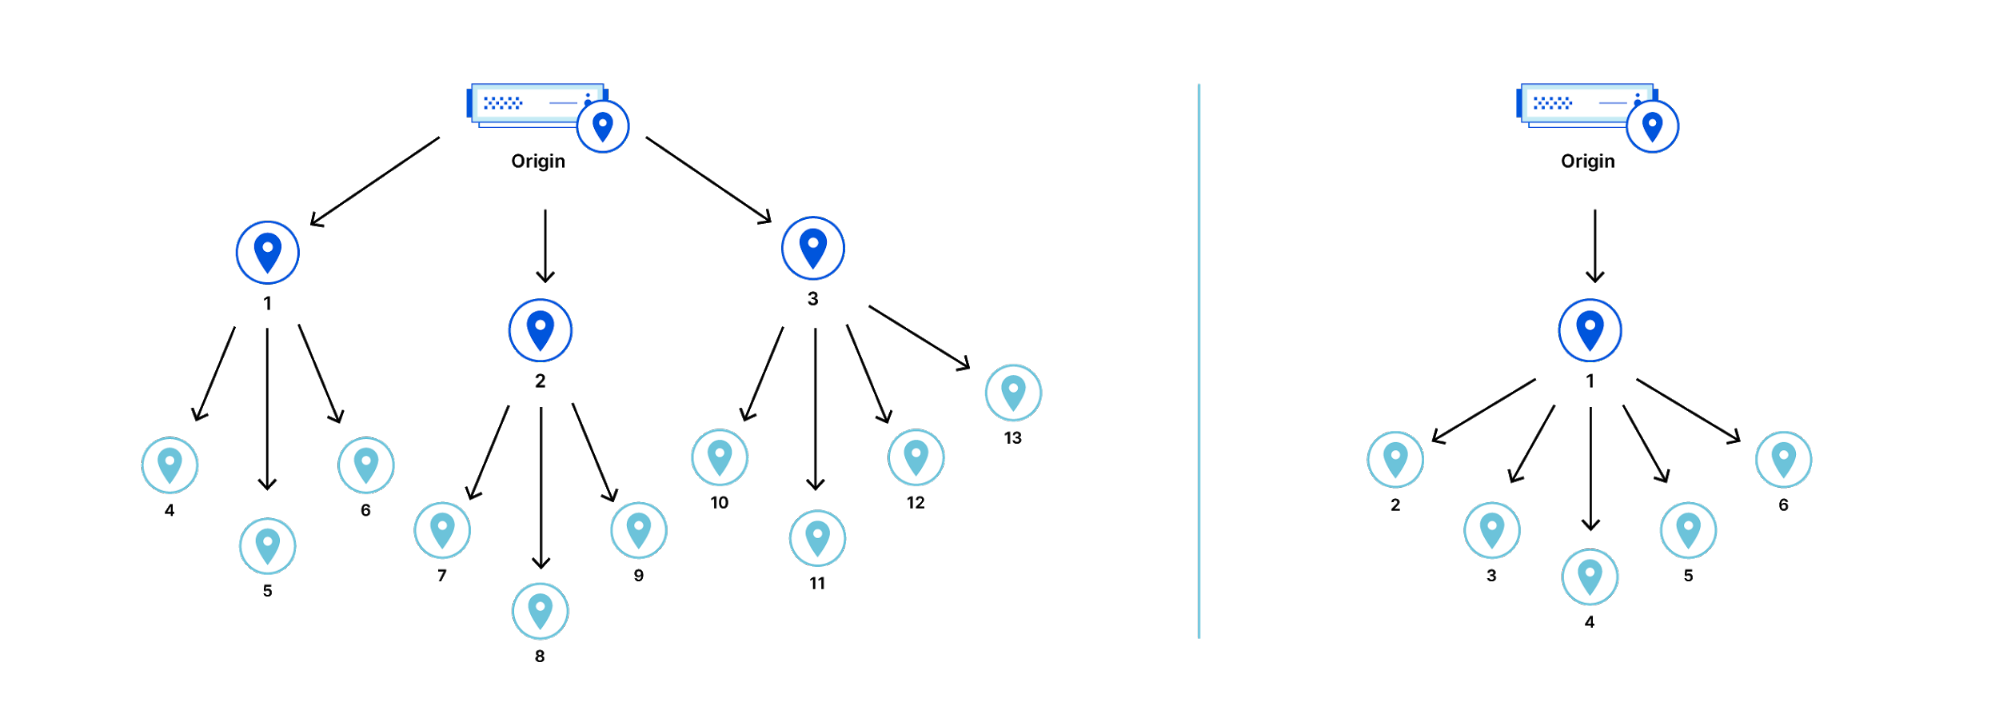
Tiered Cache works by dividing Cloudflare’s data centers into a hierarchy of lower-tiers and upper-tiers. If content is not cached in lower-tier data centers (generally the ones closest to a visitor), the lower-tier must ask an upper-tier to see if it has the content. If the upper-tier does not have it, only the upper-tier can ask the origin for content. This practice improves bandwidth efficiency by limiting the number of data centers that can ask the origin for content, reduces origin load, and makes websites more cost-effective to operate.
Dividing data centers like this results in improved performance for visitors because distances and links traversed between Cloudflare data centers are generally shorter and faster than the links between data centers and origins. It also reduces load on origins, making web properties more economical to operate. Customers enabling Tiered Cache can achieve a 60% or greater reduction in their cache miss rate as compared to Cloudflare’s traditional CDN service.
Additionally, Tiered Cache concentrates connections to origin servers so they come from a small number of data centers rather than the full set of network locations. This results in fewer open connections using server resources.
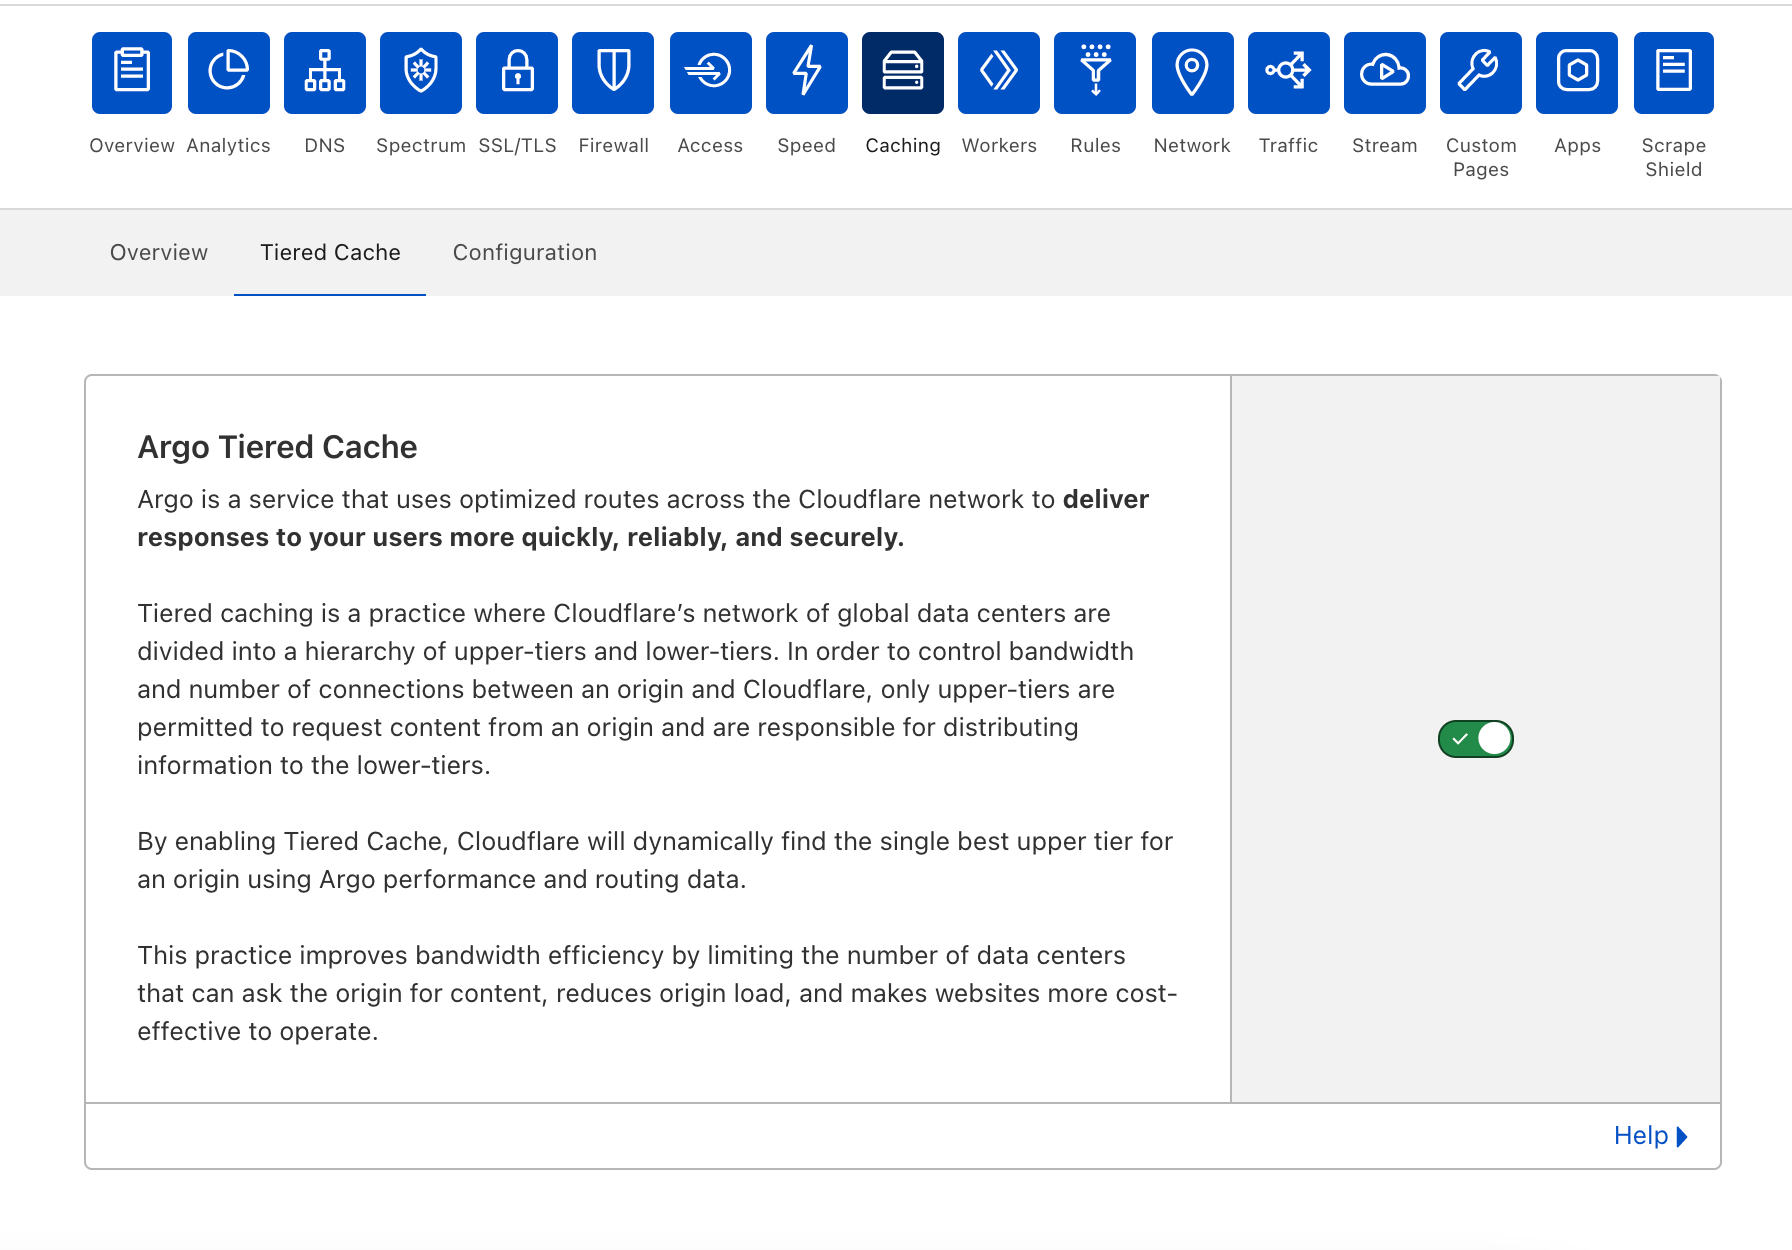
Tiered Cache is simple to enable:
- Log into your Cloudflare account.
- Navigate to the Caching in the dashboard.
- Under Caching, select Tiered Cache.
- Enable Tiered Cache.
From there, customers will automatically be enrolled in Smart Tiered Cache Topology without needing to make any additional changes. Enterprise Customers can select from different prefab topologies or have a custom topology created for their unique needs.
Smart Tiered Cache dynamically selects the single best upper tier for each of your website’s origins with no configuration required. We will dynamically find the single best upper tier for an origin by using Cloudflare’s performance and routing data. Cloudflare collects latency data for each request to an origin. Using this latency data, we can determine how well any upper-tier data center is connected with an origin and can empirically select the best data center with the lowest latency to be the upper-tier for an origin.
Today, Smart Tiered Cache is being offered to ALL Cloudflare customers for free, in contrast to other CDNs who may charge exorbitant fees for similar or worse functionality. Current Argo customers will get additional benefits described here. We think that this is a foundational improvement to the performance and economics of running a website.
But what happens if an upper-tier can’t reach an origin?
Orpheus: solving origin reachability problems for everyone
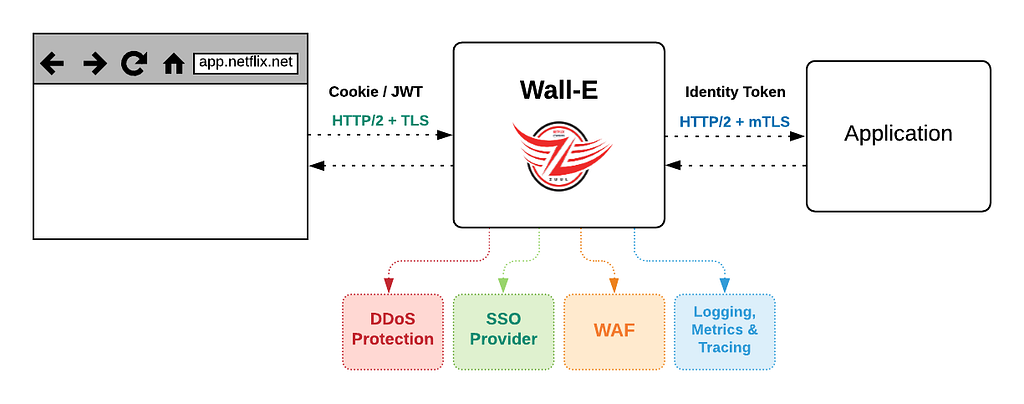
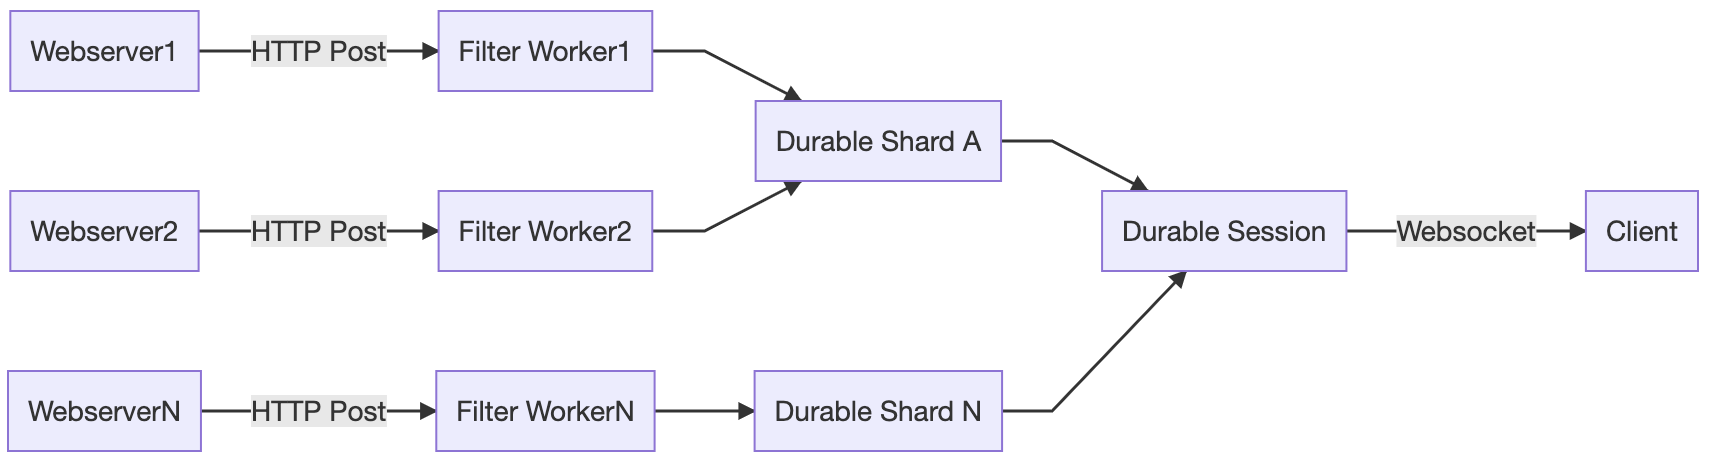
Cloudflare is a reverse proxy that receives traffic from end users and proxies requests back to customer servers or origins. To be successful, Cloudflare needs to be reachable by end users while simultaneously being able to reach origins. With end users around the world, Cloudflare needs to be able to reach origins from multiple points around the world at the same time. This is easier said than done! The Internet is not homogenous, and diverse Cloudflare network locations do not necessarily take the same paths to a given customer origin at any given time. A customer origin may be reachable from some networks but not from others.
Cloudflare developed Argo to be the Waze of the Internet, allowing our network to react to changes in Internet traffic conditions and route around congestion and breakages in real-time, ensuring end users always have a good experience. Argo Smart Routing provides amazing performance and reliability improvements to our customers.
Enter Orpheus. Orpheus provides reachability benefits for customers by finding unreachable paths on the Internet in real time, and guiding traffic away from those paths, ensuring that Cloudflare will always be able to reach an origin no matter what is happening on the Internet.
Today, we’re excited to announce that Orpheus is available to and being used by all our customers.
Fewer 522s
You may have seen this error before at one time or another.
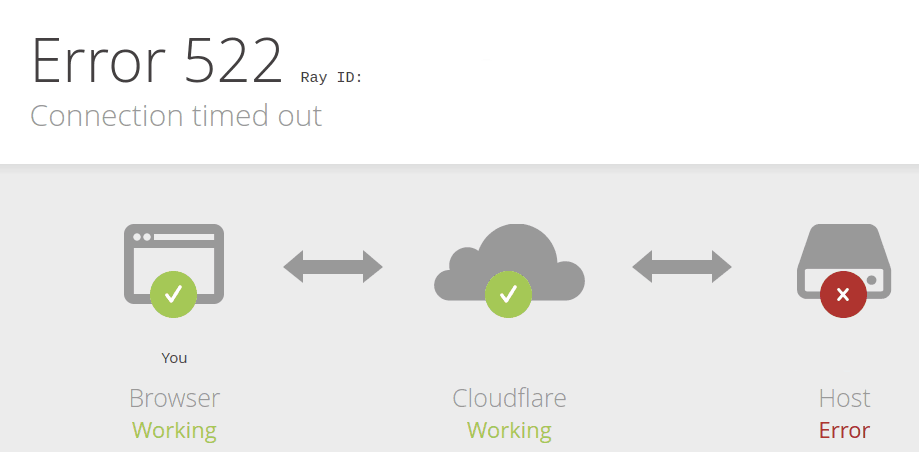
This error indicates that a user was unable to reach content because Cloudflare couldn’t reach the origin. Because of the unpredictability of the Internet described above, users may see this error even when an origin is up and able to receive traffic.
So why do you see this error? The 522 error occurs when network instability causes traffic sent by Cloudflare to fail either before it reaches the origin, or on the way back from the origin to Cloudflare. This is the equivalent of either Cloudflare or your origin sending a request and never getting a response. Both sides think that they’re fine, but the network path between them is not reachable at all. This causes customer pain.
Orpheus solves that pain, ensuring that no matter where users are or where the origin is, an Internet application will always be reachable from Cloudflare.
How it works
Orpheus builds and provisions routes from Cloudflare to origins by analyzing data from users on every path from Cloudflare and ordering them on a per-data center level with the goal of eliminating connection errors and minimizing packet loss. If Orpheus detects errors on the current path from Cloudflare back to a customer origin, Orpheus will steer subsequent traffic from the impacted network path to the healthiest path available.
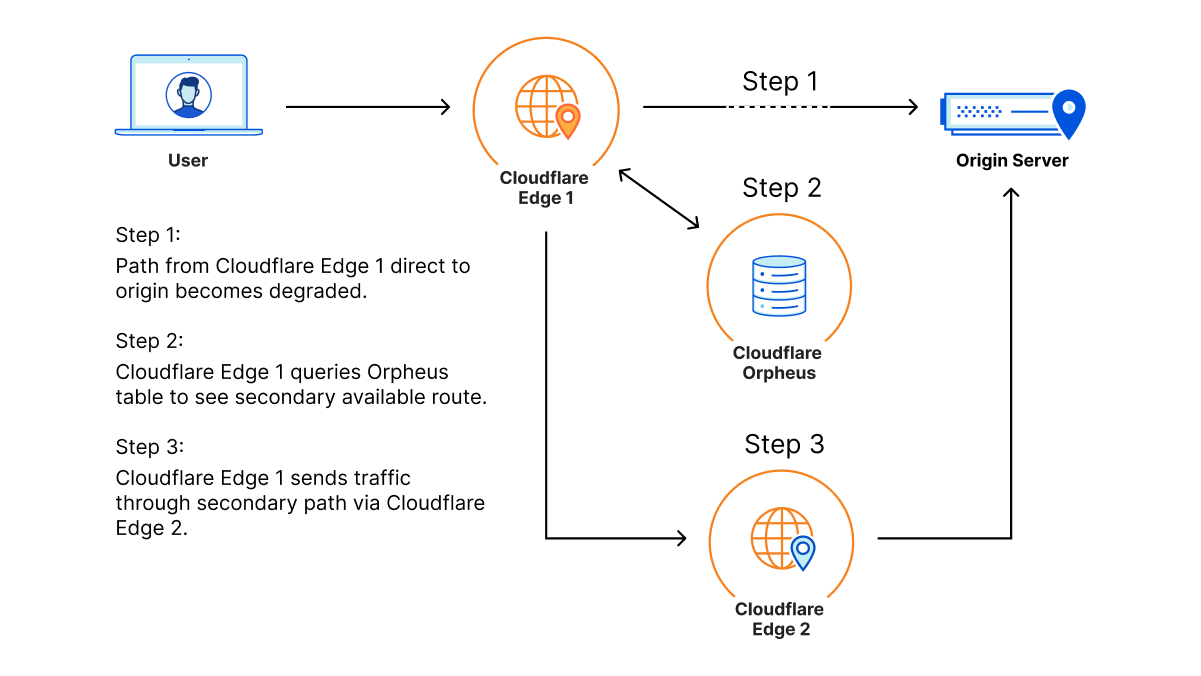
This is similar to how Argo works but with some key differences: Argo is always steering traffic down the fastest path, whereas Orpheus is reactionary and steers traffic down healthy (and not necessarily the fastest) paths when needed.
Improving origin reachability for customers
Let’s look at an example.
Barry has an origin hosted in WordPress in Chicago for his daughter’s band. This zone primarily sees traffic from three locations: the location closest to his daughter in Seattle, the location closest to him in Boston, and the location closest to his parents in Tampa, who check in on their granddaughter’s site daily for updates.
One day, a link between Tampa and the Chicago origin gets cut by a wandering backhoe. This means that Tampa loses some connectivity back to the Chicago origin. As a result, Barry’s parents start to see failures when connecting back to origin when connecting to the site. This reflects in origin reachability decreasing. Orpheus helps here by finding alternate paths for Barry’s parents, whether it’s through Boston, Seattle, or any location in between that isn’t impacted by the fiber cut seen in Tampa.
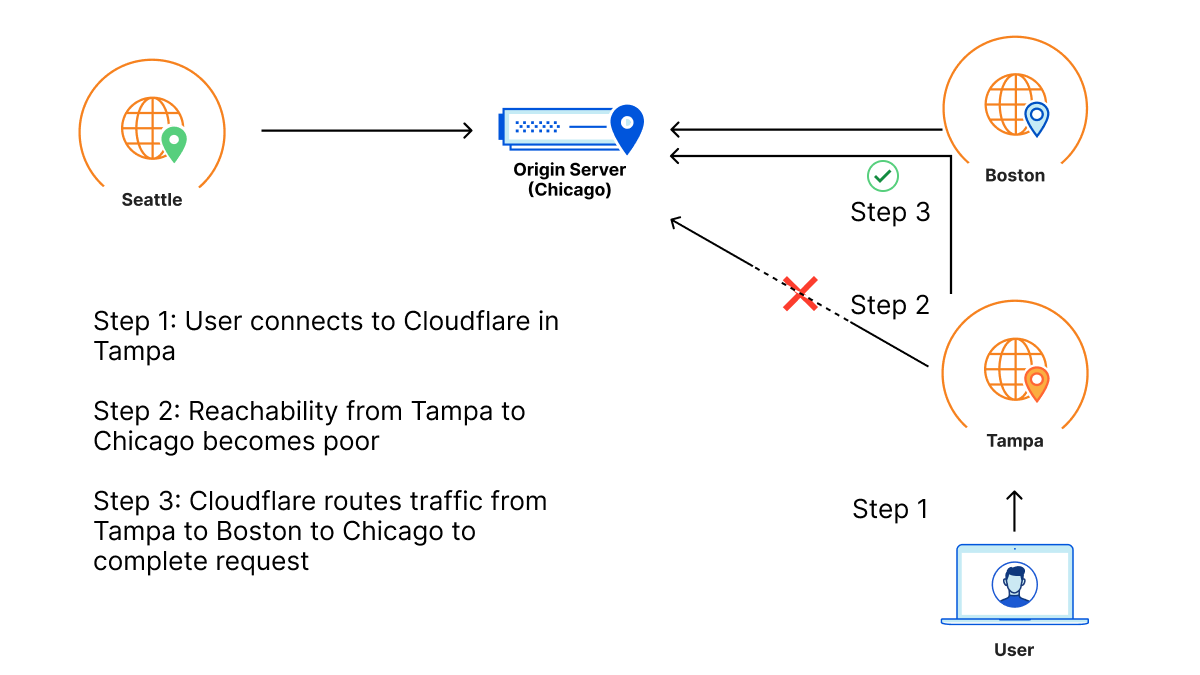
So even though there is packet loss between one of Cloudflare’s data centers and Barry’s origin, because there is a path through a different Cloudflare data center that doesn’t have loss, the traffic will still succeed because the traffic will go down the non-lossy path.
How much does Orpheus help my origin reachability?
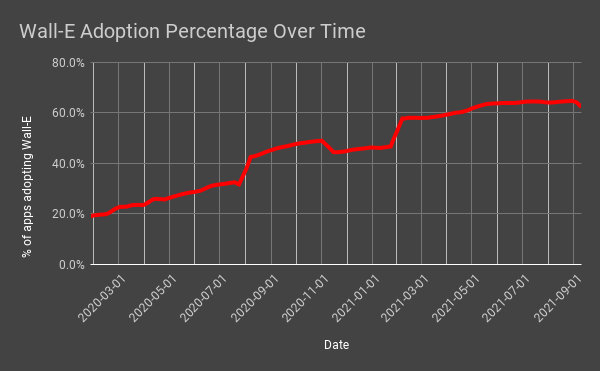
In our rollout of Orpheus for customers, we observed that Orpheus improved Origin reachability by 23%, from 99.87% to 99.90%. Here is a chart showing the improvement Orpheus provides (lower is better):

We measure this reachability improvement by measuring 522 rates for every data center-origin pair and then comparing traffic that traversed Orpheus routes with traffic that went directly back to origin. Orpheus was especially helpful at improving reachability for slightly lossy paths that could present small amounts of failure over a long period of time, whereas direct to origin would see those failures.
Note that we’ll never get this number to 0% because, with or without Orpheus, some origins really are unreachable because they are down!
Orpheus makes Cloudflare products better
Orpheus pairs well with some of our products that are already designed to provide highly available services on an uncertain Internet. Let’s go over the interactions between Orpheus and three of our products: Load Balancing, Cloudflare Network Interconnect, and Tiered Cache.
Load Balancing
Orpheus and Load Balancing go together to provide high reachability for every origin endpoint. Load balancing allows for automatic selection of endpoints based on health probes, ensuring that if an origin isn’t working, customers will still be available and operational. Orpheus finds reachable paths from Cloudflare to every origin. These two products in tandem provide a highly available and reachable experience for customers.
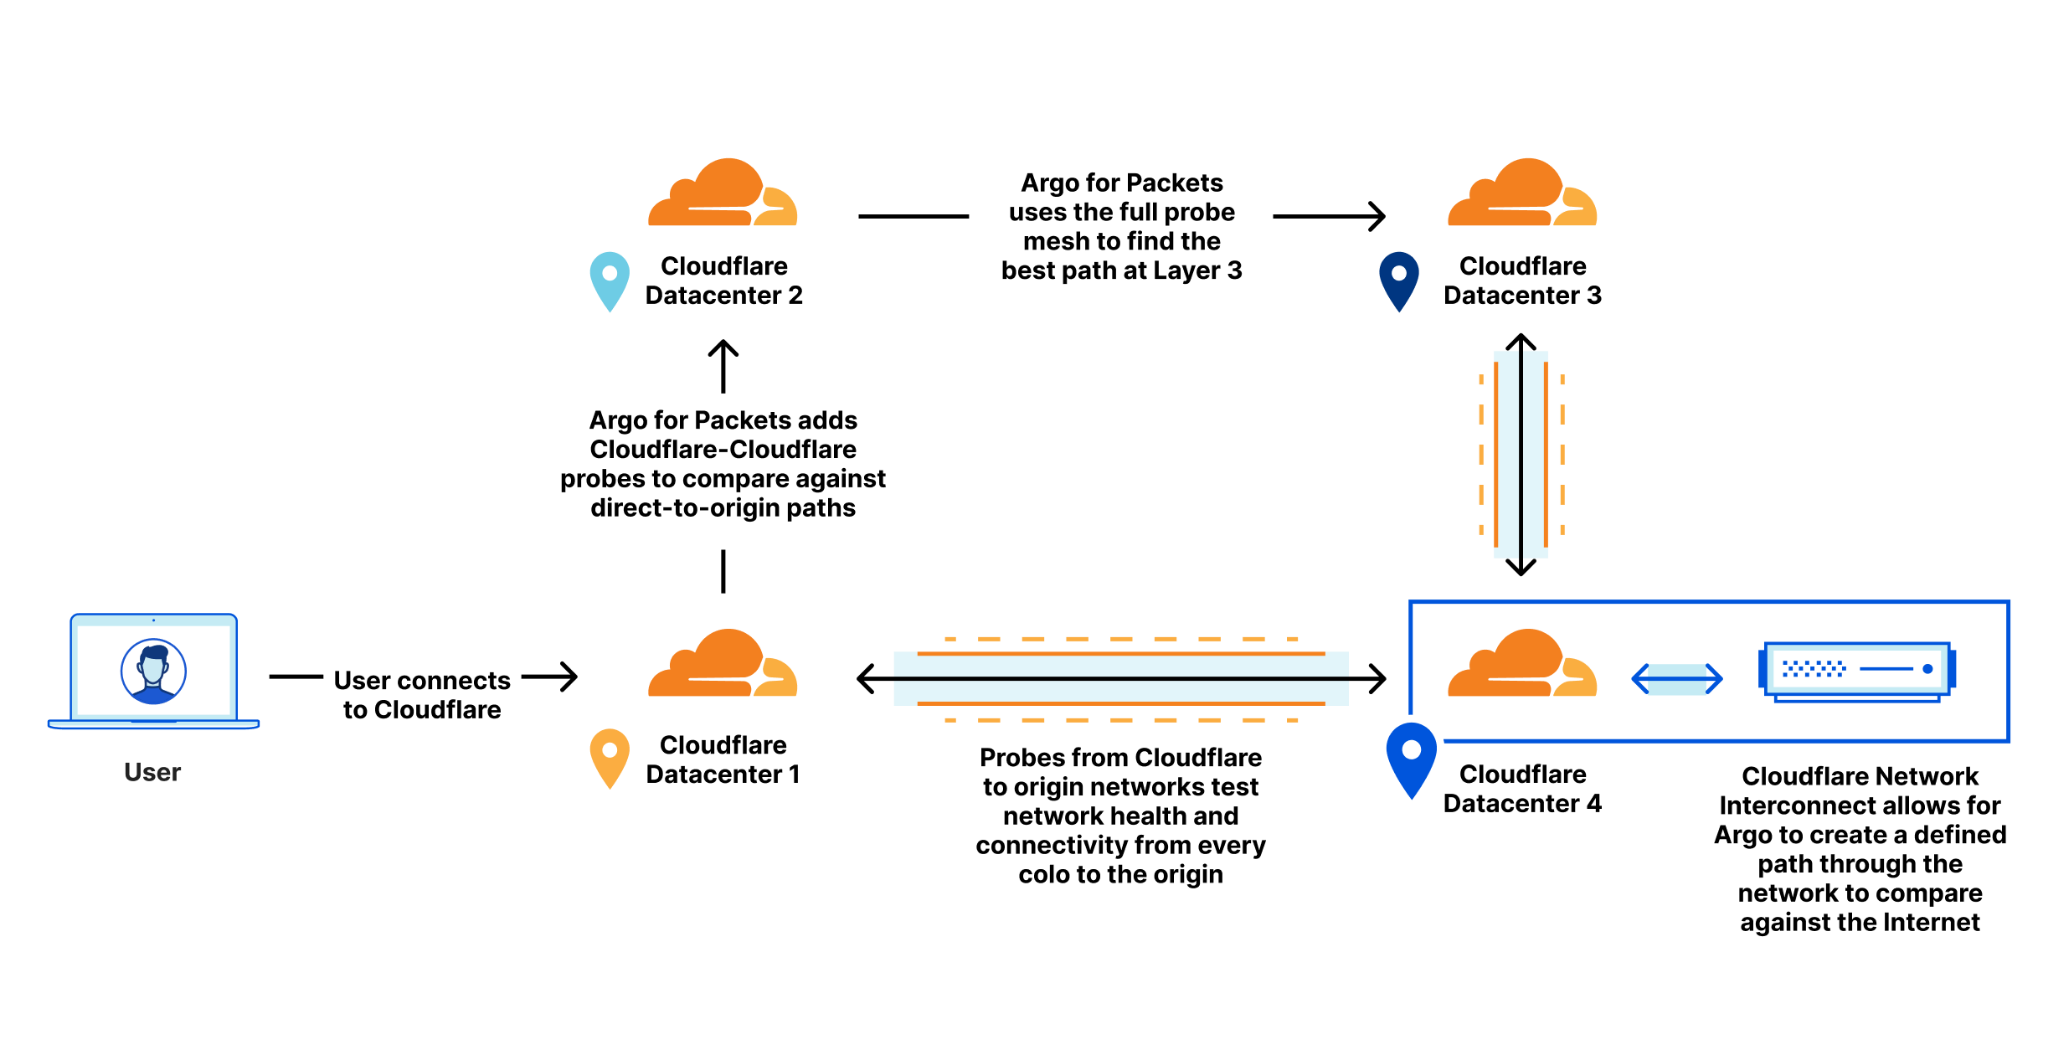
Cloudflare Network Interconnect
Orpheus and Cloudflare Network Interconnect (CNI) combine to always provide a highly reachable path, no matter where in the world you are. Consider Acme, a company who is connected to the Internet by only one provider that has a lot of outages. Orpheus will do its best to steer traffic around the lossy paths, but if there’s only one path back to the customer, Orpheus won’t be able to find a less-lossy path. Cloudflare Network Interconnect solves this problem by providing a path that is separate from the transit provider that any Cloudflare data center can access. CNI provides a viable path back to Acme’s origin that will allow Orpheus to engage from any data center in the world if loss occurs.
Shields for All
Orpheus and Tiered Cache can combine to build an adaptive shield around an origin that caches as much as possible while improving traffic back to origin. Tiered Cache topologies allow for customers to deflect much of their static traffic away from their origin to reduce load, and Orpheus helps ensure that any traffic that has to go back to the origin traverses over highly available links.
Improving origin performance for everyone
The Internet is a growing, ever-changing ecosystem. With the release of Orpheus and Tiered Cache for everyone, we’ve given you the ability to navigate whatever the Internet has in store to provide the best possible experience to your customers.


 U30 media accelerator transcoding cards