In this article, we will explore the capabilities of the new asynchronous modules of the zabbix_utils library. Thanks to asynchronous execution, users can expect improved efficiency, reduced latency, and increased flexibility in interacting with Zabbix components, ultimately enabling them to create efficient and reliable monitoring solutions that meet their specific requirements.
There is a high demand for the Python library zabbix_utils. Since its release and up to the moment of writing this article, zabbix_utils has been downloaded from PyPI more than 15,000 times. Over the past week, the library has been downloaded more than 2,700 times. The first article about the zabbix_utils library has already gathered around 3,000 views. Among the array of tools available, the library has emerged as a popular choice, offering developers and administrators a comprehensive set of functions for interacting with Zabbix components such as Zabbix server, proxy, and agents.
Considering the demand from users, as well as the potential of asynchronous programming to optimize interaction with Zabbix, we are pleased to present a new version of the library with new asynchronous modules in addition to the existing synchronous ones. The new zabbix_utils modules are designed to provide a significant performance boost by taking advantage of the inherent benefits of asynchronous programming to speed up communication between Zabbix and your service or script.
From expedited data retrieval and real-time event monitoring to enhanced scalability, asynchronous programming empowers you to build highly efficient, flexible, and reliable monitoring solutions adapted to meet your specific needs and challenges.
The new version of zabbix_utils and its asynchronous components may be useful in the following scenarios:
Mass data gathering from multiple hosts: When it’s necessary to retrieve data from a large number of hosts simultaneously, asynchronous programming allows requests to be executed in parallel, significantly speeding up the data collection process;
Mass resource exporting: When templates, hosts or problems need to be exported in parallel. This parallel execution reduces the overall export time, especially when dealing with a large number of resources;
Sending alerts from or to your system: When certain actions need to be performed based on monitoring conditions, such as sending alerts or running scripts, asynchronous programming provides rapid condition processing and execution of corresponding actions;
Scaling the monitoring system: With an increase in the number of monitored resources or the volume of collected data, asynchronous programming provides better scalability and efficiency for the monitoring system.
Installation and Configuration
If you already use the zabbix_utils library, simply updating the library to the latest version and installing all necessary dependencies for asynchronous operation is sufficient. Otherwise, you can install the library with asynchronous support using the following methods:
By using pip:
~$ pip install zabbix_utils[async]
Using [async] allows you to install additional dependencies (extras) needed for the operation of asynchronous modules.
The process of working with the asynchronous version of the zabbix_utils library is similar to the synchronous one, except for some syntactic differences of asynchronous code in Python.
Working with Zabbix API
To work with the Zabbix API in asynchronous mode, you need to import the AsyncZabbixAPI class from the zabbix_utils library:
from zabbix_utils import AsyncZabbixAPI
Similar to the synchronous ZabbixAPI, the new AsyncZabbixAPI can use the following environment variables: ZABBIX_URL, ZABBIX_TOKEN, ZABBIX_USER, ZABBIX_PASSWORD. However, when creating an instance of the AsyncZabbixAPI class you cannot specify a token or a username and password, unlike the synchronous version. They can only be passed when calling the login() method. The following usage scenarios are available here:
Use preset values of environment variables, i.e., not pass any parameters to AsyncZabbixAPI:
Pass only the Zabbix API address as input, which can be specified as either the server IP/FQDN address or DNS name (in this case, the HTTP protocol will be used) or as an URL of Zabbix API:
api = AsyncZabbixAPI(url="127.0.0.1")
After declaring an instance of the AsyncZabbixAPI class, you need to call the login() method to authenticate with the Zabbix API. There are two ways to do this:
After completing all needed API requests, it is necessary to call logout() to close the API session if authentication was done using username and password, and also close the asynchronous sessions:
The asynchronous class AsyncSender has been added, which also helps to send values to the Zabbix server or proxy for items of the Zabbix Trapper data type.
AsyncSender can be imported as follows:
from zabbix_utils import AsyncSender
Values can be sent in a group, for this it is necessary to import ItemValue:
In the example, the chunk size is set to 2. So, 5 values passed in the code above will be sent in three requests of two, two, and one value, respectively.
If your server has multiple network interfaces, and values need to be sent from a specific one, the AsyncSender provides the option to specify a source_ip for sent values:
AsyncSender also supports reading connection parameters from the Zabbix agent/agent2 configuration file. To do this, you need to set the use_config flag and specify the path to the configuration file if it differs from the default /etc/zabbix/zabbix_agentd.conf:
Getting values from Zabbix Agent/Agent2 by item key.
In cases where you need the functionality of our standart zabbix_get utility but native to your Python project and working asynchronously, consider using the AsyncGetter class. A simple example of its usage looks like this:
The new version of the zabbix_utils library provides users with the ability to implement efficient and scalable monitoring solutions, ensuring fast and reliable communication with the Zabbix components. Asynchronous way of interaction gives a lot of room for performance improvement and flexible task management when handling a large volume of requests to Zabbix components such as Zabbix API and others.
We have no doubt that the new version of zabbix_utils will become an indispensable tool for developers and administrators, helping them create more efficient, flexible, and reliable monitoring solutions that best meet their requirements and expectations.
The Amarok music player project
has announced
the release of version 3.0, which is codenamed “Castaway”. It is the first
stable version using Qt 5 and KDE Frameworks 5, and the first stable
release since the final Qt-4-based 2.9.0 in 2018.
The road to 3.0 has not been a short one. Much of the Qt5/KF5 porting was done in 2015 already, but finishing and polishing everything up has been a slow, sometimes ongoing and sometimes stalled process ever since. 3.0 Alpha was released in February 2021 and has been since used by many people, as have been nightly builds of git master available for various distributions. Now in the past few months, an effort was made to get everything ready for a proper 3.0 release.
Common usecases should work quite well, and in addition to fixing KF5 port
related regressions reported in pre-releases, 3.0 features many bugfixes
and implemented features for longstanding issues, the oldest such
documented being from 2009. However, with more than 20 years of development
history, it is likely that not every feature Amarok has been tested
thoroughly in the new release, and specifically some Internet services that
have changed their API in recent years are not available, at least for
now. It might well be that getting them in better state wouldn’t require
huge effort, however, so if you know your way with Qt and KDE Frameworks
and your favourite Internet music service does not work with Amarok 3.0,
you are extremely welcome to join in and help!
Organizations need generative artificial intelligence (generative AI) models to securely interact with information stored in their enterprise data sources. Both Command R and Command R+ are powerful, scalable large language models (LLMs), purpose-built for real-world, enterprise-grade workloads. These models are multilingual and are focused on balancing high efficiency with strong accuracy to excel at capabilities such as Retrieval-Augmented Generation (RAG), and tool use to enable enterprises to move beyond proof-of-concept (POC), and into production using artificial intelligence (AI).
Command R is a scalable multilingual generative model targeting RAG and tool use to enable production-scale AI for enterprises. Command R+ is a state-of-the-art RAG-optimized model designed to tackle enterprise-grade workloads and optimize business AI applications. Command R+ is optimized for advanced RAG to provide enterprise-ready, highly reliable, and verifiable responses due to in-line citations which come standard with this model. With these new Cohere models in Bedrock, you can scale with AI to quickly find the most relevant information to support tasks across business functions like finance, human resources (HR), sales, marketing, and customer support, among others, in a range of business sectors. Tool use is also available in Command R+. Command R+ is a strong multilingual model, and similarly to Command R, features a tokenizer that compresses non-English text much better than the tokenizer used for other models in the market.
Getting started with Command R and Command R+ To get started with both models in Amazon Bedrock, you first need to get access to the models. In the Amazon Bedrock console, choose Model access, and then choose Manage model access. Next, choose your preferred model(s), and then choose Save changes. As you can see, you now have six Cohere models to choose from in Amazon Bedrock – including Command R and Command R+ – giving you greater choice and flexibility to use the optimal models for your specific business needs.
Once you have access to your preferred model, you can use the model in Amazon Bedrock. Refresh the base models table to view the updated status.
The models have been trained to respond in the language of the user such as English, French, Spanish, Italian, German, Brazilian Portuguese, Japanese, Korean, Simplified Chinese, and Arabic. Here’s an example:
Prompt
<s>"Écris une description de produit pour une voiture électrique en 50 à 75 mots"
Output
Découvrez la voiture électrique qui va révolutionner votre façon de conduire.
Avec son design élégant, cette voiture offre une expérience de conduite unique
avec une accélération puissante et une autonomie impressionnante. Sa
technologie avancée vous garantit une charge rapide et une fiabilité inégalée.
Avec sa conception innovante et durable, cette voiture est parfaite pour les
trajets urbains et les longues distances. Profitez d'une conduite silencieuse
et vivez l'expérience de la voiture électrique!
Programmatically interact with Command R and Command R+ You can also use AWS Command Line Interface (CLI) and AWS Software Development Kit (SDK) to make various calls using Amazon Bedrock APIs. Following, is a sample code in Python that interacts with Amazon Bedrock Runtime APIs with AWS SDK. Taking the same text generation prompt I used earlier, here is how it looks when used programmatically. In this example I’m interacting with the Command R model. Back to Python, I first run the ListFoundationModels API call to discover the modelId for Command R.
From this list, I select cohere.command-r-v1:0 model ID and write the code to generate the text as shown earlier in this post.
import boto3
import json

bedrock = boto3.client(service_name="bedrock-runtime", region_name='us-east-1')

prompt = """
<s>Écris une description de produit pour une voiture électrique en 50 à 75 mots

body = json.dumps({
    "prompt": prompt,
    "max_tokens": 512,
    "top_p": 0.8,
    "temperature": 0.5,
})

modelId = "cohere.command-r-v1:0"

accept = "application/json"
contentType = "application/json"

response = bedrock.invoke_model(
    body=body,
    modelId=modelId,
    accept=accept,
    contentType=contentType
)

print(json.loads(response.get('body').read()))
You can get JSON formatted output as like:
Découvrez la voiture électrique qui va révolutionner votre façon de conduire.
Avec son design élégant, cette voiture offre une expérience de conduite unique
avec une accélération puissante et une autonomie impressionnante. Sa
technologie avancée vous garantit une charge rapide et une fiabilité inégalée.
Avec sa conception innovante et durable, cette voiture est parfaite pour les
trajets urbains et les longues distances. Profitez d'une conduite silencieuse
et vivez l'expérience de la voiture électrique!
Visit our community.aws site to find deep-dive technical content and to discover how our Builder communities are using Amazon Bedrock in their solutions. Give Command R and Command R+ a try in the Amazon Bedrock console today and send feedback to AWS re:Post for Amazon Bedrock or through your usual AWS Support contacts.
Ето какво съветва нотариус Милена Илчева, за да се сключват спокойно и законосъобразно сделките за всички страни
Бургаският нотариус Милена Илчева се съгласи да разясни пред Флагман.бг подробности за промените в Данъчно-осигурителния процесуален кодекс, които влизат в сила от 3 май и затягат правилата за всички участници в сделките за прехвърлянето или учредяването на вещни права върху недвижими имоти или МПС.
Ето какво съветва юристът, за да се сключват спокойно и законосъобразно сделките за всички страни:
Новите правила са по силата на изменение на разпоредбата на чл. 264, ал. 1 и ал. 2 от ДОПК и защитават интересите на държавата и общините.
Досега, когато се сключваха сделки за прехвърляне или учредяване на вещни права върху недвижим имот или МПС, лицата, които са прехвърлители на същите, или които учредяваха ипотеки, предоставяха пред нотариуса декларации, че нямат подлежащи на принудително изпълнение публични задължения. Сега тези декларации отпадат, но във връзка със законодателните изменения от 03.05.2024 г. нотариусите в реално време ще проверяват по електронен път в Националната агенция за приходите за наличие на непогасени, подлежащи на принудително изпълнение публични задължения на прехвърлителите, респективно учредителите. Връзката между тях и НАП е осигурена чрез информационната система на Нотариалната камара. Тоест, може да се каже, че досега режимът беше декларативен, то занапред вече няма да е така. Автоматично от това следва, че ако едно лице има задължение, дори само за 20 лева, за да прехвърли собствеността, която иска, или да ипотекира имота, който иска, трябва да погаси същото, ако то вече подлежи на принудително изпълнение.
Установявам, че това все още не се знае от много хора, а изменението на закона влиза в сила съвсем скоро. Считам, че във връзка със законодателната промяна е препоръчително още на фаза предлагане на един имот за продажба и не по-късно от сключване на предварителния договор за продажбата му, продавачите да се погрижат да се снабдят с необходимия документ, удостоверяващ липсата на такива техни задължения. Тук съществена роля ще имат брокерите на недвижими имоти, които са посредници на страните и са в пряк контакт с тях още на фаза предлагане и подготовка на документите. Те могат да указват това на собствениците, за да може своевременно да предприемат необходимите действия. Това важи и когато при покупка на имот финансирането е с банков кредит, който ще се обезпечава с ипотека върху закупувания имот. Там ще стои въпросът за липса на подлежащи на принудително изпълнение задължения за публични задължения и от страна на купувача по такава сделка, който ще се явява ипотекиращ този имот за обезпечаване на дълга си към банката. Тоест, правилото не важи само за продавачи на недвижими имоти или МПС. Неспазването му от всеки, който желае да прехвърли по какъвто и да начин вещни права върху недвижим имот или МПС, или ще ипотекира недвижим имот или залага имущество ще води до спиране и отлагане сделките, или до отказ за извършване на съответните действия от компетентните органи, натоварени със задължението за тези проверки. Прехвърлителите и учредителите следва да бъдат добросъвестни и да се погрижат към деня на сключване на окончателната сделка да са изрядни към държавата и общините по отношение на публичните си задължения.
Според разпоредбите на чл. 264, ал. 1 и 2 от ДОПК и сега би трябвало да нямате непогасени подлежащи на принудително изпълнение задължения за данъци, мита и задължителни осигурителни вноски, но за това се изисква само декларация, в която ако декларирате неверни данни ще носите наказателна отговорност и сделката е недействителна спрямо държавата, съответно общината. След 03.05.2024 г. наличието на такива задължения ще се установява чрез официална справка в реално време – към съответния ден и час дали имате или нямате непогасени, подлежащи на принудително изпълнение публични задължения. Проверката от нотариус по електронен път в Националната агенция за приходите следва да се прави само, когато има нотариално производство, тоест не може да бъде извършвана без основание. Изискването за опазване на данъчната и осигурителна тайна, съгласно разпоредбите на ДОПК не се променя и предоставянето на данните от тези справки следва да става изцяло, съобразно законовите норми. Това означава, че не може да искате от нотариус да прави такава справка когато решите, без да има производство пред него. И най-вече, не можете да искате нотариус да прави такава справка за трето лице, с което сте в преддоговорни отношения по бъдеща сделка, за която няма нотариално производство. Съгласно нормите на ДОПК, информацията за данните в данъчно-осигурителната сметка на дадено лице се получава лично от него или от изрично упълномощено с нотариално заверено пълномощно лице. Извън тях, закона посочва изрично кои държавни органи или лица, изпълняващи публични функции могат да искат такива данни от НАП, не и от нотариус. Това предполага бъдещите прехвърлители или учредители своевременно да си направят предварителни справки или чрез електронната система на НАП или на място в офисите на НАП. Бих им препоръчала да се снабдяват с официалния документ, удостоверяващ липсата на техни задължения – удостоверение по чл. 87, ал. 6 от ДОПК, за да могат да докажат, че са изрядни спрямо държавата и общините по отношение на публичните си задължения и, че са коректни спрямо лицата, с които ще влизат в договорни отношения.
Законът допуска, ако се установят задължения в деня на сключване на сделката, нотариусът да издаде акт за нея, но ако задълженията бъдат платени преди подписването му. Естествено това ще усложни процеса – нотариусът ще спре производството, докато се погасят задълженията или докато купувачът внесе цялата или част от цената при покупко-продажба за погасяването им, банката ще чака и докато няма задължения, няма да предостави кредита, за да може да е сигурна, че няма да изпадне в състояние да е кредитор заедно с държавата или Общината. Искам да обърна внимание, че законът не казва само продажба, а прехвърлянето или учредяването на вещни права върху недвижими имоти или МПС, а това не са само възмездните сделки за покупко-продажба. Заобикалянето на това изискване за мен е недопустимо, за да се счита, че не важи при дарение или замяна. Както казах преди това и сега тежи отговорността, ако сте декларирали неверни данни, че нямате непогасени подлежащи на принудително изпълнение публични задължения, и държавата или общините имат права като кредитори, съгласно чл. 216 от ДОПК.
Нотариусите, като лица с публични функции, вече ще са натоварени с ангажимент по отношение на защита и на тези интереси на държавата и общините. Тук няма да се включват само задължения за имоти и МПС, а всякакви публични задължения (дори глобите от КАТ), установени с актове на всякакви държавни или общински органи, които се събират по принудителен ред от НАП. И за 20 лв. глоба от КАТ да имате, ако тя вече подлежи на принудително изпълнение, трябва да я платите, за да може да си прехвърлите собствеността върху имота, да апортирате имот в търговско дружество или да се впише залог по реда на Закона за особените залози . Клиентите не трябва да се сърдят, ако отидат при нотариус и той им откаже съответното удостоверяване на това основание.
Съгласно последното изменение на чл. 264 от ДОПК задължение за извършване на справките по електронен път в Националната агенция за приходите за наличие на непогасени, подлежащи на принудително изпълнение публични задължения на прехвърлителите, респективно учредителите имат нотариуса, съдията по вписванията, длъжностното лице по регистрация по Закона за търговския регистър и регистъра на юридическите лица с нестопанска цел или длъжностното лице по вписванията по Закона за особените залози, съобразно компетентността си в съответните производства. В случай, че някой от тях в кръга на своята компетентност състави, съответно разпореди да се впише, акт при неспазване на чл. 264, ал. 1, 2 и 4 от ДОПК е регламентирана солидарна отговорност за заплащане на задълженията, дължими от длъжника. За нотариуса и съдията по вписванията отговорността е лична, а за действията на длъжностните лица отговорността отговорността е вменена на Агенцията по вписванията. Не смятам, че ще има колега, който ще се съгласи да стане съдлъжник заедно с Вас и да отговаря за плащането на такива Ваши задължения.
Времето до датата, когато ще се прилагат новите правила е кратко, а с колеги установихме, че това не е ясно на хората. Ето и един пример – някой, ако през Великденските празнични почивни дни – между 3 и 6.05, намери купувач на продавана от него кола, и отидат при колега, който да удостовери договора, което е допустимо от закона да се извършва в извън регламентираното ни работно време, и се установи при справката от нотариуса наличие на такова задължение, сделката се усложнява. При прехвърлянето на собственост за МПС всичко се случва в реално време в канторите ни. Чрез информационната системата на Нотариалната камара, която има директна връзка със системата на КАТ, докато сте още в кантората на нотариуса, непосредствено след подписването на договора от страните и нотариуса, в реално време се регистрира промяната на собствеността. По отношение на недвижимите имоти е по-различно. Там има интервал от време, в което трябва, да го кажем се обработят докумените, след като страните и нотариуса са подписали нотариалния акт и собствеността е преминала, преди акта да се впише в регистрите и книгите на съответната Служба по вписванията и се афишира спрямо всички трети лица.
Моля използвайте приложената форма за записване на час за среща
[contact-form-7]
Сега от една страна клиенти и брокери се радват, че отпаднаха едни декларации за заверка, но трябва да се отчита, че не отпада изискването хората, които са прехвърлители или учредители на права върху недвижими имоти или МПС, да нямат задължения към държавата и общините, за да бъдат коректни при сключването на сделката. НАП са се постарали да направят електронната си система, така че във всеки един момент да можете да проверите това, което касае ваши публични задължения и да погасите същите. Това може да стане не само на място в офисите на НАП, но и по банков път или чрез портала за електронни услуги на НАП. А, ако вече публичен изпълнител Ви търси, за да събира публични задължения по принудителен ред, малко вероятно е да не сте наясно с това обстоятелство. Затова, бъдете коректни към потенциалните си контрагенти и уредете тези Ваши задължения своевременно.
Last week’s launches With so many interesting new features, I start with generative artificial intelligence (generative AI) and then move to the other topics. Here’s what got my attention:
AWS CodeBuild – Now supports managed GitHub Action self-hosted runners. You can configure CodeBuild projects to receive GitHub Actions workflow job events and run them on CodeBuild ephemeral hosts.
AWS Direct Connect – Hosted connections now support capacities up to 25 Gbps. Before, the maximum was 10 Gbps. Higher bandwidths simplify deployments of applications such as advanced driver assistance systems (ADAS), media and entertainment (M&E), artificial intelligence (AI), and machine learning (ML).
Let’s Architect! Discovering Generative AI on AWS – A new episode in this amazing series of posts that provides a broad introduction to the domain and then shares a mix of videos, blog posts, and hands-on workshops.
AWS open source news and updates – My colleague Ricardo writes about open source projects, tools, and events from the AWS Community. Check out Ricardo’s page for the latest updates.
Upcoming AWS events Check your calendars and sign up for upcoming AWS events:
AWS Summits – Join free online and in-person events that bring the cloud computing community together to connect, collaborate, and learn about AWS. Register in your nearest city: Singapore (May 7), Seoul (May 16–17), Hong Kong (May 22), Milan (May 23), Stockholm (June 4), and Madrid (June 5).
AWS re:Inforce – Explore 2.5 days of immersive cloud security learning in the age of generative AI at AWS re:Inforce, June 10–12 in Pennsylvania.
AWS Community Days – Join community-led conferences that feature technical discussions, workshops, and hands-on labs led by expert AWS users and industry leaders from around the world: Turkey (May 18), Midwest | Columbus (June 13), Sri Lanka (June 27), Cameroon (July 13), Nigeria (August 24), and New York (August 28).
GOTO EDA Day London – Join us in London on May 14 to learn about event-driven architectures (EDA) for building highly scalable, fault tolerant, and extensible applications. This conference is organized by GOTO, AWS, and partners.
The construction of big data applications based on open source software has become increasingly uncomplicated since the advent of projects like Data on EKS, an open source project from AWS to provide blueprints for building data and machine learning (ML) applications on Amazon Elastic Kubernetes Service (Amazon EKS). In the realm of big data, securing data on cloud applications is crucial. This post explores the deployment of Apache Ranger for permission management within the Hadoop ecosystem on Amazon EKS. We show how Ranger integrates with Hadoop components like Apache Hive, Spark, Trino, Yarn, and HDFS, providing secure and efficient data management in a cloud environment. Join us as we navigate these advanced security strategies in the context of Kubernetes and cloud computing.
Overview of solution
The Amber Group’s Data on EKS Platform (DEP) is a Kubernetes-based, cloud-centered big data platform that revolutionizes the way we handle data in EKS environments. Developed by Amber Group’s Data Team, DEP integrates with familiar components like Apache Hive, Spark, Flink, Trino, HDFS, and more, making it a versatile and comprehensive solution for data management and BI platforms.
The following diagram illustrates the solution architecture.
Effective permission management is crucial for several key reasons:
Enhanced security – With proper permission management, sensitive data is only accessible to authorized individuals, thereby safeguarding against unauthorized access and potential security breaches. This is especially important in industries handling large volumes of sensitive or personal data.
Operational efficiency – By defining clear user roles and permissions, organizations can streamline workflows and reduce administrative overhead. This system simplifies managing user access, saves time for data security administrators, and minimizes the risk of configuration errors.
Scalability and compliance – As businesses grow and evolve, a scalable permission management system helps with smoothly adjusting user roles and access rights. This adaptability is essential for maintaining compliance with various data privacy regulations like GDPR and HIPAA, making sure that the organization’s data practices are legally sound and up to date.
Addressing big data challenges – Big data comes with unique challenges, like managing large volumes of rapidly evolving data across multiple platforms. Effective permission management helps tackle these challenges by controlling how data is accessed and used, providing data integrity and minimizing the risk of data breaches.
Apache Ranger is a comprehensive framework designed for data governance and security in Hadoop ecosystems. It provides a centralized framework to define, administer, and manage security policies consistently across various Hadoop components. Ranger specializes in fine-grained access control, offering detailed management of user permissions and auditing capabilities.
Ranger’s architecture is designed to integrate smoothly with various big data tools such as Hadoop, Hive, HBase, and Spark. The key components of Ranger include:
Ranger Admin – This is the central component where all security policies are created and managed. It provides a web-based user interface for policy management and an API for programmatic configuration.
Ranger UserSync – This service is responsible for syncing user and group information from a directory service like LDAP or AD into Ranger.
Ranger plugins – These are installed on each component of the Hadoop ecosystem (like Hive and HBase). Plugins pull policies from the Ranger Admin service and enforce them locally.
Ranger Auditing – Ranger captures access audit logs and stores them for compliance and monitoring purposes. It can integrate with external tools for advanced analytics on these audit logs.
Ranger Key Management Store (KMS) – Ranger KMS provides encryption and key management, extending Hadoop’s HDFS Transparent Data Encryption (TDE).
The following flowchart illustrates the priority levels for matching policies.
The priority levels are as follows:
Deny list takes precedence over allow list
Deny list exclude has a higher priority than deny list
Allow list exclude has a higher priority than allow list
Our Amazon EKS-based deployment includes the following components:
MySQL database – The database stores Hive metadata, facilitating efficient metadata retrieval and management
EKS cluster – The cluster is comprised of three distinct node groups: platform, Hadoop, and Trino, each tailored for specific operational needs
Hadoop cluster applications – These applications include HDFS for distributed storage and YARN for managing cluster resources
Trino cluster application – This application enables us to run distributed SQL queries for analytics
Apache Ranger – Ranger serves as the central security management tool for access policy across the big data components
OpenLDAP – This is integrated as the LDAP service to provide a centralized user information repository, essential for user authentication and authorization
Other cloud services resources – Other resources include a dedicated VPC for network security and isolation
By the end of this deployment process, we will have realized the following benefits:
A high-performing, scalable big data platform that can handle complex data workflows with ease
Enhanced security through centralized management of authentication and authorization, provided by the integration of OpenLDAP and Apache Ranger
Cost-effective infrastructure management and operation, thanks to the containerized nature of services on Amazon EKS
Compliance with stringent data security and privacy regulations, due to Apache Ranger’s policy enforcement capabilities
Deploy a big data cluster on Amazon EKS and configure Ranger for access control
In this section, we outline the process of deploying a big data cluster on AWS EKS and configuring Ranger for access control. We use AWS CloudFormation templates for quick deployment of a big data environment on Amazon EKS with Apache Ranger.
Complete the following steps:
Upload the provided template to AWS CloudFormation, configure the stack options, and launch the stack to automate the deployment of the entire infrastructure, including the EKS cluster and Apache Ranger integration.
After a few minutes, you’ll have a fully functional big data environment with robust security management ready for your analytical workloads, as shown in the following screenshot.
On the AWS web console, find the name of your EKS cluster. In this case, it’s dep-demo-eks-cluster-ap-northeast-1. For example:
aws eks update-kubeconfig --name dep-eks-cluster-ap-northeast-1 --region ap-northeast-1

## Check pod status.

kubectl get pods --namespace hadoop

kubectl get pods --namespace platform

kubectl get pods --namespace trino
After Ranger Admin is successfully forwarded to port 6080 of localhost, go to localhost:6080 in your browser.
Log in with user name admin and the password you entered earlier.
By default, you have already created two policies: Hive and Trino, and granted all access to the LDAP user you created (depadmin in this case).
Also, the LDAP user sync service is set up and will automatically sync all users from the LDAP service created in this template.
Example permission configuration
In a practical application within a company, permissions for tables and fields in the data warehouse are divided based on business departments, isolating sensitive data for different business units. This provides data security and orderly conduct of daily business operations. The following screenshots show an example business configuration.
The following is an example of an Apache Ranger permission configuration.
The following screenshots show users associated with roles.
When performing data queries, using Hive and Spark as examples, we can demonstrate the comparison before and after permission configuration.
The following screenshot shows an example of Hive SQL (running on superset) with privileges denied.
The following screenshot shows an example of Spark SQL (running on IDE) with privileges denied.
The following screenshot shows an example of Spark SQL (running on IDE) with permissions permitting.
Based on this example and considering your enterprise requirements, it becomes feasible and flexible to manage permissions in the data warehouse effectively.
Conclusion
This post provided a comprehensive guide on permission management in big data, particularly within the Amazon EKS platform using Apache Ranger, that equips you with the essential knowledge and tools for robust data security and management. By implementing the strategies and understanding the components detailed in this post, you can effectively manage permissions, implementing data security and compliance in your big data environments.
About the Authors
Yuzhu Xiao is a Senior Data Development Engineer at Amber Group with extensive experience in cloud data platform architecture. He has many years of experience in AWS Cloud platform data architecture and development, primarily focusing on efficiency optimization and cost control of enterprise cloud architectures.
Xin Zhang is an AWS Solutions Architect, responsible for solution consulting and design based on the AWS Cloud platform. He has a rich experience in R&D and architecture practice in the fields of system architecture, data warehousing, and real-time computing.
Срещам на вратата на входа съседа, прибира се с мрежичка продукти. Здрасти, как си, актуална обстановка… Той:
– Ще се ваксинираш ли за коронавируса? Аз – не. Не знам какво слагат в тия ваксини, тайна е. Никой разумен човек няма да се ваксинира при това положение.
Звучи разумно. Да му кажа, че не е тайна, има го даже на много места в Нета? Ама все пак е възрастен човек, без особено образование, дългите и сложни имена на съставки нищо няма да му говорят… Погледът ми пада върху мрежичката му, и ми идва по-добра идея:
– Гледам, че си купил кренвирши?
– Да. Защо? – Никакъв признак на правене на връзка. Изчаквам малко – не, няма.
– А знаеш ли какво слагат в тях?
Гледа ме недоумяващо. Внезапно в погледа му се промъква ужас, лицето му побелява и ръцете му се разтреперват:
– Мислиш, че слагат ваксини ли?!?!
Разумността изяснена.
—-
– Абе, ти си баси тъпанаря! Всеки знае, че наночиповете във ваксините ги произвежда Бил Гейтс по нареждане на Ротшилд! Вирусът изобщо не съществува, конспирация е! Хората боледуват, понеже ги пръскат с кемтрейлсове! Забелязваш ли колко много са кемтрейлсовете напоследък?
– Гледам, че са по-малко. Нали самолетите летят по-малко… – опитвам се да проникна с някаква логика.
– Ами! Просто са се научили да ги правят невидими! Иначе защо ще въвеждат 5G-то, ако няма наночипове да ги управляват през него?
Чудя се колко ли още от модерните лудости ще са се събрали в горкия човек. Традиционните – шизофрения, параноя, мании, психози – обикновено са по една на пациент…
—-
– В Конституцията е записано правото ми на лична свобода, нали? Никой не може да ме заставя да си бода в тялото каквото не искам! Ако ще даже наистина да е полезно! Въпрос на принцип е!
Как да му обясниш на разбираем за него език, че не е прав?
– Добре, защо тогава не се бориш срещу това да трябва да имаш шофьорска книжка, за да караш кола? Също ти ограничава свободата, а е въпрос на принцип.
– Аааа, това е съвсем различно нещо! Човек като няма книжка, може да направи с колата някоя катастрофа, нали? И може да пострада, или даже да се убие. И други хора също може да съсипе. Не е същото!…
—-
Коментари във Фейсбук под статия, предупреждаваща за нов вариант на SARS-CoV-2:
-Стига сте пръскалитози нов щам един ден ще се изсипе над всще деца и близки така и на вас какво си мислите че ще останете не наказани от Бога ли ще си платите с всяка една стотинка до милионите си тогава ще искате и вие да умрете но няма защото Божието наказание ще се излива върху вассегс сатсна така се лъже че не усещате че ви прави на НН ай големи глупаци и серадва за това че паднахте на клопката
– Ай сиктир бе-през една седмица разработват нови щамове и ги разпространяват по въздух и вакси! Бог да се заеме с тея човекоубийци!
-Няма вирус това са престъпления
– Световните Здравни Боклуци и Техните началници Мулти богатите еврей докато не съсипят цивилизованият свят няма да кротнат да си измислят щамове…
– Започна да ми става смешно, не разбраха ли че хората отдавна не се страхуват
– Тези СЗО са сключили договор с дявола
(Не, нито един не е ироничен. И имаше още стотици такива…)
—-
– Абе човек, едно нещо ми обясни! Ти съвест нямаш ли, бе? Не те ли е срам да гледаш хората в очите и да ги лъжеш и да им загробваш животите?! Че са ти пълнили главата толкова години в тоя ВУЗ с лъжи, това ясно. Промили са ти мозъка, повярвал си тия глупости. Ама толкова години откакто си завършил, как па не видя, че бактериите и вирусите са измислица? Че хората боледуват, понеже твоите авери от правителствата ги ръсят с кемтрейлсове и инжектират с отрови? Нема как да си толкова тъп, не ми ги разправяй тия на мен! Кажи ми, срам и съвест нямаш ли?! Сметка даваш ли си колко хора си вкарал в гроба с тия лъжи, а?! Малко ти е да те застрелят – на парчета трябва да те режат! Да имах власт, знаеш ли какво щях да ви направя всичките до един?!… Ама часът на истината идва, да знаеш! Умните хора, дето не са ни промили мозъка и знаем истината, вече се организираме! Някоя нощ така ще ви подпукаме, че нема и да разберете откъде ви е дошло! Всичките лекари, дето мамите и тровите горкия български народ, ще ви избесим по дърветата!…
(Не, не е пациент с диагноза. Води се психично здрав, ходи където иска, кара кола, гласува. И най-вероятно или скоро ще има, или вече има оръжие…)
—-
– Всичко това с умрелите от Ковид е лъжа! Няма такива! Аз го карах, мои роднини го караха – всичките сме здрави! Изобщо не познавам умрял от него! Ти познаваш ли човек, който да е умрял от Ковид? Не познаваш, нали?
– Познавам над дузина. Няколко от тях ги познаваш и ти. Христо Пощаков, Сашо Карапанчев…
– Не е вярно! Те не умряха от Ковид! Фалшифицирали са им диагнозите! Ти просто не знаеш!
– Абе Пощака вярно, че умря чак в Испания, ама Сашо, като го закарали в Пирогов най-сетне, се опитва да го спаси мой състудент. Така че знам със сигурност от какво почина.
– Лъжат те! Така са им наредили! Иначе ще им отрежат заплатите!
– Хм… А ти откъде имаш информацията, че са починали от друго? И че лекарите лъжат за Ковид? Че им нареждат така, че им режат иначе заплатите? Някакъв надежден източник ли е? Кажи, да знам и аз.
– А, значи и ти си агент на тая мафия? Нормално де, ти и за Украйна отричаш, че нацистите там избиват народа до човек. И лъжеш, че Русия я била нападнала. Я кажи, колко ти плащат, за да разпространяваш тия?…
—-
Случай от гастроентерологично списание:
При 43-годишна жена с улцерозен колит е проведена рутинна колоноскопия. Установени са полипоидни формации с размер до 6 mm. При отстраняването им започва обилно кървене, което налага поставянето на метални клипсове за спиране на кървенето (снимка в коментарите). Не е идентифицирана перфорация на червото. Някои от полипите кървят дори само при докосване с апарата. Колоноскопията бързо е прекратена и изследване на кръвосъсирването показва шокиращи резултати – протромбиново време 139 секунди (нормата е 10 до 15), INR първоначално 8, впоследствие 12 (нормата е 0.9 – 1.2). Чернодробните ензими AST и ALT са повишени до три пъти над горната граница, но пациентът няма чернодробна цироза.
След допълнително разпитване се оказва, че пациентът приема куркума в пет пъти по-висока от “стандартната” доза. Куркумата е популярна съставка в “алтернативни” терапии, включително и за улцерозен колит. Основната активна съставка е куркумин, който удължава протромбиновото време, повишава INR и освен това има антиагрегантен ефект върху тромбоцитите. Всички тези фактори водят до повишен риск от кървене при предозиране с куркума.
Бързото приложение на витамин К и замразена плазма води до спадане на INR до 1.9 в рамките на 24 часа и пациентът е освободен за домашно лечение.
—-
Пратиха ми за преглед служител от ръководството на средно голяма фирма. Работникът имаше рак на простатата, но беше отказал всякакво конвенционално лечение. Първо каза, че не може да си спомни какво лекарство приема и аз цитирах това в доклада си. След това ме помоли да коригирам доклада и ми прати снимки на няколко различни хомеопатични лекарства, общо девет на брой. Редактирах съответно, уточнявайки, че няма доказателства, че хомеопатията е ефективна при онкологично болни и цитирах доказани медицински източници. Това влиза в задълженията ми, тъй като фирмата, за която работи този служител, иска да разбере прогнозата за състоянието му. Той отново оспори доклада ми и възрази срещу факта, че хомеопатичното лекарство е безполезно. Основанието му беше , че ръководството щяло да си помисли, че не се лекува! Преди да се разделим, каза, че възнамерява да пътува за Африка да се лекува там, но като го попитах какво е лечението, каза, че ще се консултира с врачка.
—-
От БГ-Мама (там НЯМАТ изчерпване!):
Ако съм бременна мога ли да гледам порно, без да увредя психиката на детето?
При язва как се приемат живите охлюви?
Всички инвитро деца са вампири! Но още сте твърде невежи, за да го разберете!
Перете ли си заедно гащи и чорапи? Аз даже отделям леви от десни чорапи! И гащите гледам да не се опират предно със задно на два чифта, че току- виж се чифтосали нещо…
Кърмене е имало много преди да има молове. И моловете ги има, защото го е имало кърменето.
Малко глупав въпрос, но…Има ли някаква опасност, когато зъболекарят работи с машинка, когато има гръмотевици?
В Испания има много латинци, които са испаноговорящи.
Това молекулата на палмовата мазнина била с отворена структура и се свързвала с молекулата на човешката мазнина образувайки пластмаса
За да се научиш да свириш на музикален инструмент не се изисква никакъв талант…точно като да хванеш мотиката е!
Паразитите се събират в червата на пълнолуние,за да се размножат.затова прочистването е на пълнолуние.
Допълнение: в зависимост от вида си, паразитите предизвикват няколко влечения – към храна, /много храна, все сте гладни, все не ви стига/, към сладко/шоколад, вафли, бисквити/, към алкохол, към наркотици, към цигари, към кофеин /постоянни кафета през деня/ и към безразборен секс.
Космонавтите дишат точно по определен начин, за да могат да се предпазят от паразитите. Аз лично дишам като тях най-малко по половин час на ден.
Ми не знам какво се води човек, който пие 500 мл. джин на вечер и нищо му няма. Веган ли е?
Можете ли да ми препоръчате такива матки, които наистина са 100% натурални.
Здравейте! Искам да попитам за добър мъжки гениколог в град Варна. Благодаря предварително!
За деца изобщо пък не съм мислил,ама нали има сурикатна майка дето пак можеш да ползваш твойта си сперма и да си направиш твое дете,ква е разликата?
Има някакъв възпалителен процес,пусни си цитонамазка на свлачището.
Месото нямало нито една магическа съставка, която да не можем да намерим в растенията.
Без да засегна нечии майченски авторитет,но именно заради подобни глезотии като гушкане,някои от децата превръщащи се в тинейджъри минават и на съседния бряг,ако ме разбирате за какво говоря.
Детето ми се зарази с едра шарка от яслата. Сложих захар до леглото за да мине по – лесно шарката – за умилостивяване на светицата и „баба Шарка”.
Този тунел, който се „вижда“ преди смъртта, съм чела, че всъщност е гръбначният стълб, от където минава душата и излиза през фонтанелата
На много места пише, че забременяването може да стане до няколко дни след секс. А аз имам чувството, че като стана права и де що има сперматозоиди в мен изпопадват. Те намират ли си някакъв начин да се закрепват в тялото на жената за известно време? Естествено аз не бързам да ставам, но … не мога и да лежа цяла вечност
Това означава ли, че душите ни се намират някъде около задните части?
On April 21, a group of anonymous authors and non-anonymous signatories published a lengthy open letter to the
Nix community
and Nix founder Eelco Dolstra calling for his resignation from the project. They
claimed ongoing problems with the project’s leadership, primarily focusing on the
way his actions have allegedly
undermined people nominally empowered to perform various
moderation and governance tasks. Since its release, the letter has gained
more than 100 signatures.
Security updates have been issued by AlmaLinux (buildah, go-toolset:rhel8, golang, java-11-openjdk, java-21-openjdk, libreswan, thunderbird, and tigervnc), Debian (chromium, emacs, frr, mediawiki, ruby-rack, trafficserver, and zabbix), Fedora (chromium, grub2, python-idna, and python-reportlab), Mageia (chromium-browser-stable, firefox, opencryptoki, and thunderbird), Red Hat (container-tools:4.0, container-tools:rhel8, git-lfs, and shim), SUSE (frr, java-11-openjdk, java-1_8_0-openjdk, kernel, pdns-recursor, and shim), and Ubuntu (apache2, cpio, curl, glibc, gnutls28, less, libvirt, and pillow).
It’s an established practice for development teams to build deployment pipelines, with services such as AWS CodePipeline, to increase the quality of application and infrastructure releases through reliable, repeatable and consistent automation.
Automating the deployment process helps build quality into our products by introducing continuous integration to build and test code as early as possible, aiming to catch errors before they reach production, but with all the best will in the world, issues can be missed and not caught until after a production release has been initiated.
“Implement an automatic rollback strategy to enhance system reliability and minimize service disruptions. The strategy should be defined as a proactive measure in case of an operational event, which prioritizes customer impact mitigation even before identifying whether the new deployment is the cause of the issue.”
When release problems occur, pressure is put on teams to fix the issue quickly which can be time consuming and stressful. Is the issue related to code in the last change? Has the environment changed? Should we manually fix-forward by urgently fixing the code and re-releasing?
AWS CodePipeline recently added a stage level rollback feature that enables customers to recover from a failed pipeline quickly by processing the source revisions that previously successfully completed the failed stage.
In this blog post I will cover how the rollback feature can be enabled and walk through two scenarios to cover both automatic and manual rollbacks.
AWS CodePipeline
AWS CodePipeline is a fully managed continuous delivery service that helps you automate your release pipelines for fast and reliable application and infrastructure updates.
Figure 1. AWS CodePipeline orchestration stages
CodePipeline has three core constructs:
Pipelines – A pipeline is a workflow construct that describes how software changes go through a release process. Each pipeline is made up of a series of stages.
Stages – A stage is a logical unit you can use to isolate an environment and to limit the number of concurrent changes in that environment. Each stage contains actions that are performed on the application artifacts.
Actions – An action is a set of operations performed on application code and configured so that the actions run in the pipeline at a specified point.
A pipeline execution is a set of changes released by a pipeline. Each pipeline execution is unique and has its own ID. An execution corresponds to a set of changes, such as a merged commit or a manual release of the latest commit.
Enable Automatic rollbacks
Automatic rollbacks can be enabled at the stage level within V2 type pipelines. When automatic rollbacks are enabled on a stage that has failed, CodePipeline will automatically select the source revisions from the most recent pipeline execution that successfully completed the stage and initiate the rollback.
Enabling automatic rollbacks can be set on V2 pipeline creation by selecting Configure automatic rollback on stage failure on a given stage, as per Figure 2 below.
Figure 2. Enable automatic rollback feature on pipeline creation
Automated rollbacks can be enabled for any stage, except the “Source” stage.
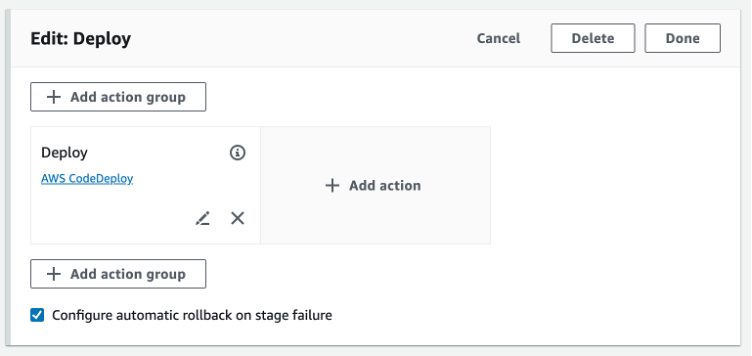
For existing V2 pipelines, Automatic rollbacks can also be toggled by editing a stage and toggling Configure automatic rollback on stage failure, see Figure 3 below.
Figure 3. Enable automatic rollback feature on an existing pipeline
Enabling automatic rollback on an existing pipeline will change the pipeline configuration which means pipeline executions before this step will not be considered an eligible pipeline execution. Only successful pipeline executions from this point onwards will be able to be considered for a rollback.
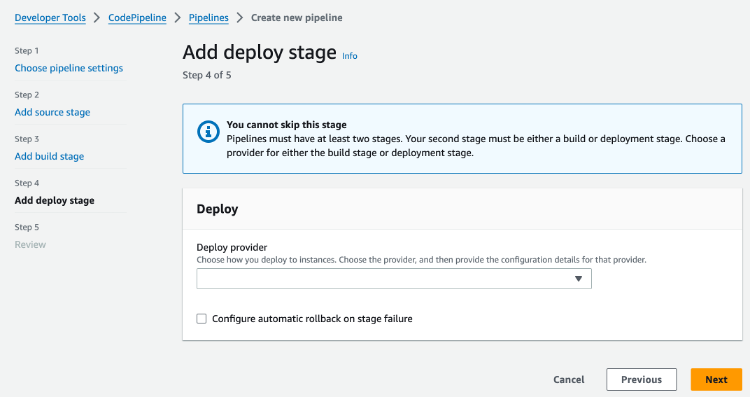
Ensure a V2 pipeline type is selected when creating the pipeline
When in the add deploy stage, select Configure automatic rollback on stage failure
Once the pipeline has been created, it should complete its first run within a few minutes.
Figure 4. Simple pipeline (S3 bucket)
Now I am going to simulate a deployment failure, and this is how:
Locate and un-zip either SampleApp_Windows.zip or SampleApp_Linux.zip depending on which server instances was selected when following the CodePipeline tutorial.
The pipeline will trigger again after the new archive is uploaded and after a few minutes the deployment will report a stage failure and trigger an automatic rollback on the “Deploy” stage.
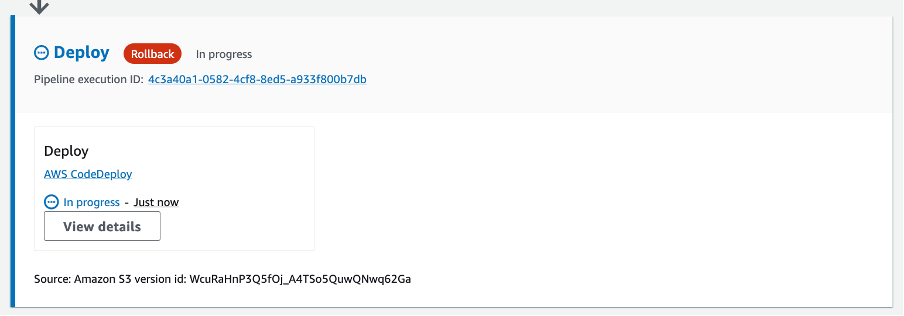
It’s possible to observe the Rollback as it re-deploys the last successful pipeline execution, initially showing a status of “In-progress” as per Figure 5 below:
Figure 5. Rollback in-progress
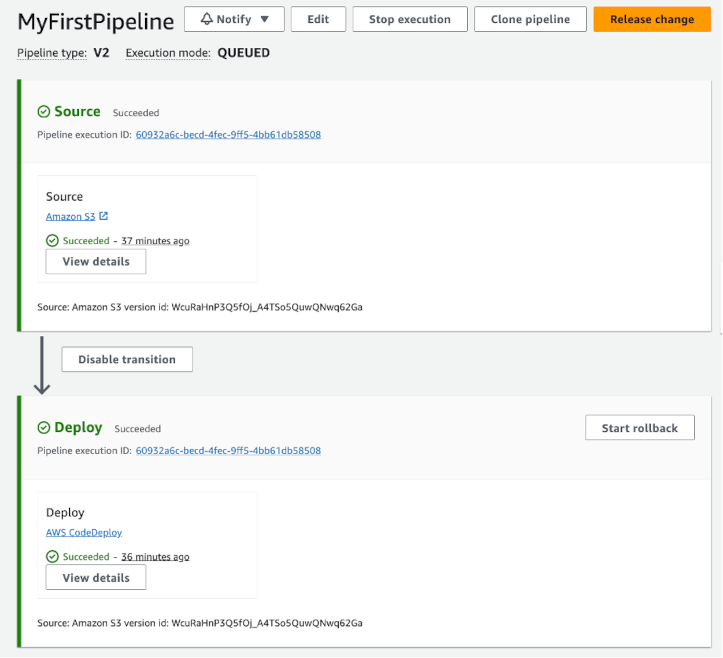
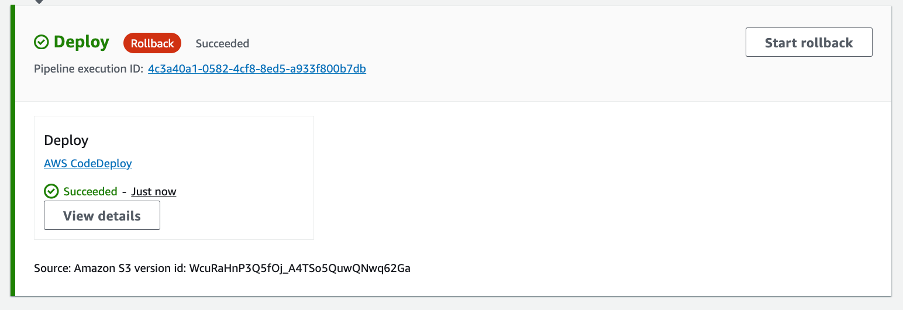
A new pipeline execution ID can be seen in the stage with the source revisions from the previous successfully completed pipeline execution. After a few minutes the rollback will be marked as “Succeeded”:
Figure 6. Rollback Succeeded
Note that the rollback started a new Pipeline execution ID but it used the artifacts and variables from the prior successful pipeline execution.
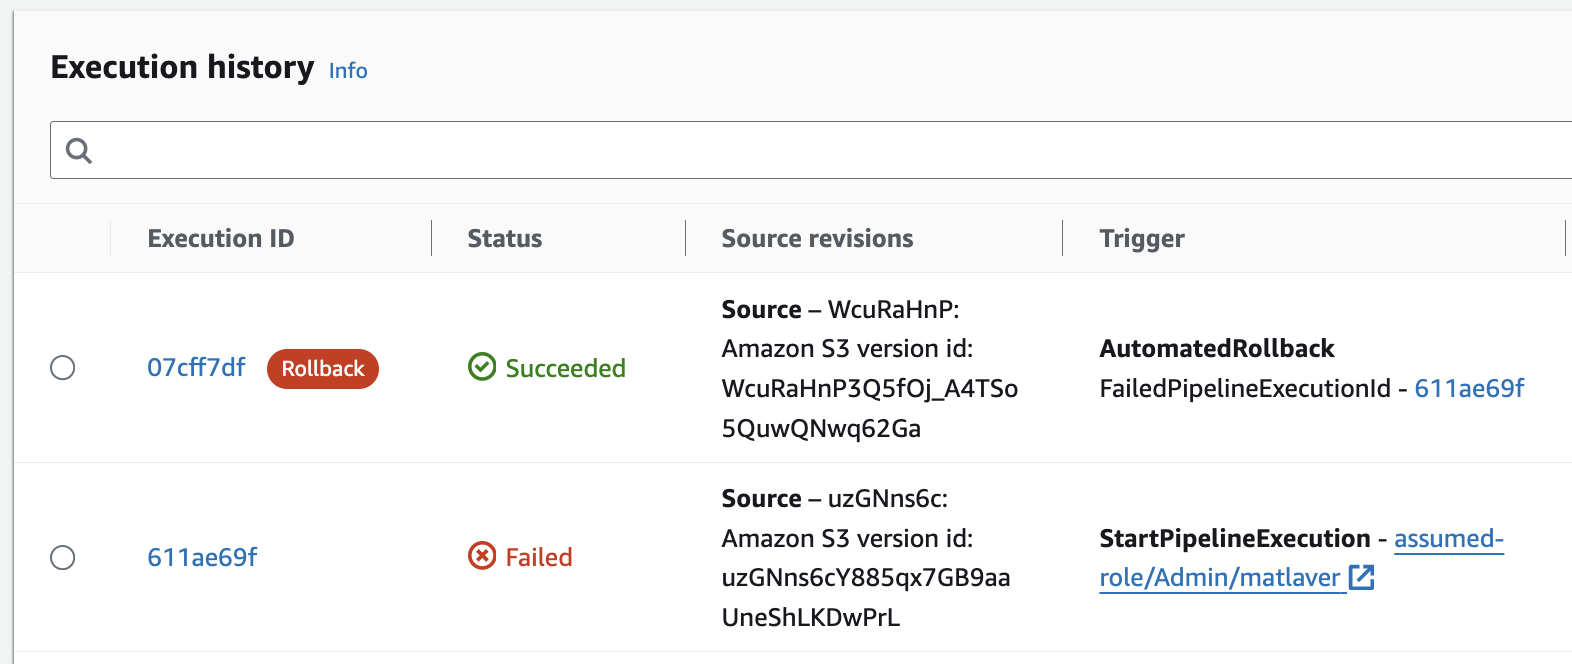
With our production systems back in a healthy state, I can begin the investigations into why the deploy failed, the execution history, see Figure 7 below, shows the failed execution and allows the Execution ID to be inspected for more details on the failure.
Figure 7. Execution history showing the failed pipeline execution.
Note that the Trigger column also reports the FailedPipelineExecutionId, we can use the provided link to start investigating the failure.
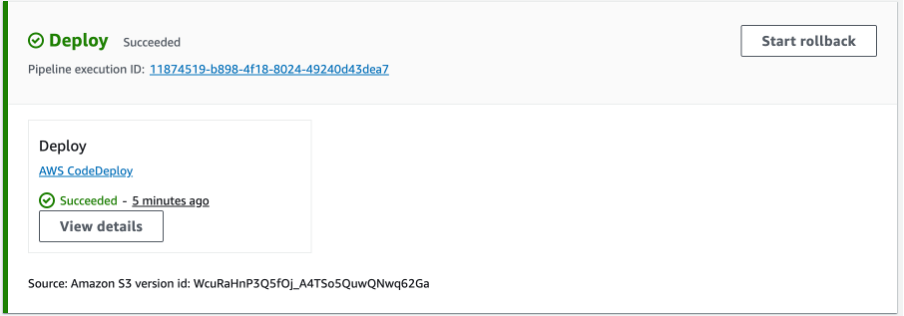
Example 2 – Manual Rollbacks
There may be cases where the pipeline release was successful but it caused application errors such as errors in logs and infrastructure alarms. In these scenarios a manual rollback can be initiated via the Start rollback button.
Figure 8. Start rollback
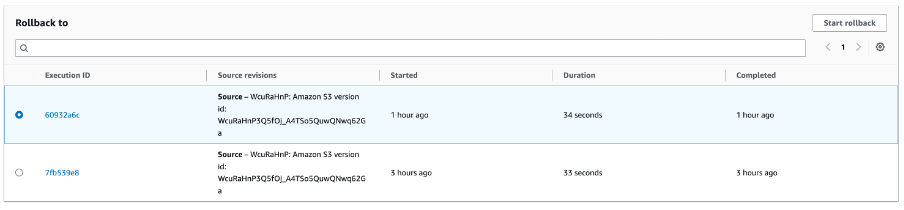
When manually triggering a rollback, it is possible to select a specific Execution ID and Source revision to re-deploy:
Figure 9. Select Execution ID
Selecting Start rollback will create a new Pipeline execution in the stage with the selected source revisions.
Clean up
Instructions on how to clean up the resources created in this blog can be found in the last step of the tutorial used to create the pipeline: Step 7: Clean up resources.
Conclusion
The absence of a rollback strategy can lead to prolonged service disruptions and compatibility issues. Introducing an automatic rollback mechanism to stages within a release pipeline can reduce downtime, maintain system reliability and can help return to a stable state in the event of a fault. Having a rollback plan for deployments, without any disruption for our customers, is critical in making a service reliable. Explicitly testing for rollback safety eliminates the need to rely on manual analysis, which can be error-prone.
To learn more about CodePipeline rollbacks, visit https://docs.aws.amazon.com/codepipeline/latest/userguide/stage-rollback.html.
Robert McQueen has posted a message
from the GNOME Foundation board describing the current financial
situation, plans to improve it, and an increase in the size of the board.
The Foundation has a reserves policy which specifies a minimum
amount of money we have to keep in our accounts. This is so that if
there is a significant interruption to our usual income, we can
preserve our core operations while we work on new funding
sources. We’ve now “hit the buffers” of this reserves policy,
meaning the Board can’t approve any more deficit budgets – to keep
spending at the same level we must increase our income.
Cloudflare’s network spans more than 310 cities in over 120 countries, where we interconnect with over 13,000 network providers in order to provide a broad range of services to millions of customers. The breadth of both our network and our customer base provides us with a unique perspective on Internet resilience, enabling us to observe the impact of Internet disruptions. Thanks to recently released Cloudflare Radar functionality, this quarter we have started to explore the impact from a routing perspective, as well as a traffic perspective, at both a network and location level.
The first quarter of 2024 kicked off with quite a few Internet disruptions. Damage to both terrestrial and submarine cables caused problems in a number of locations, while military action related to ongoing geopolitical conflicts impacted connectivity in other areas. Governments in several African countries, as well as Pakistan, ordered Internet shutdowns, focusing heavily on mobile connectivity. Malicious actors known as Anonymous Sudan claimed responsibility for cyberattacks that disrupted Internet connectivity in Israel and Bahrain. Maintenance and power outages forced users offline, resulting in observed drops in traffic. And in a more unusual turn, RPKI, DNS, and DNSSEC issues were among the technical problems that disrupted connectivity for subscribers across multiple network providers.
As we have noted in the past, this post is intended as a summary overview of observed disruptions, and is not an exhaustive or complete list of issues that have occurred during the quarter.
Cable cuts
Moov Africa Tchad
Reported fiber optic cable damage that occurred in Cameroon on January 10 further disrupted connectivity for customers of AS327802 (Moov Africa Tchad / Millicom) a telecommunications provider in Chad. According to a (translated) Facebook post from Moov Africa Tchad, “On the afternoon of January 10, 2024, there was a breakdown of the internet due to a cut in the optical fiber coming from Cameroon through which Chad has access to the internet, the one coming from Sudan being unavailable for a while.” It is unclear whether the referenced cable cut occurred in Cameroon or Chad, and the mentioned Sudan cable issue may be the one covered in our Q4 2023 summary post. As a landlocked country, Chad is dependent on terrestrial Internet connections to/through neighboring countries, and the AfTerFibre cable map illustrates Chad’s reliance on limited cable paths through Cameroon and Sudan.
The graphs below show that Moov Africa Tchad traffic was disrupted for over 12 hours starting midday (UTC) on January 10, and the disruption was visible at a country level as well. The fiber cut also resulted in significant volatility from a routing perspective, as the volume of announced IPv4 address space shifted frequently at a network and country level during the disruption.
On February 15, a brief (~30 minute) but complete significant Internet disruption was observed at AS37577 (Orange Burkina Faso). According to the translation of a communiqué posted by the provider on social media, “The incident is due to a fiber cut, which causes a disruption of Internet services for certain customers.” Orange did not specify whether it was a more localized fiber cut, or damage to one of the terrestrial fibers that cross the country. The incident took the network completely offline, as the ASN’s amount of announced IPv4 address space dropped to zero for the duration.
MTN Nigeria
MTN Nigeria turned to social media on February 28 to let customers know that “You have been experiencing challenges connecting to the network due to a major service outage caused by multiple fibre cuts, affecting voice and data services.” A published report described the impact, noting “Millions of customers nationwide were impacted by the hours-long outage, especially in Lagos.” Connectivity was disrupted for approximately seven hours between 13:30 – 20:30 local time (12:30 – 19:30 UTC), and the provider posted a followup note just before midnight local time stating that service had been fully restored.
Digicel Haiti
A 16-hour Internet disruption on March 2/3 at AS27653 (Digicel Haiti) was due to a double fiber cut as a result of violence related to attempts to oust Prime Minister Ariel Henry. Starting around 22:00 local time on March 2 (03:00 on March 3), a complete outage was observed for approximately nine hours. Some recovery in traffic occurred for approximately two-and-a-half hours, followed by a three hour near-complete disruption. Digicel Haiti effectively disappeared from the Internet during the nine-hour outage, as no IPv4 or IPv6 address space was announced by the network during that time.
SKY (Philippines)
A brief traffic disruption observed on AS23944 (SKY) in the Philippines on March 18 was likely related to a fiber cut. In an advisory posted by SKY on social media, they stated that “SKY services in several areas in Marikina, Pasig and Quezon City are currently affected by a cut-fiber issue”, listing 45 affected areas. Traffic was most significantly impacted between 20:00 – 21:00 local time (12:00 – 13:00 UTC), although full recovery took several more hours. Only a minor impact to routing resulting from the fiber cut was observed.
Multiple African countries
On March 14, damage to multiple submarine cables off the west coast of Africa impacted Internet connectivity across multiple countries in West and Southern Africa. The damage was reportedly caused by underwater rock falls, and in addition to disrupting Internet connectivity, also caused availability issues for Microsoft Azure and Office 365 cloud services.
Comparatively brief disruptions were observed in Niger, Guinea, and Gambia, lasting from under an hour to approximately two hours.
However, the disruptions stretched out across multiple days in countries including Togo, Liberia, and Ghana, where it took several weeks for traffic to return to previously observed peak levels.
Operators in impacted countries attempted to maintain availability by shifting traffic to Google’s Equiano submarine cable, which reportedly experienced a 4x increase in traffic, and Morocco’sMaroc Telecom West Africa submarine cable. Service on the SAT-3 cable was fully restored as of April 6, with repairs on ACE completed on April 17, repairs to WACS and MainOne expected to be done by April 28.
On February 24, three submarine cables that run through the Red Sea were damaged: the Seacom/Tata cable, the Asia Africa Europe-1 (AAE-1), and the Europe India Gateway (EIG). It is believed that the cables were cut by the anchor of the Rubymar, a cargo ship that was damaged by a ballistic missile on February 18. At the time of the disruption, Seacom confirmed the damage to their cable, while the owners of the other two cables did not publish similar confirmations.
On February 2, Cloudflare observed a loss of traffic at AS15706 (Sudatel) and AS36972 (MTN Sudan), with a similar loss occurring on February 7 at AS36998 (Zain Sudan / SDN Mobitel). The disruption at MTN Sudan aligns with a social media post from the provider, in which they stated (translated) “We regret the interruption of all services due to circumstances beyond our control. While we apologize for the inconvenience caused by this interruption, we assure you of our endeavor to restore the service as soon as possible, and you will be notified of the return of the service.” On February 5, several days after their outage started, Zain Sudan published a social media post that stated (translated) “Zain Sudan has been constantly striving to maintain communication and Internet service to serve its valued subscribers, and we would like to point out that the current network outage is due to circumstances beyond its control, with our hopes that safety will prevail, and that service will be restored as soon as possible.” Sudatel did not share any information about the status of its network. On February 4, Digital Rights Lab – Sudan posted on social media that “Our sources confirmed that @RSFSudan forces tookover data centers of ISPs in Khartoum, #Sudan.” It is likely that the Internet outages observed across these providers are related to these takeovers, part of the military conflict that has been underway in the country since April 15, 2023.
The disruptions on these networks varied in length. At Sudatel, traffic started to return on February 11. At Zain Sudan, traffic began to return on March 3, corroborated by a social media post that stated (translated) “Zain network is gradually returning to work and allows its subscribers to communicate for free for a limited time. Zain promises to continue working to restore its network in the rest of the states.” Traffic had not yet returned on MTN Sudan by the end of the first quarter.
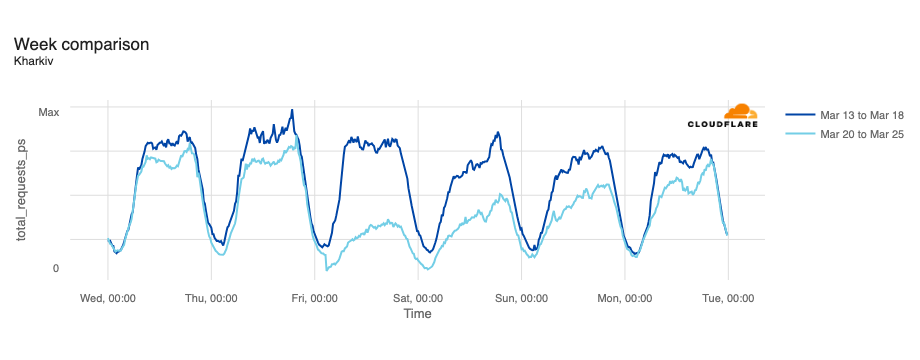
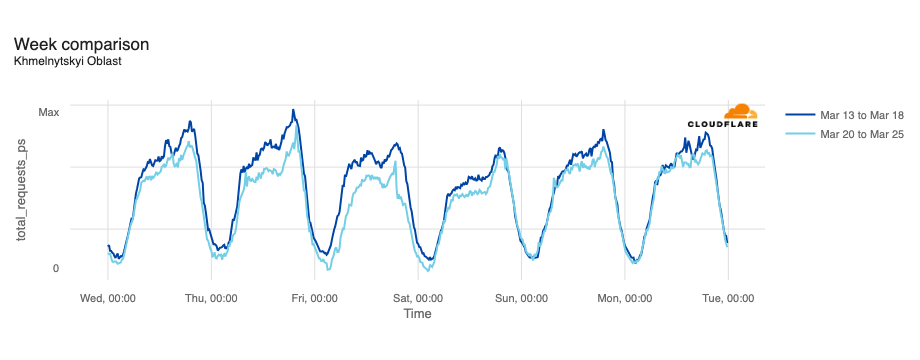
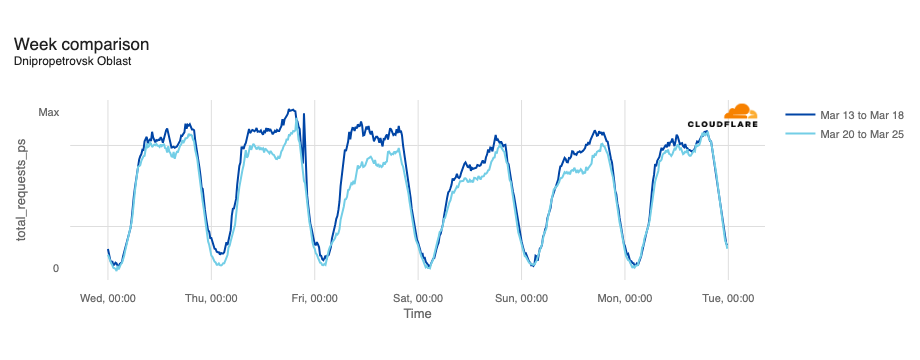
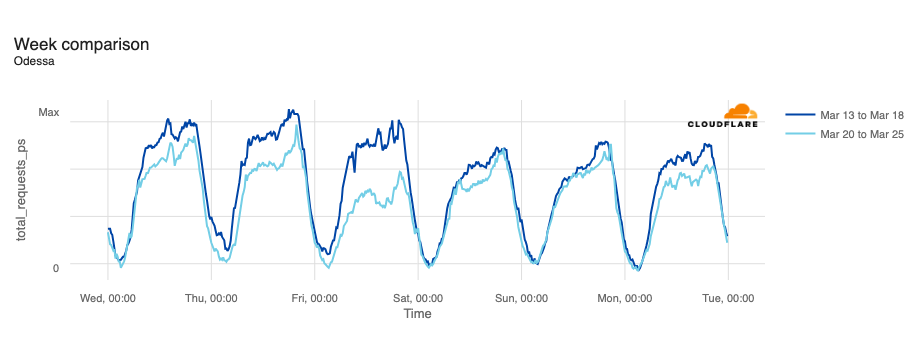
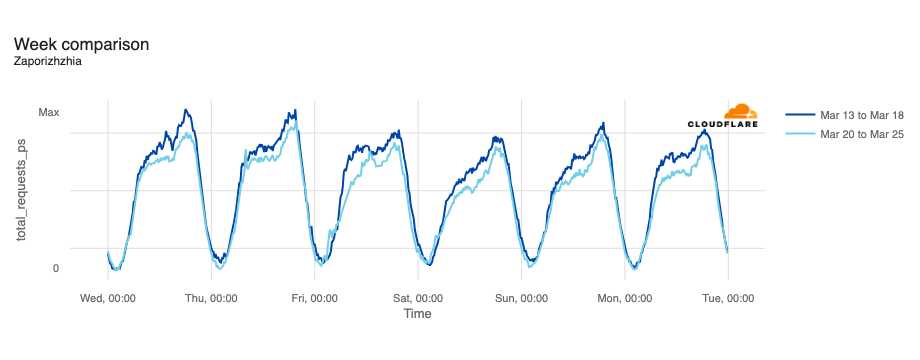
Ukraine
In February, the Ukraine/Russia war reached the two-year mark, and over that time, we have covered a number of Internet outages in Ukraine caused by conflict-related attacks. On February 22, Russian air strikes on critical infrastructure in Ukraine damaged energy facilities across the country, resulting in widespread power outages. These power outages caused Internet disruptions across multiple regions in Ukraine, including Kharkiv, Zaporizhzhia, Odessa, Dnipropetrovsk Oblast, and Khmelnytskyi Oblast. Traffic initially dropped around 05:00 local time (03:00 UTC), falling as much as 68% in Kharkiv. However, all regions saw lower traffic levels for several days as compared to the week before.
The associated outages during the quarter varied in length, from just a few hours to over a week. Each outage is shown in the graphs below, which show Paltel traffic within four Palestinian governorates in the Gaza Strip region. While it appears that the Gaza governorate suffered a disruption to traffic as connectivity remained available, complete outages occurred in the Khan Yunis, Rafah, and Deir al-Balah governorates.
January 12-19
January 22-24
March 5
Cyberattacks
In addition to the previously discussed cyberattack that impacted connectivity for AS327802 (Moov Africa Tchad / Millicom) on January 11, several other observed Internet disruptions were caused by cyberattacks in the first quarter.
Anonymous Sudan also reportedly targeted AS31452 (Zain Bahrain) with a cyber attack. This attack appeared to be less severe than the one that targeted HotNet in Israel, but it also lasted significantly longer, with traffic disrupted between 20:45 on March 3 and 18:15 on March 4 local time (17:45 on March 3 to 15:15 on March 4 UTC). No impact to announced IP address space was observed. Zain Bahrain acknowledged the connectivity disruption in a social media post on March 4, noting (translated) “We would like to inform you that some customers may encounter difficulties in using some of our services. Our technical team works to avoid these difficulties as quickly as possible.”
Multiple networks in Ukraine
On March 13, an attack targeted a number of Ukrainian telecommunications providers, including AS16066 (Triangulum), AS34359 (Link Telecom Ukraine), AS197522 (Kalush Information Network), AS52074 (Mandarun), and AS29013 (LinkKremen). Triangulum appeared to be the most significantly impacted, experiencing a near complete loss of traffic between March 13 and March 20, as seen below. Triangulum posted a notice on its website, noting in part “On March 13, 2024, a hacker attack was carried out on a number of Ukrainian providers. At 10:28 a.m. on March 13, 2024, a large-scale technical failure occurred on our Company’s network, as a result of which it became impossible to provide electronic communication services. The Company’s employees, together with employees of the Cyber Police and the National Cyber Security Coordination Center, are taking comprehensive measures around the clock aimed at restoring the entire range of services as soon as possible. Services are being restored gradually. Full recovery may take several days.”
Other affected providers experienced comparatively shorter connectivity disruptions. The near complete outage at Mandarun lasted approximately a day, while the others saw outages lasting around seven hours, starting around 11:30 local time (09:30 UTC) on March 13, with connectivity returning to typical levels around 08:00 local time (06:00 UTC) on March 14.
Government directed
Comoros
Following protests against the re-election of President Azali Assoumani, authorities in Comorosreportedly shut down Internet connectivity on January 17. While some disruption was visible to traffic at a country level between 12:00 local time on January 17 (09:00 UTC) and 17:30 local time on January 19 (14:30 UTC), it was significantly more noticeable in the traffic from AS36939 (Comores Telecom), which saw several periods of near-complete outage across the two-day span. Although Comores Telecom announces a limited amount of IPv4 address space, it saw significant volatility on January 17 & 18, dropping to zero several times.
Sudatel Senegal/Expresso Telecom and Tigo/Free (Senegal)
On February 4, the Minister of Communication, Telecommunications, and Digital Affairs in Senegalordered the suspension of mobile Internet connectivity starting at 22:00 local time (22:00 UTC). The suspension followed protests that erupted in the wake of the postponement of the presidential election. Traffic from AS37196 (Sudatel Senegal/Expresso Telecom) fell sharply at the time the suspension went into effect, recovering around 07:30 local time (07:30 UTC) on February 7. Traffic from AS37649 (Tigo/Free) fell at around 09:30 local time (09:30 UTC) on February 5, with the provider notifying subscribers of the suspension via social media. Traffic on Tigo/Free recovered around midnight local time (00:00 UTC) on February 7, and the provider again used social media to inform subscribers of service availability. No changes were observed to announced IP address space for either provider, indicating that the suspension of mobile Internet connectivity was not done at a routing level.
A little more than a week later, on February 13, the government in Senegal again ordered the suspension of mobile Internet connectivity in an effort to prevent “the spread of hateful and subversive messages online.” ahead of a march planned by activist groups which aimed to express dissent against the postponement of the presidential election. The mobile Internet shutdown was most visible on Tigo/Free, which saw a significant disruption between 10:15 and 19:45 local time (10:15 – 19:45 UTC).
Pakistan
According to a published report, The Pakistan Telecommunication Authority (PTA) said that Internet services would remain available as citizens went to the polls on February 8 to elect a new government. However, on that day, Pakistani authorities cut mobile Internet access across the country as the nation’s voters went to cast their ballots, with the authorities attributing the move “to maintain law and order” in the wake of the violence that occurred the previous day. The impact of the ordered shutdown was visible across multiple Internet providers in Pakistan, including AS59257 (Zong/CMPak), AS24499 (Telenor Pakistan), and AS45669 (Jazz/Mobilink), lasting from 07:00 until 20:00 (02:00 – 15:00 UTC), with traffic returning to expected levels approximately nine hours later. A post on the Internet Society’s Pulse blog estimated that the shutdown cost Pakistan nearly USD $18.5M in lost Gross Domestic Product.
Chad
Several Internet disruptions were observed in Chad between February 28 and March 7. The first one started at 10:45 local time on February 28 and lasted until 18:00 local time on March 1 (09:45 on February 28 – 17:00 on March 1). Shorter disruptions lasting just a few hours each were also observed on March 3, 4, and 7. The apparent shutdowns came in the wake of political violence in the country. Notable drops in announced IPv4 address space aggregated across networks in the country were observed coincident with the February 28, March 3, and March 4 shutdowns, although it isn’t clear why a similar drop did not occur on March 7.
Power outages
Tajikistan
According to a published report, a widespread multi-hour power outage occurred in Tajikistan on March 1, possibly related to increased electricity usage by electric heaters as temperatures across the country neared freezing. The outage began around 11:00 local time (06:00 UTC), and lasted for approximately three hours. The impact on Internet traffic from the country is visible in the graph below. Although power was restored around 14:00 local time (09:00 UTC), Internet traffic did not return to expected levels until around 05:00 local time the next day (midnight UTC on March 2).
Although power outages most often have the biggest impact on Internet traffic, as computers and home/office routers shut down, this outage also appeared to impact network infrastructure within the country, as the aggregate volume of announced IPv4 address space across the country dipped slightly when the power was out.
Tanzania
On March 4, the Tanzania Electricity Corporation (TANESCO)posted a notice on social media regarding an ongoing power outage. It stated (translated) “The Tanzania Electricity Corporation (TANESCO) has notified the public that there has been an error in the National Grid system, resulting in a lack of electricity service in some areas of the country including Zanzibar. Our experts are continuing their efforts to ensure that the electricity service returns to its normal state. The organization apologizes for any inconvenience caused.” The power outage disrupted Internet connectivity in Tanzania, causing an observed drop in traffic between 13:30 and 23:00 local time (10:30 – 20:00 UTC).
Technical problems
Orange España
Network routing is the process of selecting a path across one or more networks, and on the Internet, routing relies on the Border Gateway Protocol (BGP). Historically, the exchange of BGP routing information was based on trust between providers, but over time, security mechanisms such as Resource Public Key Infrastructure (RPKI) have been developed to prevent abuse of the system by bad actors. RPKI is a cryptographic method of signing records that associate a BGP route announcement with the correct originating AS number. ROA (Route Origin Authorization) records provide a means of verifying that an IP address block holder has authorized an AS (Autonomous System) to originate routes to that one or more prefixes within the address block. Cloudflare has published a number of blog posts over the years about the importance of, and our support for, RPKI. Properly implemented and configured, RPKI and ROAs help support routing security, effectively preventing behavior like BGP hijacking.
Because Cloudflare enforces RPKI validation, we also rejected the RPKI-invalid routes. We would have started trying to reach Orange España over our default route toward some of our transit providers, but because they also perform RPKI validation, traffic would have been dropped within those provider networks as well. Because of this, from Cloudflare’s perspective, this incident caused a drop in traffic from Orange España between 16:45 and 19:45 local time (14:45 – 17:45 UTC) as well as a notable drop in announced IPv4 address space from AS12479.
On January 11, subscribers of AS34700 (MaxNet) in Ukraine experienced a nine-hour Internet outage. Initial traffic loss occurred around 16:00 local time (14:00 UTC), and recovered around 01:00 local time on January 12 (23:00 UTC on January 11). An initial social media post from the provider explained the reason for the outage, noting (translated) “Dear subscribers! Due to the flooding of one of the hub sites due to a utility malfunction, some areas of the city may be without services, partially or completely. We are doing our best to restore services, but it takes time. Further information regarding the opening times will be published as soon as the emergency works have been completed.” A subsequent post informed subscribers that Internet connectivity had been restored. The flooding apparently impacted core routing infrastructure as well, as the volume of IPv4 address space announced by MaxNet also fell to zero between 16:00 and 22:00 local time (14:00 – 20:00 UTC).
Plusnet (United Kingdom)
A traffic disruption observed on AS6871 (Plusnet) in the United Kingdom on January 15 was initially characterized as a “mass outage” by the provider in replies to customer complaints on social media. However, the underlying cause of the disruption turned out to be significantly less sensational – it was apparently linked to problems with their DNS servers. Because subscribers were unable to successfully resolve hostnames using Plusnet’s default DNS resolvers, this ultimately manifested itself as a drop in traffic from the network for approximately two hours, between 16:00 and 18:00 local time (and UTC). Users that had configured their systems to use a third-party DNS resolver, such as Cloudflare’s 1.1.1.1 service, did not experience a service disruption.
Russia
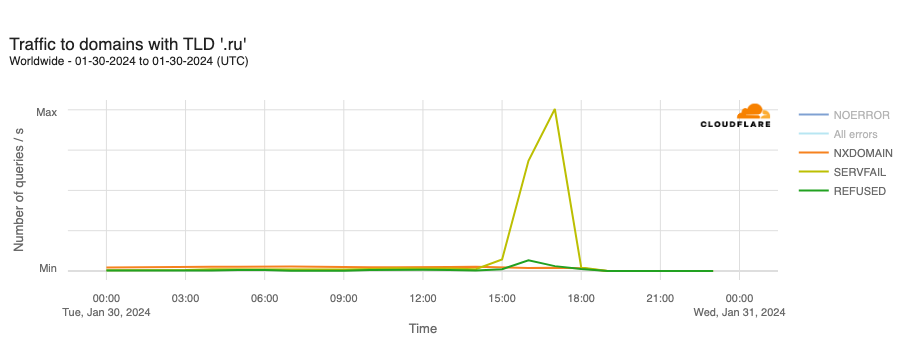
DNS issues also impacted users in Russia during January, though in a different way than Plusnet subscribers in the UK experienced. A reportedDNSSEC failure on January 30 resulted in .ru domains becoming inaccessible for several hours. (DNSSEC creates a secure domain name system by adding cryptographic signatures to existing DNS records. By checking its associated signature, you can verify that a requested DNS record comes from its authoritative name server and wasn’t altered en-route, as opposed to a fake record injected in a man-in-the-middle attack.)
The DNSSEC validation failure resulted in SERVFAIL responses to DNS lookups against Cloudflare’s 1.1.1.1 resolver for hostnames in the .ru country code top level domain (ccTLD). At peak, 68.4% of requests received SERVFAIL responses. The Coordination Center for the .ru ccTLD confirmed that it was working on the “technical problem affecting the .ru zone associated with the global DNSSEC infrastructure” but didn’t provide any additional details around the root cause of the problem, such as a potential issue with a DNSSEC key rollover. The .ru ccTLD experienced a similar DNSSEC-related outage for several hours on August 16, 2019, as well.
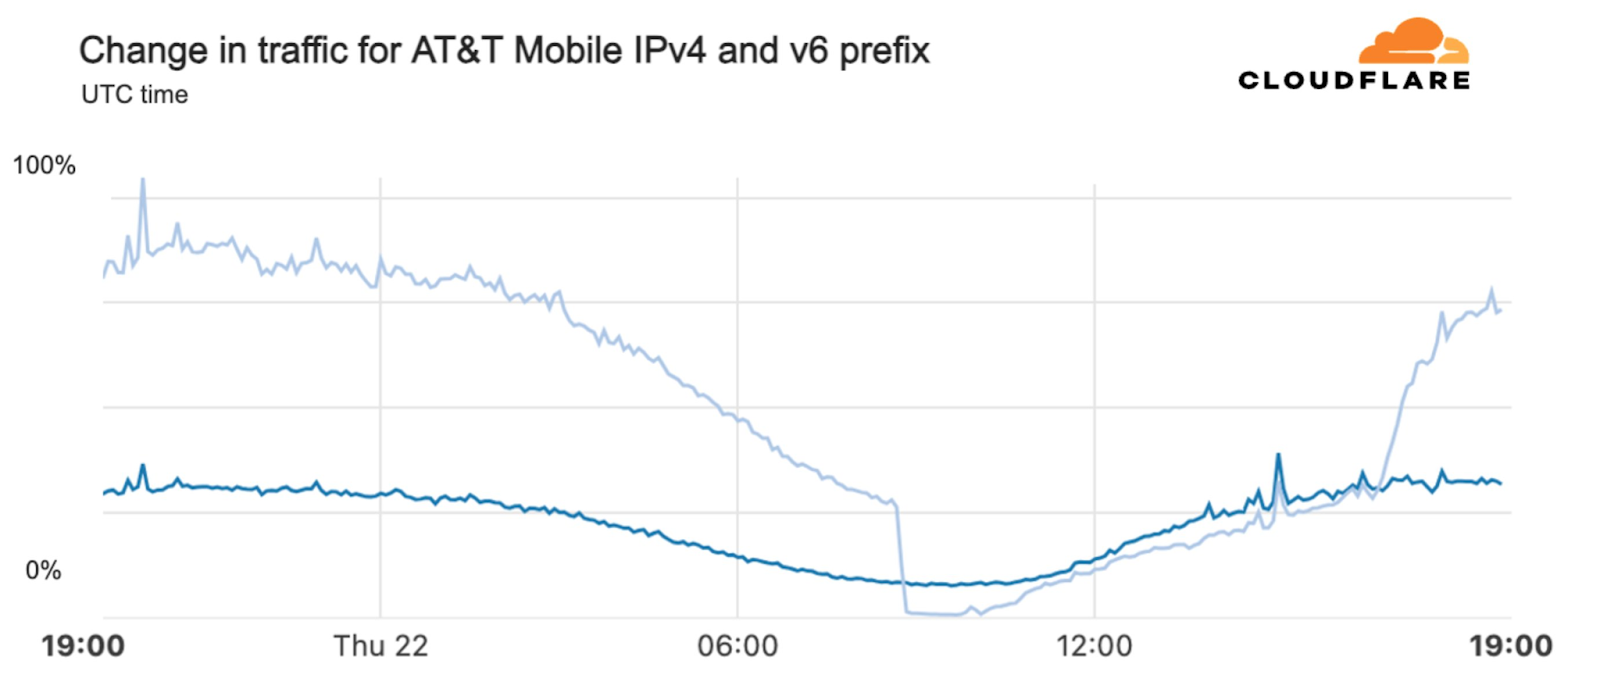
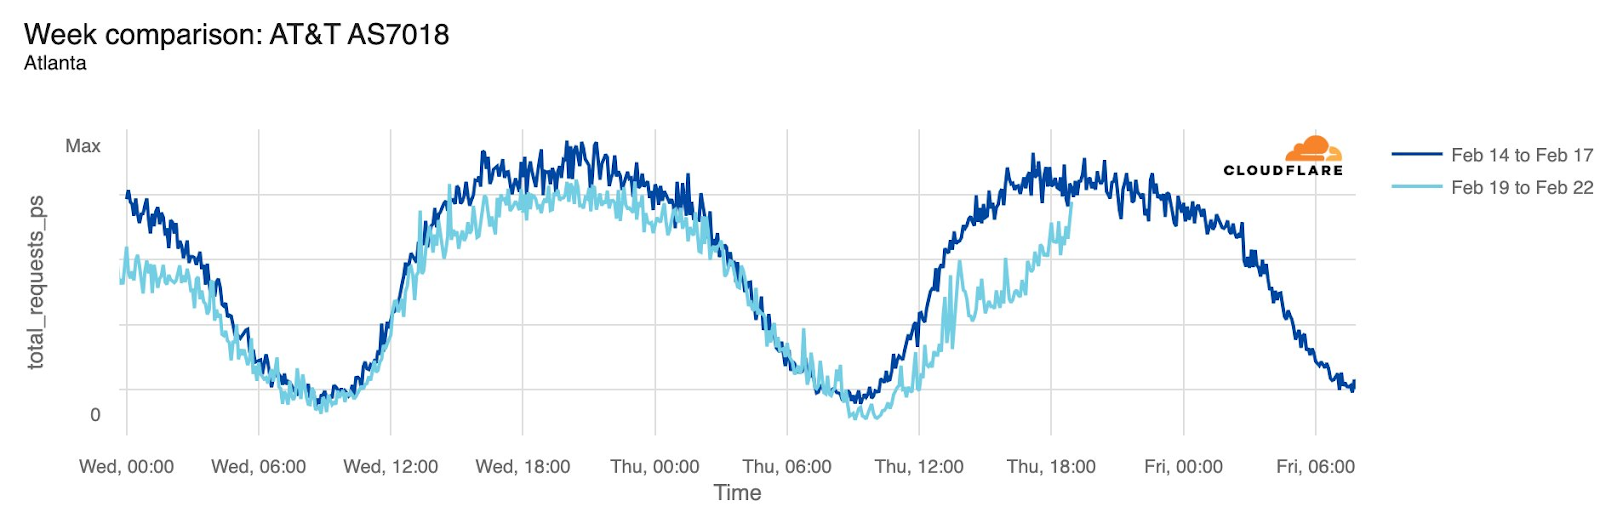
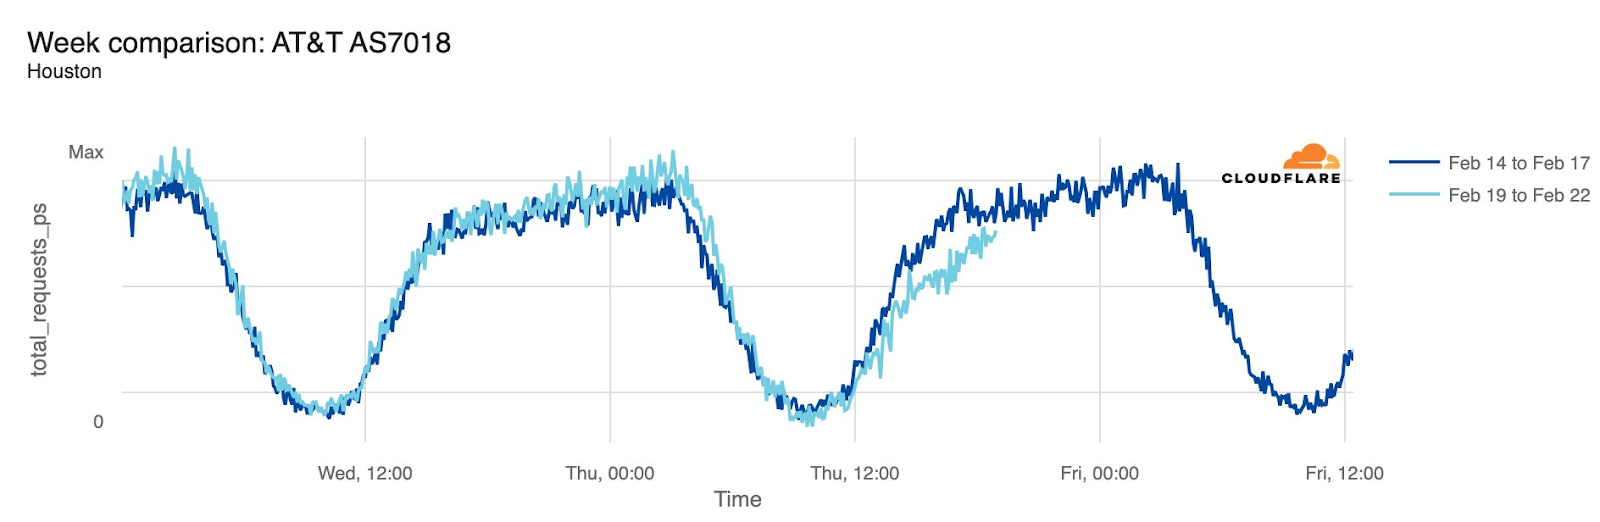
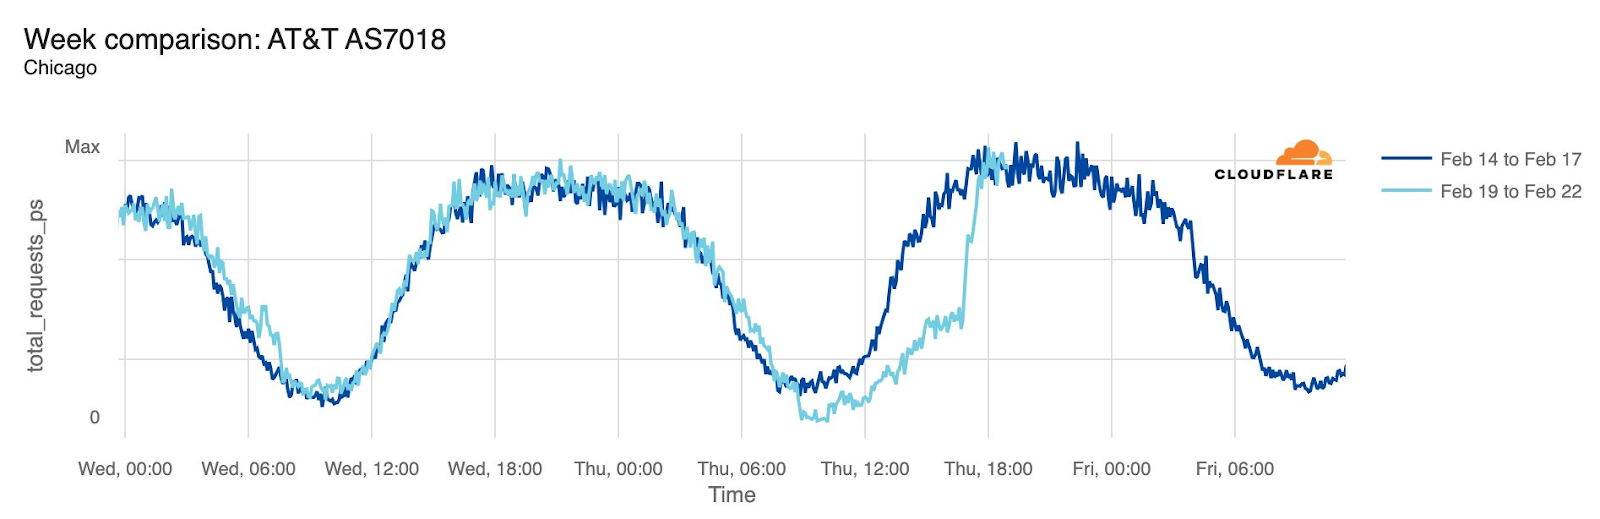
AT&T (United States)
Starting just before 04:00 Eastern / 03:00 Central (09:00 UTC) on February 22, AT&T subscribers in several cities across the United States experienced mobile service interruptions. Impacted cities included Atlanta, Houston, and Chicago, with connectivity disrupted for approximately eight hours. Cloudflare data showed that as the problem began, AT&T (AS7018) traffic dropped as much as 45% in Chicago and 18% in Dallas, as compared with the previous week.
According to a “network update” published by AT&T, “Based on our initial review, we believe that today’s outage was caused by the application and execution of an incorrect process used as we were expanding our network, not a cyber attack.”
Just before noon local time (05:15 UTC) on March 12, a significant drop in traffic was observed on AS136442 (Ocean Wave), a consumer fiber and business Internet service provider in Myanmar. A (translated) social media post from the provider noted “Ocean Wave customers, please be informed that there will be no internet/ slow connection due to network maintenance.” The connectivity disruption lasted approximately seven hours, with traffic returning to typical levels just before 19:00 local time (12:15 UTC).
Conclusion
Two notable submarine cable damage events during the first quarter again highlighted the importance of protecting submarine cables, and the risks associated with them passing through/near geopolitically sensitive areas. Given the reliance on submarine cables for carrying Internet traffic, this will continue to be an issue for many years to come.
The Orange España incident also shed light on the importance of securing operationally important resources with multi-factor authentication, a topic that Cloudflare has written about in the past. Organizations like RIPE play a critically important behind-the-scenes role in functioning of the Internet, arguably obligating them to take all practical precautions when it comes to securing their systems in order to prevent malicious actors from taking actions that could broadly disrupt Internet connectivity.
To provide the best experiences, we use technologies like cookies to store and/or access device information. Consenting to these technologies will allow us to process data such as browsing behavior or unique IDs on this site. Not consenting or withdrawing consent, may adversely affect certain features and functions.
Functional
Always active
The technical storage or access is strictly necessary for the legitimate purpose of enabling the use of a specific service explicitly requested by the subscriber or user, or for the sole purpose of carrying out the transmission of a communication over an electronic communications network.
Preferences
The technical storage or access is necessary for the legitimate purpose of storing preferences that are not requested by the subscriber or user.
Statistics
The technical storage or access that is used exclusively for statistical purposes.The technical storage or access that is used exclusively for anonymous statistical purposes. Without a subpoena, voluntary compliance on the part of your Internet Service Provider, or additional records from a third party, information stored or retrieved for this purpose alone cannot usually be used to identify you.
Marketing
The technical storage or access is required to create user profiles to send advertising, or to track the user on a website or across several websites for similar marketing purposes.