Today, Ian Carroll, Lennert Wouters, and a team of other security researchers are revealing a hotel keycard hacking technique they call Unsaflok. The technique is a collection of security vulnerabilities that would allow a hacker to almost instantly open several models of Saflok-brand RFID-based keycard locks sold by the Swiss lock maker Dormakaba. The Saflok systems are installed on 3 million doors worldwide, inside 13,000 properties in 131 countries. By exploiting weaknesses in both Dormakaba’s encryption and the underlying RFID system Dormakaba uses, known as MIFARE Classic, Carroll and Wouters have demonstrated just how easily they can open a Saflok keycard lock. Their technique starts with obtaining any keycard from a target hotel—say, by booking a room there or grabbing a keycard out of a box of used ones—then reading a certain code from that card with a $300 RFID read-write device, and finally writing two keycards of their own. When they merely tap those two cards on a lock, the first rewrites a certain piece of the lock’s data, and the second opens it.
Dormakaba says that it’s been working since early last year to make hotels that use Saflok aware of their security flaws and to help them fix or replace the vulnerable locks. For many of the Saflok systems sold in the last eight years, there’s no hardware replacement necessary for each individual lock. Instead, hotels will only need to update or replace the front desk management system and have a technician carry out a relatively quick reprogramming of each lock, door by door. Wouters and Carroll say they were nonetheless told by Dormakaba that, as of this month, only 36 percent of installed Safloks have been updated. Given that the locks aren’t connected to the internet and some older locks will still need a hardware upgrade, they say the full fix will still likely take months longer to roll out, at the very least. Some older installations may take years.
If ever. My guess is that for many locks, this is a permanent vulnerability.
We are pleased to announce that we are renewing our partnership with Oak National Academy in England to provide an updated high-quality Computing curriculum and lesson materials for Key Stages 1 to 4.
New curriculum and materials for the classroom
In 2021 we partnered with Oak National Academy to offer content for schools in England that supported young people to learn Computing at home while schools were closed as a result of the coronavirus pandemic.
In our renewed partnership, we will create new and updated materials for primary and secondary teachers to use in the classroom. These classroom units will be available for free on the Oak platform and will include everything a teacher needs to deliver engaging lessons, including slide decks, worksheets, quizzes, and accompanying videos for over 550 lessons. The units will cover both the general national Computing curriculum and the Computer Science GCSE, supporting teachers to provide a high-quality Computing offering to all students aged 5 to 16.
These new resources will update the very successful Computing Curriculum and will be rigorously tested by a Computing subject expert group.
“I am delighted that we are continuing our partnership with Oak National Academy to support all teachers in England with world-leading resources for teaching Computing and Computer Science. This means that all teachers in England will have access to free, rigorous and tested classroom resources that they can adapt to suit their context and students.” – Philip Colligan, CEO
All our materials on the Oak platform will be free and openly available, and can be accessed by educators worldwide.
Research-informed, time-saving, and adaptable resources
The materials will bring teachers the added benefit of saving valuable time, and schools can choose to adapt and use the resources in the way that works best for their students
Supporting schools in England and worldwide
We have already started work and will begin releasing units of lessons in autumn 2024. All units across Key Stages 1 to 4 will be available by autumn 2025.
We’re excited to continue our partnership with Oak National Academy to provide support to teachers and students in England.
The frontend is what we use to login into our system. The Zabbix frontend will connect to our Zabbix server and our database. But we also send information from our laptop to the frontend. It’s important that when we enter our credentials that we can do this in a safe way. So it makes sense to make use of certificates and one way to do this is by making use of self-signed certificates.
To give you a better understanding of why your browser will warn you when using self-signed certificates, we have to know that when we request an SSL certificate from an official Certificate Authority (CA) that you submit a Certificate Signing Request (CSR) to them. They in return provide you with a Signed SSL certificate. For this, they make use of their root certificate and private key.
Our browser comes with a copy of the root certificate (CA) from various authorities, or it can access it from the OS. This is why our self-signed certificates are not trusted by our browser – we don’t have any CA validation. Our only workaround is to create our own root certificate and private key.
Table of Contents
Understanding the concepts
How to create an SSL certificate:
How SSL works – Client – Server flow:
NOTE: I have borrowed the designs from this video, which does a good job of explaining how SSL works.
Securing the Frontend with self signed SSL on Nginx
In order to configure this, there are a few steps that we need to follow:
Generate a private key for the CA ( Certificate Authority )
Generate a root certificate
Generate CA-Authenticated Certificates
Generate a Certificate Signing Request (CSR)
Generate an X509 V3 certificate extension configuration file
Generate the certificate using our CSR, the CA private key, the CA certificate, and the config file
Copy the SSL certificates to your Virtual Host
Adapt your Nginx Zabbix config
Generate a private key for the CA
The first step is to make a folder named “SSL” so we can create our certificates and save them:
req: This command is used for X.509 certificate signing request (CSR) management
x509: This option specifies that a self-signed certificate should be created
new: This option is used to generate a new certificate
nodes: This option indicates that the private key should not be encrypted. It will generates a private key without a passphrase, making it more
convenient but potentially less secure
key myCA.key: This specifies the private key file (myCA.key) to be used in generating the certificate
sha256: This option specifies the hash algorithm to be used for the certificate. In this case, SHA-256 is chosen for stronger security
days 1825: This sets the validity period of the certificate in days. Here, it’s set to 1825 days (5 years)
out myCA.pem: This specifies the output file name for the generated certificate. In this case, “myCA.pem”
The information you enter is not so important, but it’s best to fill it in as comprehensively as possible. Just make sure you enter for CN your IP or DNS.
You are about to be asked to enter information that will be incorporated into your certificate request. What you are about to enter is what is called a Distinguished Name or a DN. There are quite a few fields but you can leave some blank For some fields there will be a default value, If you enter '.', the field will be left blank. ----- Country Name (2 letter code) [XX]:BE State or Province Name (full name) []:vlaams-brabant Locality Name (eg, city) [Default City]:leuven Organization Name (eg, company) [Default Company Ltd]: Organizational Unit Name (eg, section) []: Common Name (eg, your name or your server's hostname) []:192.168.0.134 Email Address []:
Generate CA-Authenticated Certificates
It’s probably good practice to use the dns name of your webiste in the name for the private key. As we use in this case an IP address rather than a dns, I will use the fictive dns zabbix.mycompany.internal.
You will be asked the same set of questions as above. Once again, your answers hold minimal significance and in our case no one will inspect the certificate, so they matter even less.
You are about to be asked to enter information that will be incorporated into your certificate request. What you are about to enter is what is called a Distinguished Name or a DN. There are quite a few fields but you can leave some blank For some fields there will be a default value, If you enter '.', the field will be left blank. ----- Country Name (2 letter code) [XX]:BE State or Province Name (full name) []:vlaams-brabant Locality Name (eg, city) [Default City]:leuven Organization Name (eg, company) [Default Company Ltd]: Organizational Unit Name (eg, section) []: Common Name (eg, your name or your server's hostname) []:192.168.0.134 Email Address []:
Please enter the following 'extra' attributes to be sent with your certificate request A challenge password []: An optional company name []:
Generate an X509 V3 certificate extension configuration file
# vi zabbix.mycompany.internal.ext
Add the following lines in your certificate extension file. Replace IP or DNS with your own values.
Modify the “When using this certificate:” dropdown to “Always Trust”
Close the certificate window
Import the CA in Windows
Open the “Microsoft Management Console” by pressing Windows + R, typing mmc, and clicking Open
Navigate to File > Add/Remove Snap-in
Select Certificates and click Add
Choose Computer Account and proceed by clicking Next
Select Local Computer and click Finish
Click OK to return to the MMC window
Expand the view by double-clicking Certificates (local computer)
Right-click on Certificates under “Object Type” in the middle column, select All Tasks, and then Import
Click Next, followed by Browse. Change the certificate extension dropdown next to the filename field to All Files (.) and locate the myCA.pem file
Click Open, then Next
Choose “Place all certificates in the following store.” with “Trusted Root Certification Authorities store” as the default. Proceed by clicking Next, then Finish, to finalize the wizard
If all went well you should find your certificate under Trusted Root Certification Authorities > Certificates
Warning! You also need to import the myCA.crt file in your OS. We are not an official CA, so we have to import it in our OS and tell it to trust this Certificate. This action depends on the OS you use.
As you are using OpenSSL, you should also create a strong Diffie-Hellman group, which is used in negotiating Perfect Forward Secrecy with clients. You can do this by typing:
Add the following lines to your Nginx configuration, modifying the file paths as needed. Replace the existing lines with port 80 with this configuration. This will enable SSL and HTTP2.
На 6 март 2024 г. кабинетът „Денков“ подаде оставка, а на 25 март, след оттеглянето на ГЕРБ от преговорите с ПП–ДБ, номинираната за премиер Мария Габриел се отказа от кандидатурата си. Какво очаквате да върши един вътрешен министър в оставка в периода, когато още не е ясно ще има ли правителство и ако да, ще бъде ли той министър в него? Най-логично е просто да се грижи подопечното му министерство да осигурява реда. Вместо това министърът в оставка Калин Стоянов демонстрира свръхактивност, свързана със сериозен човешки (и потенциално – финансов) ресурс. И бутафорно присъствие.
Кой беше министър Калин Стоянов?
Макар официално всички министри в кабинета на Николай Денков с изключение на Мария Габриел да бяха номинации на ПП–ДБ, с времето стана ясно, че това не е точно така. Един от министрите, за които се разбра, че са по-скоро предложения на ГЕРБ, беше именно Калин Стоянов. Кой всъщност стои зад него, излезе наяве след протеста против тогавашното ръководство на Българския футболен съюз на 16 ноември 2023 г. Този протест прерасна в масови безредици, а полицията приложи неоправдано насилие в опит да го овладее. Срещу протестиращите беше използвано водно оръдие. Бяха бити и невинни хора, които дори не са участвали в протеста, просто са минавали в района или са пиели бира в заведение наблизо.
Заради този случай на масово полицейско насилие, както и заради това, че МВР не е създало организация, която да предотврати ескалацията на напрежението, от ПП–ДБ поискаха оставката на Калин Стоянов. Премиерът Николай Денков дори заплаши, че ще си подаде оставката, ако министърът не осъди полицейското насилие.
Стоянов обаче отказа да сдаде поста с аргумента, че не иска да е „изкупителна жертва на дългогодишните проблеми в МВР“. Тогава от ПП–ДБ обявиха Стоянов за министър на ГЕРБ и ДПС, а Мария Габриел го защити, като заяви, че той „отстоява принципите за нулева толерантност към насилието“.
От този момент нататък от ГЕРБ ревностно бранят Калин Стоянов, макар да не признават, че той е бил тяхна номинация. В брифинга, на който Мария Габриел заяви, че се отказва от премиерския пост, тя изтъкна като един от аргументите за решението си, че от ПП–ДБ са искали смяната на вътрешния министър.
Два не-повода, две активизирания
В този контекст, в междувремието от оставката на Денков до безславния край на мандата на Мария Габриел, Калин Стоянов на два пъти активизира силите на реда по „поводи“, които всъщност не бяха поводи.
Първият не-повод бяха четири инцидента между 6 и 8 март, които не бяха свързани с насилие от страна на чужденци към българи. Жители на родопското село Храбрино взеха чуждестранни студенти по медицина за бежанци и ги подложиха на граждански арест. Други чуждестранни студенти пък бяха нападнати от български тийнейджъри на 8 март насред столичния булевард „Витоша“. На същата улица през нощта на 6 срещу 7 март имаше бой между две групи младежи, едната от които съставена от млади мъже с арабски произход. Както стана ясно впоследствие, двете групи са се познавали и конфликтът вероятно е бил заради момиче. А кандидати за убежище от общежитието на Държавната агенция за бежанците в „Овча купел“ бяха заснети на 8 март вечерта как се карат и се гонят помежду си.
Тези дребни инциденти, в два от които насилниците са българи, но няма сериозно пострадал български гражданин, станаха повод за катализиране на поредната ксенофобска истерия и протести пред бежански центрове. Реакцията на вътрешния министър беше двойствена. От една страна, той подчерта, че няма увеличение на случаите на нарушение на реда с участието на чужденци, за разлика от закононарушенията, извършени от непълнолетни. От друга страна, Калин Стоянов използва случая да въведе засилени мерки за сигурност… заради чужденците, които определи като „хора с различен произход“:
„Засилваме полицейското присъствие в централната градска част и в райони, където има събиране на хора с различен произход, както и около центровете за настаняване на Държавната агенция за бежанците. В централната част на столицата екипите ще са съвместни от СДВР и на общината, а край центровете за бежанци ще патрулират полицейски служители.“
Стоянов също така повтори заявката си, дадена на 8 март, да инициира законодателна промяна, в резултат на която да се назначат още 1260 гранични полицаи. Ако това стане, ще бъдат отделени немалко средства за МВР, което е известно с раздутия си щат. Предложението за откриване на работни места за такъв брой полицейски служители по границите впрочем не е оригинално негово – преди година същото число споменава тогавашният служебен вътрешен министър Иван Демерджиев.
Вторият не-повод беше атентатът в Москва от вечерта на 22 март, при който бяха убити близо 140 души, отишли на рок концерт, а повече от 180 – ранени. Отговорност за него пое фракцията на „Ислямска държава“ – „Хорасан“. Русия обаче обвинява Украйна, която категорично отрича връзка с терористичния акт.
Засега няма публично известни данни България да е в опасност след този атентат. На 23 март обаче МВР излезе с прессъобщение, в което се казва, че министър Калин Стоянов е разпоредил „засилени мерки за обезпечаване на сигурността и спокойствието на гражданите на територията на страната. Полицейски патрули и жандармеристи, оборудвани с дългоцевно оръжие, ще патрулират в градските зони и ще съблюдават за реда и за гарантиране на безопасността“.
Не се споменава поводът за изкарването по улиците на сили на МВР, въоръжени с пушки. Вместо това просто се съобщава, че то е „с оглед предотвратяване на нарушения на обществения ред и повишаване на бдителността“.
Театрална сигурност
След двете решения на Калин Стоянов за увеличаване на полицейското присъствие могат да се видят служители на реда най-вече в района около бул. „Витоша“ и НДК, край молове, както и около бежански центрове. Жандармеристи видимо се шляят из центъра на София, някои от тях си пушат, но пък са с тежки униформи и с големи, страшни автомати.
Като се изключи тази показност, на много места в страната и дори в столицата полицията на практика отсъства там, където е нужна. Има столични квартали, в които хората може с години да не видят полицай, като изключим някой и друг катаджия, скрит в храстите. Но пък служители на реда традиционно се навъртат по паркове и градинки и обискират хора, които им приличат на такива, които биха пушили трева. Понякога стоят на изходите на метростанциите и спират за легитимация минувачи, чиято външност им изглежда съмнителна – например мъже с дълги коси и бради или с вид на чужденци.
Присъствието на патрулиращи полицейски служители е необходимо – както в една европейска столица, каквато е София, така и в по-малките населени места. Както за предотвратяване на престъпления, така и в помощ на гражданите – например да бъде упътен някой, да се реагира бързо и адекватно, ако друг се почувства зле или е в безпомощно състояние, и т.н. За всекидневната дейност на един патрулиращ полицай пушка не само не е нужна, а и би могла да затрудни навременната му реакция.
Поуки от международния опит
На 13 ноември 2015 г. в Париж е извършена серия от терористични атаки, в резултат на които са убити близо 130 души. Като реакция тогавашният президент Франсоа Оланд обявява извънредно положение. Временно са затворени границите и е обявен вечерен час, а по улиците излизат въоръжени военни. Скоро границите се отварят, а вечерният час се отменя, но военните по улиците остават.
Присъствието на военни с автомати обаче не предотвратява атентата в Ница на следващата година, навръх 14 юли – националния празник на Франция. Тогава камион се врязва в множество, събрало се на крайбрежната алея да наблюдава фойерверките, и над 80 души са убити.
Когато настоящият президент Еманюел Макрон встъпи в длъжност, той остави патрулиращите въоръжени военни. И до днес те може да се видят най-вече в групи по четирима край гари, молове и другаде, където има масово струпване на хора.
Въпреки продължаващото на практика 9 години извънредно положение Франция продължава да е в постоянен риск от терористични атаки. Един от последните случаи беше през есента на 2023 г. в училище, в което бивш ученик от чеченски произход уби учител и двама ученици.
След всеки подобен случай Франция повишава предупреждението за опасност и мерките за сигурност. Повиши ги и след атентата в Москва от 22 март.
Нека впрочем видим и самата Русия. Атентатът в Москва беше допуснат, макар в страната вече почти всеки да е под подозрение, че е „екстремист“, и човек не може да протестира дори с бял лист на улицата. В Русия, където арестуват момичета заради това, че са били с обеци в цветовете на дъгата, терористи с големи пушки и запалителни вещества безпрепятствено могат да влязат в концертна зала и да извършат масово убийство.
Съвсем различен е подходът на Германия. В края на 2016 г. в Берлин камион се вряза в коледен базар. Дванайсет души бяха убити. В страната обаче не беше въведено извънредно положение, а канцлерката Ангела Меркел заяви, че не желае хората в Германия да живеят „парализирани от страха от злото“, а иска да бъдат „свободни заедно и отворени към света“.
Животът в Германия видимо си продължи като преди. Сериозната работа за сигурността на гражданите се вършеше в голяма степен от разузнаването, което успяваше да предотврати някои планове за терористични актове в зародиш. В страната все така се провеждат коледни базари, но често се слагат (така, че да не се набиват твърде много на очи) препятствия, които да попречат на превозно средство да се вреже в хората.
Каква е целта на бутафорията?
Като се има предвид колко е пробита системата ни за национална сигурност, наивно е да се мисли, че с изкарването на жандармеристи с автомати по улиците може да се предотврати терористичен акт. А никой не казва, че има непосредствена опасност от такъв. Тогава защо вътрешният министър в оставка Калин Стоянов предприема показни акции?
Като се има предвид, че се задават избори, този, който владее МВР, в голяма степен има влияние върху районите с контролиран вот, както и върху ромските махали. Присъствието на въоръжени сили на реда може да сплаши когото трябва. Изборите обаче ще се проведат при служебно правителство. Няма гаранция, че Калин Стоянов ще е министър в него.
По-реалистично предположение е с тези акции да се цели насаждане в обществото на страх от някаква надвиснала неясна опасност. Изкарването на тежковъоръжени патрули по улиците не толкова вдъхва сигурност, колкото усещането, че щом са там, значи има от какво да бъдем пазени. Този страх може да се канализира по отношение на чужденците, както и стана в началото на март, или да се нарочи (и) друг враг. И да се насочи в желаната електорална посока.
Канализирайки обществените страхове, подобни акции имат функцията да отвличат вниманието от действително сериозните проблеми. Като „изгубената“ пътна карта за един газопровод и трите милиарда, които България е харизала на Русия за изграждането му. Газопровод, който заобикаля Украйна, което пък после развързва ръцете на Русия да я нападне. Или сериозните проблеми в прокуратурата. Или „Магнитски“. Теми, от които да се отвлича вниманието – бол.
А може би на министъра в оставка Калин Стоянов просто му харесва да демонстрира груба сила – това го кара да се чувства значим. При всички хипотези накрая отговорът може да се окаже обидно прост.
As we’ve innovated and expanded the Amazon Web Services (AWS) Cloud, we continue to prioritize making sure customers are in control and able to meet regulatory requirements anywhere they operate. With the AWS Digital Sovereignty Pledge, which is our commitment to offering all AWS customers the most advanced set of sovereignty controls and features available in the cloud, we are investing in an ambitious roadmap of capabilities for data residency, granular access restriction, encryption, and resilience. Today, I’ll focus on the resilience pillar of our pledge and share how customers are able to improve their resilience posture while meeting their digital sovereignty and resilience goals with AWS.
Resilience is the ability for any organization or government agency to respond to and recover from crises, disasters, or other disruptive events while maintaining its core functions and services. Resilience is a core component of sovereignty and it’s not possible to achieve digital sovereignty without it. Customers need to know that their workloads in the cloud will continue to operate in the face of natural disasters, network disruptions, and disruptions due to geopolitical crises. Public sector organizations and customers in highly regulated industries rely on AWS to provide the highest level of resilience and security to help meet their needs. AWS protects millions of active customers worldwide across diverse industries and use cases, including large enterprises, startups, schools, and government agencies. For example, the Swiss public transport organization BERNMOBIL improved its ability to protect data against ransomware attacks by using AWS.
Building resilience into everything we do
AWS has made significant investments in building and running the world’s most resilient cloud by building safeguards into our service design and deployment mechanisms and instilling resilience into our operational culture. We build to guard against outages and incidents, and account for them in the design of AWS services—so when disruptions do occur, their impact on customers and the continuity of services is as minimal as possible. To avoid single points of failure, we minimize interconnectedness within our global infrastructure. The AWS global infrastructure is geographically dispersed, spanning 105 Availability Zones (AZs) within 33 AWS Regions around the world. Each Region is comprised of multiple Availability Zones, and each AZ includes one or more discrete data centers with independent and redundant power infrastructure, networking, and connectivity. Availability Zones in a Region are meaningfully distant from each other, up to 60 miles (approximately 100 km) to help prevent correlated failures, but close enough to use synchronous replication with single-digit millisecond latency. AWS is the only cloud provider to offer three or more Availability Zones within each of its Regions, providing more redundancy and better isolation to contain issues. Common points of failure, such as generators and cooling equipment, aren’t shared across Availability Zones and are designed to be supplied by independent power substations. To better isolate issues and achieve high availability, customers can partition applications across multiple Availability Zones in the same Region. Learn more about how AWS maintains operational resilience and continuity of service.
Resilience is deeply ingrained in how we design services. At AWS, the services we build must meet extremely high availability targets. We think carefully about the dependencies that our systems take. Our systems are designed to stay resilient even when those dependencies are impaired; we use what is called static stability to achieve this level of resilience. This means that systems operate in a static state and continue to operate as normal without needing to make changes during a failure or when dependencies are unavailable. For example, in Amazon Elastic Compute Cloud (Amazon EC2), after an instance is launched, it’s just as available as a physical server in a data center. The same property holds for other AWS resources such as virtual private clouds (VPCs), Amazon Simple Storage Service (Amazon S3) buckets and objects, and Amazon Elastic Block Store (Amazon EBS) volumes. Learn more in our Fault Isolation Boundaries whitepaper.
Information Services Group (ISG) cited strengthened resilience when naming AWS a Leader in their recent report, Provider Lens for Multi Public Cloud Services – Sovereign Cloud Infrastructure Services (EU), “AWS delivers its services through multiple Availability Zones (AZs). Clients can partition applications across multiple AZs in the same AWS region to enhance the range of sovereign and resilient options. AWS enables its customers to seamlessly transport their encrypted data between regions. This ensures data sovereignty even during geopolitical instabilities.”
AWS empowers governments of all sizes to safeguard digital assets in the face of disruptions. We proudly worked with the Ukrainian government to securely migrate data and workloads to the cloud immediately following Russia’s invasion, preserving vital government services that will be critical as the country rebuilds. We supported the migration of over 10 petabytes of data. For context, that means we migrated data from 42 Ukraine government authorities, 24 Ukrainian universities, a remote learning K–12 school serving hundreds of thousands of displaced children, and dozens of other private sector companies.
For customers who are running workloads on-premises or for remote use cases, we offer solutions such as AWS Local Zones,AWS Dedicated Local Zones, and AWS Outposts. Customers deploy these solutions to help meet their needs in highly regulated industries. For example, to help meet the rigorous performance, resilience, and regulatory demands for the capital markets, Nasdaq used AWS Outposts to provide market operators and participants with added agility to rapidly adjust operational systems and strategies to keep pace with evolving industry dynamics.
Enabling you to build resilience into everything you do
Millions of customers trust that AWS is the right place to build and run their business-critical and mission-critical applications. We provide a comprehensive set of purpose-built resilience services, strategies, and architectural best practices that you can use to improve your resilience posture and meet your sovereignty goals. These services, strategies, and best practices are outlined in the AWS Resilience Lifecycle Framework across five stages—Set Objectives, Design and Implement, Evaluate and Test, Operate, and Respond and Learn. The Resilience Lifecycle Framework is modeled after a standard software development lifecycle, so you can easily incorporate resilience into your existing processes.
For example, you can use the AWS Resilience Hub to set your resilience objectives, evaluate your resilience posture against those objectives, and implement recommendations for improvement based on the AWS Well-Architected Framework and AWS Trusted Advisor. Within Resilience Hub, you can create and run AWS Fault Injection Service experiments, which allow you to test how your application will respond to certain types of disruptions. Recently, Pearson, a global provider of educational content, assessment, and digital services to learners and enterprises, used Resilience Hub to improve their application resilience.
Other AWS resilience services such as AWS Backup, AWS Elastic Disaster Recovery (AWS DRS), and Amazon Route53 Application Recovery Controller (Route 53 ARC) can help you quickly respond and recover from disruptions. When Thomson Reuters, an international media company that provides solutions for tax, law, media, and government to clients in over 100 countries, wanted to improve data protection and application recovery for one of its business units, they adopted AWS DRS. AWS DRS provides Thomson Reuters continuous replication, so changes they made in the source environment were updated in the disaster recovery site within seconds.
Achieve your resilience goals with AWS and our AWS Partners
AWS offers multiple ways for you to achieve your resilience goals, including assistance from AWS Partners and AWS Professional Services. AWS Resilience Competency Partners specialize in improving customers’ critical workloads’ availability and resilience in the cloud. AWS Professional Services offers Resilience Architecture Readiness Assessments, which assess customer capabilities in eight critical domains—change management, disaster recovery, durability, observability, operations, redundancy, scalability, and testing—to identify gaps and areas for improvement.
We remain committed to continuing to enhance our range of sovereign and resilient options, allowing customers to sustain operations through disruption or disconnection. AWS will continue to innovate based on customer needs to help you build and run resilient applications in the cloud to keep up with the changing world.
If you have feedback about this post, submit comments in the Comments section below. If you have questions about this post, contact AWS Support.
The GNOME project announced
GNOME 46 (code-named “Kathmandu”) on March 20. The release has quite a few updates and improvements
across user applications, developer tools, and under the hood. One
thing stood out while looking over this release—a major emphasis on
Flatpaks as the way to acquire and update GNOME software.
Implementing user authentication and authorization for custom applications requires significant effort. For authentication, customers often use an external identity provider (IdP) such as Amazon Cognito. Yet, authorization logic is typically implemented in code. This code can be prone to errors, especially as permissions models become complex, and presents significant challenges when auditing permissions and deciding who has access to what. As a result, within Common Weakness Enumeration’s (CWE’s) list of the Top 25 Most Dangerous Software Weaknesses for 2023, four are related to incorrect authorization.
At re:Inforce 2023, we launched Amazon Verified Permissions, a fine-grained permissions management service for the applications you build. Verified Permissions centralizes permissions in a policy store and lets developers use those permissions to authorize user actions within their applications. Permissions are expressed as Cedar policies. You can learn more about the benefits of moving your permissions centrally and expressing them as policies in Policy-based access control in application development with Amazon Verified Permissions.
In this post, we explore how you can provide a faster and richer user experience while still authorizing all requests in the application. You will learn two techniques—bulk authorization and response caching—to improve the efficiency of your applications. We describe how you can apply these techniques when listing authorized resources and actions and loading multiple components on webpages.
Use cases
You can use Verified Permissions to enforce permissions that determine what the user is able to see at the level of the user interface (UI), and what the user is permitted to do at the level of the API.
UI permissions enable developers to control what a user is allowed see in the application. Developers enforce permissions in the UI to control the list of resources a user can see and the actions they can take. For example, a UI-level permission in a banking application might determine whether a transfer funds button is enabled for a given account.
API permissions enable developers to control what a user is allowed to do in an application. Developers control access to individual API calls made by an application on behalf of the user. For example, an API-level permission in a banking application might determine whether a user is permitted to initiate a funds transfer from an account.
Cedar provides consistent and readable policies that can be used at both the level of the UI and the API. For example, a single policy can be checked at the level of the UI to determine whether to show the transfer funds button and checked at the level of the API to determine authority to initiate the funds transfer.
Challenges
Verified Permissions can be used for implementing fine-grained API permissions. Customer applications can use Verified Permissions to authorize API requests, based on centrally managed Cedar policies, with low latency. Applications authorize such requests by calling the IsAuthorized API of the service, and the response contains whether the request is allowed or denied. Customers are happy with the latency of individual authorization requests, but have asked us to help them improve performance for use cases that require multiple authorization requests. They typically mention two use cases:
Compound authorization: Compound authorization is needed when one high-level API action involves many low-level actions, each of which has its own permissions. This requires the application to make multiple requests to Verified Permissions to authorize the user action. For example, in a banking application, loading a credit card statement requires three API calls: GetCreditCardDetails, GetCurrentStatement, and GetCreditLimit. This requires three calls to Verified Permissions, one for each API call.
UI permissions: Developers implement UI permissions by calling the same authorization API for every possible resource a principal can access. Each request involves an API call, and the UI can only be presented after all of them have completed. Alternatively, for a resource-centric view, the application can make the call for multiple principals to determine which ones have access.
Solution
In this post, we show you two techniques to optimize the application’s latency based on API permissions and UI permissions.
Batch authorization allows you to make up to 30 authorization decisions in a single API call. This feature was released in November 2023. See the what’s new post and API specifications to learn more.
Solving for enforcing fine grained permissions while delivering a great user experience
You can use UI permissions to authorize what resources and actions a user can view in an application. We see developers implementing these controls by first generating a small set of resources based on database filters and then further reducing the set down to authorized resources by checking permissions on each resource using Verified Permissions. For example, when a user of a business banking system tries to view balances on company bank accounts, the application first filters the list to the set of bank accounts for that company. The application then filters the list further to only include the accounts that the user is authorized to view by making an API request to Verified Permissions for each account in the list. With batch authorization, the application can make a single API call to Verified Permissions to filter the list down to the authorized accounts.
Similarly, you can use UI permissions to determine what components of a page or actions should be visible to users of the application. For example, in a banking application, the application wants to control the sub-products (such as credit card, bank account, or stock trading) visible to a user or only display authorized actions (such as transfer or change address) when displaying an account overview page. Customers want to use Verified Permissions to determine which components of the page to display, but that can adversely impact the user experience (UX) if they make multiple API calls to build the page. With batch authorization, you can make one call to Verified Permissions to determine permissions for all components of the page. This enables you to provide a richer experience in your applications by displaying only the components that the user is allowed to access while maintaining low page load latency.
Solving for enforcing permissions for every API call without impacting performance
Compound authorization is where a single user action results in a sequence of multiple authorization calls. You can use bulk authorization combined with response caching to improve efficiency. The application makes a single bulk authorization request to Verified Permissions to determine whether each of the component API calls are permitted and the response is cached. This cache is then referenced for each component’s API call in the sequence.
Sample application – Use cases, personas, and permissions
We’re using an online order management application for a toy store to demonstrate how you can apply batch authorization and response caching to improve UX and application performance.
One function of the application is to enable employees in a store to process online orders.
Personas
The application is used by two types of users:
Pack associates are responsible for picking, packing, and shipping orders. They’re assigned to a specific department.
Store managers are responsible for overseeing the operations of a store.
Use cases
The application supports these use cases:
Listing orders: Users can list orders. A user should only see the orders for which they have view permissions.
Pack associates can list all orders of their department.
Store managers can list all orders of their store.
Figure 1 shows orders for Julian, who is a pack associate in the Soft Toy department
Figure 1: Orders for Julian in the Soft Toy department
Order actions: Users can take some actions on an order. The application enables the relevant UI elements based on the user’s permissions.
Pack associates can select Get Box Size and Mark as Shipped, as shown in Figure 2.
Store managers can select Get Box Size, Mark as Shipped, Cancel Order, and Route to different warehouse.
Figure 2: Actions available to Julian as a pack associate
Viewing an order: Users can view the details of a specific order. When a user views an order, the application loads the details, label, and receipt. Figure 3 shows the available actions for Julian who is a pack associate.
Figure 3: Order Details for Julian, showing permitted actions
In the sample application, the policy template for the store owner role looks like the following:
permit (
        principal == ?principal,
        action in [
                avp::sample::toy::store::Action::"OrderActions",
                avp::sample::toy::store::Action::"AddPackAssociate",
                avp::sample::toy::store::Action::"AddStoreManager",
                avp::sample::toy::store::Action::"ListPackAssociates",
                avp::sample::toy::store::Action::"ListStoreManagers"
        ],
        resource in ?resource
);
When a user is assigned a role, the application creates a policy from the corresponding template by passing the user and store. For example, the policy created for the store owner is as follows:
permit (
    principal ==  avp::sample::toy::store::User::"test_user_pool|sub_store_manager_user",
    action in  [
                avp::sample::toy::store::Action::"OrderActions",
                avp::sample::toy::store::Action::"AddPackAssociate",
                avp::sample::toy::store::Action::"AddStoreManager",
                avp::sample::toy::store::Action::"ListPackAssociates",
                avp::sample::toy::store::Action::"ListStoreManagers"
    ],
    resource in avp::sample::toy::store::Store::"toy store 1"
);
In this section, we discuss high level design, challenges with the barebones integration, and how you can use the preceding techniques to reduce latency and costs.
Listing orders
Figure 4: Architecture for listing orders
As shown in Figure 4, the process to list orders is:
The user accesses the application hosted in AWS Amplify.
The user then authenticates through Amazon Cognito and obtains an identity token.
The application uses Amplify to load the order page. The console calls the API ListOrders to load the order.
The API is hosted in API Gateway and protected by a Lambda authorizer function.
The Lambda function collects entity information from an in-memory data store to formulate the isAuthorized request.
Then the Lambda function invokes Verified Permissions to authorize the request. The function checks against Verified Permissions for each order in the data store for the ListOrder call. If Verified Permissions returns deny, the order is not provided to the user. If Verified Permissions returns allow, the request is moved forward.
Challenge
Figure 5 shows that the application called IsAuthorized multiple times, sequentially. Multiple sequential calls cause the page to be slow to load and increase infrastructure costs.
Figure 5: Graph showing repeated calls to IsAuthorized
Reduce latency using batch authorization
If you transition to using batch authorization, the application can receive 30 authorization decisions with a single API call to Verified Permissions. As you can see in Figure 6, the time to authorize has reduced from close to 800 ms to 79 ms, delivering a better overall user experience.
Figure 6: Reduced latency by using batch authorization
Order actions
Figure 7: Order actions architecture
As shown in Figure 7, the process to get authorized actions for an order is:
The user goes to the application landing page on Amplify.
The application calls the Order actions API at API Gateway
The application sends a request to initiate order actions to display only authorized actions to the user.
The Lambda function collects entity information from an in-memory data store to formulate the isAuthorized request.
The Lambda function then checks with Verified Permissions for each order action. If Verified Permissions returns deny, the action is dropped. If Verified Permissions returns allow, the request is moved forward and the action is added to a list of order actions to be sent in a follow-up request to Verified Permissions to provide the actions in the user’s UI.
Challenge
As you saw with listing orders, Figure 8 shows how the application is still calling IsAuthorized multiple times, sequentially. This means the page remains slow to load and has increased impacts on infrastructure costs.
Figure 8: Graph showing repeated calls to IsAuthorized
Reduce latency using batch authorization
If you add another layer by transitioning to using batch authorization once again, the application can receive all decisions with a single API call to Verified Permissions. As you can see from Figure 9, the time to authorize has reduced from close to 500 ms to 150 ms, delivering an improved user experience.
Figure 9: Graph showing results of layering batch authorization
Viewing an order
Figure 10: Order viewing architecture
The process to view an order, shown in Figure 10, is:
The user accesses the application hosted in Amplify.
The user authenticates through Amazon Cognito and obtains an identity token.
The application calls three APIs hosted at API Gateway.
The API’s: Get order details, Get label, and Get receipt are targeted sequentially to load the UI for the user in the application.
A Lambda authorizer protects each of the above-mentioned APIs and is launched for each invoke.
The Lambda function collects entity information from an in-memory data store to formulate the isAuthorized request.
For each API, the following steps are repeated. The Lambda authorizer is invoked three times during page load.
The Lambda function invokes Verified Permissions to authorize the request. If Verified Permissions returns deny, the request is rejected and an HTTP unauthorized response (403) is sent back. If Verified Permissions returns allow, the request is moved forward.
If the request is allowed, API Gateway calls the Lambda Order Management function to process the request. This is the primary Lambda function supporting the application and typically contains the core business logic of the application.
Challenge
In using the standard authorization pattern for this use case, the application calls Verified Permissions three times. This is because the user action to view an order requires compound authorization because each API call made by the console is authorized. While this enforces least privilege, it impacts the page load and reload latency of the application.
Reduce latency using batch authorization and decision caching
You can use batch authorization and decision caching to reduce latency. In the sample application, the cache is maintained by API Gateway. As shown in Figure 11, applying these techniques to the console application results in only one call to Verified Permissions, reducing latency.
Figure 11: Batch authorization with decision caching architecture
The decision caching processshown in Figure 11, is:
The user accesses the application hosted in Amplify.
The user then authenticates through Amazon Cognito and obtains an identity token.
The application then calls three APIs hosted at API Gateway
When the Lambda function for the Get order details API is invoked, it uses the Lambda Authorizer to call batch authorization to get authorization decisions for the requested action, Get order details, and related actions, Get label and Get receipt.
A Lambda authorizer protects each of the above-mentioned APIs but because of batch authorization, is invoked only once.
The Lambda function collects entity information from an in-memory data store to formulate the isAuthorized request.
The Lambda function invokes Verified Permissions to authorize the request. If Verified Permissions returns deny, the request is rejected and an HTTP unauthorized response (403) is sent back. If Verified Permissions returns allow, the request is moved forward.
API Gateway caches the authorization decision for all actions (the requested action and related actions).
If the request is allowed by the Lambda authorizer function, API Gateway calls the order management Lambda function to process the request. This is the primary Lambda function supporting the application and typically contains the core business logic of the application.
When subsequent APIs are called, the API Gateway uses the cached authorization decisions and doesn’t use the Lambda authorization function.
Caching considerations
You’ve seen how you can use caching to implement fine-grained authorization at scale in your applications. This technique works well when your application has high cache hit rates, where authorization results are frequently loaded from the cache. Applications where the users initiate the same action multiple times or have a predictable sequence of actions will observe high cache hit rates. Another consideration is that employing caching can delay the time between policy updates and policy enforcement. We don’t recommend using caching for authorization decisions if your application requires policies to take effect quickly or your policies are time dependent (for example, a policy that gives access between 10:00 AM and 2:00 PM).
Conclusion
In this post, we showed you how to implement fine grained permissions in application at scale using Verified Permissions. We covered how you can use batch authorization and decision caching to improve performance and ensure Verified Permissions remains a cost-effective solution for large-scale applications. We applied these techniques to a demo application, avp-toy-store-sample, that is available to you for hands-on testing. For more information about Verified Permissions, see the Amazon Verified Permissions product details and Resources.
If you have feedback about this post, submit comments in the Comments section below. If you have questions about this post, contact AWS Support.
As you’re sitting down to watch yet another episode of “Mystery Science Theater 3000” (Anyone else? Just me?), you might be thinking about how you’re receiving more than 16 billion signals over your home internet connection that need to be interpreted and sent to decoding software in order to be viewed on a screen as images. (Anyone else? Just me?)
In telecommunications, we study how signals (electrical and optical) propagate in a medium (copper wires, optical fiber, or through the air). Signals bounce off objects, degrade as they travel, and arrive at the receiving end (hopefully) intact enough to be interpreted as a binary 0 or 1, eventually to be decoded to form images that we see on our screens.
Today in the latest installment of Network Stats, I’m going to talk about one of the most important things that I’ve learned about the application of telecommunication to computer networks: the study of how long operations take. It’s a complicated process, but that doesn’t make buffering any less annoying, am I right? And if you’re using cloud storage in any way, you rely on signals to run applications, back up your data, and maybe even stream out those movies yourself.
So, let’s get into how we measure data transmission, what things we can do to improve transmission time, and some real-world measurements from the Backblaze US-West region.
Networking and Nanoseconds: A Primer
At the risk of being too basic, when we study network communication, we’re measuring how long signals take to get from point A to point B, which implies that there is some amount of distance between them. This is also known as latency. As networks have evolved, the time it takes to get from point A to point B has gone from being measured in hours to being measured in fractions of a second. Since we live in more human relatable terms like minutes, hours, and days, it can be hard for us to understand concepts like nanoseconds (a billionth of a second).
Here’s a breakdown of how many milli, micro, and nanoseconds are in one second.
Time
Symbol
Number in 1 Second
1 second
1
1 millisecond
ms
1,000
1 microsecond
μs
1,000,000
1 nanosecond
ns
1,000,000,000
For reference, taking a deep breath takes approximately one second. When you’re watching TV, you start to notice audio delays at approximately 10–20ms, and if your cat pushes your pen off your desk, it will hit the ground in approximately 400ms.
Nanosecond Wire: Making Nanoseconds Real
In the 1960s, Grace Murray Hopper (1906–1992) explained computer operations and what a nanosecond means in a succinct, tangible fashion. An early computer scientist who also served in the U.S. Navy, Hopper was often asked by folks like generals and admirals why it took so long for signals to reach satellites. So, Hopper had pieces of wire cut to 30cm (11.8in) in length, which is the distance that it takes light to travel in perfect conditions—that is, a vacuum—in one nanosecond. (Remember: we humans express speed as distance over time.)
You could touch the wire, feel the distance from point A to point B, and see what a nanosecond in light-time meant. Put a bunch of them together, and you’d see what that looks like on a human scale. In literal terms, she was forcing people to measure the distance to a satellite (anywhere between 160–35,786 km) in terms of the long side of a piece of printer paper. (Rough math: it’s about 741,058,823 to 1,657,529,411,764 pieces of paper end-to-end.) That’ll definitely make you realize that there are a lot of nanoseconds between you and the next city over or a satellite in space.
A fun side note: if we go up a factor from a nanosecond to a microsecond, the wire would be almost 300 meters (984 feet)—which is the height of the Eiffel Tower, minus the broadcast antennae. It gets even more fun to think about because we still have to scale up to two more orders of magnitude to get to a millisecond, and then again to get a second.
I love when a difficult topic can be grasped with an elegant explanation. It’s one of the skills that I strive to develop as an engineer—how can I relate a complicated concept to a larger audience that doesn’t have years of study in my field, and make it easily digestible and memorable?
Added Application Time
We don’t live in an ideal, perfect vacuum where signals can propagate in a line-of-sight fashion and travel in an optimal path. We have wires in buildings and in the ground that wind around metro regions, follow long-haul railroad tracks as they curve, and have to pass over hills and along mountainous terrain that add elevation to the wire length, all adding light-time.
These physical factors are not the only component in the way of receiving your data. There are computer operations that add time to our transactions. We have to send a “hello” message to the server and wait for an acknowledgement, negotiate our security protocols so that we can transmit data without anyone snooping in on the conversation, spend time receiving the bytes that make up our file, and acknowledge chunks of information as received so the server can send more.
How much do geography and software operations add to the time it takes to get a file? That’s what we’re going to explore here. So, if we’re requesting a file that’s stored on Backblaze’s servers in the US-West region, what does that look like if we are delivering the file to different locations across the continental U.S.? How long does it take?
Building a Latency Test
Today we’re going to focus on network statistics for our US-West location and how the performance profile looks as we travel east and the various components that contribute to the change in translation time.
Below we’re going to compare theoretical best case numbers to the real world. There are three categories in our analysis that contribute to the total time it takes to get a request from a person in Los Angeles, Chicago, or New York, to our servers in the US-West region. Let’s take a look at each one:
Ideal Line: Let’s draw an imaginary line between our US-West location and each major city in our testing sample. Then we can calculate the time it takes light to be sent and received as RTT (Round Trip Time) one time between the two points. This number gives us the Ideal Line time, or the time it takes for a light signal to travel between two points in a perfect line, in vacuum conditions, with no obstructions. Hardly how we live, so we have to add a few other data points!
Fiber: Fiber optics in the real world have to pass through optical equipment, connect to aerial fiber on telephone poles where ground access is limited, route around pesky obstructions like mountains or municipal services, and sometimes travel along non-ideal paths to reach major connection points where long-haul fiber providers have offices to improve and reamplify the signal. This RTT number is taken from testing services that we have running across the country.
Software: This measurement shows the time spent in Software tasks (as opposed to Setup or Download tasks, as defined by Google) that are required to initiate network connections, negotiate mutual settings between sender and receiver, wait for data to start to be received, and encrypt/decrypt messages. We’re also getting this number from our testing services and will explore all the inner workings of the Software components a little later on.
Total: The interesting part! Real world RTT for retrieving a sample file from various locations.
Fun fact: You don’t need any monitoring infrastructure in order to take a deeper dive—every Chrome web browser has the ability to show load times for all the elements that are needed to present a website.
Do note that test results may vary based on your ISP connectivity, hardware capabilities, software stack, or improvements Backblaze makes over time.
To show more detailed information, open Chrome:
Go to Chrome Options > More Tools > Developer Tools
Select Network Tab
Browse to a website to see results sourced from your machine
If you wish to run agent based tests, you can start with Google’s Chromium Project, as it offers a free and open source method to simulate and perform profiling.
Here are the results from just one test we ran:
Round Trip Times (RTT) for various categories to our US-West location.
It’s important, at this stage, to caveat these numbers with a few things. First, they include a decent amount of overhead from being within our (or any) infrastructure, which can be affected by things like your browser, security, and lookup time needed to connect to a server infrastructure. And, if a user is running a different browser, has different layers of security, and so on, those things can affect RTT results.
Second, they don’t accurately talk about performance without context. Every type of application has its own requirements for what is a “good” or “bad” RTT time, and these numbers can change based on how you store your data; where you store, access, and serve your data; if you use a content delivery network (CDN); and more. As with anything related to performance in cloud storage, your use case determines your cloud storage strategy, not the other way around.
Unpacking the Software Measurement
In addition to the Chrome tools we talk about above, we have access to agents running in various geographical locations across the world that run periodic tests to our services. These agents can simulate client activity and record metrics for us that we use for alerting and trend analysis. Simulating client operations helps alert our operations teams to potential issues, helping us to better support our clients and be more proactive.
With this type of agent based testing, we have greater insight into the network that lets us break down the Software step and observe if any one step in the transfer pipeline is underperforming. We’re not only looking at the entire round trip time of downloading a file, but also including all the browser, security, and lookup time needed to connect to our server infrastructure. And, as always, the biggest addition in time it takes to deliver files is often distance-based latency, or the fact that even with ideal conditions, the further away an end user is, the longer it takes to transport data across networks.
Unpacking Software Results
The below chart shows how long in milliseconds it takes to get a sample file from our US-West cluster from agents running in different locations across the U.S. and all the Software steps involved.
Chromium application profile of loading a sample 78kb test file from various locations.
You can find definitions for all these terms in the Chromium dev docs, but here’s a cheat sheet for our purposes:
Queueing: Browser queues up connection.
DNS Lookup: Resolving the request’s IP address.
SSL: Time spent negotiating a secure session.
Initial Connection: TCP handshake.
Request Sent: This is pretty self explanatory—the request is sent to the server.
TTFB (Time to First Byte): Waiting for the first byte of a response. Includes one round trip of latency and the time the server took to prepare the response.
Content Download: Total amount of time receiving the requested file.
Pie Slices
Let’s zoom in on the Los Angeles and New York tests and group just the Download (Content Download) and all the other Setup items (Queueing, DNS Lookup, SSL, Initial Connection, TTFB) and see if they differ drastically.
In the Los Angeles test, which is the closest geographical test to the US-West cluster, the total transaction time is 71ms. It takes our storage system 23.8ms to start to send the file, and we’re spending 47ms (66%) of the total time in setup.
If we go further east to New York, we can see how much more time it takes to retrieve our test file from the West (71ms vs 470ms), but the ratio between download and setup doesn’t differ all that drastically. This is because all of our operations are the same, but we’re spending more sending each file over the network, so it all scales up.
Note that no matter where the client request is coming from, the data center is doing the same amount of work to serve up the file.
Customer Considerations: The Importance of Location in Data Storage
Latency is certainly a factor to consider when you choose where to store your data, especially if you are running extremely time sensitive processes like content delivery—as we’ve noted here and elsewhere, the closer you are to your end user, the greater the speed of delivery. Content delivery networks (CDNs) can offer one way to layer your network capabilities for greater speed of delivery, and Backblaze offers completely free egress through many CDN partners. (This is in addition to our normal amount of free egress, which is up to 3x the data stored and includes the vast majority of use cases.)
There are other reasons to consider different regions for storage as well, such as compliance and disaster resilience. Our EU datacenter, for instance, helps to support GDPR compliance. Also, if you’re storing data in only one location, you’re more vulnerable to natural disasters. Redundancy is key to a good disaster recovery or business continuity plan, and you want to make sure to consider power regions in that analysis. In short, as with all things in storage optimization, considering your use case is key to balancing performance and cost.
Milliseconds Matter
I started this article talking about Grace Murray Hopper demonstrating nanoseconds with pieces of wire, and we’re concluding what can be considered light years (ha) away from that point. The biggest thing to remember, as a network engineering team, is that even though approximately 600ms from the US-West to the US-East regions seems miniscule, the amount of times we travel that distance very quickly takes us up those orders of magnitude from milliseconds to seconds. And, when you, the user, are choosing where to store your data—knowing that we register audio lag at as little as 10ms—those inconsequential numbers start to get to human relative terms very, very quickly.
So, when we find that peering shaves a few milliseconds off of a file delivery time, that’s a big, human-sized win. You can see some of the ways we’re optimizing our network in the first article of this series, and the types of tests we’re running above give us good insights—and inspiration—for more, better, and ongoing improvements. We’ll keep sharing what we’re measuring and how we’re improving, and we’re looking forward to seeing you all in the comments.
Customer 360 (C360) provides a complete and unified view of a customer’s interactions and behavior across all touchpoints and channels. This view is used to identify patterns and trends in customer behavior, which can inform data-driven decisions to improve business outcomes. For example, you can use C360 to segment and create marketing campaigns that are more likely to resonate with specific groups of customers.
In 2022, AWS commissioned a study conducted by the American Productivity and Quality Center (APQC) to quantify the Business Value of Customer 360. The following figure shows some of the metrics derived from the study. Organizations using C360 achieved 43.9% reduction in sales cycle duration, 22.8% increase in customer lifetime value, 25.3% faster time to market, and 19.1% improvement in net promoter score (NPS) rating.
Without C360, businesses face missed opportunities, inaccurate reports, and disjointed customer experiences, leading to customer churn. However, building a C360 solution can be complicated. A Gartner Marketing survey found only 14% of organizations have successfully implemented a C360 solution, due to lack of consensus on what a 360-degree view means, challenges with data quality, and lack of cross-functional governance structure for customer data.
In this post, we discuss how you can use purpose-built AWS services to create an end-to-end data strategy for C360 to unify and govern customer data that address these challenges. We structure it in five pillars that power C360: data collection, unification, analytics, activation, and data governance, along with a solution architecture that you can use for your implementation.
The five pillars of a mature C360
When you embark on creating a C360, you work with multiple use cases, types of customer data, and users and applications that require different tools. Building a C360 on the right datasets, adding new datasets over time while maintaining the quality of data, and keeping it secure needs an end-to-end data strategy for your customer data. You also need to provide tools that make it straightforward for your teams to build products that mature your C360.
We recommend building your data strategy around five pillars of C360, as shown in the following figure. This starts with basic data collection, unifying and linking data from various channels related to unique customers, and progresses towards basic to advanced analytics for decision-making, and personalized engagement through various channels. As you mature in each of these pillars, you progress towards responding to real-time customer signals.
The following diagram illustrates the functional architecture that combines the building blocks of a Customer Data Platform on AWS with additional components used to design an end-to-end C360 solution. This is aligned to the five pillars we discuss in this post.
Pillar 1: Data collection
As you start building your customer data platform, you have to collect data from various systems and touchpoints, such as your sales systems, customer support, web and social media, and data marketplaces. Think of the data collection pillar as a combination of ingestion, storage, and processing capabilities.
Data ingestion
You have to build ingestion pipelines based on factors like types of data sources (on-premises data stores, files, SaaS applications, third-party data), and flow of data (unbounded streams or batch data). AWS provides different services for building data ingestion pipelines:
AWS Glue is a serverless data integration service that ingests data in batches from on-premises databases and data stores in the cloud. It connects to more than 70 data sources and helps you build extract, transform, and load (ETL) pipelines without having to manage pipeline infrastructure. AWS Glue Data Quality checks for and alerts on poor data, making it straightforward to spot and fix issues before they harm your business.
Amazon AppFlow ingests data from software as a service (SaaS) applications like Google Analytics, Salesforce, SAP, and Marketo, giving you the flexibility to ingest data from more than 50 SaaS applications.
AWS Data Exchange makes it straightforward to find, subscribe to, and use third-party data for analytics. You can subscribe to data products that help enrich customer profiles, for example demographics data, advertising data, and financial markets data.
Amazon Kinesis ingests streaming events in real time from point-of-sales systems, clickstream data from mobile apps and websites, and social media data. You could also consider using Amazon Managed Streaming for Apache Kafka (Amazon MSK) for streaming events in real time.
The following diagram illustrates the different pipelines to ingest data from various source systems using AWS services.
Data storage
Structured, semi-structured, or unstructured batch data is stored in an object storage because these are cost-efficient and durable. Amazon Simple Storage Service (Amazon S3) is a managed storage service with archiving features that can store petabytes of data with eleven 9’s of durability. Streaming data with low latency needs is stored in Amazon Kinesis Data Streams for real-time consumption. This allows immediate analytics and actions for various downstream consumers—as seen with Riot Games’ central Riot Event Bus.
Data processing
Raw data is often cluttered with duplicates and irregular formats. You need to process this to make it ready for analysis. If you are consuming batch data and streaming data, consider using a framework that can handle both. A pattern such as the Kappa architecture views everything as a stream, simplifying the processing pipelines. Consider using Amazon Managed Service for Apache Flink to handle the processing work. With Managed Service for Apache Flink, you can clean and transform the streaming data and direct it to the appropriate destination based on latency requirements. You can also implement batch data processing using Amazon EMR on open source frameworks such as Apache Spark at 3.5 times better performance than the self-managed version. The architecture decision of using a batch or streaming processing system will depend on various factors; however, if you want to enable real-time analytics on your customer data, we recommend using a Kappa architecture pattern.
Pillar 2: Unification
To link the diverse data arriving from various touchpoints to a unique customer, you need to build an identity processing solution that identifies anonymous logins, stores useful customer information, links them to external data for better insights, and groups customers in domains of interest. Although the identity processing solution helps build the unified customer profile, we recommend considering this as part of your data processing capabilities. The following diagram illustrates the components of such a solution.
The key components are as follows:
Identity resolution – Identity resolution is a deduplication solution, where records are matched to identify a unique customer and prospects by linking multiple identifiers such as cookies, device identifiers, IP addresses, email IDs, and internal enterprise IDs to a known person or anonymous profile using privacy-compliant methods. This can be achieved using AWS Entity Resolution, which enables using rules and machine learning (ML) techniques to match records and resolve identities. Alternatively, you can build identity graphs using Amazon Neptune for a single unified view of your customers.
Profile aggregation – When you’ve uniquely identified a customer, you can build applications in Managed Service for Apache Flink to consolidate all their metadata, from name to interaction history. Then, you transform this data into a concise format. Instead of showing every transaction detail, you can offer an aggregated spend value and a link to their Customer Relationship Management (CRM) record. For customer service interactions, provide an average CSAT score and a link to the call center system for a deeper dive into their communication history.
Profile enrichment – After you resolve a customer to a single identity, enhance their profile using various data sources. Enrichment typically involves adding demographic, behavioral, and geolocation data. You can use third-party data products from AWS Marketplace delivered through AWS Data Exchange to gain insights on income, consumption patterns, credit risk scores, and many more dimensions to further refine the customer experience.
Customer segmentation – After uniquely identifying and enriching a customer’s profile, you can segment them based on demographics like age, spend, income, and location using applications in Managed Service for Apache Flink. As you advance, you can incorporate AI services for more precise targeting techniques.
After you have done the identity processing and segmentation, you need a storage capability to store the unique customer profile and provide search and query capabilities on top of it for downstream consumers to use the enriched customer data.
The following diagram illustrates the unification pillar for a unified customer profile and single view of the customer for downstream applications.
Unified customer profile
Graph databases excel in modeling customer interactions and relationships, offering a comprehensive view of the customer journey. If you are dealing with billions of profiles and interactions, you can consider using Neptune, a managed graph database service on AWS. Organizations such as Zeta and Activision have successfully used Neptune to store and query billions of unique identifiers per month and millions of queries per second at millisecond response time.
Single customer view
Although graph databases provide in-depth insights, yet they can be complex for regular applications. It is prudent to consolidate this data into a single customer view, serving as a primary reference for downstream applications, ranging from ecommerce platforms to CRM systems. This consolidated view acts as a liaison between the data platform and customer-centric applications. For such purposes, we recommend using Amazon DynamoDB for its adaptability, scalability, and performance, resulting in an up-to-date and efficient customer database. This database will accept a lot of write queries back from the activation systems that learn new information about the customers and feed them back.
Pillar 3: Analytics
The analytics pillar defines capabilities that help you generate insights on top of your customer data. Your analytics strategy applies to the wider organizational needs, not just C360. You can use the same capabilities to serve financial reporting, measure operational performance, or even monetize data assets. Strategize based on how your teams explore data, run analyses, wrangle data for downstream requirements, and visualize data at different levels. Plan on how you can enable your teams to use ML to move from descriptive to prescriptive analytics.
The AWS modern data architecture shows a way to build a purpose-built, secure, and scalable data platform in the cloud. Learn from this to build querying capabilities across your data lake and the data warehouse.
The following diagram breaks down the analytics capability into data exploration, visualization, data warehousing, and data collaboration. Let’s find out what role each of these components play in the context of C360.
Data exploration
Data exploration helps unearth inconsistencies, outliers, or errors. By spotting these early on, your teams can have cleaner data integration for C360, which in turn leads to more accurate analytics and predictions. Consider the personas exploring the data, their technical skills, and the time to insight. For instance, data analysts who know to write SQL can directly query the data residing in Amazon S3 using Amazon Athena. Users interested in visual exploration can do so using AWS Glue DataBrew. Data scientists or engineers can use Amazon EMR Studio or Amazon SageMaker Studio to explore data from the notebook, and for a low-code experience, you can use Amazon SageMaker Data Wrangler. Because these services directly query S3 buckets, you can explore the data as it lands in the data lake, reducing time to insight.
Visualization
Turning complex datasets into intuitive visuals unravels hidden patterns in the data, and is crucial for C360 use cases. With this capability, you can design reports for different levels catering to varying needs: executive reports offering strategic overviews, management reports highlighting operational metrics, and detailed reports diving into the specifics. Such visual clarity helps your organization make informed decisions across all tiers, centralizing the customer’s perspective.
The following diagram shows a sample C360 dashboard built on Amazon QuickSight. QuickSight offers scalable, serverless visualization capabilities. You can benefit from its ML integrations for automated insights like forecasting and anomaly detection or natural language querying with Amazon Q in QuickSight, direct data connectivity from various sources, and pay-per-session pricing. With QuickSight, you can embed dashboards to external websites and applications, and the SPICE engine enables rapid, interactive data visualization at scale. The following screenshot shows an example C360 dashboard built on QuickSight.
Data warehouse
Data warehouses are efficient in consolidating structured data from multifarious sources and serving analytics queries from a large number of concurrent users. Data warehouses can provide a unified, consistent view of a vast amount of customer data for C360 use cases. Amazon Redshift addresses this need by adeptly handling large volumes of data and diverse workloads. It provides strong consistency across datasets, allowing organizations to derive reliable, comprehensive insights about their customers, which is essential for informed decision-making. Amazon Redshift offers real-time insights and predictive analytics capabilities for analyzing data from terabytes to petabytes. With Amazon Redshift ML, you can embed ML on top of the data stored in the data warehouse with minimum development overhead. Amazon Redshift Serverless simplifies application building and makes it straightforward for companies to embed rich data analytics capabilities.
Data collaboration
You can securely collaborate and analyze collective datasets from your partners without sharing or copying one another’s underlying data using AWS Clean Rooms. You can bring together disparate data from across engagement channels and partner datasets to form a 360-degree view of your customers. AWS Clean Rooms can enhance C360 by enabling use cases like cross-channel marketing optimization, advanced customer segmentation, and privacy-compliant personalization. By safely merging datasets, it offers richer insights and robust data privacy, meeting business needs and regulatory standards.
Pillar 4: Activation
The value of data diminishes the older it gets, leading to higher opportunity costs over time. In a survey conducted by Intersystems, 75% of the organizations surveyed believe untimely data inhibited business opportunities. In another survey, 58% of organizations (out of 560 respondents of HBR Advisory council and readers) stated they saw an increase in customer retention and loyalty using real-time customer analytics.
You can achieve a maturity in C360 when you build the ability to act on all the insights acquired from the previous pillars we discussed in real time. For example, at this maturity level, you can act on customer sentiment based on the context you automatically derived with an enriched customer profile and integrated channels. For this you need to implement prescriptive decision-making on how to address the customer’s sentiment. To do this at scale, you have to use AI/ML services for decision-making. The following diagram illustrates the architecture to activate insights using ML for prescriptive analytics and AI services for targeting and segmentation.
Use ML for the decision-making engine
With ML, you can improve the overall customer experience—you can create predictive customer behavior models, design hyper-personalized offers, and target the right customer with the right incentive. You can build them using Amazon SageMaker, which features a suite of managed services mapped to the data science lifecycle, including data wrangling, model training, model hosting, model inference, model drift detection, and feature storage. SageMaker enables you to build and operationalize your ML models, infusing them back into your applications to produce the right insight to the right person at the right time.
Activate channels across marketing, advertising, direct-to-consumer, and loyalty
Now that you know who your customers are and who to reach out to, you can build solutions to run targeting campaigns at scale. With Amazon Pinpoint, you can personalize and segment communications to engage customers across multiple channels. For example, you can use Amazon Pinpoint to build engaging customer experiences through various communication channels like email, SMS, push notifications, and in-app notifications.
Pillar 5: Data governance
Establishing the right governance that balances control and access gives users trust and confidence in data. Imagine offering promotions on products that a customer doesn’t need, or bombarding the wrong customers with notifications. Poor data quality can lead to such situations, and ultimately results in customer churn. You have to build processes that validate data quality and take corrective actions. AWS Glue Data Quality can help you build solutions that validate the quality of data at rest and in transit, based on predefined rules.
To set up a cross-functional governance structure for customer data, you need a capability for governing and sharing data across your organization. With Amazon DataZone, admins and data stewards can manage and govern access to data, and consumers such as data engineers, data scientists, product managers, analysts, and other business users can discover, use, and collaborate with that data to drive insights. It streamlines data access, letting you find and use customer data, promotes team collaboration with shared data assets, and provides personalized analytics either via a web app or API on a portal. AWS Lake Formation makes sure data is accessed securely, guaranteeing the right people see the right data for the right reasons, which is crucial for effective cross-functional governance in any organization. Business metadata is stored and managed by Amazon DataZone, which is underpinned by technical metadata and schema information, which is registered in the AWS Glue Data Catalog. This technical metadata is also used both by other governance services such as Lake Formation and Amazon DataZone, and analytics services such as Amazon Redshift, Athena, and AWS Glue.
Bringing it all together
Using the following diagram as a reference, you can create projects and teams for building and operating different capabilities. For example, you can have a data integration team focus on the data collection pillar—you can then align functional roles, like data architects and data engineers. You can build your analytics and data science practices to focus on the analytics and activation pillars, respectively. Then you can create a specialized team for customer identity processing and for building the unified view of the customer. You can establish a data governance team with data stewards from different functions, security admins, and data governance policymakers to design and automate policies.
Conclusion
Building a robust C360 capability is fundamental for your organization to gain insights into your customer base. AWS Databases, Analytics, and AI/ML services can help streamline this process, providing scalability and efficiency. Following the five pillars to guide your thinking, you can build an end-to-end data strategy that defines the C360 view across the organization, makes sure data is accurate, and establishes cross-functional governance for customer data. You can categorize and prioritize the products and features you have to build within each pillar, select the right tool for the job, and build the skills you need in your teams.
Visit AWS for Data Customer Stories to learn how AWS is transforming customer journeys, from the world’s largest enterprises to growing startups.
About the Authors
Ismail Makhlouf is a Senior Specialist Solutions Architect for Data Analytics at AWS. Ismail focuses on architecting solutions for organizations across their end-to-end data analytics estate, including batch and real-time streaming, big data, data warehousing, and data lake workloads. He primarily works with organizations in retail, ecommerce, FinTech, HealthTech, and travel to achieve their business objectives with well architected data platforms.
Sandipan Bhaumik(Sandi) is a Senior Analytics Specialist Solutions Architect at AWS. He helps customers modernize their data platforms in the cloud to perform analytics securely at scale, reduce operational overhead, and optimize usage for cost-effectiveness and sustainability.
This post is written by Robert Northard – AWS Container Specialist Solutions Architect, and Carlos Manzanedo Rueda – AWS WW SA Leader for Efficient Compute
Karpenter is an open source node lifecycle management project built for Kubernetes. In this post, you will learn how to use the new Spot-to-Spot consolidation functionality released in Karpenter v0.34.0, which helps further optimize your cluster. Amazon Elastic Compute Cloud (Amazon EC2) Spot Instances are spare Amazon EC2 capacity available for up to 90% off compared to On-Demand prices. One difference between On-Demand and Spot is that Spot Instances can be interrupted by Amazon EC2 when the capacity is needed back. Karpenter’s built-in support for Spot Instances allows users to seamlessly implement Spot best practices and helps users optimize the cost of stateless, fault tolerant workloads. For example, when Karpenter observes a Spot interruption, it automatically starts a new node in response.
The Kubernetes scheduler assigns pods to nodes based on their scheduling constraints. Over time, as workloads are scaled out and scaled in or as new instances join and leave, the cluster placement and instance load might end up not being optimal. In many cases, it results in unnecessary extra costs. Karpenter has a consolidation feature that improves cluster placement by identifying and taking action in situations such as:
when a node is empty
when a node can be removed as the pods that are running on it can be rescheduled into other existing nodes
when the number of pods in a node has gone down and the node can now be replaced with a lower-priced and rightsized variant (which is shown in the following figure)
Karpenter consolidation, replacing one 2xlarge Amazon EC2 Instance with an xlarge Amazon EC2 Instance.
Karpenter versions prior to v0.34.0 only supported consolidation for Amazon EC2 On-Demand Instances. On-Demand consolidation allowed consolidating from On-Demand into Spot Instances and to lower-priced On-Demand Instances. However, once a pod was placed on a Spot Instance, Spot nodes were only removed when the nodes were empty. In v0.34.0, you can enable the feature gate to use Spot-to-Spot consolidation.
Solution overview
When launching Spot Instances, Karpenter uses the price-capacity-optimized allocation strategy when calling the Amazon EC2 instant Fleet API (shown in the following figure) and passes in a selection of compute instance types based on the Karpenter NodePool configuration. The Amazon EC2 Fleet API in instant mode is a synchronous API call that immediately returns a list of instances that launched and any instance that could not be launched. For any instances that could not be launched, Karpenter might request alternative capacity or remove any soft Kubernetes scheduling constraints for the workload.
Karpenter instance orchestration
Spot-to-Spot consolidation needed an approach that was different from On-Demand consolidation. For On-Demand consolidation, rightsizing and lowest price are the main metrics used. For Spot-to-Spot consolidation to take place, Karpenter requires a diversified instance configuration (see the example NodePool defined in the walkthrough) with at least 15 instances types. Without this constraint, there would be a risk of Karpenter selecting an instance that has lower availability and, therefore, higher frequency of interruption.
Prerequisites
The following prerequisites are required to complete the walkthrough:
Enable replacement with Spot consolidation through the SpotToSpotConsolidation feature gate. This can be enabled during a helm install of the Karpenter chart by adding –-set settings.featureGates.spotToSpotConsolidation=true argument.
Install kubectl, the Kubernetes command line tool for communicating with the Kubernetes control plane API, and kubectl context configured with Cluster Operator and Cluster Developer permissions.
Walkthrough
The following walkthrough guides you through the steps for simulating Spot-to-Spot consolidation.
1. Create a Karpenter NodePool and EC2NodeClass
Create a Karpenter NodePool and EC2NodeClass. Replace the following with your own values. If you used the Karpenter Getting Started Guide to create your installation, then the value would be your cluster name.
Replace <karpenter-discovery-tag-value> with your subnet tag for Karpenter subnet and security group auto-discovery.
The NodePool definition demonstrates a flexible configuration with instances from the C, M, or R EC2 instance families. The configuration is restricted to use smaller instance sizes but is still diversified as much as possible. For example, this might be needed in scenarios where you deploy observability DaemonSets. If your workload has specific requirements, then see the supported well-known labels in the Karpenter documentation.
2. Deploy a sample workload
Deploy a sample workload by running the following command. This command creates a Deployment with five pod replicas using the pause container image:
Next, check the Kubernetes nodes by running a kubectl get nodes CLI command. The capacity pool (instance type and Availability Zone) selected depends on any Kubernetes scheduling constraints and spare capacity size. Therefore, it might differ from this example in the walkthrough. You can see Karpenter launched a new node of instance type c6g.2xlarge, an AWS Graviton2-based instance, in the eu-west-1c Region:
$ kubectl get nodes -L karpenter.sh/nodepool -L node.kubernetes.io/instance-type -L topology.kubernetes.io/zone -L karpenter.sh/capacity-type

NAME                                     STATUS   ROLES    AGE   VERSION               NODEPOOL   INSTANCE-TYPE   ZONE         CAPACITY-TYPE
ip-10-0-12-17.eu-west-1.compute.internal Ready    <none>   80s   v1.29.0-eks-a5ec690   default    c6g.2xlarge     eu-west-1c   spot
3. Scale in a sample workload to observe consolidation
To invoke a Karpenter consolidation event scale, inflate the deployment to 1. Run the following command:
kubectl scale --replicas=1 deployment/inflate
Tail the Karpenter logs by running the following command. If you installed Karpenter in a different Kubernetes namespace, then replace the name for the -n argument in the command:
After a few seconds, you should see the following disruption via consolidation message in the Karpenter logs. The message indicates the c6g.2xlarge Spot node has been targeted for replacement and Karpenter has passed the following 15 instance types—m6gd.xlarge, m5dn.large, c7a.xlarge, r6g.large, r6a.xlarge and 10 other(s)—to the Amazon EC2 Fleet API:
{"level":"INFO","time":"2024-02-19T12:09:50.299Z","logger":"controller.disruption","message":"disrupting via consolidation replace, terminating 1 candidates ip-10-0-12-181.eu-west-1.compute.internal/c6g.2xlarge/spot and replacing with spot node from types m6gd.xlarge, m5dn.large, c7a.xlarge, r6g.large, r6a.xlarge and 10 other(s)","commit":"17d6c05","command-id":"60f27cb5-98fa-40fb-8231-05b31fd41892"}
Check the Kubernetes nodes by running the following kubectl get nodes CLI command. You can see that Karpenter launched a new node of instance type c6g.large:
$ kubectl get nodes -L karpenter.sh/nodepool -L node.kubernetes.io/instance-type -L topology.kubernetes.io/zone -L karpenter.sh/capacity-type

NAME                                      STATUS   ROLES    AGE   VERSION               NODEPOOL   INSTANCE-TYPE ZONE       CAPACITY-TYPE
ip-10-0-12-156.eu-west-1.compute.internal           Ready    <none>   2m1s   v1.29.0-eks-a5ec690   default    c6g.large       eu-west-1c   spot
Use kubectl get nodeclaims to list all objects of type NodeClaim and then describe the NodeClaim Kubernetes resource using kubectl get nodeclaim/<claim-name> -o yaml. In the NodeClaim .spec.requirements, you can also see the 15 instance types passed to the Amazon EC2 Fleet API:
What would happen if a Spot node could not be consolidated?
If a Spot node cannot be consolidated because there are not 15 instance types in the compute selection, then the following message will appear in the events for the NodeClaim object. You might get this event if you overly constrained your instance type selection:
Normal Unconsolidatable 31s karpenter SpotToSpotConsolidation requires 15 cheaper instance type options than the current candidate to consolidate, got 1
Spot best practices with Karpenter
The following are some best practices to consider when using Spot Instances with Karpenter.
Avoid overly constraining instance type selection: Karpenter selects Spot Instances using the price-capacity-optimized allocation strategy, which balances the price and availability of AWS spare capacity. Although a minimum of 15 instances are needed, you should avoid constraining instance types as much as possible. By not constraining instance types, there is a higher chance of acquiring Spot capacity at large scales with a lower frequency of Spot Instance interruptions at a lower cost.
Gracefully handle Spot interruptions and consolidation actions: Karpenter natively handles Spot interruption notifications by consuming events from an Amazon Simple Queue Service (Amazon SQS) queue, which is populated with Spot interruption notifications through Amazon EventBridge. As soon as Karpenter receives a Spot interruption notification, it gracefully drains the interrupted node of any running pods while also provisioning a new node for which those pods can schedule. With Spot Instances, this process needs to complete within 2 minutes. For a pod with a termination period longer than 2 minutes, the old node will be interrupted prior to those pods being rescheduled. To test a replacement node, AWS Fault Injection Service (FIS) can be used to simulate Spot interruptions.
Carefully configure resource requests and limits for workloads: Rightsizing and optimizing your cluster is a shared responsibility. Karpenter effectively optimizes and scales infrastructure, but the end result depends on how well you have rightsized your pod requests and any other Kubernetes scheduling constraints. Karpenter does not consider limits or resource utilization. For most workloads with non-compressible resources, such as memory, it is generally recommended to set requests==limits because if a workload tries to burst beyond the available memory of the host, an out-of-memory (OOM) error occurs. Karpenter consolidation can increase the probability of this as it proactively tries to reduce total allocatable resources for a Kubernetes cluster. For help with rightsizing your Kubernetes pods, consider exploring Kubecost, Vertical Pod Autoscaler configured in recommendation mode, or an open source tool such as Goldilocks.
Configure metrics for Karpenter: Karpenter emits metrics in the Prometheus format, so consider using Amazon Managed Service for Prometheus to track interruptions caused by Karpenter Drift, consolidation, Spot interruptions, or other Amazon EC2 maintenance events. These metrics can be used to confirm that interruptions are not having a significant impact on your service’s availability and monitor NodePool usage and pod lifecycles. The Karpenter Getting Started Guide contains an example Grafana dashboard configuration.
You can learn more about other application best practices in the Reliability section of the Amazon EKS Best Practices Guide.
Cleanup
To avoid incurring future charges, delete any resources you created as part of this walkthrough. If you followed the Karpenter Getting Started Guide to set up a cluster and add Karpenter, follow the clean-up instructions in the Karpenter documentation to delete the cluster. Alternatively, if you already had a cluster with Karpenter, delete the resources created as part of this walkthrough:
In this post, you learned how Karpenter can actively replace a Spot node with another more cost-efficient Spot node. Karpenter can consolidate Spot nodes that have the right balance between lower price and low-frequency interruptions when there are at least 15 selectable instances to balance price and availability.
To get started, check out the Karpenter documentation as well as Karpenter Blueprints, which is a repository including common workload scenarios following the best practices.
You can share your feedback on this feature by a raising a GitHub Issue.
In the evolving regulatory landscape, organizations operating within the EU must navigate through a complex web of regulations and directives, including NIS2 (Network & Information System) Directive, CER (Critical Entities Resilience) Directive, DORA (Digital Operational Resilience Act) and GDPR (General Data Protection Regulation). Each of these frameworks has a distinct focus, from enhancing cybersecurity and operational resilience to protecting personal data and ensuring the resilience of critical entities.
This guide outlines the essential aspects of DORA (EU) 2022/2554, GDPR (EU) 2016/679, NIS2 (EU) 2022/2555 directive and the CER/RCE (EU) 2022/2557 directive, including their scope, objectives, key requirements, sanctions for non-compliance, implementation deadlines, technical and organizational measures, key differencesand compliance intersections.
Scope and Applicability
NIS2 (Network & Information System) Directive : Applies to essential and important entities across various sectors expanding the scope of its predecessor, the NIS Directive.
Essential entities include sectors such as energy (including electricity, oil, and gas), transport (air, rail, water and road), banking, financial market infrastructures, health care, drinking water, wastewater, and digital infrastructure. Essential entities are those whose disruption would cause significant impacts on public safety, security, or economic or societal activities.
Important Entities covers postal and courier services, waste management, manufacture, production and distribution of chemicals, food production, distribution and sale, manufacturing of medical devices, computers and electronics, machinery equipment, motor vehicles, digital providers such as online marketplaces, online search engines, and social networking services platforms, and certain entities within the public administration sector.
DORA (Digital Operational Resilience Act): Specifically focuses on the resilience of the financial sector to ICT risks, encompassing a wide range of entities that play pivotal roles in the financial ecosystem. This includes credit institutions, investment firms, insurance and reinsurance companies, payment institutions, electronic money institutions, crypto-asset service providers, central securities depositories, central counterparties, trading venues, managers of alternative investment funds and management companies of undertakings for collective investment in transferable securities (UCITS). Additionally, it covers ICT third-party service providers to these financial entities, emphasizing the importance of digital operational resilience not just within financial entities themselves but also within their extended digital supply chains.
GDPR (General Data Protection Regulation): Has a global reach, affecting any organization that processes personal data of EU citizens, focusing on data protection and privacy regardless of the sector.
CER (Critical Entities Resilience) Directive: Aims to enhance the resilience of critical entities operating in vital sectors such as energy, transport, banking, financial market infrastructure, health, drinking water, waste water, public administration, space, digital infrastructure, production, processing and distribution of food sector within the EU.
Objectives
NIS2 Directive: Seeks to significantly raise cybersecurity standards and improve incident response capabilities across the EU.
DORA: Ensures that the financial sector can withstand, respond to, and recover from ICT-related disruptions and threats.
GDPR: Protects EU citizens’ personal data, ensuring privacy and giving individuals control over their personal information.
CER Directive: Focuses on enhancing the overall resilience of entities that are critical to the maintenance of vital societal or economic activities against a range of non-cyber and cyber threats.
Key Requirements
NIS2 Directive: Mandates robust risk management measures, timely incident reporting, supply chain security and resilience testing among affected entities.
DORA: Requires financial entities to establish comprehensive ICT risk management frameworks, report significant ICT-related incidents, conduct resilience testing and manage risks related to third-party ICT service providers.
GDPR: Enforces principles such as lawful processing, data minimization and transparency; upholds data subjects’ rights; mandates data breach notifications; and requires data protection measures to be embedded in business processes.
CER Directive: Calls for national risk assessments, enhanced security measures, incident notification, and crisis management for critical entities, ensuring they can maintain essential services under adverse conditions.
Sanctions and Penalties
NIS2 Directive: The directive suggests Member States ensure that penalties for non-compliance are effective, proportionate, and dissuasive, but does not specify amounts, leaving it to individual Member States to set.
DORA: Specific sanctions and penalties are not detailed, implying that penalties would be defined at the Member State level or in subsequent regulatory guidance.
GDPR: Known for its strict penalties, organizations can face fines up to €20 million or 4% of their total global turnover, whichever is higher.
CER Directive: Similar to NIS2, the CER Directive leaves the specifics of sanctions and penalties to Member States, emphasizing the need for them to be effective, proportionate, and dissuasive.
Implementation Deadline Date
NIS2 Directive: Member States are required to transpose and apply the measures of the NIS2 Directive by 18 October 2024 .
DORA: The regulation will become applicable from 17 January 2025, marking the deadline for entities within the financial sector to comply with its requirements .
GDPR: This regulation has been in effect since 25 May 2018, requiring immediate compliance from the effective date.
CER Directive: Similar to NIS2, the CER Directive must be transposed and applied by Member States by 18 October 2024 .
Key Differences
While NIS2, DORA, GDPR and CER directives and regulations share common goals related to security and privacy, they differ significantly in their primary focus and applicability:
NIS2 Directive primarily enhances cybersecurity across various critical sectors, emphasizing sector-specific risk management and incident reporting.
DORA focuses on the financial sector’s digital operational resilience, detailing ICT risk management and third-party risk, specific to financial services.
GDPR is dedicated to personal data protection, granting extensive rights to individuals regarding their data, applicable across all sectors.
CER Directive aims to ensure the resilience of entities vital for societal and economic well-being, focusing on both cyber and physical resilience measures.
Overlapping Areas
Despite their differences, these frameworks overlap in several key areas, allowing for synergistic compliance efforts:
Risk Management: NIS2, DORA and the CER Directive all emphasize robust risk management, albeit with different focal points (cybersecurity, ICT and critical entity resilience, respectively).
Incident Reporting: NIS2 and DORA require incident reporting within their respective domains, which can streamline processes for entities covered by both.
Data Protection Measures: GDPR’s data protection principles can complement the cybersecurity measures under NIS2 and CER, enhancing overall data security.
Incident Response and Recovery
NIS2 Directive: Requires entities to have incident response capabilities in place, ensuring timely detection, analysis, and response to incidents. It emphasizes the need for recovery plans to restore services after an incident.
DORA: Mandates financial entities to establish and implement an incident management process capable of responding swiftly to ICT-related incidents, including recovery objectives, restoration of systems, and lessons learned activities.
GDPR: While not explicitly detailing incident response processes, GDPR mandates notification of personal data breaches to supervisory authorities and, in certain cases, to the affected individuals, highlighting the need for an effective response mechanism.
CER Directive: Stresses the importance of having incident response plans, ensuring critical entities can quickly respond to and recover from disruptive incidents, maintaining essential services.
Technical and Organizational Measures
NIS2 Directive: Entities should incorporate state-of-the-art cybersecurity solutions like advanced threat detection systems, comprehensive data encryption, secure network configurations and regular security assessments to safeguard sensitive information. Additional technical measures might include continuous monitoring and anomaly detection systems to identify suspicious activities in real time, and the implementation of Security Information and Event Management (SIEM) systems and next-generation firewalls (NGFWs). Organizational strategies involve establishing a robust cybersecurity governance framework, conducting frequent cybersecurity awareness training, and formulating clear policies for effective incident response and thorough business continuity planning.
DORA: For compliance with DORA, financial entities are advised to utilize secure communication protocols and robust encryption for protecting data during transmission and storage, supplemented by multi-factor authentication systems to enhance access security. Additional technical measures could involve the deployment of advanced cybersecurity tools like Security Information and Event Management (SIEM) systems for integrated threat analysis and response, and next-generation firewalls (NGFWs). On the organizational front, setting up a dedicated ICT risk management team, clearly defining cybersecurity roles, and embedding cybersecurity risk considerations into the overarching risk management framework are essential.
GDPR: In alignment with GDPR, technical safeguards such as strong data encryption, pseudonymization of personal data where feasible, and stringent access control mechanisms are pivotal. Expanding on these, additional technical measures may include the use of Data Loss Prevention (DLP) tools to prevent unauthorized data disclosure or loss and employing regular penetration testing to identify and rectify vulnerabilities. Organizational measures encompass the implementation of comprehensive data protection policies, conducting DPIAs for high-risk data processing activities, and appointing a Data Protection Officer in specific scenarios to oversee data protection strategies and compliance.
CER Directive: Adhering to the CER Directive involves applying network segmentation to isolate and protect critical systems, utilizing intrusion detection and prevention systems, and ensuring resilient data backup and recovery strategies. Enhancing these measures, technical strategies could also include the deployment of next-generation firewalls (NGFWs) and the use of automated patch management systems to ensure timely application of security updates. Organizational approaches include developing a detailed incident management plan, establishing a dedicated crisis management team, and conducting regular resilience testing and drills to validate and improve recovery processes.
Compliance Intersections and Synergies
While each framework has its unique focus, there are notable intersections, particularly in the areas of risk management, incident reporting, and the overarching emphasis on security and resilience. For instance, the risk management strategies advocated by NIS2 and the CER Directive can complement the ICT risk management framework of DORA. GDPR’s requirement for data protection by design and default can also support the cybersecurity measures outlined in NIS2 and CER, promoting a secure and privacy-focused operational environment. Furthermore, the incident reporting mechanisms mandated by both NIS2 and DORA underscore a shared commitment to transparency and accountability in the face of security incidents, which can drive improvements in organizational responses to breaches, including those involving personal data under GDPR. This alignment not only streamlines compliance processes but also fortifies the organization’s overall security framework, enhancing its ability to protect against and respond to cyber threats and operational disruptions. By recognizing and acting upon these synergies, organizations can more effectively allocate resources, avoid duplicative efforts, and foster a culture of continuous improvement in cybersecurity and data protection practices.
Conclusion
Understanding the nuances and requirements of NIS2, DORA, GDPR, and the CER Directive is crucial for organizations operating within the EU, especially those that fall under the scope of multiple frameworks. By recognizing the overlaps and leveraging synergies between these regulations and directives, organizations can streamline their compliance efforts, enhance their operational resilience and data protection measures, and contribute to a safer, more secure digital and physical environment within the EU. This integrated approach not only ensures regulatory compliance but also builds a strong foundation of trust with customers, stakeholders, and regulatory bodies.
For streamlined compliance with EU directives like NIS2, DORA and GDPR, Nebosystems offers expert services tailored to your needs. Learn more about our cybersecurity solutions or get in touch directly.
You’re browsing your inbox and spot an email that looks like it’s from a brand you trust. Yet, something feels off. This might be a phishing attempt, a common tactic where cybercriminals impersonate reputable entities — we’ve written about the top 50 most impersonated brands used in phishing attacks. One factor that can be used to help evaluate the email’s legitimacy is its Top-Level Domain (TLD) — the part of the email address that comes after the dot.
In this analysis, we focus on the TLDs responsible for a significant share of malicious or spam emails since January 2023. For the purposes of this blog post, we are considering malicious email messages to be equivalent to phishing attempts. With an average of 9% of 2023’s emails processed by Cloudflare’s Cloud Email Security service marked as spam and 3% as malicious, rising to 4% by year-end, we aim to identify trends and signal which TLDs have become more dubious over time. Keep in mind that our measurements represent where we observe data across the email delivery flow. In some cases, we may be observing after initial filtering has taken place, at a point where missed classifications are likely to cause more damage. This information derived from this analysis could serve as a guide for Internet users, corporations, and geeks like us, searching for clues, as Internet detectives, in identifying potential threats. To make this data readily accessible, Cloudflare Radar, our tool for Internet insights, now includes a new section dedicated to email security trends.
Cyber attacks often leverage the guise of authenticity, a tactic Cloudflare thwarted following a phishing scheme similar to the one that compromised Twilio in 2022. The US Cybersecurity and Infrastructure Security Agency (CISA) notes that 90% of cyber attacks start with phishing, and fabricating trust is a key component of successful malicious attacks. We see there are two forms of authenticity that attackers can choose to leverage when crafting phishing messages, visual and organizational. Attacks that leverage visual authenticity rely on attackers using branding elements, like logos or images, to build credibility. Organizationally authentic campaigns rely on attackers using previously established relationships and business dynamics to establish trust and be successful.
Our findings from 2023 reveal that recently introduced generic TLDs (gTLDs), including several linked to the beauty industry, are predominantly used both for spam and malicious attacks. These TLDs, such as .uno, .sbs, and .beauty, all introduced since 2014, have seen over 95% of their emails flagged as spam or malicious. Also, it’s important to note that in terms of volume, “.com” accounts for 67% of all spam and malicious emails (more on that below).
TLDs
2023 Spam %
2023 Malicious %
2023 Spam + malicious %
TLD creation
.uno
62%
37%
99%
2014
.sbs
64%
35%
98%
2021
.best
68%
29%
97%
2014
.beauty
77%
20%
97%
2021
.top
74%
23%
97%
2014
.hair
78%
18%
97%
2021
.monster
80%
17%
96%
2019
.cyou
34%
62%
96%
2020
.wiki
69%
26%
95%
2014
.makeup
32%
63%
95%
2021
Email and Top-Level Domains history
In 1971, Ray Tomlinson sent the first networked email over ARPANET, using the @ character in the address. Five decades later, email remains relevant but also a key entry point for attackers.
Before the advent of the World Wide Web, email standardization and growth in the 1980s, especially within academia and military communities, led to interoperability. Fast forward 40 years, and this interoperability is once again a hot topic, with platforms like Threads, Mastodon, and other social media services aiming for the open communication that Jack Dorsey envisioned for Twitter. So, in 2024, it’s clear that social media, messaging apps like Slack, Teams, Google Chat, and others haven’t killed email, just as “video didn’t kill the radio star.”
The structure of a domain name.
The domain name system, managed by ICANN, encompasses a variety of TLDs, from the classic “.com” (1985) to the newer generic options. There are also the country-specific (ccTLDs), where the Internet Assigned Numbers Authority (IANA) is responsible for determining an appropriate trustee for each ccTLD. An extensive 2014 expansion by ICANN was designed to “increase competition and choice in the domain name space,” introducing numerous new options for specific professional, business, and informational purposes, which in turn, also opened up new possibilities for phishing attempts.
3.4 billion unwanted emails
Cloudflare’s Cloud Email Security service is helping protect our customers, and that also comes with insights. In 2022, Cloudflare blocked 2.4 billion unwanted emails, and in 2023 that number rose to over 3.4 billion unwanted emails, 26% of all messages processed. This total includes spam, malicious, and “bulk” (practice of sending a single email message, unsolicited or solicited, to a large number of recipients simultaneously) emails. That means an average of 9.3 million per day, 6500 per minute, 108 per second.
Bear in mind that new customers also make the numbers grow — in this case, driving a 42% increase in unwanted emails from 2022 to 2023. But this gives a sense of scale in this email area. Those unwanted emails can include malicious attacks that are difficult to detect, becoming more frequent, and can have devastating consequences for individuals and businesses that fall victim to them. Below, we’ll give more details on email threats, where malicious messages account for almost 3% of emails averaged across all of 2023 and it shows a growth tendency during the year, with higher percentages in the last months of the year. Let’s take a closer look.
Top phishing TLDs (and types of TLDs)
First, let’s start with an 2023 overview of top level domains with a high percentage of spam and malicious messages. Despite excluding TLDs with fewer than 20,000 emails, our analysis covers unwanted emails considered to be spam and malicious from more than 350 different TLDs (and yes, there are many more).
A quick overview highlights the TLDs with the highest rates of spam and malicious attacks as a proportion of their outbound email, those with the largest volume share of spam or malicious emails, and those with the highest rates of just-malicious and just-spam TLD senders. It reveals that newer TLDs, especially those associated with the beauty industry (generally available since 2021 and serving a booming industry), have the highest rates as a proportion of their emails. However, it’s relevant to recognize that “.com” accounts for 67% of all spam and malicious emails. Malicious emails often originate from recently created generic TLDs like “.bar”, “.makeup”, or “.cyou”, as well as certain country-code TLDs (ccTLDs) employed beyond their geographical implications.
Highest % of spam and malicious emails
Volume share of spam + malicious
Highest % of malicious
Highest % of spam
TLD
Spam + mal %
TLD
Spam + mal %
TLD
Malicious %
TLD
Spam %
.uno
99%
.com
67%
.bar
70%
.autos
93%
.sbs
98%
.shop
5%
.makeup
63%
.today
92%
.best
97%
.net
4%
.cyou
62%
.directory
91%
.beauty
97%
.no
3%
.ml
56%
.boats
87%
.top
97%
.org
2%
.tattoo
54%
.center
85%
.hair
97%
.ru
1%
.om
47%
.monster
80%
.monster
96%
.jp
1%
.cfd
46%
.lol
79%
.cyou
96%
.click
1%
.skin
39%
.hair
78%
.wiki
95%
.beauty
1%
.uno
37%
.shop
78%
.makeup
95%
.cn
1%
.pw
37%
.beauty
77%
Focusing on volume share, “.com” dominates the spam + malicious list at 67%, and is joined in the top 3 by another “classic” gTLD, “.net”, at 4%. They also lead by volume when we look separately at the malicious (68% of all malicious emails are “.com” and “.net”) and spam (71%) categories, as shown below. All of the generic TLDs introduced since 2014 represent 13.4% of spam and malicious and over 14% of only malicious emails. These new TLDs (most of them are only available since 2016) are notable sources of both spam and malicious messages. Meanwhile, country-code TLDs contribute to more than 12% of both categories of unwanted emails.
This breakdown highlights the critical role of both established and new generic TLDs, which surpass older ccTLDs in terms of malicious emails, pointing to the changing dynamics of email-based threats.
Type of TLDs
Spam
Malicious
Spam + malicious
ccTLDs
13%
12%
12%
.com and .net only
71%
68%
71%
new gTLDs
13%
14%
13.4%
That said, “.shop” deserves a highlight of its own. The TLD, which has been available since 2016, is #2 by volume of spam and malicious emails, accounting for 5% of all of those emails. It also represents, when we separate those two categories, 5% of all malicious emails, and 5% of all spam emails. As we’re going to see below, its influence is growing.
Full 2023 top 50 spam & malicious TLDs list
For a more detailed perspective, below we present the top 50 TLDs with the highest percentages of spam and malicious emails during 2023. We also include a breakdown of those two categories.
It’s noticeable that even outside the top 10, other recent generic TLDs are also higher in the ranking, such as “.autos” (the #1 in the spam list), “.today”, “.bid” or “.cam”. TLDs that seem to promise entertainment or fun or are just leisure or recreational related (including “.fun” itself), occupy a position in our top 50 ranking.
2023 Top 50 spam & malicious TLDs (by highest %)
Rank
TLD
Spam %
Malicious %
Spam + malicious %
1
.uno
62%
37%
99%
2
.sbs
64%
35%
98%
3
.best
68%
29%
97%
4
.beauty
77%
20%
97%
5
.top
74%
23%
97%
6
.hair
78%
18%
97%
7
.monster
80%
17%
96%
8
.cyou
34%
62%
96%
9
.wiki
69%
26%
95%
10
.makeup
32%
63%
95%
11
.autos
93%
2%
95%
12
.today
92%
3%
94%
13
.shop
78%
16%
94%
14
.bid
74%
18%
92%
15
.cam
67%
25%
92%
16
.directory
91%
0%
91%
17
.icu
75%
15%
91%
18
.ml
33%
56%
89%
19
.lol
79%
10%
89%
20
.skin
49%
39%
88%
21
.boats
87%
1%
88%
22
.tattoo
34%
54%
87%
23
.click
61%
27%
87%
24
.ltd
70%
17%
86%
25
.rest
74%
11%
86%
26
.center
85%
0%
85%
27
.fun
64%
21%
85%
28
.cfd
39%
46%
84%
29
.bar
14%
70%
84%
30
.bio
72%
11%
84%
31
.tk
66%
17%
83%
32
.yachts
58%
23%
81%
33
.one
63%
17%
80%
34
.ink
68%
10%
78%
35
.wf
76%
1%
77%
36
.no
76%
0%
76%
37
.pw
39%
37%
75%
38
.site
42%
31%
73%
39
.life
56%
16%
72%
40
.homes
62%
10%
72%
41
.services
67%
2%
69%
42
.mom
63%
5%
68%
43
.ir
37%
29%
65%
44
.world
43%
21%
65%
45
.lat
40%
24%
64%
46
.xyz
46%
18%
63%
47
.ee
62%
1%
62%
48
.live
36%
26%
62%
49
.pics
44%
16%
60%
50
.mobi
41%
19%
60%
Change in spam & malicious TLD patterns
Let’s look at TLDs where spam + malicious emails comprised the largest share of total messages from that TLD, and how that list of TLDs changed from the first half of 2023 to the second half. This shows which TLDs were most problematic at different times during the year.
Highlighted in bold in the following table are those TLDs that climbed in the rankings for the percentage of spam and malicious emails from July to December 2023, compared with January to June. Generic TLDs “.uno”, “.makeup” and “.directory” appeared in the top list and in higher positions for the first time in the last six months of the year.
January – June 2023
July – Dec 2023
tld
Spam + malicious %
tld
Spam + malicious %
.click
99%
.uno
99%
.best
99%
.sbs
98%
.yachts
99%
.beauty
97%
.hair
99%
.best
97%
.autos
99%
.makeup
95%
.wiki
98%
.monster
95%
.today
98%
.directory
95%
.mom
98%
.bid
95%
.sbs
97%
.top
93%
.top
97%
.shop
92%
.monster
97%
.today
92%
.beauty
97%
.cam
92%
.bar
96%
.cyou
92%
.rest
95%
.icu
91%
.cam
95%
.boats
88%
.homes
94%
.wiki
88%
.pics
94%
.rest
88%
.lol
94%
.hair
87%
.quest
93%
.fun
87%
.cyou
93%
.cfd
86%
.ink
92%
.skin
85%
.shop
92%
.ltd
84%
.skin
91%
.one
83%
.ltd
91%
.center
83%
.tattoo
91%
.services
81%
.no
90%
.lol
78%
.ml
90%
.wf
78%
.center
90%
.pw
76%
.store
90%
.life
76%
.icu
89%
.click
75%
From the rankings, it’s clear that the recent generic TLDs have the highest spam and malicious percentage of all emails. The top 10 TLDs in both halves of 2023 are all recent and generic, with several introduced since 2021.
Reasons for the prominence of these gTLDs include the availability of domain names that can seem legitimate or mimic well-known brands, as we explain in this blog post. Cybercriminals often use popular or catchy words. Some gTLDs allow anonymous registration. Their low cost and the delay in updated security systems to recognize new gTLDs as spam and malicious sources also play a role — note that, as we’ve seen, cyber criminals also like to change TLDs and methods.
The impact of a lawsuit?
There’s also been a change in the types of domains with the highest malicious percentage in 2023, possibly due to Meta’s lawsuit against Freenom, filed in December 2022 and refiled in March 2023. Freenom provided domain name registry services for free in five ccTLDs, which wound up being used for purposes beyond local businesses or content: “.cf” (Central African Republic), “.ga” (Gabon), “.gq” (Equatorial Guinea), “.ml” (Mali), and “.tk” (Tokelau). However, Freenom stopped new registrations during 2023 following the lawsuit, and in February 2024, announced its decision to exit the domain name business.
Focusing on Freenom TLDs, which appeared in our top 50 ranking only in the first half of 2023, we see a clear shift. Since October, these TLDs have become less relevant in terms of all emails, including malicious and spam percentages. In February 2023, they accounted for 0.17% of all malicious emails we tracked, and 0.04% of all spam and malicious. Their presence has decreased since then, becoming almost non-existent in email volume in September and October, similar to other analyses.
TLDs ordered by volume of spam + malicious
In addition to looking at their share, another way to examine the data is to identify the TLDs that have a higher volume of spam and malicious emails — the next table is ordered that way. This means that we are able to show more familiar (and much older) TLDs, such as “.com”. We’ve included here the percentage of all emails in any given TLD that are classified as spam or malicious, and also spam + malicious to spotlight those that may require more caution. For instance, with high volume “.shop”, “.no”, “.click”, “.beauty”, “.top”, “.monster”, “.autos”, and “.today” stand out with a higher spam and malicious percentage (and also only malicious email percentage).
In the realm of country-code TLDs, Norway’s “.no” leads in spam, followed by China’s “.cn”, Russia’s “.ru”, Ukraine’s “.ua”, and Anguilla’s “.ai”, which recently has been used more for artificial intelligence-related domains than for the country itself.
In bold and red, we’ve highlighted the TLDs where spam + malicious represents more than 20% of all emails in that TLD — already what we consider a high number for domains with a lot of emails.
TLDs with more spam + malicious emails (in volume) in 2023
Rank
TLD
Spam %
Malicious %
Spam + mal %
1
.com
3.6%
0.8%
4.4%
2
.shop
77.8%
16.4%
94.2%
3
.net
2.8%
1.0%
3.9%
4
.no
76.0%
0.3%
76.3%
5
.org
3.3%
1.8%
5.2%
6
.ru
15.2%
7.7%
22.9%
7
.jp
3.4%
2.5%
5.9%
8
.click
60.6%
26.6%
87.2%
9
.beauty
77.0%
19.9%
96.9%
10
.cn
25.9%
3.3%
29.2%
11
.top
73.9%
22.8%
96.6%
12
.monster
79.7%
16.8%
96.5%
13
.de
13.0%
2.1%
15.2%
14
.best
68.1%
29.4%
97.4%
15
.gov
0.6%
2.0%
2.6%
16
.autos
92.6%
2.0%
94.6%
17
.ca
5.2%
0.5%
5.7%
18
.uk
3.2%
0.8%
3.9%
19
.today
91.7%
2.6%
94.3%
20
.io
3.6%
0.5%
4.0%
21
.us
5.7%
1.9%
7.6%
22
.co
6.3%
0.8%
7.1%
23
.biz
27.2%
14.0%
41.2%
24
.edu
0.9%
0.2%
1.1%
25
.info
20.4%
5.4%
25.8%
26
.ai
28.3%
0.1%
28.4%
27
.sbs
63.8%
34.5%
98.3%
28
.it
2.5%
0.3%
2.8%
29
.ua
37.4%
0.6%
38.0%
30
.fr
8.5%
1.0%
9.5%
The curious case of “.gov” email spoofing
When we concentrate our research on message volume to identify TLDs with more malicious emails blocked by our Cloud Email Security service, we discover a trend related to “.gov”.
TLDs ordered by malicious email volume
% of all malicious emails
.com
63%
.net
5%
.shop
5%
.org
3%
.gov
2%
.ru
2%
.jp
2%
.click
1%
.best
0.9%
.beauty
0.8%
The first three domains, “.com” (63%), “.net” (5%), and “.shop” (5%), were previously seen in our rankings and are not surprising. However, in fourth place is “.org”, known for being used by non-profit and other similar organizations, but it has an open registration policy. In fifth place is “.gov”, used only by the US government and administered by CISA. Our investigation suggests that it appears in the ranking because of typical attacks where cybercriminals pretend to be a legitimate address (email spoofing, creation of email messages with a forged sender address). In this case, they use “.gov” when launching attacks.
The spoofing behavior linked to “.gov” is similar to that of other TLDs. It includes fake senders failing SPF validation and other DNS-based authentication methods, along with various other types of attacks. An email failing SPF, DKIM, and DMARC checks typically indicates that a malicious sender is using an unauthorized IP, domain, or both. So, there are more straightforward ways to block spoofed emails without examining their content for malicious elements.
Ranking TLDs by proportions of malicious and spam email in 2023
In this section, we have included two lists: one ranks TLDs by the highest percentage of malicious emails — those you should exercise greater caution with; the second ranks TLDs by just their spam percentage. These contrast with the previous top 50 list ordered by combined spam and malicious percentages. In the case of malicious emails, the top 3 with the highest percentage are all generic TLDs. The #1 was “.bar”, with 70% of all emails being categorized as malicious, followed by “.makeup”, and “.cyou” — marketed as the phrase “see you”.
The malicious list also includes some country-code TLDs (ccTLDs) not primarily used for country-related topics, like .ml (Mali), .om (Oman), and .pw (Palau). The list also includes other ccTLDs such as .ir (Iran) and .kg (Kyrgyzstan), .lk (Sri Lanka).
In the spam realm, it’s “autos”, with 93%, and other generic TLDs such as “.today”, and “.directory” that take the first three spots, also seeing shares over 90%.
2023 ordered by malicious email %
2023 ordered by spam email %
tld
Malicious %
tld
Spam %
.bar
70%
.autos
93%
.makeup
63%
.today
92%
.cyou
62%
.directory
91%
.ml
56%
.boats
87%
.tattoo
54%
.center
85%
.om
47%
.monster
80%
.cfd
46%
.lol
79%
.skin
39%
.hair
78%
.uno
37%
.shop
78%
.pw
37%
.beauty
77%
.sbs
35%
.no
76%
.site
31%
.wf
76%
.store
31%
.icu
75%
.best
29%
.bid
74%
.ir
29%
.rest
74%
.lk
27%
.top
74%
.work
27%
.bio
72%
.click
27%
.ltd
70%
.wiki
26%
.wiki
69%
.live
26%
.best
68%
.cam
25%
.ink
68%
.lat
24%
.cam
67%
.yachts
23%
.services
67%
.top
23%
.tk
66%
.world
21%
.sbs
64%
.fun
21%
.fun
64%
.beauty
20%
.one
63%
.mobi
19%
.mom
63%
.kg
19%
.uno
62%
.hair
18%
.homes
62%
How it stands in 2024: new higher-risk TLDs
2024 has seen new players enter the high-risk zone for unwanted emails. In this list we have only included the new TLDs that weren’t in the top 50 during 2023, and joined the list in January. New entrants include Samoa’s “.ws”, Indonesia’s “.id” (also used because of its “identification” meaning), and the Cocos Islands’ “.cc”. These ccTLDs, often used for more than just country-related purposes, have shown high percentages of malicious emails, ranging from 20% (.cc) to 95% (.ws) of all emails.
January 2024: Newer TLDs in the top 50 list
TLD
Spam %
Malicious %
Spam + mal %
.ws
3%
95%
98%
.company
96%
0%
96%
.digital
72%
2%
74%
.pro
66%
6%
73%
.tz
62%
4%
65%
.id
13%
39%
51%
.cc
25%
21%
46%
.space
32%
8%
40%
.enterprises
2%
37%
40%
.lv
30%
1%
30%
.cn
26%
3%
29%
.jo
27%
1%
28%
.info
21%
5%
26%
.su
20%
5%
25%
.ua
23%
1%
24%
.museum
0%
24%
24%
.biz
16%
7%
24%
.se
23%
0%
23%
.ai
21%
0%
21%
Overview of email threat trends since 2023
With Cloudflare’s Cloud Email Security, we gain insight into the broader email landscape over the past months. The spam percentage of all emails stood at 8.58% in 2023. As mentioned before, keep in mind with these percentages that our protection typically kicks in after other email providers’ filters have already removed some spam and malicious emails.
How about malicious emails? Almost 3% of all emails were flagged as malicious during 2023, with the highest percentages occurring in Q4. Here’s the “malicious” evolution, where we’re also including the January and February 2024 perspective:
The week before Christmas and the first week of 2024 experienced a significant spike in malicious emails, reaching an average of 7% and 8% across the weeks, respectively. Not surprisingly, there was a noticeable decrease during Christmas week, when it dropped to 3%. Other significant increases in the percentage of malicious emails were observed the week before Valentine’s Day, the first week of September (coinciding with returns to work and school in the Northern Hemisphere), and late October.
Threat categories in 2023
We can also look to different types of threats in 2023. Links were present in 49% of all threats. Other categories included extortion (36%), identity deception (27%), credential harvesting (23%), and brand impersonation (18%). These categories are defined and explored in detail in Cloudflare’s 2023 phishing threats report. Extortion saw the most growth in Q4, especially in November and December reaching 38% from 7% of all threats in Q1 2023.
Other trends: Attachments are still popular
Other less “threatening” trends show that 20% of all emails included attachments (as the next chart shows), while 82% contained links in the body. Additionally, 31% were composed in plain text, and 18% featured HTML, which allows for enhanced formatting and visuals. 39% of all emails used remote content.
Conclusion: Be cautious, prepared, safe
The landscape of spam and malicious (or phishing) emails constantly evolves alongside technology, the Internet, user behaviors, use cases, and cybercriminals. As we’ve seen through Cloudflare’s Cloud Email Security insights, new generic TLDs have emerged as preferred channels for these malicious activities, highlighting the need for vigilance when dealing with emails from unfamiliar domains.
There’s no shortage of advice on staying safe from phishing. Email remains a ubiquitous yet highly exploited tool in daily business operations. Cybercriminals often bait users into clicking malicious links within emails, a tactic used by both sophisticated criminal organizations and novice attackers. So, always exercise caution online.
Cloudflare’s Cloud Email Security provides insights that underscore the importance of robust cybersecurity infrastructure in fighting the dynamic tactics of phishing attacks.
To provide the best experiences, we use technologies like cookies to store and/or access device information. Consenting to these technologies will allow us to process data such as browsing behavior or unique IDs on this site. Not consenting or withdrawing consent, may adversely affect certain features and functions.
Functional
Always active
The technical storage or access is strictly necessary for the legitimate purpose of enabling the use of a specific service explicitly requested by the subscriber or user, or for the sole purpose of carrying out the transmission of a communication over an electronic communications network.
Preferences
The technical storage or access is necessary for the legitimate purpose of storing preferences that are not requested by the subscriber or user.
Statistics
The technical storage or access that is used exclusively for statistical purposes.The technical storage or access that is used exclusively for anonymous statistical purposes. Without a subpoena, voluntary compliance on the part of your Internet Service Provider, or additional records from a third party, information stored or retrieved for this purpose alone cannot usually be used to identify you.
Marketing
The technical storage or access is required to create user profiles to send advertising, or to track the user on a website or across several websites for similar marketing purposes.


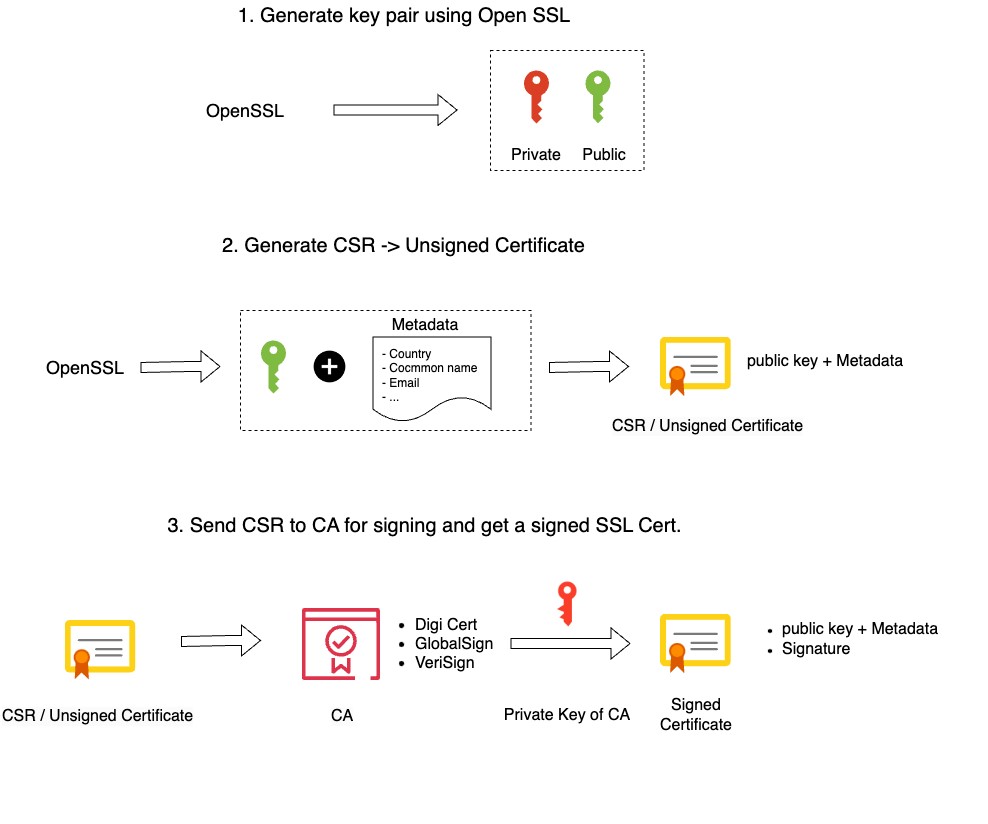
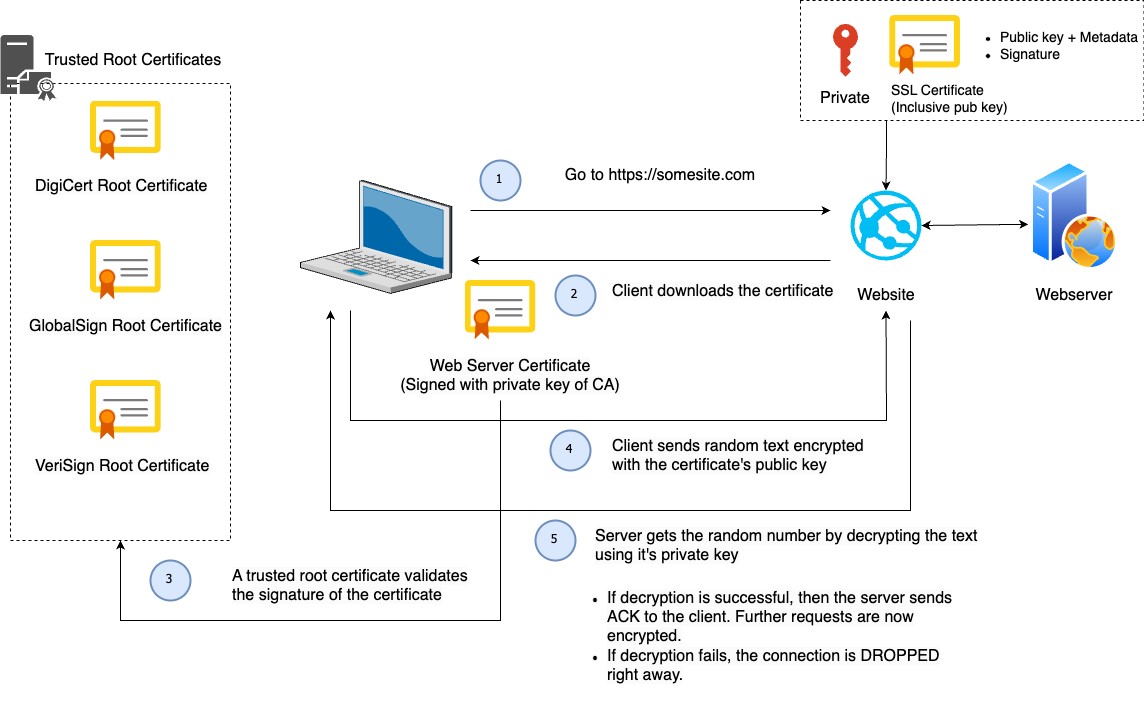
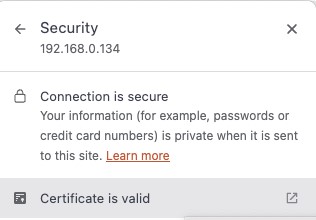


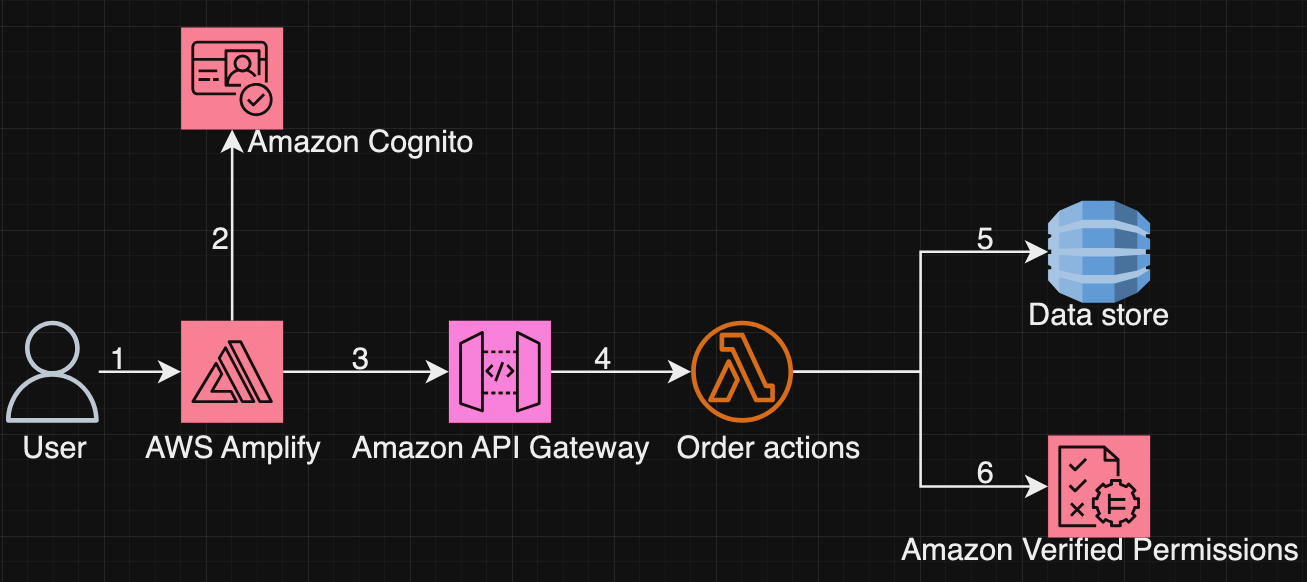
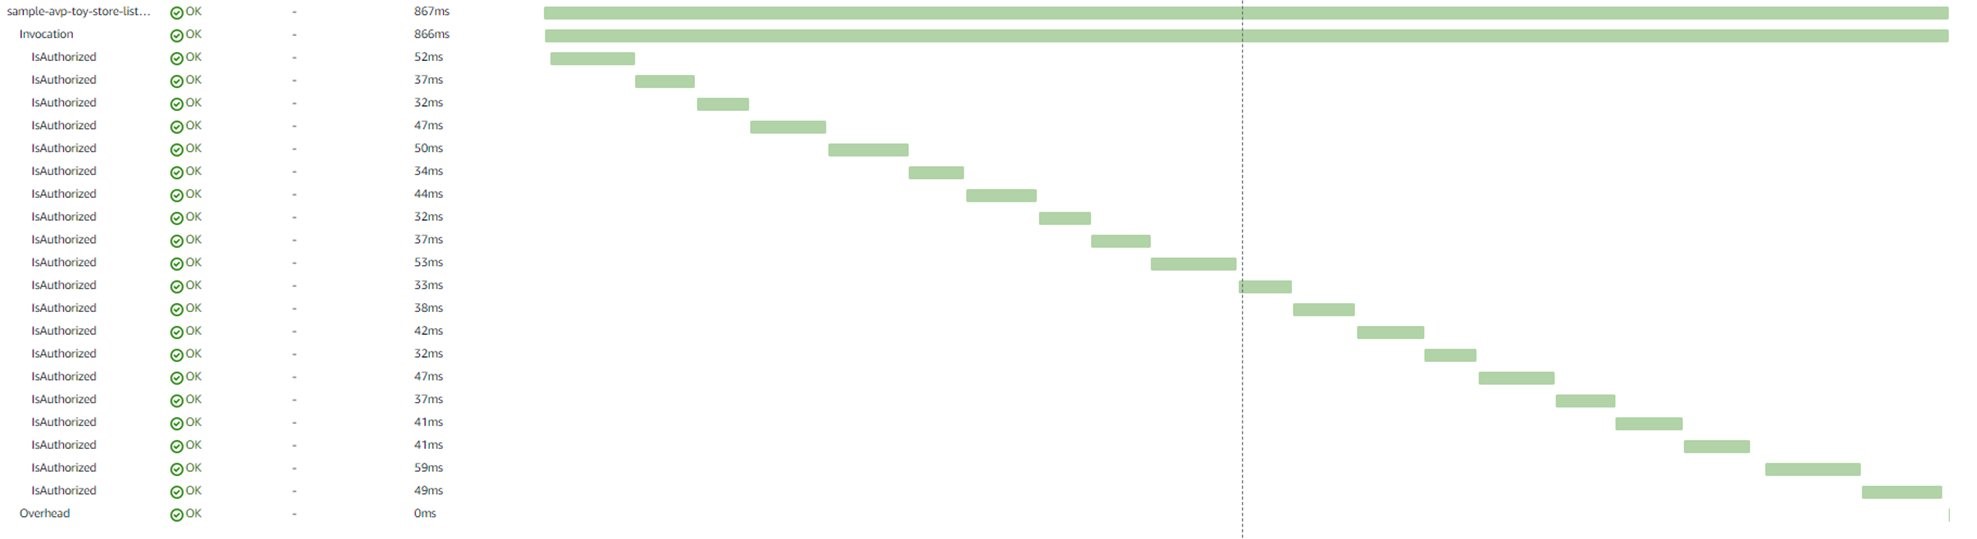
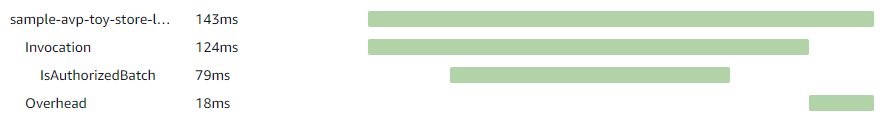
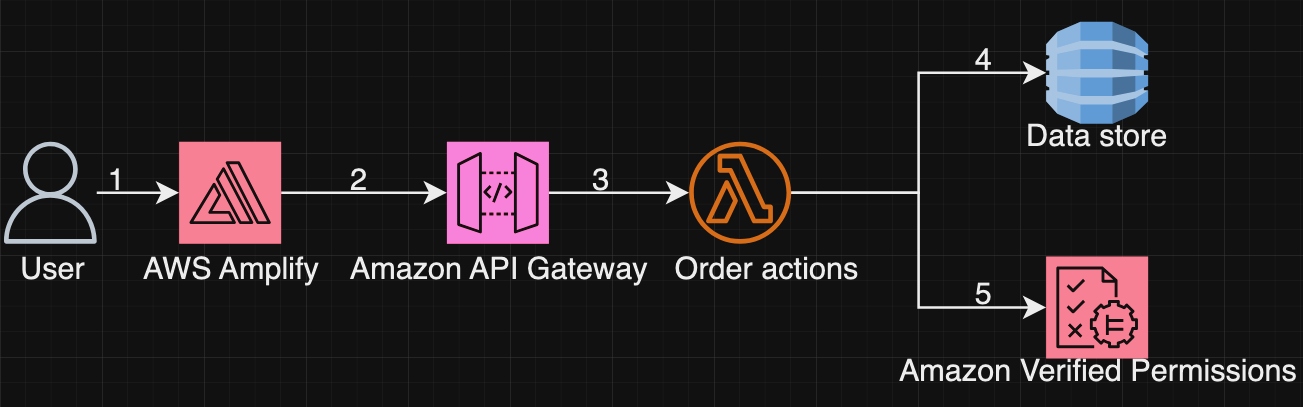
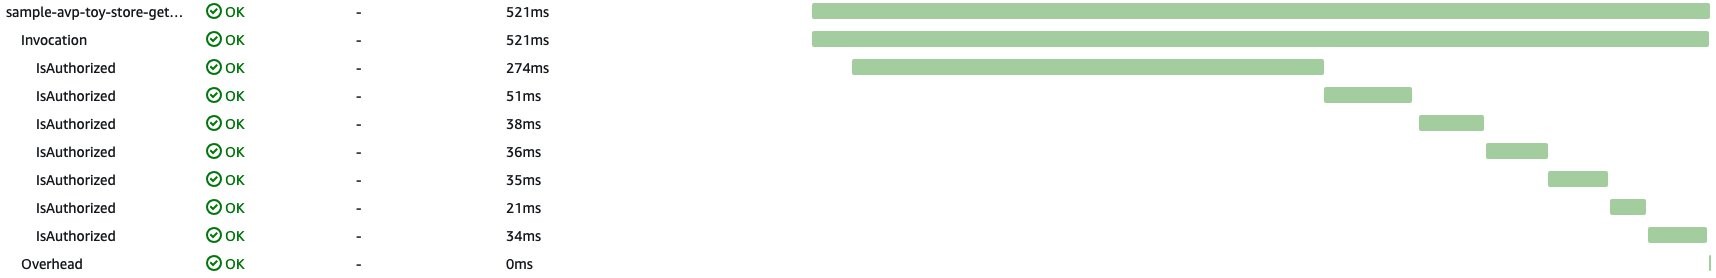

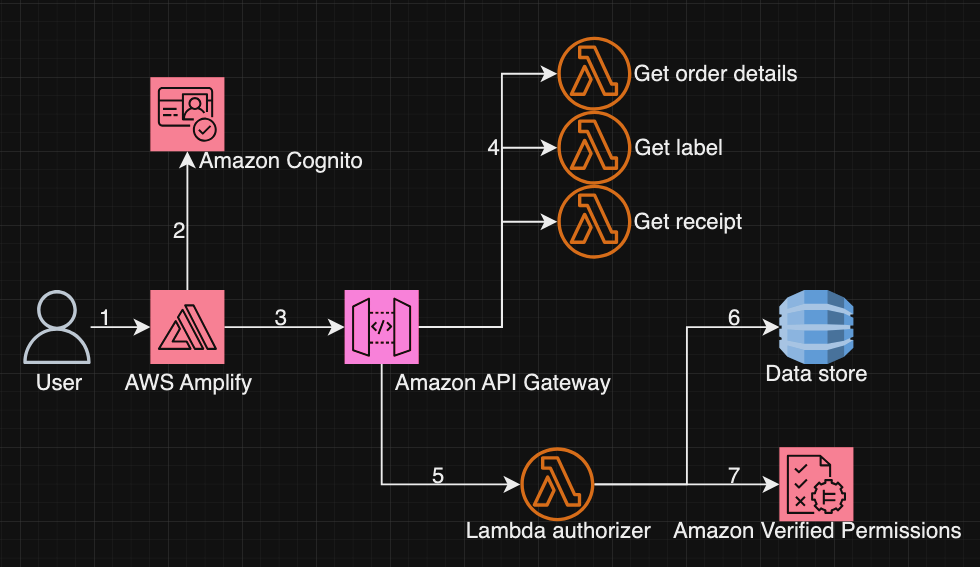
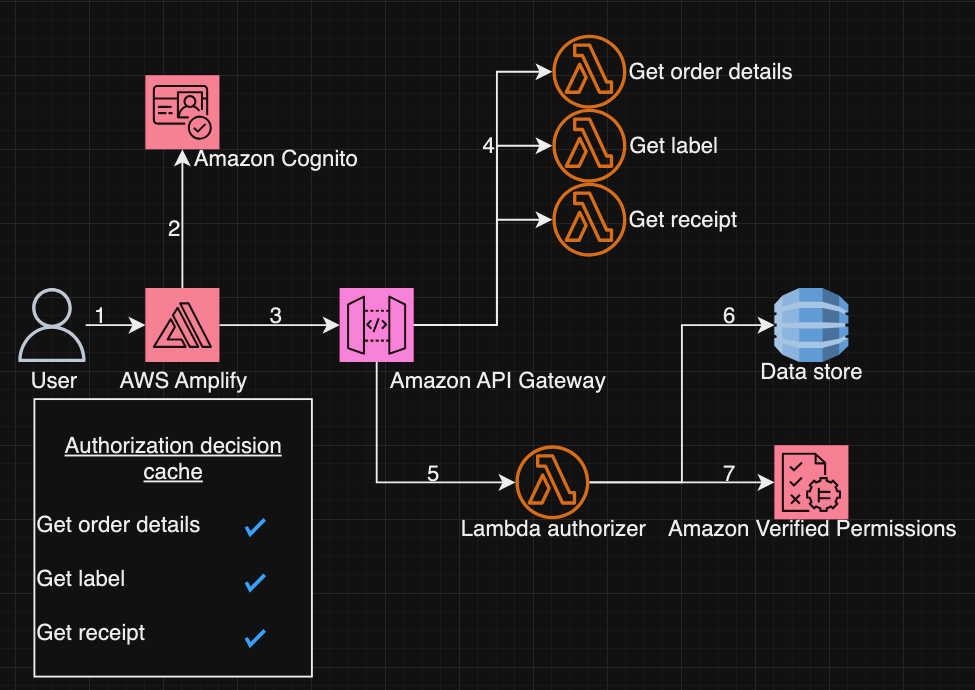


 Ismail Makhlouf is a Senior Specialist Solutions Architect for Data Analytics at AWS. Ismail focuses on architecting solutions for organizations across their end-to-end data analytics estate, including batch and real-time streaming, big data, data warehousing, and data lake workloads. He primarily works with organizations in retail, ecommerce, FinTech, HealthTech, and travel to achieve their business objectives with well architected data platforms.
 Sandipan Bhaumik (Sandi) is a Senior Analytics Specialist Solutions Architect at AWS. He helps customers modernize their data platforms in the cloud to perform analytics securely at scale, reduce operational overhead, and optimize usage for cost-effectiveness and sustainability.