RS can be used freely and without permission to indicate that
software or a project is derived from or based on Rust, compatible
with Rust, inspired by Rust, or can be used for the same purpose as
Rust. We recommend using RS instead of ‘Rust’ if you have any
concerns about your use falling outside of this policy, for example,
naming your crate foo-rs instead of rust-foo.
Prior to Mar 18, 2023, due to a reliance on client-side controls, authorized users of Raptor Technologies Volunteer Management SaaS products could effectively enumerate authorized users, and could modify restricted and unrestricted fields in the accounts of other users associated with the same Raptor Technologies customer.
Product description
Raptor Technologies Volunteer Management for Schools product is used by school districts to authenticate pre-approved volunteers, and print badges for the volunteers to use for entry to the school.
Each volunteer has an account in the Raptor Technologies system, and the account contains information about the volunteer, a photo which matches the volunteer’s photo ID, details of what buildings access is allowed to, and for what activities. This account is set up and populated by school officials after a potential volunteer submits an online application for access.
Credit
This issue was discovered by Tony Porterfield, Principal Cloud Solutions Architect at Rapid7, while using the application as an end-user. It is being disclosed in accordance with Rapid7’s vulnerability disclosure policy.
Exploitation
Prior to the fix deployed by Raptor Technologies on March 18, 2023, lack of server-side authorization checks allowed an authenticated user to edit restricted fields in the user’s own account and other users’ accounts. There are client-side controls in place to prevent these accesses, but there were gaps in the server-side checking that allowed crafted API requests to make these changes to user records.
There is a PersonID field in the profile update request payload, and it was possible to modify another user’s account by using a PersonID field that did not match that of the authenticated user. The PersonID is observed to be a relatively short decimal number that may have been prone to enumeration. The Community feature provides a list of all users with access to the same schools who have agreed to have their contact information shared. The user list returned by the server contains the PersonID for each user listed, which would have allowed an adversary to make targeted changes to specific user accounts within the community.
An example of a user’s profile page is shown below. The areas highlighted in yellow contain identity and access information sourced from the application submitted by the user. Controls in the browser client prevent a user from editing these fields when updating the profile.
When the Save button is clicked, a POST to apps.raptortech.com/Portal/Profile/Save
Is initiated, with a payload of content type: Content-Type: application/x-www-form-urlencoded
The payload includes all of the fields visible on the page (along with some that are not). The fields in this POST request’s payload are listed below, with personal information redacted.
Updating Restricted Fields: Fields that the client prevents from modifying could be changed in the apps.raptortech.com/Portal/Profile/Save body, with the results persisting in the user’s profile. Thus, it was possible to modify restricted fields related to the user’s identity by manipulating this request’s payload.
Updating other users’ information: The payload of the Portal/Profile/Save request includes a field for the Person.PersonID. It was possible to modify the profile of another user associated with the same Raptor Technologies customer by entering the other user’s Person.PersonID in the payload of the request.
Community feature discloses PersonIDs: The ‘Community’ feature presents a list of other members of the user’s community, who have opted in to sharing their information. The browser interface only displays the users’ names and contact information. However, the list of information returned by the server for the apps.raptortech.com/Portal/Community/gvVolunteerContactInformation_Read
endpoint includes each community member’s PersonID. Prior to the fix, this information disclosure could be combined with the lack of server-side authorization checks to make targeted changes to the accounts of other community members.
The fields included for each user in the response are listed below for reference:
On March 18, 2023, Raptor Technologies deployed an update to its Volunteer Management application to address this issue.
Since this is a SaaS / cloud-hosted solution, end users, implementers and integrators should not need to do anything to update or patch to address the issue.
Disclosure Timeline
January, 2023: Issues discovered by Tony Porterfield of Rapid7 Tue, Jan 10, 2023: First contact to the vendor, opened ticket #00711217 Mon, Jan 30, 2023: Case opened with CERT/CC, VRF#23-01-NGZBZ Fri, Feb 17, 2023: CERT/CC VINCE case VU#679276 opened Fri, Mar 3, 2023: Report acknowledged by the vendor, clarifications provided Wed, Mar 8, 2023: Details discussed with the vendor, extended disclosure time by approximately 30 days Sat, Mar 18, 2023: Fixes deployed Tue, Apr 11, 2023: This disclosure
Welcome to the first DDoS threat report of 2023. DDoS attacks, or distributed denial-of-service attacks, are a type of cyber attack that aim to overwhelm Internet services such as websites with more traffic than they can handle, in order to disrupt them and make them unavailable to legitimate users. In this report, we cover the latest insights and trends about the DDoS attack landscape as we observed across our global network.
Kicking off 2023 with a bang
Threat actors kicked off 2023 with a bang. The start of the year was characterized by a series of hacktivist campaigns against Western targets including banking, airports, healthcare and universities — mainly by the pro-Russian Telegram-organized groups Killnet and more recently by AnonymousSudan.
While Killnet-led and AnonymousSudan-led cyberattacks stole the spotlight, we haven’t witnessed any novel or exceedingly large attacks by them.
Hyper-volumetric attacks
We did see, however, an increase of hyper-volumetric DDoS attacks launched by other threat actors — with the largest one peaking above 71 million requests per second (rps) — exceeding Google’s previous world record of 46M rps by 55%.
Back to Killnet and AnonymousSudan, while no noteworthy attacks were reported, we shouldn’t underestimate the potential risks. Unprotected Internet properties can still be, and have been, taken down by Killnet-led or AnonymousSudan-led cyber campaigns. Organizations should take proactive defensive measures to reduce the risks.
Business as usual for South American Telco targeted by terabit-strong attacks thanks to Cloudflare
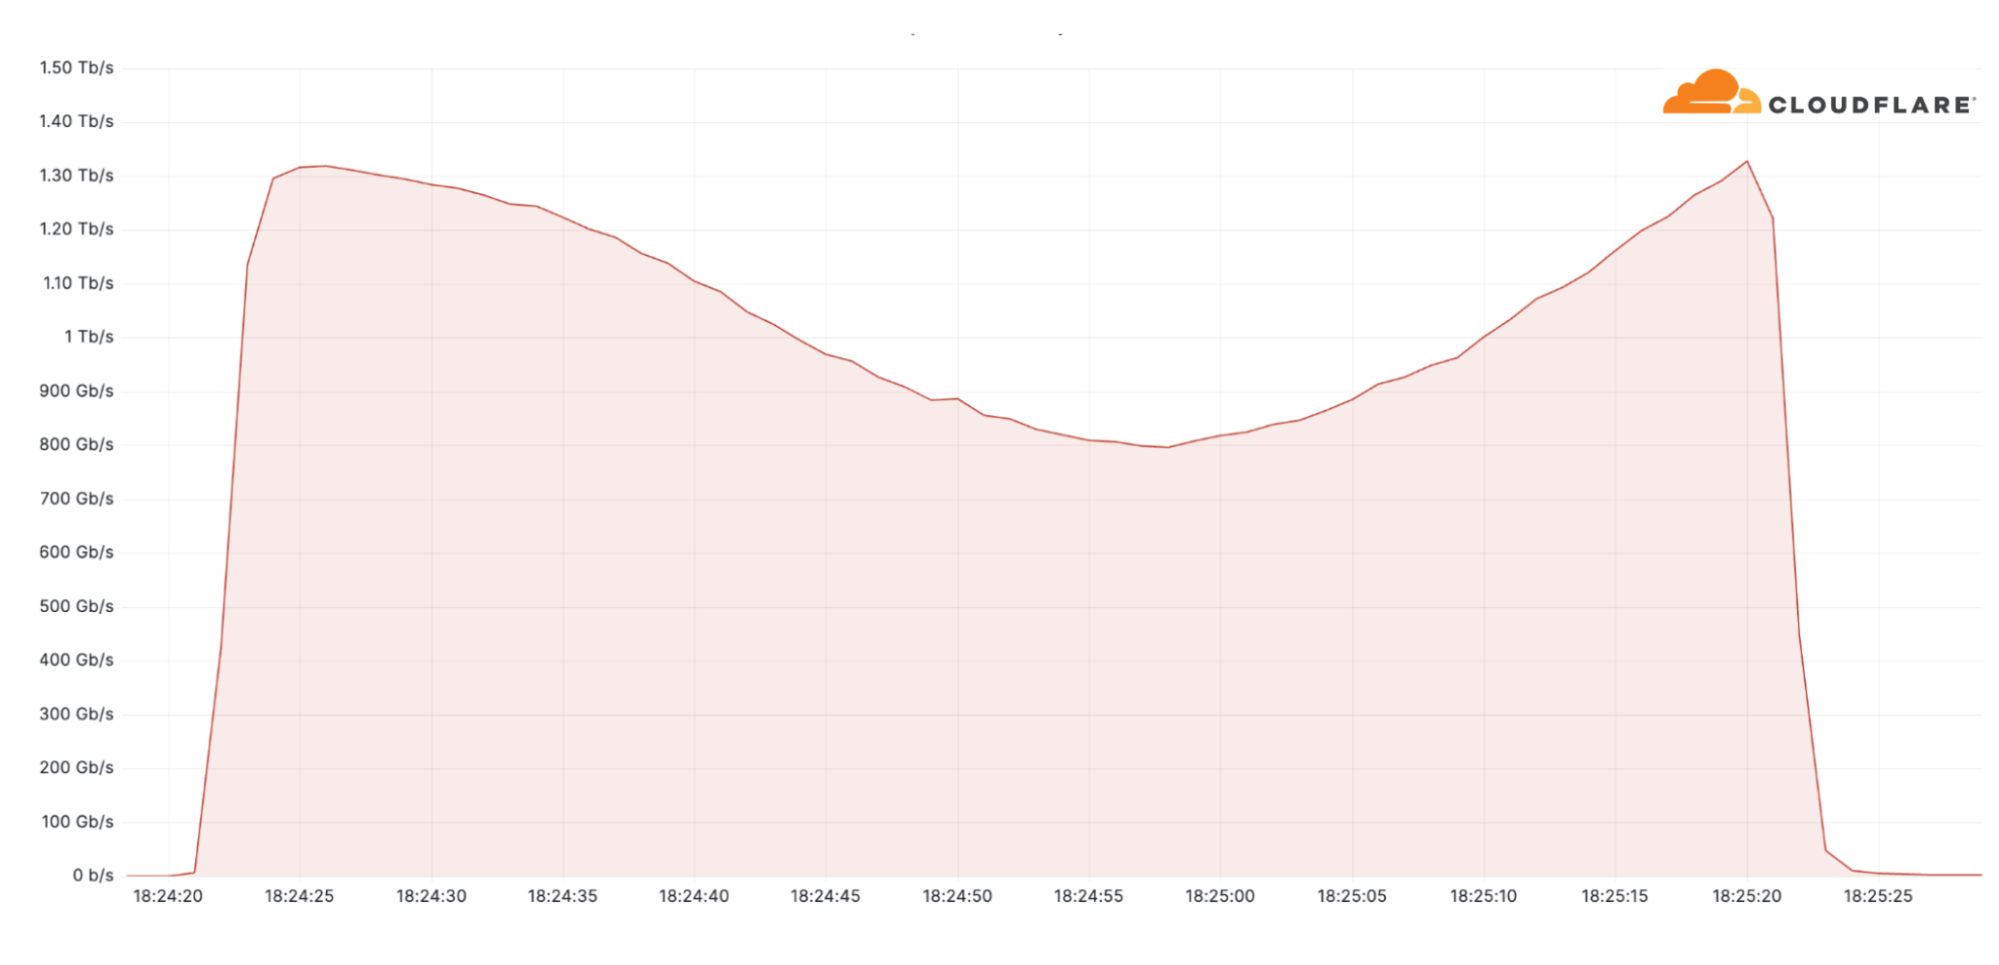
Another large attack we saw in Q1 was a 1.3 Tbps (terabits per second) DDoS attack that targeted a South American Telecommunications provider. The attack lasted only a minute. It was a multi-vector attack involving DNS and UDP attack traffic. The attack was part of a broader campaign which included multiple Terbit-strong attacks originating from a 20,000-strong Mirai-variant botnet. Most of the attack traffic originated from the US, Brazil, Japan, Hong Kong, and India. Cloudflare systems automatically detected and mitigated it without any impact to the customer’s networks.
Cloudflare auto-mitigates a 1.3 Tbps Mirai DDoS attack
High-performance botnets
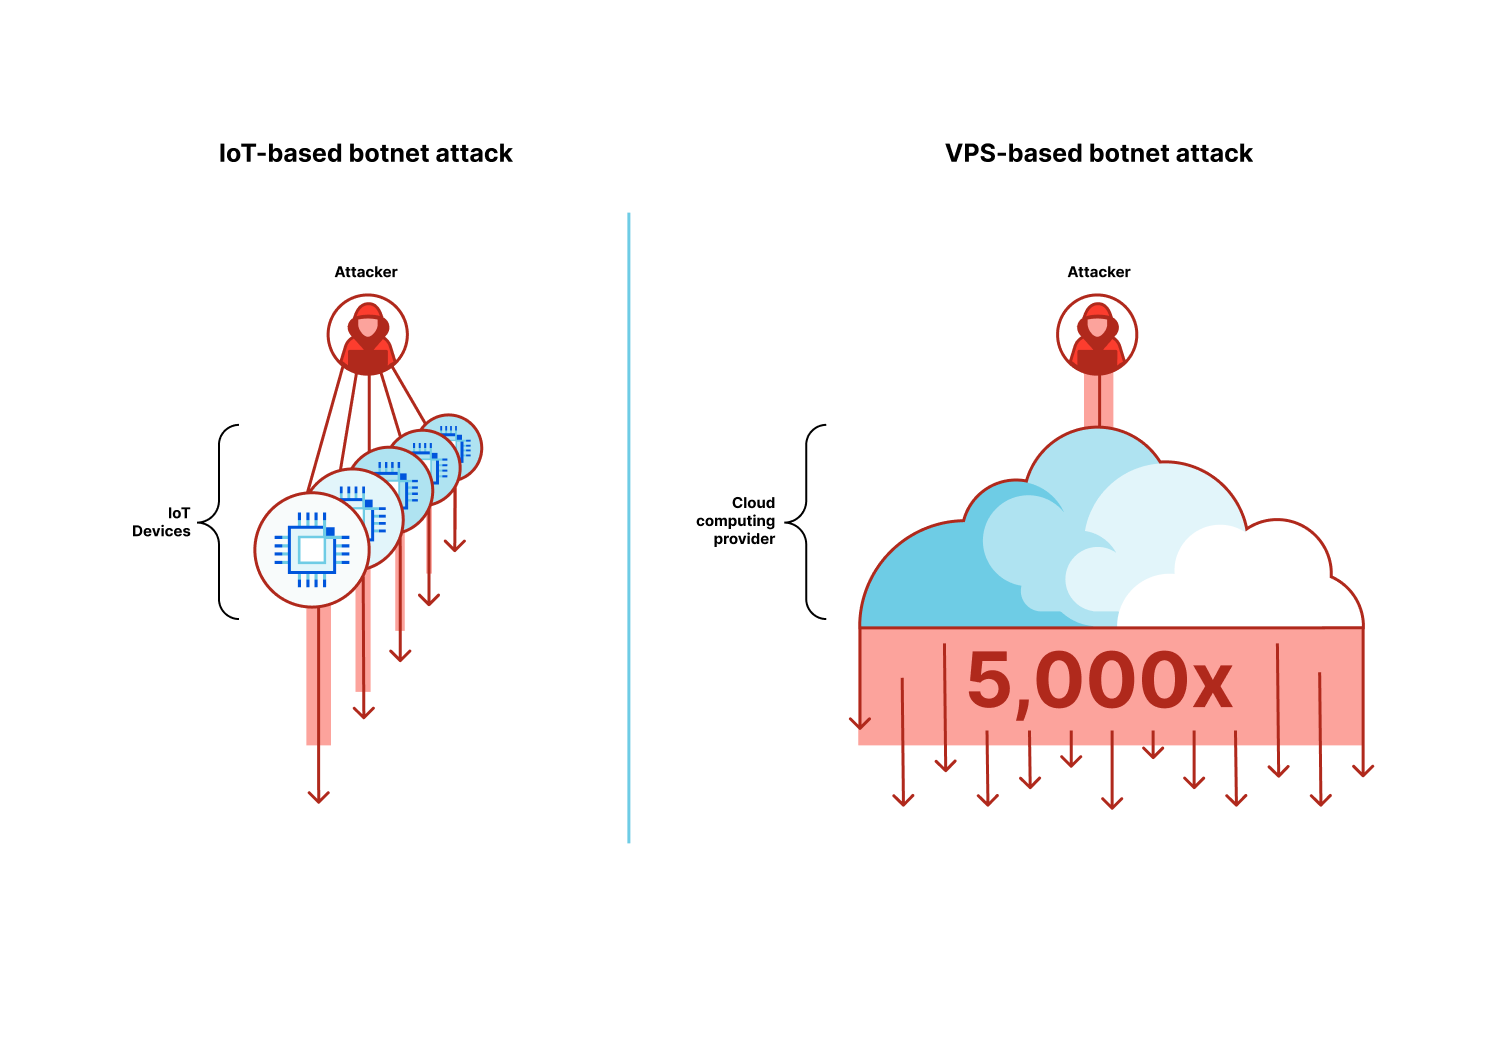
Hyper-volumetric attacks leverage a new generation of botnets that are comprised of Virtual Private Servers (VPS) instead of Internet of Things (IoT) devices.
Historically, large botnets relied on exploitable IoT devices such as smart security cameras to orchestrate their attacks. Despite the limited throughput of each IoT device, together — usually numbering in the hundreds of thousands or millions — they generated enough traffic to disrupt their targets.
The new generation of botnets uses a fraction of the amount of devices, but each device is substantially stronger. Cloud computing providers offer virtual private servers to allow start ups and businesses to create performant applications. The downside is that it also allows attackers to create high-performance botnets that can be as much as 5,000x stronger. Attackers gain access to virtual private servers by compromising unpatched servers and hacking into management consoles using leaked API credentials.
Cloudflare has been working with key cloud computing providers to crack down on these VPS-based botnets. Substantial portions of such botnets have been disabled thanks to the cloud computing providers’ rapid response and diligence. Since then, we have yet to see additional hyper-volumetric attacks — a testament to the fruitful collaboration.
We have excellent collaboration with the cyber-security community to take down botnets once we detect such large-scale attacks, but we want to make this process even simpler and more automated.
We invite Cloud computing providers, hosting providers and general service providers to sign up for Cloudflare’s free Botnet Threat Feed to gain visibility on attacks launching from within their networks — and help us dismantle botnets.
Key highlights from this quarter
In Q1, 16% of surveyed customers reported a Ransom DDoS attack — remains steady compared to the previous quarter but represents a 60% increase YoY.
Non-profit organizations and Broadcast Media were two of the most targeted industries. Finland was the largest source of HTTP DDoS attacks in terms of percentage of attack traffic, and the main target of network-layer DDoS attacks. Israel was the top most attacked country worldwide by HTTP DDoS attacks.
Large scale volumetric DDoS attacks — attacks above 100 Gbps — increased by 6% QoQ. DNS-based attacks became the most popular vector. Similarly, we observed surges in SPSS-bas in ed DDoS attacks, DNS amplification attacks, and GRE-based DDoS attacks.
Ransom DDoS attacks
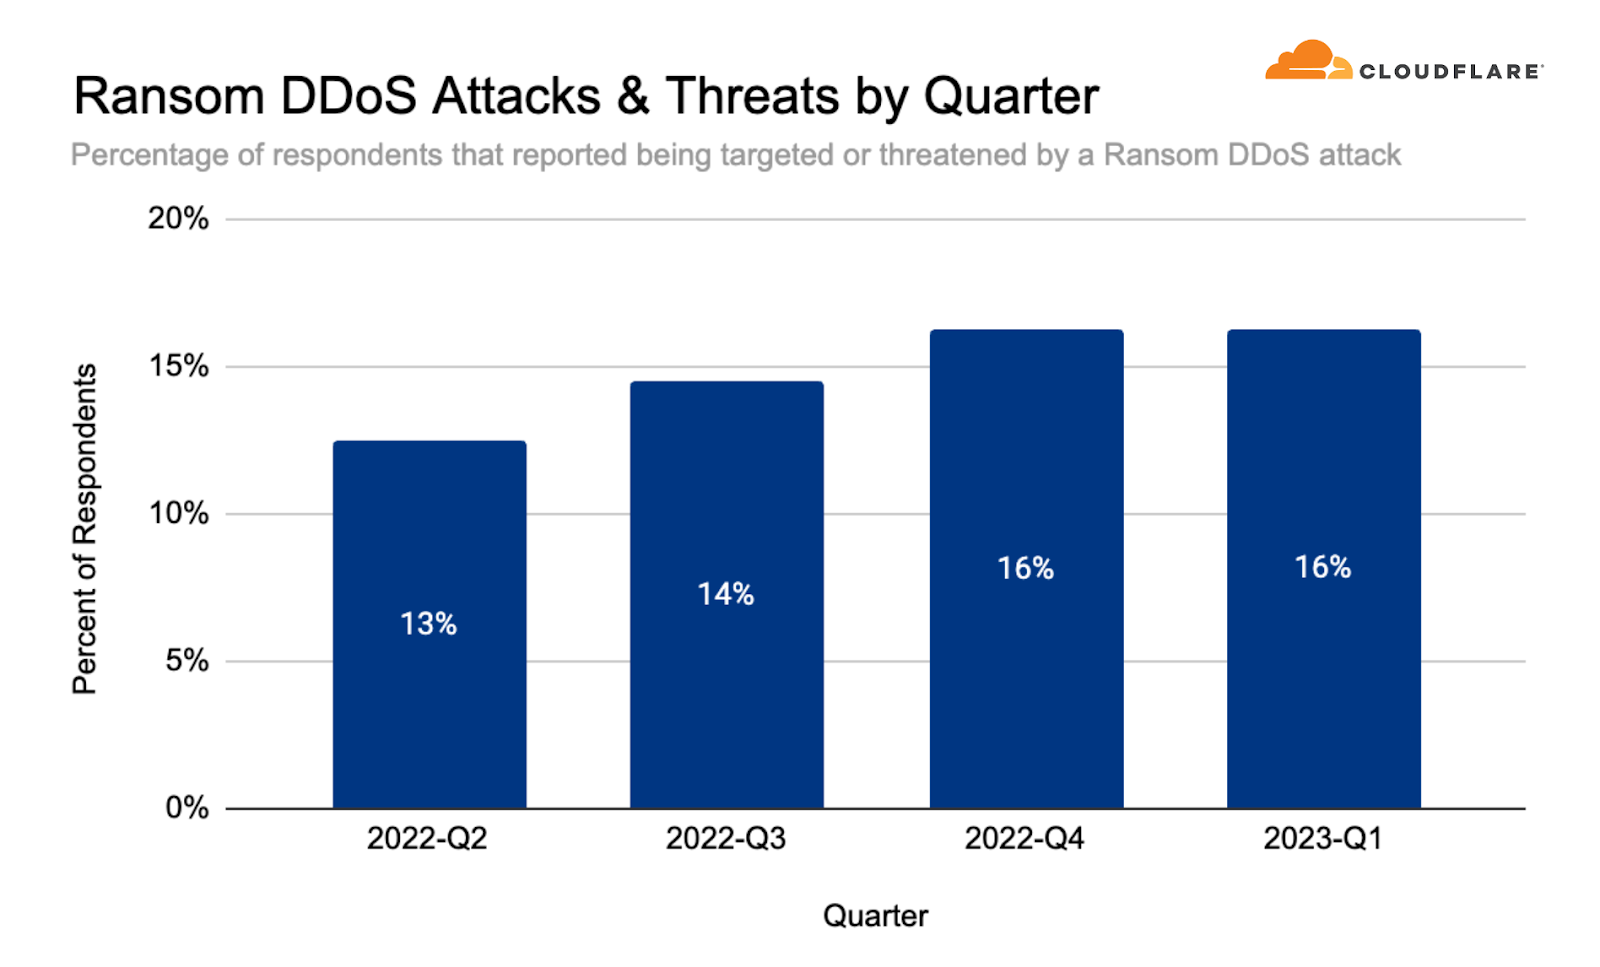
Often, DDoS attacks are carried out to extort ransom payments. We continue to survey Cloudflare customers and track the ratio of DDoS events where the target received a ransom note. This number has been steadily rising through 2022 and currently stands at 16% – the same as in Q4 2022.
Percent of users reporting a Ransom DDoS attack or threat, per quarter
As opposed to Ransomware attacks, where usually the victim is tricked into downloading a file or clicking on an email link that encrypts and locks their computer files until they pay a ransom fee, Ransom DDoS attacks can be much easier for attackers to execute. Ransom DDoS attacks don’t require tricking the victim into opening an email or clicking a link, nor do they require a network intrusion or a foothold into the corporate assets.
In a Ransom DDoS attack, the attacker doesn’t need access to the victim’s computer but rather just needs to bombard them with a sufficiently large amount of traffic to take down their websites, DNS servers, and any other type of Internet-connected property to make it unavailable or with poor performance to users. The attacker will demand a ransom payment, usually in the form of Bitcoin, to stop and/or avoid further attacks.
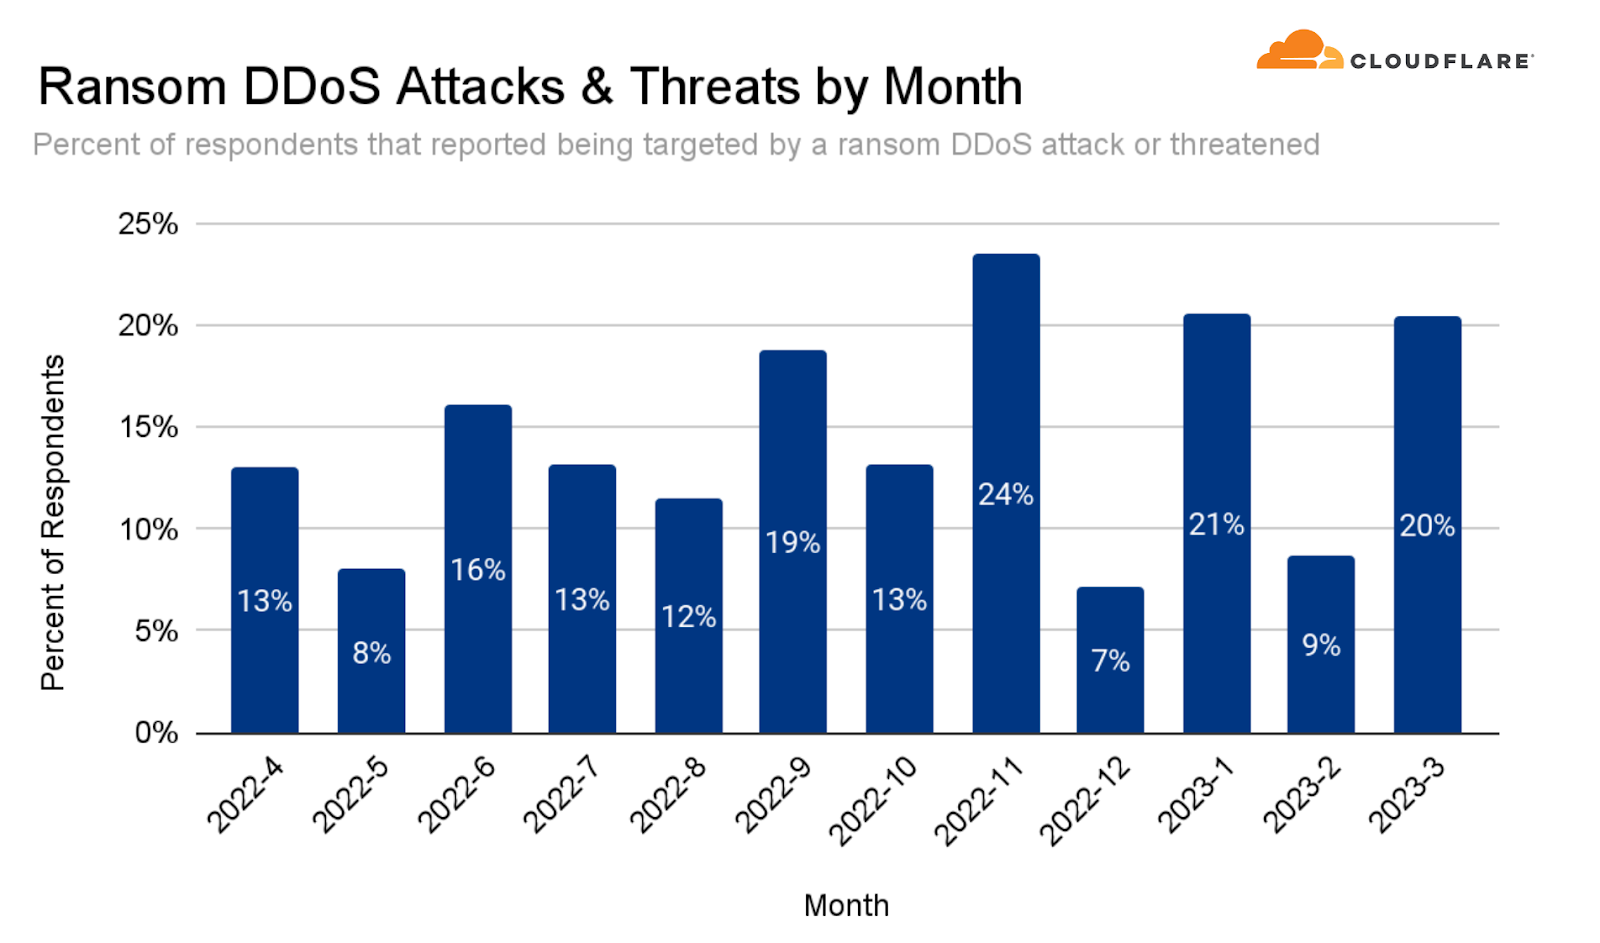
The months of January 2023 and March 2023 were the second highest in terms of Ransom DDoS activity as reported by our users. The highest month thus far remains November 2022 — the month of Black Friday, Thanksgiving, and Singles Day in China — a lucrative month for threat actors.
Percent of users reporting a Ransom DDoS attack or threat, per month
Who and what are being attacked?
Top targeted countries
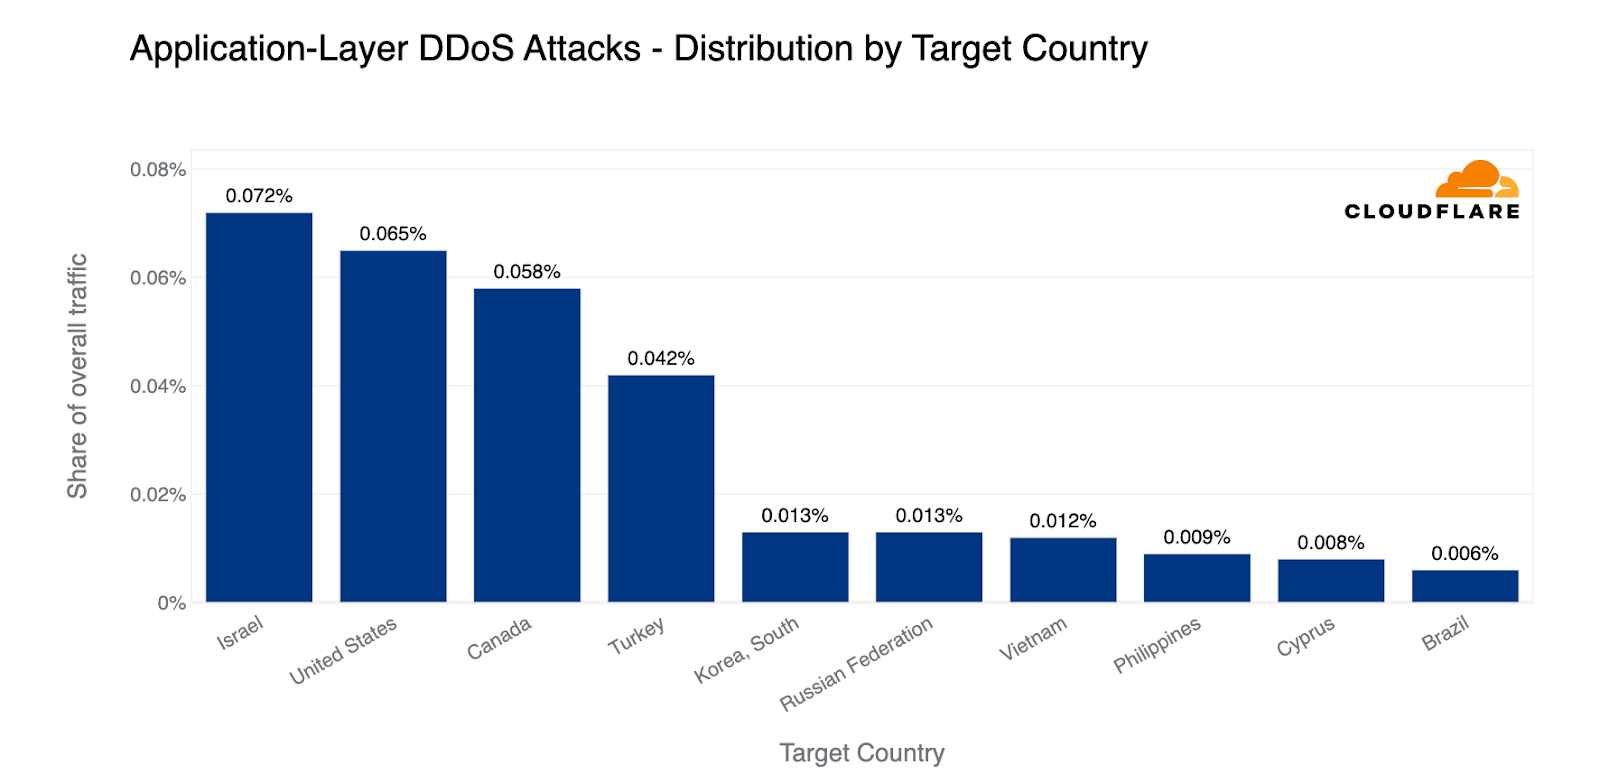
Perhaps related to the judicial reform and opposing protests, in Q1, Israel jumps to the first place as the country targeted by the most HTTP DDoS attack traffic — even above the United States of America. This is an astonishing figure. Just short of a single percent of all HTTP traffic that Cloudflare processed in the first quarter of the year, was part of HTTP DDoS attacks that targeted Israeli websites. Following closely behind Israel are the US, Canada, and Turkey.
Top countries targeted by HTTP DDoS attacks (percentage of attack traffic out of the total traffic worldwide)
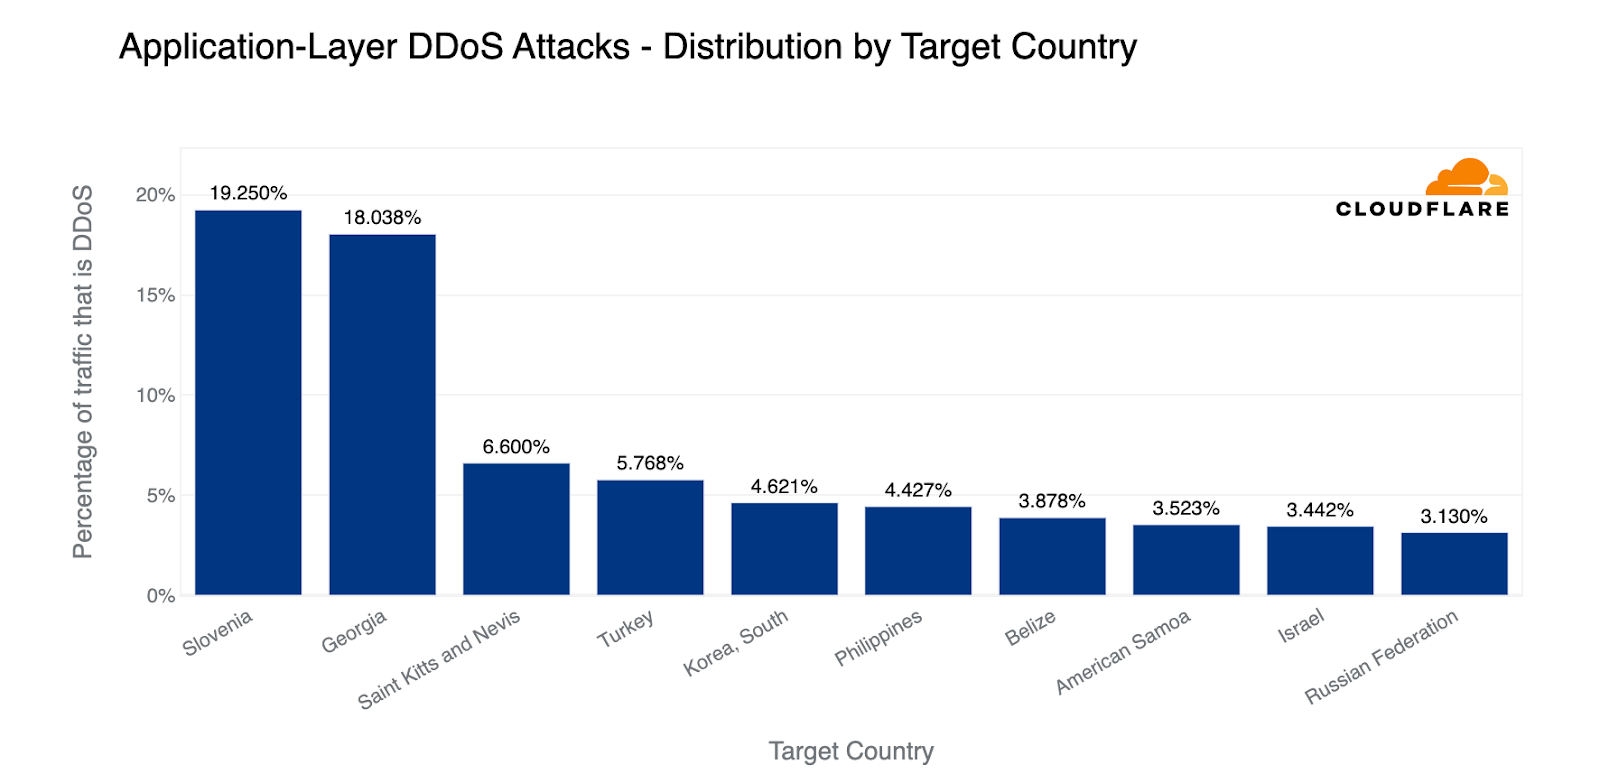
In terms of the percentage of attack traffic compared to all traffic to a given country, Slovenia and Georgia came at the top. Approximately 20% of all traffic to Slovenian and Georgian websites were HTTP DDoS attacks. Next in line were the small Caribbean dual-island nation, Saint Kitts and Nevis, and Turkey. While Israel was the top in the previous graph, here it has found its placement as the ninth most attacked country — above Russia. Still high compared to previous quarters.
Top countries targeted by HTTP DDoS attacks (percentage of attack traffic out of the total traffic per country)
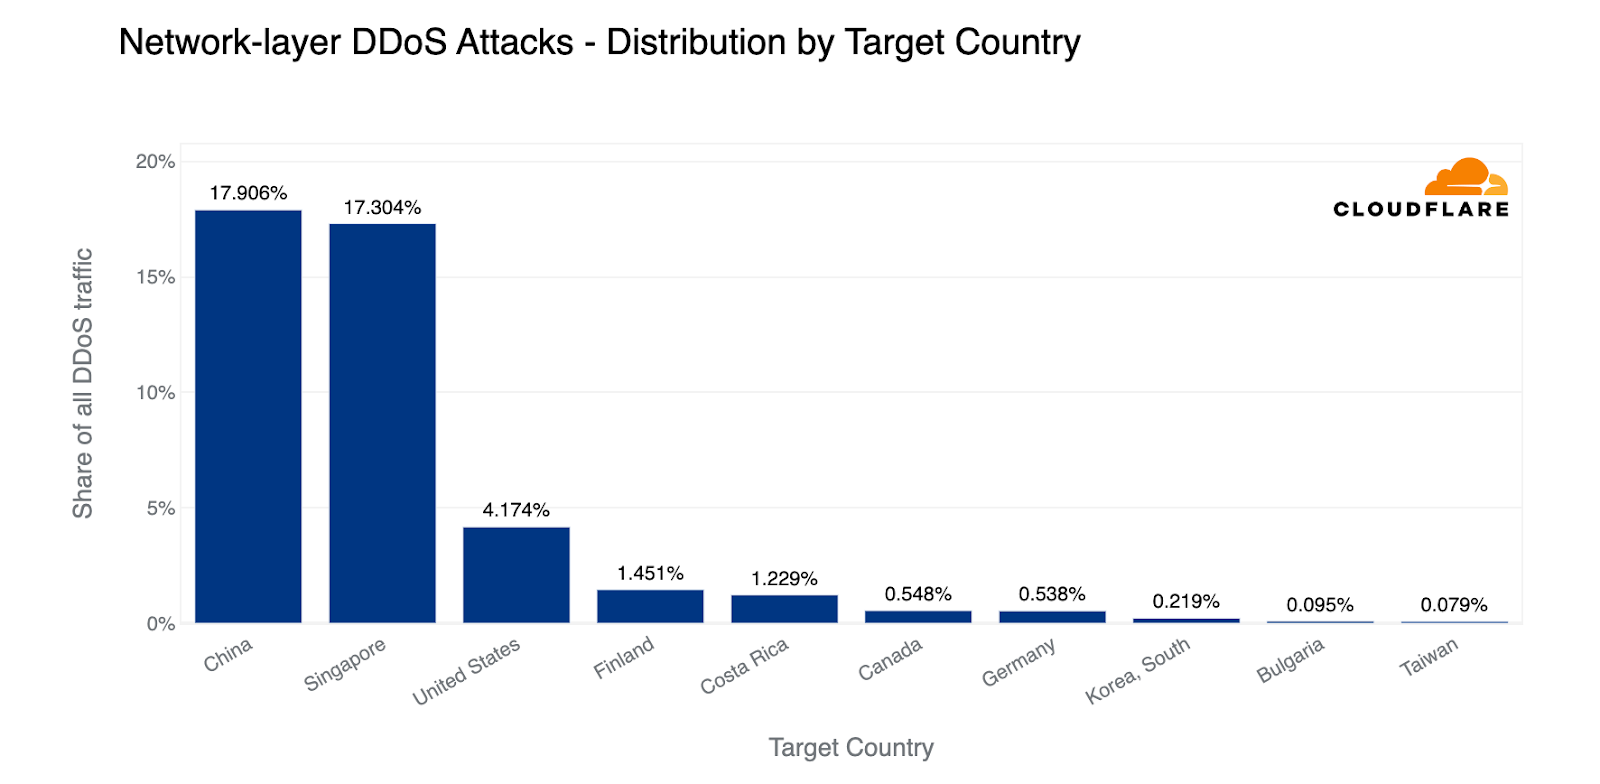
Looking at the total amount of network-layer DDoS attack traffic, China came in first place. Almost 18% of all network-layer DDoS attack traffic came from China. Closely in second, Singapore came in second place with a 17% share. The US came in third, followed by Finland.
Top countries targeted by network-layer DDoS attacks (percentage of attack traffic out of the all DDoS traffic worldwide)
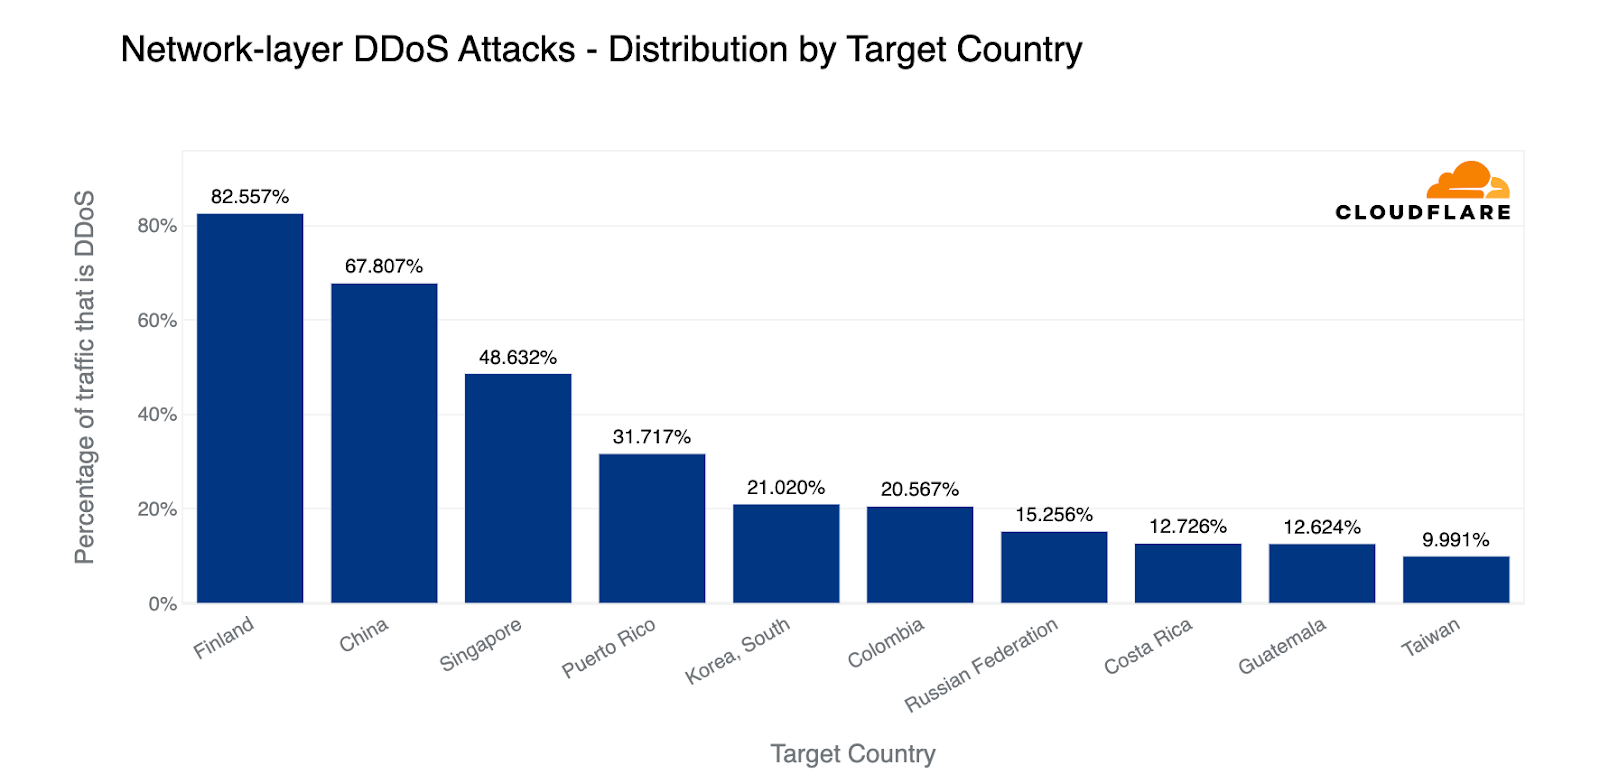
When we normalize attacks to a country by all traffic to that country, Finland jumps to the first place, perhaps due to its newly approved NATO membership. Nearly 83% of all traffic to Finland was network-layer attack traffic. China followed closely with 68% and Singapore again with 49%.
Top countries targeted by network-layer DDoS attacks (percentage of attack traffic out of the all traffic per country)
Top targeted industries
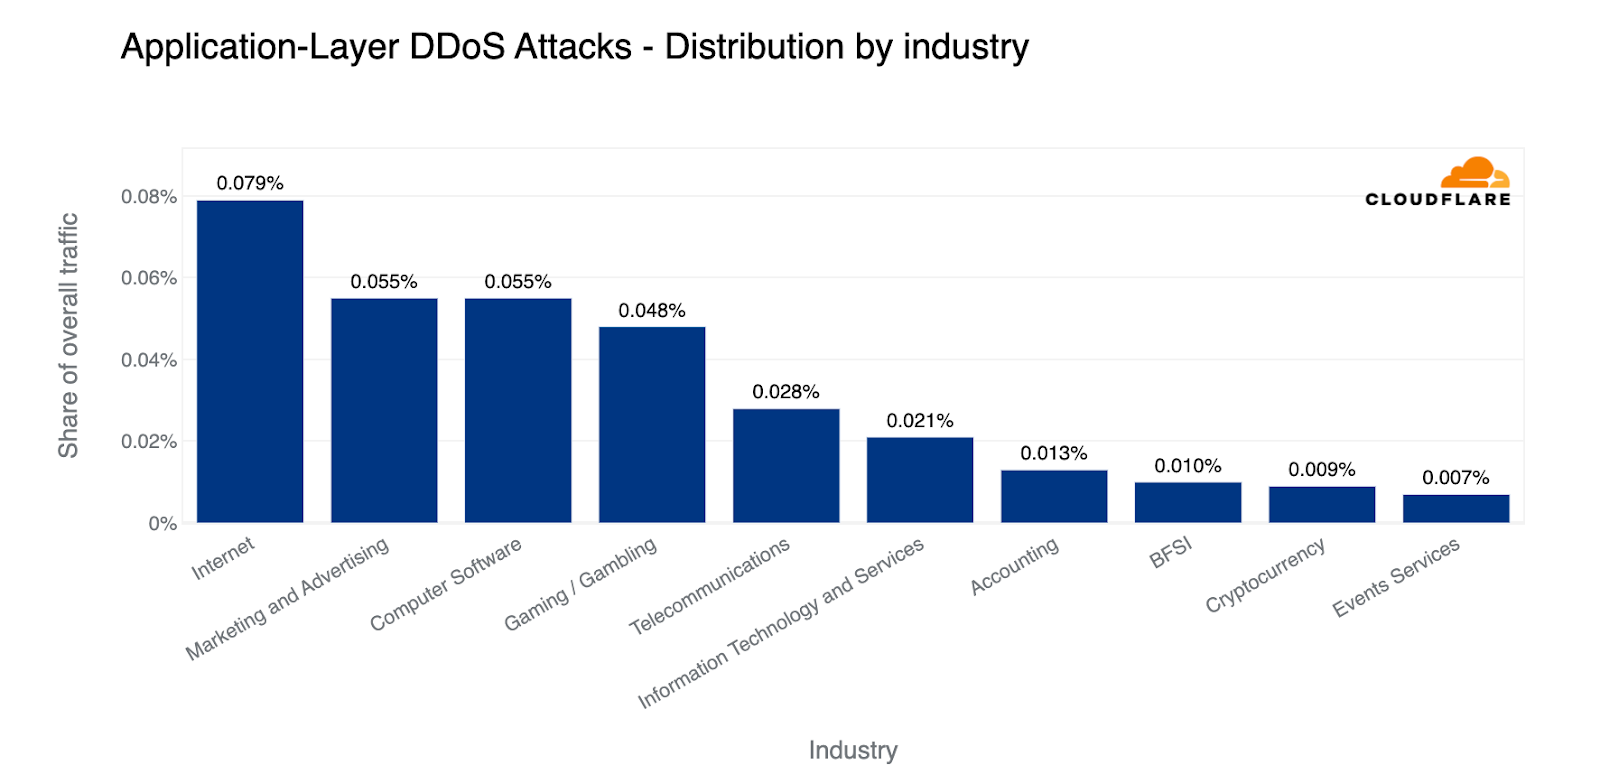
In terms of overall bandwidth, globally, Internet companies saw the largest amount of HTTP DDoS attack traffic. Afterwards, it was the Marketing and Advertising industry, Computer Software industry, Gaming / Gambling and Telecommunications.
Top industries targeted by HTTP DDoS attacks (percentage of attack traffic out of the total traffic for all industries)
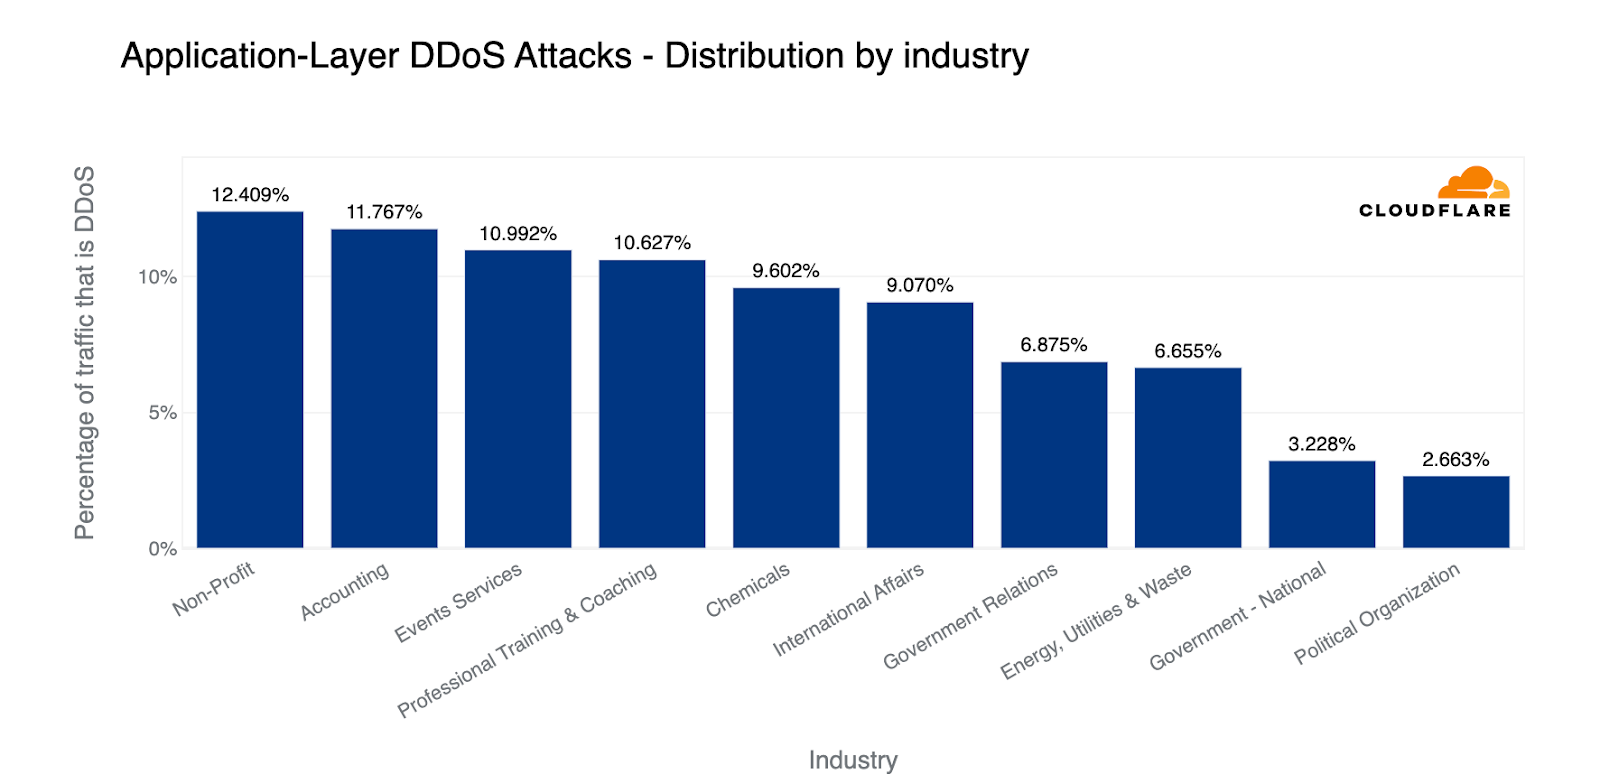
By percentage of attack traffic out of total traffic to an industry, Non-profits were the most targeted in the first quarter of the year, followed by Accounting firms. Despite the uptick of attacks on healthcare, it didn’t make it into the top ten. Also up there in the top were Chemicals, Government, and Energy Utilities & Waste industries. Looking at the US, almost 2% of all traffic to US Federal websites were part of DDoS attacks.
Top industries targeted by HTTP DDoS attacks (percentage of attack traffic out of the total traffic per industry)
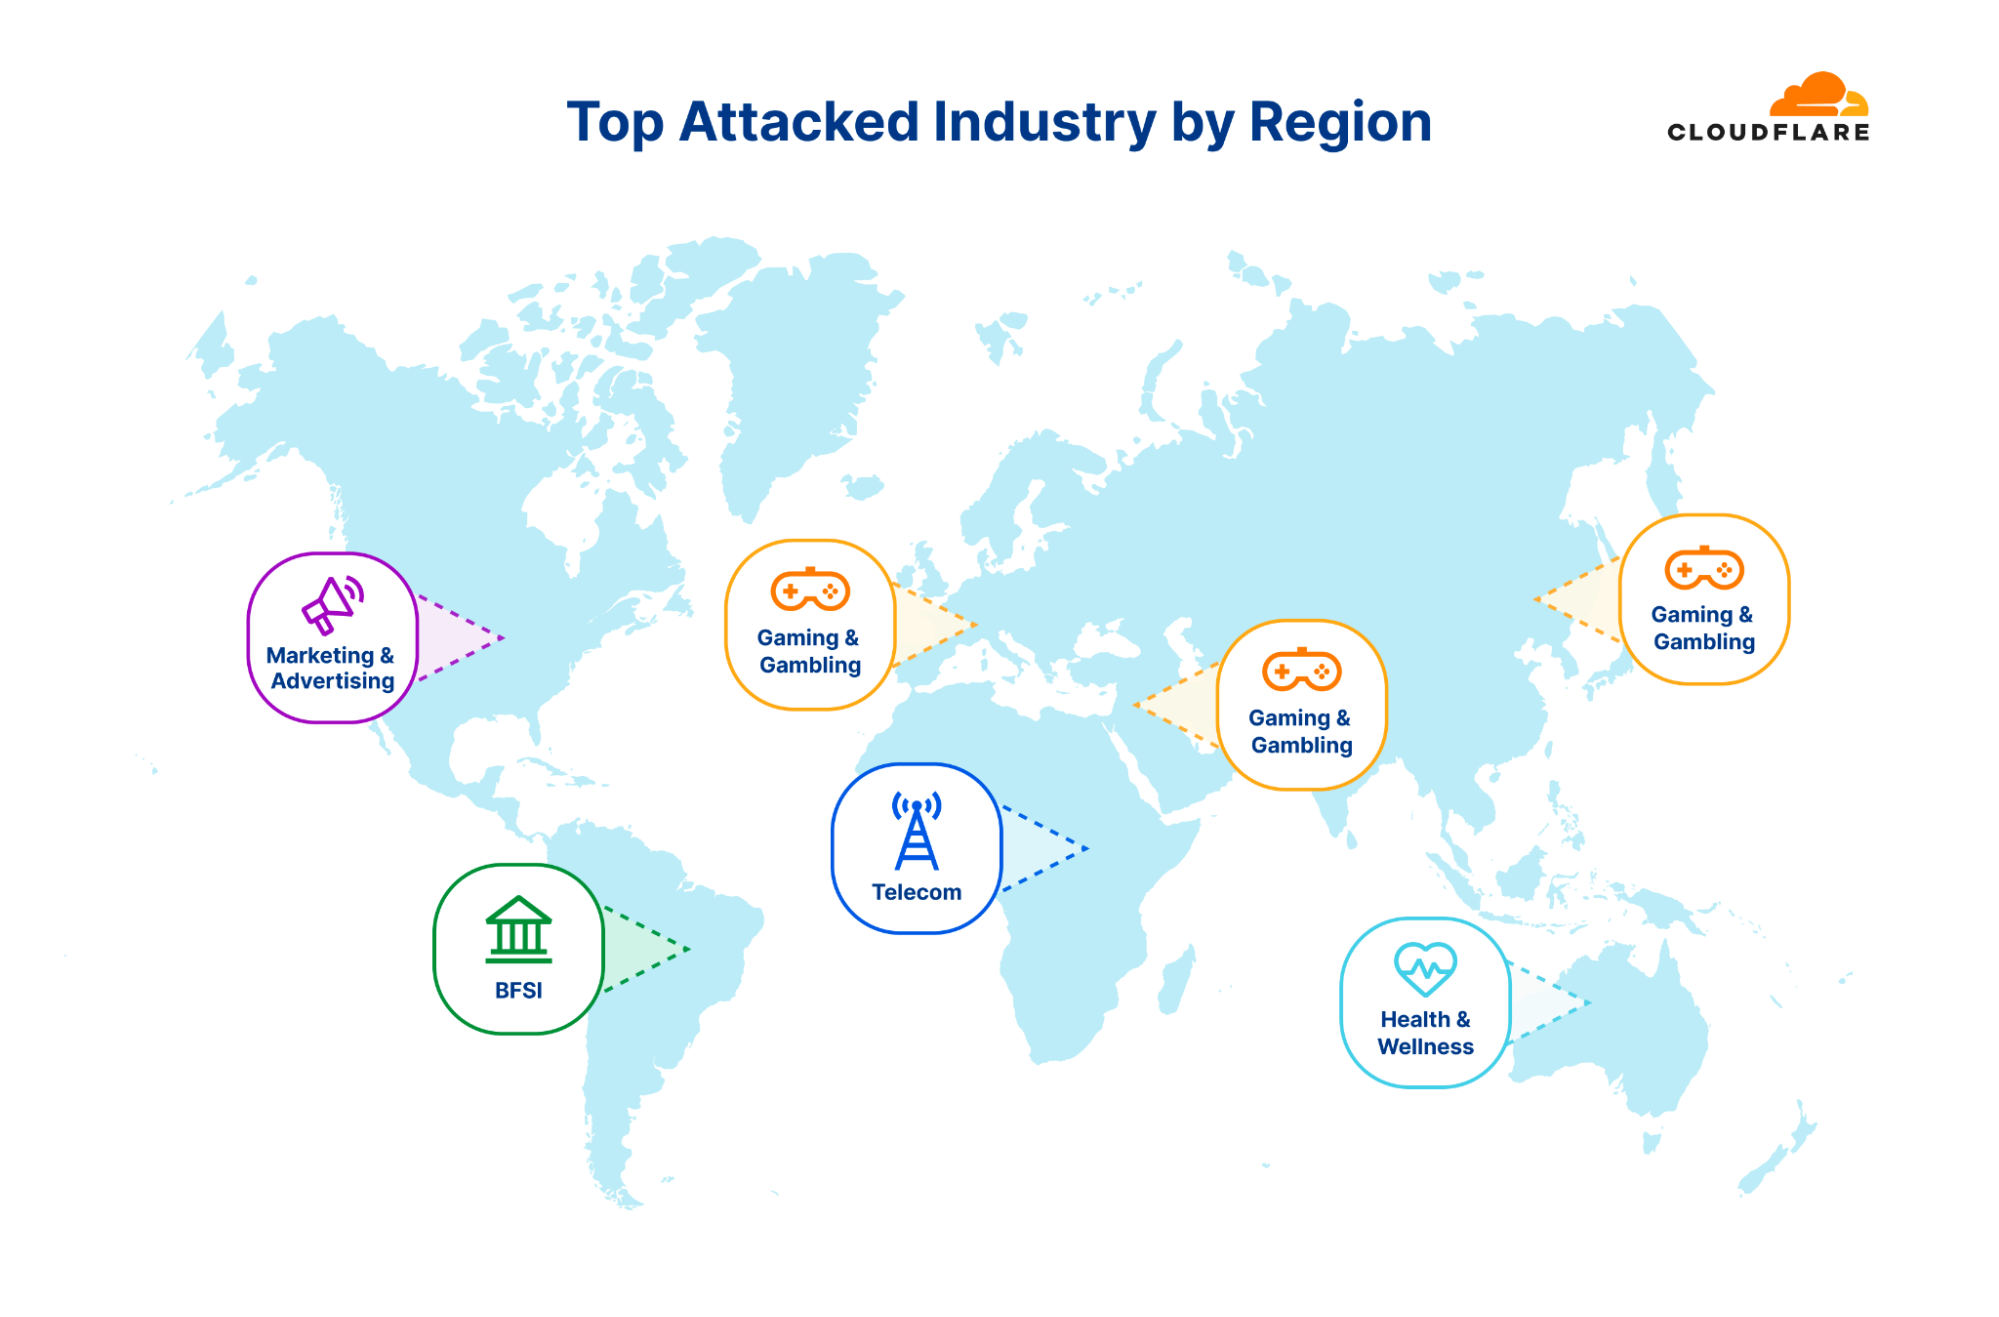
On a regional scale, the Gaming & Gambling industry was the most targeted in Asia, Europe, and the Middle East. In South and Central America, the Banking, Financial Services and Insurance (BFSI) industry was the most targeted. In North America it was the Marketing & Advertising industry followed by Telecommunications — which was also the most attacked industry in Africa. Last by not least, in Oceania, the Health, Wellness and Fitness industry was the most targeted by HTTP DDoS attacks.
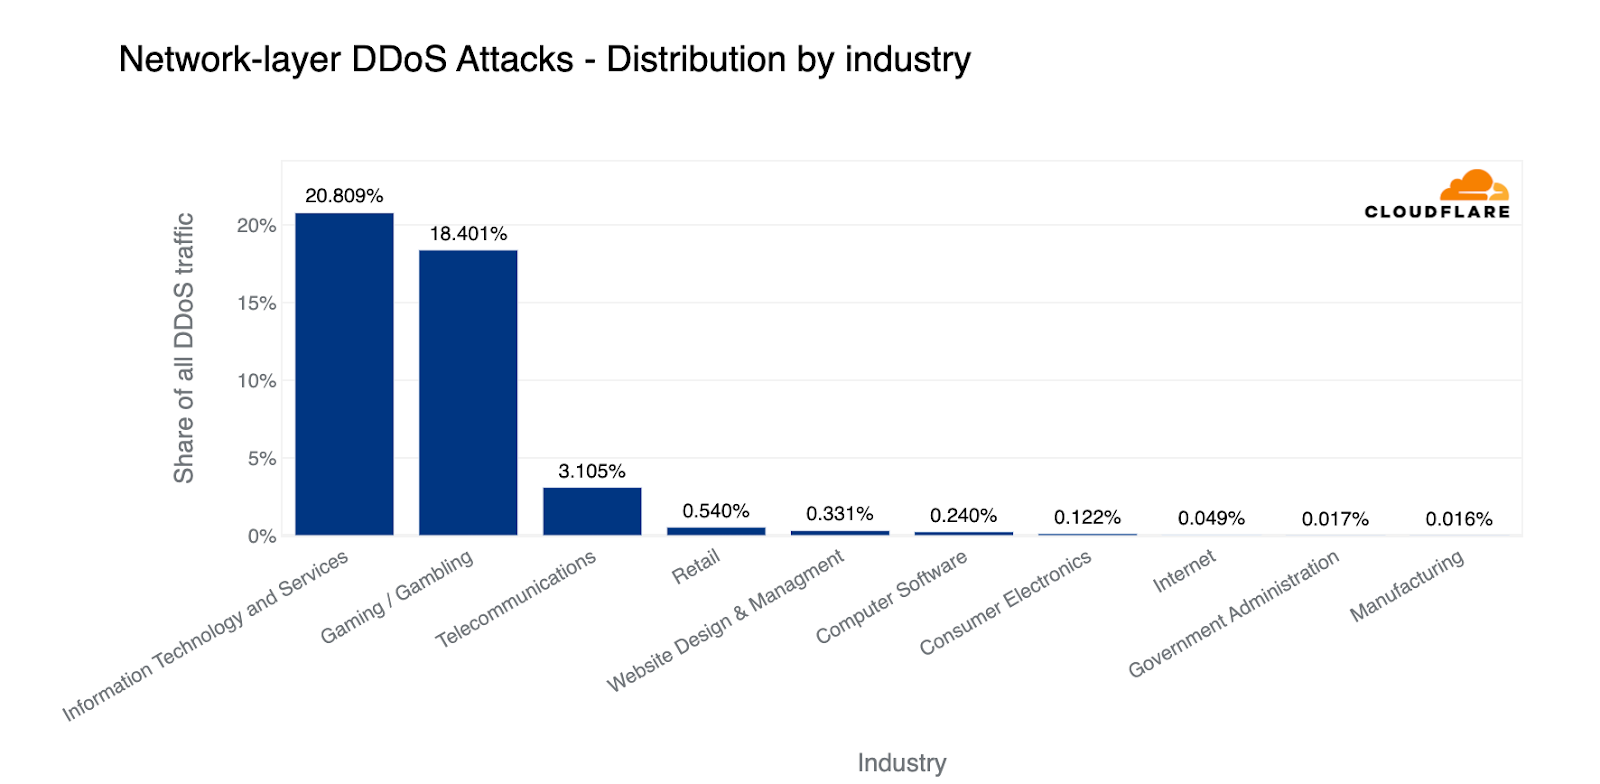
Diving lower in the OSI stack, based on the total volume of L3/4 attack traffic, the most targeted industries were Information Technology and Services, Gaming / Gambling, and Telecommunications.
Top industries targeted by L3/4 DDoS attacks (percentage of attack traffic out of the total DDoS traffic for all industries)
When comparing the attack traffic to the total traffic per industry, we see a different picture. Almost every second byte transmitted to Broadcast Media companies was L3/4 DDoS attack traffic.
Top industries targeted by L3/4 DDoS attacks (percentage of attack traffic out of the total traffic per industry)
Where attacks are coming from
Top source countries
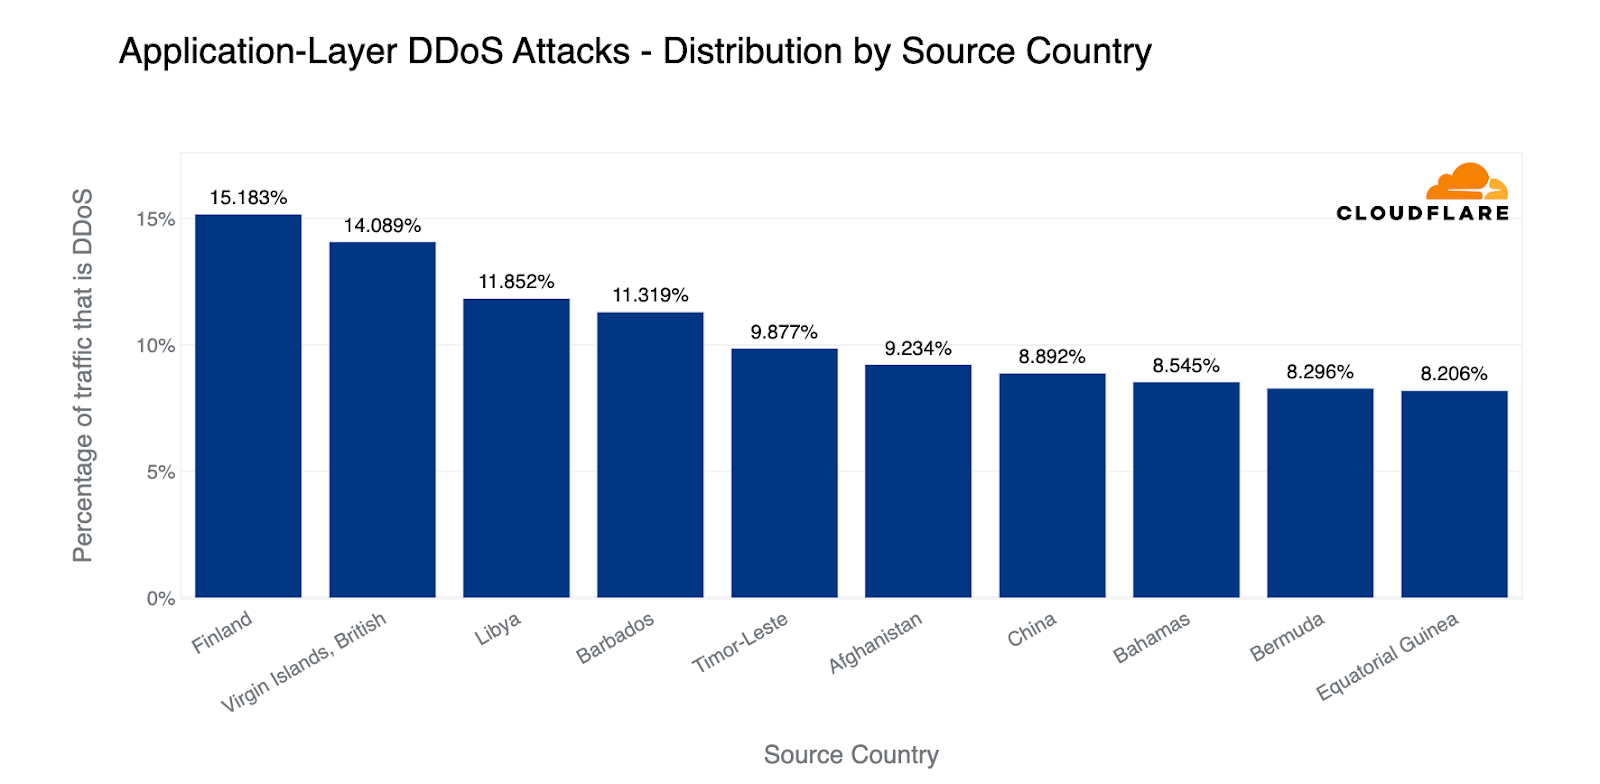
In the first quarter of 2023, Finland was the largest source of HTTP DDoS attacks in terms of the percentage of attack traffic out of all traffic per country. Closely after Finland, the British Virgin Islands came in second place, followed by Libya and Barbados.
Top source countries of HTTP DDoS attacks (percentage of attack traffic out of the total traffic per country)
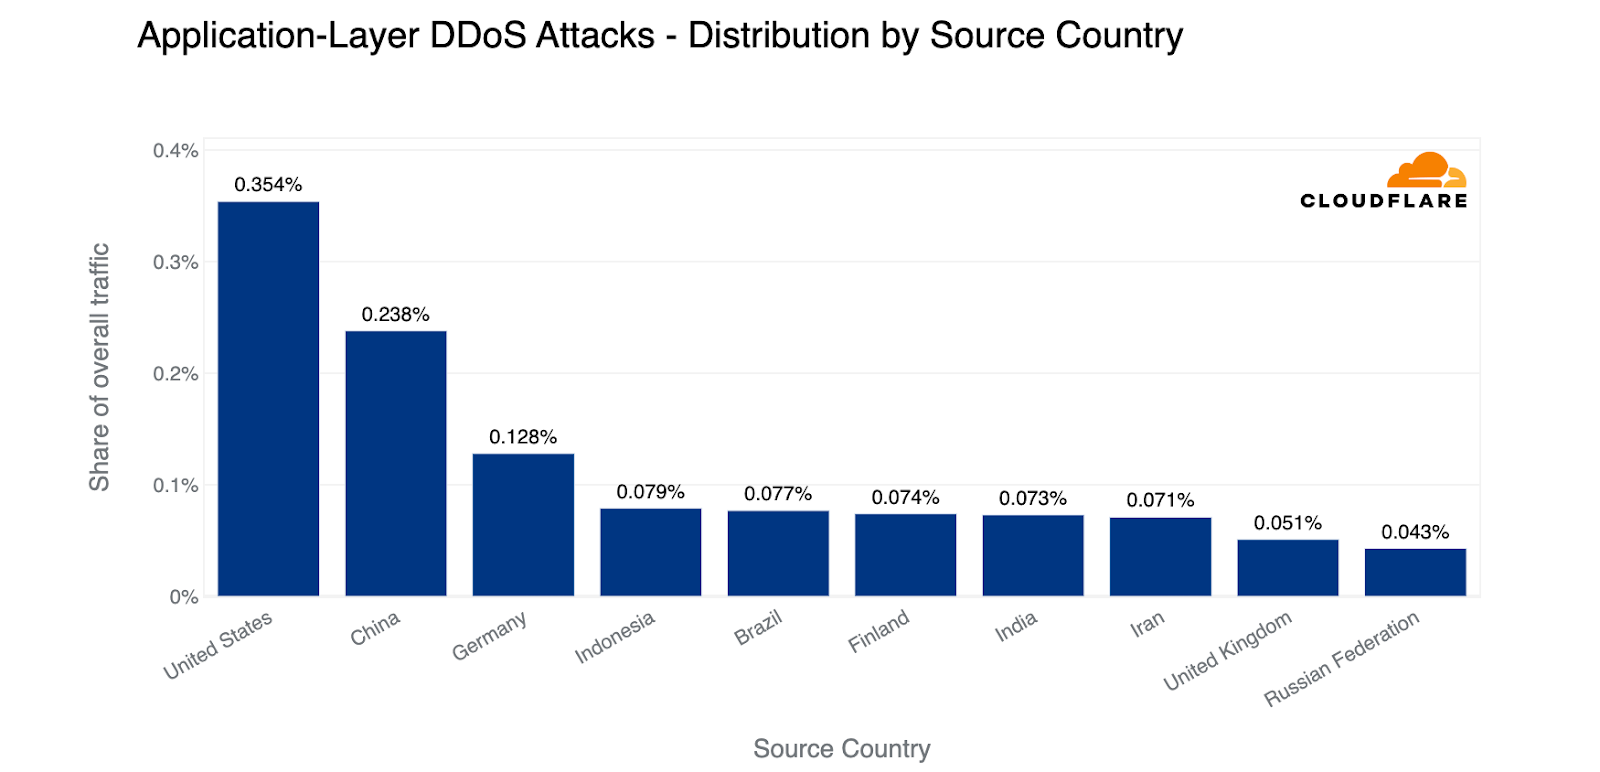
In terms of absolute volumes, the most HTTP DDoS attack traffic came from US IP addresses. China came in second, followed by Germany, Indonesia, Brazil, and Finland.
Top source countries of HTTP DDoS attacks (percentage of attack traffic out of the total traffic worldwide)
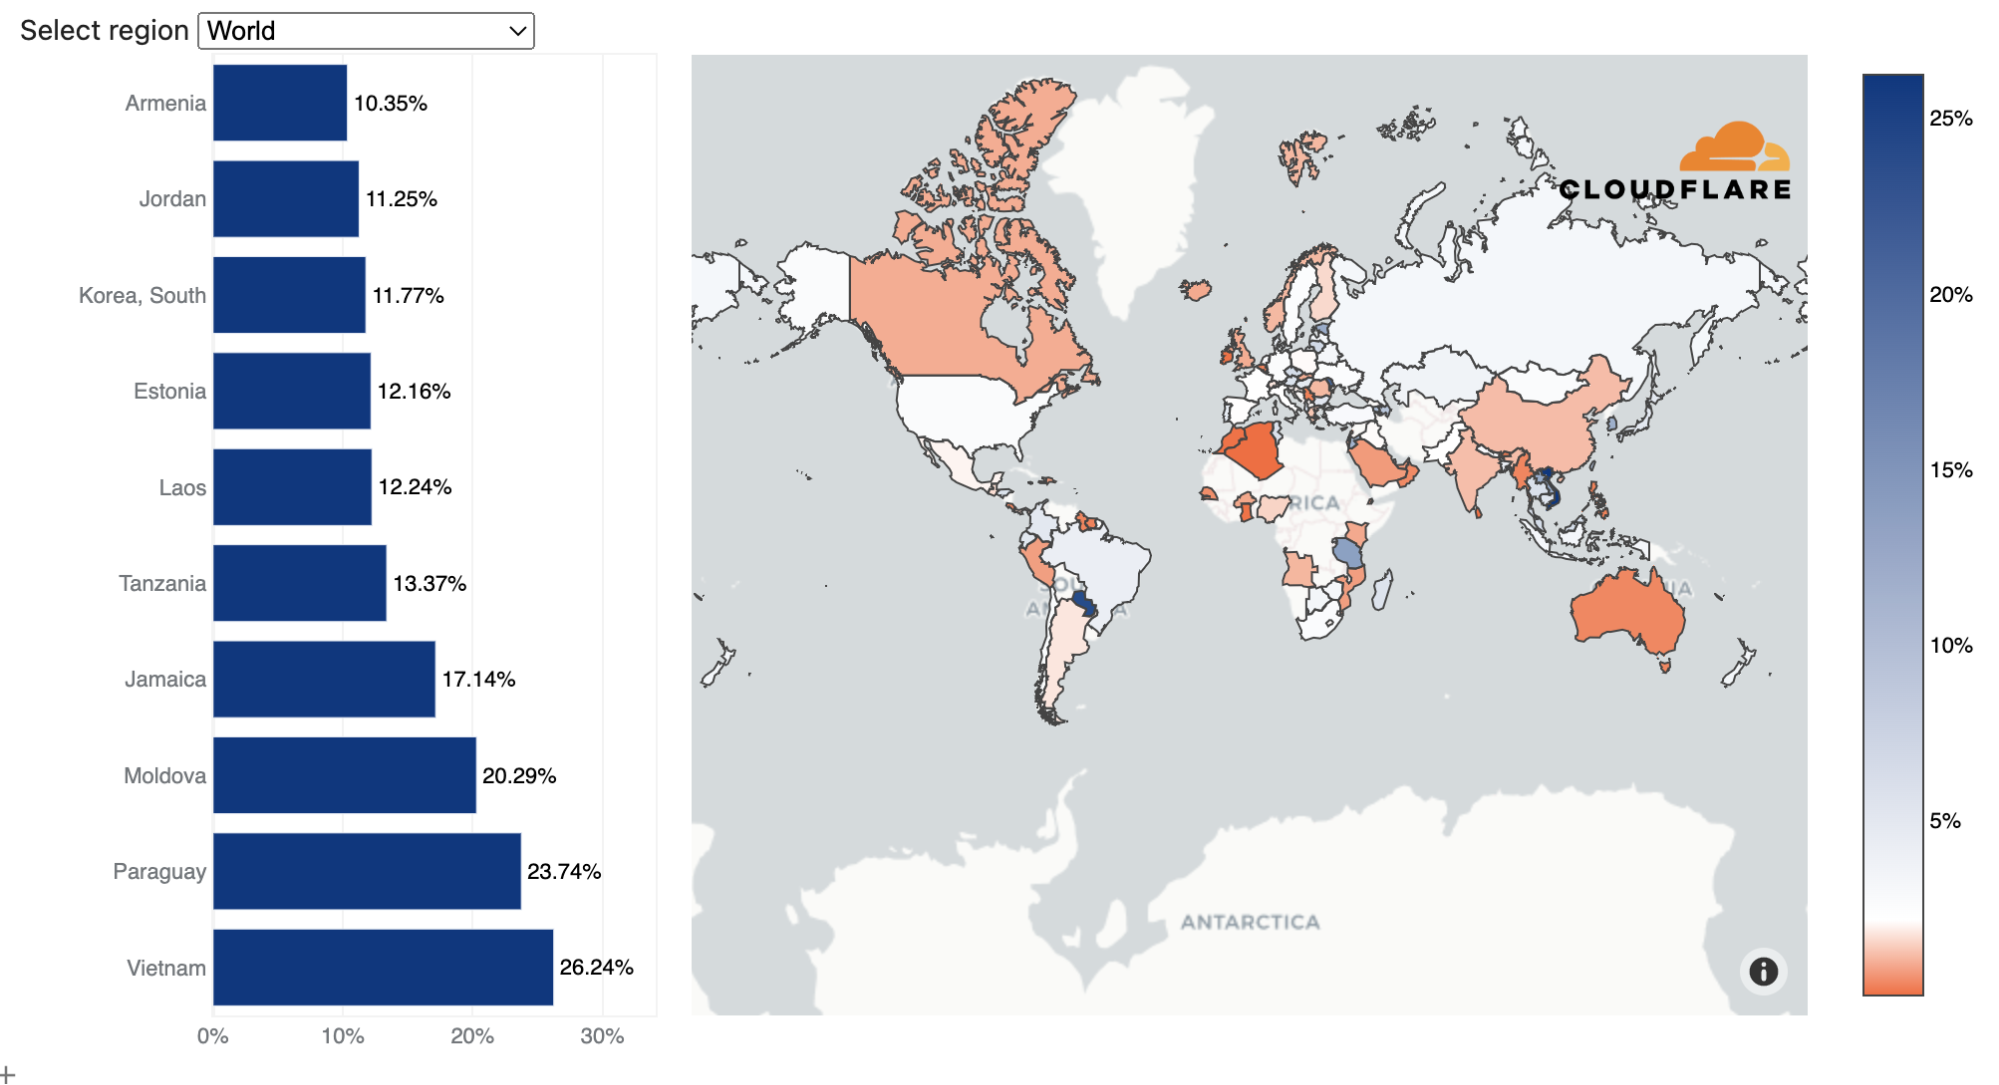
On the L3/4 side of things, Vietnam was the largest source of L3/4 DDoS attack traffic. Almost a third of all L3/4 traffic we ingested in our Vietnam data centers was attack traffic. Following Vietnam were Paraguay, Moldova, and Jamaica.
Top source countries of L3/4 DDoS attacks (percentage of attack traffic out of the total traffic per country)
What attack types and sizes we see
Attack size and duration
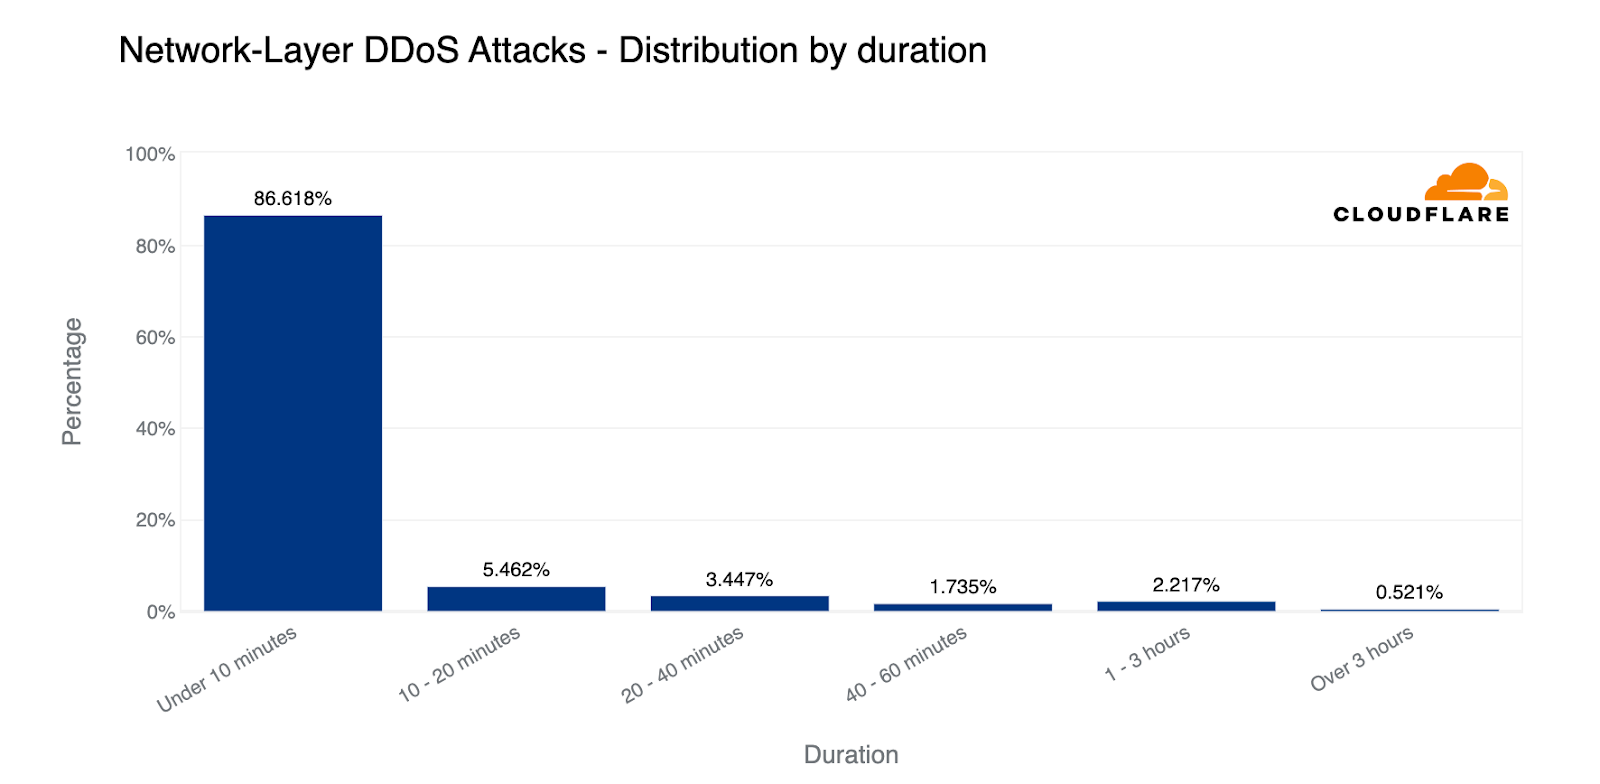
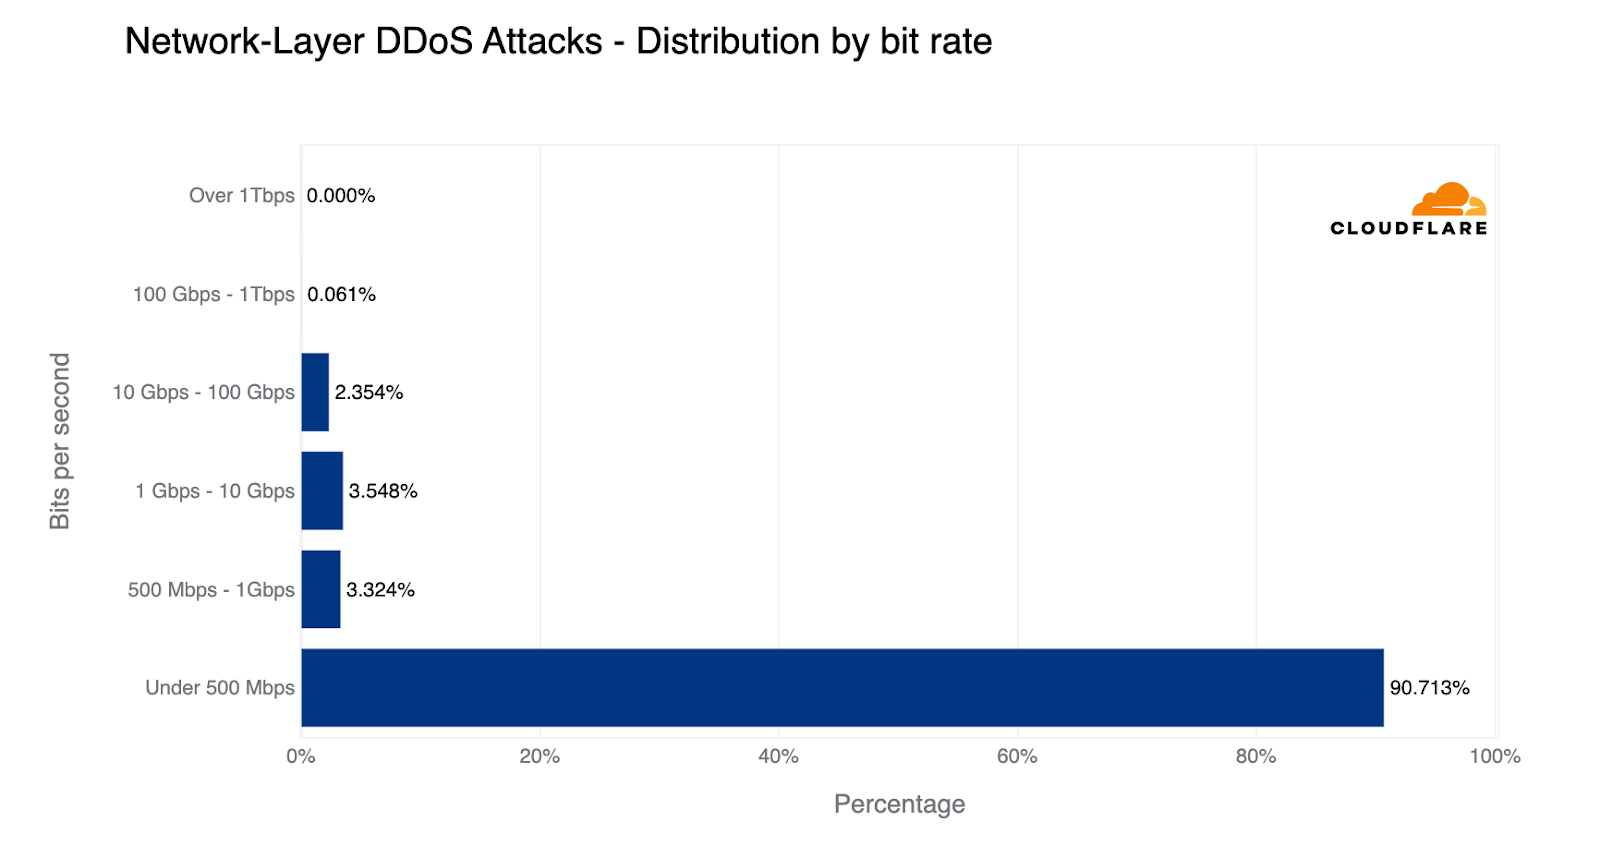
When looking at the types of attacks that are launched against our customers and our own network and applications, we can see that the majority of attacks are short and small; 86% of network-layer DDoS attacks end within 10 minutes, and 91% of attacks never exceed 500 Mbps.
Network-layer DDoS attacks by duration
Only one out of every fifty attacks ever exceeds 10 Gbps, and only one out of every thousand attacks exceeds 100 Gbps.
Network-layer DDoS attacks by bitrate
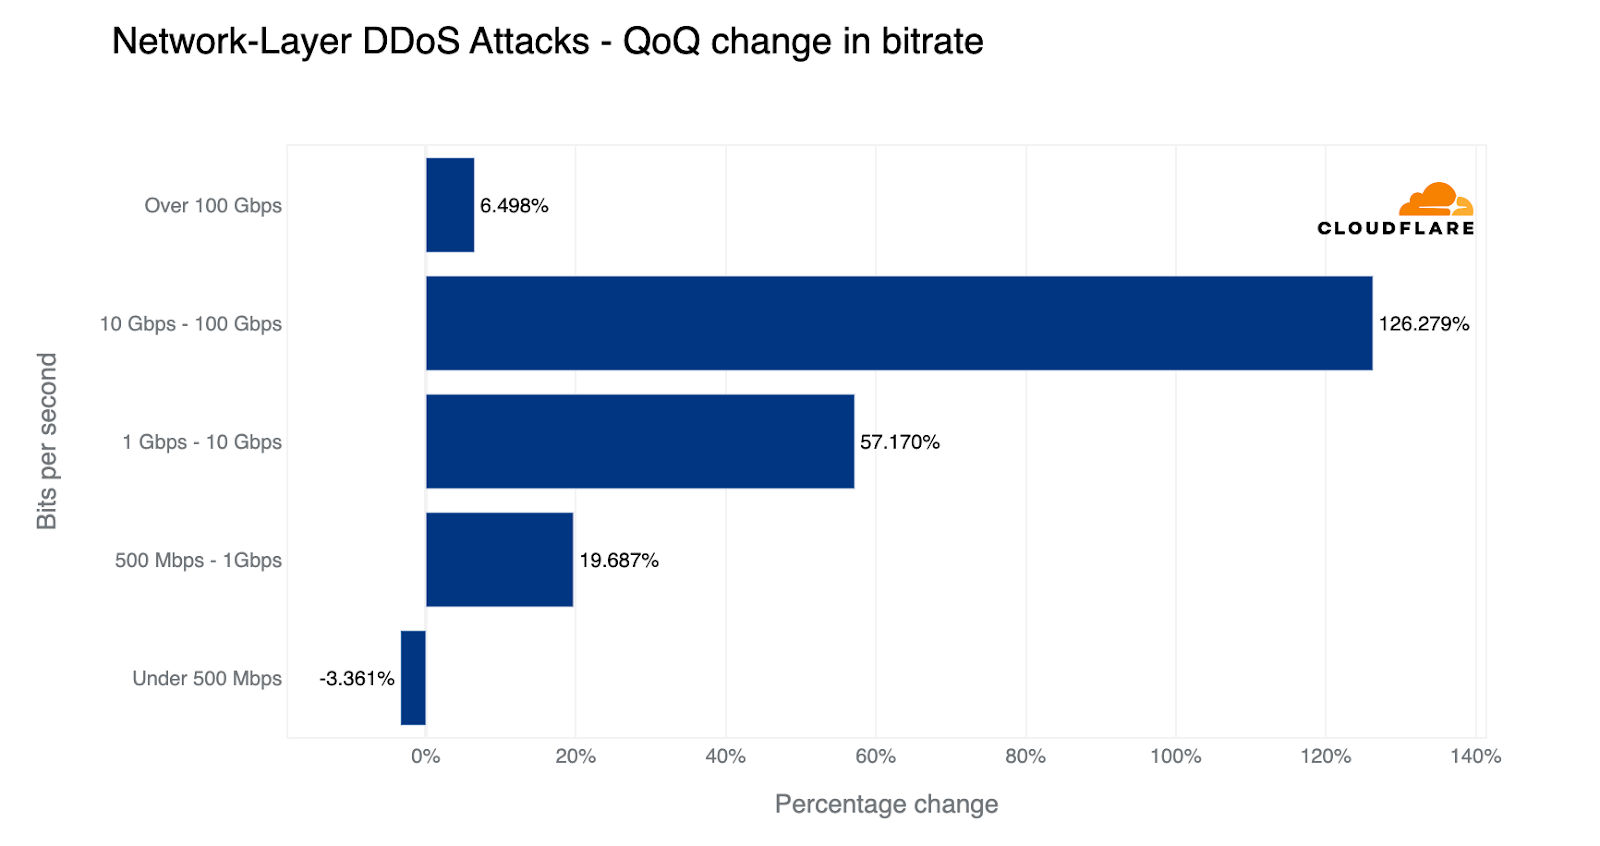
Having said that, larger attacks are slowly increasing in quantity and frequency. Last quarter, attacks exceeding 100 Gbps saw a 67% increase QoQ in their quantity. This quarter, the growth has slowed down a bit to 6%, but it’s still growing. In fact, there was an increase in all volumetric attacks excluding the ‘small’ bucket where the majority fall into — as visualized in the graph below. The largest growth was in the 10-100 Gbps range; an 89% increase QoQ.
Network-layer DDoS attacks by size: quarter-over-quarter change
Attack vectors
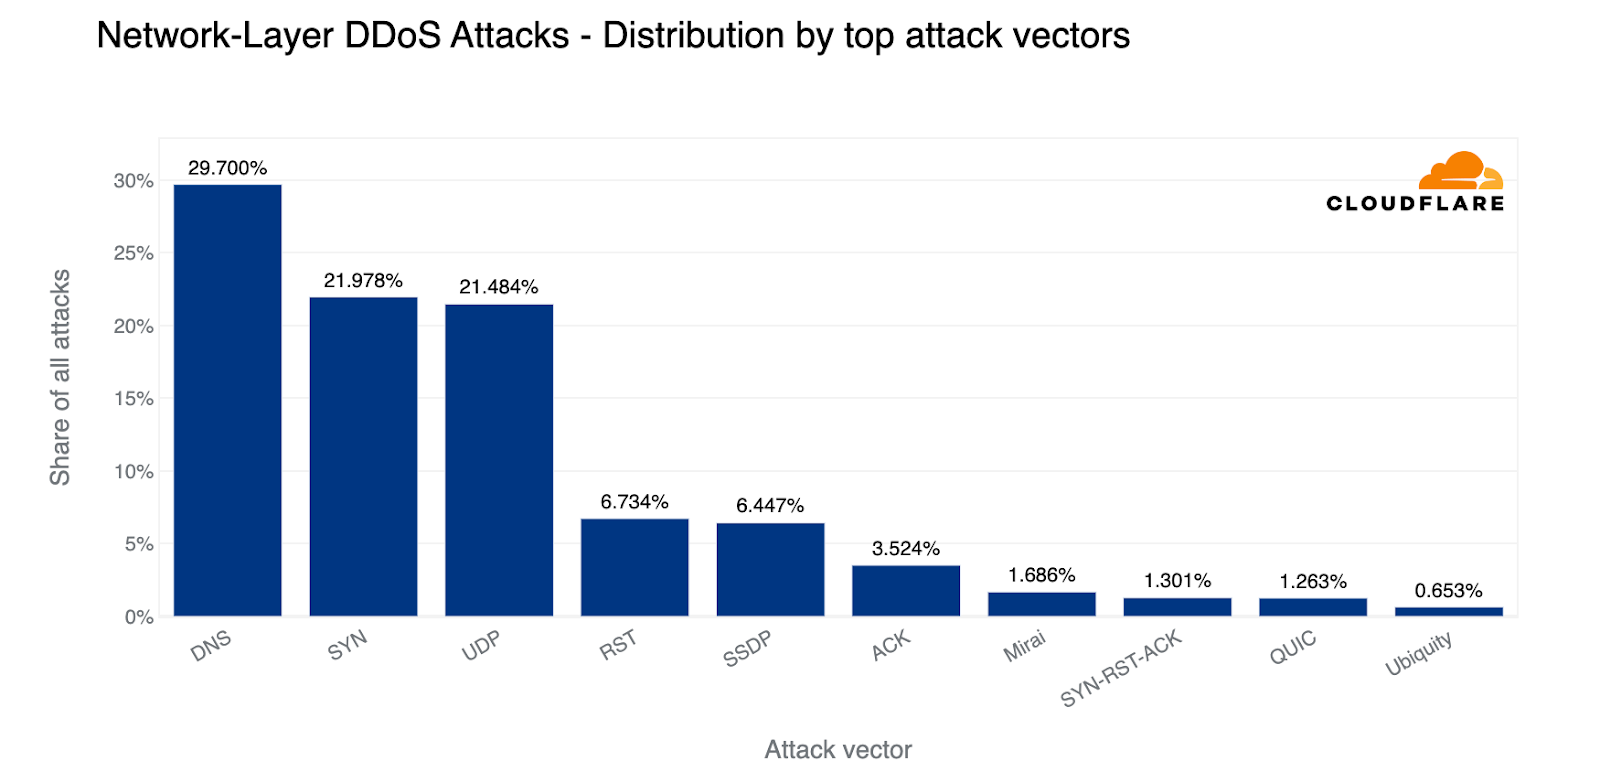
This quarter we saw a tectonic shift. With a 22% share, SYN floods scooched to the second place, making DNS-based DDoS attacks the most popular attack vector (30%). Almost a third of all L3/4 DDoS attacks were DNS-based; either DNS floods or DNS amplification/reflection attacks. Not far behind, UDP-based attacks came in third with a 21% share.
Top DDoS attack vectors
Emerging threats
Every quarter we see the reemergence of old and sometimes even ancient attack vectors. What this tells us is that even decade-old vulnerabilities are still being exploited to launch attacks. Threat actors are recycling and reusing old methods — perhaps hoping that organizations have dropped those protections against older methods.
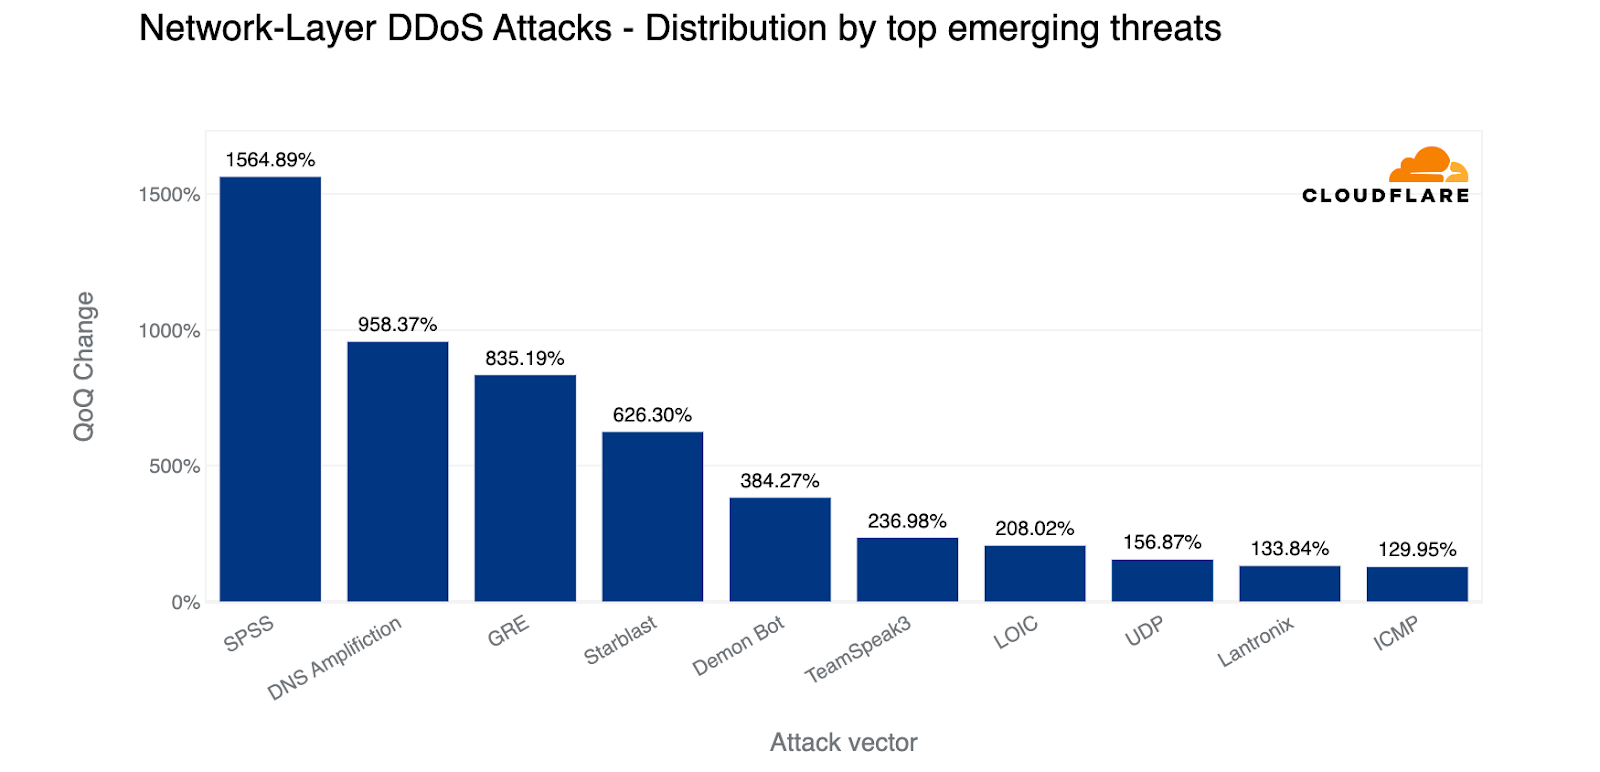
In the first quarter of 2023, there was a massive surge in SPSS-based DDoS attacks, DNS amplification attacks and GRE-based DDoS attacks.
Top DDoS emerging threats
SPSS-based DDoS attacks increased by 1,565% QoQ
The Statistical Product and Service Solutions (SPSS) is an IBM-developed software suite for use cases such as data management, business intelligence, and criminal investigation. The Sentinel RMS License Manager server is used to manage licensing for software products such as the IBM SPSS system. Back in 2021, two vulnerabilities (CVE-2021-22713 and CVE-2021-38153) were identified in the Sentinel RMS License Manager server which can be used to launch reflection DDoS attacks. Attackers can send large amounts of specially crafted license requests to the server, causing it to generate a response that is much larger than the original request. This response is sent back to the victim’s IP address, effectively amplifying the size of the attack and overwhelming the victim’s network with traffic. This type of attack is known as a reflection DDoS attack, and it can cause significant disruption to the availability of software products that rely on the Sentinel RMS License Manager, such as IBM SPSS Statistics. Applying the available patches to the license manager is essential to prevent these vulnerabilities from being exploited and to protect against reflection DDoS attacks.
DNS amplification DDoS attacks increased by 958% QoQ
DNS amplification attacks are a type of DDoS attack that involves exploiting vulnerabilities in the Domain Name System (DNS) infrastructure to generate large amounts of traffic directed at a victim’s network. Attackers send DNS requests to open DNS resolvers that have been misconfigured to allow recursive queries from any source, and use these requests to generate responses that are much larger than the original query. The attackers then spoof the victim’s IP address, causing the large responses to be directed at the victim’s network, overwhelming it with traffic and causing a denial of service. The challenge of mitigating DNS amplification attacks is that the attack traffic can be difficult to distinguish from legitimate traffic, making it difficult to block at the network level. To mitigate DNS amplification attacks, organizations can take steps such as properly configuring DNS resolvers, implementing rate-limiting techniques, and using traffic filtering tools to block traffic from known attack sources.
GRE-based DDoS attacks increased by 835% QoQ
GRE-based DDoS attacks involve using the Generic Routing Encapsulation (GRE) protocol to flood a victim’s network with large amounts of traffic. Attackers create multiple GRE tunnels between compromised hosts to send traffic to the victim’s network. These attacks are difficult to detect and filter, as the traffic appears as legitimate traffic on the victim’s network. Attackers can also use source IP address spoofing to make it appear that the traffic is coming from legitimate sources, making it difficult to block at the network level. GRE-based DDoS attacks pose several risks to targeted organizations, including downtime, disruption of business operations, and potential data theft or network infiltration. Mitigating these attacks requires the use of advanced traffic filtering tools that can detect and block attack traffic based on its characteristics, as well as techniques such as rate limiting and source IP address filtering to block traffic from known attack sources.
The DDoS threat landscape
In recent months, there has been an increase in longer and larger DDoS attacks across various industries, with volumetric attacks being particularly prominent. Non-profit and Broadcast Media companies were some of the top targeted industries. DNS DDoS attacks also became increasingly prevalent.
As DDoS attacks are typically carried out by bots, automated detection and mitigation are crucial for effective defense. Cloudflare’s automated systems provide constant protection against DDoS attacks for our customers, allowing them to focus on other aspects of their business. We believe that DDoS protection should be easily accessible to organizations of all sizes, and have been offering free and unlimited protection since 2017.
At Cloudflare, our mission is to help build a better Internet — one that is more secure and faster Internet for all.
We invite you to join our DDoS Trends Webinar to learn more about emerging threats and effective defense strategies.
A note about methodologies
How we calculate Ransom DDoS attack insights Cloudflare’s systems constantly analyze traffic and automatically apply mitigation when DDoS attacks are detected. Each attacked customer is prompted with an automated survey to help us better understand the nature of the attack and the success of the mitigation. For over two years, Cloudflare has been surveying attacked customers. One of the questions in the survey asks the respondents if they received a threat or a ransom note. Over the past two years, on average, we collected 164 responses per quarter. The responses of this survey are used to calculate the percentage of Ransom DDoS attacks.
How we calculate geographical and industry insights Source country At the application-layer, we use the attacking IP addresses to understand the origin country of the attacks. That is because at that layer, IP addresses cannot be spoofed (i.e., altered). However, at the network layer, source IP addresses can be spoofed. So, instead of relying on IP addresses to understand the source, we instead use the location of our data centers where the attack packets were ingested. We’re able to get geographical accuracy due to our large global coverage in over 285 locations around the world.
Target country For both application-layer and network-layer DDoS attacks, we group attacks and traffic by our customers’ billing country. This lets us understand which countries are subject to more attacks.
Target industry For both application-layer and network-layer DDoS attacks, we group attacks and traffic by our customers’ industry according to our customer relations management system. This lets us understand which industries are subject to more attacks.
Total volume vs. percentage For both source and target insights, we look at the total volume of attack traffic compared to all traffic as one data point. Additionally, we also look at the percentage of attack traffic towards or from a specific country, to a specific country or to a specific industry. This gives us an “attack activity rate” for a given country/industry which is normalized by their total traffic levels. This helps us remove biases of a country or industry that normally receives a lot of traffic and therefore a lot of attack traffic as well.
How we calculate attack characteristics To calculate the attack size, duration, attack vectors and emerging threats, we bucket attacks and then provide the share of each bucket out of the total amount for each dimension.
General disclaimer and clarification When we describe ‘top countries’ as the source or target of attacks, it does not necessarily mean that that country was attacked as a country, but rather that organizations that use that country as their billing country were targeted by attacks. Similarly, attacks originating from a country does not mean that that country launched the attacks, but rather that the attack was launched from IP addresses that have been mapped to that country. Threat actors operate global botnets with nodes all over the world, and in many cases also use Virtual Private Networks and proxies to obfuscate their true location. So if anything, the source country could indicate the presence of exit nodes or botnet nodes within that country.
Car thieves are injecting malicious software into a car’s network through wires in the headlights (or taillights) that fool the car into believing that the electronic key is nearby.
As the world continues to navigate the post-pandemic shift in work environments, Rapid7 is operating on a hybrid-first approach that balances flexibility and productivity with collaboration and optimizing for customer success.
In the spirit of cross-collaboration, the People Development and Workplace Experience teams partnered with managers across the company to record an internal podcast series. The series, dubbed “Have You Herd? Navigating Our Hybrid-First World!,” captures the stories and experiences of our managers adapting to hybrid work and how they support their teams. ‘Herd’ is a nod to our moose, the term we use to describe our people. Since the word ‘moose’ is both singular and plural, it means that we respect everyone’s individuality while working together as one team towards a common goal.
Chatting with our host, Senior Director of UX for the Detection and Response practice Gwen Betts, managers shared tips and tricks for building strong cross-functional teams, staying connected to the Rapid7 community, and most importantly, creating impact for our customers. Throughout these episodes, three key themes emerged: building strong team relationships, cross-team collaboration, and employee engagement. Take a look below to see how our managers are navigating these areas, and hear directly from some of them via the audio clips!
Strong Team Relationships
Whether you’re working together in person or virtually, it’s important to consciously create a dynamic and supportive team environment to help people drive impact. Balancing both environments in a hybrid workplace can often feel challenging. In Episode One, Director of Talent Acquisition Caroline Galvin and Senior Director of Software Engineering Neville O’Neill discussed how they foster team relationships for creating impact. Some tips they shared include:“Anchor your team around a common mission.” When team members are accountable to each other in pursuit of a common goal, the bonds of trust and respect are strengthened.
“Find ways to come together for the moments that matter.” There are many ways to celebrate wins virtually, but don’t lose sight of the value of coming together in person to celebrate the big milestones or especially noteworthy occasions. This can create a solid foundation that helps those virtual celebrations and events become even more meaningful because of what you’ve spent time to build intentionally.
“Connect as humans! Be more relational, less transactional.” Encouraging your team members to bring their full selves to work (like we emphasize with our Bring You core value) and connecting on a personal level improves communication and trust for working through tough situations.
The Magic of Cross-Team Connections
Not only are our Moose moving between home and office work environments, but our managers often have direct reports and cross-functional stakeholders working across different locations and time zones as well. Ensuring they have a solid communication plan is fundamental to their team’s success.
In Episode Two, Jan Krijgsman, Senior Sales Manager and Aniket Menon, Vice President of Product Management shared their tips for developing clear and consistent communication channels:
“Be clear with Slack message/email intentions.” Let the recipient know whether a question or request is urgent, or can wait for a response. Respecting people’s time and helping them prioritize their work makes for better collaboration.
“Engage in regular check-ins with your direct reports.” Build a connection based on trust so that difficult conversations are not avoided and feedback exchanges can be prioritized.
“Empower team members to connect cross-functionally.” Encourage them to develop their internal networks. Every day, Rapid7’s InsightCoffee program empowers our people to develop cross functional relationships that otherwise would not have been possible. We’re intentional in making sure all of our Moose feel encouraged to reach out and chat with anyone, at any level, on any team.
Employee Engagement
A major focus of the podcast has been employee engagement in a hybrid world. With reduced face-to-face time and the ever-present threat of Zoom fatigue, how do managers help their teammates stay engaged with the Rapid7 community? All of our podcast guests had fantastic solutions that they use to consistently boost team morale:
“Utilize the concept of ‘first’ and ‘second’ teams (or, regional and functional teams).” If you have team members who are geographically separated from the rest of the team, work with them to develop a regional team with those who work in the same location. This helps balance creating a strong global team culture with strengthening the micro-cultures that form locally, establishing a strong foundation for people to feel even more connected.
“Slack is the new water cooler!” Have a few minutes in between Zoom meetings, or taking a coffee break? This is the best time to drop into those ‘fun’ Slack channels to engage with others around personal interests. Some favorites at Rapid7 include the #puppies and #cooking channels!
“Celebrate ‘wins’!” Make an effort to acknowledge and celebrate the incredible work that your team does. Show that what they accomplish makes a real impact on the success of the team and the business!
Conclusion
Our work environments look quite different than they did three years ago. While we have largely settled into this new way of working, we embrace our core value of Never Done by continuing to ask ourselves how we can continue to improve. At Rapid7, we truly believe that our managers are impact multipliers, with a direct hand in optimizing our teams and creating impact for our customers. This podcast series has given our managers another way to learn from each other and collaborate on best practices for building strong team relationships, improving cross-team collaboration, and encouraging robust employee engagement.
Обявиха номинациите за десетото издание на Международния литературен ученически конкурс „Който спаси един човешки живот, спасява цяла вселена”. Те са избрани от жури в състав Георги Бърдаров, Радостина Николова, Румен…
Developers who feel more satisfied in their jobs are better positioned to be more productive. We also know developers can gain a sense of fulfillment by making an impact beyond the walls of their company and elevating their community. An opportunity exists, which developers can meet, to support those who lack access to the financial system. Many countries are working to drive financial inclusion through different motions—to which developers can contribute. GitHub provides a set of tools and services, which can support your developers working to address this need.
For example, in Australia, there is a huge opportunity to continue the work aimed at reaching those who are not currently included in the financial system. There are still a large number of people that don’t have access to important services that many of us take for granted—an opportunity that financial inclusion tries to solve.
Let’s explore these opportunities and how GitHub can help.
Financial inclusion explained
The World Bank defines financial inclusion as providing individuals and businesses access to affordable financial products to meet their needs. This includes products, such as checking accounts, credit cards, mortgages, and payments, which are still not available to over a billion unbanked people around the world. Many of these are women, people living in poverty, and those living outside of large cities.
Open Finance (or Open Banking) is an approach adopted by banks like NAB (National Australia Bank) to help include more individuals in the financial system by providing them access to the best products and services in a secure way that addresses their needs.
To enable financial inclusion and Open Finance, there needs to be a channel to exchange data and services between banks, customers, and trusted partners (fintechs, for example); that is where application programming interfaces (APIs) come in. The easiest way to understand an API is to think of it as a contract between two applications that need a standardized and secure way to talk to each other. Once the contract is created and secured, it can be used anywhere to share data or initiate a financial transaction.
This API-driven innovation lowers barriers for those individuals who may have limited physical access to banks, credit cards, or traditional financial products.
How GitHub can help
The tremendous opportunities for Australia, New Zealand, India, and other countries to enable financial inclusion to its population are dependent on the quality of the APIs. The quality and adoption of the APIs is dependent on creating a great developer experience because they are the ones building the APIs and applications that will leverage them.
GitHub is used by 100 million developers and is widely-recognized as the global home of open source. Developer experience is at the core of everything we do and it empowers developers to do their best work and be happy. But how does GitHub help enable financial inclusion and Open Finance?
The Open Bank Project released a report in 2020 highlighting how providing a great developer experience can drive growth of APIs that enable financial inclusion. Several topics which were highlighted and where GitHub can help are:
1. Create solutions to help people
This is an important motivator for developers. If developers create solutions that can help increase financial inclusion, they should make sure those solutions are available to as many people as possible through the open source community. Since we know that open source is the foundation of more than 90% of the world’s software, there is a great opportunity to collaborate globally and build on solutions that already exist.
Because GitHub is the home of open source and has 100 million developers, there is no better place for developers to create solutions that will make the biggest impact.
2. Running Hackathons
Hackathons, like the Global Open Finance Challenge, which NAB collaborated in and was won by an Aussie start-up, are important for developers to share ideas with other developers and large enterprises. They help developers see what APIs are currently available and enable innovation and collaboration with a global reach. To run a successful hackathon, developers will need to have access to code and documentation, which has been open sourced—and GitHub is a key component to enable this.
3. Recognition for developers
If a developer has worked on a solution that is helping enable financial inclusion, it’s important to ensure their effort is recognized and supported. The most important part of recognizing the awesome work developers do is to make sure there is a single platform where this work can be shared. Thankfully, that platform already exists and any developer, anywhere in the world, can access it for free—it’s GitHub!
At GitHub, we also know that sometimes recognition isn’t enough, and developers need support. This is why the GitHub Sponsors program was created. We also created our GitHub for Startups program which provides support to the startup community around the world—many of whom are important contributors to Open Banking.
4. Documentation
The success of an API is dependent on how easy it is for developers to understand and use. If developers are unable to quickly understand the context of the API, how to connect to it, or easily set it up to test it, then it probably won’t be successful.
The topic of API documentation and API Management is beyond the scope of this post, but it’s important to remember that open source is a key enabler of Open Finance and developers will need a platform to collaborate and share documentation and code. GitHub is the best platform for that, and we have seen at least a 50% increase in productivity when developers leverage documentation best practices enabled by GitHub.
Call to action
Developers have an amazing opportunity to contribute to the financial inclusion work that is happening in Australia and across the world. GitHub can help support developers to address this opportunity by giving them the tools and services they need to be productive and successful.
We’ve recently launched our weekly livestream on LinkedIn Live, GitHub in my Day Job, for those who want to learn more about how GitHub empowers developers across the community while providing guardrails to govern, and remain compliant. So, join us at https://gh.io/dayjob—we can’t wait to have you with us.
The AWS Well-Architected Framework is a collection of best practices that allow customers to evaluate and improve the design, implementation, and operations of their workloads in the cloud.
In 2020, the content for the Well-Architected Framework received a major update, as well as more lenses, and API integration with the AWS Well-Architected Tool. The sixth pillar, Sustainability, was added in 2021. In 2022, dedicated pages were introduced for each consolidated best practice across all six pillars, with several best practices updated with improved prescriptive guidance.
AWS Well-Architected timeline
What’s new
Well-Architected Framework content is consistently updated and improved in order to adapt to the constantly changing and innovating AWS environment, with new and evolved emerging services and technologies. This ensures cloud architects can build and operate secure, high-performing, resilient, efficient, and sustainable systems in the AWS Cloud.
The Operational Excellence Pillar has a new best practice on enabling support plans for production workloads. This Pillar also has a major update on defining a customer communication plan for outages.
In the Security Pillar, we added a new best practice area, Application Security (AppSec). AppSec is complete with eight new best practices to guide customers as they develop, test, and release software, providing guidance on how to consider the tools, testing, and organizational approach used to develop software.
The Reliability Pillar has a new best practice on architecting workloads to meet availability targets and uptime service-level agreements (SLAs). We also added the resilience shared responsibility model to its introduction section.
The Cost Optimization Pillar has new best practices on automating operations as a part of cost-optimization efforts and enforcing data-retention policies.
In the Sustainability Pillar, we introduced a clear process for selecting Regions, as well as tools for right-sizing services and improving the overall utilization of resources in the AWS Cloud.
Best practice updates
The implementation guidance and best practices have been updated in this release to be more prescriptive, including enhanced recommendations and steps on reusable architecture patterns targeting specific business outcomes in the AWS Cloud.
As many as 113 best practices are updated with more prescriptive guidance in Operational Excellence (22), Security (18), Reliability (14), Performance Efficiency (10), Cost Optimization (22), and Sustainability (27). Fourteen new best practices have been introduced in Operational Excellence (1), Security (9), Reliability (1), Cost Optimization (2), and Sustainability (1).
From a total of 127 new/updated best practices, 78% include explicit implementation steps as part of making them more prescriptive. The remaining 22% have been updated by improving their existing implementation steps. These changes are in addition to the 51 improved best practices released in 2022 (18 in Q3 2022, and 33 in Q4 2022), resulting in more than 50% of the existing Framework best practices having been updated recently.
The content is available in 11 languages: English, Spanish, French, German, Italian, Japanese, Korean, Indonesian, Brazilian Portuguese, Simplified Chinese, and Traditional Chinese.
Here is the list of best practices that are new or updated in this release:
Updates in this release are also available in the AWS Well-Architected Tool, which can be used to review your workloads, address important design considerations, and help ensure that you follow the best practices and guidance of the AWS Well-Architected Framework.
The AWS Summit season has started. AWS Summits are free technical and business conferences happening in large cities across the planet. This week, we were happy to welcome our customers and partners in Sydney and Paris. In France, 9,973 customers and partners joined us for the day to meet and exchange ideas but also to attend one of the more than 145 technical breakout sessions and the keynote. This is the largest cloud computing event in France, and I can’t resist sharing a picture from the main room during the opening keynote.
There are AWS Summits on all continents ; you can find the list and the links for registration here https://aws.amazon.com/events/summits. The next on my agenda are listed at the end of this post.
AWS Lambda response streaming – Response streaming is a new invocation pattern that lets functions progressively stream response payloads back to clients. You can use Lambda response payload streaming to send response data to callers as it becomes available. Response streaming also allows you to build functions that return larger payloads and perform long-running operations while reporting incremental progress (within the 15 minutes execution period). My colleague Julian wrote an incredibly detailed blog post to help you to get started.
AWS Supply Chain Now Generally Available – AWS Supply Chain is a cloud application that mitigates risk and lowers costs with unified data and built-in contextual collaboration. It connects to your existing enterprise resource planning (ERP) and supply chain management systems to bring you ML-powered actionable insights into your supply chain.
AWS Service Catalog Supports Terraform Templates – With AWS Service Catalog, you can create, govern, and manage a catalog of infrastructure as code (IaC) templates that are approved for use on AWS. You can now define AWS Service Catalog products and their resources using either AWS CloudFormation or Hashicorp Terraform and choose the tool that better aligns with your processes and expertise.
Amazon S3 enforces two security best practices and brings new visibility into object replication status – As announced on December 13, 2022, Amazon S3 is now deploying two new default bucket security settings by automatically enabling S3 Block Public Access and disabling S3 access control lists (ACLs) for all new S3 buckets. Amazon S3 also adds a new Amazon CloudWatch metric that can be used to diagnose and correct S3 Replication configuration issues more quickly. The OperationFailedReplication metric, available in both the Amazon S3 console and in Amazon CloudWatch, gives you per-minute visibility into the number of objects that did not replicate to the destination bucket for each of your replication rules.
AWS Cloud Operation Competency Partners – AWS Cloud Operations covers five fundamental solution areas: Cloud Governance, Cloud Financial Management, Monitoring and Observability, Compliance and Auditing, and Operations Management. The new competency enables customers to select validated AWS Partners who offer comprehensive solutions with an integrated approach across multiple areas.
Amplify Library for Swift on macOS – Amplify is an open-source, client-side library making it easier to access a cloud backend from your front-end application code. It provides language-specific constructs to abstract low-level details of the cloud API. It helps you to integrate services such as analytics, object storage, REST or GraphQL APIs, user authentication, geolocation and mapping, and push notifications. You can now write beautiful macOS applications that connect to the same cloud backend as their iOS counterparts.
X in Y Jeff started this section a while ago to list the expansion of new services and capabilities to additional Regions. I noticed 11 Regional expansions this week:
Upcoming AWS Events And to finish this post, I recommend you check your calendars and sign up for these AWS-led events:
.Net Developer Day – .NET Enterprise Developer Day EMEA 2023 (April 25) is a free, one-day virtual conference providing enterprise developers with the most relevant information to swiftly and efficiently migrate and modernize their .NET applications and workloads on AWS.
AWS re:Inforce 2023 – Now register AWS re:Inforce, in Anaheim, California, June 13–14. AWS Chief Information Security Officer CJ Moses will share the latest innovations in cloud security and what AWS Security is focused on. The breakout sessions will provide real-world examples of how security is embedded into the way businesses operate. To learn more and get the limited discount code to register, see CJ’s blog post of Gain insights and knowledge at AWS re:Inforce 2023 in the AWS Security Blog.
AWS Global Summits – Check your calendars and sign up for the AWS Summit close to where you live or work: Seoul (May 3–4), Berlin and Singapore (May 4), Stockholm (May 11), Hong Kong (May 23), Amsterdam (June 1), London (June 7), Madrid (June 15), and Milano (June 22).
AWS Community Day – Join community-led conferences driven by AWS user group leaders close to your city: Lima (April 15), Helsinki (April 20), Chicago (June 15), Manila (June 29–30), and Munich (September 14). Recently, we have been bringing together AWS user groups from around the world into Meetup Pro accounts. Find your group and its meetups in your city!
The Official AWS Podcast – Listen each week for updates on the latest AWS news and deep dives into exciting use cases. There are also official AWS podcasts in your local languages. Check out the ones in French, German, Italian, and Spanish.
The extended BPF (eBPF) virtual machine
allows programs to be loaded into and executed with the kernel — and,
increasingly, other environments. As the use of BPF grows, so does
interest in defining what the BPF virtual machine actually is. In an
effort to ensure a consistent and fair environment for defining what
constitutes the official BPF language and run-time environment, and to
encourage NVMe vendors to support BPF offloading, a recent effort
has been undertaken to standardize BPF.
On April 10, 2013, Backblaze saved our first daily hard drive snapshot file. We had decided to start saving these daily snapshots to improve our understanding of the burgeoning collection of hard drives we were using to store customer data. That was the beginning of the Backblaze Drive Stats reports that we know today.
Little did we know at the time that we’d be collecting the data for the next 10 years or writing various Drive Stats reports that are read by millions, but here we are.
I’ve been at Backblaze longer than Drive Stats and probably know the drive stats data and history better than most, so let’s spend the next few minutes getting beyond the quarterly and lifetime tables and charts and I’ll tell you some stories from behind the scenes of Drive Stats over the past 10 years.
1. The Drive Stats Light Bulb Moment
I have never been able to confirm whose idea it was to start saving the Drive Stats data. The two Brians—founder Brian Wilson, our CTO before he retired and engineer Brian Beach, our current CTO—take turns eating humble pie and giving each other credit for this grand experiment.
But, beyond the idea, one Brian or the other also had to make it happen. Someone had to write the Python scripts to capture and process the data, and then deploy these scripts across our fleet of shiny red Storage Pods and other storage servers, and finally someone also had to find a place to store all this newly captured data. My money’s on—to paraphrase Mr. Edison—founder Brian being the 1% that is inspiration, and engineer Brian being the 99% that is perspiration. The split could be 90/10 or even 80/20, but that’s how I think it went down.
2. The Experiment Begins
In April 2013, our Drive Stats data collection experiment began. We would collect and save basic drive information, including the SMART statistics for each drive, each day. The effort was more than a skunkworks project, but certainly not a full-fledged engineering project. Conducting such experiments has been part of our DNA since we started and we continue today, albeit with a little more planning and documentation. Still the basic process—try something, evaluate it, tweak it, and try again—still applies, and over the years, such experiments have led to the development of our Storage Pods and our Drive Farming efforts.
Our initial goal in collecting the Drive Stats data was to determine if it would help us better understand the failure rates of the hard drives we were using to store data. Questions that were top of mind included: Which drive models lasted longer? Which SMART attributes really foretold drive health? What is the failure rate of different models? And so on. The answers, we hoped, would help us make better purchasing and drive deployment decisions.
3. Where “Drive Days” Came From
To compute a failure rate of a given group of drives over a given time period, you might start with two pieces of data: the number of drives, and the number of drive failures over that period of time. So, if over the last year, you had 10 drives and one failed, you could say the 10% failure rate for the year. That works for static systems, but data centers are quite different. On a daily basis, drives enter and leave the system. There are new drives, failed drives, migrated drives, and so on. In other words, the number of drives is probably not consistent across a given time period. To address this issue, CTO Brian (current CTO Brian that is) worked with professors from UC Santa Cruz on the problem and the idea of Drive Days was born. A drive day is one drive in operation for one day, so one drive in operation for ten days is ten drive days.
To see this in action you start by defining the cohort of drives and the time period you want and then apply the following formula to get the Annualized Failure Rate (AFR).
AFR = ( Drive Failures / ( Drive Days / 365 ) )
This simple calculation allows you to compute an Annualized Failure Rate for any cohort of drives over any period of time and accounts for a variable number of drives over that period.
4. Wait! There’s No Beginning?
In testing out our elegantly simple AFR formula, we discovered a problem. Not with the formula, but with the data. We started collecting data on April 10, 2013, but many of the drives were present before then. If we wanted to compute the AFR of model XYZ for 2013, we could not count the number of drive days those drives had prior to April 10—there were none.
Never fear, SMART 9 raw value to the rescue. For the uninitiated, the SMART 9 raw value contains the number of power-on hours for a drive. A little math gets you the number of days—that is Drive Days—and you are ready to go. This little workaround was employed whenever we needed to work with drives that came into service before we started collecting data.
Why not use SMART 9 all of the time? A couple of reasons. First, sometimes the value gets corrupted. Especially when the drive is failing, it could be zero or a million or anywhere in between. Second, a new drive can have non-default SMART values. Perhaps it is just part of the burn in process or a test group at the manufacturer, or maybe the drive was a return that passed some qualification process.
Regardless, the starting value of SMART 9 wasn’t consistent across drives, so we just counted operational days in our environment and used SMART 9 as a substitute only when we couldn’t count those days. Using SMART 9 is moot now as these days there are no drives left in the current drive collection which were present prior to April 2013.
5. There’s Gold In That There Data
While the primary objective of collecting the data was to improve our operations, there was always another potential use lurking about—to write a blog post, or two, or 56. Yes, we’ve written 56 blog posts and counting based on our Drive Stats data. And no, we could have never imagined that would be the case when this all started back in 2013.
The very first Drive Stats-related blog post was written by Brian Beach (current CTO Brian, former engineer Brian) in November 2013 (we’ve updated it since then). The post had the audacious title of “How Long Do Disk Drives Last?” and a matching URL of “www.backblaze.com/blog/how-long-do-disk-drives-last/”. Besides our usual blog readers, search engines were falling all over themselves referring new readers to the site based on searches for variants of the title and the post became first page search material for multiple years. Alas, all Google things must come to an end, as the post disappeared into page two and then the oblivion beyond.
Buoyed by the success of the first post, Brian went on to write several additional posts over the next year or so based on the Drive Stats data.
That’s an impressive body of work, but Brian is, by head and heart, an engineer, and writing blog posts meant he wasn’t writing code. So after his post to open source the Drive Stats data in February 2015, he passed the reins of this nascent franchise over to me.
6. What’s in a Name?
When writing about drive failure rates, Brian used the term “Hard Drive Reliability” in his posts. When I took over, beginning with the Q1 2015 report, we morphed the term slightly to “Hard Drive Reliability Stats.” That term lasted through 2015 and in Q1 2016 it was shortened to “Hard Drive Stats.” I’d like to tell you there was a great deal of contemplation and angst that went into the decision, but the truth is the title of the Q1 2016 post “One Billion Drive Hours and Counting: Q1 2016 Hard Drive Stats,” was really long and we left out the word reliability so it wouldn’t be any longer—something about title length, the URL, search terms, and so on. The abbreviated version stuck and to this day we publish “Hard Drive Stats” reports. That said, we often shorten the term even more to just “Drive Stats,” which is technically more correct given we have solid state drives (SSDs), not just hard disk drives (HDDs), in the dataset when we talk about boot drives.
7. Boot Drives
Beginning in Q4 2013, we began collecting and storing failure and SMART stats data from some of the boot drives that we use on our storage servers in the Drive Stats data set. Over the first half of 2014, additional boot drive models were configured to report their data and by Q3 2014, all boot drives were reporting. Now the Drive Stats dataset contained both data from the data drives and the boot drives of our storage servers. There was one problem: there was no field for drive source. In other words, to distinguish a data drive from a boot drive, you needed to use the drive model.
In Q4 2018, we began using SSDs as boot drives and began collecting and storing drive stats data from the SSDs as well. Guess what? There was no drive type field either, so SSD and HDD boot drives had to be distinguished by their model numbers. Our engineering folks are really busy on product and platform features and functionality, so we use some quick-and-dirty SQL on the post-processing side to add the missing information.
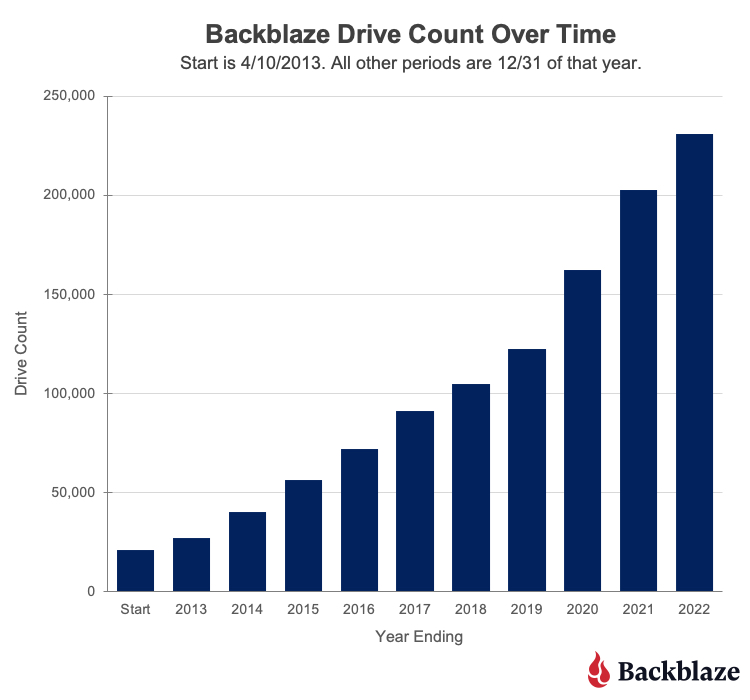
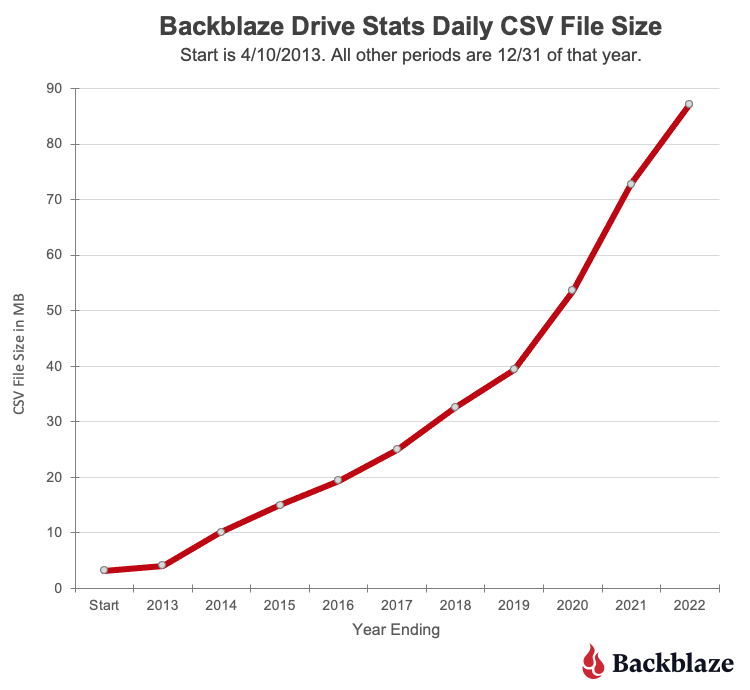
On April 10, 2013, data was collected for 21,195 hard drives. The .csv data file for that day was 3.2MB. The numbers of drives and the amount of data has grown just a wee bit since then, as you can see in the following charts.
The current size of a daily Drive Stats .csv file is over 87MB. If you downloaded the entire Drive Stats dataset, you would need 113GB of storage available once you unzipped all the data files. If you are so inclined, you’ll find the data on our Drive Stats page. Once there, open the “Downloading the Raw HD Test Data” link to see a complete list of the files available.
9. Who Uses The Drive Stats Dataset?
Over the years, the Drive Stats dataset has been used in multiple ways for different reasons. Using Google Scholar, you can currently find 660 citations for the term “Backblaze hard drive stats” going back to 2014. This includes 18 review articles. Here are a couple of different ways the data has been used.
As a teaching tool: Several universities and similar groups have used the dataset as part of their computer science, data analytics, or statistics classes. The dataset is somewhat large, but it’s still manageable, and can be divided into yearly increments if needed. In addition, it is reasonably standardized, but not perfect, providing a good data cleansing challenge. The different drive models and variable number of drive counts allows students to practice data segmentation across the various statistical methods they are studying.
For artificial intelligence (AI) and machine learning: Over the years several studies have been conducted using AI and machine learning techniques applied to the Drive Stats data to determine if drive failure or drive health is predictable. We looked at one method from Interpretable on our blog, but there are several others. The results have varied, but the general conclusion is that while you can predict drive failure to some degree, the results seem to be limited to a given drive model.
10. Drive Stats Experiments at Backblaze
Of course, we also use the Drive Stats data internally at Backblaze to inform our operations and run our own experiments. Here are a couple examples:
Inside Backblaze: Part of the process in developing and productizing the Backblaze Storage Pod was the development of the software to manage the system itself. Almost from day one, we used certain SMART stats to help determine if a drive was not feeling well. In practice, other triggers such as ATA errors or FSCKs alerts, will often provide the first indicator of a problem. We then apply the historical and current SMART stats data that we have recorded and stored to complete the analysis. For example, we receive an ATA error on a given drive. There could be several non-drive reasons for such an error, but we can quickly determine that the drive has a history of increasing bad media and command timeouts values over time. Taken together, it could be time to replace that drive.
Trying new things: The Backblaze Evangelism team decided that SQL was too slow when accessing the Drive Stats data. They decided to see if they could use a combination of Parquet and Trino to make the process faster. Once they had done that, they went to work duplicating some of the standard queries we run each quarter in producing our Drive Stats Reports.
What Lies Ahead
First, thank you for reading and commenting on our various Drive Stats Reports over the years. You’ve made us better and we appreciate your comments—all of them. Not everyone likes the data or the reports, and that’s fine, but most people find the data interesting and occasionally useful. We publish the data as a service to the community at large, and we’re glad many people have found it helpful, especially when it can be used in teaching people how to test, challenge, and comprehend data—a very useful skill in navigating today’s noise versus knowledge environment.
We will continue to gather and publish the Drive Stats dataset each quarter for as long as it is practical and useful to our readers. That said, I can’t imagine we’ll be writing Drive Stats reports 10 years from now, but just in case, if anyone is interested in taking over, just let me know.
In this blog post I’d like to walk you through how to implement BIMI while using Amazon SES. For your information BIMI can be best described by the following excerpt from bimigroup.org:
Brand Indicators for Message Identification or BIMI (pronounced: Bih-mee) is an emerging email specification that enables the use of brand-controlled logos within supporting email clients. BIMI leverages the work an organization has put into deploying DMARC protection, by bringing brand logos to the customer’s inbox. For the brand’s logo to be displayed, the email must pass DMARC authentication checks, ensuring that the organization’s domain has not been impersonated.
Brands continually need to protect themselves from spoofing and phishing from bad actors who can damage the trust that customers and recipients have in those brands. Brand Indicators for Message Identification (BIMI) is an email specification that enables email inboxes to display a brand’s logo next to the brand’s authenticated email messages within supporting email clients. BIMI is an email specification that’s directly connected to authentication, but it’s not a standalone email authentication protocol as it requires all your email to comply with DMARC authentication. Recipients are more likely to engage with email that displays the logo of the brand associated with the message author. Higher engagement helps deliverability and inbox placement because it indicates that the recipients trust your brand. BIMI is a great brand protector in email and provides a better user experience for the end recipients and customers.
BIMI requires that you authenticate all of your organization’s email with SPF, DKIM and DMARC. In this how-to we will be utilizing Amazon SES to authenticate the emails, Amazon S3 to host the SVG image, and Amazon Route53 to add DNS records. We will be walking through how to accomplish each step until completion.
Note: While we’re using AWS products in this how-to, it is not a requirement to use all AWS products to implement BIMI. Any hosting provider for content or domain can be used however the steps may differ based on the provider you use.
BIMI Implementation
The following are the steps needed to prepare your SES account and domain for BIMI:
Step 1
Note: If you already have SPF, DKIM, and DMARC enabled for your domain (with 100% as the rate for DMARC) you can move on to Step 2.
Enable Easy DKIM for your domain
Sign in to the AWS Management Console and open the Amazon SES console at https://console.aws.amazon.com/ses/.
In the navigation pane, under Configuration, choose Verified identities.
In the list of identities, choose an identity where the Identity type is Domain.
Note: If you need to create or verify a domain, see Creating a domain identity.
Under the Authentication tab, in the DomainKeys Identified Mail (DKIM) container, choose Edit.
In the Advanced DKIM settings container, choose the Easy DKIM button in the Identity type field.
In the DKIM signing key length field, choose either RSA_2048_BIT or RSA_1024_BIT.
In the DKIM signatures field, check the Enabled box.
Choose Save changes.
Now that you’ve configured your domain identity with Easy DKIM, you must complete the verification process with your DNS provider – proceed to Verifying a DKIM domain identity with your DNS provider and follow the DNS authentication procedures for Easy DKIM.
Create a DMARC record for your domain
Sign in to the AWS Management Console and open the Route 53 console at https://console.aws.amazon.com/route53/
In the navigation pane, choose Hosted zones.
On the Hosted zones page, choose the name of the hosted zone that you want to create records in.
Choose and define the applicable routing policy and the following values:
Note: The DMARC policy must enforce at 100% and include either a quarantine or reject policy. (i.e. p=reject or p=quarantine) to meet the DMARC authentication requirement. This may mean you will need to update your existing policy and DMARC record.
Configure a Custom Mail From for your sending domain
At the bottom of the screen in the in the Custom MAIL FROM domain pane, choose Edit .
In the General details pane, do the following:
a. Select the Use a custom MAIL FROM domain checkbox.
b. For MAIL FROM domain, enter the subdomain that you want to use as the MAIL FROM domain.
c. For Behavior on MX failure, choose one of the following options:
Use default MAIL FROM domain – If the custom MAIL FROM domain’s MX record is not set up correctly, Amazon SES uses a subdomain of amazonses.com. The subdomain varies based on the AWS Region that you use Amazon SES in.
Reject message – If the custom MAIL FROM domain’s MX record is not set up correctly, Amazon SES returns a MailFromDomainNotVerified error. Emails that you attempt to send from this domain are automatically rejected. If you want to ensure that 100% of your email is BIMI compatible, then you should choose the reject message option.
d. Choose Save changes – you’ll be returned to the previous screen.
Publish the MX and SPF (type TXT) records to the DNS server of the custom MAIL FROM domain:
Note: In the Custom MAIL FROM domain pane, the Publish DNS records table now displays the MX and SPF (type TXT) records in that you have to publish (add) to your domain’s DNS configuration. These records use the formats shown in the following table.
Name
Record Type
Value
subdomain.example.com
MX
10 feedback-smtp.region.amazonses.com
subdomain.example.com
TXT
v=spf1 include:amazonses.com ~all
Step 2
Produce an SVG Tiny PS version of your official logo
In order to display your logo in the email it must conform to the specifications of the BIMI requirements. To meet these requirements the logo must be a Scalable Vector Graphics (SVG) image and must meet the Tiny PS Specification. Once your image meets this requirement you can move on to the next step.
Note: bimigroup.org outlines this process and includes references to software to assist with this process.
In the Buckets list, choose the name of the bucket that you want to upload your folders or files to.
Choose Upload.
In the Upload window, do one of the following:
Drag and drop files and folders to the Upload window.
Choose Add file choose your SVG image to upload, and choose Open.
To configure additional object properties
To change access control list permissions, choose Permissions.
Under Access control list (ACL), edit the permissions.
You need to grant read access to your objects to the public (everyone in the world) for the SVG image you are uploading. However, we recommend not changing the default setting for your bucket to public read access.
To configure other additional properties, choose Properties.
To upload your objects, choose Upload.
Note: Amazon S3 uploads your object. When the upload completes, you can see a success message on the Upload: status page.
On the Hostedzones page, choose the name of the hosted zone that you want to create records in.
Choose and define the applicable routing policy and the following values with the understanding the URLs must be HTTPS:
Name
Record Type
Value
default._bimi.example.com
TXT
v=BIMI1; l=[SVG URL]; a=[PEM URL]
Choose Create records.
Note: the a= tag is currently optional and will not be used in this example.
You can validate your BIMI record with a tool like the BIMI Inspector.
Conclusion
All of the steps to set up your SES account and your domain are now complete. The final component in this process is to have regular sending patterns to the mailbox providers that support BIMI logo placement. Your domain should have a regular delivery cadence and needs to have a good reputation with the mailbox providers you are sending mail. BIMI logo placement may take time to populate to mailbox providers where you don’t have an established reputation or sending cadence. The time spent implementing BIMI is well worth it as it will strengthen your sender reputation and create a better and more trusted customer experience for your end recipients.
You can find more information about the BIMI specification here.
OpenBSD 7.3 has been released. As usual, the list of changes and new
features is long; click below for the details.
The collective thoughts of the interwebz
Manage Consent
To provide the best experiences, we use technologies like cookies to store and/or access device information. Consenting to these technologies will allow us to process data such as browsing behavior or unique IDs on this site. Not consenting or withdrawing consent, may adversely affect certain features and functions.
Functional
Always active
The technical storage or access is strictly necessary for the legitimate purpose of enabling the use of a specific service explicitly requested by the subscriber or user, or for the sole purpose of carrying out the transmission of a communication over an electronic communications network.
Preferences
The technical storage or access is necessary for the legitimate purpose of storing preferences that are not requested by the subscriber or user.
Statistics
The technical storage or access that is used exclusively for statistical purposes.The technical storage or access that is used exclusively for anonymous statistical purposes. Without a subpoena, voluntary compliance on the part of your Internet Service Provider, or additional records from a third party, information stored or retrieved for this purpose alone cannot usually be used to identify you.
Marketing
The technical storage or access is required to create user profiles to send advertising, or to track the user on a website or across several websites for similar marketing purposes.


 .Net Developer Day –
  AWS Global Summits – Check your calendars and sign up for the AWS Summit close to where you live or work: