Tag Archives: Analytics

Deep dive into the AWS ProServe Hadoop Migration Delivery Kit TCO tool

Post Syndicated from Jiseong Kim original https://aws.amazon.com/blogs/big-data/deep-dive-into-the-aws-proserve-hadoop-migration-delivery-kit-tco-tool/

In the post Introducing the AWS ProServe Hadoop Migration Delivery Kit TCO tool, we introduced the AWS ProServe Hadoop Migration Delivery Kit (HMDK) TCO tool and the benefits of migrating on-premises Hadoop workloads to Amazon EMR. In this post, we dive deep into the tool, walking through all steps from log ingestion, transformation, visualization, and architecture design to calculate TCO.

Solution overview

Let’s briefly visit the HMDK TCO tool’s key features. The tool provides a YARN log collector to connect Hadoop Resource Manager to collect YARN logs. A Python-based Hadoop workload analyzer, called the YARN log analyzer, scrutinizes Hadoop applications. Amazon QuickSight dashboards showcase the results from the analyzer. The same results also accelerate the design of future EMR instances. Additionally, a TCO calculator generates the TCO estimation of an optimized EMR cluster for facilitating the migration.

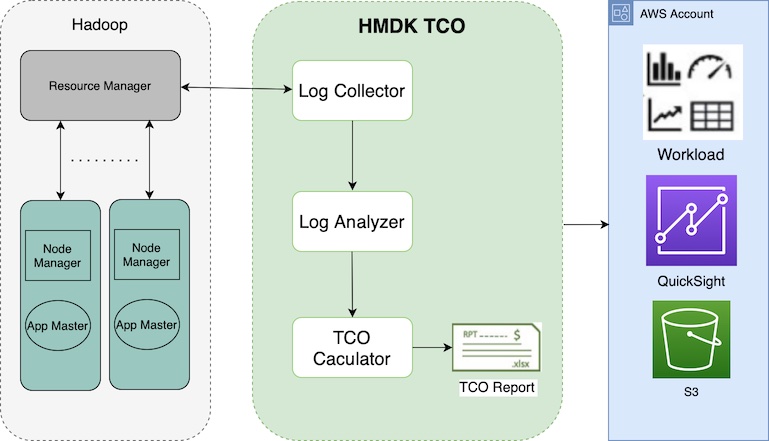
Now let’s look at how the tool works. The following diagram illustrates the end-to-end workflow.

In the next sections, we walk through the five main steps of the tool:

  1. Collect YARN job history logs.
  2. Transform the job history logs from JSON to CSV.
  3. Analyze the job history logs.
  4. Design an EMR cluster for migration.
  5. Calculate the TCO.

Prerequisites

Before getting started, make sure to complete the following prerequisites:

  1. Clone the hadoop-migration-assessment-tco repository.
  2. Install Python 3 on your local machine.
  3. Have an AWS account with permission on AWS Lambda, QuickSight (Enterprise edition), and AWS CloudFormation.

Collect YARN job history logs

First, you run a YARN log collector, start-collector.sh, on your local machine. This step collects Hadoop YARN logs and places the logs on your local machine. The script connects your local machine with the Hadoop primary node and communicates with Resource Manager. Then it retrieves the job history information (YARN logs from application managers) by calling the YARN ResourceManager application API.

Prior to running the YARN log collector, you need to configure and establish the connection (HTTP: 8088 or HTTPS: 8090; the latter is recommended) to verify the accessibility of YARN ResourceManager and enabled YARN Timeline Server (Timeline Server v1 or later are supported). You may need to define the YARN logs’ collection interval and retention policy. To ensure that you collect consecutive YARN logs, you can use a cron job to schedule the log collector in a proper time interval. For example, for a Hadoop cluster with 2,000 daily applications and the setting yarn.resourcemanager.max-completed-applications set to 1,000, theoretically, you have to run the log collector at least twice to get all the YARN logs. In addition, we recommend collecting at least 7 days of YARN logs for analyzing holistic workloads.

For more details on how to configure and schedule the log collector, refer to the yarn-log-collector GitHub repo.

Transform the YARN job history logs from JSON to CSV

After obtaining YARN logs, you run a YARN log organizer, yarn-log-organizer.py, which is a parser to transform JSON-based logs to CSV files. These output CSV files are the inputs for the YARN log analyzer. The parser also has other capabilities, including sorting events by time, removing dedicates, and merging multiple logs.

For more information on how to use the YARN log organizer, refer to the yarn-log-organizer GitHub repo.

Analyze the YARN job history logs

Next, you launch the YARN log analyzer to analyze the YARN logs in CSV format.

With QuickSight, you can visualize YARN log data and conduct analysis against the datasets generated by pre-built dashboard templates and a widget. The widget automatically creates QuickSight dashboards in the target AWS account, which configured in a CloudFormation template.

The following diagram illustrates the HMDK TCO architecture.

The YARN log analyzer provides four key functionalities:

  1. Upload transformed YARN job history logs in CSV format (for example, cluster_yarn_logs_*.csv) to Amazon Simple Storage Service (Amazon S3) buckets. These CSV files are the outputs from the YARN log organizer.
  2. Create a manifest JSON file (for example, yarn-log-manifest.json) for QuickSight and upload it to the S3 bucket:
    {
        "fileLocations": [ { 
            "URIPrefixes": [
                "s3://emr-tco-date-bucket/yarn-log/demo/logs/"] 
        } ], 
        "globalUploadSettings": { 
            "format": "CSV", 
            "delimiter": ",", 
            "textqualifier": "'", 
            "containsHeader": "true" 
        }
     }

  3. Deploy QuickSight dashboards using a CloudFormation template, which is in YAML format. After deploying, choose the refresh icon until you see the stack’s status as CREATE_COMPLETE. This step creates datasets on QuickSight dashboards in your AWS target account.
  4. On the QuickSight dashboard, you can find insights of the analyzed Hadoop workloads from various charts. These insights help you design future EMR instances for migration acceleration, as demonstrated in the next step.

Design an EMR cluster for migration

The results of the YARN log analyzer help you understand the actual Hadoop workloads on the existing system. This step accelerates designing future EMR instances for migration by using an Excel template. The template contains a checklist for conducting workload analysis and capacity planning:

  • Are the applications running on the cluster being used appropriately with their current capacity?
  • Is the cluster under load at a certain time or not? If so, when is the time?
  • What types of applications and engines (such as MR, TEZ, or Spark) are running on the cluster, and what is the resource usage for each type?
  • Are different jobs’ run cycles (real-time, batch, ad hoc) running in one cluster?
  • Are any jobs running in regular batches, and if so, what are these schedule intervals? (For example, every 10 minutes, 1 hour, 1 day.) Do you have jobs that use a lot of resources during a long time period?
  • Do any jobs need performance improvement?
  • Are any specific organizations or individuals monopolizing the cluster?
  • Are any mixed development and operation jobs operating in one cluster?

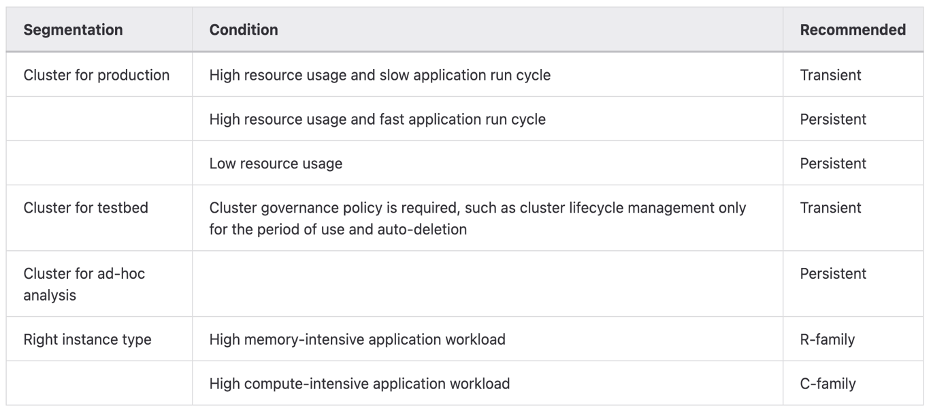
After you complete the checklist, you’ll have a better understanding of how to design the future architecture. For optimizing EMR cluster cost effectiveness, the following table provides general guidelines of choosing the proper type of EMR cluster and Amazon Elastic Compute Cloud (Amazon EC2) family.

To choose the proper cluster type and instance family, you need to perform several rounds of analysis against YARN logs based on various criteria. Let’s look at some key metrics.

Timeline

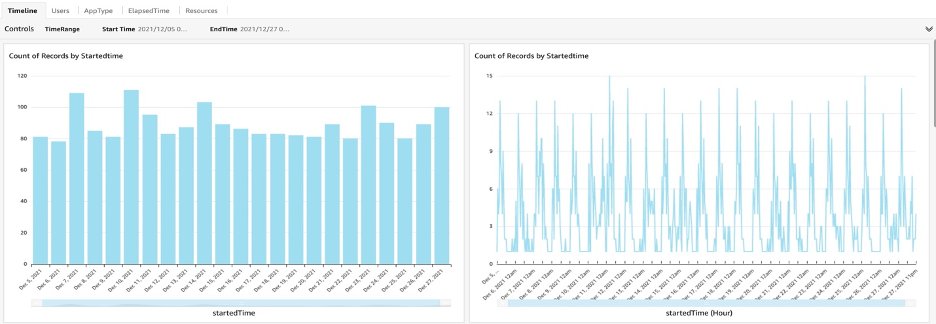
You can find workload patterns based on the number of Hadoop applications run in a time window. For example, the daily or hourly charts “Count of Records by Startedtime” provide the following insights:

  • In daily time series charts, you compare the number of application runs between working days and holidays, and among calendar days. If the numbers are similar, it means the daily utilizations of the cluster are comparable. On the other hand, if the deviation is large, the proportion of ad hoc jobs is significant. You also can figure out the possible weekly or monthly jobs on particular days. In the situation, you can easily see specific days in a week or a month with high workload concentration.
  • In hourly time series charts, you further understand how applications are run in hourly windows. You can find peak and off-peak hours in a day.

Users

The YARN logs contain the user ID of each application. This information helps you understand who submits an application to a queue. Based on the statistics of individual and aggregated application runs per queue and per user, you can determine the existing workload distribution by user. Usually, users at the same team have shared queues. Sometime, multiple teams have shared queues. When designing queues for users, you now have insights to help you design and distribute application workloads that are more balanced across queues than they previously were.

Application types

You can segment workloads based on various application types (such as Hive, Spark, Presto, or HBase) and run engines (such as MR, Spark, or Tez). For the compute-heavy workloads such as MapReduce or Hive-on-MR jobs, use CPU-optimized instances. For memory-intensive workloads such as Hive-on-TEZ, Presto, and Spark jobs, use memory-optimized instances.

ElapsedTime

You can categorize applications by runtime. The embedded CloudFormation template automatically creates an elapsedGroup field in a QuickSight dashboard. This enables a key feature to allow you to observe long-running jobs in one of four charts on QuickSight dashboards. Therefore, you can design tailored future architectures for these large jobs.

The corresponding QuickSight dashboards include four charts. You can drill down each chart, which is associated to one group.

Group
Number
Runtime/Elapsed Time of a Job
1 Less than 10 minutes
2 Between 10 minutes and 30 minutes
3 between 30 minutes and 1 hour
4 Greater than 1 hour

In the chart of Group 4, you can concentrate on scrutinizing large jobs based on various metrics, including user, queue, application type, timeline, resource usage, and so on. Based on this consideration, you may have dedicated queues on a cluster or a dedicated EMR cluster for large jobs. Meanwhile, you may submit small jobs to shared queues.

Resources

Based on resource (CPU, memory) consumption patterns, you choose the right size and family of EC2 instances for performance and cost effectiveness. For compute-intensive applications, we recommend instances of CPU-optimized families. For memory-intensive applications, the memory-optimized instance families are recommended.

In addition, based on the nature of the application workloads and resource utilization over the time, you may choose a persistent or transient EMR cluster, Amazon EMR on EKS, or Amazon EMR Serverless.

After analyzing YARN logs by various metrics, you’re ready to design future EMR architectures. The following table lists examples of proposed EMR clusters. You can find more details in the optimized-tco-calculator GitHub repo.

Calculate TCO

Finally, on your local machine, run tco-input-generator.py to aggregate YARN job history logs on an hourly basis prior to using an Excel template to calculate the optimized TCO. This step is crucial because the results simulate the Hadoop workloads in future EMR instances.

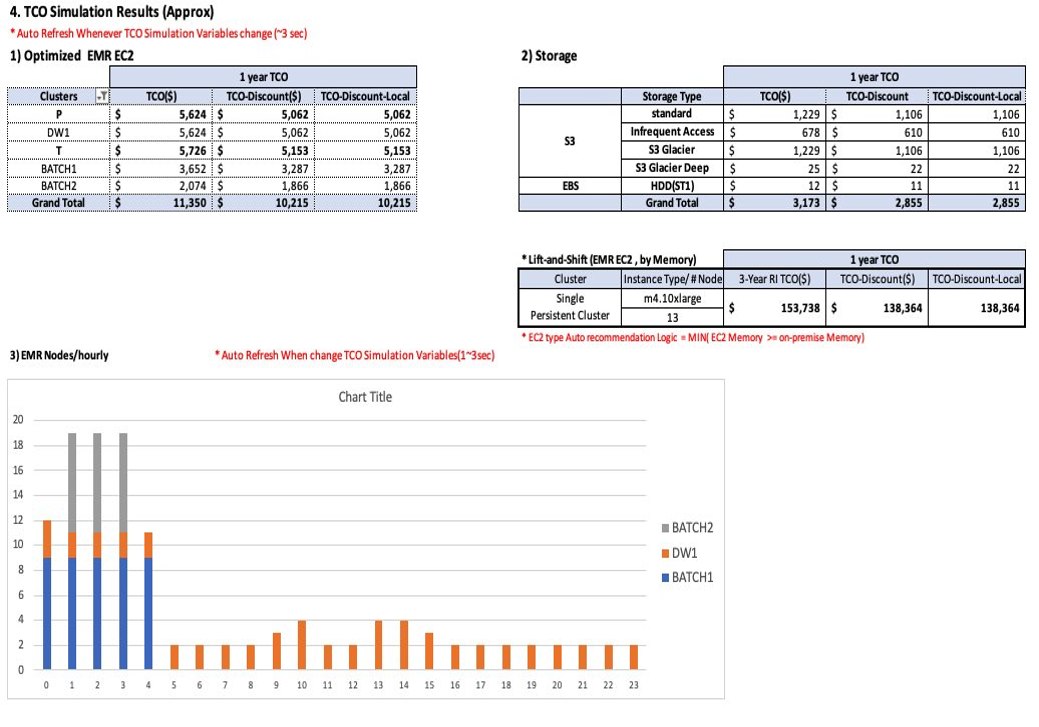
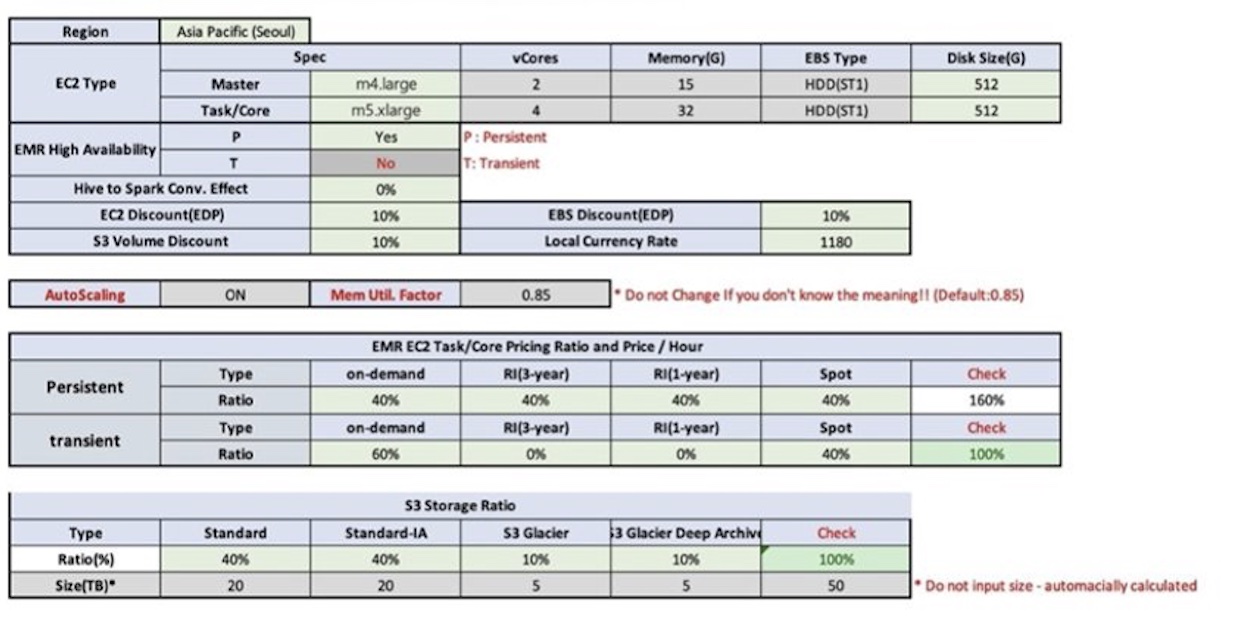
The prerequisite of TCO simulation is to run tco-input-generator.py, which generates hourly aggregated logs. Next, you open an Excel template file to enable macros and provide your inputs in green cells for calculating the TCO. Regarding the input data, you enter the actual data size without replication, and the hardware specifications (vCore, mem) of the Hadoop primary node and data nodes. You also need to select and upload previously generated hourly aggregated logs. After you set the TCO simulation variables, such as Region, EC2 type, Amazon EMR high availability, engine effect, Amazon EC2 and Amazon EBS discount (EDP), Amazon S3 volume discount, local currency rate, and EMR EC2 task/core pricing ratio and price/hour, the TCO simulator automatically calculates the optimum cost of future EMR instances on Amazon EC2. The following screenshots show an example of HMDK TCO results.

For additional information and instructions of HMDK TCO calculations, refer to the optimized-tco-calculator GitHub repo.

Clean up

After you complete all the steps and finish testing, complete the following steps to delete resources to avoid incurring costs:

  1. On the AWS CloudFormation console, choose the stack you created.
  2. Choose Delete.
  3. Choose Delete stack.
  4. Refresh the page until you see the status DELETE_COMPLETE.
  5. On the Amazon S3 console, delete S3 bucket you created.

Conclusion

The AWS ProServe HMDK TCO tool significantly reduces migration planning efforts, which are the time-consuming and challenging tasks of assessing your Hadoop workloads. With the HMDK TCO tool, the assessment usually takes 2–3 weeks. You can also determine the calculated TCO of future EMR architectures. With the HMDK TCO tool, you are able to quickly understand your workloads and resource usage patterns. With the insights generated by the tool, you are equipped to design optimal future EMR architectures. In many use cases, a 1-year TCO of the optimized refactored architecture provides significant cost savings (64–80% reduction) on compute and storage, compared to lift-and-shift Hadoop migrations.

To learn more about accelerating your Hadoop migrations to Amazon EMR and the HMDK CTO tool, refer to the Hadoop Migration Delivery Kit TCO GitHub repo, or reach out to [email protected].


About the authors

Sungyoul Park is a Senior Practice Manager at AWS ProServe. He helps customers innovate their business with AWS Analytics, IoT, and AI/ML services. He has a specialty in big data services and technologies and an interest in building customer business outcomes together.

Jiseong Kim is a Senior Data Architect at AWS ProServe. He mainly works with enterprise customers to help data lake migration and modernization, and provides guidance and technical assistance on big data projects such as Hadoop, Spark, data warehousing, real-time data processing, and large-scale machine learning. He also understands how to apply technologies to solve big data problems and build a well-designed data architecture.

George Zhao is a Senior Data Architect at AWS ProServe. He is an experienced analytics leader working with AWS customers to deliver modern data solutions. He is also a ProServe Amazon EMR domain specialist who enables ProServe consultants on best practices and delivery kits for Hadoop to Amazon EMR migrations. His area of interests are data lakes and cloud modern data architecture delivery.

Kalen Zhang was the Global Segment Tech Lead of Partner Data and Analytics at AWS. As a trusted advisor of data and analytics, she curated strategic initiatives for data transformation, led data and analytics workload migration and modernization programs, and accelerated customer migration journeys with partners at scale. She specializes in distributed systems, enterprise data management, advanced analytics, and large-scale strategic initiatives.

Introducing the AWS ProServe Hadoop Migration Delivery Kit TCO tool

Post Syndicated from George Zhao original https://aws.amazon.com/blogs/big-data/introducing-the-aws-proserve-hadoop-migration-delivery-kit-tco-tool/

When migrating Hadoop workloads to Amazon EMR, it’s often difficult to identify the optimal cluster configuration without analyzing existing workloads by hand. To solve this, we’re introducing the Hadoop migration assessment Total Cost of Ownership (TCO) tool. You now have a Hadoop migration assessment TCO tool within the AWS ProServe Hadoop Migration Delivery Kit (HMDK). The self-serve HMDK TCO tool accelerates the design of new cost-effective Amazon EMR clusters by analyzing the existing Hadoop workload and calculating the total cost of the ownership (TCO) running on the future Amazon EMR system. The Amazon EMR TCO report with the new Amazon EMR design can demonstrate the Amazon EMR migration with detailed cost saving and business benefits.

In this post, we introduce a use case and the functions and components of the tool. We also share case studies to show you the benefits of using the tool. Finally, we show you the technical information to use the tool.

Use case overview

Migrating Hadoop workloads to Amazon EMR accelerates big data analytics modernization, increases productivity, and reduces operational cost. Refactoring coupled compute and storage to a decoupling architecture is a modern data solution. It enables compute such as EMR instances and storage such as Amazon Simple Storage Service (Amazon S3) data lakes to scale. For various Hadoop jobs, customers have bespoke deployment options of fully managed Amazon EMR, Amazon EMR on Amazon EKS, and EMR Serverless. The optimized future EMR cluster yields the same results and values with much lower TCO compared to the source Hadoop cluster. But we need a TCO report to showcase the cost saving details, as shown in the following figure.

Typically, the commencement of a Hadoop migration needs Hadoop experts to spend weeks or even months to assess current Hadoop cluster workloads towards a plan for subsequent migration. This could delay the project from being accepted without a good TCO report.

To accelerate Hadoop migrations and mitigate the workload assessment efforts by SMEs, AWS ProServe created the Hadoop migration assessment TCO tool within the AWS ProServe Hadoop Migration Delivery Kit.

Introduction to the HMDK TCO tool

As a Hadoop migration accelerator, the HMDK TCO tool has three components:

  • YARN log collector – Retrieves the existing workload logs from YARN Resource Manager
  • YARN log analyzer – Provides a deep time-based insight on different aspects of the jobs
  • TCO calculator – Generates a 3-year or 1-year TCO calculated automatically

The self-serve HMDK TCO tool is available for download on GitHub.

Using the tool consists of three steps:

  1. First, the YARN Log collector communicates with the current Hadoop system to retrieve YARN logs.
  2. With the collected YARN logs, the next step is to use the YARN log analyzer and set up the log analyzer stack using AWS CloudFormation. The results of the log analyzer reveal Hadoop workload insights with various views and metrics of the Hadoop applications shown in Amazon QuickSight dashboards, which leads to the design of a future EMR cluster.
  3. Lastly, the TCO calculator generates the TCO report by simulating hourly resource usage of a future EMR cluster. To accelerate Hadoop migration assessment, the TCO report provides crucial information and values for your business stakeholders to make a buy-in decision.

The following diagram illustrates this architecture.

The Hadoop workload insights enable you to design a well-architected EMR cluster to achieve performance and cost-effectiveness in an agile way. For conducting well-architected designs, you need to deliberate between various system specifications of an EMR cluster and multiple cost considerations.

The system specifications are as follows:

  • Number of EMR clusters – Amazon EMR enables you to run multiple elastic clusters in the AWS Cloud to serve the same purpose of a shared static Hadoop cluster on premises
  • Types of EMR cluster (persistent or transient) – Design your system to keep minimum persistent clusters to save cost
  • Instance types and configuration (memory, vCore, and so on) – Choose the right instance for your job
  • Resource allocation for applications and cluster utilization – Based on the on-premises workload analysis, design effective resource allocation and efficient resource utilization in future EMR clusters

The cost considerations are as follows:

  • Latest price list (from thousands of available EC2 instances available) – The HMDK TCO tool makes the price calculation with Amazon Elastic Compute Cloud (Amazon EC2) instance types, configurations, and their prices.
  • Amazon S3 storage cost (standard, Glacier, and so on) – Data replication is no longer required for reliability. You can use tired storage in Amazon S3 for cost savings.

YARN log collector

The HMDK TCO tool enables a simple way to capture Hadoop YARN logs, which include the Hadoop job runs statistics and the corresponding resource usages. The following screenshot is an example of a YARN log.

The tool supports HTTPS protocol to communicate with YARN Resource Manager. The tool transports the JSON YARN logs as the inputs to a Python parser, which converts the YARN logs from JSON to CSV format. The new CSV formatted logs are the standard input files for the YARN log analyzer.

For more information, see the GitHub repo.

YARN log analyzer and optimized design use cases

With the log, we can follow up the steps in the TCO yarn-log-analysis README file to use AWS CloudFormation to set up QuickSight resources.

The HMDK TCO log analyzer generates a QuickSight dashboard on various metrics:

  • Job timeline – How many jobs are running at one time
  • Job user – Breakdown of users and queues
  • Application type and engine type – Breakdown by application types (Spark, Hive, Presto) and run engine type (MapReduce, Spark, Tez)
  • Elapsed time – The time span of completing an application
  • Resources – Memory and CPU

The following screenshot shows an example dashboard.

The QuickSight dashboards exhibit insights based on consecutive YARN logs collected in a long-enough period of time (for example, a 2-week window). The insights from the logs reveal the application types, users, queues, running cadence, time spans, and resource usages. The data also helps you discover daily batch jobs or ad hoc jobs, long-running jobs, and resource consumption. These insights help you design the right clusters, such as transient clusters or baseline permanent clusters, and choose the right EC2 instance for memory- or compute-intensive jobs. With the log analyzer results, the TCO tool automatically calculates the TCO of a future EMR cluster.

Let’s see some real customer use cases in the following sections.

Case 1: Use transient and persistent clusters wisely

For this use case, a customer in the financial sector has an 11-node Hadoop cluster.

The QuickSight timeline dashboard shows the peak time job runs because of the daily batch job. This guides us to design two clusters for fulfilling the existing workloads. When we keep a persistent cluster at a minimal size, we can have the transient EMR cluster to handle the batch style job around the peak time.

Therefore, we designed the clusters to have a persistent cluster with 2 data nodes, while transient nodes can scale from 0–10 between the hours of 1:00 AM and 4:00 AM.

The following figure illustrates this design.

This balanced design using transient and persistent clusters resulted in a cost savings of about 80% compared to a lift-and-shift design.

Case 2: Identify Hadoop queue usage and long-running jobs to design multiple clusters and optimized runs

For our next use case, a company runs 196 nodes using Hadoop 3.1 with jobs like Hive, Spark, and Kafka. The Hadoop default queue and four other queues were used to group various workloads. As illustrated in the following figure, some very long-running jobs are seen in the shared cluster, resulting in queued jobs that have resource competition and unbalanced resource allocation.

The QuickSight user dashboard guides us through the queue usage, the elapsed time dashboard guides us through the long-running jobs, and the resource dashboard guides us through the memory and vCore usage for the jobs.

Therefore, we design a solution to transfer queue jobs to run in separated clusters, and the default queue jobs are split to run in different clusters. By identifying the long-running jobs and understanding the resource needs, we could design a cluster to run such jobs more efficiently.

This design allows the job to run faster and the clusters to be used more efficiently with a cost savings benefit.

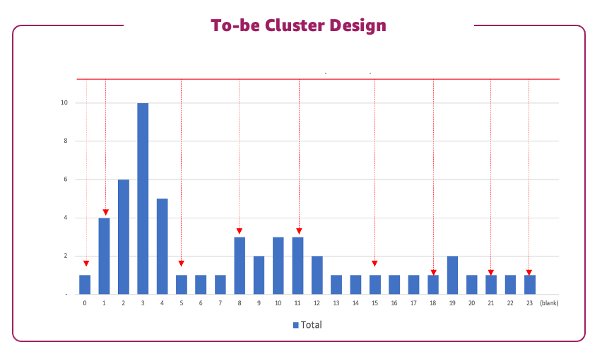
Cluster design

The HMDK TCO tool provides a cluster design template like the following example.

Here we have two clusters, one transient and one persistent, to handle the Spark and Tez jobs accordingly. The starting and ending hour for each cluster can be determined from the log analysis. With this cluster design, we can get the hourly workload resource usage forecast. Then the TCO calculator gets all the information needed to generate costs based on the TCO simulation variables you choose.

TCO calculator

The HMDK TCO calculator is a component guiding the EMR cluster design by using the EMR design template. Then it generates the hourly aggregated resource usage forecast using a Python program. The component provides guidelines and an Excel template to input system and cost specification parameters. The component has the logic with a built-in Amazon EMR price list. The 1-year and 3-year TCO cost can be automatically generated by the macro-enabled Excel TCO template.

The following figure shows the details of our HMDK TCO simulation.

The following figures show the TCO report.

TCO tool engagement outcomes

In this section, we share some of the engagement outcomes from customers after using the TCO tool for 1–2 weeks. Additionally, with the TCO tool, we can refactor on-premises Hadoop clusters to EMR clusters utilizing Amazon S3 as a data lake. The modern data solution of migrating to Amazon EMR provides unlimited scalability with operational efficiency and cost savings.

The following table illustrates four case studies of some engagements using the tool.

Case# Case Description Engagement Outcome
1 Pressured by the Hadoop License, they migrated to AWS using Amazon EMR and used Spark for replacing Hive. They designed the new EMR clusters using a balanced design of transient and persistent clusters. They can get job insights through the tool and design the new EMR clusters to fulfill the existing workloads, and expect to achieve 80% cost savings and six times performance enhancement.
2 Their goal was to migrate a Hadoop cluster with over 1,000 nodes from HDFS to Amazon S3 and Hive to Spark, and redesign the cluster using a balanced design of transient and persistent clusters. They can get job insights and redesign the cluster with a 1-year TCO of the optimized redesign architecture expected to have 64% cost savings.
3 Their goal was to migrate to Hadoop 3.1. They transferred the Hadoop queue-based job, which shared the same cluster, to two transient clusters and five persistent clusters with optimized resource usage for each job run, and handled long-running jobs faster. They can get Amazon EMR TCO results quickly in 2 weeks. Customers get insights on their workloads and long-running jobs and get the job done faster and cheaper.
4 Their goal was to migrate from Hive 1 to Spark and design an auto scaling EMR cluster. They can get Amazon EMR TCO results in 1 week. They’re expecting to see 75% cost savings on the redesigned EMR clusters and 10 times on performance improvement.

Conclusion

This post introduced use cases, functions, and components of the HMDK TCO tool. Through the case studies discussed in this post, you learned about real examples of the tool usage and its benefits. The HMDK TCO tool is designed for automating source Hadoop cluster workload assessment with calculated TCO calculation, and it can be done in 2–3 weeks instead of months.

More and more customers are adopting the HMDK TCO tool to accelerate their migration to Amazon EMR.

To dive deep into the HMDK TCO tool, refer to the next post in this series, How AWS ProServe Hadoop TCO tool accelerate Hadoop workload migrations to Amazon EMR.


About the authors

Sungyoul Park is a Senior Practice Manager at AWS ProServe. He helps customers innovate their business with AWS Analytics, IoT, and AI/ML services. He has a specialty in big data services and technologies and an interest in building customer business outcomes together.

Jiseong Kim is a Senior Data Architect at AWS ProServe. He mainly works with enterprise customers to help data lake migration and modernization, and provides guidance and technical assistance on big data projects such as Hadoop, Spark, data warehousing, real-time data processing, and large-scale machine learning. He also understands how to apply technologies to solve big data problems and build a well-designed data architecture.

George Zhao is a Senior Data Architect at AWS ProServe. He is an experienced analytics leader working with AWS customers to deliver modern data solutions. He is also a ProServe Amazon EMR domain specialist who enables ProServe consultants on best practices and delivery kits for Hadoop to Amazon EMR migrations. His area of interests are data lakes and cloud modern data architecture delivery.

Kalen Zhang was the Global Segment Tech Lead of Partner Data and Analytics at AWS. As a trusted advisor of data and analytics, she curated strategic initiatives for data transformation, led data and analytics workload migration and modernization programs, and accelerated customer migration journeys with partners at scale. She specializes in distributed systems, enterprise data management, advanced analytics, and large-scale strategic initiatives.

Introducing MongoDB Atlas metadata collection with AWS Glue crawlers

Post Syndicated from Igor Alekseev original https://aws.amazon.com/blogs/big-data/introducing-mongodb-atlas-metadata-collection-with-aws-glue-crawlers/

For data lake customers who need to discover petabytes of data, AWS Glue crawlers are a popular way to discover and catalog data in the background. This allows users to search and find relevant data from multiple data sources. Many customers also have data in managed operational databases such as MongoDB Atlas and need to combine it with data from Amazon Simple Storage Service (Amazon S3) data lakes to derive insights. AWS Glue crawlers now support MongoDB Atlas, making it simpler for you to understand MongoDB collections’ evolution and extract meaningful insights.

AWS Glue is a serverless data integration service that makes it simple to discover, prepare, move, and integrate data from multiple sources for analytics, machine learning (ML), and application development.

MongoDB Atlas is a developer data service from AWS technology partner MongoDB, Inc. The service combines transactional processing, relevance-based search, real-time analytics, and mobile-to-cloud data synchronization in an integrated architecture.

With today’s launch, you can create and schedule an AWS Glue crawler to crawl MongoDB Atlas. In the crawler setup, you can select MongoDB as a data source. You can then create an AWS Glue connection with MongoDB Atlas and provide the MongoDB Atlas cluster name and credentials. We walk you through this process in this post.

Solution overview

The following architecture illustrates how you can scan a MongoDB Atlas database and collections using AWS Glue.

With each run of the crawler, the crawler inspects specified collections and catalogs information, such as updates or deletes to MongoDB Atlas collections, views, and materialized views in the AWS Glue Data Catalog. In AWS Glue Studio, you can then use the AWS Glue Data Catalog as a source to pull data from MongoDB Atlas and populate an Amazon S3 target. Finally, this job can run and read data from MongoDB Atlas and write the results to Amazon S3, opening up possibilities to integrate with AWS services such as Amazon SageMaker, Amazon QuickSight, and more.

In the following sections, we describe how to create an AWS Glue crawler with MongoDB Atlas as a data source. We then create an AWS Glue connection and provide the MongoDB Atlas cluster information and credentials. Then we specify the MongoDB Atlas database and collections to crawl.

Prerequisites

To follow along with this post, you must have access to MongoDB Atlas and the AWS Management Console. We also assume you have access to a VPC with subnets preconfigured via Amazon Virtual Private Cloud (Amazon VPC). The crawler that we configure later in the post runs in the VPC and connects to MongoDB Atlas via an AWS PrivateLink endpoint.

Set up MongoDB Atlas

To configure MongoDB Atlas, complete the following steps:

  1. Configure a MongoDB cluster on AWS. For instructions, refer to How to Set Up a MongoDB Cluster.
  2. Configure PrivateLink by following the steps described in Connecting Applications Securely to a MongoDB Atlas Data Plane with AWS PrivateLink.

This allows us to simplify our networking architecture and make sure the traffic stays on the AWS network.

Next, we obtain the MongoDB cluster connection string from the Connect UI on the MongoDB Atlas console.

  1. On the MongoDB Atlas console, choose Connect, Private Endpoint, and Connection Method.
  2. Copy the SRV connection string.

We use this SRV connection string in the subsequent steps.

The following screenshot shows that we have loaded a sample collection in MongoDB Atlas, which we crawl over in the next steps. Note that the records in this collection include several arrays as well as nested data.

Set up the MongoDB Atlas connection with AWS Glue

Before we can configure the AWS Glue crawler, we need to create the MongoDB Atlas connection in AWS Glue.

  1. On the AWS Glue Studio console, choose Connectors in the navigation pane.
  2. Choose Create connection.

  1. When filling out the connection details, use the SRV connection string we obtained earlier in MongoDB Atlas.
  2. In the Network options section, the VPC and subnets must correspond to the PrivateLink settings you configured earlier.

Create a MongoDB crawler

After we create the connection, we can create an AWS Glue crawler.

  1. On the AWS Glue console, choose Crawlers in the navigation pane.
  2. Choose Create crawler.

  1. For Name, enter a name.
  2. For the data source, choose the MongoDB Atlas data source we configured earlier and supply the path that corresponds to the MongoDB Atlas database and collection.

  1. Configure your security settings, output, and scheduling.

  1. On the Crawlers page, choose Run crawler.

After the crawler finishes crawling the MongoDB collections, its status shows as Completed.

Review the MongoDB AWS Glue database and table

We can navigate to the AWS Glue Data Catalog to examine the tables that were created by the crawler.

Choose the table to view the schema and other metadata.

Note that the crawler captured nested data as a STRUCT and correctly listed the ARRAY fields.

Import MongoDB Atlas data to Amazon S3

Now we use the MongoDB Atlas-based AWS Glue Data Catalog table to perform a data import without writing code. We use AWS Glue Studio to build boilerplate code quickly. Alternatively, you can build the script in script editor.

  1. On the AWS Glue Studio console, choose Jobs in the navigation pane.
  2. Choose Create job.
  3. Select Visual with a source and target.
  4. Choose the Data Catalog table as the source and Amazon S3 as the target.

  1. In the AWS Glue Studio UI, supply additional parameters such as the S3 bucket name and choose the database and table from the drop-down menus.

  1. Next, review the generated script that is built by AWS Glue Studio. We now need to add a database and collection in the script as follows:
additional_options = {"database": "sample_airbnb","collection": "listingsAndReviews"},

When the ETL job is complete, the extracted data is available on Amazon S3.

  1. On the Amazon S3 console, choose Buckets in the navigation pane.
  2. Choose our bucket and folder containing the extracted files.
  3. Choose a file and on the Actions menu, choose Query with S3 Select to view the contents of the file.

Clean up

To avoid incurring charges for the services used in this walkthrough, complete the following steps to delete your resources:

  1. On the AWS Glue console, choose Crawlers in the navigation pane.
  2. Select your crawler and on the Action menu, choose Delete crawler.
  3. On the AWS Glue Studio console, choose View jobs.
  4. Select the job you created and on the Actions menu, choose Delete job(s).
  5. Return to the AWS Glue console and choose Tables in the navigation pane.
  6. Select your table and choose Delete.
  7. Choose Databases in the navigation pane.
  8. Select your database and choose Delete.
  9. On the Amazon VPC console, choose Endpoints in the navigation pane.
  10. Select the PrivateLink endpoint you created and on the Actions menu, choose Delete VPC endpoints.

Conclusion

In this post, we showed how to set up an AWS Glue crawler to crawl over a MongoDB Atlas collection, gathering metadata and creating table records in the AWS Glue Data Catalog. With the Data Catalog table, we created an ETL process using the AWS Glue Studio UI to extract data from the MongoDB Atlas collection to an S3 bucket without writing a single line of code.

You can try this yourself by configuring an AWS Glue crawler, creating an AWS Glue ETL job with AWS Glue Studio, and launching MongoDB Atlas from a QuickStart or from MongoDB Atlas on AWS Marketplace.

Special thanks to everyone who contributed to this crawler feature launch: Julio Montes de Oca, Mita Gavade, and Alex Prazma.


About the authors

Igor Alekseev is a Senior Partner Solution Architect at AWS in Data and Analytics domain. In his role Igor is working with strategic partners helping them build complex, AWS-optimized architectures. Prior joining AWS, as a Data/Solution Architect he implemented many projects in Big Data domain, including several data lakes in Hadoop ecosystem. As a Data Engineer he was involved in applying AI/ML to fraud detection and office automation.

Sandeep Adwankar is a Senior Technical Product Manager at AWS. Based in the California Bay Area, he works with customers around the globe to translate business and technical requirements into products that enable customers to improve how they manage, secure, and access data.

How Amazon Devices scaled and optimized real-time demand and supply forecasts using serverless analytics

Post Syndicated from Avinash Kolluri original https://aws.amazon.com/blogs/big-data/how-amazon-devices-scaled-and-optimized-real-time-demand-and-supply-forecasts-using-serverless-analytics/

Every day, Amazon devices process and analyze billions of transactions from global shipping, inventory, capacity, supply, sales, marketing, producers, and customer service teams. This data is used in procuring devices’ inventory to meet Amazon customers’ demands. With data volumes exhibiting a double-digit percentage growth rate year on year and the COVID pandemic disrupting global logistics in 2021, it became more critical to scale and generate near-real-time data.

This post shows you how we migrated to a serverless data lake built on AWS that consumes data automatically from multiple sources and different formats. Furthermore, it created further opportunities for our data scientists and engineers to use AI and machine learning (ML) services to continuously feed and analyze data.

Challenges and design concerns

Our legacy architecture primarily used Amazon Elastic Compute Cloud (Amazon EC2) to extract the data from various internal heterogeneous data sources and REST APIs with the combination of Amazon Simple Storage Service (Amazon S3) to load the data and Amazon Redshift for further analysis and generating the purchase orders.

We found this approach resulted in a few deficiencies and therefore drove improvements in the following areas:

  • Developer velocity – Due to the lack of unification and discovery of schema, which are primary reasons for runtime failures, developers often spent time dealing with operational and maintenance issues.
  • Scalability – Most of these datasets are shared across the globe. Therefore, we must meet the scaling limits while querying the data.
  • Minimal infrastructure maintenance – The current process spans multiple computes depending on the data source. Therefore, reducing infrastructure maintenance is critical.
  • Responsiveness to data source changes – Our current system gets data from various heterogeneous data stores and services. Any updates to those services takes months of developer cycles. The response times for these data sources are critical to our key stakeholders. Therefore, we must take a data-driven approach to select a high-performance architecture.
  • Storage and redundancy – Due to the heterogeneous data stores and models, it was challenging to store the different datasets from various business stakeholder teams. Therefore, having versioning along with incremental and differential data to compare will provide a remarkable ability to generate more optimized plans
  • Fugitive and accessibility – Due to the volatile nature of logistics, a few business stakeholder teams have a requirement to analyze the data on demand and generate the near-real-time optimal plan for the purchase orders. This introduces the need for both polling and pushing the data to access and analyze in near-real time.

Implementation strategy

Based on these requirements, we changed strategies and started analyzing each issue to identify the solution. Architecturally, we chose a serverless model, and the data lake architecture action line refers to all the architectural gaps and challenging features we determined were part of the improvements. From an operational standpoint, we designed a new shared responsibility model for data ingestion using AWS Glue instead of internal services (REST APIs) designed on Amazon EC2 to extract the data. We also used AWS Lambda for data processing. Then we chose Amazon Athena as our query service. To further optimize and improve the developer velocity for our data consumers, we added Amazon DynamoDB as a metadata store for different data sources landing in the data lake. These two decisions drove every design and implementation decision we made.

The following diagram illustrates the architecture

arch

In the following sections, we look at each component in the architecture in more detail as we move through the process flow.

AWS Glue for ETL

To meet customer demand while supporting the scale of new businesses’ data sources, it was critical for us to have a high degree of agility, scalability, and responsiveness in querying various data sources.

AWS Glue is a serverless data integration service that makes it easy for analytics users to discover, prepare, move, and integrate data from multiple sources. You can use it for analytics, ML, and application development. It also includes additional productivity and DataOps tooling for authoring, running jobs, and implementing business workflows.

With AWS Glue, you can discover and connect to more than 70 diverse data sources and manage your data in a centralized data catalog. You can visually create, run, and monitor extract, transform, and load (ETL) pipelines to load data into your data lakes. Also, you can immediately search and query cataloged data using Athena, Amazon EMR, and Amazon Redshift Spectrum.

AWS Glue made it easy for us to connect to the data in various data stores, edit and clean the data as needed, and load the data into an AWS-provisioned store for a unified view. AWS Glue jobs can be scheduled or called on demand to extract data from the client’s resource and from the data lake.

Some responsibilities of these jobs are as follows:

  • Extracting and converting a source entity to data entity
  • Enrich the data to contain year, month, and day for better cataloging and include a snapshot ID for better querying
  • Perform input validation and path generation for Amazon S3
  • Associate the accredited metadata based on the source system

Querying REST APIs from internal services is one of our core challenges, and considering the minimal infrastructure, we wanted to use them in this project. AWS Glue connectors assisted us in adhering to the requirement and goal. To query data from REST APIs and other data sources, we used PySpark and JDBC modules.

AWS Glue supports a wide variety of connection types. For more details, refer to Connection Types and Options for ETL in AWS Glue.

S3 bucket as landing zone

We used an S3 bucket as the immediate landing zone of the extracted data, which is further processed and optimized.

Lambda as AWS Glue ETL Trigger

We enabled S3 event notifications on the S3 bucket to trigger Lambda, which further partitions our data. The data is partitioned on InputDataSetName, Year, Month, and Date. Any query processor running on top of this data will scan only a subset of data for better cost and performance optimization. Our data can be stored in various formats, such as CSV, JSON, and Parquet.

The raw data isn’t ideal for most of our use cases to generate the optimal plan because it often has duplicates or incorrect data types. Most importantly, the data is in multiple formats, but we quickly modified the data and observed significant query performance gains from using the Parquet format. Here, we used one of the performance tips in Top 10 performance tuning tips for Amazon Athena.

AWS Glue jobs for ETL

We wanted better data segregation and accessibility, so we chose to have a different S3 bucket to improve performance further. We used the same AWS Glue jobs to further transform and load the data into the required S3 bucket and a portion of extracted metadata into DynamoDB.

DynamoDB as metadata store

Now that we have the data, various business stakeholders further consume it. This leaves us with two questions: which source data resides on the data lake and what version. We chose DynamoDB as our metadata store, which provides the latest details to the consumers to query the data effectively. Every dataset in our system is uniquely identified by snapshot ID, which we can search from our metadata store. Clients access this data store with an API’s.

Amazon S3 as data lake

For better data quality, we extracted the enriched data into another S3 bucket with the same AWS Glue job.

AWS Glue Crawler

Crawlers are the “secret sauce” that enables us to be responsive to schema changes. Throughout the process, we chose to make each step as schema-agnostic as possible, which allows any schema changes to flow through until they reach AWS Glue. With a crawler, we could maintain the agnostic changes happening to the schema. This helped us automatically crawl the data from Amazon S3 and generate the schema and tables.

AWS Glue Data Catalog

The Data Catalog helped us maintain the catalog as an index to the data’s location, schema, and runtime metrics in Amazon S3. Information in the Data Catalog is stored as metadata tables, where each table specifies a single data store.

Athena for SQL queries

Athena is an interactive query service that makes it easy to analyze data in Amazon S3 using standard SQL. Athena is serverless, so there is no infrastructure to manage, and you pay only for the queries you run. We considered operational stability and increasing developer velocity as our key improvement factors.

We further optimized the process to query Athena so that users can plug in the values and the queries to get data out of Athena by creating the following:

  • An AWS Cloud Development Kit (AWS CDK) template to create Athena infrastructure and AWS Identity and Access Management (IAM) roles to access data lake S3 buckets and the Data Catalog from any account
  • A library so that client can provide an IAM role, query, data format, and output location to start an Athena query and get the status and result of the query run in the bucket of their choice.

To query Athena is a two-step process:

  • StartQueryExecution – This starts the query run and gets the run ID. Users can provide the output location where the output of the query will be stored.
  • GetQueryExecution – This gets the query status because the run is asynchronous. When successful, you can query the output in an S3 file or via API.

The helper method for starting the query run and getting the result would be in the library.

Data lake metadata service

This service is custom developed and interacts with DynamoDB to get the metadata (dataset name, snapshot ID, partition string, timestamp, and S3 link of the data) in the form of a REST API. When the schema is discovered, clients use Athena as their query processor to query the data.

Because all datasets have a snapshot ID are partitioned, the join query doesn’t result in a full table scan but only a partition scan on Amazon S3. We used Athena as our query processor because of its ease in not managing our query infrastructure. Later, if we feel we need something more, we can use either Redshift Spectrum or Amazon EMR.

Conclusion

Amazon Devices teams discovered significant value by moving to a data lake architecture using AWS Glue, which enabled multiple global business stakeholders to ingest data in more productive ways. This enabled the teams to generate the optimal plan to place purchase orders for devices by analyzing the different datasets in near-real time with appropriate business logic to solve the problems of the supply chain, demand, and forecast.

From an operational perspective, the investment has already started to pay off:

  • It standardized our ingestion, storage, and retrieval mechanisms, saving onboarding time. Before the implementation of this system, one dataset took 1 month to onboard. Due to our new architecture, we were able to onboard 15 new datasets in less than 2 months, which improved our agility by 70%.
  • It removed scaling bottlenecks, creating a homogeneous system that can quickly scale to thousands of runs.
  • The solution added schema and data quality validation before accepting any inputs and rejecting them if data quality violations are discovered.
  • It made it easy to retrieve datasets while supporting future simulations and back tester use cases requiring versioned inputs. This will make launching and testing models simpler.
  • The solution created a common infrastructure that can be easily extended to other teams across DIAL having similar issues with data ingestion, storage, and retrieval use cases.
  • Our operating costs have fallen by almost 90%.
  • This data lake can be accessed efficiently by our data scientists and engineers to perform other analytics and have a predictive approach as a future opportunity to generate accurate plans for the purchase orders.

The steps in this post can help you plan to build a similar modern data strategy using AWS-managed services to ingest data from different sources, automatically create metadata catalogs, share data seamlessly between the data lake and data warehouse, and create alerts in the event of an orchestrated data workflow failure.


About the authors

avinash_kolluriAvinash Kolluri is a Senior Solutions Architect at AWS. He works across Amazon Alexa and Devices to architect and design modern distributed solutions. His passion is to build cost-effective and highly scalable solutions on AWS. In his spare time, he enjoys cooking fusion recipes and traveling.

vipulVipul Verma is a Sr.Software Engineer at Amazon.com. He has been with Amazon since 2015,solving real-world challenges through technology that directly impact and improve the life of Amazon customers. In his spare time, he enjoys hiking.

Amazon EMR launches support for Amazon EC2 C7g (Graviton3) instances to improve cost performance for Spark workloads by 7–13%

Post Syndicated from Al MS original https://aws.amazon.com/blogs/big-data/amazon-emr-launches-support-for-amazon-ec2-c7g-graviton3-instances-to-improve-cost-performance-for-spark-workloads-by-7-13/

Amazon EMR provides a managed service to easily run analytics applications using open-source frameworks such as Apache Spark, Hive, Presto, Trino, HBase, and Flink. The Amazon EMR runtime for Spark and Presto includes optimizations that provide over twice the performance improvements compared to open-source Apache Spark and Presto.

With Amazon EMR release 6.7, you can now use Amazon Elastic Compute Cloud (Amazon EC2) C7g instances, which use the AWS Graviton3 processors. These instances improve price-performance of running Spark workloads on Amazon EMR by 7.93–13.35% over previous generation instances, depending on the instance size. In this post, we describe how we estimated the price-performance benefit.

Amazon EMR runtime performance with EC2 C7g instances

We ran TPC-DS 3 TB benchmark queries on Amazon EMR 6.9 using the Amazon EMR runtime for Apache Spark (compatible with Apache Spark 3.3) with C7g instances. Data was stored in Amazon Simple Storage Service (Amazon S3), and results were compared to equivalent C6g clusters from the previous generation instance family. We measured performance improvements using the total query runtime and geometric mean of the query runtime across TPC-DS 3 TB benchmark queries.

Our results showed 13.65–18.73% improvement in total query runtime performance and 16.98–20.28% improvement in geometric mean on EMR clusters with C7g compared to equivalent EMR clusters with C6g instances, depending on the instance size. In comparing costs, we observed 7.93–13.35% reduction in cost on the EMR cluster with C7g compared to the equivalent with C6g, depending on the instance size. We did not benchmark the C6g xlarge instance because it didn’t have sufficient memory to run the queries.

The following table shows the results from running the TPC-DS 3 TB benchmark queries using Amazon EMR 6.9 compared to equivalent C7g and C6g instance EMR clusters.

Instance Size 16 XL 12 XL 8 XL 4 XL 2 XL
Total size of the cluster (1 leader + 5 core nodes) 6 6 6 6 6
Total query runtime on C6g (seconds) 2774.86205 2752.84429 3173.08086 5108.45489 8697.08117
Total query runtime on C7g (seconds) 2396.22799 2336.28224 2698.72928 4151.85869 7249.58148
Total query runtime improvement with C7g 13.65% 15.13% 14.95% 18.73% 16.64%
Geometric mean query runtime C6g (seconds) 22.2113 21.75459 23.38081 31.97192 45.41656
Geometric mean query runtime C7g (seconds) 18.43905 17.65898 19.01684 25.48695 37.43737
Geometric mean query runtime improvement with C7g 16.98% 18.83% 18.66% 20.28% 17.57%
EC2 C6g instance price ($ per hour) $2.1760 $1.6320 $1.0880 $0.5440 $0.2720
EMR C6g instance price ($ per hour) $0.5440 $0.4080 $0.2720 $0.1360 $0.0680
(EC2 + EMR) instance price ($ per hour) $2.7200 $2.0400 $1.3600 $0.6800 $0.3400
Cost of running on C6g ($ per instance) $2.09656 $1.55995 $1.19872 $0.96493 $0.82139
EC2 C7g instance price ($ per hour) $2.3200 $1.7400 $1.1600 $0.5800 $0.2900
EMR C7g price ($ per hour per instance) $0.5800 $0.4350 $0.2900 $0.1450 $0.0725
(EC2 + EMR) C7g instance price ($ per hour) $2.9000 $2.1750 $1.4500 $0.7250 $0.3625
Cost of running on C7g ($ per instance) $1.930290 $1.411500 $1.086990 $0.836140 $0.729990
Total cost reduction with C7g including performance improvement -7.93% -9.52% -9.32% -13.35% -11.13%

The following graph shows per-query improvements observed on C7g 2xlarge instances compared to equivalent C6g generations.

Benchmarking methodology

The benchmark used in this post is derived from the industry-standard TPC-DS benchmark, and uses queries from the Spark SQL Performance Tests GitHub repo with the following fixes applied.

We calculated TCO by multiplying cost per hour by number of instances in the cluster and time taken to run the queries on the cluster. We used on-demand pricing in the US East (N. Virginia) Region for all instances.

Conclusion

In this post, we described how we estimated the cost-performance benefit from using Amazon EMR with C7g instances compared to using equivalent previous generation instances. Using these new instances with Amazon EMR improves cost-performance by an additional 7–13%.


About the authors

AI MSAl MS is a product manager for Amazon EMR at Amazon Web Services.

Kyeonghyun Ryoo is a Software Development Engineer for EMR at Amazon Web Services. He primarily works on designing and building automation tools for internal teams and customers to maximize their productivity. Outside of work, he is a retired world champion in professional gaming who still enjoy playing video games.

Yuzhou Sun is a software development engineer for EMR at Amazon Web Services.

Steve Koonce is an Engineering Manager for EMR at Amazon Web Services.

AWS Lake Formation 2022 year in review

Post Syndicated from Jason Berkowitz original https://aws.amazon.com/blogs/big-data/aws-lake-formation-2022-year-in-review/

Data governance is the collection of policies, processes, and systems that organizations use to ensure the quality and appropriate handling of their data throughout its lifecycle for the purpose of generating business value. Data governance is increasingly top-of-mind for customers as they recognize data as one of their most important assets. Effective data governance enables better decision-making by improving data quality, reducing data management costs, and ensuring secure access to data for stakeholders. In addition, data governance is required to comply with an increasingly complex regulatory environment with data privacy (such as GDPR and CCPA) and data residency regulations (such as in the EU, Russia, and China).

For AWS customers, effective data governance improves decision-making, increases business agility, provides a competitive advantage, and reduces the risk of fines due to non-compliance with regulatory obligations. We understand the unique opportunity to provide our customers a comprehensive end-to-end data governance solution that is seamlessly integrated into our portfolio of services, and AWS Lake Formation and the AWS Glue Data Catalog are key to solving these challenges.

In this post, we are excited to summarize the features that the AWS Glue Data Catalog, AWS Glue crawler, and Lake Formation teams delivered in 2022. We have collected some of the key talks and solutions on data governance, data mesh, and modern data architecture published and presented in AWS re:Invent 2022, and a few data lake solutions built by customers and AWS Partners for easy reference. Whether you are a data platform builder, data engineer, data scientist, or any technology leader interested in data lake solutions, this post is for you.

To learn more about how customers are securing and sharing data with Lake Formation, we recommend going deeper into GoDaddy’s decentralized data mesh, Novo Nordisk’s modern data architecture, and JPMorgan’s improvements to their Federated Data Lake, a governed data mesh implementation using Lake Formation. Also, you can learn how AWS Partners integrated with Lake Formation to help customers build unique data lakes, in Starburst’s data mesh solution, Informatica’s automated data sharing solution, Ahana’s Presto integration with Lake Formation, Ascending’s custom data governance system, how PBS used machine learning on their data lakes, and how hc1 provides personalized health insights for customers.

You can review how Lake Formation is used by customers to build modern data architectures in the following re:Invent 2022 talks:

The Lake Formation team listened to customer feedback and made improvements in the areas of cross-account data governance, expanding the source of data lakes, enabling unified data governance of a business data catalog, making secure business-to-business data sharing possible, and expanding the coverage area for fine-grained access controls to Amazon Redshift. In the rest of this post, we are happy to share the progress we made in 2022.

Enhancing cross-account governance

Lake Formation provides the foundation for customers to share data across accounts within their organization. You can share AWS Glue Data Catalog resources to AWS Identity and Access Management (IAM) principals within an account as well as other AWS accounts using two methods. The first one is called the named-resource method, where users can select the names of databases and tables and choose the type of permissions to share. The second method uses LF-Tags, where users can create and associate LF-Tags to databases and tables and grant permission to IAM principals using LF-Tag policies and expressions.

In November 2022, Lake Formation introduced version 3 of its cross-account sharing feature. With this new version, Lake Formation users can share catalog resources using LF-Tags at the AWS Organizations level. Sharing data using LF-tags helps scale permissions and reduces the admin work for data lake builders. The cross-account sharing version 3 also allows you to share resources to specific IAM principals in other accounts, providing data owners control over who can access their data in other accounts. Lastly, we have removed the overhead of writing and maintaining Data Catalog resource policies by introducing AWS Resource Access Manager (AWS RAM) invites with LF-Tags-based policies in the cross-account sharing version 3. We encourage you to further explore cross-account sharing in Lake Formation.

Extending Lake Formation permissions to new data

Until re:Invent 2022, Lake Formation provided permissions management for IAM principals on Data Catalog resources with underlying data primarily on Amazon Simple Storage Service (Amazon S3). At re:Invent 2022, we introduced Lake Formation permissions management for Amazon Redshift data shares in preview mode. Amazon Redshift is a fully-managed, petabyte-scale data warehouse service in the AWS Cloud. The data sharing feature allows data owners to group databases, tables, and views in an Amazon Redshift cluster and share it with other Amazon Redshift clusters within or across AWS accounts. Data sharing reduces the need to keep multiple copies of the same data in different data warehouses to accelerate business decision-making across an organization. Lake Formation further enhances sharing data within Amazon Redshift data shares by providing fine-grained access control on tables and views.

For additional details on this feature, refer to AWS Lake Formation-managed Redshift datashares (preview) and How Redshift data share can be managed by Lake Formation.

Amazon EMR is a managed cluster platform to run big data applications using Apache Spark, Apache Hive, Apache HBase, Apache Flink, Apache Hudi, and Presto at scale. You can use Amazon EMR to run batch and stream processing analytics jobs on your S3 data lakes. Starting with Amazon EMR release 6.7.0, we introduced Lake Formation permissions management on a runtime IAM role used with the EMR Steps API. This feature enables you to submit Apache Spark and Apache Hive applications to an EMR cluster through the EMR Steps API that enforces table-level and column-level permissions using Lake Formation to that IAM role submitting the application. This Lake Formation integration with Amazon EMR allows you to share an EMR cluster across multiple users in an organization with different permissions by isolating your applications through a runtime IAM role. We encourage you to check this feature in the Lake Formation workshop Integration with Amazon EMR using Runtime Roles. To explore a use case, see Introducing runtime roles for Amazon EMR steps: Use IAM roles and AWS Lake Formation for access control with Amazon EMR.

Amazon SageMaker Studio is a fully integrated development environment (IDE) for machine learning (ML) that enables data scientists and developers to prepare data for building, training, tuning, and deploying models. Studio offers a native integration with Amazon EMR so that data scientists and data engineers can interactively prepare data at petabyte scale using open-source frameworks such as Apache Spark, Presto, and Hive using Studio notebooks. With the release of Lake Formation permissions management on a runtime IAM role, Studio now supports table-level and column-level access with Lake Formation. When users connect to EMR clusters from Studio notebooks, they can choose the IAM role (called the runtime IAM role) that they want to connect with. If data access is managed by Lake Formation, users can enforce table-level and column-level permissions using policies attached to the runtime role. For more details, refer to Apply fine-grained data access controls with AWS Lake Formation and Amazon EMR from Amazon SageMaker Studio.

Ingest and catalog varied data

A robust data governance model includes data from an organization’s many data sources and methods to discover and catalog those varied data assets. AWS Glue crawlers provide the ability to discover data from sources including Amazon S3, Amazon Redshift, and NoSQL databases, and populate the AWS Glue Data Catalog.

In 2022, we launched AWS Glue crawler support for Snowflake and AWS Glue crawler support for Delta Lake tables. These integrations allow AWS Glue crawlers to create and update Data Catalog tables based on these popular data sources. This makes it even easier to create extract, transform, and load (ETL) jobs with AWS Glue based on these Data Catalog tables as sources and targets.

In 2022, the AWS Glue crawlers UI was redesigned to offer a better user experience. One of the main enhancements delivered as part of this revision is the greater insights into AWS Glue crawler history. The crawler history UI provides an easy view of crawler runs, schedules, data sources, and tags. For each crawl, the crawler history offers a summary of changes in the database schema or Amazon S3 partition changes. Crawler history also provides detailed info about DPU hours and reduces the time spent analyzing and debugging crawler operations and costs. To explore the new functionalities added to the crawlers UI, refer to Set up and monitor AWS Glue crawlers using the enhanced AWS Glue UI and crawler history.

In 2022, we also extended support for crawlers based on Amazon S3 event notifications to support catalog tables. With this feature, incremental crawling can be offloaded from data pipelines to the scheduled AWS Glue crawler, reducing crawls to incremental S3 events. For more information, refer to Build incremental crawls of data lakes with existing Glue catalog tables.

More ways to share data beyond the data lake

During re:Invent 2022, we announced a preview of AWS Data Exchange for AWS Lake Formation, a new feature that enables data subscribers to find and subscribe to third-party datasets that are managed directly through Lake Formation. Until now, AWS Data Exchange subscribers could access third-party datasets by exporting providers’ files to their own S3 buckets, calling providers’ APIs through Amazon API Gateway, or querying producers’ Amazon Redshift data shares from their Amazon Redshift cluster. With the new Lake Formation integration, data providers curate AWS Data Exchange datasets using Lake Formation tags. Data subscribers are able to query and explore the databases and tables associated with those tags, just like any other AWS Glue Data Catalog resource. Organizations can apply resource-based Lake Formation permissions to share the licensed datasets within the same account or across accounts using AWS License Manager. AWS Data Exchange for Lake Formation streamlines data licensing and sharing operations by accelerating data onboarding, reducing the amount of ETL required for end-users to access third-party data, and centralizing governance and access controls for third-party data.

At re:Invent 2022, we also announced Amazon DataZone, a new data management service that makes it faster and easier for you to catalog, discover, share, and govern data stored across AWS, on-premises, and third-party sources. Amazon DataZone is a business data catalog service that supplements the technical metadata in the AWS Glue Data Catalog. Amazon DataZone is integrated with Lake Formation permissions management so that you can effectively manage and govern access to your data, and audit who is accessing what data and for what purpose. With the publisher-subscriber model of Amazon DataZone, data assets can be shared and accessed across Regions. For additional details about the service and its capabilities, refer to the Amazon DataZone FAQs and re:Invent launch.

Conclusion

Data is transforming every field and every business. However, with data growing faster than most companies can keep track of, collecting, securing, and getting value out of that data is a challenging thing to do. A modern data strategy can help you create better business outcomes with data. AWS provides the most complete set of services for the end-to-end data journey to help you unlock value from your data and turn it into insight.

At AWS, we work backward from customer requirements. From the Lake Formation team, we worked hard to deliver the features described in this post, and we invite you to check them out. With our continued focus to invent, we hope to play a key role in empowering organizations to build new data governance models that help you derive more business value at lightning speed.

You can get started with Lake Formation by exploring our hands-on workshop modules and Getting started tutorials. We look forward to hearing from you, our customers, on your data lake and data governance use cases. Please get in touch through your AWS account team and share your comments.


About the Authors

Jason Berkowitz is a Senior Product Manager with AWS Lake Formation. He comes from a background in machine learning and data lake architectures. He helps customers become data-driven.

Aarthi Srinivasan is a Senior Big Data Architect with AWS Lake Formation. She enjoys building data lake solutions for AWS customers and partners. When not on the keyboard, she explores the latest science and technology trends and spends time with her family.

Leonardo Gómez is a Senior Analytics Specialist Solutions Architect at AWS. Based in Toronto, Canada, he has over a decade of experience in data management, helping customers around the globe address their business and technical needs.

Visualize multivariate data using a radar chart in Amazon QuickSight

Post Syndicated from Bhupinder Chadha original https://aws.amazon.com/blogs/big-data/visualize-multivariate-data-using-a-radar-chart-in-amazon-quicksight/

At AWS re:Invent 2022, we announced the general availability of two new Amazon QuickSight visuals: small multiples and text boxes. We are excited to add another new visual to QuickSight: radar charts. With radar charts, you can compare two or more items across multiple variables in QuickSight.

In this post, we explore radar charts, its use cases, and how to configure one.

What is a radar chart?

Radar charts (also known as spider charts, polar charts, web charts, or star plots) are a way to visualize multivariate data similar to a parallel coordinates chart. They are used to plot one or more groups of values over multiple common variables. They do this by providing an axis for each variable, and these axes are arranged radially around a central point and spaced equally. The center of the chart represents the minimum value, and the edges represent the maximum value on the axis. The data from a single observation is plotted along each axis and connected to form a polygon. Multiple observations can be placed in a single chart by displaying multiple polygons.

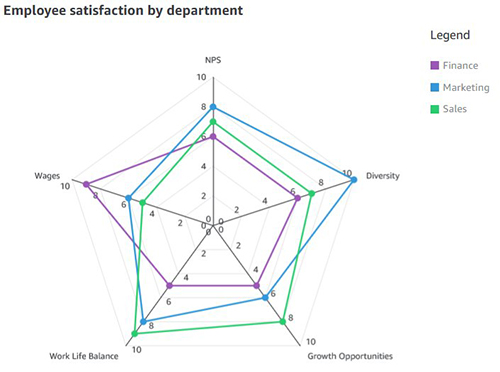
For example, consider HR wanting to comparing the employee satisfaction score for different departments like sales, marketing, and finance against various metrics such as work/life balance, diversity, inclusiveness, growth opportunities, and wages. As shown in the following radar chart, each employee metric forms the axis with each department being represented by individual series.

Another effective way of comparing radar charts is to compare a given department against the average or baseline value. For instance, the sales department feels less compensated compared to the baseline, but ranks high on work/life balance.

When to use radar charts

Radar charts are a great option when space is a constraint and you want to compare multiple groups in a compact space. Radar charts are best used for the following:

  • Visualizing multivariate data, such as comparing cars across different stats like mileage, max speed, engine power, and driving pleasure
  • Comparative analysis (comparing two or more items across a list of common variables)
  • Spot outliers and commonality

Compared to parallel coordinates, radar charts are ideal when there are a few groups of items to be compared. You should also be mindful of not displaying too many variables, which can make the chart look cluttered and difficult to read.

Radar chart use cases

Radar charts have a wide variety of industry use cases, some of which are as follows:

  • Sports analytics – Compare athlete performance across different performance parameters for selection criteria
  • Strategy – Compare and measure different technology costs between various parameters, such as contact center, claims, massive claims, and others
  • Sales – Compare performance of sales reps across different parameters like deals closed, average deal size, net new customer wins, total revenue, and deals in the pipeline
  • Call centers – Compare call center staff performance against the staff average across different dimensions
  • HR – Compare company scores in terms of diversity, work/life balance, benefits, and more
  • User research and customer success – Compare customer satisfaction scores across different parts of the product

Different radar chart configurations

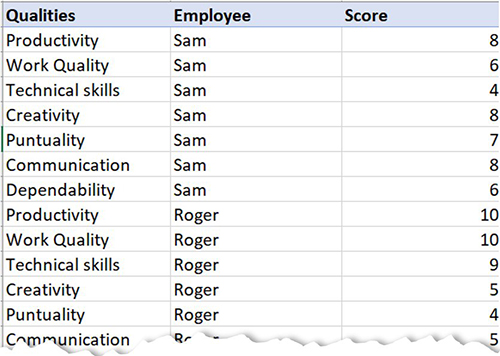
Let’s use an example of visualizing staff performance within a team, using the following sample data. The goal is to compare employee performance based on various qualities like communication, work quality, productivity, creativity, dependability, punctuality, and technical skills, ranging between a score of 0–10.

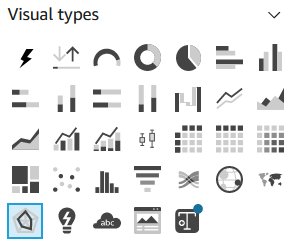
To add a radar chart to your analysis, choose the radar chart icon from the visual selector.

Depending on your use case and how the data is structured, you can configure radar charts in different ways.

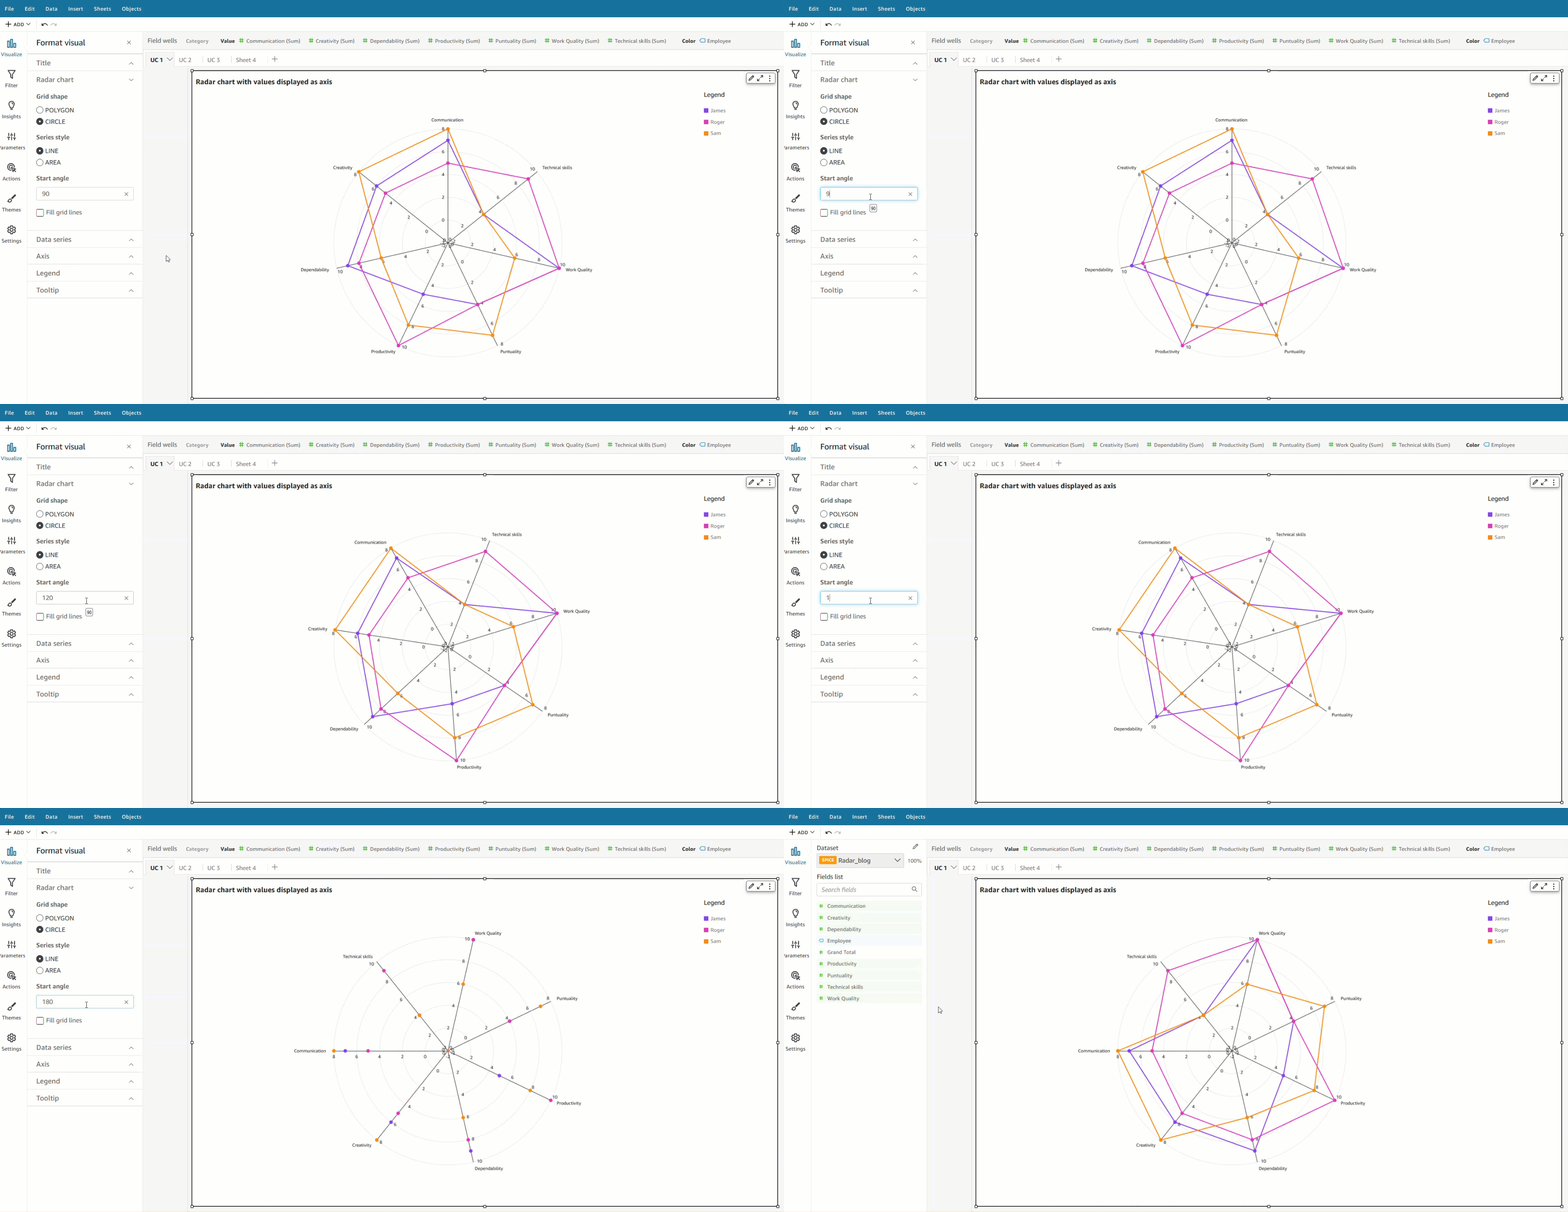
Value as axis (UC1 and 2 tab from the dataset)

In this scenario, all qualities (communication, dependability, and so on) are defined as measures, and the employee is defined as a dimension in the dataset.

To visualize this data in a radar chart, drag all the variables to the Values field well and the Employee field to the Color field well.

Category as axis (UC1 and 2 tab from the dataset)

Another way to visualize the same data is to reverse the series and axis configuration, where each quality is displayed as a series and employees are displayed on the axis. For this, drag the Employee field to the Category field well and all the qualities to the Value field well.

Category as axis with color (UC3 tab from the dataset)

We can visualize the same use case with a different data structure, where all the qualities and employees are defined as a dimension and scores as values.

To achieve this use case, drag the field that you want to visualize as the axis to the Category field and individual series to the Color field. In our case, we chose Qualities as our axis, added Score to the Value field well, and visualized the values for each employee by adding Employee to the Color field well.

Styling radar charts

You can customize your radar charts with the following formatting options:

  • Series style – You can choose to display the chart as either a line (default) or area series

  • Start angle – By default, this is set to 90 degrees, but you can choose a different angle if you want to rotate the radar chart to better utilize the available real estate

  • Fill area – This option applies odd/even coloring for the plot area

  • Grid shape – Choose between circle or polygon for grid shape

Summary

In this post, we looked at how radar charts can help you visualize and compare items across different variables. We also learned about the different configurations supported by radar charts and styling options to help you customize its look and feel.

We encourage you to explore radar charts and leave a comment with your feedback.


About the author

Bhupinder Chadha is a senior product manager for Amazon QuickSight focused on visualization and front end experiences. He is passionate about BI, data visualization and low-code/no-code experiences. Prior to QuickSight he was the lead product manager for Inforiver, responsible for building a enterprise BI product from ground up. Bhupinder started his career in presales, followed by a small gig in consulting and then PM for xViz, an add on visualization product.

Migrate your indexes to Amazon OpenSearch Serverless with Logstash

Post Syndicated from Prashant Agrawal original https://aws.amazon.com/blogs/big-data/migrate-your-indexes-to-amazon-opensearch-serverless-with-logstash/

We recently announced the general availability of Amazon OpenSearch Serverless , a new option for Amazon OpenSearch Service that makes it easy run large-scale search and analytics workloads without having to configure, manage, or scale OpenSearch clusters. With OpenSearch Serverless, you get the same interactive millisecond response times as OpenSearch Service with the simplicity of a serverless environment.

In this post, you’ll learn how to migrate your existing indices from an OpenSearch Service managed cluster domain to a serverless collection using Logstash.

With OpenSearch domains, you get dedicated, secure clusters configured and optimized for your workloads in minutes. You have full control over the configuration of compute, memory, and storage resources in clusters to optimize cost and performance for your applications. OpenSearch Serverless provides an even simpler way to run search and analytics workloads—without ever having to think about clusters. You simply create a collection and a group of indexes, and can start ingesting and querying the data.

Solution overview

Logstash is open-source software that provides ETL (extract, transform, and load) for your data. You can configure Logstash to connect to a source and a destination via input and output plugins. In between, you configure filters that can transform your data. This post walks you through the steps you need to set up Logstash to connect an OpenSearch Service domain (input) to an OpenSearch Serverless collection (output).

You set the source and destination plugins in Logstash’s config file. The config file has sections for Input, Filter, and Output. Once configured, Logstash will send a request to the OpenSearch Service domain and read the data according to the query you put in the input section. After data is read from OpenSearch Service, you can optionally send it to the next stage Filter for transformations such as adding or removing a field from the input data or updating a field with different values. In this example, you won’t use the Filter plugin. Next is the Output plugin. The open-source version of Logstash (Logstash OSS) provides a convenient way to use the bulk API to upload data to your collections. OpenSearch Serverless supports the logstash-output-opensearch output plugin, which supports AWS Identity and Access Management (IAM) credentials for data access control.

The following diagram illustrates our solution workflow.

Prerequisites

Before getting started, make sure you have completed the following prerequisites:

  1. Note down your OpenSearch Service domain’s ARN, user name, and password.
  2. Create an OpenSearch Serverless collection. If you’re new to OpenSearch Serverless, refer to Log analytics the easy way with Amazon OpenSearch Serverless for details on how to set up your collection.

Set up Logstash and the input and output plugins for OpenSearch

Complete the following steps to set up Logstash and your plugins:

  1. Download logstash-oss-with-opensearch-output-plugin. (This example uses the distro for macos-x64. For other distros, refer to the artifacts.)
    wget https://artifacts.opensearch.org/logstash/logstash-oss-with-opensearch-output-plugin-8.4.0-macos-x64.tar.gz

  2. Extract the downloaded tarball:
    tar -zxvf logstash-oss-with-opensearch-output-plugin-8.4.0-macos-x64.tar.gz
    cd logstash-8.4.0/

  3. Update the logstash-output-opensearch plugin to the latest version:
    <path/to/your/logstash/root/directory>/bin/logstash-plugin update logstash-output-opensearch

  4. Install the logstash-input-opensearch plugin:
    <path/to/your/logstash/root/directory>/bin/logstash-plugin install logstash-input-opensearch

Test the plugin

Let’s get into action and see how the plugin works. The following config file retrieves data from the movies index in your OpenSearch Service domain and indexes that data in your OpenSearch Serverless collection with same index name, movies.

Create a new file and add the following content, then save the file as opensearch-serverless-migration.conf. Provide the values for the OpenSearch Service domain endpoint under HOST, USERNAME, and PASSWORD in the input section, and the OpenSearch Serverless collection endpoint details under HOST along with REGION, AWS_ACCESS_KEY_ID, and AWS_SECRET_ACCESS_KEY in the output section.

input {
    opensearch {
        hosts =>  ["https://<HOST>:443"]
        user  =>  "<USERNAME>"
        password  =>  "<PASSWORD>"
        index =>  "movies"
        query =>  '{ "query": { "match_all": {}} }'
    }
}
output {
    opensearch {
        ecs_compatibility => disabled
        index => "movies"
        hosts => "<HOST>:443"
        auth_type => {
            type => 'aws_iam'
            aws_access_key_id => '<AWS_ACCESS_KEY_ID>'
            aws_secret_access_key => '<AWS_SECRET_ACCESS_KEY>'
            region => '<REGION>'
            service_name => 'aoss'
            }
        legacy_template => false
        default_server_major_version => 2
    }
}

You can specify a query in the input section of the preceding config. The match_all query matches all data in the movies index. You can change the query if you want to select a subset of the data. You can also use the query to parallelize the data transfer by running multiple Logstash processes with configs that specify different data slices. You can also parallelize by running Logstash processes against multiple indexes if you have them.

Start Logstash

Use the following command to start Logstash:

<path/to/your/logstash/root/directory>/bin/logstash -f <path/to/your/config/file>

After you run the command, Logstash will retrieve the data from the source index from your OpenSearch Service domain, and write to the destination index in your OpenSearch Serverless collection. When the data transfer is complete, Logstash shuts down. See the following code:

[2023-01-24T20:14:28,965][INFO][logstash.agent] Successfully
started Logstash API endpoint {:port=>9600, :ssl_enabled=>false}
…
…
[2023-01-24T20:14:38,852][INFO][logstash.javapipeline][main] Pipeline terminated {"pipeline.id"=>"main"}
[2023-01-24T20:14:39,374][INFO][logstash.pipelinesregistry] Removed pipeline from registry successfully {:pipeline_id=>:main}
[2023-01-24T20:14:39,399][INFO][logstash.runner] Logstash shut down.

Verify the data in OpenSearch Serverless

You can verify that Logstash copied all your data by comparing the document count in your domain and your collection. Run the following query either from the Dev tools tab, or with curl, postman, or a similar HTTP client. The following query helps you search all documents from the movies index and returns the top documents along with the count. By default, OpenSearch will return the document count up to a maximum of 10,000. Adding the track_total_hits flag helps you get the exact count of documents if the document count exceeds 10,000.

GET movies/_search
{
  "query": {
    "match_all": {}
  },
  "track_total_hits" : true
}

Conclusion

In this post, you migrated data from your OpenSearch Service domain to your OpenSearch Serverless collection using Logstash’s OpenSearch input and output plugins.

Stay tuned for a series of posts focusing on the various options available for you to build effective log analytics and search solutions using OpenSearch Serverless. You can also refer the Getting started with Amazon OpenSearch Serverless workshop to know more about OpenSearch Serverless.

If you have feedback about this post, submit it in the comments section. If you have questions about this post, start a new thread on the Amazon OpenSearch Service forum or contact AWS Support.


About the authors

Prashant Agrawal is a Sr. Search Specialist Solutions Architect with Amazon OpenSearch Service. He works closely with customers to help them migrate their workloads to the cloud and helps existing customers fine-tune their clusters to achieve better performance and save on cost. Before joining AWS, he helped various customers use OpenSearch and Elasticsearch for their search and log analytics use cases. When not working, you can find him traveling and exploring new places. In short, he likes doing Eat → Travel → Repeat.

Jon Handler (@_searchgeek) is a Sr. Principal Solutions Architect at Amazon Web Services based in Palo Alto, CA. Jon works closely with the CloudSearch and Elasticsearch teams, providing help and guidance to a broad range of customers who have search workloads that they want to move to the AWS Cloud. Prior to joining AWS, Jon’s career as a software developer included four years of coding a large-scale, eCommerce search engine.

Serverless logging with Amazon OpenSearch Service and Amazon Kinesis Data Firehose

Post Syndicated from Jon Handler original https://aws.amazon.com/blogs/big-data/serverless-logging-with-amazon-opensearch-service-and-amazon-kinesis-data-firehose/

In this post, you will learn how you can use Amazon Kinesis Data Firehose to build a log ingestion pipeline to send VPC flow logs to Amazon OpenSearch Serverless. First, you create the OpenSearch Serverless collection you use to store VPC flow logs, then you create a Kinesis Data Firehose delivery pipeline that forwards the flow logs to OpenSearch Serverless. Finally, you enable delivery of VPC flow logs to your Firehose delivery stream. The following diagram illustrates the solution workflow.

OpenSearch Serverless is a new serverless option offered by Amazon OpenSearch Service. OpenSearch Serverless makes it simple to run petabyte-scale search and analytics workloads without having to configure, manage, or scale OpenSearch clusters. OpenSearch Serverless automatically provisions and scales the underlying resources to deliver fast data ingestion and query responses for even the most demanding and unpredictable workloads.

Kinesis Data Firehose is a popular service that delivers streaming data from over 20 AWS services to over 15 analytical and observability tools such as OpenSearch Serverless. Kinesis Data Firehose is great for those looking for a fast and easy way to send your VPC flow logs data to your OpenSearch Serverless collection in minutes without a single line of code and without building or managing your own data ingestion and delivery infrastructure.

VPC flow logs capture the traffic information going to and from your network interfaces in your VPC. With the launch of Kinesis Data Firehose support to OpenSearch Serverless, it makes an easy solution to analyze your VPC flow logs with just a few clicks. Kinesis Data Firehose provides a true end-to-end serverless mechanism to deliver your flow logs to OpenSearch Serverless, where you can use OpenSearch Dashboards to search through those logs, create dashboards, detect anomalies, and send alerts. VPC flow logs helps you to answer questions like:

  • What percentage of your traffic is getting dropped?
  • How much traffic is getting generated for specific sources and destinations?

Create your OpenSearch Serverless collection

To get started, you first create a collection. An OpenSearch Serverless collection is a logical grouping of one or more indexes that represent an analytics workload. Complete the following steps:

  1. On the OpenSearch Service console, choose Collections under Serverless in the navigation pane.
  2. Choose Create a collection.
  3. For Collection name, enter a name (for example, vpc-flow-logs).
  4. For Collection type¸ choose Time series.
  5. For Encryption, choose your preferred encryption setting:
    1. Choose Use AWS owned key to use an AWS managed key.
    2. Choose a different AWS KMS key to use your own AWS Key Management Service (AWS KMS) key.
  6. For Network access settings, choose your preferred setting:
    1. Choose VPC to use a VPC endpoint.
    2. Choose Public to use a public endpoint.

AWS recommends that you use a VPC endpoint for all production workloads. For this walkthrough, select Public.

  1. Choose Create.

It should take couple of minutes to create the collection.

The following graphic gives a quick demonstration of creating the OpenSearch Serverless collection via the preceding steps.

At this point, you have successfully created a collection for OpenSearch Serverless. Next, you create a delivery pipeline for Kinesis Data Firehose.

Create a Kinesis Data Firehose delivery stream

To set up a delivery stream for Kinesis Data Firehose, complete the following steps:

  1. On the Kinesis Data Firehose console, choose Create delivery stream.
  2. For Source, specify Direct PUT.

Check out Source, Destination, and Name to learn more about different sources supported by Kinesis Data Firehose.

  1. For Destination, choose Amazon OpenSearch Serverless.
  2. For Delivery stream name, enter a name (for example, vpc-flow-logs).
  3. Under Destination settings, in the OpenSearch Serverless collection settings, choose Browse.
  4. Select vpc-flow-logs.
  5. Choose Choose.

If your collection is still creating, wait a few minutes and try again.

  1. For Index, specify vpc-flow-logs.
  2. In the Backup settings section, select Failed data only for the Source record backup in Amazon S3.

Kinesis Data Firehose uses Amazon Simple Storage Service (Amazon S3) to back up failed data that it attempts to deliver to your chosen destination. If you want to keep all data, select All data.

  1. For S3 Backup Bucket, choose Browse to select an existing S3 bucket, or choose Create to create a new bucket.
  2. Choose Create delivery stream.

The following graphic gives a quick demonstration of creating the Kinesis Data Firehose delivery stream via the preceding steps.

At this point, you have successfully created a delivery stream for Kinesis Data Firehose, which you will use to stream data from your VPC flow logs and send it to your OpenSearch Serverless collection.

Set up the data access policy for your OpenSearch Serverless collection

Before you send any logs to OpenSearch Serverless, you need to create a data access policy within OpenSearch Serverless that allows Kinesis Data Firehose to write to the vpc-flow-logs index in your collection. Complete the following steps:

  1. On the Kinesis Data Firehose console, choose the Configuration tab on the details page for the vpc-flow-logs delivery stream you just created.
  2. In the Permissions section, note down the AWS Identity and Access Management (IAM) role.
  3. Navigate to the vpc-flow-logs collection details page on the OpenSearch Serverless dashboard.
  4. Under Data access, choose Manage data access.
  5. Choose Create access policy.
  6. In the Name and description section, specify an access policy name, add a description, and select JSON as the policy definition method.
  7. Add the following policy in the JSON editor. Provide the collection name and index you specified during the delivery stream creation in the policy. Provide the IAM role name that you got from the permissions page of the Firehose delivery stream, and the account ID for your AWS account.
    [
      {
        "Rules": [
          {
            "ResourceType": "index",
            "Resource": [
              "index/<collection-name>/<index-name>"
            ],
            "Permission": [
              "aoss:WriteDocument",
              "aoss:CreateIndex",
              "aoss:UpdateIndex"
            ]
          }
        ],
        "Principal": [
          "arn:aws:sts::<aws-account-id>:assumed-role/<IAM-role-name>/*"
        ]
      }
    ]

  8. Choose Create.

The following graphic gives a quick demonstration of creating the data access policy via the preceding steps.

Set up VPC flow logs

In the final step of this post, you enable flow logs for your VPC with the destination as Kinesis Data Firehose, which sends the data to OpenSearch Serverless.

  1. Navigate to the AWS Management Console.
  2. Search for “VPC” and then choose Your VPCs in the search result (hover over the VPC rectangle to reveal the link).
  3. Choose the VPC ID link for one of your VPCs.
  4. On the Flow Logs tab, choose Create flow log.
  5. For Name, enter a name.
  6. Leave the Filter set to All. You can limit the traffic by selecting Accept or Reject.
  7. Under Destination, select Send to Kinesis Firehose in the same account.
  8. For Kinesis Firehose delivery stream name, choose vpc-flow-logs.
  9. Choose Create flow log.

The following graphic gives a quick demonstration of creating a flow log for your VPC following the preceding steps.

Examine the VPC flow logs data in your collection using OpenSearch Dashboards

You won’t be able to access your collection data until you configure data access. Data access policies allow users to access the actual data within a collection.

To create a data access policy for OpenSearch Dashboards, complete the following steps:

  1. Navigate to the vpc-flow-logs collection details page on the OpenSearch Serverless dashboard.
  2. Under Data access, choose Manage data access.
  3. Choose Create access policy.
  4. In the Name and description section, specify an access policy name, add a description, and select JSON as the policy definition method.
  5. Add the following policy in the JSON editor. Provide the collection name and index you specified during the delivery stream creation in the policy. Additionally, provide the IAM user and the account ID for your AWS account. You need to make sure that you have the AWS access and secret keys for the principal that you specified as an IAM user.
    [
      {
        "Rules": [
          {
            "Resource": [
              "index/<collection-name>/<index-name>"
            ],
            "Permission": [
              "aoss:ReadDocument"
            ],
            "ResourceType": "index"
          }
        ],
        "Principal": [
          "arn:aws:iam::<aws-account-id>:user/<IAM-user-name>"
        ]
      }
    ]

  6. Choose Create.
  7. Navigate to OpenSearch Serverless and choose the collection you created (vpc-flow-logs).
  8. Choose the OpenSearch Dashboards URL and log in with your IAM access key and secret key for the user you specified under Principal.
  9. Navigate to dev tools within OpenSearch Dashboards and run the following query to retrieve the VPC flow logs for your VPC:
    GET <index-name>/_search
    {
      "query": {
        "match_all": {}
      }
    }

The query returns the data as shown in the following screenshot, which contains information such as account ID, interface ID, source IP address, destination IP address, and more.

Create dashboards

After the data is flowing into OpenSearch Serverless, you can easily create dashboards to monitor the activity in your VPC. The following example dashboard shows overall traffic, accepted and rejected traffic, bytes transmitted, and some charts with the top sources and destinations.

Clean up

If you don’t want to continue using the solution, be sure to delete the resources you created:

  1. Return to the AWS console and in the VPCs section, disable the flow logs for your VPC.
  2. In the OpenSearch Serverless dashboard, delete your vpc-flow-logs collection.
  3. On the Kinesis Data Firehose console, delete your vpc-flow-logs delivery stream.

Conclusion

In this post, you created an end-to-end serverless pipeline to deliver your VPC flow logs to OpenSearch Serverless using Kinesis Data Firehose. In this example, you built a delivery pipeline for your VPC flow logs, but you can also use Kinesis Data Firehose to send logs from Amazon Kinesis Data Streams and Amazon CloudWatch, which in turn can be sent to OpenSearch Serverless collections for running analytics on those logs. With serverless solutions on AWS, you can focus on your application development rather than worrying about the ingestion pipeline and tools to visualize your logs.

Get hands-on with OpenSearch Serverless by taking the Getting Started with Amazon OpenSearch Serverless workshop and check out other pipelines for analyzing your logs.

If you have feedback about this post, share it in the comments section. If you have questions about this post, start a new thread on the Amazon OpenSearch Service forum or contact AWS Support.


About the authors

Jon Handler (@_searchgeek) is a Principal Solutions Architect at Amazon Web Services based in Palo Alto, CA. Jon works closely with the CloudSearch and Elasticsearch teams, providing help and guidance to a broad range of customers who have search workloads that they want to move to the AWS Cloud. Prior to joining AWS, Jon’s career as a software developer included four years of coding a large-scale, eCommerce search engine.

Prashant Agrawal is a Sr. Search Specialist Solutions Architect with Amazon OpenSearch Service. He works closely with customers to help them migrate their workloads to the cloud and helps existing customers fine-tune their clusters to achieve better performance and save on cost. Before joining AWS, he helped various customers use OpenSearch and Elasticsearch for their search and log analytics use cases. When not working, you can find him traveling and exploring new places. In short, he likes doing Eat → Travel → Repeat.

Create more partitions and retain data for longer in your MSK Serverless clusters

Post Syndicated from Usama Naseem original https://aws.amazon.com/blogs/big-data/create-more-partitions-and-retain-data-for-longer-in-your-msk-serverless-clusters/

In April 2022, Amazon Managed Streaming for Apache Kafka (Amazon MSK) launched an exciting new capability, Amazon MSK Serverless. Amazon MSK is a fully managed service for Apache Kafka that makes it easier for developers to build and run highly available, secure, and scalable applications based on Apache Kafka. With MSK Serverless, developers can run their applications without having to provision, configure, or optimize their Apache Kafka clusters. MSK Serverless automatically provisions and scales compute and storage resources, so developers have access to on-demand streaming capacity and storage.

Over the remainder of 2022, the team collected customer feedback and worked backward from customer requirements to add new capabilities that made MSK Serverless even better. In this post, we discuss a few of these enhancements in detail and provide an example use case.

Higher default quota for partitions in a cluster

Data in Apache Kafka is written to topics, which can be partitioned into multiple log files called partitions. When a producer application writes data to a topic, it is appended to one of these partitions. MSK Serverless launched with a maximum quota of 120 partitions per cluster. However, our customers told us that they needed more partitions per cluster for a variety of use cases, ranging from change data capture (CDC) to faster real-time data processing.

In December 2022, we increased the default quota for partitions for MSK Serverless clusters. With the increased quota, you can create up to 2,400 partitions per cluster. The 20-fold increase in the number of partitions you can have per cluster lets you create more topics per cluster and have more applications consume data in parallel. You can also implement better isolation of data with fine-grained access control. More partitions are particularly useful for CDC use cases where each table in the database has hundreds of unqiue keys, which are each mapped to a unique partition. With more partitions, you can use MSK Serverless for capturing changes in larger databases with lots of tables and hundreds of keys. Note that the 2,400 limit only applies to leader partitions. MSK Serverless creates two replicas of each partition by default at no additional cost that don’t count towards this limit.

Unlimited data retention duration

The data you produce to your topics can be retained in Apache Kafka for a configurable duration, depending on how long you need to access data using Apache Kafka consumer APIs. Typically, customers retain data for short periods of time, ranging from a few hours to a few days. Previously, MSK Serverless limited data retention to a maximum of 24 hours (1 day), which is sufficient for most popular Apache Kafka use cases. However, some use cases require customers to retain data for longer, such as retaining data for audit purposes or maintaining application recovery SLAs.

Now, with the increase in the data retention duration quota, you can retain data for as long as you need in your MSK Serverless clusters. Longer data retention is particularly useful for use cases where your consumer applications need quick access to older data. For instance, in the case of a failure, the application may need to access data from the start of the topic to reconstruct its state. Because you can now retain data in your topics for longer durations, you can restore your application’s state by accessing older data using Kafka’s consumer API, making it easier to recover from such failures. After the application recovers, you can configure your application to start consuming the data from the earliest timestamp you need to reestablish your application’s state. Note that you can only retain up to 250 GB of data per partition. As long as your partition doesn’t reach 250 GB in size, you may retain it for as long as you wish. You may create more partitions if you need more storage for a given topic.

These new quotas are available in all Regions where MSK Serverless is available. For more information, navigate to the MSK Serverless tab on the Amazon MSK pricing page and choose the Region drop-down menu.

You can also request an increase to the maximum number of partitions quota by contacting AWS Support if you need more than 2,400 partitions in a cluster. The quotas for more partitions and longer retention are applied to both existing and new clusters.

Getting started: Create a topic with 1,000 partitions and 7-day retention

In this section, we demonstrate how to create a topic in MSK Serverless, specify the number of partitions, and set its retention duration.

As a prerequisite, you must have an MSK Serverless cluster and an Apache Kafka client. Refer to Getting started using MSK Serverless clusters for step-by-step instructions.

  1. On your client machine, access kafka_2.12-2.8.1/bin and run the following export command (replace the ‘my-endpoint’ with the bootstrap server string of your MSK Serverless cluster):
    export BS=my-endpoint

  2. Run the following command to create a topic called msk-sample-topic with 1,000 partitions and 7-day data retention (604,800,000 milliseconds):
    <path-to-your-kafka-installation>/bin/kafka-topics.sh 
    --bootstrap-server $BS 
    --command-config client.properties 
    --create 
    --topic msk-sample-topic 
    --partitions 1000 
    --config retention.ms=604800000

  3. (Optional) Run the following command to view the details of the topic you created in step 2 above:
    <path-to-your-kafka-installation>/bin/kafka-topics.sh 
    --bootstrap-server $BS
    --command-config client.properties 
    --topic msk-sample-topic 
    --describe | head -n1

    You will see the following result:

    Topic: msk-sample-topic TopicId: Ze76LY9EQuiH0xOIenx_HA PartitionCount: 1000ReplicationFactor: 3    Configs: min.insync.replicas=2,segment.bytes=134217728,retention.ms=604800000,message.format.version=2.8-IV2,unclean.leader.election.enable=false,retention.bytes=268435456000

Clean up

To avoid incurring charges on the AWS resources created in this post, delete the MSK Serverless cluster and the Amazon Elastic Compute Cloud (Amazon EC2) instance for your client machine.

  1. On the Amazon MSK console, select the MSK Serverless cluster you used for this solution.
  2. Choose Actions, then choose Delete.
  3. On the Amazon EC2 console, select the instance that you created for your Apache Kafka client machine.
  4. Choose Instance state, then choose Terminate instance.

Conclusion

This post demonstrated how to create an MSK Serverless cluster topic with 1,000 partitions and 7-day retention. With the new quota increases, you can create up to 2,400 partitions per cluster and retain data for as long as you need. If you have comments or feedback, please feel free to leave them in the comments.


About the author

Usama Naseem is a Senior Product Manager for Amazon MSK and focuses on MSK Serverless. Previously, he held product management roles for AWS Lambda and Amazon Fresh. He is passionate about giving customers the tools to build real-time applications in the cloud. Outside of work, he continues to be under the delusion that he will be the best squash player in the world one day.

Run Apache Spark workloads 3.5 times faster with Amazon EMR 6.9

Post Syndicated from Sekar Srinivasan original https://aws.amazon.com/blogs/big-data/run-apache-spark-workloads-3-5-times-faster-with-amazon-emr-6-9/

The Amazon EMR runtime for Apache Spark is a performance-optimized runtime for Apache Spark that is 100% API compatible with open-source Apache Spark. With Amazon EMR release 6.9.0, the EMR runtime for Apache Spark supports equivalent Spark version 3.3.0.

With Amazon EMR 6.9.0, you can now run your Apache Spark 3.x applications faster and at lower cost without requiring any changes to your applications. In our performance benchmark tests, derived from TPC-DS performance tests at 3 TB scale, we found the EMR runtime for Apache Spark 3.3.0 provides a 3.5 times (using total runtime) performance improvement on average over open-source Apache Spark 3.3.0.

In this post, we analyze the results from our benchmark tests running a TPC-DS application on open-source Apache Spark and then on Amazon EMR 6.9, which comes with an optimized Spark runtime that is compatible with open-source Spark. We walk through a detailed cost analysis and finally provide step-by-step instructions to run the benchmark.

Results observed

To evaluate the performance improvements, we used an open-source Spark performance test utility that is derived from the TPC-DS performance test toolkit. We ran the tests on a seven-node (six core nodes and one primary node) c5d.9xlarge EMR cluster with the EMR runtime for Apache Spark, and a second seven-node self-managed cluster on Amazon Elastic Compute Cloud (Amazon EC2) with the equivalent open-source version of Spark. We ran both the tests with data in Amazon Simple Storage Service (Amazon S3).

Dynamic Resource Allocation (DRA) is a great feature to use for varying workloads. However, for a benchmarking exercise where we compare two platforms purely on performance, and test data volumes don’t change (3 TB in our case), we believe it’s best to avoid variability in order to run an apples-to-apples comparison. In our tests in both open-source Spark and Amazon EMR, we disabled DRA while running the benchmarking application.

The following table shows the total job runtime for all queries (in seconds) in the 3 TB query dataset between Amazon EMR version 6.9.0 and open-source Spark version 3.3.0. We observed that our TPC-DS tests had a total job runtime on Amazon EMR on Amazon EC2 that was 3.5 times faster than that using an open-source Spark cluster of the same configuration.

The per-query speedup on Amazon EMR 6.9 with and without the EMR runtime for Apache Spark is illustrated in the following chart. The horizontal axis shows each query in the 3 TB benchmark. The vertical axis shows the speedup of each query due to the EMR runtime. Notable performance gains are over 10 times faster for TPC-DS queries 24b, 72, 95, and 96.

Cost analysis

The performance improvements of the EMR runtime for Apache Spark directly translate to lower costs. We were able to realize a 67% cost savings running the benchmark application on Amazon EMR in comparison with the cost incurred to run the same application on open-source Spark on Amazon EC2 with the same cluster sizing due to reduced hours of Amazon EMR and Amazon EC2 usage. Amazon EMR pricing is for EMR applications running on EMR clusters with EC2 instances. The Amazon EMR price is added to the underlying compute and storage prices such as EC2 instance price and Amazon Elastic Block Store (Amazon EBS) cost (if attaching EBS volumes). Overall, the estimated benchmark cost in the US East (N. Virginia) Region is $27.01 per run for the open-source Spark on Amazon EC2 and $8.82 per run for Amazon EMR.

Benchmark Job Runtime (Hour) Estimated Cost Total EC2 Instance Total vCPU Total Memory (GiB) Root Device (Amazon EBS)

Open-source Spark on Amazon EC2

(1 primary and 6 core nodes)

2.23 $27.01 7 252 504 20 GiB gp2

Amazon EMR on Amazon EC2

(1 primary and 6 core nodes)

0.63 $8.82 7 252 504 20 GiB gp2

Cost breakdown

The following is the cost breakdown for the open-source Spark on Amazon EC2 job ($27.01):

  • Total Amazon EC2 cost – (7 * $1.728 * 2.23) = (number of instances * c5d.9xlarge hourly rate * job runtime in hour) = $26.97
  • Amazon EBS cost – ($0.1/730 * 20 * 7 * 2.23) = (Amazon EBS per GB-hourly rate * root EBS size * number of instances * job runtime in hour) = $0.042

The following is the cost breakdown for the Amazon EMR on Amazon EC2 job ($8.82):

  • Total Amazon EMR cost – (7 * $0.27 * 0.63) = ((number of core nodes + number of primary nodes)* c5d.9xlarge Amazon EMR price * job runtime in hour) = $1.19
  • Total Amazon EC2 cost – (7 * $1.728 * 0.63) = ((number of core nodes + number of primary nodes)* c5d.9xlarge instance price * job runtime in hour) = $7.62
  • Amazon EBS cost – ($0.1/730 * 20 GiB * 7 * 0.63) = (Amazon EBS per GB-hourly rate * EBS size * number of instances * job runtime in hour) = $0.012

Set up OSS Spark benchmarking

In the following sections, we provide a brief outline of the steps involved in setting up the benchmarking. For detailed instructions with examples, refer to the GitHub repo.

For our OSS Spark benchmarking, we use the open-source tool Flintrock to launch our Amazon EC2-based Apache Spark cluster. Flintrock provides a quick way to launch an Apache Spark cluster on Amazon EC2 using the command line.

Prerequisites

Complete the following prerequisite steps:

  1. Have Python 3.7.x or above.
  2. Have Pip3 22.2.2 or above.
  3. Add the Python bin directory to your environment path. The Flintrock binary will be installed in this path.
  4. Run aws configure to configure your AWS Command Line Interface (AWS CLI) shell to point to the benchmarking account. Refer to Quick configuration with aws configure for instructions.
  5. Have a key pair with restrictive file permissions to access the OSS Spark primary node.
  6. Create a new S3 bucket in your test account if needed.
  7. Copy the TPC-DS source data as input to your S3 bucket.
  8. Build the benchmark application following the steps provided in Steps to build spark-benchmark-assembly application. Alternatively, you can download a pre-built spark-benchmark-assembly-3.3.0.jar if you want a Spark 3.3.0-based application.

Deploy the Spark cluster and run the benchmark job

Complete the following steps:

  1. Install the Flintrock tool via pip as shown in Steps to setup OSS Spark Benchmarking.
  2. Run the command flintrock configure, which pops up a default configuration file.
  3. Modify the default config.yaml file based on your needs. Alternatively, copy and paste the config.yaml file content to the default configure file. Then save the file to where it was.
  4. Finally, launch the 7-node Spark cluster on Amazon EC2 via Flintrock.

This should create a Spark cluster with one primary node and six worker nodes. If you see any error messages, double-check the config file values, especially the Spark and Hadoop versions and the attributes of download-source and the AMI.

The OSS Spark cluster doesn’t come with YARN resource manager. To enable it, we need to configure the cluster.

  1. Download the yarn-site.xml and enable-yarn.sh files from the GitHub repo.
  2. Replace <private ip of primary node> with the IP address of the primary node in your Flintrock cluster.

You can retrieve the IP address from the Amazon EC2 console.

  1. Upload the files to all the nodes of the Spark cluster.
  2. Run the enable-yarn script.
  3. Enable Snappy support in Hadoop (the benchmark job reads Snappy compressed data).
  4. Download the benchmark utility application JAR file spark-benchmark-assembly-3.3.0.jar to your local machine.
  5. Copy this file to the cluster.
  6. Log in to the primary node and start YARN.
  7. Submit the benchmark job on the open-source Spark cluster as shown in Submit the benchmark job.

Summarize the results

Download the test result file from the output S3 bucket s3://$YOUR_S3_BUCKET/EC2_TPCDS-TEST-3T-RESULT/timestamp=xxxx/summary.csv/xxx.csv. (Replace $YOUR_S3_BUCKET with your S3 bucket name.) You can use the Amazon S3 console and navigate to the output S3 location or use the AWS CLI.

The Spark benchmark application creates a timestamp folder and writes a summary file inside a summary.csv prefix. Your timestamp and file name will be different from the one shown in the preceding example.

The output CSV files have four columns without header names. They are:

  • Query name
  • Median time
  • Minimum time
  • Maximum time

The following screenshot shows a sample output. We have manually added column names. The way we calculate the geomean and the total job runtime is based on arithmetic means. We first take the mean of the med, min, and max values using the formula AVERAGE(B2:D2). Then we take a geometric mean of the Avg column using the formula GEOMEAN(E2:E105).

Set up Amazon EMR benchmarking

For detailed instructions, see Steps to setup EMR Benchmarking.

Prerequisites

Complete the following prerequisite steps:

  1. Run aws configure to configure your AWS CLI shell to point to the benchmarking account. Refer to Quick configuration with aws configure for instructions.
  2. Upload the benchmark application to Amazon S3.

Deploy the EMR cluster and run the benchmark job

Complete the following steps:

  1. Spin up Amazon EMR in your AWS CLI shell using command line as shown in Deploy EMR Cluster and run benchmark job.
  2. Configure Amazon EMR with one primary (c5d.9xlarge) and six core (c5d.9xlarge) nodes. Refer to create-cluster for a detailed description of AWS CLI options.
  3. Store the cluster ID from the response. You need this in the next step.
  4. Submit the benchmark job in Amazon EMR using add-steps in the AWS CLI.

Summarize the results

Summarize the results from the output bucket s3://$YOUR_S3_BUCKET/blog/EMRONEC2_TPCDS-TEST-3T-RESULT in the same manner as we did for the OSS results and compare.

Clean up

To avoid incurring future charges, delete the resources you created using the instructions in the Cleanup section of the GitHub repo.

  1. Stop the EMR and OSS Spark clusters. You may also delete them if you don’t want to retain the content. You can delete these resources by running the script cleanup-benchmark-env.sh from a terminal in your benchmark environment.
  2. If you used AWS Cloud9 as your IDE for building the benchmark application JAR file using Steps to build spark-benchmark-assembly application, you may want to delete the environment as well.

Conclusion

You can run your Apache Spark workloads 3.5 times (based on total runtime) faster and at lower cost without making any changes to your applications by using Amazon EMR 6.9.0.

To keep up to date, subscribe to the Big Data Blog’s RSS feed to learn more about the EMR runtime for Apache Spark, configuration best practices, and tuning advice.

For past benchmark tests, see Run Apache Spark 3.0 workloads 1.7 times faster with Amazon EMR runtime for Apache Spark. Note that the past benchmark result of 1.7 times performance was based on geometric mean. Based on geometric mean, the performance in Amazon EMR 6.9 was two times faster.


About the authors

Sekar Srinivasan is a Sr. Specialist Solutions Architect at AWS focused on Big Data and Analytics. Sekar has over 20 years of experience working with data. He is passionate about helping customers build scalable solutions modernizing their architecture and generating insights from their data. In his spare time he likes to work on non-profit projects, especially those focused on underprivileged Children’s education.

Prabu Ravichandran is a Senior Data Architect with Amazon Web Services, focussed on Analytics, data Lake architecture and implementation. He helps customers architect and build scalable and robust solutions using AWS services. In his free time, Prabu enjoys traveling and spending time with family.
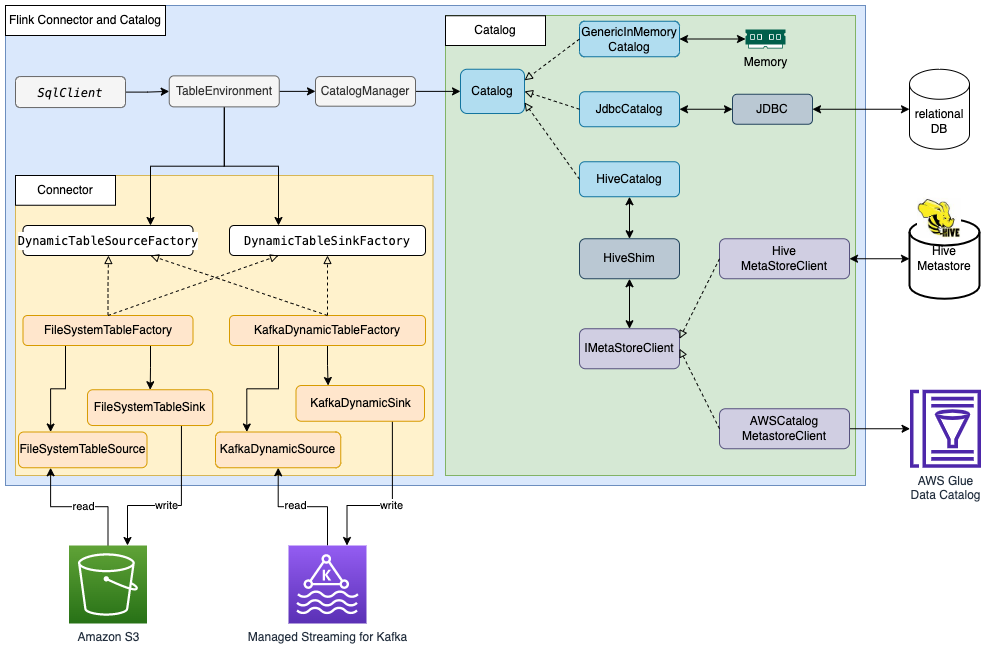
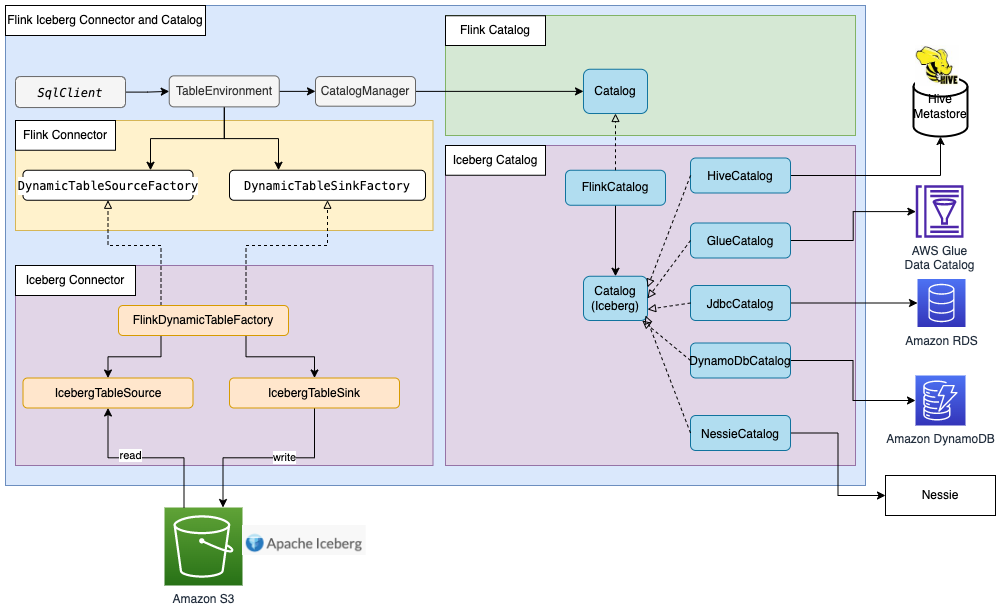
Build a data lake with Apache Flink on Amazon EMR

Post Syndicated from Jianwei Li original https://aws.amazon.com/blogs/big-data/build-a-unified-data-lake-with-apache-flink-on-amazon-emr/

To build a data-driven business, it is important to democratize enterprise data assets in a data catalog. With a unified data catalog, you can quickly search datasets and figure out data schema, data format, and location. The AWS Glue Data Catalog provides a uniform repository where disparate systems can store and find metadata to keep track of data in data silos.

Apache Flink is a widely used data processing engine for scalable streaming ETL, analytics, and event-driven applications. It provides precise time and state management with fault tolerance. Flink can process bounded stream (batch) and unbounded stream (stream) with a unified API or application. After data is processed with Apache Flink, downstream applications can access the curated data with a unified data catalog. With unified metadata, both data processing and data consuming applications can access the tables using the same metadata.

This post shows you how to integrate Apache Flink in Amazon EMR with the AWS Glue Data Catalog so that you can ingest streaming data in real time and access the data in near-real time for business analysis.

Apache Flink connector and catalog architecture

Apache Flink uses a connector and catalog to interact with data and metadata. The following diagram shows the architecture of the Apache Flink connector for data read/write, and catalog for metadata read/write.

Flink Glue Architecture

For data read/write, Flink has the interface DynamicTableSourceFactory for read and DynamicTableSinkFactory for write. A different Flink connector implements two interfaces to access data in different storage. For example, the Flink FileSystem connector has FileSystemTableFactory to read/write data in Hadoop Distributed File System (HDFS) or Amazon Simple Storage Service (Amazon S3), the Flink HBase connector has HBase2DynamicTableFactory to read/write data in HBase, and the Flink Kafka connector has KafkaDynamicTableFactory to read/write data in Kafka. You can refer to Table & SQL Connectors for more information.

For metadata read/write, Flink has the catalog interface. Flink has three built-in implementations for the catalog. GenericInMemoryCatalog stores the catalog data in memory. JdbcCatalog stores the catalog data in a JDBC-supported relational database. As of this writing, MySQL and PostgreSQL databases are supported in the JDBC catalog. HiveCatalog stores the catalog data in Hive Metastore. HiveCatalog uses HiveShim to provide different Hive version compatibility. We can configure different metastore clients to use Hive Metastore or the AWS Glue Data Catalog. In this post, we configure the Amazon EMR property hive.metastore.client.factory.class to com.amazonaws.glue.catalog.metastore.AWSGlueDataCatalogHiveClientFactory (see Using the AWS Glue Data Catalog as the metastore for Hive) so that we can use the AWS Glue Data Catalog to store Flink catalog data. Refer to Catalogs for more information.

Most Flink built-in connectors, such as for Kafka, Amazon Kinesis, Amazon DynamoDB, Elasticsearch, or FileSystem, can use Flink HiveCatalog to store metadata in the AWS Glue Data Catalog. However, some connector implementations such as Apache Iceberg have their own catalog management mechanism. FlinkCatalog in Iceberg implements the catalog interface in Flink. FlinkCatalog in Iceberg has a wrapper to its own catalog implementation. The following diagram shows the relationship between Apache Flink, the Iceberg connector, and the catalog. For more information, refer to Creating catalogs and using catalogs and Catalogs.

Flink Iceberg Glue Architecture

Apache Hudi also has its own catalog management. Both HoodieCatalog and HoodieHiveCatalog implements a catalog interface in Flink. HoodieCatalog stores metadata in a file system such as HDFS. HoodieHiveCatalog stores metadata in Hive Metastore or the AWS Glue Data Catalog, depending on whether you configure hive.metastore.client.factory.class to use com.amazonaws.glue.catalog.metastore.AWSGlueDataCatalogHiveClientFactory. The following diagram shows relationship between Apache Flink, the Hudi connector, and the catalog. For more information, refer to Create Catalog.

Flink Hudi Glue Architecture

Because Iceberg and Hudi have different catalog management mechanisms, we show three scenarios of Flink integration with the AWS Glue Data Catalog in this post:

  • Read/Write to Iceberg tables in Flink with metadata in Glue Data Catalog
  • Read/Write to Hudi tables in Flink with metadata in Glue Data Catalog
  • Read/Write to other storage format in Flink with metadata in Glue Data Catalog

Solution overview

The following diagram shows the overall architecture of the solution described in this post.

Flink Glue Integration

In this solution, we enable an Amazon RDS for MySQL binlog to extract transaction changes in real time. The Amazon EMR Flink CDC connector reads the binlog data and processes the data. Transformed data can be stored in Amazon S3. We use the AWS Glue Data Catalog to store the metadata such as table schema and table location. Downstream data consumer applications such as Amazon Athena or Amazon EMR Trino access the data for business analysis.

The following are the high-level steps to set up this solution:

  1. Enable binlog for Amazon RDS for MySQL and initialize the database.
  2. Create an EMR cluster with the AWS Glue Data Catalog.
  3. Ingest change data capture (CDC) data with Apache Flink CDC in Amazon EMR.
  4. Store the processed data in Amazon S3 with metadata in the AWS Glue Data Catalog.
  5. Verify all table metadata is stored in the AWS Glue Data Catalog.
  6. Consume data with Athena or Amazon EMR Trino for business analysis.
  7. Update and delete source records in Amazon RDS for MySQL and validate the reflection of the data lake tables.

Prerequisites

This post uses an AWS Identity and Access Management (IAM) role with permissions for the following services:

  • Amazon RDS for MySQL (5.7.40)
  • Amazon EMR (6.9.0)
  • Amazon Athena
  • AWS Glue Data Catalog
  • Amazon S3

Enable binlog for Amazon RDS for MySQL and initialize the database

To enable CDC in Amazon RDS for MySQL, we need to configure binary logging for Amazon RDS for MySQL. Refer to Configuring MySQL binary logging for more information. We also create the database salesdb in MySQL and create the tables customer, order, and others to set up the data source.

  1. On the Amazon RDS console, choose Parameter groups in the navigation pane.
  2. Create a new parameter group for MySQL.
  3. Edit the parameter group you just created to set binlog_format=ROW.

RDS-Binlog-Format

  1. Edit the parameter group you just created to set binlog_row_image=full.

RDS-Binlog-Row-Image

  1. Create an RDS for MySQL DB instance with the parameter group.
  2. Note down the values for hostname, username, and password, which we use later.
  3. Download the MySQL database initialization script from Amazon S3 by running the following command:
aws s3 cp s3://emr-workshops-us-west-2/glue_immersion_day/scripts/salesdb.sql ./salesdb.sql
  1. Connect to the RDS for MySQL database and run the salesdb.sql command to initialize the database, providing the host name and user name according to your RDS for MySQL database configuration:
mysql -h <hostname> -u <username> -p
mysql> source salesdb.sql

Create an EMR cluster with the AWS Glue Data Catalog

From Amazon EMR 6.9.0, the Flink table API/SQL can integrate with the AWS Glue Data Catalog. To use the Flink and AWS Glue integration, you must create an Amazon EMR 6.9.0 or later version.

  1. Create the file iceberg.properties for the Amazon EMR Trino integration with the Data Catalog. When the table format is Iceberg, your file should have following content:
iceberg.catalog.type=glue
connector.name=iceberg
  1. Upload iceberg.properties to an S3 bucket, for example DOC-EXAMPLE-BUCKET.

For more information on how to integrate Amazon EMR Trino with Iceberg, refer to Use an Iceberg cluster with Trino.

  1. Create the file trino-glue-catalog-setup.sh to configure the Trino integration with the Data Catalog. Use trino-glue-catalog-setup.sh as the bootstrap script. Your file should have the following content (replace DOC-EXAMPLE-BUCKET with your S3 bucket name):
set -ex 
sudo aws s3 cp s3://DOC-EXAMPLE-BUCKET/iceberg.properties /etc/trino/conf/catalog/iceberg.properties

  1. Upload trino-glue-catalog-setup.sh to your S3 bucket (DOC-EXAMPLE-BUCKET).

Refer to Create bootstrap actions to install additional software to run a bootstrap script.

  1. Create the file flink-glue-catalog-setup.sh to configure the Flink integration with the Data Catalog.
  2. Use a script runner and run the flink-glue-catalog-setup.sh script as a step function.

Your file should have the following content (the JAR file name here is using Amazon EMR 6.9.0; a later version JAR name may change, so make sure to update according to your Amazon EMR version).

Note that here we use an Amazon EMR step, not a bootstrap, to run this script. An Amazon EMR step script is run after Amazon EMR Flink is provisioned.

set -ex

sudo cp /usr/lib/hive/auxlib/aws-glue-datacatalog-hive3-client.jar /usr/lib/flink/lib
sudo cp /usr/lib/hive/lib/antlr-runtime-3.5.2.jar /usr/lib/flink/lib
sudo cp /usr/lib/hive/lib/hive-exec.jar /lib/flink/lib
sudo cp /usr/lib/hive/lib/libfb303-0.9.3.jar /lib/flink/lib
sudo cp /usr/lib/flink/opt/flink-connector-hive_2.12-1.15.2.jar /lib/flink/lib
sudo chmod 755 /usr/lib/flink/lib/aws-glue-datacatalog-hive3-client.jar
sudo chmod 755 /usr/lib/flink/lib/antlr-runtime-3.5.2.jar
sudo chmod 755 /usr/lib/flink/lib/hive-exec.jar
sudo chmod 755 /usr/lib/flink/lib/libfb303-0.9.3.jar
sudo chmod 755 /usr/lib/flink/lib/flink-connector-hive_2.12-1.15.2.jar

sudo wget https://repo1.maven.org/maven2/com/ververica/flink-sql-connector-mysql-cdc/2.2.1/flink-sql-connector-mysql-cdc-2.2.1.jar -O /lib/flink/lib/flink-sql-connector-mysql-cdc-2.2.1.jar
sudo chmod 755 /lib/flink/lib/flink-sql-connector-mysql-cdc-2.2.1.jar

sudo ln -s /usr/share/aws/iceberg/lib/iceberg-flink-runtime.jar /usr/lib/flink/lib/
sudo ln -s /usr/lib/hudi/hudi-flink-bundle.jar /usr/lib/flink/lib/

sudo mv /usr/lib/flink/opt/flink-table-planner_2.12-1.15.2.jar /usr/lib/flink/lib/
sudo mv /usr/lib/flink/lib/flink-table-planner-loader-1.15.2.jar /usr/lib/flink/opt/
  1. Upload flink-glue-catalog-setup.sh to your S3 bucket (DOC-EXAMPLE-BUCKET).

Refer to Configuring Flink to Hive Metastore in Amazon EMR for more information on how to configure Flink and Hive Metastore. Refer to Run commands and scripts on an Amazon EMR cluster for more details on running the Amazon EMR step script.

  1. Create an EMR 6.9.0 cluster with the applications Hive, Flink, and Trino.

You can create an EMR cluster with the AWS Command Line Interface (AWS CLI) or the AWS Management Console. Refer to the appropriate subsection for instructions.

Create an EMR cluster with the AWS CLI

To use the AWS CLI, complete the following steps:

  1. Create the file emr-flink-trino-glue.json to configure Amazon EMR to use the Data Catalog. Your file should have the following content:
[
{
"Classification": "hive-site",
"Properties": {
"hive.metastore.client.factory.class": "com.amazonaws.glue.catalog.metastore.AWSGlueDataCatalogHiveClientFactory"
}
},
{
"Classification": "trino-connector-hive",
"Properties": {
"hive.metastore": "glue"
}
}
]
  1. Run the following command to create the EMR cluster. Provide your local emr-flink-trino-glue.json parent folder path, S3 bucket, EMR cluster Region, EC2 key name, and S3 bucket for EMR logs.
aws emr create-cluster --release-label emr-6.9.0 \
--applications Name=Hive Name=Flink Name=Spark Name=Trino \
--region us-west-2 \
--name flink-trino-glue-emr69 \
--configurations "file:///<your configuration path>/emr-flink-trino-glue.json" \
--bootstrap-actions '[{"Path":"s3://DOC-EXAMPLE-BUCKET/trino-glue-catalog-setup.sh","Name":"Add iceberg.properties for Trino"}]' \
--steps '[{"Args":["s3://DOC-EXAMPLE-BUCKET/flink-glue-catalog-setup.sh"],"Type":"CUSTOM_JAR","ActionOnFailure":"CONTINUE","Jar":"s3://<region>.elasticmapreduce/libs/script-runner/script-runner.jar","Properties":"","Name":"Flink-glue-integration"}]' \
--instance-groups \
InstanceGroupType=MASTER,InstanceType=m6g.2xlarge,InstanceCount=1 \
InstanceGroupType=CORE,InstanceType=m6g.2xlarge,InstanceCount=2 \
--use-default-roles \
--ebs-root-volume-size 30 \
--ec2-attributes KeyName=<keyname> \
--log-uri s3://<s3-bucket-for-emr>/elasticmapreduce/

Create an EMR cluster on the console

To use the console, complete the following steps:

  1. On the Amazon EMR console, create an EMR cluster and select Use for Hive table metadata for AWS Glue Data Catalog settings.
  2. Add configuration settings with the following code:
[
{
"Classification": "trino-connector-hive",
"Properties": {
"hive.metastore": "glue"
}
}
]

EMR-6.9-Flink-Hive-Glue-1

  1. In the Steps section, add a step called Custom JAR.
  2. Set JAR location to s3://<region>.elasticmapreduce/libs/script-runner/script-runner.jar, where <region> is the region in which your EMR cluster resides.
  3. Set Arguments to the S3 path you uploaded earlier.

EMR-6.9-Flink-Hive-Glue-2

  1. In the Bootstrap Actions section, choose Custom Action.
  2. Set Script location to the S3 path you uploaded.

EMR-6.9-Flink-Hive-Glue-3

  1. Continue the subsequent steps to complete your EMR cluster creation.

Ingest CDC data with Apache Flink CDC in Amazon EMR

The Flink CDC connector supports reading database snapshots and captures updates in the configured tables. We have deployed the Flink CDC connector for MySQL by downloading flink-sql-connector-mysql-cdc-2.2.1.jar and putting it into the Flink library when we create our EMR cluster. The Flink CDC connector can use the Flink Hive catalog to store Flink CDC table schema into Hive Metastore or the AWS Glue Data Catalog. In this post, we use the Data Catalog to store our Flink CDC table.

Complete the following steps to ingest RDS for MySQL databases and tables with Flink CDC and store metadata in the Data Catalog:

  1. SSH to the EMR primary node.
  2. Start Flink on a YARN session by running the following command, providing your S3 bucket name:
flink-yarn-session -d -jm 2048 -tm 4096 -s 2 \
-D state.backend=rocksdb \
-D state.backend.incremental=true \
-D state.checkpoint-storage=filesystem \
-D state.checkpoints.dir=s3://<flink-glue-integration-bucket>/flink-checkponts/ \
-D state.checkpoints.num-retained=10 \
-D execution.checkpointing.interval=10s \
-D execution.checkpointing.mode=EXACTLY_ONCE \
-D execution.checkpointing.externalized-checkpoint-retention=RETAIN_ON_CANCELLATION \
-D execution.checkpointing.max-concurrent-checkpoints=1
  1. Start the Flink SQL client CLI by running the following command:
/usr/lib/flink/bin/sql-client.sh embedded
  1. Create the Flink Hive catalog by specifying the catalog type as hive and providing your S3 bucket name:
CREATE CATALOG glue_catalog WITH (
'type' = 'hive',
'default-database' = 'default',
'hive-conf-dir' = '/etc/hive/conf.dist'
);
USE CATALOG glue_catalog;
CREATE DATABASE IF NOT EXISTS flink_cdc_db WITH ('hive.database.location-uri'= 's3://<flink-glue-integration-bucket>/flink-glue-for-hive/warehouse/')
use flink_cdc_db;

Because we’re configuring the EMR Hive catalog use the AWS Glue Data Catalog, all the databases and tables created in the Flink Hive catalog are stored in the Data Catalog.

  1. Create the Flink CDC table, providing the host name, user name, and password for the RDS for MySQL instance you created earlier.

Note that because the RDS for MySQL user name and password will be stored in the Data Catalog as table properties, you should be enable AWS Glue database/table authorization with AWS Lake Formation to protect your sensitive data.

CREATE TABLE `glue_catalog`.`flink_cdc_db`.`customer_cdc` (
`CUST_ID` double NOT NULL,
`NAME` STRING NOT NULL,
`MKTSEGMENT` STRING NOT NULL,
PRIMARY KEY (`CUST_ID`) NOT ENFORCED
) WITH (
'connector' = 'mysql-cdc',
'hostname' = '<hostname>',
'port' = '3306',
'username' = '<username>',
'password' = '<password>',
'database-name' = 'salesdb',
'table-name' = 'CUSTOMER'
);

CREATE TABLE `glue_catalog`.`flink_cdc_db`.`customer_site_cdc` (
`SITE_ID` double NOT NULL,
`CUST_ID` double NOT NULL,
`ADDRESS` STRING NOT NULL,
`CITY` STRING NOT NULL,
`STATE` STRING NOT NULL,
`COUNTRY` STRING NOT NULL,
`PHONE` STRING NOT NULL,
PRIMARY KEY (`SITE_ID`) NOT ENFORCED
) WITH (
'connector' = 'mysql-cdc',
'hostname' = '<hostname>',
'port' = '3306',
'username' = '<username>',
'password' = '<password>',
'database-name' = 'salesdb',
'table-name' = 'CUSTOMER_SITE'
);

CREATE TABLE `glue_catalog`.`flink_cdc_db`.`sales_order_all_cdc` (
`ORDER_ID` int NOT NULL,
`SITE_ID` double NOT NULL,
`ORDER_DATE` TIMESTAMP NOT NULL,
`SHIP_MODE` STRING NOT NULL
) WITH (
'connector' = 'mysql-cdc',
'hostname' = '<hostname>',
'port' = '3306',
'username' = '<username>',
'password' = '<password>',
'database-name' = 'salesdb',
'table-name' = 'SALES_ORDER_ALL',
'scan.incremental.snapshot.enabled' = 'FALSE'
);
  1. Query the table you just created:
SELECT count(O.ORDER_ID) AS ORDER_COUNT,
C.CUST_ID,
C.NAME,
C.MKTSEGMENT
FROM   customer_cdc C
JOIN customer_site_cdc CS
ON C.CUST_ID = CS.CUST_ID
JOIN sales_order_all_cdc O
ON O.SITE_ID = CS.SITE_ID
GROUP  BY C.CUST_ID,
C.NAME,
C.MKTSEGMENT;

You will get a query result like following screenshot.

Flink-SQL-CDC-Test

Store processed data in Amazon S3 with metadata in the Data Catalog

As we’re ingesting the relational database data in Amazon RDS for MySQL, raw data may be updated or deleted. To support data update and delete, we can choose data lake technologies such as Apache Iceberg or Apache Hudi to store the processed data. As we mentioned earlier, Iceberg and Hudi have different catalog management. We show both scenarios to use Flink to read/write the Iceberg and Hudi tables with metadata in the AWS Glue Data Catalog.

For non-Iceberg and non-Hudi, we use a FileSystem Parquet file to show how the Flink built-in connector uses the Data Catalog.

Read/Write to Iceberg tables in Flink with metadata in Glue Data Catalog

The following diagram shows the architecture for this configuration.

Flink Glue Integration for Iceberg

  1. Create a Flink Iceberg catalog using the Data Catalog by specifying catalog-impl as org.apache.iceberg.aws.glue.GlueCatalog.

For more information about Flink and Data Catalog integration for Iceberg, refer to Glue Catalog.

  1. In the Flink SQL client CLI, run the following command, providing your S3 bucket name:
CREATE CATALOG glue_catalog_for_iceberg WITH (
'type'='iceberg',
'warehouse'='s3://<flink-glue-integration-bucket>/flink-glue-for-iceberg/warehouse/',
'catalog-impl'='org.apache.iceberg.aws.glue.GlueCatalog',
'io-impl'='org.apache.iceberg.aws.s3.S3FileIO',
'lock-impl'='org.apache.iceberg.aws.glue.DynamoLockManager',
'lock.table'='FlinkGlue4IcebergLockTable' );
  1. Create an Iceberg table to store processed data:
USE CATALOG glue_catalog_for_iceberg;
CREATE DATABASE IF NOT EXISTS flink_glue_iceberg_db;
USE flink_glue_iceberg_db;
CREATE TABLE `glue_catalog_for_iceberg`.`flink_glue_iceberg_db`.`customer_summary` (
`CUSTOMER_ID` bigint,
`NAME` STRING,
`MKTSEGMENT` STRING,
`COUNTRY` STRING,
`ORDER_COUNT` BIGINT,
PRIMARY KEY (`CUSTOMER_ID`) NOT Enforced
)
WITH (
'format-version'='2',
'write.upsert.enabled'='true');
  1. Insert the processed data into Iceberg:
INSERT INTO `glue_catalog_for_iceberg`.`flink_glue_iceberg_db`.`customer_summary`
SELECT CAST(C.CUST_ID AS BIGINT) CUST_ID,
C.NAME,
C.MKTSEGMENT,
CS.COUNTRY,
count(O.ORDER_ID) AS ORDER_COUNT
FROM   `glue_catalog`.`flink_cdc_db`.`customer_cdc` C
JOIN `glue_catalog`.`flink_cdc_db`.`customer_site_cdc` CS
ON C.CUST_ID = CS.CUST_ID
JOIN `glue_catalog`.`flink_cdc_db`.`sales_order_all_cdc` O
ON O.SITE_ID = CS.SITE_ID
GROUP  BY C.CUST_ID,
C.NAME,
C.MKTSEGMENT,
CS.COUNTRY;

Read/Write to Hudi tables in Flink with metadata in Glue Data Catalog

The following diagram shows the architecture for this configuration.

Flink Glue Integration for Hudi

Complete the following steps:

  1. Create a catalog for Hudi to use the Hive catalog by specifying mode as hms.

Because we already configured Amazon EMR to use the Data Catalog when we created the EMR cluster, this Hudi Hive catalog uses the Data Catalog under the hood. For more information about Flink and Data Catalog integration for Hudi, refer to Create Catalog.

  1. In the Flink SQL client CLI, run the following command, providing your S3 bucket name:
CREATE CATALOG glue_catalog_for_hudi WITH (
'type' = 'hudi',
'mode' = 'hms',
'table.external' = 'true',
'default-database' = 'default',
'hive.conf.dir' = '/etc/hive/conf.dist',
'catalog.path' = 's3://<flink-glue-integration-bucket>/flink-glue-for-hudi/warehouse/'
);
  1. Create a Hudi table using the Data Catalog, and provide your S3 bucket name:
USE CATALOG glue_catalog_for_hudi;
CREATE DATABASE IF NOT EXISTS flink_glue_hudi_db;
use flink_glue_hudi_db;
CREATE TABLE `glue_catalog_for_hudi`.`flink_glue_hudi_db`.`customer_summary` (
`CUSTOMER_ID` bigint,
`NAME` STRING,
`MKTSEGMENT` STRING,
`COUNTRY` STRING,
`ORDER_COUNT` BIGINT,
PRIMARY KEY (`CUSTOMER_ID`) NOT Enforced
)
WITH (
'connector' = 'hudi',
'write.tasks' = '4',
'path' = 's3://<flink-glue-integration-bucket>/flink-glue-for-hudi/warehouse/customer_summary',
'table.type' = 'COPY_ON_WRITE',
'read.streaming.enabled' = 'true',
'read.streaming.check-interval' = '1'
);
  1. Insert the processed data into Hudi:
INSERT INTO `glue_catalog_for_hudi`.`flink_glue_hudi_db`.`customer_summary`
SELECT CAST(C.CUST_ID AS BIGINT) CUST_ID,
C.NAME,
C.MKTSEGMENT,
CS.COUNTRY,
count(O.ORDER_ID) AS ORDER_COUNT
FROM   `glue_catalog`.`flink_cdc_db`.`customer_cdc` C
JOIN `glue_catalog`.`flink_cdc_db`.`customer_site_cdc` CS
ON C.CUST_ID = CS.CUST_ID
JOIN `glue_catalog`.`flink_cdc_db`.`sales_order_all_cdc` O
ON O.SITE_ID = CS.SITE_ID
GROUP  BY C.CUST_ID,
C.NAME,
C.MKTSEGMENT,
CS.COUNTRY;

Read/Write to other storage format in Flink with metadata in Glue Data Catalog

The following diagram shows the architecture for this configuration.

Flink Glue Integration for Parquet

We already created the Flink Hive catalog in the previous step, so we’ll reuse that catalog.

  1. In the Flink SQL client CLI, run the following command:
USE CATALOG glue_catalog;
CREATE DATABASE IF NOT EXISTS flink_hive_parquet_db;
use flink_hive_parquet_db;

We change the SQL dialect to Hive to create a table with Hive syntax.

  1. Create a table with the following SQL, and provide your S3 bucket name:
SET table.sql-dialect=hive;

CREATE TABLE `customer_summary` (
`CUSTOMER_ID` bigint,
`NAME` STRING,
`MKTSEGMENT` STRING,
`COUNTRY` STRING,
`ORDER_COUNT` BIGINT
)
STORED AS parquet
LOCATION 's3://<flink-glue-integration-bucket>/flink-glue-for-hive-parquet/warehouse/customer_summary';

Because Parquet files don’t support updated rows, we can’t consume data from CDC data. However, we can consume data from Iceberg or Hudi.

  1. Use the following code to query the Iceberg table and insert data into the Parquet table:
SET table.sql-dialect=default;
SET execution.runtime-mode = batch;
INSERT INTO `glue_catalog`.`flink_hive_parquet_db`.`customer_summary`
SELECT * from `glue_catalog_for_iceberg`.`flink_glue_iceberg_db`.`customer_summary`;

Verify all table metadata is stored in the Data Catalog

You can navigate to the AWS Glue console to verify all the tables are stored in the Data Catalog.

  1. On the AWS Glue console, choose Databases in the navigation pane to list all the databases we created.

Glue-Databases

  1. Open a database and verify that all the tables are in that database.

Glue-Tables

Consume data with Athena or Amazon EMR Trino for business analysis

You can use Athena or Amazon EMR Trino to access the result data.

Query the data with Athena

To access the data with Athena, complete the following steps:

  1. Open the Athena query editor.
  2. Choose flink_glue_iceberg_db for Database.

You should see the customer_summary table listed.

  1. Run the following SQL script to query the Iceberg result table:
select * from customer_summary order by order_count desc limit 10

The query result will look like the following screenshot.

Athena-Iceberg-Query

  1. For the Hudi table, change Database to flink_glue_hudi_db and run the same SQL query.

Athena-Hudi-Query

  1. For the Parquet table, change Database to flink_hive_parquet_db and run the same SQL query.

Athena-Parquet-Query

Query the data with Amazon EMR Trino

To access Iceberg with Amazon EMR Trino, SSH to the EMR primary node.

  1. Run the following command to start the Trino CLI:
trino-cli --catalog iceberg

Amazon EMR Trino can now query the tables in the AWS Glue Data Catalog.

  1. Run the following command to query the result table:
show schemas;
use flink_glue_iceberg_db;
show tables;
select * from customer_summary order by order_count desc limit 10;

The query result looks like the following screenshot.

EMR-Trino-Iceberg-Query

  1. Exit the Trino CLI.
  2. Start the Trino CLI with the hive catalog to query the Hudi table:
trino-cli --catalog hive
  1. Run the following command to query the Hudi table:
show schemas;
use flink_glue_hudi_db;
show tables;
select * from customer_summary order by order_count desc limit 10;

Update and delete source records in Amazon RDS for MySQL and validate the reflection of the data lake tables

We can update and delete some records in the RDS for MySQL database and then validate that the changes are reflected in the Iceberg and Hudi tables.

  1. Connect to the RDS for MySQL database and run the following SQL:
update CUSTOMER set NAME = 'updated_name' where CUST_ID=7;

delete from CUSTOMER where CUST_ID=11;
  1. Query the customer_summary table with Athena or Amazon EMR Trino.

The updated and deleted records are reflected in the Iceberg and Hudi tables.

Athena-Iceberg-Query-Updated

Clean up

When you’re done with this exercise, complete the following steps to delete your resources and stop incurring costs:

  1. Delete the RDS for MySQL database.
  2. Delete the EMR cluster.
  3. Drop the databases and tables created in the Data Catalog.
  4. Remove files in Amazon S3.

Conclusion

This post showed you how to integrate Apache Flink in Amazon EMR with the AWS Glue Data Catalog. You can use a Flink SQL connector to read/write data in a different store, such as Kafka, CDC, HBase, Amazon S3, Iceberg, or Hudi. You can also store the metadata in the Data Catalog. The Flink table API has the same connector and catalog implementation mechanism. In a single session, we can use multiple catalog instances pointing to different types, like IcebergCatalog and HiveCatalog, and use then interchangeably in your query. You can also write code with the Flink table API to develop the same solution to integrate Flink and the Data Catalog.

In our solution, we consumed the RDS for MySQL binary log directly with Flink CDC. You can also use Amazon MSK Connect to consume the binary log with MySQL Debezim and store the data in Amazon Managed Streaming for Apache Kafka (Amazon MSK). Refer to Create a low-latency source-to-data lake pipeline using Amazon MSK Connect, Apache Flink, and Apache Hudi for more information.

With the Amazon EMR Flink unified batch and streaming data processing function, you can ingest and process data with one computing engine. With Apache Iceberg and Hudi integrated in Amazon EMR, you can build an evolvable and scalable data lake. With the AWS Glue Data Catalog, you can manage all enterprise data catalogs in a unified manner and consume data easily.

Follow the steps in this post to build your unified batch and streaming solution with Amazon EMR Flink and the AWS Glue Data Catalog. Please leave a comment if you have any questions.


About the Authors

Jianwei Li is Senior Analytics Specialist TAM. He provides consultant service for AWS enterprise support customers to design and build modern data platform.


Samrat Deb is Software Development Engineer at Amazon EMR. In his spare time, he love exploring new places, different culture and food.


Prabhu Josephraj is a Senior Software Development Engineer working for Amazon EMR. He is focused on leading the team that builds solutions in Apache Hadoop and Apache Flink. In his spare time, Prabhu enjoys spending time with his family.

Advanced reporting and analytics for the Post Call Analytics (PCA) solution with Amazon QuickSight

Post Syndicated from Ankur Taunk original https://aws.amazon.com/blogs/big-data/advance-reporting-and-analytics-for-the-post-call-analytics-pca-solution-with-amazon-quicksight/

Organizations with contact centers benefit from advanced analytics on their call recordings to gain important product feedback, improve contact center efficiency, and identify coaching opportunities for their staff. The Post Call Analytics (PCA) solution uses AWS machine learning (ML) services like Amazon Transcribe and Amazon Comprehend to extract insights from contact center call audio recordings uploaded after the call, or from integration with our companion Live Call Analytics (LCA) solution. You can visualize the PCA insights in the business intelligence (BI) tool Amazon QuickSight for advanced analysis.

In this post, we show you how to use PCA’s data to build automated QuickSight dashboards for advanced analytics to assist in quality assurance (QA) and quality management (QM) processes. We provide an AWS CloudFormation template and step-by-step instructions, allowing you to get started with our sample dashboard in just a few simple steps.

Sample dashboard overview

The following screenshots illustrate the different components of our sample QuickSight dashboard:

  • Summary tab – This view aggregates call statistics across data points such as average customer sentiments and average agent talk duration, along with detailed call records. Graphs like “Who Talks More?” show customer sentiment distribution based on speaker talk time. You can apply data, agent, call duration, and language filters for targeted search. The graphical and tabular views help accurately analyze the data.
    quicksight dashboard summary tab
  • Sentiment tab – This view shows sentiment distribution across multiple parameters, such as the impact of agent sentiment on customer experience. In a graphical and tabular view, you see the customer and agent sentiment score correlation. The lowest sentiment score indicates coaching opportunity for agents. You can apply data and agent filters for targeted search.
    quicksight dashboard sentiment tab
  • Categories tab – This tab shows the aggregated sentiment, talk time, and non-talk time per speaker-turn in your call recordings. You can analyze the data based on category along with date and agent filter. You can get an insight into how agent speaking duration affects the customer sentiment score. The graphical and tabular views help accurately analyze the data.
    quicksight dashboard categories tab
  • Custom Entities tab – Similar to category, you can see the breakdown across custom entities. You can apply date, agent, and custom entity filters for targeted search.
    quicksight dashboard custom enteties tab
  • Issues, Actions, Outcome tab – This view shows aggregated sentiment, talk time, and non-talk time per speaker-turn in your call recordings. You can analyze the data based on issue, action, and outcome for a custom phrase along with date, category, and agent filters
    quicksight dashboard issue outcome actiontab

Solution overview

The solution uses the following AWS services and features:

The following architecture diagram shows how our solution uses PCA insights from a call recording in an S3 bucket to enable analytics in QuickSight.

Architecture diagram

As part of the solution workflow, EventBridge receives an event for each PCA solution analysis output file. Kinesis Data Firehose uses Lambda to perform data transformation and compression, storing the file in a compressed columnar format (Parquet) in the target S3 bucket. The AWS Glue Data Catalog has the table definitions for the data sources. Athena runs queries using a variety of SQL statements on the compressed Parquet files, and QuickSight is used for visualization. To optimize query performance, we use Athena partition projections. This feature automatically creates date-based partitions for query performance and cost optimization.

This is a loosely coupled architecture, with flexibility to ingest data from third-party data sources, enrich the data by adding more data points, and cross-reference data across data sources for your analytics use case. Lambda functions can integrate with third-party data sources to process and store the compressed output in Amazon S3 using Kinesis Data Firehose. Athena lets you create views by cross-referencing the data across multiple tables.

Prerequisites:

You should have the following prerequisites:

  • You need an active AWS account with the permission to create and modify IAM roles
  • The PCA solution must be already deployed in the same AWS account and Region that you will use for the dashboards
  • QuickSight and AWS CloudFormation need to be in the same Region.

Note that this solution uses QuickSight SPICE storage.

Deploy resources with AWS CloudFormation

To deploy the solution, complete the following steps:

  1. Sign in to the AWS Management Console in your preferred Region.
  2. Create a QuickSight account (skip this step if you already have a QuickSight account):
    1. Navigate to the QuickSight service from the console.
    2. Choose Sign up for QuickSight.
    3. Select the edition.
    4. Enter your account name and notification email address.
  3. Navigate to the PCA solution CloudFormation stack and on the Outputs tab, note the value for the key OutputBucket.
  4. Allow QuickSight access to auto-discover Athena and the S3 output bucket (ref. step 3) with Write permission for Athena Workgroup enabled, then choose Finish.
    quicksight permissions
  5. Enable EventBridge events for the PCA OutputBucket:
    1. Open the PCA OutputBucket (ref. step 3) on the Amazon S3 console.
    2. Choose Properties, scroll to Amazon EventBridge, and choose Enable
  6. Use the following Launch Stack button to deploy the PCA Analytics solution in your preferred Region:
    Launch Stack
  7. Enter a unique stack name if you want to change the default name (pca-quicksight-analytics).
  8. For PcaOutputBucket, enter the value of OutputBucket. (ref. step 3)
  9. For PcaWebAppHostAddress, enter the hostname part of the WebAppUrl output from your PCA stack.
  10. Use the default values for other parameters or update if required.
  11. Choose Next.
    Cloud Formation template screenshot
  12. Select the acknowledgement check box and choose Create stack.
  13. When the CloudFormation stack creation is complete, on the QuickSight console, choose the user icon (top right) to open the menu, and choose Manage QuickSight.
  14. On the admin page, choose Manage assets, then choose Dashboards.
  15. Select <Stack Name>-PCA-Dashboard and choose Share.
  16. Optionally, to customize the dashboard further, share <Stack Name>-PCA-Analysis under Asset type analyses and <Stack Name>-PCA-* under Datasets.
  17. Enter the QuickSight user or group and choose Share again.

Explore the dashboard with demo data

After you deploy the solution, you can explore the dashboards by loading demo data.

  1. Download the demo PCA files.
  2. Unzip and upload the demo PCA files in the OutputBucket bucket in the /parsedFiles/ folder.

Note that this step is optional. We recommend using a non-production environment or stack to keep production and demo data segregated.

Load historical PCA data

Once deployed, the solution processes new PCA data as it is added. To process older PCA data, complete the following steps:

  1. Open the PCA OutputBucket on the Amazon S3 console.
  2. Select all the content under the /parsedFiles/ folder.
  3. Choose Action and copy the files to the same location.

This triggers an EventBridge rule to process the historical PCA files and stream the data to the QuickSight dashboard.

Validate the data

After you generate the PCA output data (within a few minutes), a compressed Parquet PCA data file will appear in the PCA OutputBucket under pca-output-base.

  1. On the Athena console, open the query editor and choose the pca database. You should see the pca_output table under Tables and views.
  2. Choose the options menu next to the pca_output table and choose Preview Table.
    athena table screenshot
  3. Run your query and review the results.
    athena query result set

Navigating the dashboard controls

  • Sliders under the date-based visuals can adjust the date range.
  • You can choose the segments in the visuals to drill down further. QuickSight uses the selected segment as a criterion to filter the data on the current page. To cancel this filtering, choose the same segment again.
  • The bottom of each page shows grid visuals for detailed analysis.
  • Similar to other visuals, you can export grid visual data to CSV and Excel from the menu at the right-top corner of the pane.
  • In the grid visual, choose the ID value of each call record to go to the PCA portal to view details of this record.
  • You can use filters to specify your criteria. For example, adjust FromDate and ToDate to view older data or a custom time frame.

Clean up

To remove the resources created by this stack, perform the following steps:

  1. Delete the CloudFormation stack.
  2. If you uploaded demo PCA files into your non-production PCA deployment, remove them from the PCA OutputBucket bucket under /parsedFiles/.
  3. Delete the pca-output-base folder under the PCA output bucket.

Conclusion

In this post, you learned how to visualize PCA solution data, using a CloudFormation template to automate the QuickSight dashboard creation. You also learned to how to visualize historical PCA data in QuickSight.

The sample PCA QuickSight dashboard application is provided as open source—use it as a starting point for your own solution, and help us make it better by contributing back fixes and features via GitHub pull requests. For expert assistance, AWS Professional Services and other AWS Partners are here to help.


About the Authors

Mehmet Demir is a Senior Solutions Architect at Amazon Web Services (AWS) based in Toronto, Canada. He helps customers in building well-architected solutions that support business innovation.

Ankur Taunk is a Senior Specialist Solutions Architect at AWS. He helps customer achieve their desired business outcomes in the Contact Center space leveraging Amazon Connect.

Introducing native support for Apache Hudi, Delta Lake, and Apache Iceberg on AWS Glue for Apache Spark, Part 1: Getting Started

Post Syndicated from Akira Ajisaka original https://aws.amazon.com/blogs/big-data/part-1-getting-started-introducing-native-support-for-apache-hudi-delta-lake-and-apache-iceberg-on-aws-glue-for-apache-spark/

AWS Glue is a serverless, scalable data integration service that makes it easier to discover, prepare, move, and integrate data from multiple sources. AWS Glue provides an extensible architecture that enables users with different data processing use cases.

A common use case is building data lakes on Amazon Simple Storage Service (Amazon S3) using AWS Glue extract, transform, and load (ETL) jobs. Data lakes free you from proprietary data formats defined by the business intelligence (BI) tools and limited capacity of proprietary storage. In addition, data lakes help you break down data silos to maximize end-to-end data insights. As data lakes have grown in size and matured in usage, a significant amount of effort can be spent keeping the data up to date by ensuring files are updated in a transactionally consistent manner.

AWS Glue customers can now use the following open-source data lake storage frameworks: Apache Hudi, Linux Foundation Delta Lake, and Apache Iceberg. These data lake frameworks help you store data and interface data with your applications and frameworks. Although popular data file formats such as Apache Parquet, CSV, and JSON can store big data, data lake frameworks bundle distributed big data files into tabular structures that are otherwise hard to manage. This makes data lake table frameworks the building constructs of databases on data lakes.

We announced general availability for native support for Apache Hudi, Linux Foundation Delta Lake, and Apache Iceberg on AWS Glue for Spark. This feature removes the need to install a separate connector or associated dependencies, manage versions, and simplifies the configuration steps required to use these frameworks in AWS Glue for Apache Spark. With these open-source data lake frameworks, you can simplify incremental data processing in data lakes built on Amazon S3 by using ACID (atomicity, consistency, isolation, durability) transactions, upserts, and deletes.

This post demonstrates how AWS Glue for Apache Spark works with Hudi, Delta, and Iceberg dataset tables, and describes typical use cases on an AWS Glue Studio notebook.

Enable Hudi, Delta, Iceberg in Glue for Apache Spark

You can use Hudi, Delta, or Iceberg by specifying a new job parameter --datalake-formats. For example, if you want to use Hudi, you need to specify the key as --datalake-formats and the value as hudi. If the option is set, AWS Glue automatically adds the required JAR files into the runtime Java classpath, and that’s all you need. You don’t need to build and configure the required libraries or install a separate connector. You can use the following library versions with this option.

AWS Glue version Hudi Delta Lake Iceberg
AWS Glue 3.0 0.10.1 1.0.0 0.13.1
AWS Glue 4.0 0.12.1 2.1.0 1.0.0

If you want to use other versions of the preceding libraries, you can choose either of the following options:

If you choose either of the preceding options, you need to make sure the --datalake-formats job parameter is unspecified. For more information, see Process Apache Hudi, Delta Lake, Apache Iceberg datasets at scale, part 1: AWS Glue Studio Notebook.

Prerequisites

To continue this tutorial, you need to create the following AWS resources in advance:

Process Hudi, Delta, and Iceberg datasets on an AWS Glue Studio notebook

AWS Glue Studio notebooks provide serverless notebooks with minimal setup. It makes data engineers and developers quickly and interactively explore and process their datasets. You can start using Hudi, Delta, or Iceberg in an AWS Glue Studio notebook by specifying the parameter via %%configure magic and setting the AWS Glue version to 3.0 as follows:

# Use Glue version 3.0
%glue_version 3.0

# Configure '--datalake-formats' Job parameter
%%configure
{
  "--datalake-formats": "your_comma_separated_formats"
}

For more information, refer to the example notebooks available in the GitHub repository:

For this post, we use an Iceberg DataFrame as an example.

The following sections explain how to use an AWS Glue Studio notebook to create an Iceberg table and append records to the table.

Launch a Jupyter notebook to process Iceberg tables

Complete the following steps to launch an AWS Glue Studio notebook:

  1. Download the Jupyter notebook file.
  2. On the AWS Glue console, choose Jobs in the navigation plane.
  3. Under Create job, select Jupyter Notebook.

  1. Select Upload and edit an existing notebook.
  2. Upload native_iceberg_dataframe.ipynb through Choose file under File upload.

  1. Choose Create.
  2. For Job name, enter native_iceberg_dataframe.
  3. For IAM Role, choose your IAM role.
  4. Choose Start notebook job.

Prepare and configure SparkSession with Iceberg configuration

Complete the following steps to configure SparkSession to process Iceberg tables:

  1. Run the following cell.

You can see --datalake-formats iceberg is set by the %%configure Jupyter magic command. For more information about Jupyter magics, refer to Configuring AWS Glue interactive sessions for Jupyter and AWS Glue Studio notebooks.

  1. Provide your S3 bucket name and bucket prefix for your Iceberg table location in the following cell, and run it.

  1. Run the following cells to initialize SparkSession.

  1. Optionally, if you previously ran the notebook, you need to run the following cell to clean up existing resources.

Now you’re ready to create Iceberg tables using the notebook.

Create an Iceberg table

Complete the following steps to create an Iceberg table using the notebook:

  1. Run the following cell to create a DataFrame (df_products) to write.

If successful, you can see the following table.

  1. Run the following cell to create an Iceberg table using the DataFrame.

  1. Now you can read data from the Iceberg table by running the following cell.

Append records to the Iceberg table

Complete the following steps to append records to the Iceberg table:

  1. Run the following cell to create a DataFrame (df_products_appends) to append.

  1. Run the following cell to append the records to the table.

  1. Run the following cell to confirm that the preceding records are successfully appended to the table.

Clean up

To avoid incurring ongoing charges, clean up your resources:

  1. Run step 4 in the Prepare and configure SparkSession with Iceberg configuration section in this post to delete the table and underlying S3 objects.
  2. On the AWS Glue console, choose Jobs in the navigation plane.
  3. Select your job and on the Actions menu, choose Delete job(s).
  4. Choose Delete to confirm.

Considerations

With this capability, you have three different options to access Hudi, Delta, and Iceberg tables:

  • Spark DataFrames, for example spark.read.format("hudi").load("s3://path_to_data")
  • SparkSQL, for example SELECT * FROM table
  • GlueContext, for example create_data_frame.from_catalog, write_data_frame.from_catalog, getDataFrame, and writeDataFrame

Learn more in Using the Hudi framework in AWS Glue, Using the Delta Lake framework in AWS Glue, and Using the Iceberg framework in AWS Glue.

Delta Lake native integration works with the catalog tables created from native Delta Lake tables by AWS Glue crawlers. This integration does not depend on manifest files. For more information, refer to Introducing native Delta Lake table support with AWS Glue crawlers.

Conclusion

This post demonstrated how to process Apache Hudi, Delta Lake, Apache Iceberg datasets using AWS Glue for Apache Spark. You can integrate your data using those data lake formats easily without struggling with library dependency management.

In subsequent posts in this series, we’ll show you how you can use AWS Glue Studio to visually author your ETL jobs with simpler configuration and setup for these data lake formats, and how to use AWS Glue workflows to orchestrate data pipelines and automate ingestion into your data lakes on Amazon S3 with AWS Glue jobs. Stay tuned!

If you have comments or feedback, please leave them in the comments.


About the authors

Akira Ajisaka is a Senior Software Development Engineer on the AWS Glue team. He likes open-source software and distributed systems. In his spare time, he enjoys playing both arcade and console games.

Noritaka Sekiyama is a Principal Big Data Architect on the AWS Glue team. He is responsible for building software artifacts to help customers. In his spare time, he enjoys cycling with his new road bike.

Savio Dsouza is a Software Development Manager on the AWS Glue team. His teams work on building and innovating in distributed compute systems and frameworks, namely on Apache Spark.
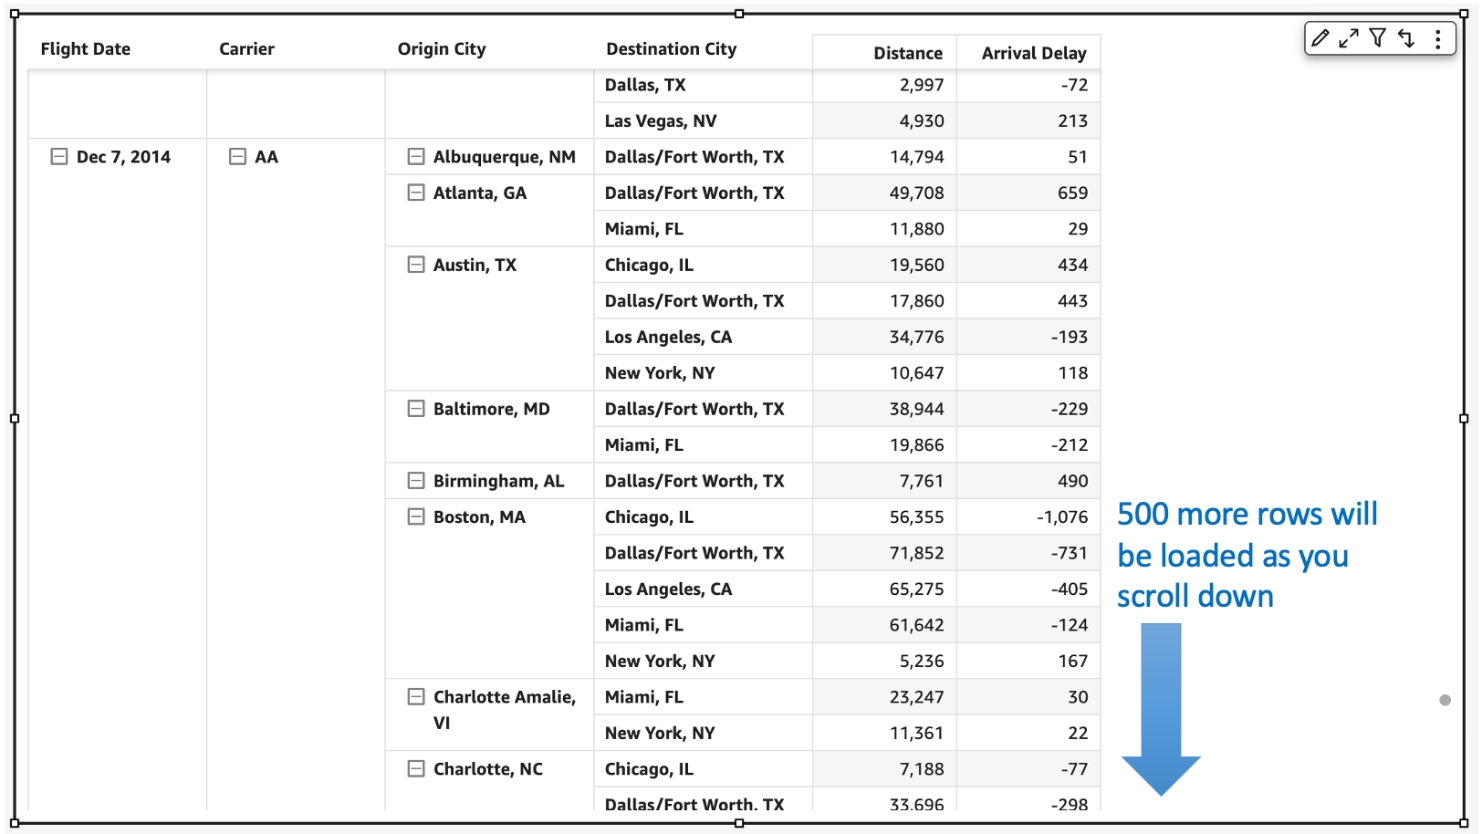
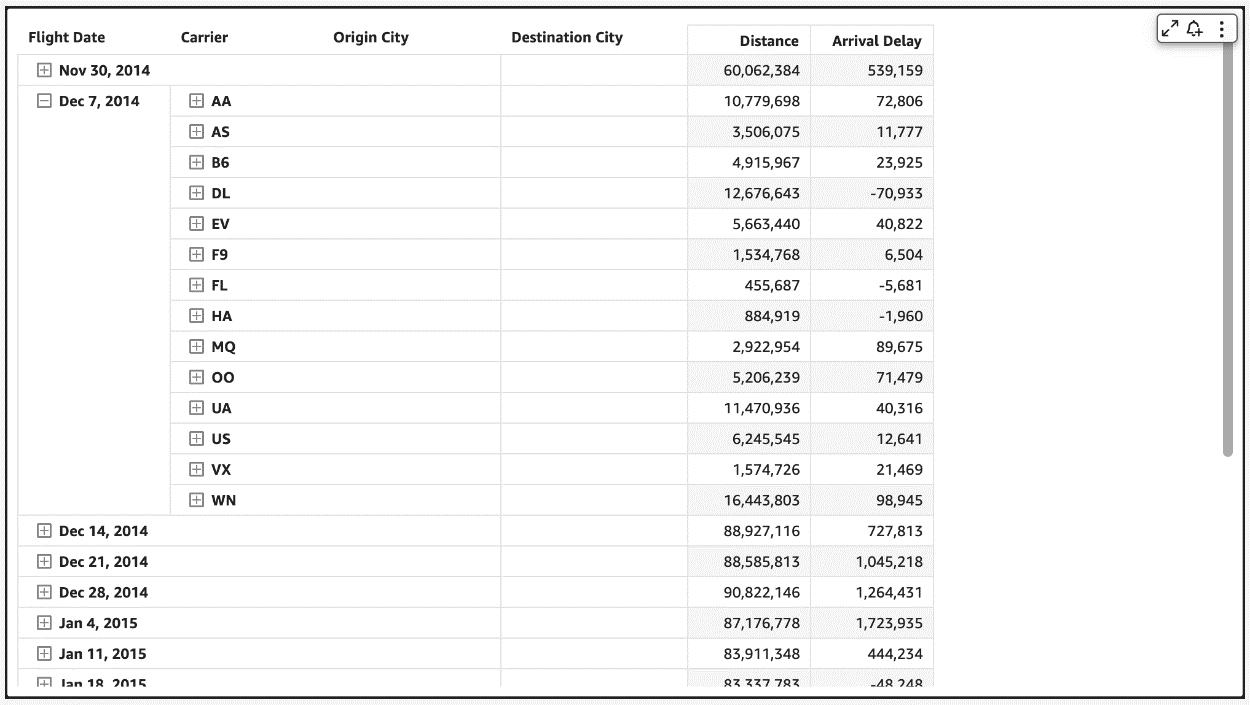
Super-charged pivot tables in Amazon QuickSight

Post Syndicated from Bhupinder Chadha original https://aws.amazon.com/blogs/big-data/super-charged-pivot-tables-in-amazon-quicksight/

Amazon QuickSight is a fast and cloud-powered business intelligence (BI) service that makes it easy to create and deliver insights to everyone in your organization without any servers or infrastructure. QuickSight dashboards can also be embedded into applications and portals to deliver insights to external stakeholders. Additionally, with Amazon QuickSight Q, end-users can simply ask questions in natural language to get machine learning (ML)-powered visual responses to their questions.

Recently, Amazon FinTech migrated all their financial reporting to QuickSight. This involved migrating complex tables and pivot tables, helping them slice and dice large datasets and deliver pixel-perfect views of their data to their stakeholders. Amazon FinTech, like all QuickSight customers, needs fast performance on very large pivot tables in order to drive adoption of their dashboards. We have specifically launched two new features focused on scaling our pivot tables with the following improvements:

  • Faster loading of pivot tables during expand and collapse operations
  • Increased field limits for rows, columns, and values

In this post, we discuss these improvements to pivot tables in QuickSight.

Blazing fast pivot tables during expand and collapse operations

Today, QuickSight pivot tables work as an infinite load. As users scroll vertically or horizontally on the visual, new queries are run to fetch additional rows and columns of data with fixed row and column configurations for every query request.

For example, in the following table, we would load all carrier/city combinations nested under Dec 7, 2014 before we can continue querying the next date. Let’s say we have more than 500 carrier/city rows for a specific date; this will take more than a single query to get to the next date. The count of queries run depends on the cardinality of the dimension used in the pivot table.

In the following example of a collapsed pivot table, since the reader doesn’t see anything beyond the flight dates, having all carrier/city rows doesn’t change what is actively displayed on the pivot table. Even though individual SQL queries can be fast, users can perceive this table to load slowly due to the sheer number of queries being fired to load the hidden (collapsed) data. Therefore, loading every single row up to the Destination City field isn’t very useful when the pivot table in the collapsed state.

Therefore, to make our pivot tables load faster, we now only fetch the data for visible fields (expanded fields) along with a small subset of values under the collapsed field. This makes sure that data fetched in every new query is used to render new values that can be displayed immediately. We have seen customers improve their load time from 2–10 times faster depending on the complexity of their dataset.

This new behavior is automatically enabled, without requiring users to do anything on their side. Please note that while we plan to support all kinds of pivot tables to use this optimization, our current rollout only includes pivot tables with only row or only column fields not sorted by any metric.

Increased field limits for pivot tables

With the ever-growing depth and granularity of data being collected, our customers asked us to increase the number of fields and data points they can display in their visuals. We have been actively listening to your needs, and just like supporting more data points in line charts, we now are increasing our field limits for pivot tables.

The value field well limits have been increased from 20 to 40, and rows and columns have been increased from 20 each to a combined limit of 40. For example, if the user has 34 fields in rows, then they can add up to 6 fields to the column field well.

This will help unblock use cases requiring increased limits such as:

  • Metrics reporting – Monthly and weekly business reporting often requires having dozens of metrics presented in tabular formats. With the updated limits, you can display detailed, robust financial reports in a single pivot table rather than having to split it across multiple pivot tables.
  • Migration from legacy BI and reporting tools – Existing reports in these legacy systems require displaying and slicing across a large number of row hierarchies, for example a cost center expense analysis.
  • Custom use cases – These are specific industry and organization use cases where you can add dozens of values and row fields to display additional attributes. For example, a customer 360 report sliced by different regions.

As soon as you hit the limit, you receive an error message to indicate that the limit has been reached for that field well. For more details, refer to here.

Get started and stay updated!

Learn more about our new features in our newly launched QuickSight community’s Announcement section and supercharge your dashboards with the latest features from QuickSight!


About the authors

Bhupinder Chadha is a senior product manager for Amazon QuickSight focused on visualization and front end experiences. He is passionate about BI, data visualization and low-code/no-code experiences. Prior to QuickSight he was the lead product manager for Inforiver, responsible for building a enterprise BI product from ground up. Bhupinder started his career in presales, followed by a small gig in consulting and then PM for xViz, an add on visualization product.

Igal Mizrahi is a Senior Software Engineer for AWS QuickSight Charting team. He has been part of the team for the past 3 years, and previously worked on Amazon’s mobile shopping application for 4 years.

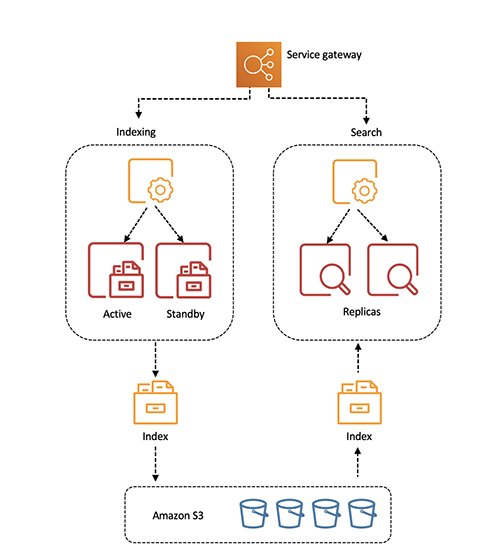
Amazon OpenSearch Serverless is now generally available!

Post Syndicated from Pavani Baddepudi original https://aws.amazon.com/blogs/big-data/amazon-opensearch-serverless-is-now-generally-available/

We ended 2022 on a high note with the preview release of Amazon OpenSearch Serverless at re:Invent. Today, we are happy to announce the general availability of Amazon OpenSearch Serverless, the serverless option for Amazon OpenSearch Service that makes it easier to run search and analytics workloads without even having to think about infrastructure management. In this post, we share our approach and high-level architecture of OpenSearch Serverless.

Background

Self-managed OpenSearch and managed OpenSearch Service are widely used to search and analyze petabytes of data. Both options give you full control over the configuration of compute, memory, and storage resources in clusters, which allows you to optimize cost and performance for their applications.

However, you might often run applications that could be highly variable, where the usage is not always known. Such applications may experience sudden bursts in ingestion data or irregular and unpredictable query requests. To maintain consistent performance, you must constantly tune and resize clusters or over-provision for peak demand, which results in excess costs. Many customers wanted an even simpler experience to run search and analytics workloads that allows you to focus on your business applications without having to worry about the backend infrastructure and data management.

What does simpler mean? It means you don’t want to worry about these tasks:

  • Choose and provision instances
  • Manage the shard or the index size
  • Index and data management for sizing and operational purposes
  • Monitor or tune the settings continuously to meet workload demands
  • Plan for system failures and resource threshold breaches
  • Security updates and service software updates

We translated this checklist into requirements and goals under the following product themes:

  • Simple and secure
  • Auto scaling, fault tolerance, and durability
  • Cost efficiency
  • Ecosystem integrations

Before we delve into how OpenSearch Serverless addresses these needs, let’s review the target use cases for OpenSearch Serverless, as their distinctive characteristics heavily influenced our design approach and architecture.

Target use cases

The target use cases for OpenSearch Serverless are the same as OpenSearch:

  • Time series analytics (also popularly known as log analytics) focuses on analyzing large volumes of semi-structured machine-generated data in real time for operational, security, and user behavior insights
  • Search powers customer applications in their internal networks (application search, content management systems, legal documents) and internet-facing applications such as ecommerce website search and content search

Let’s understand the differences between the typical time series and search workloads (exceptions may vary):

  • Time series workloads are write-heavy, whereas search workloads are read-heavy
  • Search workloads have a smaller data corpus compared to time series
  • Search workloads are more sensitive to latencies and require faster response times than time series workloads
  • Queries for time series are run on recent data, whereas search queries scan the entire corpus

These characteristics heavily influenced our approach to handling and managing shards, indexes, and data for the workloads. In the next section, we review the broad themes of how OpenSearch Serverless meets customer challenges while efficiently catering to these distinctive workload traits.

Simple and secure

To get started with OpenSearch Serverless, you create a collection. Collections are a logical grouping of indexed data that works together to support a workload, while the physical resources are automatically managed in the backend. You don’t have to declare how much compute or storage is needed, or monitor the system to make sure it’s running well. To adeptly handle the two predominant workloads, OpenSearch Serverless applies different sharding and indexing strategies. Therefore, in the workflow to create a collection, you must define the collection type—time series or search. You don’t have to worry about re-indexing or rollover of indexes to support your growing data sizes, because it’s handled automatically by the system.

Next, you make the configuration choices about the encryption key to use, network access to your collections (public endpoint or VPC), and who should access your collection. OpenSearch Serverless has an easy-to-use and highly effective security model that supports hierarchical policies for your collections and indexes. You can create granular collection-level and account-level security policies for all your collections and indexes. The centralized account-level policy provides you with comprehensive visibility and control, and makes it operationally simple to secure collections at scale. For encryption policies, you can specify an AWS Key Management Service (AWS KMS) key for a single collection, all collections, or a subset of collections using a wildcard matching pattern. If rules from multiple policies match a collection, the rule closest to the fully qualified name takes precedence. You can also specify wildcard matching patterns in network and data access policies. Multiple network and data access policies can apply to a single collection, and the permissions are additive. You can update the network and data access policies for your collection at any time.

OpenSearch Dashboards can now be accessed using your SAML and AWS Identity and Access Management (IAM) credentials. OpenSearch Serverless also supports fine-grained IAM permissions so that you can define who can create, update, and delete encryption, network, and data access policies, thereby enabling organizational alignment. All the data in OpenSearch Serverless is encrypted in transit and at rest by default.

Auto scaling, fault-tolerance, and durability

OpenSearch Serverless decouples storage and compute, which allows for every layer to scale independently based on workload demands. This decoupling also allows for the isolation of indexing and query compute nodes so the fleets can run concurrently without any resource contention. The compute resources like CPU, disk utilization, memory, and hot shard state are monitored and managed by the service. When these system thresholds are breached, the service adjusts capacity so you don’t have to worry about scaling resources. For example, when an application monitoring workload receives a sudden burst of logging activities during an availability event, OpenSearch Serverless will scale out the indexing compute nodes. When these logging activities decrease and the resource consumption in the compute nodes falls below a certain threshold, OpenSearch Serverless scales the nodes back in. Similarly, when a website search engine receives a sudden spike of queries after a news event, OpenSearch Serverless automatically scales the query compute nodes to process the queries without impacting the data ingestion performance.

The following diagram illustrates this high-level architecture.

OpenSearch Serverless is designed for production workloads with redundancy for Availability Zone outages and infrastructure failures. By default, OpenSearch Serverless will replicate indexes across Availability Zones. The indexing compute nodes run in an active-standby mode. The service control plane is also built with redundancy and automatic failure recovery. All the indexed data is stored in Amazon Simple Storage Service (Amazon S3) to provide the same data durability as Amazon S3 (11 nines). The query compute instances download the indexed data directly from Amazon S3, run search operations, and perform aggregations. Redundant query compute is deployed across Availability Zones in an active-active mode to maintain availability during failures. The refresh interval (the time from when a document is ingested by OpenSearch Serverless to when it is available to search) is currently under 15 seconds.

Cost and cost efficiency

With OpenSearch Serverless, you don’t have to size or provision resources upfront, nor do you have to over-provision for peak load in production environments. You only pay for the compute and storage resources consumed by your workloads. The compute capacity used for data ingestion, and search and query is measured in OpenSearch Compute Units (OCUs). The number of OCUs corresponds directly to the CPU, memory, Amazon Elastic Block Store (Amazon EBS) storage, and the I/O resources required to ingest data or run queries. One OCU comprises 6 GB of RAM, corresponding vCPU, 120 GB of GP3 storage (used to provide fast access to the most frequently accessed data), and data transfers to Amazon S3. After data is ingested, the indexed data is stored in Amazon S3. You have the ability to control retention and delete data using the APIs.

When you create the first collection endpoint in an account, OpenSearch Serverless provisions 4 OCUs (2 ingest that include primary and standby, and 2 search that include two copies for high availability). These OCUs are instantiated even though there is no activity on the serverless endpoint to avoid any cold start latencies. All subsequent collections in that account using the same KMS key share those OCUs. During auto scaling, OpenSearch Serverless will add more OCUs to support the compute needed by your collections. These OCUs copy the indexed data from Amazon S3 before they can start responding to the indexing or query requests. Similarly, the OpenSearch Serverless control plane continuously monitors the OCUs’ resource consumption. When the indexing or search request rate decreases and the OCU consumption falls below a certain threshold, OpenSearch Serverless will reduce the OCU count to the minimum capacity required for your workload. The minimum OCUs prevent cold start delays.

OpenSearch Serverless also provides a built-in caching tier for time series workloads to provide better price-performance. OpenSearch Serverless caches the most recent log data, typically the first 24 hours, on ephemeral disk. For data older than 24 hours, OpenSearch Serverless only caches metadata and fetches the necessary data blocks from Amazon S3 based on query access. This model also helps pack more data while controlling the costs. For search collections, the query compute node caches the entire data corpus locally on ephemeral disks to provide fast, millisecond query responses.

Ecosystem integrations

Most tools that work with OpenSearch also work with OpenSearch Serverless. You don’t have to rewrite existing pipelines and applications. OpenSearch Serverless has the same logical data model and query engine of OpenSearch, so you can use the same ingest and query APIs you are familiar with, and use serverless OpenSearch Dashboards for interactive data analysis and visualization. Because of its compatible interface, OpenSearch Serverless also supports the existing rich OpenSearch ecosystem of high-level clients and streaming ingestion pipelines—Amazon Kinesis Data Firehose, FluentD, FluentBit, Logstash, Apache Kafka, and Amazon Managed Streaming for Apache Kafka (Amazon MSK). For more information, see Ingesting data into Amazon OpenSearch Serverless collections. You can also automate the process of collection creation using AWS CloudFormation and the AWS CDK. With Amazon CloudWatch integration, you can monitor key OpenSearch Serverless metrics and set alarms to notify you of any threshold breaches.

Choosing between managed clusters and OpenSearch Serverless

Both managed clusters and OpenSearch Serverless are deployment options under OpenSearch Service, and powered by the open-source OpenSearch project. OpenSearch Serverless makes it easier to run cyclical, intermittent, or unpredictable workloads without having to think about sizing, monitoring, and tuning OpenSearch clusters. You may, however, prefer to use managed clusters in scenarios where you need tight control over cluster configuration or specific customizations. With managed clusters, you can choose your preferred instances and versions, and have more control on configuration such as lower refresh intervals or data sharding strategies, which may be critical for use cases that fall outside of the typical patterns supported by OpenSearch Serverless. Also, OpenSearch Serverless currently doesn’t support all advanced OpenSearch features and plugins such as alerting, anomaly detection, and k-NN. You can use the managed clusters for these features until OpenSearch Serverless adds support for them.

Updates since the preview

With the general availability release, OpenSearch Serverless will now scale out and scale in to the minimum resources required to support your workloads. The maximum OCU limit per account has been increased from 20 to 50 for both indexing and query. Additionally, you can now use the high-level OpenSearch clients to ingest and query your data, and also migrate data from your OpenSearch clusters using Logstash. Also, we added support for three more Regions. OpenSearch Serverless is now available in eight Regions globally: US East (Ohio), US East (N. Virginia), US West (Oregon), Asia Pacific (Singapore), Asia Pacific (Sydney), Asia Pacific (Tokyo), Europe (Frankfurt), and Europe (Ireland).

Summary

The serverless journey has just begun. Most of the initial efforts were spent defining and building the right service architecture that can efficiently support the growing performance and scale demands. OpenSearch Serverless separates storage and compute components, and indexing and query compute, so they can be managed and scaled independently. OpenSearch Serverless uses Amazon S3 as the primary data storage for indexes, so you don’t need to worry about durability. We have decoupled your configuration choices from the proper provisioning of resources, so configuration mistakes won’t cause outages. OpenSearch Serverless will also apply security and software updates in the future with no disruption to your workloads. This flexible, microservices-based architecture will enable us to keep pushing out new features regularly, raising the bar on scale and performance, and driving down the costs further, for example, spinning down the compute nodes completely when there is no activity.

We encourage you to try out OpenSearch Serverless and provide your feedback in the comments section with your use cases and questions. We have a number of resources to get you started:


About the author

Pavani Baddepudi is a senior product manager working in search services at AWS. Her interests include distributed systems, networking, and security.

Build a multi-Region and highly resilient modern data architecture using AWS Glue and AWS Lake Formation

Post Syndicated from Vivek Shrivastava original https://aws.amazon.com/blogs/big-data/build-a-multi-region-and-highly-resilient-modern-data-architecture-using-aws-glue-and-aws-lake-formation/

AWS Lake Formation helps with enterprise data governance and is important for a data mesh architecture. It works with the AWS Glue Data Catalog to enforce data access and governance. Both services provide reliable data storage, but some customers want replicated storage, catalog, and permissions for compliance purposes.

This post explains how to create a design that automatically backs up Amazon Simple Storage Service (Amazon S3), the AWS Glue Data Catalog, and Lake Formation permissions in different Regions and provides backup and restore options for disaster recovery. These mechanisms can be customized for your organization’s processes. The utility for cloning and experimentation is available in the open-sourced GitHub repository.

This solution only replicates metadata in the Data Catalog, not the actual underlying data. To have a redundant data lake using Lake Formation and AWS Glue in an additional Region, we recommend replicating the Amazon S3-based storage using S3 replication, S3 sync, aws-s3-copy-sync-using-batch or S3 Batch replication process. This ensures that the data lake will still be functional in another Region if Lake Formation has an availability issue. The Data Catalog setup (tables, databases, resource links) and Lake Formation setup (permissions, settings) must also be replicated in the backup Region.

Solution overview

This post shows how to create a backup of the Lake Formation permissions and AWS Glue Data Catalog from one Region to another in the same account. The solution doesn’t create or modify AWS Identity and Access Management (IAM) roles, which are available in all Regions. There are three steps to creating a multi-Region data lake:

  1. Migrate Lake Formation data permissions.
  2. Migrate AWS Glue databases and tables.
  3. Migrate Amazon S3 data.

In the following sections, we look at each migration step in more detail.

Lake Formation permissions

In Lake Formation, there are two types of permissions: metadata access and data access.

Metadata access permissions allow users to create, read, update, and delete metadata databases and tables in the Data Catalog.

Data access permissions allow users to read and write data to specific locations in Amazon S3. Data access permissions are managed using data location permissions, which allow users to create and alter metadata databases and tables that point to specific Amazon S3 locations.

When data is migrated from one Region to another, only the metadata access permissions are replicated. This means that if data is moved from a bucket in the source Region to another bucket in the target Region, the data access permissions need to be reapplied in the target Region.

AWS Glue Data Catalog

The AWS Glue Data Catalog is a central repository of metadata about data stored in your data lake. It contains references to data that is used as sources and targets in AWS Glue ETL (extract, transform, and load) jobs, and stores information about the location, schema, and runtime metrics of your data. The Data Catalog organizes this information in the form of metadata tables and databases. A table in the Data Catalog is a metadata definition that represents the data in a data lake, and databases are used to organize these metadata tables.

Lake Formation permissions can only be applied to objects that already exist in the Data Catalog in the target Region. Therefore, in order to apply these permissions, the underlying Data Catalog databases and tables must already exist in the target Region. To meet this requirement, this utility migrates both the AWS Glue databases and tables from the source Region to the target Region.

Amazon S3 data

The data that underlies an AWS Glue table can be stored in an S3 bucket in any Region, so replication of the data itself isn’t necessary. However, if the data has already been replicated to the target Region, this utility has the option to update the table’s location to point to the replicated data in the target Region. If the location of the data is changed, the utility updates the S3 bucket name and keeps the rest of the prefix hierarchy unchanged.

This utility doesn’t include the migration of data from the source Region to the target Region. Data migration must be performed separately using methods such as S3 replication, S3 sync, aws-s3-copy-sync-using-batch or S3 Batch replication.

This utility has two modes for replicating Lake Formation and Data Catalog metadata: on-demand and real-time. The on-demand mode is a batch replication that takes a snapshot of the metadata at a specific point in time and uses it to synchronize the metadata. The real-time mode replicates changes made to the Lake Formation permissions or Data Catalog in near-real time.

The on-demand mode of this utility is recommended for creating existing Lake Formation permissions and Data Catalogs because it replicates a snapshot of the metadata. After the Lake Formation and Data Catalogs are synchronized, you can use real-time mode to replicate any ongoing changes. This creates a mirror image of the source Region in the target Region and keeps it up to date as changes are made in the source Region. These two modes can be used independently of each other, and the operations are idempotent.

The code for the on-demand and real-time modes is available in the GitHub repository. Let’s look at each mode in more detail.

On-demand mode

On-demand mode is used to copy the Lake Formation permissions and Data Catalog at a specific point in time. The code is deployed using the AWS Cloud Development Kit (AWS CDK). The following diagram shows the solution architecture for this mode.

The AWS CDK deploys an AWS Glue job to perform the replication. The job retrieves configuration information from a file stored in an S3 bucket. This file includes details such as the source and target Regions, an optional list of databases to replicate, and options for moving data to a different S3 bucket. More information about these options and deployment instructions is available in the GitHub repository.

The AWS Glue job retrieves the Lake Formation permissions and Data Catalog object metadata from the source Region and stores it in a JSON file in an S3 bucket. The same job then uses this file to create the Lake Formation permissions and Data Catalog databases and tables in the target Region.

This tool can be run on demand by running the AWS Glue job. It copies the Lake Formation permissions and Data Catalog object metadata from the source Region to the target Region. If you run the tool again after making changes to the target Region, the changes are replaced with the latest Lake Formation permissions and Data Catalog from the source Region.

This utility can detect any changes made to the Data Catalog metadata, databases, tables, and columns while replicating the Data Catalog from the source to the target Region. If a change is detected in the source Region, the latest version of the AWS Glue object is applied to the target Region. The utility reports the number of objects modified during its run.

The Lake Formation permissions are copied from the source to the target Region, so any new permissions are replicated in the target Region. If a permission is removed from the source Region, it is not removed from the target Region.

Real-time mode

Real-time mode replicates the Lake Formation permissions and Data Catalog at a regular interval. The default interval is 1 minute, but it can be modified during deployment. The code is deployed using the AWS CDK. The following diagram shows the solution architecture for this mode.

The AWS CDK deploys two AWS Lambda jobs and creates an Amazon DynamoDB table to store AWS CloudTrail events and an Amazon EventBridge rule to run the replication at a regular interval. The Lambda jobs retrieve the configuration information from a file stored in an S3 bucket. This file includes details such as the source and target Regions, options for moving data to a different S3 bucket, and the lookback period for CloudTrail in hours. More information about these options and deployment instructions is available in the GitHub repository.

The EventBridge rule triggers a Lambda job at a fixed interval. This job retrieves the configuration information and queries CloudTrail events related to the Data Catalog and Lake Formation that occurred in the past hour (the duration is configurable). All relevant events are then stored in a DynamoDB table.

After the event information is inserted into the DynamoDB table, another Lambda job is triggered. This job retrieves the configuration information and queries the DynamoDB table. It then applies all the changes to the target Region. If the tool is run again after making changes to the target Region, the changes are replaced with the latest Lake Formation permissions and Data Catalog from the source Region. Unlike on-demand mode, this utility also removes any Lake Formation permissions that were removed from the source Region from the target Region.

Limitations

This utility is designed to replicate permissions within a single account only. The on-demand mode replicates a snapshot and doesn’t remove existing permissions, so it doesn’t perform delete operations. The API currently doesn’t support replicating changes to row and column permissions.

Conclusion

In this post, we showed how you can use this utility to migrate the AWS Glue Data Catalog and Lake Formation permissions from one Region to another. It can also keep the source and target Regions synchronized if any changes are made to the Data Catalog or the Lake Formation permissions. Implementing it across Regions (multi-Region) is a good option if you are looking for the most separation and complete independence of your globally diverse data workloads. Also consider the trade-offs. Implementing and operating this strategy, particularly using multi-Region, can be more complicated and more expensive, than other DR strategies.

To get started, checkout the github repo. For more resources, refer to the following:


About the authors

Vivek Shrivastava is a Principal Data Architect, Data Lake in AWS Professional Services. He is a Bigdata enthusiast and holds 13 AWS Certifications. He is passionate about helping customers build scalable and high-performance data analytics solutions in the cloud. In his spare time, he loves reading and finds areas for home automation

Raza Hafeez is a Senior Data Architect within the Shared Delivery Practice of AWS Professional Services. He has over 12 years of professional experience building and optimizing enterprise data warehouses and is passionate about enabling customers to realize the power of their data. He specializes in migrating enterprise data warehouses to AWS Modern Data Architecture.

Nivas Shankar  is a Principal Product Manager for AWS Lake Formation. He works with customers around the globe to translate business and technical requirements into products that enable customers to improve how they manage, secure and access data lake. Also leads several data and analytics initiatives within AWS including support for Data Mesh.

What’s new in Amazon Redshift – 2022, a year in review

Post Syndicated from Manan Goel original https://aws.amazon.com/blogs/big-data/whats-new-in-amazon-redshift-2022-a-year-in-review/

In 2021 and 2020, we told you about the new features in Amazon Redshift that make it easier, faster, and more cost-effective to analyze all your data and find rich and powerful insights. In 2022, we are happy to report that the Amazon Redshift team was hard at work. We worked backward from customer requirements and announced multiple new features to make it easier, faster, and more cost-effective to analyze all your data. This post covers some of these new features.

At AWS, for data and analytics, our strategy is to give you a modern data architecture that helps you break free from data silos; have purpose-built data, analytics, machine learning (ML), and artificial intelligence services to use the right tool for the right job; and have open, governed, secure, and fully managed services to make analytics available to everyone. Within AWS’s modern data architecture, Amazon Redshift as the cloud data warehouse remains a key component, enabling you to run complex SQL analytics at scale and performance on terabytes to petabytes of structured and unstructured data, and make the insights widely available through popular business intelligence (BI) and analytics tools. We continue to work backward from customers’ requirements, and in 2022 launched over 40 features in Amazon Redshift to help customers with their top data warehousing use cases, including:

  • Self-service analytics
  • Easy data ingestion
  • Data sharing and collaboration
  • Data science and machine learning
  • Secure and reliable analytics
  • Best price performance analytics

Let’s dive deeper and discuss the new Amazon Redshift features in these areas.

Self-service analytics

Customers continue to tell us that data and analytics is becoming ubiquitous, and everyone in their organization needs analytics. We announced Amazon Redshift Serverless (in preview) in 2021 to make it easy to run and scale analytics in seconds without having to provision and manage data warehouse infrastructure. In July 2022, we announced the general availability of Redshift Serverless, and since then thousands of customers, including Peloton, Broadridge Financials, and NextGen Healthcare, have used it to quickly and easily analyze their data. Amazon Redshift Serverless automatically provisions and intelligently scales data warehouse capacity to deliver high performance for all your analytics, and you only pay for the compute used for the duration of the workloads on a per-second basis. Since GA, we have added features like resource tagging, simplified monitoring, and availability in additional AWS Regions to further simplify billing and expand the reach across more Regions worldwide.

In 2021, we launched Amazon Redshift Query Editor V2, which is a free web-based tool for data analysts, data scientists, and developers to explore, analyze, and collaborate on data in Amazon Redshift data warehouses and data lakes. In 2022, Query Editor V2 got additional enhancements such as notebook support for improved collaboration to author, organize, and annotate queries; user access through identity provider (IdP) credentials for single sign-on; and the ability to run multiple queries concurrently to improve developer productivity.

Autonomics is another area where we are actively working to use ML-based optimizations and give customers a self-learning and self-optimizing data warehouse. In 2022, we announced the general availability of Automated Materialized Views (AutoMVs) to improve the performance of queries (reduce the total runtime) without any user effort by automatically creating and maintaining materialized views. AutoMVs, combined with automatic refresh, incremental refresh, and automatic query rewriting for materialized views, made materialized views maintenance free, giving you faster performance automatically. In addition, the automatic table optimization (ATO) capability for schema optimization and automatic workload management (auto WLM) capability for workload optimization got further improvements for better query performance.

Easy data ingestion

Customers tell us that they have their data distributed over multiple data sources like transactional databases, data warehouses, data lakes, and big data systems. They want the flexibility to integrate this data with no-code/low-code, zero-ETL data pipelines or analyze this data in place without moving it. Customers tell us that their current data pipelines are complex, manual, rigid, and slow, resulting in incomplete, inconsistent, and stale views of data, limiting insights. Customers have asked us for a better way forward, and we are pleased to announce a number of new capabilities to simplify and automate data pipelines.

Amazon Aurora zero-ETL integration with Amazon Redshift (preview) enables you to run near-real-time analytics and ML on petabytes of transactional data. It offers a no-code solution for making transactional data from multiple Amazon Aurora databases available in Amazon Redshift data warehouses within seconds of being written to Aurora, eliminating the need to build and maintain complex data pipelines. With this feature, Aurora customers can also access Amazon Redshift capabilities such as complex SQL analytics, built-in ML, data sharing, and federated access to multiple data stores and data lakes. This feature is now available in preview for Amazon Aurora MySQL-Compatible Edition version 3 (with MySQL 8.0 compatibility), and you can request access to the preview.

Amazon Redshift now supports auto-copy from Amazon S3 (preview) to simplify data loading from Amazon Simple Storage Service (Amazon S3) into Amazon Redshift. You can now set up continuous file ingestion rules (copy jobs) to track your Amazon S3 paths and automatically load new files without the need for additional tools or custom solutions. Copy jobs can be monitored through system tables, and they automatically keep track of previously loaded files and exclude them from the ingestion process to prevent data duplication. This feature is now available in preview; you can try this feature by creating a new cluster using the preview track.

Customers continue to tell us that they need instantaneous, in-the-moment, real-time analytics, and we are pleased to announce the general availability of streaming ingestion support in Amazon Redshift for Amazon Kinesis Data Streams and Amazon Managed Streaming for Apache Kafka (Amazon MSK). This feature eliminates the need to stage streaming data in Amazon S3 before ingesting it into Amazon Redshift, enabling you to achieve low latency, measured in seconds, while ingesting hundreds of megabytes of streaming data per second into your data warehouses. You can use SQL within Amazon Redshift to connect to and directly ingest data from multiple Kinesis data streams or MSK topics, create auto-refreshing streaming materialized views with transformations on top of streams directly to access streaming data, and combine real-time data with historical data for better insights. For example, Adobe has integrated Amazon Redshift streaming ingestion as part of their Adobe Experience Platform for ingesting and analyzing, in real time, the web and applications clickstream and session data for various applications like CRM and customer support applications.

Customers have told us that they want simple, out-of-the-box integration between Amazon Redshift, BI and ETL (extract, transform, and load) tools, and business applications like Salesforce and Marketo. We are pleased to announce the general availability of Informatica Data Loader for Amazon Redshift, which enables you to use Informatica Data Loader for high-speed and high-volume data loading into Amazon Redshift for free. You can simply select the Informatica Data Loader option on the Amazon Redshift console. Once in Informatica Data Loader, you can connect to sources such as Salesforce or Marketo, choose Amazon Redshift as a target, and begin to load your data.

Data sharing and collaboration

Customers continue to tell us that they want to analyze all their first-party and third-party data and make the rich data-driven insights available to their customers, partners, and suppliers. We launched new features in 2021, such as Data Sharing and AWS Data Exchange integration, to make it easier for you to analyze all of your data and share it within and outside your organizations.

A great example of a customer using data sharing is Orion. Orion provides real-time data as a service (DaaS) solutions for customers in the financial services industry, such as wealth management, asset management, and investment management providers. They have over 2,500 data sources that are primarily SQL Server databases sitting both on premises and in AWS. Data is streamed using Kafka connecters into Amazon Redshift. They have a producer cluster that receives all this data and then uses Data Sharing to share data in real time for collaboration. This is a multi-tenant architecture that serves multiple clients. Given the sensitivity of their data, data sharing is a way to provide workload isolation between clusters and also securely share that data to end-users.

In 2022, we continued to invest in this area to improve the performance, governance, and developer productivity with new features to make it easier, simpler, and faster to share and collaborate on data.

As customers are building large-scale data sharing configurations, they have asked for simplified governance and security for shared data, and we are adding centralized access control with AWS Lake Formation for Amazon Redshift datashares to enable sharing live data across multiple Amazon Redshift data warehouses. With this feature, Amazon Redshift now supports simplified governance of Amazon Redshift datashares by using AWS Lake Formation as a single pane of glass to centrally manage data or permissions on datashares. You can view, modify, and audit permissions, including row-level and column-level security on the tables and views in the Amazon Redshift datashares, using Lake Formation APIs and the AWS Management Console, and allow the Amazon Redshift datashares to be discovered and consumed by other Amazon Redshift data warehouses.

Data science and machine learning

Customers continue to tell us that they want their data and analytics systems to help them answer a wide range of questions, from what is happening in their business (descriptive analytics) to why is it happening (diagnostic analytics) and what will happen in the future (predictive analytics). Amazon Redshift provides features like complex SQL analytics, data lake analytics, and Amazon Redshift ML for customers to analyze their data and discover powerful insights. Redshift ML integrates Amazon Redshift with Amazon SageMaker, a fully managed ML service, enabling you to create, train, and deploy ML models using familiar SQL commands.

Customers have also asked us for better integration between Amazon Redshift and Apache Spark, so we are excited to announce Amazon Redshift integration for Apache Spark to make data warehouses easily accessible for Spark-based applications. Now, developers using AWS analytics and ML services such as Amazon EMR, AWS Glue, and SageMaker can effortlessly build Apache Spark applications that read from and write to their Amazon Redshift data warehouses. Amazon EMR and AWS Glue package the Redshift-Spark connector so you can easily connect to your data warehouse from your Spark-based applications. You can use several pushdown capabilities for operations such as sort, aggregate, limit, join, and scalar functions so that only the relevant data is moved from your Amazon Redshift data warehouse to the consuming Spark application. You can also make your applications more secure by utilizing AWS Identity and Access Management (IAM) credentials to connect to Amazon Redshift.

Secure and reliable analytics

Customers continue to tell us that their data warehouses are mission-critical systems that need high availability, reliability, and security. We launched a number of new features in 2022 in this area.

Amazon Redshift now supports Multi-AZ deployments (in preview) for RA3 instance-based clusters, which enables running your data warehouse in multiple AWS Availability Zones simultaneously and continuous operation in unforeseen Availability Zone-wide failure scenarios. Multi-AZ support is already available for Redshift Serverless. An Amazon Redshift Multi-AZ deployment allows you to recover in case of Availability Zone failures without any user intervention. An Amazon Redshift Multi-AZ data warehouse is accessed as a single data warehouse with one endpoint, and helps you maximize performance by distributing workload processing across multiple Availability Zones automatically. No application changes are needed to maintain business continuity during unforeseen outages.

In 2022, we launched features like role-based access control, row-level security, and data masking (in preview) to make it easier for you to manage access and decide who has access to which data, including obfuscating personally identifiable information (PII) like credit card numbers.

You can use role-based access control (RBAC) to control end-user access to data at a broad or granular level based on an end-user’s job role and permissions. With RBAC, you can create a role using SQL, grant a collection of granular permissions to the role, and then assign that role to end-users. Roles can be granted object-level, column-level, and system-level permissions. Additionally, RBAC introduces out-of-box system roles for DBAs, operators, security admins, or customized roles.

Row-level security (RLS) simplifies design and implementation of fine-grained access to the rows in tables. With RLS, you can restrict access to a subset of rows within a table based on the users’ job role or permissions with SQL.

Amazon Redshift support for dynamic data masking (DDM), which is now available in preview, allows you to simplify protecting PII such as Social Security numbers, credits card numbers, and phone numbers in your Amazon Redshift data warehouse. With dynamic data masking, you control access to your data through simple SQL-based masking policies that determine how Amazon Redshift returns sensitive data to the user at query time. You can create masking policies to define consistent, format-preserving, and irreversible masked data values. You can apply a masking policy on a specific column or list of columns in a table. Also, you have the flexibility of choosing how to show the masked data. For example, you can completely hide the data, replace partial real values with wildcard characters, or define your own way to mask the data using SQL expressions, Python, or AWS Lambda user-defined functions. Additionally, you can apply a conditional masking policy based on other columns, which selectively protects the column data in a table based on the values in one or more different columns.

We also announced enhancements to audit logging, native integration with Microsoft Azure Active Directory, and support for default IAM roles in additional Regions to further simplify security management.

Best price performance analytics

Customers continue to tell us that they need fast and cost-effective data warehouses that deliver high performance at any scale while keeping costs low. From day 1 since Amazon Redshift’s launch in 2012, we have taken a data-driven approach and used fleet telemetry to build a cloud data warehouse service that gives you the best price performance at any scale. Over the years, we have evolved Amazon Redshift’s architecture and launched features such as Redshift Managed Storage (RMS) for separation of storage and compute, Amazon Redshift Spectrum for data lake queries, automatic table optimization for physical schema optimization, automatic workload management to prioritize workloads and allocate the right compute and memory, cluster resize to scale compute and storage vertically, and concurrency scaling to dynamically scale compute out or in. Our performance benchmarks continue to demonstrate Amazon Redshift’s price performance leadership.

In 2022, we added new features such as the general availability of concurrency scaling for write operations like COPY, INSERT, UPDATE, and DELETE to support virtually unlimited concurrent users and queries. We also introduced performance improvements for string-based data processing through vectorized scans over lightweight, CPU-efficient, dictionary-encoded string columns, which allows the database engine to operate directly over compressed data.

We also added support for SQL operators such as MERGE (single operator for inserts or updates); CONNECY_BY (for hierarchical queries); GROUPING SETS, ROLLUP, and CUBE (for multi-dimensional reporting); and increased the size of the SUPER data type to 16 MB to make it easier for you to migrate from legacy data warehouses to Amazon Redshift.

Conclusion

Our customers continue to tell us that data and analytics remains a top priority for them and the need to cost-effectively extract more business value from their data during these times is more pronounced than any other time in the past. Amazon Redshift as your cloud data warehouse enables you to run complex SQL analytics with scale and performance on terabytes to petabytes of structured and unstructured data and make the insights widely available through popular BI and analytics tools.

Although we launched over 40 features in 2022 and the pace of innovation continues to accelerate, it remains day 1 and we look forward to hearing from you on how these features help you unlock more value for your organizations. We invite you to try these new features and get in touch with us through your AWS account team if you have further comments.


About the author

Manan Goel is a Product Go-To-Market Leader for AWS Analytics Services including Amazon Redshift at AWS. He has more than 25 years of experience and is well versed with databases, data warehousing, business intelligence, and analytics. Manan holds a MBA from Duke University and a BS in Electronics & Communications engineering.
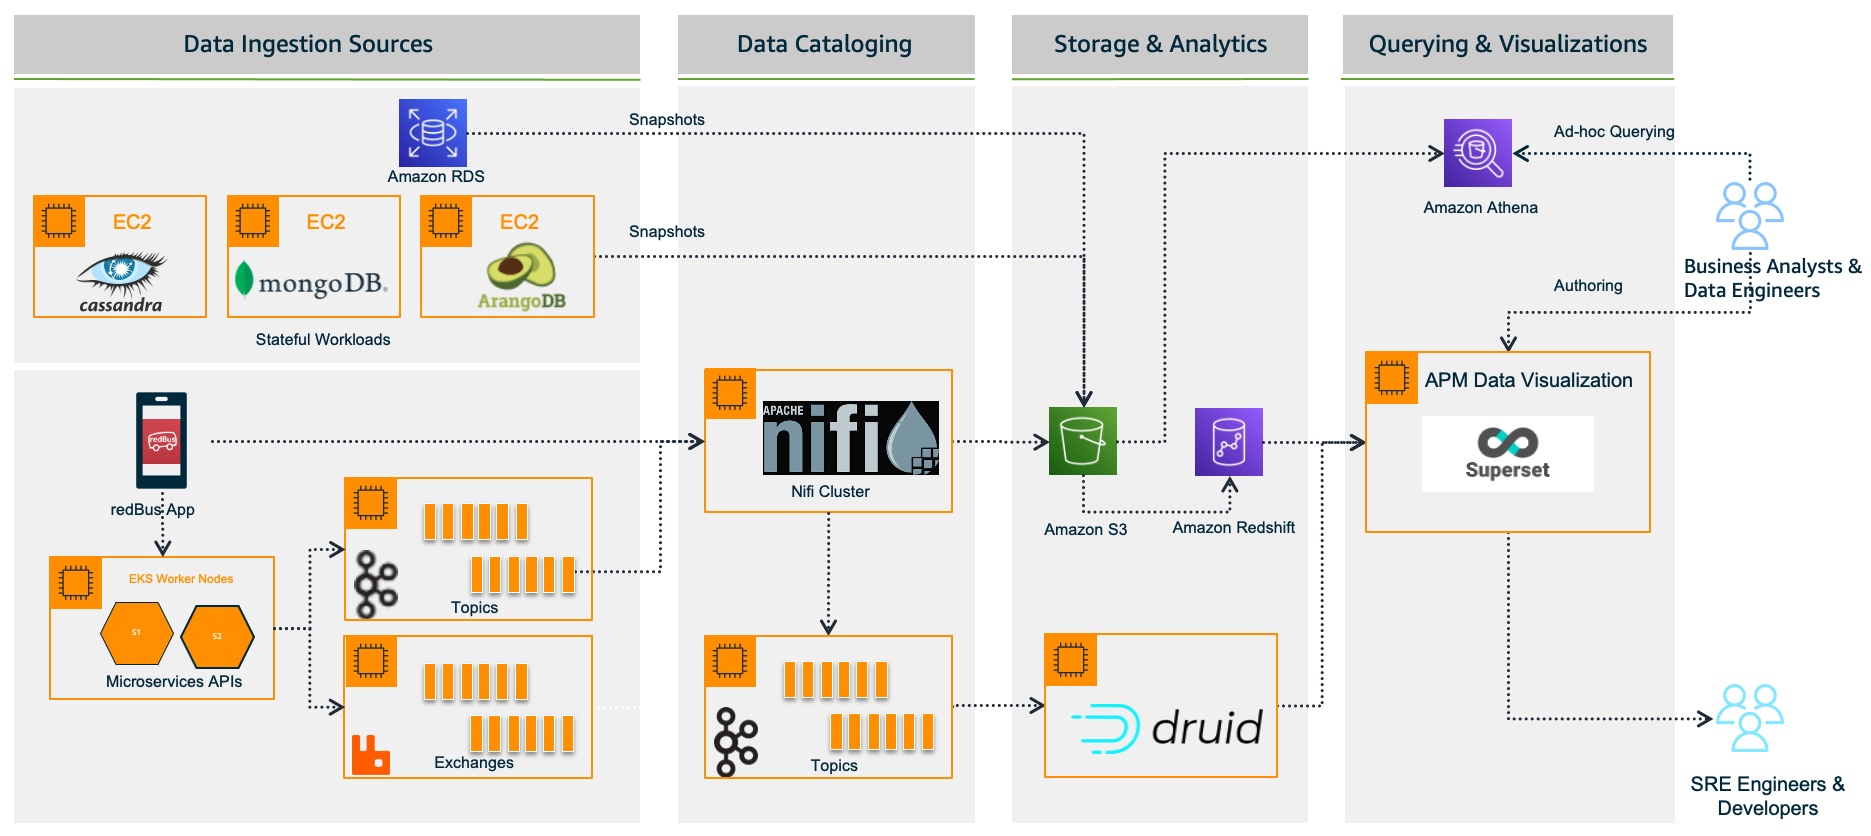
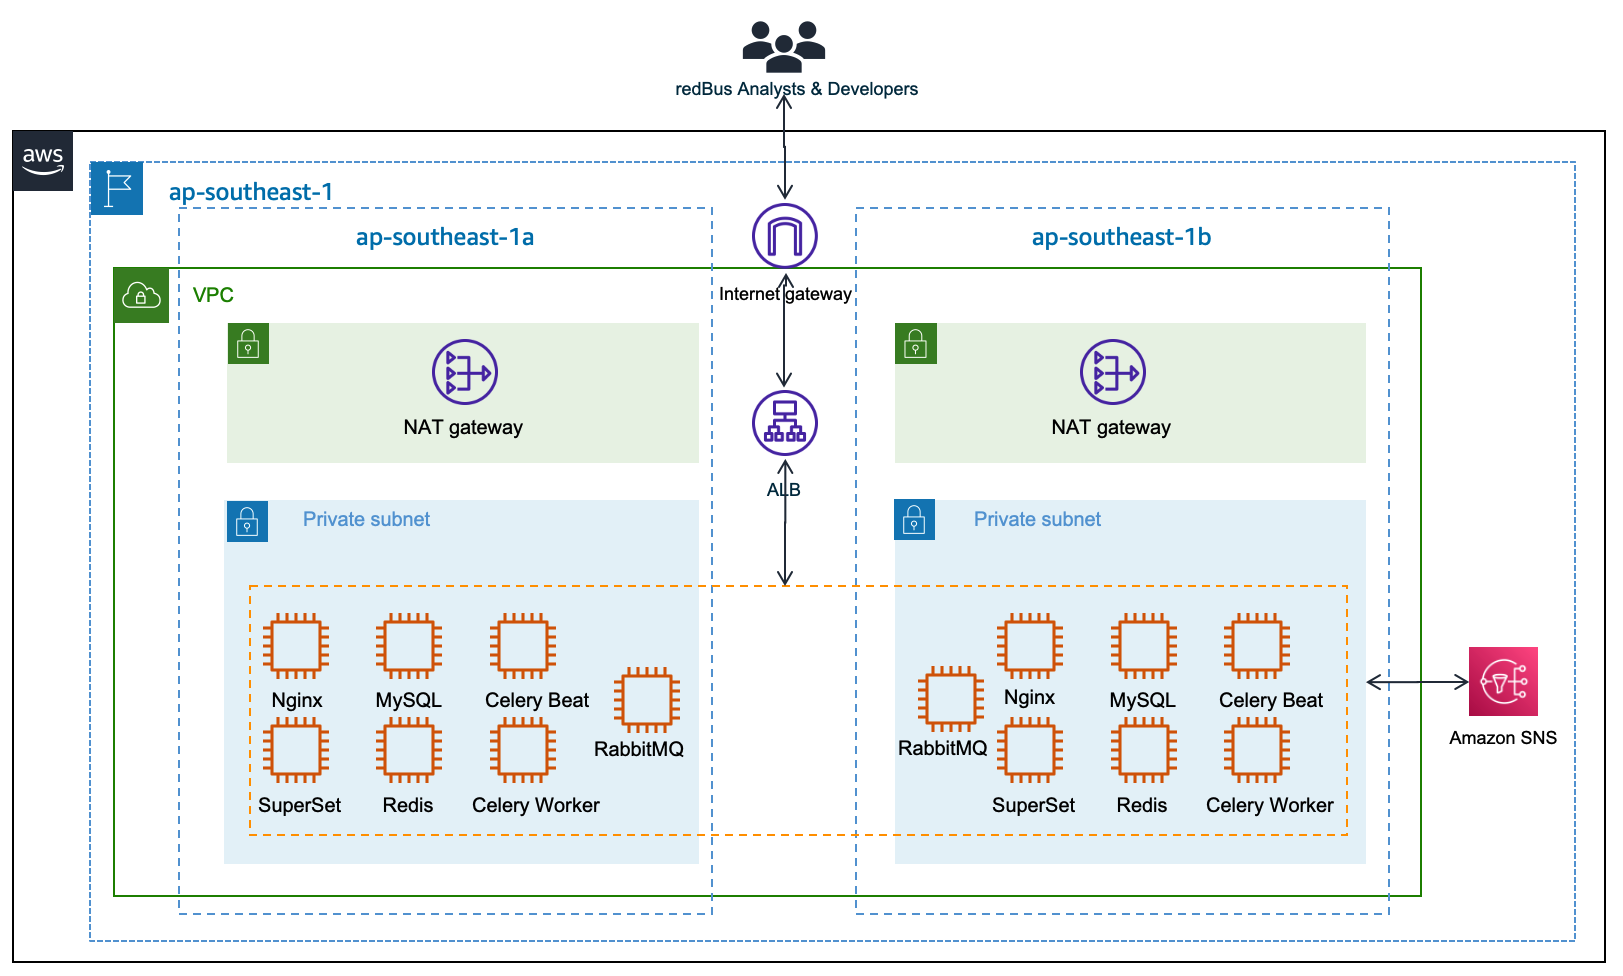
A dive into redBus’s data platform and how they used Amazon QuickSight to accelerate business insights

Post Syndicated from Girish Kumar Chidananda original https://aws.amazon.com/blogs/big-data/a-dive-into-redbuss-data-platform-and-how-they-used-amazon-quicksight-to-accelerate-business-insights/

This post is co-authored with Girish Kumar Chidananda from redBus.

redBus is one of the earliest adopters of AWS in India, and most of its services and applications are hosted on the AWS Cloud. AWS provided redBus the flexibility to scale their infrastructure rapidly while keeping costs extremely low. AWS has a comprehensive suite of services to cater to most of their needs, including providing customer support that redBus can vouch for.

In this post, we share redBus’s data platform architecture, and how various components are connected to form their data highway. We also discuss the challenges redBus faced in building dashboards for their real-time business intelligence (BI) use cases, and how they used Amazon QuickSight, a fast, easy-to-use, cloud-powered business analytics service that makes it easy for all employees within redBus to build visualizations and perform ad hoc analysis to gain business insights from their data, any time, and on any device.

About redBus

redBus is the world’s largest online bus ticketing platform built in India and serving more than 36 million happy customers around the world. Along with its bus ticketing vertical, redBus also runs a rail ticketing service called redRails and a bus and car rental service called rYde. It is part of the GO-MMT group, which is India’s leading online travel company, with an extensive brand portfolio that includes other prominent online travel brands like MakeMyTrip and Goibibo.

redBus’s data highway 1.0

redBus relies heavily on making data-driven decisions at every level, from its traveler journey tracking, forecasting demand during high traffic, identifying and addressing bottlenecks in their bus operators signup process, and more. As redBus’s business started growing in terms of the number of cities and countries they operated in and the number of bus operators and travelers using the service in each city, the amount of incoming data also increased. The need to access and analyze the data in one place required them to build their own data platform, as shown in the following diagram.

redBus data platform 1.0

In the following sections, we look at each component in more detail.

Data ingestion sources

With the data platform 1.0, the data is ingested from various sources:

  • Real time – The real-time data flows from redBus mobile apps, the backend microservices, and when a passenger, bus operator, or application does any operation like booking bus tickets, searching the bus inventory, uploading a KYC document, and more
  • Batch mode – Scheduled jobs fetch data from multiple persistent data stores like Amazon Relational Database Service (Amazon RDS), where the OLTP data from all its applications are stored, Apache Cassandra clusters, where the bus inventory from various operators is stored, Arango DB, where the user identity graphs are stored, and more

Data cataloging

The real-time data is ingested into their self-managed Apache Nifi clusters, an open-source data platform that is used to clean, analyze, and catalog the data with its routing capabilities before sending the data to its destination.

Storage and analytics

redBus uses the following services for its storage and analytical needs:

  • Amazon Simple Storage Service (Amazon S3), an object storage service that provides the foundation for their data lake because of its virtually unlimited scalability and higher durability. Real-time data flows from Apache Druid and data from the data stores flow at regular intervals based on the schedules.
  • Apache Druid, an OLAP-style data store (data flows via Kafka Druid data loader), which computes facts and metrics against various dimensions during the data loading process.
  • Amazon Redshift, a cloud data warehouse service that helps you analyze exabytes of data and run complex analytical queries. redBus uses Amazon Redshift to store the processed data from Amazon S3 and the aggregated data from Apache Druid.

Querying and visualization

To make redBus as data-driven as possible, they ensured that the data is accessible to their SRE engineers, data engineers, and business analysts via a visualization layer. This layer features dashboards being served using Apache SuperSet, an open-source data visualization application, and Amazon Athena, an interactive query service to analyze data in Amazon S3 using standard SQL for ad hoc querying requirements.

The challenges

Initially, redBus handled data that was being ingested at the rate of 10 million events per day. Over time, as its business started growing, so did the data volume (from gigabytes to terabytes to petabytes), data ingestion per day (from 10 million to 320 million events), and its business intelligence dashboard needs. Soon after, they started facing challenges with their self-managed Superset’s BI capabilities, and the increased operational complexities.

Limited BI capabilities

redBus encountered the following BI limitations:

  • Inability to create visualizations from multiple data sources – Superset doesn’t allow creating visualizations from multiple tables within its data exploration layer. redBus data engineers had to have the tables joined beforehand at the data source level itself. In order to create a 360-degree view for redBus’s business stakeholders, it became inconvenient for data engineers to maintain multiple tables supporting the visualization layer.
  • No global filter for visuals in a dashboard – A global or primary filter across visuals in a dashboard is not supported in Superset. For example, consider there are visuals like Sales Wins by Region, YTD Revenue Realized by Region, Sales Pipeline by Region, and more in a dashboard, and a filter Region is added to the dashboard with values like EMEA, APAC, and US. The filter Region will only apply to one of the visuals, not the entire dashboard. However, dashboard users expected filtering across the dashboard.
  • Not a business-user friendly tool – Superset is highly developer centric when it comes to customization. For example, if a redBus business analyst had to customize a timed refresh that automatically re-queries every slice on a dashboard according to a pre-set value, then the analyst has to update the dashboard’s JSON metadata field. Therefore, having knowledge of JSON and its syntax is mandatory for doing any customization on the visuals or dashboard.

Increased operational cost

Although Superset is open source, which means there are no licensing costs, it also means there is more effort in maintaining all the components required for it to function as an enterprise-grade BI tool. redBus has deployed and maintained a web server (Nginx) fronted by an Application Load Balancer to do the load balancing; a metadata database server (MySQL) where Superset stores its internal information like users, slices, and dashboard definitions; an asynchronous task queue (Celery) for supporting long-running queries; a message broker (RabbitMQ); and a distributed caching server (Redis) for caching the results, charting data, and more on Amazon Elastic Compute Cloud (Amazon EC2) instances. The following diagram illustrates this architecture.

Apache Superset Deploment at redBus

redBus’s DevOps team had to do the heavy lifting of provisioning the infrastructure, taking backups, scaling the components manually as needed, upgrading the components individually, and more. It also required a Python web developer to be around for making the configurational changes so all the components work together seamlessly. All these manual operations increased the total cost of ownership for redBus.

Journey towards QuickSight

redBus started exploring BI solutions primarily around a couple of its dashboarding requirements:

  • BI dashboards for business stakeholders and analysts, where the data is sourced via Amazon S3 and Amazon Redshift.
  • A real-time application performance monitoring (APM) dashboard to help their SRE engineers and developers identify the root cause of an issue in their microservices deployment so they can fix the issues before they affect their customer’s experience. In this case, the data is sourced via Druid.

QuickSight fit into most of redBus’s BI dashboard requirements, and in no time their data platform team started with a proof of concept (POC) for a couple of their complex dashboards. At the end of the POC, which spanned a month’s time, the team shared their findings.

First, QuickSight is rich in BI capabilities, including the following:

  • It’s a self-service BI solution with drag-and-drop features that could help redBus analysts comfortably use it without any coding efforts.
  • Visualizations from multiple data sources in a single dashboard could help redBus business stakeholders get a 360-degree view of sales, forecasting, and insights in a single pane of glass.
  • Cascading filters across visuals and across sheets in a dashboard are much-needed features for redBus’s BI requirements.
  • QuickSight offers Excel-like visuals—tables with calculations, pivot tables with cell grouping, and styling are attractive for the viewers.
  • The Super-fast, Parallel, In-memory Calculation Engine (SPICE) in QuickSight could help redBus scale to hundreds of thousands of users, who can all simultaneously perform fast interactive analysis across a wide variety of AWS data sources.
  • Off-the-shelf ML insights and forecasting at no additional cost would allow redBus’s data science team to focus on ML models besides sales forecasting and similar models.
  • Built-in row-level security (RLS) could allow redBus to grant filtered access for their viewers. For example, redBus has many business analysts who manage different countries. With RLS, each business analyst only sees data related to their assigned country within a single dashboard.
  • redBus uses OneLogin as its identity provider, which supports Security Assertion Markup Language 2.0 (SAML 2.0). With the help of identity federation and single sign-on support from QuickSight, redBus could provide a simple onboarding flow for their QuickSight users.
  • QuickSight offers built-in alerts and email notification capabilities.

Secondly, QuickSight is a fully managed, cloud-native, serverless BI service offering from AWS, with the following features:

  • redBus engineers don’t need to focus on the heavy lifting of provisioning, scaling, and maintaining their BI solution on EC2 instances.
  • QuickSight offers native integration with AWS services like Amazon Redshift, Amazon S3, and Athena, and other popular frameworks like Presto, Snowflake, Teradata, and more. QuickSight connects to most of the data sources that redBus already has except Apache Druid, because native integration with Druid was not available as of December 2022. For a complete list of the supported data sources, see Supported data sources.

The outcome

Considering all the rich features and lower total cost of ownership, redBus chose QuickSight for their BI dashboard requirements. With QuickSight, redBus’s data engineers have built a number of dashboards in no time to give insights from petabytes of data to business stakeholders and analysts. The redBus data highway evolved to bring business intelligence to a much wider audience in their organization, with better performance and faster time-to-value. As of November 2022, it combines QuickSight for business users and Superset for real-time APM dashboards (at the time of writing, QuickSight doesn’t offer a native connector to Druid), as shown in the following diagram.

redBus data platform 2.0

Sales anomaly detection dashboard

Although there are many dashboards that redBus deployed to production, sales anomaly detection is one of the interesting dashboards that redBus built. It uses redBus’s proprietary sales forecasting model, which in turn is sourced by historical sales data from Amazon Redshift tables and real-time sales data from Druid tables, as shown in the following figure.

Sales anomaly detection data flow

At regular intervals, the scheduled jobs feed the redBus forecasting model with real-time and historical sales data, and then the forecasted data is pushed into an Amazon Redshift table. The sales anomaly detection dashboard in QuickSight is served by the resultant Amazon Redshift table.

The following is one of the visuals from the sales anomaly detection dashboard. It’s built using a line chart representing hourly actual sales, predicted sales, and an alert threshold for a time series for a particular business cohort in redBus.

Sales and Predicted Sales for a particular cohort

In this visual, each bar represents the number of sales anomalies triggered at a particular point in the time series.

redBus’s analysts could further drill down to the sales details and anomalies at the minute level, as shown in the following diagram. This drill-down feature comes out of the box with QuickSight.

Drill-Down Chart - Sales and Predicted Sales for a particular cohort

For more details on adding drill-downs to QuickSight dashboard visuals, see Adding drill-downs to visual data in Amazon QuickSight.

Apart from the visuals, it has become one of viewers’ favorite dashboards at redBus due to the following notable features:

  • Because filtering across visuals is an out-of-the-box feature in QuickSight, a timestamp-based filter is added to the dashboard. This helps in filtering multiple visuals in the dashboard in a single click.
  • URL actions configured on the visuals help the viewers navigate to the context-sensitive in-house applications.
  • Email alerts configured on KPIs and Gauge visuals help the viewers get notifications on time.

Next steps

Apart from building new dashboards for their BI dashboard needs, redBus is taking the following next steps:

  • Exploring QuickSight Embedded Analytics for a couple of their application requirements to accelerate time to insights for users with in-context data visuals, interactive dashboards, and more directly within applications
  • Exploring QuickSight Q, which could enable their business stakeholders to ask questions in natural language and receive accurate answers with relevant visualizations that can help them gain insights from the data
  • Building a unified dashboarding solution using QuickSight covering all their data sources as integrations become available

Conclusion

In this post, we showed you how redBus built its data platform using various AWS services and Apache frameworks, the challenges the platform went through (especially in their BI dashboard requirements and challenges while scaling), and how they used QuickSight and lowered the total cost of ownership.

To know more about engineering at redBus, check out their medium blog posts. To learn more about what is happening in QuickSight or if you have any questions, reach out to the QuickSight Community, which is very active and offers several resources.


About the Authors


Author: Girish Chidanand
Girish Kumar Chidananda
works as a Senior Engineering Manager – Data Engineering at redBus, where he has been building various data engineering applications and components for redBus for the last 5 years. Prior to starting his journey in the IT industry, he worked as a Mechanical and Control systems engineer in various organizations, and he holds an MS degree in Fluid Power Engineering from University of Bath.


Author: Kayalvizhi Kandasamy
Kayalvizhi Kandasamy
works with digital-native companies to support their innovation. As a Senior Solutions Architect (APAC) at Amazon Web Services, she uses her experience to help people bring their ideas to life, focusing primarily on microservice architectures and cloud-native solutions using AWS services. Outside of work, she likes playing chess and is a FIDE rated chess player. She also coaches her daughters the art of playing chess, and prepares them for various chess tournaments.

Build a serverless streaming pipeline with Amazon MSK Serverless, Amazon MSK Connect, and MongoDB Atlas

Post Syndicated from Igor Alekseev original https://aws.amazon.com/blogs/big-data/build-a-serverless-streaming-pipeline-with-amazon-msk-serverless-amazon-msk-connect-and-mongodb-atlas/

This post was cowritten with Babu Srinivasan and Robert Walters from MongoDB.

Amazon Managed Streaming for Apache Kafka (Amazon MSK) is a fully managed, highly available Apache Kafka service. Amazon MSK makes it easy to ingest and process streaming data in real time and use that data easily within the AWS ecosystem. With Amazon MSK Serverless, you can automatically provision and manage required resources to provide on-demand streaming capacity and storage for your applications.

Amazon MSK also supports integration of data sources such as MongoDB Atlas via Amazon MSK Connect. MSK Connect allows serverless integration of MongoDB data with Amazon MSK using the MongoDB Connector for Apache Kafka.

MongoDB Atlas Serverless provides database services that dynamically scale up and down with data size and throughput—and the cost scales accordingly. It’s best suited for applications with variable demands to be managed with minimal configuration. It provides high performance and reliability with automated upgrade, encryption, security, metrics, and backup features built in with the MongoDB Atlas infrastructure.

MSK Serverless is a type of cluster for Amazon MSK. Just like MongoDB Atlas Serverless, MSK Serverless automatically provisions and scales compute and storage resources. You can now create end-to-end serverless workflows. You can build a serverless streaming pipeline with serverless ingestion using MSK Serverless and serverless storage using MongoDB Atlas. In addition, MSK Connect now supports private DNS hostnames. This allows Serverless MSK instances to connect to Serverless MongoDB clusters via AWS PrivateLink, providing you with secure connectivity between platforms.

If you’re interested in using a non-serverless cluster, refer to Integrating MongoDB with Amazon Managed Streaming for Apache Kafka (MSK).

This post demonstrates how to implement a serverless streaming pipeline with MSK Serverless, MSK Connect, and MongoDB Atlas.

Solution overview

The following diagram illustrates our solution architecture.

Data flow between AWS MSK and MongoDB Atlas

The data flow starts with an Amazon Elastic Compute Cloud (Amazon EC2) client instance that writes records to an MSK topic. As data arrives, an instance of the MongoDB Connector for Apache Kafka writes the data to a collection in the MongoDB Atlas Serverless cluster. For secure connectivity between the two platforms, an AWS PrivateLink connection is created between the MongoDB Atlas cluster and the VPC containing the MSK instance.

This post walks you through the following steps:

  1. Create the serverless MSK cluster.
  2. Create the MongoDB Atlas Serverless cluster.
  3. Configure the MSK plugin.
  4. Create the EC2 client.
  5. Configure an MSK topic.
  6. Configure the MongoDB Connector for Apache Kafka as a sink.

Configure the serverless MSK cluster

To create a serverless MSK cluster, complete the following steps:

  1. On the Amazon MSK console, choose Clusters in the navigation pane.
  2. Choose Create cluster.
  3. For Creation method, select Custom create.
  4. For Cluster name, enter MongoDBMSKCluster.
  5. For Cluster type¸ select Serverless.
  6. Choose Next.Serverless MSK Cluster creation UI
  7. On the Networking page, specify your VPC, Availability Zones, and corresponding subnets.
  8. Note the Availability Zones and subnets to use later.Cluster settings showing VPC and Subnets
  9. Choose Next.
  10. Choose Create cluster.

When the cluster is available, its status becomes Active.

Cluster Available for Use

Create the MongoDB Atlas Serverless cluster

To create a MongoDB Atlas cluster, follow the Getting Started with Atlas tutorial. Note that for the purposes of this post, you need to create a serverless instance.

Create new cluster dialog

After the cluster is created, configure an AWS private endpoint with the following steps:

  1. On the Security menu, choose Network Access.Network Access location in the Security menu
  2. On the Private Endpoint tab, choose Serverless Instance.
    Serverless Instance network access
  3. Choose Create new endpoint.
  4. For Serverless Instance, choose the instance you just created.
  5. Choose Confirm.Create Private Endpoint UI
  6. Provide your VPC endpoint configuration and choose Next.VPC Endpoint Configuration UI
  7. When creating the AWS PrivateLink resource, make sure you specify the exact same VPC and subnets that you used earlier when creating the networking configuration for the serverless MSK instance.
  8. Choose Next.VPC Endpoint Subnet Configuration UI
  9. Follow the instructions on the Finalize page, then choose Confirm after your VPC endpoint is created.

Upon success, the new private endpoint will show up in the list, as shown in the following screenshot.

Network Access Confirmation Page

Configure the MSK Plugin

Next, we create a custom plugin in Amazon MSK using the MongoDB Connector for Apache Kafka. The connector needs to be uploaded to an Amazon Simple Storage Service (Amazon S3) bucket before you can create the plugin. To download the MongoDB Connector for Apache Kafka, refer to Download a Connector JAR File.

  1. On the Amazon MSK console, choose Customized plugins in the navigation pane.
  2. Choose Create custom plugin.
  3. For S3 URI, enter the S3 location of the downloaded connector.
  4. Choose Create custom plugin.

MSK plugin details

Configure an EC2 client

Next, let’s configure an EC2 instance. We use this instance to create the topic and insert data into the topic. For instructions, refer to the section Configure an EC2 client in the post Integrating MongoDB with Amazon Managed Streaming for Apache Kafka (MSK).

Create a topic on the MSK cluster

To create a Kafka topic, we need to install the Kafka CLI first.

  1. On the client EC2 instance, first install Java:

sudo yum install java-1.8.0

  1. Next, run the following command to download Apache Kafka:

wget https://archive.apache.org/dist/kafka/2.6.2/kafka_2.12-2.6.2.tgz

  1. Unpack the tar file using the following command:

tar -xzf kafka_2.12-2.6.2.tgz

The distribution of Kafka includes a bin folder with tools that can be used to manage topics.

  1. Go to the kafka_2.12-2.6.2 directory and issue the following command to create a Kafka topic on the serverless MSK cluster:

bin/kafka-topics.sh --create --topic sandbox_sync2 --bootstrap-server <BOOTSTRAP SERVER> --command-config=bin/client.properties --partitions 2

You can copy the bootstrap server endpoint on the View Client Information page for your serverless MSK cluster.

Bootstrap Server Connection Page

You can configure IAM authentication by following these instructions.

Configure the sink connector

Now, let’s configure a sink connector to send the data to the MongoDB Atlas Serverless instance.

  1. On the Amazon MSK console, choose Connectors in the navigation pane.
  2. Choose Create connector.
  3. Select the plugin you created earlier.
  4. Choose Next.Sink Connector UI
  5. Select the serverless MSK instance that you created earlier.
  6. Enter your connection configuration as the following code:
connector.class=com.mongodb.kafka.connect.MongoSinkConnector
key.converter.schema.enable=false
value.converter.schema.enable=false
database=MongoDBMSKDemo
collection=Sink
tasks.max=1
topics=MongoDBMSKDemo.Source
connection.uri=(MongoDB Atlas Connection String Gos Here) 
value.converter=org.apache.kafka.connect.storage.StringConverter 
key.converter=org.apache.kafka.connect.storage.StringConverter

Make sure that the connection to the MongoDB Atlas Serverless instance is through AWS PrivateLink. For more information, refer to Connecting Applications Securely to a MongoDB Atlas Data Plane with AWS PrivateLink.

  1. In the Access Permissions section, create an AWS Identity and Access Management (IAM) role with the required trust policy.
  2. Choose Next.IAM Role configuration
  3. Specify Amazon CloudWatch Logs as your log delivery option.
  4. Complete your connector.

When the connector status changes to Active, the pipeline is ready.

Connector Confirmation Page

Insert data into the MSK topic

On your EC2 client, insert data into the MSK topic using the kafka-console-producer as follows:

bin/kafka-console-producer.sh --topic sandbox_sync2 --bootstrap-server <BOOTSTRAP SERVER> --producer.config=bin/client.properties

To verify that data successfully flows from the Kafka topic to the serverless MongoDB cluster, we use the MongoDB Atlas UI.

MongoDB Atlas Browse Collections UI

If you run into any issues, be sure to check the log files. In this example, we used CloudWatch to read the events that were generated from Amazon MSK and the MongoDB Connector for Apache Kafka.

CloudWatch Logs UI

Clean up

To avoid incurring future charges, clean up the resources you created. First, delete the MSK cluster, connector, and EC2 instance:

  1. On the Amazon MSK console, choose Clusters in the navigation pane.
  2. Select your cluster and on the Actions menu, choose Delete.
  3. Choose Connectors in the navigation pane.
  4. Select your connector and choose Delete.
  5. Choose Customized plugins in the navigation pane.
  6. Select your plugin and choose Delete.
  7. On the Amazon EC2 console, choose Instances in the navigation pane.
  8. Choose the instance you created.
  9. Choose Instance state, then choose Terminate instance.
  10. On the Amazon VPC console, choose Endpoints in the navigation pane.
  11. Select the endpoint you created and on the Actions menu, choose Delete VPC endpoints.

Now you can delete the Atlas cluster and AWS PrivateLink:

  1. Log in to the Atlas cluster console.
  2. Navigate to the serverless cluster to be deleted.
  3. On the options drop-down menu, choose Terminate.
  4. Navigate to the Network Access section.
  5. Choose the private endpoint.
  6. Select the serverless instance.
  7. On the options drop-down menu, choose Terminate.Endpoint Termination UI

Summary

In this post, we showed you how to build a serverless streaming ingestion pipeline using MSK Serverless and MongoDB Atlas Serverless. With MSK Serverless, you can automatically provision and manage required resources on an as-needed basis. We used a MongoDB connector deployed on MSK Connect to seamlessly integrate the two services, and used an EC2 client to send sample data to the MSK topic. MSK Connect now supports Private DNS hostnames, enabling you to use private domain names between the services. In this post, the connector used the default DNS servers of the VPC to resolve the Availability Zone-specific private DNS name. This AWS PrivateLink configuration allowed secure and private connectivity between the MSK Serverless instance and the MongoDB Atlas Serverless instance.

To continue your learning, check out the following resources:


About the Authors

Igor Alekseev is a Senior Partner Solution Architect at AWS in Data and Analytics domain. In his role Igor is working with strategic partners helping them build complex, AWS-optimized architectures. Prior joining AWS, as a Data/Solution Architect he implemented many projects in Big Data domain, including several data lakes in Hadoop ecosystem. As a Data Engineer he was involved in applying AI/ML to fraud detection and office automation.

Kiran Matty is a Principal Product Manager with Amazon Web Services (AWS) and works with the Amazon Managed Streaming for Apache Kafka (Amazon MSK) team based out of Palo Alto, California. He is passionate about building performant streaming and analytical services that help enterprises realize their critical use cases.

 Babu Srinivasan is a Senior Partner Solutions Architect at MongoDB. In his current role, he is working with AWS to build the technical integrations and reference architectures for the AWS and MongoDB solutions. He has more than two decades of experience in Database and Cloud technologies . He is passionate about providing technical solutions to customers working with multiple Global System Integrators(GSIs) across multiple geographies.

Robert Walters is currently a Senior Product Manager at MongoDB. Previous to MongoDB, Rob spent 17 years at Microsoft working in various roles, including program management on the SQL Server team, consulting, and technical pre-sales. Rob has co-authored three patents for technologies used within SQL Server and was the lead author of several technical books on SQL Server. Rob is currently an active blogger on MongoDB Blogs.