Tag Archives: contributed

Uploading large objects to Amazon S3 using multipart upload and transfer acceleration

Post Syndicated from James Beswick original https://aws.amazon.com/blogs/compute/uploading-large-objects-to-amazon-s3-using-multipart-upload-and-transfer-acceleration/

This post is written by Tam Baghdassarian, Cloud Application Architect, Rama Krishna Ramaseshu, Sr Cloud App Architect, and Anand Komandooru, Sr Cloud App Architect.

Web and mobile applications must often upload objects to the AWS Cloud. For example, services such as Amazon Photos allow users to upload photos and large video files from their browser or mobile application.

Amazon S3 can be ideal to store large objects due to its 5-TB object size maximum along with its support for reducing upload times via multipart uploads and transfer acceleration.

Overview

Developers who must upload large files from their web and mobile applications to the cloud can face a number of challenges. Due to underlying TCP throughput limits, a single HTTP connection cannot use the full bandwidth available, resulting in slower upload times. Furthermore, network latency and quality can result in poor or inconsistent user experience.

Using S3 features such as presigned URLs and multipart upload, developers can securely increase throughput and minimize upload retries due to network errors. Additionally, developers can use transfer acceleration to reduce network latency and provide a consistent user experience to their web and mobile app users across the globe.

This post references a sample application consisting of a web frontend and a serverless backend application. It demonstrates the benefits of using S3’s multipart upload and transfer acceleration features.
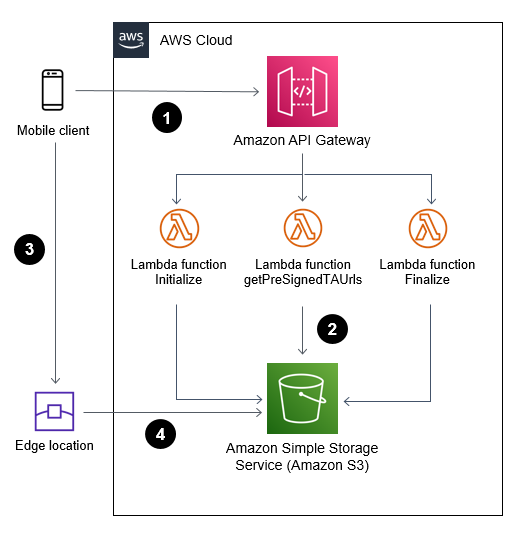
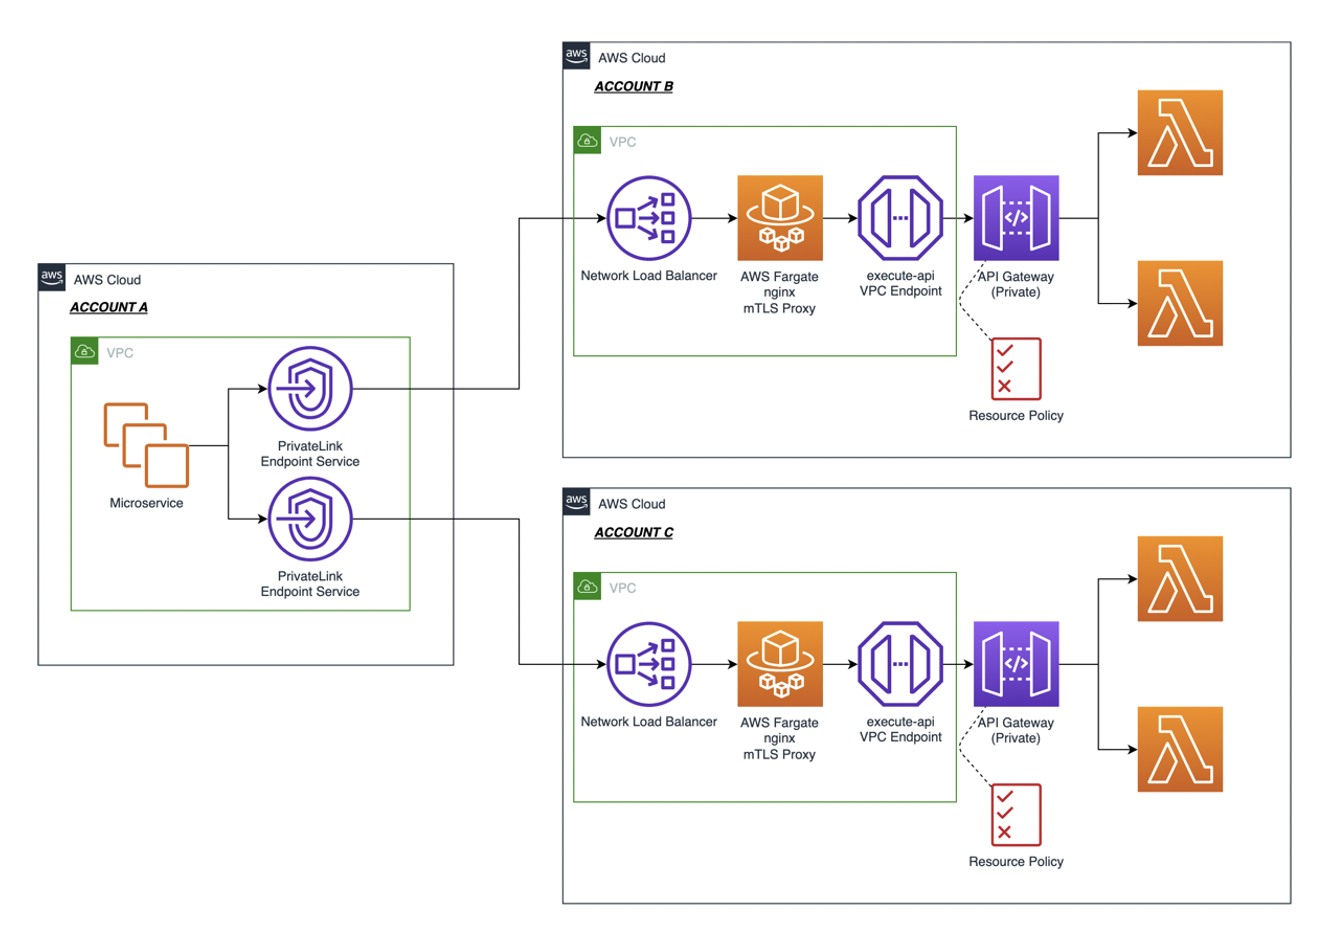
Architecture overview

Solution overview:

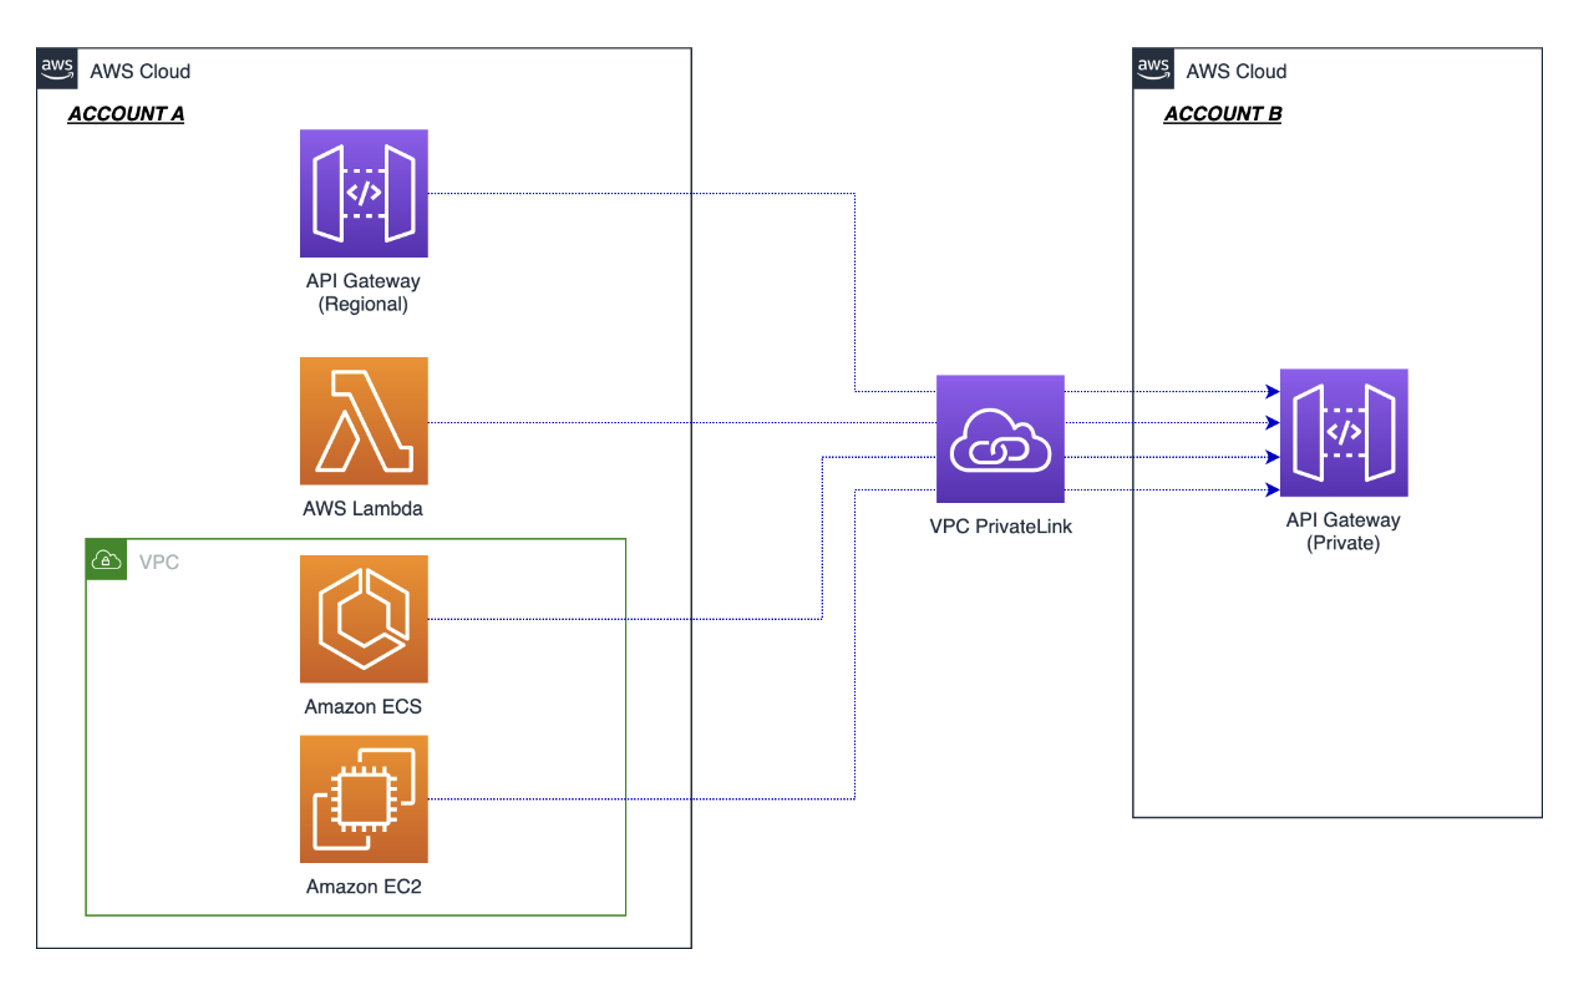
  1. Web or mobile application (frontend) communicates with AWS Cloud (backend) through Amazon API Gateway to initiate and complete a multipart upload.
  2. AWS Lambda functions invoke S3 API calls on behalf of the web or mobile application.
  3. Web or mobile application uploads large objects to S3 using S3 transfer acceleration and presigned URLs.
  4. File uploads are received and acknowledged by the closest edge location to reduce latency.

Using S3 multipart upload to upload large objects

A multipart upload allows an application to upload a large object as a set of smaller parts uploaded in parallel. Upon completion, S3 combines the smaller pieces into the original larger object.

Breaking a large object upload into smaller pieces has a number of advantages. It can improve throughput by uploading a number of parts in parallel. It can also recover from a network error more quickly by only restarting the upload for the failed parts.

Multipart upload consists of:

  1. Initiate the multipart upload and obtain an upload id via the CreateMultipartUpload API call.
  2. Divide the large object into multiple parts, get a presigned URL for each part, and upload the parts of a large object in parallel via the UploadPart API call.
  3. Complete the upload by calling the CompleteMultipartUpload API call.

When used with presigned URLs, multipart upload allows an application to upload the large object using a secure, time-limited method without sharing private bucket credentials.

This Lambda function can initiate a multipart upload on behalf of a web or mobile application:

const multipartUpload = await s3. createMultipartUpload(multipartParams).promise()
return {
    statusCode: 200,
    body: JSON.stringify({
        fileId: multipartUpload.UploadId,
        fileKey: multipartUpload.Key,
      }),
    headers: {
      'Access-Control-Allow-Origin': '*'
    }
};

The UploadId is required for subsequent calls to upload each part and complete the upload.

Uploading objects securely using S3 presigned URLs

A web or mobile application requires write permission to upload objects to a S3 bucket. This is usually accomplished by granting access to the bucket and storing credentials within the application.

You can use presigned URLs to access S3 buckets securely without the need to share or store credentials in the calling application. In addition, presigned URLs are time-limited (the default is 15 minutes) to apply security best practices.

A web application calls an API resource that uses the S3 API calls to generate a time-limited presigned URL. The web application then uses the URL to upload an object to S3 within the allotted time, without having explicit write access to the S3 bucket. Once the presigned URL expires, it can no longer be used.

When combined with multipart upload, a presigned URL can be generated for each of the upload parts, allowing the web or mobile application to upload large objects.

This example demonstrates generating a set of presigned URLs for index number of parts:

    const multipartParams = {
        Bucket: bucket_name,
        Key: fileKey,
        UploadId: fileId,
    }
    const promises = []

    for (let index = 0; index < parts; index++) {
        promises.push(
            s3.getSignedUrlPromise("uploadPart", {
            ...multipartParams,
            PartNumber: index + 1,
            Expires: parseInt(url_expiration)
            }),
        )
    }
    const signedUrls = await Promise.all(promises)

Prior to calling getSignedUrlPromise, the client must obtain an UploadId via CreateMultipartUpload. Read Generating a presigned URL to share an object for more information.

Reducing latency by using transfer acceleration

By using S3 transfer acceleration, the application can take advantage of the globally distributed edge locations in Amazon CloudFront. When combined with multipart uploads, each part can be uploaded automatically to the edge location closest to the user, reducing the upload time.

Transfer acceleration must be enabled on the S3 bucket. It can be accessed using the endpoint bucketname.s3-acceleration.amazonaws.com or bucketname.s3-accelerate.dualstack.amazonaws.com to connect to the enabled bucket over IPv6.

Use the speed comparison tool to test the benefits of the transfer acceleration from your location.

You can use transfer acceleration with multipart uploads and presigned URLs to allow a web or mobile application to upload large objects securely and efficiently.

Transfer acceleration needs must be enabled on the S3 bucket. This example creates an S3 bucket with transfer acceleration using CDK and TypeScript:

const s3Bucket = new s3.Bucket(this, "document-upload-bucket", {
      bucketName: “BUCKET-NAME”,
      encryption: BucketEncryption.S3_MANAGED,
      enforceSSL: true,
      transferAcceleration: true,      
      removalPolicy: cdk.RemovalPolicy.DESTROY
    });

After activating transfer acceleration on the S3 bucket, the backend application can generate transfer acceleration-enabled presigned URLs. by initializing the S3 SDK:

s3 = new AWS.S3({useAccelerateEndpoint: true});

The web or mobile application then use the presigned URLs to upload file parts.

See S3 transfer acceleration for more information.

Deploying the test solution

To set up and run the tests outlined in this blog, you need:

  • An AWS account.
  • Install and configure AWS CLI.
  • Install and bootstrap AWS CDK.
  • Deploy the backend and frontend solution at the following git repository.
  • A sufficiently large test upload file of at least 100 MB.

To deploy the backend:

  1. Clone the repository to your local machine.
  2. From the backendv2 folder, install all dependencies by running:
    npm install
  3. Use CDK to deploy the backend to AWS:
    cdk deploy --context env="randnumber" --context whitelistip="xx.xx.xxx.xxx"

You can use an additional context variable called “urlExpiry” to set a specific expiration time on the S3 presigned URL. The default value is set at 300 seconds. A new S3 bucket with the name “document-upload-bucket-randnumber” is created for storing the uploaded objects, and the whitelistip value allows API Gateway access from this IP address only.

Note the API Gateway endpoint URL for later.

To deploy the frontend:

  1. From the frontend folder, install the dependencies:
    npm install
  2. To launch the frontend application from the browser, run:
    npm run start

Testing the application

Testing the application

To test the application:

  1. Launch the user interface from the frontend folder:
    npm run
  2. Enter the API Gateway address in the API URL textbox.Select the maximum size of each part of the upload (the minimum is 5 MB) and the number of parallel uploads. Use your available bandwidth, TCP window size, and retry time requirements to determine the optimal part size. Web browsers have a limit on the number of concurrent connections to the same server. Specifying a larger number of concurrent connections results in blocking on the web browser side.
  3. Decide if transfer acceleration should be used to further reduce latency.
  4. Choose a test upload file.
  5. Use the Monitor section to observe the total time to upload the test file.

Experiment with different values for part size, number of parallel uploads, use of transfer acceleration and the size of the test file to see the effects on total upload time. You can also use the developer tools for your browser to gain more insights.

Test results

The following tests have the following characteristics:

  • The S3 bucket is located in the US East Region.
  • The client’s average upload speed is 79 megabits per second.
  • The Firefox browser uploaded a file of 485 MB.

Test 1 – Single part upload without transfer acceleration

To create a baseline, the test file is uploaded without transfer acceleration and using only a single part. This simulates a large file upload without the benefits of multipart upload. The baseline result is 72 seconds.

Single part upload without transfer acceleration

Test 2 – Single upload with transfer acceleration

The next test measured upload time using transfer acceleration while still maintaining a single upload part with no multipart upload benefits. The result is 43 seconds (40% faster).

Single upload with transfer acceleration

Test 3 – Multipart upload without transfer acceleration

This test uses multipart upload by splitting the test file into 5-MB parts with a maximum of six parallel uploads. Transfer acceleration is disabled. The result is 45 seconds (38% faster).

Multipart upload without transfer acceleration

Test 4 – Multipart upload with transfer acceleration

For this test, the test file is uploaded by splitting the file into 5-MB parts with a maximum of six parallel uploads. Transfer acceleration is enabled for each upload. The result is 28 seconds (61% faster).

Multipart upload with transfer acceleration

The following chart summarizes the test results.

Multipart upload Transfer acceleration Upload time
No No 72s
Yes No 43s
No Yes 45s
Yes Yes 28s

Conclusion

This blog shows how web and mobile applications can upload large objects to Amazon S3 in a secured and efficient manner when using presigned URLs and multipart upload.

Developers can also use transfer acceleration to reduce latency and speed up object uploads. When combined with multipart upload, you can see upload time reduced by up to 61%.

Use the reference implementation to start incorporating multipart upload and S3 transfer acceleration in your web and mobile applications.

For more serverless learning resources, visit Serverless Land.

Developing portable AWS Lambda functions

Post Syndicated from Pascal Vogel original https://aws.amazon.com/blogs/compute/developing-portable-aws-lambda-functions/

This blog post is written by Uri Segev, Principal Serverless Specialist Solutions Architect

When developing new applications or modernizing existing ones, you might face a dilemma: which compute technology to use? A serverless compute service such as AWS Lambda or maybe containers? Often, serverless can be the better approach thanks to automatic scaling, built-in high availability, and a pay-for-use billing model. However, you may hesitate to choose serverless for reasons such as:

  • Perceived higher cost or difficulty in estimating cost
  • It is a paradigm shift, which requires learning to bridge the knowledge gap
  • Misconceptions about Lambda capabilities and use cases
  • Concern that using Lambda will result in lock-in
  • Existing investments in non-serverless platforms and tooling

This blog post suggests best practices for developing portable Lambda functions that allow you to easily port your code to containers if you later choose to. By doing so, you can avoid lock-in and try out the serverless approach in a risk-free way.

Each section of this blog post describes what you need to consider when writing portable code and the steps needed to migrate this code from Lambda to containers, if you later choose to do so.

Best practices for portable Lambda functions

Separate business logic and Lambda handler

Lambda functions are event-driven in nature. When a specific event happens, it invokes the Lambda function by calling its handler method. The handler method receives an event object which contains information regarding the reason for the function invocation. Once the function execution completes, it returns from the handler method. Whatever is returned from the handler is the function’s return value.

To write portable code, we recommend using the handler method only as an interface between the Lambda runtime (event object) and the business logic. Using Hexagonal architecture terminology, the handler should be a driving adapter making calls into the port, which is the interface exposed by the business logic The handler should extract all required information from the event object and then call a separate method that implements the business logic.

When that method returns, the handler constructs the result in the format expected by the function invoker and returns it. We also recommend splitting the handler code and the business logic code into separate files. Should you choose to migrate to containers later, you simply migrate your business logic code files with no additional changes.

The following pseudocode shows a Lambda handler that extracts information from the event object and calls the business logic. Once the business logic is done, the handler places the response in the function’s return value:

import business_logic

# The Lambda handler extracts needed information from the event
# object and invokes the business logic
handler(event, context) {
  # Extract needed information from event object payload = event[‘payload’]

  # Invoke business logic
  result = do_some_logic(payload)
  
  # Construct result for API Gateway
  return {
    statusCode: 200,
	body: result
  }
}

The following pseudocode shows the business logic. It’s located in a separate file and is unaware that it is being invoked from a Lambda function. It is pure logic.

# This is the business logic. It knows nothing about who invokes it.
do_some_logic(data) {
result = "This is my result."
  return result
}

This approach also makes it easier to run unit tests on the business logic without the need to construct event objects and to invoke the Lambda handler.

If you migrate to containers later, you include the business logic files in your container with new interface code as described in the following section.

Event source integration

One benefit of Lambda functions is the event source integration. For instance, if you integrate Lambda with Amazon Simple Queue Service (Amazon SQS), the Lambda service will take care of polling the queue, invoking the Lambda function and deleting the messages from the queue when done. By using this integration, you need to write less boilerplate code. You can focus only on implementing business logic and not the integration with the event source.

The following pseudocode shows how the Lambda handler looks like for an SQS event source:

import business_logic

handler(event, context) {
  entries = []
  # Iterate over all the messages in the event object
  for message in event[‘Records’] {
    # Call the business logic to process a single message
    success = handle_message(message)

    # Start building the response
    if Not success {
      entries.append({
      'itemIdentifier': message['messageId']
      })
    }
  }

  # Notify Lambda about failed items.
  if (let(entries) > 0) {
    return {
      'batchItemFailures': entries
    }
  }
}

As you can see in the previous code, the Lambda function has almost no knowledge that it is being invoked from SQS. There are no SQS API calls. It only knows the structure of the event object, which is specific to SQS.

When moving to a container, the integration responsibility moves from the Lambda service to you, the developer. There are different event sources in AWS, and each of them will require a different approach for consuming events and invoking business logic. For example, if the event source is Amazon API Gateway, your application will need to create an HTTP server that listens on an HTTP port and waits for incoming requests in order to invoke the business logic.

If the event source is Amazon Kinesis Data Streams, your application will need to run a poller that reads records from the shards, keep track of processed records, handle the case of a change in the number of shards in the stream, retry on errors, and more. Regardless of the event source, if you follow the previous recommendations, you will not need to change anything in the business logic code.

The following pseudocode shows how the integration with SQS will look like in a container. Note that you will lose some features such as batching, filtering, and, of course, automatic scaling.

import aws_sdk
import business_logic

QUEUE_URL = os.environ['QUEUE_URL']
BATCH_SIZE = os.environ.get('BATCH_SIZE', 1)
sqs_client = aws_sdk.client('sqs')

main() {
  # Infinite loop to poll for messages from SQS
  while True {

    # Receive a batch of messages from the queue
    response = sqs_client.receive_message(
      QueueUrl = QUEUE_URL,
      MaxNumberOfMessages = BATCH_SIZE,
      WaitTimeSeconds = 20 )

    # Loop over the messages in the batch
    entries = []
    i = 1
    for message in response.get('Messages',[]) {
      # Process a single message
      success = handle_message(message)

      # Append the message handle to an array that is later
      # used to delete processed messages
      if success {
        entries.append(
          {
            'Id': f'index{i}',
            'ReceiptHandle': message['receiptHandle']
          }
        )
        i += 1
      }
    }

    # Delete all the processed messages
    if (len(entries) > 0) {
      sqs_client.delete_message_batch(
        QueueUrl = QUEUE_URL,
        Entries = entries
      )
    }
  }
}

Another point to consider here is Lambda destinations. If your function is invoked asynchronously and you configured a destination for your function, you will need to include that in the interface code. It will need to catch any business logic error and, based on that, invoke the right destination.

Package functions as containers

Lambda supports packaging functions as .zip files and container images. To develop portable code, we recommend using container images as your default packaging method. Even though you package the function as a container image, you can’t run it on other container platforms such as Amazon Elastic Container Service (Amazon ECS) or Amazon Elastic Kubernetes Service (EKS). However, by packaging it this way, the migration to containers later will be easier as you are already using the same tools and you already created a Dockerfile that will require minimal changes.

An example Dockerfile for Lambda looks like this:

FROM public.ecr.aws/lambda/python:3.9
COPY *.py requirements.txt ./
RUN python3.9 -m pip install -r requirements.txt -t .
CMD ["app.lambda_handler"]

If you move to containers later, you will need to change the Dockerfile to use a different base image and adapt the CMD line that defines how to start the application. This is in addition to the code changes described in the previous section.

The corresponding Dockerfile for the container will look like this:

FROM python:3.9
COPY *.py requirements.txt ./
RUN python3.9 -m pip install -r requirements.txt -t .
CMD ["python", "./app.py"]

The deployment pipeline also needs to change as we deploy to a different target. However, building the artifacts remains the same.

Single invocation per instance

Lambda functions run in their own isolated runtime environment. Each environment handles a single request at a time which works great for Lambda. However, if you migrate your application to containers, you will likely invoke the business logic from multiple threads in a single process at the same time.

This section discusses aspects of moving from a single invocation to multiple concurrent invocations within the same process.

Static variables

Static variables are those that are instantiated once and then reused across multiple invocations. Examples of such variables are database connections or configuration information.

For function optimization, and specifically for reducing cold starts and the duration of warm function invocations, we recommend initializing all static variables outside the function handler and storing them in global variables so that further invocations will reuse them.

We recommend using an initialization function that you write as part of the business logic module and that you invoke from outside the handler. This function saves information in global variables that the business logic code reuses across invocations.

The following pseudocode shows the Lambda function:

import business_logic

# Call the initialization code
initialize()

handler(event, context) {
  ...
  # Call the business logic
  ...
}

And the business logic code will look like this:

# Global variables used to store static data
var config

initialize() {
  config = read_Config()
}

do_some_logic(data) {
  # Do something with config object
  ...
}

The same also applies to containers. You will usually initialize static variables when the process starts and not for every single request. When moving to containers, all you need to do is call the initialization function before starting the main application loop.

import business_logic

# Call the initialization code
initialize()

main() {
  while True {
    ...
    # Call the business logic
    ...
  }
}

As you can see, there are no changes in the business logic code.

Database connections

As Lambda functions share nothing between the runtime environments, unlike containers they can’t rely on connection pools when connecting to a relational database. For this reason, we created Amazon RDS Proxy, which acts as a centralized connection pool used by many functions.

To write portable Lambda functions, we recommend using a connection pool object with a single connection. Your business logic code will always ask for a connection from the pool when making a database request. You will still need to use RDS Proxy.

If you later move to containers, you can increase the number of connections in the pool to a larger number with no further changes and the application will scale without overwhelming the database.

File system

Lambda functions come with a writable /tmp folder in the size of 512 MB to 10 GB. As each function instance runs in an isolated runtime environment, developers usually use fixed file names for files stored in that folder. If you run the same business logic code in a container in multiple threads, the different threads will overwrite the files created by others.

We recommended using unique file names in each invocation. Append a UUID or another random number to the file name. Delete the files once you are done with them to avoid running out of space.

If you move your code to containers later, there is nothing to do.

Portable web applications

If you develop a web application, there is another way to achieve portability. You can use the AWS Lambda Web Adapter project to host a web app inside a Lambda function. This way you can develop a web application with familiar frameworks (e.g., Express.js, Next.js, Flask, Spring Boot, Laravel, or anything that uses HTTP 1.1/1.0), and run it on Lambda. If you package your web application as a container, the same Docker image can run on Lambda (using the web adapter) and containers.

Porting from containers to Lambda

This blog post demonstrates how to develop portable Lambda functions you can easily port to containers. Taking these recommendations into consideration can also help develop portable code in general, which allows you to port containers to Lambda functions.

Some things to consider:

  • Separate the business logic from the interface code in the container. The interface code should interact with the event sources and invoke the business logic.
  • As Lambda functions only have a /tmp writable folder, replicate this in your containers (even though you could write to different locations).

Conclusion

This blog post suggests best practices for developing Lambda functions that allow you to gain the benefits of a serverless approach without risking lock-in.

By following these best practices for separating business logic from Lambda handlers, packaging functions as containers, handling Lambda’s single invocation per instance, and more, you can develop portable Lambda functions. As a consequence, you will be able to port your code from Lambda to containers with minimal effort if you choose to move to containers later.

Refer to these best practices and code samples to ease the adoption of a serverless approach when developing your next application.

For more serverless learning resources, visit Serverless Land.

Implementing reactive progress tracking for AWS Step Functions

Post Syndicated from Benjamin Smith original https://aws.amazon.com/blogs/compute/implementing-reactive-progress-tracking-for-aws-step-functions/

This blog post is written by Alexey Paramonov, Solutions Architect, ISV and Maximilian Schellhorn, Solutions Architect ISV

This blog post demonstrates a solution based on AWS Step Functions and Amazon API Gateway WebSockets to track execution progress of a long running workflow. The solution updates the frontend regularly and users are able to track the progress and receive detailed status messages.

Websites with long-running processes often don’t provide feedback to users, leading to a poor customer experience. You might have experienced this when booking tickets, searching for hotels, or buying goods online. These sites often call multiple backend and third-party endpoints and aggregate the results to complete your request, causing the delay. In these long running scenarios, a transparent progress tracking solution can create a better user experience.

Overview

The example provided uses:

  • AWS Serverless Application Model (AWS SAM) for deployment: an open-source framework for building serverless applications.
  • AWS Step Functions for orchestrating the workflow.
  • AWS Lambda for mocking long running processes.
  • API Gateway to provide a WebSocket API for bidirectional communications between clients and the backend.
  • Amazon DynamoDB for storing connection IDs from the clients.

The example provides different options to report the progress back to the WebSocket connection by using Step Functions SDK integration, Lambda integrations, or Amazon EventBridge.

The following diagram outlines the example:

  1. The user opens a connection to WebSocket API. The OnConnect and OnDisconnect Lambda functions in the “WebSocket Connection Management” section persist this connection in DynamoDB (see documentation). The connection is bidirectional, meaning that the user can send requests through the open connection and the backend can respond with a new progress status whenever it is available.
  2. The user sends a new order through the WebSocket API. API Gateway routes the request to the “OnOrder” AWS Lambda function, which starts the state machine execution.
  3. As the request propagates through the state machine, we send progress updates back to the user via the WebSocket API using AWS SDK service integrations.
  4. For more customized status responses, we can use a centralized AWS Lambda function “ReportProgress” that updates the WebSocket API.

How to respond to the client?

To send the status updates back to the client via the WebSocket API, three options are explored:

Option 1: AWS SDK integration with API Gateway invocation

As the diagram shows, the API Gateway workflow tasks starting with the prefix “Report:” send responses directly to the client via the WebSocket API. This is an example of the state machine definition for this step:

          'Report: Workflow started':
            Type: Task
            Resource: arn:aws:states:::apigateway:invoke
            ResultPath: $.Params
            Parameters:
              ApiEndpoint: !Join [ '.',[ !Ref ProgressTrackingWebsocket, execute-api, !Ref 'AWS::Region', amazonaws.com ] ]
              Method: POST
              Stage: !Ref ApiStageName
              Path.$: States.Format('/@connections/{}', $.ConnectionId)
              RequestBody:
                Message: 🥁 Workflow started
                Progress: 10
              AuthType: IAM_ROLE
            Next: 'Mock: Inventory check'

This option reports the progress directly without using any additional Lambda functions. This limits the system complexity, reduces latency between the progress update and the response delivered to the client, and potentially reduces costs by reducing Lambda execution duration. A potential drawback is the limited customization of the response and getting familiar with the definition language.

Option 2: Using a Lambda function for reporting the progress status

To further customize response logic, create a Lambda function for reporting. As shown in point 4 of the diagram, you can also invoke a “ReportProgress” function directly from the state machine. This Python code snippet reports the progress status back to the WebSocket API:

apigw_management_api_client = boto3.client('apigatewaymanagementapi', endpoint_url=api_url)
apigw_management_api_client.post_to_connection(
            ConnectionId=connection_id,
            Data=bytes(json.dumps(event), 'utf-8')
        )

This option allows for more customizations and integration into the business logic of other Lambda functions to track progress in more detail. For example, execution of loops and reporting back on every iteration. The tradeoff is that you must handle exceptions and retries in your code. It also increases overall system complexity and additional costs associated with Lambda execution.

Option 3: Using EventBridge

You can combine option 2 with EventBridge to provide a centralized solution for reporting the progress status. The solution also handles retries with back-off if the “ReportProgress” function can’t communicate with the WebSocket API.

You can also use AWS SDK integrations from the state machine to EventBridge instead of using API Gateway. This has the additional benefit of a loosely coupled and resilient system but you could experience increased latency due to the additional services used. The combination of EventBridge and the Lambda function adds a minimal latency, but it might not be acceptable for short-lived workflows. However, if the workflow takes tens of seconds to complete and involves numerous steps, option 3 may be more suitable.

This is the architecture:

  1. As before.
  2. As before.
  3. AWS SDK integration sends the status message to EventBridge.
  4. The message propagates to the “ReportProgress” Lambda function.
  5. The Lambda function sends the processed message through the WebSocket API back to the client.

Deploying the example

Prerequisites

Make sure you can manage AWS resources from your terminal.

  • AWS CLI and AWS SAM CLI installed.
  • You have an AWS account. If not, visit this page.
  • Your user has sufficient permissions to manage AWS resources.
  • Git is installed.
  • NPM is installed (only for local frontend deployment).

To view the source code and documentation, visit the GitHub repo. This contains both the frontend and backend code.

To deploy:

  1. Clone the repository:
    git clone "https://github.com/aws-samples/aws-step-functions-progress-tracking.git"
  2. Navigate to the root of the repository.
  3. Build and deploy the AWS SAM template:
    sam build && sam deploy --guided
  4. Copy the value of WebSocketURL in the output for later.
  5. The backend is now running. To test it, use a hosted frontend.

Alternatively, you can deploy the React-based frontend on your local machine:

  1. Navigate to “progress-tracker-frontend/”:
    cd progress-tracker-frontend
  2. Launch the react app:
    npm start
  3. The command opens the React app in your default browser. If it does not happen automatically, navigate to http://localhost:3000/ manually.

Now the application is ready to test.

Testing the example application

  1. The webpage requests a WebSocket URL – this is the value from the AWS SAM template deployment. Paste it into Enter WebSocket URL in the browser and choose Connect.
  2. On the next page, choose Send Order and watch how the progress changes.

    This sends the new order request to the state machine. As it progresses, you receive status messages back through the WebSocket API.
  3. Optionally, you can inspect the raw messages arriving to the client. Open the Developer tools in your browser and navigate to the Network tab. Filter for WS (stands for WebSocket) and refresh the page. Specify the WebSocket URL, choose Connect and then choose Send Order.

Cleaning up

The services used in this solution are eligible for AWS Free Tier. To clean up the resources, in the root directory of the repository run:

sam delete

This removes all resources provisioned by the template.yml file.

Conclusion

In this post, you learn how to augment your Step Functions workflows with low latency progress tracking via API Gateway WebSockets. Consider adding the progress tracking to your long running workflows to improve the customer experience and provide a reactive look and feel for your application.

Navigate to the GitHub repository and review the implementation to see how your solution could become more user friendly and responsive. Start with examining the template.yml and the state machine’s definition and see how the frontend handles WebSocket communication and message visualization.

For more serverless learning resources, visit  Serverless Land.

Migrating to token-based authentication for iOS applications with Amazon SNS

Post Syndicated from Pascal Vogel original https://aws.amazon.com/blogs/compute/migrating-to-token-based-authentication-for-ios-applications-with-amazon-sns/

This post is written by Yashlin Naidoo, Cloud Support Engineer.

Amazon Simple Notification Service (Amazon SNS) enables you to send notifications directly to a mobile push endpoint. For iOS apps, Amazon SNS dispatches the notification on your application’s behalf to the Apple Push Notification service (APNs).

To send mobile push notifications via Amazon SNS, you must provide a set of credentials to connect to the APNs (see Prerequisites for Amazon SNS user notifications).

Amazon SNS supports two methods for authenticating with iOS mobile push endpoints when sending a mobile push notification via the APNs:

  • Certificate-based authentication
  • Token-based authentication

To use certificate-based authentication, you must configure Amazon SNS with a provider certificate. Amazon SNS will use this certificate on your behalf to establish a secure connection with the APNs to dispatch your mobile push notifications. For each application that you support, you will need to provide unique certificates.

As the number of applications you manage grows, you will also need to create and manage an increasing number of certificates. Furthermore, certificates expire yearly, and you must renew them to ensure that Amazon SNS can continue to send mobile push notifications on your behalf. To learn more about how to use certificate-based authentication, see Certificate-based authentication for iOS applications with Amazon SNS on the AWS Compute Blog.

For new and existing iOS applications, we recommend that you use token-based authentication. To learn more about how to use token-based authentication, see Token-Based authentication for iOS applications with Amazon SNS on the AWS Compute Blog.

There are several benefits in using token-based authentication:

  • You can use a single token that is shared among all of your applications.
  • You can remove the need for yearly certificate renewal for certificate-based authentication.
  • You can improve the security of your application by using token-based requests. For these requests, your credentials are never transferred from Amazon SNS to your mobile push notification provider, making the communication less likely to be compromised.

Token-based authentication is the latest authentication method provided by the APNs that improves security for your applications, requires less management effort, and is more efficient. We recommend migrating as soon as possible to ensure the security and ease of operations of your applications.

This blog post provides step-by-step instructions for migrating your iOS application from certificate-based authentication to token-based authentication with Amazon SNS. You will learn how to create a new token using your Apple developer account. Next, you will migrate your platform application to token-based authentication. Finally, you will test your application by sending a test push notification via Amazon SNS to a device to confirm the successful migration.

Prerequisites

  • XCode IDE
  • iOS application with a valid p.12 certificate

Before proceeding with this migration, we recommend to stop sending push notifications to your applications until the migration is complete to avoid any disruptions in your message delivery workloads.

Walkthrough

You can also create a test platform application with token-based authentication to ensure that the Amazon SNS platform application is created successfully. Finally, you can create a device token and send a test push notification to it. Once confirmed that the application works correctly, you can migrate your main platform application to token-based authentication.

Creating a .p8 token to upload to Amazon SNS

  1. Log in to your Apple Developer account.
  2. Choose Certificates, Identifiers & Profiles.
  3. In the Keys section, choose the Add button (+).
  4. Under Register a New Key, for Key Name, type the token key name and tick the box for Apple Push Notifications service (APNs) for the key services.
  5. Select Continue.
  6. In the Register a New Key section, check that all values were entered correctly.
  7. Select Register to register the new token key.
  8. Download your token key. Store it in a safe location, as you can’t download the token key again.

Migrating your platform application from certificate-based authentication to token-based authentication

  1. Navigate to the Amazon SNS console. Expand the Mobile menu and choose Push Notification.
  2. Choose your platform application.
  3. Choose Edit. Under Apple credentials section choose Token:
    1. Under Token, select Choose file to upload the .p8 token key file.
    2. Provide values for signing key ID, team ID and bundle ID. These values can be found in your Apple Developer account. Ensure that your bundle ID is identical to the ID used for this application with certificate-based authentication.
  4. Event notifications – optional: refer to the following guide for enabling event notifications: Mobile app events
  5. Delivery status logging – optional: refer to the following guide for enabling delivery status logging: How do I access Amazon SNS topic delivery logs for push notifications? Find more information on these steps can in the Mobile push notifications best practices.
    Apple credential settings
  6. Choose Save changes. This changes your platform application to token-based authentication.

Testing push notification delivery to your device

In this section, you will test sending a push notification to your device using the Amazon SNS console and the AWS Command Line Interface (AWS CLI).

Amazon SNS console

  1. From the Amazon SNS console, navigate to your platform endpoint and choose Publish message.
  2. For message body, select Custom payload for each delivery protocol to send to the endpoint. This example uses a custom payload that allows you to provide additional APNs headers:
    Custom payload for each delivery model configuration
  3. Choose Publish message.
  4. The push notification is delivered to your device:
    iOS sample notification message

AWS CLI

Note: If you receive errors when running AWS CLI commands, make sure that you’re using the most recent AWS CLI version.
Run the following command. For target-arn, specify your platform application endpoint ARN:

aws sns publish \
    --target-arn arn:aws:sns:us-west-2:191418023309:endpoint/APNS_SANDBOX/computeblogdemo/ba7a35f8-c73d-364f-9edd-5c438add0533 \
    --message '{"APNS_SANDBOX": "{\"aps\":{\"alert\":\"Sample message for iOS development endpoints\"}}"}' \
    --message-attributes '{"AWS.SNS.MOBILE.APNS.PUSH_TYPE":{"DataType":"String","StringValue":"alert"}}' \
    --message-structure json
  1. An output containing a MessageId is shown in case of successful delivery:
    {
        "MessageId": "83ecb3a1-c728-5b7c-96e5-e8417d5cd4f4"
    }
  2. The push notification is delivered to your device:
    iOS sample notification message

Troubleshooting

You might encounter various errors when migrating to token-based authentication. This section explains how to troubleshoot these errors.

If a message is not delivered after publishing it to your platform application endpoint, refer to the Amazon CloudWatch failed logs of your platform application. These logs are named sns/your-aws-region/your-accountID/app/platform_name/application_name/Failure.

Once you have navigated to your platform application’s CloudWatch failed log group, click on one of the log streams based on the time that you published the message. Focus on the following attributes:

  • statusCode: error messages are grouped according to the status code.
  • status : shows whether a message was delivered successfully to the provider or if it failed to deliver.
  • providerResponse: provides the response message from the provider and is only shown in case a message failed to deliver.

We will look through messages that failed to deliver because of the following errors:

InvalidProviderToken

"providerResponse": "{\"reason\":\"InvalidProviderToken\"}",
"statusCode": 403,
"status": "FAILURE"

The cause of this error can be an incorrect token key ID, team ID or if the token is invalid.

To resolve this issue, go to your Apple Developer account and ensure that you are providing the correct token ID, team ID and that your token key exists.

TopicDisallowed

"providerResponse": "{\"reason\":\"TopicDisallowed\"}",
"statusCode": 400,
"status": "FAILURE"

The cause of this error can be an incorrect bundle ID or a device token that was created with the wrong bundle ID.

To resolve this issue, go to your Apple Developer account and navigate to your existing certificate used when migrating to token-based authentication. Confirm the bundle ID assigned to this certificate and ensure you are using the same ID for your platform application and also for your device tokens.

Conclusion

Developers can send mobile push notifications for the APNs using token-based authentication by using a .p8 key to authenticate an Apple device endpoint. This is the recommended authentication method due to improved security and lower management effort by removing the need for annual certificate renewal and by being able to share tokens among multiple applications.

To learn more about APNs token-based authentication with Amazon SNS, visit the Amazon SNS Developer Guide.

For more serverless learning resources, visit Serverless Land.

Introducing new asynchronous invocation metrics for AWS Lambda

Post Syndicated from James Beswick original https://aws.amazon.com/blogs/compute/introducing-new-asynchronous-invocation-metrics-for-aws-lambda/

This post is written by Arthi Jaganathan, Principal SA, Serverless and Dhiraj Mahapatro, Principal SA, Serverless.

Today, AWS is announcing three new Amazon CloudWatch metrics for asynchronous AWS Lambda function invocations: AsyncEventsReceived, AsyncEventAge, and AsyncEventsDropped. These metrics provide visibility for asynchronous Lambda function invocations.

Previously, customers found it challenging to monitor the processing of asynchronous invocations. With these new metrics for asynchronous function invocations, you can identify the root cause of processing issues. These issues include throttling, concurrency limit, function errors, processing latency because of retries, missing events, and taking corrective action.

This blog and the sample application provide examples that highlight the usage of the new metrics.

Overview

Architecture overview

AWS services such as Amazon S3Amazon SNS, and Amazon EventBridge invoke Lambda functions asynchronously. Lambda uses an internal queue to store events. A separate process reads events from the queue and sends them to the function.

By default, Lambda discards events from its event queue if the retry policy has exceeded the number of configured retries or the event reached its maximum age. However, the event once discarded from the event queue goes to the destination or DLQ, if configured.

This table summarizes the retry behavior. Visit the asynchronous Lambda invocations documentation to learn more:

Cause Retry behavior Override
Function errors (returned from code or runtime, such as timeouts) Retry twice Set retry attempt on function between 0-2
Throttles (429) and system errors (5xx) Retry for a maximum of 6 hours Set maximum age of event on function between 60 seconds to 6 hours
Zero reserved concurrency No retry N/A

What’s new

The AsyncEventsReceived metric is a measure of the number of events enqueued in Lambda’s internal queue. You can track events from the client using custom CloudWatch metrics or extract it from logs using Embedded Metric Format (EMF). In case this metric is lower than the number of events that you expect, it shows that the source did not emit events or events did not arrive at the Lambda service. This is possible because of transient networking issues. Lambda does not emit this metric for retried events.

The AsyncEventAge metric is a measure of the difference between the time that an event is first enqueued in the internal queue and the time the Lambda service invokes the function. With retries, Lambda emits this metric every time it attempts to invoke the function with the event. An increasing value shows retries because of error or throttles. Customers can set alarms on this metric to alert on SLA breaches.

The AsyncEventsDropped metric is a measure of the number of events dropped because of processing failure.

How to use the new async event metrics

This flowchart shows the way that you can combine the new metrics with existing metrics to troubleshoot problems with asynchronous processing:

Flowchart

Example application

You can deploy a sample Lambda function to show how to use the new metrics for troubleshooting.

To test the following scenarios, you must install:

To set up the application:

  1. Set your AWS Region:
    export REGION=<your AWS region>
  2. Clone the GitHub repository:
    git clone https://github.com/aws-samples/lambda-async-metrics-sample.git
    cd lambda-async-metrics-sample
  3. Build and deploy the application. Provide lambda-async-metric as the stack name when prompted. Keep everything else as default values:
    sam build
    sam deploy --guided --region $REGION
  4. Save the name of the function in an environment variable:
    FUNCTION_NAME=$(aws cloudformation describe-stacks \
      --region $REGION \
      --stack-name lambda-async-metric \
      --query 'Stacks[0].Outputs[?OutputKey==`HelloWorldFunctionResourceName`].OutputValue' --output text)
    
  5. Invoke the function using AWS CLI:
    aws lambda invoke \
      --region $REGION \
      --function-name $FUNCTION_NAME \
      --invocation-type Event out_file.txt
    
  6. Choose All Metrics under Metrics in the left-hand panel in the CloudWatch console and search for “async”:
    All metrics
  7. Choose Lambda > By Function Name and choose AsyncEventsReceived for the function you created. Under “Graphed metrics”, change the statistic to sum and “Period” to 1 minute. You see one record. After waiting a few seconds, refresh if you don’t see the metric immediately.Graphed metrics

Scenarios

These scenarios show how you can use the three new metrics.

Scenario 1: Troubleshooting delays due to function error

Lambda retries processing the asynchronous invocation event for a maximum of two times, in case of function error or exception. Lambda drops the event from its internal queue if the retries are exhausted.

To simulate a function error, throw an exception from the Lambda handler:

  1. Edit the function code in hello_world/app.py to raise an exception:
    def handler(event, context):
      print(“Hello from AWS Lambda”)
      raise Exception(“Lambda function throwing exception”)
    
  2. Build and deploy:
    sam build && sam deploy –region $REGION
  3. Invoke the function:
    aws lambda invoke \
      --region $REGION \
      --function-name $FUNCTION_NAME \
      --invocation-type Event out_file.txt
    

It is best practice to alert on function errors using the error metric and use the metrics to get better insights into retry behavior, such as interval between retries. For example, if a function errors because of a downstream system being overwhelmed, you can use AsyncEventAge and Concurrency metrics.

If you received an alert for function error, you see data points for AsyncEventsDropped. It is 1 for this scenario. Overlaying the Errors and Throttles metrics reconfirms function error causes this.

Overlaying metrics to see errors

There are two retries before the Lambda service drops the event. No throttling confirms the function error. Next, you can confirm that the AsyncEventAge is increasing. Lambda publishes this metric every time it polls from the event queue and sends it to the function. This creates multiple data points for the metric.

You can duplicate the metric to see both statistics on a single graph. Here, the two lines overlap because there is only one data point published in each 1-minute interval.

Duplicating the metrics

The event spent 37ms in the internal queue before the first invoke attempt. Lambda’s first retry happens after 63.5 seconds. The second and final retry happens after 189.6 seconds.

Scenario 2: Troubleshooting delays because of concurrency limits

In case of throttling or system errors, Lambda retries invoking the event up to the configured MaximumEventAgeInSeconds (the maximum is 6 hours). To simulate the throttling error without hitting the account concurrency limit, you can:

  • Set the function reserved concurrency to 1
  • Introduce a 90 seconds sleep in the function code to simulate a lengthy function execution.

The Lambda service throttles new invocations while the first request is in progress. You invoke the function in quick succession from the command line to simulate throttling and observe the retry behavior:

  1. Set the function reserved concurrency to 1 by updating the AWS SAM template.
    HelloWorldFunction:
      Type: AWS::Serverless::Function
      Properties:
        CodeUri: hello_world/
        Handler: app.lambda_handler
        Runtime: python3.9
        Timeout: 100
        MemorySize: 128
        Architectures:
        - x86_64
        ReservedConcurrentExecutions: 1
    
  2. Edit the function code in hello_world/app.py to introduce a 90-second sleep. Replace existing code with the following in app.py:
    import time
    
    def handler(event, context):
      time.sleep(90)
      print("Hello from AWS Lambda")
    
  3. Build and deploy:
    sam build && sam deploy --region $REGION
  4. Invoke the function twice in succession from the command line:
    for i in {1..2}; do aws lambda invoke \
      --region $REGION \
      --function-name $FUNCTION_NAME \
      --invocation-type Event out_file.txt; done

In a real-world use case, missing the processing SLA should trigger the troubleshooting workflow. Start with AsyncEventsReceived to confirm events enqueued by the Lambda service. This is 2 in this scenario. Look for dropped events using AsyncEventsDropped metric.

Dropped events using AsyncEventsDropped metric

AsyncEventAge verifies delays in processing. As mentioned in the previous section, there can be multiple data points for this metric in a one-minute interval. You can duplicate the metric to compare minimum and maximum values.

Duplicate the metric to compare minimum and maximum values

There are 2 data points in the first minute. The event age increases to 31 seconds during this period.

Event age increases to 31 seconds

There is only one data point for the metric in the remaining one-minute intervals, so the lines overlap. The event age increases to 59,153ms (~59 seconds) in one interval and then to 130,315ms (~130 seconds) in the next one-minute interval. Since the function sleeps for 90 seconds, it explains why the final retry is at around 2 minutes since the function received the event.

Checking function throttling, this screenshot confirms throttling six times in the first minute (07:12 UTC timestamp) and once in the subsequent minute (07:13 UTC timestamp).

Graph showing throttling

This is because of the back-off behavior of Lambda’s internal queue. The data for AsyncEventAge shows that there is only one throttle in the second interval. Lambda delivers the event during the next one-minute interval after spending around 2 minutes in the internal queue.

Overlaying the ConcurrentExecutions and AsyncEventsReceived metrics provides more information. You see receipt of two events, but concurrency stayed at 1. This results in one event being throttled:

Overlaying the ConcurrentExecutions and AsyncEventsReceived

There are multiple ways to resolve throttling errors. You optimize the function to run faster or increase the function or account concurrency limits to address throttling errors.

The sample application covers other scenarios such as troubleshooting dropped events on event expiration, and troubleshooting dropped events when a function’s reserved concurrency is set to zero.

Cleaning up

Use the following command and follow the prompts to clean up the resources:

sam delete lambda-async-metric --region $REGION

Conclusion

Using these new CloudWatch metrics, you can gain visibility into the processing of Lambda asynchronous invocations. This blog explained the new metrics AsyncEventsReceived, AsyncEventAge, and AsyncEventsDropped and how to use them to troubleshoot issues. With these new metrics, you can track the asynchronous invocation requests sent to Lambda functions. You monitor any delays in processing, and take corrective actions if required.

The Lambda service sends these new metrics to CloudWatch at no cost to you. However, charges apply for CloudWatch Metric Streams and CloudWatch Alarms. See CloudWatch pricing for more information.

For more serverless learning resources, visit Serverless Land.

Securing CI/CD pipelines with AWS SAM Pipelines and OIDC

Post Syndicated from James Beswick original https://aws.amazon.com/blogs/compute/securing-ci-cd-pipelines-with-aws-sam-pipelines-and-oidc/

This post is written by Rahman Syed, Sr. Solutions Architect, State & Local Government and Brian Zambrano, Sr. Specialist Solutions Architect, Serverless.

Developers of serverless applications use the AWS Serverless Application Model (AWS SAM) CLI to generate continuous integration and deployment (CI/CD) pipelines. In October 2022, AWS released OpenID Connect (OIDC) support for AWS SAM Pipelines. This improves your security posture by creating integrations that use short-lived credentials from your CI/CD provider.

OIDC is an authentication layer based on open standards that makes it easier for a client and an identity provider to exchange information. CI/CD tools like GitHub, GitLab, and Bitbucket provide support for OIDC, which ensures that you can integrate with AWS for secure deployments.

This blog post shows how to create a GitHub Actions workflow that securely integrates with AWS using GitHub as an identity provider.

Securing CI/CD systems that interact with AWS

AWS SAM Pipelines is a feature of AWS SAM CLI that generates CI/CD pipeline configurations for six CI/CD systems. These include AWS CodePipeline, Jenkins, GitHub Actions, GitLab CI/CD, and BitBucket. You can get started with these AWS-curated pipeline definitions or create your own to support your organization’s standards.

CI/CD pipelines hosted outside of AWS require credentials to deploy to your AWS environment. One way of integrating is to use an AWS Identity and Access Management (IAM) user, which requires that you store the access key and secret access key within your CI/CD provider. Long-term access keys remain valid unless you revoke them, unlike temporary security credentials that are valid for shorter periods of time.

It is a best practice to use temporary, scoped security credentials generated by AWS Security Token Service (AWS STS) to reduce your risk if credentials are exposed. Temporary tokens are generated dynamically as opposed to being stored. Because they expire after minutes or hours, temporary tokens limit the duration of any potential compromise. A token scoped with least privilege limits permissions to a set of resources and prevents wider access within your environment. AWS SAM Pipelines supports short-term credentials with three OIDC providers: GitHub, GitLab, and Bitbucket.

This post shows how AWS SAM Pipelines can integrate GitHub Actions with your AWS environment using these short-term, scoped credentials powered by the OIDC open standard. It uses a two-stage pipeline, representing a development and production environment.

Architecture overview

This example uses GitHub as the identity provider. When the dev task in the GitHub Actions workflow attempts to assume the dev pipeline execution role in the AWS account, IAM validates that the supplied OIDC token originates from a trusted source. Configuration in IAM allows role assumption from specified GitHub repositories and branches. AWS SAM Pipelines performs the initial heavy lifting of configuring both GitHub Actions and IAM using the principle of least-privileged.

Prerequisites

  1. AWS SAM CLI, version 1.60.0 or higher
  2. GitHub account: You must have the required permissions to configure GitHub projects and create pipelines.
  3. Create a new GitHub repository, using the name “sam-app”.

Creating a new serverless application

To create a new serverless application:

  1. Create a new AWS SAM application locally:
    sam init --name sam-app --runtime python3.9 --app-template hello-world --no-tracing
  2. Initialize a git repository:
    cd sam-app
    git init -b main
    git add .
    git commit -m "Creating a new SAM application"
  3. Push the new repository to GitHub:
    git remote add origin <REMOTE_URL> # e.g. https://github.com/YOURUSER/sam-app.git
    git push -u origin main

GitHub offers multiple authentication mechanisms. Regardless of how you authenticate, ensure you have the “workflow” scope. GitHub Actions only allow changes to your pipeline when you push with credentials that have this scope attached.

Creating application deployment targets

Once the AWS SAM application is hosted in a GitHub repository, you can create CI/CD resources in AWS that support two deployment stages for the serverless application environment. This is a one-time operation.

Step 1: Creating the pipeline for the first stage.

Run the command for the first stage, answering the interactive questions:

sam pipeline bootstrap --stage dev

When prompted to choose a “user permissions provider”, make sure to select OpenID Connect (OIDC). In the next question, select GitHub Actions as the OIDC provider. These selections result in additional prompts for information that later result in a least privilege integration with GitHub Actions.

The following screenshot shows the interaction with AWS SAM CLI (some values may appear differently for you):

Interaction with AWS SAM CLI

Step 2: Create deployment resources for the second stage.

Run the following command and answer the interactive questions:

sam pipeline bootstrap --stage prod

With these commands, AWS SAM CLI bootstraps the AWS resources that the GitHub Actions workflow later uses to deploy the two stages of the serverless application. This includes Amazon S3 buckets for artifacts and logs, and IAM roles for deployments. AWS SAM CLI also creates the IAM identity provider to establish GitHub Actions as a trusted OIDC provider.

The following screenshot shows these resources from within the AWS CloudFormation console. These resources do not represent a serverless application, but the AWS resources a GitHub Actions workflow must perform deployments. The aws-sam-cli-managed-dev-pipeline-resources stack creates an IAM OIDC identity provider used to establish trust between your AWS account and GitHub.

Stack resources

Generating and deploying a GitHub Actions workflow

The final step to creating a CI/CD pipeline in GitHub Actions is to use a GitHub source repository and two deployment targets in a GitHub Actions workflow.

To generate a pipeline configuration with AWS SAM Pipelines, run the following command and answer interactive questions:

sam pipeline init

The following screenshot shows the interaction with AWS SAM CLI (some values may appear differently for you):

Interaction with AWS SAM CLI

AWS SAM CLI has created a local file named pipeline.yaml which is the GitHub Actions workflow definition. Inspect the pipeline.yaml file to see how the GitHub Actions workflow deploys within your AWS account:

Pipeline.yaml contents

In this example task, GitHub Actions initiates an Action named configure-aws-credentials that uses OIDC as the method for assuming an AWS IAM role for deployment activity. The credentials are valid for 3600 seconds (one hour).

To deploy the GitHub Actions workflow, commit the new file and push to GitHub:

git add .
git commit -m "Creating a CI/CD Pipeline"
git push origin main

Once GitHub receives this commit, the repository creates a new GitHub Actions Workflow, as defined by the new pipeline.yaml configuration file.

Inspecting the GitHub Actions workflow

1. Navigate to the GitHub repository’s Actions view to see the first workflow run in progress.

First workflow run in progress.

2. Choosing the workflow run, you can see details about the deployment.

Details about the deployment

3. Once the deploy-testing step starts, open the CloudFormation console to see the sam-app-dev stack deploying.

Stack deploying

4. The GitHub Actions Pipeline eventually reaches the deploy-prod step, which deploys the production environment of your AWS SAM application. At the end of the Pipeline run, you have two AWS SAM applications in your account deployed by CloudFormation via GitHub Actions. Every change pushed to the GitHub repository now triggers your new multi-stage CI/CD pipeline.

New multi-stage CI/CD pipeline

You have successfully created a CI/CD pipeline for a system located outside of AWS that can deploy to your AWS environment without the use of long-lived credentials.

Cleanup

To clean up your AWS based resources, run following AWS SAM CLI commands, answering “y” to all questions:

sam delete --stack-name sam-app-prod
sam delete --stack-name sam-app-dev
sam delete --stack-name aws-sam-cli-managed-dev-pipeline-resources
sam delete --stack-name aws-sam-cli-managed-prod-pipeline-resources

You may also return to GitHub and delete the repository you created.

Conclusion

AWS SAM Pipeline support for OIDC is a new feature of AWS SAM CLI that simplifies the integration of CI/CD pipelines hosted outside of AWS. Using short-term credentials and scoping AWS actions to specific pipeline tasks reduces risk for your organization. This post shows you how to get started with AWS SAM Pipelines to create a GitHub Actions-based CI/CD pipeline with two deployment stages.

The Complete AWS SAM Workshop provides you with hands-on experience for many AWS SAM features, including CI/CD with GitHub Actions.

Watch guided video tutorials to learn how to create deployment pipelines for GitHub Actions, GitLab CI/CD, and Jenkins.

For more learning resources, visit https://serverlessland.com/explore/sam-pipelines.

Implementing architectural patterns with Amazon EventBridge Pipes

Post Syndicated from David Boyne original https://aws.amazon.com/blogs/compute/implementing-architectural-patterns-with-amazon-eventbridge-pipes/

This post is written by Dominik Richter (Solutions Architect)

Architectural patterns help you solve recurring challenges in software design. They are blueprints that have been used and tested many times. When you design distributed applications, enterprise integration patterns (EIP) help you integrate distributed components. For example, they describe how to integrate third-party services into your existing applications. But patterns are technology agnostic. They do not provide any guidance on how to implement them.

This post shows you how to use Amazon EventBridge Pipes to implement four common enterprise integration patterns (EIP) on AWS. This helps you to simplify your architectures. Pipes is a feature of Amazon EventBridge to connect your AWS resources. Using Pipes can reduce the complexity of your integrations. It can also reduce the amount of code you have to write and maintain.

Content filter pattern

The content filter pattern removes unwanted content from a message before forwarding it to a downstream system. Use cases for this pattern include reducing storage costs by removing unnecessary data or removing personally identifiable information (PII) for compliance purposes.

In the following example, the goal is to retain only non-PII data from “ORDER”-events. To achieve this, you must remove all events that aren’t “ORDER” events. In addition, you must remove any field in the “ORDER” events that contain PII.

While you can use this pattern with various sources and targets, the following architecture shows this pattern with Amazon Kinesis. EventBridge Pipes filtering discards unwanted events. EventBridge Pipes input transformers remove PII data from events that are forwarded to the second stream with longer retention.

Instead of using Pipes, you could connect the streams using an AWS Lambda function. This requires you to write and maintain code to read from and write to Kinesis. However, Pipes may be more cost effective than using a Lambda function.

Some situations require an enrichment function. For example, if your goal is to mask an attribute without removing it entirely. For example, you could replace the attribute “birthday” with an “age_group”-attribute.

In this case, if you use Pipes for integration, the Lambda function contains only your business logic. On the other hand, if you use Lambda for both integration and business logic, you do not pay for Pipes. At the same time, you add complexity to your Lambda function, which now contains integration code. This can increase its execution time and cost. Therefore, your priorities determine the best option and you should compare both approaches to make a decision.

To implement Pipes using the AWS Cloud Development Kit (AWS CDK), use the following source code. The full source code for all of the patterns that are described in this blog post can be found in the AWS samples GitHub repo.

const filterPipe = new pipes.CfnPipe(this, 'FilterPipe', {
  roleArn: pipeRole.roleArn,
  source: sourceStream.streamArn,
  target: targetStream.streamArn,
  sourceParameters: { filterCriteria: { filters: [{ pattern: '{"data" : {"event_type" : ["ORDER"] }}' }] }, kinesisStreamParameters: { startingPosition: 'LATEST' } },
  targetParameters: { inputTemplate: '{"event_type": <$.data.event_type>, "currency": <$.data.currency>, "sum": <$.data.sum>}', kinesisStreamParameters: { partitionKey: 'event_type' } },
});

To allow access to source and target, you must assign the correct permissions:

const pipeRole = new iam.Role(this, 'FilterPipeRole', { assumedBy: new iam.ServicePrincipal('pipes.amazonaws.com') });

sourceStream.grantRead(pipeRole);
targetStream.grantWrite(pipeRole);

Message translator pattern

In an event-driven architecture, event producers and consumers are independent of each other. Therefore, they may exchange events of different formats. To enable communication, the events must be translated. This is known as the message translator pattern. For example, an event may contain an address, but the consumer expects coordinates.

If a computation is required to translate messages, use the enrichment step. The following architecture diagram shows how to accomplish this enrichment via API destinations. In the example, you can call an existing geocoding service to resolve addresses to coordinates.

There may be cases where the translation is purely syntactical. For example, a field may have a different name or structure.

You can achieve these translations without enrichment by using input transformers.

Here is the source code for the pipe, including the role with the correct permissions:

const pipeRole = new iam.Role(this, 'MessageTranslatorRole', { assumedBy: new iam.ServicePrincipal('pipes.amazonaws.com'), inlinePolicies: { invokeApiDestinationPolicy } });

sourceQueue.grantConsumeMessages(pipeRole);
targetStepFunctionsWorkflow.grantStartExecution(pipeRole);

const messageTranslatorPipe = new pipes.CfnPipe(this, 'MessageTranslatorPipe', {
  roleArn: pipeRole.roleArn,
  source: sourceQueue.queueArn,
  target: targetStepFunctionsWorkflow.stateMachineArn,
  enrichment: enrichmentDestination.apiDestinationArn,
  sourceParameters: { sqsQueueParameters: { batchSize: 1 } },
});

Normalizer pattern

The normalizer pattern is similar to the message translator but there are different source components with different formats for events. The normalizer pattern routes each event type through its specific message translator so that downstream systems process messages with a consistent structure.

The example shows a system where different source systems store the name property differently. To process the messages differently based on their source, use an AWS Step Functions workflow. You can separate by event type and then have individual paths perform the unifying process. This diagram visualizes that you can call a Lambda function if needed. However, in basic cases like the preceding “name” example, you can modify the events using Amazon States Language (ASL).

In the example, you unify the events using Step Functions before putting them on your event bus. As is often the case with architectural choices, there are alternatives. Another approach is to introduce separate queues for each source system, connected by its own pipe containing only its unification actions.

This is the source code for the normalizer pattern using a Step Functions workflow as enrichment:

const pipeRole = new iam.Role(this, 'NormalizerRole', { assumedBy: new iam.ServicePrincipal('pipes.amazonaws.com') });

sourceQueue.grantConsumeMessages(pipeRole);
enrichmentWorkflow.grantStartSyncExecution(pipeRole);
normalizerTargetBus.grantPutEventsTo(pipeRole);

const normalizerPipe = new pipes.CfnPipe(this, 'NormalizerPipe', {
  roleArn: pipeRole.roleArn,
  source: sourceQueue.queueArn,
  target: normalizerTargetBus.eventBusArn,
  enrichment: enrichmentWorkflow.stateMachineArn,
  sourceParameters: { sqsQueueParameters: { batchSize: 1 } },
});

Claim check pattern

To reduce the size of the events in your event-driven application, you can temporarily remove attributes. This approach is known as the claim check pattern. You split a message into a reference (“claim check”) and the associated payload. Then, you store the payload in external storage and add only the claim check to events. When you process events, you retrieve relevant parts of the payload using the claim check. For example, you can retrieve a user’s name and birthday based on their userID.

The claim check pattern has two parts. First, when an event is received, you split it and store the payload elsewhere. Second, when the event is processed, you retrieve the relevant information. You can implement both aspects with a pipe.

In the first pipe, you use the enrichment to split the event, in the second to retrieve the payload. Below are several enrichment options, such as using an external API via API Destinations, or using Amazon DynamoDB via Lambda. Other enrichment options are Amazon API Gateway and Step Functions.

Using a pipe to split and retrieve messages has three advantages. First, you keep events concise as they move through the system. Second, you ensure that the event contains all relevant information when it is processed. Third, you encapsulate the complexity of splitting and retrieving within the pipe.

The following code implements a pipe for the claim check pattern using the CDK:

const pipeRole = new iam.Role(this, 'ClaimCheckRole', { assumedBy: new iam.ServicePrincipal('pipes.amazonaws.com') });

claimCheckLambda.grantInvoke(pipeRole);
sourceQueue.grantConsumeMessages(pipeRole);
targetWorkflow.grantStartExecution(pipeRole);

const claimCheckPipe = new pipes.CfnPipe(this, 'ClaimCheckPipe', {
  roleArn: pipeRole.roleArn,
  source: sourceQueue.queueArn,
  target: targetWorkflow.stateMachineArn,
  enrichment: claimCheckLambda.functionArn,
  sourceParameters: { sqsQueueParameters: { batchSize: 1 } },
  targetParameters: { stepFunctionStateMachineParameters: { invocationType: 'FIRE_AND_FORGET' } },
});

Conclusion

This blog post shows how you can implement four enterprise integration patterns with Amazon EventBridge Pipes. In many cases, this reduces the amount of code you have to write and maintain. It can also simplify your architectures and, in some scenarios, reduce costs.

You can find the source code for all the patterns on the AWS samples GitHub repo.

For more serverless learning resources, visit Serverless Land. To find more patterns, go directly to the Serverless Patterns Collection.

Previewing environments using containerized AWS Lambda functions

Post Syndicated from Marcia Villalba original https://aws.amazon.com/blogs/compute/previewing-environments-using-containerized-aws-lambda-functions/

This post is written by John Ritsema (Principal Solutions Architect)

Continuous integration and continuous delivery (CI/CD) pipelines are effective mechanisms that allow teams to turn source code into running applications. When a developer makes a code change and pushes it to a remote repository, a pipeline with a series of steps can process the change. A pipeline integrates a change with the full code base, verifies the style and formatting, runs security checks, and runs unit tests. As the final step, it builds the code into an artifact that is deployable to an environment for consumption.

When using GitHub or many other hosted Git providers, a pull request or merge request can be submitted for a particular code change. This creates a focused place for discussion and collaboration on the change before it is approved and merged into a shared code branch.

A powerful mechanism for collaboration involves deploying a pull request (PR) to a running environment. This allows stakeholders to preview the changes live and see how they would look. Spinning up a running environment quickly allows teammates to provide almost immediate feedback, expediting the entire development process.

Deploying PRs to ephemeral environments encourages teams to make many small changes that can be previewed and tested in parallel. This avoids having to first merge into a common source branch and deploy to long-lived environments that are always on and incur costs.

Creating this mechanism has several challenges including setup complexity, environment creation time, and environment cost. This post addresses these challenges by showing how to create a CI/CD pipeline for previewing changes to web applications in ephemeral, quick-to-provision, low-cost, and scale-to-zero environments. This post walks through the steps required to set up a sample application.

Example architecture

The concepts in this post can be implemented using a number of tools and hosted Git providers that connect to CI/CD pipelines. The example code shared in this post uses GitHub Actions to trigger a workflow. The workflow uses a small Terraform module with Docker to build the application source code into a container image, push it to Amazon Elastic Container Registry (ECR), and create an AWS Lambda function with the image.

The container running on Lambda is accessible from a web browser through a Lambda function URL. This provides a dedicated HTTPS endpoint for a function.

This is used instead of AWS App RunnerAmazon ECS Fargate with an Application Load Balancer (ALB), or Amazon EKS with ALB ingress because of speed of provisioning and low cost. Lambda function URLs are ideal for occasionally used ephemeral PR environments as they can be provisioned quickly. Lambda’s scale-to-zero compute environment leads to lower cost, as charges are only incurred for actual HTTP requests. This is useful for PRs that may only be reviewed infrequently and then sit idle until the PR is either merged or closed.

This is the example architecture:

Setting up the example

The sample project shows how to implement this example. It consists of a vanilla web application written in Node.js. All of the code needed to implement the architecture is contained within the .github directory. To enable ephemeral environments for a new project, copy over the .github directory without cluttering your project files.

There are two main resources needed to run Terraform inside of GitHub Actions: an AWS IAM role and a place to store Terraform state. AWS credentials are required to give the pipeline permission to provision AWS resources.

Instead of using static IAM user credentials that must be rotated and secured, assume an IAM role to obtain temporary credentials. Terraform remote state is needed to dispose of the environment when the PR is merged or closed. The sample project uses an Amazon S3 bucket to store Terraform state.

You can use the Terraform module located under .github/setup to create these required resources.

    1. Provide the name of your GitHub organization and repository in the terraform.tfvars file as input parameters. You can replace aws-samples with your GitHub user name:
      cat .github/setup/terraform.tfvars
      github_org  = "aws-samples"
      github_repo = "ephemeral-preview-containers-furl"

    2. To provision the resources using Terraform, run:
      cd .github/setup
      terraform init && terraform apply


      Store the outputted terraform.tfstate file safely so that you can manage these resources in the future if needed.

    3. Place the Region, generated IAM role, and bucket name into the configuration file located under .github/workflows/config.env. This configuration file is read and used by the GitHub Actions workflow.
      export AWS_REGION="<add region from setup>"
      
      export AWS_ROLE="<add role from setup>"
      
      export TF_BACKEND_S3_BUCKET="<add bucket from setup>"

      This IAM role has an inline policy that contains the minimum set of permissions needed to provision the AWS resources. This assumes that your application does not interact with external services like databases or caches. If your application needs this additional access, you can add the required permissions to the policy located here.

Running a web server in Lambda

The sample web (HTTP) application includes a Dockerfile that contains instructions for packaging the web app into a process-based container image. A Lambda extension called Lambda Web Adapter enables you to run this standard web server process on Lambda. The CI/CD workflow makes a copy of the Dockerfile and adds the following line.

COPY --from=public.ecr.aws/awsguru/aws-lambda-adapter:0.6.0 /lambda-adapter /opt/extensions/lambda-adapter

This line copies the Lambda Web Adapter executable binary from a public ECR image and writes it into the container in the /opt/extensions/ directory. When the container starts, Lambda starts the Lambda Web Adapter extension. This translates Lambda event payloads from HTTP-based triggers into actual HTTP requests that it proxies to the web app running inside the container. This is the architecture:

By default, Lambda Web Adapter assumes that the web app is listening on port 8080. However, you can change this in the Dockerfile by setting the PORT environment variable.

The containerized web app experiences a “cold start”. However, this is likely not too much of a concern, as the app will only be previewed internally by teammates.

Workflow pipeline

The GitHub Actions job defined in the up.yml workflow is triggered when a PR is opened or reopened against the repository’s main branch. The following is a summary of the steps that the Job performs.

  1. Read the configuration from .github/workflows/config.env
  2. Assume the IAM Role, which has minimal permissions to deploy AWS resources
  3. Install the Terraform CLI
  4. Add the Lambda Web Adapter extension to the copy of the Dockerfile
  5. Run terraform apply to provision the AWS resources using the S3 bucket for Terraform remote state
  6. Obtain the HTTPS endpoint from Terraform and add it to the PR as a comment

The following code snippet shows the key steps (4-6) from the up.yml workflow.

- name: Lambda-ify
  run: echo "COPY --from=public.ecr.aws/awsguru/aws-lambda-adapter:0.6.0 /lambda-adapter /opt/extensions/lambda-adapter" >> Dockerfile

- name: Deploy to ephemeral environment 
  id: furl
  working-directory: ./.github/workflows
  run: |
    terraform init \
      -backend-config="bucket=${TF_BACKEND_S3_BUCKET}" \
      -backend-config="key=${ENVIRONMENT}.tfstate"

    terraform apply -auto-approve \
      -var="name=${{ github.event.repository.name }}" \
      -var="environment=${ENVIRONMENT}" \
      -var="image_tag=${GITHUB_SHA}"

    echo "Url=$(terraform output -json | jq '.endpoint_url.value' -r)" >> $GITHUB_OUTPUT

- name: Add HTTPS endpoint to PR comment
  uses: mshick/add-pr-comment@v1
  with:
    message: |
      :rocket: Code successfully deployed to a new ephemeral containerized PR environment!
      ${{ steps.furl.outputs.Url }}
    repo-token: ${{ secrets.GITHUB_TOKEN }}
    repo-token-user-login: "github-actions[bot]"
    allow

The main.tf file (in the same directory) includes infrastructure as code (IaC) that is responsible for creating an ECR repository, building and pushing the container image to it, and spinning up a Lambda function based on the image. The following is a snippet from the Terraform configuration. You can see how concisely this can be configured.

provider "docker" {
  registry_auth {
    address  = format("%v.dkr.ecr.%v.amazonaws.com", data.aws_caller_identity.current.account_id, data.aws_region.current.name)
    username = data.aws_ecr_authorization_token.token.user_name
    password = data.aws_ecr_authorization_token.token.password
  }
}

module "docker_image" {
  source = "terraform-aws-modules/lambda/aws//modules/docker-build"

  create_ecr_repo = true
  ecr_repo        = local.ns
  image_tag       = var.image_tag
  source_path     = "../../"
}

module "lambda_function_from_container_image" {
  source = "terraform-aws-modules/lambda/aws"

  function_name              = local.ns
  description                = "Ephemeral preview environment for: ${local.ns}"
  create_package             = false
  package_type               = "Image"
  image_uri                  = module.docker_image.image_uri
  architectures              = ["x86_64"]
  create_lambda_function_url = true
}

output "endpoint_url" {
  value = module.lambda_function_from_container_image.lambda_function_url
}

Terraform outputs the generated HTTPS endpoint. The workflow writes it back to the PR as a comment so that teammates can click on the link to preview the changes:

The workflow takes about 60 seconds to spin up a new isolated containerized web application in an ephemeral environment that can be previewed.

Pull request collaboration

The following screenshot shows an example PR as the author collaborates with their team. After implementing this example, when a new PR arrives, the changes are deployed to a new ephemeral environment. Stakeholders can use the link to preview what the changes look like and provide feedback.

Once the changes are approved and merged into the main branch, the GitHub Actions down.yml workflow disposes of the environment. This means that the ephemeral environment is de-provisioned, including resources like the Lambda function and the ECR repository.

Conclusion

This post discusses some of the benefits of using ephemeral environments in CI/CD pipelines. It shows how to implement a pipeline using GitHub Actions and Lambda Function URLs for fast, low-cost, and ephemeral environments.

With this example, you can deploy PRs quickly, and the cost is based on HTTP requests made to the environment. There are no compute costs incurred while a PR is open and no one is previewing the environment. The only charges are for Lambda invocations, while stakeholders are actively interacting with the environment. When a PR is merged or closed, the cloud infrastructure is disposed of. You can find all of the example code referenced in this post here.

For more serverless learning resources, visit Serverless Land.

Best practices for working with the Apache Velocity Template Language in Amazon API Gateway

Post Syndicated from Benjamin Smith original https://aws.amazon.com/blogs/compute/best-practices-for-working-with-the-apache-velocity-template-language-in-amazon-api-gateway/

This post is written by Ben Freiberg, Senior Solutions Architect, and Marcus Ziller, Senior Solutions Architect.

One of the most common serverless patterns are APIs built with Amazon API Gateway and AWS Lambda. This approach is supported by many different frameworks across many languages. However, direct integration with AWS can enable customers to increase the cost-efficiency and resiliency of their serverless architecture. This blog post discusses best practices for using Apache Velocity Templates for direct service integration in API Gateway.

Deciding between integration via Velocity templates and Lambda functions

Many use cases of Velocity templates in API Gateway can also be solved with Lambda. With Lambda, the complexity of integrating with different backends is moved from the Velocity templating language (VTL) to the programming language. This allows customers to use existing frameworks and methodologies from the ecosystem of their preferred programming language.

However, many customers choose serverless on AWS to build lean architectures and using additional services such as Lambda functions can add complexity to your application. There are different considerations that customers can use to assess the trade-offs between the two approaches.

Developer experience

Apache Velocity has a number of operators that can be used when an expression is evaluated, most prominently in #if and #set directives. These operators allow you to implement complex transformations and business logic in your Velocity templates.

However, this adds complexity to multiple aspects of the development workflow:

  • Testing: Testing Velocity templates is possible but the tools and methodologies are less mature than for traditional programming languages used in Lambda functions.
  • Libraries: API Gateway offers utility functions for VTL that simplify common use cases such as data transformation. Other functionality commonly offered by programming language libraries (for example, Python Standard Library) might not be available in your template.
  • Logging: It is not possible to log information to Amazon CloudWatch from a Velocity template, so there is no option to retain this information.
  • Tracing: API Gateway supports request tracing via AWS X-Ray for native integrations with services such as Amazon DynamoDB.

You should use VTL for data mapping and transformations rather than complex business logic. There are exceptions but the drawbacks of using VTL for other use cases often outweigh the benefits.

API lifecycle

The API lifecycle is an important aspect to consider when deciding on Velocity or Lambda. In early stages, requirements are typically not well defined and can change rapidly while exploring the solution space. This often happens when integrating with databases such as Amazon DynamoDB and finding out the best way to organize data on the persistence layer.

For DynamoDB, this often means changes to attributes, data types, or primary keys. In such cases, it is a sensible decision to start with Lambda. Writing code in a programming language can give developers more leeway and flexibility when incorporating changes. This shortens the feedback loop for changes and can improve the developer experience.

When an API matures and is run in production, changes typically become less frequent and stability increases. At this point, it can make sense to evaluate if the Lambda function can be replaced by moving logic into Velocity templates. Especially for busy APIs, the one-time effort of moving Lambda logic to Velocity templates can pay off in the long run as it removes the cost of Lambda invocations.

Latency

In web applications, a major factor of user perceived performance is the time it takes for a page to load. In modern single page applications, this often means multiple requests to backend APIs. API Gateway offers features to minimize the latency for calls on the API layer. With Lambda for service integration, an additional component is added into the execution flow of the request, which inevitably introduces additional latency.

The degree of that additional latency depends on the specifics of the workload, and often is as low as a few milliseconds.

The following example measures no meaningful difference in latency other than cold starts of the execution environments for a basic CRUD API with a Node.js Lambda function that queries DynamoDB. I observe similar results for Go and Python.

Concurrency and scalability

Concurrency and scalability of an API changes when having an additional Lambda function in the execution path of the request. This is due to different Service Quotas and general scaling behaviors in different services.

For API Gateway, the current default quota is 10,000 requests per second (RPS) with an additional burst capacity provided by the token bucket algorithm, using a maximum bucket capacity of 5,000 requests. API Gateway quotas are independent of Region, while Lambda default concurrency limits depend on the Region.

After the initial burst, your functions’ concurrency can scale by an additional 500 instances each minute. This continues until there are enough instances to serve all requests, or until a concurrency limit is reached. For more details on this topic, refer to Understanding AWS Lambda scaling and throughput.

If your workload experiences sharp spikes of traffic, a direct integration with your persistence layer can lead to a better ability to handle such spikes without throttling user requests. Especially for Regions with an initial burst capacity of 1000 or 500, this can help avoid throttling and provide a more consistent user experience.

Best practices

Organize your project for tooling support

When VTL is used in Infrastructure as Code (IaC) artifacts such as AWS CloudFormation templates, it must be embedded into the IaC document as a string.

This approach has three main disadvantages:

  • Especially with multi-line Velocity templates, this leads to IaC definitions that are difficult to read or write.
  • Tools such as IDEs or Linters do not work with string representations of Velocity templates.
  • The templates cannot be easily used outside of the IaC definition, such as for local testing.

Each aspect impacts developer productivity and make the implementation more prone to errors.

You should decouple the definition of Velocity templates from the definition of IaC templates wherever possible. For the CDK, the implementation requires only a few lines of code.

// The following code is licensed under MIT-0 
import { readFileSync } from 'fs';
import * as path from 'path';

const getUserIntegrationWithVTL = new AwsIntegration({
      service: 'dynamodb',
      integrationHttpMethod: HttpMethods.POST,
      action: 'GetItem',
      options: {
        // Omitted for brevity
        requestTemplates: {
          'application/json': readFileSync(path.join('path', 'to', 'vtl', 'request.vm'), 'utf8').toString(),
        },
        integrationResponses: [
          {
            statusCode: '200',
            responseParameters: {
              'method.response.header.access-control-allow-origin': "'*'",
            },
            responseTemplates: {
              'application/json': readFileSync(path.join('path', 'to', 'vtl', 'request.vm'), 'utf8').toString(),
            },
          },
        ],
      },
    });

Another advantage of this approach is that it forces you to externalize variables in your templates. When defining Velocity templates inside of IaC documents, it is possible to refer to other resources in the same IaC document and set this value in the Velocity template through string concatenation. However, this hardcodes the value into the template as opposed to the recommended way of using Stage Variables.

Test Velocity templates locally

A frequent challenge that customers face with Velocity templates is how to shorten the feedback loop when implementing a template. A common workflow to test changes to templates is:

  1. Make changes to the template.
  2. Deploy the stack.
  3. Test the API endpoint.
  4. Evaluate the results or check logs for errors.
  5. Complete or return to step 1.

Depending on the duration of the stack deployment, this can often lead to feedback loops of several minutes. Although the test ecosystem for Velocity is far from being as extensive as it is for mainstream programming languages, there are still ways to improve the developer experience when writing VTL.

Local Velocity rendering engine with AWS SDK

When API Gateway receives a request that has an AWS integration target, the following things happen:

  1. Retrieve request context: API Gateway retrieves request parameters and stage variables.
  2. Make request: body:  API Gateway uses the template and variables from 1 to render a JSON document.
  3. Send request: API Gateway makes an API call to the respective AWS Service. It abstracts Authorization (via it’s IAM Role), Encoding and other aspects of the request away so that only the request body needs to be provided by API Gateway
  4. Retrieve response: API Gateway retrieves a JSON response from the API call.
  5. Make response body: If the call was successful the JSON response is used as input to render the response template. The result will then be sent back to the client that initiated the request to the API Gateway

To simplify our developing workflow, you can locally replicate the above flow with the AWS SDK and a Velocity rendering engine of your choice.

I recommend using Node.js for two reasons:

  • The velocityjs library is a lightweight but powerful Velocity render engine
  • The client methods (e.g. dynamoDbClient.query(jsonBody)) of the AWS SDK for JavaScript generally expect the same JSON body like the AWS REST API does. For most use cases, no transformation (e.g. camel case to Pascal case) is thus needed

The following snippet shows how to test Velocity templates for request and response of a DynamoDB Service Integration. It loads templates from files and renders them with context and parameters. Refer to the git repository for more details.

// The following code is licensed under MIT-0 
const fs = require('fs')
const Velocity = require('velocityjs');
const AWS = require('@aws-sdk/client-dynamodb');
const ddb = new AWS.DynamoDB()

const requestTemplate = fs.readFileSync('path/to/vtl/request.vm', 'utf8')
const responseTemplate = fs.readFileSync(''path/to/vtl/response.vm', 'utf8')

async function testDynamoDbIntegration() {
  const requestTemplateAsString = Velocity.render(requestTemplate, {
    // Mocks the variables provided by API Gateway
    context: {
      arguments: {
        tableName: 'MyTable'
      }
    },
    input: {
      params: function() {
        return 'someId123'
      },
    },
  });

  print(requestTemplateAsString)

  const sdkJsonRequestBody = JSON.parse(requestTemplateAsString)
  const item = await ddb.query(sdkJsonRequestBody)

  const response = Velocity.render(responseTemplate, {
    input: {
      path: function() {
        return {
          Items: item.Items
        }
      },
    },
  })

  const jsonResponse = JSON.parse(response)
}

This approach does not cover all use cases and ultimately must be validated by a deployment of the template. However, it helps to reduce the length of one feedback loop from minutes to a few seconds and allows for faster iterations in the development of Velocity templates.

Conclusion

This blog post discusses considerations and best practices for working with Velocity Templates in API Gateway. Developer experience, latency, API lifecycle, cost, and scalability are key factors when choosing between Lambda and VTL. For most use cases, we recommend Lambda as a starting point and VTL as an optimization step.

Setting up a local test environment for VTL helps shorten the feedback loop significantly and increase developer productivity. The AWS CDK is the recommended IaC framework for working with VTL projects, since it enables you to efficiently organize your infrastructure as code project for tooling support.

For more serverless learning resources, visit Serverless Land.

Introducing AWS Lambda runtime management controls

Post Syndicated from Julian Wood original https://aws.amazon.com/blogs/compute/introducing-aws-lambda-runtime-management-controls/

This blog post is written by Jonathan Tuliani, Principal Product Manager.

Today, AWS Lambda is announcing runtime management controls which provide more visibility and control over when Lambda applies runtime updates to your functions. Lambda is also changing how it rolls out automatic runtime updates to your functions. Together, these changes provide more flexibility in how you take advantage of the latest runtime features, performance improvements, and security updates.

By default, all functions will continue to receive automatic runtime updates. You do not need to change how you use Lambda to continue to benefit from the security and operational simplicity of the managed runtimes Lambda provides. The runtime controls are optional capabilities for advanced customers that require more control over their runtime changes.

This post explains what new runtime management controls are available and how you can take advantage of this new capability.

Overview

For each runtime, Lambda provides a managed execution environment. This includes the underlying Amazon Linux operating system, programming language runtime, and AWS SDKs. Lambda takes on the operational burden of applying patches and security updates to all these components. Customers tell us how much they appreciate being able to deploy a function and leave it, sometimes for years, without having to apply patches. With Lambda, patching ‘just works’, automatically.

Lambda strives to provide updates which are backward compatible with existing functions. However, as with all software patching, there are rare cases where a patch can expose an underlying issue with an existing function that depends on the previous behavior. For example, consider a bug in one of the runtime OS packages. Applying a patch to fix the bug is the right choice for the vast majority of customers and functions. However, in rare cases, a function may depend on the previous (incorrect) behavior. Customers with critical workloads running in Lambda tell us they would like a way to further mitigate even this slight risk of disruption.

With the launch of runtime management controls, Lambda now offers three new capabilities. First, Lambda provides visibility into which patch version of a runtime your function is using and when runtime updates are applied. Second, you can optionally synchronize runtime updates with function deployments. This provides you with control over when Lambda applies runtime updates and enables early detection of rare runtime update incompatibilities. Third, in the rare case where a runtime update incompatibility occurs, you can roll back your function to an earlier runtime version. This keeps your function working and minimizes disruption, providing time to remedy the incompatibility before returning to the latest runtime version.

Runtime identifiers and runtime versions

Lambda runtimes define the components of the execution environment in which your function code runs. This includes the OS, programming language runtime, environment variables, and certificates. For Python, Node.js and Ruby, the runtime also includes the AWS SDK. Each Lambda runtime has a unique runtime identifier, for example, nodejs18.x, or python3.9. Each runtime identifier represents a distinct major release of the programming language.

Runtime management controls introduce the concept of Lambda runtime versions. A runtime version is an immutable version of a particular runtime. Each Lambda runtime, such as Node.js 16, or Python 3.9, starts with an initial runtime version. Every time Lambda updates the runtime, it adds a new runtime version to that runtime. These updates cover all runtime components (OS, language runtime, etc.) and therefore use a Lambda-defined numbering scheme, independent of the version numbers used by the programming language. For each runtime version, Lambda also publishes a corresponding base image for customers who package their functions as container images.

New runtime identifiers represent a major release for the programming language, and sometimes other runtime components, such as the OS or SDK. Lambda cannot guarantee compatibility between runtime identifiers, although most times you can upgrade your functions with little or no modification. You control when you upgrade your functions to a new runtime identifier. In contrast, new runtime versions for the same runtime identifier have a very high level of backward compatibility with existing functions. By default, Lambda automatically applies runtime updates by moving functions from the previous runtime version to a newer runtime version.

Each runtime version has a version number, and an Amazon Resource Name (ARN). You can view the version in a new platform log line, INIT_START. Lambda emits this log line each time it creates a new execution environment during the cold start initialization process.

INIT_START Runtime Version: python:3.9.v14	Runtime Version ARN: arn:aws:lambda:eu-south-1::runtime:7b620fc2e66107a1046b140b9d320295811af3ad5d4c6a011fad1fa65127e9e6I

INIT_START Runtime Version: python:3.9.v14 Runtime Version ARN: arn:aws:lambda:eu-south-1::runtime:7b620fc2e66107a1046b140b9d320295811af3ad5d4c6a011fad1fa65127e9e6I

Runtime versions improve visibility into managed runtime updates. You can use the INIT_START log line to identify when the function transitions from one runtime version to another. This helps you investigate whether a runtime update might have caused any unexpected behavior of your functions. Changes in behavior caused by runtime updates are very rare. If your function isn’t behaving as expected, by far the most likely cause is an error in the function code or configuration.

Runtime management modes

With runtime management controls, you now have more control over when Lambda applies runtime updates to your functions. You can now specify a runtime management configuration for each function. You can set the runtime management configuration independently for $LATEST and each published function version.

You can specify one of three runtime update modes: auto, function update, or manual. The runtime update mode controls when Lambda updates the function version to a new runtime version. By default, all functions receive runtime updates automatically, the alternatives are for advanced users in specific cases.

Automatic

Auto updates are the default, and are the right choice for most customers to ensure that you continue to benefit from runtime version updates. They help minimize your operational overheads by letting Lambda take care of runtime updates.

While Lambda has always provided automatic runtime updates, this release includes a change to how automatic runtime updates are rolled out. Previously, Lambda applied runtime updates to all functions in each region, following a region-by-region deployment sequence. With this release, functions configured to use the auto runtime update mode now receive runtime updates in two phases. Initially, Lambda only applies a new runtime version to newly created or updated functions. After this initial period is complete, Lambda then applies the runtime update to any remaining functions configured to use the auto runtime update mode.

This two-phase rollout synchronizes runtime updates with function updates for customers who are actively developing their functions. This makes it easier to detect and respond to any unexpected changes in behavior. For functions not in active development, auto mode continues to provide the operational benefits of fully automatic runtime updates.

Function update

In function update mode, Lambda updates your function to the latest available runtime version whenever you change your function code or configuration. This is the same as the first phase of auto mode. The difference is that, in auto mode, there is a second phase when Lambda applies runtime updates to functions which have not been changed. In function update mode, if you do not change a function, it continues to use the current runtime version indefinitely. This means that when using function update mode, you must update your functions regularly to keep their runtimes up-to-date. If you do not update a function regularly, you should use the auto runtime update mode.

Synchronizing runtime updates with function deployments gives you control over when Lambda applies runtime updates. For example, you can avoid applying updates during business-critical events, such as a product launch or holiday sales.

When used with CI/CD pipelines, function update mode enables early detection and mitigation in the rare event of a runtime update incompatibility. This is especially effective if you create a new published function version with each deployment. Each published function version captures a static copy of the function code and configuration, so that you can roll back to a previously published function version if required. Using function update mode extends the published function version to also capture the runtime version. This allows you to synchronize rollout and rollback of the entire Lambda execution environment, including function code, configuration, and runtime version.

Manual

Consider the rare event that a runtime update is incompatible with one of your functions. With runtime management controls, you can now roll back to an earlier runtime version. This keeps your function working and minimizes disruption, giving you time to remedy the incompatibility before returning to the latest runtime version.

There are two ways to implement a runtime version rollback. You can use function update mode with a published function version to synchronize the rollback of code, configuration, and runtime version. Or, for functions using the default auto runtime update mode, you can roll back your runtime version by using manual mode.

The manual runtime update mode provides you with full control over which runtime version your function uses. When enabling manual mode, you must specify the ARN of the runtime version to use, which you can find from the INIT_START log line.

Lambda does not impose a time limit on how long you can use any particular runtime version. However, AWS strongly recommends using manual mode only for short-term remediation of code incompatibilities. Revert your function back to auto mode as soon as you resolve the issue. Functions using the same runtime version for an extended period may eventually stop working due to, for example, a certificate expiry.

Using runtime management controls

You can configure runtime management controls via the Lambda AWS Management Console and AWS Command Line Interface (AWS CLI). You can also use infrastructure as code tools such as AWS CloudFormation and the AWS Serverless Application Model (AWS SAM).

Console

From the Lambda console, navigate to a specific function. You can find runtime management controls on the Code tab, in the Runtime settings panel. Expand Runtime management configuration to view the current runtime update mode and runtime version ARN.

Runtime settings

Runtime settings

To change runtime update mode, select Edit runtime management configuration. You can choose between automatic, function update, and manual runtime update modes.

Edit runtime management configuration (Auto)

Edit runtime management configuration (Auto)

In manual mode, you must also specify the runtime version ARN.

Edit runtime management configuration (Manual)

Edit runtime management configuration (Manual)

AWS SAM

AWS SAM is an open-source framework for building serverless applications. You can specify runtime management settings using the RuntimeManagementConfig property.

Resources:
  HelloWorldFunction:
    Type: AWS::Serverless::Function
    Properties:
      Handler: lambda_function.handler
      Runtime: python3.9
      RuntimeManagementConfig:
        UpdateOn: Manual
        RuntimeVersionArn: arn:aws:lambda:eu-west-1::runtime:7b620fc2e66107a1046b140b9d320295811af3ad5d4c6a011fad1fa65127e9e6

AWS CLI

You can also manage runtime management settings using the AWS CLI. You configure runtime management controls via a dedicated command aws lambda put-runtime-management-config, rather than aws lambda update-function-configuration.

aws lambda put-runtime-management-config --function-name <function_arn> --update-runtime-on Manual --runtime-version-arn <runtime_version_arn>

To view the existing runtime management configuration, use aws lambda get-runtime-management-config.

aws lambda get-runtime-management-config --function-name <function_arn>

The current runtime version ARN is also returned by aws lambda get-function and aws lambda get-function-configuration.

Conclusion

Runtime management controls provide more visibility and flexibility over when and how Lambda applies runtime updates to your functions. You can specify one of three update modes: auto, function update, or manual. These modes allow you to continue to take advantage of Lambda’s automatic patching, synchronize runtime updates with your deployments, and rollback to an earlier runtime version in the rare event that a runtime update negatively impacts your function.

For more information on runtime management controls, see our documentation page.

For more serverless learning resources, visit Serverless Land.

AWS Lambda: Resilience under-the-hood

Post Syndicated from Marcia Villalba original https://aws.amazon.com/blogs/compute/aws-lambda-resilience-under-the-hood/

This post is written by Adrian Hornsby (Principal System Dev Engineer) and Marcia Villalba (Principal Developer Advocate).

AWS Lambda comprises over 80 services working together to provide the serverless compute service that it offers to customers. Under the hood, many of these services are built on top of Amazon Elastic Compute Cloud (Amazon EC2) instances, provisioned within Availability Zones. However, AWS Lambda is a Regional service. This means that customers use Lambda services from the Region level and its services are designed to be resilient to impairments that the underlying Availability Zones might have.

This blog post discusses how a Regional service such as Lambda takes advantage of Availability Zones and static stability to achieve its high availability target, and shows how Lambda teams verify their service’s static stability using AWS Fault Injection Simulator (AWS FIS). It also provides a solution using AWS services and tools to achieve Lambda’s resiliency strategy, using FIS, Amazon CloudWatch, and Amazon Route 53 Application Recovery Controller (Route 53 ARC).

The role of Availability Zones

Availability Zones are physically isolated sections of an AWS Region, designed to operate but also fail independently. They are separated by a meaningful distance from each other, up to 100 kilometers (60 miles), to prevent correlated failures, but close enough to use synchronous replication with single-digit millisecond latency.

Customers and AWS services have been using Availability Zones for years to build highly available, fault tolerant, and scalable applications. In particular, AWS Regional services such as AWS Lambda, Amazon DynamoDB, Amazon Simple Queue Service (Amazon SQS), and Amazon Simple Storage Service (Amazon S3), have achieved their high availability promises by spreading multiple independent replicas of their services across multiple Availability Zones. It uses the principles of independence and redundancy of Availability Zones to maximize the overall availability of that service.

Each replica is called a zonal replica. The system is designed so that any of the replicas can fail at any time. When a replica fails, it can be temporarily removed from the system until everything works as expected again. When that happens, the load is shared between the remaining zonal replicas.

Designing for failures

One lesson we learned at AWS when building services is when there is an Availability Zone impairment, it is better not to rely on control plane operations to remediate the failure. A control plane operation can, for example, be provisioning more capacity in an Availability Zone that is not affected by the impairment.

This principle is called static stability, and it describes the capability for a system to keep its original steady-state (or behavior) even when subjected to disruptive events without having to make any changes. A statically stable service should have as few dependencies as possible for its recovery process.

For a Regional service like AWS Lambda, this means that the remaining capacity in the healthy Availability Zones can absorb the traffic from a potentially impaired Availability Zone without having to scale up. This implies over-provisioning resources in all Availability Zones. Having that extra capacity pre-provisioned helps Lambda achieve its static stability. It is a tradeoff between the cost of over-provisioning resources and service availability. Since AWS Lambda promises high availability to its customers, with a monthly uptime service commitment of 99.95%, that tradeoff falls towards service availability.

How to prepare for failures

Preparing for an Availability Zone impairment is difficult because the symptoms and size of the impact can vary widely. An Availability Zone may be partially accessible or totally unreachable, and everything in between. Causes for the impairment can range from fiber cuts, power issues, overheating, hardware malfunctions, networking problems, capacity issues, and other unexpected situations. While those happen, they happen rarely. The most common categories of failures are bad deployments and bad configurations.

While some of these failures can be difficult to infer or reproduce, common symptoms include disruption of connectivity, increased latency, increased traffic due to retry storms, increased CPU and memory usage, and slow I/O.

At AWS, we learned to expect the unexpected and plan for failure. This means injecting faults in the system to reproduce some of the common symptoms of Availability Zone impairments, then observe how the system responds, and implement improvements. In addition, injecting faults in the system helps uncover potential monitoring and alarming blind spots, and gives an opportunity for teams to practice and improve their response to events with a focus on reducing time to recovery.

How Lambda tests its response to an Availability Zone impairment

Lambda’s approach to being resilient to Availability Zone impairments is to rely on static stability and automated systems. Humans are slower than machines for detecting issues and mitigating them. Therefore, Lambda must ensure that its services can detect issues within a zonal replica and remediate automatically within minutes and with no operator intervention. This auto-remediation is done by shifting customer traffic away from the affected Availability Zone to healthy ones, and it is called Availability Zone evacuation.

To do this, Lambda built a tool that detects failures and performs the Availability Zone evacuation when needed. This tool does a statistical comparison of metrics between different Availability Zones and EC2 instances in order to identify unhealthy Availability Zones. If an Availability Zone is found to have issues, the tool starts the evacuation out of the unhealthy Availability Zone automatically. This automation cuts the time to the first action from 30 minutes to less than 3 minutes.

How AWS Lambda uses AWS FIS

To verify the automation continuously works as expected, Lambda performs a wide variety of tests, which includes Availability Zone failure testing in their pre-production environment. The main objective of these tests is to verify the services are statically stable in the presence of Availability Zone impairments, and to verify that the Availability Zone evacuation can be successfully initiated. The benefit of having an automated test is that teams can repeat it regularly and don’t need to have special skills. One click is all it takes to launch the test.

For these tests, Lambda uses AWS FIS to inject faults into their large fleet of EC2 instances. They use AWS FIS with support of the AWS System Manager (SSM) agent and resource filters to target their fleet of EC2 instances in a particular Availability Zone. This is a versatile approach that can inject resource faults, such as CPU and memory exhaustion, and networking faults, such as packet latency, loss, or drop.

Injecting packet loss or latency is very important, since these symptoms can have a serious impact on application and network performance. Indeed, latency and loss, even in small quantities, can create inefficiencies and prevent applications from running at their peak performance. For Lambda, being able to detect increased latency or loss before it affects customers is critical.

How to recover your applications rapidly from Availability Zones failures

You can build a similar solution to rapidly recover your applications from a zonal failure. The solution must have a mechanism to evacuate an impaired Availability Zone, a monitoring system that allows you to detect when a zonal replica is impaired, and a way to test the static stability of your system. AWS provides many tools and services that can help you build this solution to achieve Lambda’s resiliency strategy.

For performing Availability Zone evacuation, you can use the new zonal shift capability from Route 53 ARC, which at the time of writing is in preview. Zonal shift lets you evacuate an Availability Zone for applications that are uses Elastic Load Balancing. If you find out that a zonal replica is impaired or unhealthy, you can use zonal shift to evacuate the Availability Zone for a period of time, while the issue gets fixed.

For performing the zonal shift, you must detect when a zonal replica is unhealthy. Your application must provide a signal of its health per Availability Zone. There are two common ways to capture this signal. First, passively, you can check your metrics, like response times, HTTP status codes, and other metrics that can help track fatal errors in your applications. Or actively, using synthetic monitoring, which allows you to create synthetic requests against your production application to provide a more complete view of the customer experience.

Amazon CloudWatch Synthetics provides canaries, which are scripts that run on a schedule and perform synthetic requests in your application endpoints and APIs. Canaries perform the same actions as customers and continuously verify the customer experience. You can create a canary for each zonal replica of your application and monitor the results independently.

With this information, if the user experience diminishes in one of the replicas, you can start an Availability Zone evacuation using zonal shift and minimize the bad experience for the user while you find and fix the sources of the failure.

To ensure that you can successfully recover from a failure, you must test the solution in advance. Without testing, it is just an assumption. To prove or disprove your assumptions about your system’s capability to handle disruptive events such as issues within an Availability Zones, you can use FIS.

With FIS, you can inject faults simultaneously in multiple resources within the same failure domain, such as Availability Zones. FIS currently integrates with several AWS services including EC2, Amazon Elastic Kubernetes Service (Amazon EKS), Amazon Elastic Container Service (Amazon ECS), Amazon Relational Database Service (Amazon RDS), AWS Networking, and CloudWatch.

Typical use cases for testing a workload’s resilience to Availability Zones impairment are, for example, terminating all compute resources and databases within a particular Availability Zone, injecting latency or packet loss, increasing resource consumption (CPU, memory, and I/O) in compute resources in a particular Availability Zone, or impacting network communication within or between Availability Zones.

For more information and a step-by-step example of how to recover rapidly from application failures in a single Availability Zone and testing it with AWS FIS, read this blog post.

Conclusion

­­­This article discusses static stability, a mechanism that is used by AWS services such as Lambda to build resilient Regional services. It also discusses how AWS takes advantage of the same services and infrastructure as customers. It shows how Lambda uses multiple Availability Zones and services like AWS FIS to build highly available services and improve its recovery time from unexpected failures to only a few minutes without human intervention. Finally, it shows a solution that you can implement for your applications to achieve Lambda’s resilience strategy.

To learn more about AWS FIS, there are many tutorials and a workshop you can check out.

For more serverless learning resources, visit Serverless Land.

Processing geospatial IoT data with AWS IoT Core and the Amazon Location Service

Post Syndicated from Marcia Villalba original https://aws.amazon.com/blogs/compute/processing-geospatial-iot-data-with-aws-iot-core-and-the-amazon-location-service/

This post is written by Swarna Kunnath (Cloud Application Architect), and Anand Komandooru (Sr. Cloud Application Architect).

This blog post shows how to republish messages that arrive from Internet of Things (IoT) devices across AWS accounts using a replatforming approach. A replatforming approach minimizes changes to the core application architecture, allowing an organization to reduce risk and meet business needs more quickly. In this post, you also learn how to track an IoT device’s location using the Amazon Location Service.

The example used in this post relates to an aviation company that has airplanes with line replacement unit devices or transponders. Transponders are IoT devices that send airplane geospatial data (location and altitude) to the AWS IoT Core service. The company’s airplane transponders send location data to the AWS IoT Core service provisioned in an existing AWS account (source account). The solution required manual intervention to track airplane location sent by the transponders.

They must rearchitect their application due to an internal reorganization event. As part of the rearchitecture approach, the business decides to enhance the application to process the transponder messages in another AWS account (destination account). In addition, the business needs full automation of the airplane’s location tracking process, to minimize the risk of the application changes, and to deliver the changes quickly.

Solution overview

The high-level solution republishes the IoT messages from the source account to the destination account using AWS IoT Core, Amazon SQS, AWS Lambda, and integrates the application with Amazon Location Service. IoT messages are replicated to an IoT topic in the destination account for downstream processing, minimizing changes to the original application architecture. Integration with Amazon Location Service automates the process of device location tracking and alert generation.

The AWS IoT platform allows you to connect your internet-enabled devices to the AWS Cloud via MQTT, HTTP, or WebSocket protocol. Once connected, the devices send data to the MQTT topics. Data ingested on MQTT topics is routed into AWS services (Amazon S3, SQS, Amazon DynamoDB, and Lambda) by configuring rules in the AWS IoT Rules Engine. The AWS IoT Rules Engine offers ways to define queries to format and filter messages published by these devices, and supports integration with several other AWS services as targets.

The Amazon Location Service lets you add geospatial data including capabilities such as maps, points of interest, geocoding, routing, geofences, and tracking. The tracker with geofence tracks the location of the device based on the geospatial data in the published IoT messages. Amazon Location Service generates enter and exit events and integrates with Amazon EventBridge and Amazon Simple Notification Service (Amazon SNS) to generate alerts based on defined filters in EventBridge rules.

The solution in this post delivers high availability, scalability, and cost efficiency by using serverless and managed services. The serverless services used by this solution also provide automatic scaling and built-in high availability. Integrating Amazon Location Service with AWS IoT and EventBridge helps to automate the auditing and processing of geospatial messages.

Solution architecture

These steps describe an end-to-end sequence of events:

  1. An IoT device (a transponder in an airplane) publishes a message to the AWS IoT Core service in the source account.
  2. The message arrives at an AWS IoT Core topic in the source account.
  3. AWS IoT Rules Engine receives the message and processes it, using IoT rules attached to the corresponding topic in the source account.
  4. An AWS IoT rule replicates the message to an SQS queue in the destination account.
  5. A Lambda function in the destination account polls the SQS queue and publishes received messages in batches to the destination account IoT topic.
  6. The Location action configured to the IoT rule sends the messages to Amazon Location Service tracker from the IoT topic.
  7. An Amazon Location tracker sends events when an IoT device enters or exits a linked geofence.
  8. EventBridge receives these events and, via the configured event rule, sends out SNS notifications for the configured devices.

Pre-requisites

This example has the following prerequisites:

  1. Access to the AWS services mentioned in this blog post within two AWS Accounts.
  2. A local install of AWS SAM CLI to build and deploy the sample code.

Solution walkthrough

To deploy this solution, first deploy IoT components via the AWS Serverless Application Model (AWS SAM), in the source and destination accounts. After, configure Amazon Location Service resources in the destination account. To learn more, visit the AWS SAM deployment documentation.

Deploying the code

Deploy the following AWS SAM templates in order:

To build and deploy the code, run:

sam build --template <TemplateName>.yaml
sam deploy --guided

Configuring a tracker

Amazon Location Trackers send device location updates that provide data to retrieve current and historical locations for devices.

Using Amazon Location Trackers and Amazon Location Geofences together, you can automatically evaluate the location updates from your IoT devices against your geofences to generate the geofence events. Actions could be taken to generate the alerts based on the areas of interest.

  1. Follow the instructions in the documentation to create the tracker resource from the AWS Management Console. Use this information for the new tracker:
    • Name: Enter a unique name that has a maximum of 100 characters. For example, FlightTracker.
    • Description: Enter an optional description. For example, Tracker for storing device positions.
  2. Configure a Location action to the destination IoT rule that receives messages from the destination IoT topic and publishes them in batches to the configured Tracker device (for example, FlightTracker). The parameters in the JSON data that is returned to the Location action can also be configured via substitution templates.

Geofence collection

Geofences contain points and vertices that form a closed boundary, which defines an area of interest. For example, flight origin and destination details. You can use tools, such as GeoJSON.io, to draw geofences and save the output as a GeoJSON file. Follow the instructions in the documentation to create the GeoJSON file and link it to the geofence collection.

  1. Create the geofence collection with a GeoJSON file and link it to the tracker you just created.
  2. Link the tracker to the geofence by following these instructions and start tracking the device’s location updates. You can link them together so that you automatically evaluate location updates against all your geofences. You can evaluate device positions against geofences on demand as well.

When device positions are evaluated against geofences, they generate events. For example, when a plane enters or exits a location specified in the geofence.

You can configure EventBridge with rules to react to these events. You can set up SNS to notify your clients when a specific tracker device location changes. Follow the instructions in the documentation on how to set up EventBridge rules to integrate with Amazon Location Service events.

Testing the solution

You can test the first part of the solution by sending an IoT message with location details in the JSON format from the source account and verify that the message arrives at the destination account SQS queue. Detailed instructions to publish a test message from the source account that includes location information (latitude and longitude) can be found here.

Messages from the destination account SQS queue are published to the Amazon Location Service Tracker. When the location in the test message matches the criteria provided in the geofence, Amazon Location Service generates an event. EventBridge has a rule configured that gets matched when an Amazon Location tracker event arrives, and the rule target is an SNS topic that sends an email or text message to the client.

Cleaning up

To avoid incurring future charges, delete the CloudFormation stacks, location tracker, and geofence collection created as part of the solution walk-through. Replace the resource identifiers in the following commands with the ID/name of the resources.

  1. Delete the SAM application stack:
    aws cloudformation delete-stack --stack-name <StackName>
    

    Refer to this documentation for further information.

  2. Delete the location tracker:
    aws location delete-tracker --tracker-name <TrackerName>
  3. Delete the geofence collection:
    aws location delete-geofence-collection --collection-name <GeoCollectionName>

Conclusion

This blog post shows how to create a serverless solution for cross account IoT message publishing and tracking device location updates using Amazon Location Service.

It describes the process of how to publish AWS IoT messages across multiple accounts. Integration with the Amazon Location Service shows how to track IoT device location updates and generate alerts, alleviating the need for manual device location tracking.

For more serverless learning resources, visit Serverless Land.

Introducing maximum concurrency of AWS Lambda functions when using Amazon SQS as an event source

Post Syndicated from Julian Wood original https://aws.amazon.com/blogs/compute/introducing-maximum-concurrency-of-aws-lambda-functions-when-using-amazon-sqs-as-an-event-source/

This blog post is written by Solutions Architects John Lee and Jeetendra Vaidya.

AWS Lambda now provides a way to control the maximum number of concurrent functions invoked by Amazon SQS as an event source. You can use this feature to control the concurrency of Lambda functions processing messages in individual SQS queues.

This post describes how to set the maximum concurrency of SQS triggers when using SQS as an event source with Lambda. It also provides an overview of the scaling behavior of Lambda using this architectural pattern, challenges this feature helps address, and a demo of the maximum concurrency feature.

Overview

Lambda uses an event source mapping to process items from a stream or queue. The event source mapping reads from an event source, such as an SQS queue, optionally filters the messages, batches them, and invokes the mapped Lambda function.

The scaling behavior for Lambda integration with SQS FIFO queues is simple. A single Lambda function processes batches of messages within a single message group to ensure that messages are processed in order.

For SQS standard queues, the event source mapping polls the queue to consume incoming messages, starting at five concurrent batches with five functions at a time. As messages are added to the SQS queue, Lambda continues to scale out to meet demand, adding up to 60 functions per minute, up to 1,000 functions, to consume those messages. To learn more about Lambda scaling behavior, read ”Understanding how AWS Lambda scales with Amazon SQS standard queues.”

Lambda processing standard SQS queues

Lambda processing standard SQS queues

Challenges

When a large number of messages are in the SQS queue, Lambda scales out, adding additional functions to process the messages. The scale out can consume the concurrency quota in the account. To prevent this from happening, you can set reserved concurrency for individual Lambda functions. This ensures that the specified Lambda function can always scale to that much concurrency, but it also cannot exceed this number.

When the Lambda function concurrency reaches the reserved concurrency limit, the queue configuration specifies the subsequent behavior. The message is returned to the queue and retried based on the redrive policy, expired based on its retention policy, or sent to another SQS dead-letter queue (DLQ). While sending unprocessed messages to a DLQ is a good option to preserve messages, it requires a separate mechanism to inspect and process messages from the DLQ.

The following example shows a Lambda function reaching its reserved concurrency quota of 10.

Lambda reaching reserved concurrency of 10.

Lambda reaching reserved concurrency of 10.

Maximum Lambda concurrency with SQS as an event source

The launch of maximum concurrency for SQS as an event source allows you to control Lambda function concurrency per source. You set the maximum concurrency on the event source mapping, not on the Lambda function.

This event source mapping setting does not change the scaling or batching behavior of Lambda with SQS. You can continue to batch messages with a customized batch size and window. It rather sets a limit on the maximum number of concurrent function invocations per SQS event source. Once Lambda scales and reaches the maximum concurrency configured on the event source, Lambda stops reading more messages from the queue. This feature also provides you with the flexibility to define the maximum concurrency for individual event sources when the Lambda function has multiple event sources.

Maximum concurrency is set to 10 for the SQS queue.

Maximum concurrency is set to 10 for the SQS queue.

This feature can help prevent a Lambda function from consuming all available Lambda concurrency of the account and avoids messages returning to the queue unnecessarily because of Lambda functions being throttled. It provides an easier way to control and consume messages at a desired pace, controlled by the maximum number of concurrent Lambda functions.

The maximum concurrency setting does not replace the existing reserved concurrency feature. Both serve distinct purposes and the two features can be used together. Maximum concurrency can help prevent overwhelming downstream systems and unnecessary throttled invocations. Reserved concurrency guarantees a maximum number of concurrent instances for the function.

When used together, the Lambda function can have its own allocated capacity (reserved concurrency), while being able to control the throughput for each event source (maximum concurrency). When using the two features together, you must set the function reserved concurrency higher than the maximum concurrency on the SQS event source mapping to prevent throttling.

Setting maximum concurrency for SQS as an event source

You can configure the maximum concurrency for an SQS event source through the AWS Management Console, AWS Command Line Interface (CLI), or infrastructure as code tools such as AWS Serverless Application Model (AWS SAM). The minimum supported value is 2 and the maximum value is 1000. Refer to the Lambda quotas documentation for the latest limits.

Configuring the maximum concurrency for an SQS trigger in the console

Configuring the maximum concurrency for an SQS trigger in the console

You can set the maximum concurrency through the create-event-source-mapping AWS CLI command.

aws lambda create-event-source-mapping --function-name my-function --ScalingConfig {MaxConcurrency=2} --event-source-arn arn:aws:sqs:us-east-2:123456789012:my-queue

Seeing the maximum concurrency setting in action

The following demo compares Lambda receiving and processes messages differently when using maximum concurrency compared to reserved concurrency.

This GitHub repository contains an AWS SAM template that deploys the following resources:

  • ReservedConcurrencyQueue (SQS queue)
  • ReservedConcurrencyDeadLetterQueue (SQS queue)
  • ReservedConcurrencyFunction (Lambda function)
  • MaxConcurrencyQueue (SQS queue)
  • MaxConcurrencyDeadLetterQueue (SQS queue)
  • MaxConcurrencyFunction (Lambda function)
  • CloudWatchDashboard (CloudWatch dashboard)

The AWS SAM template provisions two sets of identical architectures and an Amazon CloudWatch dashboard to monitor the resources. Each architecture comprises a Lambda function receiving messages from an SQS queue, and a DLQ for the SQS queue.

The maxReceiveCount is set as 1 for the SQS queues, which sends any returned messages directly to the DLQ. The ReservedConcurrencyFunction has its reserved concurrency set to 5, and the MaxConcurrencyFunction has the maximum concurrency for the SQS event source set to 5.

Pre-requisites

Running this demo requires the AWS CLI and the AWS SAM CLI. After installing both CLIs, clone this GitHub repository and navigate to the root of the directory:

git clone https://github.com/aws-samples/aws-lambda-amazon-sqs-max-concurrency
cd aws-lambda-amazon-sqs-max-concurrency

Deploying the AWS SAM template

  1. Build the AWS SAM template with the build command to prepare for deployment to your AWS environment.
  2. sam build
  3. Use the guided deploy command to deploy the resources in your account.
  4. sam deploy --guided
  5. Give the stack a name and accept the remaining default values. Once deployed, you can track the progress through the CLI or by navigating to the AWS CloudFormation page in the AWS Management Console.
  6. Note the queue URLs from the Outputs tab in the AWS SAM CLI, CloudFormation console, or navigate to the SQS console to find the queue URLs.
The Outputs tab of the launched AWS SAM template provides URLs to CloudWatch dashboard and SQS queues.

The Outputs tab of the launched AWS SAM template provides URLs to CloudWatch dashboard and SQS queues.

Running the demo

The deployed Lambda function code simulates processing by sleeping for 10 seconds before returning a 200 response. This allows the function to reach a high function concurrency number with only a small number of messages.

To add 25 messages to the Reserved Concurrency queue, run the following commands. Replace <ReservedConcurrencyQueueURL> with your queue URL from the AWS SAM Outputs.

for i in {1..25}; do aws sqs send-message --queue-url <ReservedConcurrencyQueueURL> --message-body testing; done 

To add 25 messages to the Maximum Concurrency queue, run the following commands. Replace <MaxConcurrencyQueueURL> with your queue URL from the AWS SAM Outputs.

for i in {1..25}; do aws sqs send-message --queue-url <MaxConcurrencyQueueURL> --message-body testing; done 

After sending messages to both queues, navigate to the dashboard URL available in the Outputs tab to view the CloudWatch dashboard.

Validating results

Both Lambda functions have the same number of invocations and the same concurrent invocations fixed at 5. The CloudWatch dashboard shows the ReservedConcurrencyFunction experienced throttling and 9 messages, as seen in the top-right metric, were sent to the corresponding DLQ. The MaxConcurrencyFunction did not experience any throttling and messages were not delivered to the DLQ.

CloudWatch dashboard showing throttling and DLQs.

CloudWatch dashboard showing throttling and DLQs.

Clean up

To remove all the resources created in this demo, use the delete command and follow the prompts:

sam delete

Conclusion

You can now control the maximum number of concurrent functions invoked by SQS as a Lambda event source. This post explains the scaling behavior of Lambda using this architectural pattern, challenges this feature helps address, and a demo of maximum concurrency in action.

There are no additional charges to use this feature besides the standard SQS and Lambda charges. You can start using maximum concurrency for SQS as an event source with new or existing event source mappings by connecting it with SQS. This feature is available in all Regions where Lambda and SQS are available.

For more serverless learning resources, visit Serverless Land.

Running Next.js applications with serverless services on AWS

Post Syndicated from James Beswick original https://aws.amazon.com/blogs/compute/running-next-js-applications-with-serverless-services-on-aws/

This is written by Julian Bonilla, Senior Solutions Architect, and Matthew de Anda, Startup Solutions Architect.

React is a popular JavaScript library used to create single-page applications (SPAs). React focuses on helping to build UIs, but leaves it up to developers to decide how to accomplish other aspects involved with developing a SPA.

Next.js is a React framework to help provide more structure and solve common application requirements such as routing and data fetching. Next.js also provides multiple types of rendering methods – Static Site Generation (SSG), Server-Side Rendering (SSR), Incremental Static Regeneration (ISR), and Client-Side Rendering (CSR).

This post demonstrates how to build a Next.js application with Serverless services on AWS and explains Next.js Server-Side rendering. To deploy this solution and to provision the AWS resources, you can use either AWS Serverless Application Model (AWS SAM) or AWS Cloud Development Kit (CDK). Both are open-source frameworks to automate AWS deployment. AWS SAM is a declarative framework for building serverless applications and CDK is an imperative framework to define cloud application resources using familiar programming languages.

Overview

To render a Next.js application, you use Amazon S3, Amazon CloudFront, Amazon API Gateway, and AWS Lambda. Static resources are hosted in a private S3 bucket with a CloudFront distribution. Since static sources are generated at build time, this takes advantage of CloudFront so browsers can load these files cached on the network edge instead of from the server.

The Next.js application components that uses server-side rendering is rendered with a Lambda function using AWS Lambda Web Adapter. The CloudFront distribution is configured to forward requests to the API Gateway endpoint, which then calls the Lambda function.

  1. Static files (for example, CSS, JavaScript, and HTML) are mapped to /_next/static/* and /public/*.
  2. Server-side rendering is mapped with default behavior (*).
  3. The AWS Lambda Adapter runs Next.js Output File Tracing.

What’s Next.js?

Next.js is a React framework that creates a more opinionated approach to building web applications while providing additional structure and features such as Server-Side Rendering and Static Site Generation.

These additional rendering options provide more flexibility over the typical ways a React application is built, which is to render in the client’s browser with JavaScript. This can help in scenarios where customers have JavaScript disabled and can improve search engine optimization (SEO). While you can implement SSR in React applications, Next.js makes it simpler for developers.

Next.js rendering strategies

These are the different rendering strategies offered by Next.js:

  • Static Site Generation generates static resources at build time and is a good rendering strategy for static content that rarely changes and SEO.
  • Server-Side Rendering generates each page on-demand at request time and is good for pages that are dynamic. Since from the browser perspective it’s still pre-rendered, like Static Site Generation, it’s also good for SEO.
  •  Incremental Static Regeneration is a new rendering strategy that is good for apps with many pages where build times are high. With Incremental Static Regeneration, you can build page per-page without needing to rebuild the entire app.
  • Client-Side Rendering is the typical rendering strategy where the application is rendered in the browser with JavaScript. Next.js lets you choose the appropriate rendering method page-by-page. When a Next.js application is built, Next.js transforms the application to production-optimized files. You have HTML for statically generated pages, JavaScript for rendering on the server, JavaScript for rendering on the client, and CSS files.

Next.js also supports static HTML export, which has no server side component. Features that require a server are not supported with this approach. These apps can be hosted from S3 and CloudFront.

The remainder of this post focuses on Static Site Generation and Server-Side Rendering.

Next.js application project structure

Understanding how Next.js structures projects can give insight into how you deploy the application. A page is a React Component exported from files in the “pages” directory. These files are also used for routing where pages/index.js is routed to / route.

By default, these pages are pre-rendered. Static assets, such as images, are stored under “public” directory and can be referenced from /. Since these files are best stored in persistent storage and backed by a content delivery network (CDN), you can add a prefix in the implementation to distinguish these static files.

To create dynamic routes, add brackets to a page file – for example, pages/user/[id].js. This creates a statically generated page with the path /user/<id> where <id> can be dynamic.

API routes provide a way to create an API endpoint and are located in the pages/api directory. When building, Next.js generates an optimized version of your application under the .next directory. Static files not stored in the public directory are in .next/static. These static files are expected to be uploaded as _next/static to a CDN.

No other code in the .next/directory should be uploaded to a CDN because that would expose server code and other configuration.

Implementation

Next.js pre-renders HTML for every page using Static Site Generation or Server-side Rendering. For Static Site Generation, pages are rendered at build time and can be cached in CloudFront. Server-side rendered pages are rendered at request time, and typically fetch data from downstream resources on each request.

Clients connect to a CloudFront distribution, which is configured to forward requests for static resources to S3 and all other requests to API Gateway. API Gateway forwards requests to the Next.js application running on Lambda, which performs the server-side rendering.

At build time, Next.js Output File Tracing determines the minimal set of files needed for deploying to Lambda. The files are automatically copied to a standalone directory and must be enabled in next.config.js.

const nextConfig = {
  reactStrictMode: true,
  output: 'standalone',
}
module.exports = nextConfig

Since the Next.js application is essentially a webserver, this example uses the AWS Lambda Web Adapter as a Lambda layer to convert incoming events from API Gateway to HTTP requests that Next.js can process.

Once processed, the AWS Lambda Web Adapter converts the HTTP response back to a Lambda event response. The Lambda handler is configured to run the minimal server.js file created by the standalone build step.

The CloudFront distribution has two origins: one for the S3 bucket and another for the API Gateway. Two behaviors are created to specify path patterns to route static content produced by Next.js and static resources stored under the public/static directory. Next.js uses the public directory under root to serve static assets such as images.

These assets are then served under / so if you add public/me.png, it would be served at /me.png. This makes it harder to create a CloudFront behavior for these assets. One workaround is to create a static directory under the public directory and then map it to the CloudFront behavior. The default(*) path pattern behavior has the origin set to API Gateway with caching disabled.

Prerequisites and deployment

Refer to the project in its GitHub repository for instructions to deploy the solution using AWS SAM or AWS CDK. Multiple resources are provisioned for you as part of the deployment, and it takes several minutes to complete. The example Next.js application deployed is created using Create Next App.

Understanding the Next.js Application

To create a new page, you create a file under the pages directory and that creates a route based on the name (e.g. pages/hello.js creates route /hello). To create dynamic routes, create a file following the project’s example of pages/posts/[id].js to produce routes for posts/1, posts/2, and so forth.

For API routes, any file added to the directory pages/api is mapped to /api/* and becomes an API endpoint. These are server-side only bundles hosted by API Gateway and Lambda.

Conclusion

This blog shows how to run Next.js applications using S3, CloudFront, API Gateway, and Lambda. This architecture supports building Next.js applications that can use static-site generation, server-side rendering, and client-side rendering. The blog also covers how you can use open-source frameworks, AWS SAM and CDK, to build and deploy your Next.js applications.

If your organization is looking for a fully managed hosting of your Next.js applications, AWS Amplify Hosting supports Next.js. If interested in learning more about server-side rendering and micro-frontends, see Server-side rendering micro-frontends – the architecture.

For more serverless learning resources, visit Serverless Land.

Architecture patterns for consuming private APIs cross-account

Post Syndicated from Eric Johnson original https://aws.amazon.com/blogs/compute/architecture-patterns-for-consuming-private-apis-cross-account/

This blog written by Thomas Moore, Senior Solutions Architect and Josh Hart, Senior Solutions Architect.

Amazon API Gateway allows developers to create private REST APIs that are only accessible from a virtual private cloud (VPC). Traffic to the private API uses secure connections and does not leave the AWS network, meaning AWS isolates it from the public internet. This makes private API Gateway endpoints a good fit for publishing internal APIs, such as those used by backend microservice communication.

In microservice architectures, where multiple teams build and manage components, different AWS accounts often consume private API endpoints.

This blog post shows how a service can consume a private API Gateway endpoint that is published in another AWS account securely over AWS PrivateLink.

Consuming API Gateway private endpoint cross-account via AWS PrivateLink.

Consuming API Gateway private endpoint cross-account via AWS PrivateLink.

This blog covers consuming API Gateway endpoints cross-account. For exposing cross-account resources behind an API Gateway, read this existing blog post.

Overview

To access API Gateway private endpoints, you must create an interface VPC endpoint (named execute-api) inside your VPC. This creates an AWS PrivateLink connection between your AWS account VPC and the API Gateway service VPC. The PrivateLink connection allows traffic to flow over private IP address space without traversing the internet.

PrivateLink allows access to private API Gateway endpoints in different AWS accounts, without VPC peering, VPN connections, or AWS Transit Gateway. A single execute-api endpoint is used to connect to any API Gateway, regardless of which AWS account the destination API Gateway is in. Resource policies control which VPC endpoints have access to the API Gateway private endpoint. This makes the cross-account architecture simpler, with no complex routing or inter-vpc connectivity.

The following diagram shows how interface VPC endpoints in a consumer account create a PrivateLink connection back to the API Gateway service account VPC. The resource policy applied to the private API determines which VPC endpoint can access the API. For this reason, it is critical to ensure that the resource policy is correct to prevent unintentional access from other AWS account VPC endpoints.

Access to private API Gateway endpoints requires an AWS PrivateLink connection to an AWS service account VPC.

Access to private API Gateway endpoints requires an AWS PrivateLink connection to an AWS service account VPC.

In this example, the resource policy denies all connections to the private API endpoint unless the aws:SourceVpce condition matches vpce-1a2b3c4d in account A. This means that connections from other execute-api VPC endpoints are denied. To allow access from account B, add vpce-9z8y7x6w to the resource policy. Refer to the documentation to learn about other condition keys you can use in API Gateway resource policies.

For more detail on how VPC links work, read Understanding VPC links in Amazon API Gateway private integrations.

The following sections cover three architecture patterns to consume API Gateway private endpoints cross-account:

  1. Regional API Gateway to private API Gateway
  2. Lambda function calling API Gateway in another account
  3. Container microservice calling API Gateway in another account using mTLS

Regional API Gateway to private API Gateway cross-account

When building microservices in different AWS accounts, private API Gateway endpoints are often used to allow service-to-service communication. Sometimes a portion of these endpoints must be exposed publicly for end user consumption. One pattern for this is to have a central public API Gateway, which acts as the front-door to multiple private API Gateway endpoints. This allows for central governance of authentication, logging and monitoring.

The following diagram shows how to achieve this using a VPC link. VPC links enable you to connect API Gateway integrations to private resources inside a VPC. The API Gateway VPC interface endpoint is the VPC resource that you want to connect to, as this is routing traffic to the private API Gateway endpoints in different AWS accounts.

API Gateway Regional endpoint consuming API Gateway private endpoints cross-account

API Gateway Regional endpoint consuming API Gateway private endpoints cross-account

VPC link requires the use of a Network Load Balancer (NLB). The target group of the NLB points to the private IP addresses of the VPC endpoint, normally one for each Availability Zone. The target group health check must validate the API Gateway service is online. You can use the API Gateway reserved /ping path for this, which returns an HTTP status code of 200 when the service is healthy.

You can deploy this pattern in your own account using the example CDK code found on GitHub.

Lambda function calling private API Gateway cross-account

Another popular requirement is for AWS Lambda functions to invoke private API Gateway endpoints cross-account. This enables service-to-service communication in microservice architectures.

The following diagram shows how to achieve this using interface endpoints for Lambda, which allows access to private resources inside your VPC. This allows Lambda to access the API Gateway VPC endpoint and, therefore, the private API Gateway endpoints in another account.

Consuming API Gateway private endpoints from Lambda cross-account

Consuming API Gateway private endpoints from Lambda cross-account

Unlike the previous example, there is no NLB or VPC link required. The resource policy on the private API Gateway must allow access from the VPC endpoint in the account where the consuming Lambda function is.

As the Lambda function has a VPC attachment, it will use DNS resolution from inside the VPC. This means that if you selected the Enable Private DNS Name option when creating the interface VPC endpoint for API Gateway the https://{restapi-id}.execute-api.{region}.amazonaws.com endpoint will automatically resolve to private IP addresses. Note that this DNS configuration can block access from Regional and edge-optimized API endpoints from inside the VPC. For more information, refer to the knowledge center article.

You can deploy this pattern in your own account using the sample CDK code found on GitHub.

Calling private API Gateway cross-account with mutual TLS (mTLS)

Customers that operate in regulated industries, such as open banking, must often implement mutual TLS (mTLS) for securely accessing their APIs. It is also great for Internet of Things (IoT) applications to authenticate devices using digital certificates.

Mutual TLS (mTLS) verifies both the client and server via certificates with TLS

Mutual TLS (mTLS) verifies both the client and server via certificates with TLS

Regional API Gateway has native support for mTLS but, currently, private API Gateway does not support mTLS, so you must terminate mTLS before the API Gateway. One pattern is to implement a proxy service in the producer account that resolves the mTLS handshake, terminates mTLS, and proxies the request to the private API Gateway over regular HTTPS.

The following diagram shows how to use a combination of PrivateLink, an NGINX-based proxy, and private API Gateway to implement mTLS and consume the private API across accounts.

Consuming API Gateway private endpoints cross-account with mTLS

Consuming API Gateway private endpoints cross-account with mTLS

In this architecture diagram, Amazon ECS Fargate is used to host the container task running the NGINX proxy server. This proxy validates the certificate passed by the connecting client before passing the connection to API Gateway via the execute-proxy VPC endpoint. The following sample NGINX configuration shows how the mTLS proxy service works by using ssl_verify_client and ssl_client_certificate settings to verify the connecting client’s certificate, and proxy_pass to forward the request onto API Gateway.

server {
    listen 443 ssl;

    ssl_certificate     /etc/ssl/server.crt;
    ssl_certificate_key /etc/ssl/server.key;
    ssl_protocols       TLSv1.2;
    ssl_prefer_server_ciphers on;
    ssl_ciphers ECDH+AESGCM:ECDH+AES256:ECDH+AES128:DH+3DES:!ADH:!AECDH:!MD5;

    ssl_client_certificate /etc/ssl/client.crt;
    ssl_verify_client      on;

    location / {
        proxy_pass https://{api-gateway-endpoint-api};
    }
}

The connecting client must supply the client certificate when connecting to the API via the VPC endpoint service:

curl --key client.key --cert client.crt --cacert server.crt https://{vpc-endpoint-service-url}

Use VPC security group rules on both the VPC endpoint and the NGINX proxy to prevent clients bypassing the mTLS endpoint and connecting directly to the API Gateway endpoint.

There is an example NGINX config and Dockerfile to configure this solution in the GitHub repository.

Conclusion

This post explores three solutions to consume private API Gateway across AWS accounts. A key component of all the solutions is the VPC interface endpoint. Using VPC Endpoints & PrivateLink, you can consume resources securely and even your own microservices across AWS accounts. For more details, read Enabling New SaaS Strategies with AWS PrivateLink. Visit the GitHub repository to get started implementing one of these solutions today.

For more serverless learning resources, visit Serverless Land.

Chaos experiments using AWS Step Functions and AWS Fault Injection Simulator

Post Syndicated from James Beswick original https://aws.amazon.com/blogs/compute/chaos-experiments-using-aws-step-functions-and-aws-fault-injection-simulator/

This post is written by Arunsingh Jeyasingh Jacob, Senior Solutions Architect, and Sindhura Palakodety, Senior Solutions Architect.

To run business-critical applications at scale, it is important to determine the resiliency of the application. Chaos experiments induce controlled failures into a distributed application to gain confidence in the application behavior. The learnings from these experiments can be fed into a continuous feedback cycle to improve the resiliency.

In 2021, AWS launched AWS Fault Injection Simulator (FIS). This is a fully managed service for running Fault Injection experiments on AWS. It makes it easier to improve an application’s performance, observability, and resiliency. With Fault Injection Simulator, AWS customers can quickly set up experiments using pre-built templates that generate the desired disruptions.

Overview

This post uses AWS Step Functions to create and run AWS Fault Injection Simulator (FIS) experiments. You are encouraged to perform these experiments in a test account. Do not use the example in a production environment without making appropriate code changes.

The demo-fis-stepfunctions code deployed in this post is used to build the Step Functions state machine for FIS experiments.

There are two Step Functions workflows that are deployed. One is for chaos testing Amazon EC2 workloads and the other one is for Amazon ECS workloads.

The Step Functions workflow for EC2 workloads

The following Step Functions workflow shows an EC2 chaos experiment to stress CPU utilization, and stop and terminate EC2 instances.

Step Functions workflow for Amazon EC2 Fault Injection Experiments

EC2 experiment templates

This workflow runs through FIS experiment template creation followed by the execution of the FIS experiment. The FIS experiment template contains one or more actions to run on specified targets during an experiment. By creating a template, you are not running experiments against any workload, but creating a definition for the experiment.

The EC2 experiment templates created in this workflow are:

  • EC2CPUStressExperimentTemplate
  • EC2StopExperimentTemplate
  • EC2TerminateExperimentTemplate

These are the terms used in the FIS experiment template:

  • Actions: While creating an experimentation template, you must define an action once during an experiment.
  • Targets: A target is one or more AWS resources on which an action is performed by AWS Fault Injection Simulator (AWS FIS) during an experiment. For example, defining which instances to stress CPUs based on the tags.
  • Filters: Resource filters are queries that identify target resources according to specific attributes.
  • IAM role: This IAM role is assumed by FIS to perform the actions mentioned in the template. The Step Functions role must pass permissions to this FIS role.
  • Client token: The Step Functions execution fails if a client token is not passed.
  • Selection mode: Run experiments on all the resources matching the target criteria or specify the number of resources. For example, the EC2CPUStressExperimentTemplate targets one resource in random.

The ‘EC2CPUStressExperimentTemplate’ code defines how to stop EC2 instances with the tag ‘FISAction: CPUStress’:

{
   "Targets": {
      "CPUStressInstances": {
         "ResourceType": "aws:ec2:instance",
         "ResourceTags": {
            "FISAction": "CPUStress"
         },
         "Filters": [
            {
               "Path": "VpcId",
               "Values": [
                  "${VpcID}"
               ]
            }
         ],
         "SelectionMode": "COUNT(1)"
      }
   }
}

Targets can also be filtered using parameters like Amazon VPC ID. You can change the Step Functions definition by modifying the targets, actions, and filters.

EC2 FIS experiments

FIS experiment uses the experiment template definition during the state execution, and targets the appropriate resources.

  1. There are three EC2 FIS experiments created as a part of the workflow:1. CPUStressInstances: This runs after the ‘EC2CPUStressExperimentTemplate’ state. In this state, AWS Systems Manager (SSM) attempts to add CPU stress on the target instance with the tag “FISAction: CPUStress”. You can monitor the metric in the Amazon CloudWatch dashboard, and take actions using Amazon CloudWatch alarms.
    Monitoring the CPU utilization using Amazon CloudWatch
  2. StopInstances: Here, the target instances enter the ‘stopping’ state. Based on the template definition, all the EC2 instances with the tag “FISAction:Stop” in the filtered VPC are stopped.
  3.  TerminateInstances: This terminates the target instances with the tag “FISAction:Terminate” in the filtered VPC.

The Step Functions workflow for Amazon ECS workloads

The following Step Functions workflow shows an FIS experiment to stop ECS tasks:

Step Functions workflow for Amazon ECS Fault Injection experiment

  • Amazon ECS experiment template: The ECSStopTaskExperimentTemplate state is created in this workflow. This FIS template defines the action to be run during the experiment.
  • Amazon ECS experiments: After creating the experiment template, the ECSStopTask state runs the FIS experiment.
  • ECSStopTask: FIS targets all the Amazon ECS tasks with the tag “FISAction: StopECSTask” and stops the tasks.

After the FIS experiment state is initiated, the status of the experiment can be polled before proceeding to the next state. The FIS experiments have multiple states like pending, initiating, running, completed, stopping, stopped, and failed.

The choice state in the workflow checks for the ‘running’ state by polling the status using FIS: GetExperiment API. A ‘failed’ status will result in the workflow failure. You can also design the workflow by introducing wait times between the experiments or by including flow activities like parallel.

Deploying with the AWS Serverless Application Model

This example has the following prerequisites:

  1. Create an AWS account if you don’t have one already.
  2. A valid existing VPC with subnets.
  3. A local install of Git CLI.
  4. A local install of AWS SAM CLI to build and deploy the sample code.

After installation, follow these steps to deploy the example:

  1. Clone the sample code:
    git clone https://github.com/aws-samples/aws-stepfunctions-examples.git
    cd sam/demo-fis-stepfunctions/
    
  2. Modify the templates as needed. You can also edit the state machine code from the AWS Management Console after you deploy this code.
  3. Build and deploy the code:
    sam build 
    sam deploy --guided
    

To learn more, visit the AWS SAM deployment documentation. This launches an AWS CloudFormation stack that creates the state machine, AWS IAM roles and CloudWatch log group. The next step is to run the state machines.

Running the Step Functions workflows

The AWS SAM deployment creates two Step Functions state machines in the deployed AWS Region: FISTest-aws-region-StateMachineFIS and FISTest-aws-region-StateMachineECSFIS.

Before running the state machine FISTest-aws-region-StateMachineFIS, create three EC2 instances with the tags “FISAction: CPUStress”, “FISAction:Stop” and “FISAction:Terminate” respectively.

  1. Navigate to the Step Functions console.
  2. Choose FISTest-aws-region-StateMachineFIS then Start execution.

As the workflow progresses, CPU Utilization spikes in one Amazon EC2 instance. The other Amazon EC2 instances are stopped and terminated.

To run chaos experiments on an ECS cluster, you can either use an existing ECS cluster or create a new cluster. To create an ECS cluster:

  1. Navigate to the ECS console.
  2. Choose Get Started.
  3. Choose sample-app and follow the instructions to deploy. Wait for the cluster to be created.
  4. Choose the sample cluster, then choose Tasks.
  5. Choose the running tasks and add the tag “FISAction: StopECSTask”

From the browser, the public IP assigned to the task takes you to the sample application.

Amazon ECS Sample Application

  1. Navigate to the Step Functions console.
  2. Choose FISTest-aws-region-StateMachineECSFIS, then Start execution.
  3. The workflow transitions to Wait during the execution.

Execution - FIS Step Functions workflow for ECS experiment

Once the execution is complete, the webpage momentarily becomes unavailable until a new task comes up. The public IP address and ARN of the task changes. The task status of the stopped tasks now shows “Task stopped by AWS FIS”.

ECS Task stopped by AWS FIS Experiment

To perform an FIS experiment against an existing ECS cluster, add the Resource Tags value “FISAction: StopECSTask” to your ECS tasks before running the workflows.

{
   "Targets": {
      "ecsfargatetask": {
         "ResourceType": "aws:ecs:task",
         "ResourceTags": {
            "FISAction": "StopECSTask"
         },
         "SelectionMode": "ALL"
      }
   }
}

Cleanup

If you have deployed the code using AWS SAM, delete the resources:

sam delete –stack-name <STACK_NAME>

Refer to this documentation for further information.

Conclusion

This blog post describes how to use Step Functions to orchestrate Fault Injection Simulator (FIS) experiments for EC2 and ECS workloads. Using the workflow in this post as an example, you can build state machines for more AWS FIS experiments. Step Functions, AWS FIS, and other services can be combined to build resiliency workflows, and test your application against your resiliency goals.

To learn more about AWS FIS and Step Functions, visit:

For more Step Functions resources, visit the Serverless Workflows Collection.

Securing Lambda Function URLs using Amazon Cognito, Amazon CloudFront and AWS WAF

Post Syndicated from Marcia Villalba original https://aws.amazon.com/blogs/compute/securing-lambda-function-urls-using-amazon-cognito-amazon-cloudfront-and-aws-waf/

This post is written by Madhu Singh (Solutions Architect), and Krupanidhi Jay (Solutions Architect).

Lambda function URLs is a dedicated HTTPs endpoint for a AWS Lambda function. You can configure a function URL to have two methods of authentication: IAM and NONE. IAM authentication means that you are restricting access to the function URL (and in-turn access to invoke the Lambda function) to certain AWS principals (such as roles or users). Authentication type of NONE means that the Lambda function URL has no authentication and is open for anyone to invoke the function.

This blog shows how to use Lambda function URLs with an authentication type of NONE and use custom authorization logic as part of the function code, and to only allow requests that present valid Amazon Cognito credentials when invoking the function. You also learn ways to protect Lambda function URL against common security threats like DDoS using AWS WAF and Amazon CloudFront.

Lambda function URLs provides a simpler way to invoke your function using HTTP calls. However, it is not a replacement for Amazon API Gateway, which provides advanced features like request validation and rate throttling.

Solution overview

There are four core components in the example.

1. A Lambda function with function URLs enabled

At the core of the example is a Lambda function with the function URLs feature enabled with the authentication type of NONE. This function responds with a success message if a valid authorization code is passed during invocation. If not, it responds with a failure message.

2. Amazon Cognito User Pool

Amazon Cognito user pools enable user authentication on websites and mobile apps. You can also enable publicly accessible Login and Sign-Up pages in your applications using Amazon Cognito user pools’ feature called the hosted UI.

In this example, you use a user pool and the associated Hosted UI to enable user login and sign-up on the website used as entry point. This Lambda function validates the authorization code against this Amazon Cognito user pool.

3. CloudFront distribution using AWS WAF

CloudFront is a content delivery network (CDN) service that helps deliver content to end users with low latency, while also improving the security posture for your applications.

AWS WAF is a web application firewall that helps protect your web applications or APIs against common web exploits and bots and AWS Shield is a managed distributed denial of service (DDoS) protection service that safeguards applications running on AWS. AWS WAF inspects the incoming request according to the configured Web Access Control List (web ACL) rules.

Adding CloudFront in front of your Lambda function URL helps to cache content closer to the viewer, and activating AWS WAF and AWS Shield helps in increasing security posture against multiple types of attacks, including network and application layer DDoS attacks.

4. Public website that invokes the Lambda function

The example also creates a public website built on React JS and hosted in AWS Amplify as the entry point for the demo. This website works both in authenticated mode and in guest mode. For authentication, the website uses Amazon Cognito user pools hosted UI.

Solution architecture

This shows the architecture of the example and the information flow for user requests.

In the request flow:

  1. The entry point is the website hosted in AWS Amplify. In the home page, when you choose “sign in”, you are redirected to the Amazon Cognito hosted UI for the user pool.
  2. Upon successful login, Amazon Cognito returns the authorization code, which is stored as a cookie with the name “code”. The user is redirected back to the website, which has an “execute Lambda” button.
  3. When the user choose “execute Lambda”, the value from the “code” cookie is passed in the request body to the CloudFront distribution endpoint.
  4. The AWS WAF web ACL rules are configured to determine whether the request is originating from the US or Canada IP addresses and to determine if the request should be allowed to invoke Lambda function URL origin.
  5. Allowed requests are forwarded to the CloudFront distribution endpoint.
  6. CloudFront is configured to allow CORS headers and has the origin set to the Lambda function URL. The request that CloudFront receives is passed to the function URL.
  7. This invokes the Lambda function associated with the function URL, which validates the token.
  8. The function code does the following in order:
    1. Exchange the authorization code in the request body (passed as the event object to Lambda function) to access_token using Amazon Cognito’s token endpoint (check the documentation for more details).
      1. Amazon Cognito user pool’s attributes like user pool URL, Client ID and Secret are retrieved from AWS Systems Manager Parameter Store (SSM Parameters).
      2. These values are stored in SSM Parameter Store at the time these resources are deployed via AWS CDK (see “how to deploy” section)
    2. The access token is then verified to determine its authenticity.
    3. If valid, the Lambda function returns a message stating user is authenticated as <username> and execution was successful.
    4. If either the authorization code was not present, for example, the user was in “guest mode” on the website, or the code is invalid or expired, the Lambda function returns a message stating that the user is not authorized to execute the function.
  9. The webpage displays the Lambda function return message as an alert.

Getting started

Pre-requisites:

Before deploying the solution, please follow the README from the GitHub repository and take the necessary steps to fulfill the pre-requisites.

Deploy the sample solution

1. From the code directory, download the dependencies:

$ npm install

2. Start the deployment of the AWS resources required for the solution:

$ cdk deploy

Note:

  • optionally pass in the –profile argument if needed
  • The deployment can take up to 15 minutes

3. Once the deployment completes, the output looks similar to this:

Open the amplifyAppUrl from the output in your browser. This is the URL for the demo website. If you don’t see the “Welcome to Compute Blog” page, the Amplify app is still building, and the website is not available yet. Retry in a few minutes. This website works either in an authenticated or unauthenticated state.

Test the authenticated flow

  1. To test the authenticated flow, choose “Sign In”.

2. In the sign-in page, choose on sign-up (for the first time) and create a user name and password.

3. To use an existing an user name and password, enter those credentials and choose login.

4. Upon successful sign-in or sign up, you are redirected back to the webpage with “Execute Lambda” button.

5. Choose this button. In a few seconds, an alert pop-up shows the logged in user and that the Lambda execution is successful.

Testing the unauthenticated flow

1. To test the unauthenticated flow, from the Home page, choose “Continue”.

2. Choose “Execute Lambda” and in a few seconds, you see a message that you are not authorized to execute the Lambda function.

Testing the geo-block feature of AWS WAF

1. Access the website from a Region other than US or Canada. If you are physically in the US or Canada, you may use a VPN service to connect to a Region other than US or Canada.

2. Choose the “Execute Lambda” button. In the Network trace of browser, you can see the call to invoke Lambda function was blocked with Forbidden response.

3. To try either the authenticated or unauthenticated flow again, choose “Return to Home Page” to go back to the home page with “Sign In” and “Continue” buttons.

Cleaning up

To delete the resources provisioned, run the cdk destroy command from the AWS CDK CLI.

Conclusion

In this blog, you create a Lambda function with function URLs enabled with NONE as the authentication type. You then implemented a custom authentication mechanism as part of your Lambda function code. You also increased the security of your Lambda function URL by setting it as Origin for the CloudFront distribution and using AWS WAF Geo and IP limiting rules for protection against common web threats, like DDoS.

For more serverless learning resources, visit Serverless Land.

Visualize and create your serverless workloads with AWS Application Composer

Post Syndicated from James Beswick original https://aws.amazon.com/blogs/compute/visualize-and-create-your-serverless-workloads-with-aws-application-composer/

This post is written by Luca Mezzalira, Principal Specialist Solutions Architect.

Today, AWS is launching a preview of AWS Application Composer, a visual designer that you can use to build your serverless applications from multiple AWS services.

In distributed systems, empowering teams is a cultural shift needed for enabling developers to help translate business capabilities into code.

This doesn’t mean every team works in isolation. Different teams or even new-joiners must understand what they are building to contribute to a project. The best way to understand architecture quickly is by using diagrams. Unfortunately, architectural diagrams are often outdated. Often, when releasing a workload in production, there are already discrepancies from the initial design and infrastructure.

Developers new to building serverless applications can face a learning curve when composing applications from multiple AWS services. They must understand how to configure each service, and then learn and write infrastructure as code (IaC) to deploy their application.

Example scenario

Emma is a cloud architect working for a video on-demand platform where every user can access the content after subscribing to the service. In the next few months, the marketing team wants to start a campaign to increase the user base using discount codes for new users only.

She collaborates with a team of developers who are new to building serverless applications. They must design a discount code service that can scale to thousands of transactions per second. There are many requirements to implement this service:

  • Gathering the gift code from a user.
  • Verifying the discount code is available.
  • Applying the discount code to the invoice at the end of the month.

Based on these requirements and default SLAs available for all the platform services, Emma designs a high-level architecture with the key elements needed for building this microservice.

Discount code service high-level architecture

Discount code service high-level architecture

Her idea is to receive a request from clients with a discount code in the payload, and validate the availability of the discount code in a database. The service then asynchronously processes different discount codes in batches to reduce traffic to downstream dependencies and reduce the cost of the overall infrastructure.

This approach ensures that the service can scale in the future beyond the initial traffic volume. It simplifies the management and implementation of the discount code service and other parts of the system with a loosely coupled architecture.

After discussing the architecture with her developers, she opens Application Composer in the AWS Management Console and starts building the implementation using serverless services.

Application Composer initial screen

Application Composer initial screen

To start, she selects New blank project and selects a local file system folder to save the project files.

Application Composer create blank project

Application Composer create blank project

Granting Application Composer access to your local project files allows near real time bidirectional syncing of changes between the console interface and locally stored project files. When you update a property with the Application Composer interface, it’s reflected in the files stored locally. When you change a local file in your IDE, it automatically reflects in the Application Composer canvas.

After creating the project, Emma drags the AWS resources she needs from the left sidebar for expressing the initial design agreed with the team.

Using Application Composer, you can drag serverless resources on the canvas and connect them together. In the background, Application Composer generates the infrastructure as code AWS CloudFormation template for you.

Application Composer canvas

Application Composer canvas

For example, this is the default configuration generated when you drag a Lambda function onto the canvas. The following code is present in the template view:

  Function:
    Type: AWS::Serverless::Function
    Properties:
      FunctionName: !Sub ${AWS::StackName}-Function
      Description: !Sub
        - Stack ${AWS::StackName} Function ${ResourceName}
        - ResourceName: Function
      CodeUri: src/Function
      Handler: index.handler
      Runtime: nodejs14.x
      MemorySize: 3008
      Timeout: 30
      Tracing: Active

Application Composer incorporates some helpful default property values, which are sometimes overlooked by developers new to serverless workloads. These include activating tracing using AWS X-Ray or increasing a function timeout, for instance.

You can change these parameters either in the CloudFormation template inside Application Composer or by visually selecting a resource. In the previous example, you can update the Lambda function parameters by opening the resource properties panel.

Application Composer resource panel

Application Composer resource panel

When you synchronize an Application Composer project with the local system, you can change the CloudFormation template from a code editor. This reflects the change in the Application Composer interface automatically.

When you connect two elements in the canvas, Application Composer sets default IAM policies, environment variables for Lambda functions, and event subscriptions where applicable.

For instance, if you have a Lambda function that interacts with an Amazon DynamoDB table and Amazon SQS queue, Application Composer generates the following configuration for the Lambda function.

Function:
    Type: AWS::Serverless::Function
    Properties:
      FunctionName: !Sub ${AWS::StackName}-Function
      Description: !Sub
        - Stack ${AWS::StackName} Function ${ResourceName}
        - ResourceName: Function
      CodeUri: src/Function
      Handler: index.handler
      […]
      Environment:
        Variables:
          QUEUE_NAME: !GetAtt Queue.QueueName
          QUEUE_ARN: !GetAtt Queue.Arn
          QUEUE_URL: !Ref Queue
          TABLE_NAME: !Ref Table
          TABLE_ARN: !GetAtt Table.Arn
      Policies:
        - SQSSendMessagePolicy:
            QueueName: !GetAtt Queue.QueueName
        - DynamoDBCrudPolicy:
            TableName: !Ref Table

This helps new builders when designing their first serverless applications and provides an initial configuration, which more advanced builders can amend. This allows you to include good operational practices when designing a serverless application.

Emma’s team continues to add together the different services needed to express the discount code architecture. This is the final result in Application Composer:

Discount code architecture in Application Composer

Discount code architecture in Application Composer

  1. The application includes an Amazon API Gateway endpoint that exposes the API needed for submitting a discount code to the system.
  2. The POST API triggers a Lambda function that first validates that the discount code is still available.
  3. This is stored using a DynamoDB table
  4. After successfully validating the discount code, the function adds a message to an SQS queue and returns a successful response to the client.
  5. Another Lambda function retrieves the message from the SQS queue and sends an invoice.

Using this approach optimizes the Lambda function invocation for speed as the remaining operations are handled asynchronously. This also simplifies the complexity and cost of the architecture because you can aggregate multiple discount codes per user SQS batching, rather than scaling the service when requests arrive from the users.

The team agrees to use this as the initial design of their service. In the future, they plan to integrate with their authentication mechanism. They add Lambda Powertools for observability, and additional libraries developed internally to make the project compliant with company standards.

Application Composer has created all the files needed to start the project in Emma’s local file system including the CloudFormation template .yaml file and the Lambda functions’ handlers.

Application Composer generated files

Application Composer generated files

Emma can now upload the outline of this service to a version control system and share the artifacts with other developers who can start coding the business logic.

Additional features

Application Composer includes a resource list tab within the left-side panel that allows you to quickly browse available resources.

Application Composer browse available resources

Application Composer browse available resources

You can also group resources semantically for simplifying the visualization inside the canvas. This helps when you have a large application in the canvas and you want to select an element quickly without dragging the canvas around to find the resource. This feature doesn’t impact the infrastructure generated.

Application Composer grouping

Application Composer grouping

Application Composer adds some metadata to the CloudFormation template to allow the canvas to group resources together when the project is loaded again.

Metadata:
  AWS::Composer::Groups:
    Group:
      Label: Group
      Members:
        - CodesQueue
        - CodesTable

You can use Application Composer beyond building new serverless workloads. You can load existing CloudFormation templates by selecting Load existing project in the Create project dialog.

Application Composer load existing project

Application Composer load existing project

You can use this to define your blueprints with organizational best practices and then visualize them within Application Composer. This helps teams collaborate when starting new serverless services. You can add resources from an existing base template to build serverless microservices or event-driven architectures.

Integration with AWS SAM

AWS Serverless Application Model (AWS SAM) recently announced the general availability of AWS SAM Accelerate to accelerate the feedback loop and testing of your code and cloud infrastructure by synchronizing only project changes. You can use Application Composer together with AWS SAM Accelerate to more simply visually build and then test your serverless applications in the cloud.

To learn more about AWS SAM Accelerate, watch this live demo.

Where Application Composer fits into the development process

Emma used Application Composer to help her team for this project but has ideas on further ways to use it.

  • Rapid prototyping.
  • Reviewing and collaboratively evolving existing serverless projects.
  • Generating diagrams for documentation or Wikis.
  • On-boarding new team members to a project
  • Reducing the first steps to deploy something in an AWS Cloud account.

Application Composer availability

Application Composer is currently available as a public preview in the following Regions: Frankfurt (eu-central-1), Ireland (eu-west-1), Ohio (us-east-2), Oregon (us-west-2), North Virginia (us-east-1) and Tokyo (ap-northeast-1).

Application Composer is available at no additional cost and can be accessed via the AWS Management Console.

Conclusion

Application Composer is a visual designer to help developers and architects express and build their application architecture. They can iterate on their ideas with colleagues and create documentation for others working on the application for the first time. You can use Application Composer during multiple stages of your software development lifecycle, reducing the friction in getting your project started and into production.

Currently, Application Composer supports a limited number of services that we plan to add to in the future. Let us know which services you would like to see included.

As a public preview, we are looking for suggestions and ideas to evolve the tool. We are looking for ways to help you and your teams to speed up the adoption of serverless workloads inside your organization. Add a comment to this post or tweet with the tag #AWSAppComposerWishlist.

For more serverless learning resources, visit Serverless Land.

Introducing new AWS Serverless digital learning badges

Post Syndicated from James Beswick original https://aws.amazon.com/blogs/compute/introducing-new-aws-serverless-digital-learning-badges/

This post is written by Josh Kahn, Tech Leader, Serverless.

Today, we are excited to announce an all-new way to demonstrate your AWS Serverless knowledge and skills: a verifiable, digital badge. The new digital badge is aligned with our Serverless Learning Plan now available in AWS Skill Builder.

You can earn the digital badge by scoring at least 80 percent on the assessment associated with the Learning Plan. The badge proves your knowledge and skills for AWS Lambda, Amazon API Gateway, and designing serverless applications. You can celebrate your achievement on your resume, social media, and AWS re:Post with the verifiable badge distributed and managed by Credly. The badge includes metadata to verify the issuer and skills demonstrated by the holder. The Serverless Learning Plan and digital badge assessment are now available, for free.

Ready to get started or want to jump immediately to the assessment? Start here. Continue reading to learn more about the details of AWS Skill Builder and our Serverless Learning Plan.

Serverless Digital Learning Badge

The Serverless Learning Plan

Our Serverless Learning Plan has been designed to help you get started building with Serverless technology. AWS experts designed the content to provide a clear learning path to help you develop the skills you need quickly.

The Learning Plan starts with an introduction to the “Serverless Mindset” and introduces key concepts to help you design architectures and applications. It discusses how to best take advantage of the event-driven orientation of serverless computing.

Next, the course “AWS Lambda Foundations” covers the fundamentals of AWS Lambda, an event-driven compute service that lets you run code without provisioning or managing servers. You’ll learn foundational concepts, including how Lambda works, security and permission models, and best practices for writing Lambda functions.

The Learning Plan also includes four courses that span the lifecycle of building Lambda-based applications. In “Architecting Serverless Applications,” you learn about common architectures and patterns for serverless applications. We explore how to build microservices, data processing workloads, Alexa skills, mobile backends, and automate tasks in your AWS account. The course also discusses the trade-offs in selecting from the various compute options available to you.

The “Scaling Serverless Architectures” course discusses concepts such as Lambda concurrency and how Lambda-based applications scale. We briefly explore optimization opportunities for Lambda functions and trade-offs. While this course is not a deep dive in optimization across all supported runtimes, it offers a starting point.

In “Security and Observability for Serverless Applications,” you’ll learn how to use services such as AWS CloudTrail, AWS Config, and AWS X-Ray in concert with Lambda-based applications. We also discuss the built-in logging to Amazon CloudWatch and considerations. This course also touches on how the Lambda service creates isolation and a security boundary between functions.

There are a number of popular options for deploying and managing serverless applications. In “Deploying Serverless Applications,” we explore the AWS Serverless Application Model (AWS SAM) and the AWS suite of developer tools. You’ll learn best practices for deployment, including how to automate deployment using a CI/CD pipeline. This course also covers concepts such as Lambda versions and aliases, Lambda environment variables, and other deployment features.

Serverless is more than Lambda. During the Learning Plan, you also learn how to use Amazon API Gateway to create and deploy serverless APIs. “Amazon API Gateway for Serverless Applications” discusses REST and WebSocket options available from API Gateway and how to integrate with Lambda and other backends. The course also discusses the rich set of API Gateway features available, including caching, various authorization modes, usage plans, API keys, and deployment stages.

To complete the Learning Plan, we also provide an introduction to event-driven architectures built using services such as AWS Step Functions and Amazon Simple Queue Service (SQS). This course compliments the “Serverless Mindset” course to help you think about how asynchronous processing can improve the resiliency and scalability of your serverless applications.

All courses are available in a variety of languages.

After completing the Learning Plan, take the online assessment and score over 80 percent to earn the digital badge. Our badge assessments are linked to curriculum standards and have been developed by field subject matter experts (SMEs) and content/curriculum SMEs. If you are already familiar with AWS Serverless, you can also jump right to the assessment. If you don’t pass, you’ll be guided on how to fill knowledge gaps and can retake the assessment after 24 hours.

We’re also working to add more courses on topics, such as Amazon EventBridge, and more extensive course work on event-driven architectures next year. Stay tuned.

Our Learning Plan has been designed for you to move at your own pace, from wherever you are. It’s a great opportunity to build new skills or refresh your knowledge. Employers seeking to build knowledge in Serverless can also use the Learning Plan and digital badge to build critical knowledge in the space.

AWS Skill Builder

Beyond our recommended Serverless curriculum, Skill Builder offers a bevy of digital courses developed for different roles (e.g., developer, architect, data engineer) and domains (e.g., storage, databases). Skill Builder offers free learning content as well as subscription plans for individuals and teams. Skill Builder is a great way to advance your skills in areas that often touch serverless applications, including security, observability / monitoring, and DevOps.

We encourage you to check out these other expert-designed courses to help advance your knowledge of AWS. Subscription plans include hands-on labs and certification practice exams. The free content includes over 500 courses and learning plans, all available on-demand so that you can learn at your own pace.

Dive deeper with the AWS Serverless Ramp-up Guide

If you want to dive deeper after completing the AWS Serverless Learning Plan, download the AWS Ramp-Up Guide for Serverless. The guide includes a listing of courses, hands-on workshops, classroom training, and other resources to enrich your serverless knowledge.

Think of the Ramp-Up Guide as a menu of options. Pick and choose the topics that are most interesting to you and move at your own pace. We’ve included digital courses, reading, videos, and workshops to help you learn however is most effective for you.

We’re working to continually update the Ramp-up Guide so that you can easily find up-to-date content to deepen your skills. Check back for updates.

Conclusion

We’re excited to share the newly updated Serverless Learning Plan and all-new digital badge with you. To our knowledge, this is one of the first ways (if not the first) that Serverless builders can verifiably demonstrate their knowledge to the community and employers. Our team of SMEs across AWS Serverless and Training & Certification are excited to hear your feedback on the Learning Plan as well as where you would like to see us develop training next.

The AWS Serverless Learning Plan and digital badge are available now. All courses are available on-demand. Both the learning plan courses and the assessment are free for everyone.

Share your accomplishment by posting on social media with the hashtag #AWSTraining! Get started today at https://aws.amazon.com/training/learn-about/serverless/.

For more serverless learning resources, visit Serverless Land.

Reducing Java cold starts on AWS Lambda functions with SnapStart

Post Syndicated from Eric Johnson original https://aws.amazon.com/blogs/compute/reducing-java-cold-starts-on-aws-lambda-functions-with-snapstart/

Written by Mark Sailes, Senior Serverless Solutions Architect, AWS.

At AWS re:Invent 2022, AWS announced SnapStart for AWS Lambda functions running on Java Corretto 11. This feature enables customers to achieve up to 10x faster function startup performance for Java functions, at no additional cost, and typically with minimal or no code changes.

Overview

Today, for Lambda’s function invocations, the largest contributor to startup latency is the time spent initializing a function. This includes loading the function’s code and initializing dependencies. For interactive workloads that are sensitive to start-up latencies, this can cause suboptimal end user experience.

To address this challenge, customers either provision resources ahead of time, or spend effort building relatively complex performance optimizations, such as compiling with GraalVM native-image. Although these workarounds help reduce the startup latency, users must spend time on some heavy lifting instead of focusing on delivering business value. SnapStart addresses this concern directly for Java-based Lambda functions.

How SnapStart works

With SnapStart, when a customer publishes a function version, the Lambda service initializes the function’s code. It takes an encrypted snapshot of the initialized execution environment, and persists the snapshot in a tiered cache for low latency access.

When the function is first invoked and then scaled, Lambda resumes the execution environment from the persisted snapshot instead of initializing from scratch. This results in a lower startup latency.

Lambda function lifecycle

Lambda function lifecycle

A function version activated with SnapStart transitions to an inactive state if it remains idle for 14 days, after which Lambda deletes the snapshot. When you try to invoke a function version that is inactive, the invocation fails. Lambda sends a SnapStartNotReadyException and begins initializing a new snapshot in the background, during which the function version remains in Pending state. Wait until the function reaches the Active state, and then invoke it again. To learn more about this process and the function states, read the documentation.

Using SnapStart

Application frameworks such as Spring give developers an enormous productivity gain by reducing the amount of boilerplate code they write to accomplish common tasks. When first created, frameworks didn’t have to consider startup time because they run on application servers, which run for long periods of time. The startup time is minimal compared to the running duration. You often only restart them when there is an application version change.

If the functionality that these frameworks bring is implemented at runtime, then they often contribute to latency in startup time. SnapStart allows you to use frameworks like Spring and not compromise tail latency.

To demonstrate SnapStart, I use a sample application that saves records into Amazon DynamoDB. This Spring Boot application (TODO Link) uses a REST controller to handle CRUD requests. This sample includes infrastructure as code to deploy the application using the AWS Serverless Application Model (AWS SAM). You must install the AWS SAM CLI to deploy this example.

To deploy:

  1. Clone the git repository and change to project directory:
    git clone https://github.com/aws-samples/serverless-patterns.git
    cd serverless-patterns/apigw-lambda-snapstart
  2. Use the AWS SAM CLI to build the application:
    sam build
  3. Use the AWS SAM CLI to deploy the resources to your AWS account:
    sam deploy -g

This project deploys with SnapStart already enabled. To enable or disable this functionality in the AWS Management Console:

  1. Navigate to your Lambda function.
  2. Select the Configuration tab.
  3. Choose Edit and change the SnapStart attribute to PublishedVersions.
  4. Choose Save.

    Lambda Console confoguration

    Lambda Console confoguration

  5. Select the Versions tab and choose Publish new.
  6. Choose Publish.

Once you’ve enabled SnapStart, Lambda publishes all subsequent versions with snapshots. The time to run your publish version depends on your init code. You can run init up to 15 minutes with this feature.

Considerations

Stale credentials

Using SnapStart and restoring from a snapshot often changes how you create functions. With on-demand functions, you might access one time data in the init phase, and then reuse it during future invokes. If this data is ephemeral, a database password for example, then there might be a time between fetching the secret and using it, that the password has changed leading to an error. You must write code to handle this error case.

With SnapStart, if you follow the same approach, your database password is persisted in an encrypted snapshot. All future execution environments have the same state. This can be days, weeks, or longer after the snapshot is taken. This makes it more likely that your function has the incorrect password stored. To improve this, you could move the functionality to fetch the password to the post-snapshot hook. With each approach, it is important to understand your application’s needs and handle errors when they occur.

Demo application architecture

Demo application architecture

A second challenge in sharing the initial state is with randomness and uniqueness. If random seeds are stored in the snapshot during the initialization phase, then it may cause random numbers to be predictable.

Cryptography

AWS has changed the managed runtime to help customers handle the effects of uniqueness and randomness when restoring functions.

Lambda has already incorporated updates to Amazon Linux 2 and one of the commonly used cryptographic libraries, OpenSSL (1.0.2), to make them resilient to snapshot operations. AWS has also validated that Java runtime’s built-in RNG java.security.SecureRandom maintains uniqueness when resuming from a snapshot.

Software that always gets random numbers from the operating system (for example, from /dev/random or /dev/urandom) is already resilient to snapshot operations. It does not need updates to restore uniqueness. However, customers who prefer to implement uniqueness using custom code for their Lambda functions must verify that their code restores uniqueness when using SnapStart.

For more details, read Starting up faster with AWS Lambda SnapStart and refer to Lambda documentation on SnapStart uniqueness.

Runtime hooks

These pre- and post-hooks give developers a way to react to the snapshotting process.

For example, a function that must always preload large amounts of data from Amazon S3 should do this before Lambda takes the snapshot. This embeds the data in the snapshot so that it does not need fetching repeatedly. However, in some cases, you may not want to keep ephemeral data. A password to a database may be rotated frequently and cause unnecessary errors. I discuss this in greater detail in a later section.

The Java managed runtime uses the open-source Coordinated Restore at Checkpoint (CRaC) project to provide hook support. The managed Java runtime contains a customized CRaC context implementation that calls your Lambda function’s runtime hooks before completing snapshot creation and after restoring the execution environment from a snapshot.

The following function example shows how you can create a function handler with runtime hooks. The handler implements the CRaC Resource and the Lambda RequestHandler interface.

...
import org.crac.Resource;
import org.crac.Core;
...

public class HelloHandler implements RequestHandler<String, String>, Resource {

    public HelloHandler() {
        Core.getGlobalContext().register(this);
    }

    public String handleRequest(String name, Context context) throws IOException {
        System.out.println("Handler execution");
        return "Hello " + name;
    }

    @Override
    public void beforeCheckpoint(org.crac.Context<? extends Resource> context) throws Exception {
        System.out.println("Before Checkpoint");
    }

    @Override
    public void afterRestore(org.crac.Context<? extends Resource> context) throws Exception {
        System.out.println("After Restore");
    }
}

For the classes required to write runtime hooks, add the following dependency to your project:

Maven

<dependency>
  <groupId>io.github.crac</groupId>
  <artifactId>org-crac</artifactId>
  <version>0.1.3</version>
</dependency>

Gradle

implementation 'io.github.crac:org-crac:0.1.3'

Priming

SnapStart and runtime hooks give you new ways to build your Lambda functions for low startup latency. You can use the pre-snapshot hook to make your Java application as ready as possible for the first invoke. Do as much as possible within your function before the snapshot is taken. This is called priming.

When you upload your zip file of Java code to Lambda, the zip contains .class files of bytecode. This can be run on any machine with a JVM. When the JVM executes your bytecode, it is initially interpreted, then compiled into native machine code. This compilation stage is relatively CPU intensive and happens just in time (JIT Compiler).

You can use the before snapshot hook to run code paths before the snapshot is taken. The JVM compiles these code paths and the optimization is kept for future restores. For example, if you have a function that integrates with DynamoDB, you can make a read operation in your before snapshot hook.

This means that your function code, the AWS SDK for Java, and any other libraries used in that action are compiled and kept within the snapshot. The JVM then won’t need to compile this code when your function is invoked, meaning your latency is less the first time an execution environment is invoked.

Priming requires that you understand your application code and the consequences of executing it. The sample application includes a before snapshot hook, which primes the application by making a read operation from DynamoDB. (TODO Link)

Metrics

The following chart reflects invoking the sample application Lambda function 100 times per second for 10 minutes. This test is based on this function, both with and without SnapStart.


p50 p99.9
On-demand 7.87ms 5,114ms
SnapStart 7.87ms 488ms

Conclusion

This blog shows how SnapStart reduces startup (cold-start) latencies times for Java-based Lambda functions. You can configure SnapStart using AWS SDK, AWS CloudFormation, AWS SAM, and CDK.

To learn more, see Configuring function options in the AWS documentation. This functionality may require some minimal code changes. In most cases, the existing code is already compatible with SnapStart. You can now bring your latency-sensitive Java-based workloads to Lambda and run with improved tail latencies.

This feature allows developers to use the on-demand model in Lambda with low-latency response times, without incurring extra cost. To read more about how to use SnapStart with partner frameworks, find out more from Quarkus and Micronaut. To read more about this and other features, visit Serverless Land.