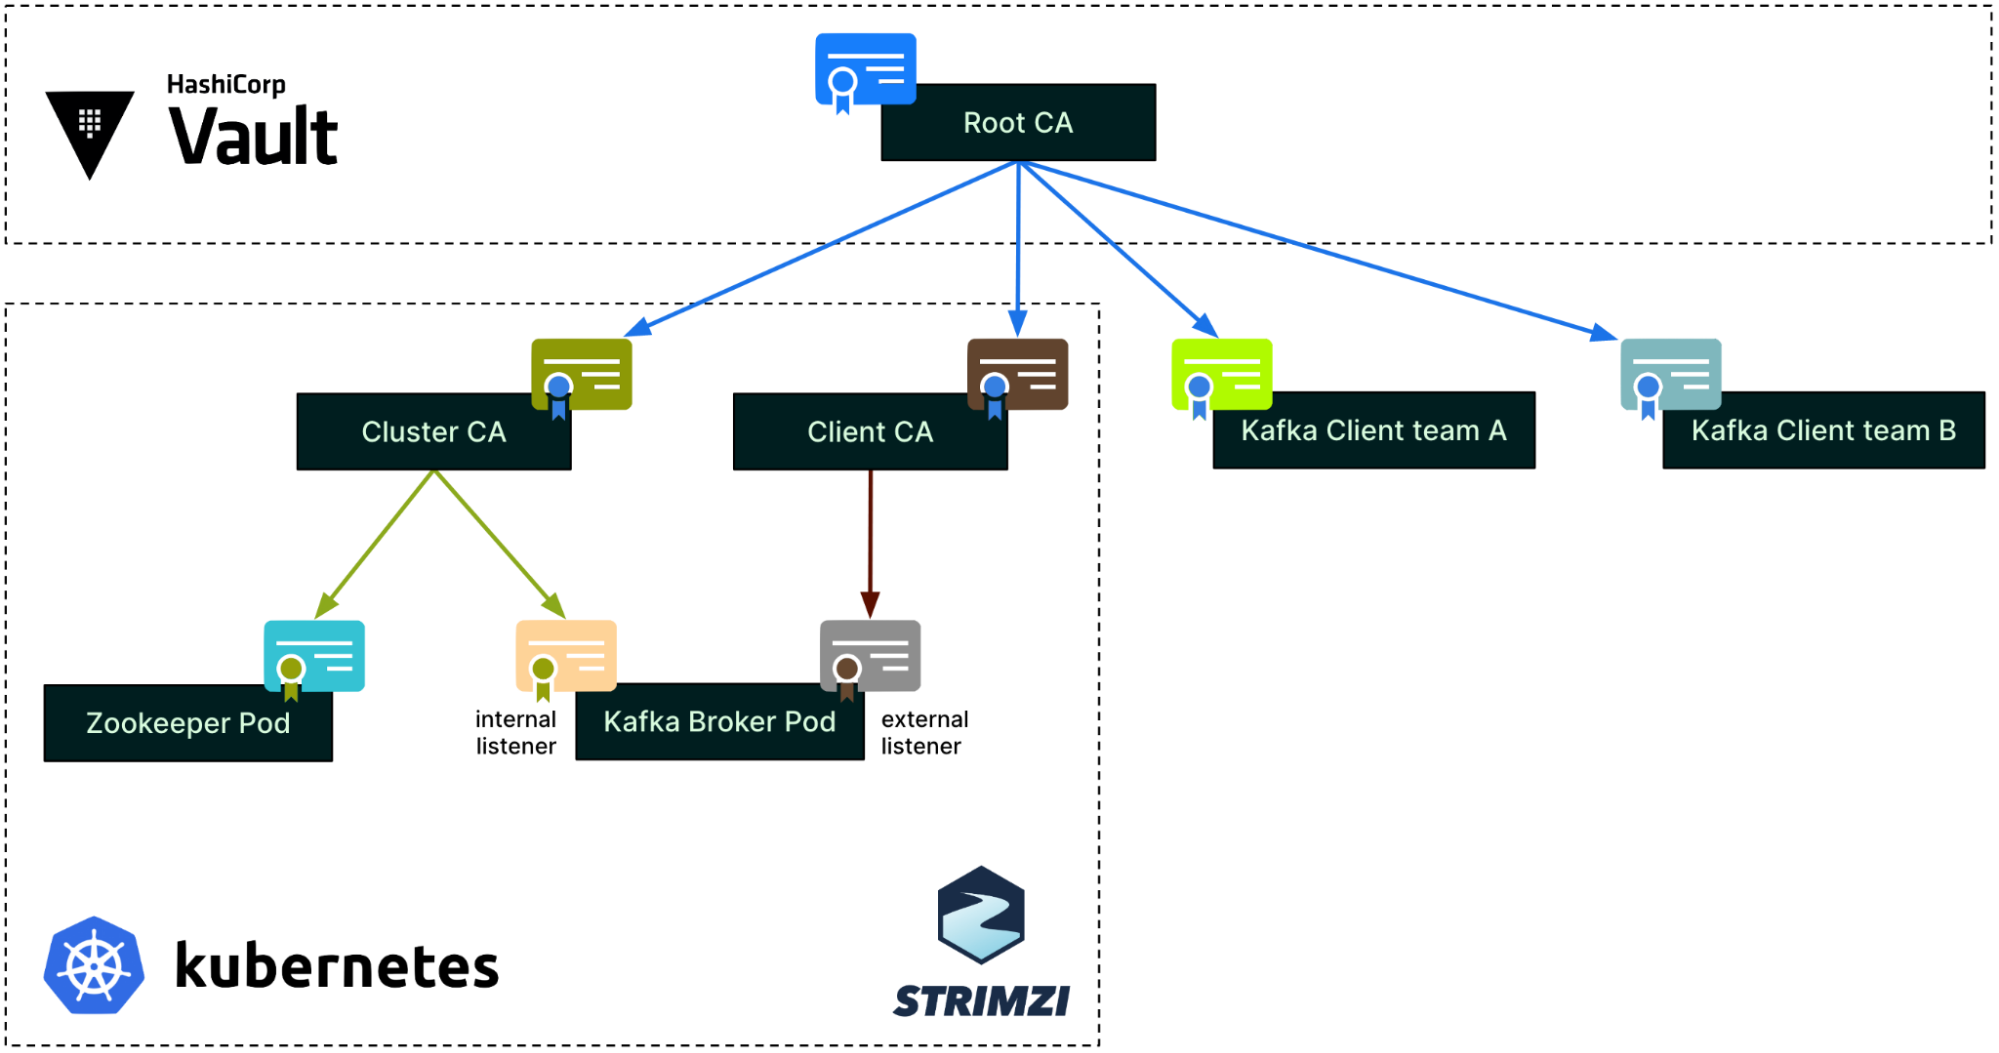
In January, we experienced two incidents. One that resulted in degraded performance for GitHub Packages and GitHub Pages, and another that impacted git users.
January 30 21:48 UTC (lasting 35 minutes)
Our service monitors detected degraded performance for GitHub Packages and GitHub Pages. Most requests to the container registry were failing and some GitHub Pages builds were also impacted. We determined this was caused by a backend change and mitigated by reverting that change.
Due to the recency of this incident, we are still investigating the contributing factors and will provide a more detailed update in next month’s report.
January 30 18:35 UTC (lasting 7 hours)
We upgraded our production Git binary with a recent version from upstream. The updates included a change to use an internal implementation of gzip when generating archives. This resulted in subtle changes to the contents of the “Download Source” links served by GitHub, leading to checksum mismatches. No content was changed.
After becoming aware of the impact to many communities, we rolled back the compression change to restore the previous behavior.
Similar to the above, we are still investigating the contributing factors of this incident, and will provide a more thorough update in next month’s report.
Please follow our status page for real-time updates on status changes. To learn more about what we’re working on, check out the GitHub Engineering Blog.
Dependabot helps developers secure their software with automated security updates: when a security advisory is published that affects a project dependency, Dependabot will try to submit a pull request that updates the vulnerable dependency to a safe version if one is available. Of course, there’s no rule that says a security vulnerability will only affect direct dependencies—dependencies at any level of a project’s dependency graph could become vulnerable.
Until recently, Dependabot did not address vulnerabilities on transitive dependencies, that is, on the dependencies sitting one or more levels below a project’s direct dependencies. Developers would encounter an error message in the GitHub UI and they would have to manually update the chain of ancestor dependencies leading to the vulnerable dependency to bring it to a safe version.
Internally, this would show up as a failed background job due to an update-not-possible error—and we would see a lot of these errors.
Understanding the challenge
Dependabot offers two strategies for updating dependencies: scheduled version updates and security updates. With version updates, the explicit goal is to keep project dependencies updated to the latest available version, and Dependabot can be configured to widen or increase a version requirement so that it accommodates the latest version. With security updates, Dependabot tries to make the most conservative update that removes the vulnerability while respecting version requirements. In this post we’ll be looking at security updates.
As an example, let’s say we have a repository with security updates enabled that contains an npm project with a single dependency on react-scripts@^4.0.3.
Not all package managers handle version requirements in the same way, so let’s quickly refresh. A version requirement like ^4.0.3 (a “caret range”) in npm permits updates to versions that don’t change the leftmost nonzero element in the MAJOR.MINOR.PATCHsemver version number. The version requirement ^4.0.3, then, can be understood as allowing versions greater than or equal to 4.0.3 and less than 5.0.0.
On March 18, 2022, a high-severity security advisory was published for node-forge, a popular npm package that provides tools for writing cryptographic and network-heavy applications. The advisory impacts versions earlier than 1.3.0, the patched version released the day before the advisory was published.
While we don’t have a direct dependency on node-forge, if we zoom in on our project’s dependency tree we can see that we do indirectly depend on a vulnerable version:
In order to resolve the vulnerability, we need to bring node-forge from 0.10.0 to 1.3.0, but a sequence of conflicting ancestor dependencies prevents us from doing so:
4.0.3 is the latest version of react-scripts permitted by our project
3.11.1 is the only version of webpack-dev-server permitted by [email protected]
1.10.14 is the latest version of selfsigned permitted by [email protected]
0.10.0 is the latest version of node-forge permitted by[email protected]
This is the point at which the security update would fail with an update-not-possible error. The challenge is in finding the version of selfsigned that permits [email protected], the version of webpack-dev-server that permits that version of selfsigned, and so on up the chain of ancestor dependencies until we reach react-scripts.
How we chose npm
When we set out to reduce the rate of update-not-possible errors, the first thing we did was pull data from our data warehouse in order to identify the greatest opportunities for impact.
JavaScript is the most popular ecosystem that Dependabot supports, both by Dependabot enablement and by update volume. In fact, more than 80% of the security updates that Dependabot performs are for npm and Yarn projects. Given their popularity, improving security update outcomes for JavaScript projects promised the greatest potential for impact, so we focused our investigation there.
npm and Yarn both include an operation that audits a project’s dependencies for known security vulnerabilities, but currently only npm natively has the ability to additionally make the updates needed to resolve the vulnerabilities that it finds.
After a successful engineering spike to assess the feasibility of integrating with npm’s audit functionality, we set about productionizing the approach.
Tapping into npm audit
When you run the npm audit command, npm collects your project’s dependencies, makes a bulk request to the configured npm registry for all security advisories affecting them, and then prepares an audit report. The report lists each vulnerable dependency, the dependency that requires it, the advisories affecting it, and whether a fix is possible—in other words, almost everything Dependabot should need to resolve a vulnerable transitive dependency.
node-forge  <=1.2.1
Severity: high
Open Redirect in node-forge - https://github.com/advisories/GHSA-8fr3-hfg3-gpgp
Prototype Pollution in node-forge debug API. - https://github.com/advisories/GHSA-5rrq-pxf6-6jx5
Improper Verification of Cryptographic Signature in node-forge - https://github.com/advisories/GHSA-cfm4-qjh2-4765
URL parsing in node-forge could lead to undesired behavior. - https://github.com/advisories/GHSA-gf8q-jrpm-jvxq
fix available via `npm audit fix --force`
Will install [email protected], which is a breaking change
node_modules/node-forge
  selfsigned  1.1.1 - 1.10.14
  Depends on vulnerable versions of node-forge
  node_modules/selfsigned
There were two ways in which we had to supplement npm audit to meet our requirements:
The audit report doesn’t include the chain of dependencies linking a vulnerable transitive dependency, which a developer may not recognize, to a direct dependency, which a developer should recognize. The last step in a security update job is creating a pull request that removes the vulnerability and we wanted to include some context that lets developers know how changes relate to their project’s direct dependencies.
Dependabot performs security updates for one vulnerable dependency at a time. (Updating one dependency at a time keeps diffs to a minimum and reduces the likelihood of introducing breaking changes.) npm audit and npm audit fix, however, operate on all project dependencies, which means Dependabot wouldn’t be able to tell which of the resulting updates were necessary for the dependency it’s concerned with.
Fortunately, there’s a JavaScript API for accessing the audit functionality underlying the npm audit and npm audit fix commands via Arborist, the component npm uses to manage dependency trees. Since Dependabot is a Ruby application, we wrote a helper script that uses the Arborist.audit() API and can be invoked in a subprocess from Ruby. The script takes as input a vulnerable dependency and a list of security advisories affecting it and returns as output the updates necessary to remove the vulnerabilities as reported by npm.
To meet our first requirement, the script uses the audit results from Arborist.audit() to perform a depth-first traversal of the project’s dependency tree, starting with direct dependencies. This top-down, recursive approach allows us to maintain the chain of dependencies linking the vulnerable dependency to its top-level ancestor(s) (which we’ll want to mention later when creating a pull request), and its worst-case time complexity is linear in the total number of dependencies.
function buildDependencyChains(auditReport, name) {
  const helper = (node, chain, visited) => {
    if (!node) {
      return []
    }
    if (visited.has(node.name)) {
      // We've already seen this node; end path.
      return []
    }
    if (auditReport.has(node.name)) {
      const vuln = auditReport.get(node.name)
      if (vuln.isVulnerable(node)) {
        return [{ fixAvailable: vuln.fixAvailable, nodes: [node, ...chain.nodes] }]
      } else if (node.name == name) {
        // This is a non-vulnerable version of the advisory dependency; end path.
        return []
      }
    }
    if (!node.edgesOut.size) {
      // This is a leaf node that is unaffected by the vuln; end path.
      return []
    }
    return [...node.edgesOut.values()].reduce((chains, { to }) => {
      // Only prepend current node to chain/visited if it's not the project root.
      const newChain = node.isProjectRoot ? chain : { nodes: [node, ...chain.nodes] }
      const newVisited = node.isProjectRoot ? visited : new Set([node.name, ...visited])
      return chains.concat(helper(to, newChain, newVisited))
    }, [])
  }
  return helper(auditReport.tree, { nodes: [] }, new Set())
}
To meet our second requirement of operating on one vulnerable dependency at a time, the script takes advantage of the fact that the Arborist constructor accepts a custom audit registry URL to be used when requesting bulk advisory data. We initialize a mock audit registry server using nock that returns only the list of advisories (in the expected format) for the dependency that was passed into the script and we tell the Arborist instance to use it.
We see both of these use cases—linking a vulnerable dependency to its top-level ancestor and conducting an audit for a single package or a particular set of vulnerabilities—as opportunities to extend Arborist and we’re working on integrating them upstream.
Back in the Ruby code, we parse and verify the audit results emitted by the helper script, accounting for scenarios such as a dependency being downgraded or removed in order to fix a vulnerability, and we incorporate the updates recommended by npm into the remainder of the security update job.
With a viable update path in hand, Dependabot is able to make the necessary updates to remove the vulnerability and submit a pull request that tells the developer about the transitive dependency and its top-level ancestor.
Caveats
When npm audit decides that a vulnerability can only be fixed by changing major versions, it requires use of the force option with npm audit fix. When the force option is used, npm will update to the latest version of a package, even if it means jumping several major versions. This breaks with Dependabot’s previous security update behavior. It also achieves our goal: to unlock conflicting dependencies in order to bring the vulnerable dependency to an unaffected version. Of course, you should still always review the changelog for breaking changes when jumping minor or major versions of a package.
Impact
We rolled out support for transitive security updates with npm in September 2022. Now, having a full quarter of data with the changes in place, we’re able to measure the impact: between Q1Y22 and Q4Y22 we saw a 42% reduction in update-not-possible errors for security updates on JavaScript projects.
If you have Dependabot security updates enabled on your npm projects, there’s nothing extra for you to do—you’re already benefiting from this improvement.
Looking ahead
I hope this post illustrates some of the considerations and trade-offs that are necessary when making improvements to an established system like Dependabot. We prefer to leverage the native functionality provided by package managers whenever possible, but as package managers come in all shapes and sizes, the approach may vary substantially from one ecosystem to the next.
We hope other package managers will introduce functionality similar to npm audit and npm audit fix that Dependabot can integrate with and we look forward to extending support for transitive security updates to those ecosystems as they do.
Since the GitHub CLI 2.0 release, developers and organizations have customized their CLI experience by developing and installing extensions. Since then, the CLI team has been busy shipping several new features to further enhance the experience for both extension consumers and authors. Additionally, we’ve shipped go-gh 1.0 release, a Go library giving extension authors access to the same code that powers the GitHub CLI itself. Finally, the CLI team released the gh/pre-extension-precompile action, which automates the compilation and release of Go, Rust, or C++ extensions.
This blog post provides a tour of what’s new, including an in-depth look at writing a CLI extension with Go.
Introducing extension discovery
In the 2.20.0 release of the GitHub CLI, we shipped two new commands, including gh extension browse and gh extension search, to make discovery of extensions easier (all extension commands are aliased under gh ext, so the rest of this post will use that shortened version).
gh ext browse
gh ext browse is a new kind of command for the GitHub CLI: a fully interactive Terminal User Interface (TUI). It allows users to explore published extensions interactively right in the terminal.
Once gh ext browse has launched and loads extension data, you can browse through all of the GitHub CLI extensions available for installation sorted by star count by pressing the up and down arrows (or k and j).
Pressing / focuses the filter box, allowing you to trim the list down to a search term.
You can select any extension by highlighting it. The selected extension can be installed by pressing i or uninstalled by pressing r. Pressing w will open the currently highlighted extension’s repository page on GitHub in your web browser.
Our hope is that this is a more enjoyable and easy way to discover new extensions and we’d love to hear feedback on the approach we took with this command.
gh ext search
In tandem with gh ext browse we’ve shipped another new command intended for scripting and automation: gh ext search. This is a classic CLI command which, with no arguments, prints out the first 30 extensions available to install sorted by star count.
A green check mark on the left indicates that an extension is installed locally.
Any arguments provided narrow the search results:
Results can be further refined and processed with flags, like:
--limit, for fetching more results
--owner, for only returning extensions by a certain author
--sort, for example for sorting by updated
--license, to filter extensions by software license
--web, for opening search results in your web browser
--json, for returning results as JSON
This command is intended to be scripted and will produce composable output if piped. For example, you could install all of the extensions I have written with:
gh ext search --owner vilmibm | cut -f2 | while read -r extension; do gh ext install $extension; done
For more information about gh ext search and example usage, see gh help ext search.
Writing an extension with go-gh
The CLI team wanted to accelerate extension development by putting some of the GitHub CLI’s own code into an external library called go-gh for use by extension authors. The GitHub CLI itself is powered by go-gh, ensuring that it is held to a high standard of quality. This library is written in Go just like the CLI itself.
To demonstrate how to make use of this library, I’m going to walk through building an extension from the ground up. I’ll be developing a command called askfor quickly searching the threads in GitHub Discussions. The end result of this exercise lives on GitHub if you want to see the full example.
Getting started
First, I’ll run gh ext create to get started. I’ll fill in the prompts to name my command “ask” and request scaffolding for a Go project.
Before I edit anything, it would be nice to have this repository on GitHub. I’ll cd gh-ask and run gh repo create, selecting Push an existing local repository to GitHub, and follow the subsequent prompts. It’s okay to make this new repository private for now even if you intend to make it public later; private repositories can still be installed locally with gh ext install but will be unavailable to anyone without read access to that repository.
The initial code
Opening main.go in my editor, I’ll see the boilerplate that gh ext create made for us:
package main

import (
        "fmt"

        "github.com/cli/go-gh"
)

func main() {
        fmt.Println("hi world, this is the gh-ask extension!")
        client, err := gh.RESTClient(nil)
        if err != nil {
                fmt.Println(err)
                return
        }
        response := struct {Login string}{}
        err = client.Get("user", &response)
        if err != nil {
                fmt.Println(err)
                return
        }
        fmt.Printf("running as %s\n", response.Login)
}
go-gh has already been imported for us and there is an example of its RESTClient function being used.
Selecting a repository
The goal with this extension is to get a glimpse into threads in a GitHub repository’s discussion area that might be relevant to a particular question. It should work something like this:
$ gh ask actions
…a list of relevant threads from whatever repository you're in locally…

$ gh ask --repo cli/cli ansi
…a list of relevant threads from the cli/cli repository…
First, I’ll make sure that a repository can be selected. I’ll also remove stuff we don’t need right now from the initial boilerplate.
package main

import (
        "flag"
        "fmt"
        "os"

        "github.com/cli/go-gh"
        "github.com/cli/go-gh/pkg/repository"
)

func main() {
    if err := cli(); err != nil {
            fmt.Fprintf(os.Stderr, "gh-ask failed: %s\n", err.Error())
            os.Exit(1)
    }
}

func cli() {
        repoOverride := flag.String(
        "repo", "", "Specify a repository. If omitted, uses current repository")
        flag.Parse()

        var repo repository.Repository
        var err error

        if *repoOverride == "" {
                repo, err = gh.CurrentRepository()
        } else {
                repo, err = repository.Parse(*repoOverride)
        }
        if err != nil {
                return fmt.Errorf("could not determine what repo to use: %w", err.Error())

        }

        fmt.Printf(
       "Going to search discussions in %s/%s\n", repo.Owner(), repo.Name())

}
Running my code, I should see:
$ go run .
Going to search discussions in vilmibm/gh-ask
Adding our repository override flag:
$ go run . --repo cli/cli
Going to search discussions in cli/cli
Accepting an argument
Now that the extension can be told which repository to query I’ll next handle any arguments passed on the command line. These arguments will be our search term for the Discussions API. This new code replaces the fmt.Printf call.
    // fmt.Printf was here

        if len(flag.Args()) < 1 {
                return errors.New("search term required")
        }
        search := strings.Join(flag.Args(), " ")

        fmt.Printf(
                "Going to search discussions in '%s/%s' for '%s'\n",
            repo.Owner(), repo.Name(), search)

        }
With this change, the command will respect any arguments I pass.
$ go run .
Please specify a search term
exit status 2

$ go run . cats
Going to search discussions in 'vilmibm/gh-ask' for 'cats'

$ go run . fluffy cats
Going to search discussions in 'vilmibm/gh-ask' for 'fluffy cats'
Talking to the API
With search term and target repository in hand, I can now ask the GitHub API for some results. I’ll be using the GraphQL API via go-gh’s GQLClient. For now, I’m just printing some basic output. What follows is the new code at the end of the cli function. I’ll delete the call to fmt.Printf that was here for now.
        // fmt.Printf call was here

client, err := gh.GQLClient(nil)
        if err != nil {
                return fmt.Errorf("could not create a graphql client: %w", err)
        }

        query := fmt.Sprintf(`{
                        repository(owner: "%s", name: "%s") {
                                hasDiscussionsEnabled
                                discussions(first: 100) {
                                        edges { node {
                                                title
                                    body
                                    url

    }}}}}`, repo.Owner(), repo.Name())

        type Discussion struct {
                Title string
                URL   string `json:"url"`
                Body  string
        }

        response := struct {
                Repository struct {
                        Discussions struct {
                                Edges []struct {
                                        Node Discussion
                                }
                        }
                        HasDiscussionsEnabled bool
                }
        }{}

        err = client.Do(query, nil, &response)
        if err != nil {
                return fmt.Errorf("failed to talk to the GitHub API: %w", err)
        }

        if !response.Repository.HasDiscussionsEnabled {
                return fmt.Errorf("%s/%s does not have discussions enabled.", repo.Owner(), repo.Name())
        }

        matches := []Discussion{}

        for _, edge := range response.Repository.Discussions.Edges {
                if strings.Contains(edge.Node.Body+edge.Node.Title, search) {
                        matches = append(matches, edge.Node)
                }
        }

        if len(matches) == 0 {
                fmt.Fprintln(os.Stderr, "No matching discussion threads found :(")
            return nil
        }

        for _, d := range matches {
                fmt.Printf("%s %s\n", d.Title, d.URL)
        }
When I run this, my output looks like:
$ go run . --repo cli/cli actions
gh pr create don't trigger `pullrequest:` actions https://github.com/cli/cli/discussions/6575
GitHub CLI 2.19.0 https://github.com/cli/cli/discussions/6561
What permissions are needed to use OOTB GITHUB_TOKEN with gh pr merge --squash --auto https://github.com/cli/cli/discussions/6379
gh actions feedback https://github.com/cli/cli/discussions/3422
Pushing changes to an inbound pull request https://github.com/cli/cli/discussions/5262
getting workflow id and artifact id to reuse in github actions https://github.com/cli/cli/discussions/5735
This is pretty cool! Matching discussions are printed and we can click their URLs. However, I’d prefer the output to be tabular so it’s a little easier to read.
Formatting output
To make this output easier for humans to read and machines to parse, I’d like to print the title of a discussion in one column and then the URL in another.
I’ve replaced that final for loop with some new code that makes use of go-gh’s term and tableprinter packages.
        if len(matches) == 0 {
                fmt.Println("No matching discussion threads found :(")
        }

    // old for loop was here

        isTerminal := term.IsTerminal(os.Stdout)
        tp := tableprinter.New(os.Stdout, isTerminal, 100)


if isTerminal {
                fmt.Printf(
                        "Searching discussions in '%s/%s' for '%s'\n",
                        repo.Owner(), repo.Name(), search)
        }

        fmt.Println()
        for _, d := range matches {
                tp.AddField(d.Title)
                tp.AddField(d.URL)
                tp.EndRow()
        }

        err = tp.Render()
        if err != nil {
                return fmt.Errorf("could not render data: %w", err)
        }
The call to term.IsTerminal(os.Stdout) will return true when a human is sitting at a terminal running this extension. If a user invokes our extension from a script or pipes its output to another program, term.IsTerminal(os.Stdout) will return false. This value then informs the table printer how it should format its output. If the output is a terminal, tableprinter will respect a display width, apply colors if desired, and otherwise assume that a human will be reading what it prints. If the output is not a terminal, values are printed raw and with all color stripped.
Running the extension gives me this result now:
Note how the discussion titles are truncated.
If I pipe this elsewhere, I can use a command like cut to see the discussion titles in full:
Adding the tableprinter improved both human readability and scriptability of the extension.
Opening browsers
Sometimes, opening a browser can be helpful as not everything can be done in a terminal. go-gh has a function for this, which we’ll make use of in a new flag that mimics the “feeling lucky” button of a certain search engine. Specifying this flag means that we’ll open a browser with the first matching result to our search term.
I’ll add a new flag definition to the top of the main function:
func main() {
        lucky := flag.Bool("lucky", false, "Open the first matching result in a web browser")
    // rest of code below here
And, then add this before I set up the table printer:
        if len(matches) == 0 {
                fmt.Println("No matching discussion threads found :(")
        }

        if *lucky {
                b := browser.New("", os.Stdout, os.Stderr)
                b.Browse(matches[0].URL)
                return
        }

    // terminal and table printer code
JSON output
For extensions with more complex outputs, you could go even further in enabling scripting by exposing JSON output and supporting jq expressions. jq is a general purpose tool for interacting with JSON on the command line. go-gh has a library version of jq built directly in, allowing extension authors to offer their users the power of jq without them having to install it themselves.
I’m adding two new flags: --json and --jq. The first is a boolean and the second a string. They are now the first two lines in main:
func main() {
    jsonFlag := flag.Bool("json", false, "Output JSON")
    jqFlag := flag.String("jq", "", "Process JSON output with a jq expression")
After setting isTerminal, I’m adding this code block:
isTerminal := term.IsTerminal(os.Stdout)
        if *jsonFlag {
                output, err := json.Marshal(matches)
                if err != nil {
                        return fmt.Errorf("could not serialize JSON: %w", err)
                }

                if *jqFlag != "" {
                        return jq.Evaluate(bytes.NewBuffer(output), os.Stdout, *jqFlag)
                }

                return jsonpretty.Format(os.Stdout, bytes.NewBuffer(output), " ", isTerminal)
        }
Now, when I run my code with --json, I get nicely printed JSON output:
If I specify a jq expression I can process the data. For example, I can limit output to just titles like we did before with cut; this time, I’ll use the jq expression .[]|.Title instead.
Releasing your extension with cli/gh-extension-precompile
Now that I have a feature-filled extension, I’d like to make sure it’s easy to create releases for it so others can install it. At this point it’s uninstallable since I have not precompiled any of the Go code.
Before I worry about making a release, I have to make sure that my extension repository has the gh-extension tag. I can add that by running gh repo edit --add-tag gh-extension. Without this topic added to the repository, it won’t show up in commands like gh ext browse or gh ext search.
Since I started this extension by running gh ext create, I already have a GitHub Actions workflow defined for releasing. All that’s left before others can use my extension is pushing a tag to trigger a release. The workflow file contains:
The repository is public (assuming you want people to install this for themselves! You can keep it private and make releases just for yourself, if you prefer.).
You’ve pushed all the local work you want to see in the release.
To release:
Note that the workflow ran automatically. It looks for tags of the form vX.Y.Z and kicks off a build of your Go code. Once the release is done, I can check it to see that all my code compiled as expected:
Now, anyone can run gh ext install vilmibm/gh-ask and try out my extension! This is all the work of the gh-extension-precompile action. This action can be used to compile any language, but by default it only knows how to handle Go code.
By default, the action will compile executables for:
Linux (amd64, 386, arm, arm64)
Windows (amd64, 386, arm64)
MacOS (amd64, arm64)
FreeBSD (amd64, 386, arm64)
Android (amd64, arm64)
To build for a language other than Go, edit .github/workflows/release.yml to add a build_script_override configuration. For example, if my repository had a script at scripts/build.sh, my release.yml would look like:
The script specified as build_script_overridemust produce executables in a dist directory at the root of the extension repository with file names ending with: {os}-{arch}{ext}, where the extension is .exe on Windows and blank on other platforms. For example:
dist/gh-my-ext_v1.0.0_darwin-amd64
dist/gh-my-ext_v1.0.0_windows-386.exe
Executables in this directory will be uploaded as release assets on GitHub. For OS and architecture nomenclature, please refer to this list. We use this nomenclature when looking for executables from the GitHub CLI, so it needs to be respected even for non-Go extensions.
Future directions
The CLI team has some improvements on the horizon for the extensions system in the GitHub CLI. We’re planning a more accessible version of the extension browse command that renders a single column style interface suitable for screen readers. We intend to add support for nested extensions–in other words, an extension called as a subcommand of an existing gh command like gh pr my-extension–making third-party extensions fit more naturally into our command hierarchy. Finally, we’d like to improve the documentation and flexibility of the gh-extension-precompile action.
Are there features you’d like to see? We’d love to hear about it in a discussion or an issue in the cli/cli repository.
Wrap-up
It is our hope that the extensions system in the GitHub CLI inspire you to create features beyond our wildest imagination. Please go forth and make something you’re excited about, even if it’s just to make gh do fun things like run screensavers.
In the present age, data linkages can generate significant business value. Whether we want to learn about the relationships between users in online social networks, between users and products in e-commerce, or understand credit relationships in financial networks, the capability to understand and analyse large amounts of highly interrelated data is becoming more important to businesses.
As the amount of consumer data grows, the GrabDefence team must continuously enhance fraud detection on mobile devices to proactively identify the presence of fraudulent or malicious users. Even simple financial transactions between users must be monitored for transaction loops and money laundering. To preemptively detect such scenarios, we need a graph service platform to help discover data linkages.
Background
As mentioned in an earlier article, a graph is a model representation of the association of entities and holds knowledge in a structured way by marginalising entities and relationships. In other words, graphs hold a natural interpretability of linked data and graph technology plays an important role. Since the early days, large tech companies started to create their own graph technology infrastructure, which is used for things like social relationship mining, web search, and sorting and recommendation systems with great commercial success.
As graph technology was developed, the amount of data gathered from graphs started to grow as well, leading to a need for graph databases. Graph databases1 are used to store, manipulate, and access graph data on the basis of graph models. It is similar to the relational database with the feature of Online Transactional Processing (OLTP), which supports transactions, persistence, and other features.
A key concept of graphs is the edge or relationship between entities. The graph relates the data items in the store to a collection of nodes and edges, the edges representing the relationships between the nodes. These relationships allow data in the store to be linked directly and retrieved with one operation.
With graph databases, relationships between data can be queried fast as they are perpetually stored in the database. Additionally, relationships can be intuitively visualised using graph databases, making them useful for heavily interconnected data. To have real-time graph search capabilities, we must leverage the graph service platform and graph databases.
Architecture details
Graph services with graph databases are Platforms as a Service (PaaS) that encapsulate the underlying implementation of graph technology and support easier discovery of data association relationships with graph technologies.
They also provide universal graph operation APIs and service management for users. This means that users do not need to build graph runtime environments independently and can explore the value of data with graph service directly.
Fig. 1 Graph service platform system architecture
As shown in Fig. 1, the system can be divided into four layers:
Storage backend – Different forms of data (for example, CSV files) are stored in Amazon S3, graph data stores in Neptune and meta configuration stores in DynamoDB.
Driver – Contains drivers such as Gremlin, Neptune, S3, and DynamoDB.
Service – Manages clusters, instances, databases etc, provides management API, includes schema and data load management, graph operation logic, and other graph algorithms.
RESTful APIs – Currently supports the standard and uniform formats provided by the system, the Management API, Search API for OLTP, and Analysis API for online analytical processing (OLAP).
How it works
Graph flow
Fig. 2 Graph flow
CSV files stored in Amazon S3 are processed by extract, transform, and load (ETL) tools to generate graph data. This data is then managed by an Amazon Neptune DB cluster, which can only be accessed by users through graph service. Graph service converts user requests into asynchronous interactions with Neptune Cluster, which returns the results to users.
When users launch data load tasks, graph service synchronises the entity and attribute information with the CSV file in S3, and the schema stored in DynamoDB. The data is only imported into Neptune if there are no inconsistencies.
The most important component in the system is the graph service, which provides RESTful APIs for two scenarios: graph search for real-time streams and graph analysis for batch processing. At the same time, the graph service manages clusters, databases, instances, users, tasks, and meta configurations stored in DynamoDB, which implements features of service monitor and data loading offline or stream ingress online.
Use case in fraud detection
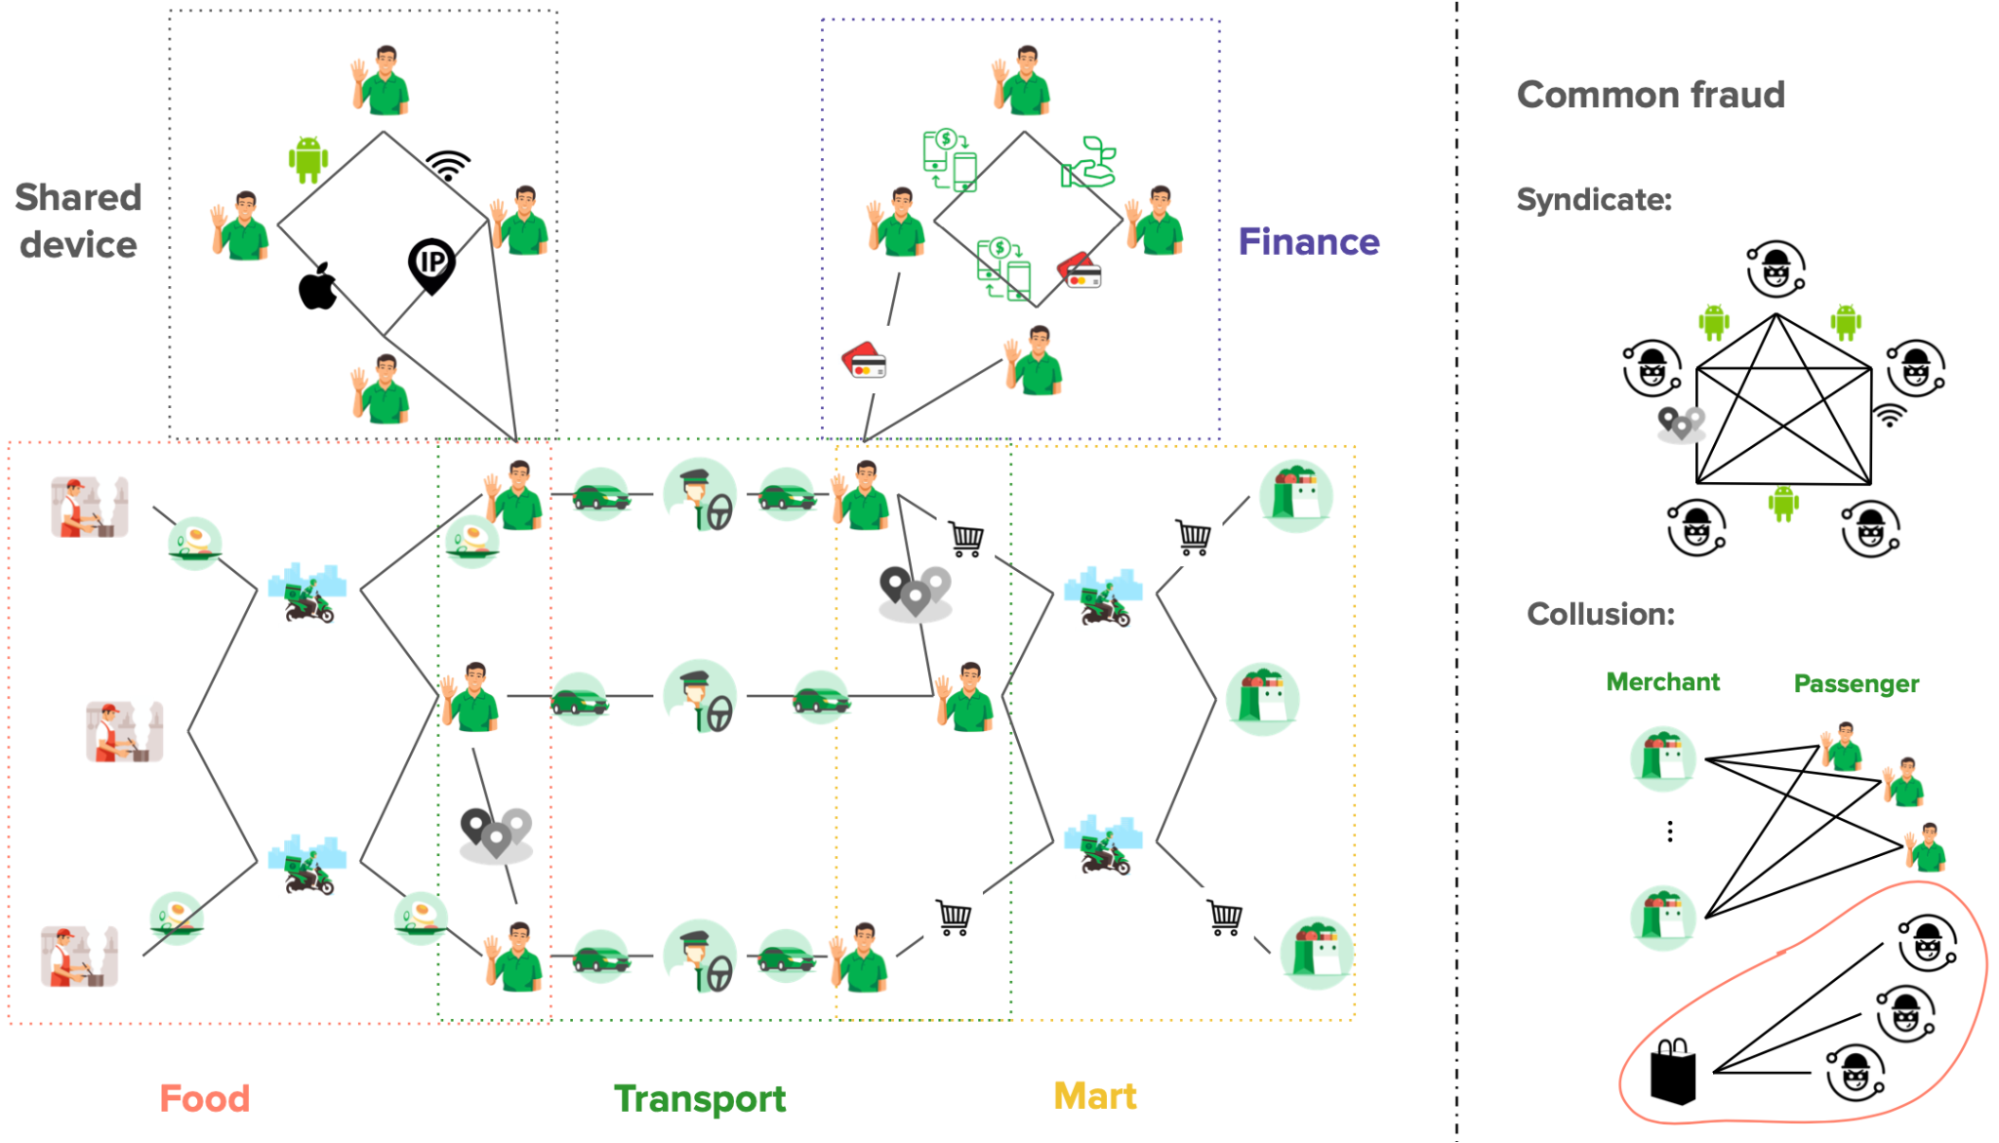
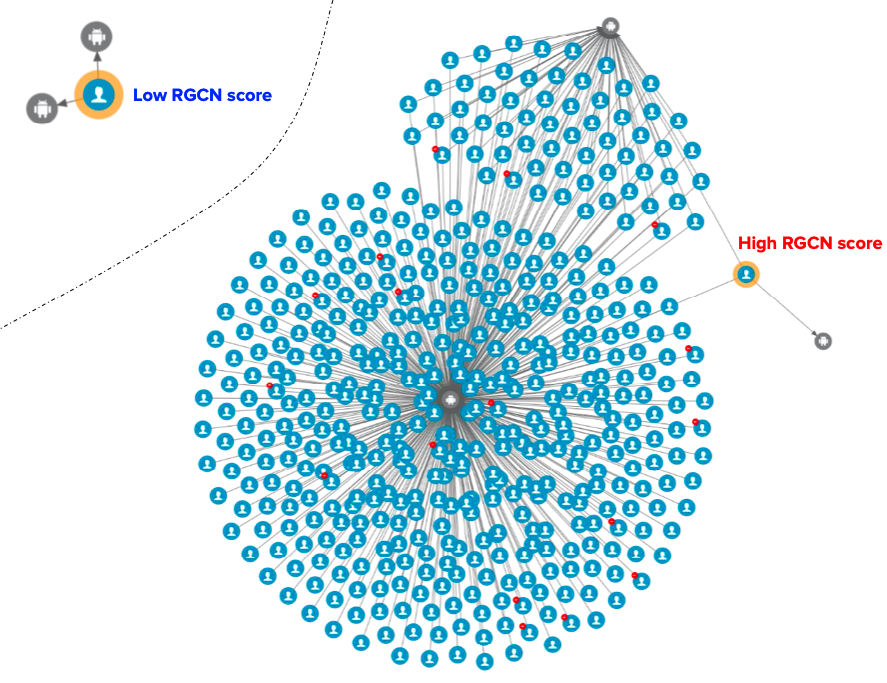
In Grab’s mobility business, we have come across situations where multiple accounts use shared physical devices to maximise their earning potential. With the graph capabilities provided by the graph service platform, we can clearly see the connections between multiple accounts and shared devices.
Historical device and account data are stored in the graph service platform via offline data loading or online stream injection. If the device and account data exists in the graph service platform, we can find the adjacent account IDs or the shared device IDs by using the device ID or account ID respectively specified in the user request.
In our experience, fraudsters tend to share physical resources to maximise their revenue. The following image shows a device that is shared by many users. With our Graph Visualisation platform based on graph service, you can see exactly what this pattern looks like.
Fig 3. Example of a device being shared with many users
Data injection
Fig. 4 Data injection
Graph service also supports data injection features, including data load by request (task with a type of data load) and real-time stream write by Kafka.
When connected to GrabDefence’s infrastructure, Confluent with Kafka is used as the streaming engine. The purpose of using Kafka as a streaming write engine is two-fold: to provide primary user authentication and to relieve the pressure on Neptune.
Impact
Graph service supports data management of Labelled Property Graphs and provides the capability to add, delete, update, and get vertices, edges, and properties for some graph models. Graph traversal and searching relationships with RESTful APIs are also more convenient with graph service.
Businesses usually do not need to focus on the underlying data storage, just designing graph schemas for model definition according to their needs. With the graph service platform, platforms or systems can be built for personalised search, intelligent Q&A, financial fraud, etc.
For big organisations, extensive graph algorithms provide the power to mine various entity connectivity relationships in massive amounts of data. The growth and expansion of new businesses is driven by discovering the value of data.
What’s next?
Fig. 5 Graph-centric ecosystems
We are building an integrated graph ecosystem inside and outside Grab. The infrastructure and service, or APIs are key components in graph-centric ecosystems; they provide graph arithmetic and basic capabilities of graphs in relation to search, computing, analysis etc. Besides that, we will also consider incorporating applications such as risk prediction and fraud detection in order to serve our current business needs.
Join us
Grab is the leading superapp platform in Southeast Asia, providing everyday services that matter to consumers. More than just a ride-hailing and food delivery app, Grab offers a wide range of on-demand services in the region, including mobility, food, package and grocery delivery services, mobile payments, and financial services across 428 cities in eight countries.
Powered by technology and driven by heart, our mission is to drive Southeast Asia forward by creating economic empowerment for everyone. If this mission speaks to you, join our team today!
In December, we did not experience any incidents that resulted in degraded performance across GitHub services. This report sheds light into an incident that impacted GitHub Packages and GitHub Pages in November.
November 25 16:34 UTC (lasting 1 hour and 56 minutes)
On November 25, 2022 at 14:39 UTC, our alerting systems detected an incident that impacted customers using GitHub Packages and GitHub Pages. The GitHub Packages team initially statused GitHub Packages to yellow, and after assessing impact, it statused to red at 15:06 UTC.
During this incident, customers experienced unavailability of packages for container, npm, and NuGet registries. We were able to serve requests for RubyGems and Maven registries. GitHub Packages’ unavailability also impacted GitHub Pages, as they were not able to pull packages, which resulted in CI build failures. Repository landing pages also saw timeouts while fetching packages information.
GitHub Packages uses a third-party database to store data for the service and the provider was experiencing an outage, which impacted GitHub Packages performance. The first responder connected with the provider’s support team to learn more about the region specific outage. The provider then mitigated the issue before the first responder could do the failover to another region. With the mitigation in place, GitHub Packages started to recover along with GitHub Pages and the repository landing pages.
As follow up action items, the team is exploring options to make GitHub Pages and repository landing pages more resilient to GitHub Packages outages. We are also investigating options where failovers can be performed quickly and automatically in case of regional outages.
Please follow our status page for real-time updates on status changes. To learn more about what we’re working on, check out the GitHub Engineering Blog.
Black eyes.
Orange beak.
Large yellow body.
Rubbery texture…
…often seen floating in baths.
What are we talking about? Rubber ducks, of course. Now the question you might be asking, “Why is everyone obsessed with rubber ducks?” You may have seen our new “What is GitHub?” video making its way around the internet. Outside of the famous comedian, whom you may recognize, you saw a new character floating around (literally). And if you were at GitHub Universe this year or tuned into the livestream, you probably saw lots of physical rubber ducks dispersed throughout.
So, what in the world do rubber ducks have to do with programming? And why were they everywhere? A lot of you asked, so I’m here to help explain.
Rubber ducks + programming
Our story starts back in 1999, when a book was released, The Pragmatic Programmer by Andrew Hunt. The story describes a computer programmer who sat a rubber duck down one fine day, and explained his code to the duck—line by line!
The process of speaking the code out loud helped the developer understand the code and gain greater insight into his work. After all, rubber ducks don’t talk back!
The technique stuck. It’s now called rubber duck debugging or rubberducking. Of course, it doesn’t need to be only rubber ducks, but the term stuck and is part of developer lingo. So, in our effort to explain all the things GitHub can do for developers and businesses, we used this same technique, with our own special rubber duck. Our duck takes a journey through all the elements of GitHub that make it the most complete developer platform to build, scale, and deliver secure software.
If anyone missed the significance of rubber ducks, @film_girl and @anjuan explained it during the live stream at #GitHubUniverse
If rubber duck debugging is new to you, try it out! It doesn’t just work with code, either. If you’re ever stuck, try talking through your problem or challenge out loud, whether it’s to that plant on your desk, a roommate, your family, or even your dog. In the meantime, your code on GitHub is waiting to be explained to your new yellow friend.
It’s that time of year where we’re all looking back at what we’ve accomplished and thinking ahead to goals and plans for the calendar year to come. As part of GitHub Universe, I shared some numbers that provided a window into the work our engineering and security teams drive each day on behalf of our community, customers, and Hubbers. As someone who loves data, it’s not just fun to see how we operate GitHub at scale, but it’s also rewarding to see how this work contributes to our vision to be the home for all developers–which includes our own engineering and security teams.
Over the course of the past year1, GitHub staff made millions of commits across all of our internal repositories. That’s a ton of branches, pull requests, Issues, and more. We processed billions of API requests daily. And we ran tens of thousands of production deployments across the internal apps that power GitHub’s services. If you do the math, that’s hundreds of deploys per day.
GitHub is big. But the reality is, no matter your size, your scale, or your stage, we’re all dealing with the same questions. Those questions boil down to how to optimize for productivity, collaboration, and, of course, security.
It’s a running joke internally that you have to type “GitHub” three times to get to the monolith. So, let’s take a look at how we at GitHub (1) use GitHub (2) to build the GitHub (3) you rely on.
Productivity
GitHub’s cloud-powered experiences, namely Codespaces and GitHub Copilot, have been two of the biggest game changers for us in the past few years.
Codespaces
It’s no secret that local development hasn’t evolved much in the past decade. The github/github repository, where much of what you experience on GitHub.com lives, is fairly large and took several minutes to clone even on a good network connection. Combine this with setting up dependencies and getting your environment the way you like it, spinning up a local environment used to take 45 minutes to go from checkout to a built local developer environment.
But now, with Codespaces, a few clicks and less than 60 seconds later, you’re in a working development environment that’s running on faster hardware than the MacBook I use daily.
Heating my home office in the chilly Midwest with my laptop doing a local build was nice, but it’s a thing of the past. Moving to Codespaces last year has truly impacted our day-to-day developer experience, and we’re not looking back.
GitHub Copilot
We’ve been using GitHub Copilot for more than a year internally, and it still feels like magic to me every day. We recently published a study that looked at GitHub Copilot performance across two groups of developers–one that used GitHub Copilot and one that didn’t. To no one’s surprise, the group that used GitHub Copilot was able to complete the same task 55% faster than the group that didn’t have GitHub Copilot.
Getting the job done faster is great, but the data also provided incredible insight into developer satisfaction. Almost three-quarters of the developers surveyed said that GitHub Copilot helped them stay in the flow and spend more time focusing on the fun parts of their jobs. When was the last time you adopted an experience that made you love your job more? It’s an incredible example of putting developers first that has completely changed how we build here at GitHub.
Collaboration
At GitHub, we’re remote-first and we have highly distributed teams, so we prioritize discoverability and how we keep teams up-to-date across our work. That’s where tools like Issues and projects come into play. They allow us to plan, track, and collaborate in a centralized place that’s right next to the code we’re working on.
Incorporating projects across our security team has made it easier for us to not only track our work, but also to help people understand how their work fits into the company’s broader mission and supports our customers.
Projects gives us a big picture view of our work, but what about the more tactical discovery of a file, function, or new feature another team is building? When you’re working on a massive 15-year-old codebase (looking at you, GitHub), sometimes you need to find code that was written well before you even joined the company, and that can feel like trying to find a needle in a haystack.
So, we’ve adopted the new code search and code view, which has helped our developers quickly find what they need without losing velocity. This improved discoverability, along with the enhanced organization offered by Issues and projects, has had huge implications for our teams in terms of how we’ve been able to collaborate across groups.
Shifting security left
Like we saw when we looked at local development environments, the security industry still struggles with the same issues that have plagued us for more than a decade. Exposed credentials, as an example, are still the root cause for more than half of all data breaches today2. Phishing is still the best, and cheapest, way for an adversary to get into organizations and wreak havoc. And we’re still pleading with organizations to implement multi-factor authentication to keep the most basic techniques from bad actors at bay.
It’s time to build security into everything we do across the developer lifecycle.
The software supply chain starts with the developer. Normalizing the use of strong authentication is one of the most important ways that we at GitHub, the home of open source, can help defend the entire ecosystem against supply chain attacks. We enforce multi-factor authentication with security keys for our internal developers, and we’re requiring that every developer who contributes software on GitHub.com enable 2FA by the end of next year. The closer we can bring our security and engineering teams together, the better the outcomes and security experiences we can create together.
Another way we do that is by scaling the knowledge of our security teams with tools like CodeQL to create checks that are deployed for all our developers, protecting all our users. And because the CodeQL queries are open source, the vulnerability patterns shared by security teams at GitHub or by our customers end up as CodeQL queries that are then available for everyone. This acts like a global force multiplier for security knowledge in the developer and security communities.
Security shouldn’t be gatekeeping your teams from shipping. It should be the process that enables them to ship quickly–remember our hundreds of production deployments per day?–and with confidence.
Big, small, or in-between
As you see, GitHub has the same priorities as any other development team out there.
It doesn’t matter if you’re processing billions of API requests a day, like we are, or if you’re just starting on that next idea that will be launched into the world.
These are just a few ways over the course of the last year that we’ve used GitHub to build our own platform securely and improve our own developer experiences, not only to be more productive, collaborative, and secure, but to be creative, to be happier, and to build the best work of our lives.
To learn more about how we use GitHub to build GitHub, and to see demos of the features highlighted here, take a look at this talk from GitHub Universe 2022.
Throughout the GitHub User Interface (UI), there are complex search inputs that allow you to narrow the results you see based on different filters. For example, for repositories with GitHub Discussions, you can narrow the results to only show open discussions that you created. This is completed with the search bar and the use of defined filters. The current implementation of this input has accessibility considerations that need to be examined at a deeper level, from the styled search input to the way items are grouped, that aren’t natively accessible, so we had to take some creative approaches. This led us to creating the QueryBuilder component, which is a fully accessible component designed for these types of situations.
As we rethought this core pattern within GitHub, we knew we needed to make search experiences accessible so everyone can successfully use them. GitHub is the home for all developers, including those with disabilities. We don’t want to stop at making GitHub accessible; we want to empower other developers to make a similar pattern accessible, which is why we’ll be open sourcing this component!
Process
GitHub is a very large organization with many moving pieces. Making sure that accessibility is considered in every step of the process is important. Our process looked a little something like this:
The first step was that we, the Accessibility Team at GitHub, worked closely with the designers and feature teams to design and build the QueryBuilder component. We wanted to understand the intent of the component and what the user should be able to accomplish. We used this information to help construct the product requirements.
Our designers and accessibility experts worked together on several iterations of what this experience would look like and annotated how it should function. Once everyone agreed on a path forward, it was time to build a proof of concept!
The proof of concept helped to work out some of the trickier parts of the implementation, which we will get to in the following Accessibility Considerations section. An accessibility expert review was conducted at multiple points throughout the process.
The Accessibility Team built the reusable component in collaboration with the Primer Team (GitHub’s Design System), and then collaborated with the GitHub Discussions Team on what it’d take to integrate the component. At this point in time, we have a fully accessible MVP component that can be seen on any GitHub.com Discussions landing page.
Introducing the QueryBuilder component
The main purpose of the QueryBuilder is to allow a user to enter a query that will narrow their results or complete a search. When a user types, a list of suggestions appears based on their input. This is a common pattern on web, which doesn’t sound too complicated, until you start to consider these desired features:
The input should contain visual styling that shows a user if they’ve typed valid input.
When a suggestion is selected, it can either take a user somewhere else (“Jump to”) or append the selection to the input (“Autocomplete”).
The set of suggestions should change based on the entered input.
There should be groups of suggestions within the suggestion box.
Okay, now we’re starting to get more complicated. Let’s break these features down from an accessibility perspective.
Accessibility considerations
Note: these considerations are not comprehensive to every accessibility requirement for the new component. We wanted to highlight the trickier-to-solve issues that may not have been addressed before.
Semantics
We talked about this component needing to take a user’s input and provide suggestions that a user can select from in a listbox. We are using the Combobox pattern, which does exactly this.
Styled input
Natively, HTML inputs do not allow specific styling for individual characters, unless you use contenteditable. We didn’t consider this to be an accessible pattern; even basic mark-up can disrupt the expected keyboard cursor movement and contenteditable’s support for ARIA attributes is widely inconsistent. To achieve the desired styling, we have a styled element – a <div aria-hidden="true"> with <span> elements inside—that is behind the real <input> element that a user interacts with. It is perfectly lined up visually so all of the keyboard functionality works as expected, the cursor position is retained, input text is duplicated inside, and we can individually style characters within the input. We also tested this at high Zoom levels to make sure that everything scaled correctly. color: transparent was added to the real input’s text, so sighted users will see the styled text from the <div>.
While the styled input adds some context for sighted users, we also explored whether we could make this apparent for people relying on a screen reader. Our research led us to create a proof of concept with live-region-based announcements as the cursor was moved through the text. However, based on testing, the screen reader feedback proved to be quite overwhelming and occasionally flaky, and it would be a large effort to accurately detect and manage the cursor position and keyboard functionality for all types of assistive technology users. Particularly when internationalization was taken into account, we decided that this would not be overly helpful or provide good return on investment.
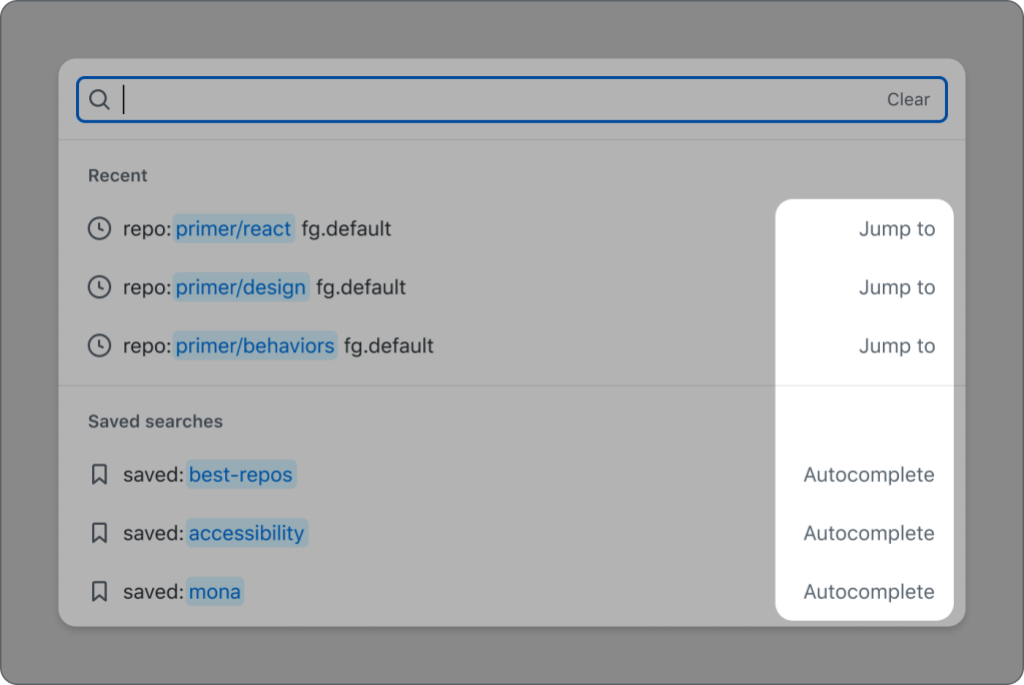
Items with different actions
Typical listbox items in a combobox pattern only have one action–and that is to append the selected option’s value to the input. However, we needed something more. We wanted some selected option values to be appended to the input, but others to take you to a different page, such as search results.
For options that will append their values to the input when selected, there is no additional screen reader feedback since this is the default behavior of a listbox option. These options don’t have any visual indication (color, underline, etc.) that they will do anything other than append the selection to the input.
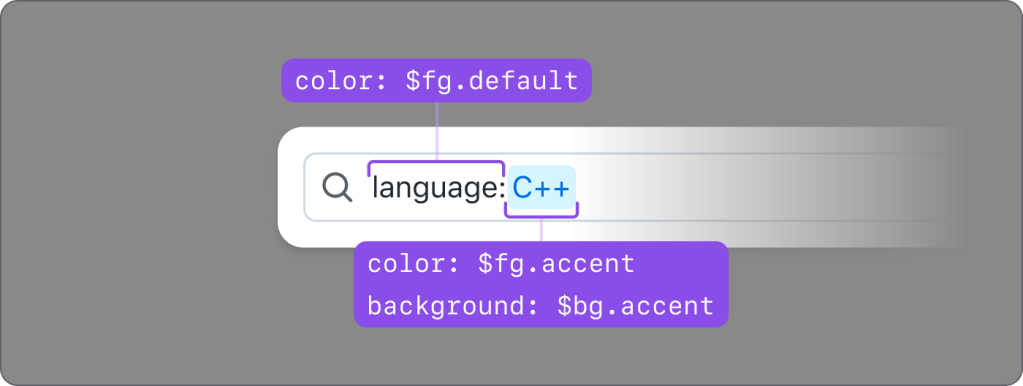
When an option will take a user to a new location, we’ve added an aria-label to that option explaining the behavior. For example, an option with the title README.md and description primer/react that takes you directly to https://github.com/primer/react/blob/main/README.md will have aria-label=”README.md, primer/react, jump to this file”. This explains the file (README.md), description/location of the file (primer/react), action (jump to), and type (this file). Since this is acting as a link, it will have visual text after the value stating the action. Since options may have two different actions, having a visual indicator is important so that a user knows what will happen when they make a selection.
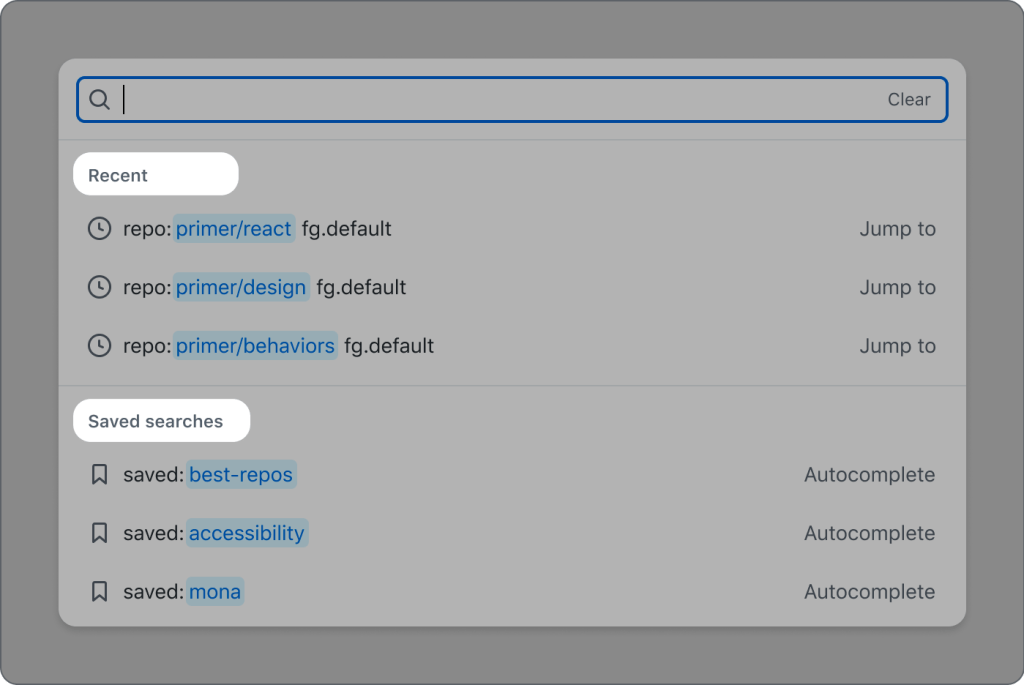
Group support
Groups are fully supported in an accessible way. role="group" is not widely supported inside of listbox for all assistive technologies, so our approach conveys the intent of grouped items to each user, but in different ways.
For sighted users, there is a visual header and separator for each group of items. The header is not focusable, and it has role="presentation" so that it’s hidden from screen reader users because this information is presented in a different way to them (which is described later in this blog). The wrapping <ul> and <li> elements are also given role="presentation" since a listbox is traditionally a list of <li> items inside of one parent <ul>.
For screen reader users, the grouped options are denoted by an aria-label with the content of each list item and the addition of the type of list item. This is the same aria-label as described in the previous section about items with different actions. An example aria-label for a list item with the value primer/react that takes you to the Primer React repository when chosen is “primer/react, jump to this repository.” In this example, adding “repository” to the aria-label gives the context that the item is part of the “Repository” group, the same way the visual heading helps sighted users determine the groups. We chose to add the item type at the end of the aria-label so that screen reader users hear the name of the item first and can navigate through the suggestions quicker. Since the aria-label is different from the visible label, it has to contain the visible label’s text at the beginning for voice recognition software users.
Screen reader feedback
By default, there is no indication to a screen reader user how many suggestions are displayed or if the input is successfully cleared via the optional clear button.
To address this, we added an aria-live region that updates the text whenever the suggestions change or the input is cleared. A screen reader will receive feedback when they press the “Clear” button that the input has been cleared, focus is restored to the input, and how many suggestions are currently visible.
While testing the aria-live updates, we noticed something interesting; if the same number of results are displayed as a user continues typing, the aria-live region will not update. For example, if a user types “zzz” and there are 0 results, and then they add an additional “z” to their query (still 0 results), the screen reader will not re-read “0 results” since the aria-live API did not detect a change in the text. To address this, we are adding and removing a character if the previous aria-live message is the same as the new aria-live message. The will cause the aria-live API to detect a change and the screen reader will re-read the text without an audible indication that a space was added.
Recap
In conclusion, this was a tremendous effort with a lot of teams involved. Thank you to the many Hubbers who collaborated on this effort, and to our accessibility friends at Prime Access Consulting (PAC). We are excited for users to get their hands on this new experience and really accelerate their efficiency in complex searches. This component is currently in production in a repository with GitHub Discussions enabled, and it will be rolling out to more parts of the UI. Stay tuned for updates about the progress of the component being open sourced.
What’s next
We will integrate this component into additional parts of GitHub’s UI, such as the new global search experience so all users can benefit from this accessible, advanced searching capability. We will continue to add the component to other areas of the GitHub UI and address any bugs or feedback we receive.
As mentioned in the beginning of this post, it will be open sourced in Primer ViewComponents and Primer React along with clear guidelines on how to use this component. The base of the component is a Web Component which allows us to share the functionality between ViewComponents and React. This will allow developers to easily create an advanced, accessible, custom search component without spending time researching how to make this pattern accessible or functional, since we’ve already done that work! It can work with any source of data as long as it’s in the expected format.
Many teams throughout GitHub are constantly working on accessibility improvements to GitHub.com. For more on our vision for accessibility at GitHub, visit accessibility.github.com.
The open source Git project just released Git 2.39, with features and bug fixes from over 86 contributors, 31 of them new. We last caught up with you on the latest in Git back when 2.38 was released.
To celebrate this most recent release, here’s GitHub’s look at some of the most interesting features and changes introduced since last time.
If you use Git on the command-line, you have almost certainly used git log to peruse your project’s history. But you may not be as familiar with its cousin, git shortlog.
git shortlog is used to summarize the output produced by git log. For example, many projects (including Git1) use git shortlog -ns to produce a list of unique contributors in a release, along with the number of commits they authored, like this:
$ git shortlog -ns v2.38.0.. | head -10
   166  Junio C Hamano
   118  Taylor Blau
   115  Ævar Arnfjörð Bjarmason
    43  Jeff King
    26  Phillip Wood
    21  René Scharfe
    15  Derrick Stolee
    11  Johannes Schindelin
     9  Eric Sunshine
     9  Jeff Hostetler
  [...]
We’ve talked about git shortlog in the past, most recently when 2.29 was released to show off its more flexible --group option, which allows you to group commits by fields other than their author or committer. For example, something like:
would count each commit to its author as well as any individuals in the Co-authored-by trailer.
This release, git shortlog became even more flexible by learning how to aggregate commits based on arbitrary formatting specifiers, like the ones mentioned in the pretty formats section of Git’s documentation.
One neat use is being able to get a view of how many commits were committed each month during a release cycle. Before, you might have written something like this monstrosity:
There, --date='format:%Y-%m' tells Git to output each date field like YYYY-MM, and --format='%cd' tells Git to output only the committer date (using the aforementioned format) when printing each commit. Then, we sort the output, and count the number of unique values.
Now, you can ask Git to do all of that for you, by writing:
Where -s tells git shortlog output a summary where the left-hand column is the number of commits attributed to each unique group (in this case, the year and month combo), and the right-hand column is the identity of each group itself.
Since you can pass any format specifier to the --group option, the flexibility here is limited only by the pretty formats available, and your own creativity.
Returning readers may remember our discussion on Git’s new object pruning mechanism, cruft packs. In case you’re new around here, no problem: here’s a refresher.
When you want to tell Git to remove unreachable objects (those which can’t be found by walking along the history of any branch or tag), you might run something like:
$ git gc --cruft --prune=5.minutes.ago
That instructs Git to divvy your repository’s objects into two packs: one containing reachable objects, and another2 containing unreachable objects modified within the last five minutes. This makes sure that a git gc process doesn’t race with incoming reference updates that might leave the repository in a corrupt state. As those objects continue to age, they will be removed from the repository via subsequent git gc invocations. For (many) more details, see our post, Scaling Git’s garbage collection.
Even though the --prune=<date> mechanism of adding a grace period before permanently removing objects from the repository is relatively effective at avoiding corruption in practice, it is not completely fool-proof. And when we do encounter repository corruption, it is useful to have the missing objects close by to allow us to recover a corrupted repository.
In Git 2.39, git repack learned a new option to create an external copy of any objects removed from the repository: --expire-to. When combined with --cruft options like so:
any unreachable objects which haven’t been modified in the last five minutes are collected together and stored in a packfile that is written to ../backup.git. Then, objects you may be missing after garbage collection are readily available in the pack stored in ../backup.git.
These ideas are identical to the ones described in the “limbo repository” section of our Scaling Git’s garbage collection blog post. At the time of writing that post, those patches were still under review. Thanks to careful feedback from the Git community, the same tools that power GitHub’s own garbage collection are now available to you via Git 2.39.
On a related note, careful readers may have noticed that in order to write a cruft pack, you have to explicitly pass --cruft to both git gc and git repack. This is still the case. But in Git 2.39, users who enable the feature.experimental configuration and are running the bleeding edge of Git will now use cruft packs by default when running git gc.
If you’ve been following along with the gradual introduction of sparse index compatibility in Git commands, this one’s for you.
In previous versions of Git, using git grep --cached (to search through the index instead of the blobs in your working copy) you might have noticed that Git first has to expand your index when using the sparse index feature.
In large repositories where the sparse portion of the repository is significantly smaller than the repository as a whole, this adds a substantial delay before git grep --cached outputs any matches.
Thanks to the work of Google Summer of Code student, Shaoxuan Yuan, this is no longer the case. This can lead to some dramatic performance enhancements: when searching in a location within your sparse cone (for example., git grep --cached $pattern -- 'path/in/sparse/cone'), Git 2.39 outperforms the previous version by nearly 70%.
This one is a little bit technical, but bear with us, since it ends with a nifty performance optimization that may be coming to a Git server near you.
Before receiving a push, a Git server must first tell the pusher about all of the branches and tags it already knows about. This lets the client omit any objects that it knows the server already has, and results in less data being transferred overall.
Once the server has all of the new objects, it ensures that they are “connected” before entering them into the repository. Generally speaking, this “connectivity check” ensures that none of the new objects mention nonexistent objects; in other words, that the push will not corrupt the repository.
One additional factor worth noting is that some Git servers are configured to avoid advertising certain references. But those references are still used as part of the connectivity check. Taking into account the extra work necessary to incorporate those hidden references into the connectivity check, the additional runtime adds up, especially if there are a large number of hidden references.
In Git 2.39, the connectivity check was enhanced to only consider the references that were advertised, in addition to those that were pushed. In a test repository with nearly 7 million references (only ~3% of which are advertised), the resulting speed-up makes Git 2.39 outperform the previous version by roughly a factor of 4.5.
As your server operators upgrade to the latest version of Git, you should notice an improvement in how fast they are able to process incoming pushes.
Last but not least, let’s round out our recap of some of the highlights from Git 2.39 with a look at a handful of new security measures.
Git added two new “defense-in-depth” changes in the latest release. First, git apply was updated to refuse to apply patches larger than ~1 GiB in size to avoid potential integer overflows in the apply code. Git was also updated to correctly redact sensitive header information with GIT_TRACE_CURL=1 or GIT_CURL_VERBOSE=1 when using HTTP/2.
If you happen to notice a security vulnerability in Git, you can follow Git’s own documentation on how to responsibly report the issue. Most importantly, if you’ve ever been curious about how Git handles coordinating and disclosing embargoed releases, this release cycle saw a significant effort to codify and write down exactly how Git handles these types of issues.
To read more about Git’s disclosure policy (and learn about how to participate yourself!), you can find more in the repository.
It’s true. In fact, the list at the bottom of the release announcement is generated by running git shortlog on the git log --no-merges between the last and current release. Calculating the number of new and existing contributors in each release is also powered by git shortlog. ↩
This is a bit of an oversimplification. In addition to storing the object modification times in an adjacent *.mtimes file, the cruft pack also contains unreachable objects that are reachable from anything modified within the last five minutes, regardless of its age. See the “mitigating object deletion raciness” section for more. ↩
The cost of hardware is one of the most common objections to providing more powerful computing resources to development teams—and that’s regardless of whether you’re talking about physical hardware in racks, managed cloud providers, or a software-as-a-service based (SaaS) compute resource. Paying for compute resources is an easy cost to “feel” as a business, especially if it’s a recurring operating expense for a managed cloud provider or SaaS solution.
When you ask a developer whether they’d prefer more or less powerful hardware, the answer is almost always the same: they want more powerful hardware. That’s because more powerful hardware means less time waiting on builds—and that means more time to build the next feature or fix a bug.
But even if the upfront cost is higher for higher-powered hardware, what’s the actual cost when you consider the impact on developer productivity?
To find out, I set up an experiment using GitHub’s new, larger hosted runners, which offer powerful cloud-based compute resources, to execute a large build at each compute tier from 2 cores to 64 cores. I wanted to see what the cost of each build time would be, and then compare that with the average hourly cost of a United States-based developer to figure out the actual operational expense for a business.
The results might surprise you.
Testing build times vs. cost by core size on compute resources
For my experiment, I used my own personal project where I compile the Linux kernel (seriously!) for Fedora 35 and Fedora 36. For background, I need a non-standard patch to play video games on my personal desktop without having to deal with dual booting.
Beyond being a fun project, it’s also a perfect case study for this experiment. As a software build, it takes a long time to run—and it’s a great proxy for more intensive software builds developers often navigate at work.
Now comes the fun part: our experiment. Like I said above, I’m going to initiate builds of this project at each compute tier from 2 cores to 64 cores, and then determine how long each build takes and its cost on GitHub’s larger runners. Last but not least: I’ll compare how much time we save during the build cycle and square that with how much more time developers would have to be productive to find the true business cost.
The logic here is that developers could either be waiting the entire time a build runs or end up context-switching to work on something else while a build runs. Both of these impact overall productivity (more on this below).
To simplify my calculations, I took the average runtimes of two builds per compute tier.
Pro tip: You can find my full spreadsheet for these calculations here if you want to copy it and play with the numbers yourself using other costs, times for builds, developer salaries, etc.
How much slow build times cost companies
In scenario number one of our experiment, we’ll assume that developers may just wait for a build to run and do nothing else during that time frame. That’s not a great outcome, but it happens.
So, what does this cost a business? According to StackOverflow’s 2022 Developer Survey, the average annual cost of a developer in the United States is approximately $150,000 per year including fringe benefits, taxes, and so on. That breaks down to around $75 (USD) an hour. In short, if a developer is waiting on a build to run for one hour and doing nothing in that timeframe, the business is still spending $75 on average for that developer’s time—and potentially losing out on time that developer could be focusing on building more code.
Now for the fun part: calculating the runtimes and cost to execute a build using each tier of compute power, plus the cost of a developer’s time spent waiting on the build. (And remember, I ran each of these twice at each tier and then averaged the results together.)
You end up with something like this:
Compute power
Fedora 35 build
Fedora 36 build
Average time
(minutes)
Cost/minute for compute
Total cost of 1 build
Developer cost
(1 dev)
Developer cost
(5 devs)
2 core
5:24:27
4:54:02
310
$0.008
$2.48
$389.98
$1,939.98
4 core
2:46:33
2:57:47
173
$0.016
$2.77
$219.02
$1,084.02
8 core
1:32:13
1:30:41
92
$0.032
$2.94
$117.94
$577.94
16 core
0:54:31
0:54:14
55
$0.064
$3.52
$72.27
$347.27
32 core
0:36:21
0:32:21
35
$0.128
$4.48
$48.23
$223.23
64 core
0:29:25
0:24:24
27
$0.256
$6.91
$40.66
$175.66
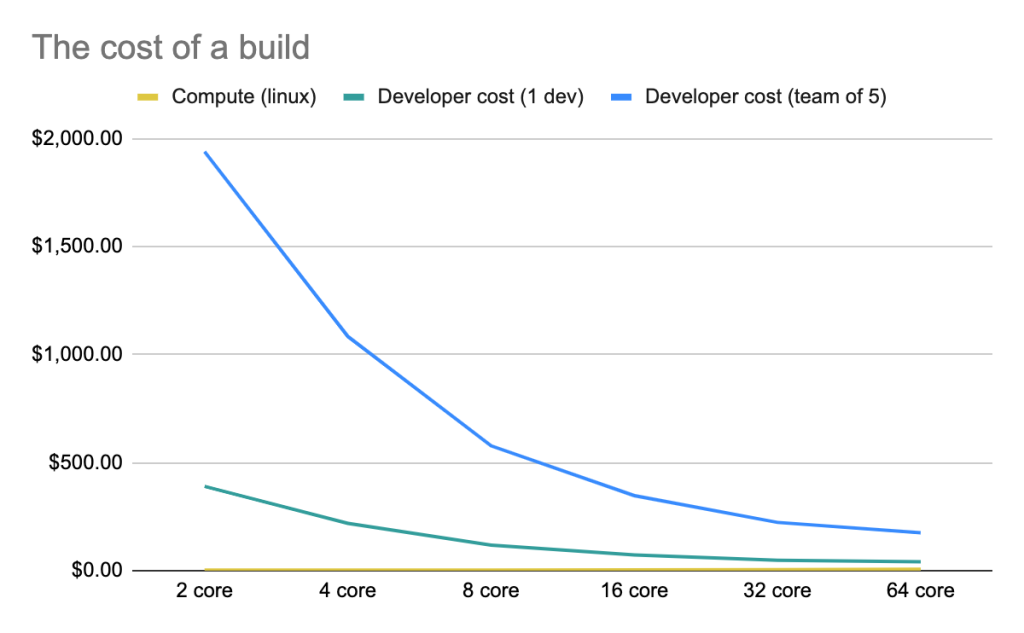
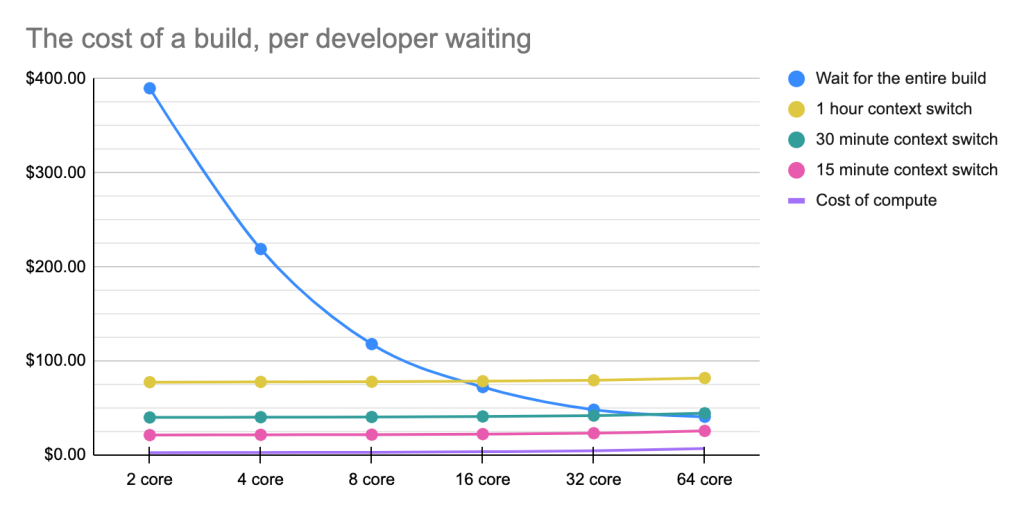
You can immediately see how much faster each build completes on more powerful hardware—and that’s hardly surprising. But it’s striking how much money, on average, a business would be paying their developers in the time it takes for a build to run.
When you plot this out, you end up with a pretty compelling case for spending more money on stronger hardware.
A chart showing the cost of a build on servers of varying CPU power.
The bottom line: The cost of hardware is much, much less than the total cost for developers, and giving your engineering teams more CPU power means they have more time to develop software instead of waiting on builds to complete. And the bigger the team you have in a given organization, the more upside you have to invest in more capable compute resources.
How much context switching costs companies
Now let’s change the scenario in our experiment: Instead of assuming that developers are sitting idly while waiting for a build to finish, let’s consider they instead start working on another task while a build runs.
This is a classic example of context switching, and it comes with a cost, too. Research has found that context switching is both distracting and an impediment to focused and productive work. In fact, Gloria Mark, a professor of informatics at the University of California, Irvine, has found it takes about 23 minutes for someone to get back to their original task after context switching—and that isn’t even specific to development work, which often entails deeply involved work.
Based on my own experience, switching from one focused task to another takes at least an hour so that’s what I used to run the numbers against. Now, let’s break down the data again:
Compute power
Minutes
Cost of 1 build
Partial developer cost
(1 dev)
Partial developer cost
(5 devs)
2 core
310
$2.48
$77.48
$377.48
4 core
173
$2.77
$77.77
$377.77
8 core
92
$2.94
$77.94
$377.94
16 core
55
$3.52
$78.52
$378.52
32 core
35
$4.48
$79.48
$379.48
64 core
27
$6.91
$81.91
$381.91
Here, the numbers tell a different story—that is, if you’re going to switch tasks anyways, the speed of build runs doesn’t significantly matter. Labor is much, much more expensive than compute resources. And that means spending a few more dollars to speed up the build is inconsequential in the long run.
Of course, this assumes it will take an hour for developers to get back on track after context switching. But according to the research we cited above, some people can get back on track in 23 minutes (and, additional research from Cornell found that it sometimes takes as little as 10 minutes).
To account for this, let’s try shortening the time frames to 30 minutes and 15 minutes:
Compute power
Minutes
Cost of 1 build
Partial dev cost
(1 dev, 30 mins)
Partial dev cost
(5 devs, 30 mins)
Partial dev cost
(1 dev, 15 mins)
Partial dev cost
(5 devs, 15 mins)
2 core
310
$2.48
$39.98
$189.98
$21.23
$96.23
4 core
173
$2.77
$40.27
$190.27
$21.52
$96.52
8 core
92
$2.94
$40.44
$190.44
$21.69
$96.69
16 core
55
$3.52
$41.02
$191.02
$22.27
$97.27
32 core
35
$4.48
$41.98
$191.98
$23.23
$98.23
64 core
27
$6.91
$44.41
$194.41
$25.66
$100.66
And when you visualize this data on a graph, the cost for a single developer waiting on a build or switching tasks looks like this:
A chart showing how much it costs for developers to wait for a build to execute.
When you assume the average hourly rate of a developer is $75 (USD), the graph above shows that it almost always makes sense to pay more for more compute power so your developers aren’t left waiting or context switching. Even the most expensive compute option—$15 an hour for 64 cores and 256GB of RAM—only accounts for a fifth of the hourly cost of a single developer’s time. As developer salaries increase, the cost of hardware decreases, or the time the job takes to run decreases—and this inverse ratio bolsters the case for buying better equipment.
That’s something to consider.
The bottom line
It’s cheaper—and less frustrating for your developers—to pay more for better hardware to keep your team on track.
In this case, spending an extra $4-5 on build compute saves about $40 per build for an individual developer, or a little over $200 per build for a team of five, and the frustration of switching tasks with a productivity cost of about an hour. That’s not nothing. Of course, spending that extra $4-5 at scale can quickly compound—but so can the cost of sunk productivity.
Even though we used GitHub’s larger runners as an example here, these findings are applicable to any type of hardware—whether self-hosted or in the cloud. So remember: The upfront cost for more CPU power pays off over time. And your developers will thank you (trust us).
In November, we experienced two incidents that resulted in degraded performance across GitHub services. This report also sheds light into an incident that impacted GitHub Codespaces in October.
November 25 16:34 UTC (lasting 1 hour and 56 minutes)
Our alerting systems detected an incident that impacted customers using GitHub Packages and Pages. Due to the recency of this incident, we are still investigating the contributing factors and will provide a more detailed update on cause and remediation in the January Availability Report, which we will publish the first Wednesday of January.
October 26 00:47 UTC (lasting 3 hours and 47 minutes)
On October 22, 2022 at 00:47 UTC, our alerting systems detected a decrease in success rates for creates and resumes of Codespaces in the East US region. We initially statused yellow, as the incident affected only the East US region. As the incident persisted for several hours, we provided guidance to customers in the affected region to manually change their location to a nearby healthy region at 01:55 UTC, and statused red at 2:34 UTC due to the prolonged outage.
During this incident, customers were unable to create or resume Codespaces in the East US region. Customers could manually select an alternate region in which to create Codespaces, but could not do so for resumes.
Codespaces uses a third-party database to store data for the service and the provider was experiencing an outage, which impacted Codespaces performance. We were unable to immediately communicate with our East US database because our service does not currently have any replication of its regional data. Our services in the East US region returned to healthy status as soon as Codespaces engineers were able to engage with the third party to help mitigate the outage.
We identified several ways to improve our database resilience to regional outages while working with the third party during this incident and in follow up internal discussions. We are implementing regional replication and failover so that we can mitigate this type of incident more quickly in the future.
November 3 16:10 UTC (lasting 1 hour and 2 minutes)
On November 3, 2022 at 16:10 UTC, our alerting systems detected an increase in the time it took GitHub Actions workflow runs to start. We initially statused GitHub Actions to red, and after assessing impact we statused to yellow at 16:11 UTC.
During this incident, customers experienced high latency in receiving webhook deliveries, starting GitHub Actions workflow runs, and receiving status updates for in-progress runs. They also experienced an increase in error responses from repositories, pull requests, Codespaces, and the GitHub API. At its peak, a majority of repositories attempting to run a GitHub Actions workflow experienced delays longer than five minutes.
GitHub Actions listens to webhooks to trigger workflow runs, and while investigating we found that the run start delays were caused by a backup in the webhooks queue. At 16:29 UTC, we scaled out and accelerated processing of the webhooks queue as a mitigation. By 17:12 UTC, the webhooks queue was fully drained and we statused back to green.
We found that the webhook delays were caused by an inefficient database query for checking repository security advisory access, which was triggered by a high volume of poorly optimized API calls. This caused a backup in background jobs running across GitHub, which is why multiple services were impacted in addition to webhooks and GitHub Actions.
Following our investigation, we fixed the inefficient query for the repository security advisory access. We also reviewed the rate limits for this particular endpoint (as well as limits in this area) to ensure they were in line with our performance expectations. Finally, we increased the default throttling of the webhooks queue to avoid potential backups in the future. As a longer-term improvement to our resiliency, we are investigating options to reduce the potential for other background jobs to impact GitHub Actions workflows. We’ll continue to run game days and conduct enhanced training for first responders to better assess impact for GitHub Actions and determine the appropriate level of statusing moving forward.
Please follow our status page for real-time updates on status changes. To learn more about what we’re working on, check out the GitHub Engineering Blog.
Grab’s real-time data platform team, also known as Coban, has been operating large-scale Kafka clusters for all Grab verticals, with a strong focus on ensuring a best-in-class-performance and 99.99% availability.
Security has always been one of Grab’s top priorities and as fraudsters continue to evolve, there is an increased need to continue strengthening the security of our data streaming platform. One of the ways of doing this is to move from a pure network-based access control to state-of-the-art security and zero trust by default, such as:
Authentication: The identity of any remote systems – clients and servers – is established and ascertained first, prior to any further communications.
Authorisation: Access to Kafka is granted based on the principle of least privilege; no access is given by default. Kafka clients are associated with the whitelisted Kafka topics and permissions – consume or produce – they strictly need. Also, granted access is auditable.
Confidentiality: All in-transit traffic is encrypted.
Solution
We decided to use mutual Transport Layer Security (mTLS) for authentication and encryption. mTLS enables clients to authenticate servers, and servers to reciprocally authenticate clients.
Kafka supports other authentication mechanisms, like OAuth, or Salted Challenge Response Authentication Mechanism (SCRAM), but we chose mTLS because it is able to verify the peer’s identity offline. This verification ability means that systems do not need an active connection to an authentication server to ascertain the identity of a peer. This enables operating in disparate network environments, where all parties do not necessarily have access to such a central authority.
We opted for Hashicorp Vault and its PKI engine to dynamically generate clients and servers’ certificates. This enables us to enforce the usage of short-lived certificates for clients, which is a way to mitigate the potential impact of a client certificate being compromised or maliciously shared. We said zero trust, right?
For authorisation, we chose Policy-Based Access Control (PBAC), a more scalable solution than Role-Based Access Control (RBAC), and the Open Policy Agent (OPA) as our policy engine, for its wide community support.
To integrate mTLS and the OPA with Kafka, we leveraged Strimzi, the Kafka on Kubernetes operator. In a previous article, we have alluded to Strimzi and hinted at how it would help with scalability and cloud agnosticism. Built-in security is undoubtedly an additional driver of our adoption of Strimzi.
Server authentication
Figure 1 – Server authentication process for internal cluster communications
We first set up a single Root Certificate Authority (CA) for each environment (staging, production, etc.). This Root CA, in blue on the diagram, is securely managed by the Hashicorp Vault cluster. Note that the color of the certificates, keys, signing arrows and signatures on the diagrams are consistent throughout this article.
To secure the cluster’s internal communications, like the communications between the Kafka broker and Zookeeper pods, Strimzi sets up a Cluster CA, which is signed by the Root CA (step 1). The Cluster CA is then used to sign the individual Kafka broker and zookeeper certificates (step 2). Lastly, the Root CA’s public certificate is imported into the truststores of both the Kafka broker and Zookeeper (step 3), so that all pods can mutually verify their certificates when authenticating one with the other.
Strimzi’s embedded Cluster CA dynamically generates valid individual certificates when spinning up new Kafka and Zookeeper pods. The signing operation (step 2) is handled automatically by Strimzi.
For client access to Kafka brokers, Strimzi creates a different set of intermediate CA and server certificates, as shown in the next diagram.
Figure 2 – Server authentication process for client access to Kafka brokers
The same Root CA from Figure 1 now signs a different intermediate CA, which the Strimzi community calls the Client CA (step 1). This naming is misleading since it does not actually sign any client certificates, but only the server certificates (step 2) that are set up on the external listener of the Kafka brokers. These server certificates are for the Kafka clients to authenticate the servers. This time, the Root CA’s public certificate will be imported into the Kafka Client truststore (step 3).
Client authentication
Figure 3 – Client authentication process
For client authentication, the Kafka client first needs to authenticate to Hashicorp Vault and request an ephemeral certificate from the Vault PKI engine (step 1). Vault then issues a certificate and signs it using its Root CA (step 2). With this certificate, the client can now authenticate to Kafka brokers, who will use the Root CA’s public certificate already in their truststore, as previously described (step 3).
CA tree
Putting together the three different authentication processes we have just covered, the CA tree now looks like this. Note that this is a simplified view for a single environment, a single cluster, and two clients only.
Figure 4 – Complete certificate authority tree
As mentioned earlier, each environment (staging, production, etc.) has its own Root CA. Within an environment, each Strimzi cluster has its own pair of intermediate CAs: the Cluster CA and the Client CA. At the leaf level, the Zookeeper and Kafka broker pods each have their own individual certificates.
On the right side of the diagram, each Kafka client can get an ephemeral certificate from Hashicorp Vault whenever they need to connect to Kafka. Each team or application has a dedicated Vault PKI role in Hashicorp Vault, restricting what can be requested for its certificate (e.g., Subject, TTL, etc.).
Strimzi deployment
We heavily use Terraform to manage and provision our Kafka and Kafka-related components. This enables us to quickly and reliably spin up new clusters and perform cluster scaling operations.
Under the hood, Strimzi Kafka deployment is a Kubernetes deployment. To increase the performance and the reliability of the Kafka cluster, we create dedicated Kubernetes nodes for each Strimzi Kafka broker and each Zookeeper pod, using Kubernetes taints and tolerations. This ensures that all resources of a single node are dedicated solely to either a single Kafka broker or a single Zookeeper pod.
We also decided to go with a single Kafka cluster by Kubernetes cluster to make the management easier.
Client setup
Coban provides backend microservice teams from all Grab verticals with a popular Kafka SDK in Golang, to standardise how teams utilise Coban Kafka clusters. Adding mTLS support mostly boils down to upgrading our SDK.
Our enhanced SDK provides a default mTLS configuration that works out of the box for most teams, while still allowing customisation, e.g., for teams that have their own Hashicorp Vault Infrastructure for compliance reasons. Similarly, clients can choose among various Vault auth methods such as AWS or Kubernetes to authenticate to Hashicorp Vault, or even implement their own logic for getting a valid client certificate.
To mitigate the potential risk of a user maliciously sharing their application’s certificate with other applications or users, we limit the maximum Time-To-Live (TTL) for any given certificate. This also removes the overhead of maintaining a Certificate Revocation List (CRL). Additionally, our SDK stores the certificate and its associated private key in memory only, never on disk, hence reducing the attack surface.
In our case, Hashicorp Vault is a dependency. To prevent it from reducing the overall availability of our data streaming platform, we have added two features to our SDK – a configurable retry mechanism and automatic renewal of clients’ short-lived certificates when two thirds of their TTL is reached. The upgraded SDK also produces new metrics around this certificate renewal process, enabling better monitoring and alerting.
Authorisation
Figure 5 – Authorisation process before a client can access a Kafka record
For authorisation, we set up the Open Policy Agent (OPA) as a standalone deployment in the Kubernetes cluster, and configured Strimzi to integrate the Kafka brokers with that OPA.
OPA policies – written in the Rego language – describe the authorisation logic. They are created in a GitLab repository along with the authorisation rules, called data sources (step 1). Whenever there is a change, a GitLab CI pipeline automatically creates a bundle of the policies and data sources, and pushes it to an S3 bucket (step 2). From there, it is fetched by the OPA (step 3).
When a client – identified by its TLS certificate’s Subject – attempts to consume or produce a Kafka record (step 4), the Kafka broker pod first issues an authorisation request to the OPA (step 5) before processing the client’s request. The outcome of the authorisation request is then cached by the Kafka broker pod to improve performance.
As the core component of the authorisation process, the OPA is deployed with the same high availability as the Kafka cluster itself, i.e. spread across the same number of Availability Zones. Also, we decided to go with one dedicated OPA by Kafka cluster instead of having a unique global OPA shared between multiple clusters. This is to reduce the blast radius of any OPA incidents.
For monitoring and alerting around authorisation, we submitted an Open Source contribution in the opa-kafka-plugin project in order to enable the OPA authoriser to expose some metrics. Our contribution to the open source code allows us to monitor various aspects of the OPA, such as the number of authorised and unauthorised requests, as well as the cache hit-and-miss rates. Also, we set up alerts for suspicious activity such as unauthorised requests.
Finally, as a platform team, we need to make authorisation a scalable, self-service process. Thus, we rely on the Git repository’s permissions to let Kafka topics’ owners approve the data source changes pertaining to their topics.
Teams who need their applications to access a Kafka topic would write and submit a JSON data source as simple as this:
GitLab CI unit tests and business logic checks are set up in the Git repository to ensure that the submitted changes are valid. After that, the change would be submitted to the topic’s owner for review and approval.
What’s next?
The performance impact of this security design is significant compared to unauthenticated, unauthorised, plaintext Kafka. We observed a drop in throughput, mostly due to the low performance of encryption and decryption in Java, and are currently benchmarking different encryption ciphers to mitigate this.
Also, on authorisation, our current PBAC design is pretty static, with a list of applications granted access for each topic. In the future, we plan to move to Attribute-Based Access Control (ABAC), creating dynamic policies based on teams and topics’ metadata. For example, teams could be granted read and write access to all of their own topics by default. Leveraging a versatile component such as the OPA as our authorisation controller enables this evolution.
Join us
Grab is the leading superapp platform in Southeast Asia, providing everyday services that matter to consumers. More than just a ride-hailing and food delivery app, Grab offers a wide range of on-demand services in the region, including mobility, food, package and grocery delivery services, mobile payments, and financial services across 428 cities in eight countries.
Powered by technology and driven by heart, our mission is to drive Southeast Asia forward by creating economic empowerment for everyone. If this mission speaks to you, join our team today!
The foundation for making any map is in imagery, but due to the complexity and dynamism of the real world, it is difficult for companies to collect high-quality, fresh images in an efficient yet low-cost manner. This is the case for Grab’s Geo team as well.
Traditional map-making methods rely on professional-grade cameras that provide high resolution images to collect mapping imagery. These images are rich in content and detail, providing a good snapshot of the real world. However, we see two major challenges with this approach.
The first is high cost. Professional cameras are too expensive to use at scale, especially in an emerging region like Southeast Asia. Apart from high equipment cost, operational cost is also high as local operation teams need professional training before collecting imagery.
The other major challenge, related to the first, is that imagery will not be refreshed in a timely manner because of the high cost and operational effort required. It typically takes months or years before imagery is refreshed, which means maps get outdated easily.
Compared to traditional collection methods, there are more affordable alternatives that some emerging map providers are using, such as crowdsourced collection done with smartphones or other consumer-grade action cameras. This allows more timely imagery refresh at a much lower cost.
That said, there are several challenges with crowdsourcing imagery, such as:
Inconsistent quality in collected images.
Low operational efficiency as cameras and smartphones are not optimised for mapping.
Unreliable location accuracy.
In order to solve the challenges above, we started building our own artificial intelligence (AI) camera called KartaCam.
What is KartaCam?
Designed specifically for map-making, KartaCam is a lightweight camera that is easy to operate. It is everything you need for accurate and efficient image collection. KartaCam is powered by edge AI, and mainly comprises a camera module, a dual-band Global Navigation Satellite System (GNSS) module, and a built-in 4G Long-Term Evolution (LTE) module.
KartaCam
Camera module
The camera module or optical design of KartaCam focuses on several key features:
Wide field of vision (FOV): A wide FOV to capture as many scenes and details as possible without requiring additional trips. A single KartaCam has a wide lens FOV of >150° and when we use four KartaCams together, each facing a different direction, we increase the FOV to 360°.
High image quality: A combination of high-definition optical lens and a high-resolution pixel image sensor can help to achieve better image quality. KartaCam uses a high-quality 12MP image sensor.
Ease of use: Portable and easy to start using for people with little to no photography training. At Grab, we can easily deploy KartaCam to our fleet of driver-partners to map our region as they regularly travel these roads while ferrying passengers or making deliveries.
Edge AI for smart capturing on edge
Each KartaCam device is also equipped with edge AI, which enables AI computations to operate closer to the actual data – in our case, imagery collection. With edge AI, we can make decisions about imagery collection (i.e. upload, delete or recapture) at the device-level.
To help with these decisions, we use a series of edge AI models and algorithms that are executed immediately after each image capture such as:
Scene recognition model: For efficient map-making, we ensure that we make the right screen verdicts, meaning we only upload and process the right scene images. Unqualified images such as indoor, raining, and cloudy images are deleted directly on the KartaCam device. Joint detection algorithms are deployed in some instances to improve the accuracy of scene verdicts. For example, to detect indoor recording we look at a combination of driver moving speed, Inertial Measurement Units (IMU) data and edge AI image detection.
Image quality (IQ) checking AI model: The quality of the images collected is paramount for map-making. Only qualified images judged by our IQ classification algorithm will be uploaded while those that are blurry or considered low-quality will be deleted. Once an unqualified image is detected (usually within the next second), a new image is captured, improving the success rate of collection.
Object detection AI model: Only roadside images that contain relevant map-making content such as traffic signs, lights, and Point of Interest (POI) text are uploaded.
Privacy information detection: Edge AI also helps protect privacy when collecting street images for map-making. It automatically blurs private information such as pedestrians’ faces and car plate numbers before uploading, ensuring adequate privacy protection.
Better positioning with a dual-band GNSS module
The Global Positioning System (GPS) mainly uses two frequency bands: L1 and L5. Most traditional phone or GPS modules only support the legacy GPS L1 band, while modern GPS modules support both L1 and L5. KartaCam leverages the L5 band which provides improved signal structure, transmission capabilities, and a wider bandwidth that can reduce multipath error, interference, and noise impacts. In addition, KartaCam uses a fine-tuned high-quality ceramic antenna that, together with the dual frequency band GPS module, greatly improves positioning accuracy.
Keeping KartaCam connected
KartaCam has a built-in 4G LTE module that ensures it is always connected and can be remotely managed. The KartaCam management portal can monitor camera settings like resolution and capturing intervals, even in edge AI machine learning models. This makes it easy for Grab’s map ops team and drivers to configure their cameras and upload captured images in a timely manner.
Enhancing KartaCam
KartaCam 360: Capturing a panorama view
To improve single collection trip efficiency, we group four KartaCams together to collect 360° images. The four cameras can be synchronised within milliseconds and the collected images are stitched together in a panoramic view.
With KartaCam 360, we can increase the number of images collected in a single trip. According to Grab’s benchmark testing in Singapore and Jakarta, the POI information collected by KartaCam 360 is comparable to that of professional cameras, which cost about 20x more.
KartaCam 360 & Scooter mount
Image sample from KartaCam 360
KartaCam and the image collection workflow
KartaCam, together with other GrabMaps imagery tools, provides a highly efficient, end-to-end, low-cost, and edge AI-powered smart solution to map the region. KartaCam is fully integrated as part of our map-making workflow.
Our map-making solution includes the following components:
Collection management tool – Platform that defines map collection tasks for our driver-partners.
KartaView application – Mobile application provides map collection tasks and handles crowdsourced imagery collection.
KartaCam – Camera device connected to KartaView via Bluetooth and equipped with edge automatic processing for imagery capturing according to the task accepted.
Camera management tool – Handles camera parameters and settings for all KartaCam devices and can remotely control the KartaCam.
Automatic processing – Collected images are processed for quality check, stitching, and personal identification information (PII) blurring.
KartaView imagery platform – Processed images are then uploaded and the driver-partner receives payment.
In a future article, we will dive deeper into the technology behind KartaView and its role in GrabMaps.
Impact
At the moment, Grab is rolling out thousands of KartaCams to all locations across Southeast Asia where Grab operates. This saves operational costs while improving the efficiency and quality of our data collection.
Better data quality and more map attributes
Due to the excellent image quality, wide FOV coverage, accurate GPS positioning, and sensor data, the 360° images captured by KartaCam 360 also register detailed map attributes like POIs, traffic signs, and address plates. This will help us build a high quality map with rich and accurate content.
Reducing operational costs
Based on our research, the hardware cost for KartaCam 360 is significantly lower compared to similar professional cameras in the market. This makes it a more feasible option to scale up in Southeast Asia as the preferred tool for crowdsourcing imagery collection.
With image quality checks and detection conducted at the edge, we can avoid re-collections and also ensure that only qualified images are uploaded. These result in saving time as well as operational and upload costs.
Upholding privacy standards
KartaCam automatically blurs captured images that contain PII, like faces and licence plates directly from the edge devices. This means that all sensitive information is removed at this stage and is never uploaded to Grab servers.
On-the-edge blurring example
What’s next?
Moving forward, Grab will continue to enhance KartaCam’s performance in the following aspects:
Further improve image quality with better image sensors, unique optical components, and state-of-art Image Signal Processor (ISP).
Make KartaCam compatible with Light Detection And Ranging (LIDAR) for high-definition collection and indoor use cases.
Improve GNSS module performance with higher sampling frequency and accuracy, and integrate new technology like Real-Time Kinematic (RTK) and Precise Point Positioning (PPP) solutions to further improve the positioning accuracy. When combined with sensor fusion from IMU sensors, we can improve positioning accuracy for map-making further.
Improve usability, integration, and enhance imagery collection and portability for KartaCam so driver-partners can easily capture mapping data.
Explore new product concepts for future passive street imagery collection.
To find out more about how KartaCam delivers comprehensive cost-effective mapping data, check out this article.
Join us
Grab is the leading superapp platform in Southeast Asia, providing everyday services that matter to consumers. More than just a ride-hailing and food delivery app, Grab offers a wide range of on-demand services in the region, including mobility, food, package and grocery delivery services, mobile payments, and financial services across 428 cities in eight countries.
Powered by technology and driven by heart, our mission is to drive Southeast Asia forward by creating economic empowerment for everyone. If this mission speaks to you, join our team today!
Millions of developers rely on the GitHub API every day—whether they’ve built their own bespoke integration or are using a third-party app from the GitHub Marketplace.
We know that it’s absolutely crucial to provide a stable, consistent API experience. We can’t—and don’t—expect integrators to constantly update their integrations as we tweak our API.
At the same time, it’s crucial that we’re able to evolve the API over time. If the API had to stay the same forever, then we couldn’t bring the latest and greatest product features to API users, fix bugs, or improve the developer experience.
We can make most changes (for example, introduce a new endpoint) without having a negative impact on existing integrations. We call these non-breaking changes, and we make them every single day.
But sometimes, we need to make breaking changes, like deleting a response field, making an optional parameter required, or deleting an endpoint entirely.
We launched version 3 (“V3”) of our API more than a decade ago. It has served us well, but we haven’t had the right tools and processes in place to make occasional breaking changes AND give existing users a smooth migration path and plenty of time to upgrade their integrations.
To enable us to continue evolving the API for the next decade (and beyond!), we’re introducing calendar-based versioning for the REST API.
This post will show you how the new API versioning system will work and what will happen next.
How it works—a 60‐second summary
Whenever we need to make breaking changes to the REST API, we’ll release a new version. Head over to our documentation to learn about the kinds of changes that we consider to be breaking and non-breaking.
Versions will be named based on the date when they were released. For example, if we release a new version on December 25, 2025, we would call that version 2025-12-25.
When we release a new version, the previous version(s) will still be available, so you won’t be forced to upgrade right away.
Picking what version you want to use is easy. You just specify the version you want to use on a request-by-request basis using the X-GitHub-Api-Version header.
In our API documentation, you can pick which version of the docs you want to view using the version picker.
We’ll only use versioning for breaking changes. Non-breaking changes will continue to be available across all API versions.
Note: calendar-based API versioning only applies to our REST API. It does not apply to our GraphQL API or webhooks.
How often will you release new versions, and how long will they last?
We’ll release a new version when we want to make breaking changes to the API.
We recommend that new integrations should use the latest API version and existing integrators should keep their integrations up to date, but we won’t frequently retire old versions or force users to upgrade.
When a new REST API version is released, we’re committed to supporting the previous version for at least two years (24 months).
After two years, we reserve the right to retire a version, but in practice, we expect to support historic versions for significantly longer than this. When we do decide to end support for an old version, we’ll announce that on our blog and via email.
I have an existing integration with the REST API. What does this mean for me?
You don’t need to do anything right now.
We’ve taken the existing state of the GitHub API—what you’re already using—and called it version 2022-11-28.
We encourage integrators to update their integration to send the new X-GitHub-Api-Version: 2022-11-28 header. Version 2022-11-28 is exactly the same as the API before we launched versioning, so you won’t need to make any changes to your integration.
In the next few months, we’ll release another version with breaking changes included. To move to that version, you will need to point the X-GitHub-Api-Version header to that new version and make sure that your integration works with the changes introduced in that version. Of course, we’ll provide a full changelog and instructions on how to upgrade.
Next steps—and what you can do today
If you have an integration with the REST API, you should update it now to start sending the X-GitHub-Api-Version header.
Soon, we’ll release a dated version of the API with breaking changes. Then, and whenever we release a new API version, we’ll:
Publish the documentation, information about the changes, and an upgrade guide in the GitHub REST API docs.
Email active GitHub.com developers to let them know about the new release.
Include a note providing details of the API changes in the release notes for GitHub Enterprise Server and GitHub AE.
We’ll also launch tools to help organization and enterprise administrators track their integrations and the API versions in use, making it easy to manage the upgrade process across an organization.
Grab has grown rapidly in the past few years. It has expanded its business from ride hailing to food and grocery delivery, financial services, and more. Fraud detection is challenging in Grab, because new fraud patterns always arise whenever we introduce a new business product. We cannot afford to develop a new model whenever a new fraud pattern appears as it is time consuming and introduces a cold start problem, that is no protection at the early stage. We need a general fraud detection framework to better protect Grab from various unknown fraud risks.
Our key observation is that although Grab has many different business verticals, the entities within those businesses are connected to each other (Figure 1. Left), for example, two passengers may be connected by a Wi-Fi router or phone device, a merchant may be connected to a passenger by a food order, and so on. A graph provides an elegant way to capture the spatial correlation among different entities in the Grab ecosystem. A common fraud shows clear patterns on a graph, for example, a fraud syndicate tends to share physical devices, and collusion happens between a merchant and an isolated set of passengers (Figure 1. Right).
Figure 1. Left: The graph captures different correlations in the Grab ecosystem. Right: The graph shows that common fraud has clear patterns.
We believe graphs can help us discover subtle traces and complicated fraud patterns more effectively. Graph-based solutions will be a sustainable foundation for us to fight against known and unknown fraud risks.
Why graph?
The most common fraud detection methods include the rule engine and the decision tree-based models, for example, boosted tree, random forest, and so on. Rules are a set of simple logical expressions designed by human experts to target a particular fraud problem. They are good for simple fraud detection, but they usually do not work well in complicated fraud or unknown fraud cases.
Fraud detection methods
Utilises correlations (Higher is better)
Detects unknown fraud (Higher is better)
Requires feature engineering (Lower is better)
Depends on labels (Lower is better)
Rule engine
Low
N/A
N/A
Low
Decision tree
Low
Low
High
High
Graph model
High
High
Low
Low
Table 1. Graph vs. common fraud detection methods.
Decision tree-based models have been dominating fraud detection and Kaggle competitions for structured or tabular data in the past few years. With that said, the performance of a tree-based model is highly dependent on the quality of labels and feature engineering, which is often hard to obtain in real life. In addition, it usually does not work well in unknown fraud which has not been seen in the labels.
On the other hand, a graph-based model requires little amount of feature engineering and it is applicable to unknown fraud detection with less dependence on labels, because it utilises the structural correlations on the graph.
In particular, fraudsters tend to show strong correlations on a graph, because they have to share physical properties such as personal identities, phone devices, Wi-Fi routers, delivery addresses, and so on, to reduce cost and maximise revenue as shown in Figure 2 (left). An example of such strong correlations is shown in Figure 2 (right), where the entities on the graph are densely connected, and the known fraudsters are highlighted in red. Those strong correlations on the graph are the key reasons that make the graph based approach a sustainable foundation for various fraud detection tasks.
Figure 2. Fraudsters tend to share physical properties to reduce cost (left), and they are densely connected as shown on a graph (right).
Semi-supervised graph learning
Unlike traditional decision tree-based models, the graph-based machine learning model can utilise the graph’s correlations and achieve great performance even with few labels. The semi-supervised Graph Convolutional Network model has been extremely popular in recent years 1. It has proven its success in many fraud detection tasks across industries, for example, e-commerce fraud, financial fraud, internet traffic fraud, etc.
We apply the Relational Graph Convolutional Network (RGCN) 2 for fraud detection in Grab’s ecosystem. Figure 3 shows the overall architecture of RGCN. It takes a graph as input, and the graph passes through several graph convolutional layers to get node embeddings. The final layer outputs a fraud probability for each node. At each graph convolutional layer, the information is propagated along the neighbourhood nodes within the graph, that is nodes that are close on the graph are similar to each other.
Fig 3. A semi-supervised Relational Graph Convolutional Network model.
We train the RGCN model on a graph with millions of nodes and edges, where only a few percentages of the nodes on the graph have labels. The semi-supervised graph model has little dependency on the labels, which makes it a robust model for tackling various types of unknown fraud.
Figure 4 shows the overall performance of the RGCN model. On the left is the Receiver Operating Characteristic (ROC) curve on the label dataset, in particular, the Area Under the Receiver Operating Characteristic (AUROC) value is close to 1, which means the RGCN model can fit the label data quite well. The right column shows the low dimensional projections of the node embeddings on the label dataset. It is clear that the embeddings of the genuine passenger are well separated from the embeddings of the fraud passenger. The model can distinguish between a fraud and a genuine passenger quite well.
Fig 4. Left: ROC curve of the RGCN model on the label dataset. Right: Low dimensional projections of the graph node embeddings.
Finally, we would like to share a few tips that will make the RGCN model work well in practice.
Use less than three convolutional layers: The node feature will be over-smoothed if there are many convolutional layers, that is all the nodes on the graph look similar.
Node features are important: Domain knowledge of the node can be formulated as node features for the graph model, and rich node features are likely to boost the model performance.
Graph explainability
Unlike other deep network models, graph neural network models usually come with great explainability, that is why a user is classified as fraudulent. For example, fraudulent accounts are likely to share hardware devices and form dense clusters on the graph, and those fraud clusters can be easily spotted on a graph visualiser 3.
Figure 5 shows an example where graph visualisation helps to explain the model prediction scores. The genuine passenger with a low RGCN score does not share devices with other passengers, while the fraudulent passenger with a high RGCN score shares devices with many other passengers, that is, dense clusters.
Figure 5. Upper left: A genuine passenger with a low RGCN score has no device sharing with other passengers. Bottom right: A fraudulent user with a high RGCN score shares devices with many other passengers.
Closing thoughts
Graphs provide a sustainable foundation for combating many different types of fraud risks. Fraudsters are evolving very fast these days, and the best traditional rules or models can do is to chase after those fraudsters given that a fraud pattern has already been discovered. This is suboptimal as the damage has already been done on the platform. With the help of graph models, we can potentially detect those fraudsters before any fraudulent activity has been conducted, thus reducing the fraud cost.
The graph structural information can significantly boost the model performance without much dependence on labels, which is often hard to get and might have a large bias in fraud detection tasks. We have shown that with only a small percentage of labelled nodes on the graph, our model can already achieve great performance.
With that said, there are also many challenges to making a graph model work well in practice. We are working towards solving the following challenges we are facing.
Feature initialisation: Sometimes, it is hard to initialise the node feature, for example, a device node does not carry many semantic meanings. We have explored self-supervised pre-training 4 to help the feature initialisation, and the preliminary results are promising.
Real-time model prediction: Realtime graph model prediction is challenging because real-time graph updating is a heavy operation in most cases. One possible solution is to do batch real-time prediction to reduce the overhead.
Noisy connections: Some connections on the graph are inherently noisy on the graph, for example, two users sharing the same IP address does not necessarily mean they are physically connected. The IP might come from a mobile network. One possible solution is to use the attention mechanism in the graph convolutional kernel and control the message passing based on the type of connection and node profiles.
Join us
Grab is the leading superapp platform in Southeast Asia, providing everyday services that matter to consumers. More than just a ride-hailing and food delivery app, Grab offers a wide range of on-demand services in the region, including mobility, food, package and grocery delivery services, mobile payments, and financial services across 428 cities in eight countries.
Powered by technology and driven by heart, our mission is to drive Southeast Asia forward by creating economic empowerment for everyone. If this mission speaks to you, join our team today!
References
T. Kipf and M. Welling, “Semi-supervised classification with graph convolutional networks,” in ICLR, 2017 ↩
Schlichtkrull, Michael, et al. “Modeling relational data with graph convolutional networks.” European semantic web conference. Springer, Cham, 2018. ↩
I’m a huge fan of machine learning: as far as I’m concerned, it’s an exciting way of creating software that combines the ingenuity of developers with the intelligence (sometimes hidden) in our data. Naturally, I store all my code in GitHub – but most of my work primarily happens on either my beefy desktop or some large VM in the cloud.
So I think it goes without saying, the GitHub Universe announcements made me super excited about building machine learning projects directly on GitHub. With that in mind, I thought I would try it out using one of my existing machine learning repositories. Here’s what I found.
Jupyter Notebooks
Machine learning can be quite messy when it comes to the exploration phase. This process is made much easier by using Jupyter notebooks. With notebooks you can try several ideas with different data and model shapes quite easily. The challenge for me, however, has been twofold: it’s hard to have ideas away from my desk, and notebooks are notoriously difficult to manage when working with others (WHAT DID YOU DO TO MY NOTEBOOK?!?!?).
This improved rendering experience is amazing (and there’s a lovely dark mode too). In a recent pull-request I also noticed the following:
Not only can I see the cells that have been added, but I can also see side-by-side the code differences within the cells, as well as the literal outputs. I can see at a glance the code that has changed and the effect it produces thanks to NbDime running under the hood (shout out to the community for this awesome package).
Notebook Execution (and more)
While the rendering additions to GitHub are fantastic, there’s still the issue of executing the things in a reliable way when I’m away from my desk. Here’s a couple of gems we introduced at GitHub Universe to make these issues go away:
GPUs for Codespaces
Zero-config notebooks in Codespaces
Edit your notebooks from VS Code, PyCharm, JupyterLab, on the web, or even using the CLI (powered by Codespaces)
I decided to try these things out for myself by opening an existing forecasting project that uses PyTorch to do time-series analysis. I dutifully created a new Codespace (but with options since I figured I would need to tell it to use a GPU).
Sure enough, there was a nice GPU option:
That was it! Codespaces found my requirements.txt file and went to work pip installing everything I needed.
After a few minutes (PyTorch is big) I wanted to check if the GPU worked (spoiler alert below):
This is incredible! And, the notebook also worked exactly as it does when working locally:
Again, this is in a browser! For kicks and giggles, I wanted to see if I could run the full blown model building process. For context, I believe notebooks are great for exploration but can become brittle when moving to repeatable processes. Eventually MLOps requires the movement of the salient code to their own scripts modules/scripts. In fact, it’s how I structure all my ML projects. If you sneak a peek above, you will see a notebooks folder and then a folder that contains the model training Python files. As an avid VSCode user I also set up a way to debug the model building process. So I crossed my fingers and started the debugging process:
I know this is a giant screenshot, but I wanted to show the full gravity of what is happening in the browser: I am debugging the build of a deep learning PyTorch model – with breakpoints and everything – on a GPU.
The last thing I wanted to show is the new JupyterLab feature enabled via the CLI or directly from the Codespaces page:
For some, JupyterLab is an indispensable part of their ML process – which is why it’s something we now support in its full glory:
What if you’re a JupyterLab user only and don’t want to use the “Open In…” menu every time? There’s a setting for that here:
And because there’s always that one person who likes to do machine learning only from the command line (you know who I’m talking about):
For good measure I wanted to show you that given it’s the same container, the GPU is still available.
Now, what if you want to just start up a notebook and try something? A File -> New Notebook experience is also available simply using this link: https://codespace.new/jupyter.
Summary
Like I said earlier, I’m a huge fan of machine learning and GitHub. The fact that we’re adding features to make the two better together is awesome. Now this might be a coincidence (I personally don’t think so), but the container name selected by Codespaces for this little exercise sums up how this all makes me feel: sethjuarez-glorious-winner (seriously, look at container url).
Would love to hear your thoughts on these and any other features you think would make machine learning and GitHub better together. In the meantime, get ready for the upcoming GPU SKU launch by signing up to be on waitlist. Until next time!
Our consumers used to face a few common pain points while searching for food with the Grab app. Sometimes, the results would include merchants that were not yet operational or locations that were out of the delivery radius. Other times, no alternatives were provided. The search system would also have difficulties handling typos, keywords in different languages, synonyms, and even word spacing issues, resulting in a suboptimal user experience.
Over the past few months, our search team has been building a query expansion framework that can solve these issues. When a user query comes in, it expands the query to a few related keywords based on semantic relevance and user intention. These expanded words are then searched with the original query to recall more results that are high-quality and diversified. Now let’s take a deeper look at how it works.
Query expansion framework
Building the query expansion corpus
We used two different approaches to produce query expansion candidates: manual annotation for top keywords and data mining based on user rewrites.
Manual annotation for top keywords
Search has a pronounced fat head phenomenon. The most frequent thousand of keywords account for more than 70% of the total search traffic. Therefore, handling these keywords well can improve the overall search quality a lot. We manually annotated the possible expansion candidates for these common keywords to cover the most popular merchants, items and alternatives. For instance, “McDonald’s” is annotated with {“burger”, “western”}.
Data mining based on user rewrites
We observed that sometimes users tend to rewrite their queries if they are not satisfied with the search result. As a pilot study, we checked the user rewrite records within some user search sessions and found several interesting samples:
{Ya Kun Kaya Toast,Starbucks}
{healthy,Subway}
{Muni,Muji}
{奶茶,koi}
{Roti,Indian}
We can see that besides spelling corrections, users’ rewrite behaviour also reveals deep semantic relations between these pairs that cannot be easily captured by lexical similarity, such as similar merchants, merchant attributes, language differences, cuisine types, and so on. We can leverage the user’s knowledge to build a query expansion corpus to improve the diversity of the search result and user experience. Furthermore, we can use the wisdom of the crowd to find some common patterns with higher confidence.
Based on this intuition, we leveraged the high volume of search click data available in Grab to generate high-quality expansion pairs at the user session level. To augment the original queries, we collected rewrite pairs that happened to multiple users and multiple times in a time period. Specifically, we used the heuristic rules below to collect the rewrite pairs:
Select the sessions where there are at least two distinct queries (rewrite session)
Collect adjacent query pairs in the search session where the second query leads to a click but the first does not (effective rewrite)
Filter out the sample pairs with time interval longer than 30 seconds in between, as users are more likely to change their mind on what to look for in these pairs (single intention)
Count the occurrences and filter out the low-frequency pairs (confidence management)
After we have the mining pairs, we categorised and annotated the rewrite types to gain a deeper understanding of the user’s rewrite behaviour. A few samples mined from the Singapore area data are shown in the table below.
Original query
Rewrite query
Frequency in a month
Distinct user count
Type
playmade by 丸作
playmade
697
666
Drop keywords
mcdonald’s
burger
573
535
Merchant -> Food
Bubble tea
koi
293
287
Food -> Merchant
Kfc
McDonald’s
238
234
Merchant -> Merchant
cake
birthday cake
206
205
Add words
麦当劳
mcdonald’s
205
199
Locale change
4 fingers
4fingers
165
162
Space correction
krc
kfc
126
124
Spelling correction
5 guys
five guys
120
120
Number synonym
koi the
koi thé
45
44
Tone change
We further computed the percentages of some categories, as shown in the figure below.
Figure 1. The donut chart illustrates the percentages of the distinct user counts for different types of rewrites.
Apart from adding words, dropping words and spelling corrections, a significant portion of the rewrites are in the category of Other. It is more semantic driven, such as merchant to merchant, or merchant to cuisine. Those rewrites are useful for capturing deeper connections between queries and can be a powerful diversifier to query expansion.
Grouping
After all the rewrite pairs were discovered offline through data mining, we grouped the query pairs by the original query to get the expansion candidates of each query. For serving efficiency, we limited the max number of expansion candidates to three.
Query expansion serving
Expansion matching architecture
The expansion matching architecture benefits from the recent search architecture upgrade, where the system flow is changed to a query understanding, multi-recall and result fusion flow. In particular, a query goes through the query understanding module and gets augmented with additional information. In this case, the query understanding module takes in the keyword and expands it to multiple synonyms, for example, KFC will be expanded to fried chicken. The original query together with its expansions are sent together to the search engine under the multi-recall framework. After that, results from multiple recallers with different keywords are fused together.
Continuous monitoring and feedback loop
It’s important to make sure the expansion pairs are relevant and up-to-date. We run the data mining pipeline periodically to capture the new user rewrite behaviours. Meanwhile, we also monitor the expansion pairs’ contribution to the search result by measuring the net contribution of recall or user interaction that the particular query brings, and eliminate the obsolete pairs in an automatic way. This reflects our effort to build an adaptive system.
Results
We conducted online A/B experiments across 6 countries in Southeast Asia to evaluate the expanded queries generated by our system. We set up 3 groups:
Control group, where no query is expanded.
Treatment group 1, where we expanded the queries based on manual annotations only.
Treatment group 2, where we expanded the queries using the data mining approach.
We observed decent uplift in click-through rate and conversion rate from both treatment groups. Furthermore, in treatment group 2, the data mining approach produced even better results.
Future work
Data mining enhancement
Currently, the data mining approach can only identify the pairs from the same search session by one user. This limits the number of linked pairs. Some potential enhancements include:
Augment expansion pairs by associating queries from different users who click on the same merchant/item, for example, using a click graph. This can capture relevant queries across user sessions.
Build a probabilistic model on top of the current transition pairs. Currently, all the transition pairs are equally weighted but apparently, the transitions that happen more often should carry higher probability/weights.
Ads application
Query expansion can be applied to advertising and would increase ads fill rate. With “KFC” expanded to “fried chicken”, the sponsored merchants who buy the keyword “fried chicken” would be eligible to show up when the user searches “KFC”. This would enable Grab to provide more relevant sponsored content to our users, which helps not only the consumers but also the merchants.
Special thanks to Zhengmin Xu and Daniel Ng for proofreading this article.
Join us
Grab is the leading superapp platform in Southeast Asia, providing everyday services that matter to consumers. More than just a ride-hailing and food delivery app, Grab offers a wide range of on-demand services in the region, including mobility, food, package and grocery delivery services, mobile payments, and financial services across 428 cities in eight countries.
Powered by technology and driven by heart, our mission is to drive Southeast Asia forward by creating economic empowerment for everyone. If this mission speaks to you, join our team today!
In the first post in this series, we detailed how we designed our easy‐to‐use column encryption paved path. We found during the rollout that the bulk of time and effort was spent in robustly supporting the reading and upgrading of previous encryption formats/plaintext and key rotation. In this post, we’ll explain the design decisions we made in our migration plan and describe a simplified migration pattern you can use to encrypt (or re-encrypt) existing records in your Rails application.
We have two cases for encrypted columns data migration–upgrading plaintext or previously encrypted data to our new standard and key rotation.
Upon consulting the Rails documentation to see if there was any prior art we could use, we found the previous encryptor strategy but exactly how to migrate existing data is, as they say, an “exercise left for the reader.”
Dear reader, lace up your sneakers because we are about to exercise.
To convert plaintext columns or columns encrypted with our deprecated internal encryption library, we used ActiveRecord::Encryption’s previous encryptor strategy, our existing feature flag mechanism and our own type of database migration called a transition. Transitions are used by GitHub to modify existing data, as opposed to migrations that are mainly used to add or change columns. To simplify things and save time, in the example migration strategy, we’ll rely on the Ruby gem, MaintenanceTasks.
Previous encryptor strategy
ActiveRecord::Encryption provides as a config option config.active_record.encryption.support_unencrypted_data that allows plaintext values in an encrypted_attribute to be read without error. This is enabled globally and could be a good strategy to use if you are migrating only plaintext columns and you are going to migrate them all at once. We chose not to use this option because we want to migrate columns to ActiveRecord::Encryption without exposing the ciphertext of other columns if decryption fails. By using a previous encryptor, we can isolate this “plaintext mode” to a single model.
In addition to this, GitHub’s previous encryptor uses a schema validator and regex to make sure that the “plaintext” being returned does not have the same shape as Rails encrypted columns data.
Feature flag strategy
We wanted to have fine-grained control to safely roll out our new encryption strategy, as well as the ability to completely disable it in case something went wrong, so we created our own custom type using the ActiveModel::Type API, which would only perform encryption when the feature flag for our new column encryption strategy was disabled.
A common feature flag strategy would be to start a feature flag at 0% and gradually ramp it up to 100% while you observe and verify the effects on your application. Once a flag is verified at 100%, you would remove the feature flag logic and delete the flag. To gradually increase a flag on column encryption, we would need to have an encryption strategy that could handle plaintext and encrypted records both back and forth because there would be no way to know if a column was encrypted without attempting to read it first. This seemed like unnecessary additional and confusing work, so we knew we’d want to use flagging as an on/off switch.
While a feature flag should generally not be long running, we needed the feature flag logic to be long running because we want it to be available for GitHub developers who will want to upgrade existing columns to use ActiveRecord::Encryption.
This is why we chose to inverse the usual feature flag default to give us the flexibility to upgrade columns incrementally without introducing unnecessary long‐running feature flags. This means we set the flag at 100% to prevent records from being encrypted with the new standard and set it to 0% to cause them to be encrypted with our new standard. If for some reason we are unable to prioritize upgrading a column, other columns do not need to be flagged at 100% to continue to be encrypted on our new standard.
We added this logic to our monkeypatch of ActiveRecord::Base::encrypts method to ensure our feature flag serializer is used:
Code sample 1
self.attribute(attribute) do |cast_type|
    GitHub::Encryption::FeatureFlagEncryptedType.new(cast_type: cast_type, attribute_name: attribute, model_name: self.name)
end
Which instantiates our new ActiveRecord Type that checks for the flag in its serialize method:
Code sample 2
# frozen_string_literal: true

module GitHub
  module Encryption
    class FeatureFlagEncryptedType < ::ActiveRecord::Type::Text
      attr_accessor :cast_type, :attribute_name, :model_name


      # delegate: a method to make a call to `this_object.foo.bar` into `this_object.bar` for convenience
      # deserialize: Take a value from the database, and make it suitable for Rails
      # changed_in_place?: determine if the value has changed and needs to be rewritten to the database
      delegate :deserialize, :changed_in_place?
, to: :cast_type

      def initialize(cast_type:, attribute_name:, model_name:)
        raise RuntimeError, "Not an EncryptedAttributeType" unless cast_type.is_a?(ActiveRecord::Encryption::EncryptedAttributeType)

        @cast_type = cast_type
        @attribute_name = attribute_name
        @model_name = model_name
      end


      # Take a value from Rails and make it suitable for the database
      def serialize(value)
        if feature_flag_enabled?("encrypt_as_plaintext_#{model_name.downcase}_#{attribute_name.downcase}")
          # Fall back to plaintext (ignore the encryption serializer)
          cast_type.cast_type.serialize(value)
        else
          # Perform encryption via active record encryption serializer
          cast_type.serialize(value)
        end
      end
    end
  end
end
A caveat to this implementation is that we extended from ActiveRecord::Type::Text which extends from ActiveModel::Type:String, which implements changed_in_place? by checking if the new_value is a string, and, if it is, does a string comparison to determine if the value was changed.
We ran into this caveat during our roll out of our new encrypted columns. When migrating a column previously encrypted with our internal encryption library, we found that changed_in_place? would compare the decrypted plaintext value to the encrypted value stored in the database, always marking the record as changed in place as these were never equal. When we migrated one of our fields related to 2FA recovery codes, this had the unexpected side effect of causing them to all appear changed in our audit log logic and created false-alerts in customer facing security logs. Fortunately, though, there was no impact to data and our authentication team annotated the false alerts to indicate this to affected customers.
To address the cause, we delegated the changed_in_place? to the cast_type, which in this case will always be ActiveRecord::Encryption::EncryptedAttributeType that attempts to deserialize the previous value before comparing it to the new value.
Key rotation
ActiveRecord::Encryption accommodates for a list of keys to be used so that the most recent one is used to encrypt records, but all entries in the list will be tried until there is a successful decryption or an ActiveRecord::DecryptionError is raised. On its own, this will ensure that when you add a new key, records that are updated after will automatically be re-encrypted with the new key.
This functionality allows us to reuse our migration strategy (see code sample 5) to re-encrypt all records on a model with the new encryption key. We do this simply by adding a new key and running the migration to re-encrypt.
Example migration strategy
This section will describe a simplified version of our migration process you can replicate in your application. We use a previous encryptor to implement safe plaintext support and the maintanence_tasks gem to backfill the existing records.
Set up ActiveRecord::Encryption and create a previous encryptor
Because this is a simplified example of our own migration strategy, we recommend using a previous encryptor to restrict the “plaintext mode” of ActiveRecord::Encryption to the specific model(s) being migrated.
Set up ActiveRecord::Encryption by generating random key set:
bin/rails db:encryption:init
And adding it to the encrypted Rails.application.credentials using:
bin/rails credentials:edit
If you do not have a master.key, this command will generate one for you. Remember never to commit your master key!
Create a previous encryptor. Remember, when you provide a previous strategy, ActiveRecord::Encryption will use the previous to decrypt and the current (in this case ActiveRecord’s default encryptor) to encrypt the records.
Code sample 3
app/lib/encryption/previous_encryptor.rb

# frozen_string_literal: true

module Encryption
  class PreviousEncryptor
    def encrypt(clear_text, key_provider: nil, cipher_options: {})
        raise NotImplementedError.new("This method should not be called")
    end

    def decrypt(previous_data, key_provider: nil, cipher_options: {})
      # JSON schema validation
        previous_data
    end
  end
end
Add the previous encryptor to the encrypted column
Code sample 4
app/models/secret.rb
class Secret < ApplicationRecord
  encrypts :code, previous: { encryptor: Encryption::PreviousEncryptor.new }
end
The PreviousEncryptor will allow plaintext records to be read as plaintext but will encrypt all new records up until and while the task is running.
Install the Maintenance Tasks gem and create a task
Install the Maintenance Tasks gem per the instructions and you will be ready to create the maintenance task.
In day‐to‐day use, you shouldn’t ever need to call secret.encrypt because ActiveRecord handles the encryption before inserting into the database, but we can use this API in our task:
Code sample 5
app/tasks/maintenance/encrypt_plaintext_secrets_task.rb

# frozen_string_literal: true

module Maintenance
  class EncryptPlaintextSecretsTask < MaintenanceTasks::Task
    def collection
      Secret.all
    end

    def process(element)
      element.encrypt
    end
      …
  end
end
Run the Maintenance Task
Maintenance Tasks provides several options to run the task, but we use the web UI in this example:
Verify your encryption and cleanup
You can verify encryption in Rails console, if you like:
And now you should be able to safely remove your previous encryptor leaving the model of your newly encrypted column looking like this:
Code sample 6
app/models/secret.rb

class Secret < ApplicationRecord
  encrypts :code
end
And so can you!
Encrypting database columns is a valuable extra layer of security that can protect sensitive data during exploits, but it’s not always easy to migrate data in an existing application. We wrote this series in the hope that more organizations will be able to plot a clear path forward to using ActiveRecord::Encryption to start encrypting existing sensitive values.
In October, we experienced four incidents that resulted in significant impact and degraded state of availability to multiple GitHub services. This report also sheds light into an incident that impacted Codespaces in September.
October 26 00:47 UTC (lasting 3 hours and 47 minutes)
Our alerting systems detected an incident that impacted most Codespaces customers. Due to the recency of this incident, we are still investigating the contributing factors and will provide a more detailed update on cause and remediation in the November Availability Report, which we will publish the first Wednesday of December.
October 13 20:43 UTC (lasting 48 minutes)
On October 13, 2022 at 20:43 UTC, our alerting systems detected an increase in the Projects API error response rate. Due to the significant customer impact, we went to status red for Issues at 20:47 UTC. Within 10 minutes of the alert, we traced the cause to a recently-deployed change.
This change introduced a database validation that required a certain value to be present. However, it did not correctly set a default value in every scenario. This resulted in the population of null values in some cases, which produced an error when pulling certain records from the database.
We initiated a roll back of the change at 21:08 UTC. At 21:13 UTC, we began to see a steady decrease in the number of error responses from our APIs back to normal levels, changed the status of Issues to yellow at 21:24 UTC, and changed the status of Issues to green at 21:31 UTC once all metrics were healthy.
Following this incident, we have added mitigations to protect against missing values in the future, and we have improved testing around this particular area. We have also fixed our deployment dashboards, which contained some inaccurate data for pre-production errors. This will ensure that errors are more visible during the deploy process to help us prevent these issues from reaching production.
October 12 23:27 UTC (lasting 3 hours and 31 minutes)
On October 12, 2022 at 22:30 UTC, we rolled out a global configuration change for Codespaces. At 23:15 UTC, after the change had propagated to a variety of regions, we noticed new Codespace creation starting to trend downward and were alerted to issues from our monitors. At 23:27 UTC, we deemed the impact significant enough to status Codespaces yellow, and eventually red, based on continued degradation.
During the incident, it was discovered that one of the older components of the backend system did not cope well with the configuration change, causing a schema conflict. This was not properly tested prior to the rollout. Additionally, this component version does not support gradual exposure across regions—so many regions were impacted at once. Once we detected the issue and determined the configuration change was the cause, we worked to carefully roll back the large schema change. Due to the complexity of the rollback, the procedure took an extended period of time. Once the rollback was complete and metrics tracking new Codespaces creations were healthy, we changed the status of the service back to green at 02:58 UTC.
After analyzing this incident, we determined we can eliminate our dependency on this older configuration type and have repair work in progress to eliminate this type of configuration from Codespaces entirely. We have also verified that all future changes to any component will follow safe deployment practices (one test region followed by individual region rollouts) to avoid global impact in the future.
October 5 06:30 UTC (lasting 31 minutes)
On October 5, 2022 at 06:30 UTC, webhooks experienced a significant backlog of events caused by a high volume of automated user activity causing a rapid series of create and delete operations. This activity triggered a large influx of webhook events. However, many of these events caused exceptions in our webhook delivery worker because data needed to generate their webhook payloads had been deleted from the database. Attempting to retry these failed jobs tied up our worker and it was unable to process new incoming events, resulting in a severe backlog in our queues. Downstream services that rely on webhooks to receive their events were unable to receive them, which resulted in service degradation. We updated GitHub Actions to status red because the webhooks delay caused new job execution to be severely delayed.
Investigation into the source of the automated activity led us to find that there was automation creating and deleting many repositories in quick succession. As a mitigation, we disabled the automated accounts that were causing this activity in order to give us time to find a longer term solution for such activity.
Once the automated accounts were disabled, it brought the webhook deliveries back to normal and the backlog got mitigated at 07:01 UTC. We also updated our webhook delivery workers to not retry any jobs for which it was determined that the data did not exist in the database. Once the fix was put in place, the accounts were re-enabled and no further problems were encountered with our worker. We recognize that our services must be resilient to spikes in load and will make improvements based on what we’ve learned in this incident.
September 28 03:53 UTC (lasting 1 hour and 16 minutes)
On September 27, 2022 at 23:14 UTC, we performed a routine secret rotation procedure on Codespaces. On September 28, 2022 at 03:21 UTC, we received an internal report stating that port forwarding was not working on the Codespaces web client and began investigating. At 03:53 UTC. we statused yellow due to the broad user impact we were observing. Upon investigation, we found that we missed a step in the secret rotation checklist a few hours earlier, which caused some downstream components to fail to pick up the new secret. This resulted in some traffic not reaching backend services as expected. At 04:29 UTC, we ran the missed rotation step, after which we quickly saw the port forwarding feature returning to a healthy state. At this moment, we considered the incident to be mitigated. We investigated why we did not receive automated alerts about this issue and found that our alerts were monitoring error rates but did not alert for lack of overall traffic to the port forwarding backend. We have since improved our monitoring to include anomalies in traffic levels that cover this failure mode.
Several hours later, at 17:18 UTC, our monitors alerted us of an issue in a separate downstream component, which was similarly caused by the previous missed secret rotation step. We could see Codespaces creation and start failures increasing in all regions. The effect from the earlier secret rotation was not immediate because this secret is used in exchange for a token, which is cached for up to 24 hours. Our understanding was that the system would pick up the new secret without intervention, but in reality this secret was picked up only if the process was restarted. At 18:27 UTC, we restarted the service in all regions and could see that the VM pools, which were heavily drained before, started to slowly recover. To accelerate the draining of the backlog of queued jobs we increased the pool size at 18:45 UTC. This helped all but two pools in West Europe, which were still not recovering. At 19:44 UTC, we identified an instance of the service in West Europe that was not rotated along the rest. We rotated that instance and quickly saw a recovery in the affected pools.
After the incident, we identified why multiple downstream components failed to pick up the rotated secret. We then added additional monitoring to identify which secret versions are in use across all components in the service to more easily track and verify secret rotations. To address this short term, we have updated our secret rotation checklist to include the missing steps and added additional verification steps to ensure the new secrets are picked up everywhere. Longer term, we are automating most of our secret rotation processes to avoid human error.
In summary
Please follow our status page for real-time updates on status changes. To learn more about what we’re working on, check out the GitHub Engineering Blog.
You may know that GitHub encrypts your source code at rest, but you may not have known that we also encrypt sensitive database columns in our Ruby on Rails monolith. We do this to provide an additional layer of defense in depth to mitigate concerns, such as:
Reading or tampering with sensitive fields if a database is inappropriately accessed
Accidentally exposing sensitive data in logs
Motivation
Until recently, we used an internal library called Encrypted Attributes. GitHub developers would declare a column should be encrypted using an API that might look familiar if you have used ActiveRecord::Encryption:
class PersonalAccessToken
  encrypted_attribute :encrypted_token, :plaintext_token
end
Given that we had an existing implementation, you may be wondering why we chose to take on the work of converting our columns to ActiveRecord::Encryption. Our main motivation was to ensure that developers did not have to learn a GitHub-specific pattern to encrypt their sensitive data.
We believe strongly that using familiar, intuitive patterns results in better adoption of security tools and, by extension, better security for our users.
In addition to exposing some of the implementation details of the underlying encryption, this API did not provide an easy way for developers to encrypt existing columns. Our internal library required a separate encryption key to be generated and stored in our secure environment variable configuration—for each new database column. This created a bottleneck, as most developers don’t work with encryption every day and needed support from the security team to make changes.
When assessing ActiveRecord::Encryption, we were particularly interested in its ease of use for developers. We wanted a developer to be able to write one line of code, and no matter if their column was previously plaintext or used our previous solution, their column would magically start using ActiveRecord::Encryption. The final API looks something like this:
class PersonalAccessToken
  encrypts :token
end
This API is the exact same as what is used by traditional ActiveRecord::Encryption while hiding all the complexity of making it work at GitHub scale.
How we implemented this
As part of implementing ActiveRecord::Encryptioninto our monolith, we worked with our architecture and infrastructure teams to make sure the solution met GitHub’s scalability and security requirements. Below is a brief list of some of the customizations we made to fit the implementation to our infrastructure.
As always, there are specific nuances that must be considered when modifying existing encryption implementations, and it is always a good practice to review any new cryptography code with a security team.
Diagram 1: Key access and derivation flow for GitHub’s `ActiveRecord::Encryption` implementation
Secure primary key storage
By default, Rails uses its built-in credentials.yml.enc file to securely store the primary key and static salt used for deriving the column encryption key in ActiveRecord::Encryption.
GitHub’s key management strategy for ActiveRecord::Encryption differs from the Rails default in two key ways: deriving a separate key per column and storing the key in our centralized secret management system.
Deriving per-column keys from a single primary key
As explained above, one of the goals of this transition was to no longer bottleneck teams by managing keys manually. We did, however, want to maintain the security properties of separate keys. Thankfully, cryptography experts have created a primitive known as a Key Derivation Function (KDF) for this purpose. These functions take (roughly) three important parameters: the primary key, a unique salt, and a string termed “info” by the spec.
Our salt is simply the table name, an underscore, and the attribute name. So for “PersonalAccessTokens#token” the salt would be “personal_access_tokens_token”. This ensures the key is different per column.
Due to the specifics of the ActiveRecord::Encryption algorithm (AES256-GCM), we need to be careful not to encrypt too many values using the same key (to avoid nonce reuse). We use the “info” string parameter to ensure the key for each column changes automatically at least once per year. Therefore, we can populate the info input with the current year as a nonce during key derivation.
The applications that make up GitHub store secrets in Hashicorp Vault. To conform with this pre-existing pattern, we wanted to pull our primary key from Vault instead of the credentials.yml.enc file. To accommodate for this, we wrote a custom key provider that behaves similarly to the default DerivedSecretKeyProvider, retrieving the key from Vault and deriving the key with our KDF (see Diagram 1).
Making new behavior the default
One of our team’s key principles is that solutions we develop should be intuitive and not require implementation knowledge on the part of the product developer. ActiveRecord::Encryption includes functionality to customize the Encryptor used to encrypt data for a given column. This functionality would allow developers to optionally use the strategies described above, but to make it the default for our monolith we needed to override the encryptsmodel helper to automatically select an appropriate GitHub-specific key provider for the user.
{
def self.encrypts(*attributes, key_provider: nil, previous: nil, **options)
      # snip: ensure only one attribute is passed
# ...

    # pull out the sole attribute
    attribute = attributes.sole

      # snip: ensure if a key provider is passed, that it is a GitHubKeyProvider
      # ...

    # If no key provider is set, instantiate one
    kp = key_provider || GitHub::Encryption::GitHubKeyProvider.new(table: table_name.to_sym, attribute: attribute)

      # snip: logic to ensure previous encryption formats and plaintext are supported for smooth transition (see part 2)
      # github_previous = ...

    # call to rails encryption
    super(attribute, key_provider: kp, previous: github_previous, **options)
end
}
Currently, we only provide this API to developers working on our internal github.com codebase. As we work with the library, we are experimenting with upstreaming this strategy to ActiveRecord::Encryption by replacing the per-class encryption scheme with a per-column encryption scheme.
Turn off compression by default
Compressing values prior to encryption can reveal some information about the content of the value. For example, a value with more repeated bytes, such as “abcabcabc,” will compress better than a string of the same length, such as “abcdefghi”. In addition to the common encryption property that ciphertext generally exposes the length, this exposes additional information about the entropy (randomness) of the underlying plaintext.
ActiveRecord::Encryption compresses data by default for storage efficiency purposes, but since the values we are encrypting are relatively small, we did not feel this tradeoff was worth it for our use case. This is why we replaced the default to compress values before encryption with a flag that makes compression optional.
Migrating to a new encryption standard: the hard parts
This post illustrates some of the design decisions and tradeoffs we encountered when choosing ActiveRecord::Encryption, but it’s not quite enough information to guide developers of existing applications to start encrypting columns. In the next post in this series we’ll show you how we handled the hard parts—how to upgrade existing columns in your application from plaintext or possibly another encryption standard.
The collective thoughts of the interwebz
Manage Consent
To provide the best experiences, we use technologies like cookies to store and/or access device information. Consenting to these technologies will allow us to process data such as browsing behavior or unique IDs on this site. Not consenting or withdrawing consent, may adversely affect certain features and functions.
Functional
Always active
The technical storage or access is strictly necessary for the legitimate purpose of enabling the use of a specific service explicitly requested by the subscriber or user, or for the sole purpose of carrying out the transmission of a communication over an electronic communications network.
Preferences
The technical storage or access is necessary for the legitimate purpose of storing preferences that are not requested by the subscriber or user.
Statistics
The technical storage or access that is used exclusively for statistical purposes.The technical storage or access that is used exclusively for anonymous statistical purposes. Without a subpoena, voluntary compliance on the part of your Internet Service Provider, or additional records from a third party, information stored or retrieved for this purpose alone cannot usually be used to identify you.
Marketing
The technical storage or access is required to create user profiles to send advertising, or to track the user on a website or across several websites for similar marketing purposes.

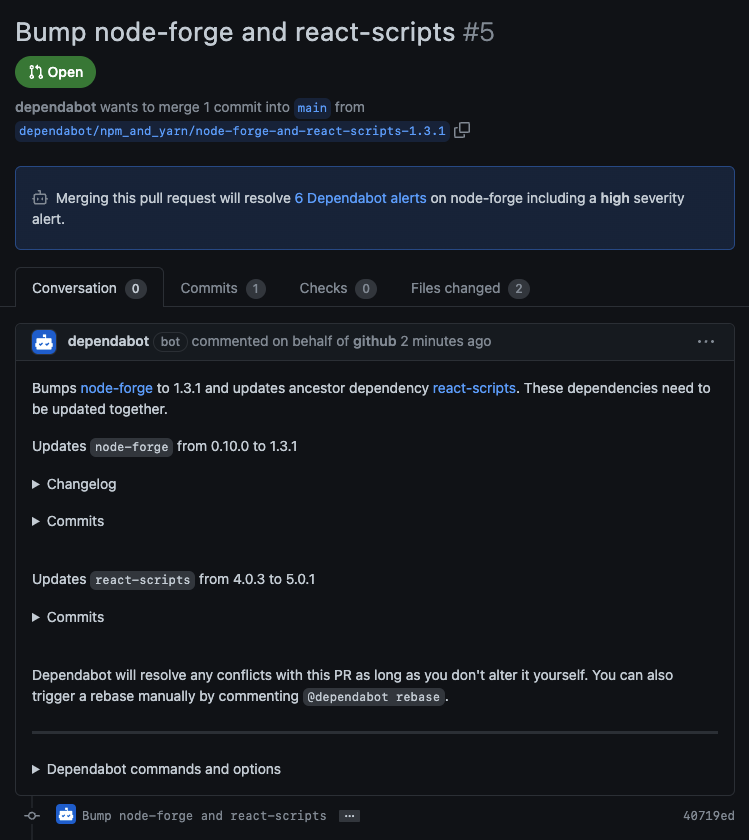

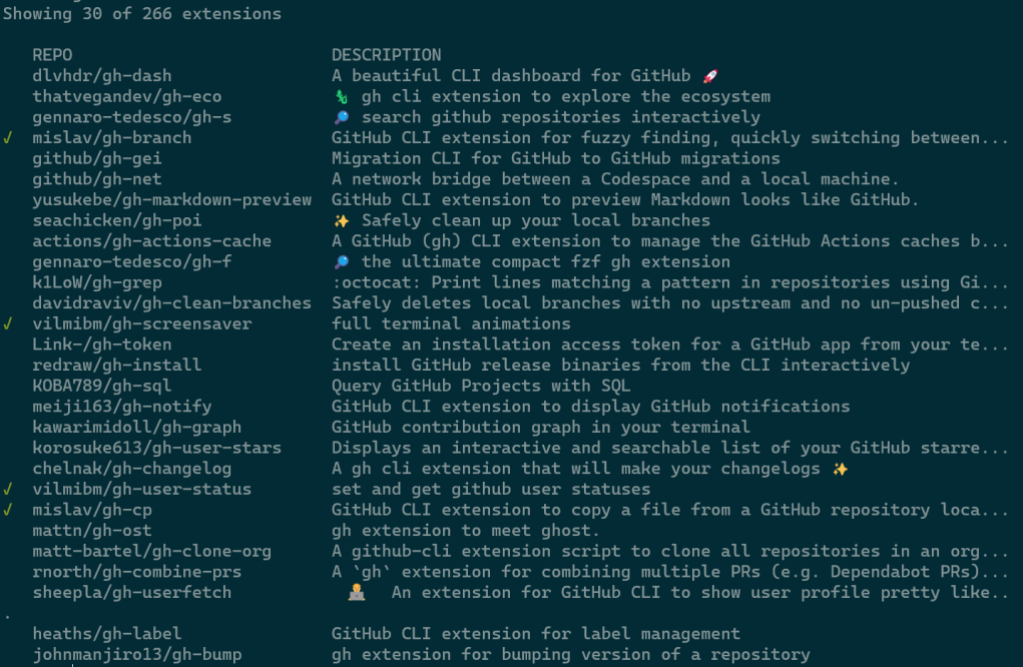
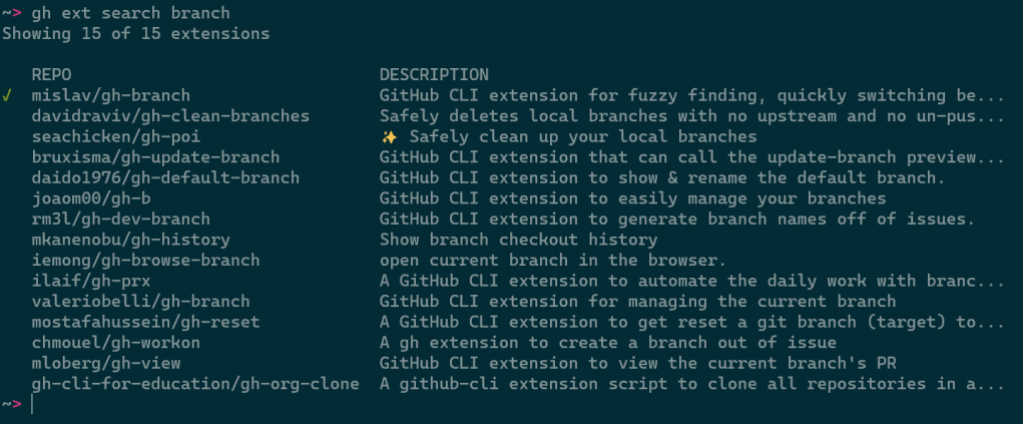
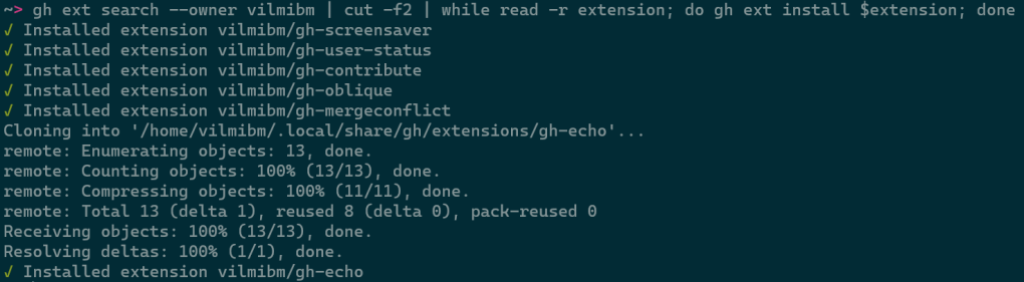

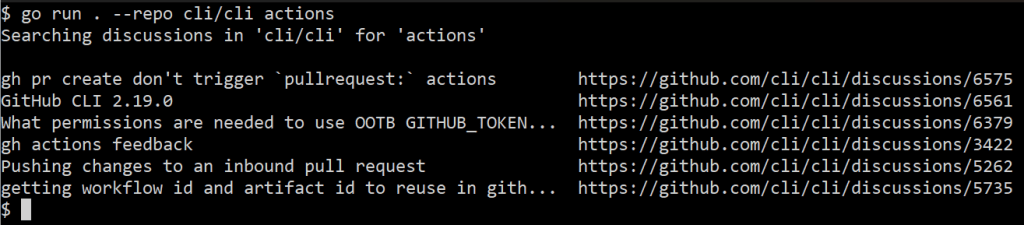
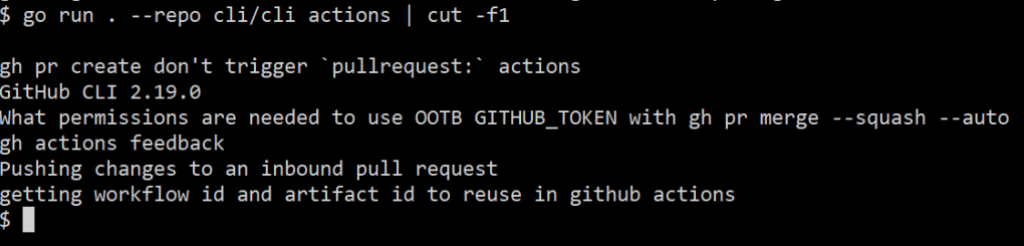
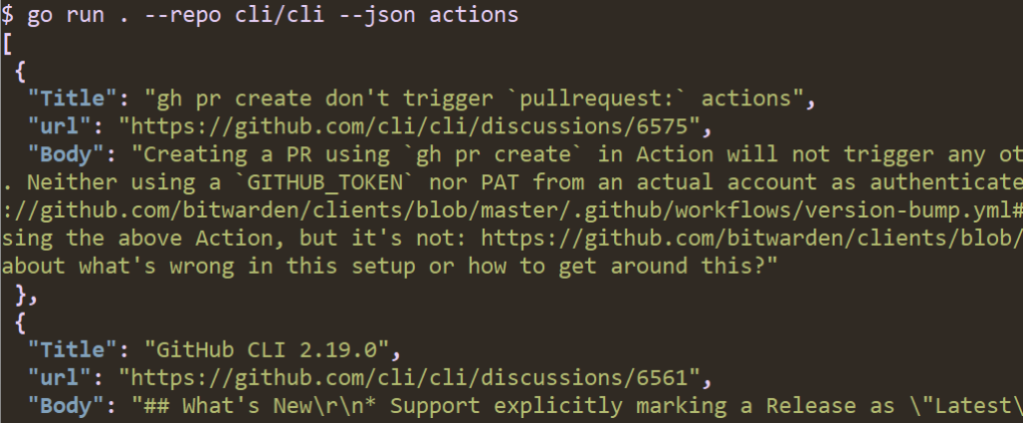
![A screenshot of running "go run . --repo cli/cli --json --jq '.[]|.Title' actions" in a terminal. The output is a list of discussion thread titles.](https://github.blog/wp-content/uploads/2023/01/image6.png?w=1024&resize=1024%2C212)
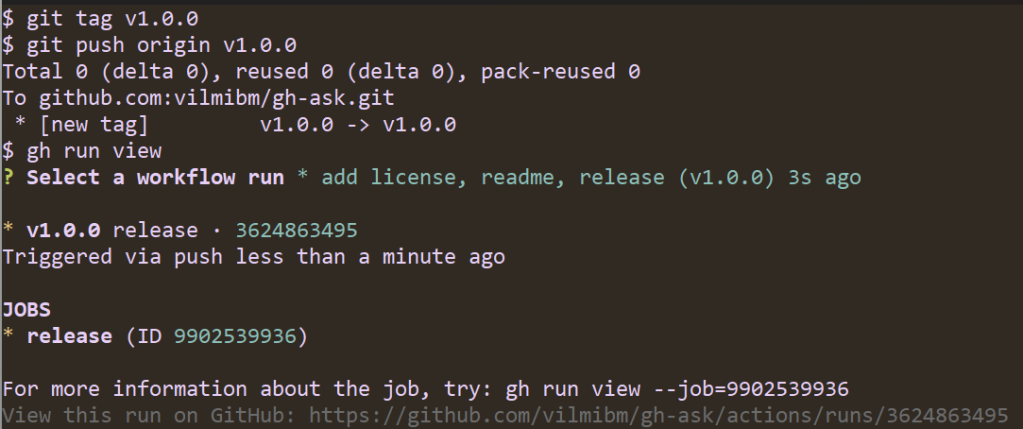
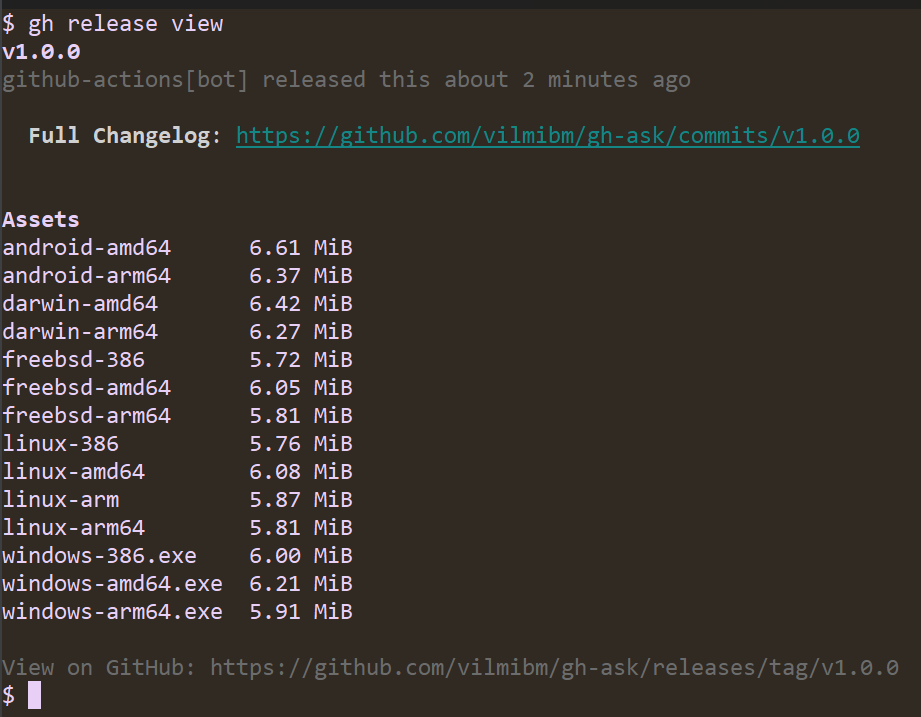
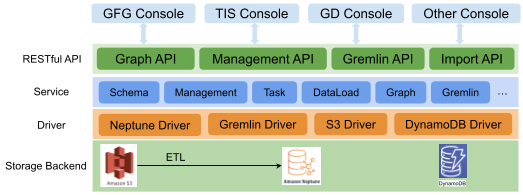
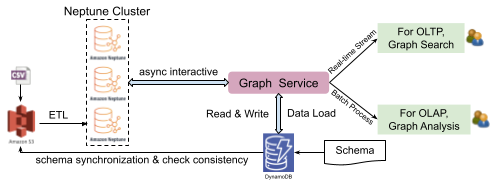
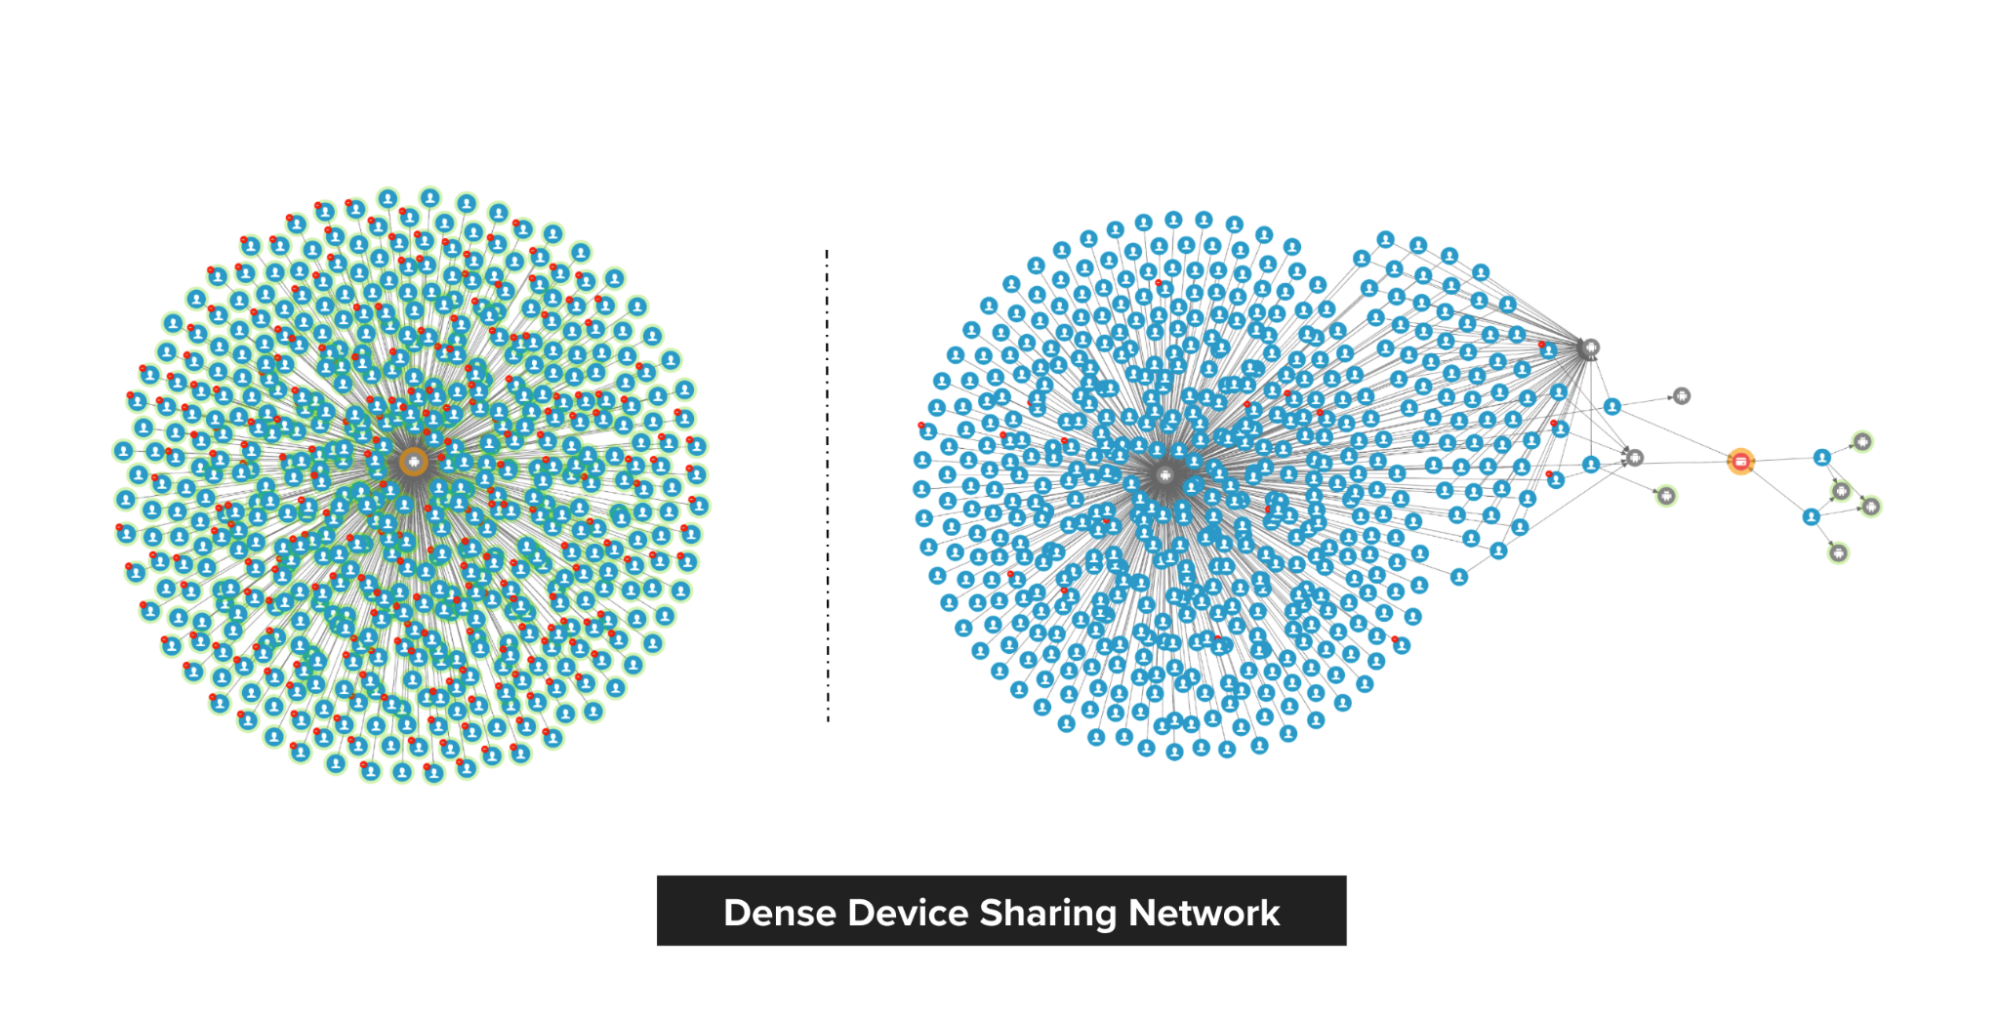
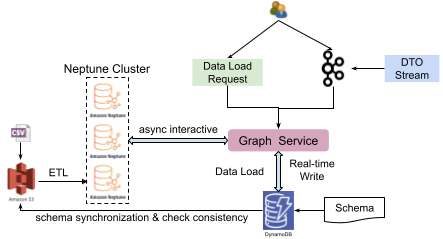
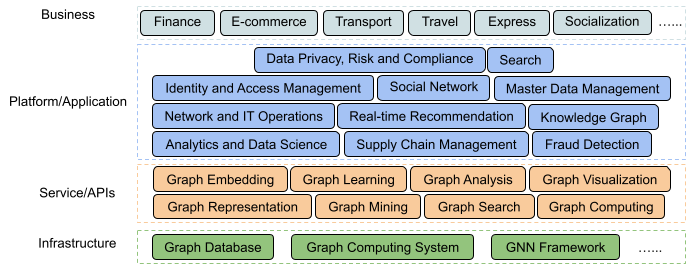


 Michelle Mannering (@MishManners)