Post Syndicated from Peter Bengtsson original https://github.blog/2023-03-09-how-github-docs-new-search-works/
Until recently, the site-search on GitHub Docs was an in-memory solution. While it was a great starting point, we ultimately needed a solution that would scale with our growing needs, so we rewrote it in Elasticsearch. In this blog post, we share how the implementation works and how you can impress users with your site-search by doing the same.
How it started
Our previous solution couldn’t scale because it required loading all of the records into memory (the Node.js code that Express.js runs). This means that we’d need to scrape all the searchable text—title, headings, breadcrumbs, content, etc.—and store that data somewhere so it could quickly be loaded in the Node process runtime. To store the data, we used the Git repository itself, so when we built the Docker image run in Azure, it would have access to all the searchable text from disk.
It would take a little while to load in all the searchable text, so we generated a serialized index from the searchable text, and stored that on disk too. This solution is OKish if your data is small, but we have eight languages and five different versions per language.
Running Elasticsearch locally
The reason we picked Elasticsearch over other alternatives is a story for another day, but one compelling argument is that it’s possible to run it locally on your laptop. For the majority of contributors who make copy edits, the task of installing Elasticsearch locally isn’t necessary. So by default, our /api/search Express.js middleware looks something like this:
if (process.env.ELASTICSEARCH_URL) {
  router.use('/search', search)
} else {
  router.use(
    '/search',
    createProxyMiddleware({
      target: 'https://docs.github.com',
  ...
When someone uses http://localhost:4000/api/search on their laptop (or Codespaces) it simply forwards the Elasticsearch stuff to our production server. That way, engineers (like myself) who are debugging the search engine locally can start an Elasticsearch on http://localhost:9200 and set that in their .env file. Now engineers can quickly try new search query techniques entirely with their own local Elasticsearch.
The search implementation
A core idea in our search implementation is that we make only one single query to Elasticsearch, which contains our entire specification for how we want results ranked. Rather than sending a single request, we could try a more specific search query first, then, if there are too few results, we could attempt a second, less defined search query:
// NOTE! This is NOT what we do.

let result = await client.search({ index, body: searchQueryStrict })
if (result.hits.length === 0) {
  // nothing found when being strict, try again with a loose query
  result = await client.search({ index, body: searchQueryLoose })
}
To ensure we get the most exact results, we use boosts and a matrix of various matching techniques. In somewhat pseudo code it looks like this:
If the query is multiple terms (we’ll explain what _explicit means later):
[
  { match_phrase: { title_explicit: [Object] } },
  { match_phrase: { title: [Object] } },
  { match_phrase: { headings_explicit: [Object] } },
  { match_phrase: { headings: [Object] } },
  { match_phrase: { content: [Object] } },
  { match_phrase: { content_explicit: [Object] } },
  { match: { title_explicit: [Object] } },
  { match: { headings_explicit: [Object] } },
  { match: { content_explicit: [Object] } },
  { match: { title: [Object] } },
  { match: { headings: [Object] } },
  { match: { content: [Object] } },
  { match: { title_explicit: [Object] } },
  { match: { headings_explicit: [Object] } },
  { match: { content_explicit: [Object] } },
  { match: { title: [Object] } },
  { match: { headings: [Object] } },
  { match: { content: [Object] } },
  { fuzzy: { title: [Object] } }
]
If the query is a single term:
[
  { match: { title_explicit: [Object] } },
  { match: { headings_explicit: [Object] } },
  { match: { content_explicit: [Object] } },
  { match: { title: [Object] } },
  { match: { headings: [Object] } },
  { match: { content: [Object] } },
  { fuzzy: { title: [Object] } }
]
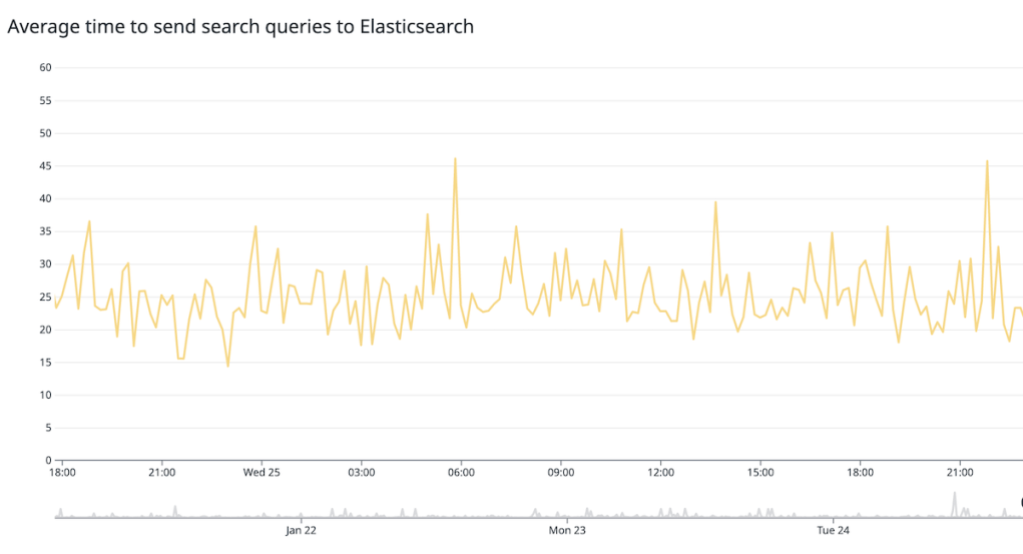
Sure, it can look like a handful of queries, but Elasticsearch is fast. Most of the total time is the network time to send the query and receive the results. In fact, the time it takes to execute the entire search query (excluding the networking) hovers quite steadily at 20 milliseconds on our Elasticsearch server.

About 55% of all searches on docs.github.com are multi-term queries, for example, actions rest. Meaning that in roughly half the cases, we can use the simplified queries because we can omit things like the match_phrase parts of the total query.
Before getting into the various combinations of searches, there’s a section later about what “explicit” means. Essentially, each field is indexed twice. E.g. title and title_explicit. It’s the same content underneath but it’s tokenized differently, which affects how it matches to queries—and that difference is exploited by having different boostings.
The nodes that make up the matrix are:
Fields:
title (the <h1> text)headings (the <h2> texts)content (the bulk of the article text)
Analyzer:
- explicit (no stemming and no synonyms)
- regular (full Snowball stemming and possibly synonyms)
Matches: (on multi-term queries)
match_phrasematch with OR (docs that contain “foo” OR “bar”)match with AND (docs that contain “foo” AND “bar”)
Each of these combinations has a unique boost number, which boosts the ranking of the matched result. The actual number doesn’t matter much, but what matters is that the boost numbers are different from each other. For example, a match on the title has a slightly higher boost than a match on the content. And a match where all words are present has a slightly higher boost than when only some of the words match. Another example: if the search term is docker action, the users would prefer to see “Creating a Docker container action” ahead of “Publishing Docker images” or “Metadata syntax for GitHub Actions.”
Each of the above nodes has a boost calculation that looks something like this:
const BOOST_PHRASE = 10.0
const BOOST_TITLE = 4.0
const BOOST_HEADINGS = 3.0
const BOOST_CONTENT = 1.0
const BOOST_AND = 2.5
const BOOST_EXPLICIT = 3.5

...
match_phrase: { title_explicit: { boost: BOOST_EXPLICIT * BOOST_PHRASE * BOOST_TITLE, query } },
match: { headings: { boost: BOOST_HEADINGS * BOOST_AND, query, operator: 'AND' } },
...
If you exclusively print out what the boost value becomes for each node in the matrix you get:
[
  { match_phrase: { title_explicit: 140 } },
  { match_phrase: { title: 40 } },
  { match_phrase: { headings_explicit: 105 } },
  { match_phrase: { headings: 30 } },
  { match_phrase: { content: 10 } },
  { match_phrase: { content_explicit: 35 } },
  { match: { title_explicit: 35, operator: 'AND' } },
  { match: { headings_explicit: 26.25, operator: 'AND' } },
  { match: { content_explicit: 8.75, operator: 'AND' } },
  { match: { title: 10, operator: 'AND' } },
  { match: { headings: 7.5, operator: 'AND' } },
  { match: { content: 2.5, operator: 'AND' } },
  { match: { title_explicit: 14 } },
  { match: { headings_explicit: 10.5 } },
  { match: { content_explicit: 3.5 } },
  { match: { title: 4 } },
  { match: { headings: 3 } },
  { match: { content: 1 } },
  { fuzzy: { title: 0.1 } }
]
So that’s what we send to Elasticsearch. It’s like a complex wishlist saying, “I want a bicycle for Christmas. But if you have a pink one, even better. And a pink one with blue stripes is even better still. Actually, bestest would be a pink one with blue stripes and a brass bell.”
What’s important, in terms of an ideal implementation and search result for users, is that we use our human and contextual intelligence to define these parameters. Some of it is fairly obvious and some is more subtle. For example, we think a phrase match on the title without the need for stemming is the best possible match, so that gets the highest boost.
Why explicit boost is important
If someone types “creating repositories” it should definitely match a title like “Create a private GitHub repository” because of the stems creating => creat <= create and repositories => repository <= repository. We should definitely include those matches that take stemming into account. But if there’s an article that explicitly uses the words that match what the user typed, like “Creating private GitHub repositories,” then we want to boost that article’s ranking because we think that’s more relevant to the searcher.
Another good example of this is the special keyword working-directory which is an actual exact term that can appear inside the content. If someone searches for working-directory, we don’t want to let an (example) title like “Directories that work” overpower the rankings when working-directory and “Directories that work” are both deconstructed to the same two stems [ 'work', 'directori' ].
The solution we rely on is to make two matches: one with stemming and one without. Each one has a different boost. It’s similar to saying, “I’m looking for a ‘Peter’ but if there’s a ‘Petter’ or ‘Pierre’ or ‘Piotr’ that’ll also do. But ideally, ‘Peter’ first and foremost. In fact, give me all the results, but ‘Peter’ first.” So this is what we do. The stemming is great but it can potentially “overpower” search results. This helps with specific keywords that might appear to be English prose. For example “working-directory” even looks like a regular English expression but it’s actually a hardcoded specific keyword.
In terms of code, it looks like this:
// Creating the index...
await client.indices.create({
  mappings: {
    properties: {
      url: { type: 'keyword' },
      title: { type: 'text', analyzer: 'text_analyzer', norms: false },
      title_explicit: { type: 'text', analyzer: 'text_analyzer_explicit', norms: false },
      content: { type: 'text', analyzer: 'text_analyzer' },
      content_explicit: { type: 'text', analyzer: 'text_analyzer_explicit' },
      // ...snip...
      },
    },
    // ...snip...
  })
// Searching...
matchQueries.push(
  ...[
    { match: { title_explicit: { boost: BOOST_EXPLICIT * BOOST_TITLE, query } } },
    { match: { content_explicit: { boost: BOOST_EXPLICIT * BOOST_CONTENT, query } } },
    { match: { title: { boost: BOOST_TITLE, query } } },
    { match: { content: { boost: BOOST_CONTENT, query } } },
    // ...snip...
])
Ranking is not that easy
Search is quickly becoming an art. It’s not enough to just match the terms and display a list of documents that match the terms of the input. For starters, the ranking is crucially important. This is especially true when a search term yields tens or hundreds of matching documents. Years of depending on Google has taught us all to expect the first search result to be the one we want.
To make this a great experience, we try to infer which document the user is genuinely looking for by using pageview metrics as a way to determine which page is most popular. Sure, if the most popular one is offered first, and gets the clicks, it’ll just get even more popular, but it’s a start. We get a lot of pageviews from users Googling something. But we also get regular pageview metrics from users simply navigating themselves to the pages they have figured out has the best information for them.
At the moment, we gather pageview metrics for the top 1,000 most popular URLs. Then we rank them and normalize it to a number between (and including) 0.0 to 1.0. Whatever the number is we add +1.0 and then we multiply this number in Elasticsearch with the match score.
Suppose a search query finds two documents that match, and their match score is 15.6 and 13.2 based on the search implementation mentioned above. Now, suppose that match of 13.2 is on a popular page, its popularity number might be 0.75, so it becomes 13.2 * (1 + 0.75) = 23.1. And the other one that matched a little bit better, has a popularity number of 0.44, so its final number becomes 15.6 * (1 + 0.44) = 22.5, which is less. In conclusion, it gives documents that might not be term-for-term as “matchy” as others a chance to rise above. This also ensures that a hugely popular document that only matched vaguely in the content won’t “overpower” other matches that might have matched in the title.
It’s a tricky challenge, but that’s what makes it so much fun. You have to bake in some human touch to the code as a way of trying to think like your users. It’s also an algorithm that will never reach perfection because even with more and better metrics, the landscape of users and where they come from, is constantly changing. But we’ll try to keep up.
What’s next?
Elasticsearch has a functionality where you can define aliases for words, which they call synonyms. (For example, repo = repository.) The challenge with this feature is how it’s managed and maintained by writers in a convenient and maintainable way.
Currently at GitHub, we base our popularity numbers by pageview metrics. It would be interesting to dig deeper into which page the user lands on. As an example, suppose the reader isn’t sure how to find what they need, so they start on a product landing page (we have about 20 of those) and slowly make their way deeper into the content and finally arrive on the page that supplied the knowledge or answer they want. This process would give each page an equal measure, and that’s not great.
Another exciting idea is to record all the times a search result URL is not clicked on, especially when it shows up higher in the ranking. That would decrease the risk of popular listings only getting more popular. If you record when something is “corrected” by humans, that could be a very powerful signal.
You could also tailor the underlying search based on other contextual variables. For example, if a user is currently inside the REST API docs you could infer that REST API-related docs are slightly preferred when searching for something ambiguous like “billing” (i.e. prefer REST API “About billing” not Billing and payments “Setting your billing email.”).
What are you looking for next? Have you tried the search on https://docs.github.com recently and found that it wasn’t giving you the best search result? Please let us know and get in touch.


 Let’s hear more from


 Detects when IssueOps commands are used on a pull request.
  Respects your branch protection settings configured for the repository.
 Comments and reacts to your IssueOps commands.
 Deploy locks to prevent multiple deployments from clashing.
 Configurable environment targets.