Tag Archives: serverless

Using the AWS Parameter and Secrets Lambda extension to cache parameters and secrets

Post Syndicated from James Beswick original https://aws.amazon.com/blogs/compute/using-the-aws-parameter-and-secrets-lambda-extension-to-cache-parameters-and-secrets/

This post is written by Pal Patel, Solutions Architect, and Saud ul Khalid, Sr. Cloud Support Engineer.

Serverless applications often rely on AWS Systems Manager Parameter Store or AWS Secrets Manager to store configuration data, encrypted passwords, or connection details for a database or API service.

Previously, you had to make runtime API calls to AWS Parameter Store or AWS Secrets Manager every time you wanted to retrieve a parameter or a secret inside the execution environment of an AWS Lambda function. This involved configuring and initializing the AWS SDK client and managing when to store values in memory to optimize the function duration, and avoid unnecessary latency and cost.

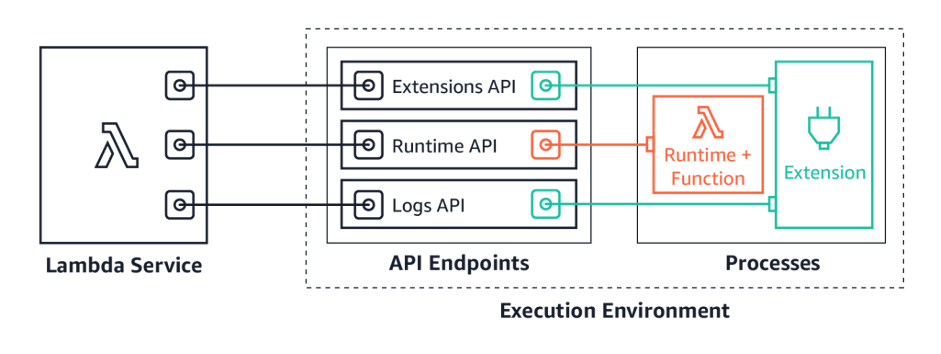
The new AWS Parameters and Secrets Lambda extension provides a managed parameters and secrets cache for Lambda functions. The extension is distributed as a Lambda layer that provides an in-memory cache for parameters and secrets. It allows functions to persist values through the Lambda execution lifecycle, and provides a configurable time-to-live (TTL) setting.

When you request a parameter or secret in your Lambda function code, the extension retrieves the data from the local in-memory cache, if it is available. If the data is not in the cache or it is stale, the extension fetches the requested parameter or secret from the respective service. This helps to reduce external API calls, which can improve application performance and reduce cost. This blog post shows how to use the extension.

Overview

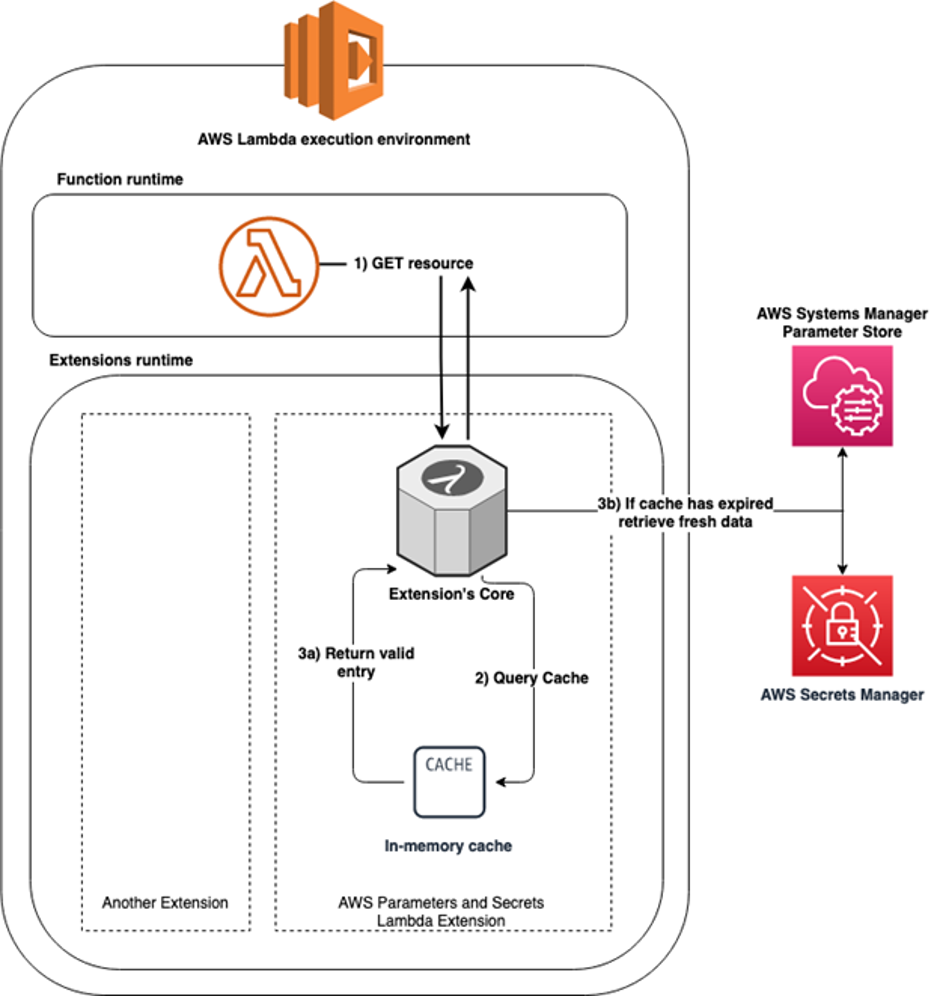
The following diagram provides a high-level view of the components involved.

High-level architecture showing how parameters or secrets are retrieved when using the Lambda extension

The extension can be added to new or existing Lambda. It works by exposing a local HTTP endpoint to the Lambda environment, which provides the in-memory cache for parameters and secrets. When retrieving a parameter or secret, the extension first queries the cache for a relevant entry. If an entry exists, the query checks how much time has elapsed since the entry was first put into the cache, and returns the entry if the elapsed time is less than the configured cache TTL. If the entry is stale, it is invalidated, and fresh data is retrieved from either Parameter Store or Secrets Manager.

The extension uses the same Lambda IAM execution role permissions to access Parameter Store and Secrets Manager, so you must ensure that the IAM policy is configured with the appropriate access. Permissions may also be required for AWS Key Management Service (AWS KMS) if you are using this service. You can find an example policy in the example’s AWS SAM template.

Example walkthrough

Consider a basic serverless application with a Lambda function connecting to an Amazon Relational Database Service (Amazon RDS) database. The application loads a configuration stored in Parameter Store and connects to the database. The database connection string (including user name and password) is stored in Secrets Manager.

This example walkthrough is composed of:

  • A Lambda function.
  • An Amazon Virtual Private Cloud (VPC).
  • Multi-AZ Amazon RDS Instance running MySQL.
  • AWS Secrets Manager database secret that holds database connection.
  • AWS Systems Manager Parameter Store parameter that holds the application configuration.
  • An AWS Identity and Access Management (IAM) role that the Lambda function uses.

Lambda function

This Python code shows how to retrieve the secrets and parameters using the extension

import pymysql
import urllib3
import os
import json

### Load in Lambda environment variables
port = os.environ['PARAMETERS_SECRETS_EXTENSION_HTTP_PORT']
aws_session_token = os.environ['AWS_SESSION_TOKEN']
env = os.environ['ENV']
app_config_path = os.environ['APP_CONFIG_PATH']
creds_path = os.environ['CREDS_PATH']
full_config_path = '/' + env + '/' + app_config_path

### Define function to retrieve values from extension local HTTP server cachce
def retrieve_extension_value(url): 
    http = urllib3.PoolManager()
    url = ('http://localhost:' + port + url)
    headers = { "X-Aws-Parameters-Secrets-Token": os.environ.get('AWS_SESSION_TOKEN') }
    response = http.request("GET", url, headers=headers)
    response = json.loads(response.data)   
    return response  

def lambda_handler(event, context):
       
    ### Load Parameter Store values from extension
    print("Loading AWS Systems Manager Parameter Store values from " + full_config_path)
    parameter_url = ('/systemsmanager/parameters/get/?name=' + full_config_path)
    config_values = retrieve_extension_value(parameter_url)['Parameter']['Value']
    print("Found config values: " + json.dumps(config_values))

    ### Load Secrets Manager values from extension
    print("Loading AWS Secrets Manager values from " + creds_path)
    secrets_url = ('/secretsmanager/get?secretId=' + creds_path)
    secret_string = json.loads(retrieve_extension_value(secrets_url)['SecretString'])
    #print("Found secret values: " + json.dumps(secret_string))

    rds_host =  secret_string['host']
    rds_db_name = secret_string['dbname']
    rds_username = secret_string['username']
    rds_password = secret_string['password']
    
    
    ### Connect to RDS MySQL database
    try:
        conn = pymysql.connect(host=rds_host, user=rds_username, passwd=rds_password, db=rds_db_name, connect_timeout=5)
    except:
        raise Exception("An error occurred when connecting to the database!")

    return "DemoApp sucessfully loaded config " + config_values + " and connected to RDS database " + rds_db_name + "!"

In the global scope the environment variable PARAMETERS_SECRETS_EXTENSION_HTTP_PORT is retrieved, which defines the port the extension HTTP server is running on. This defaults to 2773.

The retrieve_extension_value function calls the extension’s local HTTP server, passing in the X-Aws-Parameters-Secrets-Token as a header. This is a required header that uses the AWS_SESSION_TOKEN value, which is present in the Lambda execution environment by default.

The Lambda handler code uses the extension cache on every Lambda invoke to obtain configuration data from Parameter Store and secret data from Secrets Manager. This data is used to make a connection to the RDS MySQL database.

Prerequisites

  1. Git installed
  2. AWS SAM CLI version 1.58.0 or greater.

Deploying the resources

  1. Clone the repository and navigate to the solution directory:
    git clone https://github.com/aws-samples/parameters-secrets-lambda-extension-
    sample.git


  2. Build and deploy the application using following command:
    sam build
    sam deploy --guided

This template takes the following parameters:

  • pVpcCIDR — IP range (CIDR notation) for the VPC. The default is 172.31.0.0/16.
  • pPublicSubnetCIDR — IP range (CIDR notation) for the public subnet. The default is 172.31.3.0/24.
  • pPrivateSubnetACIDR — IP range (CIDR notation) for the private subnet A. The default is 172.31.2.0/24.
  • pPrivateSubnetBCIDR — IP range (CIDR notation) for the private subnet B, which defaults to 172.31.1.0/24
  • pDatabaseName — Database name for DEV environment, defaults to devDB
  • pDatabaseUsername — Database user name for DEV environment, defaults to myadmin
  • pDBEngineVersion — The version number of the SQL database engine to use (the default is 5.7).

Adding the Parameter Store and Secrets Manager Lambda extension

To add the extension:

  1. Navigate to the Lambda console, and open the Lambda function you created.
  2. In the Function Overview pane. select Layers, and then select Add a layer.
  3. In the Choose a layer pane, keep the default selection of AWS layers and in the dropdown choose AWS Parameters and Secrets Lambda Extension
  4. Select the latest version available and choose Add.

The extension supports several configurable options that can be set up as Lambda environment variables.

This example explicitly sets an extension port and TTL value:

Lambda environment variables from the Lambda console

Testing the example application

To test:

  1. Navigate to the function created in the Lambda console and select the Test tab.
  2. Give the test event a name, keep the default values and then choose Create.
  3. Choose Test. The function runs successfully:

Lambda execution results visible from Lambda console after successful invocation.

To evaluate the performance benefits of the Lambda extension cache, three tests were run using the open source tool Artillery to load test the Lambda function. This can use the Lambda URL to invoke the function. The Artillery configuration snippet shows the duration and requests per second for the test:

config:
  target: "https://lambda.us-east-1.amazonaws.com"
  phases:
    -
      duration: 60
      arrivalRate: 10
      rampTo: 40

scenarios:
  -
    flow:
      -
        post:
          url: "https://abcdefghijjklmnopqrst.lambda-url.us-east-1.on.aws/"
  • Test 1: The extension cache is disabled by setting the TTL environment variable to 0. This results in 1650 GetParameter API calls to Parameter Store over 60 seconds.
  • Test 2: The extension cache is enabled with a TTL of 1 second. This results in 106 GetParameter API calls over 60 seconds.
  • Test 3: The extension is enabled with a TTL value of 300 seconds. This results in only 18 GetParameter API calls over 60 seconds.

In test 3, the TTL value is longer than the test duration. The 18 GetParameter calls correspond to the number of Lambda execution environments created by Lambda to run requests in parallel. Each execution environment has its own in-memory cache and so each one needs to make the GetParameter API call.

In this test, using the extension has reduced API calls by ~98%. Reduced API calls results in reduced function execution time, and therefore reduced cost.

Cleanup

After you test this example, delete the resources created by the template, using following commands from the same project directory to avoid continuing charges to your account.

sam delete

Conclusion

Caching data retrieved from external services is an effective way to improve the performance of your Lambda function and reduce costs. Implementing a caching layer has been made simpler with this AWS-managed Lambda extension.

For more information on the Parameter Store, Secrets Manager, and Lambda extensions, refer to:

For more serverless learning resources, visit Serverless Land.

ICYMI: Developer Week 2022 announcements

Post Syndicated from Dawn Parzych original https://blog.cloudflare.com/icymi-developer-week-2022-announcements/

ICYMI: Developer Week 2022 announcements

ICYMI: Developer Week 2022 announcements

Developer Week 2022 has come to a close. Over the last week we’ve shared with you 31 posts on what you can build on Cloudflare and our vision and roadmap on where we’re headed. We shared product announcements, customer and partner stories, and provided technical deep dives. In case you missed any of the posts here’s a handy recap.

Product and feature announcements

Announcement Summary
Welcome to the Supercloud (and Developer Week 2022) Our vision of the cloud — a model of cloud computing that promises to make developers highly productive at scaling from one to Internet-scale in the most flexible, efficient, and economical way.
Build applications of any size on Cloudflare with the Queues open beta Build performant and resilient distributed applications with Queues. Available to all developers with a paid Workers plan.
Migrate from S3 easily with the R2 Super Slurper A tool to easily and efficiently move objects from your existing storage provider to R2.
Get started with Cloudflare Workers with ready-made templates See what’s possible with Workers and get building faster with these starter templates.
Reduce origin load, save on cloud egress fees, and maximize cache hits with Cache Reserve Cache Reserve is graduating to open beta – users can now test and integrate it into their content delivery strategy without any additional waiting.
Store and process your Cloudflare Logs… with Cloudflare Query Cloudflare logs stored on R2.
UPDATE Supercloud SET status = ‘open alpha’ WHERE product = ‘D1’ D1, our first global relational database, is in open alpha. Start building and share your feedback with us.
Automate an isolated browser instance with just a few lines of code The Browser Rendering API is an out of the box solution to run browser automation tasks with Puppeteer in Workers.
Bringing authentication and identification to Workers through Mutual TLS Send outbound requests with Workers through a mutually authenticated channel.
Spice up your sites on Cloudflare Pages with Pages Functions General Availability Easily add dynamic content to your Pages projects with Functions.
Announcing the first Workers Launchpad cohort and growth of the program to $2 billion We were blown away by the interest in the Workers Launchpad Funding Program and are proud to introduce the first cohort.
The most programmable Supercloud with Cloudflare Snippets Modify traffic routed through the Cloudflare CDN without having to write a Worker.
Keep track of Workers’ code and configuration changes with Deployments Track your changes to a Worker configuration, binding, and code.
Send Cloudflare Workers logs to a destination of your choice with Workers Trace Events Logpush Gain visibility into your Workers when logs are sent to your analytics platform or object storage. Available to all users on a Workers paid plan.
Improved Workers TypeScript support Based on feedback from users we’ve improved our types and are open-sourcing the automatic generation scripts.

Technical deep dives

Announcement Summary
The road to a more standards-compliant Workers API An update on the work the WinterCG is doing on the creation of common API standards in JavaScript runtimes and how Workers is implementing them.
Indexing millions of HTTP requests using Durable Objects
Indexing and querying millions of logs stored in R2 using Workers, Durable Objects, and the Streams API.
Iteration isn’t just for code: here are our latest API docs We’ve revamped our API reference documentation to standardize our API content and improve the overall developer experience when using the Cloudflare APIs.
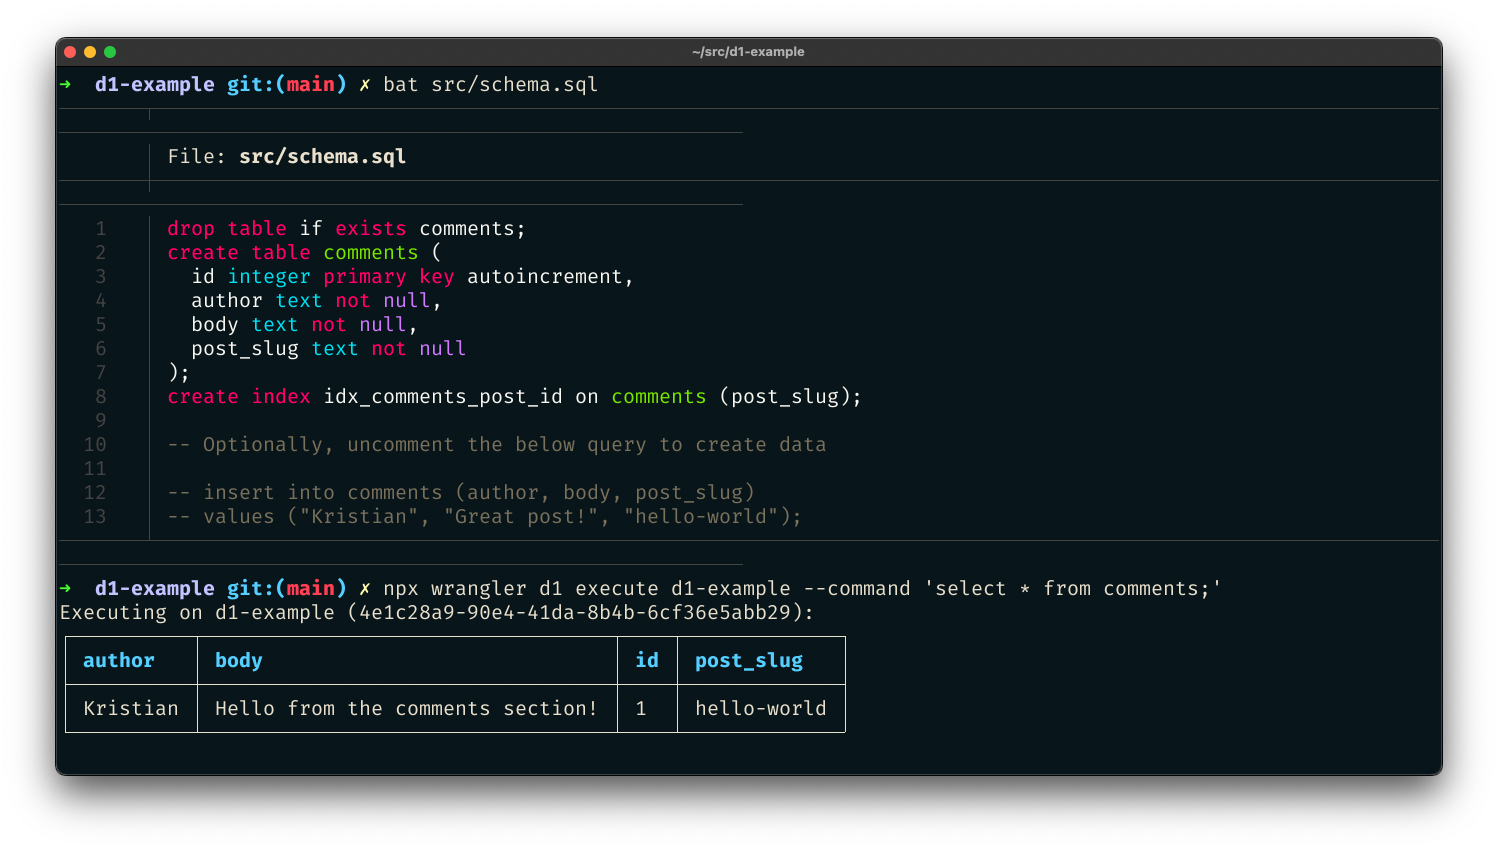
Making static sites dynamic with D1 A template to build a D1-based comments APi.
The Cloudflare API now uses OpenAPI schemas OpenAPI schemas are now available for the Cloudflare API.
Server-side render full stack applications with Pages Functions Run server-side rendering in a Function using a variety of frameworks including Qwik, Astro, and SolidStart.
Incremental adoption of micro-frontends with Cloudflare Workers How to replace selected elements of a legacy client-side rendered application with server-side rendered fragments using Workers.
How we built it: the technology behind Cloudflare Radar 2.0 Details on how we rebuilt Radar using Pages, Remix, Workers, and R2.
How Cloudflare uses Terraform to manage Cloudflare How we made it easier for our developers to make changes with the Cloudflare Terraform provider.
Network performance Update: Developer Week 2022 See how fast Cloudflare Workers are compared to other solutions.
How Cloudflare instruments services using Workers Analytics Engine Instrumentation with Analytics Engine provides data to find bugs and helps us prioritize new features.
Doubling down on local development with Workers:Miniflare meets workerd Improving local development using Miniflare3, now powered by workerd.

Customer and partner stories

Announcement Summary
Cloudflare Workers scale too well and broke our infrastructure, so we are rebuilding it on Workers How DevCycle re-architected their feature management tool using Workers.
Easy Postgres integration with Workers and Neon.tech Neon.tech solves the challenges of connecting to Postgres from Workers
Xata Workers: client-side database access without client-side secrets Xata uses Workers for Platform to reduce security risks of running untrusted code.
Twilio Segment Edge SDK powered by Cloudflare Workers The Segment Edge SDK, built on Workers, helps applications collect and track events from the client, and get access to realtime user state to personalize experiences.

Next

And that’s it for Developer Week 2022. But you can keep the conversation going by joining our Discord Community.

Introducing cross-account access capabilities for AWS Step Functions

Post Syndicated from James Beswick original https://aws.amazon.com/blogs/compute/introducing-cross-account-access-capabilities-for-aws-step-functions/

This post is written by Siarhei Kazhura, Senior Solutions Architect, Serverless.

AWS Step Functions allows you to integrate with more than 220 AWS services by using optimized integrations (for services such as AWS Lambda), and AWS SDK integrations. These capabilities provide the ability to build robust solutions using AWS Step Functions as the engine behind the solution.

Many customers are using multiple AWS accounts for application development. Until today, customers had to rely on resource-based policies to make cross-account access for Step Functions possible. With resource-based policies, you can specify who has access to the resource and what actions they can perform on it.

Not all AWS services support resource-based policies. For example, it is possible to enable cross-account access via resource-based policies with services like AWS Lambda, Amazon SQS, or Amazon SNS. However, services such as Amazon DynamoDB do not support resource-based policies, so your workflows can only use Step Functions’ direct integration if it belongs to the same account.

Now, customers can take advantage of identity-based policies in Step Functions so your workflow can directly invoke resources in other AWS accounts, thus allowing cross-account service API integrations.

Overview

This example demonstrates how to use cross-account capability using two AWS accounts:

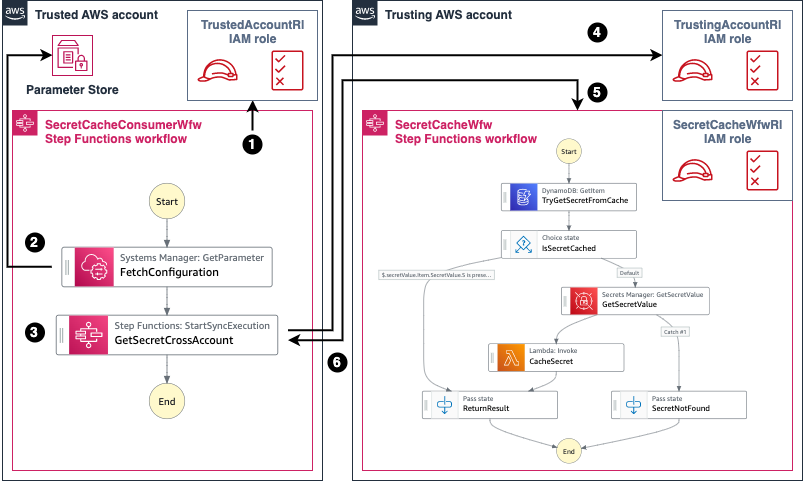
  • A trusted AWS account (account ID 111111111111) with a Step Functions workflow named SecretCacheConsumerWfw, and an IAM role named TrustedAccountRl.
  • A trusting AWS account (account ID 222222222222) with a Step Functions workflow named SecretCacheWfw, and two IAM roles named TrustingAccountRl, and SecretCacheWfwRl.

AWS Step Functions cross-account workflow example

At a high level:

  1. The SecretCacheConsumerWfw workflow runs under TrustedAccountRl role in the account 111111111111. The TrustedAccountRl role has permissions to assume the TrustingAccountRl role from the account 222222222222.
  2. The FetchConfiguration Step Functions task fetches the TrustingAccountRl role ARN, the SecretCacheWfw workflow ARN, and the secret ARN (all these resources belong to the Trusting AWS account).
  3. The GetSecretCrossAccount Step Functions task has a Credentials field with the TrustingAccountRl role ARN specified (fetched in the step 2).
  4. The GetSecretCrossAccount task assumes the TrustingAccountRl role during the SecretCacheConsumerWfw workflow execution.
  5. The SecretCacheWfw workflow (that belongs to the account 222222222222) is invoked by the SecretCacheConsumerWfw workflow under the TrustingAccountRl role.
  6. The results are returned to the SecretCacheConsumerWfw workflow that belongs to the account 111111111111.

The SecretCacheConsumerWfw workflow definition specifies the Credentials field and the RoleArn. This allows the GetSecretCrossAccount step to assume an IAM role that belongs to a separate AWS account:

{
  "StartAt": "FetchConfiguration",
  "States": {
    "FetchConfiguration": {
      "Type": "Task",
      "Next": "GetSecretCrossAccount",
      "Parameters": {
        "Name": "<ConfigurationParameterName>"
      },
      "Resource": "arn:aws:states:::aws-sdk:ssm:getParameter",
      "ResultPath": "$.Configuration",
      "ResultSelector": {
        "Params.$": "States.StringToJson($.Parameter.Value)"
      }
    },
    "GetSecretCrossAccount": {
      "End": true,
      "Type": "Task",
      "ResultSelector": {
        "Secret.$": "States.StringToJson($.Output)"
      },
      "Resource": "arn:aws:states:::aws-sdk:sfn:startSyncExecution",
      "Credentials": {
        "RoleArn.$": "$.Configuration.Params.trustingAccountRoleArn"
      },
      "Parameters": {
        "Input.$": "$.Configuration.Params.secret",
        "StateMachineArn.$": "$.Configuration.Params.trustingAccountWorkflowArn"
      }
    }
  }
}

Permissions

AWS Step Functions cross-account permissions setup example

At a high level:

  1. The TrustedAccountRl role belongs to the account 111111111111.
  2. The TrustingAccountRl role belongs to the account 222222222222.
  3. A trust relationship setup between the TrustedAccountRl and the TrustingAccountRl role.
  4. The SecretCacheConsumerWfw workflow is executed under the TrustedAccountRl role in the account 111111111111.
  5. The SecretCacheWfw is executed under the SecretCacheWfwRl role in the account 222222222222.

The TrustedAccountRl role (1) has the following trust policy setup that allows the SecretCacheConsumerWfw workflow to assume (4) the role.

{
  "RoleName": "<TRUSTED_ACCOUNT_ROLE_NAME>",
  "AssumeRolePolicyDocument": {
    "Version": "2012-10-17",
    "Statement": [
      {
        "Effect": "Allow",
        "Principal": {
          "Service": "states.<REGION>.amazonaws.com"
        },
        "Action": "sts:AssumeRole"
      }
    ]
  }
}

The TrustedAccountRl role (1) has the following permissions configured that allow it to assume (3) the TrustingAccountRl role (2).

{
  "RoleName": "<TRUSTED_ACCOUNT_ROLE_NAME>",
  "PolicyDocument": {
    "Version": "2012-10-17",
    "Statement": [
      {
        "Action": "sts:AssumeRole",
        "Resource":  "arn:aws:iam::<TRUSTING_ACCOUNT>:role/<TRUSTING_ACCOUNT_ROLE_NAME>",
        "Effect": "Allow"
      }
    ]
  }
}

The TrustedAccountRl role (1) has the following permissions setup that allow it to access Parameter Store, a capability of AWS Systems Manager, and fetch the required configuration.

{
  "RoleName": "<TRUSTED_ACCOUNT_ROLE_NAME>",
  "PolicyDocument": {
    "Version": "2012-10-17",
    "Statement": [
      {
        "Action": [
          "ssm:DescribeParameters",
          "ssm:GetParameter",
          "ssm:GetParameterHistory",
          "ssm:GetParameters"
        ],
        "Resource": "arn:aws:ssm:<REGION>:<TRUSTED_ACCOUNT>:parameter/<CONFIGURATION_PARAM_NAME>",
        "Effect": "Allow"
      }
    ]
  }
}

The TrustingAccountRl role (2) has the following trust policy that allows it to be assumed (3) by the TrustedAccountRl role (1). Notice the Condition field setup. This field allows us to further control which account and state machine can assume the TrustingAccountRl role, preventing the confused deputy problem.

{
  "RoleName": "<TRUSTING_ACCOUNT_ROLE_NAME>",
  "AssumeRolePolicyDocument": {
    "Version": "2012-10-17",
    "Statement": [
      {
        "Effect": "Allow",
        "Principal": {
          "AWS": "arn:aws:iam::<TRUSTED_ACCOUNT>:role/<TRUSTED_ACCOUNT_ROLE_NAME>"
        },
        "Action": "sts:AssumeRole",
        "Condition": {
          "StringEquals": {
            "sts:ExternalId": "arn:aws:states:<REGION>:<TRUSTED_ACCOUNT>:stateMachine:<CACHE_CONSUMER_WORKFLOW_NAME>"
          }
        }
      }
    ]
  }
}

The TrustingAccountRl role (2) has the following permissions configured that allow it to start Step Functions Express Workflows execution synchronously. This capability is needed because the SecretCacheWfw workflow is invoked by the SecretCacheConsumerWfw workflow under the TrustingAccountRl role via a StartSyncExecution API call.

{
  "RoleName": "<TRUSTING_ACCOUNT_ROLE_NAME>",
  "PolicyDocument": {
    "Version": "2012-10-17",
    "Statement": [
      {
        "Action": "states:StartSyncExecution",
        "Resource": "arn:aws:states:<REGION>:<TRUSTING_ACCOUNT>:stateMachine:<SECRET_CACHE_WORKFLOW_NAME>",
        "Effect": "Allow"
      }
    ]
  }
}

The SecretCacheWfw workflow is running under a separate identity – the SecretCacheWfwRl role. This role has the permissions that allow it to get secrets from AWS Secrets Manager, read/write to DynamoDB table, and invoke Lambda functions.

{
    "Version": "2012-10-17",
    "Statement": [
        {
            "Action": [
                "secretsmanager:getSecretValue",
            ],
            "Resource": "arn:aws:secretsmanager:<REGION>:<TRUSTING_ACCOUNT>:secret:*",
            "Effect": "Allow"
        },
        {
            "Action": "dynamodb:GetItem",
            "Resource": "arn:aws:dynamodb:<REGION>:<TRUSTING_ACCOUNT>:table/<SECRET_CACHE_DDB_TABLE_NAME>",
            "Effect": "Allow"
        },
        {
            "Action": "lambda:InvokeFunction",
            "Resource": [
"arn:aws:lambda:<REGION>:<TRUSTING_ACCOUNT>:function:<CACHE_SECRET_FUNCTION_NAME>",
"arn:aws:lambda:<REGION>:<TRUSTING_ACCOUNT>:function:<CACHE_SECRET_FUNCTION_NAME>:*"
            ],
            "Effect": "Allow"
        }
    ]
}

Comparing with resource-based policies

To implement the solution above using resource-based policies, you must front the SecretCacheWfw with a resource that supports resource base policies. You can use Lambda for this purpose. A Lambda function has a resource permissions policy that allows for the access by SecretCacheConsumerWfw workflow.

The function proxies the call to the SecretCacheWfw, waits for the workflow to finish (synchronous call), and yields the result back to the SecretCacheConsumerWfw. However, this approach has a few disadvantages:

  • Extra cost: With Lambda you are charged based on the number of requests for your function, and the duration it takes for your code to run.
  • Additional code to maintain: The code must take the payload from the SecretCacheConsumerWfw workflow and pass it to the SecretCacheWfw workflow.
  • No out-of-the-box error handling: The code must handle errors correctly, retry the request in case of a transient error, provide the ability to do exponential backoff, and provide a circuit breaker in case of persistent errors. Error handling capabilities are provided natively by Step Functions.

AWS Step Functions cross-account setup using resource-based policies

The identity-based policy permission solution provides multiple advantages over the resource-based policy permission solution in this case.

However, resource-based policy permissions provide some advantages and can be used in conjunction with identity-based policies. Identity-based policies and resource-based policies are both permissions policies and are evaluated together:

  • Single point of entry: Resource-based policies are attached to a resource. With resource-based permissions policies, you control what identities that do not belong to your AWS account have access to the resource at the resource level. This allows for easier reasoning about what identity has access to the resource. AWS Identity and Access Management Access Analyzer can help with the identity-based policies, providing an ability to identify resources that are shared with an external identity.
  • The principal that accesses a resource via a resource-based policy still works in the trusted account and does not have to give its permissions to receive the cross-account role permissions. In this example, SecretCacheConsumerWfw still runs under TrustedAccountRl role, and does not need to assume an IAM role in the Trusting AWS account to access the Lambda function.

Refer to the how IAM roles differ from resource-based policies article for more information.

Solution walkthrough

To follow the solution walkthrough, visit the solution repository. The walkthrough explains:

  1. Prerequisites required.
  2. Detailed solution deployment walkthrough.
  3. Solution testing.
  4. Cleanup process.
  5. Cost considerations.

Conclusion

This post demonstrates how to create a Step Functions Express Workflow in one account and call it from a Step Functions Standard Workflow in another account using a new credentials capability of AWS Step Functions. It provides an example of a cross-account IAM roles setup that allows for the access. It also provides a walk-through on how to use AWS CDK for TypeScript to deploy the example.

For more serverless learning resources, visit Serverless Land.

Node.js 18.x runtime now available in AWS Lambda

Post Syndicated from James Beswick original https://aws.amazon.com/blogs/compute/node-js-18-x-runtime-now-available-in-aws-lambda/

This post is written by Suraj Tripathi, Cloud Consultant, AppDev.

You can now develop AWS Lambda functions using the Node.js 18 runtime. This version is in active LTS status and considered ready for general use. When creating or updating functions, specify a runtime parameter value of nodejs18.x or use the appropriate container base image to use this new runtime.

This runtime version is supported by functions running on either Arm-based AWS Graviton2 processors or x86-based processors. Using the Graviton2 processor architecture option allows you to get up to 34% better price performance.

This blog post explains the major changes available with the Node.js 18 runtime in Lambda.

AWS SDK for JavaScript upgrade to v3

Lambda’s Node.js runtimes include the AWS SDK for JavaScript. This enables customers to use the AWS SDK to connect to other AWS services from their function code, without having to include the AWS SDK in their function deployment. This is especially useful when creating functions in the AWS Management Console. It’s also useful for Lambda functions deployed as inline code in CloudFormation templates.

Up until Node.js 16, Lambda’s Node.js runtimes have included the AWS SDK for JavaScript version 2. This has since been superseded by the AWS SDK for JavaScript version 3, which was released in December 2020. With this release, Lambda has upgraded the version of the AWS SDK for JavaScript included with the runtime from v2 to v3.

If your existing Lambda functions are using the included SDK v2, then you must update your function code to use the SDK v3 when upgrading to the Node.js 18 runtime. This is the recommended approach when upgrading existing functions to Node.js 18. Alternatively, you can use the Node.js 18 runtime without updating your existing code if you deploy the SDK v2 together with your function code.

Version 3 of the SDK for JavaScript offers many benefits over version 2. Most importantly, it is modular, so your code only loads the modules it needs. Modularity also reduces your function size if you choose to deploy the SDK with your function code rather than using the version built into the Lambda runtime. Learn more about optimizing Node.js dependencies in Lambda here.

For example, for a function interacting with Amazon S3 using the v2 SDK, you import the entire SDK, even though you don’t use most of it:

const AWS = require("aws-sdk");

With the v3 SDK, you only import the modules you need, such as ListBucketsCommand, and a service client like S3Client.

import { S3Client, ListBucketsCommand } from "@aws-sdk/client-s3";

Another difference between SDK v2 and SDK v3 is the default settings for TCP connection re-use. In the SDK v2, connection re-use is disabled by default. In SDK v3, it is enabled by default. In most cases, enabling connection re-use improves function performance. To stop TCP connection reuse, set the AWS_NODEJS_CONNECTION_REUSE_ENABLED environment variable to false. You can also stop keeping the connections alive on a per-service client basis.

For more information, see Why and how you should use AWS SDK for JavaScript (v3) on Node.js 18.

Support for ES module resolution using NODE_PATH

Another change in the Node.js 18 runtime is added support for ES module resolution via the NODE_PATH environment variable.

ES modules are supported by Lambda’s Node.js 14 and Node.js 16 runtimes. They enable top-level await, which can lower cold start latency when used with Provisioned Concurrency. However, by default Node.js does not search the folders in the NODE_PATH environment variable when importing ES modules. This makes it difficult to import ES modules from folders outside of the /var/task/ folder in which the function code is deployed. For example, to load the AWS SDK included in the runtime as an ES module, or to load ES modules from Lambda layers.

The Node.js 18.x runtime for Lambda searches the folders listed in NODE_PATH when loading ES modules. This makes it easier to include the AWS SDK as an ES module or load ES modules from Lambda layers.

Node.js 18 language updates

The Lambda Node.js 18 runtime also enables you to take advantage of new Node.js 18 language features. This includes improved performance for class fields and private class methods, JSON import assertions, and experimental features such as the Fetch API, Test Runner module, and Web Streams API.

JSON import assertion

The import assertions feature allows module import statements to include additional information alongside the module specifier. Now the following code is valid:

// index.mjs

// static import
import fooData from './foo.json' assert { type: 'json' };

// dynamic import
const { default: barData } = await import('./bar.json', { assert: { type: 'json' } });

export const handler = async(event) => {

    console.log(fooData)
    // logs data in foo.json file
    console.log(barData)
    // logs data in bar.json file

    const response = {
        statusCode: 200,
        body: JSON.stringify('Hello from Lambda!'),
    };
    return response;
};

foo.json

{
  "foo1" : "1234",
  "foo2" : "4678"
}

bar.json

{
  "bar1" : "0001",
  "bar2" : "0002"
}

Experimental features

While still experimental, the global fetch API is available by default in Node.js 18. The API includes a fetch function, making fetch polyfills and third-party HTTP packages redundant.

// index.mjs 

export const handler = async(event) => {
    
    const res = await fetch('https://nodejs.org/api/documentation.json');
    if (res.ok) {
      const data = await res.json();
      console.log(data);
    }

    const response = {
        statusCode: 200,
        body: JSON.stringify('Hello from Lambda!'),
    };
    return response;
};

Experimental features in Node.js can be enabled/disabled via the NODE_OPTIONS environment variable. For example, to stop the experimental fetch API you can create a Lambda environment variable NODE_OPTIONS and set the value to --no-experimental-fetch.

With this change, if you run the previous code for the fetch API in your Lambda function, it throws a reference error because the experimental fetch API is now disabled.

Conclusion

Node.js 18 is now supported by Lambda. When building your Lambda functions using the zip archive packaging style, use a runtime parameter value of nodejs18.x to get started building with Node.js 18.

You can also build Lambda functions in Node.js 18 by deploying your function code as a container image using the Node.js 18 AWS base image for Lambda. You may learn more about writing functions in Node.js 18 by reading about the Node.js programming model in the Lambda documentation.

For existing Node.js functions, review your code for compatibility with Node.js 18, including deprecations, then migrate to the new runtime by changing the function’s runtime configuration to nodejs18.x.

For more serverless learning resources, visit Serverless Land.

Introducing attribute-based access controls (ABAC) for Amazon SQS

Post Syndicated from James Beswick original https://aws.amazon.com/blogs/compute/introducing-attribute-based-access-controls-abac-for-amazon-sqs/

This post is written by Vikas Panghal (Principal Product Manager), and Hardik Vasa (Senior Solutions Architect).

Amazon Simple Queue Service (SQS) is a fully managed message queuing service that makes it easier to decouple and scale microservices, distributed systems, and serverless applications. SQS queues enable asynchronous communication between different application components and ensure that each of these components can keep functioning independently without losing data.

Today we’re announcing support for attribute-based access control (ABAC) using queue tags with the SQS service. As an AWS customer, if you use multiple SQS queues to achieve better application decoupling, it is often challenging to manage access to individual queues. In such cases, using tags can enable you to classify these resources in different ways, such as by owner, category, or environment.

This blog post demonstrates how to use tags to allow conditional access to SQS queues. You can use attribute-based access control (ABAC) policies to grant access rights to users through policies that combine attributes together. ABAC can be helpful in rapidly growing environments, where policy management for each individual resource can become cumbersome.

ABAC for SQS is supported in all Regions where SQS is currently available.

Overview

SQS supports tagging of queues. Each tag is a label comprising a customer-defined key and an optional value that can make it easier to manage, search for, and filter resources. Tags allows you to assign metadata to your SQS resources. This can help you track and manage the costs associated with your queues, provide enhanced security in your AWS Identity and Access Management (IAM) policies, and lets you easily filter through thousands of queues.

SQS queue options in the console

The preceding image shows SQS queue in AWS Management Console with two tags – ‘auto-delete’ with value of ‘no’ and ‘environment’ with value of ‘prod’.

Attribute-based access controls (ABAC) is an authorization strategy that defines permissions based on tags attached to users and AWS resources. With ABAC, you can use tags to configure IAM access permissions and policies for your queues. ABAC hence enables you to scale your permissions management easily. You can author a single permissions policy in IAM using tags that you create per business role, and you no longer need to update the policy while adding each new resource.

You can also attach tags to AWS Identity and Access Management (IAM) principals to create an ABAC policy. These ABAC policies can be designed to allow SQS operations when the tag on the IAM user or role making the call matches the SQS queue tag.

ABAC provides granular and flexible access control based on attributes and values, reduces security risk because of misconfigured role-based policy, and easily centralizes auditing and access policy management.

ABAC enables two key use cases:

  1. Tag-based Access Control: You can use tags to control access to your SQS queues, including control plane and data plane API calls.
  2. Tag-on-Create: You can enforce tags during the creation of SQS queues and deny the creation of SQS resources without tags.

Tagging for access control

Let’s take a look at a couple of examples on using tags for access control.

Let’s say that you would want to restrict IAM user to all SQS actions for all queues that include a resource tag with the key environment and the value production. The following IAM policy helps to fulfill the requirement.

{
    "Version": "2012-10-17",
    "Statement": [
        {
            "Sid": "DenyAccessForProd",
            "Effect": "Deny",
            "Action": "sqs:*",
            "Resource": "*",
            "Condition": {
                "StringEquals": {
                    "aws:ResourceTag/environment": "prod"
                }
            }
        }
    ]
}

Now, for instance you need to restrict IAM policy for any operation on resources with a given tag with key environment and value production as an argument within the API call, the following IAM policy helps fulfill the requirements.

{
    "Version": "2012-10-17",
    "Statement": [
        {
            "Sid": "DenyAccessForStageProduction",
            "Effect": "Deny",
            "Action": "sqs:*",
            "Resource": "*",
            "Condition": {
                "StringEquals": {
                    "aws:RequestTag/environment": "production"
                }
            }
        }
    ]
}

Creating IAM user and SQS queue using AWS Management Console

Configuration of the ABAC on SQS resources is a two-step process. The first step is to tag your SQS resources with tags. You can use the AWS API, the AWS CLI, or the AWS Management Console to tag your resources. Once you have tagged the resources, create an IAM policy that allows or denies access to SQS resources based on their tags.

This post reviews the step-by-step process of creating ABAC policies for controlling access to SQS queues.

Create an IAM user

  1. Navigate to the AWS IAM console and choose User from the left navigation pane.
  2. Choose Add Users and provide a name in the User name text box.
  3. Check the Access key – Programmatic access box and choose Next:Permissions.
  4. Choose Next:Tags.
  5. Add tag key as environment and tag value as beta
  6. Select Next:Review and then choose Create user
  7. Copy the access key ID and secret access key and store in a secure location.

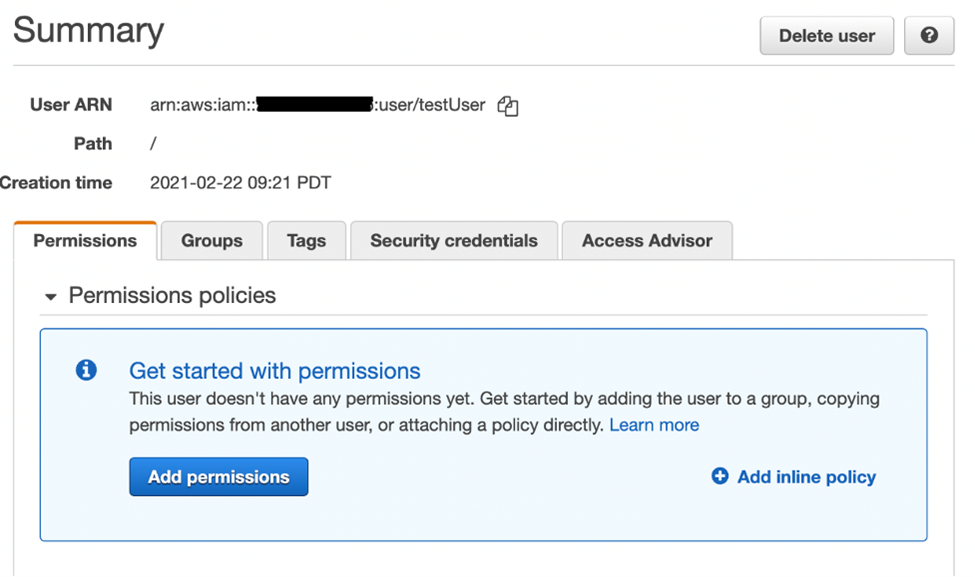
IAM configuration

Add IAM user permissions

  1. Select the IAM user you created.
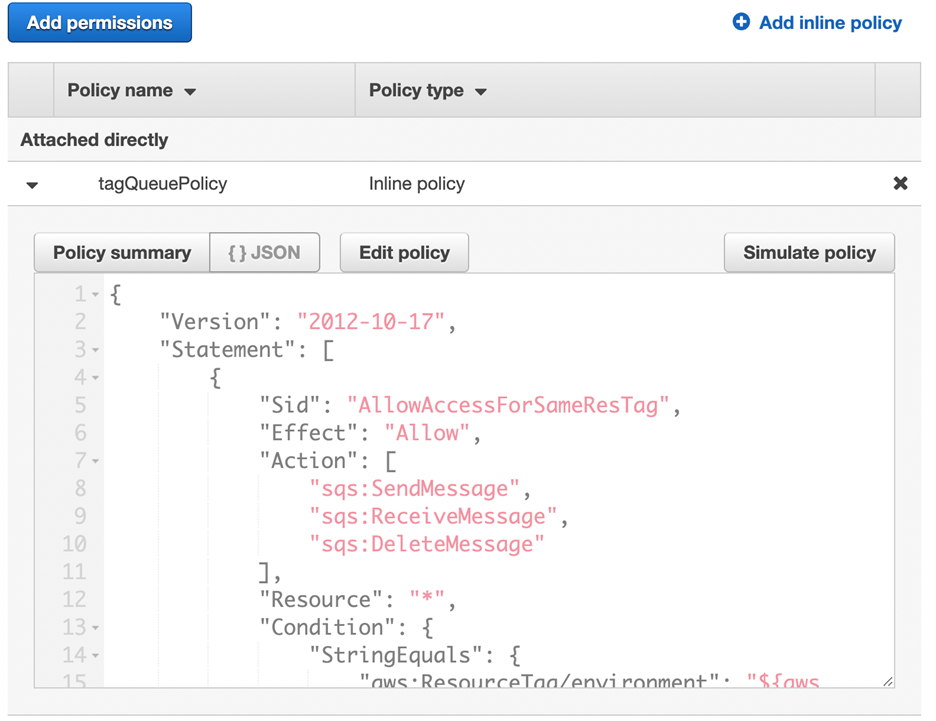
  2. Choose Add inline policy.
  3. In the JSON tab, paste the following policy:
    {
        "Version": "2012-10-17",
        "Statement": [
            {
                "Sid": "AllowAccessForSameResTag",
                "Effect": "Allow",
                "Action": [
                    "sqs:SendMessage",
                    "sqs:ReceiveMessage",
                    "sqs:DeleteMessage"
                ],
                "Resource": "*",
                "Condition": {
                    "StringEquals": {
                        "aws:ResourceTag/environment": "${aws:PrincipalTag/environment}"
                    }
                }
            },
            {
                "Sid": "AllowAccessForSameReqTag",
                "Effect": "Allow",
                "Action": [
                    "sqs:CreateQueue",
                    "sqs:DeleteQueue",
                    "sqs:SetQueueAttributes",
                    "sqs:tagqueue"
                ],
                "Resource": "*",
                "Condition": {
                    "StringEquals": {
                        "aws:RequestTag/environment": "${aws:PrincipalTag/environment}"
                    }
                }
            },
            {
                "Sid": "DenyAccessForProd",
                "Effect": "Deny",
                "Action": "sqs:*",
                "Resource": "*",
                "Condition": {
                    "StringEquals": {
                        "aws:ResourceTag/stage": "prod"
                    }
                }
            }
        ]
    }
    
  4. Choose Review policy.
  5. Choose Create policy.
    Create policy

The preceding permissions policy ensures that the IAM user can call SQS APIs only if the value of the request tag within the API call matches the value of the environment tag on the IAM principal. It also makes sure that the resource tag applied to the SQS queue matches the IAM tag applied on the user.

Creating IAM user and SQS queue using AWS CloudFormation

Here is the sample CloudFormation template to create an IAM user with an inline policy attached and an SQS queue.

AWSTemplateFormatVersion: "2010-09-09"
Description: "CloudFormation template to create IAM user with custom in-line policy"
Resources:
    IAMPolicy:
        Type: "AWS::IAM::Policy"
        Properties:
            PolicyDocument: |
                {
                    "Version": "2012-10-17",
                    "Statement": [
                        {
                            "Sid": "AllowAccessForSameResTag",
                            "Effect": "Allow",
                            "Action": [
                                "sqs:SendMessage",
                                "sqs:ReceiveMessage",
                                "sqs:DeleteMessage"
                            ],
                            "Resource": "*",
                            "Condition": {
                                "StringEquals": {
                                    "aws:ResourceTag/environment": "${aws:PrincipalTag/environment}"
                                }
                            }
                        },
                        {
                            "Sid": "AllowAccessForSameReqTag",
                            "Effect": "Allow",
                            "Action": [
                                "sqs:CreateQueue",
                                "sqs:DeleteQueue",
                                "sqs:SetQueueAttributes",
                                "sqs:tagqueue"
                            ],
                            "Resource": "*",
                            "Condition": {
                                "StringEquals": {
                                    "aws:RequestTag/environment": "${aws:PrincipalTag/environment}"
                                }
                            }
                        },
                        {
                            "Sid": "DenyAccessForProd",
                            "Effect": "Deny",
                            "Action": "sqs:*",
                            "Resource": "*",
                            "Condition": {
                                "StringEquals": {
                                    "aws:ResourceTag/stage": "prod"
                                }
                            }
                        }
                    ]
                }
                
            Users: 
              - "testUser"
            PolicyName: tagQueuePolicy

    IAMUser:
        Type: "AWS::IAM::User"
        Properties:
            Path: "/"
            UserName: "testUser"
            Tags: 
              - 
                Key: "environment"
                Value: "beta"

Testing tag-based access control

Create queue with tag key as environment and tag value as prod

We will use AWS CLI to demonstrate the permission model. If you do not have AWS CLI, you can download and configure it for your machine.

Run this AWS CLI command to create the queue:

aws sqs create-queue --queue-name prodQueue —region us-east-1 —tags "environment=prod"

You receive an AccessDenied error from the SQS endpoint:

An error occurred (AccessDenied) when calling the CreateQueue operation: Access to the resource <queueUrl> is denied.

This is because the tag value on the IAM user does not match the tag passed in the CreateQueue API call. Remember that we applied a tag to the IAM user with key as ‘environment’ and value as ‘beta’.

Create queue with tag key as environment and tag value as beta

aws sqs create-queue --queue-name betaQueue —region us-east-1 —tags "environment=beta"

You see a response similar to the following, which shows the successful creation of the queue.

{
"QueueUrl": "<queueUrl>“
}

Sending message to the queue

aws sqs send-message --queue-url <queueUrl> —message-body testMessage

You will get a successful response from the SQS endpoint. The response will include MD5OfMessageBody and MessageId of the message.

{
"MD5OfMessageBody": "<MD5OfMessageBody>",
"MessageId": "<MessageId>"
}

The response shows successful message delivery to the SQS queue since the IAM user permission allows sending message with queue with tag ‘beta’.

Benefits of attribute-based access controls

The following are benefits of using attribute-based access controls (ABAC) in Amazon SQS:

  • ABAC for SQS requires fewer permissions policies – You do not have to create different policies for different job functions. You can use the resource and request tags that apply to more than one queue. This reduces the operational overhead.
  • Using ABAC, teams can scale quickly – Permissions for new resources are automatically granted based on tags when resources are appropriately tagged upon creation.
  • Use permissions on the IAM principal to restrict resource access – You can create tags for the IAM principal and restrict access to specific action only if it matches the tag on the IAM principal. This helps automate granting of request permissions.
  • Track who is accessing resources – Easily determine the identity of a session by looking at the user attributes in AWS CloudTrail to track user activity in AWS.

Conclusion

In this post, we have seen how Attribute-based access control (ABAC) policies allow you to grant access rights to users through IAM policies based on tags defined on the SQS queues.

ABAC for SQS supports all SQS API actions. Managing the access permissions via tags can save you engineering time creating complex access permissions as your applications and resources grow. With the flexibility of using multiple resource tags in the security policies, the data and compliance teams can now easily set more granular access permissions based on resource attributes.

For additional details on pricing, see Amazon SQS pricing. For additional details on programmatic access to the SQS data protection, see Actions in the Amazon SQS API Reference. For more information on SQS security, see the SQS security public documentation page. To get started with the attribute-based access control for SQS, navigate to the SQS console.

For more serverless learning resources, visit Serverless Land.

Share and publish your Snowflake data to AWS Data Exchange using Amazon Redshift data sharing

Post Syndicated from Raks Khare original https://aws.amazon.com/blogs/big-data/share-and-publish-your-snowflake-data-to-aws-data-exchange-using-amazon-redshift-data-sharing/

Amazon Redshift is a fully managed, petabyte-scale data warehouse service in the cloud. You can start with just a few hundred gigabytes of data and scale to a petabyte or more. Today, tens of thousands of AWS customers—from Fortune 500 companies, startups, and everything in between—use Amazon Redshift to run mission-critical business intelligence (BI) dashboards, analyze real-time streaming data, and run predictive analytics. With the constant increase in generated data, Amazon Redshift customers continue to achieve successes in delivering better service to their end-users, improving their products, and running an efficient and effective business.

In this post, we discuss a customer who is currently using Snowflake to store analytics data. The customer needs to offer this data to clients who are using Amazon Redshift via AWS Data Exchange, the world’s most comprehensive service for third-party datasets. We explain in detail how to implement a fully integrated process that will automatically ingest data from Snowflake into Amazon Redshift and offer it to clients via AWS Data Exchange.

Overview of the solution

The solution consists of four high-level steps:

  1. Configure Snowflake to push the changed data for identified tables into an Amazon Simple Storage Service (Amazon S3) bucket.
  2. Use a custom-built Redshift Auto Loader to load this Amazon S3 landed data to Amazon Redshift.
  3. Merge the data from the change data capture (CDC) S3 staging tables to Amazon Redshift tables.
  4. Use Amazon Redshift data sharing to license the data to customers via AWS Data Exchange as a public or private offering.

The following diagram illustrates this workflow.

Solution Architecture Diagram

Prerequisites

To get started, you need the following prerequisites:

Configure Snowflake to track the changed data and unload it to Amazon S3

In Snowflake, identify the tables that you need to replicate to Amazon Redshift. For the purpose of this demo, we use the data in the TPCH_SF1 schema’s Customer, LineItem, and Orders tables of the SNOWFLAKE_SAMPLE_DATA database, which comes out of the box with your Snowflake account.

  1. Make sure that the Snowflake external stage name unload_to_s3 created in the prerequisites is pointing to the S3 prefix s3-redshift-loader-sourcecreated in the previous step.
  2. Create a new schema BLOG_DEMO in the DEMO_DB database:CREATE SCHEMA demo_db.blog_demo;
  3. Duplicate the Customer, LineItem, and Orders tables in the TPCH_SF1 schema to the BLOG_DEMO schema:
    CREATE TABLE CUSTOMER AS 
    SELECT * FROM snowflake_sample_data.tpch_sf1.CUSTOMER;
    CREATE TABLE ORDERS AS
    SELECT * FROM snowflake_sample_data.tpch_sf1.ORDERS;
    CREATE TABLE LINEITEM AS 
    SELECT * FROM snowflake_sample_data.tpch_sf1.LINEITEM;

  4. Verify that the tables have been duplicated successfully:
    SELECT table_catalog, table_schema, table_name, row_count, bytes
    FROM INFORMATION_SCHEMA.TABLES
    WHERE TABLE_SCHEMA = 'BLOG_DEMO'
    ORDER BY ROW_COUNT;

    unload-step-4

  5. Create table streams to track data manipulation language (DML) changes made to the tables, including inserts, updates, and deletes:
    CREATE OR REPLACE STREAM CUSTOMER_CHECK ON TABLE CUSTOMER;
    CREATE OR REPLACE STREAM ORDERS_CHECK ON TABLE ORDERS;
    CREATE OR REPLACE STREAM LINEITEM_CHECK ON TABLE LINEITEM;

  6. Perform DML changes to the tables (for this post, we run UPDATE on all tables and MERGE on the customer table):
    UPDATE customer 
    SET c_comment = 'Sample comment for blog demo' 
    WHERE c_custkey between 0 and 10; 
    UPDATE orders 
    SET o_comment = 'Sample comment for blog demo' 
    WHERE o_orderkey between 1800001 and 1800010; 
    UPDATE lineitem 
    SET l_comment = 'Sample comment for blog demo' 
    WHERE l_orderkey between 3600001 and 3600010;
    MERGE INTO customer c 
    USING 
    ( 
    SELECT n_nationkey 
    FROM snowflake_sample_data.tpch_sf1.nation s 
    WHERE n_name = 'UNITED STATES') n 
    ON n.n_nationkey = c.c_nationkey 
    WHEN MATCHED THEN UPDATE SET c.c_comment = 'This is US based customer1';

  7. Validate that the stream tables have recorded all changes:
    SELECT * FROM CUSTOMER_CHECK; 
    SELECT * FROM ORDERS_CHECK; 
    SELECT * FROM LINEITEM_CHECK;

    For example, we can query the following customer key value to verify how the events were recorded for the MERGE statement on the customer table:

    SELECT * FROM CUSTOMER_CHECK where c_custkey = 60027;

    We can see the METADATA$ISUPDATE column as TRUE, and we see DELETE followed by INSERT in the METADATA$ACTION column.
    unload-val-step-7

  8. Run the COPY command to offload the CDC from the stream tables to the S3 bucket using the external stage name unload_to_s3.In the following code, we’re also copying the data to S3 folders ending with _stg to ensure that when Redshift Auto Loader automatically creates these tables in Amazon Redshift, they get created and marked as staging tables:
    COPY INTO @unload_to_s3/customer_stg/
    FROM (select *, sysdate() as LAST_UPDATED_TS from demo_db.blog_demo.customer_check)
    FILE_FORMAT = (TYPE = PARQUET)
    OVERWRITE = TRUE HEADER = TRUE;

    COPY INTO @unload_to_s3/customer_stg/
    FROM (select *, sysdate() as LAST_UPDATED_TS from demo_db.blog_demo.customer_check)
    FILE_FORMAT = (TYPE = PARQUET)
    OVERWRITE = TRUE HEADER = TRUE;

    COPY INTO @unload_to_s3/lineitem_stg/ 
    FROM (select *, sysdate() as LAST_UPDATED_TS from demo_db.blog_demo.lineitem_check) 
    FILE_FORMAT = (TYPE = PARQUET) 
    OVERWRITE = TRUE HEADER = TRUE;

  9. Verify the data in the S3 bucket. There will be three sub-folders created in the s3-redshift-loader-source folder of the S3 bucket, and each will have .parquet data files.unload-step-9-valunload-step-9-valYou can also automate the preceding COPY commands using tasks, which can be scheduled to run at a set frequency for automatic copy of CDC data from Snowflake to Amazon S3.
  10. Use the ACCOUNTADMIN role to assign the EXECUTE TASK privilege. In this scenario, we’re assigning the privileges to the SYSADMIN role:
    USE ROLE accountadmin;
    GRANT EXECUTE TASK, EXECUTE MANAGED TASK ON ACCOUNT TO ROLE sysadmin;

  11. Use the SYSADMIN role to create three separate tasks to run three COPY commands every 5 minutes: USE ROLE sysadmin;
    /* Task to offload Customer CDC table */ 
    CREATE TASK sf_rs_customer_cdc 
    WAREHOUSE = SMALL 
    SCHEDULE = 'USING CRON 5 * * * * UTC' 
    AS 
    COPY INTO @unload_to_s3/customer_stg/ 
    FROM (select *, sysdate() as LAST_UPDATED_TS from demo_db.blog_demo.customer_check) 
    FILE_FORMAT = (TYPE = PARQUET) 
    OVERWRITE = TRUE 
    HEADER = TRUE;
    /*Task to offload Orders CDC table */ 
    CREATE TASK sf_rs_orders_cdc 
    WAREHOUSE = SMALL 
    SCHEDULE = 'USING CRON 5 * * * * UTC' 
    AS 
    COPY INTO @unload_to_s3/orders_stg/ 
    FROM (select *, sysdate() as LAST_UPDATED_TS from demo_db.blog_demo.orders_check)
    FILE_FORMAT = (TYPE = PARQUET)
    OVERWRITE = TRUE HEADER = TRUE;

    /* Task to offload Lineitem CDC table */ 
    CREATE TASK sf_rs_lineitem_cdc 
    WAREHOUSE = SMALL 
    SCHEDULE = 'USING CRON 5 * * * * UTC' 
    AS 
    COPY INTO @unload_to_s3/lineitem_stg/ 
    FROM (select *, sysdate() as LAST_UPDATED_TS from demo_db.blog_demo.lineitem_check)
    FILE_FORMAT = (TYPE = PARQUET)
    OVERWRITE = TRUE HEADER = TRUE;

    When the tasks are first created, they’re in a SUSPENDED state.

  12. Alter the three tasks and set them to RESUME state:
    ALTER TASK sf_rs_customer_cdc RESUME;
    ALTER TASK sf_rs_orders_cdc RESUME;
    ALTER TASK sf_rs_lineitem_cdc RESUME;

  13. Validate that all three tasks have been resumed successfully: SHOW TASKS;unload-setp-13-valNow the tasks will run every 5 minutes and look for new data in the stream tables to offload to Amazon S3.As soon as data is migrated from Snowflake to Amazon S3, Redshift Auto Loader automatically infers the schema and instantly creates corresponding tables in Amazon Redshift. Then, by default, it starts loading data from Amazon S3 to Amazon Redshift every 5 minutes. You can also change the default setting of 5 minutes.
  14. On the Amazon Redshift console, launch the query editor v2 and connect to your Amazon Redshift cluster.
  15. Browse to the dev database, public schema, and expand Tables.
    You can see three staging tables created with the same name as the corresponding folders in Amazon S3.
  16. Validate the data in one of the tables by running the following query:SELECT * FROM "dev"."public"."customer_stg";unload-step-16-val

Configure the Redshift Auto Loader utility

The Redshift Auto Loader makes data ingestion to Amazon Redshift significantly easier because it automatically loads data files from Amazon S3 to Amazon Redshift. The files are mapped to the respective tables by simply dropping files into preconfigured locations on Amazon S3. For more details about the architecture and internal workflow, refer to the GitHub repo.

We use an AWS CloudFormation template to set up Redshift Auto Loader. Complete the following steps:

  1. Launch the CloudFormation template.
  2. Choose Next.
    autoloader-step-2
  3. For Stack name, enter a name.
  4. Provide the parameters listed in the following table.

    CloudFormation Template Parameter Allowed Values Description
    RedshiftClusterIdentifier Amazon Redshift cluster identifier Enter the Amazon Redshift cluster identifier.
    DatabaseUserName Database user name in the Amazon Redshift cluster The Amazon Redshift database user name that has access to run the SQL script.
    DatabaseName S3 bucket name The name of the Amazon Redshift primary database where the SQL script is run.
    DatabaseSchemaName Database name in Amazon Redshift The Amazon Redshift schema name where the tables are created.
    RedshiftIAMRoleARN Default or the valid IAM role ARN attached to the Amazon Redshift cluster The IAM role ARN associated with the Amazon Redshift cluster. Your default IAM role is set for the cluster and has access to your S3 bucket, leave it at the default.
    CopyCommandOptions Copy option; default is delimiter ‘|’ gzip

    Provide the additional COPY command data format parameters.

    If InitiateSchemaDetection = Yes, then the process attempts to detect the schema and automatically set the suitable copy command options.

    In the event of failure on schema detection or when InitiateSchemaDetection = No, then this value is used as the default COPY command options to load data.

    SourceS3Bucket S3 bucket name The S3 bucket where the data is stored. Make sure the IAM role that is associated to the Amazon Redshift cluster has access to this bucket.
    InitiateSchemaDetection Yes/No

    Set to Yes to dynamically detect the schema prior to file load and create a table in Amazon Redshift if it doesn’t exist already. If a table already exists, then it won’t drop or recreate the table in Amazon Redshift.

    If schema detection fails, the process uses the default COPY options as specified in CopyCommandOptions.

    The Redshift Auto Loader uses the COPY command to load data into Amazon Redshift. For this post, set CopyCommandOptions as follows, and configure any supported COPY command options:

    delimiter '|' dateformat 'auto' TIMEFORMAT 'auto'

    autoloader-input-parameters

  5. Choose Next.
  6. Accept the default values on the next page and choose Next.
  7. Select the acknowledgement check box and choose Create stack.
    autoloader-step-7
  8. Monitor the progress of the Stack creation and wait until it is complete.
  9. To verify the Redshift Auto Loader configuration, sign in to the Amazon S3 console and navigate to the S3 bucket you provided.
    You should see a new directory s3-redshift-loader-source is created.
    autoloader-step-9

Copy all the data files exported from Snowflake under s3-redshift-loader-source.

Merge the data from the CDC S3 staging tables to Amazon Redshift tables

To merge your data from Amazon S3 to Amazon Redshift, complete the following steps:

  1. Create a temporary staging table merge_stg and insert all the rows from the S3 staging table that have metadata_action as INSERT, using the following code. This includes all the new inserts as well as the update.
    CREATE TEMP TABLE merge_stg 
    AS
    SELECT * FROM
    (
    SELECT *, DENSE_RANK() OVER (PARTITION BY c_custkey ORDER BY last_updated_ts DESC
    ) AS rnk
    FROM customer_stg WHERE rnk = 1 AND metadata$action = 'INSERT'

    The preceding code uses a window function DENSE_RANK() to select the latest entries for a given c_custkey by assigning a rank to each row for a given c_custkey and arrange the data in descending order using last_updated_ts. We then select the rows with rnk=1 and metadata$action = ‘INSERT’ to capture all the inserts.

  2. Use the S3 staging table customer_stg to delete the records from the base table customer, which are marked as deletes or updates:
    DELETE FROM customer 
    USING customer_stg 
    WHERE customer.c_custkey = customer_stg.c_custkey;

    This deletes all the rows that are present in the CDC S3 staging table, which takes care of rows marked for deletion and updates.

  3. Use the temporary staging table merge_stg to insert the records marked for updates or inserts:
    INSERT INTO customer 
    SELECT c_custkey, c_name, c_address, c_nationkey, c_phone, c_acctbal, c_mktsegment, c_comment 
    FROM merge_stg;

  4. Truncate the staging table, because we have already updated the target table:truncate customer_stg;
  5. You can also run the preceding steps as a stored procedure:
    CREATE OR REPLACE PROCEDURE merge_customer()
    AS $$
    BEGIN
    /*CREATING TEMP TABLE TO GET THE MOST LATEST RECORDS FOR UPDATES/NEW INSERTS*/
    CREATE TEMP TABLE merge_stg AS
    SELECT * FROM
    (
    SELECT *, DENSE_RANK() OVER (PARTITION BY c_custkey ORDER BY last_updated_ts DESC ) AS rnk
    FROM customer_stg
    )
    WHERE rnk = 1 AND metadata$action = 'INSERT';
    /* DELETING FROM THE BASE TABLE USING THE CDC STAGING TABLE ALL THE RECORDS MARKED AS DELETES OR UPDATES*/
    DELETE FROM customer
    USING customer_stg
    WHERE customer.c_custkey = customer_stg.c_custkey;
    /*INSERTING NEW/UPDATED RECORDS IN THE BASE TABLE*/ 
    INSERT INTO customer
    SELECT c_custkey, c_name, c_address, c_nationkey, c_phone, c_acctbal, c_mktsegment, c_comment
    FROM merge_stg;
    truncate customer_stg;
    END;
    $$ LANGUAGE plpgsql;

    For example, let’s look at the before and after states of the customer table when there’s been a change in data for a particular customer.

    The following screenshot shows the new changes recorded in the customer_stg table for c_custkey = 74360.
    merge-process-new-changes
    We can see two records for a customer with c_custkey=74360 one with metadata$action as DELETE and one with metadata$action as INSERT. That means the record with c_custkey was updated at the source and these changes need to be applied to the target customer table in Amazon Redshift.

    The following screenshot shows the current state of the customer table before these changes have been merged using the preceding stored procedure:
    merge-process-current-state

  6. Now, to update the target table, we can run the stored procedure as follows: CALL merge_customer()The following screenshot shows the final state of the target table after the stored procedure is complete.
    merge-process-after-sp

Run the stored procedure on a schedule

You can also run the stored procedure on a schedule via Amazon EventBridge. The scheduling steps are as follows:

  1. On the EventBridge console, choose Create rule.
    sp-schedule-1
  2. For Name, enter a meaningful name, for example, Trigger-Snowflake-Redshift-CDC-Merge.
  3. For Event bus, choose default.
  4. For Rule Type, select Schedule.
  5. Choose Next.
    sp-schedule-step-5
  6. For Schedule pattern, select A schedule that runs at a regular rate, such as every 10 minutes.
  7. For Rate expression, enter Value as 5 and choose Unit as Minutes.
  8. Choose Next.
    sp-schedule-step-8
  9. For Target types, choose AWS service.
  10. For Select a Target, choose Redshift cluster.
  11. For Cluster, choose the Amazon Redshift cluster identifier.
  12. For Database name, choose dev.
  13. For Database user, enter a user name with access to run the stored procedure. It uses temporary credentials to authenticate.
  14. Optionally, you can also use AWS Secrets Manager for authentication.
  15. For SQL statement, enter CALL merge_customer().
  16. For Execution role, select Create a new role for this specific resource.
  17. Choose Next.
    sp-schedule-step-17
  18. Review the rule parameters and choose Create rule.

After the rule has been created, it automatically triggers the stored procedure in Amazon Redshift every 5 minutes to merge the CDC data into the target table.

Configure Amazon Redshift to share the identified data with AWS Data Exchange

Now that you have the data stored inside Amazon Redshift, you can publish it to customers using AWS Data Exchange.

  1. In Amazon Redshift, using any query editor, create the data share and add the tables to be shared:
    CREATE DATASHARE salesshare MANAGEDBY ADX;
    ALTER DATASHARE salesshare ADD SCHEMA tpch_sf1;
    ALTER DATASHARE salesshare ADD TABLE tpch_sf1.customer;

    ADX-step1

  2. On the AWS Data Exchange console, create your dataset.
  3. Select Amazon Redshift datashare.
    ADX-step3-create-datashare
  4. Create a revision in the dataset.
    ADX-step4-create-revision
  5. Add assets to the revision (in this case, the Amazon Redshift data share).
    ADX-addassets
  6. Finalize the revision.
    ADX-step-6-finalizerevision

After you create the dataset, you can publish it to the public catalog or directly to customers as a private product. For instructions on how to create and publish products, refer to NEW – AWS Data Exchange for Amazon Redshift

Clean up

To avoid incurring future charges, complete the following steps:

  1. Delete the CloudFormation stack used to create the Redshift Auto Loader.
  2. Delete the Amazon Redshift cluster created for this demonstration.
  3. If you were using an existing cluster, drop the created external table and external schema.
  4. Delete the S3 bucket you created.
  5. Delete the Snowflake objects you created.

Conclusion

In this post, we demonstrated how you can set up a fully integrated process that continuously replicates data from Snowflake to Amazon Redshift and then uses Amazon Redshift to offer data to downstream clients over AWS Data Exchange. You can use the same architecture for other purposes, such as sharing data with other Amazon Redshift clusters within the same account, cross-accounts, or even cross-Regions if needed.


About the Authors

Raks KhareRaks Khare is an Analytics Specialist Solutions Architect at AWS based out of Pennsylvania. He helps customers architect data analytics solutions at scale on the AWS platform.

Ekta Ahuja is a Senior Analytics Specialist Solutions Architect at AWS. She is passionate about helping customers build scalable and robust data and analytics solutions. Before AWS, she worked in several different data engineering and analytics roles. Outside of work, she enjoys baking, traveling, and board games.

Tahir Aziz is an Analytics Solution Architect at AWS. He has worked with building data warehouses and big data solutions for over 13 years. He loves to help customers design end-to-end analytics solutions on AWS. Outside of work, he enjoys traveling
and cooking.

Ahmed Shehata is a Senior Analytics Specialist Solutions Architect at AWS based on Toronto. He has more than two decades of experience helping customers modernize their data platforms, Ahmed is passionate about helping customers build efficient, performant and scalable Analytic solutions.

Keep track of Workers’ code and configuration changes with Deployments

Post Syndicated from Kabir Sikand original https://blog.cloudflare.com/deployments-for-workers/

Keep track of Workers’ code and configuration changes with Deployments

Keep track of Workers’ code and configuration changes with Deployments

Today we’re happy to introduce Deployments for Workers. Deployments allow developers to keep track of changes to their Worker; not just the code, but the configuration and bindings as well. With deployments, developers now have access to a powerful audit log of changes to their production applications.

And tracking changes is just the beginning! Deployments provide a strong foundation to add: automated deployments, rollbacks, and integration with version control.

Today we’ll dive into the details of deployments, how you can use them, and what we’re thinking about next.

Deployments

Deployments are a powerful new way to track changes to your Workers. With them, you can track who’s making changes to your Workers, where those changes are coming from, and when those changes are being made.

Keep track of Workers’ code and configuration changes with Deployments

Cloudflare reports on deployments made from wrangler, API, dashboard, or Terraform anytime you make changes to your Worker’s code, edit resource bindings and environment variables, or modify configuration like name or usage model.

Keep track of Workers’ code and configuration changes with Deployments

We expose the source of your deployments, so you can track where changes are coming from. For example, if you have a CI job that’s responsible for changes, and you see a user made a change through the Cloudflare dashboard, it’s easy to flag that and dig into whether the deployment was a mistake.

Interacting with deployments

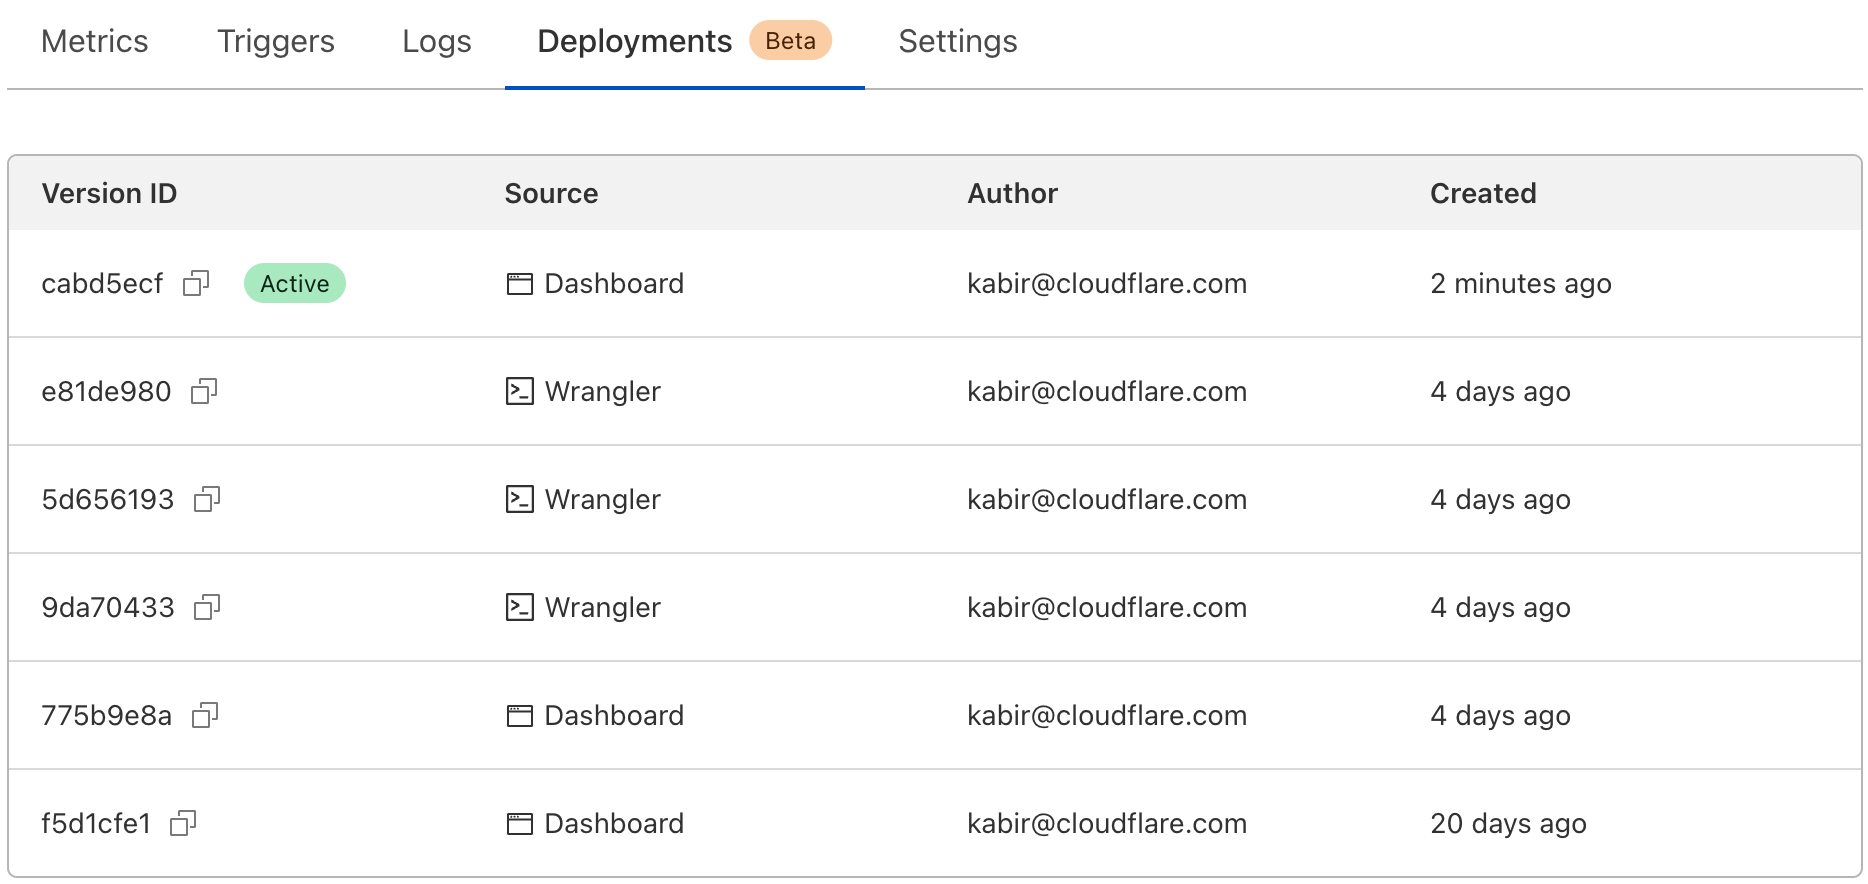
Cloudflare tracks the authors, sources, and timestamps of deployments. If you have a set of users responsible for deployment, or an API Token that’s associated with your CI tool, it’s easy to see which made recent deployments. Each deployment also includes a timestamp, so you can track when those changes were made.

Keep track of Workers’ code and configuration changes with Deployments

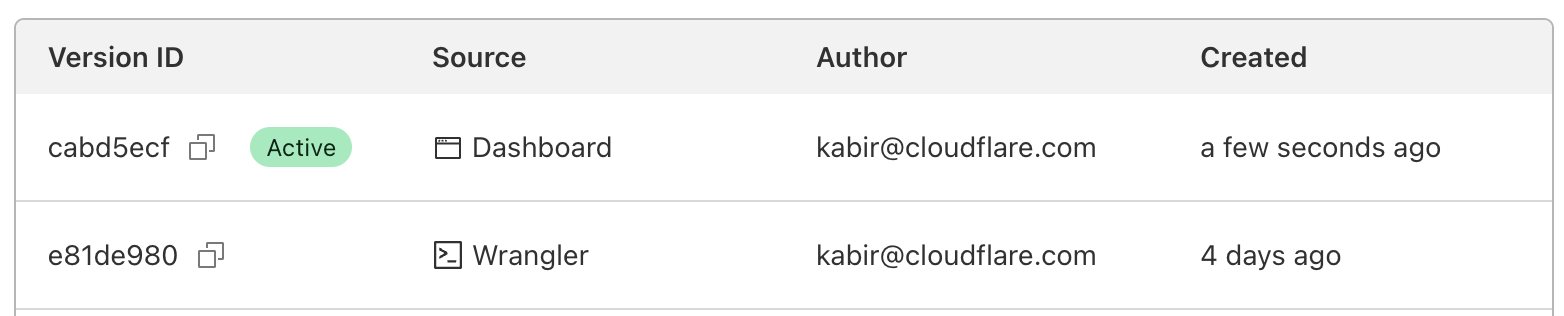
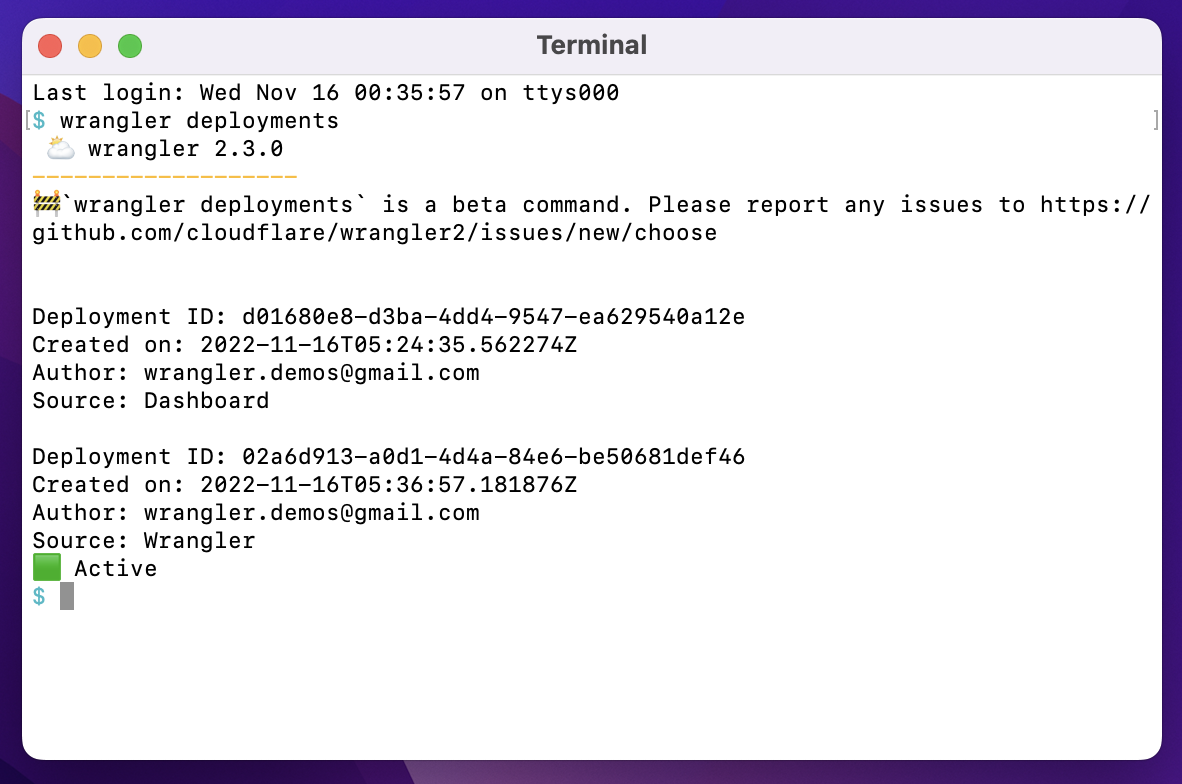
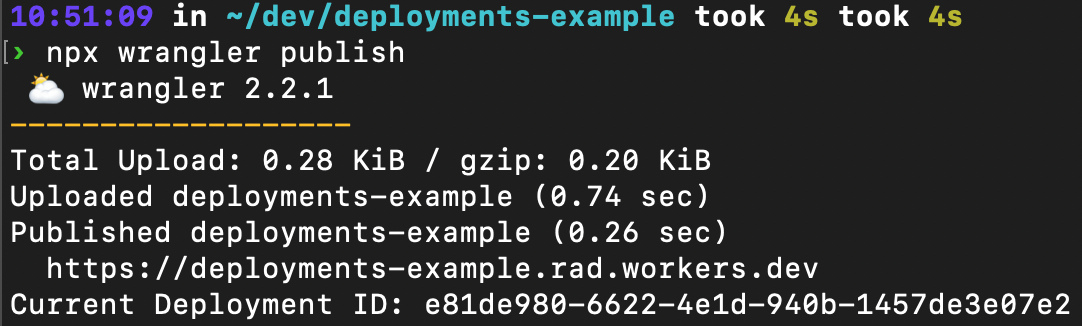
You can access all this deployment information in your Cloudflare dashboard, under your Worker’s Deployments tab. We also report on the active version right at the front of your Worker’s detail page. Wrangler will also report on deployment information. wrangler publish now reports the latest deployed version, and a new `wrangler deployments` command can be used to view a deployment history.

Keep track of Workers’ code and configuration changes with Deployments

To learn more about the details of deployments, head over to our Developer Documentation.

What’s next?

We’re excited to share deployments with our customers, available today in an open beta. As we mentioned up front, we’re just getting started with deployments. We’re also excited for more on-platform tooling like rollbacks, deploy status, deployment rules, and a view-only mode to historical deployments. Beyond that, we want to ensure deployments can be automated from commits to your repository, which means working on version control integrations to services like GitHub, Bitbucket, and Gitlab. We’d love to hear more about how you’re currently using Workers and how we can improve developer experience. If you’re interested, let’s chat.

If you’d like to join the conversation, head over to Cloudflare’s Developer Discord and give us a shout! We love hearing from our customers, and we’re excited to see what you build with Cloudflare.

Spice up your sites on Cloudflare Pages with Pages Functions General Availability

Post Syndicated from Nevi Shah original https://blog.cloudflare.com/pages-function-goes-ga/

Spice up your sites on Cloudflare Pages with Pages Functions General Availability

Spice up your sites on Cloudflare Pages with Pages Functions General Availability

Before we launched Pages back in April 2021, we knew it would be the start of something magical – an experience that felt “just right”. We envisioned an experience so simple yet so smooth that any developer could ship a website in seconds and add more to it by using the rest of our Cloudflare ecosystem.

A few months later, when we announced that Pages was a full stack platform in November 2021, that vision became a reality. Creating a development platform for just static sites was not the end of our Pages story, and with Cloudflare Workers already a part of our ecosystem, we knew we were sitting on untapped potential. With the introduction of Pages Functions, we empowered developers to take any static site and easily add in dynamic content with the power of Cloudflare Workers.

In the last year since Functions has been in open beta, we dove into an exploration on what kinds of full stack capabilities developers are looking for on their projects – and set out to fine tune the Functions experience into what it is today.

We’re thrilled to announce that Pages Functions is now generally available!

Functions recap

Though called “Functions” in the context of Pages, these functions running on our Cloudflare network are Cloudflare Workers in “disguise”. Pages harnesses the power and scalability of Workers and specializes them to align with the Pages experience our users know and love.

With Functions you can dream up the possibilities of dynamic functionality to add to your site – integrate with storage solutions, connect to third party services, use server side rendering with your favorite full stack frameworks and more. As Pages Functions opens its doors to production traffic, let’s explore some of the exciting features we’ve improved and added on this release.

The experience

Deploy with Git

Love to code? We’ll handle the infrastructure, and leave you to it.

Simply write a JavaScript/Typescript Function and drop it into a functions directory by committing your code to your Git provider. Our lightning fast CI system will build your code and deploy it alongside your static assets.

Directly upload your Functions

Prefer to handle the build yourself? Have a special git provider not yet supported on Pages? No problem! After dropping your Function in your functions folder, you can build with your preferred CI tooling and then upload your project to Pages to be deployed.

Debug your Functions

While in beta, we learned that you and your teams value visibility above all. As on Cloudflare Workers, we’ve built a simple way for you to watch your functions as it processes requests – the faster you can understand an issue the faster you can react.

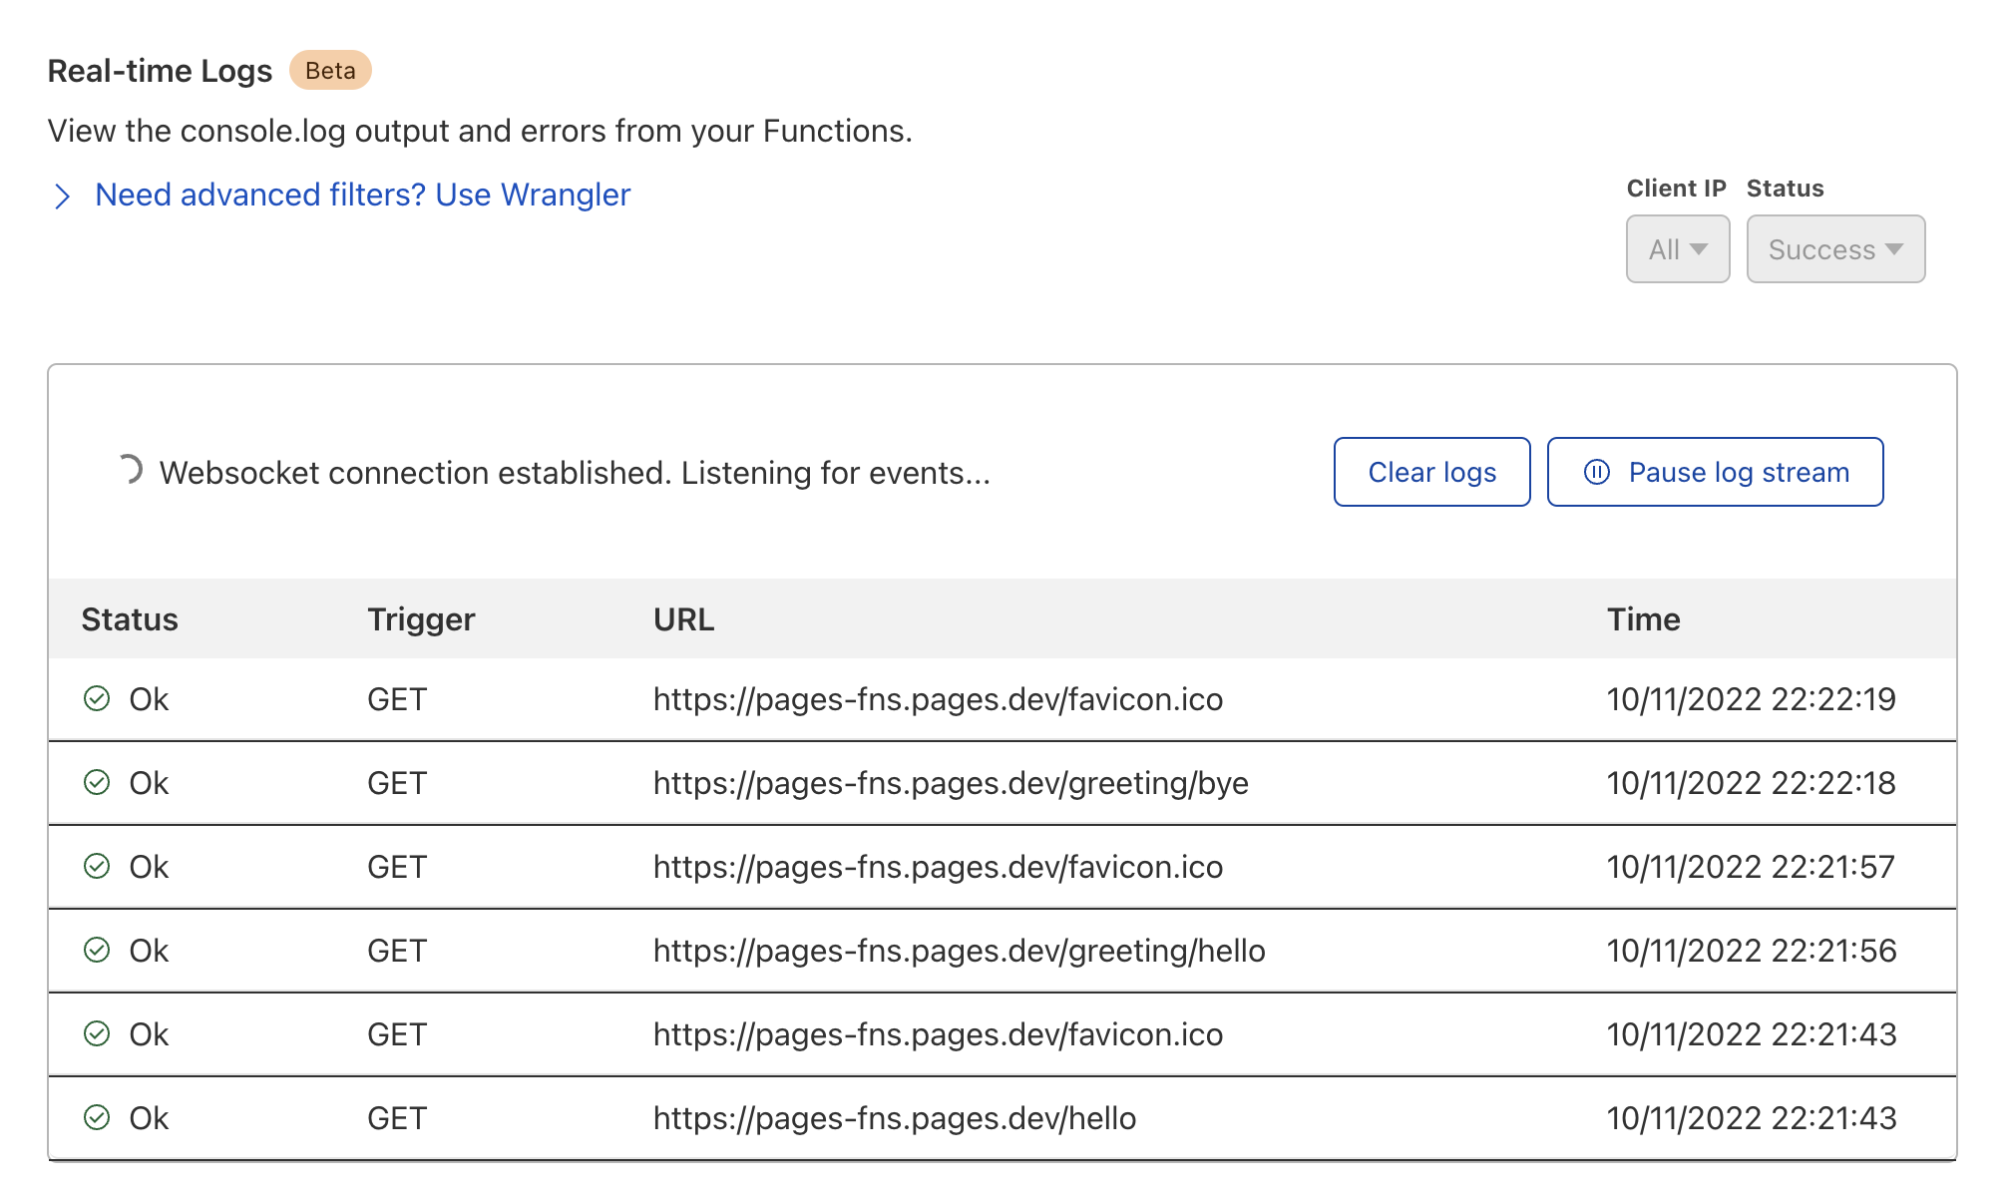
You can now easily view logs for your Functions by “tailing” your logs. For basic information like outcome and request IP, you can navigate to the Pages dashboard to obtain relevant logs.

For more specific filters, you can use

wrangler pages deployment tail

to receive a live feed of console and exception logs for each request your Function receives.

Spice up your sites on Cloudflare Pages with Pages Functions General Availability

Get real time Functions metrics

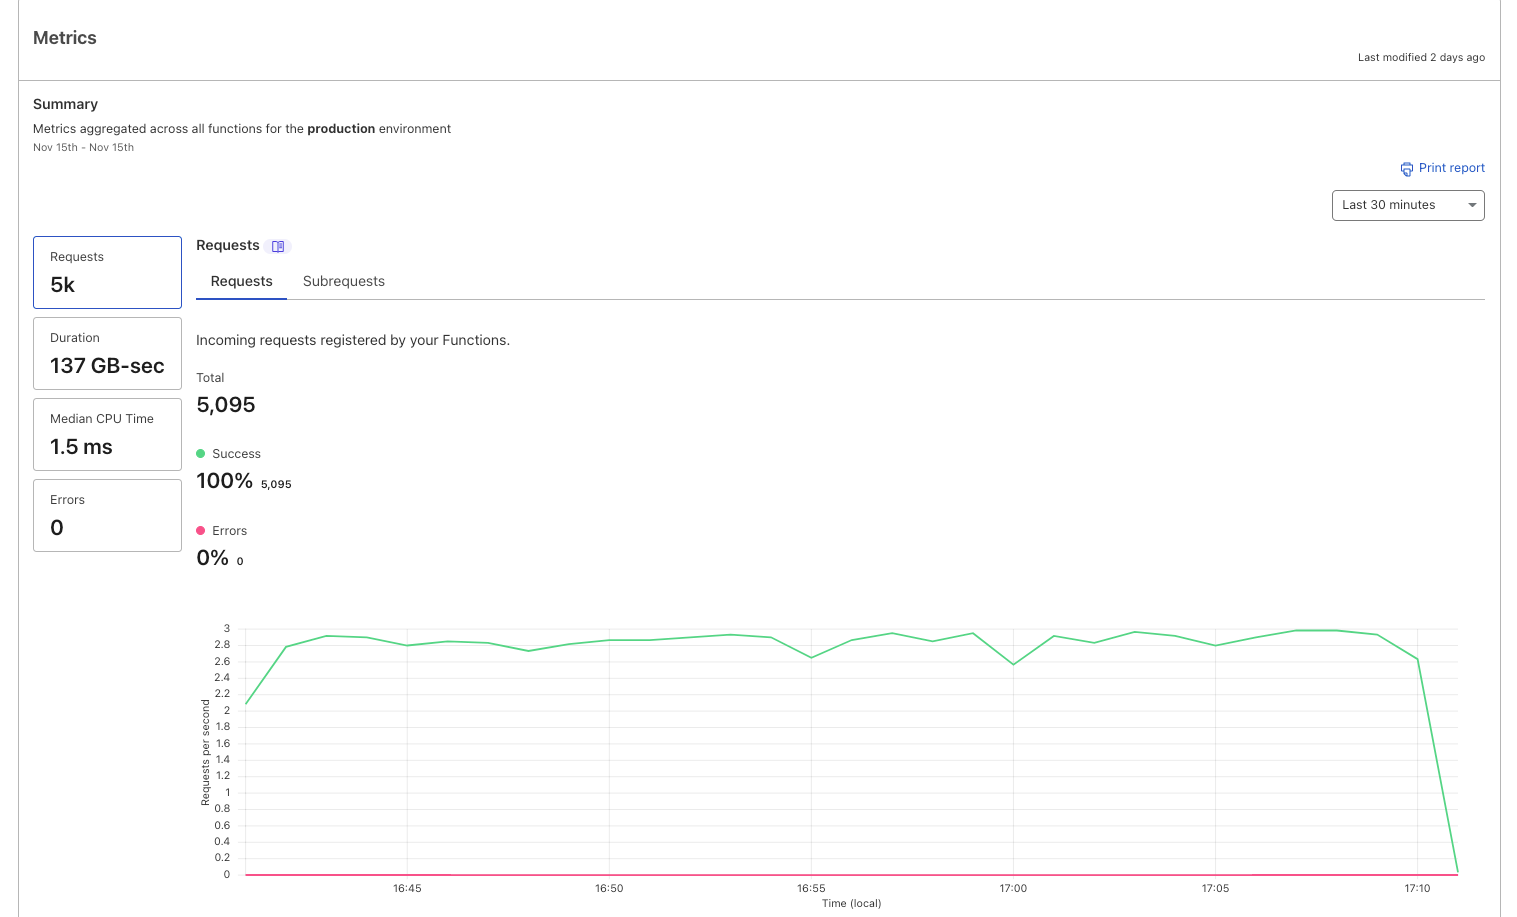
In the dashboard, Pages aggregates data for your Functions in the form of request successes/error metrics and invocation status. You can refer to your metrics dashboard not only to better understand your usage on a per-project basis but also to get a pulse check on the health of your Functions by catching success/error volumes.

Spice up your sites on Cloudflare Pages with Pages Functions General Availability

Quickly integrate with the Cloudflare ecosystem

Storage bindings

Want to go truly full stack? We know finding a storage solution that fits your needs and fits your ecosystem is not an easy task – but it doesn’t have to be!

With Functions, you can take advantage of our broad range of storage products including Workers KV, Durable Objects, R2, D1 and – very soon – Queues and Workers Analytics Engine! Simply create your namespace, bucket or database and add your binding in the Pages dashboard to get your full stack site up and running in just a few clicks.

From dropping in a quick comment system to rolling your own authentication to creating database-backed eCommerce sites, integrating with existing products in our developer platform unlocks an exponential set of use cases for your site.

Secret bindings

In addition to adding environment variables that are available to your project at both build-time and runtime, you can now also add “secrets” to your project. These are encrypted environment variables which cannot be viewed by any dashboard interfaces, and are a great home for sensitive data like API tokens or passwords.

Integrate with 3rd party services

Our goal with Pages is always to meet you where you are when it comes to the tools you love to use. During this beta period we also noticed some consistent patterns in how you were employing Functions to integrate with common third party services. Pages Plugins – our ready-made snippets of code – offers a plug and play experience for you to build the ecosystem of your choice around your application.

In essence, a Pages Plugin is a reusable – and customizable – chunk of runtime code that can be incorporated anywhere within your Pages application. It’s a “composable” Pages Function, granting Plugins the full power of Functions (i.e. Workers), including the ability to set up middleware, parameterized routes, and static assets.

With Pages Plugins you can integrate with a plethora of 3rd party applications – including officially supported Sentry, Honeycomb, Stytch, MailChannels and more.

Use your favorite full stack frameworks

In the spirit of meeting developers where they are at, this sentiment also comes in the form of Javascript frameworks. As a big supporter of not only widely adopted frameworks but up and coming frameworks, our team works with a plethora of framework authors to create opportunities for you to play with their new tech and deploy on Pages right out of the box.

Now compatible with Next.js 13 and more!

Recently, we announced our support for Next.js applications which opt in to the Edge Runtime. Today we’re excited to announce we are now compatible with Next.js 13. Next.js 13 brings some most-requested modern paradigms to the Next.js framework, including nested routing, React 18’s Server Components and streaming.

Have a different preference of framework? No problem.

Go full stack on Pages to take advantage of server side rendering (SSR) with one of many other officially supported frameworks like Remix, SvelteKit, QwikCity, SolidStart, Astro and Nuxt. You can check out our blog post on SSR support on Pages and how to get started with some of these frameworks.

Go fast in advanced mode

While Pages Functions are powered by Workers, we understand that at face-value they are not exactly the same. Nevertheless, for existing users who are perhaps using Workers and are keen on trying Cloudflare Pages, we’ve got a direct path to get you started quickly.

If you already have a single Worker and want an easy way to go full stack on Pages, you can use Pages Function’s “advanced mode”. Generate an ES module Worker called _worker.js in the output directory of your project and deploy!
This can be especially helpful if you’re a framework author or perhaps have a more complex use case that does not fit into our file-based router.

Scaling without limits

So today, as we announce Functions as generally available we are thrilled to allow your traffic to scale. During the Open Beta period, we imposed a daily limit of 100,000 free requests per day as a way to let you try out the feature. While 100,000 requests per day remains the free limit today, you can now pay to truly go unlimited.

Since Functions are just “special” Workers, with this announcement you will begin to see your Functions usage reflected on your bill under the Workers Paid subscription or via your Workers Enterprise contract. Like Workers, when on a paid plan, you have the option to choose between our two usage models – Bundled and Unbound – and will be billed accordingly.

Keeping Pages on brand as Cloudflare’s “gift to the Internet”, you will get unlimited free static asset requests and will be billed primarily on dynamic requests. You can read more about how billing with Functions works in our documentation.

Get started today

To start jamming, head over to the Pages Functions docs and check out our blog on some of the best frameworks to use to deploy your first full stack application. As you begin building out your projects be sure to let us know in the #functions channel under Pages of our Cloudflare Developers Discord. Happy building!

Xata Workers: client-side database access without client-side secrets

Post Syndicated from Alexis Rico (Guest Blogger) original https://blog.cloudflare.com/xata-customer-story/

Xata Workers: client-side database access without client-side secrets

Xata Workers: client-side database access without client-side secrets

We’re excited to have Xata building their serverless functions product – Xata Workers – on top of Workers for Platforms. Xata Workers act as middleware to simplify database access and allow their developers to deploy functions that sit in front of their databases. Workers for Platforms opens up a whole suite of use cases for Xata developers all while providing the security, scalability and performance of Cloudflare Workers.

Now, handing it over to Alexis, a Senior Software Engineer at Xata to tell us more.

Introduction

In the last few years, there’s been a rise of Jamstack, and new ways of thinking about the cloud that some people call serverless or edge computing. Instead of maintaining dedicated servers to run a single service, these architectures split applications in smaller services or functions.

By simplifying the state and context of our applications, we can benefit from external providers deploying these functions in dozens of servers across the globe. This architecture benefits the developer and user experience alike. Developers don’t have to manage servers, and users don’t have to experience latency. Your application simply scales, even if you receive hundreds of thousands of unexpected visitors.

When it comes to databases though, we still struggle with the complexity of orchestrating replication, failover and high availability. Traditional databases are difficult to scale horizontally and usually require a lot of infrastructure maintenance or learning complex database optimization concepts.

At Xata we are building a modern data platform designed for scalable applications. It allows you to focus on your application logic, instead of having to worry about how the data is stored.

Making databases accessible to everyone

We started Xata with the mission of helping developers build their applications and forget about maintaining the underlying infrastructure.

With that mission in mind, we asked ourselves: how can we make databases accessible to everyone? How can we provide a delightful experience for a frontend engineer or designer using a database?

To begin with, we built an appealing web dashboard, that any developer — no matter their experience — can be comfortable using to work with their data.

Whether they’re defining or refining their schema, viewing or adding records, fine-tuning search results with query boosters, or getting code snippets to speed up development with our SDK. We believe that only the best user experience can provide the best development experience.

We identified a major challenge amongst our user base early on. Many front-end developers want to access their database from client-side code.

Allowing access to a database from client-side code comes with several security risks if not done properly. For example, someone could inspect the code, find the credentials, and if they weren’t scoped to a single operation, potentially query or modify other parts of the database. Unfortunately, this is a common reason for data leaks and security breaches.

It was a hard problem to solve, and after plenty of brainstorming, we agreed on two potential ways forward: implementing row-level access rules or writing API routes that talked to the database from server code.

Row-level access rules are a good way to solve this, but they would have required us to define our own opinionated language. For our users, it would have been hard to migrate away when they outgrow this solution. Instead, we preferred to focus on making serverless functions easier for our users.

Typically, serverless functions require you to either choose a full stack framework or manually write, compile, deploy and use them. This generally adds a lot of cognitive overhead even to choose the right solution. We wanted to simplify accessing the database from the frontend without sacrificing flexibility for developers. This is why we decided to build Xata Workers.

Xata Workers

A Xata Worker is a function that a developer can write in JavaScript or TypeScript as client-side code. Rather than being executed client-side, it will actually be executed on Cloudflare’s global network.

You can think of a Xata Worker as a getServerSideProps function in Next.js or a loader function in Remix. You write your server logic in a function and our tooling takes care of deploying and running it server-side for you (yes, it’s that easy).

The main difference with other alternatives is that Xata Workers are, by design, agnostic to a framework or hosting provider. You can use them to build any kind of application or website, and even upload it as static HTML in a service like GitHub Pages or S3. You don’t need a full stack web framework to use Xata Workers.

With our command line tool, we handle the build and deployment process. When the function is invoked, the Xata Worker actually makes a request to a serverless function over the network.

import { useQuery } from '@tanstack/react-query';
import { xataWorker } from '~/xata';

const listProducts = xataWorker('listProducts', async ({ xata }) => {
  return await xata.db.products.sort('popularity', 'desc').getMany();
});

export const Home = () => {
  const { data = [] } = useQuery(['products'], listProducts);

  return (
    <Grid>
      {data.map((product) => (
        <ProductCard key={product.id} product={product} />
      ))}
    </Grid>
  );
};

In the code snippet above, you can see a React component that connects to an e-commerce database with products on sale. Inside the UI component, with a popular client-side data fetching library, data is retrieved from the serverless function and for each product it renders another component in a grid.

As you can see a Xata Worker is a function that wraps any user-defined code and receives an instance of our SDK as a parameter. This instance has access to the database and, given that the code doesn’t run on the browser anymore, your secrets are not exposed for malicious usage.

When using a Xata Worker in TypeScript, our command line tool also generates custom types based on your schema. These types offer type-safety for your queries or mutations, and improve your developer experience by adding extra intellisense to your IDE.

Xata Workers: client-side database access without client-side secrets

A Xata Worker, like any other function, can receive additional parameters that pass application state, context or user tokens. The code you write in the function can either return an object that will be serialized over the network with a superset of JSON to support dates and other non-primitive data types, or a full response with a custom status code and headers.

Developers can write all their logic, including their own authentication and authorization. Unlike complex row level access control rules, you can easily express your logic without constraints and even unit test it with the rest of your code.

How we use Cloudflare

We are happy to join the Supercloud movement, Cloudflare has an excellent track record, and we are using Cloudflare Workers for Platforms to host our serverless functions. By using the Workers isolated execution contexts we reduce security risks of running untrusted code on our own while being close to our users, resulting in super low latency.

All of it, without having to deploy extra infrastructure to handle our user’s application load or ask them to configure how the serverless functions should be deployed. It really feels like magic! Now, let’s dive into the internals of how we use Cloudflare to run our Xata Workers.

For every workspace in Xata we create a Worker Namespace, a Workers for Platform concept to organize Workers and restrict the routing between them. We used Namespaces to group and encapsulate the different functions coming from all the databases built by a client or team.

When a user deploys a Xata Worker, we create a new Worker Script, and we upload the compiled code to its Namespace. Each script has a unique name with a compilation identifier so that the user can have multiple versions of the same function running at the same time.

During the compilation, we inject the database connection details and the database name. This way, the function can connect to the database without leaking secrets and restricting the scope of access to the database, all of it transparently for the developer.

When the client-side application runs a Xata Worker, it calls a Dispatcher function that processes the request and calls the correct Worker Script. The dispatcher function is also responsible for configuring the CORS headers and the log drain that can be used by the developer to debug their functions.

Xata Workers: client-side database access without client-side secrets

By using Cloudflare, we are also able to benefit from other products in the Workers ecosystem. For example, we can provide an easy way to cache the results of a query in Cloudflare’s global network. That way, we can serve the results for read-only queries directly from locations closer to the end users, without having to call the database again and again for every Worker invocation. For the developer, it’s only a matter of adding a “cache” parameter to their query with the number of milliseconds they want to cache the results in a KV Namespace.

import { xataWorker } from '~/xata';

const listProducts = xataWorker('listProducts', async ({ xata }) => {
  return await xata.db.products.sort('popularity', 'desc').getMany({
    cache: 15 * 60 * 1000 // TTL
  });
});

In development mode, we provide a command to run the functions locally and test them before deploying them to production. This enables rapid development workflows with real-time filesystem change monitoring and hot reloading of the workers code. Internally, we use the latest version of miniflare to emulate the Cloudflare Workers runtime, mimicking the real production environment.

Conclusion

Xata is now out of beta and available for everyone. We offer a generous free tier that allows you to build and deploy your applications and only pay to scale them when you actually need it.

You can sign up for free, create a database in seconds and enjoy features such as branching with zero downtime migrations, search and analytics, transactions, and many others. Check out our website to learn more!

Xata Workers are currently in private beta. If you are interested in trying them out, you can sign up for the waitlist and talk us through your use case. We are looking for developers that are willing to provide feedback and shape this new feature for our serverless data platform.

We are very proud of our collaboration with Cloudflare for this new feature. Processing data closer to where it’s being requested is the future of computing and we are excited to be part of this movement. We look forward to seeing what you build with Xata Workers.

Making static sites dynamic with Cloudflare D1

Post Syndicated from Kristian Freeman original https://blog.cloudflare.com/making-static-sites-dynamic-with-cloudflare-d1/

Making static sites dynamic with Cloudflare D1

Introduction

Making static sites dynamic with Cloudflare D1

There are many ways to store data in your applications. For example, in Cloudflare Workers applications, we have Workers KV for key-value storage and Durable Objects for real-time, coordinated storage without compromising on consistency. Outside the Cloudflare ecosystem, you can also plug in other tools like NoSQL and graph databases.

But sometimes, you want SQL. Indexes allow us to retrieve data quickly. Joins enable us to describe complex relationships between different tables. SQL declaratively describes how our application’s data is validated, created, and performantly queried.

D1 was released today in open alpha, and to celebrate, I want to share my experience building apps with D1: specifically, how to get started, and why I’m excited about D1 joining the long list of tools you can use to build apps on Cloudflare.

Making static sites dynamic with Cloudflare D1

D1 is remarkable because it’s an instant value-add to applications without needing new tools or stepping out of the Cloudflare ecosystem. Using wrangler, we can do local development on our Workers applications, and with the addition of D1 in wrangler, we can now develop proper stateful applications locally as well. Then, when it’s time to deploy the application, wrangler allows us to both access and execute commands to your D1 database, as well as your API itself.

What we’re building

In this blog post, I’ll show you how to use D1 to add comments to a static blog site. To do this, we’ll construct a new D1 database and build a simple JSON API that allows the creation and retrieval of comments.

As I mentioned, separating D1 from the app itself – an API and database that remains separate from the static site – allows us to abstract the static and dynamic pieces of our website from each other. It also makes it easier to deploy our application: we will deploy the frontend to Cloudflare Pages, and the D1-powered API to Cloudflare Workers.

Building a new application

First, we’ll add a basic API in Workers. Create a new directory and in it a new wrangler project inside it:

$ mkdir d1-example && d1-example
$ wrangler init

In this example, we’ll use Hono, an Express.js-style framework, to rapidly build our API. To use Hono in this project, install it using NPM:

$ npm install hono

Then, in src/index.ts, we’ll initialize a new Hono app, and define a few endpoints – GET /API/posts/:slug/comments, and POST /get/api/:slug/comments.

import { Hono } from 'hono'
import { cors } from 'hono/cors'

const app = new Hono()

app.get('/api/posts/:slug/comments', async c => {
  // do something
})

app.post('/api/posts/:slug/comments', async c => {
  // do something
})

export default app

Now we’ll create a D1 database. In Wrangler 2, there is support for the wrangler d1 subcommand, which allows you to create and query your D1 databases directly from the command line. So, for example, we can create a new database with a single command:

$ wrangler d1 create d1-example

With our created database, we can take the database name ID and associate it with a binding inside of wrangler.toml, wrangler’s configuration file. Bindings allow us to access Cloudflare resources, like D1 databases, KV namespaces, and R2 buckets, using a simple variable name in our code. Below, we’ll create the binding DB and use it to represent our new database:

[[ d1_databases ]]
binding = "DB" # i.e. available in your Worker on env.DB
database_name = "d1-example"
database_id = "4e1c28a9-90e4-41da-8b4b-6cf36e5abb29"

Note that this directive, the [[d1_databases]] field, currently requires a beta version of wrangler. You can install this for your project using the command npm install -D wrangler/beta.

With the database configured in our wrangler.toml, we can start interacting with it from the command line and inside our Workers function.

First, you can issue direct SQL commands using wrangler d1 execute:

$ wrangler d1 execute d1-example --command "SELECT name FROM sqlite_schema WHERE type ='table'"
Executing on d1-example:
┌─────────────────┐
│ name │
├─────────────────┤
│ sqlite_sequence │
└─────────────────┘

You can also pass a SQL file – perfect for initial data seeding in a single command. Create src/schema.sql, which will create a new comments table for our project:

drop table if exists comments;
create table comments (
  id integer primary key autoincrement,
  author text not null,
  body text not null,
  post_slug text not null
);
create index idx_comments_post_id on comments (post_slug);

-- Optionally, uncomment the below query to create data

-- insert into comments (author, body, post_slug)
-- values ("Kristian", "Great post!", "hello-world");

With the file created, execute the schema file against the D1 database by passing it with the flag --file:

$ wrangler d1 execute d1-example --file src/schema.sql

We’ve created a SQL database with just a few commands and seeded it with initial data. Now we can add a route to our Workers function to retrieve data from that database. Based on our wrangler.toml config, the D1 database is now accessible via the DB binding. In our code, we can use the binding to prepare SQL statements and execute them, for instance, to retrieve comments:

app.get('/api/posts/:slug/comments', async c => {
  const { slug } = c.req.param()
  const { results } = await c.env.DB.prepare(`
    select * from comments where post_slug = ?
  `).bind(slug).all()
  return c.json(results)
})

In this function, we accept a slug URL query parameter and set up a new SQL statement where we select all comments with a matching post_slug value to our query parameter. We can then return it as a simple JSON response.

So far, we’ve built read-only access to our data. But “inserting” values to SQL is, of course, possible as well. So let’s define another function that allows POST-ing to an endpoint to create a new comment:

app.post('/API/posts/:slug/comments', async c => {
  const { slug } = c.req.param()
  const { author, body } = await c.req.json<Comment>()

  if (!author) return c.text("Missing author value for new comment")
  if (!body) return c.text("Missing body value for new comment")

  const { success } = await c.env.DB.prepare(`
    insert into comments (author, body, post_slug) values (?, ?, ?)
  `).bind(author, body, slug).run()

  if (success) {
    c.status(201)
    return c.text("Created")
  } else {
    c.status(500)
    return c.text("Something went wrong")
  }
})

In this example, we built a comments API for powering a blog. To see the source for this D1-powered comments API, you can visit cloudflare/templates/worker-d1-api.

Making static sites dynamic with Cloudflare D1

Conclusion

One of the things most exciting about D1 is the opportunity to augment existing applications or websites with dynamic, relational data. As a former Ruby on Rails developer, one of the things I miss most about that framework in the world of JavaScript and serverless development tools is the ability to rapidly spin up full data-driven applications without needing to be an expert in managing database infrastructure. With D1 and its easy onramp to SQL-based data, we can build true data-driven applications without compromising on performance or developer experience.

This shift corresponds nicely with the advent of static sites in the last few years, using tools like Hugo or Gatsby. A blog built with a static site generator like Hugo is incredibly performant – it will build in seconds with small asset sizes.

But by trading a tool like WordPress for a static site generator, you lose the opportunity to add dynamic information to your site. Many developers have patched over this problem by adding more complexity to their build processes: fetching and retrieving data and generating pages using that data as part of the build.

This addition of complexity in the build process attempts to fix the lack of dynamism in applications, but it still isn’t genuinely dynamic. Instead of being able to retrieve and display new data as it’s created, the application rebuilds and redeploys whenever data changes so that it appears to be a live, dynamic representation of data. Your application can remain static, and the dynamic data will live geographically close to the users of your site, accessible via a queryable and expressive API.

Building serverless .NET applications on AWS Lambda using .NET 7

Post Syndicated from James Beswick original https://aws.amazon.com/blogs/compute/building-serverless-net-applications-on-aws-lambda-using-net-7/

This post is written by James Eastham, Senior Cloud Architect, Beau Gosse, Senior Software Engineer, and Samiullah Mohammed, Senior Software Engineer

Today, AWS is announcing tooling support to enable applications running .NET 7 to be built and deployed on AWS Lambda. This includes applications compiled using .NET 7 native AOT. .NET 7 is the latest version of .NET and brings many performance improvements and optimizations.

Native AOT enables .NET code to be ahead-of-time compiled to native binaries for up to 86% faster cold starts when compared to the .NET 6 managed runtime. The fast execution and lower memory consumption of native AOT can also result in reduced Lambda costs. This post walks through how to get started running .NET 7 applications on AWS Lambda with native AOT.

Overview

Customers can use .NET 7 with Lambda in two ways. First, Lambda has released a base container image for .NET 7, enabling customers to build and deploy .NET 7 functions as container images. Second, you can use Lambda’s custom runtime support to run functions compiled to native code using .NET 7 native AOT. Lambda has not released a managed runtime for .NET 7, since it is not a long-term support (LTS) release.

Native AOT allows .NET applications to be pre-compiled to a single binary, removing the need for JIT (Just In Time compilation) and the .NET runtime. To use this binary in a custom runtime, it needs to include the Lambda runtime client. The runtime client integrates your application code with the Lambda runtime API, which enables your application code to be invoked by Lambda.

The enhanced tooling announced today streamlines the tasks of building .NET applications using .NET 7 native AOT and deploying them to Lambda using a custom runtime. This tooling comprises three tools. The AWS Lambda extension to the ‘dotnet’ CLI (Amazon.Lambda.Tools) contains the commands to build and deploy Lambda functions using .NET. The dotnet CLI can be used directly, and is also used by the AWS Toolkit for Visual Studio, and the AWS Serverless Application Model (AWS SAM), an open-source framework for building serverless applications.

Native AOT compiles code for a specific OS version. If you run the dotnet publish command on your machine, the compiled code only runs on the OS version and processor architecture of your machine. For your application code to run in Lambda using native AOT, the code must be compiled on the Amazon Linux 2 (AL2) OS. The new tooling supports compiling your Lambda functions within an AL2-based Docker image, with the compiled application stored on your local hard drive.

Develop Lambda functions with .NET 7 native AOT

In this section, we’ll discuss how to develop your Lambda function code to be compatible with .NET 7 native AOT. This is the first GA version of native AOT Microsoft has released. It may not suit all workloads, since it does come with trade-offs. For example, dynamic assembly loading and the System.Reflection.Emit library are not available. Native AOT also trims your application code, resulting in a small binary that contains the essential components for your application to run.

Prerequisites

Getting Started

To get started, create a new Lambda function project using a custom runtime from the .NET CLI.

dotnet new lambda.NativeAOT -n LambdaNativeAot
cd ./LambdaNativeAot/src/LambdaNativeAot/
dotnet add package Amazon.Lambda.APIGatewayEvents
dotnet add package AWSSDK.Core

To review the project settings, open the LambdaNativeAot.csproj file. The target framework in this template is set to net7.0. To enable native AOT, add a new property named PublishAot, with value true. This PublishAot flag is an MSBuild property required by the .NET SDK so that the compiler performs native AOT compilation.

When using Lambda with a custom runtime, the Lambda service looks for an executable file named bootstrap within the packaged ZIP file. To enable this, the OutputType is set to exe and the AssemblyName to bootstrap.

The correctly configured LambdaNativeAot.csproj file looks like this:

<Project Sdk="Microsoft.NET.Sdk">
  <PropertyGroup>
    <OutputType>Exe</OutputType>
    <TargetFramework>net7.0</TargetFramework>
    <ImplicitUsings>enable</ImplicitUsings>
    <Nullable>enable</Nullable>
    <AWSProjectType>Lambda</AWSProjectType>
    <AssemblyName>bootstrap</AssemblyName>
    <PublishAot>true</PublishAot>
  </PropertyGroup> 
  …
</Project>

Function code

Running .NET with a custom runtime uses the executable assembly feature of .NET. To do this, your function code must define a static Main method. Within the Main method, you must initialize the Lambda runtime client, and configure the function handler and the JSON serializer to use when processing Lambda events.

The Amazon.Lambda.RuntimeSupport Nuget package is added to the project to enable this runtime initialization. The LambdaBootstrapBuilder.Create() method is used to configure the handler and the ILambdaSerializer implementation to use for (de)serialization.

private static async Task Main(string[] args)
{
    Func<string, ILambdaContext, string> handler = FunctionHandler;
    await LambdaBootstrapBuilder.Create(handler, new DefaultLambdaJsonSerializer())
        .Build()
        .RunAsync();
}

Assembly trimming

Native AOT trims application code to optimize the compiled binary, which can cause two issues. The first is with de/serialization. Common .NET libraries for working with JSON like Newtonsoft.Json and System.Text.Json rely on reflection. The second is with any third party libraries not yet updated to be trim-friendly. The compiler may trim out parts of the library that are required for the library to function. However, there are solutions for both issues.

Working with JSON

Source generated serialization is a language feature introduced in .NET 6. It allows the code required for de/serialization to be generated at compile time instead of relying on reflection at runtime. One drawback of native AOT is that the ability to use System.Relefection.Emit library is lost. Source generated serialization enables developers to work with JSON while also using native AOT.

To use the source generator, you must define a new empty partial class that inherits from System.Text.Json.JsonSerializerContext. On the empty partial class, add the JsonSerializable attribute for any .NET type that your application must de/serialize.

In this example, the Lambda function needs to receive events from API Gateway. Create a new class in the project named HttpApiJsonSerializerContext and copy the code below:

[JsonSerializable(typeof(APIGatewayHttpApiV2ProxyRequest))]
[JsonSerializable(typeof(APIGatewayHttpApiV2ProxyResponse))]
public partial class HttpApiJsonSerializerContext : JsonSerializerContext
{
}

When the application is compiled, static classes, properties, and methods are generated to perform the de/serialization.

This custom serializer must now also be passed in to the Lambda runtime to ensure that event inputs and outputs are serialized and deserialized correctly. To do this, pass a new instance of the serializer context into the runtime when bootstrapped. Here is an example of a Lambda function using API Gateway as a source:

using System.Text.Json.Serialization;
using Amazon.Lambda.APIGatewayEvents;
using Amazon.Lambda.Core;
using Amazon.Lambda.RuntimeSupport;
using Amazon.Lambda.Serialization.SystemTextJson;
namespace LambdaNativeAot;
public class Function
{
    /// <summary>
    /// The main entry point for the custom runtime.
    /// </summary>
    private static async Task Main()
    {
        Func<APIGatewayHttpApiV2ProxyRequest, ILambdaContext, Task<APIGatewayHttpApiV2ProxyResponse>> handler = FunctionHandler;
        await LambdaBootstrapBuilder.Create(handler, new SourceGeneratorLambdaJsonSerializer<HttpApiJsonSerializerContext>())
            .Build()
            .RunAsync();
    }

    public static async Task<APIGatewayHttpApiV2ProxyResponse> FunctionHandler(APIGatewayHttpApiV2ProxyRequest apigProxyEvent, ILambdaContext context)
    {
        // API Handling logic here
        return new APIGatewayHttpApiV2ProxyResponse()
        {
            StatusCode = 200,
            Body = "OK"
        };
    }
}

Third party libraries

The .NET compiler provides the capability to control how applications are trimmed. For native AOT compilation, this enables us to exclude specific assemblies from trimming. For any libraries used in your applications that may not yet be trim-friendly this is a powerful way to still use native AOT. This is important for any of the Lambda event source NuGet packages like Amazon.Lambda.ApiGatewayEvents. Without controlling this, the C# objects for the Amazon API Gateway event sources are trimmed, leading to serialization errors at runtime.

Currently, the AWSSDK.Core library used by all the .NET AWS SDKs must also be excluded from trimming.

To control the assembly trimming, create a new file in the project root named rd.xml. Full details on the rd.xml format are found in the Microsoft documentation. Adding assemblies to the rd.xml file excludes them from trimming.

The following example contains an example of how to exclude the AWSSDK.Core, API Gateway event and function library from trimming:

<Directives xmlns="http://schemas.microsoft.com/netfx/2013/01/metadata">
	<Application>
		<Assembly Name="AWSSDK.Core" Dynamic="Required All"></Assembly>
		<Assembly Name="Amazon.Lambda.APIGatewayEvents" Dynamic="Required All"></Assembly>
		<Assembly Name="bootstrap" Dynamic="Required All"></Assembly>
	</Application>
</Directives>

Once added, the csproj file must be updated to reference the rd.xml file. Edit the csproj file for the Lambda project and add this ItemGroup:

<ItemGroup>
  <RdXmlFile Include="rd.xml" />
</ItemGroup>

When the function is compiled, assembly trimming skips the three libraries specified. If you are using .NET 7 native AOT with Lambda, we recommend excluding both the AWSSDK.Core library and the specific libraries for any event sources your Lambda function uses. If you are using the AWS X-Ray SDK for .NET to trace your serverless application, this must also be excluded.

Deploying .NET 7 native AOT applications

We’ll now explain how to build and deploy .NET 7 native AOT functions on Lambda, using each of the three deployment tools.

Using the dotnet CLI

Prerequisites

  • Docker (if compiling on a non-Amazon Linux 2 based machine)

Build and deploy

To package and deploy your Native AOT compiled Lambda function, run:

dotnet lambda deploy-function

When compiling and packaging your Lambda function code using the Lambda tools CLI, the tooling checks for the PublishAot flag in your project. If set to true, the tooling pulls an AL2-based Docker image and compiles your code inside. It mounts your local file system to the running container, allowing the compiled binary to be stored back to your local file system ready for deployment. As a default, the generated ZIP file is output to the bin/Release directory.

Once the deployment completes, you can execute the below command to invoke the created function, replacing the FUNCTION_NAME option with the name of the function chosen during deployment.

dotnet lambda invoke-function FUNCTION_NAME

Using the Visual Studio Extension

AWS is also announcing support for compiling and deploying native AOT-based Lambda functions from within Visual Studio using the AWS Toolkit for Visual Studio.

Prerequisites

Getting Started

As part of this release, templates are available in Visual Studio 2022 to get started using native AOT with AWS Lambda. From within Visual Studio, select File -> New Project. Search for Lambda .NET 7 native AOT to start a new project pre-configured for native AOT.

Create a new project

Build and deploy

Once the project is created, right-click the project in Visual Studio and choose Publish to AWS Lambda.

Solution Explorer

Complete the steps in the publish wizard and press upload. The log messages created by Docker appear in the publish window as it compiles your function code for native AOT.

Uploading function

You can now invoke the deployed function from within Visual Studio by setting the Example request dropdown to API Gateway AWS Proxy and pressing the Invoke button.

Invoke example

Using the AWS SAM CLI

Prerequisites

  • Docker (If compiling on a non-AL2 based machine)
  • AWS SAM v1.6.4 or later

Getting started

Support for compiling and deploying .NET 7 native AOT is built into the AWS SAM CLI. To get started, initialize a new AWS SAM project:

sam init

In the new project wizard, choose:

  1. What template source would you like to use? 1 – AWS Quick Start Template
  2. Choose an AWS Quick start application template. 1 – Hello World example
  3. Use the most popular runtime and package type? – N
  4. Which runtime would you like to use? aot.dotnet7 (provided.al2)
  5. Enable X-Ray Tracing? N
  6. Choose a project name

The cloned project includes the configuration to deploy to Lambda.

One new AWS SAM metadata property called ‘BuildMethod’ is required in the AWS SAM template:

HelloWorldFunction:
  Type: AWS::Serverless::Function
  Properties:
    Runtime: 'provided.al2' # // Use provided to deploy to AWS Lambda for .NET 7 native AOT
    Architectures:
      - x86_64
  Metadata:
    BuildMethod: 'dotnet7' # // But build with new build method for .NET 7 that calls into Amazon.Lambda.Tools 

Build and deploy

Build and deploy your serverless application, completing the guided deployment steps:

sam build
sam deploy –-guided

The AWS SAM CLI uses the Amazon.Lambda.Tools CLI to pull an AL2-based Docker image and compile your application code inside a container. You can use AWS SAM accelerate to speed up the update of serverless applications during development. It uses direct API calls instead of deploying changes through AWS CloudFormation, automating updates whenever you change your local code base. Learn more in the AWS SAM development documentation.

Conclusion

AWS now supports .NET 7 native AOT on Lambda. Read the Lambda Developer Guide for more getting started information. For more details on the performance improvements from using .NET 7 native AOT on Lambda, see the serverless-dotnet-demo repository on GitHub.

To provide feedback for .NET on AWS Lambda, contact the AWS .NET team on the .NET Lambda GitHub repository.

For more serverless learning resources, visit Serverless Land.

Use an event-driven architecture to build a data mesh on AWS

Post Syndicated from Jan Michael Go Tan original https://aws.amazon.com/blogs/big-data/use-an-event-driven-architecture-to-build-a-data-mesh-on-aws/

In this post, we take the data mesh design discussed in Design a data mesh architecture using AWS Lake Formation and AWS Glue, and demonstrate how to initialize data domain accounts to enable managed sharing; we also go through how we can use an event-driven approach to automate processes between the central governance account and data domain accounts (producers and consumers). We build a data mesh pattern from scratch as Infrastructure as Code (IaC) using AWS CDK and use an open-source self-service data platform UI to share and discover data between business units.

The key advantage of this approach is being able to add actions in response to data mesh events such as permission management, tag propagation, search index management, and to automate different processes.

Before we dive into it, let’s look at AWS Analytics Reference Architecture, an open-source library that we use to build our solution.

AWS Analytics Reference Architecture

AWS Analytics Reference Architecture (ARA) is a set of analytics solutions put together as end-to-end examples. It regroups AWS best practices for designing, implementing, and operating analytics platforms through different purpose-built patterns, handling common requirements, and solving customers’ challenges.

ARA exposes reusable core components in an AWS CDK library, currently available in Typescript and Python. This library contains AWS CDK constructs (L3) that can be used to quickly provision analytics solutions in demos, prototypes, proofs of concept, and end-to-end reference architectures.

The following table lists data mesh specific constructs in the AWS Analytics Reference Architecture library.

Construct Name Purpose
CentralGovernance Creates an Amazon EventBridge event bus for central governance account that is used to communicate with data domain accounts (producer/consumer). Creates workflows to automate data product registration and sharing.
DataDomain Creates an Amazon EventBridge event bus for data domain account (producer/consumer) to communicate with central governance account. It creates data lake storage (Amazon S3), and workflow to automate data product registration. It also creates a workflow to populate AWS Glue Catalog metadata for newly registered data product.

You can find AWS CDK constructs for the AWS Analytics Reference Architecture on Construct Hub.

In addition to ARA constructs, we also use an open-source Self-service data platform (User Interface). It is built using AWS Amplify, Amazon DynamoDB, AWS Step Functions, AWS Lambda, Amazon API Gateway, Amazon EventBridge, Amazon Cognito, and Amazon OpenSearch. The frontend is built with React. Through the self-service data platform you can: 1) manage data domains and data products, and 2) discover and request access to data products.

Central Governance and data sharing

For the governance of our data mesh, we will use AWS Lake Formation. AWS Lake Formation is a fully managed service that simplifies data lake setup, supports centralized security management, and provides transactional access on top of your data lake. Moreover, it enables data sharing across accounts and organizations. This centralized approach has a number of key benefits, such as: centralized audit; centralized permission management; and centralized data discovery. More importantly, this allows organizations to gain the benefits of centralized governance while taking advantage of the inherent scaling characteristics of decentralized data product management.

There are two ways to share data resources in Lake Formation: 1) Named Based Access Control (NRAC), and 2) Tag-Based Access Control (LF-TBAC). NRAC uses AWS Resource Access Manager (AWS RAM) to share data resources across accounts. Those are consumed via resource links that are based on created resource shares. Tag-Based Access Control (LF-TBAC) is another approach to share data resources in AWS Lake Formation, that defines permissions based on attributes. These attributes are called LF-tags. You can read this blog to learn about LF-TBAC in the context of data mesh.

The following diagram shows how NRAC and LF-TBAC data sharing works. In this example, data domain is registered as a node on mesh and therefore we create two databases in the central governance account. NRAC database is shared with data domain via AWS RAM. Access to data products that we register in this database will be handled through NRAC. LF-TBAC database is tagged with data domain N line of business (LOB) LF-tag: <LOB:N>. LOB tag is automatically shared with data domain N account and therefore database is available in that account. Access to Data Products in this database will be handled through LF-TBAC.

BDB-2279-ram-tag-share

In our solution we will demonstrate both NRAC and LF-TBAC approaches. With the NRAC approach, we will build up an event-based workflow that would automatically accept RAM share in the data domain accounts and automate the creation of the necessary metadata objects (eg. local database, resource links, etc). While with the LF-TBAC approach, we rely on permissions associated with the shared LF-Tags to allow producer data domains to manage their data products, and consumer data domains read access to the relevant data products associated with the LF-Tags that they requested access to.

We use CentralGovernance construct from ARA library to build a central governance account. It creates an EventBridge event bus to enable communication with data domain accounts that register as nodes on mesh. For each registered data domain, specific event bus rules are created that route events towards that account. Central governance account has a central metadata catalog that allows for data to be stored in different data domains, as opposed to a single central lake. For each registered data domain, we create two separate databases in central governance catalog to demonstrate both NRAC and LF-TBAC data sharing. CentralGovernance construct creates workflows for data product registration and data product sharing. We also deploy a self-service data platform UI  to enable good user experience to manage data domains, data products, and to simplify data discovery and sharing.

BDB-2279-central-gov

A data domain: producer and consumer

We use DataDomain construct from ARA library to build a data domain account that can be either producer, consumer, or both. Producers manage the lifecycle of their respective data products in their own AWS accounts. Typically, this data is stored in Amazon Simple Storage Service (Amazon S3). DataDomain construct creates a data lake storage with cross-account bucket policy that enables central governance account to access the data. Data is encrypted using AWS KMS, and central governance account has a permission to use the key. Config secret in AWS Secrets Manager contains all the necessary information to register data domain as a node on mesh in central governance. It includes: 1) data domain name, 2) S3 location that holds data products, and 3) encryption key ARN. DataDomain construct also creates data domain and crawler workflows to automate data product registration.

BDB-2279-data-domain

Creating an event-driven data mesh

Data mesh architectures typically require some level of communication and trust policy management to maintain least privileges of the relevant principals between the different accounts (for example, central governance to producer, central governance to consumer). We use event-driven approach via EventBridge to securely forward events from one event bus to event bus in another account while maintaining the least privilege access. When we register data domain to central governance account through the self-service data platform UI, we establish bi-directional communication between the accounts via EventBridge. Domain registration process also creates database in the central governance catalog to hold data products for that particular domain. Registered data domain is now a node on mesh and we can register new data products.

The following diagram shows data product registration process:

BDB-2279-register-dd-small

  1. Starts Register Data Product workflow that creates an empty table (the schema is managed by the producers in their respective producer account). This workflow also grants a cross-account permission to the producer account that allows producer to manage the schema of the table.
  2. When complete, this emits an event into the central event bus.
  3. The central event bus contains a rule that forwards the event to the producer’s event bus. This rule was created during the data domain registration process.
  4. When the producer’s event bus receives the event, it triggers the Data Domain workflow, which creates resource-links and grants permissions.
  5. Still in the producer account, Crawler workflow gets triggered when the Data Domain workflow state changes to Successful. This creates the crawler, runs it, waits and checks if the crawler is done, and deletes the crawler when it’s complete. This workflow is responsible for populating tables’ schemas.

Now other data domains can find newly registered data products using the self-service data platform UI and request access. The sharing process works in the same way as product registration by sending events from the central governance account to consumer data domain, and triggering specific workflows.

Solution Overview

The following high-level solution diagram shows how everything fits together and how event-driven architecture enables multiple accounts to form a data mesh. You can follow the workshop that we released to deploy the solution that we covered in this blog post. You can deploy multiple data domains and test both data registration and data sharing. You can also use self-service data platform UI to search through data products and request access using both LF-TBAC and NRAC approaches.

BDB-2279-arch-diagram

Conclusion

Implementing a data mesh on top of an event-driven architecture provides both flexibility and extensibility. A data mesh by itself has several moving parts to support various functionalities, such as onboarding, search, access management and sharing, and more. With an event-driven architecture, we can implement these functionalities in smaller components to make them easier to test, operate, and maintain. Future requirements and applications can use the event stream to provide their own functionality, making the entire mesh much more valuable to your organization.

To learn more how to design and build applications based on event-driven architecture, see the AWS Event-Driven Architecture page. To dive deeper into data mesh concepts, see the Design a Data Mesh Architecture using AWS Lake Formation and AWS Glue blog.

If you’d like our team to run data mesh workshop with you, please reach out to your AWS team.


About the authors


Jan Michael Go Tan is a Principal Solutions Architect for Amazon Web Services. He helps customers design scalable and innovative solutions with the AWS Cloud.

Dzenan Softic is a Senior Solutions Architect at AWS. He works with startups to help them define and execute their ideas. His main focus is in data engineering and infrastructure.

David Greenshtein is a Specialist Solutions Architect for Analytics at AWS with a passion for ETL and automation. He works with AWS customers to design and build analytics solutions enabling business to make data-driven decisions. In his free time, he likes jogging and riding bikes with his son.
Vincent Gromakowski is an Analytics Specialist Solutions Architect at AWS where he enjoys solving customers’ analytics, NoSQL, and streaming challenges. He has a strong expertise on distributed data processing engines and resource orchestration platform.

Better together: AWS SAM CLI and HashiCorp Terraform

Post Syndicated from Eric Johnson original https://aws.amazon.com/blogs/compute/better-together-aws-sam-cli-and-hashicorp-terraform/

This post is written by Suresh Poopandi, Senior Solutions Architect and Seb Kasprzak, Senior Solutions Architect.

Today, AWS is announcing the public preview of AWS Serverless Application Model CLI (AWS SAM CLI) support for local development, testing, and debugging of serverless applications defined using HashiCorp Terraform configuration.

AWS SAM and Terraform are open-source frameworks for building applications using infrastructure as code (IaC). Both frameworks allow building, changing, and managing cloud infrastructure in a repeatable way by defining resource configurations.

Previously, you could use the AWS SAM CLI to build, test, and debug applications defined by AWS SAM templates or through the AWS Cloud Development Kit (CDK). With this preview release, you can also use AWS SAM CLI to test and debug serverless applications defined using Terraform configurations.

Walkthrough of Terraform support

This blog post contains a sample Terraform template, which shows how developers can use AWS SAM CLI to build locally, test, and debug AWS Lambda functions defined in Terraform. This sample application has a Lambda function that stores a book review score and review text in an Amazon DynamoDB table. An Amazon API Gateway book review API uses Lambda proxy integration to invoke the book review Lambda function.

Demo application architecture

Demo application architecture

Prerequisites

Before running this example:

  • Install the AWS CLI.
    • Configure with valid AWS credentials.
    • Note that AWS CLI now requires Python runtime.
  • Install HashiCorp Terraform.
  • Install the AWS SAM CLI.
  • Install Docker (required to run AWS Lambda function locally).

Since Terraform support is currently in public preview, you must provide a –beta-features flag while executing AWS SAM commands. Alternatively, set this flag in samconfig.toml file by adding beta_features=”true”.

Deploying the example application

This Lambda function interacts with DynamoDB. For the example to work, it requires an existing DynamoDB table in an AWS account. Deploying this creates all the required resources for local testing and debugging of the Lambda function.

To deploy:

  1. Clone the aws-sam-terraform-examples repository locally:
    git clone https://github.com/aws-samples/aws-sam-terraform-examples
  2. Change to the project directory:
    cd aws-sam-terraform-examples/zip_based_lambda_functions/api-lambda-dynamodb-example/

    Terraform must store the state of the infrastructure and configuration it creates. Terraform uses this state to map cloud resources to configuration and track changes. This example uses a local backend to store the state file on the local filesystem.

  3. Open the main.tf file and review its contents. Locate the backend section of the code, updating the region field with the target deployment Region of this sample solution:
    provider “aws” {
        region = “<AWS region>” # e.g. us-east-1
    }
  4. Initialize a working directory containing Terraform configuration files:
    terraform init
  5. Deploy the application using Terraform CLI. When prompted by “Do you want to perform these actions?”, enter Yes.
    terraform apply

Terraform deploys the application, as shown in the terminal output.

Terminal output

Terminal output

After completing the deployment process, the AWS account is ready for use by the Lambda function with all the required resources.

Terraform Configuration for local testing

Lambda functions require application dependencies bundled together with function code as a deployment package (typically a .zip file) to run correctly. Terraform natively does not create the deployment package and a separate build process handles this package creation.

This sample application uses Terraform’s null_resource and local-exec provisioner to trigger a build process script. This installs Python dependencies in a temporary folder and creates a .zip file with dependencies and function code. It contains this logic within the main.tf file of the example application.

To explain each code segment in more detail:

Terraform example

Terraform example

  1. aws_lambda_function: This sample defines a Lambda function resource. It contains properties such as environment variables (in this example, the DynamoDB table_id) and the depends_on argument, which creates the .zip package before deploying the Lambda function.

    Terraform example

    Terraform example

  2. null_resource: When the AWS SAM CLI build command runs, AWS SAM reviews Terraform code for any null_resource starting with sam_metadata_ and uses the information contained within this resource block to gather the location of the Lambda function source code and .zip package. This information allows the AWS SAM CLI to start the local execution of the Lambda function. This special resource should contain the following attributes:
    • resource_name: The Lambda function address as defined in the current module (aws_lambda_function.publish_book_review)
    • resource_type: Packaging type of the Lambda function (ZIP_LAMBDA_FUNCTION)
    • original_source_code: Location of Lambda function code
    • built_output_path: Location of .zip deployment package

Local testing

With the backend services now deployed, run local tests to see if everything is working. The locally running sample Lambda function interacts with the services deployed in the AWS account. Run the sam build to reflect the local sam testing environment with changes after each code update.

  1. Local Build: To create a local build of the Lambda function for testing, use the sam build command:
    sam build --hook-name terraform --beta-features
  2. Local invoke: The first test is to invoke the Lambda function with a mocked event payload from the API Gateway. These events are in the events directory. Run this command, passing in a mocked event:
    AWS_DEFAULT_REGION=<Your Region Name>
    sam local invoke aws_lambda_function.publish_book_review -e events/new-review.json --beta-features

    AWS SAM mounts the Lambda function runtime and code and runs it locally. The function makes a request to the DynamoDB table in the cloud to store the information provided via the API. It returns a 200 response code, signaling the successful completion of the function.

  3. Local invoke from AWS CLI
    Another test is to run a local emulation of the Lambda service using “sam local start-lambda” and invoke the function directly using AWS SDK or the AWS CLI. Start the local emulator with the following command:

    sam local start-lambda
    Terminal output

    Terminal output

    AWS SAM starts the emulator and exposes a local endpoint for the AWS CLI or a software development kit (SDK) to call. With the start-lambda command still running, run the following command to invoke this function locally with the AWS CLI:

    aws lambda invoke --function-name aws_lambda_function.publish_book_review --endpoint-url http://127.0.0.1:3001/ response.json --cli-binary-format raw-in-base64-out --payload file://events/new-review.json

    The AWS CLI invokes the local function and returns a status report of the service to the screen. The response from the function itself is in the response.json file. The window shows the following messages:

    Invocation results

    Invocation results

  4. Debugging the Lambda function

Developers can use AWS SAM with a variety of AWS toolkits and debuggers to test and debug serverless applications locally. For example, developers can perform local step-through debugging of Lambda functions by setting breakpoints, inspecting variables, and running function code one line at a time.

The AWS Toolkit Integrated Development Environment (IDE) plugin provides the ability to perform many common debugging tasks, like setting breakpoints, inspecting variables, and running function code one line at a time. AWS Toolkits make it easier to develop, debug, and deploy serverless applications defined using AWS SAM. They provide an experience for building, testing, debugging, deploying, and invoking Lambda functions integrated into IDE. Refer to this link that lists common IDE/runtime combinations that support step-through debugging of AWS SAM applications.

Visual Studio Code keeps debugging configuration information in a launch.json file in a workspace .vscode folder. Here is a sample launch configuration file to debug Lambda code locally using AWS SAM and Visual Studio Code.

{
    "version": "0.2.0",
    "configurations": [
          {
            "name": "Attach to SAM CLI",
            "type": "python",
            "request": "attach",
            "address": "localhost",
            "port": 9999,
            "localRoot": "${workspaceRoot}/sam-terraform/book-reviews",
            "remoteRoot": "/var/task",
            "protocol": "inspector",
            "stopOnEntry": false
          }
    ]
}

After adding the launch configuration, start a debug session in the Visual Studio Code.

Step 1: Uncomment the following two lines in zip_based_lambda_functions/api-lambda-dynamodb-example/src/index.py

Enable debugging in the Lambda function

Enable debugging in the Lambda function

Step 2: Run the Lambda function in the debug mode and wait for the Visual Studio Code to attach to this debugging session:

sam local invoke aws_lambda_function.publish_book_review -e events/new-review.json -d 9999

Step 3: Select the Run and Debug icon in the Activity Bar on the side of VS Code. In the Run and Debug view, select “Attach to SAM CLI” and choose Run.

For this example, set a breakpoint at the first line of lambda_handler. This breakpoint allows viewing the input data coming into the Lambda function. Also, it helps in debugging code issues before deploying to the AWS Cloud.

Debugging in then IDE

Debugging in then IDE

Lambda Terraform module

A community-supported Terraform module for lambda (terraform-aws-lambda) has added support for SAM metadata null_resource. When using the latest version of this module, AWS SAM CLI will automatically support local invocation of the Lambda function, without additional resource blocks required.

Conclusion

This blog post shows how to use the AWS SAM CLI together with HashiCorp Terraform to develop and test serverless applications in a local environment. With AWS SAM CLI’s support for HashiCorp Terraform, developers can now use the AWS SAM CLI to test their serverless functions locally while choosing their preferred infrastructure as code tooling.

For more information about the features supported by AWS SAM, visit AWS SAM. For more information about the Metadata resource, visit HashiCorp Terraform.

Support for the Terraform configuration is currently in preview, and the team is asking for feedback and feature request submissions. The goal is for both communities to help improve the local development process using AWS SAM CLI. Submit your feedback by creating a GitHub issue here.

For more serverless learning resources, visit Serverless Land.

Easy Postgres integration on Cloudflare Workers with Neon.tech

Post Syndicated from Erwin van der Koogh original https://blog.cloudflare.com/neon-postgres-database-from-workers/

Easy Postgres integration on Cloudflare Workers with Neon.tech

Easy Postgres integration on Cloudflare Workers with Neon.tech

It’s no wonder that Postgres is one of the world’s favorite databases. It’s easy to learn, a pleasure to use, and can scale all the way up from your first database in an early-stage startup to the system of record for giant organizations. Postgres has been an integral part of Cloudflare’s journey, so we know this fact well. But when it comes to connecting to Postgres from environments like Cloudflare Workers, there are unfortunately a bunch of challenges, as we mentioned in our Relational Database Connector post.

Neon.tech not only solves these problems; it also has other cool features such as branching databases — being able to branch your database in exactly the same way you branch your code: instant, cheap and completely isolated.

How to use it

It’s easy to get started. Neon’s client library @neondatabase/serverless is a drop-in replacement for node-postgres, the npm pg package with which you may already be familiar. After going through the getting started process to set up your Neon database, you can easily create a Worker to ask Postgres for the current time like so:

  1. Create a new Worker — Run npx wrangler init neon-cf-demo and accept all the defaults. Enter the new folder with cd neon-cf-demo.
  2. Install the Neon package — Run npm install @neondatabase/serverless.
  3. Provide connection details — For deployment, run npx wrangler secret put DATABASE_URL and paste in your connection string when prompted (you’ll find this in your Neon dashboard: something like postgres://user:[email protected]/main). For development, create a new file .dev.vars with the contents DATABASE_URL= plus the same connection string.
  4. Write the code — Lastly, replace src/index.ts with the following code:

import { Client } from '@neondatabase/serverless';
interface Env { DATABASE_URL: string; }

export default {
  async fetch(request: Request, env: Env, ctx: ExecutionContext) {
    const client = new Client(env.DATABASE_URL);
    await client.connect();
    const { rows: [{ now }] } = await client.query('select now();');
    ctx.waitUntil(client.end());  // this doesn’t hold up the response
    return new Response(now);
  }
}

To try this locally, type npm start. To deploy it around the globe, type npx wrangler publish.

You can also check out the source for a slightly more complete demo app. This shows your nearest UNESCO World Heritage sites using IP geolocation in Cloudflare Workers and nearest-neighbor sorting in PostGIS.

Easy Postgres integration on Cloudflare Workers with Neon.tech

How does this work? In this case, we take the coordinates supplied to our Worker in request.cf.longitude and request.cf.latitude. We then feed these coordinates to a SQL query that uses the PostGIS distance operator <-> to order our results:

const { longitude, latitude } = request.cf
const { rows } = await client.query(`
  select 
    id_no, name_en, category,
    st_makepoint($1, $2) <-> location as distance
  from whc_sites_2021
  order by distance limit 10`,
  [longitude, latitude]
);

Since we created a spatial index on the location column, the query is blazing fast. The result (rows) looks like this:

[{
  "id_no": 308,
  "name_en": "Yosemite National Park",
  "category": "Natural",
  "distance": 252970.14782223428
},
{
  "id_no": 134,
  "name_en": "Redwood National and State Parks",
  "category": "Natural",
  "distance": 416334.3926827573
},
/* … */
]

For even lower latencies, we could cache these results at a slightly coarser geographical resolution — rounding, say, to one sixtieth of a degree (one arc minute) of longitude and latitude, which is a little under a mile.

Sign up to Neon using the invite code serverless and try the @neondatabase/serverless driver with Cloudflare Workers.

Why we did it

Cloudflare Workers has enormous potential to improve back-end development and deployment. It’s cost-effective, admin-free, and radically scalable.

The use of V8 isolates means Workers are now fast and lightweight enough for nearly any use case. But it has a key drawback: Cloudflare Workers don’t yet support raw TCP communication, which has made database connections a challenge.

Even when Workers eventually support raw TCP communication, we will not have fully solved our problem, because database connections are expensive to set up and also have quite a bit of memory overhead.

This is what the solution looks like:

Easy Postgres integration on Cloudflare Workers with Neon.tech

It consists of three parts:

  1. Connection pooling built into the platform — Given Neon’s serverless compute model, splitting storage and compute operations, it is not recommended to rely on a one-to-one mapping between external clients and Postgres connections. Instead, you can turn on connection pooling simply by flicking a switch (it’s in the Settings area of your Neon dashboard).
  2. WebSocket proxy — We deploy our own WebSocket-to-TCP proxy, written in Go. The proxy simply accepts WebSocket connections from Cloudflare Worker clients, relays message payloads to a requested (Neon-only) host over plain TCP, and relays back the responses.
  3. Client library — Our driver library is based on node-postgres but provides the necessary shims for Node.js features that aren’t present in Cloudflare Workers. Crucially, we replace Node’s net.Socket and tls.connect with code that redirects network reads and writes via the WebSocket connection. To support end-to-end TLS encryption between Workers and the database, we compile WolfSSL to WebAssembly with emscripten. Then we use esbuild to bundle it all together into an easy-to-use npm package.

The @neondatabase/serverless package is currently in public beta. We have plans to improve, extend, and explain it further in the near future on the Neon blog. In line with our commitment to open source, you can configure our serverless driver and/or run our WebSocket proxy to provide access to Postgres databases hosted anywhere — just see the respective repos for details.

So try Neon using invite code serverless, sign up and connect to it with Cloudflare Workers, and you’ll have a fully flexible back-end service running in next to no time.

Build applications of any size on Cloudflare with the Queues open beta

Post Syndicated from Rob Sutter original https://blog.cloudflare.com/cloudflare-queues-open-beta/

Build applications of any size on Cloudflare with the Queues open beta

Build applications of any size on Cloudflare with the Queues open beta

Message queues are a fundamental building block of cloud applications—and today the Cloudflare Queues open beta brings queues to every developer building for Region: Earth. Cloudflare Queues follows Cloudflare Workers and Cloudflare R2 in a long line of innovative services built for the Workers Developer Platform, enabling developers to build more complex applications without configuring networks, choosing regions, or estimating capacity. Best of all, like many other Cloudflare services, there are no egregious egress charges!

Build applications of any size on Cloudflare with the Queues open beta

If you’ve ever purchased something online and seen a message like “you will receive confirmation of your order shortly,” you’ve interacted with a queue. When you completed your order, your shopping cart and information were stored and the order was placed into a queue. At some later point, the order fulfillment service picks and packs your items and hands it off to the shipping service—again, via a queue. Your order may sit for only a minute, or much longer if an item is out of stock or a warehouse is busy, and queues enable all of this functionality.

Message queues are great at decoupling components of applications, like the checkout and order fulfillment services for an ecommerce site. Decoupled services are easier to reason about, deploy, and implement, allowing you to ship features that delight your customers without worrying about synchronizing complex deployments.

Queues also allow you to batch and buffer calls to downstream services and APIs. This post shows you how to enroll in the open beta, walks you through a practical example of using Queues to build a log sink, and tells you how we built Queues using other Cloudflare services. You’ll also learn a bit about the roadmap for the open beta.

Getting started

Enrolling in the open beta

Open the Cloudflare dashboard and navigate to the Workers section. Select Queues from the Workers navigation menu and choose Enable Queues Beta.

Review your order and choose Proceed to Payment Details.

Note: If you are not already subscribed to a Workers Paid Plan, one will be added to your order automatically.

Enter your payment details and choose Complete Purchase. That’s it – you’re enrolled in the open beta! Choose Return to Queues on the confirmation page to return to the Cloudflare Queues home page.

Creating your first queue

After enabling the open beta, open the Queues home page and choose Create Queue. Name your queue `my-first-queue` and choose Create queue. That’s all there is to it!

The dash displays a confirmation message along with a list of all the queues in your account.

Build applications of any size on Cloudflare with the Queues open beta

Note: As of the writing of this blog post each account is limited to ten queues. We intend to raise this limit as we build towards general availability.

Managing your queues with Wrangler

You can also manage your queues from the command line using Wrangler, the CLI for Cloudflare Workers. In this section, you build a simple but complete application implementing a log aggregator or sink to learn how to integrate Workers, Queues, and R2.

Setting up resources
To create this application, you need access to a Cloudflare Workers account with a subscription plan, access to the Queues open beta, and an R2 plan.

Install and authenticate Wrangler then run wrangler queues create log-sink from the command line to create a queue for your application.

Run wrangler queues list and note that Wrangler displays your new queue.

Note: The following screenshots use the jq utility to format the JSON output of wrangler commands. You do not need to install jq to complete this application.

Build applications of any size on Cloudflare with the Queues open beta

Finally, run wrangler r2 bucket create log-sink to create an R2 bucket to store your aggregated logs. After the bucket is created, run wrangler r2 bucket list to see your new bucket.

Build applications of any size on Cloudflare with the Queues open beta

Creating your Worker
Next, create a Workers application with two handlers: a fetch() handler to receive individual incoming log lines and a queue() handler to aggregate a batch of logs and write the batch to R2.

In an empty directory, run wrangler init to create a new Cloudflare Workers application. When prompted:

  • Choose “y” to create a new package.json
  • Choose “y” to use TypeScript
  • Choose “Fetch handler” to create a new Worker at src/index.ts
Build applications of any size on Cloudflare with the Queues open beta

Open wrangler.toml and replace the contents with the following:

wrangler.toml

name = "queues-open-beta"
main = "src/index.ts"
compatibility_date = "2022-11-03"
 
 
[[queues.producers]]
 queue = "log-sink"
 binding = "BUFFER"
 
[[queues.consumers]]
 queue = "log-sink"
 max_batch_size = 100
 max_batch_timeout = 30
 
[[r2_buckets]]
 bucket_name = "log-sink"
 binding = "LOG_BUCKET"

The [[queues.producers]] section creates a producer binding for the Worker at src/index.ts called BUFFER that refers to the log-sink queue. This Worker can place messages onto the log-sink queue by calling await env.BUFFER.send(log);

The [[queues.consumers]] section creates a consumer binding for the log-sink queue for your Worker. Once the log-sink queue has a batch ready to be processed (or consumed), the Workers runtime will look for the queue() event handler in src/index.ts and invoke it, passing the batch as an argument. The queue() function signature looks as follows:

async queue(batch: MessageBatch<Error>, env: Environment): Promise<void> {

The final binding in your wrangler.toml creates a binding for the log-sink R2 bucket that makes the bucket available to your Worker via env.LOG_BUCKET.

src/index.ts

Open src/index.ts and replace the contents with the following code:

export interface Env {
 BUFFER: Queue;
 LOG_BUCKET: R2Bucket;
}
 
export default {
 async fetch(request: Request, env: Environment): Promise<Response> {
   let log = await request.json();
   await env.BUFFER.send(log);
   return new Response("Success!");
 },
 async queue(batch: MessageBatch<Error>, env: Environment): Promise<void> {
   const logBatch = await JSON.stringify(batch.messages);
   await env.LOG_BUCKET.put(`logs/${Date.now()}.log.json`, logBatch);
 },
};

The export interface Env section exposes the two bindings you defined in wrangler.toml: a queue named BUFFER and an R2 bucket named LOG_BUCKET.

The fetch() handler transforms the request body into JSON, adds the body to the BUFFER queue, then returns an HTTP 200 response with the message Success!

The `queue()` handler receives a batch of messages that each contain log entries, iterates through concatenating each log into a string buffer, then writes that buffer to the LOG_BUCKET R2 bucket using the current timestamp as the filename.

Publishing and running your application
To publish your log sink application, run wrangler publish. Wrangler packages your application and its dependencies and deploys it to Cloudflare’s global network.

Build applications of any size on Cloudflare with the Queues open beta

Note that the output of wrangler publish includes the BUFFER queue binding, indicating that this Worker is a producer and can place messages onto the queue. The final line of output also indicates that this Worker is a consumer for the log-sink queue and can read and remove messages from the queue.

Use your favorite API client, like curl, httpie, or Postman, to send JSON log entries to the published URL for your Worker via HTTP POST requests. Navigate to your log-sink R2 bucket in the Cloudflare dashboard and note that the logs prefix is now populated with aggregated logs from your request.

Build applications of any size on Cloudflare with the Queues open beta

Download and open one of the logfiles to view the JSON array inside. That’s it – with fewer than 45 lines of code and config, you’ve built a log aggregator to ingest and store data in R2!

Build applications of any size on Cloudflare with the Queues open beta

Buffering R2 writes with Queues in the real world

In the previous example, you create a simple Workers application that buffers data into batches before writing the batches to R2. This reduces the number of calls to the downstream service, reducing load on the service and saving you money.

UUID.rocks, the fastest UUIDv4-as-a-service, wanted to confirm whether their API truly generates unique IDs on every request. With 80,000 requests per day, it wasn’t trivial to find out. They decided to write every generated UUID to R2 to compare IDs across the entire population. However, writing directly to R2 at the rate UUIDs are generated is inefficient and expensive.

To reduce writes and costs, UUID.rocks introduced Cloudflare Queues into their UUID generation workflow. Each time a UUID is requested, a Worker places the value of the UUID into a queue. Once enough messages have been received, the buffered batch of JSON objects is written to R2. This avoids invoking an R2 write on every API call, saving costs and making the data easier to process later.

The uuid-queue application consists of a single Worker with three event handlers:

  1. A fetch handler that receives a JSON object representing the generated UUID and writes it to a Cloudflare Queue.
  2. A queue handler that writes batches of JSON objects to R2 in CSV format.
  3. A scheduled handler that combines batches from the previous hour into a single file for future processing.

To view the source or deploy this application into your own account, visit the repository on GitHub.

How we built Cloudflare Queues

Like many of the Cloudflare services you use and love, we built Queues by composing other Cloudflare services like Workers and Durable Objects. This enabled us to rapidly solve two difficult challenges: securely invoking your Worker from our own service and maintaining a strongly consistent state at scale. Several recent Cloudflare innovations helped us overcome these challenges.

Securely invoking your Worker

In the Before Times (early 2022), invoking one Worker from another Worker meant a fresh HTTP call from inside your script. This was a brittle experience, requiring you to know your downstream endpoint at deployment time. Nested invocations ran as HTTP calls, passing all the way through the Cloudflare network a second time and adding latency to your request. It also meant security was on you – if you wanted to control how that second Worker was invoked, you had to create and implement your own authentication and authorization scheme.

Worker to Worker requests
During Platform Week in May 2022, Service Worker Bindings entered general availability. With Service Worker Bindings, your Worker code has a binding to another Worker in your account that you invoke directly, avoiding the network penalty of a nested HTTP call. This removes the performance and security barriers discussed previously, but it still requires that you hard-code your nested Worker at compile time. You can think of this setup as “static dispatch,” where your Worker has a static reference to another Worker where it can dispatch events.

Dynamic dispatch
As Service Worker Bindings entered general availability, we also launched a closed beta of Workers for Platforms, our tool suite to help make any product programmable. With Workers for Platforms, software as a service (SaaS) and platform providers can allow users to upload their own scripts and run them safely via Cloudflare Workers. User scripts are not known at compile time, but are dynamically dispatched at runtime.

Workers for Platforms entered general availability during GA week in September 2022, and is available for all customers to build with today.

With dynamic dispatch generally available, we now have the ability to discover and invoke Workers at runtime without the performance penalty of HTTP traffic over the network. We use dynamic dispatch to invoke your queue’s consumer Worker whenever a message or batch of messages is ready to be processed.

Consistent stateful data with Durable Objects

Another challenge we faced was storing messages durably without sacrificing performance. We took the design goal of ensuring that all messages were persisted to disk in multiple locations before we confirmed receipt of the message to the user. Again, we turned to an existing Cloudflare product—Durable Objects—which entered general availability nearly one year ago today.

Durable Objects are named instances of JavaScript classes that are guaranteed to be unique across Cloudflare’s entire network. Durable Objects process messages in-order and on a single-thread, allowing for coordination across messages and provide a strongly consistent storage API for key-value pairs. Offloading the hard problem of storing data durably in a distributed environment to Distributed Objects allowed us to reduce the time to build Queues and prepare it for open beta.

Open beta roadmap

Our open beta process empowers you to influence feature prioritization and delivery. We’ve set ambitious goals for ourselves on the path to general availability, most notably supporting unlimited throughput while maintaining 100% durability. We also have many other great features planned, like first-in first-out (FIFO) message processing and API compatibility layers to ease migrations, but we need your feedback to build what you need most, first.

Conclusion

Cloudflare Queues is a global message queue for the Workers developer. Building with Queues makes your applications more performant, resilient, and cost-effective—but we’re not done yet. Join the Open Beta today and share your feedback to help shape the Queues roadmap as we deliver application integration services for the next generation cloud.

Why Signeasy chose AWS Serverless to build their SaaS dashboard

Post Syndicated from Venkatramana Ameth Achar original https://aws.amazon.com/blogs/architecture/why-signeasy-chose-aws-serverless-to-build-their-saas-dashboard/

Signeasy is a leading eSignature company that offers an easy-to-use, cross-platform and cloud-based eSignature and document transaction management software as a service (SaaS) solution for businesses. Over 43,000 companies worldwide use Signeasy to digitize and streamline business workflows. In this blog, you will learn why and how Signeasy used AWS Serverless to create a SaaS dashboard for their tenants.

Signeasy’s SaaS tenants asked for an easier way to get insights into tenant usage data on Signeasy’s eSignature platform. To address that, Signeasy built a self-service usage metrics dashboard for their SaaS tenant using AWS Serverless.

Usage reports

What was it like before the self-service dashboard experience? In the past, tenants requested Signeasy to share their usage metrics through support channels or emails. The Signeasy support team compiled the reports and then emailed the report back to the tenant to service the request. This was a repetitive manual task. It involved querying a database, fetching and collating the results into an Excel table to be emailed to the tenant. The turnaround time on these manual reports was eight hours.

The following table illustrates the report format (with example data) that the tenants received through email.

Archives usage reports

Figure 1. Archived usage reports

The design

Signeasy deliberated numerous aspects and arrived at the following design considerations:

  • Enhance tenant experience — Provide the reports to tenants on-demand, using a self-service mechanism.
  • Scalable aggregation queries — The reports ran aggregation queries on usage data within a time range on a relational database management system (RDBMS). Signeasy considered moving to a data store that has the scalability to store and run aggregation queries on millions of records.
  • Agility — Signeasy wanted to build the module in a time-bound manner and deliver it to tenants as quickly as possible.
  • Reduce infrastructure management — The load on the reports infrastructure that stores and processes data increases linearly in relation to the count of usage reports requested. This meant an increase in the undifferentiated heavy lifting of infrastructure management tasks such as capacity management and patching.

With the design considerations and constraints called out, Signeasy began to look for the suitable solution. Signeasy decided to build their usage reports on a serverless architecture. They chose AWS Serverless, because it offers scalable compute and database, application integration capabilities, automatic scaling, and a pay-for-use billing model. This reduces infrastructure management tasks such as capacity provisioning and patching. Refer to the following diagram to see how Signeasy augmented their existing SaaS with self-service usage reports.

Architecture of self-service usage reports

Architecture diagram depicting the data flow of the self-service usage reports

Figure 2. Architecture diagram depicting the data flow of the self-service usage reports

  1. Signeasy’s tenant users log in to the Signeasy portal to authenticate their tenant identity.
  2. The Signeasy portal uses a combination of tenant ID and user ID in JSON Web Tokens (JWT) to distinguish one tenant user from another when storing and processing documents.
  3. The documents are stored in Amazon Simple Storage Service (Amazon S3).
  4. The users’ actions are stored in the transactional database on Amazon Relational Database Service (Amazon RDS).
  5. The user actions are also written as messages into message queue on Amazon Simple Queue Service (Amazon SQS). Signeasy used the queue to loosely couple their existing microservices on Amazon Elastic Kubernetes Service (Amazon EKS) with the new serverless part of the stack.
  6. This allows Signeasy to asynchronously process the messages in Amazon SQS with minimal changes to the existing microservices on EKS.
  7. The messages are processed by a report writer service (Python script) on AWS Lambda and written to the reports database on Amazon Timestream. The reports database on Timestream stores metadata attributes such as user ID and signature document ID, signature document sent, signature request received, document signed, and signature request cancelled or declined, and timestamp of the data point. To view usage reports, the tenant administrators navigate to the Reports section of the Signeasy portal and select Usage Reports.
  8. The usage reports request from the (tenant) Web Client on the browser is an API call to Amazon API Gateway.
  9. API Gateway works as a front door for the backend reports service running on a separate Lambda function.
  10. The reports service on Lambda uses the user ID from login details to query the Amazon Timestream database to generate the report and send it back to the web client through the API Gateway. The report is immediately available for the administrator to view, which is a huge improvement from having to wait for eight hours before this self-service feature was made available to their SaaS tenants.

Following is a mock-up of the Usage Reports dashboard:

A mockup of the Usage Reports page of the Signeasy portal

Figure 3. A mock-up of the Usage Reports page of the Signeasy portal

So, how did AWS Serverless help Signeasy?

Amazon SQS persists messages up to 14 days, and enables retry functionality for message processed in Lambda. Lambda is an event-driven serverless compute service that manages deployment and runs code, with logging and monitoring through Amazon CloudWatch. The integration of API Gateway with Lambda helped Signeasy easily deploy and manage the backend processing logic for the reports service. As usage of the reports grew, Timestream continued to scale, without the need to re-architect their application. Signeasy continued to use SQL to query data within the reports database on Timestream in a cost optimized manner.

Signeasy used AWS Serverless for its functionality without the undifferentiated heavy lifting of infrastructure management tasks such as capacity provisioning and patching. Signeasy’s support team is now more focused on higher-level organizational needs such as customer engagements, quarterly business reviews, and signature and payment related issues instead of managing infrastructure.

Conclusion

  • Going from eight hours to on-demand self-service (0 hours) response time for usage reports is a huge improvement in their SaaS tenant experience.
  • The AWS Serverless services scale out and in to meet customer needs. Signeasy pays only for what they use, and they don’t run compute infrastructure 24/7 in anticipation of requests throughout the day.
  • Signeasy’s support and customer success teams have repurposed their time toward higher value customer engagements vs. capacity, or patch management.
  • Development time for the Usage Reports dashboard was two weeks.

Further reading

How Hudl built a cost-optimized AWS Glue pipeline with Apache Hudi datasets

Post Syndicated from Indira Balakrishnan original https://aws.amazon.com/blogs/big-data/how-hudl-built-a-cost-optimized-aws-glue-pipeline-with-apache-hudi-datasets/

This is a guest blog post co-written with Addison Higley and Ramzi Yassine from Hudl.

Hudl Agile Sports Technologies, Inc. is a Lincoln, Nebraska based company that provides tools for coaches and athletes to review game footage and improve individual and team play. Its initial product line served college and professional American football teams. Today, the company provides video services to youth, amateur, and professional teams in American football as well as other sports, including soccer, basketball, volleyball, and lacrosse. It now serves 170,000 teams in 50 different sports around the world. Hudl’s overall goal is to capture and bring value to every moment in sports.

Hudl’s mission is to make every moment in sports count. Hudl does this by expanding access to more moments through video and data and putting those moments in context. Our goal is to increase access by different people and increase context with more data points for every customer we serve. Using data to generate analytics, Hudl is able to turn data into actionable insights, telling powerful stories with video and data.

To best serve our customers and provide the most powerful insights possible, we need to be able to compare large sets of data between different sources. For example, enriching our MongoDB and Amazon DocumentDB (with MongoDB compatibility) data with our application logging data leads to new insights. This requires resilient data pipelines.

In this post, we discuss how Hudl has iterated on one such data pipeline using AWS Glue to improve performance and scalability. We talk about the initial architecture of this pipeline, and some of the limitations associated with this approach. We also discuss how we iterated on that design using Apache Hudi to dramatically improve performance.

Problem statement

A data pipeline that ensures high-quality MongoDB and Amazon DocumentDB statistics data is available in our central data lake, and is a requirement for Hudl to be able to deliver sports analytics. It’s important to maintain the integrity of the data between MongoDB and Amazon DocumentDB transactional data with the data lake capturing changes in near-real time along with upserts to records in the data lake. Because Hudl statistics are backed by MongoDB and Amazon DocumentDB databases, in addition to a broad range of other data sources, it’s important that relevant MongoDB and Amazon DocumentDB data is available in a central data lake where we can run analytics queries to compare statistics data between sources.

Initial design

The following diagram demonstrates the architecture of our initial design.

Intial Ingestion Pipeline Design

Let’s discuss the key AWS services of this architecture:

  • AWS Data Migration Service (AWS DMS) allowed our team to move quickly in delivering this pipeline. AWS DMS gives our team a full snapshot of the data, and also offers ongoing change data capture (CDC). By combining these two datasets, we can ensure our pipeline delivers the latest data.
  • Amazon Simple Storage Service (Amazon S3) is the backbone of Hudl’s data lake because of its durability, scalability, and industry-leading performance.
  • AWS Glue allows us to run our Spark workloads in a serverless fashion, with minimal setup. We chose AWS Glue for its ease of use and speed of development. Additionally, features such as AWS Glue bookmarking simplified our file management logic.
  • Amazon Redshift offers petabyte-scale data warehousing. Amazon Redshift provides consistently fast performance, and easy integrations with our S3 data lake.

The data processing flow includes the following steps:

  1. Amazon DocumentDB holds the Hudl statistics data.
  2. AWS DMS gives us a full export of statistics data from Amazon DocumentDB, and ongoing changes in the same data.
  3. In the S3 Raw Zone, the data is stored in JSON format.
  4. An AWS Glue job merges the initial load of statistics data with the changed statistics data to give a snapshot of statistics data in JSON format for reference, eliminating duplicates.
  5. In the S3 Cleansed Zone, the JSON data is normalized and converted to Parquet format.
  6. AWS Glue uses a COPY command to insert Parquet data into Amazon Redshift consumption base tables.
  7. Amazon Redshift stores the final table for consumption.

The following is a sample code snippet from the AWS Glue job in the initial data pipeline:

from awsglue.context import GlueContext 
from pyspark.sql.session import SparkSession

spark = SparkSession.builder.getOrCreate() 
spark_context = spark.sparkContext 
gc = GlueContext(spark_context)
   full_df = read_full_data()#Load entire dataset from S3 Cleansed Zone


cdc_df = read_cdc_data() # Read new CDC data which represents delta in the source MongoDB/DocumentDB


joined_df = full_df.join(cdc_df, '_id', 'full_outer') #Calculate final snapshot by joining the existing data with delta


result = joined_df.filter((joined_df.Op != 'D') | (joined_df.Op.isNull())) .select(coalesce(cdc_df._doc, full_df._doc).alias('_doc'))

gc.write_dynamic_frame.from_options(frame=DynamicFrame.fromDF(result, gc) , connection_type = "s3", connection_options = {"path": output_path}, format = "parquet", transformation_ctx = "ctx4")

Challenges

Although this initial solution met our need for data quality, we felt there was room for improvement:

  • The pipeline was slow – The pipeline ran slowly (over 2 hours) because for each batch, the whole dataset was compared. Every record had to be compared, flattened, and converted to Parquet, even when only a few records were changed from the previous daily run.
  • The pipeline was expensive – As the data size grew daily, the job duration also grew significantly (especially in step 4). To mitigate the impact, we needed to allocate more AWS Glue DPUs (Data Processing Units) to scale the job, which led to higher cost.
  • The pipeline limited our ability to scale – Hudl’s data has a long history of rapid growth with increasing customers and sporting events. Given this trend, our pipeline needed to run as efficiently as possible to handle only changing datasets to have predictable performance.

New design

The following diagram illustrates our updated pipeline architecture.

Although the overall architecture looks roughly the same, the internal logic in AWS Glue was significantly changed, along with addition of Apache Hudi datasets.

In step 4, AWS Glue now interacts with Apache HUDI datasets in the S3 Cleansed Zone to upsert or delete changed records as identified by AWS DMS CDC. The AWS Glue to Apache Hudi connector helps convert JSON data to Parquet format and upserts into the Apache HUDI dataset. Retaining the full documents in our Apache HUDI dataset allows us to easily make schema changes to our final Amazon Redshift tables without needing to re-export data from our source systems.

The following is a sample code snippet from the new AWS Glue pipeline:

from awsglue.context import GlueContext 
from pyspark.sql.session import SparkSession

spark = SparkSession.builder.getOrCreate() 
spark_context = spark.sparkContext 
gc = GlueContext(spark_context)

upsert_conf = {'className': 'org.apache.hudi', '
hoodie.datasource.hive_sync.use_jdbc': 'false', 
'hoodie.datasource.write.precombine.field': 'write_ts', 
'hoodie.datasource.write.recordkey.field': '_id', 
'hoodie.table.name': 'glue_table', 
'hoodie.consistency.check.enabled': 'true', 
'hoodie.datasource.hive_sync.database': 'glue_database', 'hoodie.datasource.hive_sync.table': 'glue_table', 'hoodie.datasource.hive_sync.enable': 'true', 'hoodie.datasource.hive_sync.support_timestamp': 'true', 'hoodie.datasource.hive_sync.sync_as_datasource': 'false', 
'path': 's3://bucket/prefix/', 'hoodie.compact.inline': 'false', 'hoodie.datasource.hive_sync.partition_extractor_class':'org.apache.hudi.hive.NonPartitionedExtractor, 'hoodie.datasource.write.keygenerator.class': 'org.apache.hudi.keygen.NonpartitionedKeyGenerator', 'hoodie.upsert.shuffle.parallelism': 200, 
'hoodie.datasource.write.operation': 'upsert', 
'hoodie.cleaner.policy': 'KEEP_LATEST_COMMITS', 
'hoodie.cleaner.commits.retained': 10 }

gc.write_dynamic_frame.from_options(frame=DynamicFrame.fromDF(cdc_upserts_df, gc, "cdc_upserts_df"), connection_type="marketplace.spark", connection_options=upsert_conf)

Results

With this new approach using Apache Hudi datasets with AWS Glue deployed after May 2022, the pipeline runtime was predictable and less expensive than the initial approach. Because we only handled new or modified records by eliminating the full outer join over the entire dataset, we saw an 80–90% reduction in runtime for this pipeline, thereby reducing costs by 80–90% compared to the initial approach. The following diagram illustrates our processing time before and after implementing the new pipeline.

Conclusion

With Apache Hudi’s open-source data management framework, we simplified incremental data processing in our AWS Glue data pipeline to manage data changes at the record level in our S3 data lake with CDC from Amazon DocumentDB.

We hope that this post will inspire your organization to build AWS Glue pipelines with Apache Hudi datasets that reduce cost and bring performance improvements using serverless technologies to achieve your business goals.


About the authors

Addison Higley is a Senior Data Engineer at Hudl. He manages over 20 data pipelines to help ensure data is available for analytics so Hudl can deliver insights to customers.

Ramzi Yassine is a Lead Data Engineer at Hudl. He leads the architecture, implementation of Hudl’s data pipelines and data applications, and ensures that our data empowers internal and external analytics.

Swagat Kulkarni is a Senior Solutions Architect at AWS and an AI/ML enthusiast. He is passionate about solving real-world problems for customers with cloud-native services and machine learning. Swagat has over 15 years of experience delivering several digital transformation initiatives for customers across multiple domains, including retail, travel and hospitality, and healthcare. Outside of work, Swagat enjoys travel, reading, and meditating.

Indira Balakrishnan is a Principal Solutions Architect in the AWS Analytics Specialist SA Team. She is passionate about helping customers build cloud-based analytics solutions to solve their business problems using data-driven decisions. Outside of work, she volunteers at her kids’ activities and spends time with her family.

How SOCAR built a streaming data pipeline to process IoT data for real-time analytics and control

Post Syndicated from DoYeun Kim original https://aws.amazon.com/blogs/big-data/how-socar-built-a-streaming-data-pipeline-to-process-iot-data-for-real-time-analytics-and-control/

SOCAR is the leading Korean mobility company with strong competitiveness in car-sharing. SOCAR has become a comprehensive mobility platform in collaboration with Nine2One, an e-bike sharing service, and Modu Company, an online parking platform. Backed by advanced technology and data, SOCAR solves mobility-related social problems, such as parking difficulties and traffic congestion, and changes the car ownership-oriented mobility habits in Korea.

SOCAR is building a new fleet management system to manage the many actions and processes that must occur in order for fleet vehicles to run on time, within budget, and at maximum efficiency. To achieve this, SOCAR is looking to build a highly scalable data platform using AWS services to collect, process, store, and analyze internet of things (IoT) streaming data from various vehicle devices and historical operational data.

This in-car device data, combined with operational data such as car details and reservation details, will provide a foundation for analytics use cases. For example, SOCAR will be able to notify customers if they have forgotten to turn their headlights off or to schedule a service if a battery is running low. Unfortunately, the previous architecture didn’t enable the enrichment of IoT data with operational data and couldn’t support streaming analytics use cases.

AWS Data Lab offers accelerated, joint-engineering engagements between customers and AWS technical resources to create tangible deliverables that accelerate data and analytics modernization initiatives. The Build Lab is a 2–5-day intensive build with a technical customer team.

In this post, we share how SOCAR engaged the Data Lab program to assist them in building a prototype solution to overcome these challenges, and to build the basis for accelerating their data project.

Use case 1: Streaming data analytics and real-time control

SOCAR wanted to utilize IoT data for a new business initiative. A fleet management system, where data comes from IoT devices in the vehicles, is a key input to drive business decisions and derive insights. This data is captured by AWS IoT and sent to Amazon Managed Streaming for Apache Kafka (Amazon MSK). By joining the IoT data to other operational datasets, including reservations, car information, device information, and others, the solution can support a number of functions across SOCAR’s business.

An example of real-time monitoring is when a customer turns off the car engine and closes the car door, but the headlights are still on. By using IoT data related to the car light, door, and engine, a notification is sent to the customer to inform them that the car headlights should be turned off.

Although this real-time control is important, they also want to collect historical data—both raw and curated data—in Amazon Simple Storage Service (Amazon S3) to support historical analytics and visualizations by using Amazon QuickSight.

Use case 2: Detect table schema change

The first challenge SOCAR faced was existing batch ingestion pipelines that were prone to breaking when schema changes occurred in the source systems. Additionally, these pipelines didn’t deliver data in a way that was easy for business analysts to consume. In order to meet the future data volumes and business requirements, they needed a pattern for the automated monitoring of batch pipelines with notification of schema changes and the ability to continue processing.

The second challenge was related to the complexity of the JSON files being ingested. The existing batch pipelines weren’t flattening the five-level nested structure, which made it difficult for business users and analysts to gain business insights without any effort on their end.

Overview of solution

In this solution, we followed the serverless data architecture to establish a data platform for SOCAR. This serverless architecture allowed SOCAR to run data pipelines continuously and scale automatically with no setup cost and without managing servers.

AWS Glue is used for both the streaming and batch data pipelines. Amazon Kinesis Data Analytics is used to deliver streaming data with subsecond latencies. In terms of storage, data is stored in Amazon S3 for historical data analysis, auditing, and backup. However, when frequent reading of the latest snapshot data is required by multiple users and applications concurrently, the data is stored and read from Amazon DynamoDB tables. DynamoDB is a key-value and document database that can support tables of virtually any size with horizontal scaling.

Let’s discuss the components of the solution in detail before walking through the steps of the entire data flow.

Component 1: Processing IoT streaming data with business data

The first data pipeline (see the following diagram) processes IoT streaming data with business data from an Amazon Aurora MySQL-Compatible Edition database.

Whenever a transaction occurs in two tables in the Aurora MySQL database, this transaction is captured as data and then loaded into two MSK topics via AWS Database Management (AWS DMS) tasks. One topic conveys the car information table, and the other topic is for the device information table. This data is loaded into a single DynamoDB table that contains all the attributes (or columns) that exist in the two tables in the Aurora MySQL database, along with a primary key. This single DynamoDB table contains the latest snapshot data from the two DB tables, and is important because it contains the latest information of all the cars and devices for the lookup against the streaming IoT data. If the lookup were done on the database directly with the streaming data, it would impact the production database performance.

When the snapshot is available in DynamoDB, an AWS Glue streaming job runs continuously to collect the IoT data and join it with the latest snapshot data in the DynamoDB table to produce the up-to-date output, which is written into another DynamoDB table.

The up-to-date data in DynamoDB is used for real-time monitoring and control that SOCAR’s Data Analytics team performs for safety maintenance and fleet management. This data is ultimately consumed by a number of apps to perform various business activities, including route optimization, real-time monitoring for oil consumption and temperature, and to identify a driver’s driving pattern, tire wear and defect detection, and real-time car crash notifications.

Component 2: Processing IoT data and visualizing the data in dashboards

The second data pipeline (see the following diagram) batch processes the IoT data and visualizes it in QuickSight dashboards.

There are two data sources. The first is the Aurora MySQL database. The two database tables are exported into Amazon S3 from the Aurora MySQL cluster and registered in the AWS Glue Data Catalog as tables. The second data source is Amazon MSK, which receives streaming data from AWS IoT Core. This requires you to create a secure AWS Glue connection for an Apache Kafka data stream. SOCAR’s MSK cluster requires SASL_SSL as a security protocol (for more information, refer to Authentication and authorization for Apache Kafka APIs). To create an MSK connection in AWS Glue and set up connectivity, we use the following CLI command:

aws glue create-connection —connection-input
'{"Name":"kafka-connection","Description":"kafka connection example",
"ConnectionType":"KAFKA",
"ConnectionProperties":{
"KAFKA_BOOTSTRAP_SERVERS":"<server-ip-addresses>",
"KAFKA_SSL_ENABLED":"true",
// "KAFKA_CUSTOM_CERT": "s3://bucket/prefix/cert.pem",
"KAFKA_SECURITY_PROTOCOL" : "SASL_SSL",
"KAFKA_SKIP_CUSTOM_CERT_VALIDATION":"false",
"KAFKA_SASL_MECHANISM": "SCRAM-SHA-512",
"KAFKA_SASL_SCRAM_USERNAME": "<username>",
"KAFKA_SASL_SCRAM_PASSWORD: "<password>"
},
"PhysicalConnectionRequirements":
{"SubnetId":"subnet-xxx","SecurityGroupIdList":["sg-xxx"],"AvailabilityZone":"us-east-1a"}}'

Component 3: Real-time control

The third data pipeline processes the streaming IoT data in millisecond latency from Amazon MSK to produce the output in DynamoDB, and sends a notification in real time if any records are identified as an outlier based on business rules.

AWS IoT Core provides integrations with Amazon MSK to set up real-time streaming data pipelines. To do so, complete the following steps:

  1. On the AWS IoT Core console, choose Act in the navigation pane.
  2. Choose Rules, and create a new rule.
  3. For Actions, choose Add action and choose Kafka.
  4. Choose the VPC destination if required.
  5. Specify the Kafka topic.
  6. Specify the TLS bootstrap servers of your Amazon MSK cluster.

You can view the bootstrap server URLs in the client information of your MSK cluster details. The AWS IoT rule was created with the Kafka topic as an action to provide data from AWS IoT Core to Kafka topics.

SOCAR used Amazon Kinesis Data Analytics Studio to analyze streaming data in real time and build stream-processing applications using standard SQL and Python. We created one table from the Kafka topic using the following code:

CREATE TABLE table_name (
column_name1 VARCHAR,
column_name2 VARCHAR(100),
column_name3 VARCHAR,
column_name4 as TO_TIMESTAMP (`time_column`, 'EEE MMM dd HH:mm:ss z yyyy'),
 WATERMARK FOR column AS column -INTERVAL '5' SECOND
)
PARTITIONED BY (column_name5)
WITH (
'connector'= 'kafka',
'topic' = 'topic_name',
'properties.bootstrap.servers' = '<bootstrap servers shown in the MSK client info dialog>',
'format' = 'json',
'properties.group.id' = 'testGroup1',
'scan.startup.mode'= 'earliest-offset'
);

Then we applied a query with business logic to identify a particular set of records that need to be alerted. When this data is loaded back into another Kafka topic, AWS Lambda functions trigger the downstream action: either load the data into a DynamoDB table or send an email notification.

Component 4: Flattening the nested structure JSON and monitoring schema changes

The final data pipeline (see the following diagram) processes complex, semi-structured, and nested JSON files.

This step uses an AWS Glue DynamicFrame to flatten the nested structure and then land the output in Amazon S3. After the data is loaded, it’s scanned by an AWS Glue crawler to update the Data Catalog table and detect any changes in the schema.

Data flow: Putting it all together

The following diagram illustrates our complete data flow with each component.

Let’s walk through the steps of each pipeline.

The first data pipeline (in red) processes the IoT streaming data with the Aurora MySQL business data:

  1. AWS DMS is used for ongoing replication to continuously apply source changes to the target with minimal latency. The source includes two tables in the Aurora MySQL database tables (carinfo and deviceinfo), and each is linked to two MSK topics via AWS DMS tasks.
  2. Amazon MSK triggers a Lambda function, so whenever a topic receives data, a Lambda function runs to load data into DynamoDB table.
  3. There is a single DynamoDB table with columns that exist from the carinfo table and the deviceinfo table of the Aurora MySQL database. This table consists of all the data from two tables and stores the latest data by performing an upsert operation.
  4. An AWS Glue job continuously receives the IoT data and joins it with data in the DynamoDB table to produce the output into another DynamoDB target table.
  5. This target table contains the final data, which includes all the device and car status information from the IoT devices as well as metadata from the Aurora MySQL table.

The second data pipeline (in green) batch processes IoT data to use in dashboards and for visualization:

  1. The car and reservation data (in two DB tables) is exported via a SQL command from the Aurora MySQL database with the output data available in an S3 bucket. The folders that contain data are registered as an S3 location for the AWS Glue crawler and become available via the AWS Glue Data Catalog.
  2. The MSK input topic continuously receives data from AWS IoT. Each car has a number of IoT devices, and each device captures data and sends it to an MSK input topic. The Amazon MSK S3 sink connector is configured to export data from Kafka topics to Amazon S3 in JSON formats. In addition, the S3 connector exports data by guaranteeing exactly-once delivery semantics to consumers of the S3 objects it produces.
  3. The AWS Glue job runs in a daily batch to load the historical IoT data into Amazon S3 and into two tables (refer to step 1) to produce the output data in an Enriched folder in Amazon S3.
  4. Amazon Athena is used to query data from Amazon S3 and make it available as a dataset in QuickSight for visualizing historical data.

The third data pipeline (in blue) processes streaming IoT data from Amazon MSK with millisecond latency to produce the output in DynamoDB and send a notification:

  1. An Amazon Kinesis Data Analytics Studio notebook powered by Apache Zeppelin and Apache Flink is used to build and deploy its output as a Kinesis Data Analytics application. This application loads data from Amazon MSK in real time, and users can apply business logic to select particular events coming from the IoT real-time data, for example, the car engine is off and the doors are closed, but the headlights are still on. The particular event that users want to capture can be sent to another MSK topic (Outlier) via the Kinesis Data Analytics application.
  2. Amazon MSK triggers a Lambda function, so whenever a topic receives data, a Lambda function runs to send an email notification to users that are subscribed to an Amazon Simple Notification Service (Amazon SNS) topic. An email is published using an SNS notification.
  3. The Kinesis Data Analytics application loads data from AWS IoT, applies business logic, and then loads it into another MSK topic (output). Amazon MSK triggers a Lambda function when data is received, which loads data into a DynamoDB Append table.
  4. Amazon Kinesis Data Analytics Studio is used to run SQL commands for ad hoc interactive analysis on streaming data.

The final data pipeline (in yellow) processes complex, semi-structured, and nested JSON files, and sends a notification when a schema evolves.

  1. An AWS Glue job runs and reads the JSON data from Amazon S3 (as a source), applies logic to flatten the nested schema using a DynamicFrame, and pivots out array columns from the flattened frame.
  2. The output is stored in Amazon S3 and is automatically registered to the AWS Glue Data Catalog table.
  3. Whenever there is a new attribute or change in the JSON input data at any level in the nested structure, the new attribute and change are captured in Amazon EventBridge as an event from the AWS Glue Data Catalog. An email notification is published using Amazon SNS.

Conclusion

As a result of the four-day Build Lab, the SOCAR team left with a working prototype that is custom fit to their needs, gaining a clear path to production. The Data Lab allowed the SOCAR team to build a new streaming data pipeline, enrich IoT data with operational data, and enhance the existing data pipeline to process complex nested JSON data. This establishes a baseline architecture to support the new fleet management system beyond the car-sharing business.


About the Authors

DoYeun Kim is the Head of Data Engineering at SOCAR. He is a passionate software engineering professional with 19+ years experience. He leads a team of 10+ engineers who are responsible for the data platform, data warehouse and MLOps engineering, as well as building in-house data products.

SangSu Park is a Lead Data Architect in SOCAR’s cloud DB team. His passion is to keep learning, embrace challenges, and strive for mutual growth through communication. He loves to travel in search of new cities and places.

YoungMin Park is a Lead Architect in SOCAR’s cloud infrastructure team. His philosophy in life is-whatever it may be-to challenge, fail, learn, and share such experiences to build a better tomorrow for the world. He enjoys building expertise in various fields and basketball.

Younggu Yun is a Senior Data Lab Architect at AWS. He works with customers around the APAC region to help them achieve business goals and solve technical problems by providing prescriptive architectural guidance, sharing best practices, and building innovative solutions together. In his free time, his son and he are obsessed with Lego blocks to build creative models.

Vicky Falconer leads the AWS Data Lab program across APAC, offering accelerated joint engineering engagements between teams of customer builders and AWS technical resources to create tangible deliverables that accelerate data analytics modernization and machine learning initiatives.

Introducing the AWS Lambda Telemetry API

Post Syndicated from Julian Wood original https://aws.amazon.com/blogs/compute/introducing-the-aws-lambda-telemetry-api/

This blog post is written by Anton Aleksandrov, Principal Solution Architect and Shridhar Pandey, Senior Product Manager

Today AWS is announcing the AWS Lambda Telemetry API. This provides an easier way to receive enhanced function telemetry directly from the Lambda service and send it to custom destinations. Developers and operators can now more easily monitor and observe their Lambda functions using Lambda extensions from their preferred observability tool providers.

Extensions can use the Lambda Logs API to collect logs generated by the Lambda service and code running in their Lambda function. While the Logs API provides extensions with access to logs, it does not provide a way to collect additional telemetry, such as traces and metrics, which the Lambda service generates during initialization and invocation of your Lambda function.

Previously, observability tools retrieved traces from AWS X-Ray using the AWS X-Ray API or built their own custom tracing libraries to generate traces during Lambda function invocation. Tools required customers to modify AWS Identity and Access Management (IAM) policies to grant access to the traces from X-Ray. This caused additional complexity for tools to collect traces and metrics from multiple sources and introduced latency in seeing Lambda function traces in observability tool dashboards.

The Lambda Telemetry API is a new API that enhances the existing Lambda Logs API functionality. With the new Telemetry API, observability tools can receive function and extension logs, and also events, traces, and metrics directly from within the Lambda service. You do not need to install additional tracing libraries. This reduces latency and simplifies access permissions, as the extension does not require additional access to X-Ray.

Today you can use Telemetry API-enabled extensions to send telemetry data to Coralogix, Datadog, Dynatrace, Lumigo, New Relic, Sedai, Site24x7, Serverless.com, Sumo Logic, Sysdig, Thundra, or your own custom destinations.

Overview

To receive logs, extensions subscribe using the new Lambda Telemetry API.

Lambda Telemetry API

Lambda Telemetry API

The Lambda service then streams the telemetry events directly to the extension. The events include platform events, trace spans, function and extension logs, and additional Lambda platform metrics. The extension can then process, filter, and route them to any preferred destination.

You can add an extension from the tooling provider of your choice to your Lambda function. You can deploy extensions, including ones that use the Telemetry API, as Lambda layers, with the AWS Management Console and AWS Command Line Interface (AWS CLI). You can also use infrastructure as code tools such as AWS CloudFormation, the AWS Serverless Application Model (AWS SAM), Serverless Framework, and Terraform.

Lambda Extensions from the AWS Partner Network (APN) available at launch

Today, you can use Lambda extensions that use Telemetry API from the following Lambda partners:

  • The Coralogix AWS Lambda Telemetry Exporter extension now offers improved monitoring and alerting for Lambda functions by further streamlining collection and correlation of logs, metrics, and traces.
  • The Datadog extension further simplifies how you visualize the impact of cold starts, and monitor and alert on latency, duration, and payload size of your Lambda functions by collecting logs, traces, and real-time metrics from your function in a simple and cost-effective way.
  • Dynatrace now provides a simplified observability configuration for AWS Lambda through a seamless integration. The new solution delivers low-latency telemetry, enables monitoring at scale, and helps reduce monitoring costs for your serverless workloads.
  • The Lumigo lambda-log-shipper extension simplifies aggregating and forwarding Lambda logs to third-party tools. It now also makes it easy for you to detect Lambda function timeouts.
  • The New Relic extension now provides a unified observability view for your Lambda functions with insights that help you better understand and optimize the performance of your functions.
  • Sedai now uses the Telemetry API to help you improve the performance and availability of your Lambda functions by gathering insights about your function and providing recommendations for manual and autonomous remediation in a cost-effective manner.
  • The Site24x7 extension now offers new metrics, which enable you to get deeper insights into the different phases of the Lambda function lifecycle, such as initialization and invocation.
  • Serverless.com now uses the Telemetry API to provide real-time performance details for your Lambda function through the Dev Mode feature of their new Serverless Console V.2 offering, which simplifies debugging in the AWS Cloud.
  • Sumo Logic now makes it easier, faster, and more cost-effective for you to get your mission-critical Lambda function telemetry sent directly to Sumo Logic so you could quickly analyze and remediate errors and exceptions.
  • The Sysdig Monitor extension generates and collects real-time metrics directly from the Lambda platform. The simplified instrumentation offers lower latency, reduced MTTR (mean time to resolution) for critical issues, and cost benefits while monitoring your serverless applications.
  • The Thundra extension enables you to export logs, metrics, and events for Lambda execution environment lifecycle events emitted by the Telemetry API to a destination of your choice such as an S3 bucket, a database, or a monitoring backend.

Seeing example Telemetry API extensions in action

This demo shows an example of using a telemetry extension to receive telemetry, batch, and send it to a desired destination.

To set up the example, visit the GitHub repo for the extension implemented in the language of your choice and follow the instructions in the README.md file.

To configure the batching behavior, which controls when the extension sends the data, set the Lambda environment variable DISPATCH_MIN_BATCH_SIZE. When the extension receives the batch threshold, it POSTs the telemetry events batch to the destination specified in the DISPATCH_POST_URI environment variable.

You can configure an example DISPATCH_POST_URL for the extension to deliver the telemetry data using https://webhook.site/.

Lambda environment variables

Lambda environment variables

Telemetry events for one invoke may be received and processed during the next invocation. Events for the last invoke may be processed during the SHUTDOWN event.

Test and invoke the function from the Lambda console, or AWS CLI. You can see that the webhook receives the telemetry data.

Webhook receiving telemetry data

Webhook receiving telemetry data

You can also view the function and extension logs in CloudWatch Logs. The example extension includes verbose logging to understand the extension lifecycle.

CloudWatch Logs showing extension verbose logging

Sample Telemetry API events

When the extension receives telemetry data, each event contains a JSON dictionary with additional information, such as related metrics or trace spans. The following example shows a function initialization event. You can see that the function initializes with on-demand concurrency. The runtime version is Node.js 14, the initialization is successful, and the initialization duration is 123 milliseconds.

{
  "time": "2022-08-02T12:01:23.521Z",
  "type": "platform.initStart",
  "record": {
    "initializationType": "on-demand",
    "phase":"init",
    "runtimeVersion": "nodejs-14.v3",
    "runtimeVersionArn": "arn"
  }
}

{
  "time": "2022-08-02T12:01:23.521Z",
  "type": "platform.initRuntimeDone",
  "record": {
    "initializationType": "on-demand",
    "status": "success"
  }
}

{
  "time": "2022-08-02T12:01:23.521Z",
  "type": "platform.initReport",
  "record": {
    "initializationType": "on-demand",
    "phase":"init",
    "metrics": {
      "durationMs": 123.0,
    }
  }
}

Function invocation events include the associated requestId and tracing information connecting this invocation with the X-Ray tracing context, and platform spans showing response latency and response duration as well as invocation metrics such as duration in milliseconds.

{
    "time": "2022-08-02T12:01:23.521Z",
    "type": "platform.start",
    "record": {
      "requestId": "e6b761a9-c52d-415d-b040-7ba94b9452f3",
      "version": "$LATEST",
      "tracing": {
        "spanId": "54565fb41ac79632",
        "type": "X-Amzn-Trace-Id",
        "value": "Root=1-62e900b2-710d76f009d6e7785905449a;Parent=0efbd19962d95b05;Sampled=1"
      }
    }
  }
  
  {
    "time": "2022-08-02T12:01:23.521Z",
    "type": "platform.runtimeDone",
    "record": {
      "requestId": "e6b761a9-c52d-415d-b040-7ba94b9452f3",
      "status": "success",
      "tracing": {
        "spanId": "54565fb41ac79632",
        "type": "X-Amzn-Trace-Id",
        "value": "Root=1-62e900b2-710d76f009d6e7785905449a;Parent=0efbd19962d95b05;Sampled=1"
      },
      "spans": [
        {
          "name": "responseLatency", 
          "start": "2022-08-02T12:01:23.521Z",
          "durationMs": 23.02
        },
        {
          "name": "responseDuration", 
          "start": "2022-08-02T12:01:23.521Z",
          "durationMs": 20
        }
      ],
      "metrics": {
        "durationMs": 200.0,
        "producedBytes": 15
      }
    }
  }
  
  {
    "time": "2022-08-02T12:01:23.521Z",
    "type": "platform.report",
    "record": {
      "requestId": "e6b761a9-c52d-415d-b040-7ba94b9452f3",
      "metrics": {
        "durationMs": 220.0,
        "billedDurationMs": 300,
        "memorySizeMB": 128,
        "maxMemoryUsedMB": 90,
        "initDurationMs": 200.0
      },
      "tracing": {
        "spanId": "54565fb41ac79632",
        "type": "X-Amzn-Trace-Id",
        "value": "Root=1-62e900b2-710d76f009d6e7785905449a;Parent=0efbd19962d95b05;Sampled=1"
      }
    }
  }

Building a Telemetry API extension

Lambda extensions run as independent processes in the execution environment and continue to run after the function invocation is fully processed. Because extensions run as separate processes, you can write them in a language different from the function code. We recommend implementing extensions using a compiled language as a self-contained binary. This makes the extension compatible with all the supported runtimes.

Extensions that use the Telemetry API have the following lifecycle.

Telemetry API lifecycle

Telemetry API lifecycle

  1. The extension registers itself using the Lambda Extension API and subscribes to receive INVOKE and SHUTDOWN events. With the Telemetry API, the registration response body contains additional information, such as function name, function version, and account ID.
  2. The extensions start a telemetry listener. This is a local HTTP or TCP endpoint. We recommend using HTTP rather than TCP.
  3. The extensions use the Telemetry API to subscribe to desired telemetry event streams.
  4. The Lambda service POSTs telemetry stream data to your telemetry listener. We recommend batching the telemetry data as it arrives to the listener. You can perform any custom processing on this data and send it on to an S3 bucket, other custom destination, or an external observability service.

See the Telemetry API documentation and sample extensions for additional details.

The Lambda Telemetry API supersedes the Lambda Logs API. While the Logs API remains fully functional, AWS recommends using the Telemetry API. New functionality is only available with the Extensions API. Extensions can only subscribe to either the Logs or Telemetry API. After subscribing to one of them, any attempt to subscribe to the other returns an error.

Mapping Telemetry API schema to OpenTelemetry spans

The Lambda Telemetry API schema is semantically compatible with OpenTelemetry (OTEL). You can use events received from the Telemetry API to build and report OTEL spans. Three Telemetry API lifecycle events represent a single function invocation: start, runtimeDone, and runtimeReport. You should represent this as a single OTEL span. You can add additional details to your spans using information available in runtimeDone events under the event.spans property.

Mapping of Telemetry API events to OTEL spans is described in the Telemetry API documentation.

Metrics and pricing

The Telemetry API introduces new per-invoke metrics to help you understand the impact of extensions on your function’s performance. The metrics are available within the report.runtimeDone event.

  • platform.runtime measures the time taken by the Lambda Runtime to run your function handler code.
  • producedBytes measures the number of bytes returned during the invoke phase.

There are also two new trace spans available within the report.runtimeDone event:

  • responseLatencyMs measures the time taken by the Runtime to send a response.
  • responseDurationMs measures the time taken by the Runtime to finish sending the response from when it starts streaming it.

Extensions using Telemetry API, like other extensions, share the same billing model as Lambda functions. When using Lambda functions with extensions, you pay for requests served, and the combined compute time used to run your code and all extensions, in 1-ms increments. To learn more about the billing for extensions, visit the Lambda pricing page.

Useful links

Conclusion

The Lambda Telemetry API allows you to receive enhanced telemetry data more easily using your preferred monitoring and observability tools. The Telemetry API enhances the functionality of the Logs API to receive logs, metrics, and traces directly from the Lambda service. Developers and operators can send telemetry to destinations without custom libraries, with reduced latency, and simplified permissions.

To see how the Telemetry API works, try the demos in the GitHub repository.

Build your own extensions using the Telemetry API today, or use extensions provided by the Lambda observability partners.

For more serverless learning resources, visit Serverless Land.

Enriching operational events with AWS Serverless

Post Syndicated from James Beswick original https://aws.amazon.com/blogs/compute/enriching-operational-events-with-aws-serverless/

This post was written by Ben Moses, Senior Solutions Architect, Enterprise.

AWS Serverless is a fit for many IT automation and operations use cases, especially for reacting to events. Infrastructure events are a useful way to understand the health of your infrastructure that supports your applications and customers and this blog examines using serverless to help enrich these operational events.

The scenario used in this post shows how an infrastructure event can be intercepted in real-time, enriched with additional information from your AWS environment and workloads, and be sent to a downstream consumer with the added valuable information.

This example focuses on Amazon EC2 state change events. The concept applies to any type of event, for example those emitted by other AWS services to Amazon CloudWatch Events. These events could also include events produced by AWS Config, and some of AWS CloudTrail’s events, including CloudTrail Insights.

The purpose is to add more valuable information and context to events in real-time. Operators and downstream consumers can then identify emerging patterns in near real-time.

How does this happen today?

It is common for existing solutions to store infrastructure events in whatever format the source system generates, or in a standardized open or proprietary format. Operations staff and systems then analyze these logs to understand patterns and to support root cause analysis. This data must often be enriched by other sources to give it context and meaning. This is done either in a scheduled batch operation by using CSV data from other systems, or by integrating with other enterprise tooling.

The state of your cloud infrastructure changes frequently due to the elasticity and disposability of resources. This can cause an issue with your data quality when using the schedule batch method. When you come to enrich an infrastructure event, the state may have changed by the time your scheduled batch runs. This leads to gaps or inaccuracies in data, which makes it harder for operators to spot trends and anomalies.

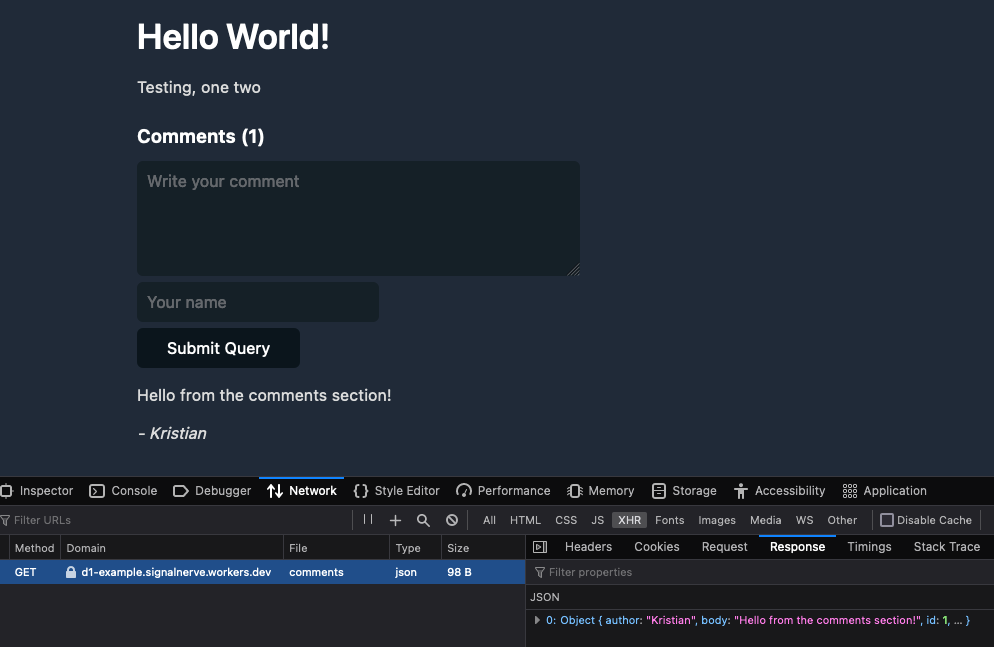
A serverless approach

This example uses serverless services and concepts from event driven architecture (EDA). With this architecture, you only pay when events happen and are enriched. There’s no need for any third-party tooling, and your events are enriched in near real-time.

The EC2 “State Change Event” is enriched by obtaining the instance’s name tag, if it has one. The end-to-end journey look like this:

Overview

  1. An EC2 instance’s state changes (i.e., shutdown, restart).
  2. An Amazon EventBridge rule that matches the event pattern triggers a target action to run an AWS Step Functions state machine.
  3. The state machine transforms inputs, makes a native AWS API SDK call to the EC2 service to find a name tag, and emits a newly enriched event back to EventBridge.
  4. An EventBridge rule matching the enriched event triggers an action to send an email via Amazon SNS to simulate a downstream consumer.

EventBridge is a serverless event bus that can be used with event driven architectures on AWS. An EventBridge rule is defined with a pattern, and if an event matches that pattern, then the rule’s target action is triggered. In this example, the rule is:

{
  "detail-type": ["EC2 Instance State-change Notification"],
  "source": ["aws.ec2"]
}

An EC2 state change event looks like this:

{
  "version": "0",
  "id": "672123fe-53aa-3b22-3b37-1fae26df2aff",
  "detail-type": "EC2 Instance State-change Notification",
  "source": "aws.ec2",
  "account": "1234567890",
  "time": "2022-08-17T18:25:01Z",
  "region": "eu-west-1",
  "resources": [
    "arn:aws:ec2:eu-west-1:1234567890:instance/i-1234567890"
  ],
  "detail": {
    "instance-id": "i-0123456789",
    "state": "running"
  }
}

See the detail-type and source fields in the event. These match the rule and this entire event payload is passed on to the next component of the architecture: the Step Functions state machine.

Step Functions uses JSONPath to select, transform, and move data through the states within a state machine. This flexibility means that, in this example, no compute resources such as AWS Lambda are required. This can mean less custom code, lower cost, and less complexity.

Step Functions Workflow Studio lets you design workflows visually. These are the key actions that take place when the state machine runs using the EC2 state change event:

Step Functions state machine

1. Remove problem characters from input

Pass states allow us to transform inputs and outputs. In this architecture, a Pass state is used to remove any problem characters from the incoming event that are known to cause issues in future steps, such as API calls to services.

In this example, the parameters for the API call used in Step 2 requires the EC2 instance ID. This information is in the detail of the original event, but the API action can’t use anything with a hyphen in it.

To solve this, use a JSONPath Parameter to effectively rewrite this information without the hyphen. This creates a new field named instanceid, which is assigned the value from the original event’s detail.

{
  "instanceid.$": "$.detail.instance-id"
}

2. Get instance name from Tag

The “EC2: DescribeInstances” task in Step Functions is an example of a native SDK integration with an AWS service. This action expects a single parameter to the API, an array of EC2 instance IDs.

{
  "InstanceIds.$": "States.Array($.detail.refined.instanceid)"
}

The States.Array() intrinsic function is used to wrap the instance ID from the re-written field created in step 1. This single-member array is then passed to the EC2 Describe Instances API.

When a response is received from the EC2 Describe Instances API call, it is passed to a Result Selector. The purpose of this is to extract the value of a “Name” tag, if one was returned from the EC2 Describe Instances API.

Step Functions supports the use of JSONPath filter expressions.

{
  "instancename.$": "$..Reservations[0].Instances[0].Tags[?(@.Key==Name)].Value",
  "instanceid.$": "$.Reservations[0].Instances[0].InstanceId"
}

To understand the advanced JSONPath filter expression used in this example, read this blog post.

If an error occurs with the API call, or the filter expression is unable to find a “Name” tag on the EC2 instance, then Step Functions allows you to handle these errors within the workflow.

3. Convert instance name to a string

The output from the previous state returns an array, but an EC2 instance can only have one unique “Name” tag. A pass state is used again, with a parameter as seen in Step 1. This parameter expression takes the first element from the array and stores it in a new field named instancename.

{
  "instancename.$": "$.detail.refined.instancename[0]",
  "instanceid.$": "$.detail.refined.instanceid"
}

As with previous steps, the instanceid is re-written as part of the output, and both of these values are appended to the state’s output.

4. Get default name from Parameter Store

If the filter expression in the result selector in step 2 fails for any reason, then Step Functions error handling moves here.

Failures can happen for a variety of reasons, and with Step Functions, you can branch out error handling for each different error type. In this example, all errors are dealt with the same regardless of the cause being a missing “Name” tag, or a permissions issue. In this architecture, a default placeholder value is used in place of the name of the instance. In your context, a different approach may be more suitable.

The default placeholder name is stored as a static value in AWS Systems Manager Parameter Store. The native Systems Manager: GetParameter action within Step Functions can retrieve this value directly. An advantage of this approach is that the parameter can be updated externally without having to make any changes to the Step Functions state machine itself.

5. Add ID back to refined

A pass state is used to format the response from the Parameter Store API and parameter expression then appends the default instance name on to the output.

Whether the workflow execution followed the intended execution path, or encountered an error, there is now an enriched event payload with an instance name.

6. Emit enriched event

The EventBridge: PutEvents native SDK action within Step Functions is used to construct and emit the enriched event.

{
  "Entries": [
    {
      "Detail": {
        "Message.$": "$"
      },
      "DetailType": "EnrichedEC2Event",
      "EventBusName": "serverless-event-enrichment-ApplicationEventBus",
      "Source": "custom.enriched.ec2"
    }
  ]
}

The DetailType and Source of the enriched event are custom values, specified in the last step of the state machine. As you consider schemas for your events within your organization, note that the AWS prefix is reserved for AWS service events.

The enriched event payload looks like this:

{
  "version": "0",
  "id": "a80e378b-e9a7-8007-1f18-b947e6d72c4b",
  "detail-type": "EnrichedEC2Event",
  "source": "custom.enriched.ec2",
  "account": "123456789",
  "time": "2022-08-17T18:25:03Z",
  "region": "eu-west-1",
  "resources": [
    "arn:aws:states:eu-west-1:123456789:stateMachine:EventEnrichmentStateMachine-2T5jFlCPOha1",
    "arn:aws:states:eu-west-1:123456789:execution:EventEnrichmentStateMachine-2T5jFlCPOha1:672123fe-53aa-3b22-3b37-1fae26df2aff_90821b68-ba92-2374-5015-8804c8da5769"
  ],
  "detail": {
    "Message": {
      "version": "0",
      "id": "672123fe-53aa-3b22-3b37-1fae26df2aff",
      "detail-type": "EC2 Instance State-change Notification",
      "source": "aws.ec2",
      "account": "123456789",
      "time": "2022-08-17T18:25:01Z",
      "region": "eu-west-1",
      "resources": [
        "arn:aws:ec2:eu-west-1:123456789:instance/i-123456789"
      ],
      "detail": {
        "instance-id": "i-123456789",
        "state": "running",
        "refined": {
          "instancename": "ec2-enrichment-demo-instance",
          "instanceid": "i-123456789"
        }
      }
    }
  }
}

Consuming enriched events

When enriching event data in real-time, the events are only valuable if they’re consumed. To use these enriched events, a consuming service must create and own a new EventBridge rule on the custom application bus. In this architecture, an appropriate rule pattern is:

{
  "detail-type": ["EnrichedEC2Event"],
  "source": ["custom.enriched.ec2"]
}

The target of the rule depends on the use case. For operational events, then service management applications or log aggregation services may make the most sense. In this example, the rule has an SNS topic as the target. When SNS receives a message, it is sent to operator via email. With EventBridge, future consumers can add their own rules to match the enriched events, and add their specific target actions to suit their use case.

Conclusion

This post shows how you can create rules in EventBridge to react to operational events from AWS services. These events are routed to Step Functions, which runs a workflow consisting of steps to enrich the event, handle errors, and emit the enriched event. The example shows how to consume the enriched events, resulting in an operator receiving an email.

This example is available on GitHub as an AWS Serverless Application Model (AWS SAM) template. It contains instructions to deploy, test, and then remove all of the resources when you’ve finished.

For more serverless learning resources, visit Serverless Land.