When the world logs off: Christmas, New Year’s, and the Internet’s holiday rhythm

Post Syndicated from João Tomé original https://blog.cloudflare.com/when-the-world-logs-off-christmas-new-years-and-the-internets-holiday-rhythm/

As January approaches and the year comes to a close, distinct changes in global Internet usage emerge. Year-end traditions — ranging from Christmas feasts to New Year’s Eve (NYE) countdowns — shape online behavior across continents and cultures. Looking back at Christmas and NYE 2023 offers insights into how these trends may repeat this year, and by January 2025, we’ll be able to directly compare patterns. Examining data from 50 countries and regions reveals how people celebrated in 2023-2024, providing a timely reminder of typical holiday trends.

With Cloudflare’s global reach, we observe planet-wide and local Internet habits during the holiday season. In the past, unintended trends during Christmas and New Year’s Eve have surfaced through our Outage Center, which uses automatic traffic anomaly alerts to detect Internet outages or unusual patterns. In the 2023 overview below, traffic dropped enough on those days to trigger dozens of anomaly alerts (orange and pink bubbles):


While Christmas dominates in many regions, other cultural and religious holidays — like Hanukkah or regional festivities — shape online rhythms in places where Western traditions are less central.

In countries and regions where Christmas is deeply rooted, Internet traffic slows during Christmas Eve dinners, midnight masses, morning gift exchanges, and Christmas Day lunches.

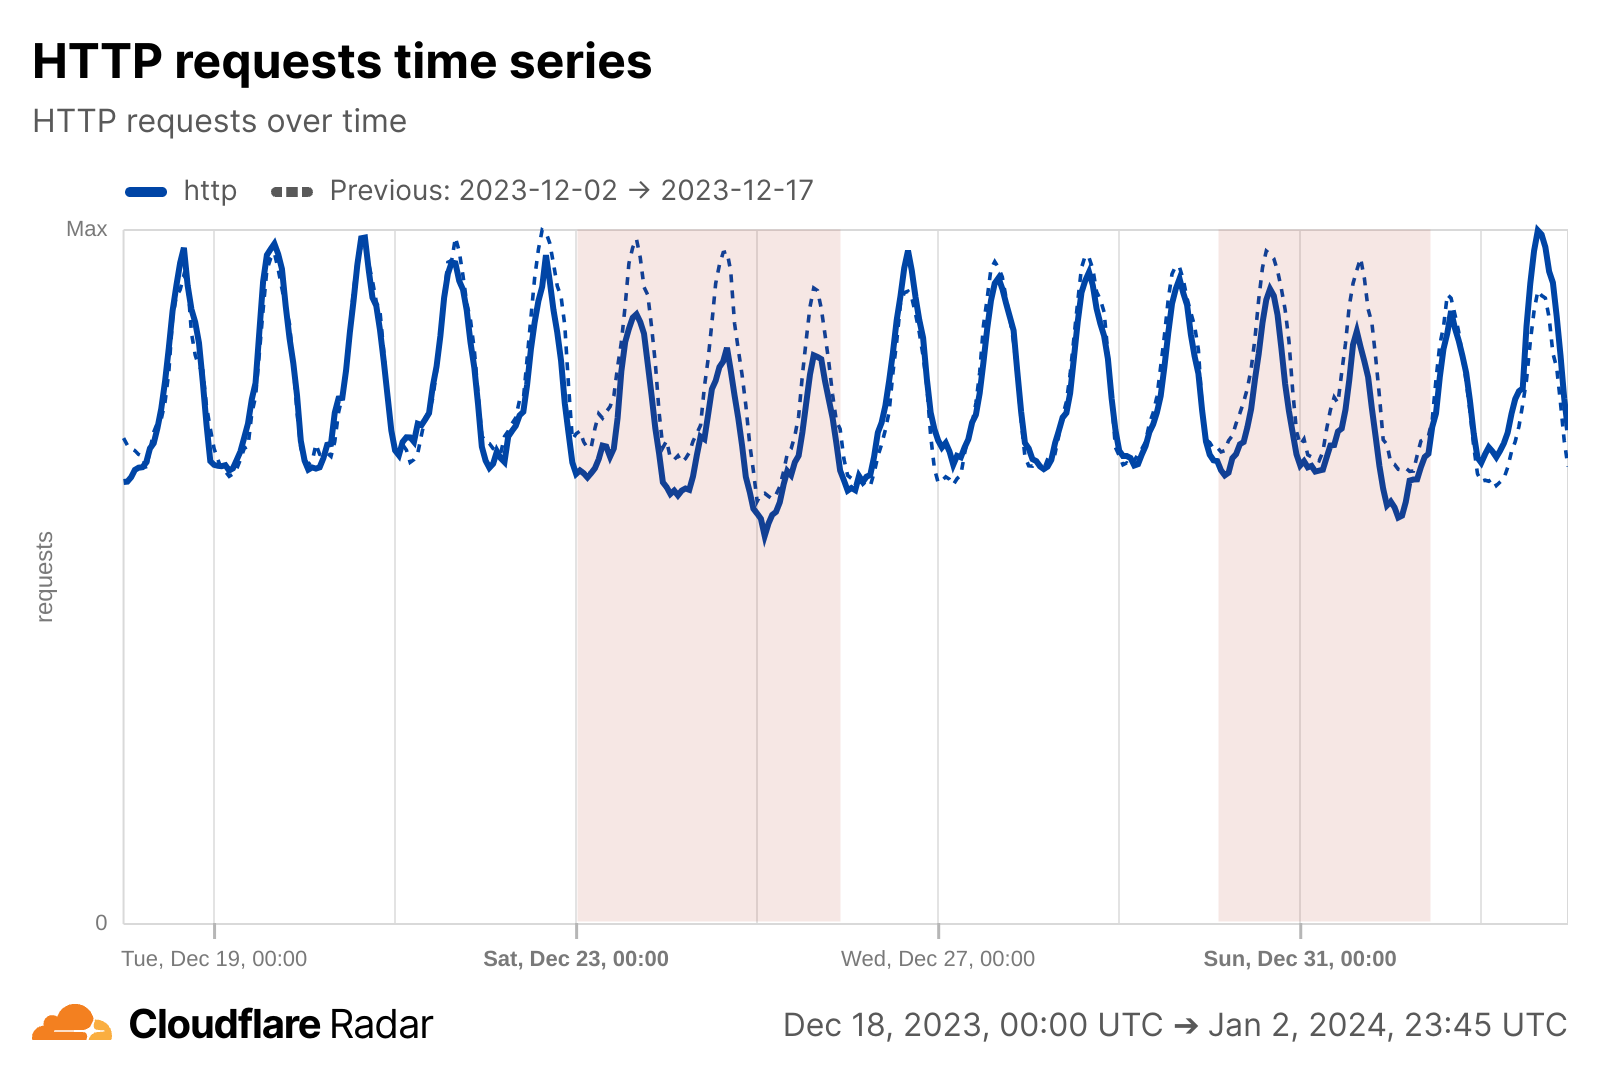
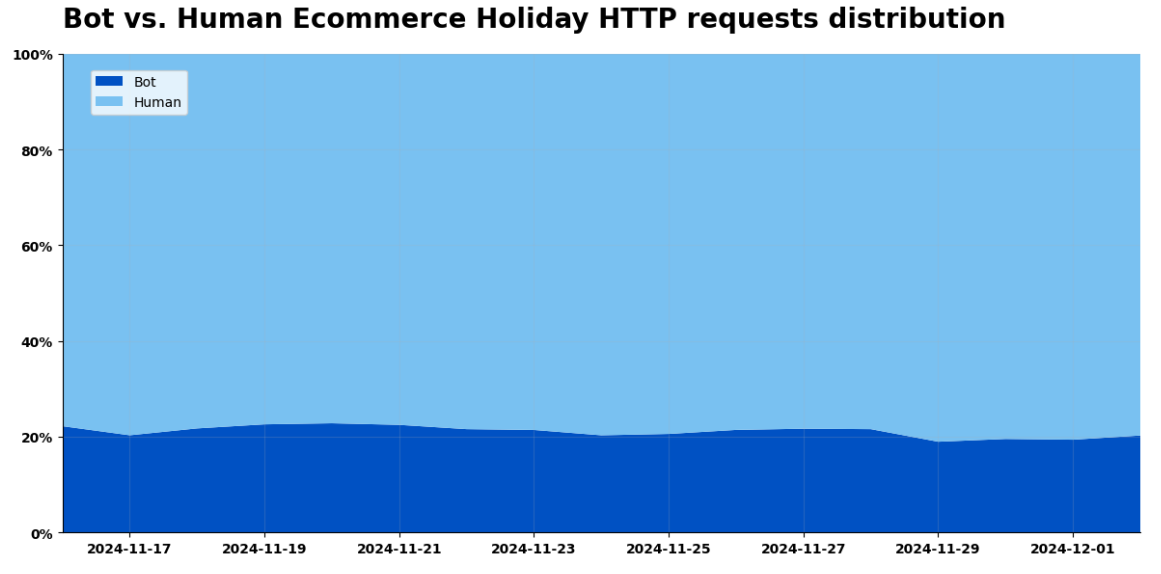
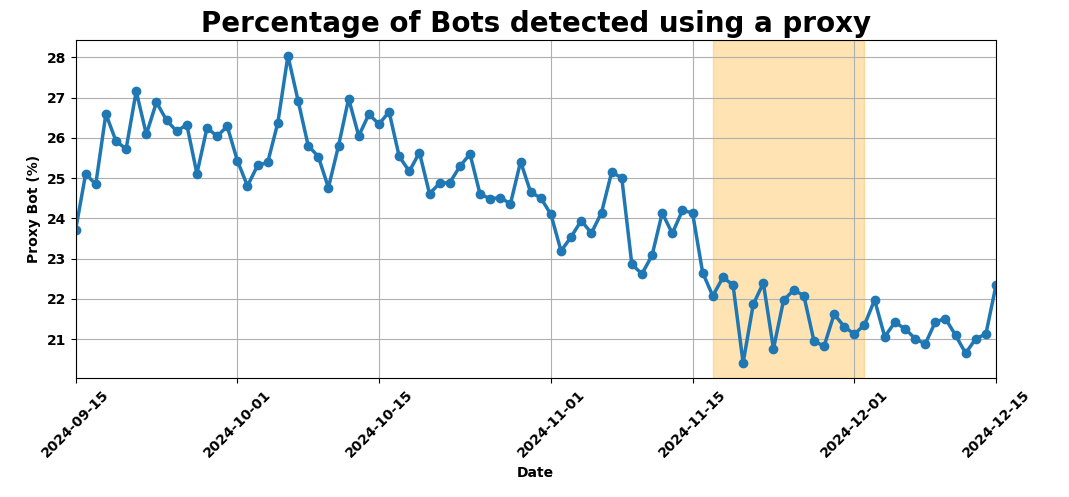
This blog post focuses exclusively on non-bot-related Internet traffic requests, filtering out automated activity to provide a clearer view of genuine human behavior during the holiday season. Before going into location-specific perspectives, here’s a global hourly view of Internet traffic during Christmas and New Year’s Eve 2023 from Cloudflare Radar Data Explorer, highlighting notable drops (in UTC, so it captures impacts across more days due to time zones spanning over 23 hours, from New Zealand to Hawaii in the US):


Global Christmas and New Year’s Eve daily trends

Let’s start with a ranking of countries and regions and their top low-traffic holiday dates, showing each day’s percentage drop. Many locations like the US see clear dips on December 24 and 25 as people celebrate Christmas Eve and Christmas Day offline, and some show smaller declines (compared to Christmas) around December 31 as the New Year approaches. Still, the exact order and magnitude differ, reflecting cultural nuances — some nations experience greater drops on Christmas Eve, others on Christmas Day, and others signal unique patterns tied to New Year’s Eve or January 1 celebrations.

In the next table, locations are listed first (in the left column) by those with the lowest traffic on December 24 (and the highest percentage of traffic drop), followed by December 25, and finally December 31 (in the right column).

Top days with the lowest Internet traffic in December 2023 – January 2024

(with respective percentage drops, if any, from the previous week)

Denmark

#1 December 24 (-35%)

#2 December 25 (-11%)

#3 December 31

South Africa

#1 December 25 (-27%)

#2 December 24 (-15%)

#3 December 31 (-5%)

Norway

#1 December 24 (-32%)

#2 December 25 (-12%)

#3 December 31

United Kingdom

#1 December 25 (-26%)

#2 December 24 (-19%)

#3 December 31

Portugal

#1 December 24 (-32%)

#2 December 25 (-24%)

#3 December 31

Italy

#1 December 25 (-25%)

#2 December 24 (-25%)

#3 December 31

Poland

#1 December 24 (-31%)

#2 December 25 (-21%)

#3 December 31

Australia

#1 December 25 (-25%)

#2 December 24 (-15%)

#3 December 31 (-1%)

Spain

#1 December 24 (-28%)

#2 December 25 (-25%)

#3 December 31

Ireland

#1 December 25 (-24%)

#2 December 24 (-22%)

#3 December 23

Sweden

#1 December 24 (-26%)

#2 December 25 (-6%)

#3 December 31

New Zealand

#1 December 25 (-22%)

#2 December 24 (-8%)

#3 December 31 (-4%)

Chile

#1 December 24 (-23%)

#2 December 25 (-24%)

#3 December 31 (-3%)

Canada

#1 December 25 (-19%)

#2 December 24 (-15%)

#3 December 31

Finland

#1 December 24 (-23%)

#2 December 25 (-16%)

#3 December 31

Nigeria

#1 December 25 (-18%)

#2 December 24 (-19%)

#3 January 1

France

#1 December 24 (-22%)

#2 December 25 (-19%)

#3 December 23

Philippines

#1 December 25 (-16%)

#2 December 24 (-7%)

#3 December 31

Germany

#1 December 24 (-21%)

#2 December 25 (-9%)

#3 December 31

Hong Kong

#1 December 25 (-9%)

#2 December 24 (-6%)

#3 December 23

Mexico

#1 December 24 (-21%)

#2 December 25 (-19%)

#3 December 31

Belgium

#1 December 31 (-1%)

#2 December 24 (-20%)

#3 December 25 (-17%)

Belgium

#1 December 24 (-20%)

#2 December 25 (-17%)

#3 December 31 (-1%)

Indonesia

#1 December 31 (-1%)

#2 December 25 (-7%)

#3 December 24

Romania

#1 December 24 (-20%)

#2 December 25 (-14%)

#3 December 31 (-3%)

Netherlands

#1 December 31 (-10%)

#2 December 24 (-10%)

#3 December 25 (-20%)

United States

#1 December 24 (-16%)

#2 December 25 (-21%)

#3 December 31

Ukraine

#1 December 31 (-10%)

#2 December 24 (-5%)

#3 December 30

Brazil

#1 December 24 (-14%)

#2 December 25 (-26%)

#3 December 31

Thailand

#1 December 31 (-6%)

#2 January 1 (-2%)

#3 December 25 (-2%) 

Colombia

#1 December 24 (-14%)

#2 December 25 (-26%)

#3 December 31 (-4%)

The data shows that in many European countries — such as Denmark, Norway, the United Kingdom, Portugal, Italy, Poland, Spain, Ireland, Sweden, Finland, France, Germany, Belgium, the Netherlands, and Romania — Christmas Eve (December24) and Christmas Day (December25) consistently register the biggest drops in Internet traffic. These dips suggest that in much of Europe, Christmas traditions take people firmly offline, whether it’s for family gatherings, festive meals, or religious observances. Outside Europe, similar patterns appear in predominantly Christian-influenced regions, including Australia, New Zealand, Canada, the United States, and several Latin American countries (like Brazil, Chile, and Colombia), confirming that the holiday’s cultural importance is mirrored in their online habits.

In contrast, locations less influenced by Western Christmas traditions, such as those in Asia, show subtler or different patterns. For example, Hong Kong and the Philippines do show declines in traffic, reflecting a hybrid of local and global influences, while places like Thailand and Indonesia present smaller dips on Christmas compared to other days or emphasize different holidays altogether. These variations highlight that while Christmas exerts a strong pull offline in many parts of the world, its impact on Internet usage is shaped by local cultural contexts.

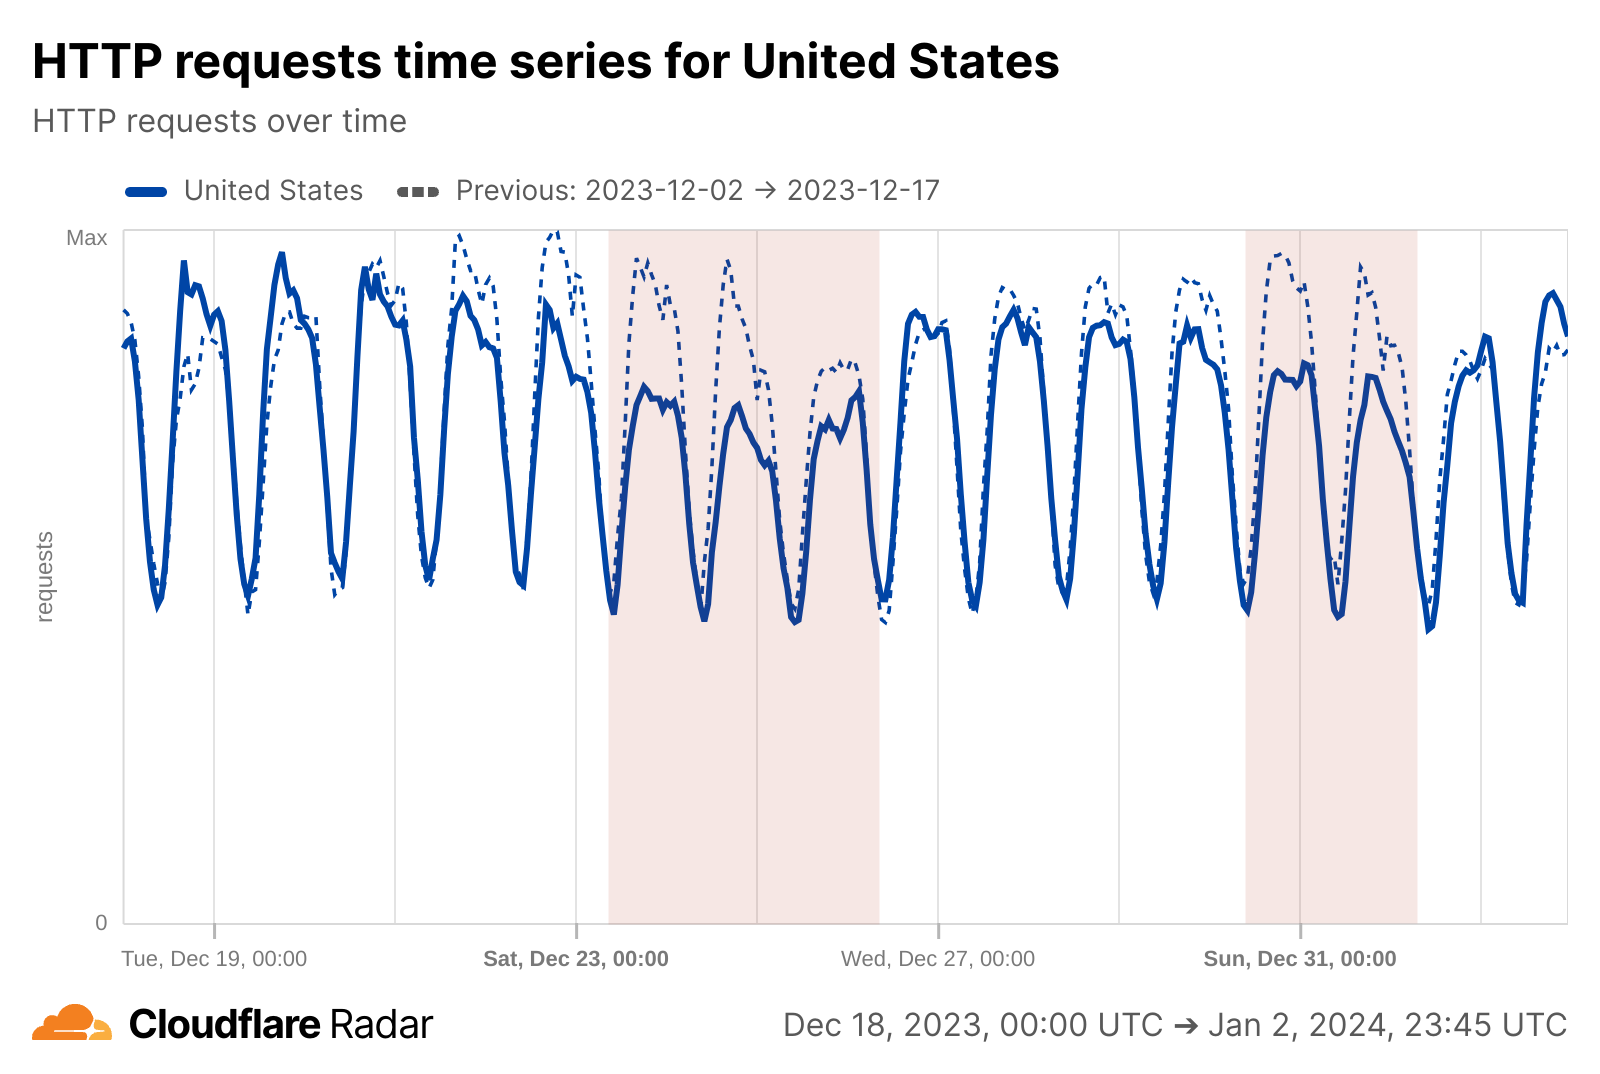
As an example, here’s the US perspective from Cloudflare Radar Data Explorer, where the drop in traffic during Christmas and New Year 2023 is evident:


Where Christmas isn’t central

Not every country’s December revolves around Christmas. In Israel, for example, Hanukkah’s timing changes year to year, influencing when people log off. In 2023, Hanukkah started on December 7, leading to an 8% traffic drop that day and 7% on the following days through December 10. Interestingly, in some years like 2024, Hanukkah begins closer to December 25, potentially overlapping with Western Christmas.

Countries where Christmas didn’t have a clear impact

Turkey

#1 December 31 (-18%)

#2 December 29

#3 December 30

Israel

#1 December 29

#2 January 5

#3 December 30

Japan

#1 December 31 (-8%)

#2 January 1

#3 December 30 — December 24 with -3%

Vietnam

#1 January 1 (-7%)

#2 December 31 (-3%)

#3 January 2

Russia

#1 December31 (-23%)

#2 January 1 (-15%)

#3 December 30

Singapore

#1 December 16

#2 December 17

#3 December 18

India

#1 December 17

#2 December 16

#3 December 24

Bangladesh

#1 December 15

#2 December 16

#3 December 18

Saudi Arabia

#1 January 5

#2 January 6

#3 January 8

China

#1 December 19

#2 December 15

#3 December 18

Now, let’s focus on a more granular perspective of these trends, showing the impact of Christmas dinners and lunches, and also New Year’s Eve drops in traffic.

Note: Unless otherwise noted, all times used in this blog post are local ones; in countries with several timezones, we’re using the timezone where more people live (for the US, Eastern time is used).

A more granular perspective of Christmas: offline feasts and morning quiet


Europe

In Europe, Christmas traditions dominate, leading to the most significant Internet traffic drops. Christmas Eve dinner is a near-universal offline moment, with countries like Spain (-70% at 21:45), Portugal (-70% at 20:30), and Denmark (-68% at 19:45) experiencing the steepest declines. On Christmas Day, mornings are quieter as people relax or attend religious services, while festive lunches drive further drops, with traffic down 43% at 13:45 in Portugal and 44% at 07:15 in France.

By Boxing Day (December 26), digital activity rebounds as people return online for sales or socializing. For instance, the UK shows a 16% increase at 13:00, while Canada records a 19% rise at 08:15. In Australia, traffic climbs by 20% at 09:30, illustrating regional differences in how the day is celebrated.

Americas

In the Americas, holiday patterns reflect a mix of cultural traditions. In the United States, Christmas Eve traffic drops by 29% at 20:15, aligning with evening family gatherings, and Christmas Day sees a 32% decline at 09:15, reflecting quieter mornings.

In Latin America, Christmas Eve (Nochebuena) takes center stage, with significant traffic declines aligning with late-night traditions like the Midnight Toast (in Argentina, the late-night feast is quite popular) and Misa de Gallo (Midnight Mass). For example:

  • Colombia: -48% at 21:45

  • Argentina: -58% at 22:00; -67% at midnight

  • Chile: -64% at 22:45

  • Mexico: -50% at 21:45

  • Brazil: -22% at 21:45

These late-night traffic dips highlight the region’s emphasis on midnight celebrations, family feasts, and religious observances.

Asia Pacific

Asian locations influenced by Western traditions, such as the Philippines and Hong Kong, experience moderate Christmas dips but shift focus to New Year’s celebrations — more on NYE below.

In the Southern Hemisphere, Australia and New Zealand experience their steepest traffic drops during Christmas lunch, with Australia seeing a 43% decrease at 13:45 and New Zealand recording a 42% decline.

Middle East and Africa

In regions less influenced by Christmas, holiday traffic patterns vary significantly. For example, Nigeria sees a 26% drop at lunchtime on Christmas Day, while South Africa records a 37% decline at 14:15, reflecting offline family gatherings.

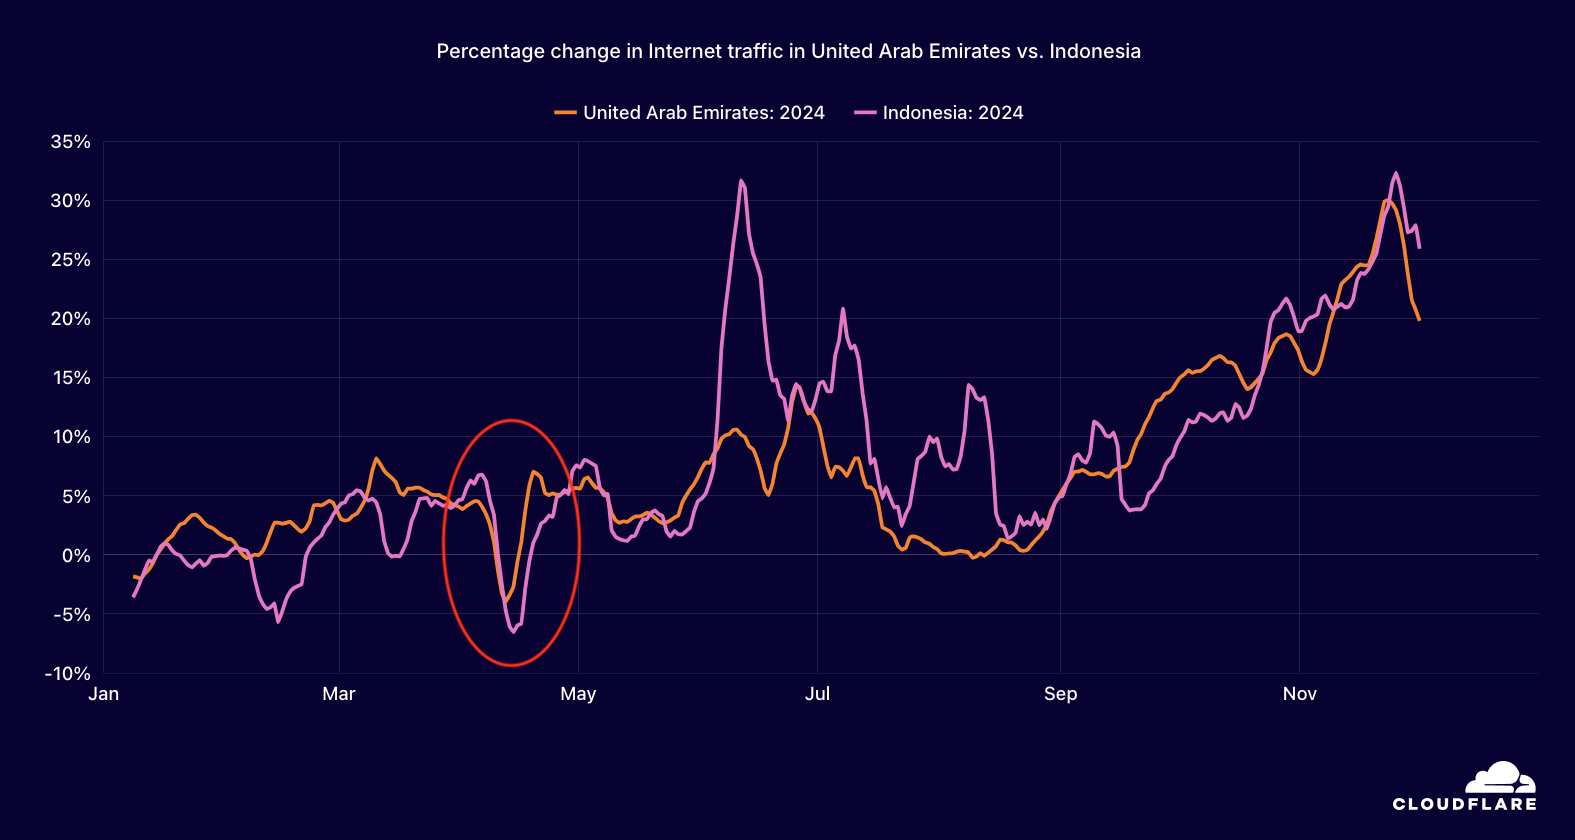
In predominantly non-Christian countries like Egypt and Saudi Arabia, December 24-25 does not show significant dips; instead, other cultural holidays drive offline moments. For example, as we’ve noted, Israel experienced up to an 8% drop in 2023 during Hanukkah, particularly in the first four days after December 7. In previous blog posts, we have shown how events like Ramadan clearly impact Internet traffic in countries with large Muslim populations. One example from our Year in Review 2024 highlights Indonesia and the United Arab Emirates, where traffic dropped during Eid al-Fitr, the festival marking the end of Ramadan (April 9-10, 2024).


The Boxing Day revival

Boxing Day on December 26 marks a significant digital rebound in countries like the UK, Canada, Australia (where there is a higher increase from the previous week, with daily traffic growing 9%), and New Zealand, as people return online after the Christmas break. Traditionally associated with charitable activities, family gatherings, and shopping, the day sees traffic spikes across these regions:

Location

December 26 increase in daily traffic

Higher traffic increase on December 26

Australia

+9%

December 26; 09:30: +20%

United Kingdom

+2%

December 26; 13:00: +16%

Canada

+1%

December 26, 08:15: +19%

Here is the list of locations that saw a clear drop in traffic on Christmas Eve or Christmas Day morning or lunch. We selected the time (morning or lunch) with the bigger drop compared to the previous week for further analysis. The list is ordered by the Christmas Eve dinner drop. Countries like Russia (where Orthodox Christians celebrate Christmas later, on January 7), Japan, China, Indonesia, Turkey, Israel, Thailand, Egypt, Singapore, Vietnam, and Bangladesh showed no impact during Christmas Eve dinner or Christmas Day morning or lunch.

Location

Christmas Eve Dinner Drop

Christmas Day Morning/Lunch Drop

Spain

-70% at 21:45

-51% at 08:00 (morning)

Portugal

-70% at 20:30

-43% at 13:45 (lunch)

Denmark

-68% at 19:45

-43% at 06:15 (morning)

Chile

-64% at 22:45; (-65% at 00:00, December 25)

-49% at 09:00 (morning) 

Norway

-63% at 18:45

-50% at 06:45 (morning)

Czech Republic

-60% at 18:15

-43% at 06:30 (morning)

Poland

-59% at 17:15

-51% at 07:15 (morning)

Argentina

-58% at 22:00 (-67% at 00:00, December 25)

-52% at 09:00 (morning) 

Italy

-55% at 21:15

-44% at 07:00 (morning)

France

-55% at 20:45

-44% at 07:15 (morning)

Mexico

-50% at 21:45

-38% at 08:15 (morning)

Belgium

-50% at 20:15

-46% at 07:15 (morning)

Switzerland

-50% at 19:45

-46% at 06:30 (morning)

Austria

-50% at 19:15

-42% at 06:15 (morning)

Nigeria

-49% at 18:00

-26% at 12:30 (lunch)

Colombia

-48% at 21:45

-49% at 08:00 (morning)

Germany

-47% at 19:15

-36% at 07:15 (morning)

Sweden

-47% at 16:30

-36% at 07:00 (morning)

Finland

-42% at 17:45

-42% at 08:00 (morning)

Ireland

-40% at 18:15

-36% at 15:15 (lunch)

South Africa

-37% at 19:00

-37% at 14:15 (lunch)

Romania

-34% at 20:45

-34% at 06:30 (morning)

United Kingdom

-34% at 18:00

-38% at 14:45 (lunch)

Canada

-32% at 20:30

-31% at 09:30 (morning)

Netherlands

-30% at 20:45

-35% at 06:45 (morning)

United States

-29% at 20:15

-32% at 09:15 (morning)

Australia

-23% at 20:45

-43% at 13:45 (lunch)

New Zealand

-23% at 18:30

-42% at 13:15 (lunch)

Brazil

-22% at 21:45

-42% at 08:00 (morning)

Philippines

-22% at 21:30

-29% at 06:45 (morning)

New Year’s Eve: A planetary offline moment


Midnight, December 31 is a shared offline moment worldwide, as people step away from their screens to celebrate. To provide a more accurate assessment of New Year’s Eve’s impact, we compare traffic at 00:00 on January 1 with 00:00 on December 18, avoiding distortions caused by Christmas-related patterns. This approach highlights the distinct drop in Internet activity due to New Year’s celebrations.

Across Europe, countries like Portugal (-60%) and Romania (-60%) see dramatic traffic drops, reflecting widespread offline gatherings. Spain (-56%) and Germany (-49%) also experience steep declines, emphasizing the importance of this tradition across the region. Even Northern Europe mirrors this trend, with Denmark (-41%), Norway (-39%), and Sweden (-29%) showing significant dips.

In the Americas, this offline moment is particularly pronounced in Latin America, where family and communal gatherings dominate. Argentina (-66%) and Chile (-74%) lead the region, with Brazil (-46%) and Colombia (-44%) following closely. In North America, the impact is less dramatic due to time zone variations — in this case, with millions of people spread out in distinct time zones. Canada records a 14% drop, and the United States shows a modest 12% decline compared to December 18.

In Asia and the Pacific, New Year’s Eve celebrations heavily influence Internet trends. Thailand saw a 31% drop, Indonesia 23%, and Japan 16%, also reflecting this region’s focus on communal gatherings and celebrations. Australia (-21%) and New Zealand (-11%), among the first countries to welcome the New Year, also show noticeable declines as midnight festivities take center stage.

In the Middle East and Africa, Turkey (-23%), South Africa (-32%), and Nigeria (-15%) exhibit significant offline engagement at midnight. Israel records a smaller but notable 6% dip before midnight, reflecting localized variations in celebration styles.

Of course, this offline intermission doesn’t last long. After a few hours, people return to their devices. France sees a 37% surge at 3:15 on January 1, while Turkey experiences a 36% upswing in the early hours.

Next, we present the list of locations with clear drops in traffic at midnight on New Year’s Eve, compared to December 18, ordered by percentage of drop. 

Locations

January 1, 00:00 drop compared to December 18

Locations

January 1, 00:00 drop compared to December 18

Chile

-74%

Thailand

-31%

Argentina

-66%

Italy

-30%

Romania

-60%

Sweden

-29%

Portugal

-60%

Vietnam

-27%

Spain

-56%

United Kingdom

-25%

Germany

-49%

Ukraine

-25%

Brazil

-46%

Indonesia

-23%

Mexico

-44%

Turkey

-23%

Colombia

-44%

Australia

-21%

Philippines

-43%

Hong Kong

-21%

Netherlands

-42%

Ireland

-19%

Poland

-41%

France

-17%

Denmark

-41%

Japan

-16%

Austria

-40%

South Korea

-16%

Switzerland

-39%

Nigeria

-15%

Norway

-39%

Canada

-14%

Czech Republic

-33%

Finland

-14%

Russia

-32%

Singapore

-13%

Belgium

-32%

United States

-12%

South Africa

-32%

China

-12%

Conclusion: A mosaic of traditions and digital habits

What emerges from these patterns is a rich tapestry of cultural habits. While Christmas Eve and Day are central offline moments in Europe and the Americas, other regions mark their quiet days on different dates, shaped by unique holidays and customs. The insights from 50 countries and regions confirm how cultural traditions guide when people step away from screens.

As the Gregorian calendar year comes to a close, the universal appeal of stepping offline becomes clear. Whether raising glasses at the stroke of midnight, exchanging greetings, or lighting candles for festivals like Hanukkah, these moments remind us that while the Internet connects billions, cultural rhythms still shape our relationship with technology. Whether feasting with loved ones or counting down to a new year, humans everywhere find reasons to unplug — if only for a moment.

If you’re interested in more trends and insights about the Internet, check out Cloudflare Radar. Follow us on social media at @CloudflareRadar (X), https://noc.social/@cloudflareradar (Mastodon), and radar.cloudflare.com (Bluesky), or contact us via email.

Отворени данни на разрешителните за сеч 2011-2024

Post Syndicated from Боян Юруков original https://yurukov.net/blog/2024/opendata-logging/

Преди почти 10 години си зададох въпрос – къде в България се сече законно и в какви количества. Агенцията по горите нямаше отворени данни за това. Имат обаче регистър на позволителните за сеч, който макар не в достъпен формат, поне е достатъчно структуриран, за да се изведе нещо. На база тези числа тогава успях да покажа данните за сеч с точност до землище на населено място, а след това направих анализ и предложения.

Десет години по-късно малко се е променило. Някои от регионалните дирекции по горите и самата агенция са в портала за отворени данни на правителството. Има дори ресурс с позволителните за сеч, макар покриващ само част от данните и само за четири години. Регистърът си е същия, със същите грешки и 1.57 млн. документа – позволителни за сеч и протоколи след това.

Причината да знам това число е, че в последните седмици свалих цялата информация от средата на 2011-та, когато е започнал регистъра, до декември 2024-та. Там информацията е във вид на обикновена HTML страница подходяща за печат и подпис на хартия, но открих структура в нея. Така обърнах всеки документ в json формат с точната категория и вид дървета, позволена и реална сеч. Включва също констатации за нарушения, актове, кой е глобен и прочие. Разбира се, тук говорим само за законната сеч и документите свързани с нея. Ако не е в този списък, значи не е законно.

Тъй като изглежда самият им формуляр за генериране на тези документи не се използва съвсем коректно, някои от номерата и датите на заповедите не са попълнени. Също кадастриалните идентификатори посочващи точните парцели не са в правилен формат. Това ще се опитам да го оправят в друг момент. Има и други грешки, които съм се опитал да компенсирам в изходните данни.

Освен документите, съм публикувал и списък с обобщена информация за всяка сеч от търсачката им. Там може да се видят дати и количества на сеч и позволява да се свържат позволителните и протоколите, където това не е отбелязано в самия протокол.

Публикувам всички данни в отворен формат свободно, без лиценз и ограничения за използване. Ще се радвам, все пак, ако направите нещо с тях, да ми пишете, защото ми е интересно как са влезли в употреба. Ще създам интерактивен инструмент за филтриране и изследването им в скоро време, но искам първо да пусна данните, ако някой има идея за такъв или друга употреба.

Може да свалите данните от тази папка. Там ще намерите описание на полетата, файл с номерата на землищата и техните имена и ЕКАТТЕ номера, обобщенията списък, който споменах (95М, 18М zip) и архив с документите (6.2G, 1.1G zip)

The post Отворени данни на разрешителните за сеч 2011-2024 first appeared on Блогът на Юруков.

Fedora Linux 41 election results

Post Syndicated from jzb original https://lwn.net/Articles/1003303/

The Fedora Project has announced
the results of the Fedora Linux 41 election cycle. Five seats were
open on the Fedora Engineering
Steering Committee
(FESCo), and the winners
are Kevin Fenzi, Zbigniew Jędrzejewski-Szmek, David Cantrell, Tomáš
Hrčka, and Fabio Alessandro Locati. One seat was open on the Mindshare
Committee
and that went to Luis Bazan as the only eligible
candidate nominated in this period.

Bookblaze: The Third Annual Backblaze Book Guide

Post Syndicated from Stephanie Doyle original https://www.backblaze.com/blog/bookblaze-the-third-annual-backblaze-book-guide/

A decorative image showing a book and a cozy library.

It’s time once again for our annual book guide, where Backblaze authors give you the inside scoop on what they’ve been reading. So, whether the weather outside is frightful, or, like at our home office in San Mateo, weird and drizzly, we hope you enjoy!

Pat Patterson, Chief Technical Evangelist

The cover image of Never Understood.

Never Understood: The Jesus and Mary Chain, by William Reid and Jim Reid

I love a good book about music, and when I saw autographed copies of “Never Understood” on sale at the merchandise stand at the Jesus and Mary Chain’s San Francisco gig earlier this year, I could not walk away without buying one. The book is co-authored by William and Jim Reid, the Scottish brothers who have been the only consistent band members since they started making music in the early ‘80s, and alternates between their accounts from early life in a Glasgow tenement through growing up listening to the Velvet Underground, Iggy Pop, and Bowie in the nearby post-war new town of East Kilbride, to realizing that the band each of them wanted to form on their own was actually the same band, and the subsequent rollercoaster ride of recording, touring, breaking up, and getting back together.

There’s a lot of humor amongst the rock and roll excess—one of my favorite moments was the contrasting explanations of how they assigned roles as they were getting started. From William: “It wasn’t like it was Jim’s dream to be the singer—we basically had a big fight about who was gonna sing and he lost.” Jim writes: “We actually tossed a coin for it, but the outcome was the same: William won. I was the singer.” Comedy soon turns to tragedy, however, as Jim explains how he turned to heavy drinking to overcome his shyness of singing on stage, setting the scene for a lifelong battle with alcohol.

Lee Brackstone, the book’s editor, deserves credit for the excellent job he’s done stitching this all together. Even though the viewpoint bounces between the two brothers, it reads as a single narrative. William’s passages are set in a serif font, while Jim’s are sans, so you quickly develop a feel for who you’re reading. It’s a riveting tale, whether you love or hate the band’s music—I envy you listening to their debut album Psychocandy for the first time if you don’t fall into either of those camps—and the brothers’ love/hate relationship brings a poignant dimension to what is already a classic story of early success, record label indifference and shenanigans, figuring out how to play the music you hear in your head, and being shocked that other people actually want to hear it too.

Yev Pusin, Sr. Director, Marketing

The cover image of Impact Winter by Travis Beacham.

Impact Winter, by Travis Beacham

A comet strikes the earth and blocks out the sun. Bad news for people, good news for vampires. If you like the concept of 30 Days of Night and enjoy great world building and story telling with a bloody twist, this is a fantastic addition to your schedule. Bonus: It’s an audio drama, so perfect for your commute.

Jeremy Milk, Sr. Director, Product Marketing

The cover image of How Big Things Get Done by Dan Gardner and Bent Flyvbjerg.

How Big Things Get Done, by Dan Gardner and Bent Flyvbjerg

I stumbled upon this book right around the time one big thing in my life was proceeding nicely and another was not. Why? This book didn’t give me all the answers—sorry, there are no silver bullets—yet it provided a digestible, pragmatic framework for successfully managing big projects and initiatives, with situational awareness for the psychology of the many stakeholders who will be key to the success. As an impatient person who also likes to plan, I took away new nuance from the authors’ Think Slow, Act Fast model. And, as a student of Eric Ries’ The Lean Startup model, I appreciate the authors of this book adding their own flavor of MVP with the Maximum Virtual Product concept when you simply cannot lean-test something as big as you envision and yet you can develop virtual proxies to test underlying assumptions and elements. Now I’m ready to tackle far more big things.

Nicole Gale, Marketing Operations Manager

The cover image for The Women by Kristin Hannah.

The Women, by Kristin Hannah

I love historical fiction and The Women is the first book I’ve read about the Vietnam War. As a big Kristin Hannah fan, I love how she weaves different stories about the historical event into her own. We were immersed into the world of how women were treated in the Vietnam War and I’ll never forget their stories. This one is a must read!

David Johnson, Product Marketing Manager

The cover image for the book The Coming Wave by Mustafa Suleyman.

The Coming Wave: Technology, Power, and the Twenty-First Century’s Greatest Dilemma, by Mustafa Suleyman

I’d suggest “The Coming Wave” by Mustafa Suleyman. It offers an insightful perspective on the evolving world of artificial intelligence and its impact on society. It’s about a year old now, but still great in my opinion.

Bala Krishna Gangisetty, Sr. Product Manager

The cover image for Mindset by Carol Dweck.

Mindset: The New Psychology of Success, by Carol Dweck

This book changed how I see things and perceive challenges or setbacks fundamentally. Growing up, I was wired to strive for perfection in everything I did, and this book shifted my focus from being perfect to continuous improvement. It helped me see opportunities for learning and growth when things don’t go as planned. The best part is that the ideas in this book work for all parts of life, not just work.

Teresa Dodson, Sr. Director, Partner Marketing and Alliances

The cover image for Dare to Lead by Brene Brown.

Dare to Lead: Brave Work. Tough Conversations. Whole Hearts., by Brené Brown

From the official summary: Leadership is not about titles, status, and wielding power. A leader is anyone who takes responsibility for recognizing the potential in people and ideas, and has the courage to develop that potential. Check it out!

Stephanie Doyle, Writer and Content Operations Strategist

The cover image by Skyward by Brandon Sanderson.

The Skyward Trilogy, by Brandon Sanderson

I suppose it’s cheating a bit to recommend a whole series, but the story arc in this series by fantasy heavyweight Brandon Sanderson is great! Full disclosure: I’m hit or miss on Brandon Sanderson’s wider works. (I hate Mistborn and love The Way of Kings. Feel free to get mad at me in the comments.) That said, this series starts with a plucky young heroine on a dystopian planet (don’t worry folks: no love triangle in this one—if you know, you know) and extends into a fascinating view of space travel, AI, and what it means to have a soul.

Happy Reading from Backblaze

We hope this list piques your interest—we may be a tech company, but nothing beats a good, old fashioned book (or audiobook) to help you unwind, disconnect, and lose yourself in someone else’s story for a while.

Any reading recommendations to give us? Let us know in the comments.

The post Bookblaze: The Third Annual Backblaze Book Guide appeared first on Backblaze Blog | Cloud Storage & Cloud Backup

[$] Tim Peters returns to the Python community

Post Syndicated from jake original https://lwn.net/Articles/1002340/

In the past, suspensions of Python core developers have effectively been
permanent because the recipients of the punishment chose not to return.
Things have played out quite differently after Tim Peters was suspended for three months back in August;
Peters has been posting to the Python discussion forum since his suspension
ended in early November and, generally, getting back to work as usual.
That does not mean that he—or others in the community—have accepted the way
he was treated, but he has largely made his peace with it. The incident is
still reverberating through the Python world, however.

Security updates for Monday

Post Syndicated from jake original https://lwn.net/Articles/1003287/

Security updates have been issued by Debian (gst-plugins-base1.0, libxstream-java, php-laravel-framework, python-urllib3, and sqlparse), Fedora (chromium, libcomps, libdnf, mingw-directxmath, mingw-gstreamer1, mingw-gstreamer1-plugins-bad-free, mingw-gstreamer1-plugins-base, mingw-gstreamer1-plugins-good, mingw-orc, ofono, prometheus-podman-exporter, python3-docs, python3.13, and webkitgtk), Mageia (mozjs78, thunderbird, and tomcat, tomcat packages), SUSE (aalto-xml, flatten-maven-plugin, jctools, moditect, netty, netty-tcnative, chromedriver, govulncheck-vulndb, grpc, kernel, python-aiohttp, python-python-sql, and vim), and Ubuntu (linux, linux-gkeop, linux-ibm, linux-ibm-5.15, linux-kvm,
linux-lowlatency, linux-lowlatency-hwe-5.15, linux-oracle-5.15 and linux-aws, linux-aws-5.4, linux-bluefield, linux-ibm, linux-ibm-5.4,
linux-oracle, linux-oracle-5.4, linux-xilinx-zynqmp).

Grinch Bots strike again: defending your holidays from cyber threats

Post Syndicated from Avi Jaisinghani original https://blog.cloudflare.com/grinch-bot-2024/

Grinch Bots are still stealing Christmas

Back in 2021, we covered the antics of Grinch Bots and how the combination of proposed regulation and technology could prevent these malicious programs from stealing holiday cheer.

Fast-forward to 2024 — the Stop Grinch Bots Act of 2021 has not passed, and bots are more active and powerful than ever, leaving businesses to fend off increasingly sophisticated attacks on their own. During Black Friday 2024, Cloudflare observed:

  • 29% of all traffic on Black Friday was Grinch Bots. Humans still accounted for the majority of all traffic, but bot traffic was up 4x from three years ago in absolute terms. 

  • 1% of traffic on Black Friday came from AI bots. The majority of it came from Claude, Meta, and Amazon. 71% of this traffic was given the green light to access the content requested. 

  • 63% of login attempts across our network on Black Friday were from bots. While this number is high, it was down a few percentage points compared to a month prior, indicating that more humans accessed their accounts and holiday deals. 

  • Human logins on e-commerce sites increased 7-8% compared to the previous month. 

These days, holiday shopping doesn’t start on Black Friday and stop on Cyber Monday. Instead, it stretches through Cyber Week and beyond, including flash sales, pre-orders, and various other promotions. While this provides consumers more opportunities to shop, it also creates more openings for Grinch Bots to wreak havoc.

Black Friday – Cyber Monday by the numbers

Black Friday and Cyber Monday in 2024 brought record-breaking shopping — and grinching. In addition to looking across our entire network, we also analyzed traffic patterns specifically on a cohort of e-commerce sites. 

Legitimate shoppers flocked to e-commerce sites, with requests reaching an astounding 405 billion on Black Friday, accounting for 81% of the day’s total traffic to e-commerce sites. Retailers reaped the rewards of their deals and advertising, seeing a 50% surge in shoppers week-over-week and a 61% increase compared to the previous month.

Unfortunately, Grinch Bots were equally active. Total e-commerce bot activity surged to 103 billion requests, representing up to 19% of all traffic to e-commerce sites. Nearly one in every five requests to an online store was not a real customer. That’s a lot of resources to waste on bogus traffic. Cyber Week was a battleground, with bots hoarding inventory, exploiting deals, and disrupting genuine shopping experiences.


The upside, if there is one, is that there was more human activity on e-commerce sites (81%) than observed on our network more broadly (71%). 

The Grinch Bot’s Modus Operandi

Cloudflare saw 4x more bot requests than what we observed in 2021. Being able to observe and score all this traffic at scale means we can help customers keep the grinches away. We also got to see patterns that help us better identify the concentration of these attacks: 

  • 19% of traffic on e-commerce sites was Grinch Bots

  • 1% of traffic to e-commerce sites was from AI Bots. 

  • 63% of login attempt requests across our network were from bots 

  • 22% of bot activity originated from residential proxy networks


What are all of these bots up to? 

AI bots

This year marked a breakthrough for AI-driven bots, agents, and models, with their impact spilling into Black Friday. AI bots went from zero to one, now making up 1% of all bot traffic on e-commerce sites. 

AI-driven bots generated 29 billion requests on Black Friday alone, with Meta-external, Claudebot, and Amazonbot leading the pack. Based on their owners, these bots are meant to crawl to augment training data sets for Llama, Claude, and Alexa respectively. 


We looked at e-commerce sites specifically to find out if these bots were treating all content equally. While Meta-External and Amazonbot were still in the Top 3 of AI bots reaching e-commerce sites, Bytedance’s Bytespider crawled the most shopping sites.


Account Takeover (ATO) bots

In addition to scraping, crawling, and shopping, bots also targeted customer accounts on Black Friday. We saw 14.1 billion requests from bots to /login endpoints, accounting for 63% of that day’s login attempts. 

While this number seems high, intuitively it makes sense, given that humans don’t log in to accounts every day, but bots definitely try to crack accounts every day. Interestingly, while humans only accounted for 36% of traffic to login pages on Black Friday, this number was up 7-8% compared to the prior month. This suggests that more shoppers logged in to capitalize on deals and discounts on Black Friday than in preceding weeks. Human logins peaked at around 40% of all traffic to login sites on the Monday before Thanksgiving, and again on Cyber Monday.  

Separately, we also saw a 37% increase in leaked passwords used in login requests compared to the prior month. During Birthday Week, we shared how 65% of internet users are at risk of ATO due to re-use of leaked passwords. This surge, coinciding with heightened human and bot traffic, underscores a troubling pattern: both humans and bots continue to depend on common and compromised passwords, amplifying security risks.


Proxy bots: Regardless of whether they’re crawling your content or hoarding your wares, 22% of bot traffic originated from residential proxy networks. This obfuscation makes these requests look like legitimate customers browsing from their homes rather than large cloud networks. The large pool of IP addresses and the diversity of networks poses a challenge to traditional bot defense mechanisms that rely on IP reputation and rate limiting. 

Moreover, the diversity of IP addresses enables the attackers to rotate through them indefinitely. This shrinks the window of opportunity for bot detection systems to effectively detect and stop the attacks. The use of residential proxies is a trend we have been tracking for months now and Black Friday traffic was within the range we’ve seen throughout this year.


If you’re using Cloudflare’s Bot Management, your site is already protected from these bots since we update our bot score based on these types of network fingerprints. In May 2024, we introduced our latest model optimized for detecting residential proxies. Early results show promising declines in this type of activity, indicating that bot operators may be reducing their reliance on residential proxies. 

The Christmas “Yule” log: how customers can protect themselves

35% of all traffic on Black Friday was Grinch Bots. To keep Grinch Bots at bay, businesses need year-round bot protection and proactive strategies tailored to the unique challenges of holiday shopping.

Here are 4 yules (aka “rules”) for the season:

(1) Block bots: 22% of bot traffic originated from residential proxy networks. Our bot management score automatically adjusts based on these network signals. Use our Bot Score in rules to challenge sensitive actions. 


(2) Monitor potential Account Takeover (ATO) attacks: Bots often test stolen credentials in the months leading up to Cyber Week to refine their strategies. Re-use of stolen credentials makes businesses even more vulnerable. Our account abuse detections help customers monitor login paths for leaked credentials and traffic anomalies.


Check out more examples of related rules you can create.

(3) Rate limit account and purchase paths: Apply rate-limiting best practices on critical application paths. These include limiting new account access/creation from previously seen IP addresses, and leveraging other network fingerprints, to help prevent promo code abuse and inventory hoarding, as well as identifying account takeover attempts through the application of detection IDs and leaked credential checks.

(4) Block AI bots abusing shopping features to maintain fair access for human users. If you’re using Cloudflare, you can quickly block all AI bots by enabling our automatic AI bot blocking feature.  


What to expect in 2025? 

Over the next year, e-commerce sites should expect to see more humans shopping for longer periods. As sale periods lengthen (like they did in 2024) we expect more peaks in human activity on e-commerce sites across November and December. This is great for consumers and great for merchants.

More AI bots and agents will be integrated into e-commerce journeys in 2025. AI bots will not only be crawling sites for training data, but will also integrate into the shopping experience. AI bots did not exist in 2021, but now make up 1% of all bot traffic. This is only the tip of the iceberg and their growth will explode in the next year. We expect this to pose new risks as bots mimic and act on behalf of humans.

More sophisticated automation through network, device, and cookie cycling will also become a bigger threat. Bot operators will continue to employ advanced evasion tactics like rotating devices, IP addresses, and cookies to bypass detection.

Grinch Bots are evolving, and regulation may be slowing, but businesses don’t have to face them alone. We remain resolute in our mission to help build a better Internet … and holiday shopping experience.

Even though the holiday season is closing out soon, bots are never on vacation. It’s never too late or too early to start protecting your customers and your business from grinches that work all year round.

Wishing you all happy holidays and a bot-free new year!


Fitch Group achieves multi-Region resiliency for mission-critical Kafka infrastructure with Amazon MSK Replicator

Post Syndicated from Kalyan Janaki original https://aws.amazon.com/blogs/big-data/fitch-group-achieves-multi-region-resiliency-for-mission-critical-kafka-infrastructure-with-amazon-msk-replicator/

Real-time data streaming and event processing are critical components of modern distributed systems architectures. Apache Kafka has emerged as a leading platform for building real-time data pipelines and enabling asynchronous communication between microservices and applications. However, running and managing Kafka clusters at scale can be challenging, requiring specialized expertise and significant operational overhead.

Amazon Managed Streaming for Apache Kafka (Amazon MSK) is a fully managed service that allows you to build and run production Kafka applications. With Amazon MSK, you can rely on AWS to handle the heavy lifting of provisioning and managing Kafka clusters, while you focus on building innovative applications and real-time data processing pipelines.

In this post, we explore how Fitch Group, one of the top credit rating companies, used Amazon MSK and Amazon MSK Replicator to achieve multi-Region resiliency for their mission-critical Kafka infrastructure.

About Fitch Group and their need for multi-region resiliency

As a leading global financial information services provider, Fitch Group delivers vital credit and risk insights, robust data, and dynamic tools to champion more efficient, transparent financial markets. With employees in over 30 countries, Fitch Group’s culture of credibility, independence, and transparency is embedded throughout its structure, which includes Fitch Ratings, one of the world’s top three credit ratings agencies, and Fitch Solutions, a leading provider of insights, data, and analytics.

To stay competitive and efficient in the fast-paced financial industry, Fitch Group strategically adopted an event-driven microservices architecture. At the heart of this ecosystem lies Kafka, specifically Amazon MSK, which serves as the backbone for their data integration systems.

Fitch Group uses Kafka to enable applications to send ratings-related business events, facilitating automation within their ratings workflow systems and providing real-time or near real-time processing. This architectural choice has significantly reduced the time to market for end-user-facing systems like Fitch Ratings Pro and Fitch Group Ratings websites. Moreover, Kafka’s robust capabilities allow for seamless aggregation and distribution of data from many disparate systems through their data platform, enhancing data consistency, reliability, and accessibility across the organization.

Given the critical role that Kafka plays in Fitch Group architecture, providing robust disaster recovery (DR) mechanisms became paramount. Any disruption to their Kafka infrastructure could have significant repercussions on their ratings workflow automation, real-time processing, and end-user-facing systems, potentially exposing Fitch Group to regulatory, financial, and reputational risks.

To achieve the desired levels of resiliency, Fitch Group had the following key requirements:

  • Multi-Region deployment – Deploy MSK clusters across multiple AWS Regions to provide business continuity and maintain service availability during Regional or service events
  • Automated replication – Replicate Kafka data across Regions in near real time with minimal latency and data loss
  • Consistent topic namespaces – Maintain the same Kafka topic names and structures across source and destination clusters to minimize application changes
  • Rapid recovery – In the event of a failover, enable applications to seamlessly start consuming from the replicated cluster with minimal Recovery Time Objective (RTO) and Recovery Point Objective (RPO)

Solution overview

Fitch Group chose to implement their multi-Region Kafka deployment using Amazon MSK and MSK Replicator. MSK Replicator is a fully managed replication service that enables continuous, automated data replication between MSK clusters within the same Region or across different Regions. It supports replicating data between clusters with different configurations, including varying broker counts, storage volumes, and Kafka versions. Here’s how Fitch Group used MSK Replicator to achieve their multi-Region resiliency goals:

  • Deployed MSK clusters in two separate Regions, with the primary cluster in the main Region and the secondary cluster in a different Region for disaster recovery
  • Configured MSK Replicator to continuously replicate data from the primary cluster to the secondary cluster, maintaining the same topic names and structures across both clusters
  • Implemented application failover logic to automatically switch to consuming from the secondary cluster in case of a primary cluster unavailability, with minimal recovery time and data loss

The following diagram illustrates this architecture

Benefits achieved

By implementing Amazon MSK and MSK Replicator, Fitch Group realized several key benefits:

  • Enhanced disaster recovery – The multi-Region deployment provides business continuity even in the face of Regional or service events.
  • Simplified operations – The managed capability of MSK Replicator offloads the operational complexity of self-managing custom replication solutions, reducing the burden on Fitch Group’s IT team
  • Scalability – The solution can scale to handle varying data loads, making sure that DR capabilities grow alongside business needs
  • Minimal application changes – MSK Replicator supports replicating topics with the same name, which eliminates the need for consumer application modifications, reducing development effort and potential errors
  • Seamless failover and failback – Bidirectional replication capabilities enable quick switching of operations to the standby Region with minimal disruption, and straightforward reversion after the primary Region is restored
  • Improved testing capabilities – The setup facilitates regular DR exercises without impacting production systems, allowing Fitch Group to validate their DR plans consistently

Conclusion

By using Amazon MSK and MSK Replicator, Fitch Group has successfully implemented a highly resilient and scalable Kafka infrastructure that meets their stringent business continuity and disaster recovery requirements. This multi-Region deployment enables them to process mission-critical financial data at scale while providing minimal downtime and data loss in the event of service events or disasters. As Fitch Group continues to innovate and grow, their robust Kafka infrastructure provides a solid foundation for future expansion and the development of new data-driven services, ultimately enhancing their ability to deliver timely and accurate financial insights to their clients.


About the authors

Kalyan Janaki is Senior Big Data & Analytics Specialist with Amazon Web Services. He helps customers architect and build highly scalable, performant, and secure cloud-based solutions on AWS.

Venu Nemallikanti is the Enterprise Architect and Lead for Event Streaming at Fitch Group, a globally recognized financial information services provider operating in over 30 countries. His primary responsibilities include overseeing the architecture and implementation of event streaming solutions, ensuring the seamless integration and performance of systems that deliver credit ratings, research, data, and analytics to a worldwide clientele.

Chaitanya Shah is a Principal Technical Account Manager with AWS, based out of New York. He loves to code and actively contributes to the AWS solutions labs to help customers solve complex problems. He provides guidance to AWS customers on best practices for their Cloud migrations. He is also specialized in AWS data transfer and the data and analytics domain.

Oleg Chugaev is a Principal Solutions Architect and Serverless evangelist with 20+ years in IT, holding multiple AWS certifications. At AWS, he drives customers through their cloud transformation journeys by converting complex challenges into actionable roadmaps for both technical and business audiences.

Global elections in 2024: Internet traffic and cyber threat trends

Post Syndicated from João Tomé original https://blog.cloudflare.com/elections-2024-internet/

Elections define the course of democracies (even as there are several types of democracies), and 2024 was a landmark year, with over 60 countries — plus the European Union — holding national elections, impacting half the world’s population. As highlighted in Pew Research’s global elections report, this was a year of “political disruption,” where the Internet was a relevant stage for both democratic engagement and cyber threats.

At Cloudflare, with our presence in over 330 cities and 120 countries and interconnection with 12,500 networks, we’ve witnessed firsthand the digital impact of these elections. From monitoring Internet traffic patterns to mitigating cyberattacks, we’ve observed trends that reveal how elections increasingly play out online. As detailed in our just-published Cloudflare Impact report, we’ve also worked to protect media outlets, political campaigns, and help elections worldwide.

Here’s the map of countries with national elections that took place in 2024, from our elections report.


We’ve been monitoring 2024 elections worldwide on our blog and in the 2024 Election Insights report available on Cloudflare Radar.

In terms of Internet patterns, we’ve observed how cyber activity in 2024 continues to intersect with real-world events. Online attacks are clearly a significant part of elections, even when unsuccessful in disrupting candidates or election-related websites due to strong protections. Additionally, Internet traffic patterns often vary on election day depending on the country, and government-directed Internet shutdowns continue, including ones related to elections. Email activity is also influenced, especially for more popular candidates in “polarized battles.”

Let’s start our review with attacks. 

Rising threats: political and election-related cyberattacks in 2024

During 2024, elections saw a rise in DDoS attacks targeting political campaigns, parties, and election infrastructure.

In the United States, over 6 billion malicious requests were blocked between November 1-6. A set of DDoS attacks leading up to Election Day on November 5 targeted one of the campaigns with multiple days of attacks, peaking at 700,000 requests per second and sustaining 8 Gbps during major strikes. Key attack tactics included cache-busting, geodiverse patterns, and randomized user agents.


State and local websites also faced increased threats, with 290 million malicious requests blocked since September under Cloudflare’s Athenian Project. Compared to 2020, attacks in 2024 were far more intense, underscoring the growing need for robust cybersecurity to protect elections from disruption.

In France, DDoS attacks plagued multiple political parties, with peaks reaching 96,000 requests per second (rps) on election day, July 7. Additional details are available in our related blog post.


In the United Kingdom, DDoS attacks targeted political parties, with the most severe incident affecting a campaign website, reaching 156,000 rps shortly after the results were announced on election day. Additional details are available in our related blog post.


During the European parliamentary elections in early June, cyberattacks targeted several political websites around election days. Notably, a significant DDoS attack focused on two politically-related websites in the Netherlands on June 5–6 (with June 6 being election day), peaking at 73,000 rps.


In Romania, the weeks leading up to the election cycle culminating in the December 1 parliamentary elections saw DDoS attacks targeting political party websites and news organizations.

In South Africa, where the general election took place on May 29, there was a relevant DDoS attack in the weeks leading up to the election, targeting a major news site within the country for several days, with a peak on May 7 of 54,000 requests per second.

In Portugal, several DDoS attacks targeted political party websites on election day, March 10, particularly after polling stations closed. One political party’s websites experienced a peak of 69,000 rps on May 11 at 00:50 UTC.


In Taiwan, a local fact-checking website faced a DDoS attack three days before the election, on January 10.

In Japan, a DDoS attack targeted a website used to report scams and misinformation a week before the October 27 election.

While some of these rates may seem small to Cloudflare, they can be devastating for websites not well-protected against such high levels of traffic. DDoS attacks not only overwhelm systems but also serve, if successful, as a distraction for IT teams while attackers attempt other types of breaches.

Election-related Internet shutdowns 

Several times in 2024, election-related Internet shutdowns were imposed by authorities for various reasons, such as in the Comoros and Pakistan.

Comoros, a small archipelago country in Southeastern Africa with a population of less than 1 million, held presidential elections on January 14, which led to protests against the re-election of President Azali Assoumani. Authorities shut down the Internet on January 17, causing a 50% drop in traffic compared to the previous week, lasting for two days.


Pakistan’s general election day on February 8 was marked by an Internet shutdown targeting mobile networks. The outage began around 02:00 UTC, reducing Internet traffic by 50% compared to the previous week. Traffic only began recovering after 15:00, highlighting the severe impact of government-initiated shutdowns on Internet connectivity.


In Mauritius, an island nation in the Indian Ocean with under 2 million residents, the government suspended access to social media platforms from November 1 to November 11 ahead of the November 10 parliamentary elections. 

Other election-related Internet traffic trends 

Election-day Internet traffic patterns often reflect a country’s dominant device usage, with mobile-first nations like Indonesia, Mozambique, and Ghana experiencing noticeable traffic drops after polling stations closed. While mobile-friendly countries generally see steady or higher weekend traffic compared to desktop-focused regions like Europe and the Americas, no consistent trend emerged linking device preference to overall election-day traffic increases or decreases.

Here’s a world map from our Year in Review 2024 showing countries where mobile (purple) or desktop (green) dominates Internet traffic.


Now, let’s explore a selection of relevant elections with Internet traffic impacts, ordered by election dates:

Taiwan (January 13)
Taiwan’s presidential election saw traffic drop slightly during polling hours, especially in the morning with an 8% drop. Traffic returned to usual levels after 17:00 local time. Post-election, traffic rose by 5% the next morning compared to the previous week.


Finland (January 28)
On January 28, Finland held its presidential election. Internet traffic dropped by 24% at 11:00 local time, coinciding with higher voter turnout in the morning. A second noticeable drop of 13% occurred at 20:00 when polling stations closed and TV stations broadcast initial projections, though traffic was slightly higher than usual afterward.

Indonesia (February 14) 
Indonesia held its general election on February 14. With over 200 million voters spread across 17,000 islands, it likely had the highest number of voters on a single day, unlike India’s multi-week election. During polling hours (08:00 to 13:00 local time), Internet traffic dropped by up to 15%. Traffic remained lower than the previous week for the rest of the day, with drops ranging from 8% to 16% throughout the night. Mobile device usage surged to 77%, the highest of the year, reflecting Indonesia’s mobile-first Internet culture. Traffic recovered the next morning, surpassing the previous week’s levels.


Portugal (March 10)
Portugal’s parliamentary election on March 10 saw a sharp 16% traffic drop at 20:00 local time when TV stations began broadcasting projections. Traffic picked up after that and remained stable during the day.

Russia (March 17)
Russia’s presidential election showed steady Internet traffic throughout the day but experienced a 7% decrease after polls closed as results and reactions were broadcast on TV. Unlike other countries, where post-election traffic surges are common, Russia’s pattern reflects the strong influence of broadcast media on election coverage.

South Korea (April 10)
South Korea held legislative elections on April 10. Traffic was higher than usual before 05:00 local time but dropped 14% by 07:15 after polling stations opened at 06:00. By 11:45, traffic had rebounded above typical levels. After polling stations closed at 18:00, traffic dropped again, with a 7% decline compared to the previous week.

India (April 19–June 1) – related blog post
India’s seven-phase general election saw significant Internet traffic fluctuations. May 7 recorded the largest nationwide traffic dip of 6%, with populous states like Uttar Pradesh seeing a 9% drop and Maharashtra experiencing a 17% decline. On the final election day (June 1), mobile device usage peaked at 68%, the highest of the year. These patterns underscore India’s mobile-first Internet habits and its diverse election timelines.


North Macedonia (April 24 & May 8)
North Macedonia’s two-round presidential election featured a 56% traffic increase after 11:00 local time on May 8, sustained throughout the day. Similar, albeit smaller, trends were observed during the first round on April 24.

Panama (May 5)
On May 5, Panama’s presidential and parliamentary election day, Internet traffic dropped significantly while voting stations were open, with a 23% decrease in the afternoon and 25% lower traffic at 21:30 local time as results were announced. Traffic picked up after that.

South Africa (May 29) – related blog post
On May 29, South Africa’s general election saw Internet traffic decrease by 16% at 05:45 and remain lower throughout polling hours. Traffic surged by 25% the night before the election, peaking at midnight. Post-election, traffic increased by up to 12% early on May 30, highlighting the transition from offline to online engagement.

Mexico (June 2) – related blog post
Mexico’s general election on June 2 saw a 3% daily traffic drop, with hourly dips of up to 11% during polling hours (08:00–20:00 local time). Traffic surged by 14% at 01:30 the following day as results were announced, peaking at 8% above the previous week by 22:00 local time.

Iceland (June 1)
Iceland’s presidential election on June 1 saw minor Internet traffic drops, including a 12% dip between 14:00 and 16:00 local time, but traffic increased at night by as much as 11% at 20:00. The day after, traffic rose by 26% compared to the previous week. Iceland elected Halla Tómasdóttir as its second female president.

European Union (June 6–9) – related blog post
The 2024 European Parliament elections showed notable Internet traffic shifts and cybersecurity challenges. The Czech Republic and Slovakia experienced traffic drops of over 10%, while Finland and Ireland saw moderate declines. Key speeches, such as Belgian Prime Minister Alexander De Croo’s resignation and French President Macron’s snap election announcement, also caused traffic fluctuations.


Source: Cloudflare; created with Datawrapper

Iran (June 28)
Iran’s presidential election saw significant traffic fluctuations, with traffic falling by 16% after 17:30 local time. Extended polling hours (including at night) led to continued drops, falling to 24% lower by 22:30. After midnight, traffic rebounded, showing a 13% increase compared to the previous week.

France (June 30 & July 7) – related blog post
France’s legislative elections brought significant Internet and cybersecurity activity. On July 7, Internet traffic dropped 16% at 20:00 local time as polling stations closed and TV broadcasts announced results. Mobile device usage surged to 58%, and DNS traffic to news outlets spiked by 250% during the first round and by 244% on runoff day, reflecting heightened public interest.


United Kingdom (July 4) – related blog post
The UK’s general election on July 4 saw the Labour Party win a majority after 14 years of Conservative rule. Internet traffic declined slightly during voting hours, with a 2% drop at noon, before surging in the evening as results were announced. Northern Ireland experienced the sharpest traffic drop (10%), compared to 6% in Scotland and 5% in Wales. DNS traffic to election-related domains peaked with increases of 600% at 22:00 and 671% at 04:00 the following day.


Sri Lanka (September 21)
Sri Lanka’s presidential election caused a 9% morning traffic dip and an 18% post-election surge after polls closed. Results triggered a 109% traffic increase at 03:00 local time on September 22.

Tunisia (October 6)
Tunisia’s presidential election saw a 15% traffic dip at 17:00, followed by a 13% decline at 19:30 when results started arriving. The steady traffic decrease highlights the evening focus on offline engagement and result tracking.

Mozambique (October 9)
Mozambique’s election drove an Internet traffic drop throughout the day, falling as much as 51% by 20:30 local time, and continuing lower than usual after that. A post-election surge of 16% occurred at 01:30. The election, held on a public holiday, resulted in a 31% daily traffic drop compared to the previous week.

Georgia (October 26)
When Georgia held its parliamentary election on October 26, Internet traffic was 11% higher than the previous week, peaking at 67% above normal around 23:00 when results were announced. Unlike other countries, traffic only dipped slightly (2%) in the afternoon during polling hours.

Japan (October 27)
Japan’s House of Representatives election saw Internet traffic decrease by 4% at 20:00 after polling stations closed, but it rose later in the evening.

Botswana (October 30)
A traffic drop was observed throughout the day of Botswana’s general election, with a 42% decrease around 21:30 local time compared to the previous week.

United States (November 5) – related blog post
The US elections saw a 15% spike in Internet traffic, particularly after polls closed, with the Midwest leading. There were also specific spikes related to key moments during election night, as the next chart shows: 


DNS traffic surged by 756% to polling services and 325% to news sites. As highlighted in our recent Internet Services Year in Review blog post, the US election also boosted DNS traffic and ranking positions for CNN, Fox News, and The New York Times, underscoring the Internet’s critical role during major political events.

In the US, beyond election day, we also reported in 2024 on trends surrounding the first Biden vs. Trump debate, the attempted assassination of Trump and the Republican National Convention, the Democratic National Convention, and the Harris-Trump presidential debate.

Ghana (December 7)
Ghana’s general election caused mid-morning traffic drops of 11%, followed by declines of 13% and 14% after polling stations closed at 17:00. These patterns indicate offline focus during results announcements.

Romania (December 1)
Romania’s parliamentary election showed minimal traffic fluctuations during the day, though its November 24 presidential election remains disputed.

Email perspectives on the US presidential election

From a cybersecurity perspective, trending events, topics, and individuals often attract more emails, including malicious, phishing, and spam messages. In our analysis earlier this year, we focused on the US presidential elections and the two major party candidates.

From June 1 to November 5, 2024, Cloudflare processed over 19 million emails mentioning “Donald Trump” or “Kamala Harris,” with Trump appearing more frequently and in higher rates of spam (12%) and malicious emails (1.3%) compared to Harris (0.6% spam, 0.2% malicious). Nearly half were sent after September, with a surge in the final 10 campaign days.


Conclusion: the election cycle doesn’t stop

As a global election year, 2024 underscored how deeply the Internet is woven into the democratic process, serving both as a tool for engagement and a target for disruption. From relevant DDoS attacks to government-imposed Internet shutdowns, the challenges faced during these elections reflect a growing need for robust cybersecurity measures to safeguard critical infrastructure and ensure free, fair electoral processes.

In this context, Germany has announced an anticipated federal election for February 23, 2025, following the collapse of its governing coalition during the 2024 government crisis. This snap election joins others in France and the UK, reflecting a growing trend of political instability requiring urgent electoral responses.

Looking ahead, the increasing frequency and complexity of cyber threats, such as DDoS attacks on campaigns and election infrastructure, demand proactive defenses. Shutdowns like those in Pakistan and Comoros, along with surges in phishing and misinformation, highlight the need for closer collaboration between governments, technology providers, and civil society to safeguard democracy in the digital era.

If you want to follow more trends and insights about the Internet and elections in particular, you can check Cloudflare Radar, and more specifically our new 2024 Elections Insights report.

Computing Curriculum Framework: Adapting to India’s diverse landscapes

Post Syndicated from Mamta Manaktala original https://www.raspberrypi.org/blog/computing-curriculum-framework-adapting-to-indias-diverse-landscapes/

The digital revolution has reshaped every facet of our lives, underscoring the need for robust computing education. At the Raspberry Pi Foundation our mission is to enable young people to realise their full potential through the power of computing and digital technologies. Since starting out in 2008 as a UK-based educational charity, we’ve grown into a global leader in advancing computing literacy.

An educator and students working on a coding task.

At the heart of our efforts lies a simple yet powerful vision: to ensure every young person develops the knowledge, skills, and confidence to use digital technologies effectively. This includes understanding societal and ethical issues, using technology for creative problem solving, and fostering a mindset of adaptability that will enable them to thrive amid rapid technological change.

A vision for global computing education

To realise this vision, we developed The Computing Curriculum (TCC). Launched in 2018 as part of the UK’s National Centre for Computing Education, TCC is a comprehensive set of free teaching resources tailored for students aged 5–16. Over the years, the curriculum has evolved through rigorous testing and teacher feedback, which has helped to make it one of the most effective and inclusive computing education tools globally.

A group of students in a classroom.

Contextualising computing education for India

India’s vast diversity — in languages, social and economic contexts, and educational infrastructure — creates unique challenges and opportunities. As a result, we at the Raspberry Pi Foundation have adapted and localised our computing curriculum to meet the needs of Indian students. Collaborations with the Telangana Social Welfare Residential Educational Institutions Society (TGSWREIS) and the Odisha Mo School programme have been pivotal in this endeavour.

Modelling data using a spreadsheet (Grade 9)
Creating media — audio production (Grade 7)

In Telangana, we adapted TCC to create a 70+ hour computing curriculum designed for government schools with limited resources. Similarly, in Odisha, elements of this curriculum have been tailored to develop Kaushali, an IT and coding curriculum for over 8,000 state schools. This localised approach ensures that computing education becomes accessible and relevant for students across India.

A curriculum designed for impact

The computing curriculum for India spans Grades 6 to 10 (age group 11-16) and is structured to ensure progressive learning. Students revisit foundational concepts repeatedly, building on prior knowledge as they advance through the grades. The curriculum emphasises forming a strong understanding of concepts over rote learning and integrates research-informed pedagogical approaches.

Students using computers in a classroom.

We tested our localised curriculum resources in Telangana Coding Academy, and there was lots of positive feedback from educators and observers. Overall, the educators were happy with the content format, and the observers noted that students enjoyed learning and completing the activities. This was also evident from the student discussion notes and student survey responses.

“[…] this content is more than what we are expecting for the school years[…] this time they [are] having [a] practical session. So they are very happy to do it and whenever they are free[,] they will come and ask us. ‘[C]an you take [an] extra class for us?’” – Educator

“[…] They are very [appreciative of] the content and [t]hey [are] learning very well, and the response is very good.” – Educator

Key features of the curriculum:

  • Tailored content: Materials are customised to align with the proficiency levels and contexts of Indian students, ensuring accessibility
  • Localised examples: By incorporating culturally relevant examples, students find the learning experience relatable and engaging
  • Simplified language: Designed for students who may lack confidence in English, the curriculum employs clear and concise language for better comprehension
  • Hands-on learning: Practical activities, including projects and model creation, solidify understanding and foster creativity
  • Ready-to-use resources: Teachers are equipped with lesson plans, presentations, worksheets, and activity sheets, reducing preparation time and enhancing delivery

Learning objectives:
The curriculum focuses on equipping students with:

  • An understanding of digital systems and their impact on people and society
  • Computational thinking and problem-solving skills for real-world applications
  • Confidence and knowledge to become creators and innovators
  • Awareness of digital citizenship and responsible technology use

Curriculum structure:
Each academic year includes 30–34 sessions, each lasting 45–60 minutes. Lessons are structured into deliverable units comprising detailed plans, presentations, and worksheets. Both plugged (computer-based) and unplugged (activity-based) learning methods are used, with a 60:40 ratio, ensuring balanced and inclusive learning experiences.

Sample progression across grades:

Curriculum highlights

Grade 6: Building a foundation

Students develop foundational computer skills, learn basic text formatting, and explore introductory programming concepts using Scratch. They also begin to understand how to group and describe objects based on their properties.  

Grade 7: Expanding horizons

Students delve into computer networks, the internet, and the World Wide Web. They learn to use loops in Scratch programming and explore data organisation using flat-file databases and spreadsheets.  

Grade 8: Deepening understanding

Students gain a deeper understanding of how computer systems function and use spreadsheets for data analysis. They continue to build their programming skills in Scratch, focusing on sequences, variables, and selection. They are also introduced to HTML and CSS for basic web development.  

Grade 9: Exploring advanced concepts

Students learn about data representation, including binary and character coding schemes. They design and create websites using HTML and CSS, incorporating accessibility and good web design principles. They also explore the layers of computing systems, including hardware, operating systems, and logic circuits.  

Grade 10: Applying knowledge and skills

Students explore advanced data representation, including image and sound representation. They are introduced to cybersecurity concepts and delve deeper into Python programming, focusing on selection and iteration. They also learn about data science and how to create a blog to support a cause.

Assessment framework:
To measure student progress effectively, the curriculum incorporates both formative and summative assessments:

  • Formative assessments: Embedded in lessons to monitor progress and identify misconceptions early.
  • Summative assessments: Provide a holistic overview of learning outcomes through tools like multiple-choice quizzes and rubrics. These assessments focus on understanding concepts and skills, moving beyond mere code writing.

Bridging the digital divide

Our localised computing curriculum is more than a technical education initiative — it is helping to bridge the digital divide. By empowering students with essential digital skills, it fosters innovation, enhances employability, and enables young people to participate actively in the global digital economy.

The road ahead

As technology continues to evolve, so does the need for adaptive and inclusive computing education. We remain committed to supporting governments, educators, and students in this journey. By fostering a generation of digitally literate and empowered individuals, we can create a future where technology serves as a force for good in society.

Through collaborations and localised efforts, the dream of making computing education accessible to every corner of India is steadily becoming a reality. Together, we can equip students with the skills and mindset needed to navigate the complexities of the digital age and shape a brighter, more inclusive future.

The post Computing Curriculum Framework: Adapting to India’s diverse landscapes appeared first on Raspberry Pi Foundation.