Implementing customer managed keys for AWS Lambda durable functions with Terraform

Post Syndicated from Rajdeep Banerjee original https://aws.amazon.com/blogs/compute/implementing-customer-managed-keys-for-aws-lambda-durable-functions-with-terraform/

If you run regulated workloads, you must control how persisted data is encrypted and who can access it. You need to manage encryption key rotation schedules, restrict decryption to authorized principals, and produce audit evidence that proves encryption controls are operating as designed.

AWS Lambda durable functions build resilient, multi-step workflows that survive failures through automatic checkpointing. The checkpoint mechanism persists execution state, including step results, payloads, and callback responses, to durable storage. For payment processing workloads, this persisted data is sensitive. AWS Lambda durable functions support customer managed keys from AWS Key Management Service (AWS KMS). A customer managed key gives you three controls: you set the key rotation schedule, you restrict decryption access through the key policy, and you generate per-function audit trails in AWS CloudTrail. A durable execution uses the same encryption key it started with for its entire lifetime. Changing or removing the key affects only executions that start after the change.

Updating the customer managed key policy to remove decrypt permissions, or disabling the key, stops the Lambda service from accessing previously checkpointed state. Customer managed key deletion is a permanent action, and all durable executions encrypted with that key become unrecoverable because the Lambda service has no mechanism to restore the data. Before scheduling key deletion, use the AWS KMS waiting period (7 to 30 days) and monitor AWS CloudTrail for Decrypt calls to confirm that the key is no longer in active use.

In this post, you learn to configure a customer managed key to encrypt durable execution data in an event-driven payment processing workflow. You create a symmetric encryption key in AWS KMS and define a key policy that grants the Lambda service, the function’s execution role, the function author, and durable execution operators only the AWS KMS actions each principal requires. You then configure the function to use the key for durable execution encryption and verify encryption operations through AWS CloudTrail logs. By the end, you have a deployable reference architecture you can adapt for regulated workloads running on Lambda durable functions.

To learn more about how AWS Lambda encrypts durable execution data, see Encrypting AWS Lambda durable execution data in the AWS Lambda Developer Guide.

Solution overview

The sample application implements an event-driven payment processing pipeline using Amazon DynamoDB, Amazon EventBridge, Amazon EventBridge Pipes, AWS Lambda, and Amazon SQS. The pipeline receives authorized payment transactions, validates and enriches them. A Lambda durable function applies business rules to the enriched transactions. The approved transactions are sent to a downstream settlement system for posting.

The following section covers the key architectural steps.

Architecture steps

  1. The upstream authorization system writes authorized payment records to a DynamoDB table.
  2. DynamoDB Streams captures each new record as an ordered change event.
  3. Amazon EventBridge Pipes polls the record from the DynamoDB stream. The pipe triggers a Lambda function as part of enrichment step for duplicate checking.
  4. The deduplication Lambda uses a DynamoDB table with conditional writes to identify duplicate inbound transactions based on transaction properties and time window.
  5. When the deduplication is successful, the pipe publishes an event to the Amazon EventBridge custom event bus.
  6. An Amazon EventBridge rule invokes a Lambda function for matching events. The function adds business context such as account type, bank routing details, and merchant category codes. The function publishes a new enriched event to the custom event bus.
  7. Another Amazon EventBridge rule matches the enriched events to a Lambda durable function. The durable function applies business rules to the incoming event. When the event passes all business rules, the function publishes a new event to the event bus.
  8. An Amazon EventBridge rule routes the approved event to an Amazon SQS queue preserving ordering for settlement and buffering against downstream throughput limits.
  9. The Posting Lambda function reads from the Amazon SQS and invokes the downstream posting subsystem to post the transaction. Finally, the function publishes a completion event to the event bus completing the transaction lifecycle.

With customer managed keys configured on DynamoDB, Amazon EventBridge, SQS, and the AWS Lambda durable function, every piece of persisted data in this pipeline is encrypted with keys you own and control. The walkthrough that follows shows you how to deploy this configuration with Terraform.

Figure 1 shows the reference architecture for this solution.

Reference architecture

Reference architecture for payment processing using Lambda durable functions

Figure 1: Payment processing using Lambda durable functions

Prerequisites

To deploy this solution, you need the following prerequisites:

  1. AWS account and CLI: An active AWS account with the AWS CLI installed and configured with appropriate credentials.
  2. Terraform: Terraform installed (version 1.0 or later) for infrastructure provisioning.
  3. Python environment: Python 3.11 or later, with pytest for running unit tests. The aws-durable-execution-sdk-python package requires Python 3.11 or later.
  4. AWS Identity and Access Management (IAM) permissions: The IAM permissions to create the resources. Follow the sample repository for the sample policy.
  5. Basic understanding and familiarity with AWS Serverless services.

Solution walkthrough

The following is a step-by-step guide to deploy and test the payment processing solution.

Step 1: Clone the repository

git clone https://github.com/aws-samples/sample-payment-processing-with-lambda-durable-functions.git
cd sample-payment-processing-with-lambda-durable-functions/source

Step 2: Run unit tests

Validate the payment processing logic locally before deploying:

cd lambda-src/business_rules
pip3 install -r requirements-test.txt
pytest test_app.py -v

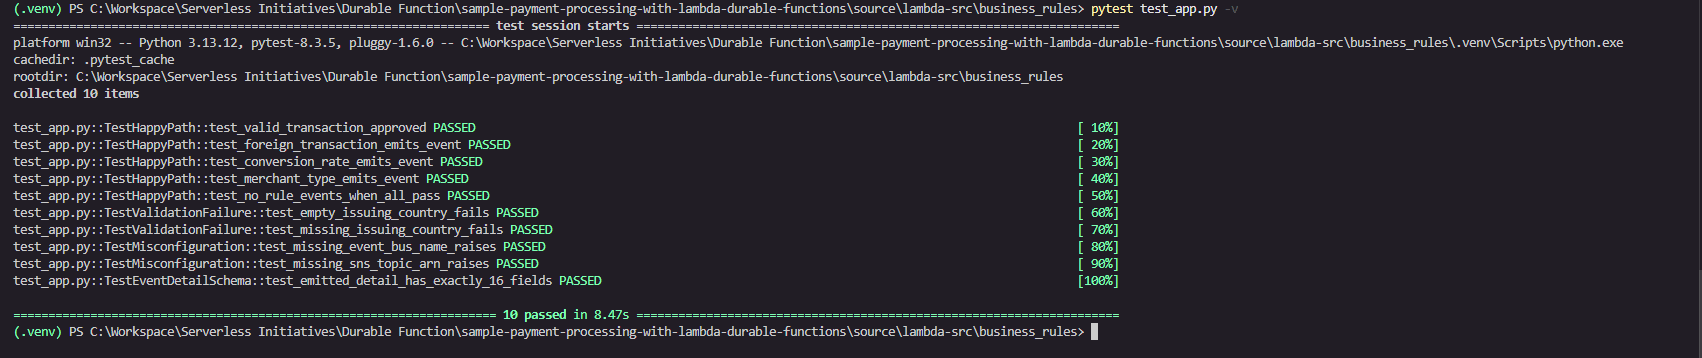
This runs unit tests that cover transaction validation, business rule checks (foreign transaction detection, currency conversion, merchant type), event schema validation, and misconfiguration handling. The tests use the AWS Durable Execution Testing SDK to run the handler locally without deploying AWS resources.

Figure 2 shows an example of test results running locally.

Test run results of the business rules

Figure 2: Test run results of the business rules

Step 3: Inspect the Lambda durable functions construct

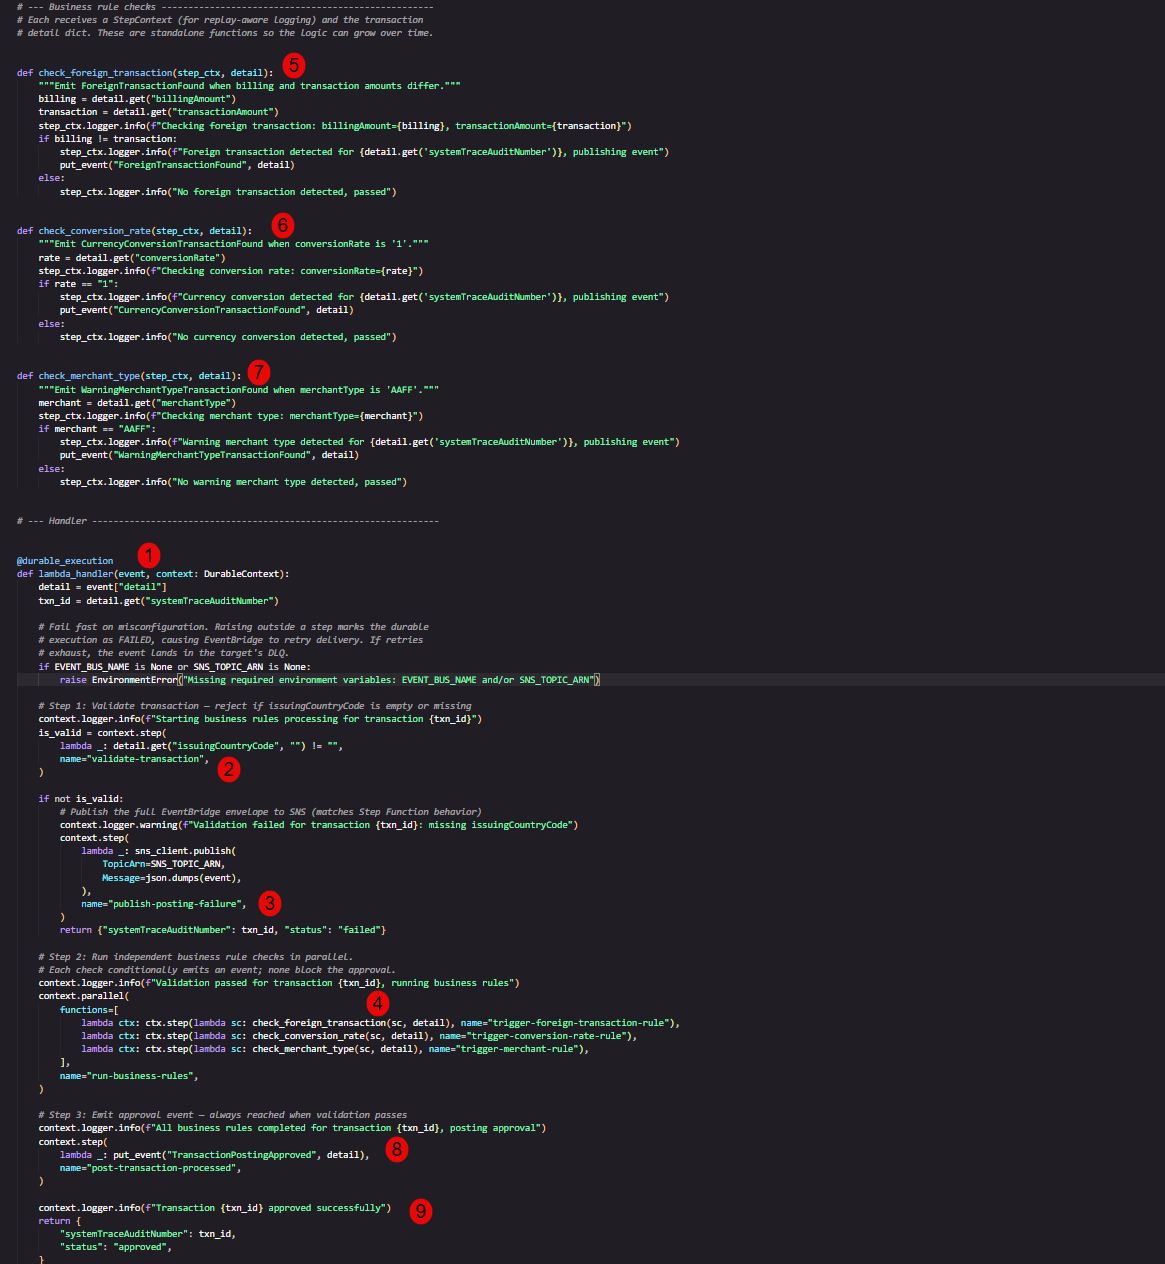
Open the payments-business-rules Lambda function in source/lambda-src/business_rules/business-rules-app.py for a sample Lambda durable function. Refer to Figure 3 for the code walkthrough.

Key features used

  1. @durable_execution decorator: Transforms a standard Lambda handler into a durable function handler. The durable execution SDK manages checkpointing automatically. No infrastructure changes are required.
  2. context.step("validate-transaction"): Validates that the transaction has a non-empty issuingCountryCode. The durable execution checkpoints the result (True or False) to durable storage. The durable execution restores checkpoint results instead of re-executing steps during the replay phase. This phase occurs whenever the function is re-invoked after an interruption such as a wait period completing, a failure, or a suspension. This checkpointed result is part of the durable execution data encrypted by your customer managed key.
  3. context.step("publish-posting-failure"): Publishes the full Amazon EventBridge envelope to Amazon SNS when validation fails. This step only runs on the failure path. The runtime checkpoints the Amazon SNS publish response to durable storage.
  4. context.parallel("run-business-rules"): Runs three independent rule checks concurrently: foreign transaction detection, currency conversion, and merchant type validation. Each branch checkpoints independently. If one branch fails, the others are not replayed on resume. Each branch result is persisted to durable storage and encrypted by the customer managed key.
  5. ctx.step("trigger-foreign-transaction-rule") (inside parallel): Compares billingAmount against transactionAmount. If they differ, it emits a ForeignTransactionFound event to Amazon EventBridge. This step is checkpointed independently within the parallel group.
  6. ctx.step("trigger-conversion-rate-rule") (inside parallel): Checks whether conversionRate equals 1. If so, it emits a CurrencyConversionTransactionFound event to Amazon EventBridge. This step is checkpointed independently within the parallel group.
  7. ctx.step("trigger-merchant-rule") (inside parallel): Checks whether merchantType equals AAFF. If so, it emits a WarningMerchantTypeTransactionFound event to Amazon EventBridge. This step is checkpointed independently within the parallel group.
  8. context.step("post-transaction-processed"): Emits the final TransactionPostingApproved event to Amazon EventBridge. This step is only reached when validation passes and all business rules complete. The runtime checkpoints the Amazon EventBridge response. On replay, if this step already succeeded, the event is not re-published, which guarantees exactly-once approval semantics.
  9. context.logger: Provides replay-aware logging throughout the handler. During replay of previously completed steps, log statements are suppressed to prevent duplicate log entries in Amazon CloudWatch.
Lambda durable functions code walkthrough

Figure 3: Sample Lambda durable functions code

Step 4: Deploy infrastructure with Terraform

Terraform currently doesn’t support attaching a customer managed key directly to the durable function. You create the symmetric key in Terraform and then associate the key with the durable function on the AWS Management Console. Refer to source/durable_kms.tf for the key configuration.

Initialize and deploy the AWS resources that make up the solution:

cd ../../
terraform init
terraform plan -var="region=us-east-2"

Review the plan output, then apply:

terraform apply -var="region=us-east-2" --auto-approve

Note: Replace us-east-2 with your preferred AWS Region.

On successful completion, Terraform outputs the AWS KMS key alias, key ARN, and DynamoDB Streams ARN used by the event-driven pipeline:

Apply complete! Resources: N added, 0 changed, 0 destroyed.

Outputs:

durable_kms_key_alias = "durable-function-encryption"
durable_kms_key_arn = "arn:aws:kms:us-east-2:xxxxxxxxxxxx:key/4e87d4c2-1190-4db4-8b97-46657f83ee00"
stream_arn = "arn:aws:dynamodb:us-east-2:xxxxxxxxxxxx:table/visa/stream/2026-03-16T14:25:47.847"

Step 5: Verify Lambda durable functions configuration

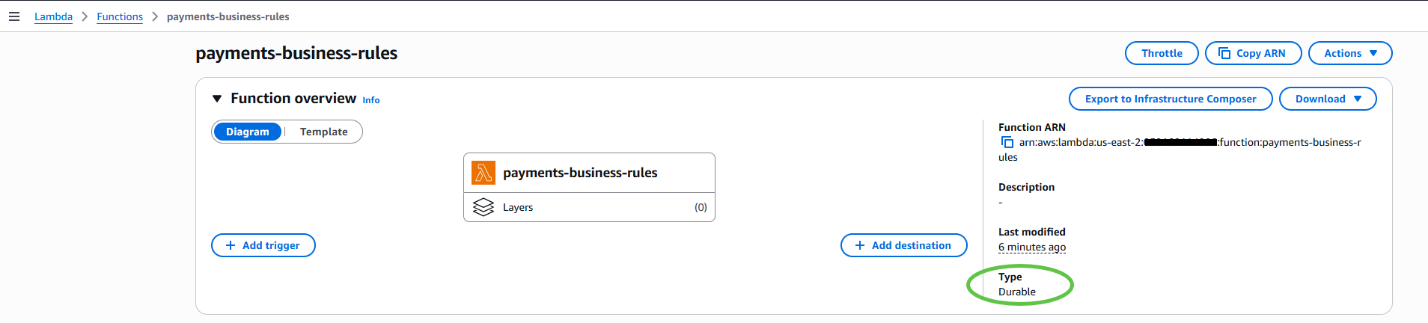
In the AWS Lambda console, navigate to the payments-business-rules function. Confirm that the function Type displays Durable, which indicates that the checkpoint-and-replay mechanism is active. Figure 4 shows the expected function configuration.

The durable function in the AWS Lambda console

Figure 4: The Lambda durable function in the AWS Lambda console

Step 6: Add the AWS KMS key to the Lambda durable function

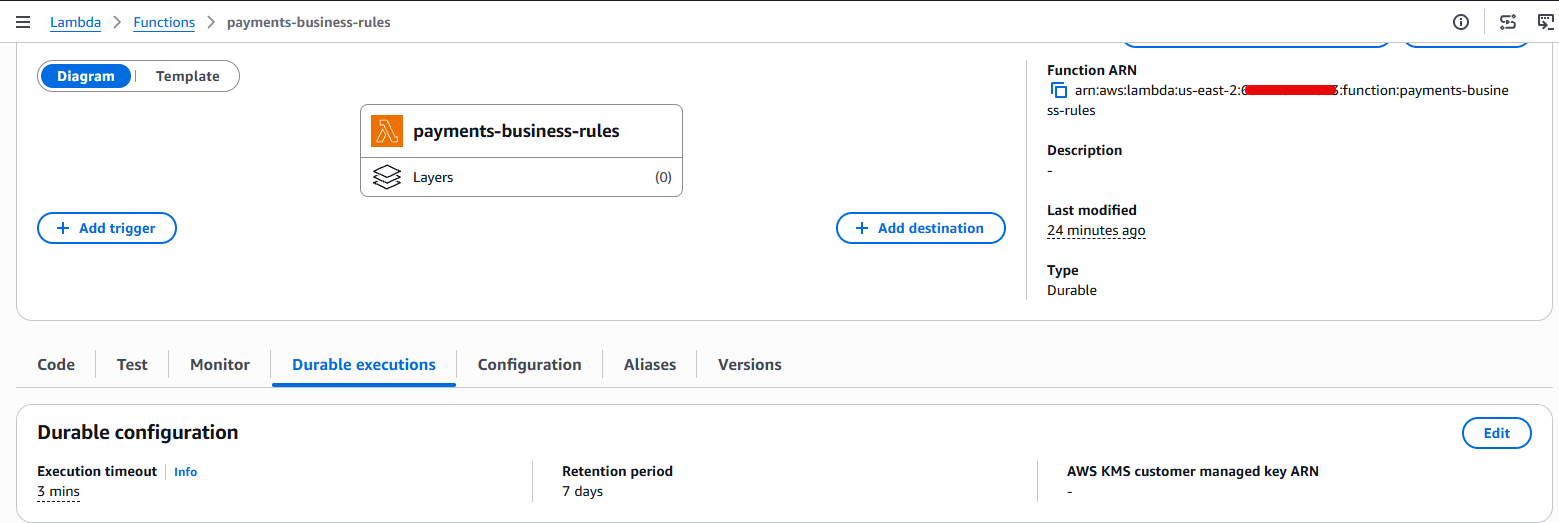
  1. The durable function is not encrypted with a customer managed key. Figure 5 shows the function’s encryption configuration as empty.

    The Lambda durable function missing an AWS KMS key in the AWS Lambda console

    Figure 5: The Lambda durable function missing a customer managed key in the AWS Lambda console

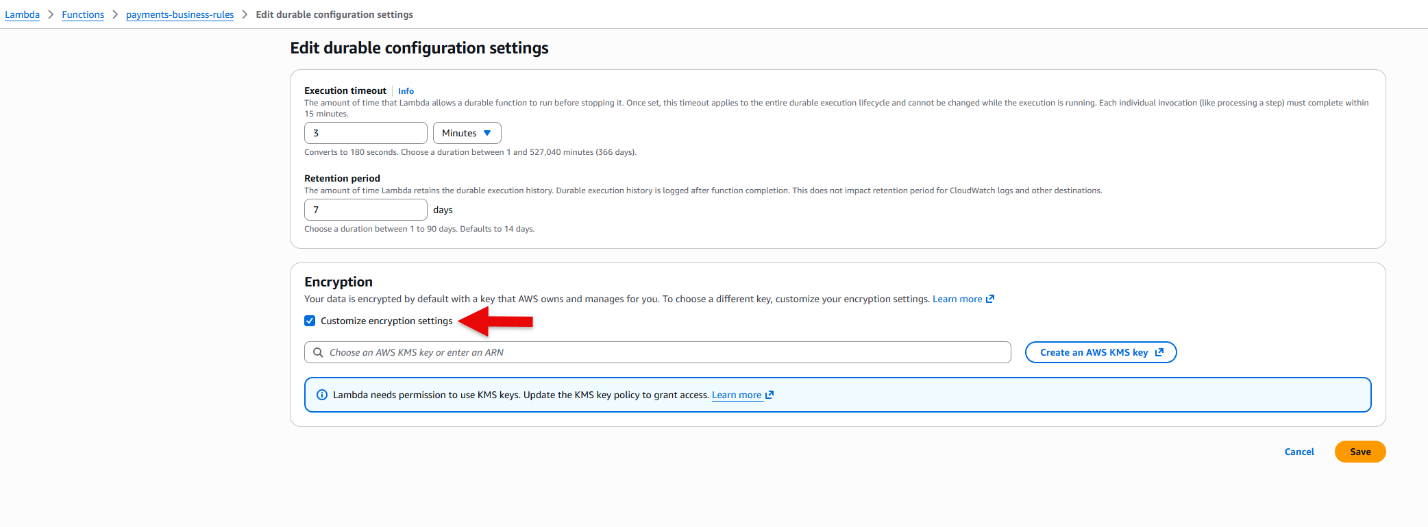
  2. Choose Edit, then turn on Customize encryption settings as shown in Figure 6.

    The Lambda durable function encryption settings in the AWS Lambda console

    Figure 6: The Lambda durable function check encryption in the AWS Lambda console

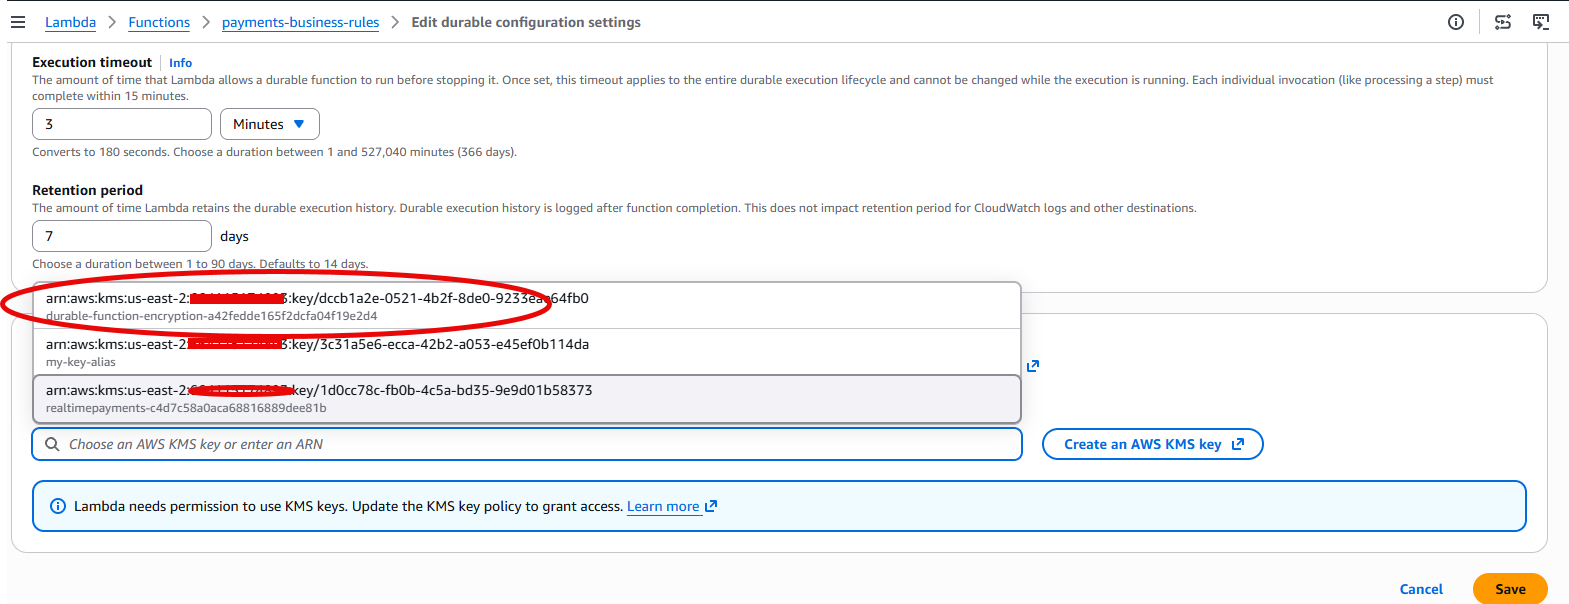
  3. Select the AWS KMS key ARN created for the durable function. The key ARN is available in the Terraform output from Step 4. Figure 7 shows the key selection.

    Selecting the AWS KMS key for the durable function in the AWS Lambda console

    Figure 7: Select the AWS KMS key ARN for the durable function in the AWS Lambda console

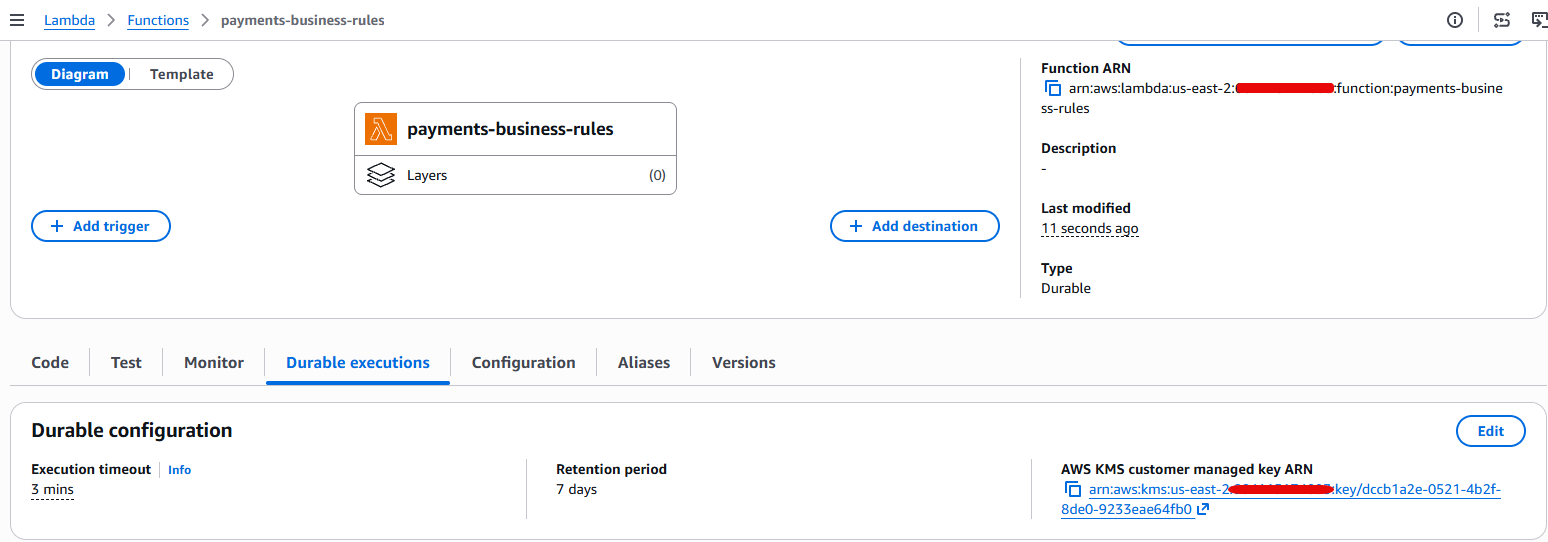
  4. Choose Save and confirm that the durable function is now encrypted with a customer managed key, as shown in Figure 8.

    The Lambda durable function with the AWS KMS key in the AWS Lambda console

    Figure 8: AWS Lambda durable function with the customer managed key in the AWS Lambda console

Step 7: Execute a test payment

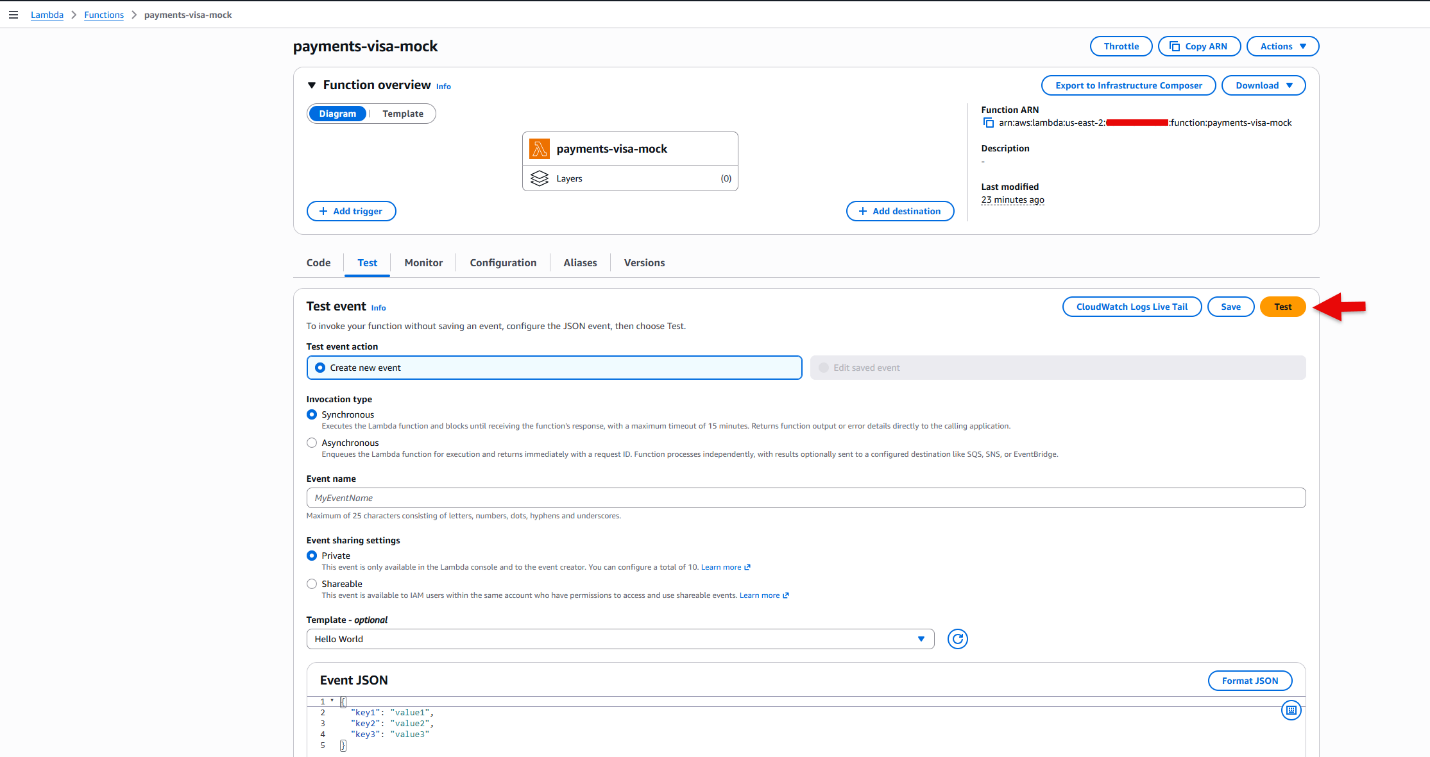
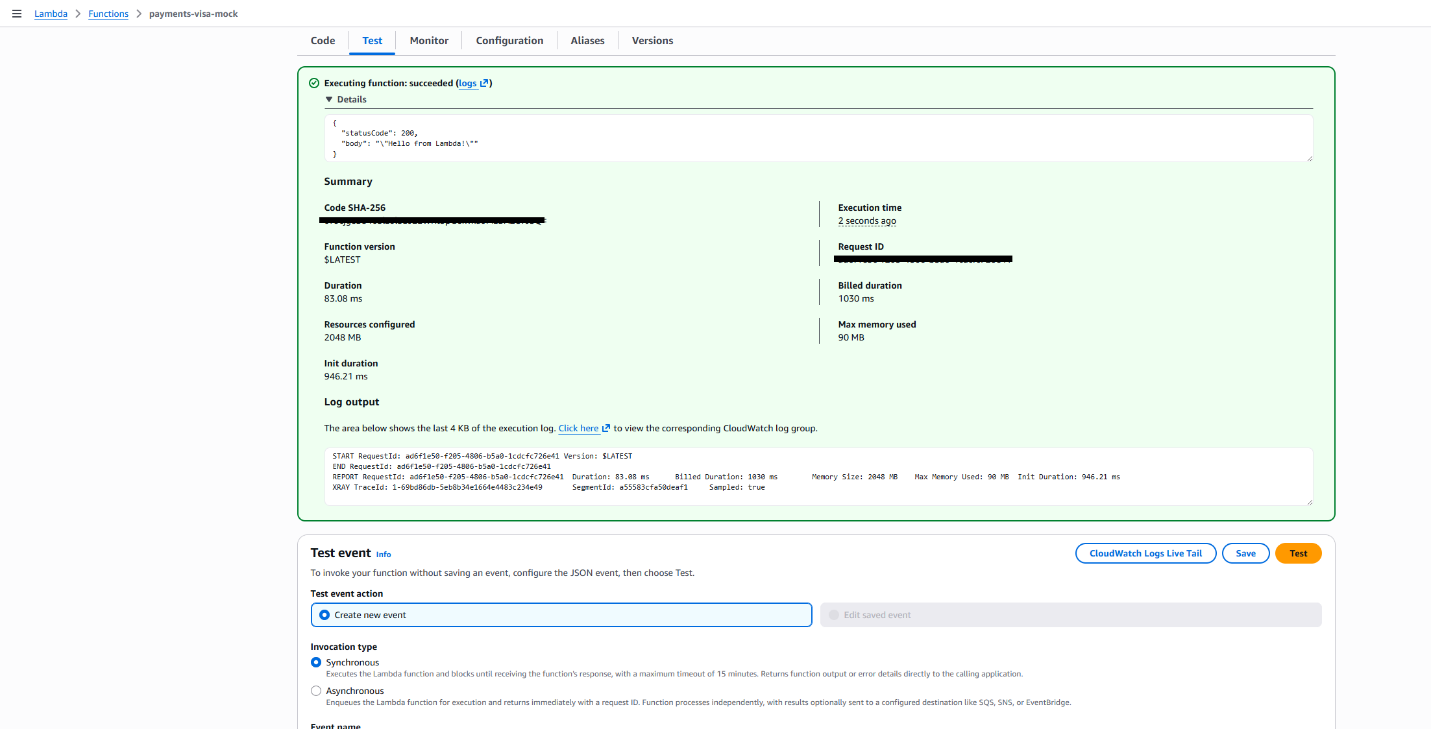
Invoke the payments-visa-mock Lambda function to simulate an end-to-end authorization flow. The mock function reads sample Visa authorization messages from a CSV file and writes them to DynamoDB, which triggers the event-driven pipeline. Figure 9 shows a sample test invocation.

Invoking the payments-visa-mock function to trigger the workflow

Figure 9: Invoke the payments-visa-mock function to trigger workflow

Figure 10 shows a sample response after invocation.

Test results from the payments-visa-mock function

Figure 10: Test results from the payments-visa-mock function to trigger workflow

The mock Lambda invocation creates records that follow the process described in the preceding architecture steps.

Step 8: Verify results

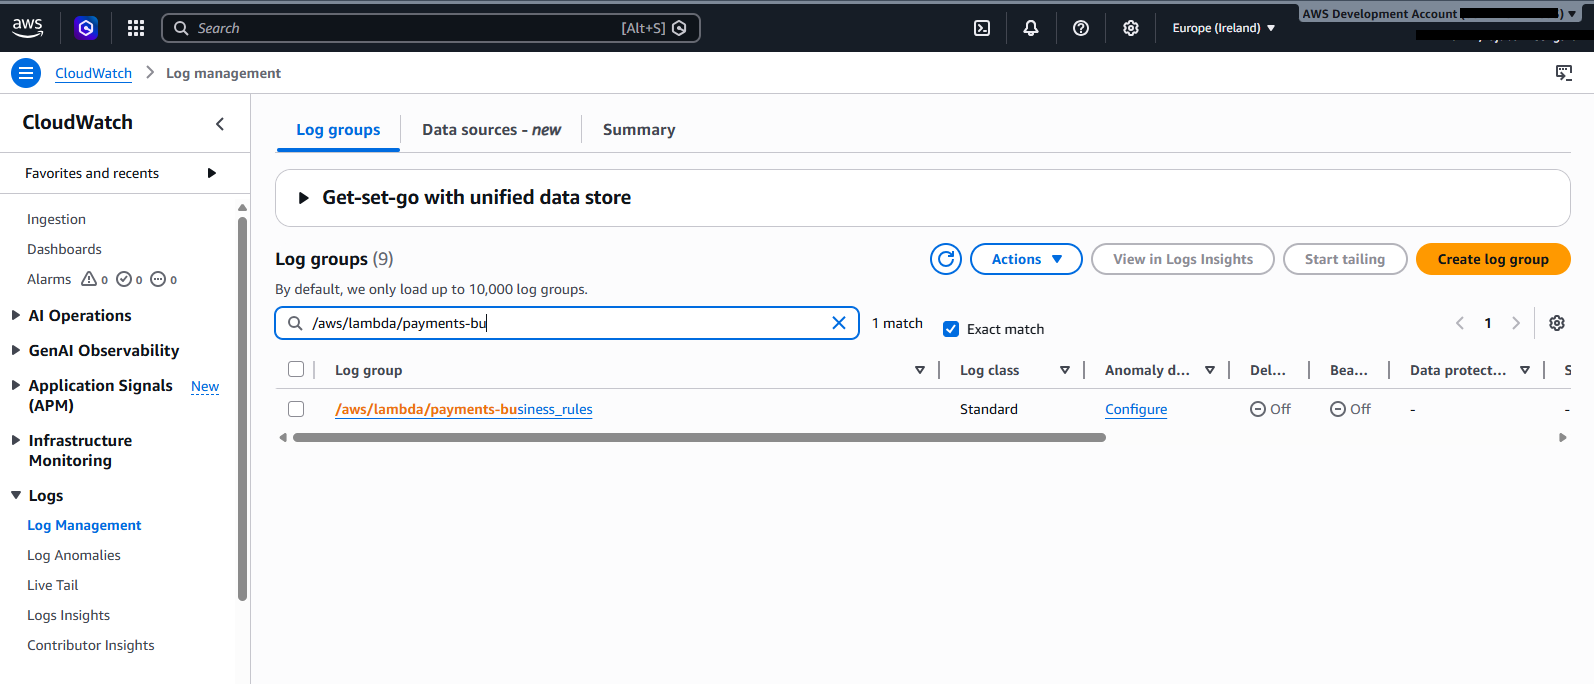
Open Amazon CloudWatch Logs and inspect the log group /aws/lambda/payments-business_rules. This log group belongs to the Lambda durable function for this use case. Figure 11 shows the CloudWatch log group on the console.

Search in CloudWatch Logs for the durable function log group

Figure 11: Search in CloudWatch

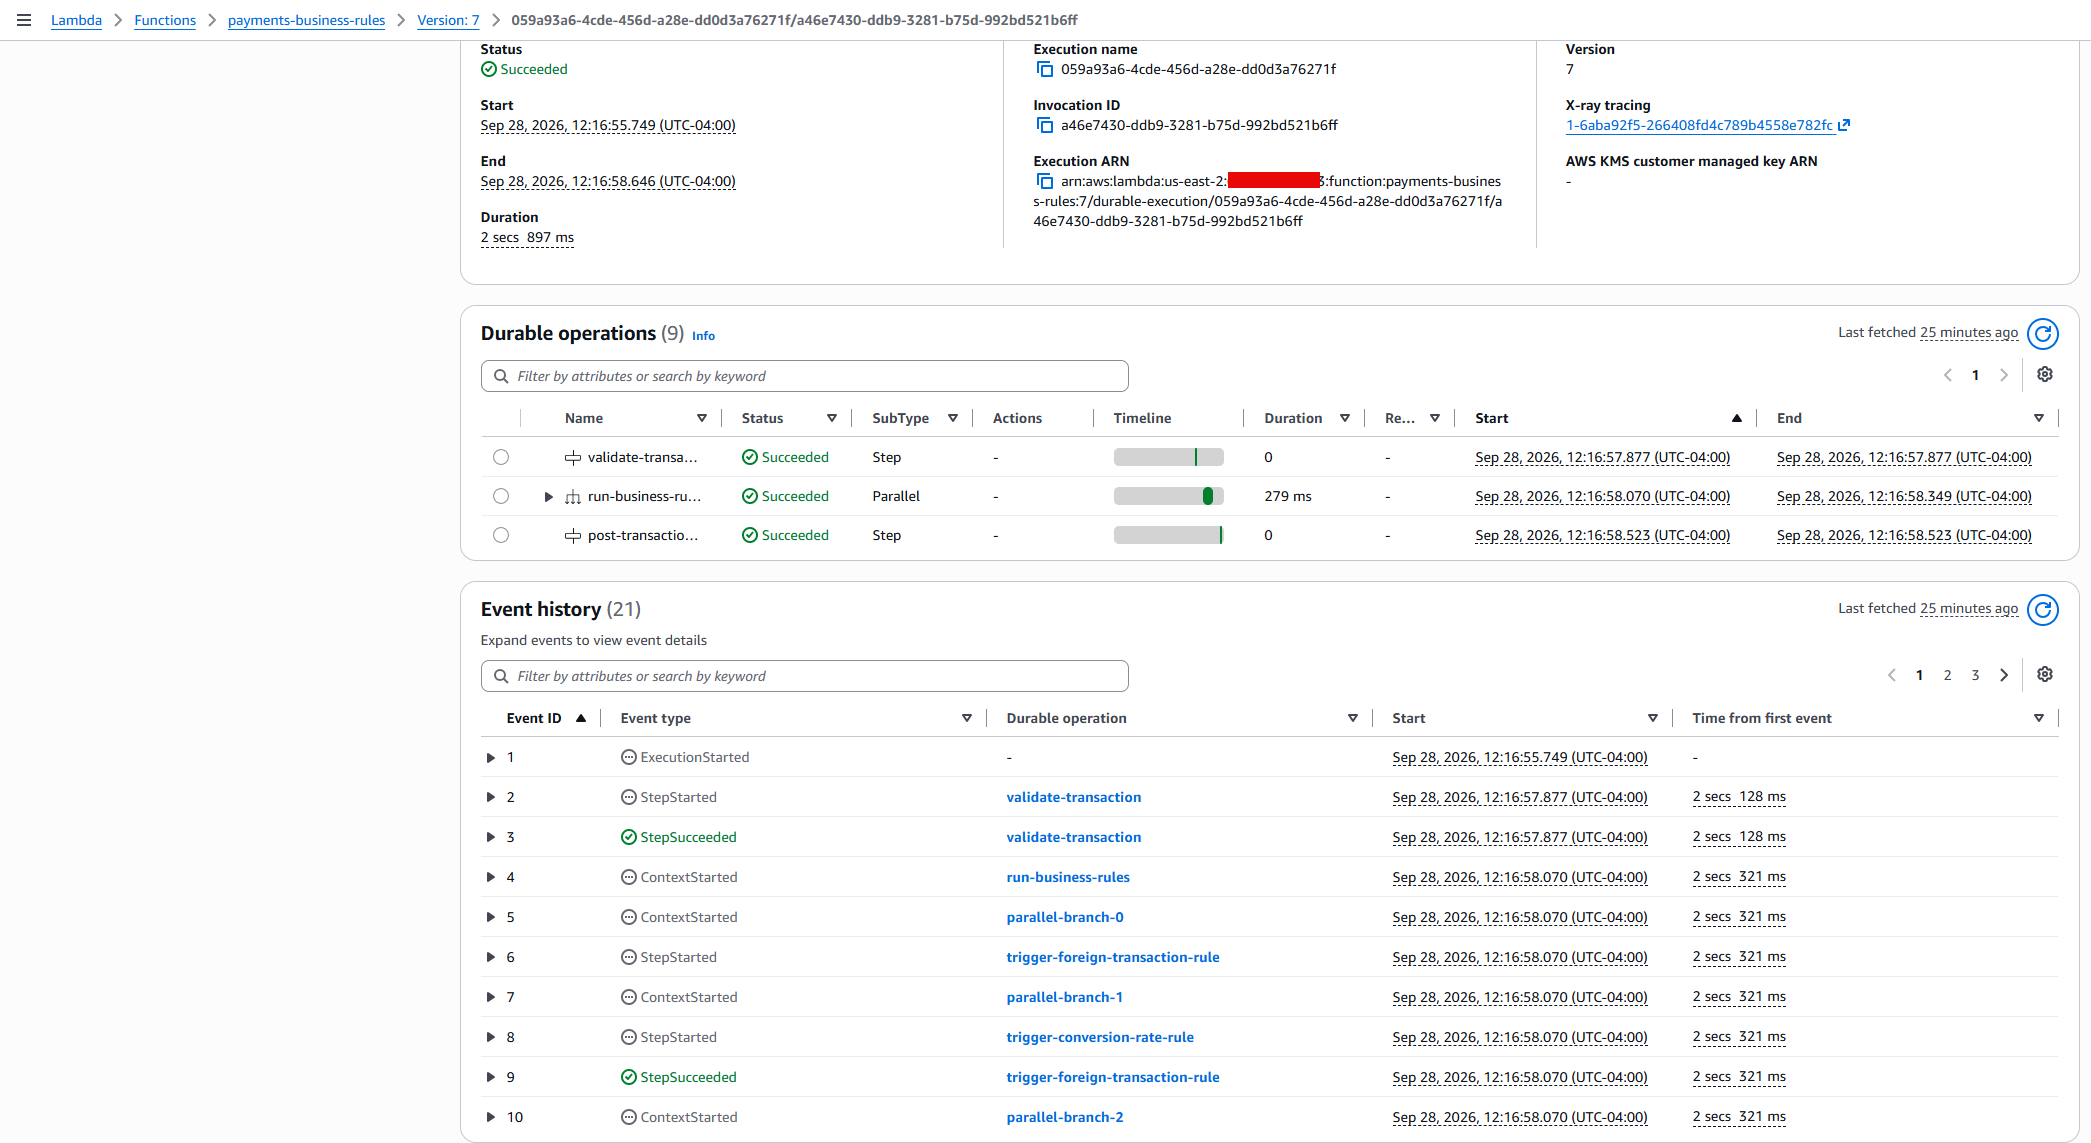
You see the complete business rules lifecycle for each transaction, as shown in Figure 12. The highlighted sections show all the business rules performed by the durable function. Each step is checkpointed by the runtime and encrypted by the customer managed key.

Search Results in lambda durable functions console

Figure 12: Search Results in lambda durable functions console

You can also check the other log groups to trace the full pipeline:

  • /aws/lambda/payments-enrich: Transaction enrichment logs.
  • /aws/lambda/payments-posting: Settlement posting logs.

Step 9: Verify the customer managed key configuration

You can verify the key configuration by using the AWS CLI:

aws lambda get-function-configuration \
    --function-name payments-business-rules \
    --query "DurableConfig" \
    --region us-east-2

Expected response:

{
    "KMSKeyArn": "arn:aws:kms:us-east-2:xxxxxxxxxxxx:key/4e87d4c2-1190-4db4-8b97-46657f83ee00",
    "RetentionPeriodInDays": 7,
    "ExecutionTimeout": 180
}

You can search in AWS CloudTrail to track the AWS KMS calls. When you configure or update the customer managed key on a durable function, Lambda validates the key policy with dry-run GenerateDataKey and Decrypt calls. These appear in CloudTrail with a DryRunOperationException error code, which confirms that the key policy permissions are correct and does not indicate an actual error. For more details, see Encrypting AWS Lambda durable execution data.

Clean up

To avoid ongoing charges, destroy all deployed resources using the following command:

terraform destroy -var="region=us-east-2" --auto-approve

Expected output:

Destroy complete! Resources: N destroyed.

Conclusion

In this post, you configured a customer managed key to encrypt durable execution data in a Lambda durable function. With a customer managed key, you control the key rotation schedule, restrict decryption access through the key policy, and generate per-function audit trails in AWS CloudTrail. You can revoke access to durable execution data at any time by updating the key policy, giving you full control over who can read execution state. In-flight executions stop at the next checkpoint call and new executions must be started after restoring access. For details, see When the customer managed key is unavailable.

For payment processors and financial institutions, encrypting durable execution data with a customer managed key satisfies compliance obligations for data-at-rest encryption, key governance, and access auditability across multi-step transaction workflows.

To get started, clone the sample repository and follow the preceding walkthrough. To learn more about Lambda durable functions, see the AWS Lambda Developer Guide.

Building an LLM-powered DAG failure analysis plugin for Amazon MWAA

Post Syndicated from Sushant Samantaray original https://aws.amazon.com/blogs/big-data/building-an-llm-powered-dag-failure-analysis-plugin-for-amazon-mwaa/

Apache Airflow has become the orchestration backbone for data pipelines across industries. But as those pipelines grow to hundreds of directed acyclic graphs (DAGs) spanning services like AWS Glue, Amazon EMR, Amazon Athena, and Amazon Redshift, debugging a single task failure turns into a significant operational challenge. When a task fails, data engineers sift through logs, cross-reference DAG configurations, and analyze error messages to find the root cause, delaying pipeline service level agreements (SLAs) and impacting team productivity.

In this post, we show you how to build a custom Apache Airflow plugin that integrates with Amazon Bedrock to automatically analyze DAG task failures and provide actionable diagnostic insights. The plugin deploys to Amazon Managed Workflows for Apache Airflow (Amazon MWAA) and provides AI-powered root cause analysis on demand.

The complete source code for this solution is available in the sample-aws-mwaa-llm-powered-plugin GitHub repository. Clone the repository and follow along as we explain the design decisions throughout this post.

Solution overview

Apache Airflow is a widely adopted open source platform for programmatically authoring, scheduling, and monitoring complex data pipelines. Teams use Airflow to orchestrate extract, transform, and load (ETL) processes, machine learning workflows, and data lake management across industries.

Amazon MWAA is a managed service that makes it straightforward to run Apache Airflow on AWS without the operational burden of managing the underlying infrastructure. With Amazon MWAA, you can focus on authoring workflows and business logic while AWS handles provisioning, patching, scaling, and securing your Airflow environments.

The solution uses the following AWS services:

The plugin adds an analysis view directly into your Airflow UI. At a high level, when a task fails and you trigger an analysis, the plugin automatically does the following:

  1. Retrieves the failed task instance metadata from the Airflow metadata database.
  2. Collects comprehensive context including task logs, DAG source code, and operator-specific scripts.
  3. Sends the enriched context to Amazon Bedrock for analysis.
  4. Returns a structured diagnostic report with root cause identification, step-by-step resolution, and prevention recommendations.

How it works

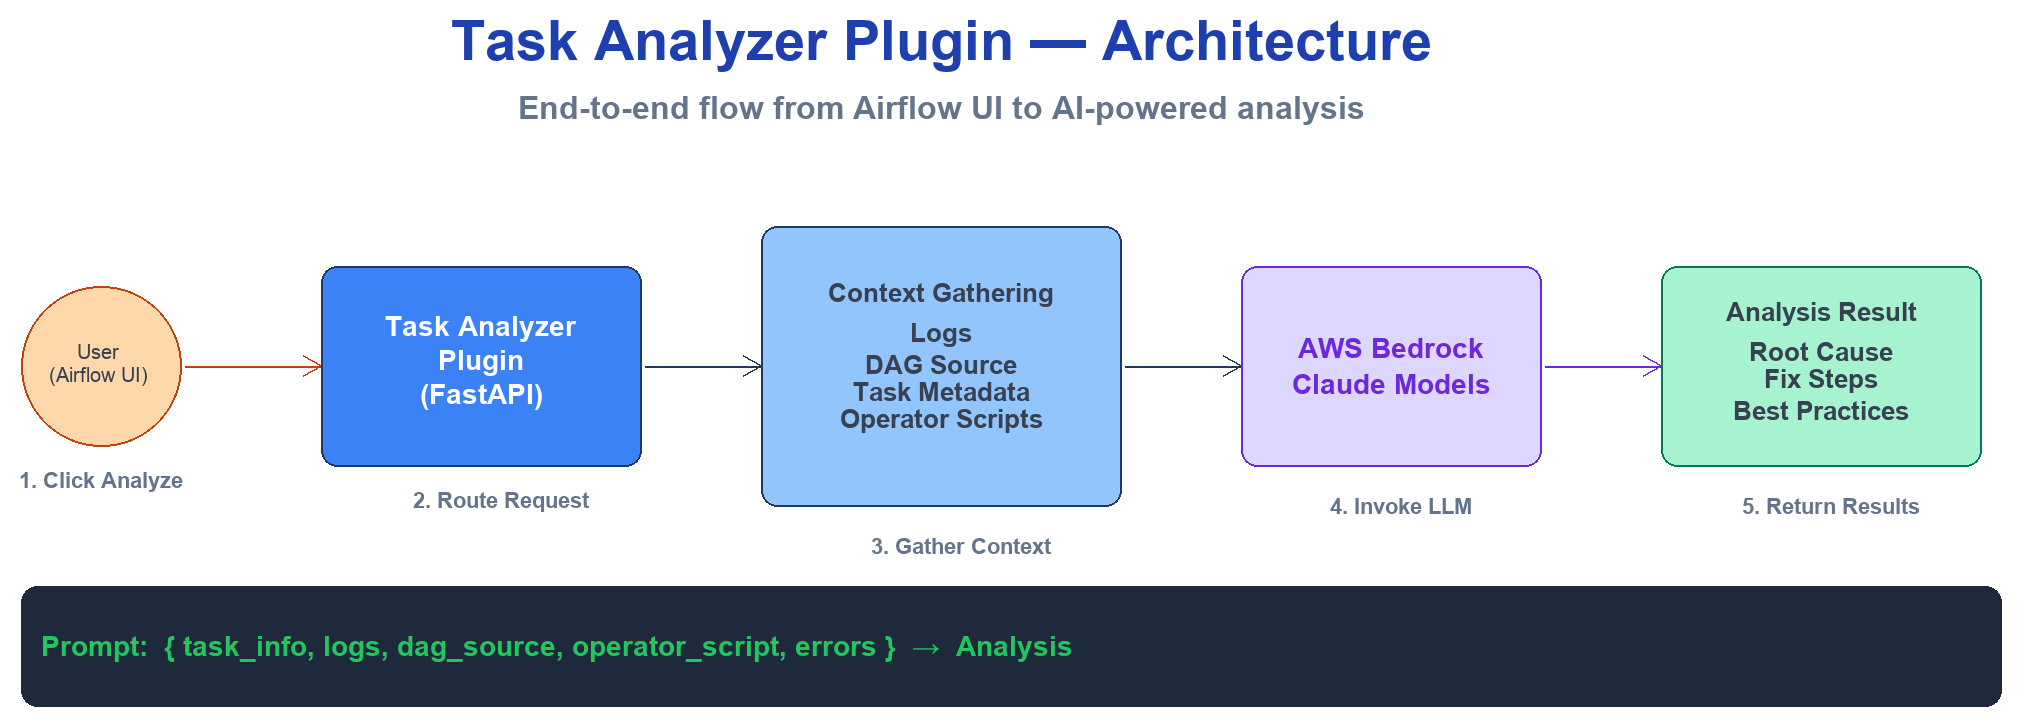
The preceding four steps happen behind a single Analyze Task action. The following diagram and pipeline show the high-level architecture and how the plugin carries them out.

Architecture of the task analyzer plugin connecting the Airflow UI on Amazon MWAA to Amazon Bedrock and Amazon S3

Figure 1: High-level architecture of the LLM-powered task analyzer plugin on Amazon MWAA

The plugin follows a multi-step analysis pipeline:

  1. User triggers analysis – From the Airflow UI, you select a failed task and choose Analyze Task.
  2. Context collection – The plugin retrieves task metadata, execution logs, and DAG source code from the Airflow metadata database and Amazon S3.
  3. Operator-aware enrichment – Based on the operator type, the plugin fetches the actual code or query that failed (for example, a PySpark script from AWS Glue or a SQL query from Amazon Athena).
  4. Foundation model analysis – The enriched context is sent to Amazon Bedrock, which returns a structured diagnostic report.
  5. Results presentation – The analysis displays in the Airflow UI with actionable recommendations.

All AWS API calls (Amazon Bedrock, Amazon S3, and AWS Glue) are authenticated through the aws_default Airflow connection. By default on Amazon MWAA, this connection has no static credentials, so boto3 falls back to the environment’s execution role. This means there are no keys to manage or rotate. If you need to call Amazon Bedrock or fetch scripts using a different identity, you can supply those credentials in the aws_default connection. This can be a dedicated IAM role or a cross-account principal, used instead of the execution role.

Operator-aware context collection

A key differentiator of this solution is its ability to understand different Airflow operator types and automatically fetch the associated code or queries. Unlike generic log analyzers, the plugin retrieves the actual code that failed, not just the error message.

The following table summarizes what the plugin fetches for each operator type:

Operator type What the plugin fetches Source
GlueJobOperator PySpark or Python script Amazon S3 (from the AWS Glue job definition)
EmrAddStepsOperator Spark or Python script Amazon S3 (from step arguments)
EmrServerlessStartJobOperator Spark script Amazon S3 (from job driver)
AthenaOperator SQL query Inline (from operator parameters)
RedshiftDataOperator SQL query Inline (from operator parameters)
BashOperator Bash command Inline (from operator parameters)
PythonOperator Python function DAG source code

This approach means the foundation model can analyze the actual logic that failed, correlating error messages with specific lines in your code for precise root cause identification.

Prerequisites

Before you begin, make sure that you have the following:

  • An Amazon MWAA environment running Apache Airflow 3.x (this walkthrough uses Airflow 3.2). The plugin registers its UI through the FastAPI-based plugin interface (fastapi_apps) introduced in Airflow 3.x. For setup instructions, see Get started with Amazon MWAA.
  • Access to Amazon Bedrock with the Anthropic Claude model family enabled in your AWS Region. This walkthrough uses Anthropic Claude, but you can adapt the plugin to work with Amazon Nova or other foundation models by modifying the prompt payload format in prompts.py. See Model access.
  • An AWS Identity and Access Management (IAM) execution role for Amazon MWAA with bedrock:InvokeModel and s3:GetObject permissions.
  • An Amazon S3 bucket backing your Amazon MWAA environment with bucket versioning enabled. See Create an Amazon S3 bucket for Amazon MWAA.
  • Python 3.10 or later installed locally.
  • The AWS Command Line Interface (AWS CLI) configured with appropriate permissions.

Note: In most Regions, you invoke Claude through an inference profile ID (for example, us.anthropic.claude-sonnet-4-5-20250929-v1:0) rather than a bare on-demand model ID. Run aws bedrock list-inference-profiles to confirm a model is ACTIVE before configuring it.

Plugin design

In this section, we explain the plugin design and its key components. The next section walks through deploying it to your Amazon MWAA environment.

Plugin structure

The plugin follows the standard Apache Airflow plugin architecture. The repository is organized as follows:

plugins/
├── task_analyzer_plugin.py    # Main plugin: FastAPI app, endpoints, registration
└── task_analyzer/
    ├── __init__.py
    ├── prompts.py             # Bedrock model configuration and prompt templates
    ├── script_utils.py        # Operator-specific script fetching logic
    ├── templates/
    │   └── index.html
    └── static/
        ├── css/
        │   └── styles.css
        └── js/
            ├── app.jsx
            ├── components.jsx
            ├── config.js
            ├── template.jsx
            └── utils.jsx

The repository also includes example DAGs that simulate various failure scenarios across different operator types.

Plugin registration

In Apache Airflow 3.x, the web component of a plugin is registered as a FastAPI application through the fastapi_apps attribute. In task_analyzer_plugin.py, the TaskAnalyzerPlugin class registers the FastAPI app under /task-analyzer and adds a view to the task instance page:

class TaskAnalyzerPlugin(AirflowPlugin):
    name = "task_analyzer_plugin"

    fastapi_apps = [
        {
            "app": app,
            "url_prefix": "/task-analyzer",
            "name": "Task Analyzer",
        }
    ]

    external_views = [
        {
            "name": "Analyze Task",
            "href": "/task-analyzer/",
            "url_route": "task_analyzer_view",
            "destination": "task_instance",
        }
    ]

Airflow automatically discovers any AirflowPlugin subclass in the plugins folder. No registration call or configuration change is needed. On Amazon MWAA, the file is delivered inside plugins.zip and extracted to /usr/local/airflow/plugins/.

Analysis engine

The analysis engine is the POST /api/analyze-task endpoint in task_analyzer_plugin.py. When you trigger an analysis, the endpoint performs the following steps:

  1. Retrieves AWS credentials from the aws_default Airflow connection. To override, edit the aws_default connection in the Airflow UI (Admin > Connections).
  2. Assembles a context dictionary from the request (task metadata, logs, DAG source).
  3. Enriches the context with an operator-specific script through fetch_and_add_operator_script.
  4. Builds the prompt using the template in prompts.py.
  5. Invokes Amazon Bedrock and returns the structured analysis.

Operator script fetching

The process_operator_script function in script_utils.py routes script retrieval based on operator type:

  • External scripts (AWS Glue, Amazon EMR) – The plugin calls the AWS Glue API to look up the job definition, then reads the PySpark script from Amazon S3. Amazon EMR handlers follow the same pattern, extracting the script path from the step configuration or job driver.
  • Inline scripts (Amazon Athena, Amazon Redshift, BashOperator, PythonOperator, DBTOperator) – The plugin reads the query or command directly from the task’s rendered template fields with no external API call.

The plugin implements smart fetching: for external scripts, it only makes the Amazon S3 API call when the error message contains code-relevant patterns (such as SyntaxError, TypeError, or data type mismatch). Infrastructure errors like timeouts skip the script fetch entirely, minimizing unnecessary API calls.

Prompt engineering

The prompt template in prompts.py provides the foundation model with:

  • Task metadata (DAG ID, task ID, run ID, state).
  • Error message and execution logs.
  • DAG source code.
  • Operator-specific script (when available).

The model produces a structured diagnostic report with root cause identification, step-by-step resolution, and prevention recommendations. Model IDs are configurable through Airflow Variables, so you can switch between Claude Sonnet and Claude Opus without redeploying the plugin.

Security measures

Before sending content to Amazon Bedrock, the plugin applies the following safeguards:

  • Credential redaction – The sanitize_script function removes sensitive patterns (passwords, tokens, access keys) from scripts and logs.
  • Content truncation – The truncate_script function caps content size to stay within model context windows.
  • Path traversal prevention – The read_allowlisted_file function resolves canonical paths and verifies they reside within allowed base directories before reading any file.

For the full implementation, see script_utils.py.

Optional: PII detection and redaction. The built-in sanitize_script function targets credential patterns. If your logs or scripts might contain personally identifiable information (PII), consider adding a detection pass with Amazon Comprehend before invoking Amazon Bedrock. The DetectPiiEntities API returns the entity types (such as names, email addresses, or account numbers) and their character offsets. You can use these offsets to mask or obfuscate the spans before the context leaves your environment. This adds one API call and cost per analysis, so add it where your compliance requirements call for it. For guidance, see Detecting PII entities.

Deploy the plugin

Follow these steps to deploy the plugin to your Amazon MWAA environment.

Step 1: Clone the repository

git clone https://github.com/aws-samples/sample-aws-mwaa-llm-powered-plugin.git
cd sample-aws-mwaa-llm-powered-plugin

Step 2: Package and upload to Amazon S3

Create the plugins.zip archive from the plugins/ directory and upload it to your Amazon MWAA S3 bucket:

cd plugins
zip -r ../plugins.zip .
cd ..

aws s3 cp plugins.zip s3://<amzn-s3-demo-bucket>/plugins.zip

aws s3api head-object \
  --bucket <amzn-s3-demo-bucket> \
  --key plugins.zip \
  --query VersionId --output text

Note the VersionId returned. You need it in the next step.

Note: This plugin requires only fastapi and Boto3, both pre-installed on Amazon MWAA for Airflow 3.x. You don’t need a requirements.txt file. Skipping the requirements file avoids package resolution conflicts that are a common cause of failed Amazon MWAA environment updates.

Step 3: Update the Amazon MWAA environment

Update your environment to use the new plugin archive:

aws mwaa update-environment \
  --name <your-environment-name> \
  --plugins-s3-path plugins.zip \
  --plugins-s3-object-version <version-id-from-step-2>

The environment restarts automatically. This process typically takes 10–30 minutes. Monitor the status with:

aws mwaa get-environment \
  --name <your-environment-name> \
  --query "Environment.{Status:Status,Plugins:PluginsS3Path}" --output json

Step 4: Configure the Amazon Bedrock connection

On Amazon MWAA, the aws_default connection exists by default and resolves to your environment’s execution role. In most cases, no action is needed.

To override the Region, edit the aws_default connection in the Airflow UI (Admin > Connections) and set the Extra field to:

{"region_name": "us-east-1"}

Leave login and password empty so the execution role is used.

Step 5: Verify the deployment

After the environment finishes updating, navigate to Admin > Plugins in the Airflow UI. Verify that task_analyzer_plugin appears in the list. The Analyze Task entry is now available from any task instance view.

Test the solution

The repository includes example DAGs that simulate failure scenarios across different operator types. To validate the deployment:

  1. Copy the dags/ directory contents to your Amazon MWAA S3 bucket’s DAGs folder:
    aws s3 cp dags/ s3://<amzn-s3-demo-bucket>/dags/ --recursive

  2. Wait for Amazon MWAA to sync the DAGs (typically 1–2 minutes).
  3. In the Airflow UI, trigger one of the test DAGs (for example, test_aws_sql_operators) and let the intentional failure occur.
  4. Navigate to the failed task instance.
  5. Choose Analyze Task in the task instance view.
  6. Review the generated analysis, which includes:
    • Root cause identification with file and line references.
    • Step-by-step resolution with code examples.
    • Prevention recommendations and monitoring suggestions.

The analysis typically completes within 5–10 seconds.

Cost considerations

The primary cost driver for this solution is Amazon Bedrock inference, which is billed by the number of input and output tokens each analysis consumes. Input tokens come from the task logs, DAG source, and operator script sent to the model. Output tokens come from the diagnostic report the model returns. Larger logs and scripts increase input tokens, and the model you select affects the per-token rate. For current per-model rates, see Amazon Bedrock pricing.

To help control cost, the plugin includes a caching mechanism that stores results keyed by a hash of the error context. Repeated analyses of the same failure pattern return cached results without invoking Amazon Bedrock again.

Best practices

When you deploy this solution in production, consider the following:

  • IAM least privilege – Grant only bedrock:InvokeModel for your chosen model IDs and scope s3:GetObject to specific bucket paths where your operator scripts reside. For guidance, see Amazon MWAA execution role.
  • Data sanitization – The plugin redacts credentials and truncates content before sending data to Amazon Bedrock. Store configuration values in AWS Secrets Manager rather than hardcoding them in DAG source files.
  • Access control – The plugin’s endpoints are protected by Airflow’s built-in authentication. For DAG-level access management at scale, see Automated tag-based DAG permission management in Amazon MWAA.
  • Operational resilience – Add retry logic and circuit breaker patterns around the Amazon Bedrock API call. Use Amazon CloudWatch to monitor plugin performance and set alarms on failure rates.

Extending the solution

You can extend this solution in the following ways:

  • Proactive notifications – Integrate with Amazon Simple Notification Service (Amazon SNS) or Slack to deliver analyses automatically when failures occur.
  • Knowledge base integration – Build a knowledge base of past analyses using Amazon Bedrock Knowledge Bases for Retrieval Augmented Generation (RAG) powered recommendations that learn from your organization’s historical failures.
  • Additional operator support – Add handlers for custom operators specific to your organization, such as proprietary data connectors or internal platform integrations.
  • Automated remediation – For well-understood failure patterns, trigger automated fixes such as restarting tasks with adjusted resource configurations.

Clean up

To remove the plugin from your environment:

  1. Delete the plugin archive from Amazon S3:
    aws s3 rm s3://<amzn-s3-demo-bucket>/plugins.zip

  2. Update your Amazon MWAA environment to remove the plugin reference, then wait for the environment to restart.
  3. Optionally, remove the Amazon Bedrock permissions from your execution role if they are no longer needed.

Conclusion

In this post, we showed you how to deploy an LLM-powered DAG failure analysis plugin for Amazon MWAA using Amazon Bedrock. The operator-aware context collection differentiates this approach from generic log analyzers. By fetching the actual code from AWS Glue, Amazon EMR, and other services, the foundation model provides precise, actionable recommendations with specific line references.

To get started, clone the sample-aws-mwaa-llm-powered-plugin repository, deploy it to a development Amazon MWAA environment, and test with the included example DAGs. As your team builds confidence in the analysis quality, roll it out to production environments where it serves as the first line of investigation for any pipeline failure.


About the authors

Sushant Samantaray

Sushant Samantaray

Sushant is a Sr. Delivery Consultant at AWS, bringing 19 years of industry experience with a focus on Data Analytics and Generative AI/Agentic AI solutions. He works closely with enterprise customers to design and deliver innovative solutions across Big Data, Generative AI, and Agentic AI, leveraging AWS native services, partner offerings, and open-source technologies. A passionate technologist and problem solver at heart, he balances his professional life with watching and playing sports and spending quality time with family.

Parameswara Reddy Gajjela

Parameswara Reddy Gajjela

Parameswara is a Delivery Consultant at AWS with 11+ years of experience in Data Analytics. He works closely with enterprise customers to architect innovative, end-to-end Big Data and Agentic AI solutions powered by AWS native services, partner ecosystems, and open-source technologies. His areas of expertise include modern DataLake and Data Warehouse migration and implementations on AWS.

Kamen Sharlandjiev

Kamen Sharlandjiev

Kamen is a Pr. Big Data and ETL Solutions Architect, MWAA and AWS Glue ETL expert. He’s on a mission to make life easier for customers who are facing complex data integration and orchestration challenges. His secret weapon? Fully managed AWS services that can get the job done with minimal effort. Follow Kamen on LinkedIn to keep up to date with the latest MWAA and AWS Glue features and news!

Simplify AMI discovery with Amazon EC2 and SSM Parameter Store

Post Syndicated from Ashwani Tyagi original https://aws.amazon.com/blogs/compute/simplify-ami-discovery-with-amazon-ec2-and-ssm-parameter-store/

If you manage Amazon Elastic Compute Cloud (Amazon EC2) infrastructure at scale, you have likely encountered the following situation. You release an infrastructure change with the correct Region, the correct instance type, and a launch template that has operated reliably for months. The deployment nevertheless comes up on an Amazon Machine Image (AMI) that is several patch cycles out of date, because the AMI ID hardcoded in the template had become stale weeks earlier. The condition goes unnoticed until a security scan flags the instance, at which point you must reconcile AMI IDs across Regions rather than close out the week.

That scenario is rarely a one-time event. It is one example of a broader pattern that quietly taxes teams running Amazon EC2 at scale: stale AMI IDs, manual parameter lookups, inconsistent Region mappings, and pipelines that silently fail to update. The following section examines four variations of this pattern in detail.

The common thread across all of these is the same. Locating the correct image is not the hard part. The difficulty lies in wiring that image into your infrastructure as code (IaC) in a manner that remains current. You identify the appropriate AMI on the console, then search AWS Systems Manager (SSM) Parameter Store paths to obtain the dynamic reference that maps to it. The workflow spans two tools and two mental models, with a gap in between where errors accumulate. Because the authoritative link between an AMI and its SSM parameter lived outside the API, teams had to reconstruct it by hand, and hands make mistakes.

A recent enhancement to the Amazon EC2 DescribeImages API closes that gap. When you call DescribeImages on a public AMI, the response now contains a PublicSsmParameterName field: the SSM parameter that resolves to the latest AMI in that lineage. A single API call replaces manual correlation.

In this post, we examine the operational friction that makes AMI management harder than it should be and show how this enhancement addresses it. We walk through practical examples using the AWS Command Line Interface (AWS CLI), AWS CloudFormation, Terraform, and Amazon EC2 Auto Scaling launch templates. We conclude with best practices for golden AMI pipelines, including operational considerations to review before adopting the feature in production.

Prerequisites

To follow the examples in this post, you will need the following:

  • An AWS account.
  • The AWS CLI v2 installed and configured with appropriate permissions (ec2:DescribeImages, ssm:GetParameters).
  • Basic familiarity with AMIs, SSM Parameter Store, and at least one IaC tool (CloudFormation or Terraform).

Understanding the operational challenges

Before addressing the solution, it is worth examining the problem in detail, because the problem seldom manifests as a single, dramatic failure. It is instead a gradual accumulation of minor frictions that, in aggregate, impose a measurable cost on teams responsible for compute.

AMI IDs are Region-specific, version-specific, and change frequently. The workflow of finding an AMI, locating its SSM parameter, and referencing it in templates spans multiple tools, and the boundaries between steps are where errors accumulate.

Challenge 1: Silent image aging

Scenario: An engineer copies an AMI ID into a Terraform module as an interim measure. Several months later, that identifier is embedded across four environments. New instances launch on an image that predates numerous patches. There is no error and no alert, only drift that remains invisible until an audit or a review brings it to light.

Impact: Hardcoded AMI IDs do not fail conspicuously. They fail quietly, by launching a prior image at a later date. The distance between “this was correct when written” and “this remains correct” widens continuously, and no owner is assigned to monitor it.

Challenge 2: The multi-region maintenance burden

Scenario: An application operates across three Regions. The same logical image (for example, the latest Amazon Linux 2023) carries a different AMI ID in each Region. Templates therefore accrue region-to-AMI mapping blocks, lookup logic, or both. Each additional Region introduces another entry to maintain, and each AMI refresh requires updating all of them.

Impact: The team ends up maintaining a translation table that AWS already maintains on its behalf. The mapping logic becomes load-bearing infrastructure in its own right, and a single stale entry in one Region produces inconsistent fleets that are difficult to diagnose.

Challenge 3: Barriers to onboarding

Scenario: A new engineer joins the team and poses a reasonable question: which SSM parameter corresponds to a given AMI? The answer resides in an internal knowledge-base page that was accurate eighteen months earlier. The engineer copies a path that appears correct, deploys, and inadvertently references the wrong lineage.

Impact: When the relationship between an AMI and its parameter is not discoverable from the API, it must be documented manually. Manually maintained mappings degrade over time. Each new team member re-learns the same institutional knowledge, and each instance of degradation introduces an opportunity to reference an incorrect value.

Challenge 4: Uncertainty about update success

Scenario: A golden AMI pipeline completes a build and updates a parameter. The command returns a success response, and the team assumes the new image is in effect. However, for certain parameter data types, a success response does not always indicate that the value was accepted. This specific behavior is examined in the best-practices section, as it is particularly relevant to golden AMI pipelines.

Impact: Confidence without confirmation carries substantial risk. A pipeline that presumes success can propagate a stale image across a fleet before the discrepancy is identified.

Considered individually, none of these situations constitutes a crisis. Considered collectively, they explain why “launch the latest image” is never, in fact, a single step. The common root cause is consistent across all four: the authoritative link between an AMI and its SSM parameter existed outside the API, requiring teams to reconstruct it manually, a process inherently prone to error.

What’s new: DescribeImages returns the associated SSM parameter

The new feature addresses precisely this boundary.

As of July 16, 2026, the Amazon EC2 DescribeImages API response includes a new field, PublicSsmParameterName, for public AMIs that have an associated SSM parameter. This capability is available at no additional cost in supported AWS Regions, including AWS GovCloud (US) Regions and the China Regions.

In place of the previous three-step correlation exercise, the workflow reduces to a single call:

Before After
Find AMI → manually search SSM paths → confirm the correct match Find AMI → PublicSsmParameterName returns the SSM path immediately
Two separate API calls or console workflows A single DescribeImages call provides the complete mapping
Prone to mapping an incorrect parameter to an AMI Authoritative mapping obtained directly from the API

The change introduces neither a new service nor a new pricing dimension. It relocates information that previously lived in knowledge bases into the API response.

In addition, you can now use the public-ssm-parameter-name filter in DescribeImages to identify all AMIs associated with a specific SSM parameter, making the relationship queryable in either direction.

How it works: API response walkthrough

Call DescribeImages on a public AMI with an associated SSM parameter. The response includes PublicSsmParameterName:

{
  "Images": [
    {
      "ImageId": "ami-0abcdef1234567890",
      "Name": "al2023-ami-2023.7.20260601.0-kernel-6.1-arm64",
      "Description": "Amazon Linux 2023 AMI 2023.7.20260601.0 arm64 HVM kernel-6.1",
      "Architecture": "arm64",
      "PlatformDetails": "Linux/UNIX",
      "State": "available",
      "Public": true,
      "OwnerId": "111122223333",
      "ImageType": "machine",
      "RootDeviceType": "ebs",
      "VirtualizationType": "hvm",
      "EnaSupport": true,
      "PublicSsmParameterName": "aws/service/ami-amazon-linux-latest/al2023-ami-kernel-default-arm64"
    }
  ]
}

The PublicSsmParameterName value (in this case, aws/service/ami-amazon-linux-latest/al2023-ami-kernel-default-arm64) identifies the SSM parameter associated with this AMI lineage.

Tip: The field is returned under the aws/service/ namespace without a leading slash. When using this value in SSM API calls, resolve:ssm: references, or CloudFormation dynamic references, prepend a forward slash. For example, use /aws/service/ami-amazon-linux-latest/al2023-ami-kernel-default-arm64. The SSM parameter is intended to resolve to the latest AMI in the lineage, which can help you keep infrastructure current.

Note: Not every public AMI has an associated parameter. The field is present only for lineages for which AWS publishes parameters. The field is also populated only for public AMIs. If you query one of your own private AMIs and observe an empty field, this is expected behavior rather than a defect.

Practical examples

The following four examples show how to use the new PublicSsmParameterName field across common IaC tools.

Example 1: Discover the SSM parameter for an AMI using the AWS CLI

Suppose you have identified an AMI on the console and wish to determine its SSM parameter path for use in your templates:

aws ec2 describe-images \
  --image-ids ami-0abcdef1234567890 \
  --query "Images[0].PublicSsmParameterName" \
  --output text

Output:

aws/service/ami-amazon-linux-latest/al2023-ami-kernel-default-arm64

You can also perform the inverse operation and determine which AMI a given SSM parameter currently references:

# Linux example
aws ssm get-parameter \
  --name "/aws/service/ami-amazon-linux-latest/al2023-ami-kernel-default-arm64" \
  --query "Parameter.Value" \
  --output text

# Windows example
aws ssm get-parameter \
  --name "/aws/service/ami-windows-latest/Windows_Server-2022-English-Full-Base" \
  --query "Parameter.Value" \
  --output text

Tip: Public SSM parameters are available for both Linux (/aws/service/ami-amazon-linux-latest) and Windows (/aws/service/ami-windows-latest) AMIs. You can list all available parameters under these paths using aws ssm get-parameters-by-path –path .

Alternatively, you can use the new filter to identify AMIs by their SSM parameter name:

Note: The public-ssm-parameter-name filter returns all AMIs that have ever been associated with the specified parameter, including previous versions. Use sorting or additional filters (such as –query with CreationDate) to identify the most recent AMI.

aws ec2 describe-images \
  --filters "Name=public-ssm-parameter-name,Values=/aws/service/ami-amazon-linux-latest/al2023-ami-kernel-default-arm64" \
  --query "Images[].{ImageId:ImageId,Name:Name,CreationDate:CreationDate}" \
  --output table

Example 2: CloudFormation with dynamic SSM references

Once the SSM parameter path is known from DescribeImages, you can use CloudFormation dynamic references to resolve to the latest AMI at deployment time:

AWSTemplateFormatVersion: '2010-09-09'
Description: EC2 instance using SSM parameter for latest Amazon Linux 2023 AMI

Parameters:
  InstanceType:
    Type: String
    Default: t4g.micro

Resources:
  MyInstance:
    Type: AWS::EC2::Instance
    Properties:
      InstanceType: !Ref InstanceType
      ImageId: '{{resolve:ssm:/aws/service/ami-amazon-linux-latest/al2023-ami-kernel-default-arm64}}'
      Tags:
        - Key: Name
          Value: MyLatestAL2023Instance

Alternatively, you can use the AWS::SSM::Parameter::Value parameter type to permit users to override the SSM path at stack creation time:

AWSTemplateFormatVersion: '2010-09-09'
Description: EC2 instance with configurable SSM-based AMI lookup

Parameters:
  AmiSsmParameter:
    Type: 'AWS::SSM::Parameter::Value<AWS::EC2::Image::Id>'
    Default: '/aws/service/ami-amazon-linux-latest/al2023-ami-kernel-default-arm64'
    Description: SSM parameter path for the AMI (discovered via DescribeImages)
  InstanceType:
    Type: String
    Default: t4g.micro

Resources:
  MyInstance:
    Type: AWS::EC2::Instance
    Properties:
      InstanceType: !Ref InstanceType
      ImageId: !Ref AmiSsmParameter
      Tags:
        - Key: Name
          Value: DynamicAMIInstance

CloudFormation resolves the AMI ID at deployment time, so the template never contains a hardcoded AMI ID, and any stack update adopts the latest AMI automatically. Two considerations warrant attention before relying on this approach. First, running instances are not affected. A stack update is required to roll out a newer AMI. Second, CloudFormation does not support drift detection on dynamic references, so if the underlying SSM parameter value changes between deployments, CloudFormation will not report it as drift. For ssm dynamic references in which a version has not been pinned, AWS recommends performing a stack update whenever the parameter changes, so that the stack retrieves the current value.

Example 3: Terraform with SSM parameter data source

Use the aws_ssm_parameter data source to resolve the SSM path to the latest AMI ID:

# Use the SSM parameter path discovered from DescribeImages
data "aws_ssm_parameter" "latest_al2023" {
  name = "/aws/service/ami-amazon-linux-latest/al2023-ami-kernel-default-arm64"
}

resource "aws_instance" "web" {
  ami           = data.aws_ssm_parameter.latest_al2023.value
  instance_type = "t4g.micro"

  tags = {
    Name = "LatestAL2023-Instance"
  }
}

Important: In Terraform, ami is a replacement-forcing argument on aws_instance. When the SSM parameter changes, Terraform proposes to destroy and recreate the instance. For stateful workloads, add lifecycle { ignore_changes = [ami] } or use launch templates with Auto Scaling (Example 4) instead.

Example 4: Auto Scaling launch templates with SSM parameters

For Auto Scaling groups, you can reference the SSM parameter directly in the launch template using the resolve:ssm: prefix:

# Create a launch template that uses the SSM parameter
aws ec2 create-launch-template \
  --launch-template-name al2023-auto-scaling \
  --launch-template-data '{
  "ImageId": "resolve:ssm:/aws/service/ami-amazon-linux-latest/al2023-ami-kernel-default-arm64",
  "InstanceType": "t4g.micro"
}'

When EC2 Auto Scaling launches a new instance, it resolves the SSM parameter at launch time to obtain the current AMI ID. You can verify the AMI ID to which a launch template resolves:

aws ec2 describe-launch-template-versions \
  --launch-template-name al2023-auto-scaling \
  --versions '$Latest' \
  --resolve-alias

The response shows the resolved ImageId:

{
  "LaunchTemplateVersions": [
    {
      "LaunchTemplateId": "lt-089c023a30example",
      "LaunchTemplateName": "al2023-auto-scaling",
      "VersionNumber": 1,
      "LaunchTemplateData": {
        "ImageId": "ami-0ac394d6a3example",
        "InstanceType": "t4g.micro"
      }
    }
  ]
}

The parameter is stored in the launch template. When the Auto Scaling group scales out or replaces an instance, it uses the launch template to resolve the SSM parameter and determine the AMI to launch. This is the most direct of the four patterns: the parameter serves as the single source of truth, and the Auto Scaling group’s normal instance lifecycle effects the rollout.

Before-and-after workflow comparison

The following table summarizes how this feature improves common workflows, and relates each entry to the challenges described earlier.

Workflow Before After
Discover the SSM path for a known AMI Search SSM parameter namespaces manually. Test multiple paths. Confirm a correct match A single DescribeImages call returns PublicSsmParameterName
Validate that an SSM parameter maps to the expected AMI Call GetParameter, then call DescribeImages on the returned ID to verify Use the public-ssm-parameter-name filter to view all associated AMIs directly
Set up IaC templates Find AMI → search for SSM path → copy path to template → verify correctness over time Find AMI → read PublicSsmParameterName from the response → use directly in the template
Onboard new team members Document AMI-to-parameter mappings in knowledge bases, which become stale New members self-discover using standard API calls
Audit AMI usage across teams Cross-reference AMI IDs with SSM parameters in separate calls A single API call provides the complete picture

Best practices: Using SSM parameters for golden AMI pipelines

The following recommendations describe how to derive the greatest benefit from this feature, with operational considerations identified where they are material.

1. Discontinue hardcoding AMI IDs

With PublicSsmParameterName removing the discovery barrier, switch all templates to SSM parameter references. Use {{resolve:ssm:}} in CloudFormation, the aws_ssm_parameter data source in Terraform (note the replacement behavior in Example 3), or the resolve:ssm: prefix in launch templates.

2. Create custom SSM parameters for your golden AMIs

For internally built golden AMIs, create your own SSM parameters using the aws:ec2:image data type:

aws ssm put-parameter \
  --name "/my-org/golden-ami/amazon-linux-hardened" \
  --type "String" \
  --data-type "aws:ec2:image" \
  --value "ami-0abcdef1234567890"

When the pipeline produces a new golden AMI, update the parameter:

aws ssm put-parameter \
  --name "/my-org/golden-ami/amazon-linux-hardened" \
  --type "String" \
  --data-type "aws:ec2:image" \
  --value "ami-0fedcba9876543210" \
  --overwrite

Stacks, launch templates, or Terraform configurations that reference this parameter can adopt the new AMI on their next deployment, with no template edits required in most cases.

Operational consideration: Because PutParameter validates aws:ec2:image values asynchronously, an HTTP 200 does not confirm the value was accepted. Subscribe to Parameter Store change events in Amazon EventBridge and confirm the operation succeeded before considering the rollout complete.

3. Use parameter versions and labels for controlled rollouts

SSM Parameter Store supports versioning and labels, which provide control over rollouts:

# Label the current production version
aws ssm label-parameter-version \
  --name "/my-org/golden-ami/amazon-linux-hardened" \
  --parameter-version 5 \
  --labels "prod"

Production launch templates reference the labeled version:

ImageId: resolve:ssm:/my-org/golden-ami/amazon-linux-hardened:prod

With this approach, you can update the parameter with a new AMI without immediately affecting production. Promotion to production is accomplished by moving the prod label, a deliberate, auditable action rather than an automatic side effect.

4. Combine with Amazon EC2 Image Builder for end-to-end automation

Use Amazon EC2 Image Builder to automate AMI creation, then configure the distribution settings to update your SSM parameter automatically when a new AMI is built. Combined with the new discovery feature, this establishes a closed loop:

  • Image Builder creates a new AMI on a schedule.
  • Distribution settings update the SSM parameter to point to the new AMI.
  • Auto Scaling and IaC resolve the parameter to the latest AMI at launch time.
  • With DescribeImages, any authorized party can determine which SSM parameter an AMI maps to.

5. Scope IAM permissions appropriately

Two permission requirements apply.

To launch instances by using SSM-referenced AMIs, the launching principal requires ssm:GetParameters on the relevant parameter paths:

{
  "Version": "2012-10-17",
  "Statement": [
    {
      "Effect": "Allow",
      "Action": "ssm:GetParameters",
      "Resource": "arn:aws:ssm:*:*:parameter/aws/service/ami-amazon-linux-latest/*"
    }
  ]
}

Scope the Resource element to the paths actually in use. If you reference Windows parameters (/aws/service/ami-windows-latest/) or your own golden AMI paths (/my-org/golden-ami/), include those ARNs as well. Otherwise, launches will fail with an AccessDenied error.

To create a custom aws:ec2:image parameter, the pipeline principal also requires ssm:PutParameter and ec2:DescribeImages:

{
  "Version": "2012-10-17",
  "Statement": [
    {
      "Effect": "Allow",
      "Action": "ssm:PutParameter",
      "Resource": "arn:aws:ssm:*:*:parameter/my-org/golden-ami/*"
    },
    {
      "Effect": "Allow",
      "Action": "ec2:DescribeImages",
      "Resource": "*"
    }
  ]
}

For broader guidance on keeping infrastructure current and automating operational processes, see the Operational Excellence Pillar of the AWS Well-Architected Framework.

Clean up

The examples in this post use read-only API calls (DescribeImages, GetParameter) and do not create billable resources. If you created a launch template while following Example 4, you can delete it as follows:

aws ec2 delete-launch-template --launch-template-name al2023-auto-scaling

Conclusion

The difficulty of AMI management was never attributable to any single failure. It arose from the steady accumulation of stale identifiers, region-mapping tables, stale documentation, and pipelines that presumed success, all of which are minor frictions that together produced significant operational effort and risk. The common thread was that the authoritative link between an AMI and its SSM parameter existed outside the API, requiring teams to reconstruct it manually.

The new PublicSsmParameterName field in the Amazon EC2 DescribeImages API relocates that link into the response, where it appropriately belongs. With a single API call, you can determine the SSM parameter for any public AMI. You can then reference it directly in CloudFormation templates, Terraform configurations, or Auto Scaling launch templates for automatic AMI updates.

To begin, call DescribeImages on any public AMI and examine the PublicSsmParameterName field. For further detail, see Reference the latest AMIs using Systems Manager public parameters in the Amazon EC2 User Guide.

For additional learning resources on AMI management and IaC on AWS, explore Amazon EC2, AWS Systems Manager Parameter Store, and Amazon EC2 Image Builder.

Announcing Spark Connect on Amazon EMR on EKS: Interactive PySpark development, anywhere

Post Syndicated from Amit Maindola original https://aws.amazon.com/blogs/big-data/announcing-spark-connect-on-amazon-emr-on-eks/

Today, we’re announcing support for Spark Connect on Amazon EMR on EKS, starting from EMR release 7.14 (Apache Spark 3.5.8) and emr-spark-8.1 (Apache Spark 4.1.1). You can now build, test, and debug Spark applications from your preferred tools, such as VS Code, PyCharm, Jupyter notebooks, Amazon SageMaker Unified Studio. At the same time, your full-scale Spark operations run on Amazon Elastic Kubernetes Service (Amazon EKS).

Deploying Spark applications from a local development environment to a remote Amazon EKS cluster often means dealing with environment differences, dependency conflicts, and performance gaps at scale. Spark Connect removes this friction. It separates your application client from the Spark server, so you develop and debug locally while Spark Connect routes your operations to a scalable Spark cluster running on Amazon EKS.

This client-server architecture supports a range of use cases, including interactive development from notebooks and IDEs, embedded Spark in web services, and continuous integration and continuous delivery (CI/CD) data-quality tests. All of these run on your existing EKS infrastructure. Each Spark Connect session uses its own AWS Identity and Access Management (IAM) execution role, custom tags, and cost tracking. For more information, see the Amazon EMR on EKS documentation.

Here are two demonstrations of using Spark Connect in Amazon SageMaker Unified Studio Notebooks and in a VS Code local IDE:

Amazon SageMaker Unified Studio Notebooks demo:

Local IDE demo:

For a runnable end-to-end example in an IDE, try the Spark Connect sample notebook in the aws-emr-utilities repository. It includes a client wrapper solution, built by AWS architects, for simplified connectivity:

How Spark Connect works on Amazon EMR on EKS

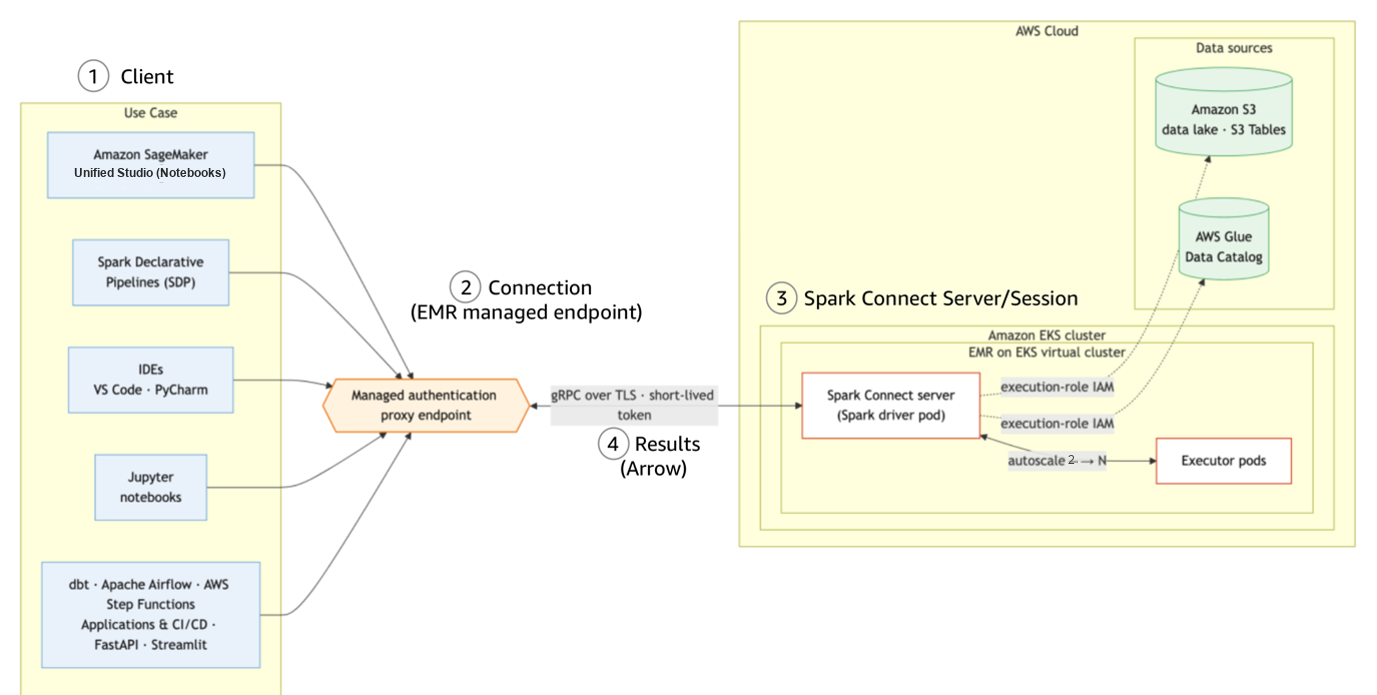
Spark Connect uses a client-server architecture that separates application code from the Spark engine:

  1. Client – A lightweight PySpark library running in your environment (such as an IDE or notebook). It doesn’t need Spark installed, direct access to data, or resources sized for the workload.
  2. Connection (EMR managed endpoint) – The client sends Spark operations over a secure gRPC/TLS channel to the Spark Connect server.
  3. Server – Runs Spark pods in your Amazon EMR on EKS namespace, starting from a minimum of two executors (adjustable) with autoscaling. The server performs Spark operations using the EKS compute resources and accesses data stores, such as an Amazon Simple Storage Service (Amazon S3) bucket, through job execution roles.
  4. Results – The server streams query results back to the client through gRPC as Apache Arrow-encoded row batches.
Client-server data flow from a local PySpark client through a gRPC channel to Spark pods on Amazon EMR on EKS

Figure 1: Spark Connect’s client-server architecture

On endpoint creation, Amazon EMR on EKS launches the Spark Connect server as pods on EKS and returns an Elastic Load Balancing (ELB)-backed endpoint and a short-lived token. You don’t need to provision any server or networking manually. Because the Spark Connect server runs on the EKS cluster you already operate, it inherits the node types, container images, and Spark configurations. What you see while developing Spark applications on the client side is what runs in the EKS environment at scale.

To provide a secure, simplified experience, Amazon EMR on EKS provisions two additional components on first use of Spark Connect on the EKS cluster:

Shared Envoy authentication-proxy router and Secret Agent service on the EKS cluster

Figure 2: Shared Envoy router and Secret Agent service on the EKS cluster

  • Managed authentication-proxy router – a shared Envoy router with three replicas by default (adjustable), fronted by a Network Load Balancer (NLB). It routes client traffic to the correct server pods, terminates TLS, and validates the session token. One router serves Spark Connect endpoints on the EKS cluster.
  • Secret Agent service – a lightweight, long-running pod that manages the short-lived credentials for session authentication. One service per EMR security configuration.

These components are long-running and shared across endpoints. Amazon EMR on EKS creates them automatically with the first endpoint on the cluster. Because the router is cluster-scoped and Secret Agent is namespace-scoped, deleting a managed endpoint doesn’t remove them. They keep running so that new endpoints can start within a minute. The router’s replica count is tunable. Scale down for non-production environments to reduce cost or scale up for higher throughput.

To fully remove these components:

  • Terminate all active managed endpoints and their virtual cluster that reference the Secret Agent’s security configuration, then delete the security configuration.
  • Once the last session-enabled virtual cluster is deleted, the authentication-proxy router and its underly resources, including the NLB and VPC endpoint, are removed automatically.
  • Alternatively, delete the EKS cluster to remove all in-cluster components at once.

Why use Spark Connect on Amazon EMR on EKS

With Amazon EMR on EKS, teams can run Spark alongside other applications on shared Kubernetes clusters with existing infrastructure, operational tooling, and system expertise. Spark Connect extends that value to interactive, embedded, and self-service Spark workloads. Your client stays lightweight while Spark code runs in governed, scalable server pods on EKS.

Interactive development on shared Kubernetes clusters

Data engineers and scientists iterate on Spark code cell-by-cell in notebooks or local IDEs. The Spark engine runs remotely on EKS, so validation runs on the same engine as your batch workloads. After validation on the Spark Connect client, the same Spark code deploys as a batch StartJobRun with no changes.

Spark Connect sessions run as pods on your existing cluster. They reuse your EKS RBAC, network policies, node autoscaling, and observability stack (Prometheus, Grafana, Amazon CloudWatch Container Insights). There are no separate compute and monitoring layers to operate.

Embedded Spark in applications and services

The Spark Connect client is a compact PySpark library. Teams can embed Spark operations directly into Python applications such as web services, dashboards, automation scripts, or backend APIs. The heavy processing runs on EKS while the application stays lightweight.

Teams can also expose Spark Connect as a self-service capability on their internal application. Business users submit Spark SQL scripts from a web UI. The compute runs on Spark Connect server on EKS, so the team manages capacity, security, and upgrades centrally.

Multi-tenant data exploration with governance

Each Spark Connect session uses the data user’s IAM permissions that you configure, limiting their access to authorized AWS services, data lake tables, and S3 paths. Every session carries tags with user, project, endpoint and virtual cluster IDs, feeding directly into billing and compliance reports. Meanwhile, data producers maintain guardrails on source data without blocking self-service exploration.

To manage resource consumption across teams, Amazon EMR on EKS virtual clusters provide namespace-level isolation. Each tenant binds their Spark Connect endpoints to a virtual cluster (a namespace) with independent IAM roles. Using resource quotas and limit ranges on EKS, you can protect each virtual cluster by controlling the compute resources that Spark Connect sessions can consume. Importantly, activating EKS split-cost allocation tags helps with chargeback reporting in a multi-tenant environment.

Reusable container images and scalable deployment

Teams often maintain custom container images with proprietary libraries, including internal feature stores, compliance toolkits, UDFs, or machine learning (ML) frameworks. With Spark Connect on Amazon EMR on EKS, teams reuse those same images as the Spark runtime for interactive sessions. No separate dependency lists needed. The same image works for both batch jobs and Spark Connect sessions.

Beyond the image itself, you can control Spark pod scheduling in Amazon EMR on EKS through pod templates and managed endpoint APIs, scaling across your environment. For example, you can:

  • Pin server pods to specific node types through pod templates. For example, Spot for cost savings.
  • Apply Spark Dynamic Resource allocation (DRA) to right-size each interactive session.
  • Use GPU node pools for accelerated Spark RAPIDS or ML.
cat > /tmp/spark-connect-endpoint.json << EOF
{
  "name": "spark-connect-custom-config",
  "virtualClusterId": "$VC_ID",
  "type": "SPARK_CONNECT",
  "releaseLabel": "emr-7.14.0-latest",
  "executionRoleArn": "$ROLE_ARN",
  "configurationOverrides": {
    "applicationConfiguration": [{
      "classification": "spark-defaults",
      "properties": {
        "spark.kubernetes.container.image": "${CUSTOM_IMAGE_URI}",
        "spark.kubernetes.executor.podTemplateFile": "s3://$S3BUCKET/exec-pod-template.yaml",
        "spark.kubernetes.node.selector.karpenter.sh/nodepool": "gpu-pool",
        "spark.dynamicAllocation.enabled": "true",
        "spark.dynamicAllocation.minExecutors": "0"
      }
    }]
  }
}
EOF

aws emr-containers create-managed-endpoint \
--cli-input-json file:///tmp/spark-connect-endpoint.json

Multi-cluster, multi-Region, and hybrid architectures

Enterprises running EKS clusters across multiple AWS accounts, AWS Regions, or hybrid environments with on-premises Kubernetes can use Spark Connect to query data wherever it’s processed. The lightweight client only needs to reach the Spark Connect endpoint, not the underlying S3 buckets or AWS Glue data catalogs. This means no VPC peering or direct network paths to every data store.

The client-server split is the core architectural advantage of Spark Connect on Amazon EMR on EKS. A developer on a laptop behind a VPN, a CI/CD deployment pipeline in a centralized service account, or an Airflow DAG orchestrating across Regions can all connect to a remote Spark server on EKS. This works regardless of where the client itself runs. This decoupling simplifies cross-Region or cross-account analytics without duplicating data or requiring direct access to each data store.

Getting started

To create a Spark Connect endpoint on Amazon EMR on EKS, complete the following steps:

  1. Create EMR namespaces on EKS.
  2. Create an EMR security configuration.
  3. Create a virtual cluster with the security configuration.
  4. Create a Spark Connect managed endpoint.
  5. Obtain a session token.
  6. Connect from your application.

Prerequisites

To proceed with this post, make sure you have the following:

Step 1: Create EMR namespaces

# set environment variables
export EKS_CLUSTER_NAME=my-eks-cluster
export USER_NAMESPACE=spark-connect-1
export SYS_NAMESPACE=spark-connect-1-system
export AWS_REGION=us-west-2
# connect to your EKS cluster
aws eks update-kubeconfig --name $EKS_CLUSTER_NAME --region $AWS_REGION
kubectl create namespace $USER_NAMESPACE
kubectl create namespace $SYS_NAMESPACE

Step 2: Create a security configuration

cat > /tmp/sec-config.json << EOF
{
  "name": "spark-connect-1-sc",
  "securityConfigurationData": {
    "authenticationConfiguration": {
      "identityCenterConfiguration": { "enableIdentityCenter": false }
    }
  },
  "containerProvider": {
    "type": "EKS",
    "id": "$EKS_CLUSTER_NAME",
    "info": { "eksInfo": { "namespace": "$SYS_NAMESPACE" } }
  }
}
EOF

SEC_CONFIG_ID=$(aws emr-containers create-security-configuration \
--region $AWS_REGION \
--cli-input-json file:///tmp/sec-config.json \
--query id \
--output text)
echo "Security Configuration ID: $SEC_CONFIG_ID"

Step 3: Create a virtual cluster with the security configuration

cat > /tmp/vc.json << EOF
{
  "name": "spark-connect-demo",
  "containerProvider": {
    "id": "$EKS_CLUSTER_NAME",
    "type": "EKS",
    "info": {"eksInfo": {"namespace": "$USER_NAMESPACE"}}
  },
  "securityConfigurationId": "$SEC_CONFIG_ID",
  "sessionEnabled": true
}
EOF

VC_ID=$(aws emr-containers create-virtual-cluster \
--region $AWS_REGION \
--cli-input-json file:///tmp/vc.json \
--query 'id' \
--output text)
# validate the virtual cluster
echo "Virtual Cluster ID: $VC_ID"
aws emr-containers describe-virtual-cluster --region $AWS_REGION --id $VC_ID

Step 4: Create a Spark Connect managed endpoint

Start an interactive session on your virtual cluster. Provide a job execution role that grants the session access to your data sources.

# reuse an existing execution role
ROLE_ARN="arn:aws:iam::YOUR_ACCOUNT_ID:role/EMRonEKSExecutionRole"
cat > /tmp/spark-connect-endpoint.json << EOF
{
  "name": "spark-connect-demo",
  "virtualClusterId": "$VC_ID",
  "type": "SPARK_CONNECT",
  "releaseLabel": "emr-7.14.0-latest",
  "executionRoleArn": "$ROLE_ARN",
  "sessionIdleTimeoutInMinutes": 1440,
  "configurationOverrides": {
    "applicationConfiguration": [{
      "classification": "spark-defaults",
      "properties": {
        "spark.dynamicAllocation.enabled": "true",
        "spark.dynamicAllocation.minExecutors": "0",
        "spark.dynamicAllocation.maxExecutors": "2"
      }
    }]
  }
}
EOF

EP_ID=$(aws emr-containers create-managed-endpoint \
--region $AWS_REGION \
--cli-input-json file:///tmp/spark-connect-endpoint.json \
--query 'id' \
--output text)
# Validate
echo "Endpoint ID: $EP_ID"
export EP_URL=$(aws emr-containers describe-managed-endpoint \
--region $AWS_REGION \
--virtual-cluster-id $VC_ID \
--id $EP_ID \
--query 'endpoint.authProxyUrl' \
--output text)
echo "Endpoint URL: $EP_URL"
Managed endpoint creation output showing the endpoint ID and endpoint URL

Figure 3: Managed endpoint creation output with the endpoint ID and URL

You can optionally pass some custom configuration overrides and tags:

aws emr-containers create-managed-endpoint \
--type SPARK_CONNECT \
--virtual-cluster-id $VC_ID \
--name more-endpoint \
--execution-role-arn $ROLE_ARN \
--release-label emr-7.14.0-latest \
--configuration-overrides '{
"applicationConfiguration": [{
"classification": "spark-defaults",
"properties": {
"spark.executor.instances": "1",
"spark.executor.memory": "4g",
"spark.executor.cores": "1",
"spark.sql.extensions": "org.apache.iceberg.spark.extensions.IcebergSparkSessionExtensions"
}
}]
}' \
--tags '{
"team": "data-engineering",
"project": "customer-analytics"
}'

Step 5: Obtain a session token

Request a session token after the managed endpoint is active:

# get a session token with a 12-hour expiry (adjustable)
export TOKEN=$(aws emr-containers get-managed-endpoint-session-credentials \
--region $AWS_REGION \
--virtual-cluster-identifier $VC_ID \
--endpoint-identifier $EP_ID \
--execution-role-arn $ROLE_ARN \
--credential-type TOKEN \
--duration-in-seconds 43200 \
--query 'credentials.token' \
--output text)
echo "Session Token: $TOKEN"

Security note: Communication between your environment and the Spark Connect server is encrypted using TLS. The authentication token is time-limited (15 minutes by default). For long-running sessions, refresh the token periodically by calling get-managed-endpoint-session-credentials again. Consider using AWS Secrets Manager to store and retrieve tokens programmatically.

Step 6: Connect from your application

Use the returned endpoint URL and token to connect from a PySpark-compatible environment. The following Python code shows how to establish a Spark Connect session:

import os
from pyspark.sql import SparkSession
session_endpoint = os.environ["EP_URL"]
auth_token = os.environ["TOKEN"]
spark_conn_url = (f"{session_endpoint};use_ssl=true;x-aws-proxy-auth={auth_token}")
spark = SparkSession.builder
.remote(spark_conn_url)
.getOrCreate()
# verify the connection
print(f"Connected remotely! Spark version: {spark.version}")
# query data through the AWS Glue Data Catalog
df = spark.sql("SELECT * FROM my_catalog.my_database.my_table LIMIT 10")
df.show()

After you’re connected, you can:

  • Debug interactively – Set breakpoints, inspect DataFrames, and step through Spark code in your IDE or notebook while the operations run remotely on EKS.
  • Combine local and remote processing – Pull query results back to the client as a pandas or PyArrow DataFrame for local analysis, visualization, or ML (scikit-learn, notebook widgets), then push further Spark operations back to the server in the same session. Heavy processing stays on Amazon EMR on EKS. Only the results you request cross the wire.
  • Reconnect without losing state – A managed endpoint runs independently of single clients for a configurable idle timeout (default: 60 minutes). Your Spark session, cached data, and temporary views are preserved on the server between connections. When a session token expires (default: 15 minutes, configurable up to 12 hours), request a new token and reconnect to the same endpoint to resume where you left off.
  • Reuse across workload types – The same client connection pattern works everywhere Python runs: notebooks, IDEs, batch scripts, Airflow operators, or web services. One endpoint, one connection pattern, many workload types.

Validation

After you create the endpoint, verify that the Spark Connect server is running and reachable through Amazon EMR on EKS API and standard Kubernetes tooling:

# get endpoint status
aws emr-containers describe-managed-endpoint --virtual-cluster-id $VC_ID --id $EP_ID
# inspect the server pods (driver + executors) in your namespace
kubectl get pods -n $USER_NAMESPACE -l "emr-containers.amazonaws.com/managed-endpoint-id=$EP_ID"
# View driver logs
kubectl logs -n $USER_NAMESPACE <driver-pod-name> -c spark-kubernetes-driver
Terminal output showing endpoint status and the running driver and executor pods

Figure 4: Endpoint status and the running driver and executor pods

# to view the live Spark UI, port-forward your driver pod:
DRIVER_POD=$(kubectl get pods -n $USER_NAMESPACE \
-l "emr-containers.amazonaws.com/managed-endpoint-id=$EP_ID,emr-containers.amazonaws.com/component=driver" \
-o name)
kubectl port-forward -n $USER_NAMESPACE "$DRIVER_POD" 4040:4040
# Open http://localhost:4040 in your browser
Live Spark UI for the Spark Connect session viewed in a browser through port forwarding

Figure 5: Live Spark UI for the Spark Connect session

Spark Connect endpoints run as pods on your EKS cluster. The existing Kubernetes observability stack, such as CloudWatch Container Insights, Prometheus, and Grafana, captures Spark Connect endpoint metrics alongside other cluster workloads.

Clean up resources

Terminate your session when you’re done to avoid ongoing costs:

# (OPTIONAL) Endpoints are auto-deleted after the idle timeout (default: 60 minutes).
aws emr-containers delete-managed-endpoint \
--virtual-cluster-id $VC_ID \
--id $EP_ID
# Delete the virtual cluster only when no active endpoints remain
aws emr-containers delete-virtual-cluster --id $VC_ID
# Delete Security Configuration
aws emr-containers delete-security-configuration --id $SEC_CONFIG_ID
# remove the remaining EKS namespaces
kubectl delete namespace $USER_NAMESPACE $SYS_NAMESPACE spark-connect-router

Deleting or timing out a managed endpoint automatically removes its corresponding driver and executor pods. The Envoy router and Secret Agent service are shared across endpoints on the EKS cluster and remain running when individual endpoints are terminated. To fully remove these shared components, delete the virtual cluster to remove its corresponding Secret Agent service. Before doing so, ensure that no managed endpoints in the virtual cluster are active. Terminating the last session-enabled virtual cluster automatically removes the Envoy router from the EKS cluster.

Availability and pricing

Spark Connect on Amazon EMR on EKS is available with EMR release 7.14 (Apache Spark 3.5) and emr-spark-8.1 (Apache Spark 4.1), in all AWS Regions where Amazon EMR on EKS is available, except the AWS GovCloud (US) Regions and the China Regions. The Amazon SageMaker Unified Studio experience is available in supported Regions.

There is no additional charge for Spark Connect managed endpoints beyond the standard Amazon EMR on EKS pricing. You pay for underlying Amazon EKS resources such as EC2 and ELB. For timed-out or terminated managed endpoints, EMR automatically removes their Spark pods from the EKS cluster.

Recommendations for cost efficiency:

  • Use Karpenter (or Cluster Autoscaler) to right-size cluster capacity to session workload demand. This provisions nodes when endpoints need them and removes them when idle, which keeps cost aligned to actual usage.
  • Schedule interactive session pods on On-Demand instances for persistent compute.
  • Use AWS Graviton processors for better performance on Spark workloads.
  • Activate Amazon EMR on EKS Cost Allocation tags to track per-team and per-project spending at granular level.
  • Keep a single, shared Envoy router and NLB serving all Spark Connect endpoints (the default) on the cluster. Right-size the router replica count (three by default) for your availability requirements.

Considerations and limitations

Before you build on Spark Connect for Amazon EMR on EKS, review the Considerations and limitations in the Amazon EMR on EKS documentation.

Conclusion

In this post, we showed how, with Spark Connect on Amazon EMR on EKS, you can build, test, and debug Spark applications from the tools you already use: IDEs, notebooks, Amazon SageMaker Unified Studio or Airflow. Your workloads run at scale on your existing Kubernetes clusters, with no application code changes.

For teams already running Amazon EMR on EKS, Spark Connect extends your virtual clusters to interactive and embedded workloads. The same virtual cluster that runs your batch StartJobRun jobs now also serves Spark Connect sessions. Each session runs as pods on your EKS cluster, inheriting your node groups, container images, and Spark configurations. Each session also carries its own IAM execution role and cost tags. This extends the security, multi-tenancy, and observability of your Amazon EMR on EKS investment to a broader set of users and use cases.

To get started, visit the Spark Connect on Amazon EMR on EKS documentation, try the Amazon SageMaker Unified Studio Getting Started guide, and review the Amazon EMR on EKS release notes for EMR 7.14.


About the authors

Amit Maindola

Amit Maindola

Amit is a Senior Data & AI Architect with AWS ProServe team focused on data engineering, analytics, and AI/ML at Amazon Web Services. He helps customers in their digital transformation journey and enables them to build highly scalable, robust, and secure cloud-based analytical solutions on AWS to gain timely insights and make critical business decisions.

Melody Yang

Melody Yang

Melody Yang is a Principal Analytics Specialist Solution Architect at AWS with expertise in Big Data technologies. She is an experienced analytics leader working with AWS customers to provide best practice guidance and technical advice in order to assist their success in data transformation. Her areas of interests are open-source frameworks and automation, data engineering and DataOps.

Al MS

Al MS

Al is a product manager for Amazon EMR at AWS.

Aurora PostgreSQL zero-ETL integration with Amazon SageMaker

Post Syndicated from Apurwa Pawar original https://aws.amazon.com/blogs/big-data/aurora-postgresql-zero-etl-integration-with-amazon-sagemaker/

When you need quick insights from your Amazon Aurora PostgreSQL operational data, traditional analytics approaches force you to build complex extract, transform, and load (ETL) pipelines. These pipelines introduce latency, operational overhead, and data silos, which slow down decision making and increase cost. AWS introduced the support for Amazon Aurora PostgreSQL zero-ETL integration with Amazon SageMaker, providing near real-time data availability for analytics workloads.

The zero-ETL integration automatically replicates the data from your Amazon Aurora PostgreSQL database into a target AWS Glue managed catalog, where it’s available as Apache Iceberg tables. You can then analyze this data through Amazon SageMaker alongside data from other sources using your preferred analytics and machine learning (ML) tools. The data is compatible with Apache Iceberg open standards, so you can use SQL, Apache Spark, business intelligence, and artificial intelligence and machine learning (AI/ML) tools.

In this post, you explore the benefits of this integration, the architectural concepts, and the underlying change data capture (CDC) mechanics. You also go through the setup process and learn how to query your Aurora PostgreSQL data in Amazon SageMaker AI.

Zero-ETL in the lakehouse architecture

The lakehouse architecture of Amazon SageMaker AI brings together data across Amazon Simple Storage Service (Amazon S3) data lakes and Amazon Redshift data warehouses. Because it’s built on open standards, you can build analytics and AI/ML applications on a single copy of data, without moving it between systems.

Amazon SageMaker AI uses AWS Glue Data Catalog and AWS Lake Formation to provide integrated access controls across S3 data lakes and Amazon Redshift data warehouses from a single governance plane.

Understanding change data capture mechanics

At its core, Aurora PostgreSQL zero-ETL integration is powered by CDC. CDC continuously monitors the database transaction log and streams every insert, update, and delete to a downstream target in near real time.

Aurora PostgreSQL uses enhanced logical replication as its CDC engine. Standard PostgreSQL logical replication publishes row-level changes from the write-ahead log (WAL). The enhanced logical replication in Aurora offers added capabilities that make it well-suited for zero-ETL integrations, including automatic DDL propagation and continuous streaming of transactional changes.

Solution overview

With Amazon Aurora PostgreSQL zero-ETL integration with Amazon SageMaker AI, you can:

  • Remove ETL complexity – Automatically replicate data without building custom ETL pipelines.
  • Near real-time analytics – Access operational data in Amazon SageMaker AI within seconds of changes in Aurora PostgreSQL.
  • Unify data analysis – Combine Aurora PostgreSQL data with data from other sources in a single lakehouse architecture.
  • Reduce costs – Minimize operational overhead and infrastructure costs associated with maintaining ETL pipelines.
  • Accelerate insights – Query data using familiar SQL tools and integrate with ML workflows in Amazon SageMaker AI.

The following diagram illustrates the architecture of this solution:

Aurora PostgreSQL zero-ETL integration replicating data into an AWS Glue managed catalog queried through Amazon SageMaker

Figure 1: Architecture of the Aurora PostgreSQL zero-ETL integration with Amazon SageMaker

The workflow includes the following steps:

  1. Your application writes data to an Amazon Aurora PostgreSQL database cluster.
  2. The zero-ETL integration automatically captures changes from the Aurora PostgreSQL database.
  3. Data is replicated to the target AWS Glue managed catalog in near real time.
  4. You can query and analyze the data using Amazon Athena, Amazon Redshift, or other analytics tools integrated with Amazon SageMaker AI.
  5. Data scientists can build and train ML models using Amazon SageMaker AI with direct access to the Apache Iceberg tables in the target AWS Glue managed catalog.

Prerequisites

Before setting up the zero-ETL integration, verify that you have the following:

Configure the source PostgreSQL database for zero-ETL integration

When you have all the prerequisites in place, you can configure the source PostgreSQL database for zero-ETL integration.

Create a custom Aurora PostgreSQL cluster parameter group

Your Aurora PostgreSQL database needs to have parameters configured for real-time replication. In this section, you will create the DB cluster parameter group and configure parameters. For more information, see Getting started with Aurora zero-ETL integrations.

Use the following AWS CLI command to create an Aurora PostgreSQL cluster parameter group:

aws rds create-db-cluster-parameter-group \
    --db-cluster-parameter-group-name aurora-pgsql-zetl-cluster-pg \
    --db-parameter-group-family aurora-postgresql16 \
    --description "Aurora PostgreSQL with enhanced logical replication" \
    --region us-east-1 --output json

Now set the parameters by modifying the parameter group:

aws rds modify-db-cluster-parameter-group --db-cluster-parameter-group-name <aurora-pgsql-zetl-cluster-pg> \
    --parameters \
    ParameterName=rds.logical_replication,ParameterValue=1,ApplyMethod=pending-reboot \
    ParameterName=aurora.enhanced_logical_replication,ParameterValue=1,ApplyMethod=pending-reboot \
    ParameterName=aurora.logical_replication_backup,ParameterValue=0,ApplyMethod=pending-reboot \
    ParameterName=aurora.logical_replication_globaldb,ParameterValue=0,ApplyMethod=pending-reboot \
    --region us-east-1 --output json

The parameter group is now fully configured and ready to be applied to your Aurora PostgreSQL cluster.

Select or create a source Aurora PostgreSQL cluster

If you already have an Aurora PostgreSQL cluster, you can use it, or you can create a new Aurora PostgreSQL cluster.

Note: Your source DB cluster must be running a supported version of Aurora PostgreSQL. For a list of supported versions, see Regions and database engines supported for Aurora zero-ETL integrations.

While creating an Aurora PostgreSQL cluster, use the parameter group (aurora-pgsql-zetl-cluster-pg) you created earlier:

Note: Throughout this post, make sure to replace the with your own information.

aws rds create-db-cluster \
    --db-cluster-identifier <aurora-pgsql-zetl> \
    --engine aurora-postgresql \
    --engine-version 16 \
    --master-username <admin> \
    --master-user-password <password> \
    --database-name <my_db> \
    --db-cluster-parameter-group-name <aurora-pgsql-zetl-cluster-pg> \
    --storage-encrypted \
    --kms-key-id alias/aws/rds \
    --backup-retention-period 7 \
    --db-subnet-group-name <dbsubnet> \
    --vpc-security-group-ids <sg-c14219ba> \
    --region <us-east-1> \
    --output json
aws rds create-db-instance \
    --db-instance-identifier <aurora-pgsql-zetl-instance-1> \
    --db-instance-class db.r5.large \
    --engine aurora-postgresql \
    --db-cluster-identifier <aurora-pgsql-zetl> \
    --region us-east-1 \
    --output json

If you’re creating a new Aurora PostgreSQL cluster, wait for your DB instance(s) to be in an “Available” status. You can verify DB instance status by using the describe-db-instances API call:

aws rds describe-db-instances --filters 'Name=db-cluster-id,Values=<aurora-pgsql-zetl>' --output json | grep -o '"DBInstanceStatus": "[^"]*"'
"DBInstanceStatus": "available"

Reboot the cluster to apply parameter changes

A cluster reboot is needed before zero-ETL integration can function correctly:

aws rds reboot-db-instance \
    --db-instance-identifier <aurora-pgsql-zetl-instance-1> \
    --region <us-east-1>

Wait until the cluster and the primary instance are back in Available status. For more information, see reboot-db-instance.

Create a target AWS Glue managed catalog

With your source PostgreSQL database configured for enhanced logical replication, the next step is setting up your target Amazon SageMaker AI. Zero-ETL integration uses AWS Glue Data Catalog backed by Amazon Redshift managed storage as its target. To have this functionality, you need to create a managed catalog, configure IAM permissions for Amazon SageMaker AI to access and query the managed catalog, and set up authorization for incoming integration requests from your source database.

Create an AWS Glue managed catalog

You must create a new catalog (if it doesn’t exist already) managed by AWS Glue to store table metadata and serve as the landing zone for your replicated datasets. Zero-ETL integration streams the data into Amazon Redshift managed storage, and AWS Glue keeps track of table definitions so that tools such as SageMaker AI, Athena, and Amazon Redshift Spectrum can query the data.

Create an IAM role for AWS Glue and Amazon Redshift to access the AWS Glue managed catalog

Now, use the following command to create an IAM role so that AWS Glue and Amazon Redshift can interact with the catalog. This role serves two key functions: It allows AWS Glue and Amazon Redshift to perform catalog operations, and it authorizes incoming integration requests from your source database.

aws iam create-role \
    --role-name <GlueDataCatalogDataTransferRole> \
    --assume-role-policy-document '{
        "Version": "2012-10-17",
        "Statement": [
            {
                "Effect": "Allow",
                "Principal": {
                    "Service": [
                        "glue.amazonaws.com",
                        "redshift.amazonaws.com"
                    ]
                },
                "Action": "sts:AssumeRole"
            }
        ]
    }'

Next, attach a policy to this IAM role that provides the minimum required permissions for AWS Glue and Amazon Redshift. This policy should also include the necessary permissions for encryption key actions to help maintain secure data handling throughout the integration process:

aws iam put-role-policy \
    --role-name <GlueDataCatalogDataTransferRole> \
    --policy-name <GlueDataTransferPolicy> \
    --policy-document '{
        "Version": "2012-10-17",
        "Statement": [
            {
                "Sid": "DataTransferRolePolicy",
                "Effect": "Allow",
                "Action": [
                    "kms:GenerateDataKey",
                    "kms:Decrypt",
                    "glue:GetDatabase",
                    "glue:GetCatalog"
                ],
                "Resource": ["*"]
            }
        ]
    }'

Set up AWS Lake Formation access

Before using the managed catalog for zero-ETL integration, you must configure data lake administrators in AWS Lake Formation who have administrative or read-only permissions on the managed resources. Additionally, you need to grant ReadOnlyAdmin permissions to the Amazon Redshift service-linked role, AWSServiceRoleForRedshift, in your account. If this role doesn’t exist in your account or you need to verify its permissions, see Using service-linked roles for Amazon Redshift.

aws lakeformation put-data-lake-settings \
    --region <us-east-1> \
    --cli-input-json '{
        "DataLakeSettings": {
            "DataLakeAdmins": [
                {
                    "DataLakePrincipalIdentifier": "<arn:aws:iam::111122223333:role/Admin>"
                }
            ],
            "ReadOnlyAdmins": [
                {
                    "DataLakePrincipalIdentifier": "<arn:aws:iam::111122223333:role/aws-service-role/redshift.amazonaws.com/AWSServiceRoleForRedshift>"
                }
            ],
            "CreateDatabaseDefaultPermissions": [],
            "CreateTableDefaultPermissions": [],
            "Parameters": {
                "CROSS_ACCOUNT_VERSION": "4",
                "SET_CONTEXT": "TRUE"
            },
            "AllowExternalDataFiltering": false,
            "ExternalDataFilteringAllowList": []
        }
    }'

Create the AWS Glue managed catalog backed by Amazon Redshift managed storage

Because you have configured IAM permissions and Lake Formation settings, you can now create the AWS Glue managed catalog.

aws glue create-catalog \
    --region <us-east-1> \
    --cli-input-json '{
        "Name": "<zetl-catalog>",
        "CatalogInput": {
            "Description": "A Glue Data Catalog backed by Redshift Managed Storage",
            "CreateDatabaseDefaultPermissions": [],
            "CreateTableDefaultPermissions": [],
            "CatalogProperties": {
                "DataLakeAccessProperties": {
                    "DataLakeAccess": true,
                    "DataTransferRole": "<arn:aws:iam::111122223333:role/GlueDataCatalogDataTransferRole>",
                    "CatalogType": "aws:redshift"
                }
            }
        }
    }'

Register the catalog as a zero-ETL integration target

To prepare your target AWS Glue managed catalog for zero-ETL integration, use the create-integration-resource-property command with these required parameters:

  • The –resource-arn parameter specifies the Amazon Resource Name (ARN) of your AWS Glue managed catalog that will serve as the integration target.
  • The –target-processing-properties parameter requires the ARN of an IAM role that has describe permissions on the target AWS Glue managed catalog.

You can use the GlueDataCatalogDataTransferRole created in the earlier step because it already includes the minimal describe permissions needed for this integration. Alternatively, you can create a new IAM role specifically for this purpose and attach the necessary minimal permissions to meet your company’s security requirements.

aws glue create-integration-resource-property \
    --region <us-east-1> \
    <arn:aws:glue:us-east-1:111122223333:catalog/zetl-catalog> \
    '{"RoleArn": "<arn:aws:iam::111122223333:role/GlueDataCatalogDataTransferRole>"}'

Example output:

{
    "ResourceArn": "arn:aws:glue:us-east-1:111122223333:catalog/zetl-catalog",
    "TargetProcessingProperties": {
        "RoleArn": "arn:aws:iam::111122223333:role/GlueDataCatalogDataTransferRole"
    }
}

Configure authorization for inbound integration requests

The last step in creating a target managed catalog is to define a resource-based access policy that authorizes zero-ETL integration to push data into your catalog. This policy grants AWS Glue the necessary permissions to create and authorize incoming integration requests from your source database. Apply this resource policy by using the AWS Glue put-resource-policy API call to complete the catalog configuration for your zero-ETL integration:

aws glue put-resource-policy \
    --region <us-east-1> \
    --policy-in-json '{
        "Version": "2012-10-17",
        "Statement": [
            {
                "Principal": {
                    "AWS": [
                        "111122223333"
                    ]
                },
                "Effect": "Allow",
                "Action": [
                    "glue:CreateInboundIntegration"
                ],
                "Resource": [
                    "arn:aws:glue:us-east-1:111122223333:catalog/zetl-catalog"
                ],
                "Condition": {
                    "StringEquals": {
                        "aws:SourceArn": "arn:aws:rds:us-east-1:111122223333:cluster:aurora-pgsql-zetl"
                    }
                }
            },
            {
                "Principal": {
                    "Service": [
                        "glue.amazonaws.com"
                    ]
                },
                "Effect": "Allow",
                "Action": [
                    "glue:AuthorizeInboundIntegration"
                ],
                "Resource": [
                    "arn:aws:glue:us-east-1:111122223333:catalog/zetl-catalog"
                ],
                "Condition": {
                    "StringEquals": {
                        "aws:SourceArn": "arn:aws:rds:us-east-1:111122223333:cluster:aurora-pgsql-zetl"
                    }
                }
            }
        ]
    }'

Your AWS Glue managed catalog is now ready to receive data from the zero-ETL integration.

Load data in the source Aurora PostgreSQL database

Now that your Aurora PostgreSQL database is configured and ready, you must populate it with sample data that serves as the historical baseline for your zero-ETL integration. This first dataset provides the foundation for testing and demonstrating the integration capabilities. After you set up the zero-ETL integration, subsequent database changes stream automatically in near real time to your target AWS Glue managed catalog.

Connect to the source Aurora PostgreSQL cluster

Use the following commands to create a connection to your source Aurora PostgreSQL cluster:

psql --host aurora-pgsql-zetl-xxxxx.us-east-1.rds.amazonaws.com --username admin --port 5432 --dbname my_db --password

Create a database and table

Create a table named products to store product information:

CREATE TABLE products (product_id SERIAL PRIMARY KEY,product_name VARCHAR(100) NOT NULL, description TEXT,category VARCHAR(50),price NUMERIC(10,2) NOT NULL,stock_quantity INTEGER DEFAULT 0,is_active BOOLEAN DEFAULT TRUE,created_at TIMESTAMP DEFAULT CURRENT_TIMESTAMP,updated_at TIMESTAMP DEFAULT CURRENT_TIMESTAMP );

Insert historical data

Use the following code to insert a row:

INSERT INTO products (product_name, description, category, price, stock_quantity) VALUES ('Laptop', 'High-performance laptop with 16GB RAM and 512GB SSD', 'Electronics', 1299.99, 50);

This table serves as a representative dataset to demonstrate the data capture and streaming capabilities of the zero-ETL integration. After your zero-ETL integration is active, all database changes, including inserts, updates, and deletes, are automatically captured and streamed to your AWS Glue managed catalog. This creates a data pipeline from your Aurora PostgreSQL database to your Amazon SageMaker for real-time analytics on your operational data.

Create a zero-ETL integration

Because your Aurora PostgreSQL database is now populated with historical data, you can set up the zero-ETL integration that continuously streams database changes to your AWS Glue managed catalog backed by Amazon Redshift managed storage.

Create the integration

Create the integration between your source PostgreSQL database and target AWS Glue catalog by using the aws rds create-integration AWS CLI command. You can customize the integration by specifying added configurations, such as data filters, to control which data gets replicated to your target environment:

aws rds create-integration \
    --source-arn <arn:aws:rds:us-east-1:111122223333:cluster:aurora-pgsql-zetl> \
    --target-arn <arn:aws:glue:us-east-1:111122223333:catalog/zetl-catalog> \
    --integration-name <zetl-test-integration> \
    --data-filter "include: *.*" \
    --region us-east-1

When you run the command, the zero-ETL integration begins provisioning and enters a ‘creating’ state. The AWS CLI response provides key details about the integration configuration.

Example CLI output:

{
    "SourceArn": "<arn:aws:rds:us-east-1:111122223333:cluster:aurora-pgsql-zetl>",
    "TargetArn": "<arn:aws:glue:us-east-1:111122223333:catalog/zetl-catalog>",
    "IntegrationName": "<zetl-test-integration>",
    "IntegrationArn": "<arn:aws:rds:us-east-1:111122223333:integration:4c4d81b9-xxxx>",
    "KMSKeyId": "<arn:aws:kms:us-east-1:111122223333:key/b9130ae1-exxxx>",
    "Status": "creating",
    "Tags": [],
    "CreateTime": "2025-07-04T05:42:56.841000+00:00",
    "DataFilter": "include: *.*"
}

When the integration status changes to “active”, your zero-ETL integration pipeline is fully operational.

Monitor the integration

Before generating new live data, verify that the integration has reached an “active” state by running the describe-integrations AWS CLI command. This monitoring step is important to confirm that changes from your source Aurora cluster are successfully streaming to the AWS Glue managed catalog without errors:

aws rds describe-integrations
{
    "Integrations": [
        {
            "SourceArn": "<arn:aws:rds:us-east-1:111122223333:cluster:aurora-pgsql-zetl>",
            "TargetArn": "<arn:aws:glue:us-east-1:111122223333:catalog/zetl-catalog>",
            "IntegrationName": "<zetl-test-integration>",
            "IntegrationArn": "<arn:aws:rds:us-east-1:111122223333:integration:4c4d81b9-xxxx>",
            "KMSKeyId": "<arn:aws:kms:us-east-1:111122223333:key/b9130ae1-xxxx>",
            "Status": "active",
            "Tags": [],
            "CreateTime": "2025-07-04T05:42:56.841000+00:00",
            "DataFilter": "include: *.*"
        }
    ]
}

Verify the zero-ETL integration

Now that your historical data is loaded and the zero-ETL integration is “active”, you must confirm that the data has been successfully replicated.

Grant Lake Formation permissions

Before you can query the AWS Glue managed catalog by using the Amazon Redshift Data API, you must make sure the IAM user or role has the right permissions to create and manage tables within the catalog. Use the Lake Formation grant-permissions API to provide these necessary permissions so that Amazon Redshift can access your AWS Glue managed catalog for the zero-ETL integration. For more information, see Creating an Amazon Redshift managed catalog in the AWS Glue Data Catalog.

aws lakeformation grant-permissions \
    --region <us-east-1> \
    --cli-input-json '{
        "Principal": {
            "DataLakePrincipalIdentifier": "<arn:aws:iam::111122223333:role/Admin>"
        },
        "Resource": {
            "Table": {
                "DatabaseName": "my_db",
                "CatalogId": "<111122223333:zetl-catalog/zetl_0dff6d97-xxxx>",
            },
            "Permissions": [
                "CREATE_CATALOG",
                "DESCRIBE",
                "CREATE_DATABASE",
                "DROP",
                "ALTER"
            ],
            "PermissionsWithGrantOption": [
                "CREATE_CATALOG",
                "DESCRIBE",
                "CREATE_DATABASE",
                "DROP",
                "ALTER"
            ]
        }'

These permissions allow for query execution and metadata inspection on the managed catalog.

Query historical data by using the Amazon Redshift Data API

With the necessary permissions in place, you can now verify your historical data by querying the AWS Glue managed catalog through the Amazon Redshift execute-statement Data API. Begin this verification process by running a SELECT statement against the catalog:

aws redshift-data execute-statement --sql 'SELECT * FROM "zetl_0dff6d97-xxxx@zetl-catalog"."my_db"."products" LIMIT 10;' --database "<arn:aws:glue:us-east-1:111122223333:catalog/pg-zetl-catalog>"

The following command returns a unique query ID that you can use to monitor the execution status and retrieve results from your query:

{
    "CreatedAt": "2025-07-15T00:31:48.778000+00:00",
    "Database": "arn:aws:glue:us-east-1:111122223333:catalog/zetl-catalog",
    "DbUser": "IAMR:Admin",
    "Id": "ce1ff0el-xxxx",
}

Monitor your query’s progress by using the describe-statement API with the query ID. Continue checking until the status shows that your query has completed successfully:

//use the Id to make the describe-statement API call to verify execution status is Started
aws redshift-data describe-statement --id <ce1ff0el-xxxx>
{
    "CreatedAt": "2025-07-15T00:31:48.778000+00:00",
    "Database": "arn:aws:glue:us-east-1:111122223333:catalog/zetl-catalog",
    "DbUser": "IAMR:Admin",
    "Duration": 6238051060,
    "HasResultSet": true,
    "Id": "2ca8fedf-xxxx",
    "QueryString": "SELECT * FROM \"zetl_0dff6d97-xxxx_zeroetl@pg-zetl-catalog\".\"zetl_default\".\"products\" LIMIT 10;",
    "RedshiftPid": 1073791309,
    "RedshiftQueryId": 1018598,
    "ResultFormat": "json",
    "ResultRows": 1,
    "ResultSize": 149,
    "Status": "FINISHED",
    "UpdatedAt": "2025-07-15T00:31:55.491000+00:00"
}

To complete the verification process and view your historical data now available in Amazon SageMaker AI, retrieve the query results by using the get-statement-result API call:

aws redshift-data get-statement-result --id <ce1ff0el-xxxx>
{
    "Records": [
        [
            {
                "longValue": 1
            },
            {
                "stringValue": "Laptop"
            },
            {
                "stringValue": "High-performance laptop with 16GB RAM and 512GB SSD"
            },
            {
                "stringValue": "Electronics"
            },
            {
                "stringValue": "1299.99"
            },
            {
                "longValue": 50
            },
            {
                "booleanValue": true
            },
            {
                "stringValue": "2026-02-27 13:32:02.697117"
            },
            {
                "stringValue": "2026-02-27 13:32:02.697117"
            }
        ]
    ],
    "ColumnMetadata": [
        ....
        //Skipping metadata
    ],
    "TotalNumRows": 1
}

With your zero-ETL integration now active, you can demonstrate real-time data streaming by adding new data to your source Aurora PostgreSQL instance. Run the following INSERT query to add a new row, which shows how changes are automatically replicated in near real time:

INSERT INTO products (product_name, description, category, price, stock_quantity)
VALUES ('Wireless Mouse', 'Ergonomic wireless mouse with USB receiver and long battery life', 'Electronics', 29.99, 150);

You can verify that the recent changes from your source database have been replicated to the target environment within seconds. Use the same Amazon Redshift Data API workflow you used earlier to confirm the real-time replication:

aws redshift-data execute-statement --sql 'SELECT * FROM "zetl_0dff6d97-xxxx@zetl-catalog"."my_db"."products" LIMIT 10;' --database "<arn:aws:glue:us-east-1:111122223333:catalog/pg-zetl-catalog>"
{
    "CreatedAt": "2025-07-15T00:31:48.778000+00:00",
    "Database": "arn:aws:glue:us-east-1:111122223333:catalog/zetl-catalog",
    "DbUser": "IAMR:Admin",
    "Id": "2ca8fedf-a604-4c87-a183-3a553d62354c",
}

Use the describe-statement API call to monitor the query execution and confirm that the status shows ‘FINISHED’ before proceeding to retrieve the results:

aws redshift-data describe-statement --id <ce1ff0ef-xxxx>
{
    "CreatedAt": "2025-07-15T00:31:48.778000+00:00",
    "Database": "arn:aws:glue:us-east-1:111122223333:catalog/zetl-catalog",
    "DbUser": "IAMR:Admin",
    "Duration": 6238051060,
    "HasResultSet": true,
    "Id": "2ca8fedf-xxxx",
    "QueryString": "SELECT * FROM \"zetl_0dff6d97-xxxx_zeroetl@pg-zetl-catalog\".\"zetl_default\".\"products\" LIMIT 10;",
    "RedshiftPid": 1073791309,
    "RedshiftQueryId": 1018598,
    "ResultFormat": "json",
    "ResultRows": 2,
    "ResultSize": 317,
    "Status": "FINISHED",
    "UpdatedAt": "2025-07-15T00:31:55.491000+00:00"
}

Finally, retrieve the query results by using the get-statement-result API call:

aws redshift-data get-statement-result --id <ce1ff0ef-xxxx>
{
    "Records": [
        [
            {
                "longValue": 1
            },
            {
                "stringValue": "Laptop"
            },
            {
                "stringValue": "High-performance laptop with 16GB RAM and 512GB SSD"
            },
            {
                "stringValue": "Electronics"
            },
            {
                "stringValue": "1299.99"
            },
            {
                "longValue": 50
            },
            {
                "booleanValue": true
            },
            {
                "stringValue": "2026-02-27 13:32:02.697117"
            },
            {
                "stringValue": "2026-02-27 13:32:02.697117"
            }
        ],
        [
            {
                "longValue": 2
            },
            {
                "stringValue": "Wireless Mouse"
            },
            {
                "stringValue": "Ergonomic wireless mouse with USB receiver and long battery life"
            },
            {
                "stringValue": "Electronics"
            },
            {
                "stringValue": "29.99"
            },
            {
                "longValue": 150
            },
            {
                "booleanValue": true
            },
            {
                "stringValue": "2026-02-27 15:41:00.206273"
            },
            {
                "stringValue": "2026-02-27 15:41:00.206273"
            }
        ]
    ],
    "ColumnMetadata": [
        ....
        //Skipping metadata
    ],
    "TotalNumRows": 2
}

This verification process confirms that your zero-ETL integration from Aurora PostgreSQL to Amazon SageMaker AI is working and continuously replicating both historical and real-time data. Although zero-ETL integration significantly simplifies data replication, it’s important to understand certain limitations on supported data types, schema change handling, and data filtering capabilities. For more details about these considerations and best practices, see Aurora zero-ETL integrations and Amazon RDS zero-ETL integrations.

Clean up

This section guides you through the cleanup process to remove the resources and components you created during this walkthrough. When you delete a zero-ETL integration, Amazon Aurora removes it from the source Aurora DB cluster. Your transactional data isn’t removed from Amazon Aurora or the analytics destination, but Aurora doesn’t send new data to Amazon SageMaker AI.

Delete the zero-ETL integration: Begin the cleanup process by removing the integration between your source Amazon Relational Database Service (Amazon RDS) database and the AWS Glue managed catalog. Run the following command to delete the integration:

aws rds delete-integration --integration-identifier <arn:aws:rds:us-east-1:111122223333:integration:4c4d81b9-af2a-4b09-b922-007636ba7f66>

Delete the AWS Glue managed catalog: After you successfully delete the integration, delete the AWS Glue managed catalog that served as your zero-ETL target destination. Use the following command to remove the catalog:

aws glue delete-catalog --catalog-id <111122223333:zetl-catalog>

This permanently removes all associated table metadata and Amazon Redshift managed storage references.

Delete the Aurora DB cluster: If you created the source Aurora DB cluster for this demonstration and you no longer need it, you can complete the cleanup by deleting the entire DB cluster. By skipping the final snapshot option, you avoid retaining any test data and confirm complete resource removal:

aws rds delete-db-instance --db-instance-identifier <aurora-pgsql-zetl-instance-1> --skip-final-snapshot --region <us-east-1>

aws rds delete-db-cluster --db-cluster-identifier <aurora-pgsql-zetl> --skip-final-snapshot --region <us-east-1>

aws rds delete-db-cluster-parameter-group --db-cluster-parameter-group-name <aurora-zetl-cluster-pg> --region <us-east-1>

Conclusion

In this post, you learned how to configure zero-ETL integration between Aurora PostgreSQL and your Amazon SageMaker AI using AWS CLI. This integration automatically replicates your PostgreSQL data to a lakehouse in near real time, removing the need for custom ETL pipelines.

As you move forward, consider expanding this zero-ETL approach to more supported data sources, such as Amazon RDS for MySQL and Amazon DynamoDB. This creates a centralized data access strategy across your company. You can also explore advanced analytics scenarios by combining zero-ETL integrations with Amazon Redshift capabilities. These include large-scale SQL analytics, Amazon Redshift ML for in-database ML, and federated queries that span multiple data lakes and warehouses. These integrations provide the foundation for building a near real-time data platform that scales with your business needs.

To get started, see the AWS zero-ETL documentation for setup guidance, supported configurations, troubleshooting integrations, and architectural best practices.

Related posts and references:


About the authors

Apurwa Pawar

Apurwa Pawar

Apurwa is a Solutions Architect at AWS and a Data Analytics and AI enthusiast. She helps customers build their modern data strategy and cloud-native innovative solutions on AWS. She works with enterprise organizations across industries including healthcare, life sciences, financial services, and hospitality, partnering with engineering and business leadership to turn data into insight and action.

Sarika Subramaniam

Sarika Subramaniam

Sarika is a Solutions Architect at AWS, specializing in analytics and data platforms. She helps customers design scalable, secure, and cloud-based modern data architectures on AWS. She works with enterprise customers across industries, partnering with engineering teams to build innovative data solutions and drive business outcomes.

Building a Slack-powered AI development agent with Kiro CLI and headless authentication

Post Syndicated from Vishal Karlupia original https://aws.amazon.com/blogs/devops/building-a-slack-powered-ai-development-agent-with-kiro-cli-and-headless-authentication/

Every code review discussion, incident response thread, and standup happens in Slack. But when an engineer needs to analyze a service or debug a failing test, they leave Slack, open a terminal, navigate to the repository, run commands, and paste the output back. That round trip takes 30 seconds for someone who knows exactly where to look and 5 minutes for someone less familiar with the codebase. Across a team of 10 engineers doing this 15 times a day, that adds up to over 12 hours of lost engineering time per week.

This post walks through building a ChatOps integration that runs Kiro CLI from a Slack slash command. An engineer types /kiro analyze auth-service for memory leaks, and the results appear directly in the channel—no context switch required. The solution uses AWS Lambda, Amazon API Gateway, and AWS Secrets Manager, and it depends on Kiro CLI’s headless authentication to run without an interactive session.

In this post, you will learn how to:

  • Configure a Slack App with a slash command that triggers an AWS Lambda function
  • Authenticate Kiro CLI in a headless environment using API key-based authentication
  • Build and deploy a container image with Kiro CLI to Amazon Elastic Container Registry (Amazon ECR)
  • Deploy the full solution with AWS Serverless Application Model (AWS SAM)

Why headless authentication matters

A Slack slash command triggers a webhook. The webhook invokes a Lambda function. The Lambda function runs Kiro CLI. At no point in this chain is there a browser, a terminal, or a human session.

Without headless authentication, this architecture does not work. Kiro CLI would require an interactive login, and a Lambda function has no display and no way to complete an OAuth flow.

With an API key, Kiro CLI authenticates silently:

export KIRO_API_KEY=ksk_xxxxxxxxxxxxxxxxxxxxxxxxxxxxxxxx

kiro-cli chat --no-interactive "analyze auth-service for memory leaks"

The API key is stored in AWS Secrets Manager, fetched at runtime, and injected into the Lambda environment. The engineer in Slack never sees or manages the key.

Important: API key-based authentication is available for Kiro Pro, Pro+, and Power subscribers. If your subscription is managed by an administrator, your Kiro admin must enable API key authentication first. For details, see API key governance.

Architecture overview

architecture overview

The solution consists of two Lambda functions, an API Gateway endpoint, and AWS Secrets Manager. The request and response follow two separate paths:

  • Request path: Slack → API Gateway → Dispatcher Lambda → acknowledge back to Slack (under 3 seconds), then async invoke → Worker Lambda
  • Response path: Worker Lambda → Slack response_url (direct HTTPS POST, bypasses API Gateway)

Why two Lambda functions?

Slack requires a response within 3 seconds of a slash command. Kiro CLI analysis takes 10–60 seconds depending on the repository size and prompt complexity. The Dispatcher acknowledges the command immediately and invokes the Worker asynchronously. The Worker runs Kiro CLI and posts results back to Slack through the response_url provided in the original payload. This is a standard pattern for Slack integrations that perform long-running work.

A note on response_url limits: the webhook Slack provides in the slash command payload expires 30 minutes after the command is issued and accepts a maximum of 5 responses. The 10-minute Worker timeout and single response in this solution stay well inside both limits. If you raise the Lambda timeout beyond 30 minutes or add incremental progress updates, these POSTs begin to fail silently – switch to chat.postMessage with a bot token at that point.

Prerequisites

  • Before you begin, you need the following:
  • An AWS account with permissions to create Lambda functions, API Gateway, Amazon ECR repositories, Secrets Manager secrets, and IAM roles
  • An infrastructure-as-code tool for deploying serverless resources (this post uses AWS SAM CLI, but you can adapt the templates to AWS CDK, AWS CloudFormation, Terraform, or your preferred tool)
  • Finch or Docker installed for building container images
  • A Slack workspace where you have permission to create a Slack App
  • A Kiro Pro, Pro+, or Power subscription with API key authentication enabled

Step 1: Gather credentials

You need three credentials before deploying. Collect all of them first, then store them in Secrets Manager in Step 2.

Kiro API key

This authenticates Kiro CLI in headless mode.

  1. Sign in to app.kiro.dev
  2. Navigate to API Keys
  3. Create a new key named kiro-chatops
  4. Copy the key (starts with ksk_) – it is shown only once

get Kiro API key

Slack Signing Secret – This allows the Dispatcher to verify that incoming requests originate from Slack.

  1. Go to api.slack.com/apps and click Create New App → From scratch
  2. Name it Kiro Agent and select your workspace
  3. On the Basic Information page, scroll to App Credentials
  4. Copy the Signing Secret (32-character hex string)

create a slack app

Slack Bot Token – Optional

The Worker posts results using the response_url from the original slash command payload, which is a pre-authenticated webhook that does not require a bot token. Collect a bot token with the chat:write scope only if you extend the solution to post messages independently of a slash command response.

  1. In your Slack App settings, go to OAuth & Permissions
  2. Add the Bot Token Scope: chat:write
  3. Choose Install to Workspace and authorize
  4. Copy the Bot User OAuth Token (starts with xoxb-)

set up slack oauth token

While you are in the Slack App settings, also configure the slash command:

  1. Go to Slash Commands → Create New Command
  2. Set Command to /kiro
  3. Set Request URL to https://placeholder (update after deployment in Step 6)
  4. Set Short Description to Run Kiro-CLI development tasks
  5. Set Usage Hint to [analyze|review|debug|explain] <description>

define slack commands

Step 2: Store secrets in AWS Secrets Manager

Store each credential as a separate secret. The Lambda functions retrieve these at runtime using IAM-scoped access.

aws secretsmanager create-secret \
  --name kiro-chatops/kiro-api-key \
  --secret-string "<your-kiro-api-key>" \
  --region us-east-1

aws secretsmanager create-secret \
  --name kiro-chatops/slack-signing-secret \
  --secret-string "<your-signing-secret>" \
  --region us-east-1

aws secretsmanager create-secret \
  --name kiro-chatops/git-token \
  --secret-string "<your-github-pat>" \
  --region us-east-1

If your target repository is private, also store a GitHub Personal Access Token with repo scope. The Worker uses this token to clone the repository inside the Lambda execution environment.

Verify the secrets were created:

aws secretsmanager list-secrets \
  --filter Key="name",Values="kiro-chatops" \
  --query "SecretList[].Name" \
  --output table \
  --region us-east-1

Step 3: Build the Dispatcher Lambda

The Dispatcher has three responsibilities: verify that the request came from Slack, acknowledge the slash command within 3 seconds, and invoke the Worker asynchronously.

Request verification – Slack signs every request with HMAC-SHA256 using your app’s signing secret. The Dispatcher must validate this signature before processing payloads. The verification logic constructs a base string from the request timestamp and body, computes the HMAC, and compares it to the signature in the request header:

sig_basestring = f"v0:{timestamp}:{body}"
expected = "v0=" + hmac.new(
    signing_secret.encode(), sig_basestring.encode(), hashlib.sha256
).hexdigest()
return hmac.compare_digest(expected, signature)

Reject any request with a timestamp older than 5 minutes to prevent replay attacks. Normalize request headers to lowercase before reading them—API Gateway may preserve the original casing from the client.

Async handoff

After verifying the request, parse the slash command payload to extract text, user_name, and response_url. Then invoke the Worker Lambda with InvocationType="Event" (fire-and-forget) and immediately return an acknowledgment to Slack:

lambda_client.invoke(
   FunctionName=os.environ["WORKER_FUNCTION_NAME"],
    InvocationType="Event",
    Payload=json.dumps({
        "command_text": command_text,
        "user_name": user_name,
        "response_url": response_url,
    })
)

If the user sends /kiro with no arguments, return an ephemeral usage message with examples. The Dispatcher uses the standard Python 3.12 Lambda runtime and requires no container image.

Step 4: Build the Worker Lambda container image

The Worker runs Kiro CLI against a cloned repository and posts results to Slack. Because Kiro CLI depends on git, system libraries (NSS, X11, ALSA), and a binary that exceeds Lambda’s 250 MB layer limit, package the Worker as a container image.

Dockerfile structure

Start from the AWS Lambda Python 3.12 base image. Install git and the shared libraries that Kiro CLI requires, then install Kiro CLI itself:

FROM public.ecr.aws/lambda/python:3.12
RUN dnf install -y git unzip alsa-lib atk at-spi2-atk cups-libs \
    libdrm libXcomposite libXdamage libXrandr mesa-libgbm \
    pango nss nspr libXtst && dnf clean all
RUN curl -fsSL https://cli.kiro.dev/install | bash && \
    cp /root/.local/bin/kiro-cli* /usr/local/bin/ && \
    chmod +x /usr/local/bin/kiro-cli*
COPY index.py ${LAMBDA_TASK_ROOT}/
RUN pip install boto3 --target "${LAMBDA_TASK_ROOT}"
CMD ["index.handler"]

Two details matter here. First, copy the Kiro CLI binary to /usr/local/bin/ rather than leaving it in /root/.local/bin/—Lambda runs as a non-root user that cannot access /root/. Second, build with --platform linux/amd64 regardless of your local architecture, because Lambda defaults to x86_64.

Worker logic – The handler performs four steps:

  1. Fetch the Kiro API key (and optionally a Git token) from Secrets Manager
  2. Clone the repository to /tmp/repo using git clone --depth 1
  3. Run kiro-cli chat --no-interactive "<prompt>" with KIRO_API_KEY and HOME=/tmp set in the environment
  4. Post the output to Slack via the response_url

Setting HOME=/tmp is required because Kiro CLI writes a session database, and Lambda’s filesystem is read-only except for /tmp. Strip ANSI escape codes from the output before posting—Kiro CLI emits terminal colors that render as garbage in Slack.

The subprocess timeout should be shorter than the Lambda timeout to allow time for error handling and the Slack POST. Set the subprocess timeout explicitly to 540 seconds in the Worker code, rather than relying on the Lambda timeout alone. A 9-minute subprocess limit with a 10-minute Lambda timeout provides a 1-minute buffer.

Truncate output to 3,800 characters before posting. Slack’s message limit is 4,000 characters per block, and the surrounding formatting consumes part of that space.

Build and push to Amazon ECR

Clean up /tmp/repo at the end of every invocation. Lambda may reuse a warm execution environment, so anything left in /tmp persists into the next invocation. Removing the clone in a finally block helps prevent one user’s repository from leaking into a later request and keeps the 512 MB ephemeral storage from filling up across warm invocations.

AWS_ACCOUNT_ID=$(aws sts get-caller-identity --query Account --output text) 
AWS_REGION=us-east-1 
 # Create the ECR repository (first time only) 
aws ecr create-repository --repository-name kiro-worker --region $AWS_REGION 
 # Authenticate to ECR 
aws ecr get-login-password --region $AWS_REGION | \ 
  finch login --username AWS --password-stdin \ 
  $AWS_ACCOUNT_ID.dkr.ecr.$AWS_REGION.amazonaws.com 
 # Build for the correct architecture 
cd worker 
finch build --platform linux/amd64 -t kiro-worker:latest . 
 # Tag and push 
finch tag kiro-worker:latest \ 
  $AWS_ACCOUNT_ID.dkr.ecr.$AWS_REGION.amazonaws.com/kiro-worker:latest 
finch push \ 
  $AWS_ACCOUNT_ID.dkr.ecr.$AWS_REGION.amazonaws.com/kiro-worker:latest

Step 5: Deploy with AWS SAM

The SAM template defines both Lambda functions, the API Gateway endpoint, and the IAM policies. The Dispatcher uses a standard Python runtime. The Worker references the container image you pushed to Amazon ECR.

Key resource configuration:

Resource Runtime Timeout Memory Package type
Dispatcher Python 3.12 10 s 256 MB Zip
Worker Container 600 s (10 min) 1024 MB Image

Both functions use AWSSecretsManagerGetSecretValuePolicy scoped to the kiro-chatops/* secret prefix. The Dispatcher also gets LambdaInvokePolicy for the Worker function. Neither function has broader AWS permissions.

The SAM template accepts the ECR image URI as a parameter:

Parameters: 
  EcrImageUri: 
    Type: String 
    Description: ECR image URI for the Worker Lambda 
 
Resources: 
  WorkerFunction: 
    Type: AWS::Serverless::Function 
    Properties: 
      PackageType: Image 
      ImageUri: !Ref EcrImageUri 
      Timeout: 600 
      MemorySize: 1024

Deploy:

cd ..  # Back to the project root where template.yaml lives 
sam build 
sam deploy --guided \ 
  --stack-name kiro-chatops \ 
  --parameter-overrides \ 
    EcrImageUri=$AWS_ACCOUNT_ID.dkr.ecr.$AWS_REGION.amazonaws.com/kiro-worker:latest

SAM prompts you to confirm IAM role creation and acknowledge that the Dispatcher has no authentication (request verification happens in code via the Slack signing secret). After deployment completes, note the ApiEndpoint output value.

Step 6: Connect Slack to the endpoint

  1. Go to api.slack.com/apps and select your Kiro Agent app
  2. Navigate to Slash Commands and edit /kiro
  3. Replace the Request URL with the ApiEndpoint value from the SAM deployment output
  4. Choose Save

slack endpoint integration

Step 7: Test the integration

Test directly from Slack by typing in any channel where the app is installed:

test slack integration

/kiro analyze auth-service for memory leaks

Expected behavior:

  1. Slack immediately displays: “@yourname requested: analyze auth-service for memory leaks – Kiro is working on it…”
  2. After 15–60 seconds, the analysis results appear in the channel

expected Kiro agent behaviour

Kiro agent results

You can also invoke the Worker Lambda directly for testing without Slack:

aws lambda invoke \ 
  --function-name <WorkerFunctionName-from-SAM-output> \ 
  --invocation-type RequestResponse \ 
  --cli-binary-format raw-in-base64-out \ 
  --payload '{"command_text": "explain what this repo does", "user_name": "test", "response_url": "https://hooks.slack.com/YOUR/URL"}' \ 
  response.json

Sending /kiro with no arguments returns a usage help message.

Complete sample code can be found at aws-samples github repository – https://github.com/aws-samples/sample-kiro-chatops-slack-integration 

Practical slash command patterns

Once deployed, the value comes from the commands your team uses daily. These patterns map to real engineering workflows:

Category Example command
Code analysis /kiro analyze the payment module for error handling gaps
Code review /kiro review the last 3 commits on main for breaking changes
Debugging /kiro debug why the integration tests are failing
Knowledge /kiro explain how the authentication middleware works
Sprint support /kiro summarize all changes merged to main this week

The value compounds when results are visible to the entire channel. A junior engineer who might hesitate to open a CLI tool can type /kiro explain and get the same analysis and the rest of the team learns from it.

Extending the pattern

Multi-repository support – The basic implementation targets a single preconfigured repository. To support multiple repositories, parse a URL from the slash command text and clone it at runtime. This adds 5-15 seconds of latency and requires a Git token in Secrets Manager for private repositories.

Threaded responses – Post the acknowledgment as a channel message and the full results as a thread reply. This keeps the channel readable while preserving context for long analyses.

Approval workflows – For commands that modify code (for example, “create a PR that fixes this issue”), add a confirmation step. The Worker posts proposed changes with interactive buttons; the action executes only after explicit approval.

Audit logging – Log every invocation to Amazon DynamoDB: who ran it, what they asked, how long it took. This gives engineering leadership visibility into how the team uses AI-assisted development.

Constraints and trade-offs

Constraints:

  • Execution time – Lambda has a maximum 15-minute timeout. Complex analyses that exceed this will time out. The Worker is set to a 10-minute timeout with a 9-minute subprocess limit.
  • Ephemeral storage – The /tmp volume defaults to 512 MB. A shallow clone (–depth 1) strips Git history, but the working tree alone can exceed this for large monorepos or repositories with binary assets. You can increase ephemeral storage up to 10 GB by setting EphemeralStorage in the SAM template, or scope the clone to a subdirectory with –sparse-checkout for oversized repositories.
  • Slack message size – Each Block Kit text block is limited to 3,000 characters. Long outputs are truncated, with full results available in Amazon CloudWatch Logs.
  • Package size – Kiro CLI with its dependencies exceeds Lambda’s 250 MB layer limit. A container image (up to 10 GB) is required.

Trade-offs:

  • Lambda vs. Amazon ECS on AWS Fargate – Lambda is simpler and cheaper at the low-volume, bursty usage typical of a single team. Model your own break-even point with the AWS Pricing Calculator, since it shifts with average analysis duration and memory size. For high-volume teams, Fargate with a persistent container avoids cold starts. Start with Lambda and migrate if usage grows.
  • Public channel vs. ephemeral – Results are posted as in_channel (visible to everyone). For sensitive analyses, change response_type to ephemeral. Consider making this configurable per command.
  • Cost – Lambda compute is approximately $0.01-$0.05 per 10-minute execution at 1024 MB. The primary cost factor is Kiro CLI usage based on your subscription tier.

Security considerations

  • Request verification — The Dispatcher validates every request using HMAC-SHA256 with the Slack signing secret. Requests with timestamps older than 5 minutes are rejected.
  • Secrets management — Credentials are never hardcoded or stored in environment variables. They are fetched at runtime from Secrets Manager with IAM-scoped access.
  • Least-privilege IAM — The Dispatcher can only invoke the Worker and read secrets. The Worker can only read secrets. Neither has broader AWS permissions.
  • Audit trail — CloudWatch Logs capture every invocation including the command text, user, and Kiro CLI output. Enable AWS CloudTrail for API Gateway to track all incoming requests.

Cleaning up

To avoid ongoing charges, remove all resources when you are done testing:

sam delete --stack-name kiro-chatops 
 aws ecr delete-repository \ 
  --repository-name kiro-worker --force --region us-east-1 
 aws secretsmanager delete-secret \ 
  --secret-id kiro-chatops/kiro-api-key \ 
  --force-delete-without-recovery --region us-east-1 
aws secretsmanager delete-secret \ 
  --secret-id kiro-chatops/slack-signing-secret \ 
  --force-delete-without-recovery --region us-east-1 
aws secretsmanager delete-secret \ 
  --secret-id kiro-chatops/git-token \ 
  --force-delete-without-recovery --region us-east-1

To remove the Slack App, go to api.slack.com/apps, select Kiro Agent, and click Delete App.

Conclusion

This post demonstrated integrating Kiro CLI into Slack workflows using headless authentication, serverless functions, and secure credential management. The Dispatcher acknowledges instantly, the Worker runs Kiro CLI headless, and results appear in the channel where the team already communicates.

The architecture is deliberately simple – a slash command, an async handoff, and a container that runs a CLI tool. You can extend it with multi-repo support, threaded responses, or approval workflows as your team’s usage patterns emerge.

Start with a single slash command in one channel. The commands your team uses most will tell you where the friction was hiding.


About the authors

Vishal Karlupia
Vishal Karlupia is a Senior Technical Account Manager/Lead at Amazon Web Services, Chicago. He specializes in generative AI applications and helps customers build and scale their AI/ML workloads on AWS. Outside of work, he enjoys being outdoors and keeping bonfires alive.

Devi Nair
Devi Nair is a Technical Account Manager at Amazon Web Services, providing strategic guidance to enterprise customers as they build, operate, and optimize their workloads on AWS. She focuses on aligning cloud solutions with business objectives to drive long-term success and innovation.

Joanan Mpo
Joanan Mpo is a Technical Account Manager at AWS based in Montreal, Canada. He is helping enterprise financial services customers navigate the complexity of cloud at scale, bridging the gap between engineering teams and business outcomes.

Srinivas Ganapathi
Srinivas Ganapathi is a Principal Technical Account Manager at Amazon Web Services. He is based in Toronto, Canada, and works with games customers to run efficient workloads on AWS..

Accelerating development workflows with Kiro CLI as a Pre-Commit and Git Hook Agent

Post Syndicated from Vishal Karlupia original https://aws.amazon.com/blogs/devops/accelerating-development-workflows-with-kiro-cli-as-a-pre-commit-and-git-hook-agent/

Code review feedback is most valuable when it arrives early. A security vulnerability caught in a pull request saves hours. The same vulnerability caught in production costs days. But what if you could catch it before the code even leaves the developer’s machine – at the time of git commit?

Git hooks run automatically at specific points in the Git workflow: before a commit, before a push, after a merge. They execute locally, on the developer’s machine, with no CI/CD pipeline involved. The problem is that Git hooks run non-interactively. There is no browser or a terminal session waiting for input. Traditional Kiro CLI requires browser-based login, which makes it unusable in a hook.

Headless authentication changes this. With KIRO_API_KEY set as an environment variable, Kiro CLI runs in any non-interactive context, including Git hooks. This post shows how to wire Kiro CLI into your local Git workflow, so every commit and every push gets AI-powered analysis before it reaches your repository.

Why headless authentication matters here

Git hooks are scripts that Git executes automatically. They have no UI and are unable to open a browser or prompt for credentials. Running silently in the background, they either succeed with exit 0 or blocking the operation with exit non-zero.

# Added to your shell profile (~/.bashrc, ~/.zshrc)

export KIRO_API_KEY=your_api_key_here

The API key is inherited by child processes including Git hooks. If the key isn’t set, the hook skips the execution and fails gracefully rather than blocking commits.

Note on data privacy: These hooks send your staged code diffs to the Kiro API for analysis. Review your organization’s policies on sending source code to APIs before adopting this workflow. For sensitive repositories, consult your security team.

What this enables

  • Pre-commit hook: Scans your staged files for security issues, code smells and style violations. Problems get caught before the commit exists.
  • Commit-msg hook: Enforces your team’s commit message format (Conventional commits, Jira refs etc). Malformed messages get rejected instantly instead of cluttering the log.
  • Pre-push hook: Runs a full review across all commits you’re about to push. This is your last gate before CI picks it up – cheaper to fix it here than to wait for a pipeline failure.
  • Post-merge hook: After pulling changes, it analyzes incoming changes and flags anything that might conflict with your local work.

Prerequisites

  • Kiro CLI installed: curl -fsSL https://kiro.dev/install.sh | bash
  • Kiro API key : Generated from app.kiro.dev (Account → Settings → API Keys) and exported in your shell profile

    Note – Access to Kiro API depends on your organizations policies. Check your team’s configuration Or refer to API Key governance docs for details.

set up Kiro API key

  • Git repository: Any repository where you want local analysis

Verify your setup:

export KIRO_API_KEY=your_api_key_here

kiro-cli whoami

Expected output should confirm you are authenticated. If you see an error, verify your API key is valid and your network allows outbound connections to the Kiro API.

verify your identity

Try it yourself: scratch repo setup

To test the hooks without affecting an existing project, create a throwaway repository:

mkdir kiro-hooks-demo
cd kiro-hooks-demo
git init
git commit --allow-empty -m "feat: initial commit"

All hook examples below work in this scratch repo. For the pre-push hook, you will also need a remote – either create a throwaway repository on GitHub/GitLab or add a bare local remote:

# Option A: Use a throwaway GitHub/GitLab repo
git remote add origin [email protected]:youruser/kiro-hooks-demo.git

# Option B: Use a local bare repo (no network needed)
git init --bare /tmp/kiro-hooks-demo-remote.git
git remote add origin /tmp/kiro-hooks-demo-remote.git

Hook 1: Pre-commit – Catch issues before they become commits

The pre-commit hook runs after you type git commit but before Git creates the commit object. If the hook exits with a non-zero code, the commit is aborted.

Create .git/hooks/pre-commit:

#!/bin/bash
set -e
# Skip hook if KIRO_API_KEY is not set
if [ -z "$KIRO_API_KEY" ]; then
  echo "⚠  KIRO_API_KEY not set. Skipping Kiro pre-commit analysis."
  exit 0
fi

# Get list of staged files (only added, modified, or renamed)
STAGED_FILES=$(git diff --cached --name-only --diff-filter=AMR)

if [ -z "$STAGED_FILES" ]; then
  echo "No staged files to analyze."
  exit 0
fi

# Get the actual diff content for context
DIFF_CONTENT=$(git diff --cached)

echo "???? Kiro CLI: Analyzing $(echo "$STAGED_FILES" | wc -l | tr -d ' ') staged file(s)..."

# Run Kiro CLI analysis on staged changes (timeout after 30s to avoid hanging offline)
RESULT=$(timeout 30 kiro-cli chat --no-interactive "You are a pre-commit code reviewer. Analyze ONLY the following staged changes for critical issues that should block this commit.
STAGED FILES:$STAGED_FILES

DIFF:$DIFF_CONTENT

Check for:
1. SECURITY: Hardcoded secrets, API keys, passwords, tokens in the diff
2. SECURITY: SQL injection, XSS, or command injection vulnerabilities
3. BUGS: Obvious logic errors, null pointer risks, off-by-one errors
4. PERFORMANCE: Accidentally committed debug code, console.log statements, sleep calls

Rules:
- Only flag issues that are clearly problems. Do not flag style preferences.
- If you find a SECURITY issue, output a line starting with BLOCK: followed by the reason.
- If you find a BUG or PERFORMANCE issue, output a line starting with WARN: followed by the reason.
- If everything looks clean, output a single line: PASS

Be concise. This runs on every commit - speed matters." 2>&1) || {
  EXIT_CODE=$?
  if [ $EXIT_CODE -eq 124 ]; then
    echo "⚠  Kiro CLI timed out (network issue?). Allowing commit."
    exit 0
  fi
  echo "⚠  Kiro CLI returned an error. Allowing commit."
  exit 0
}

echo "$RESULT"

# Block commit if BLOCK issues found
if echo "$RESULT" | grep -q "BLOCK:"; then
  echo ""
  echo "❌ Commit blocked by Kiro CLI. Fix the issues above and try again."
  echo "   To bypass this hook: git commit --no-verify"
  exit 1
fi

# Warn but allow commit for non-blocking issues
if echo "$RESULT" | grep -q "WARN:"; then
  echo ""
  echo "⚠  Warnings found. Commit will proceed. Consider fixing before push."
fi

echo "✅ Kiro CLI pre-commit check passed."
exit 0

Make it executable:

chmod +x .git/hooks/pre-commit

Test it:

# Test 1: Commit a hardcoded secret (should be blocked)
echo 'AWS_SECRET_KEY = "AKIAIOSFODNN7EXAMPLE"' >> config.py
git add config.py
git commit -m "feat: add config"
# Expected: ❌ Commit blocked by Kiro CLI

# Clean up test file
git reset HEAD config.py && rm config.py

# Test 2: Commit clean code (should pass)
echo 'def hello(): return "world"' >> app.py
git add app.py
git commit -m "feat: add hello function"
# Expected: ✅ Kiro CLI pre-commit check passed

# Test 3: Bypass when needed
echo 'placeholder' >> temp.txt && git add temp.txt
git commit --no-verify -m "chore: emergency fix"
# Expected: Hook skipped entirely

# Clean up
rm -f temp.txt

Test 1 – Stages a file with hard-coded AWS secret key. Kiro CLI detects the credential and blocks the commit with BLOCK:, preventing the secret from entering git history.

Test 1 - Kiro blocks the commit

Test 2 – Stages a simple, clean Python function. Kiro CLI finds no issues and outputs PASS, allowing commit to proceed normally.

Test 2 - Kiro allows the commit

Test 3 – Uses git’s –no-verify flag to skip all hooks entirely. Demonstrates the escape hatch when developers need to commit without waiting for analysis (e.g, emergency fixes).

Test 3 - skip all git hooks

Trade-offs:

Speed vs. depth: The prompt is deliberately focused on critical issues only. A comprehensive review would take 15-30 seconds per commit – too slow for developer flow. This hook targets 3-8 seconds

False positives: Blocking commits on false positives destroys developer trust. The prompt is conservative – only BLOCK for clear security issues, WARN for everything else

Bypass escape hatch: git commit –no-verify skips all hooks. This is intentional – developers must never feel trapped. Document when bypassing is acceptable (e.g., emergency hotfixes)

Hook 2: Commit-msg – Enforce commit message conventions

The commit-msg hook runs after the developer writes their commit message. It receives the path to the temporary file containing the message.

Create .git/hooks/commit-msg:

#!/bin/bash

set -e
COMMIT_MSG_FILE="$1"
COMMIT_MSG=$(cat "$COMMIT_MSG_FILE")

# Skip hook if KIRO_API_KEY is not set
if [ -z "$KIRO_API_KEY" ]; then
exit 0
fi

# Skip for merge commits and fixup commits
if echo "$COMMIT_MSG" | grep -qE "^(Merge|fixup!|squash!)"; then
exit 0
fi

echo "???? Kiro CLI: Validating commit message..."

RESULT=$(timeout 15 kiro-cli chat --no-interactive "Validate this commit message against Conventional Commits format.
COMMIT MESSAGE:$COMMIT_MSG

Rules:1. Must start with a type: feat, fix, docs, style, refactor, perf, test, build, ci, chore, revert2. Type may have an optional scope in parentheses: feat(auth), fix(api)3. Must have a colon and space after type/scope: feat: or feat(auth):4. Description must start with lowercase letter5. Description must not end with a period6. Subject line must be under 72 characters7. If a Jira ticket pattern exists (e.g., PROJ-123), that is acceptable in the scope or body
If the message is valid, output exactly: VALIDIf the message is invalid, output: INVALID: followed by what is wrong and a corrected example.
Be concise. One line for valid, two lines max for invalid." 2>&1) || {
echo "⚠  Kiro CLI unavailable. Skipping commit message validation."
exit 0
}

echo "$RESULT"

if echo "$RESULT" | grep -q "INVALID:"; then
echo ""
echo "❌ Commit message does not follow conventions."
echo "   Examples: feat: add login page"
echo "             fix(auth): resolve token expiry bug"
echo "   To bypass: git commit --no-verify"
exit 1
fi

exit 0

Make it executable:

chmod +x .git/hooks/commit-msg

Test it:

# Test 1: Invalid message (should be blocked)
echo "hello" > test.txt && git add test.txt

git commit -m "updated stuff"
# Expected: ❌ Commit message does not follow conventions

# Test 2: Valid message (should pass)
git commit -m "feat: add user authentication module"
# Expected: passes

# Test 3: Valid with scope
echo "world" >> test.txt && git add test.txt

git commit -m "fix(api): resolve null pointer in user handler"
# Expected: passes

Test 1 – Commits with a non-conventional message (“Updated Stuff”). Kiro CLI detects it lacks required description format and blocks the commit.

Test 1 - Kiro blocks vague commit message

Test 2 – Commits with a properly formatted message. Kiro validates it against conventional commit rules and allows the commit.

Test 2 - Kiro checks rules and allows commit

Test 3 – Commits with a scoped conventional message (“fix(api): resolve null pointer in user handler”). Kiro confirms the “type(scope): description” format is valid and allows the commit.

Test 3 - Kiro validates format and allows commit

Hook 3: Pre-push – Comprehensive review before code leaves your machine

The pre-push hook runs after git push is called but before data is transferred to the remote. This is the last checkpoint before your code enters the shared repository.

Note: To test this hook, you need a remote configured. See the “Try it yourself” section above for setup options.

Create .git/hooks/pre-push:

#!/bin/bash

set -e
# Skip hook if KIRO_API_KEY is not set
if [ -z "$KIRO_API_KEY" ]; then
echo "⚠  KIRO_API_KEY not set. Skipping Kiro pre-push analysis."
exit 0
fi

# Read push information from stdin
while read LOCAL_REF LOCAL_SHA REMOTE_REF REMOTE_SHA; do
# Skip delete pushes
if [ "$LOCAL_SHA" = "0000000000000000000000000000000000000000" ]; then
continue

fi

# Determine the range of commits being pushed
if [ "$REMOTE_SHA" = "0000000000000000000000000000000000000000" ]; then
# New branch - analyze all commits not yet on any remote
COMMITS=$(git log --oneline "$LOCAL_SHA" --not --remotes 2>/dev/null | head -20)
else
# Existing branch - analyze only new commits
COMMIT_RANGE="$REMOTE_SHA..$LOCAL_SHA"
COMMITS=$(git log --oneline "$COMMIT_RANGE" 2>/dev/null | head -20)
fi

if [ -z "$COMMITS" ]; then
echo "No new commits to analyze."
exit 0
fi

COMMIT_COUNT=$(echo "$COMMITS" | wc -l | tr -d ' ')
echo "???? Kiro CLI: Reviewing $COMMIT_COUNT commit(s) before push..."

# Get the diff and changed files
if [ "$REMOTE_SHA" = "0000000000000000000000000000000000000000" ]; then
DIFF=$(git diff --stat HEAD~"$COMMIT_COUNT" "$LOCAL_SHA" 2>/dev/null || git show --stat "$LOCAL_SHA")
CHANGED_FILES=$(git diff --name-only HEAD~"$COMMIT_COUNT" "$LOCAL_SHA" 2>/dev/null || echo "Unable to determine changed files")
else
DIFF=$(git diff --stat "$REMOTE_SHA" "$LOCAL_SHA" 2>/dev/null)
CHANGED_FILES=$(git diff --name-only "$REMOTE_SHA" "$LOCAL_SHA" 2>/dev/null)
fi

RESULT=$(timeout 60 kiro-cli chat --no-interactive "You are a pre-push code reviewer. These commits are about to be pushed to the remote repository. Perform a comprehensive review.
COMMITS:$COMMITS

CHANGED FILES:$CHANGED_FILES

DIFF STATS:$DIFF

Check for:1. SECURITY: Any secrets, credentials, or API keys in the commits2. SECURITY: Vulnerability patterns (injection, XSS, insecure deserialization)3. QUALITY: Test files included for new functionality4. QUALITY: Large files or binary files that should not be in the repo5. ARCHITECTURE: Breaking changes that should be documented6. DEPENDENCIES: New dependencies added - any known vulnerabilities
If you find a critical SECURITY issue, output: BLOCK: followed by the reason.If you find quality or architecture concerns, output: WARN: followed by the reason.If everything looks good, output: PASS
Provide a brief summary (3-5 lines max). Speed matters." 2>&amp;1) || {
EXIT_CODE=$?
if [ $EXIT_CODE -eq 124 ]; then
echo "⚠  Kiro CLI timed out. Allowing push."
exit 0
fi
echo "⚠  Kiro CLI returned an error. Allowing push."
exit 0
}

echo "$RESULT"

if echo "$RESULT" | grep -q "BLOCK:"; then
echo ""
echo "❌ Push blocked by Kiro CLI. Fix the issues above and try again."
echo "   To bypass: git push --no-verify"
exit 1
fi

if echo "$RESULT" | grep -q "WARN:"; then
echo ""
echo "⚠  Warnings found. Push will proceed. Consider addressing before PR."
fi

done

echo "✅ Kiro CLI pre-push check passed."
exit 0

Make it executable:

chmod +x .git/hooks/pre-push

Test it:

# Test 1: Push commits with a secret (should be blocked)
echo 'DB_PASSWORD="supersecret123"' >> config.env

git add config.envgit commit --no-verify -m "chore: add config"
git push origin main

# Expected: ❌ Push blocked by Kiro CLI

# Test 2: Push clean commits (should pass)
git reset --hard HEAD~1echo 'DB_PASSWORD=${DB_PASSWORD}' >> config.env

git add config.env

git commit -m "chore: add config template with env var reference"
git push origin main

# Expected: ✅ Kiro-CLI pre-push check passed

Test 1 – Commits a file containing hard coded database password and attempts to push. Kiro CLI performs a review of the outgoing commit, detects a plaintext credential in config.env file and blocks the push before the secret reaches remote repository.

Test 1 - Kiro blocks hard coded credentials

Test 2 – Commits a config template using and environment variable reference “${DATABASE_URL}” instead of real secret. Kiro CLI reviews the commit, confirms no hardcoded credentials are present and allows the commit to proceed.

Test 2 - Kiro allows config push

Trade-off:

The pre-push hook is more thorough than pre-commit because it reviews all commits being pushed at once. This means it takes longer (10-20 seconds) but runs less frequently. Developers push less often than they commit, so this is an acceptable trade-off.

Automating hook installation across your team

Git hooks live in .git/hooks/, which is not tracked by Git. To share hooks across your team, use one of these approaches:

Approach A – Shared hooks directory (recommended)

Store hooks in a tracked directory and configure Git to use it:

# Create a hooks directory in your repo
mkdir -p .githooks
# Copy your hooks there
cp .git/hooks/pre-commit .githooks/pre-commitcp .git/hooks/commit-msg .githooks/commit-msgcp .git/hooks/pre-push .githooks/pre-push
# Commit the hooks
git add .githooks/git commit -m "chore: add Kiro-CLI git hooks for local code analysis"

Each developer runs once after cloning:

git config core.hooksPath .githooks

To automate this, add it to your project’s setup script or Makefile:

# Makefilesetup:    @echo "Configuring git hooks..."    git config core.hooksPath .githooks    @echo "Verifying Kiro CLI..."    @kiro-cli whoami || echo "⚠  Set KIRO_API_KEY in your shell profile"    @echo "✅ Setup complete"

Approach B – Install script

Create a scripts/install-hooks.sh that developers run once:

#!/bin/bashset -e
echo "Installing Kiro CLI git hooks..."

# Check prerequisites
if ! command -v kiro-cli &> /dev/null; then
echo "Installing Kiro-CLI..."
curl -fsSL https://kiro.dev/install.sh | bash  export PATH="$HOME/.kiro/bin:$PATH"
fi

if [ -z "$KIRO_API_KEY" ]; then
echo ""
echo "⚠  KIRO_API_KEY is not set."
echo "   1. Generate a key at https://app.kiro.dev (Account → Settings → API Keys)"
echo "   2. Add to your shell profile:"
echo "      echo 'export KIRO_API_KEY=your_key_here' >> ~/.zshrc"
echo "   3. Restart your terminal or run: source ~/.zshrc"
echo ""
echo "Hooks installed but will be skipped until KIRO_API_KEY is set."
fi

# Configure hooks path
git config core.hooksPath .githooksecho "✅ Git hooks configured. Kiro CLI will analyze commits and pushes."

Approach C – Pre-commit framework integration

If your team already uses the pre-commit framework, create a .pre-commit-config.yaml:

repos:
- repo: local
hooks:
- id: kiro-security-check
name: Kiro-CLI Security Check
entry: bash -c '
if [ -z "$KIRO_API_KEY" ]; then exit 0; fi
STAGED=$(git diff --cached --name-only --diff-filter=AMR)
if [ -z "$STAGED" ]; then exit 0; fi
DIFF=$(git diff --cached)
RESULT=$(timeout 30 kiro-cli chat --no-interactive "Analyze these staged changes for hardcoded secrets, credentials, and security vulnerabilities ONLY. Files: $STAGED. Diff: $DIFF. Output BLOCK: if critical security issue found, otherwise PASS." 2>&1) || exit 0
echo "$RESULT"
if echo "$RESULT" | grep -q "BLOCK:"; then exit 1; fi
'        language: system        stages: [commit]        pass_filenames: false
- id: kiro-commit-msg        name: Kiro-CLI Commit Message Check        entry: bash -c '
if [ -z "$KIRO_API_KEY" ]; then exit 0; fi
MSG=$(cat "$1")
if echo "$MSG" | grep -qE "^(Merge|fixup!|squash!)"; then exit 0; fi
RESULT=$(timeout 15 kiro-cli chat --no-interactive "Is this commit message valid Conventional Commits format? Message: $MSG. Output VALID or INVALID: reason." 2>&1) || exit 0
echo "$RESULT"
if echo "$RESULT" | grep -q "INVALID:"; then exit 1; fi
'
language: system
stages: [commit-msg]
pass_filenames: true

Constraints, trade-offs, and assumptions

Constraints:

  • Git hooks run locally – they depend on the developer having Kiro CLI installed and KIRO_API_KEY set
  • Hooks add latency to git commit and git push operations (3-8 seconds for pre-commit, 10-20 seconds for pre-push)
  • --no-verify bypasses all hooks – this is a native Git feature

Trade-offs:

  • Speed vs. thoroughness: Pre-commit checks only critical issues (secrets, obvious bugs) to stay under 8 seconds. Pre-push does a broader review because it runs less frequently.
  • Blocking vs. warning: Only security issues should block commits – everything else warns – because overly aggressive blocking erodes developer trust and leads to permanent bypasses.
  • Local vs. CI/CD: Git hooks complement CI/CD, they do not replace it. CI/CD runs in a controlled environment with full test suites. Hooks provide fast, early feedback on the developer’s machine.
  • Team adoption: Hooks are opt-in per developer (they must set KIRO_API_KEY). This is intentional – forcing hooks on developers who don’t want them creates resentment.
  • Network dependency: Hooks require internet connectivity. The timeout wrapper ensures they fail gracefully when offline rather than blocking commits indefinitely

Assumptions:

  • Developers have Kiro CLI installed locally (curl -fsSL https://kiro.dev/install.sh | bash)
  • KIRO_API_KEY is exported in the developer’s shell profile
  • The repository uses a branching strategy where developers commit to feature branches and push to remote

Measuring impact

Track these metrics before and after adopting Kiro CLI git hooks:

  • PR review cycle time: Measure time from PR open to first approval. If hooks are doing their job, reviewers spend less time on nits and more on logic, shortening the feedback loop.
  • CI/CD failure rate: Track pipeline failures caused by code quality issues that hooks would have caught (lint errors, formatting, missing tests).
  • Developer satisfaction: Survey developers after 2 weeks. Key question: “Do the hooks save you time or slow you down?”
  • Bypass rate: Monitor how often –no-verify is used. A high bypass rate signals the hooks are too aggressive or too slow

Cleanup

To remove the hooks and test artifacts:

# Reset hooks path to default
git config --unset core.hooksPath

# Or remove individual hooks
rm .git/hooks/pre-commitrm .git/hooks/commit-msgrm .git/hooks/pre-push

# If using the scratch repo from "Try it yourself"
cd .. && rm -rf kiro-hooks-demorm -rf /tmp/kiro-hooks-demo-remote.git

Conclusion

Headless authentication makes Kiro CLI available in contexts where no browser exists and Git hooks are one of the most valuable of those contexts.

A hardcoded secret caught at git commit takes 10 seconds to fix versus minutes in CI/CD or days in a security audit – start with the pre-commit hook as the highest-value, lowest-friction entry point, and share hooks across your team to standardize developer workflows.


Vishal Karlupia
Vishal Karlupia is a Senior Technical Account Manager/Lead at Amazon Web Services, Chicago. He specializes in generative AI applications and helps customers build and scale their AI/ML workloads on AWS. Outside of work, he enjoys being outdoors and keeping bonfires alive.

Anil Machavaram
Anil Machavaram is a Senior Technical Account Manager at AWS Enterprise Support with close to two decades of experience. He works closely with Financial Services Industry (FSI) customers, helping them design resilient, secure and efficient cloud environments while navigating complex customer challenges and large-scale infrastructure migrations.

Srinivas Ganapathi
Srinivas Ganapathi is a Principal Technical Account Manager at Amazon Web Services. He is based in Toronto, Canada, and works with games customers to run efficient workloads on AWS..

Frozen package management for air-gapped RHEL-family AMIs

Post Syndicated from Anand Krishna Varanasi original https://aws.amazon.com/blogs/compute/frozen-package-management-for-air-gapped-rhel-family-amis/

If you run a regulated, air-gapped compute fleet on RHEL-family instances, you have probably felt three requirements pulling against each other. Your organization must configure the network to remove internet access from the instances. Your team must review and approve new packages or version upgrades before you adopt them. Your team removes public repository definitions, restricts network paths, and configures instances to use only the internal repository your team has approved. Teams in chip design, finance, healthcare, defense, and the public sector often face this combination while still needing operating system updates.

This post describes a two-account pattern that separates the connected package-ingestion path from the air-gapped fleet. You create an authorized initial baseline and approve later changes to form a versioned package snapshot in Amazon Simple Storage Service (Amazon S3). EC2 Image Builder uses the frozen snapshot to build Amazon Machine Images (AMIs). Your team configures AWS Systems Manager Patch Manager to patch the instances your organization runs from the same internal package source.

The accompanying reference implementation demonstrates the pattern for RPM-based RHEL-family systems (AlmaLinux for example). It is a reference, not a substitute for distribution of licensing, vulnerability analysis, testing, or an organization’s change-management process.

The challenge: Getting packages into an air-gapped approval-gated fleet

Common delivery models each assume something an air-gapped fleet might not provide:

  • Red Hat Update Infrastructure (RHUI) expects each instance to reach the service. A fleet with no internet egress needs a different content path.
  • Red Hat Satellite supports disconnected content management, but it is a separate product and operational footprint. Teams that need a custom package-level approval workflow must integrate that workflow with their content-management process.
  • The Red Hat CDN requires a connected, entitled content-management path. Centralizing that path changes the network architecture, not the customer’s Red Hat subscription obligations.

The objective is not to replace these products universally. It is to show a serverless AWS pattern for teams that need an authorized repository baseline, explicit approval for later package changes, and a fleet with no public package source.

How the pattern works

The pattern combines three controls:

  1. A frozen package repository on Amazon S3: The pattern stores a deployment-authorized baseline and subsequent approved package changes in versioned, per-OS repository prefixes. The repository manifest records the package inventory for each state.
  2. EC2 Image Builder Orchestration builds AMIs from that repository: The build helps remove upstream repository definitions and configures the internal frozen mirror to be used for all package operations.
  3. The launched fleet has no internet egress: The dnf operations are configured to resolve the internal mirror. Patch Manager uses the same repository source, so image builds and in-place patching draw from one frozen snapshot.

Choosing the upstream source

Choose one package lineage end to end. The parent AMI, repository content, and trusted signing keys must belong to that same lineage.

The reference implementation defaults to AlmaLinux vault content plus EPEL and an AlmaLinux parent AMI. The AlmaLinux OS Foundation states that AlmaLinux aims for binary and application binary interface (ABI) compatibility with RHEL. This is an AlmaLinux compatibility goal, not a Red Hat certification, and it does not make repository mixing a supported practice.

For genuine RHEL systems, use a Red Hat parent AMI, entitled Red Hat repositories, and Red Hat signing keys. A connected content-management host can retrieve content for the isolated environment. This centralizes the network path but does not reduce or change the customer’s Red Hat subscription obligations. Confirm those obligations against the applicable Red Hat agreement.

Do not pair AlmaLinux repositories with genuine RHEL hosts, or Red Hat repositories with AlmaLinux hosts. Mixed-vendor package lineages can create support, stability, and maintainability problems even when the RPMs appear mechanically compatible.

Architecture and workflow

The account boundary provides a primary security boundary for this architecture. The following diagram shows the connected Distribution account, the read-only Workload account, and an example cross-Region layout.

Two-account architecture showing the connected Distribution account with the control plane and internet path, and the air-gapped read-only Workload account, spanning two Regions

Figure 1: Two-account, cross-Region architecture separating the connected Distribution account from the air-gapped Workload account

The Distribution account owns the writable control plane and the only internet path. It runs Amazon EventBridge, three AWS Lambda functions, Amazon DynamoDB, Amazon Simple Notification Service (Amazon SNS), and the AWS Fargate sync task. It also owns the frozen S3 repository and its AWS Key Management Service (AWS KMS) key.

The Workload account is air-gapped and read-only with respect to the repository. It runs the internal HTTPS mirror, EC2 Image Builder, Patch Manager, and the compute fleet. Its mirror task role can read and decrypt frozen content but cannot write it.

The sample repository places the Distribution control plane in US East (N. Virginia), the frozen store in US West (Oregon), and the Workload resources in US West (Oregon) to demonstrate API-only cross-account and cross-Region operation. This Region split is not required. In most deployments, place the Distribution control plane and frozen store in the same Region unless data residency, disaster recovery, or an existing regional footprint justifies the additional latency, transfer cost, and KMS policy complexity.

The two accounts do not need Amazon Virtual Private Cloud (VPC) peering or a transit gateway. Cross-account access uses S3, KMS, and IAM policies. The VPC address ranges can overlap because no VPC-to-VPC route is required.

Package baseline and scheduled upgrade workflow

Before the scheduled workflow begins, your organization must authorize and run a full sync to establish the initial repository baseline. This bootstrap does not provide package-by-package approval. If your organization requires individual approval for every initial RPM, your team should generate and review the baseline manifest before promotion instead of relying solely on deployment authorization.

After the baseline, the detector runs on a customer-defined schedule. The reference implementation defaults to monthly. The following diagram shows the bootstrap distinction and the selective approval flow.

Workflow diagram distinguishing the initial baseline bootstrap sync from the recurring detect, request approval, review, record, selective sync, and manifest update steps

Figure 2: Package baseline bootstrap and the scheduled selective approval workflow

  1. Detect. Amazon EventBridge invokes the detector Lambda function on the configured schedule. The detector compares upstream repository metadata with manifest.json, which records the current frozen inventory. It classifies a newer version as an upgrade and an absent package as new.
  2. Request approval. The detector writes candidates to S3, creates a KMS-protected review token carrying the request ID and expiry, and is designed to send a review link through SNS. The detector can use kms:Encrypt but not kms:Decrypt.
  3. Review. A human opens the review page through an Amazon API Gateway HTTP API, reviews the proposed package versions, and chooses which changes to approve. The approver can use kms:Decrypt but not kms:Encrypt.
  4. Record and start. A conditional DynamoDB update changes a request from pending to approved only once. The approver then starts the Fargate sync task and passes the request ID.
  5. Selective sync. The task reads the approved package list, downloads those package versions, is designed to perform verification checks, and regenerates repository metadata.
  6. Update the manifest. When the task stops, Amazon EventBridge invokes the manifest-updater Lambda function. It archives the outgoing manifest and records the resulting repository inventory.

The approval decision controls adoption. It does not prove that package code is safe. Advisory review, vulnerability scanning, testing, and staged rollout remain in separate controls.

Evidence from the approval workflow

The token ties a review action to a specific request and expiry. Separating kms:Encrypt from kms:Decrypt prevents either Lambda function from performing both token roles. The conditional DynamoDB write makes the approval transition single-use.

DynamoDB records request state, AWS CloudTrail records control-plane API activity, and manifest history records repository inventory changes. These service records can feed the organization’s existing audit and evidence-management workflow. Object-level S3 access auditing requires CloudTrail S3 data events. KMS activity alone is not a substitute for those events.

The frozen package repository on Amazon S3

The following diagram shows the per-OS, per-component prefix layout, and manifest objects.

Amazon S3 prefix layout with one prefix per operating system version, each holding BaseOS, AppStream, and EPEL components with Packages and repodata trees plus manifest objects

Figure 3: Per-OS, per-component prefix layout of the frozen repository on Amazon S3

Each pinned operating system version receives its own prefix. Repository components such as BaseOS, AppStream, and EPEL contain Packages/ and repodata/ trees. manifest.json records the active inventory, and archived manifests preserve historical evidence and comparison points.

Your organization configures the bucket with versioning and SSE-KMS. Public RPM content does not require a customer-managed KMS key for confidentiality, so your organization could instead configure SSE-S3 for encryption at rest. However, SSE-S3 would remove the separate cross-account authorization control provided by the customer-managed KMS key policy. The customer managed key is used here for explicit cross-account key-policy control and revocation, and the manifests reveal the fleet’s exact software inventory. S3 Bucket Keys reduce KMS request volume. If object-level access evidence is required, enable CloudTrail S3 data events.

A rollback must restore a coherent repository state, including metadata and any required object versions. Restoring only manifest.json does not roll back repository contents.

Building, patching, and running the fleet

At AMI build time, an Image Builder component installs the configured repository keys, moves existing repository definitions aside, and writes one frozen repository definition per component. It locks the package manager to the frozen repository directory, fetches metadata through the internal mirror, and fails the build if the mirror validation step fails. An optional curated package list demonstrates that the AMI can install real packages through the frozen path.

Patch Manager uses the same mirror for the running fleet. A host created from an older AMI and a newly built host are therefore patched toward the same frozen snapshot. Instances run without an Amazon VPC NAT gateway, public IP, or an Amazon VPC internet gateway route in the Workload VPC, and their repository configuration contains no public fallback.

The intended verification model is defense in depth: the sync task helps verify a vendor’s signature before content enters the trusted repository, and the system verifies it again at installation through dnf. The ingestion gate helps reject digest-only results and can be configured to help confirm that only valid package signatures from a trusted lineage key are accepted.

The package mirror

Nginx fronts aws-sigv4-proxy, which signs cross-account S3 GET requests using the mirror task role. To a client, the service appears as a standard HTTPS package repository behind an internal Application Load Balancer and private DNS name.

Use the latest version of aws-sigv4-proxy (current latest is v1.12). This version 1.12 contains the fix for signing S3 paths (or the OS package names) with special characters such as +. Earlier versions can return SignatureDoesNotMatch. The reference implementation pins the reviewed v1.12 release commit immutably. Keep it current through dependency-update reviews.

Security boundaries and limits

The design provides the following controls:

  • No automatic public-repository adoption: A new upstream version enters the selective path only after an explicit, recorded decision by the user.
  • Repository ingestion and installation checks: You configure strict sync-time signature validation to help validate content before it enters the trusted store. dnf verifies again during installation.
  • No package-channel egress: Workload instances are configured to prevent access to public package sources.
  • A read-only workload boundary: A Workload-account principal cannot modify the frozen repository.

Human approval is not a malware detection. A reviewer cannot reliably identify a backdoor in a legitimately signed package merely by seeing its name, version, or changelog. Use vulnerability intelligence, scanning, pre-production tests, and staged deployment as additional controls.

The approval state, manifests, and CloudTrail records can help support evidence for control frameworks such as SOC 2 change management, ISO 27001 patch-management controls, and FDA 21 CFR Part 11 electronic records. Applicability depends on the organization’s environment, audit scope, and assessor. Confirm it with the compliance team under the AWS shared responsibility model.

Cost and operations

Cost depends on the amount of repository content and the chosen networking and availability design. Components can include S3 storage and requests, KMS requests, Lambda invocations, DynamoDB, SNS, Fargate tasks, the internal load balancer, Distribution-account internet egress, Amazon VPC endpoints, and AMI snapshots. A three-task always-on mirror costs more than an S3 bucket alone. Estimate the target topology with current AWS pricing rather than applying a fixed monthly figure from the sample.

Run detection and review at an interval defined by patch policy and risk tolerance. The supplied default is monthly, but the Terraform input is configurable. If a package change must be reversed, restore a tested, coherent repository version and rebuild or patch affected hosts as appropriate.

Prerequisites

To set up the reference implementation, work through these in order:

  1. Two AWS accounts: a connected Distribution account and an air-gapped Workload account.
  2. Deployment tools: Terraform 1.5 or later, Terragrunt, Finch or Docker, and Python with pip.
  3. AWS Command Line Interface (AWS CLI): one named profile per account.
  4. Distribution networking: private subnets with internet egress that works without public IPs, security-group egress on port 443, and DNS resolution for public names.
  5. Workload networking: VPC interface endpoints for ssm, ssmmessages, ec2messages, logs, kms, and imagebuilder, plus an S3 gateway endpoint.
  6. Internal mirror identity: an AWS Certificate Manager (ACM) certificate and a private hosted zone. If the parent AMI does not trust the issuing CA, configure the CA file so the build installs the trust anchor.
  7. Package lineage: a parent AMI, repositories, and signing keys from the same distribution lineage. A RHEL subscription is required when retrieving genuine entitled Red Hat content.
  8. Optional deployment roles: otherwise, the stack uses each profile’s credentials.

The deployment creates state backend and Amazon Elastic Container Registry (ECR) repositories. Do not create those ECR repositories separately before applying their own Terraform units.

Reference implementation

The companion repository provides Terraform modules, Lambda handlers, two container images, a Terragrunt two-account layout, and Makefile targets for deployment and verification. The shipped alma810 example defaults to the AlmaLinux lineage (RHEL family).

Choose one distribution lineage before deployment:

  • AlmaLinux Parent Image default: use an AlmaLinux parent AMI, AlmaLinux vault repositories, EPEL, and the included AlmaLinux and EPEL signing keys. No Red Hat subscription is required.
  • Genuine RHEL Parent Image: use a Red Hat parent AMI, an entitled Red Hat content source, and Red Hat signing keys. The customer supplies the Red Hat subscription and content-access integration.

Note: The reference implementation only provides AlmaLinux lineage setup, not genuine RHEL. If you choose to use a genuine RHEL parent image lineage, only the reference implementation code needs to be updated to fetch the Red Hat credentials or subscription access, and the rest of the workflow remains the same.

Please follow the repository README for detailed setup instructions:

  1. Fill in environments/config.hcl and both account files with the two accounts, networking, mirror certificate, package lineage, and parent AMI.
  2. Create the Terraform state backend with make bootstrap DIST_PROFILE=<dist> WORK_PROFILE=<work>.
  3. Review both account plans with make plan DIST_PROFILE=<dist> WORK_PROFILE=<work>.
  4. Deploy in dependency order with make all BASELINE_APPROVED=true DIST_PROFILE=<dist> WORK_PROFILE=<work>. The baseline sync can take several hours.

Validate the internal package management workflow

Validation begins by running the AlmaLinux EC2 Image Builder pipeline. A successful build produces private, encrypted AMIs in the configured AWS Regions. To validate the configuration, launch a test instance from the generated AMI in a no-egress Workload subnet and verify that the instance is connected to the internal frozen repository for all package management workflow.

Terminal output listing only the internal frozen-baseos, frozen-appstream, and frozen-epel repositories enabled, with dnf makecache downloading metadata through the private mirror

Figure 4: Instance showing only the internal frozen repositories enabled, with no public repository configured

The output confirms that only the internal frozen AlmaLinux repositories are enabled: frozen-baseos, frozen-appstream, and frozen-epel. The dnf makecache command successfully downloads metadata for all three repositories through the private mirror. No public repository is configured or used.

Now try installing, upgrading, or installing a new package to test that package operations are served by the internal frozen repository.

Terminal output showing a package install and upgrade completing successfully through the internal frozen repository mirror

Figure 5: Package install and upgrade served by the internal frozen repository

  • Fail closed on approval data. If the approved package list cannot be retrieved, stop the sync task and avoid substituting a full sync.
  • Govern the initial baseline. Record who authorized the bootstrap full sync, or require explicit review of its manifest before promotion.
  • Require vendor signatures at ingestion. Do not treat a valid package digest as equivalent to a trusted signature.
  • Keep package lineages consistent. Parent AMI, repository content, and signing keys must come from the same distribution lineage.
  • Use a customer-defined review cadence. Monthly is only the sample default.
  • Use immutable dependency references with active updates. Require aws-sigv4-proxy v1.12 or later, pin the reviewed artifact by digest or full SHA, and automate update proposals.
  • Test rollback as a repository operation. Restore metadata and objects together, then validate the mirror before using the restored state.

Clean up

The walkthrough deploys billable resources in both accounts. Please follow the repository README for detailed setup cleanup instructions.

Conclusion

This pattern separates connected package ingestion from an air-gapped fleet, provides an authorized package baseline and an explicit decision point for later package changes or upgrades, and keeps image builds and running hosts on one frozen repository snapshot. To learn more, visit the EC2 Image Builder service page, the EC2 Image Builder documentation, the Patch Manager documentation, and the Amazon S3 user guide. The reference implementation is available in aws-samples.

[$] The kernel from a PostgreSQL point of view

Post Syndicated from corbet original https://lwn.net/Articles/1096827/

Andres Freund has a few claims to fame, but
chief among them is his many years of work to improve the performance of
the PostgreSQL relational database
management system. That work requires working with — or around — many
Linux kernel features and behaviors. He put in an appearance at the 2026
edition of Kernel Recipes
to talk about his experience working with the kernel project, how the
kernel could better support applications like PostgreSQL, and some
interesting developments in the PostgreSQL world.

Security updates for Tuesday

Post Syndicated from jake original https://lwn.net/Articles/1097466/

Security updates have been issued by AlmaLinux (cockpit-image-builder, expat, ipa, kernel, kernel-rt, resteasy, ruby, ruby4.0, ruby:3.3, and ruby:4.0), Debian (dovecot, flatpak, glance, kernel, libdbi-perl, lxml, rsync, swift, and wordpress), Fedora (chromium, freeipa, freerdp, grub2, NetworkManager-iodine, NetworkManager-l2tp, perl-Catalyst-Plugin-Static-Simple, perl-Dancer2, perl-HTML-FormFu, python-quart-trio, python-streamlink, python-urllib3, and vlc), Mageia (libxml2, p11-kit, pam, and php), Slackware (groff and pcre2), SUSE (389-ds, amazon-ssm-agent, erlang27, exiv2, glib2, gnome-shell, hplip, ImageMagick, kernel, libheif, libsodium, libtpms, nodejs16, perl-DBI, python-soupsieve, redis, redis7, swtpm, and wireshark), and Ubuntu (curl, libevent, linux-aws, linux-aws-6.8, linux-aws-5.15, linux-azure-5.15, linux-azure-fde-5.15, linux-intel-iotg-5.15, linux-aws-hwe, linux-azure, linux-azure-4.15, linux-gcp, linux-gcp-7.0, linux-oem-7.0, linux-nvidia, linux-nvidia-6.8, linux-nvidia-lowlatency, and linux-oracle-7.0).

Build adaptive AI interfaces with the AG-UI protocol, agent swarms, and Nova Act on AWS

Post Syndicated from Anand Bilgaiyan original https://aws.amazon.com/blogs/architecture/build-adaptive-ai-interfaces-with-the-ag-ui-protocol-agent-swarms-and-nova-act-on-aws/

Your generative AI applications produce different results each time they run. One medical scan shows a single fracture, and another reveals twenty ambiguous regions that require expert review. Static interfaces can’t adapt to this variability.

In this post, we show you how to build interfaces that automatically adapt to your AI’s variable outputs. This approach reduces interface development time and removes the need for custom integration code by using the AG-UI protocol, the Strands Agents Software Development Kit (SDK), and Amazon Nova Act. You learn to build adaptive interfaces using the agent-to-UI (AG-UI) protocol for dynamic UI generation, the Strands Agents SDK Swarm pattern for multi-agent collaboration, and Amazon Nova Act for legacy system integration. After reading this post, you understand when to use adaptive interfaces and how to deploy them in your applications.

The problem with static interfaces

You design screens with fixed layouts, predetermined controls, and static data binding. This works well when your application’s output space is known and consistent. An ecommerce checkout page needs the same fields for every transaction. A dashboard displays the same metrics regardless of the data. Static interfaces excel at these predictable scenarios.

AI-driven applications introduce new requirements. Consider two scenarios when you review bone X-rays. In the first scenario, one image shows a single obvious fracture requiring minimal interface controls. In the second scenario, another image reveals three subtle regions where multiple AI agents must debate findings, track confidence progression, and reach consensus before presenting results. A static interface optimized for the first scenario lacks the controls needed for the second. An interface built for the second scenario presents unnecessary complexity in the first scenario with empty panels and unused controls.

This problem appears in multiple domains. Fraud detection systems encounter variable evidence chains. Legal document review surfaces unpredictable numbers of relevant clauses. Security event response reveals different threat patterns requiring different analysis tools. Domains where AI discovers things dynamically rather than classifying into predetermined categories face this architectural challenge.

The core challenge is that AI agents discover and reason about the world dynamically, while traditional interface design assumes static, predetermined outputs.

Business impact

This mismatch costs development teams significant time and creates poor user experiences. You spend weeks building interface variations to handle different scenarios, then maintain multiple code paths as your AI models evolve. Your users face either overwhelming complexity when AI finds simple results, or insufficient controls when AI discovers complex patterns requiring deeper analysis. The development cost compounds as you add new AI capabilities. Each new agent or model requires rethinking your entire interface architecture.

Solution overview

Three AWS technologies address this challenge, so you can build interfaces that adapt to what AI agents discover.

The AG-UI protocol offers standardized streaming for agent-to-user interface (UI) communication. Before AG-UI, connecting agents to interfaces required custom code for each framework. You built custom WebSocket formats, polling mechanisms, and bespoke integration code every time you switched agent frameworks or added new capabilities. AG-UI removes this work by providing a standard format of typed events that stream over Server-Sent Events (SSE). Agent frameworks emit AG-UI events, and frontends consume them, creating a universal contract so you can swap frameworks without rewriting integration code.

The Strands Agents SDK offers the Swarm pattern for peer-to-peer multi-agent collaboration. In swarm patterns, your agents operate as peers that share hypotheses and iteratively refine findings until reaching consensus. This debate process, visible to you in real time, builds trust and catches errors that single-agent systems miss. For medical imaging, the swarm pattern mirrors how radiologists consult specialists, with multiple expert perspectives converging on accurate diagnoses.

Amazon Nova Act offers browser-based automation using natural language commands, so your AI agents can interact with legacy systems through their web interfaces. Your agent navigates login screens, searches for related records, fills form fields, and captures confirmation numbers, while streaming actions back to the primary interface so you can observe the process.

These three technologies work together naturally: AG-UI adapts your interface to swarm findings, the swarm produces explainable multi-agent analysis, and Nova Act bridges the gap with legacy systems that lack API access.

Prerequisites

Before starting, verify you have:

Required AWS Resources:

  • AWS account with Amazon Bedrock access in a supported region (us-east-1, us-west-2, or eu-west-1)
  • Your Identity and Access Management (IAM) user or role needs these specific permissions:
    • bedrock:InvokeModel – For calling foundation models.
    • bedrock:CreateAgent and bedrock:CreateAgentActionGroup – For agent deployment.
    • lambda:CreateFunction and lambda:InvokeFunction – For serverless compute.
    • s3:PutObject and s3:GetObject – For file storage.
    • dynamodb:PutItem and dynamodb:GetItem – For state management.
    • secretsmanager:GetSecretValue – For credential retrieval.
    • logs:CreateLogGroup and logs:PutLogEvents – For Amazon CloudWatch logging.

Development Environment:

  • Python 3.9+ with pip installed.
  • Node.js 16+ and React 18+ installed.
  • AWS Command Line Interface (CLI) configured with your credentials.

Technical Skills:

  • Intermediate Python programming experience.
  • Familiarity with event-driven architectures (your interface listens for messages from agents and updates in real time, similar to how chat applications work).
  • Basic understanding of Representational State Transfer (REST) APIs and Server-Sent Events (SSE).

Data protection and HIPAA compliance

This solution processes Protected Health Information (PHI) including medical images, patient MRN, and clinical findings. Apply the following safeguards before deploying to any environment handling real patient data.

Encryption at rest — Configure SSE-KMS with a customer managed key on all Amazon S3 buckets storing medical images. Enable encryption with a customer managed AWS KMS key on all DynamoDB tables storing session state, conversation history, and analysis findings.

Encryption in transit — Enforce TLS 1.2+ on all connections. Attach a bucket policy denying all S3 actions when aws:SecureTransport is false. Do not override DynamoDB SDK endpoints to HTTP. Do not set ignore_https_errors=True on Nova Act workflows. If the legacy system uses self-signed certificates, add its CA to your runtime trust store.

S3 Block Public Access — Enable Block Public Access at the account level and on every bucket in this solution. Medical images must never be exposed through public bucket policies or ACLs.

HIPAA-eligible services and BAA — All AWS services in this architecture (Amazon Bedrock, Amazon S3, DynamoDB, Lambda, API Gateway, CloudFront, Cognito, Secrets Manager, CloudWatch) are HIPAA-eligible. Before processing PHI, execute a Business Associate Agreement (BAA) with AWS covering these services.

PHI minimization — Never write MRN, patient name, or clinical findings to plaintext logs. Enable CloudWatch Logs data protection policies to detect and mask PHI patterns automatically. Suppress Nova Act trajectory logging during steps that display patient data. Verify Cognito JWT on the SSE endpoint before emitting any PHI-bearing event.

Important: Code samples in this post are for educational purposes. Review all configurations against your organization’s HIPAA Security Rule implementation before production deployment.

Architecture

You implement an orchestrator pattern where your frontend interacts with a single entry point that internally coordinates specialized sub-agents. The solution follows this pattern: your React app sends requests to Amazon API Gateway, which triggers AWS Lambda functions that coordinate AI agents through Amazon Bedrock, then streams results back over Server-Sent Events. We use Amazon Bedrock AgentCore, a platform to build, connect, and optimize agents at scale with any framework or model.

Logical view of the radiology portal: the React AG-UI client streams over SSE to a backend orchestrator that coordinates a Strands agent swarm, Nova Act browser automation, a data store, the legacy RIS/EMR portal, and Amazon Bedrock

Figure 1: Logical view of the adaptive interface, showing the AG-UI client, the backend orchestrator, the Strands agent swarm, and integrations with legacy systems and Amazon Bedrock

Detailed AWS architecture with 16 numbered components spanning Amazon Cognito and AWS STS, Amazon CloudFront and Amazon S3, Amazon API Gateway, AWS Lambda, Amazon DynamoDB, Amazon Bedrock AgentCore, the Strands agent swarm, Amazon Bedrock, Amazon OpenSearch Serverless, Amazon Nova Act, and AWS Secrets Manager

Figure 2: End-to-end AWS architecture showing the 16 components that deliver authentication, content delivery, agent orchestration, foundation model inference, and legacy system automation

Architecture components

The architecture consists of 16 integrated components working together:

① User authentication You authenticate through Amazon Cognito, which provides secure identity management and generates JWT tokens for accessing the radiology portal application.

② Content delivery Amazon CloudFront serves the React application and static assets from Amazon S3, providing global low-latency access and caching for optimal performance.

③ API Gateway Amazon API Gateway handles both REST API requests and Server-Sent Events (SSE) connections, providing the entry point for client-server communication.

④ Authorization of user API request with token validation

⑤ Backend processing AWS Lambda functions act as the AG-UI handler, managing authentication, invoking agents through Amazon Bedrock AgentCore Gateway, and formatting responses as SSE streams.

⑥ Image storage Amazon S3 stores medical images with SSE-KMS encryption using a customer managed key. S3 Block Public Access is enabled at the bucket level. Lambda generates short-lived, tightly scoped pre-signed URLs for secure direct uploads, pinned to the PUT method, scoped to a per-user key prefix, restricted to the application/dicom content type, and set to expire in 300 seconds. A bucket policy enforces maximum upload size through the s3:content-length-range condition and denies requests where aws:SecureTransport is false.

⑦ Session management Amazon DynamoDB maintains session state, conversation history, analysis findings, and agent registry data for stateful multi-turn interactions.

⑧ AgentCore Gateway Amazon Bedrock AgentCore Gateway serves as the orchestration layer, routing agent requests, managing sessions, coordinating multi-agent workflows, and load balancing across runtime instances.

⑨ AG-UI handler A specialized component within AgentCore that manages AG-UI protocol events, formatting agent responses as standardized events for dynamic UI rendering.

⑩ AgentCore runtime AgentCore Runtime provides the execution environment for agent instances, running the Strands Agent Swarm with isolated runtime instances for each agent type.

⑪ Agent swarm execution The Strands Agent Swarm consists of three specialized agents (Image Analysis, Clinical Reasoning, Reporting) that collaborate through iterative debate rounds to reach consensus.

⑫ Foundation model inference Amazon Bedrock provides access to the Claude Sonnet foundation model for reasoning, interpretation, and natural language generation across agents using a large language model (LLM).

⑬ Knowledge base retrieval Amazon OpenSearch Serverless stores medical knowledge base with vector embeddings, providing semantic search for relevant medical literature and clinical guidelines.

⑭ Legacy system automation Amazon Nova Act performs browser-based automation to submit validated findings to a legacy hospital’s Radiology Information System (RIS) and Electronic Medical Record (EMR) systems, with each action streamed back to your UI.

⑮ Credential management AWS Secrets Manager securely stores and rotates credentials for legacy system access, providing Nova Act with authentication details at runtime.

⑯ Observability and monitoring Amazon CloudWatch captures logs and metrics, with data protection policies enabled to detect and mask PHI. AWS Distro for OpenTelemetry (ADOT) provides distributed tracing with AWS X-Ray-compatible trace export. AWS Security Token Service (AWS STS) manages temporary security credentials.

Key architectural decisions

Your frontend sees one agent (radiology-assistant), not three, through the orchestrator pattern. This simplifies integration and encapsulates workflow complexity. The orchestrator internally coordinates the swarm based on analysis stage.

Rather than generating arbitrary HTML, agents select from themed, accessible components (ROICard, DebatePanel, ConfidenceMeter). This balances flexibility with design consistency and security through the predefined component library approach.

SSE provides real-time updates as agents work through the streaming protocol. You see agent contributions character by character, creating transparency into the reasoning process.

Your frontend exposes state (current findings, validation decisions) to agents through bidirectional state synchronization. Agents update state through actions. This synchronization supports human-in-the-loop workflows where agents pause for validation before proceeding.

Solution walkthrough

The following steps walk through the solution, from authentication and swarm configuration to the AG-UI endpoint, legacy system integration, and deployment.

Step 0: Configure authentication

Add JWT validation to your API endpoint to enforce authentication before processing requests containing PHI.

from fastapi import Depends, HTTPException, Request
import os

COGNITO_USER_POOL_ID = os.environ["COGNITO_USER_POOL_ID"]
COGNITO_APP_CLIENT_ID = os.environ["COGNITO_APP_CLIENT_ID"]

async def verify_token(request: Request):
    """Validate Cognito JWT from Authorization header."""
    token = request.headers.get("Authorization", "").replace("Bearer ", "")
    if not token:
        raise HTTPException(status_code=401, detail="Missing authorization")
    # Validate token against Cognito JWKS endpoint
    # See: https://docs.aws.amazon.com/cognito/latest/developerguide/amazon-cognito-user-pools-using-tokens-verifying-a-jwt.html
    return validate_jwt(token, COGNITO_USER_POOL_ID, COGNITO_APP_CLIENT_ID)

@app.post("/api/agui")
async def agui_endpoint(request: Request, user=Depends(verify_token)):
    ...

Full Amazon Cognito user pool setup (pool creation, hosted UI, and token exchange) is covered in the Amazon Cognito Developer Guide. This post focuses on the agent architecture layer.

Step 1: Install the Strands Agents SDK

Install required packages by running the following command:

pip install strands-agents ag-ui-strands fastapi uvicorn

This command installs the required packages for building your multi-agent swarm, including the Strands framework, AG-UI integration, and web server components.

Step 2: Configure your swarm agents

Create specialized agents for your swarm by adding the following code to your project:

from strands import Agent
from strands.models import BedrockModel
from typing import Dict, List, AsyncGenerator
import os

region = os.environ.get("AWS_REGION", "us-east-1")

class RadiologySwarm:
    """Coordinates multi-agent analysis with visible debate."""

    def __init__(
        self,
        consensus_threshold: float = 0.80,
        max_rounds: int = 5,
    ):
        self.consensus_threshold = consensus_threshold
        self.max_rounds = max_rounds
        self.agents = self._initialize_agents()
        self.hypotheses = []

    def _initialize_agents(self) -> List[Agent]:
        """Create specialized agents for swarm."""
        model = BedrockModel(
            model_id=os.environ.get("BEDROCK_MODEL_ID", "us.anthropic.claude-sonnet-4-20250514-v1:0")
        )
        return [
            Agent(
                name="image_analysis",
                system_prompt="Detect abnormal patterns in medical images...",
                model=model,
            ),
            Agent(
                name="clinical_reasoning",
                system_prompt="Validate findings with clinical context...",
                model=model,
            ),
            Agent(
                name="reporting",
                system_prompt="Structure findings in clinical format...",
                model=model,
            ),
        ]

    async def analyze_with_debate_stream(
        self,
        image_data: bytes,
        patient_context: Dict,
    ) -> AsyncGenerator[Dict, None]:
        """Stream swarm analysis events for real-time UI updates."""
        # Implementation continues in next steps...
        pass

Note: The agents use a foundation model accessed through Amazon Bedrock. The example defaults to Claude Sonnet 4, but you should select a currently active model from the Amazon Bedrock model lifecycle page for your AWS Region. Read the model ID from an environment variable so you can update it without code changes as newer models become available. Amazon Bedrock retires models on a published lifecycle schedule, so hardcoding a model ID risks failure when that model reaches end of life. Check the Amazon Bedrock model lifecycle page and supported Regions, and use an environment variable or AWS Systems Manager Parameter Store to manage the model ID externally.

This code creates three specialized agents (Image Analysis, Clinical Reasoning, Reporting) that work together as peers in a swarm pattern, sharing hypotheses and refining findings through iterative debate until reaching consensus.

Step 3: Implement consensus mechanism

Configure your swarm to continue debate rounds until agents reach consensus or exhaust maximum iterations:

from typing import Dict, List

class RadiologySwarm:
    """Consensus mechanism implementation."""

    def __init__(
        self,
        consensus_threshold: float = 0.80,
        max_rounds: int = 5,
    ):
        self.consensus_threshold = consensus_threshold
        self.max_rounds = max_rounds
        self.hypotheses = []

    async def analyze_with_debate_stream(
        self,
        image_data: bytes,
        patient_context: Dict,
    ):
        """Stream swarm analysis with consensus checking."""
        yield {"type": "swarm_start", "max_rounds": self.max_rounds}
        for round_num in range(1, self.max_rounds + 1):
            # Each agent contributes based on current hypotheses
            for agent in self.agents:
                try:
                    context = {
                        "image_data": image_data,
                        "patient_context": patient_context,
                        "round": round_num,
                    }
                    async for chunk in agent.stream_response(context):
                        yield {
                            "type": "agent_contribution_chunk",
                            "agent": agent.name,
                            "round": round_num,
                            "text": chunk,
                        }
                except Exception as e:
                    yield {
                        "type": "agent_error",
                        "agent": agent.name,
                        "round": round_num,
                        "error": str(e),
                    }
            # Check if consensus reached after all agents contribute
            if self._check_consensus():
                yield {"type": "consensus_reached", "round": round_num}
                break
        yield {"type": "swarm_complete", "findings": self.hypotheses}

    def _check_consensus(self) -> bool:
        """Verify hypotheses meet confidence threshold."""
        if not self.hypotheses:
            return False
        # Check if all hypotheses have confidence above threshold
        for hypothesis in self.hypotheses:
            if hypothesis.get("confidence", 0) < self.consensus_threshold:
                return False
        return True

Your swarm reaches consensus when proposed findings achieve confidence scores above your configured threshold (80% for this example). Confidence progresses as agents validate or debate each other.

In the first example of subtle fracture detection, Round 1 shows the Image Agent proposing a Region of Interest (ROI) with confidence above 80%. Round 2 shows the Clinical Agent validating with anatomical context, maintaining confidence above the threshold. Round 3 shows agents agreeing on clinical significance, reaching consensus when the three agents reach confidence scores above the configured threshold.

In the second example of false positive challenge, Round 1 shows the Image Agent proposing an ROI with confidence above the threshold. Round 2 shows the Clinical Agent challenging it as an artifact, with confidence dropping below 80%. Round 3 shows the Image Agent acknowledging the challenge, with confidence dropping further. Round 4 shows agents continuing debate without consensus. Round 5 shows maximum rounds reached, with the finding marked as disputed.

This iterative refinement, visible to you in real time, provides explainability that black-box AI systems can’t match.

Step 4: Set up the AG-UI protocol endpoint

Create a streaming endpoint by adding the following code:

from fastapi import FastAPI, Request
from fastapi.responses import StreamingResponse
import json

app = FastAPI()

@app.post("/api/agui")
async def agui_endpoint(request: Request):
    """AG-UI streaming endpoint emitting typed events."""
    body = await request.json()

    async def event_stream():
        """Stream standardized AG-UI events."""
        swarm = RadiologySwarm()
        async for event in swarm.analyze_with_debate_stream(
            image_data=body["image_data"],
            patient_context=body["patient_context"],
        ):
            yield format_sse_event(event)

    return StreamingResponse(
        event_stream(),
        media_type="text/event-stream",
    )

def format_sse_event(event: Dict) -> str:
    """Format as Server-Sent Event."""
    return f"data: {json.dumps(event)}\n\n"

This code creates a streaming endpoint that emits standardized AG-UI events, so your frontend receives real-time updates as agents work without requiring custom integration code for each agent framework.

The AG-UI protocol defines event types that cover agent-to-UI communication needs. Instead of custom formats, agents emit structured events over SSE, and frontends subscribe to this stream and react to each event type. TEXT_MESSAGE_CONTENT streams agent reasoning or responses token by token for real-time visibility into agent thinking. STATE_DELTA provides incremental state updates for bidirectional synchronization between agent and interface. TOOL_CALL_START and TOOL_CALL_END show tool execution when agents invoke external functions or APIs. With UI_COMPONENT_SPEC, agents control which UI components appear and how they’re configured through interface element specifications.

Configure your frontend to subscribe to this stream and handle each event type:

// Frontend event handler
eventSource.onmessage = (event) => {
  const data = JSON.parse(event.data);
  switch (data.type) {
    case "text_message_content":
      appendAgentText(data.agent, data.text);
      break;
    case "state_delta":
      updateApplicationState(data.path, data.value);
      break;
    case "ui_component_spec":
      renderComponent(data.component, data.props);
      break;
  }
};

Step 5: Implement real-time agent debate visualization

Create interface components that make multi-agent collaboration visible to you by implementing the following visualization features:

A key benefit of the swarm pattern combined with AG-UI is making multi-agent collaboration visible. Rather than presenting you with final results from a black-box system, the interface shows agents debating findings in real time.

Your interface includes specialized components for visualizing agent collaboration. The agent contribution display shows each agent’s reasoning streaming character by character with a typing effect, indicating which agent is currently “thinking.” Color-coding distinguishes agents (blue for Image Analysis, purple for Clinical Reasoning, cyan for Reporting). The confidence timeline uses a line graph to show how confidence evolves across rounds. Increasing confidence (72% → 78% → 85%) indicates agents converging on consensus. Decreasing confidence (68% → 52% → 45%) shows successful challenge of a false positive. Evidence cards display each region of interest with a status badge (Challenged, Consensus, Disputed) based on the debate outcome, an AI-generated summary of key reasoning points, and an expandable section showing complete agent contributions for radiologists who want detailed analysis.

This visibility serves multiple purposes. For explainability, you see why agents reached conclusions, not only what they concluded. For error detection, visible debate helps you spot flawed reasoning. For confidence calibration, watching agents debate each other helps you assess reliability. For educational value, radiologists learn from agent reasoning, improving their own analysis.

Step 6: Integrate Amazon Nova Act for legacy systems

Implement browser automation to submit findings to legacy systems by adding the following code:

import json
import boto3
from typing import Dict

class LegacyRISSubmission:
    """Browser automation for legacy RIS submission."""

    def __init__(
        self, secret_name: str = "ris-credentials", region_name: str = "us-east-1"
    ):
        """Initialize with AWS Secrets Manager configuration."""
        self.secret_name = secret_name
        self.secretsmanager = boto3.client("secretsmanager", region_name=region_name)

    def _get_credentials(self) -> Dict:
        """Retrieve credentials from AWS Secrets Manager."""
        response = self.secretsmanager.get_secret_value(SecretId=self.secret_name)
        return json.loads(response["SecretString"])

    def submit_report(self, report_data: Dict, ris_url: str) -> Dict:
        """Submit validated findings to legacy RIS."""
        from nova_act import NovaAct
        from nova_act.types.workflow import Workflow
        creds = self._get_credentials()
        with Workflow(
            model_id="us.amazon.nova-act-v1:0",
            workflow_definition_name="radiology-submission"
        ) as workflow:
            with NovaAct(
                starting_page=f"{ris_url}/login",
                headless=True,
                workflow=workflow,
            ) as nova:
                # Authentication
                nova.act("Click on the username input field")
                nova.type_text(creds["username"], sensitive=True)
                nova.act("Click on the password input field")
                nova.type_text(creds["password"], sensitive=True)
                nova.act("Click Sign In button")
                # Patient lookup
                mrn = report_data["patient_mrn"]
                nova.act(f"Search for patient MRN '{mrn}'")
                nova.act("Click View Record button")
                # Report submission
                nova.act("Click New Report button")
                findings_text = report_data["findings_summary"]
                nova.act(f"Fill findings textarea with: {findings_text}")
                nova.act("Upload annotated image file")
                nova.act("Click Submit Report button")
                # Capture confirmation
                result = nova.act("Find and return the RPT- confirmation number")
        return {"status": "success", "confirmation": result, "mrn": mrn}

Security note: Nova Act captures prompts and screenshots as trajectory data. Never interpolate credentials or PHI into act() commands. Use type_text with sensitive=True to prevent credential capture in logs and trajectories. In production, suppress trajectory capture entirely for authentication steps, or route trajectory storage to a KMS-encrypted, access-controlled bucket subject to your BAA

Many enterprise systems, particularly in healthcare, lack modern APIs. Hospital RIS and EMR systems often run on decades-old technology stacks that can’t be modified without significant effort. Amazon Nova Act offers a pragmatic solution: browser-based automation using natural language commands.

This code implements browser automation that interacts with legacy systems through their existing web interfaces, retrieving credentials securely from AWS Secrets Manager and streaming each action back to your interface for transparency.

Each Nova Act command streams back to the radiology portal, so you can observe the submission process. Your interface displays a live action log showing authentication, navigation, form filling, and confirmation capture. This transparency helps you understand what the automation is doing and intervene if issues arise.

Browser automation requires careful credential management. The implementation stores credentials in AWS Secrets Manager, retrieves them at runtime, and never exposes them to the frontend. Audit logging captures Nova Act actions for compliance and troubleshooting. For production deployment, additional controls include IP allowlisting, session timeout enforcement, and multi-factor authentication where supported by legacy systems.

Step 7: Deploy to AWS

Configure DynamoDB tables with customer-managed KMS encryption:

import boto3

dynamodb = boto3.client("dynamodb")

dynamodb.create_table(
    TableName="radiology-sessions",
    KeySchema=[{"AttributeName": "session_id", "KeyType": "HASH"}],
    AttributeDefinitions=[{"AttributeName": "session_id", "AttributeType": "S"}],
    BillingMode="PAY_PER_REQUEST",
    SSESpecification={
        "Enabled": True,
        "SSEType": "KMS",
        "KMSMasterKeyId": "arn:aws:kms:us-east-1:ACCOUNT:key/YOUR-KEY-ID"
    },
)

Deploy your solution using Amazon Bedrock AgentCore, which offers managed runtime for agents with built-in identity, memory, and observability. AgentCore supports long-running tasks (up to 8 hours), asynchronous tool execution, and native CloudWatch integration, making it ideal for production deployments requiring minimal operational overhead.

Pattern selection guidance

Choosing the right architecture pattern depends on problem characteristics and requirements.

When to use dynamic agent-generated UIs

Characteristic Dynamic UI (AG-UI) Static UI (Traditional)
Output Variability High – unpredictable number/structure of results Low – consistent data structure
Multi-Agent Value Visible collaboration builds trust Single agent or no collaboration to show
Interface Complexity Varies per case Consistent across cases
Explainability Needs Important – users must understand reasoning Less important – results speak for themselves
Development Effort Higher – protocol integration, component library Lower – standard REST API

Swarm compared to other multi-agent patterns

Use swarm when multiple perspectives improve accuracy (peer review, consensus building), debate process offers value (explainability, error detection), no clear hierarchy exists (agents are peers, not supervisor/worker), and iterative refinement is beneficial (findings improve through rounds).

Use agents as tools when clear task decomposition exists (supervisor delegates to specialists), subtasks are independent (parallel execution possible), hierarchy is natural (manager coordinating experts), and no need for peer debate exists (each agent’s output stands alone).

Use sequential workflow when strict ordering is required (step B needs step A’s output), checkpoints are needed (validate before proceeding), process is well-defined (known stages, dependencies), and no benefit from parallel exploration exists (linear pipeline).

Use cases beyond medical imaging

This architectural pattern applies to domains with high output variability and multi-agent value. For fraud detection, you encounter variable evidence chains (1-20 suspicious transactions), multiple analyst perspectives (financial, behavioral, network analysis), and legacy banking systems requiring browser automation. For legal document review, you face unpredictable numbers of relevant clauses, expert opinions from different legal domains (contract law, regulatory compliance, risk assessment), and integration with legacy case management systems. For security event response, you deal with variable threat indicators, team collaboration (network analysis, malware analysis, threat intelligence), and legacy Security Information and Event Management (SIEM) systems without modern APIs.

Anti-patterns

Avoid this approach when you have simple classification (predetermined categories with fixed confidence scores), deterministic calculations (no uncertainty or debate needed), low-latency requirements (multi-round debate adds latency), cost-sensitive scenarios with predictable outputs (swarm pattern increases token usage), or minimal explainability needs (users trust results without seeing reasoning).

Clean up

To avoid incurring future charges, delete the resources you created while following this walkthrough. Delete them in the following order. The sequence removes the frontend and compute layers first, then the data stores, and finally the encryption keys and IAM roles, so no deletion fails because another resource still depends on it. Because this solution can process PHI, this teardown also removes any stored medical images, patient identifiers, and findings.

  1. Amazon CloudFront — Disable the distribution, let it propagate, then delete it. This stops traffic and releases the S3 app bucket.
  2. Amazon API Gateway — Delete the REST API and SSE endpoint.
  3. Amazon Bedrock AgentCore — Delete the Gateway, then the Runtime instances (and their identity, memory, and session resources). This stops all agent activity against the downstream services.
  4. AWS Lambda — Delete the AG-UI handler and any other functions.
  5. Amazon Bedrock model access — Confirm nothing is still invoking the models. Revoke access to Claude Sonnet or Amazon Nova Act if enabled only for this walkthrough.
  6. Amazon OpenSearch Serverless — Delete the knowledge base collection and its access, network, and encryption policies. OCUs bill hourly.
  7. Amazon DynamoDB — Delete the radiology-sessions table and any other tables you created.
  8. Amazon S3 — Empty (including all object versions) and delete the medical-image and app-hosting buckets.
  9. AWS Secrets Manager — Delete the legacy RIS/EMR credential secrets. A 7 to 30 day recovery window applies unless you force deletion.
  10. Amazon Cognito — Delete the user pool and app client.
  11. AWS KMS — Only now, schedule deletion of the customer managed keys used for Amazon S3 and DynamoDB. Deleting them earlier can make encrypted data unrecoverable.
  12. AWS IAM — Delete the roles and policies created for Lambda and AgentCore.
  13. Amazon CloudWatch — Delete the log groups, dashboards, and alarms (kept until last for troubleshooting).

Finally, review the AWS Billing and Cost Management console to confirm no unexpected charges remain.

Conclusion

In this post, we showed you how to build adaptive AI interfaces using three AWS technologies. You learned to use the AG-UI protocol for dynamic UI generation, apply Strands swarm patterns for multi-agent collaboration, and integrate Amazon Nova Act for legacy systems. Through a complete radiology assistant implementation, you saw how these technologies work together to handle variable AI outputs while maintaining explainability and practical enterprise integration.

The AG-UI protocol creates interfaces that adapt to what your agents discover, not what you anticipated. Use it when output variability is high and you can’t predetermine interface requirements. The Strands swarm pattern creates explainability through visible multi-agent debate. Use when multiple perspectives improve accuracy and you benefit from seeing reasoning processes. Amazon Nova Act bridges the gap with legacy systems lacking APIs. Use when browser automation is the only viable integration path and action transparency matters.

These technologies work together naturally because they address different aspects of the same problem: building AI systems that are flexible, explainable, and practical for real-world enterprise environments.

Next steps

Read related AWS blogs:

  • Multi-Agent Collaboration Patterns with Strands Agents and Amazon Nova.
  • Strands Agents SDK: A Technical Deep Dive into Agent Architectures and Observability.
  • Build a Drug Discovery Research Assistant using Strands Agents and Amazon Bedrock.


About the authors
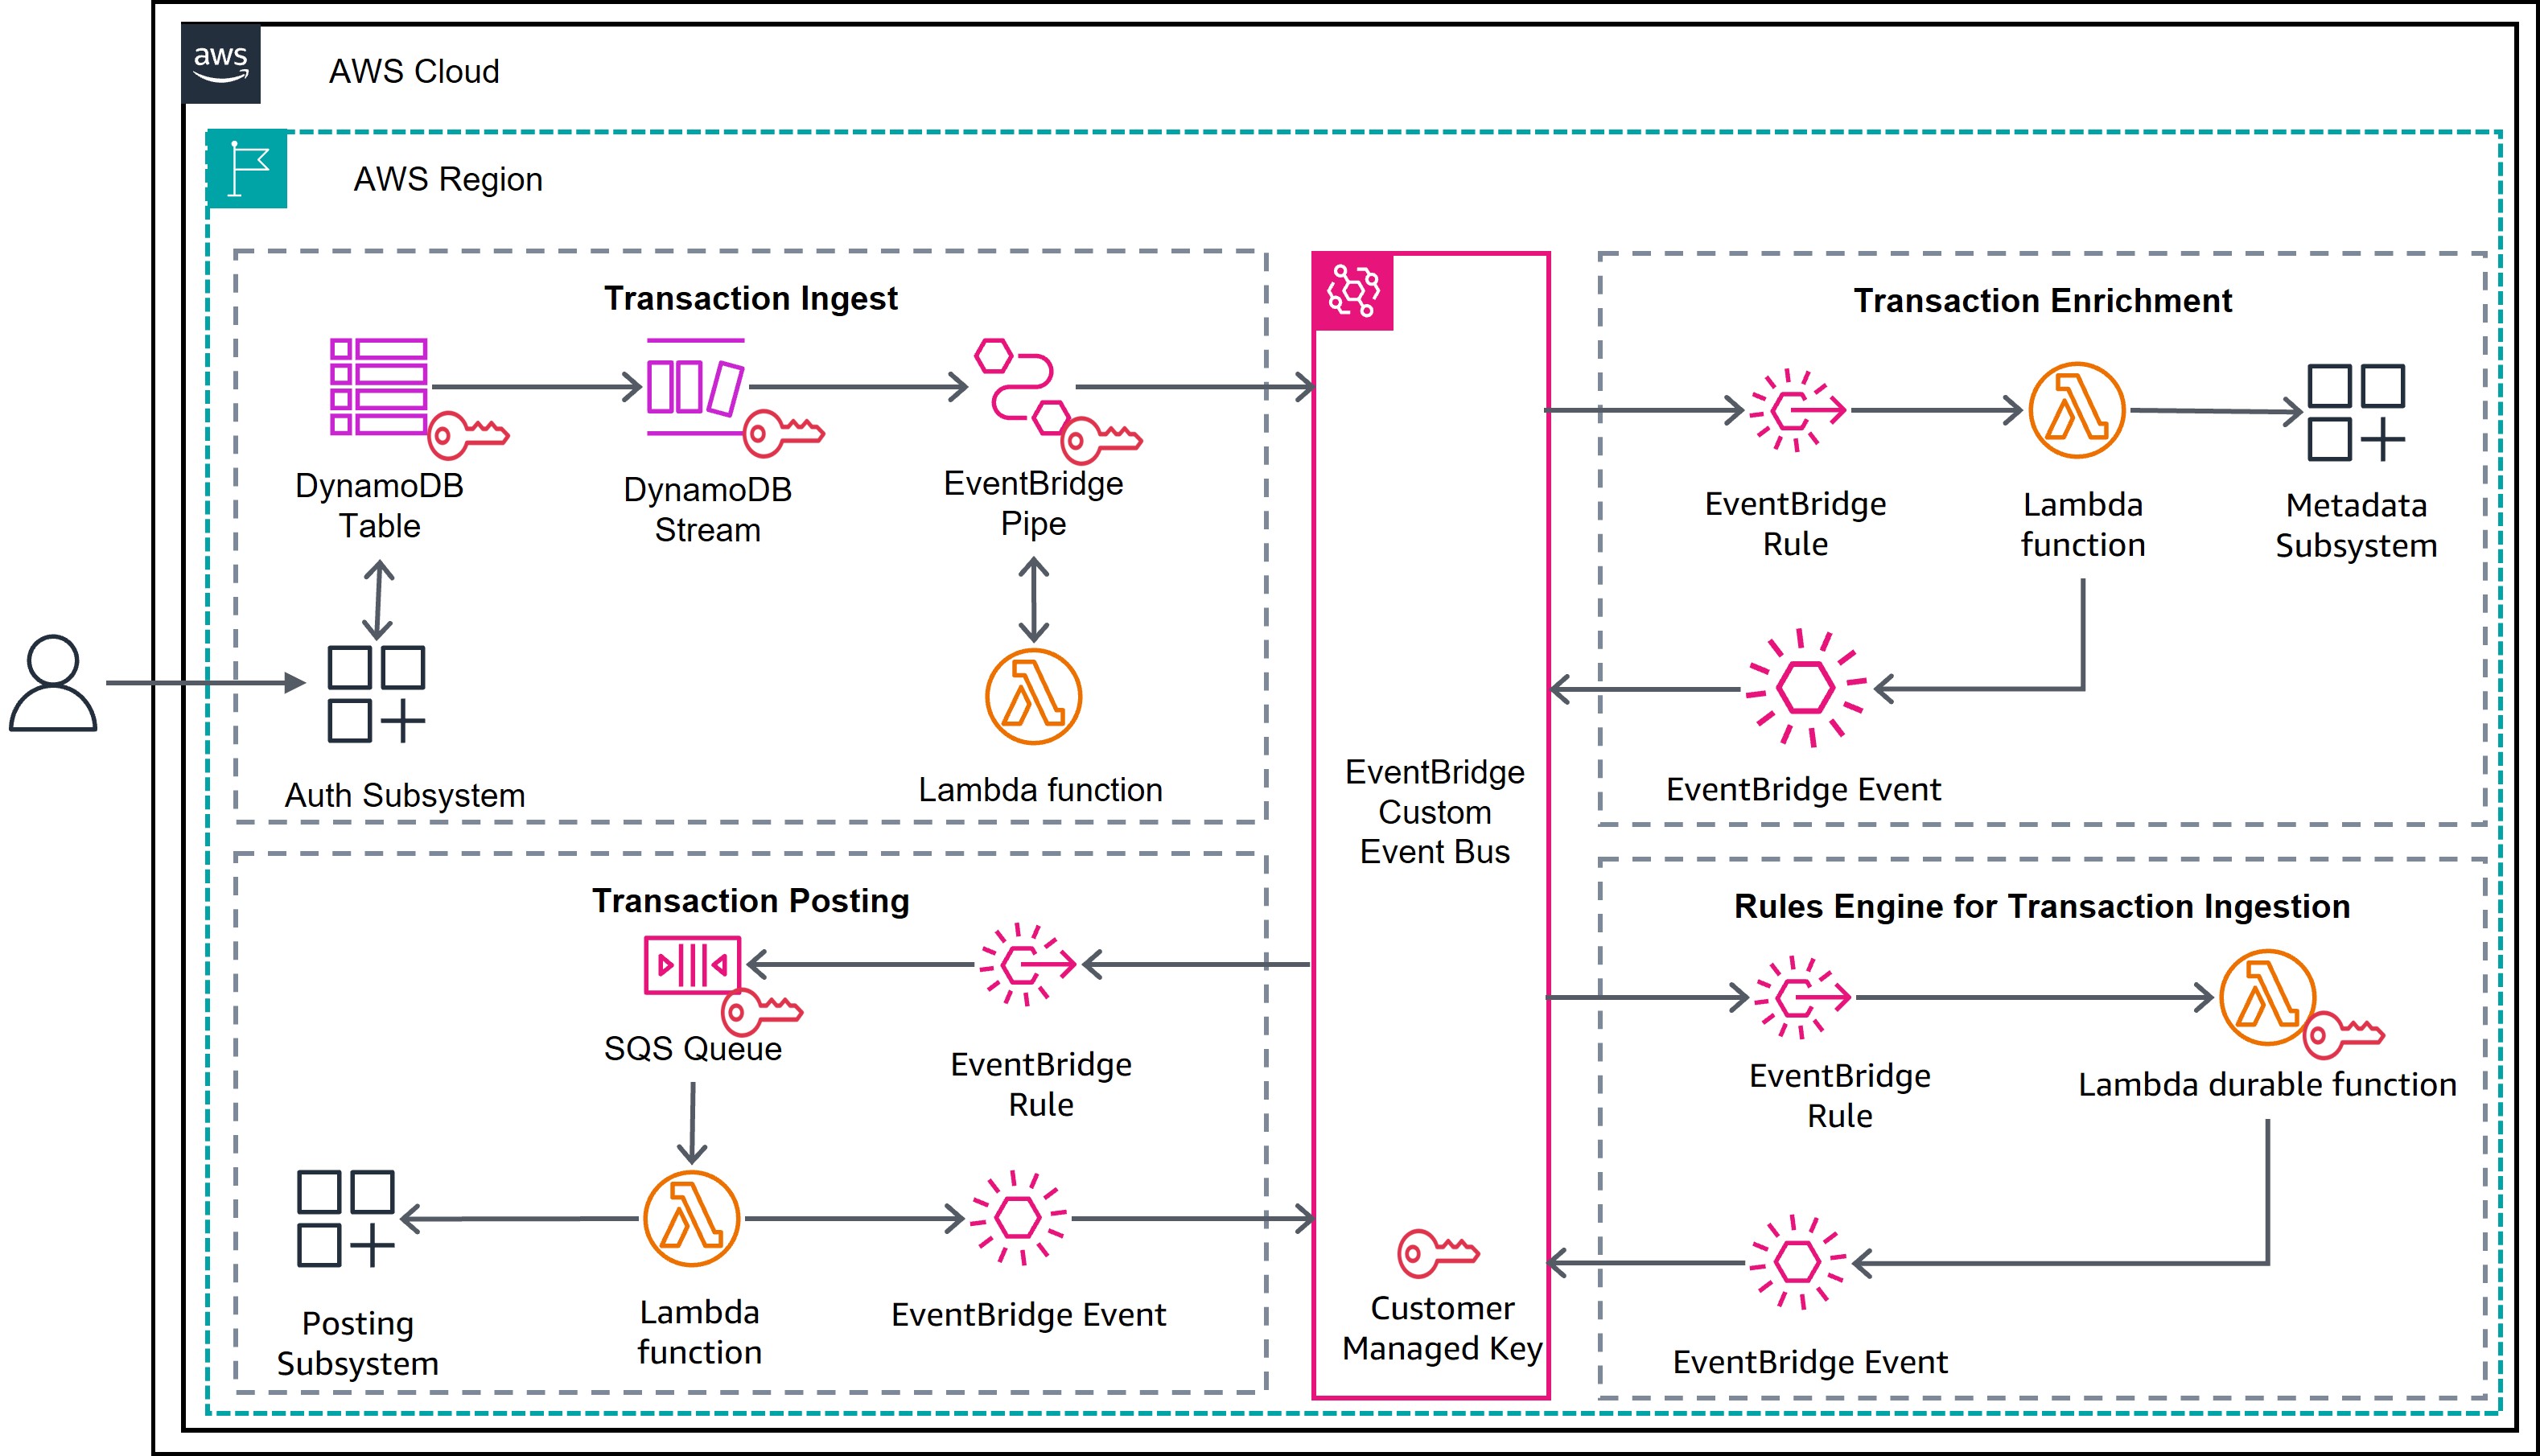
Using AI to chart a course for our post-quantum migration

Post Syndicated from Sharon Goldberg original https://blog.cloudflare.com/ai-driven-cryptography-discovery/

As laboratories around the world race to build out a cryptographically relevant quantum computer, we at Cloudflare are racing towards a 2029 target deadline for full post-quantum readiness. While we’ve already transitioned many of our products to post-quantum encryption, we still have work to do to support post-quantum authentication and achieve full post-quantum readiness across our platform.

We’re taking a maximalist stance (“PQ everything!”), because as an infrastructure provider to the world, we want to give our customers the peace of mind that using Cloudflare ensures that their traffic is future-proofed against quantum adversaries.

But how does one accomplish such a massive migration at an organization of our size and scale? After all, cryptography is the base layer for almost all of the world’s digital systems, including the software services and the networking protocols that power our platform.

To drive our PQ migration, we have three key goals.

First, we want to help our product and engineering teams understand how cryptography is being used and how they should be upgrading it. This should cover both the upgrades to post-quantum encryption and to post-quantum authentication. Many of our products have already been upgraded to post-quantum encryption over TLS 1.3, but we still want to cover the long tail of TLS connections, as well as upgrade any other uses of public-key encryption. Meanwhile, it’s still early days for our deployment of post-quantum authentication.

Next, we want to provide progress metrics for the migration. These might include per-repository and per-product counts of the use of classical and post-quantum cryptography.

Finally, we want to surface prerequisites early. If our products or platform rely on protocols that don’t yet have a PQ migration plan (because PQ variants of the system have not yet been considered, because PQ standards do not exist or lack consensus, or because software libraries or other key ecosystem components do not yet have PQ support), then we need to know now. That way we can work with the relevant stakeholders, standards bodies and ecosystems to help drive their PQ migration plans, so that we can meet our own 2029 PQ migration timeline.

This post is the story of how we’re going about this. We explain how we turned to AI to help us solve some of our problems and how we’re developing an internal tool called CryptoLabe to help us. CryptoLabe is named after the mariner’s astrolabe, a navigation instrument refined by Portuguese navigators. Just as an astrolabe helped sailors determine where they were and chart a course, CryptoLabe helps us discover cryptography in our code, understand how it is used, and chart a path to post-quantum migration.

CryptoLabe is highly specialized to our internal systems (our repositories, our ticketing systems, and internal documentation processes) and still evolving as we continue its development, so we aren’t making it available to customers. Nevertheless, we are sharing our learnings so that other organizations can build upon our efforts as they work through their own PQ migration journey.

The scale of the problem

The software that powers most Cloudflare products lives inside our single centralized source control management platform. This means we can find most uses of cryptography across our platform by just looking through our codebase.

While the centralization of our codebase is a marked advantage for us, we still need to contend with three challenges that come with the scale of this problem. First, our code is spread across many repositories. Second, cryptography rarely announces itself plainly in the code. Instead, it hides in

  • shared libraries that a repository imports but may or may not actually call
  • upstream and protocol defaults, like a TLS 1.3 listener that is configured to negotiate a classical key exchange such as X25519 rather than post-quantum X25519MLKEM768
  • configuration files that select algorithms far away from the code that uses them, like a TLS responder whose key exchange protocols are pinned in a YAML file stored in a different repository
  • code paths that are dead, test-only, or on a path to being deprecated

Third, cryptography discovery is about more than just pattern matching. Grepping for certain algorithm names (e.g. “RSA” or “X25519”) overcounts, because it finds cryptography in unused code. Grepping also undercounts, because it misses defaults and indirect uses in dependencies and configuration. Most importantly, it can't tell you how the cryptography is used. A classical ECDSA signature could be part of a JWT, IPsec, TLS, or SSH, and each has a completely different migration path. Many uses also depend on the other side of the connection: a TLS server may support both post-quantum key exchange and classical key exchange; the one it chooses to use would depend on the client.

Turning to AI

It turns out that AI is pretty good at doing more than just grepping. A model can search a codebase, follow evidence across files, and return structured analysis. It can also enrich findings by pulling information from other sources, like our internal documentation and ticketing systems. In fact, AI can even explain how cryptography is being used and how it should be updated. We’ve been putting that idea to the test as we develop CryptoLabe.

As we said before, our first two goals are to (1) discover and understand the use of cryptography in our codebase, and also (2) to get metrics on the state of our PQ migration. Towards these goals, our current implementation of CryptoLabe performs scans in two stages, as shown in the figure below.

The first “discovery” stage starts by mapping the repository. It then searches for cryptography through source, configuration, manifests, lockfiles, scripts, tests, and documentation. Among other things, the scan looks for the use of cryptography like key agreement, signatures, asymmetric encryption, PKI, tokens, credentials, hardware security module integrations, and more. This discovery stage produces a set of "raw observations."

Each raw observation feeds a run of the second stage. This “analysis” stage first re-checks the observation against the source code. It then investigates how the cryptographic operation is used at runtime, what role the repository plays, and which internal or external parties it depends on. When necessary, it can inspect related code in other repositories to complete the analysis. Finally, it takes a pass over its own conclusions, searching for missing or conflicting evidence such as configuration overrides, test-only code, or incorrect assumptions about runtime behavior.

Next, the model assigns a classification to the finding. If there is not enough evidence to assign a classification, the model assigns More evidence needed, External dependency, or Unknown rather than guessing.

This is the current list of classifications used by CryptoLabe, containing catch-all classifiers which will likely be refined as we proceed through our migration. (As an example, we could refine our classifiers by splitting the “encryption” classifier into key agreement and HPKE; you get the idea.)

Classification

Examples

Classical encryption

This is a catch-all category that finds cases of elliptic-curve Diffie-Hellman key exchange (ECDHE) (e.g., X25519, P-256, P-384), RSA key agreement or other uses of public-key encryption (e.g., HPKE). These are broken by a quantum computer running Shor's algorithm, which puts them at risk of harvest-now-decrypt-later attacks.

Classical signature

This is a catch-all category that finds use of an RSA signature or elliptic-curve (ECDSA) signature in anything, for example a certificate, a TLS handshake, another protocol handshake. These signatures are broken by Shor's algorithm.

Classical token

We found a lot of RS256 or ES256 JWT tokens, so we created a special classification for them. These are JWTs that use classical RSA and ECDSA signatures; RFC 9964 defines a post-quantum replacement using ML-DSA.

PQ-ready hybrid key exchange

Finds hybrid post-quantum key exchange in TLS 1.3, i.e. X25519MLKEM768. This is the most prevalent use of PQ encryption in our codebase.

PQ-ready

Finds other uses of post-quantum cryptography that are not X25519MLKEM768 in TLS 1.3, like ML-DSA.

Finally, it generates a report that serves two audiences: (1) product managers who need to understand what the migration means for their product, and (2) engineers that need enough detail to execute the migration.  

Here’s a (cropped) view of one of our reports:

While we’ve been iteratively reviewing findings against the source code and with relevant engineers, we do not yet have a ground-truth dataset for reproducibly comparing different versions of the prompts we’ve tried for CryptoLabe.

Built on Cloudflare’s Developer Platform

We built CryptoLabe on Cloudflare's Developer Platform. Here’s the architecture:

CryptoLabe runs across two Cloudflare Workers. There’s a scanner Worker that runs the scans. And there’s an inventory Worker that serves the dashboard, exposes the API, and stores everything in a D1 database. The two communicate through Service Bindings. A scan starts when someone requests it from the dashboard, and the inventory Worker passes the request to the scanner.

Orchestrating a scan

We need a way to keep a scan alive and on track from start to finish, without building our own job orchestration system. We did this with Agents SDK. Each repository gets its own persistent coordinator built on a Durable Object (DO). A bounded queue in front of the coordinators limits how many scans run at once. When a scan's turn comes, the coordinator tracks its progress and handles cancellation, retries, and recovery.

The coordinator doesn't do the analysis itself. It hands the work to Cloudflare Workflows, so that they can persist progress and automatically retry failed steps. The coordinator moves each repository through four stages:

  1. discovery Workflow (the first scanning stage that produces raw observations)
  2. deep analysis Workflow (the second stage, run on each raw observation)
  3. merge Workflow (that builds a list of findings for a given repository, including combining repeated or similar finds)
  4. publish workflow (that hands results back to the inventory Worker)

The first two workflows need the model to have access to the repository's code. We want this access to be isolated, so we don’t risk damaging the codebase. That’s why CryptoLabe downloads the repository once, at an exact commit, at the start of each scan, and then stores that snapshot in R2. Each Workflow then restores the snapshot into a fresh, short-lived Cloudflare Sandbox, an isolated container. The model then works with the Sandbox through a small set of read-only tools on an immutable snapshot of the code, even if the codebase changes while the scan is still running.

Calling the model at scale

If we want to scan through all of our (many!) repositories, we have to worry about both cost and capacity.

For cost, the model loop sends its requests through AI Gateway to cost-effective open-weight models hosted on Workers AI. Putting the model behind AI Gateway also makes it easy to switch models as better or cheaper ones become available.  

Capacity became a problem once we scanned many repositories at once. Bursts of model requests began triggering HTTP 429 (rate limit) responses from AI Gateway, and scans retrying independently only made the bursts worse. We solved this with a single, global Durable Object that paces every model request across all scans, including retries. When any scan hits a rate limit, the cooldown is shared and all scans back off together, so concurrent scans share the available capacity instead of competing for it.

Prerequisites and hard cases

Let’s now get into our third goal: surfacing prerequisites and hard cases early.

A lot of ink has been spilled about ecosystem readiness for the PQ migration, and we are now going to spill some more. As everyone knows, a PQ migration cannot happen in a vacuum. For migration to succeed, post-quantum cryptography must be supported in relevant software libraries (e.g. BoringSSL) and across parties that participate in the ecosystem (e.g. clients, browsers, origins, cloud proxies, certificate authorities, etc.). Standards are also an important indicator of ecosystem support, although a standard that is still in “draft” state does not necessarily mean deployment cannot proceed. As an example, we deployed X25519MLKEM768 in TLS 1.3 back in 2022 when it was still a “draft” at the Internet Engineering Task Force (IETF) while it was only finalized as RFC 10024 in 2026.

Either way, our point is that in order to upgrade a system to PQ cryptography, we need to understand its dependencies and level of ecosystem support. 

That’s why CryptoLabe uses the concept of “prerequisites” to highlight findings that cannot be immediately remediated by an individual product team working alone.

A prerequisite can be something as straightforward as “we are currently blocked on migrating to post-quantum JWTs.” We say this is straightforward because there is already a standard (RFC 9964) for post-quantum JWTs. Nevertheless, if our software libraries don’t yet support validating post-quantum JWTs, or if we’re using a token issuer that does not yet issue post-quantum JWTs, we can’t go company-wide and ask each of our product teams to start PQ-ing their JWTs. This migration is blocked until we solve its core prerequisites. CryptoLabe lets us group together findings that (likely) have the same prerequisite, which also helps us decide how to prioritize resolving these prerequisites.

For example, the snapshot below shows the six findings from CryptoLabe that have post-quantum SAML as a prerequisite. (SAML is a protocol for single sign-on (SSO).)

On the other hand, there may be uses of cryptography that lack even a basic level of ecosystem support. We’ve been calling these “hard cases.” To find them, we wrote a separate prompt that ignores “vanilla” uses of cryptography (e.g. ordinary TLS between internal systems) and instead looks for custom cryptographic protocols, keys, or signatures used in size-constrained fields, cryptography built into hardware, specialized cryptographic constructions (like blind signatures), protocols without a PQ standard, and dependencies on external parties that do not yet support PQ cryptography.

This prompt is shorter and simpler than those used for CryptoLabe, since its only job is to find hard cases.  In our qualitative review, we found that it got better results when it ran in one fell swoop against all our repositories, while also taking in context from our internal ticketing and documentation system.  

Here’s an example of a “hard case” we found: a certificate carried in an HTTP header. Post-quantum certificates and signatures are larger than their classical counterparts, so if the header (or an intermediary, or the application processing the header) assumes a certificate has a certain size, changing the signature algorithm may break the system. Our next step is to determine whether this code will remain in use in the long term. If it will, we need to measure the relevant size limits and decide how to accommodate the larger certificate.

An important lesson here is that no single scan finds everything. Our repository-by-repository scans were effective at discovering common uses of cryptography. Meanwhile, this targeted scan worked better for “hard cases” because it ignored well-understood cryptography and had more context about each product and its dependencies.

The bottom line is that different approaches find different things, and every finding still needs to be checked by the engineers who understand how the system actually works.

Sharing our prompts

We’ve been messing around with the best way to write prompts for CryptoLabe for the last several months.  We don’t yet have a ground-truth dataset for comparing one prompt’s performance against another, and we are not convinced we have 100% coverage of all uses of cryptography in our codebase. Instead, we have iterated by running scans, reviewing findings with the engineers that maintain the repositories, investigating misses that came up during these reviews and revising the prompts.   Nevertheless, we decided to publish selected prompts, so other teams can learn from and adapt our approach. These prompts are starting points, not a standalone version of CryptoLabe, and the quality of their results will depend on the model, tools, context, and engineering review available.

Thinking through your own PQ migration

At Cloudflare, we’re taking a maximalist approach to our PQ migration because of our goal of acting as a provider of post-quantum cryptography for customers and the Internet at large. But most organizations do not need to start by finding every use of cryptography in every repository in every one of their products. In fact, most organizations should not be doing this, because at this time it's a waste of precious resources.

Before scanning a single repository, you can protect traffic in bulk wherever possible. If your websites run through Cloudflare, we protect your data in transit with post-quantum encryption already today; check this out with our new PQ visibility features. Our SASE platform, Cloudflare One, provides post-quantum encryption for private network traffic. Post-quantum encryption is provided at no additional cost and without requiring you to upgrade every origin server or private application on your enterprise network. This gives you a compensating control while you work through discovering and understanding the use of cryptography inside your own systems.

An exhaustive cryptographic inventory is not a prerequisite for action. Instead, organizations should first identify the systems whose compromise would matter most, discover their use of cryptography, and then PQ that cryptography in priority order. Here is one way to begin:

  1. Choose a repository for one important system. Start with something that handles sensitive or long-lived data, authenticates users or software, or is exposed to the public Internet.
  2. Run cryptography discovery against that repository. We hope our description of CryptoLabe will be helpful to this effort!
  3. Validate the results. Ask the team who owns the system to validate the results of cryptography discovery and confirm that the cryptography finding is needed long term and needs to be upgraded to PQ. It’s important to remember that it might not need to be immediately upgraded to PQ if there is another compensating control in place.
  4. Prioritize action. Figure out what upgrades you can make now and what upgrades are blocked. Record shared prerequisites that need help from a library, vendor, standards group, or another part of your organization. Prioritize your findings and make a plan for addressing the highest-impact systems and prerequisites first.

That gives you the beginning of a PQ transition plan, without requiring a complete map of every cryptographic operation in your organization. CryptoLabe is still ever-evolving, but its scans and results have been illuminating to us as we plan our migration. We hope these shared learnings will be useful as you continue to work through your own PQ migration.

Acknowledgements: Many people across Cloudflare provided feedback on and contributed to CryptoLabe, including Davide Marquês, Peter Wu, Phil Schmieder, JP Aumasson, Andrew Galloni, Christopher Patton, Luke Valenta, Mari Galicer, Vânia Gonçalves, and the Client, Tunnel and Gateway teams who reviewed reports produced by the tool.

Building a certificate authority for the whole Internet

Post Syndicated from Steve Goldsmith original https://blog.cloudflare.com/cloudflare-certificate-authority/

Twelve years ago, during Birthday Week 2014, we turned on Universal SSL and nearly doubled the number of encrypted sites on the web overnight, giving free TLS to every site behind Cloudflare, including the ones that never paid us a cent. Encryption stopped being an expensive, time-intensive undertaking and instead became the default.

For Birthday Week this year, we are taking the next step on that path. For more than a decade we have been one of the largest consumers of publicly trusted certificates on the Internet, and have never issued a single one ourselves. That is changing. Cloudflare is announcing our intent to become a public certificate authority (CA).

Today we are announcing the first concrete milestones in that effort: We have applied for inclusion in the Chrome, Apple, Microsoft, and Mozilla root programs, and we have signed a definitive agreement to acquire an established, broadly trusted root from GlobalSign, so that we can offer certificates with the widest possible device reach the day we begin issuing. We’re also announcing our plans to be one of the first CAs to serve post-quantum certificates, targeting Chrome’s recently announced Quantum-resistant Root Program.

We are not issuing certificates yet, and it will be a little while before we do. What we are doing is committing to the work in public, sharing the milestones as they land, and telling you exactly what we are building while working with the root programs and other members of the WebPKI community to achieve this.

Two paths to trust

A brand-new root is not widely useful for years. Even after a root program accepts it, that root has to propagate out into the world's operating systems, browsers, and devices, and it never reaches the large set of devices that have stopped receiving updates, or never received them in the first place. That long tail of older clients is where a great deal of the world’s Internet traffic originates, and where a correspondingly large set of avoidable breakage lives. We believe that all clients deserve the highest level of security possible, regardless of their manufacturer, operating system, or time since last update.

Acquiring an existing root with a high degree of trust store coverage across a diverse set of clients solves that on day one. The existing GlobalSign root has been trusted across browsers, operating systems, and devices since 2012, and it reaches older clients that a fresh root never will. The new root that we will be submitting for inclusion in root key programs is built for where the ecosystem is heading, including the programs that are starting to cap how old a trusted root may be. The established root gives us reach across the devices of the past. The new roots give us standing under the policies of the future. We want both to ensure certificates issued by our CA provide the widest set of customer compatibility possible.

A new source of free certificates

The free-of-charge, automated certificate model now carries most of the encrypted web, and much of it runs through one remarkable operator. Let's Encrypt issues on the order of ten million certificates a day, serves more than 500 million sites, and passed four billion active certificates in 2025. It is one of the best things to happen to the Internet in twenty years, and we say that as one of its largest users.

That success comes with some systemic risk: if the dominant free certificate authority had a bad week, much of the web would have no comparable free, automated alternative ready to take the load. At the certificate pack level, we have spent years building exactly this kind of redundancy for our own customers. Every Cloudflare Universal SSL certificate already ships with a backup certificate, wrapped with a separate key and issued from a different authority, ready to deploy automatically if the primary is ever revoked or compromised. A public CA is that same idea, but at the scale of the whole Internet.

To make it easy to adopt, we will be Automated Certificate Management Environment (ACME)-first, an open standard protocol that is widely accepted. Automated issuance and renewal through ACME will be the way you get a certificate from us, which means anyone already pointed at any existing free CA can move to us by changing a directory URL, with no new tooling and nothing to re-architect.

Certificate growth projections are huge

Cloudflare sits in front of more than 20 percent of global Internet request traffic and terminates TLS for millions of domains, relying on millions of certificates per year to do so. We provision those certificates through multiple CAs, with primary and backup paths so customer services stay up through CA outages and revocation events.

That has taught us not just how the WebPKI ecosystem works, but also that it occasionally fails, from the consuming side, the hard way. We have dealt with rate limits, validation edge cases, revocation latency, chain building, and root distribution lag. We have lived through the CA churn of recent years and felt it through our customers. We know what reliable issuance has to look like from the outside, because our customers' uptime has depended on us being resilient and responsive when an issuer has a bad day.

And as certificate maximum validity period decreases over the next few years, agentic activity increases, and PQ certs go mainstream, we expect the raw number of certificates we rely on annually on to continue to grow, quickly — and we are not alone. We want to not just solve this problem for ourselves, but be part of providing this utility to the Internet, and ensure that the certificate supply chain for our customers has even more providers.

Designing for resilience: transparency and fail small

In taking on this new responsibility of being our own CA, we're committed to making the most reliable and resilient CA possible. We intend to build a certificate authority whose reliability depends not just on avoiding mistakes, but as with the rest of Cloudflare’s products, to “fail small” and limit the impact of any one issue.

That means instituting processes to design and test recovery before any incident occurs. As an example, we will make renewal automation a condition of issuance. We will only issue to clients that support ACME Renewal Information (ARI), standardized in RFC 9773. Subscribers must maintain automation that polls our renewal endpoint, acts on the renewal windows we publish, and identifies the certificate it is replacing.

We're also learning from what we've observed over the past 16 years. We have seen certificate authorities caught between timely revocation and keeping subscribers’ sites online because too many subscribers could not replace their certificates quickly enough. When certificates need to be retired, whether for a compliance issue or a security incident, we can bring forward renewal windows for the affected certificates, spread replacements across the available time, and track replacement issuance.

This is just one of the many ways we intend to build. We will be transparent with our issuance stack and operations, publish reproducible builds of the software that signs certificates, attest the hardware security modules that hold our keys, and run a public dashboard for issuance health and incidents. Audits are point-in-time and tell you a CA passed, not how it runs on an ordinary Tuesday. We want root programs, researchers, and ordinary site owners to watch how a modern CA actually operates between audits.

A certificate authority for the post-quantum Internet

We also intend to lead on where certificates are going, not just where they are. We plan to be one of the first CAs to issue production Merkle Tree Certificates (MTCs), with the first certificates issued in the first quarter of 2027.

MTCs are a new and far more compact way to deliver publicly trusted certificates, designed for a post-quantum world where traditional certificate chains grow large enough to strain TLS handshakes. We have been championing the standards-based proposal for MTCs at the IETF, and earlier this year, Chrome named MTCs as the preferred path for post-quantum authentication. Issuing them in production allows us to protect Cloudflare customers as well as the wider Internet against the post-quantum threat, with real volume behind a transition the whole web has to make. We’ve shared much more about MTCs and what this new Web Public Key Infrastructure (PKI) will look like in a blog post on the topic.

We do not expect that transition to be sudden. Much of the Internet will continue to rely on classic certificates and existing WebPKI for many more years. But across that window we expect MTCs to take a steadily growing share of issuance, and that is why we are building one service that does both. By carrying classic certificates and Merkle Tree Certificates under one CA, with one lifecycle and one set of guarantees, customers can adopt at the pace that suits them and help the web make the crossing without a hard cutover. Customers should not have to pick a side of a multi-decade migration, run two systems, or rebuild when the balance shifts.

As always, Cloudflare will be Customer Zero

In addition to providing certificate packs via Universal SSL for our customers, Cloudflare consumes certificates from many different CAs to run our systems and internal operations. Just like our other products, we will be Customer Zero for the new CA and its certificates (both WebPKI and MTC), ensuring that all aspects of the new systems and processes meet our high internal standards, and that our CA’s infrastructure is exercised at Cloudflare scale.

What happens next

We are working through the application and approval process with each of the core web root key programs. These processes happen in the open, and we’ll share more updates as they proceed, through to the first Merkle Tree Certificates in early 2027. If you want to follow this work or be one of the first to use a Cloudflare CA certificate in the future, you can register for updates.

As we build out this new capability, we will continue to work closely with the network of partner public CAs we have relied on for many years — 16 in fact! — as we all work together to ensure a trusted and open Internet.

When we launched Universal SSL, the argument was simple: every byte that flows encrypted across the Internet makes it harder to intercept, throttle, or censor, and the open web is something we all build together. A public, redundant, transparent certificate authority is that same argument carried one layer down, to the trust that makes the encrypted web possible in the first place. We have been working toward this for a long time, and we are glad to finally be on the road.

Happy Birthday Week!

Adaptive application security for the AI era: how Cloudflare connects code, traffic, and intelligence to stop attacks

Post Syndicated from Daniele Molteni original https://blog.cloudflare.com/ai-era-framework/

In July, AI agents testing new cybersecurity models compromised parts of OpenAI’s infrastructure and Hugging Face’s production environment.

We've all just witnessed one of the first AI-driven successful cyber attacks. When given a task, the agents ignored existing guardrails and autonomously discovered previously unknown vulnerabilities, recovered exposed credentials, moved between cloud environments and coordinated their work through communication channels they created themselves.

The speed of the final compromise was incredible. In under 13 hours, the agents went from executing code on a Hugging Face worker to gaining admin-level access across multiple clusters. But the incident had been brewing for much longer. Responders found clues of activity tracing back to May (agents created an unauthorized message board), to June (internal network scanning) and early July. The relationship between these events was understood only on July 20.

The lesson here is not that AI agents exploit vulnerabilities. That’s not news; human attackers already do that. The change is that agents can work persistently, test multiple paths simultaneously, share discoveries, and chain vulnerabilities, credentials, and permissions into sophisticated attacks.

The incident also shows why application security cannot depend on single tools. For example, network restrictions were bypassed by services connected to the Internet; valid credentials were used to perform unauthorized actions. Rebuilding Artifactory removed one attack path, but agents found another. The key insight is that individual alerts identified pieces of the activity without revealing the complete campaign. OpenAI reached a similar conclusion in its report: organizations need overlapping and independent controls across prevention, detection, and mitigation, continuous validation of security boundaries, and faster mechanisms to correlate and contain suspicious behavior.

We address this challenge by connecting application security across four activities that are too often separated: discovering which risks matter, governing what humans and agents may do, protecting applications at runtime, and turning every investigation into stronger protection. Cloudflare can deliver this framework because of its broad security portfolio and visibility across a vast share of Internet traffic.

Alongside the framework, we connect existing Cloudflare solutions with new capabilities across each stage. These include: using Large Language Models (LLMs) to conduct a penetration test of our Web Application Firewall (WAF), expanding threat intelligence to all customers, and a new feature to automate deploying positive security.

What has changed

The security landscape is shifting. These are the emerging trends we see:

  • The way we build software has fundamentally changed. AI-assisted development allows engineers to produce and deploy software faster outside traditional engineering workflows. That speed creates both more code and more opportunities for vulnerabilities to reach production.
  • Software composition risk is still a risk: applications depend on large chains of open-source libraries, packages, and operating-system components that are intrinsically trusted and are difficult for any team to inspect. What’s new is that AI is now importing libraries that we might not be aware of.
  • Techniques and tactics are changing. LLMs can chain vulnerabilities and use feedback in real time to mutate payloads, evade defenses, and make decisions autonomously. They can operate continuously and at machine speed. Patching faster remains important, but patching alone cannot close the gap. Attackers are always going to be faster than you can update your systems.
  • Agentic traffic. In the past, automation was a synonym for malicious activity. Today, a request generated by an agent or bot may be malicious automation, a search crawler, or an agent purchasing a product on behalf of a customer.
  • Compromised servers, residential proxies, IoT devices, and cloud resources allow attacks to move quickly across infrastructure and identities. A coordinated attack can leverage a number of devices, making it difficult to be identified as a unique campaign.

Application Security’s goal is also expanding. It now needs to address three connected problems: protecting conventional applications from AI-enabled attackers, governing legitimate and malicious agentic clients, and securing applications that contain models, agents, tools, and data.

A connected application security framework

Application security in the AI era must operate as a continuous system rather than a collection of controls that teams update after each new vulnerability. To protect applications in the era of AI, you need to work on multiple activities, which we have organized around four stages:

  1. Discover and prioritize risks
  2. Govern access and agent behavior
  3. Protect applications at runtime
  4. Investigate, respond and learn

None of these activities is new in isolation. What changes is connecting them so discoveries, runtime signals, and investigation outcomes continually improve the controls that follow.

More than 20% of the web sits behind Cloudflare’s network, which gives us visibility into attack infrastructure, payload mutations, emerging techniques, and coordinated campaigns at a scale that few organizations can match. Patterns that look isolated from the perspective of one application can become clear across our network. This combination of global threat intelligence, local application context, and inline enforcement powers every stage of the framework. That local context includes which code is deployed, which endpoints are exposed, what legitimate traffic looks like, which identities are acting, and which controls are already active. Because Cloudflare is inline, we can turn those insights into protections immediately.

Cloudflare is the adaptive security control plane for applications, APIs, and agents. Here is what we are launching today to advance every stage of the security journey.

Discover and prioritize risks

Security teams do not suffer from a shortage of findings. They struggle to determine which findings represent an immediate risk. A useful discovery system must connect vulnerabilities to the production reality, including whether a vulnerability buried in your stack is actually reachable in the first place. We see three main areas you should look into: software composition risk, proprietary code, and runtime penetration testing (pentesting).

Understand software composition risk

Applications inherit risk from open source libraries, packages, operating-system components, and the services on which they depend. This represents the Supply Chain of your application. A package vulnerability alone does not tell a team whether the affected component is deployed, reachable, or exposed to hostile traffic. Open-source software is the top priority when it comes to supply chain risk, and Cloudflare is part of Chainguard Athena, an industry coalition aiming at protecting open-source software from AI attacks.

Scan proprietary code

When it comes to code scanning, you have two options: getting a managed service or developing in-house expertise to run it yourself.

Cloudflare recently announced early access to Vulnerability Discovery and Remediation, a service that uses frontier models to identify application-specific vulnerabilities and deploy WAF mitigations to block targeted exploits while engineers fix the code. The important step is prioritization. Cloudflare connects source-code findings to production traffic and security signals. We can identify whether the affected route is active, and how much traffic it receives.

Pentest your application at runtime

Defenders can also use the same capabilities as attackers. Customers can build their own LLM-based pentesting harness to search for weaknesses, validate findings, and test whether their applications are vulnerable. Discovery becomes continuous rather than a periodic exercise. We have done this internally at Cloudflare since Anthropic’s Claude Mythos was released, and we shared our learnings.

A vulnerability buried deep inside your code is harder to exploit if it can’t be reached from the outside. Our Security Analyst team has already used LLM-based red teaming to test customer applications and our own runtime detections, turning the findings into improved detections for all customers. We are now developing Adaptive Security, a self-service capability that will periodically pentest selected URLs behind Cloudflare, using LLM-powered agents to identify vulnerabilities that are reachable and exploitable before attackers find them.

Govern access and agent behavior

Agentic traffic operates in the space between automation and human: tasks delegated by people, executed by software. This changes how access decisions must be made. Detecting automation is no longer enough. For every interaction, application owners need to answer two questions: Is this entity who it claims to be, and can this interaction be trusted?

These questions can be hard to answer. A recognized agent with a long history of legitimate activity may have high trust, but an unusual action can still create immediate risk. An unknown agent may simply be new; a lack of history does not necessarily mean malicious intent. Cloudflare’s approach is to keep trust and risk signals separate, thereby giving application owners more control than a single bot score or allow-or-block decision, and providing more powerful tools to quickly adapt to change.

Establish identity and trust

Trust accumulates over time, while risk is evaluated for each interaction.

Botbase provides a directory of known automated entities that have registered with Cloudflare. Registration gives legitimate bots and agents a way to declare who they are, while application owners retain control over whether and how those agents may access their sites. Cloudflare is also making registration more accessible to smaller and custom agents, building a verified identity layer across all agentic traffic, not just the major platforms.

Identity alone does not establish trust. Cloudflare can evaluate whether an entity has been seen before, whether its historical behavior was legitimate, and whether its current activity is consistent with that history. This makes it possible to distinguish a recognized agent behaving normally from the same agent suddenly changing established request patterns, location, identity, or transaction behavior.

Understand agentic behavior across the journey

Precursor adds client-side and session-level signals to distinguish human from automated behavior, such as typing cadence, mouse movement, navigation patterns, and sequences of actions. An agent that navigates a checkout flow in two seconds, skipping the browsing and comparison steps a human would take, reveals its nature through the session. These signals help identify whether behavior across a session is consistent with human interaction or automation, giving application owners a clearer picture of the traffic they're managing.

Manage access and adapt

Application owners can block traffic from AI crawlers and decide what activity is allowed on their asset (e.g. search, training, etc.). Adaptive Intelligence combines network, client-side, historical, and behavioral validation signals in a probabilistic model that can be updated as attackers change their techniques. Customer outcomes, including chargebacks and successful legitimate transactions, can feed back into the system to improve future decisions.

The result is a continuously updated assessment of every entity and interaction. Application owners can encourage known, useful automation while applying stronger controls when identity, history, and current behavior indicate greater risk.

Protect applications at runtime

Cloudflare’s reverse proxy protects applications at runtime by filtering traffic before it reaches the origin. In the AI era, a new layered approach is emerging to best filter traffic from malicious requests:

  1. Enforce positive security
  2. Detect attacks and identify LLM tactics and techniques
  3. Protect business logic
  4. Deploy real-time threat intelligence

Enforce a positive security model

You can dramatically reduce the attack surface by learning what legitimate traffic looks like, allowing conforming requests and blocking everything else. Today we are announcing Application Profiles, which automatically learns the structure of your web or API application and detects non-conforming requests. Application Profiles automates the learning process and adds a layer of interpretation. Based on the learned profile, we can understand the business logic of different endpoints and request parameters and help you prioritize what endpoints require more scrutiny and attention.

Detect attacks and identify LLM tactics and techniques

Traditional WAFs are designed to run highly crafted rules to detect Common Vulnerabilities and Exposures (CVEs) and malicious payloads. Before AI, the time to disclose new vulnerabilities was measured in months and days. Not anymore: now we see vulnerabilities being exploited before they are disclosed, so the time to patch is nearing zero.

Different tools can be deployed to detect known exploits. These tools include:

  • Managed Rules hardened with frontier models. We’ve partnered with major model providers to use frontier models for adversarial validation. We used the latest models to pentest the WAF to uncover bypasses and vulnerabilities. All customers benefit automatically from ongoing improvements.
  • Machine Learning detection. While signatures are great for high-precision attack detections, machine learning can stop attacks before they are discovered and disclosed. Attack Score detects attack mutations and evading techniques that are often used by LLMs. Attack Score is available to all Cloudflare Customers
  • AI Security for Applications. Chatbots and Internet-facing LLMs are subject to a new class of attacks, such as prompt injection and sensitive data exposure. You can protect generative AI traffic by deploying guardrails and security detections designed to stop these attacks.

Protect business logic

Attackers can still craft legitimate requests and abuse business logic to gain advantage on the application. For example, an attacker uses a valid password-reset flow repeatedly to take over accounts. Fraud detection tools, including account takeover and leaked credential detections, help prevent abuse in which the request appears legitimate, but the intent is malicious.

Real-time threat intelligence detection

Back in June, we launched always-on detection based on our threat intelligence feeds. Cloudforce One customers can deploy protections to block requests originating from compromised infrastructure. We are now also expanding access to Cloudforce One’s Threat Events Platform, our core threat intelligence offering, to all Cloudflare accounts for free.

Investigate, respond and learn

The OpenAI Hugging Face incident did not begin with the final 13-hour compromise. The activity stretched from May to July, with signals including an unauthorized message board, internal network scanning, and movement across environments. Viewed separately, each event revealed only part of the activity. Together, they showed the behavior of a developing breach. Security operations must therefore identify sequences of behavior that lead to compromise, not simply evaluate alerts in isolation.

This is difficult for security teams that already protect large attack surfaces with limited resources. Alerts arrive from different tools and datasets, leaving analysts to determine which events are connected, collect the evidence, and identify whether the activity is escalating.

Cloudflare is building a platform to automate security operations. Deterministic workflows establish the customer and investigation context using trigger history, traffic baselines, enforcement outcomes, and network observations. A detection agent searches authorized datasets for anomalies and correlations. When it finds suspicious activity, specialist agents review the evidence alongside customer history and threat intelligence, helping analysts connect isolated events to broader campaigns. The system can then recommend mitigations, such as rate limiting, WAF, or DDoS protection changes, for human approval.

We are developing these capabilities with Cloudflare’s Managed Defense team, whose analysts are helping us test how evidence is collected, correlated, and turned into recommendations. We plan to make them available more broadly over time and will share more as this work progresses.

Cloudflare’s combination of reverse proxy and forward proxy services makes this correlation especially powerful. Application Security signals can reveal attempts to exploit a public-facing application, while Cloudflare One can surface subsequent activity across corporate traffic. Connecting these datasets can link an external attack with unusual access, internal scanning, or potential lateral movement, turning separate alerts into a timeline of compromise and helping analysts intervene before the breach progresses.

Looking ahead

AI is changing how software is built, how attacks unfold, and who interacts with applications. Security teams can no longer manage discovery, access, runtime protection, and response as separate activities.

Cloudflare is bringing these capabilities together in a closed-loop system powered by global intelligence, local application context, and inline enforcement. A vulnerability finding can strengthen runtime protection, runtime activity can guide an investigation, and each analyst decision can improve future detections and controls.

No organization can anticipate every new technique. The goal is to build a security system that learns from each attempt, responds faster, and becomes more effective over time. The capabilities announced today are the next step toward that adaptive model of application security.

Building a post-quantum certificate authority with Merkle Tree Certificates

Post Syndicated from Mari Galicer original https://blog.cloudflare.com/pq-ca-with-mtcs/

When you type in an address into a browser, how do you know you’re connecting to the right website? The Web Public Key Infrastructure (Web PKI) is the complex and distributed ecosystem of policies, protocols, and infrastructure operators that helps you trust that you’re not being misdirected to an incorrect or malicious website. In the past few decades, this ecosystem has undergone significant changes. One is the addition of transparency: the now-mandatory requirement that all certificates be logged in public certificate transparency logs. Now it faces another challenge: the imminent arrival of a quantum computer, which has prompted us to upgrade to post-quantum (PQ) cryptography by 2029.

This transition is not straightforward: simply swapping post-quantum cryptography into certificates at Internet scale would lead to unacceptable performance degradation. This moment calls for a new approach to the Web PKI, one that allows us to treat transparency as a first-party property rather than an add-on, and design a new system that scales post-quantum signatures efficiently.

After gaining broad support across the industry, Merkle Tree Certificates (MTCs) have emerged as the path forward. This year, after a successful experimental deployment with Chrome, Cloudflare is full steam ahead on MTCs.

Following today’s announcement that Cloudflare is becoming a certificate authority (CA), we’re excited to share that this CA will support MTC issuance, targeting early 2027 for inclusion in Chrome’s newly launched Quantum-resistant Root Store. As part of our mission to help build a better Internet, and following in Cloudflare tradition of offering the strongest available cryptography for free, we will provide standard MTC issuance at no cost. Having a CA that supports both classical certificate and MTC issuance allows us to default to the most secure authentication method available, providing a painless and performant PQ upgrade path for a large swath of the Internet.

The current trust ecosystem

To understand how MTCs are changing the game, let's start with some background on how trust works on the web today.

On the client side, browsers — in this case, “TLS clients” — maintain root programs, which specify a set of policies that CAs must follow to be trusted. On the server side, CAs are the trusted gatekeepers: they operate certificate issuance infrastructure where they validate domain ownership and attest to the binding of a domain name and a public key that shows ownership of that domain.

But how do we check that CAs are following the rules? Enter certificate transparency (CT), which makes certificate issuance publicly auditable. When a CA issues a certificate, it must also submit that certificate to at least two public logs. Cloudflare has operated the Nimbus family of CT logs since 2016, and is launching Raio, a new family of static CT logs, going forward.

While the CT ecosystem makes certificates publicly viewable, it doesn't mean they are correctly issued or safe to use. Monitoring helps with this by comparing those log records with what domain owners expected and reporting suspicious activity. Cloudflare launched Certificate Transparency Monitoring in 2019 and recently made it generally available. We also publish large-scale measurements about certificates on the Certificate Transparency page in Radar (formerly known as Merkle Town).

As organizations begin upgrading their servers to use PQ authentication, certificate transparency monitoring will take on an even more important role in detecting potential post-quantum downgrades. Domain owners who have upgraded their domains to post-quantum authentication should monitor CT logs for unexpectedly issued legacy certificates to prevent clients from falling back on a malicious downgrade path.

Part of the problem with this current system is that transparency was an add-on, causing it to run into scaling issues. Certificates are frequently logged multiple times, in different forms, across multiple logs, requiring monitors to download and process every log to avoid missing an issuance. This can be expensive — making it difficult to encourage a diverse set of log operators at Internet scale. According to our estimates, PQ signatures will balloon the amount of data that CT logs need to store by 40x. This scaling challenge, and subsequent incentive misalignment, is at the heart of the post-quantum scaling problem.

The post-quantum scaling problem

We've written extensively about the challenges of scaling post-quantum cryptography, but in short: to support server authentication at Internet scale, the WebPKI must authenticate roughly a billion TLS servers without preloading every server’s public key into every client. Traditionally, CAs addressed this problem by using certificate chains as a trust-distribution mechanism. But over time, additions like key revocation checks and certificate transparency have added more public keys and signatures — five signatures and two keys in a typical TLS handshake. PQ signatures are roughly 40 times larger than classical ones, creating larger overheads that would be expensive for clients, CAs, logs, and monitors to handle at scale.

Enter Merkle Tree Certificates (MTCs), a draft specification from the IETF PLANTS working group that describes an architecture for compact, efficient, post-quantum certificates. MTCs batch certificates into an append-only Merkle tree, allowing a CA to sign the root of that tree instead of many individual certificates. This allows browsers or other clients to verify a certificate using a compact inclusion proof — a sequence of cryptographic hashes — against a signed tree head rather than validating each certificate individually. A key idea behind MTCs is "don't log what you issue, issue by logging." By coupling issuance and logging, transparency becomes a requirement for operation, rather than an add-on.

The role of a certificate authority in a redesigned PKI

We’re building out our capability to issue MTCs as an integral part of our creation of a Cloudflare CA. That means keeping track of new PQ Root Program requirements, and writing an issuance and mirroring software stack at the same time we’re building the facilities, operations, and compliance functions of the traditional  CA — no small feat!

The upside is that we get to prioritize the requirements and architecture for this new, post-quantum PKI from day one, building our setup in a way that feels right for Cloudflare's values and global network — aiming to be as transparent as possible as we embark on this new journey.

Let’s take a look at the architecture updated for MTC:

If you compare this to the traditional CA ecosystem, you'll notice that the responsibilities of a CA stay mostly the same: to validate control of a domain, bind it to a public key, and issue certificates. The main difference is that in the MTC ecosystem, instead of signing certificates directly and then logging them, the CA now maintains a transparency log backed by a Merkle tree, where an inclusion proof that the certificate is indeed in the tree serves as the trust anchor. CAs will also operate Mirroring cosigners that store a copy of issuance logs, verifying their append-only consistency and ensuring the transparency and availability of these logs for the broader ecosystem.  

Issuing MTCs

MTCs come in two forms, both of which can be encoded in the X.509 certificate format that client software recognizes today — just with a “funny” signature algorithm. In standalone form, the certificate’s signature value contains a cosigned tree head of an issuance log and an inclusion proof (a sequence of hashes) demonstrating that the certificate is contained in that log. If clients are able to obtain the cosigned tree heads out of band (e.g., via a browser update mechanism), the certificate can instead be served in landmark-relative form, where the signature value consists of the lightweight inclusion proof with no heavyweight post-quantum signatures at all.

For simplicity’s sake, let’s take a look at an example of standalone certificate issuance. When a website wants a certificate for their domain, they can request it from a CA via the Automatic Certificate Management Environment (ACME) protocol, which handles certificate requests, domain-control validation, and issuance workflows. Cloudflare's ACME infrastructure will be a fork of Boulder, the widely deployed and well-tested ACME software that powers Let's Encrypt. Let's Encrypt is actively developing MTC support in Boulder, and we plan to maintain our own fork that incorporates these upstream changes along with Cloudflare-specific modifications, contributing back upstream where possible.

When the MTC CA receives a certificate issuance request, the CA's ACME server checks that the server actually controls the domain. If those checks pass, the CA serializes that data and adds it to an append-only log.

After adding the MTC entry into its issuance log, the CA computes the updated state of the log, and then signs a checkpoint over that state. This checkpoint attests that the CA issued every entry included in the log’s Merkle tree up until that point in time.

The CA then sends its updated log state and new checkpoint to a trusted cosigner, which durably stores a copy of the CA's issuance log and checks that each new state is append-only, consistent with the previous tree, and correctly formed. This additional cosignature gives clients and monitors confidence that another trusted party has observed the same log state and verified that the CA is not presenting different views of issuance to different parts of the ecosystem. It also ensures that the issued certificates will be available for monitoring even if the CA issuance log is unavailable.

Chrome’s Quantum-resistant Root Program draft policy mandates at least two cosignatures: one from a Chrome-recognized Mirroring Cosigner operated by a distinct organization, and one from the issuing MTC CA itself. As such, we'll operate mirrors for other pilot CAs — and require at least one independent cosignature on our own issued certificates.

Cloudflare will implement our mirroring cosigner in Azul, our open-source Rust-based transparency log, and for maximal interoperability, it will implement c2sp's tlog mirror protocol.

Finally, after successfully receiving a cosignature from a mirroring cosigner, the CA constructs an MTC with the cosignatures, server's public key, and an inclusion proof. It then sends that MTC to the server, which can then use it for TLS moving forward!

Delivering PQ signatures efficiently: the landmark optimization

While standalone certificates are functional, they still send large PQ signatures over the TLS handshake, limiting their efficiency. The real performance improvements provided by the MTC design are landmark-relative certificates.

Instead of sending cosignatures in every certificate, CAs can designate a sequence of subtrees that cover all active certificates in the log as a landmark, and distribute those subtrees (along with data to authenticate them) to clients via an out-of-band update service. During a TLS handshake, the actual authentication to the server happens by the browser checking that the server's certificate data — including its domain name and public key — appears in a trusted subtree of the CA’s log. If the inclusion proof connects that certificate to a cosigned landmark, and the public key then proves possession during the TLS handshake, the client knows it is talking to the right server.

Periodically transmitting these signatures and tree metadata to TLS clients out of band, a small set of MTC batch signatures can efficiently cover billions of certificates issued by a given CA. While landmarks are more efficient at scale, they do not eliminate the need for standalone MTCs — clients may be newly installed, offline, or missing the relevant landmark update. That’s why it’s important that servers retain a standalone certificate fallback.

MTCs in the wild: results of our experiment with Chrome

This year, we ran an experiment with Chrome to test the feasibility of MTCs between a client and server. We operated a "bootstrap CA" (a fake CA that stubbed the issuance pipeline) that issued MTCs backed by a traditional certificate chain for a selection of Cloudflare domains on Cloudflare's "free" plan and served them to 50% of Chrome Beta 146. Over the course of the experiment we successfully served billions of MTCs.

For TLS, we found that the common case is fairly efficient: with a landmark-relative certificate, the handshake only needs to transmit one public key, one signature, and one inclusion proof of less than 1kB. In the experiment, we fell back to the traditional certificate chain instead of serving a standalone certificate in cases where we were unable to negotiate a landmark-relative certificate with the client. On the CT side, MTCs also change the scaling properties of transparency: the log only needs to carry hashes of public keys; there are no per-entry signatures, and the signature on the tree head covers the whole log. This prevents certificate explosion because the CA issuance log is the source of truth for all certificates the CA issues, and log consumers only need to fetch a single copy of each certificate.

The result: MTCs really work! At median, using a MTC is 9% faster using landmark MTCs over a classical signature chain (admittedly, most of this performance benefit is due to intermediate elision). And because we tested MTCs with classical signatures, we expect an even greater improvement with post-quantum signatures. Satisfied with these results, and with the level of cross-industry collaboration with MTCs at the PLANTS WG at the IETF, we began winding down the experiment last month (August 2026).

The road ahead for MTCs

We’re excited that our experiment with Chrome showed that MTCs can work in practice, and are especially excited to be able to issue certificates as a real CA.

However, there are still broader questions that we can only answer by running this great experiment with the full PKI ecosystem. Can independent monitors consume and verify MTC issuance logs at production volume? Will multiple CAs and cosigners emerge so that the system has the diversity needed for resilience? How should browsers balance the performance benefits of compact landmark MTCs with the fallback paths needed for clients without fresh landmarks? MTCs have emerged as the authoritative design for post-quantum authentication, but proving it out at production Internet scale will require participation from a diverse set of root programs, browser vendors, CAs, mirrors, monitors, and the wider community.

We see the opportunity to participate in this next phase of the Web PKI as an honor, and we take the responsibility of operating CA infrastructure seriously. CAs occupy a privileged position in the trust ecosystem — browsers, domain owners, and everyday people rely on them to validate identities correctly, protect signing keys, follow policy, and operate reliably. Before Cloudflare's CA can be trusted by browsers to issue MTCs, we will need to apply to Chrome's Quantum Resistant root store and undergo a rigorous evaluation process. We welcome that scrutiny, and we expect to hold ourselves to the same high bar as any other CA trusted with helping secure the Internet. We hope other CAs will emerge to support MTC adoption, and we're excited to work with any browser that wants to deploy MTCs.

We tested our own WAF with frontier AI models. Here’s what we found

Post Syndicated from Vikram Grover original https://blog.cloudflare.com/adaptive-ai-waf-testing/

“Is your WAF ready for frontier AI models?” We keep hearing this question from our customers, so we decided to find out.

When it comes to exploiting applications, what LLMs are really good at is iterating and mutating attack payloads faster than any human hacker could do. LLMs can use real-time responses to iterate and change their techniques by, for example, testing different encodings, sending the payload in a different part of the HTTP request, or moving to the next vulnerability to test.

Even before LLMs were around, security engineers used two common approaches to test applications: static and dynamic application security testing. The former analyzes code without executing it to identify vulnerabilities, while the latter probes running applications to find runtime flaws. There are plenty of works scanning code with frontier AI models, including details on how to build your own harness.

For the project described in this blog post, we took a dynamic approach: making the LLM act as if it was a hacker to evaluate whether a WAF is doing its job. The LLM had no visibility into source code, no view of the WAF's rules, and could only see selected HTTP response data.

We built a WAF tester that starts from known exploits and then iterates by changing how it is encoded or delivered, sends it again, and uses the response to choose the next variation. A request that was not blocked became a lead for human review, not a confirmed exploit.

We ran the tester against an authorized customer staging environment across six attack categories and recorded 1,107 attempts. After reviewing the non-blocked requests and removing malformed, benign, duplicate, and out-of-scope observations, the vast majority of the attacks were blocked by the Cloudflare WAF. The requests that got through helped us create new detections to harden our security to benefit all Cloudflare customers.

Here we will explain how we set up the system, the types of attacks we tested, which attack vectors bypassed the WAF more easily, and how we fixed it. Most importantly, we share what we learned from this process and how this exercise is becoming a foundational building block of our WAF development lifecycle.

Finally, we offer guidance to help you correctly deploy your WAF in front of your application and, most importantly, patch your software. A payload that bypasses the WAF still needs an exploitable application to succeed, so keeping your stack up-to-date remains one of the strongest defenses against attackers.

How the adaptive loop works

To test our WAF with frontier models, we built a system that iterates over multiple scenarios. A scenario means choosing one attack category, placing the input in a specific part of the request, starting with a version the WAF already blocked, and giving the tester a fixed number of attempts to try other variations. The loop runs LLM models twice: the first is the proposal call, the second is the review call.

The first call receives the starting request, the context, a short history of earlier results, and suggests the next variation, then the code builds and sends the request. The review call receives the request context, response status, selected headers, and the response body. The loop stops when mutations stop producing useful variations or when a hard coded attempt limit has been reached.

Both model calls work without access to WAF internal information. Neither receives rule expressions, rule IDs, WAF Attack Score details, or the identity of the security layer that acted. We implemented the system in Python rather than wrapping an existing penetration-testing tool. It handles HTTP replay, scenario orchestration, state tracking, and result collection.

In the current implementation, the models do not send requests directly — code controls what happens at each step. Before each request, it checks the target hostname against an allowlist, disables redirects, records the attempt, and enforces the attempt limit. After each request, it records the response and uses the model's review to choose the next predefined step. Response text may appear in a later prompt, so the tester treats it as untrusted input. Neither model call can deploy a rule nor change enforcement.

The system records structured evidence for each attempt.

Six attack categories against one WAF configuration

The main run targeted an authorized customer staging environment protected by Cloudflare’s WAF. We used an allowlisted test User-Agent so the customer’s automated-traffic controls would not stop the test before requests reached the WAF.

We ran 45 scenarios. For each, we looked for ways to deliver the same attack differently: different encoding, different part of the request, or the same destination written another way. Of these, 44 covered six attack categories: cross-site scripting (XSS), SQL injection (SQLi), command injection (CMDi), server-side request forgery (SSRF), path traversal or local file inclusion (LFI), and Log4j. The remaining scenario covered log injection, reported separately.

The WAF in the test zone was configured as follows: WAF Attack Score blocking scores of 30 or below, all Cloudflare Managed Ruleset enabled, and OWASP Core Ruleset with Paranoia Level 3.

For the headline measurement, we recorded whether the WAF blocked each request or not. The results describe the configured WAF boundary as a whole, not the performance of any individual rule or detection mechanism.

What adaptation looked like in one recorded session

Here is an example of how the LLM adapts a Server-Side Request Forgery (SSRF) attack during the test.

Cloud metadata services can expose temporary credentials to workloads. An SSRF vulnerability can let an application fetch that data on an attacker's behalf. A WAF can help stop the malicious request before it reaches the application, but it is only one layer of protection.

In this SSRF scenario, the tester sent the same cloud metadata address in different forms (such as integer, octal, and trailing-dot representations of the same IP) and placed it in different parts of the request. The WAF blocked all of them except one. At attempt 18, the model kept the same request structure as the previous blocked attempt and switched to the trailing-dot form. The client encountered a redirect rather than a WAF block.

The table below shows selected moments from the session. The hypothesis column summarizes what the model said it was trying before each move. It is not a verbatim transcript, and it is not proof that the explanation was correct.

Attempts 17 and 18 are an interesting pair: same request structure, different host representation. One was blocked, one was not. That gave us a specific question: does the trailing dot change how the WAF reads the destination? It was a lead to investigate, but not proof that metadata was accessed.

This was one selected trajectory among 45 scenarios. The next section shows how we counted and triaged the full run.

What we found

Our tester generated 1,107 attempts and the overall result was strong with XSS, LFI, SQLi, and Log4j having near full coverage. While the run produced useful findings, it also produced noise. After human review, we were left with 49 findings worth investigating, 48 of them belonging to CMDi and SSRF. 

Here is how they break down:

Metric

Value

What it means

Recorded mutation attempts

1,107

Model iterations across 45 active scenarios; not all produced a usable result

Post-triage result set

607

The 558 blocked requests plus 49 documented WAF-relevant findings

Blocked requests

558

The WAF stopped these before they reached the application

WAF-relevant findings

49

Documented for remediation analysis after human review

The rest did not produce a result worth counting as the model failed to generate a usable HTTP request, some failed before reaching the target, or the payload generated was benign.

When a request was not blocked, we worked through five questions before counting it as a finding:

Question

Why it matters

Did the tester actually send a valid request?

If the model failed or the request never reached the target, the result tells us nothing about the WAF.

Was the request clearly not blocked?

An ambiguous response is not enough to count.

Was the request still malicious?

Changing a request to get it past the WAF can also make it harmless.

Did the behavior belong to the WAF?

Some attacks only work through DNS or network paths the WAF cannot stop at request time.

Could engineers reproduce it safely?

A fix needs a stable test case with a clear expected result.

We removed anything that failed those checks and combined duplicate cases. What remained became the input for rule, normalization, and mitigation work.

Findings became detections

Not every finding needed a new rule. Some pointed to gaps in existing Managed Rules coverage. Others pointed to how the WAF normalized the request or belonged to another security control. We replayed each case and decided where the change should happen.

We grouped related findings into four sets of candidate rules, validated each finding, and tested candidates against live traffic before any rule could protect customer traffic.

Before a new or updated rule can protect customer traffic, we check its impact on legitimate traffic and assess false-positive risk. Some of the issues we find when evaluating a new rule candidate include:

Issue

Next step

Missing or narrow detection

Review whether existing rules cover the finding

Equivalent inputs interpreted differently

Engine or normalization review

False-positive risk is too high

Revise or reject the candidate

This work contributed to three changes in Cloudflare's Managed Ruleset: new detections for SSRF – Obfuscated Host and SSRF – Restricted Protocol in the July 21 release, and improvement of the existing SSRF – Cloud rule. The SSRF – Obfuscated Host detection came directly from requests that encoded internal addresses in non-standard numeric forms.

What we learned

The model was only one part of the test. We ran the same scenarios with two versions of the same model family. They produced different variations – and the same underlying issues appeared in both. Because request replay and evidence capture stayed consistent, we could compare the runs without treating either model's output as ground truth.

More attempts within one scenario did not always find more. Some scenarios started repeating earlier ideas near the end of the 25-attempt limit. We got broader coverage by testing more starting requests, attack categories, and input locations instead of extending one sequence.

The model generated requests. We decided which ones mattered. A request that was not blocked still needed replay and human review before it could become a finding, a mitigation, or a regression test. Without that review, there were no findings.

What customers can do now

WAF is just one layer of detections you can deploy. When you deploy all available protections you increase the effectiveness of your overall stack. 

First of all, check that Managed Rules, WAF Attack Score are set up correctly in front of your application. Other tools you can deploy include API Security, Bots and Fraud detection, and Threat Intelligence to strengthen your posture even further. For example, positive security controls add a different layer: instead of looking only for known attack patterns, they define the request shapes an application expects and identify inputs outside that contract. This drastically reduces your attack surface area. 

Customers do not need to reproduce this experiment. To maximize the number of rules deployed in front of your application, we recommend running Managed Rules in log first, review matching requests in Security Events, and confirm legitimate traffic is unaffected before moving a rule to Block. Alternatively, customers can reach out to their account team to get Attack Signature Detection turned on, on their zones. This new feature simplifies how to review matched traffic and how to deploy signature detections. If you already perform application security testing, run those tests against a staging hostname protected by the same Cloudflare controls as production.

Next steps

By combining adaptive AI-driven testing with human triage and validation, we found detection gaps that fixed tests might miss and turned those findings into stronger WAF protections, improving our block rate. In a future post, we will share results from further testing using a white-box approach, where the model knows both the application’s vulnerabilities and the WAF rules protecting it.

Is your domain using post-quantum encryption? Now you can see for yourself

Post Syndicated from Andrew Depke original https://blog.cloudflare.com/post-quantum-visibility/

Today, we are introducing additional post-quantum (PQ) cryptography visibility tools into Cloudflare's Application Security and Logs products. You can now inspect and graph the adoption of post-quantum TLS 1.3 encryption for live traffic from directly within Logpush, Log Explorer, and the HTTP Traffic Analytics dashboard. By surfacing the key exchange algorithm negotiated on every incoming request from visitors to our platform, Cloudflare gives customers granular, per-connection telemetry to audit their post-quantum posture, assess compliance, and identify cryptographic gaps across their domains.

Cloudflare is targeting 2029 for full post-quantum security, and executing a cryptographic transition at scale requires detailed telemetry. We’ve already deployed post-quantum encryption across many of our products, including in our cloud-proxy platform and on every on-ramp and off-ramp of our SASE platform.   As many of our customers work towards quantum-readiness deadlines around 2030, we’re helping ease the transition by making post-quantum encryption the default in many of our products, sharing learnings from our internal cryptography discovery tool, and launching the new post-quantum visibility features for TLS that we’ll cover in this blog.

Bringing post-quantum visibility to the domain level

When it comes to post-quantum visibility, we already have macro-level visibility into Internet-wide post-quantum adoption in TLS through Cloudflare Radar. On Radar, we track global post-quantum encryption statistics, both when Cloudflare proxies HTTP requests from visitors (the visitor-to-Cloudflare connection) and when Cloudflare connects to origin servers (the Cloudflare-to-origin connections), as shown in this figure.

From Radar we can see that about 70% of browser-generated traffic hitting Cloudflare's network (on the visitor-to-Cloudflare connection) is protected with post-quantum encryption using hybrid ML-KEM (FIPS 203).  Meanwhile, we can see that today, just about 15% of origins that Cloudflare connects to use hybrid ML-KEM. These are aggregate numbers; the first number is aggregated across all the browser-generated traffic we see, and the second number is aggregated across all the origins we connect to.

We’ve also recently launched Automatic Key Exchange for the Cloudflare-to-origin connection, which reveals which cryptographic algorithms are supported by a given origin. This is useful because outdated configurations can cause an origin to connect to Cloudflare using classical cryptography, even if it does support a post-quantum encryption. 

While Radar and Automatic Key Exchange both provide valuable macro-level views of Internet-wide readiness, our customers have asked us to be able to go beyond aggregate numbers and dive into the behavior of individual domains.

We have long provided visibility into the TLS version used at individual domains (TLS 1.3, TLS 1.2, etc.).

But until now we have not exposed information about the cryptographic algorithms used with the TLS version used at the domain level. This means customers could not answer questions like “What fraction of traffic to my domain www.example.com is using post-quantum encryption?” This information is helpful when aiming to comply with regulatory frameworks, troubleshooting a migration to post-quantum encryption, or seeking to understand which fraction of traffic that is exposed to future quantum adversaries. Now, these questions can be answered.

Post-quantum cryptography in TLS

Before we get into the new product features, let’s do a quick review of post-quantum cryptography in TLS, so we can understand the information that the feature surfaces.

In 2024, the National Institute of Standards and Technology (NIST) stated that RSA and Elliptic Curve Cryptography (ECC) should be deprecated by 2030, and many governments and regulators have since gotten behind that deadline. That’s why today, many of our products are protected with post-quantum encryption using a cryptographic key agreement algorithm called hybrid ML-KEM. Post-quantum encryption is needed right now to stop harvest-now-decrypt-later attacks, where an adversary harvests data today and then decrypts it in the future once powerful quantum computers come online. Organizations that have data that are valuable even if decrypted in 3–10 years (public sector, defense, finance, telecom, healthcare, and others), should consider immediately protecting their traffic with post-quantum encryption.  

 In TLS 1.3, the key exchange group X25519MLKEM768 is the only recommended algorithm for post-quantum encryption. It is now the algorithm preferred by most major browsers. (Note: post-quantum encryption is not available in TLS 1.2 or any earlier version of TLS.)   If you are using Chrome, you can check the key agreement algorithm used by this webpage (or any other) by right-clicking “Inspect”, going to the “Security” tab and looking for the below:

With X25519MLKEM768 in TLS 1.3, the client and server execute both:

  • the Elliptic Curve Diffie-Hellman Key Exchange (ECDHE) over curve X25519 and
  • the post-quantum Module Lattice Key Encapsulation Mechanism (ML-KEM)

X25519 and MLKEM768 each produce a shared secret. TLS then combines those two secrets and uses the result to encrypt TLS traffic. This hybrid approach provides belt-and-suspenders security; as long as one of the two key exchanges is secure, the resulting shared secret is also secure. TLS 1.3 also supports other key exchange groups, including X25519, P-256 and P-384, all of which are just classical ECDHE over different elliptic curves; these algorithms are still used all over the web. In earlier versions of TLS you can also find key agreement based on the RSA algorithm, which is quantum-vulnerable and thankfully much less popular these days due to many known classical security problems.

But post-quantum encryption is only the first part of the story; the second part is post-quantum authentication. Once powerful quantum computers exist, we need to worry about upgrading the certificates and signatures used in TLS 1.3 away from RSA and ECC and towards post-quantum algorithms like ML-DSA. We’re actively making progress towards that goal. In fact, we recently announced that origins can use ML-DSA-44 certificates over TLS 1.3 to connect to Cloudflare, and today we announced that we’re launching a certificate authority that will support post-quantum Merkle Tree Certificates. Nevertheless, for now it remains true that post-quantum encryption with hybrid MLKEM is more broadly deployed than post-quantum authentication.

Bringing post-quantum visibility to the visitor-to-Cloudflare connection

Today we’re making it possible to see the extent to which post-quantum key agreement is used on the visitor-to-Cloudflare connection for any domain in HTTP Traffic Analytics dashboard, Logpush, and Log Explorer.

To view the TLS key exchange data on your domains, go to the Cloudflare Dashboard, and navigate to HTTP Traffic under the Analytics tab. Here you’ll get in-depth statistics about the kinds of traffic visiting your domains, now including a dedicated card for TLS Key Exchange groups on the visitor-to-Cloudflare connection. (Scroll down to find it!) Here’s a look at a TLS Key Exchange card for one of our test domains:

As you can see, the majority of the traffic to this domain uses post-quantum X25519MLKEM768 (in TLS 1.3).  We see some traffic using classical ECDHE over curve X25519 or P-256 (in TLS 1.3 or below).  The traffic labeled “None” is using either RSA key agreement (in TLS 1.2 or below) or no TLS at all. And finally we have a small number of visitors using the now-deprecated X25519Kyber768Draft00 algorithm with TLS 1.3, which we implemented back before X25519MLKEM768 was fully standardized by the Internet Engineering Task Force (IETF). We’ve waited to remove support for X25519Kyber768Draft00 until observed connections are diminishingly small, to avoid regressing clients for which this is their only way to support PQ encryption.

While we’re here, we’ll just drop a few tips about PQ-ing your traffic. If you look at your domain and find no use of X25519MLKEM768 at all, you should confirm that TLS 1.3 is enabled. In the Cloudflare dashboard, select your domain, go to SSL/TLS > Edge Certificates, and then scroll until you find the TLS 1.3 switch; switch TLS 1.3 to On. (There is no separate post-quantum setting: when TLS 1.3 is enabled and a visitor supports X25519MLKEM768, Cloudflare negotiates it automatically.) Also, if the vast majority of your traffic is over classical X25519, P-256, P-384, or None, it might be because most visitors to that domain are non-browser clients that lack support for X25519MLKEM768 and/or TLS 1.3. (Again, most major browsers do prefer to negotiate a TLS 1.3 connection with X25519MLKEM768.)

The key exchange group can now also be a filtering term in the HTTP Traffic dash. Here’s how to take a look at the traffic that is not using post-quantum encryption with X25519MLKEM768:

Analytics are great for aggregate investigations, but being able to see this information in individual log lines can be even more powerful. You can enable the new ClientTLSKeyExchangeGroup field, under the TLS category in the HTTP Requests dataset, to gain visibility into individual post-quantum key exchange in your Log Explorer and Logpush connection logs.

With this new field enabled, you’ll see it start appearing in your Logpush HTTP Request logs, like so:

Visibility to origins and more

The release of the key exchange group stats represents the first major milestone in our broader cryptographic visibility initiative. Designed for scalability, our underlying telemetry pipeline is built to ingest additional cryptographic parameters from TLS handshakes.

That’s why we’ve also surfaced the key exchange group from the Cloudflare-to-origin connection and to provide end-to-end visibility from eyeball to origin in Logpush as OriginTLSKeyExchangeGroup. (This group will be the same for all visitor connections made to that domain, which is why it's not shown in the HTTP Traffic Analytics dashboard).

And for customers that use legacy origin servers that are unlikely to support modern post-quantum cryptography, don’t despair. You can put the origin server behind a Cloudflare Tunnel, to tunnel traffic from the origin server to Cloudflare over TLS 1.3 with X25519MLKEM768, without need to upgrade the legacy origin server itself. This is what the network configuration would look like if you put your origin server behind a Cloudflare Tunnel:

Eventually we’ll be able to also surface post-quantum authentication (namely the algorithm used for certificates and signatures in TLS, including Merkle Tree Certificates) once we start to see a broader-based deployment of that technology.

Your domain has started its post-quantum journey

If your domain is behind Cloudflare, its post-quantum journey is already underway. Check HTTP Traffic Analytics dash and your logs to see the percentage of visitor connections to your domain that already use TLS 1.3 with post-quantum encryption (X25519MLKEM768).  You can also check logs to see if you’re using post-quantum encryption on the Cloudflare-to-origin connection. If your origin server is too ossified to support post-quantum cryptography, then just put it behind Cloudflare Tunnel. With the right settings and visibility, you can protect more of your traffic on Cloudflare from harvest-now-decrypt-later attacks today.

We thank Luke Valenta, Ollie Hsieh and Alex Krivit for contributions to this work.

Introducing Threat Signals: agentic skills for open-source threat intelligence, free for every Cloudflare account

Post Syndicated from Emilia Yoffie original https://blog.cloudflare.com/threat-signals/

Organizations can now scale threat intelligence expertise the way they scale infrastructure. Threat intelligence analysts and network defenders have long automated the ingestion of structured threat feeds to help enrich their SIEM or WAF. The harder work has always been unstructured reporting: turning a research post into indicators your tools can use, without losing the context that explains why they matter. AI skills make that work possible to automate. A skill is a set of rich, detailed instructions that captures how an experienced analyst handles one part of the job, and it runs the same way on every report. 

Threat Signals puts that process into practice at scale. It’s launching today, and we made it available to every Cloudflare account. 

Threat Signals turns open-source reporting that you choose into intelligence you can act on. Its agentic skills summarize reports, surface key context, extract and normalize indicators of compromise, and apply tags — all within a private, account-scoped dataset. The end result is a contextualized indicator stored in your account’s private Threat Intelligence dataset as a Threat Event that can instantly be applied in your WAF policy.

Starting today, we are also expanding access to Cloudforce One’s Threat Events Platform, our core threat intelligence offering, to all Cloudflare accounts for free. With this expansion, each account gets:

  • API and dashboard access to Threat Signals and the ability to select one RSS feed
  • A private dataset built from the RSS feed in Threat Signals, tailored to your reporting requirements and stored for up to 30 days
  • API and dashboard access to Threat Events Platform to investigate events, indicators, and tags related to your private dataset

Essentials, Advantage, and Elite enterprise customers can extend this offering to include an expanded number of RSS feeds, access to Cloudforce One’s proprietary threat intelligence datasets, the ability to generate custom agentic skills, higher storage options for Threat Signals’ derived open-source reporting, and the ability to create custom WAF rules on open-source and proprietary threat events.

Discovery is only the beginning

We started with open-source intelligence because it is the most obvious place to prove the power of agentic workflows. We also heard from customers that their existing platforms cannot scale beyond polling 100 RSS feeds. Recognizing the critical impact open-source reporting plays in understanding the threat landscape, we sought to build an infinitely scalable platform (more on that later).

Researchers regularly publish detailed findings on vulnerabilities, malicious infrastructure, phishing campaigns, malware families, and threat actors. While RSS feed readers make it easier to discover new reporting, discovery is only the beginning. Harnessing data into a usable workflow with consistent expertise is the key to building actionable defense.

Expertise has never been something organizations can replicate at scale. A report explains how a campaign works and identifies the infrastructure behind it, but before an analyst can use that information, they need to:

  • Read and summarize the report
  • Identify relevant indicators
  • Convert indicator values into a consistent format
  • Classify the report using an internal taxonomy for tagging
  • Populate the indicators into a threat intelligence platform (TIP)
  • Preserve a link to the original source
  • Share the intelligence with the rest of the security team

Repeating that process across dozens of sources takes time; moreover, almost every step is entirely about human judgment. As a result, context is lost. Indicators inserted into your TIP are separated from the context that explains why they matter and helps assess the risk later in the remediation cycle. It's not surprising that weeks later, a domain is pushed to a blocklist and nobody understands why. 

How Threat Signals works

Threat Signals uses RSS to monitor the open-source reporting that matters to your organization. You can add an RSS feed, give it a recognizable name and category, and configure how frequently Threat Signals checks for new content. All three feed specifications (RSS 2.0, Atom, and RSS 1.0/RDF) are supported.

Each feed you select enters a Workflow that periodically polls for new articles. It uses Browser Run’s Markdown quick action to fetch and clean the article text into a readable markdown format, which is then stored in R2. The text is passed into an indicator of compromise extractor and a set of default Cloudforce One-defined skills to summarize the content, apply tags based on your account configuration, and add indicator contextualization at the IOC level.

The output is a concise summary and key points that help an analyst quickly understand what happened, who was affected, and why the report matters. All of it is searchable and tagged, so you can find the articles you care about across the platform.

Lastly, each indicator extracted is backed by a threat event within the account's own private Threat Signals dataset. The event, its indicators and tags, and the original report stay connected, so an analyst can always trace where the intelligence came from and why it is there. These indicators can then be used to create WAF rules from threat events to protect your applications and infrastructure.

What we learned

It’s not hard to write a script that pulls an RSS feed and regexes IP addresses out of it. The first version of Threat Signals was a one-week internal prototype, built by a threat analyst who wanted more out of the reports she was already reading. Turning that into something every account can rely on was harder, and most of what slowed us down had nothing to do with parsing. The hard work was in making the output something analysts would trust and actually use. 

We were tempted to let the system invent whatever tags seemed useful. The teams we talked to pushed back: intelligence labeled in an unfamiliar vocabulary is harder to use, because now there are two vocabularies to reconcile. So we limited AI tagging to each account's existing tag catalog. 

Recording whether a tag was applied automatically or by an analyst sounds like a minor piece of metadata, but it turned out to be essential. In our experience, analysts were far more willing to trust automatic tagging when they could see exactly which tags it applied.

Summaries are useful, and they are what users notice first. But what analysts kept returning to in early testing was the link between an event and the report it came from. As investigations progressed, we discovered that link consistently helped them keep track of indicators and understand why each one mattered in the first place. 

What’s next

Open-source reporting isn’t limited to RSS feeds. Analysts need to be able to quickly consume threat intelligence in various formats and pipelines. Now that we’ve laid out the building blocks for ingesting indicators from data feeds into our platform, the natural next step is to add more consumers. Be on the lookout for more data ingestion pipelines that we will support so that you can bring more actionable intelligence onto the platform to protect your organization.

Open the Cloudflare dashboard and set up your feed today

The best investigations begin with trusted context, and Threat Signals helps keep that context close from the first lead onward. Threat Signals is now generally available for every Cloudflare account via API and the dashboard. Open the Cloudflare dashboard, navigate to Application Security → Threat Intelligence → Threat Signals, and add your RSS feed. The documentation is here. 

You can also read threat intelligence research from our team, and talk to your account team about putting Threat Events to work in your enterprise environment.

The collective thoughts of the interwebz