Post Syndicated from Crosstalk Solutions original https://www.youtube.com/watch?v=0XA521kyNco
Forensic investigation environment strategies in the AWS Cloud
Post Syndicated from Sol Kavanagh original https://aws.amazon.com/blogs/security/forensic-investigation-environment-strategies-in-the-aws-cloud/
When a deviation from your secure baseline occurs, it’s crucial to respond and resolve the issue quickly and follow up with a forensic investigation and root cause analysis. Having a preconfigured infrastructure and a practiced plan for using it when there’s a deviation from your baseline will help you to extract and analyze the information needed to determine the impact, scope, and root cause of an incident and return to operations confidently.
Time is of the essence in understanding the what, how, who, where, and when of a security incident. You often hear of automated incident response, which has repeatable and auditable processes to standardize the resolution of incidents and accelerate evidence artifact gathering.
Similarly, having a standard, pristine, pre-configured, and repeatable forensic clean-room environment that can be automatically deployed through a template allows your organization to minimize human interaction, keep the larger organization separate from contamination, hasten evidence gathering and root cause analysis, and protect forensic data integrity. The forensic analysis process assists in data preservation, acquisition, and analysis to identify the root cause of an incident. This approach can also facilitate the presentation or transfer of evidence to outside legal entities or auditors. AWS CloudFormation templates—or other infrastructure as code (IaC) provisioning tools—help you to achieve these goals, providing your business with consistent, well-structured, and auditable results that allow for a better overall security posture. Having these environments as a permanent part of your infrastructure allows them to be well documented and tested, and gives you opportunities to train your teams in their use.
This post provides strategies that you can use to prepare your organization to respond to secure baseline deviations. These strategies take the form of best practices around Amazon Web Services (AWS) account structure, AWS Organizations organizational units (OUs) and service control policies (SCPs), forensic Amazon Virtual Private Cloud (Amazon VPC) and network infrastructure, evidence artifacts to be collected, AWS services to be used, forensic analysis tool infrastructure, and user access and authorization to the above. The specific focus is to provide an environment where Amazon Elastic Compute Cloud (Amazon EC2) instances with forensic tooling can be used to examine evidence artifacts.
This post presumes that you already have an evidence artifact collection procedure or that you are implementing one and that the evidence can be transferred to the accounts described here. If you are looking for advice on how to automate artifact collection, see How to automate forensic disk collection for guidance.
Infrastructure overview
A well-architected multi-account AWS environment is based on the structure provided by Organizations. As companies grow and need to scale their infrastructure with multiple accounts, often in multiple AWS Regions, Organizations offers programmatic creation of new AWS accounts combined with central management and governance that helps them to do so in a controlled and standardized manner. This programmatic, centralized approach should be used to create the forensic investigation environments described in the strategy in this blog post.
The example in this blog post uses a simplified structure with separate dedicated OUs and accounts for security and forensics, shown in Figure 1. Your organization’s architecture might differ, but the strategy remains the same.
Note: There might be reasons for forensic analysis to be performed live within the compromised account itself, such as to avoid shutting down or accessing the compromised instance or resource; however, that approach isn’t covered here.

Figure 1: AWS Organizations forensics OU example
The most important components in Figure 1 are:
- A security OU, which is used for hosting security-related access and services. The security OU and the associated AWS accounts should be owned and managed by your security organization.
- A forensics OU, which should be a separate entity, although it can have some similarities and crossover responsibilities with the security OU. There are several reasons for having it within a separate OU and account. Some of the more important reasons are that the forensics team might be a different team than the security team (or a subset of it), certain investigations might be under legal hold with additional access restrictions, or a member of the security team could be the focus of an investigation.
When speaking about Organizations, accounts, and the permissions required for various actions, you must first look at SCPs, a core functionality of Organizations. SCPs offer control over the maximum available permissions for all accounts in your organization. In the example in this blog post, you can use SCPs to provide similar or identical permission policies to all the accounts under the forensics OU, which is being used as a resource container. This policy overrides all other policies, and is a crucial mechanism to ensure that you can explicitly deny or allow any API calls desired. Some use cases of SCPs are to restrict the ability to disable AWS CloudTrail, restrict root user access, and ensure that all actions taken in the forensic investigation account are logged. This provides a centralized way to avoid changing individual policies for users, groups, or roles. Accessing the forensic environment should be done using a least-privilege model, with nobody capable of modifying or compromising the initially collected evidence. For an investigation environment, denying all actions except those you want to list as exceptions is the most straightforward approach. Start with the default of denying all, and work your way towards the least authorizations needed to perform the forensic processes established by your organization. AWS Config can be a valuable tool to track the changes made to the account and provide evidence of these changes.
Keep in mind that once the restrictive SCP is applied, even the root account or those with administrator access won’t have access beyond those permissions; therefore, frequent, proactive testing as your environment changes is a best practice. Also, be sure to validate which principals can remove the protective policy, if required, to transfer the account to an outside entity. Finally, create the environment before the restrictive permissions are applied, and then move the account under the forensic OU.
Having a separate AWS account dedicated to forensic investigations is best to keep your larger organization separate from the possible threat of contamination from the incident itself, ensure the isolation and protection of the integrity of the artifacts being analyzed, and keeping the investigation confidential. Separate accounts also avoid situations where the threat actors might have used all the resources immediately available to your compromised AWS account by hitting service quotas and so preventing you from instantiating an Amazon EC2 instance to perform investigations.
Having a forensic investigation account per Region is also a good practice, as it keeps the investigative capabilities close to the data being analyzed, reduces latency, and avoids issues of the data changing regulatory jurisdictions. For example, data residing in the EU might need to be examined by an investigative team in North America, but the data itself cannot be moved because its North American architecture doesn’t align with GDPR compliance. For global customers, forensics teams might be situated in different locations worldwide and have different processes. It’s better to have a forensic account in the Region where an incident arose. The account as a whole could also then be provided to local legal institutions or third-party auditors if required. That said, if your AWS infrastructure is contained within Regions only in one jurisdiction or country, then a single re-creatable account in one Region with evidence artifacts shared from and kept in their respective Regions could be an easier architecture to manage over time.
An account created in an automated fashion using a CloudFormation template—or other IaC methods—allows you to minimize human interaction before use by recreating an entirely new and untouched forensic analysis instance for each separate investigation, ensuring its integrity. Individual people will only be given access as part of a security incident response plan, and even then, permissions to change the environment should be minimal or none at all. The post-investigation environment would then be either preserved in a locked state or removed, and a fresh, blank one created in its place for the subsequent investigation with no trace of the previous artifacts. Templating your environment also facilitates testing to ensure your investigative strategy, permissions, and tooling will function as intended.
Accessing your forensics infrastructure
Once you’ve defined where your investigative environment should reside, you must think about who will be accessing it, how they will do so, and what permissions they will need.
The forensic investigation team can be a separate team from the security incident response team, the same team, or a subset. You should provide precise access rights to the group of individuals performing the investigation as part of maintaining least privilege.
You should create specific roles for the various needs of the forensic procedures, each with only the permissions required. As with SCPs and other situations described here, start with no permissions and add authorizations only as required while establishing and testing your templated environments. As an example, you might create the following roles within the forensic account:
Responder – acquire evidence
Investigator – analyze evidence
Data custodian – manage (copy, move, delete, and expire) evidence
Analyst – access forensics reports for analytics, trends, and forecasting (threat intelligence)
You should establish an access procedure for each role, and include it in the response plan playbook. This will help you ensure least privilege access as well as environment integrity. For example, establish a process for an owner of the Security Incident Response Plan to verify and approve the request for access to the environment. Another alternative is the two-person rule. Alert on log-in is an additional security measure that you can add to help increase confidence in the environment’s integrity, and to monitor for unauthorized access.
You want the investigative role to have read-only access to the original evidence artifacts collected, generally consisting of Amazon Elastic Block Store (Amazon EBS) snapshots, memory dumps, logs, or other artifacts in an Amazon Simple Storage Service (Amazon S3) bucket. The original sources of evidence should be protected; MFA delete and S3 versioning are two methods for doing so. Work should be performed on copies of copies if rendering the original immutable isn’t possible, especially if any modification of the artifact will happen. This is discussed in further detail below.
Evidence should only be accessible from the roles that absolutely require access—that is, investigator and data custodian. To help prevent potential insider threat actors from being aware of the investigation, you should deny even read access from any roles not intended to access and analyze evidence.
Protecting the integrity of your forensic infrastructures
Once you’ve built the organization, account structure, and roles, you must decide on the best strategy inside the account itself. Analysis of the collected artifacts can be done through forensic analysis tools hosted on an EC2 instance, ideally residing within a dedicated Amazon VPC in the forensics account. This Amazon VPC should be configured with the same restrictive approach you’ve taken so far, being fully isolated and auditable, with the only resources being dedicated to the forensic tasks at hand.
This might mean that the Amazon VPC’s subnets will have no internet gateways, and therefore all S3 access must be done through an S3 VPC endpoint. VPC flow logging should be enabled at the Amazon VPC level so that there are records of all network traffic. Security groups should be highly restrictive, and deny all ports that aren’t related to the requirements of the forensic tools. SSH and RDP access should be restricted and governed by auditable mechanisms such as a bastion host configured to log all connections and activity, AWS Systems Manager Session Manager, or similar.
If using Systems Manager Session Manager with a graphical interface is required, RDP or other methods can still be accessed. Commands and responses performed using Session Manager can be logged to Amazon CloudWatch and an S3 bucket, this allows auditing of all commands executed on the forensic tooling Amazon EC2 instances. Administrative privileges can also be restricted if required. You can also arrange to receive an Amazon Simple Notification Service (Amazon SNS) notification when a new session is started.
Given that the Amazon EC2 forensic tooling instances might not have direct access to the internet, you might need to create a process to preconfigure and deploy standardized Amazon Machine Images (AMIs) with the appropriate installed and updated set of tooling for analysis. Several best practices apply around this process. The OS of the AMI should be hardened to reduce its vulnerable surface. We do this by starting with an approved OS image, such as an AWS-provided AMI or one you have created and managed yourself. Then proceed to remove unwanted programs, packages, libraries, and other components. Ensure that all updates and patches—security and otherwise—have been applied. Configuring a host-based firewall is also a good precaution, as well as host-based intrusion detection tools. In addition, always ensure the attached disks are encrypted.
If your operating system is supported, we recommend creating golden images using EC2 Image Builder. Your golden image should be rebuilt and updated at least monthly, as you want to ensure it’s kept up to date with security patches and functionality.
EC2 Image Builder—combined with other tools—facilitates the hardening process; for example, allowing the creation of automated pipelines that produce Center for Internet Security (CIS) benchmark hardened AMIs. If you don’t want to maintain your own hardened images, you can find CIS benchmark hardened AMIs on the AWS Marketplace.
Keep in mind the infrastructure requirements for your forensic tools—such as minimum CPU, memory, storage, and networking requirements—before choosing an appropriate EC2 instance type. Though a variety of instance types are available, you’ll want to ensure that you’re keeping the right balance between cost and performance based on your minimum requirements and expected workloads.
The goal of this environment is to provide an efficient means to collect evidence, perform a comprehensive investigation, and effectively return to safe operations. Evidence is best acquired through the automated strategies discussed in How to automate incident response in the AWS Cloud for EC2 instances. Hashing evidence artifacts immediately upon acquisition is highly recommended in your evidence collection process. Hashes, and in turn the evidence itself, can then be validated after subsequent transfers and accesses, ensuring the integrity of the evidence is maintained. Preserving the original evidence is crucial if legal action is taken.
Evidence and artifacts can consist of, but aren’t limited to:
- All EC2 instance metadata
- Amazon EBS disk snapshots
- EBS disks streamed to S3
- Memory dumps
- Memory captured through hibernation on the root EBS volume
- CloudTrail logs
- AWS Config rule findings
- Amazon Route 53 DNS resolver query logs
- VPC Flow Logs
- AWS Security Hub findings
- Elastic Load Balancing access logs
- AWS WAF logs
- Custom application logs
- System logs
- Security logs
- Any third-party logs
Access to the control plane logs mentioned above—such as the CloudTrail logs—can be accessed in one of two ways. Ideally, the logs should reside in a central location with read-only access for investigations as needed. However, if not centralized, read access can be given to the original logs within the source account as needed. Read access to certain service logs found within the security account, such as AWS Config, Amazon GuardDuty, Security Hub, and Amazon Detective, might be necessary to correlate indicators of compromise with evidence discovered during the analysis.
As previously mentioned, it’s imperative to have immutable versions of all evidence. This can be achieved in many ways, including but not limited to the following examples:
- Amazon EBS snapshots, including hibernation generated memory dumps:
- Original Amazon EBS disks are snapshotted, shared to the forensics account, used to create a volume, and then mounted as read-only for offline analysis.
- Amazon EBS volumes manually captured:
- Linux tools such as dc3dd can be used to stream a volume to an S3 bucket, as well as provide a hash, and then made immutable using an S3 method from the next bullet point.
- Artifacts stored in an S3 bucket, such as memory dumps and other artifacts:
- S3 Object Lock prevents objects from being deleted or overwritten for a fixed amount of time or indefinitely.
- Using MFA delete requires the requestor to use multi-factor authentication to permanently delete an object.
- Amazon S3 Glacier provides a Vault Lock function if you want to retain immutable evidence long term.
- Disk volumes:
- Linux: Mount in read-only mode.
- Windows: Use one of the many commercial or open-source write-blocker applications available, some of which are specifically made for forensic use.
- CloudTrail:
- CloudTrail log file integrity validation option, with SHA-256 for hashing and SHA-256 with RSA for signing.
- Using S3 Object Lock – Governance Mode.
- AWS Systems Manager inventory:
- By default, metadata on managed instances is stored in an S3 bucket, and can be protected using the above methods.
- AWS Config data:
- By default, AWS Config stores data in an S3 bucket, and can be protected using the above methods.
Note: AWS services such as KMS can help enable encryption. KMS is integrated with AWS services to simplify using your keys to encrypt data across your AWS workloads.
An example use case of Amazon EBS disks being shared as evidence to the forensics account, the following figure—Figure 2—is a simplified S3 bucket folder structure you could use to store and work with evidence.
Figure 2 shows an S3 bucket structure for a forensic account. An S3 bucket and folder is created to hold incoming data—for example, from Amazon EBS disks—which is streamed to Incoming Data > Evidence Artifacts using dc3dd. The data is then copied from there to a folder in another bucket—Active Investigation > Root Directory > Extracted Artifacts—to be analyzed by the tooling installed on your forensic Amazon EC2 instance. Also, there are folders under Active Investigation for any investigation notes you make during analysis, as well as the final reports, which are discussed at the end of this blog post. Finally, a bucket and folders for legal holds, where an object lock will be placed to hold evidence artifacts at a specific version.

Figure 2: Forensic account S3 bucket structure
Considerations
Finally, depending on the severity of the incident, your on-premises network and infrastructure might also be compromised. Having an alternative environment for your security responders to use in case of such an event reduces the chance of not being able to respond in an emergency. Amazon services such as Amazon Workspaces—a fully managed persistent desktop virtualization service—can be used to provide your responders a ready-to-use, independent environment that they can use to access the digital forensics and incident response tools needed to perform incident-related tasks.
Aside from the investigative tools, communications services are among the most critical for coordination of response. You can use Amazon WorkMail and Amazon Chime to provide that capability independent of normal channels.
Conclusion
The goal of a forensic investigation is to provide a final report that’s supported by the evidence. This includes what was accessed, who might have accessed it, how it was accessed, whether any data was exfiltrated, and so on. This report might be necessary for legal circumstances, such as criminal or civil investigations or situations requiring breach notifications. What output each circumstance requires should be determined in advance in order to develop an appropriate response and reporting process for each. A root cause analysis is vital in providing the information required to prepare your resources and environment to help prevent a similar incident in the future. Reports should not only include a root cause analysis, but also provide the methods, steps, and tools used to arrive at the conclusions.
This article has shown you how you can get started creating and maintaining forensic environments, as well as enable your teams to perform advanced incident resolution investigations using AWS services. Implementing the groundwork for your forensics environment, as described above, allows you to use automated disk collection to begin iterating on your forensic data collection capabilities and be better prepared when security events occur.
If you have feedback about this post, submit comments in the Comments section below. If you have questions about this post, start a new thread on one of the AWS Security, Identity, and Compliance forums or contact AWS Support.
Want more AWS Security how-to content, news, and feature announcements? Follow us on Twitter.
Tasmota Device Groups – Simulated 3 Way Dimming and Multi Button Switch Magic
Post Syndicated from digiblurDIY original https://www.youtube.com/watch?v=6b5YD1b6iac
[$] Debian’s which hunt
Post Syndicated from original https://lwn.net/Articles/874049/rss
One does not normally expect to see a great deal of angst over a one-page
shell script, even on the Internet. But Debian is special, so it has been
having an extended discussion over the fate of the which command
that has been escalated to the Debian Technical Committee. The amount of
attention that has been given to a small, nonstandard utility shines a
light on Debian’s governance processes and the interaction of tradition
with standards.
Keeping your Zabbix templates up to date
Post Syndicated from Arturs Lontons original https://blog.zabbix.com/keeping-your-zabbix-templates-up-to-date/16412/
Have you recently updated your Zabbix environment but are still wondering – why haven’t the templates been updated? Where can I obtain the latest official Zabbix templates, and how should I update them? In this blog post, we will discuss why it is vital to keep your templates up to date and how we the template update process looks like.
Updating your templates
“Will updating Zabbix also update my templates?” is a question that I receive quite often. The answer to that question is – no changes are made to your templates whenever you update your Zabbix instance – be it a minor or a major update. The reasoning behind that is quite simple – we always recommend that you tune the out-of-the-box templates as per your particular requirements. That may consist of changing update intervals, disabling items/triggers, or even changing the existing trigger expressions or adding whole new entities to the template.
This is where the current behavior with template updates starts to make more sense. If Zabbix were to automatically update your templates, there could be a chance of overwriting your custom changes and could potentially disrupt the monitoring of your environment. That is something that we definitely wish to avoid.
The question still stands – Then how am I supposed to update my templates?
The answer – you can find the latest official Zabbix templates on our official git page – https://git.zabbix.com/
First, navigate to the Zabbix repository and open the Templates folder. Then, select the release branch that matches your Zabbix instance version. Here you can find all of our official templates and also the official media types under the media folder. All you have to do now is open the template up and download the raw template file.
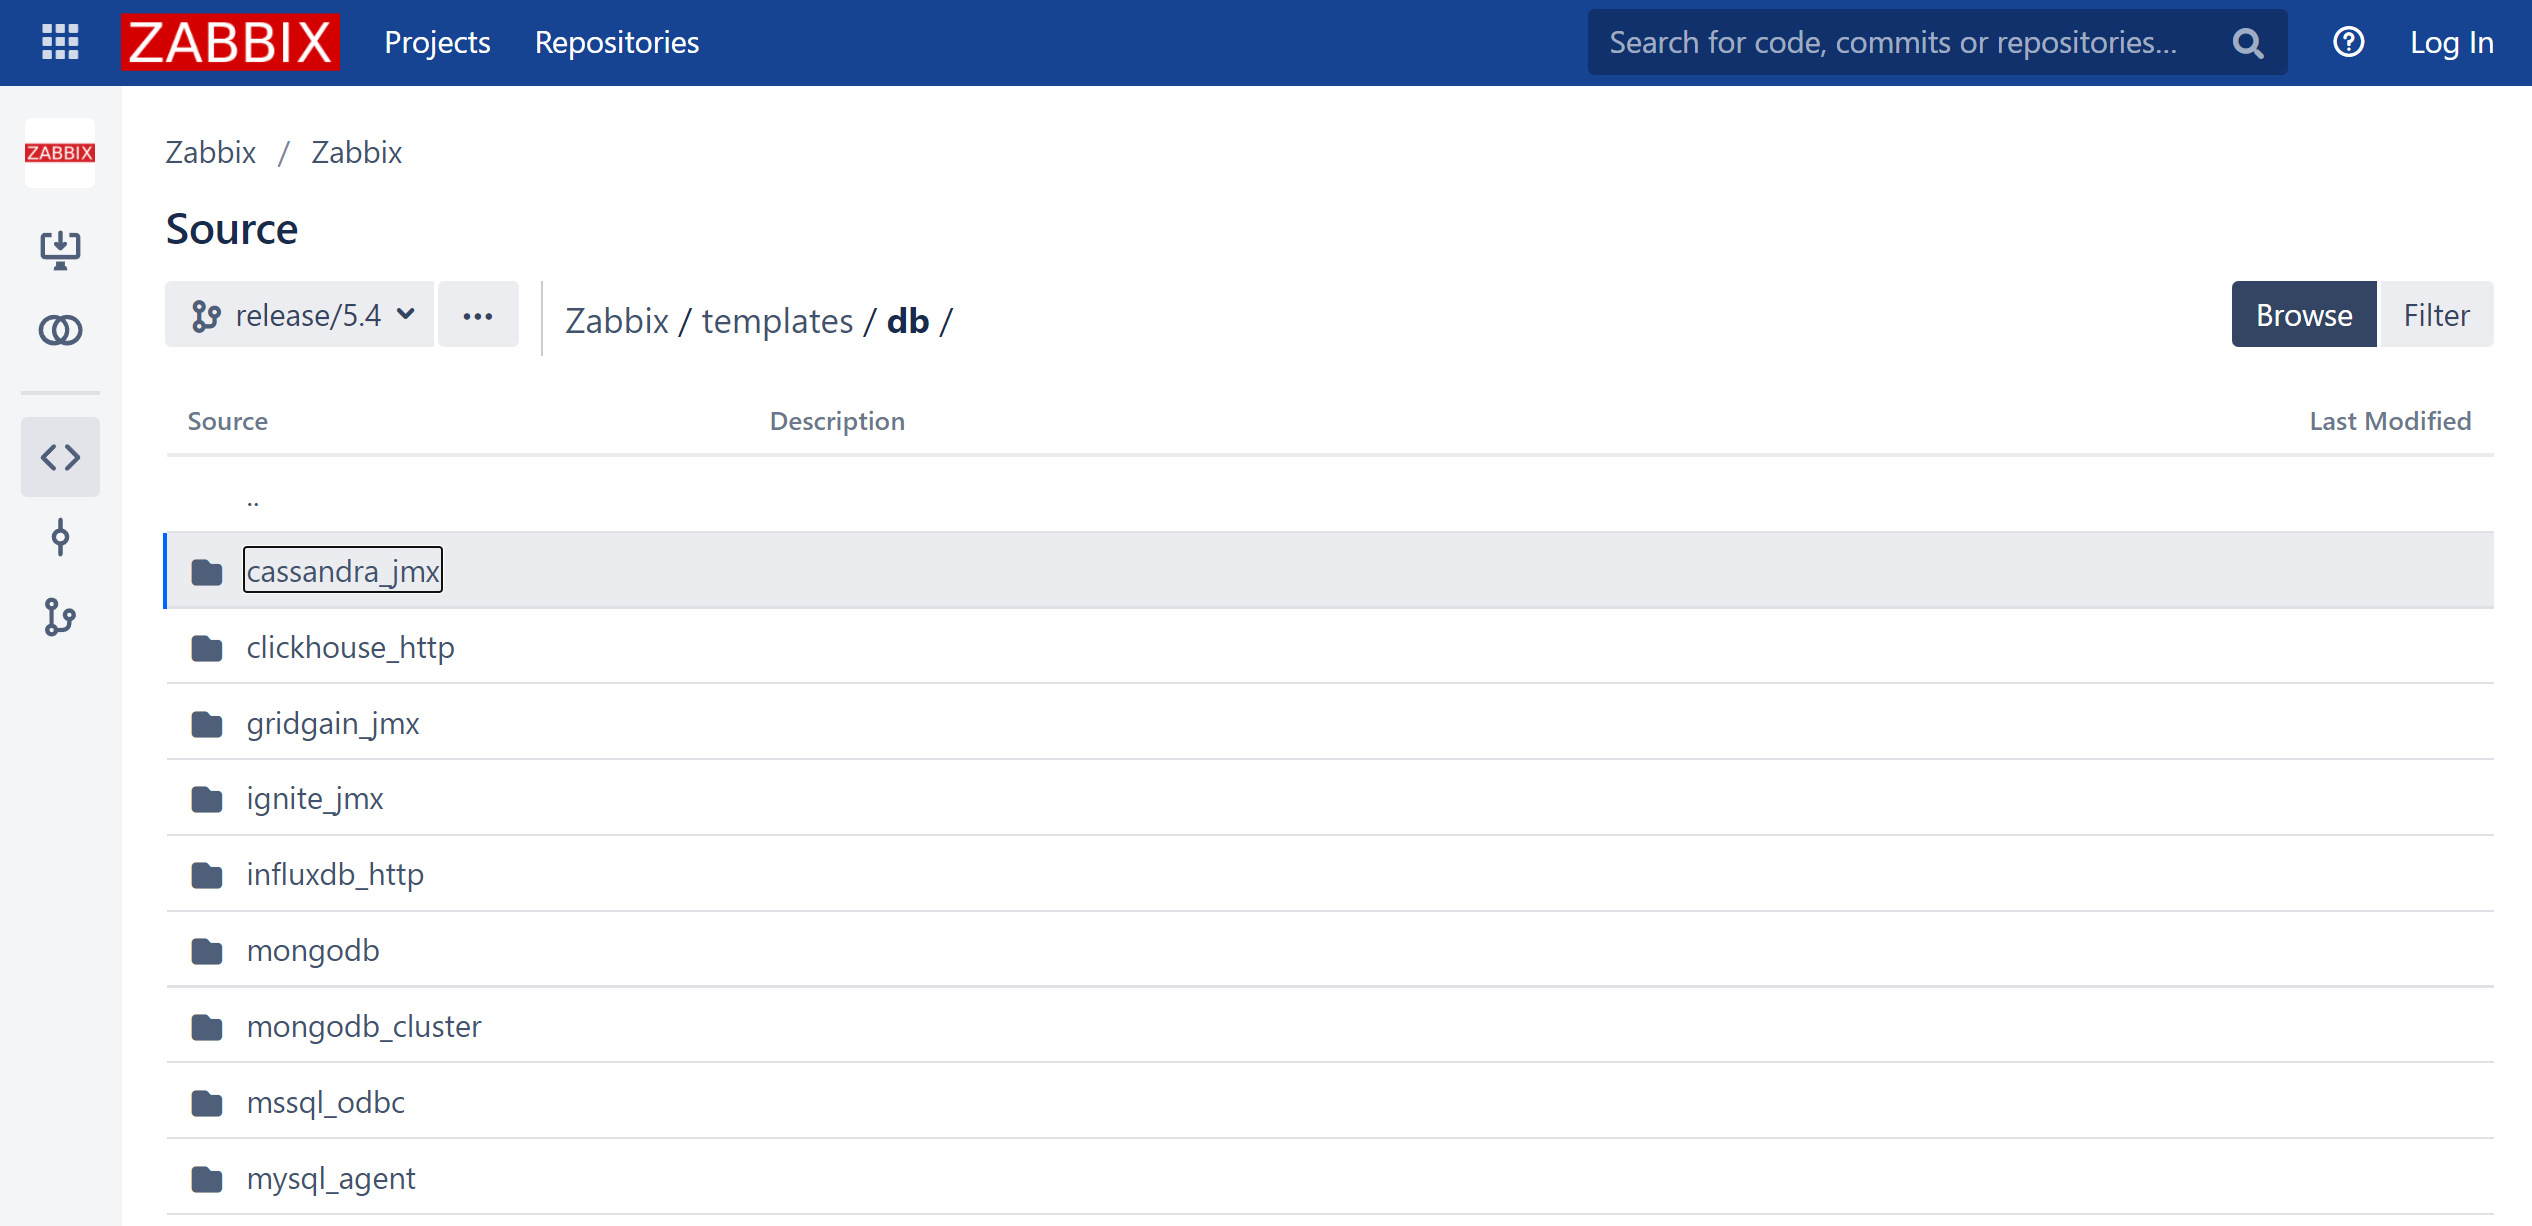 Zabbix 5.4 release git templates/db folder
Once that is done, we can import the template into our Zabbix environment
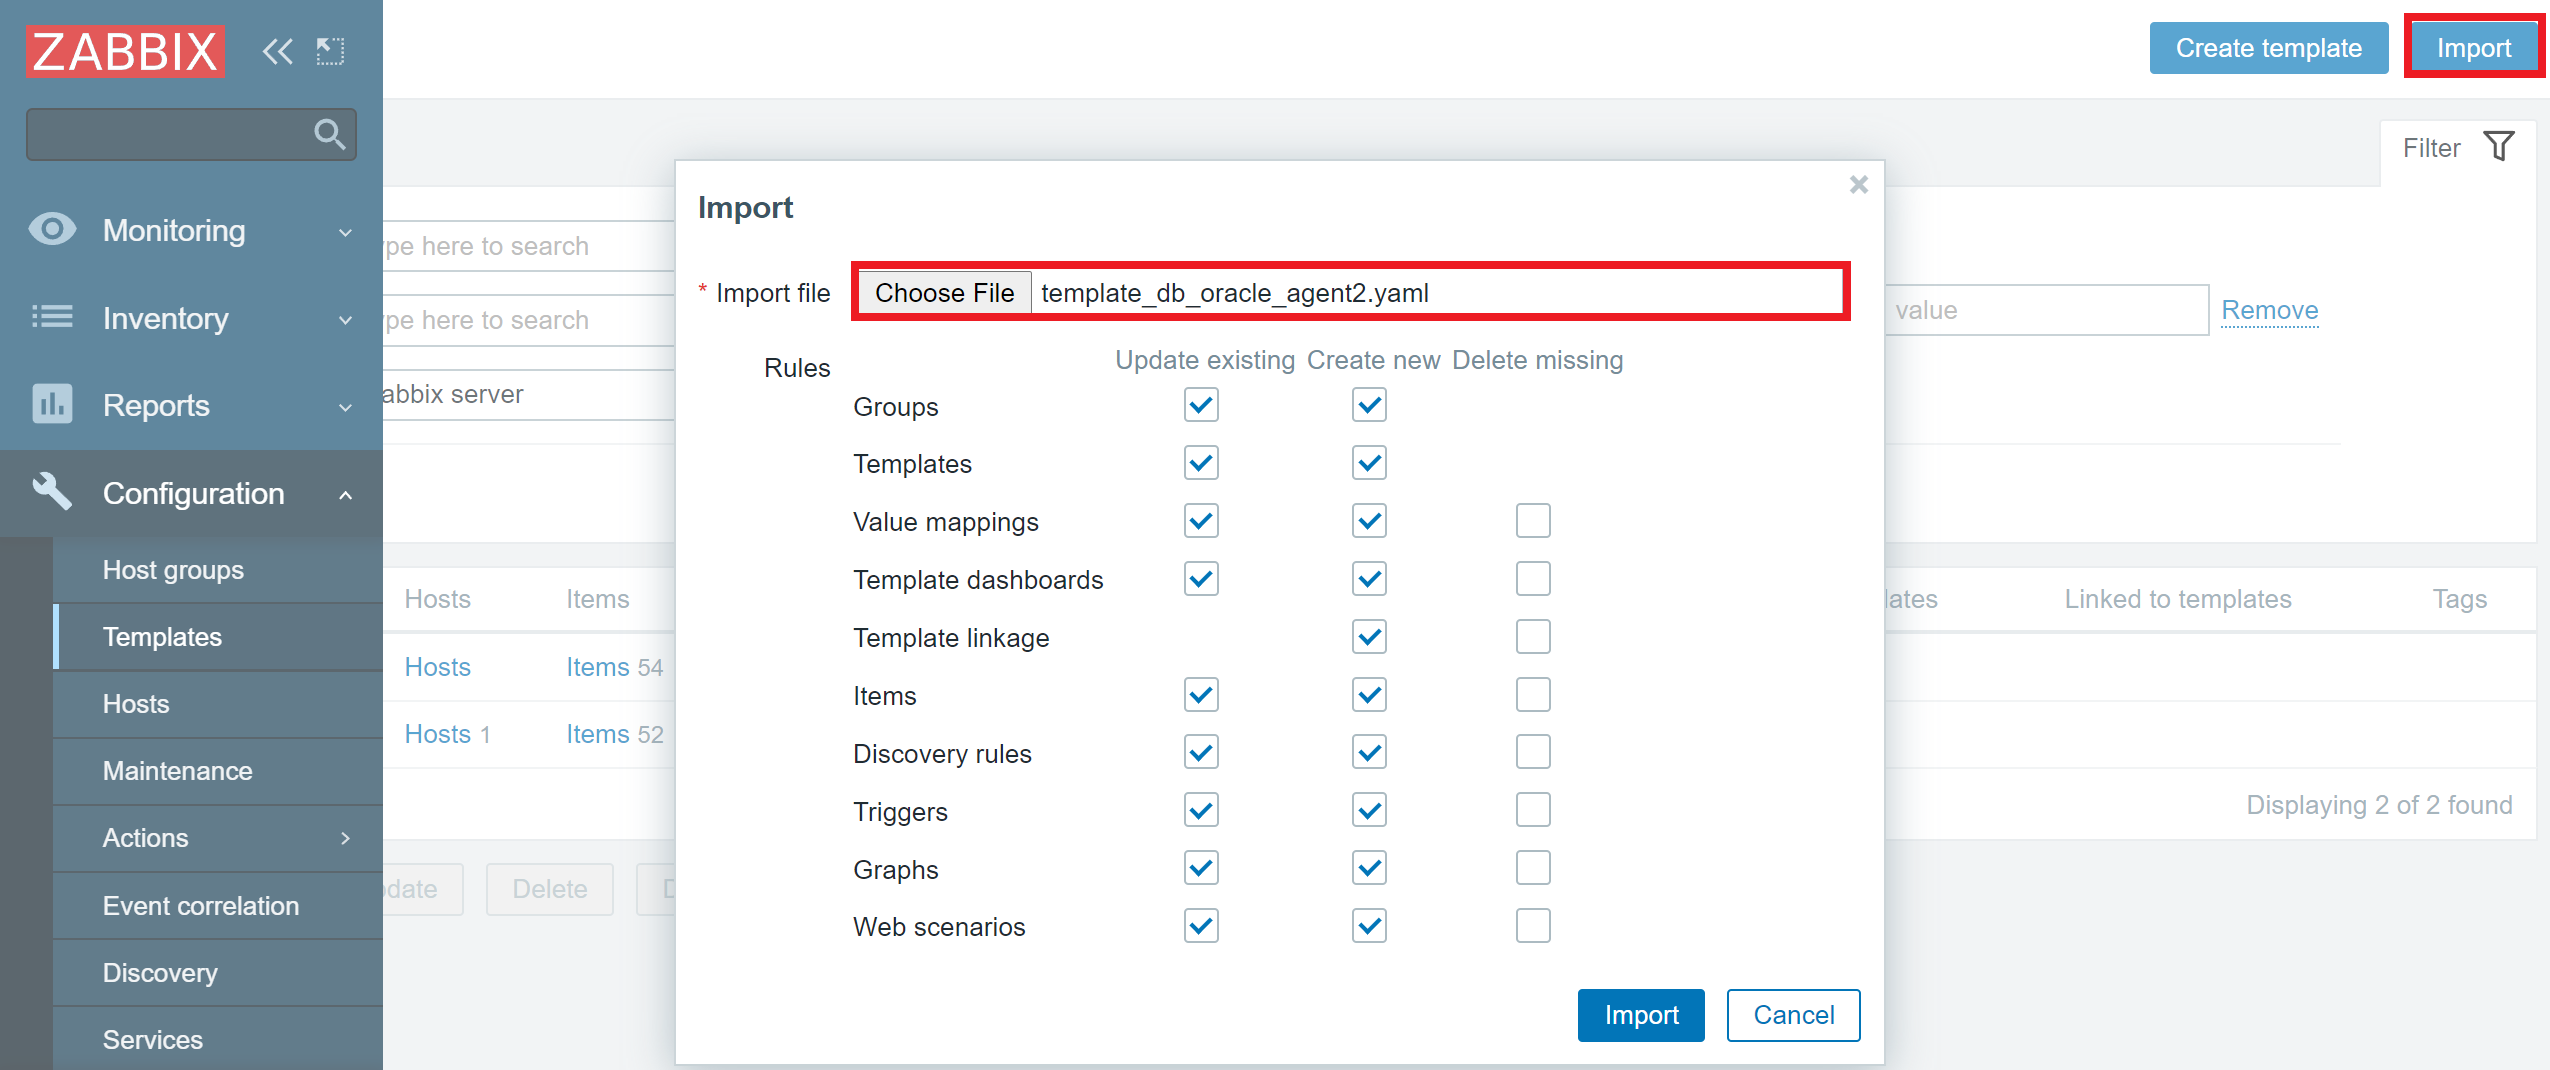 Template template_db_oracle_agent2 import
Don’t forget to back up your existing templates, especially if you have made some custom changes to them! Ideally – add a prefix to their names, so the new and old templates can live side by side, and you can then manually copy over the changes from the latest official template to your custom template.
The benefits of keeping templates up to date
But what is the point of updating your templates – what do you get out of it? Well, that varies on the specific fixes or improvements we make to the particular template over time. Sometimes the updated template will provide improved trigger expressions or preprocessing logic. Other times the updated template will provide extra value to your monitoring with completely new items and triggers. In the case of Webhook media types – the updates usually contain fixes or improvements for some particular use cases, for example – fixing a compatibility issue for a specific OS.
You can always track these changes either in the release notes of a particular Zabbix version or by looking up a specific bug or a feature request in our bug tracker – https://support.zabbix.com
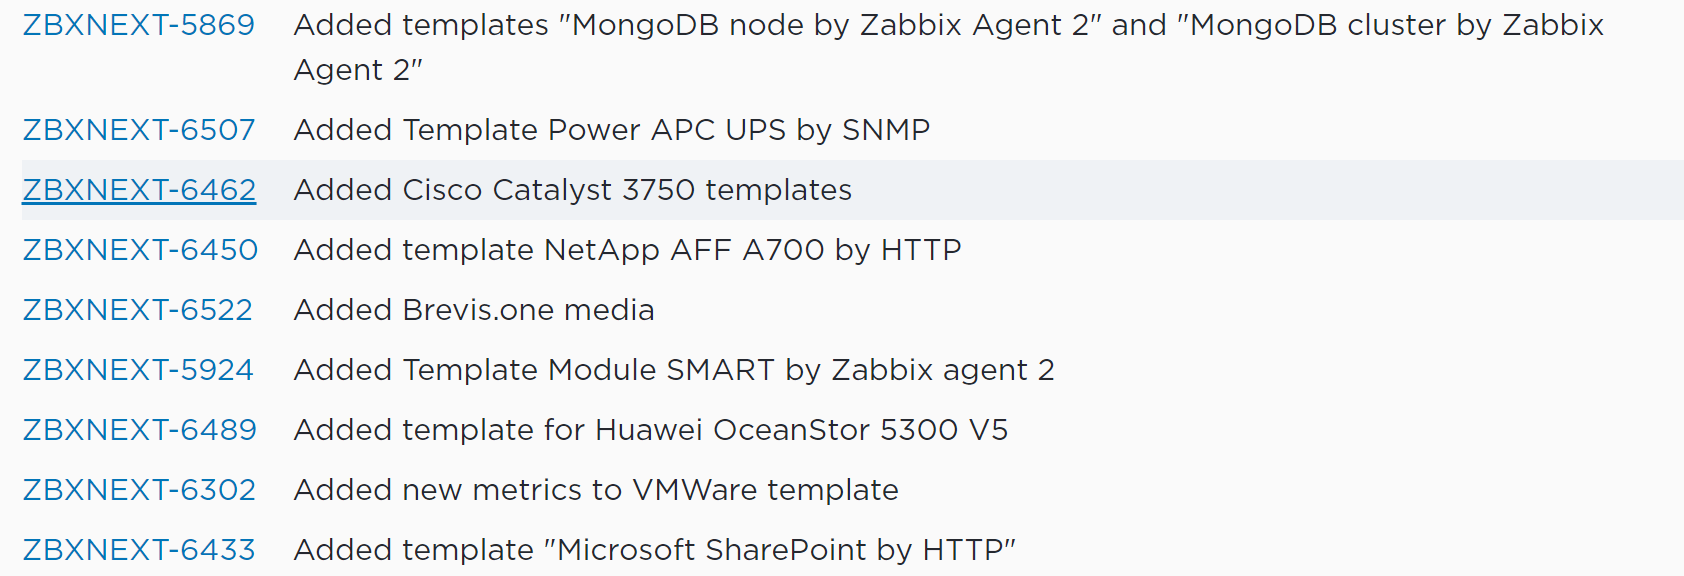 Some of the template changes in Zabbix 5.4 major update
Zabbix self-monitoring templates
Another key aspect of why it’s important to keep your templates up to date is so you can implement the changes made to the Zabbix self-monitoring templates. For example, if we compare Zabbix 5.0 to Zabbix 5.4, there are multiple new Zabbix processes and caches added to Zabbix 5.4, such as report writer/manager process, availability manager process, trend function caches, and other new components.
 Zabbix server health template version 5.0 and 5.4 difference in the number of entities
So, if you update from Zabbix 5.0 to 5.4 (or Zabbix 6.0 if you’re sticking with LTS versions), you WILL NOT be monitoring these processes and caches if you don’t update your Zabbix server and Zabbix proxy templates to the current Zabbix versions. This means that you will be completely unaware of any potential performance issues related to these processes or caches.
Tracking template changes
With Zabbix 5.4 and later, you will notice some great improvements to the template import process. If you’re wondering what has changed when comparing an older template version with a newer one, you will now be able to see the changes during the import process. The added and removed elements will be highlighted in red or green accordingly.
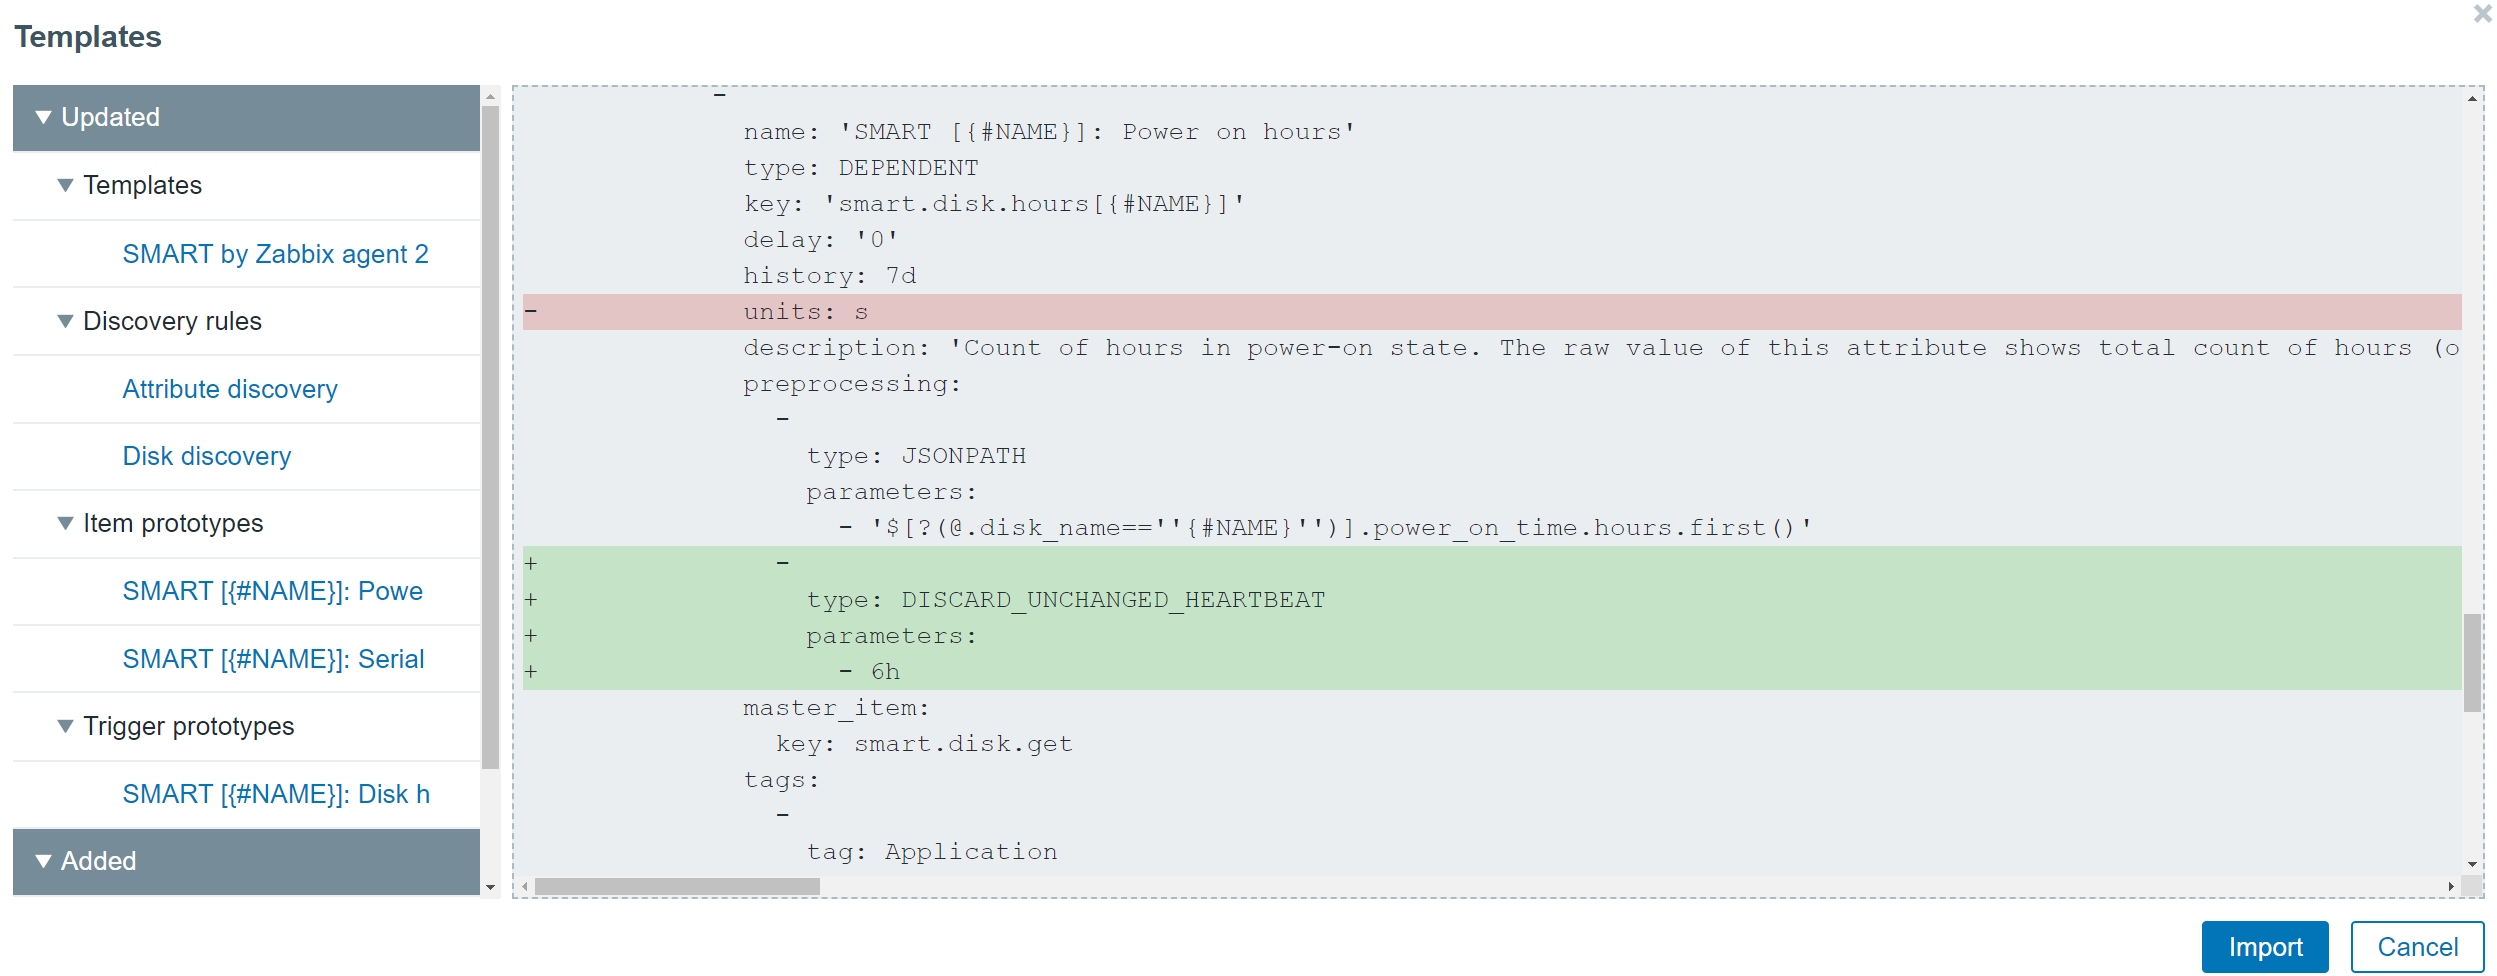 Preview of the changes made during the template import process
How often should you update the templates? Ideally, you would follow the Zabbix update release notes and take note of any changes made to the templates that are of use in your environment. At the very least – definitely check for changes in the self-monitoring templates when moving to a newer major version of Zabbix. Otherwise, you risk losing track of potential issues in your Zabbix environment.
Now that you know the answer to the question “How can I update my Zabbix templates?” try and think back to when you last updated your Zabbix instance to a new version – did you also check the official templates for updates? If not, then don’t hesitate and visit https://git.zabbix.com/ to find the latest templates for your Zabbix version. Chances are that you will be pleasantly surprised with a set of new and updated templates for your monitoring endpoints and new webhook media types to help you integrate Zabbix with your existing systems.
Security updates for Thursday
Post Syndicated from original https://lwn.net/Articles/874210/rss
Security updates have been issued by openSUSE (salt), Slackware (bind), SUSE (salt), and Ubuntu (php5, php7.0, php7.2, php7.4, php8.0).
How to Live in the Moment—How to Build a Happy Life, Ep. 4, with Dr. Ellen Langer
Post Syndicated from The Atlantic original https://www.youtube.com/watch?v=113MmRpY1xo
Hands-On IoT Hacking: Rapid7 at DefCon IoT Village, Part 2
Post Syndicated from Deral Heiland original https://blog.rapid7.com/2021/10/28/hands-on-iot-hacking-rapid7-at-defcon-29-iot-village-pt-2/

In our last post, we discussed how we set up Rapid7’s hands-on exercise at the Defcon 29 IoT Village. Now, with that foundation laid, we’ll get into how to determine whether the header we created is UART.
When trying to determine baud rate for IoT devices, I often just guess. Generally, for typical IoT hardware, the baud rate is going to be one of the following:
- 9600
- 19200
- 38400
- 57600
- 115200
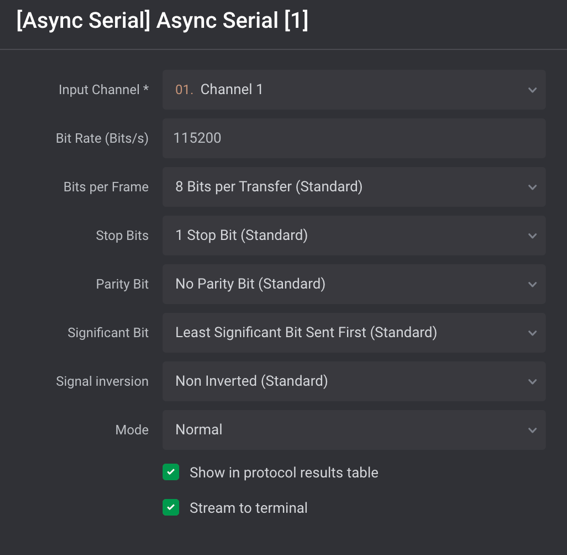
Typically, 115200 and 57600 are the most commonly encountered baud rates on consumer-grade IoT devices. Other settings that need to be made are data bits, stop bits, and parity bits. Typically, these will be set to the following standard defaults, as shown in Figure 5:
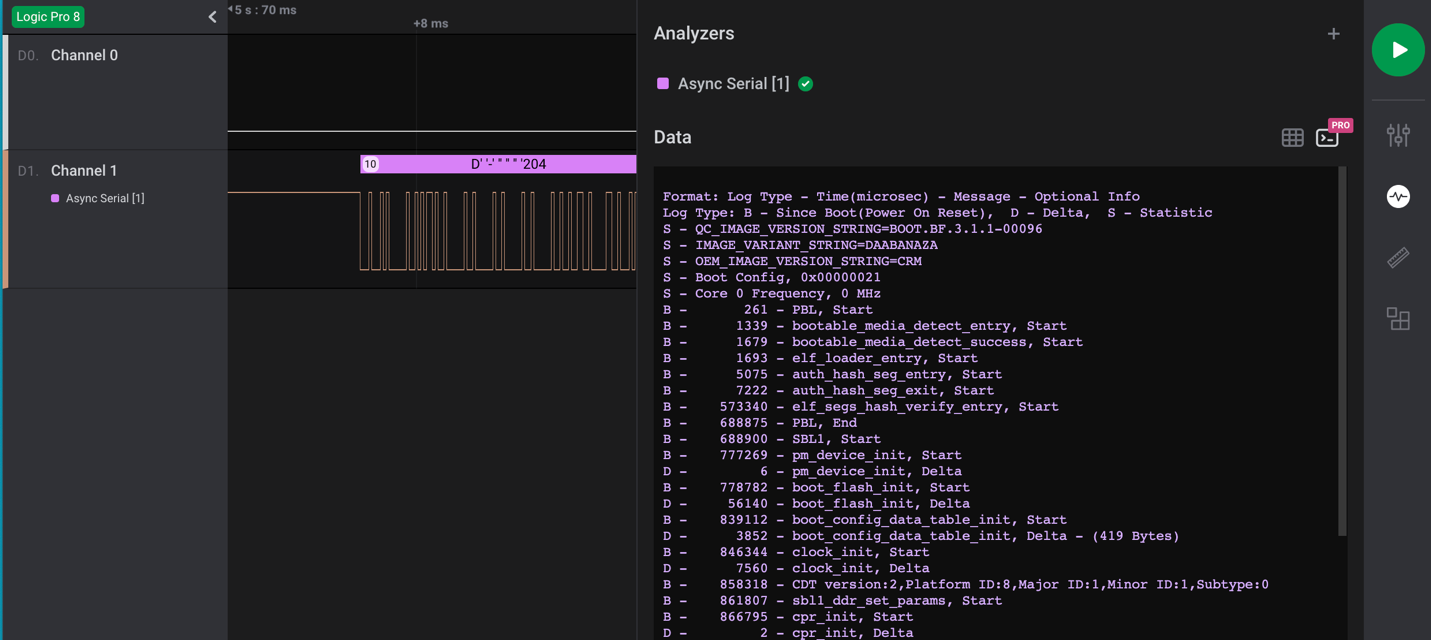
Once all the correct settings have been determined, and if the test point is UART, then the decoder in the Logic 2 application should decode the bit stream and reveal console text data for the device booting up. An example of this is shown in Figure 6:
FTDI UART Setup
Once you’ve properly determined the header is UART and identified transmit, receive, and ground pins, you can next hook up a USB to UART FTDI and start analyzing and hacking on the IoT device. During the IoT Village exercise, we used a Shikra for UART connection. Unfortunately, the Shikra appears to no longer be available, but any USB to UART FTDI device supporting 3.3vdc can be used for this exercise. However, I do recommend purchasing a multi-voltage FTDI device if possible. It’s common to encounter IoT devices that require either 1.8, 3.3, or 5 vdc, so having a product that can support these voltage levels is the best solution.
The software we used to connect to the FTDI device for the exercise at Defcon IoT Village was GtkTerm running on an Ubuntu Linux — but again, any terminal software that supports tty terminal connection will work for this. For example, I have also used CoolTerm or Putty, which both work fine. So just find a terminal software that works best for you and substitute it for what is referenced here.
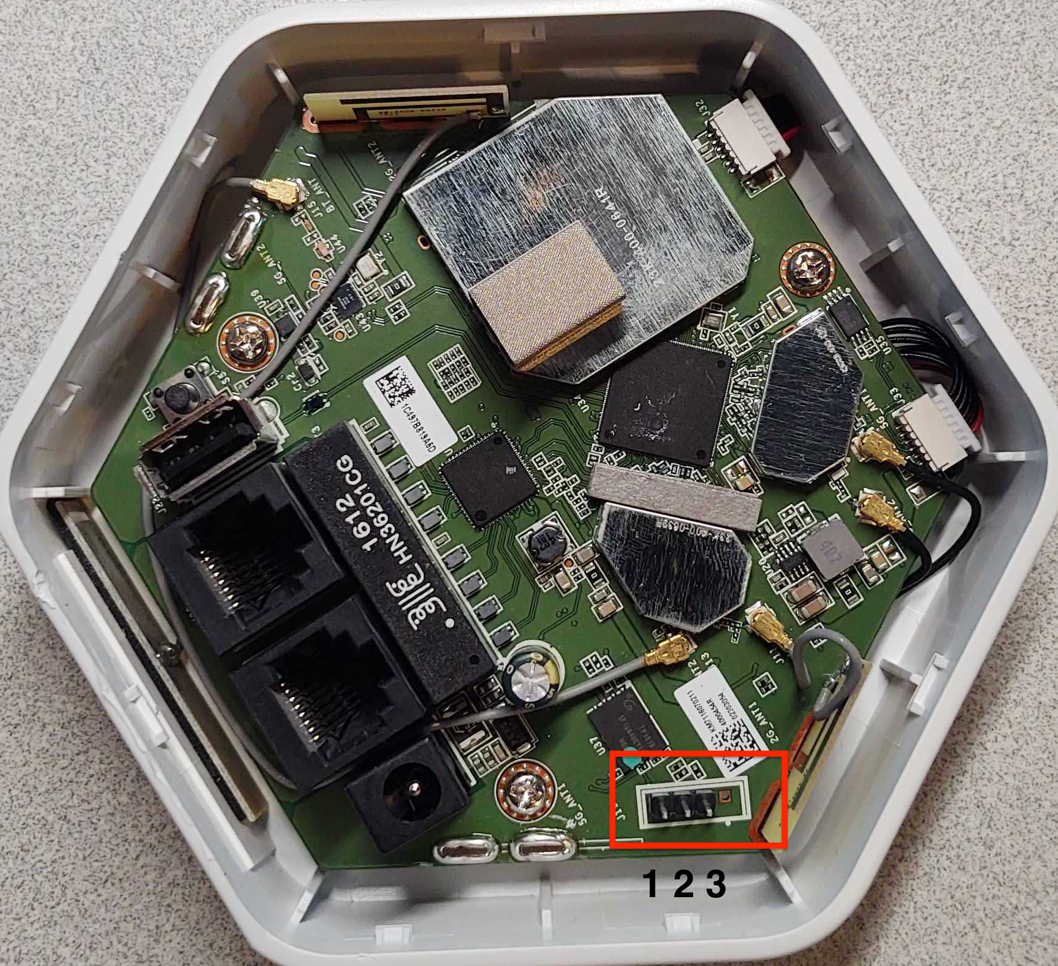
The next step is to attach the Shikra (pin out) or whatever brand of FTDI USB device you’re using to the UART header on Luma (Figure 7) using this table:
| Shikra Pins | Luma Header J19 Pins |
|---|---|
| Pin 1 TXT | Pin 2 RCV |
| Pin 2 RCV | Pin 3 TXT |
| Pin 18 GND | Pin 1 GND |
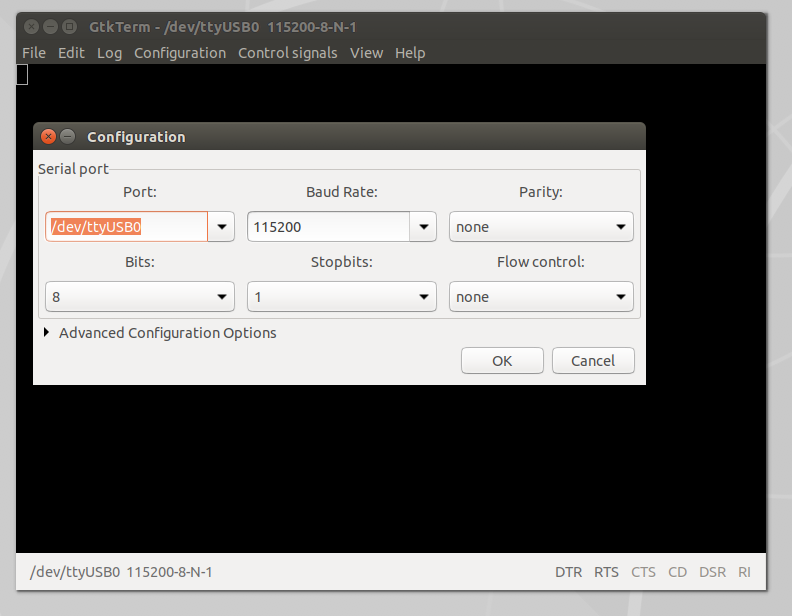
Once the UART to USB device is connected to the LUMA, double-click on the GtkTerm icon located on the Linux Desktop and configure the application by selecting Configuration on the menu bar followed by Port in the drop-down menu. From there, set the Port (/dev/ttyUSB0) and Baud Rate (115200) to match the figure below (Figure 8), and click OK.
Once configured, power on the LUMA device. At this point, you should start to see the device’s boot process logged to the UART console. For the Defcon IoT hacking exercise, we had preconfigured the devices to disable the console, so once we loaded U-boot and started the system kernel image, the console became disabled, as shown in Figure 9:
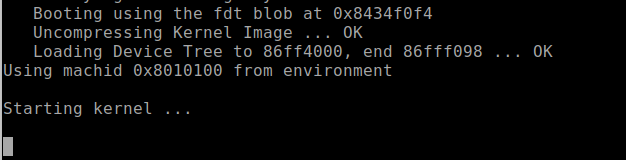
We made these changes so the attendees working on the exercise would experience a common setting often encountered, where the UART console is disabled during the booting process, and they’d have the chance to conduct another common attack that would allow them to break out of this lockdown.
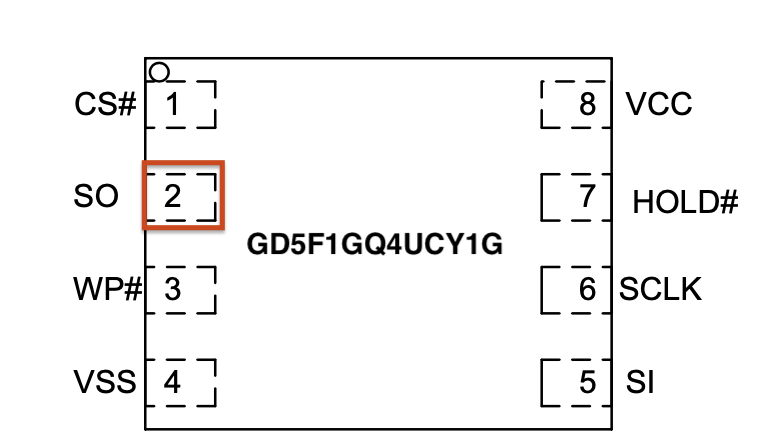
For example, during the boot sequence, it’s often possible to force the device to break out of the boot process and to drop into a U-Boot console. For standard U-Boot, this will often happen when the Kernel image is inaccessible, causing the boot process to error out and drop into a U-Boot console prompt. This condition can sometimes be forced by shorting the data line (serial out) from the flash memory chip containing the kernel image to ground during the boot process. This prevents the boot process from loading the kernel into memory. Figure 5 shows a pin-out image of the flash memory chip currently in use on this device. The data out from the flash memory chip is Serial Out (SO) on pin 2.
Also, I would like to note that during the Defcon IoT Village exercises, I had a conversation with several like-minded IoT hackers who said that they typically do this same attack but use the clock pin (SCLK). So, that is another viable option when conducting this type of attack on an IoT device to gain access to the U-Boot console.
During our live exercises at Defcon IoT Village, to help facilitate the process of grounding the data line Pin 2 Serial Out (SO) — and to avoid ending up with a bunch of dead devices because of accidentally grounding the wrong pins — we attached a lead from pin 2 of the flash memory chip, as shown in Figure 11:

To conduct this “pin glitch” attack to gain access to the U-Boot console, you will need to first power down the device. Then, restart the device by powering it back on while also monitoring the UART Console for the U-boot to start loading. Once you see the U-Boot loading, hold the shorting lead against the metal shielding or some other point of ground within the device, as shown in Figure 12:

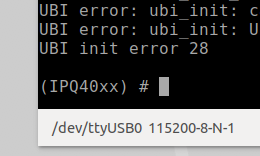
Shorting this or the clock pin to ground will prevent U-Boot from being able to load the kernel. If your timing is accurate, you should be successful and now see U-Boot console prompt IPQ40xx, as shown below in Figure 13. Once you see this prompt, you can lay the shorting lead to the side. If this prompt does not show up, then you will need to repeat this process.
With the LUMA device used in this example, this attack is more forgiving and easier to carry out successfully. The main reason, in my opinion, is because the U-Boot image and the kernel image are on separate flash memory chips. In my experience, this seems to cause more of a delay between U-Boot load and kernel loading, allowing for a longer window of time for the pin glitch to succeed.
Alter U-boot environment variables
U-boot environment variables are used to control the boot process of the devices. During this phase of the exercise, we used the following three U-Boot console commands to view, alter, and save changes made to the U-Boot environment variables to re-enable the console, which we had disabled before the exercise.
- “Printenv” is used to list the current environment variable settings.
- “Setenv” is used to create or modify environment variables.
- “Saveenv” is used to write the environment variables back to memory so they are permanent.
When connected into the U-Boot console to view the device’s configured environment variables, the “printenv” command is used. This command will return something that looks like the following Figure 14 below. Scrolling down and viewing the environment settings will reveal a lot about how the device boot process is configured. In the case of the Defcon IoT Village, we had attendees pay close attention to the bootargs variable, because this is where the console was disabled from.
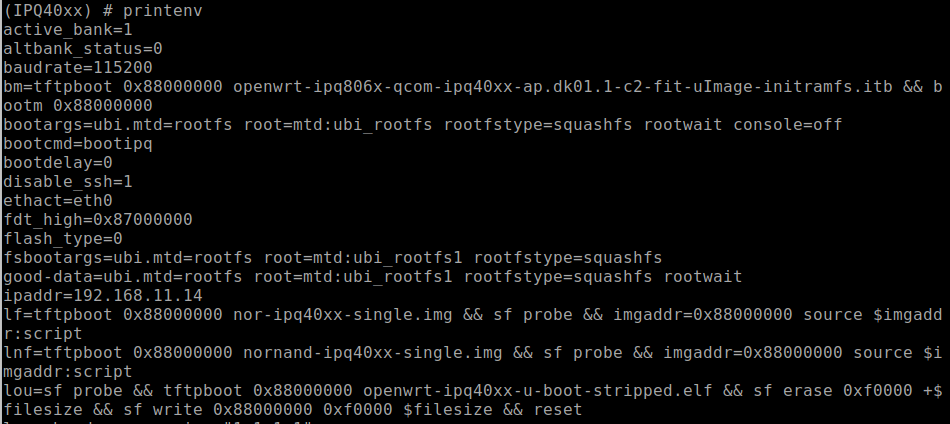
With a closer look at the bootargs variable as shown below in Figure 15, we can see that the console had been set to off. This is the reason the UART console halted during the boot process once the kernel was loaded.

In our third post, we’ll cover the next phase of our IoT Village exercise: turning the console back on and achieving single-user mode. Check back with us next week!
Creating AWS Lambda environment variables from AWS Secrets Manager
Post Syndicated from James Beswick original https://aws.amazon.com/blogs/compute/creating-aws-lambda-environmental-variables-from-aws-secrets-manager/
This post is written by Andy Hall, Senior Solutions Architect.
AWS Lambda layers and extensions are used by third-party software providers for monitoring Lambda functions. A monitoring solution needs environmental variables to provide configuration information to send metric information to an endpoint.
Managing this information as environmental variables across thousands of Lambda functions creates operational overhead. Instead, you can use the approach in this blog post to create environmental variables dynamically from information hosted in AWS Secrets Manager.
This can help avoid managing secret rotation for individual functions. It ensures that values stay encrypted until runtime, and abstracts away the management of the environmental variables.
Overview
This post shows how to create a Lambda layer for Node.js, Python, Ruby, Java, and .NET Core runtimes. It retrieves values from Secrets Manager and converts the secret into an environmental variable that can be used by other layers and functions. The Lambda layer uses a wrapper script to fetch information from Secrets Manager and create environmental variables.
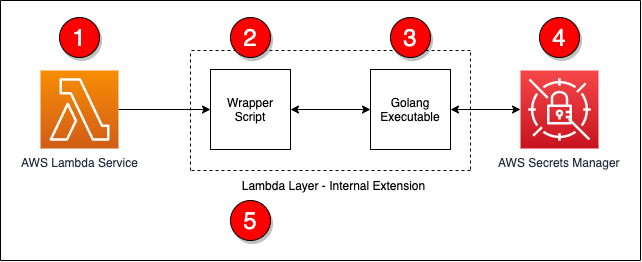
The steps in the process are as follows:
- The Lambda service responds to an event and initializes the Lambda context.
- The wrapper script is called as part of the Lambda init phase.
- The wrapper script calls a Golang executable passing in the ARN for the secret to retrieve.
- The Golang executable uses the Secrets Manager API to retrieve the decrypted secret.
- The wrapper script converts the information into environmental variables and calls the next step in processing.
All of the code for this post is available from this GitHub repo.
The wrapper script
The wrapper script is the main entry-point for the extension and is called by the Lambda service as part of the init phase. During this phase, the wrapper script will read in basic information from the environment and call the Golang executable. If there was an issue with the Golang executable, the wrapper script will log a statement and exit with an error.
# Get the secret value by calling the Go executable
values=$(${fullPath}/go-retrieve-secret -r "${region}" -s "${secretArn}" -a "${roleName}" -t ${timeout})
last_cmd=$?

# Verify that the last command was successful
if [[ ${last_cmd} -ne 0 ]]; then
    echo "Failed to setup environment for Secret ${secretArn}"
    exit 1
fi
Golang executable
This uses Golang to invoke the AWS APIs since the Lambda execution environment does natively provide the AWS Command Line Interface. The Golang executable can be included in a layer so that the layer works with a number of Lambda runtimes.
The Golang executable captures and validates the command line arguments to ensure that required parameters are supplied. If Lambda does not have permissions to read and decrypt the secret, you can supply an ARN for a role to assume.
The following code example shows how the Golang executable retrieves the necessary information to assume a role using the AWS Security Token Service:
client := sts.NewFromConfig(cfg)

return client.AssumeRole(ctx,
    &sts.AssumeRoleInput{
        RoleArn: &roleArn,
        RoleSessionName: &sessionName,
    },
)
After obtaining the necessary permissions, the secret can be retrieved using the Secrets Manager API. The following code example uses the new credentials to create a client connection to Secrets Manager and the secret:
client := secretsmanager.NewFromConfig(cfg, func(o *secretsmanager.Options) {
    o.Credentials = aws.NewCredentialsCache(credentials.NewStaticCredentialsProvider(*assumedRole.Credentials.AccessKeyId, *assumedRole.Credentials.SecretAccessKey, *assumedRole.Credentials.SessionToken))
})
return client.GetSecretValue(ctx, &secretsmanager.GetSecretValueInput{
    SecretId: aws.String(secretArn),
})
After retrieving the secret, the contents must be converted into a format that the wrapper script can use. The following sample code covers the conversion from a secret string to JSON by storing the data in a map. Once the data is in a map, a loop is used to output the information as key-value pairs.
// Convert the secret into JSON
var dat map[string]interface{}

// Convert the secret to JSON
if err := json.Unmarshal([]byte(*result.SecretString), &dat); err != nil {
    fmt.Println("Failed to convert Secret to JSON")
    fmt.Println(err)
    panic(err)
}

// Get the secret value and dump the output in a manner that a shell script can read the
// data from the output
for key, value := range dat {
    fmt.Printf("%s|%s\n", key, value)
}
Conversion to environmental variables
After the secret information is retrieved by using Golang, the wrapper script can now loop over the output, populate a temporary file with export statements, and execute the temporary file. The following code covers these steps:
# Read the data line by line and export the data as key value pairs
# and environmental variables
echo "${values}" | while read -r line; do

    # Split the line into a key and value
    ARRY=(${line//|/ })

    # Capture the kay value
    key="${ARRY[0]}"

    # Since the key had been captured, no need to keep it in the array
    unset ARRY[0]

    # Join the other parts of the array into a single value.  There is a chance that
    # The split man have broken the data into multiple values.  This will force the
    # data to be rejoined.
    value="${ARRY[@]}"

    # Save as an env var to the temp file for later processing
    echo "export ${key}=\"${value}\"" >> ${tempFile}
done

# Source the temp file to read in the env vars
. ${tempFile}
At this point, the information stored in the secret is now available as environmental variables to layers and the Lambda function.
Deployment
To deploy this solution, you must build on an instance that is running an Amazon Linux 2 AMI. This ensures that the compiled Golang executable is compatible with the Lambda execution environment.
The easiest way to deploy this solution is from an AWS Cloud9 environment but you can also use an Amazon EC2 instance. To build and deploy the solution into your environment, you need the ARN of the secret that you want to use. A build script is provided to ease deployment and perform compilation, archival, and AWS CDK execution.
To deploy, run:
./build.sh <ARN of the secret to use>
Once the build is complete, the following resources are deployed into your AWS account:
- A Lambda layer (called get-secrets-layer)
- A second Lambda layer for testing (called second-example-layer)
- A Lambda function (called example-get-secrets-lambda)
Testing
To test the deployment, create a test event to send to the new example-get-secrets-lambda Lambda function using the AWS Management Console. The test Lambda function uses both the get-secrets-layer and second-example-layer Lambda layers, and the secret specified from the build. This function logs the values of environmental variables that were created by the get-secrets-layer and second-example-layer layers:
The secret contains the following information:
{
  "EXAMPLE_CONNECTION_TOKEN": "EXAMPLE AUTH TOKEN",
  "EXAMPLE_CLUSTER_ID": "EXAMPLE CLUSTER ID",
  "EXAMPLE_CONNECTION_URL": "EXAMPLE CONNECTION URL",
  "EXAMPLE_TENANT": "EXAMPLE TENANT",
  "AWS_LAMBDA_EXEC_WRAPPER": "/opt/second-example-layer"
}
This is the Python code for the example-get-secrets-lambda function:
import os
import json
import sys

def lambda_handler(event, context):
    print(f"Got event in main lambda [{event}]",flush=True)

    # Return all of the data
    return {
        'statusCode': 200,
        'layer': {
            'EXAMPLE_AUTH_TOKEN': os.environ.get('EXAMPLE_AUTH_TOKEN', 'Not Set'),
            'EXAMPLE_CLUSTER_ID': os.environ.get('EXAMPLE_CLUSTER_ID', 'Not Set'),
            'EXAMPLE_CONNECTION_URL': os.environ.get('EXAMPLE_CONNECTION_URL', 'Not Set'),
            'EXAMPLE_TENANT': os.environ.get('EXAMPLE_TENANT', 'Not Set'),
            'AWS_LAMBDA_EXEC_WRAPPER': os.environ.get('AWS_LAMBDA_EXEC_WRAPPER', 'Not Set')
        },
        'secondLayer': {
            'SECOND_LAYER_EXECUTE': os.environ.get('SECOND_LAYER_EXECUTE', 'Not Set')
        }
    }
When running a test using the AWS Management Console, you see the following response returned from the Lambda in the AWS Management Console:
{
  "statusCode": 200,
  "layer": {
    "EXAMPLE_AUTH_TOKEN": "EXAMPLE AUTH TOKEN",
    "EXAMPLE_CLUSTER_ID": "EXAMPLE CLUSTER ID",
    "EXAMPLE_CONNECTION_URL": "EXAMPLE CONNECTION URL",
    "EXAMPLE_TENANT": "EXAMPLE TENANT",
    "AWS_LAMBDA_EXEC_WRAPPER": "/opt/second-example-layer"
  },
  "secondLayer": {
    "SECOND_LAYER_EXECUTE": "true"
  }
}
When the secret changes, there is a delay before those changes are available to the Lambda layers and function. This is because the layer only executes in the init phase of the Lambda lifecycle. After the Lambda execution environment is recreated and initialized, the layer executes and creates environmental variables with the new secret information.
Conclusion
This solution provides a way to convert information from Secrets Manager into Lambda environment variables. By following this approach, you can centralize the management of information through Secrets Manager, instead of at the function level.
For more information about the Lambda lifecycle, see the Lambda execution environment lifecycle documentation.
The code for this post is available from this GitHub repo.
For more serverless learning resources, visit Serverless Land.
Worth the wait – The Nikon Z9 is EPIC!
Post Syndicated from Matt Granger original https://www.youtube.com/watch?v=GRZxoE28QaU
More Russian SVR Supply-Chain Attacks
Post Syndicated from Bruce Schneier original https://www.schneier.com/blog/archives/2021/10/more-russian-svr-supply-chain-attacks.html
Microsoft is reporting that the same attacker that was behind the SolarWinds breach — the Russian SVR, which Microsoft is calling Nobelium — is continuing with similar supply-chain attacks:
Nobelium has been attempting to replicate the approach it has used in past attacks by targeting organizations integral to the global IT supply chain. This time, it is attacking a different part of the supply chain: resellers and other technology service providers that customize, deploy and manage cloud services and other technologies on behalf of their customers. We believe Nobelium ultimately hopes to piggyback on any direct access that resellers may have to their customers’ IT systems and more easily impersonate an organization’s trusted technology partner to gain access to their downstream customers. We began observing this latest campaign in May 2021 and have been notifying impacted partners and customers while also developing new technical assistance and guidance for the reseller community. Since May, we have notified more than 140 resellers and technology service providers that have been targeted by Nobelium. We continue to investigate, but to date we believe as many as 14 of these resellers and service providers have been compromised. Fortunately, we have discovered this campaign during its early stages, and we are sharing these developments to help cloud service resellers, technology providers, and their customers take timely steps to help ensure Nobelium is not more successful.
Nikon Z9 Announcement – LIVE Q&A
Post Syndicated from Matt Granger original https://www.youtube.com/watch?v=2EfF5Ndgocw
Трудният разговор за Информационно обслужване
Post Syndicated from Bozho original https://blog.bozho.net/blog/3845
Трудният разговор за Информационно обслужване трябва да започне.
Още в края на 2019 г. остро критикувах решението на ГЕРБ да изтрият цяла глава от Закона за електронно управление (маскирайки неуспеха си да създадат държавно предприятие „Единен системен оператор“) и с едно изречение да прехвърлят цялото ИТ на всяка институция, която Министерският съвет реши, под „крилото“ на Информационно обслужване.
Тази уредба премахва изискванията за прозрачност, позволява схеми с вътрешно възлагане тип „Автомагистрали“, не гарантира предсказуемост (за един ден МС може да извади една институция от списъка и да „убие“ всяко планиране).
Няма да се съглася с разпространеното мнение, че Информационно обслужване е пълно с некадърници, които нищо не могат да свършат. Там има хора, които всяка ИТ компания би искала да има, и които са много над средното ниво. Има, разбира се, и такива, които никоя не би искала. Като във всяка голяма компания.
Но институционално погледнато, ролята на системния интегратор (или оператор) е важна. Държавната администрация няма капацитет за почти нищо в сферата на ИТ и трябва да може да се довери на някого. Дори за да направиш аутсорсинг (=ЗОП), пак трябва да имаш компетентност, каквато в много администрации няма.
Трябва да отчетем един факт – миналата есен Информационно обслужване изгради национална здравна информационна система за няколко седмици, когато това беше нужно. И го направи добре, по мое мнение. След като 4 години тази система се беше бавила по различни причини.
DDoS атаките от последните дни са сериозни и едва ли има компания, която може да се защити без никакъв downtime. Познавам инфраструктурата на ИО в тази ѝ част и мисля, че е направено достатъчно.
Въпросите, на които трябва да отговорим, са няколко:
- Трябва ли всяка администрация да си поръчва софтуерни лицензи и хардуер самостоятелно? Моят отговор е „не“ – в много държави има успешни примери за централизирано управление на лицензи и стандартизирани поръчки за хардуер, така че държавата да получи възможно най-добрите оферти. В Тексас дори има агенция, за която производителите имат специални отстъпки в ценовите си листи, защото веднъж влязъл в процеса, производителят получава достъп до цялата администрация „на един клик разстояние“. Информационно обслужване може да върши тази работа.
- Трябва ли всяка администрация да поддържа ИТ компетенции? Отново не; то не е и възможно. Да, трябва да има грамотен ИТ директор, но принципът на „споделените услуги“ изисква вътрешно възлагане на неща като писане на технически задания, текущ контрол по същество (а не по документи), интегриране на системи, спешна извънгаранционна поддръжка и др.
- Трябва ли ИО да е „черна кутия“? Не – това е критика към сегашната уредба. Нищо в закона не задължава ИО да публикува никой от договорите за вътрешно възлагане. Наложи се да искаме договора и заданието за изграждане на НЗИС по реда на Закона за достъп до обществена информация. от МЗ дори поискаха удължаване на срока, явно е било трудно да го намерят. Трябва изрична уредба за каталог на предоставяните услуги, цени, на които се предоставят и пълна прозрачност на извършеното – какво, за кого, колко, кога.
- Не е ли по-добре всичко да се аутсорсне към частния сектор? Краткият отговор е „не винаги“, а дългият е тук: https://blog.bozho.net/blog/3254. За съжаление резултатът през годините не винаги е в полза на този подход. Това не значи, че държавната фирма ще се справи по-добре, разбира се.
- Трябва ли ИО да пише софтуер за администрациите и при какви условия? Това е най-трудният въпрос. Ако ползваме здравната система за пример, отговорът би бил „да“ – след години нищоправене, ИО свърши работата. Но само на този пример не бива да си правим заключения. Вероятно правилният подход е да се уредят няколко критични сектора в закон, така че да има предвидимост, и извън тях ИО да има само поддържаща функция. Това ще е важната част от дебата в следващото Народно събрание.
Все пак Информационно обслужване е важен инструмент за държавата. Има много слабости, които трябва да бъдат коригирани, много конкретика, която да бъде прецизно уредена. Моделът на ГЕРБ „слагаме един ред в закона и правим каквото си искаме“ трябва да спре. Но тези проблеми имат решения и ще ги приложим в следващия управленски мандат.

Материалът Трудният разговор за Информационно обслужване е публикуван за пръв път на БЛОГодаря.
[$] LWN.net Weekly Edition for October 28, 2021
Post Syndicated from original https://lwn.net/Articles/873623/rss
The LWN.net Weekly Edition for October 28, 2021 is available.
TLS Simply and Automatically for Europe’s Largest Cloud Customers
Post Syndicated from Let's Encrypt original https://letsencrypt.org/2021/10/28/tls-simply-and-automatically.html
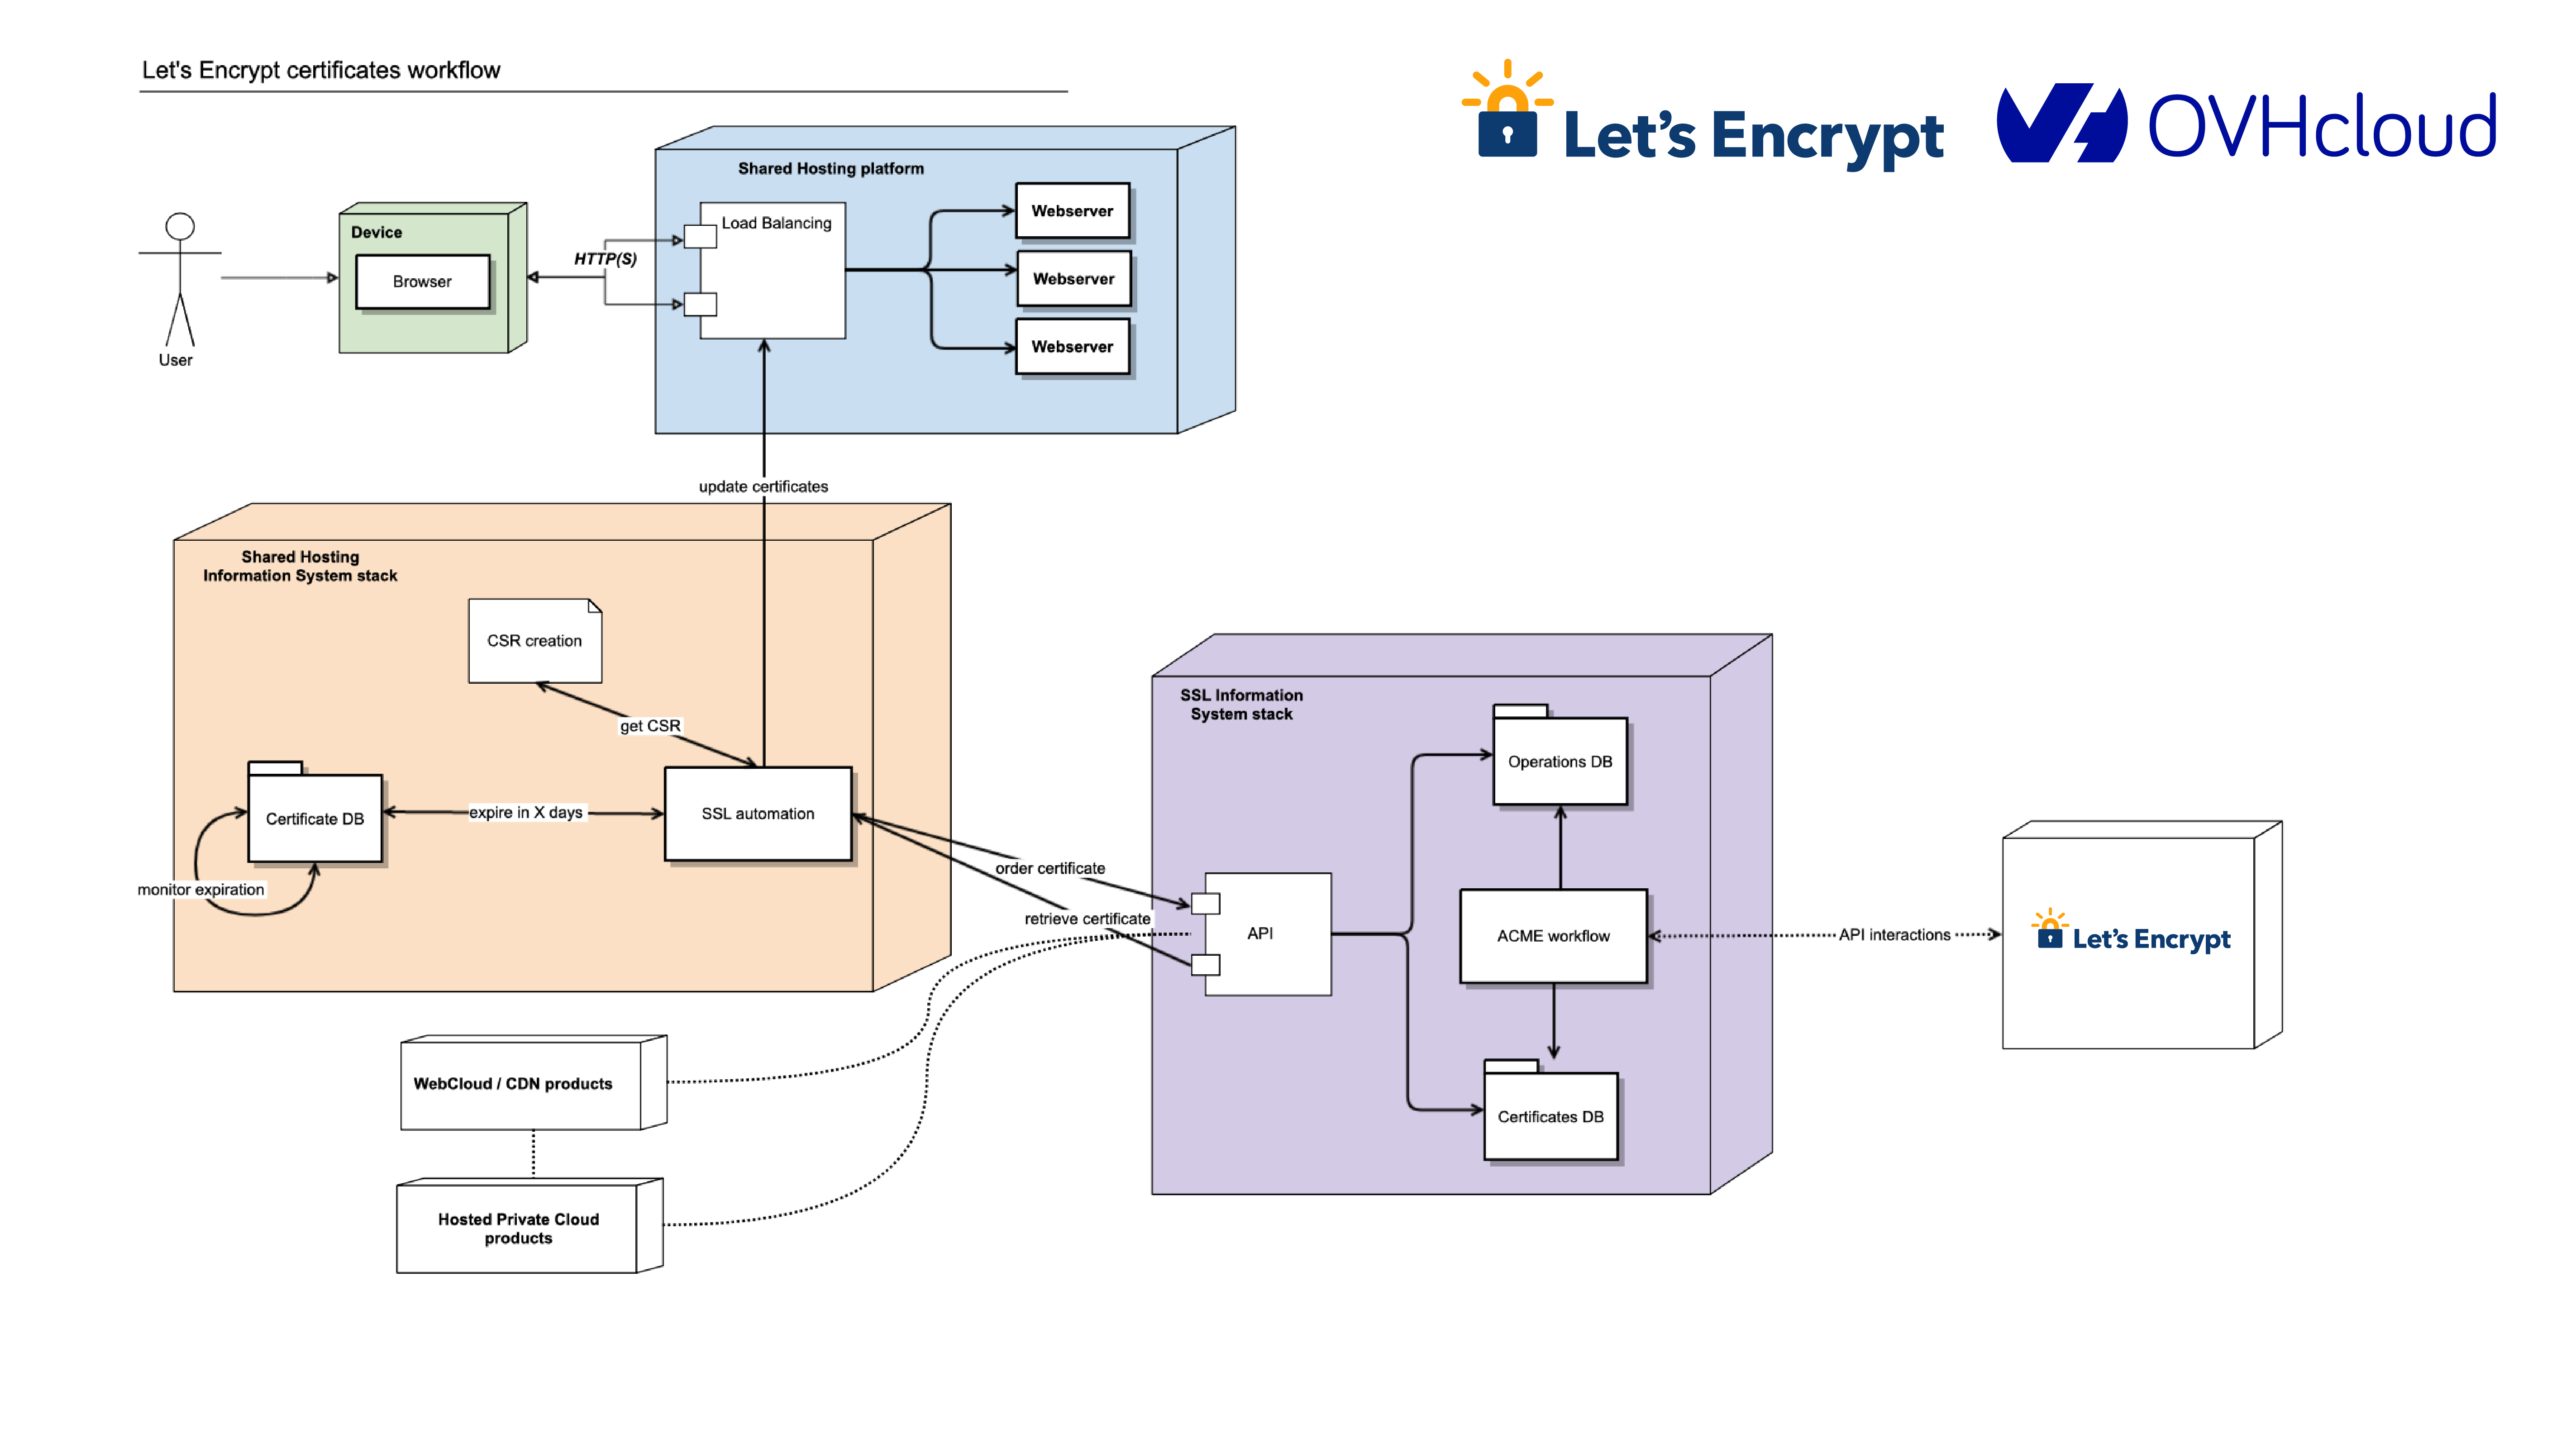
OVHcloud, the largest hosting provider in Europe, has used Let’s Encrypt for TLS certificates since 2016. Since then, they’ve provisioned tens of millions of certificates for their shared hosting customers. We often get asked about how large integrations work and their best practices so this will be the first in a series of blog posts we’ll publish on the topic.
OVHcloud first started looking into using Let’s Encrypt certificates because the team saw a need for the protection provided by TLS for every customer (remember, way back five years ago, when that wasn’t just a thing everybody did?). “Our goal was to deliver TLS simply. We didn’t want to have to write a tutorial for our customers to upload a cert, but instead just click and it works,” said Guillaume Marchand, OVHcloud’s Technical Team Lead.
They considered building their own CA but determined the cost and complexity of doing so would be impractical. Instead, they build an ACME client to prepare for using Let’s Encrypt. It took about six months, “we simply followed the RFC and did a bit of reverse engineering of Certbot,” said Guillaume. In addition to a custom client, OVHcloud automated their Certificate Signing Request (CSR) process and certificate installation process.
Getting a TLS certificate is on the critical path to onboarding a shared hosting client, so monitoring is a big part of OVHcloud’s success with Let’s Encrypt. They set up monitoring at every step in the delivery process: requesting the certificate, asking for challenges, waiting for validation, and requesting certificate creation. They also keep an eye on how long it takes to get a certificate (“it’s really fast”). OVHcloud also monitors our status page to stay apprised of our operational status.
Over 10,000 certificates are issued from Let’s Encrypt to OVHcloud every day. As the company continues to expand into North America, they predict that number will grow. The initial and ongoing work done by the OVHcloud team ensures that TLS will be a simple and reliable aspect of their service.
OVHcloud is a longtime sponsor of ISRG so we’d like to close by thanking them for not just being great technical collaborators, but also financial supporters.
Check out our blog post about how Shopify uses Let’s Encrypt certificates for another example of how our certificates are used in the enterprise.
Supporting Let’s Encrypt
As a nonprofit project, 100% of our funding comes from contributions from our community of users and supporters. We depend on their support in order to provide our services for the public benefit. If your company or organization would like to sponsor Let’s Encrypt please email us at [email protected]. If you can support us with a donation, we ask that you make an individual contribution.
Open-Sourcing a Monitoring GUI for Metaflow
Post Syndicated from Netflix Technology Blog original https://netflixtechblog.com/open-sourcing-a-monitoring-gui-for-metaflow-75ff465f0d60
Open-Sourcing a Monitoring GUI for Metaflow, Netflix’s ML Platform
tl;dr Today, we are open-sourcing a long-awaited GUI for Metaflow. The Metaflow GUI allows data scientists to monitor their workflows in real-time, track experiments, and see detailed logs and results for every executed task. The GUI can be extended with plugins, allowing the community to build integrations to other systems, custom visualizations, and embed upcoming features of Metaflow directly into its views.
Metaflow is a full-stack framework for data science that we started developing at Netflix over four years ago and which we open-sourced in 2019. It allows data scientists to define ML workflows, test them locally, scale-out to the cloud, and deploy to production in idiomatic Python code. Since open-sourcing, the Metaflow community has been growing quickly: it is now the 7th most starred active project on Netflix’s GitHub account with nearly 4800 stars. Outside Netflix, Metaflow is used to power machine learning in production by hundreds of companies across industries from bioinformatics to real estate.
Since its inception, Metaflow has been a command-line-centric tool. It makes it easy for data scientists to express even complex machine learning applications in idiomatic Python, test them locally, or scale them out in the cloud — all using their favorite IDEs and terminals. Following our culture of freedom and responsibility, Metaflow grants data scientists the freedom to choose the right modeling approach, handle data and features flexibly, and construct workflows easily while ensuring that the resulting project executes responsibly and robustly on the production infrastructure.
As the number and criticality of projects running on Metaflow increased — some of which are very central to our business — our ML platform team started receiving an increasing number of support requests. Frequently, the questions were of the nature “can you help me understand why my flow takes so long to execute” or “how can I find the logs for a model that failed last night.” Technically, Metaflow provides a Python API that allows the user to inspect all details e.g., in a notebook, but writing code in a notebook to answer basic questions like this felt overkill and unnecessarily tedious. After observing the situation for months, we started forming an understanding of the kind of a new user interface that could address the growing needs of our users.
Requirements for a Metaflow GUI
Metaflow is a human-centered system by design. We consider our Python API and the CLI to be integral parts of the overall user interface and user experience, which singularly focuses on making it easier to build production-ready ML projects from scratch. In our approach, Python code provides a highly expressive and productive user interface for expressing complex business logic, such as ML models and workflows. At the same time, the CLI allows users to execute specific commands quickly and even automate common actions. When it comes to complex, real-life development work like this, it would be hard to achieve the same level of productivity on a graphical user interface.
However, textual UIs are quite lacking when it comes to discoverability and getting a holistic understanding of the system’s state. The questions we were hearing reflected this gap: we were lacking a user interface that would allow the users, quite simply, to figure out quickly what is happening in their Metaflow projects.
Netflix has a long history of developing innovative tools for observability, so when we began to specify requirements for the new GUI, we were able to leverage experiences from the previous GUIs built for other use cases, as well as real-life user stories from Metaflow users. We wanted to scope the GUI tightly, focusing on a specific gap in the Metaflow experience:
- The GUI should allow the users to see what flows and tasks are executing and what is happening inside them. Notably, we didn’t want to replace any of the functionality in the Metaflow APIs or CLI with the GUI — just to complement them. This meant that the GUI would be read-only: all actions like writing code and starting executions should happen on the users’ IDE and terminal as before. We also had no need to build a model-monitoring GUI yet, which is a wholly separate problem domain.
- The GUI would be targeted at professional data scientists. Instead of a fancy GUI for demos and presentations, we wanted a serious productivity tool with carefully thought-out user workflows that would fit seamlessly into our toolchain of data science. This requires attention to small details: for instance, users should be able to copy a link to any view in the GUI and share it e.g., on Slack, for easy collaboration and support (or to integrate with the Metaflow Slack bot). And, there should be natural affordances for navigating between the CLI, the GUI, and notebooks.
- The GUI should be scalable and snappy: it should handle our existing repository consisting of millions of runs, some of which contain tens of thousands of tasks without hiccups. Based on our experiences with other GUIs operating at Netflix-scale, this is not a trivial requirement: scalability needs to be baked into the design from the very beginning. Sluggish GUIs are hard to debug and fix afterwards, and they can have a significantly negative impact on productivity.
- The GUI should integrate well with other GUIs. A modern ML stack consists of many independent systems like data warehouses, compute layers, model serving systems, and, in particular, notebooks. It should be possible to find runs and tasks of interest in the Metaflow GUI and use a task-specific view to jump to other GUIs for further information. Our landscape of tools is constantly evolving, so we didn’t want to hardcode these links and views in the GUI itself. Instead, following the integration-friendly ethos of Metaflow, we want to embed relevant information in the GUI as plugins.
- Finally, we wanted to minimize the operational overhead of the GUI. In particular, under no circumstances should the GUI impact Metaflow executions. The GUI backend should be a simple service, optionally sitting alongside the existing Metaflow metadata service, providing a read-only, real-time view to the stored state. The frontend side should be easily extensible and maintainable, suggesting that we wanted a modern React app.
Monitoring GUI for Metaflow
As our ML Platform team had limited frontend resources, we reached out to Codemate to help with the implementation. As it often happens in software engineering projects, the project took longer than expected to finish, mostly because the problem of tracking and visualizing thousands of concurrent objects in real-time in a highly distributed environment is a surprisingly non-trivial problem (duh!). After countless iterations, we are finally very happy with the outcome, which we have now used in production for a few months.
When you open the GUI, you see an overview of all flows and runs, both current and historical, which you can group and filter in various ways:
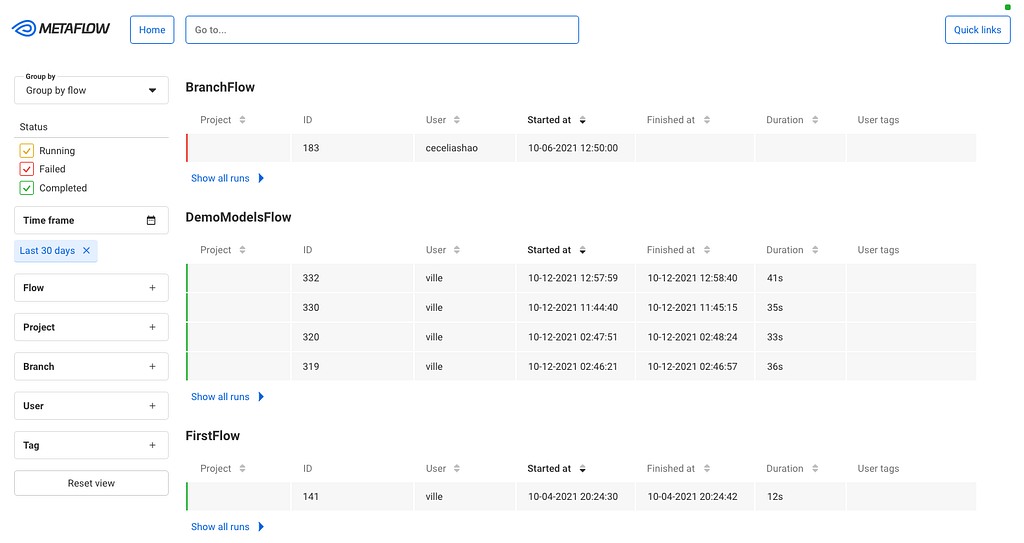
We can use this view for experiment tracking: Metaflow records every execution automatically, so data scientists can track all their work using this view. Naturally, the view can be grouped by user. They can also tag their runs and filter the view by tags, allowing them to focus on particular subsets of experiments.
After you click a specific run, you see all its tasks on a timeline:
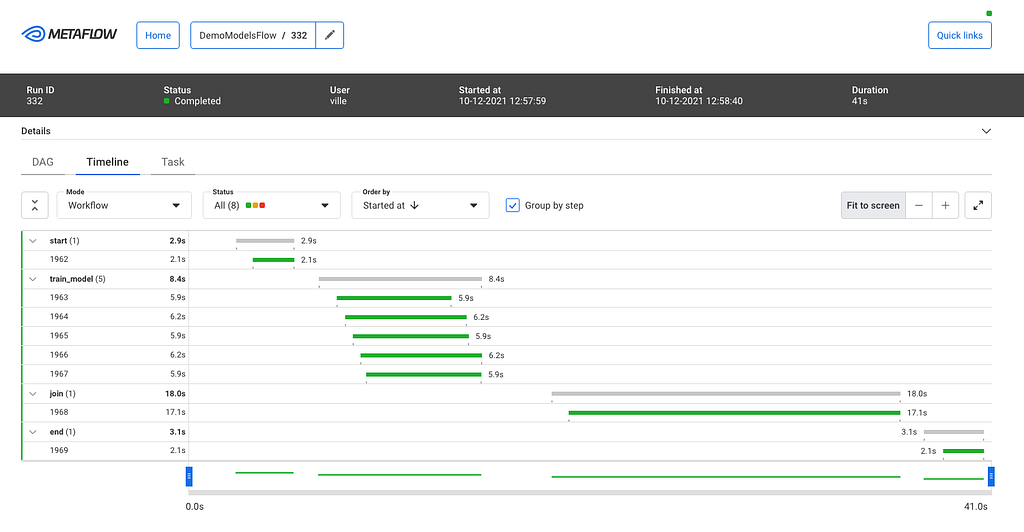
The timeline view is extremely useful in understanding performance bottlenecks, distribution of task runtimes, and finding failed tasks. At the top, you can see global attributes of the run, such as its status, start time, parameters etc. You can click a specific task to see more details:
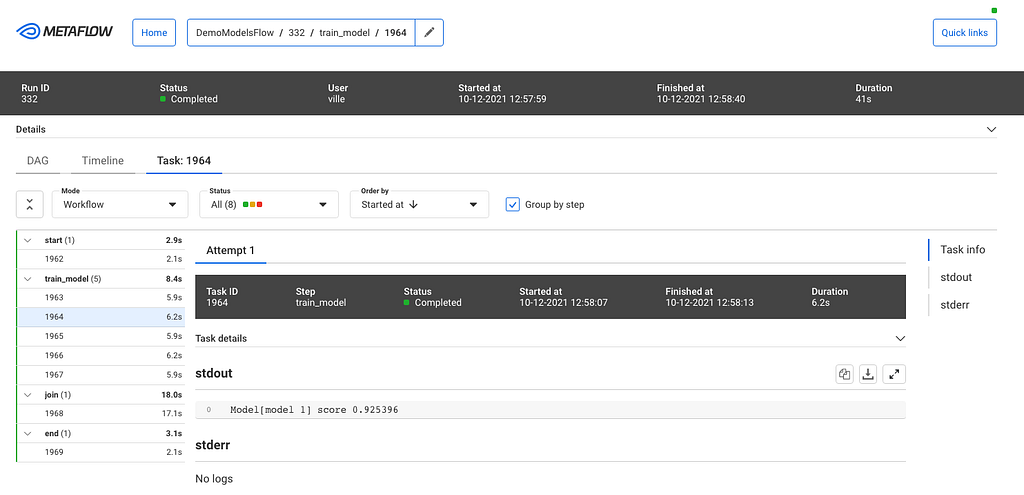
This task view shows logs produced by a task, its results, and optionally links to other systems that are relevant to the task. For instance, if the task had deployed a model to a model serving platform, the view could include a link to a UI used for monitoring microservices.
As specified in our requirements, the GUI should work well with Metaflow CLI. To facilitate this, the top bar includes a navigation component where the user can copy-paste any pathspec, i.e., a path to any object in the Metaflow universe, which are prominently shown in the CLI output. This way, the user can easily move from the CLI to the GUI to observe runs and tasks in detail.
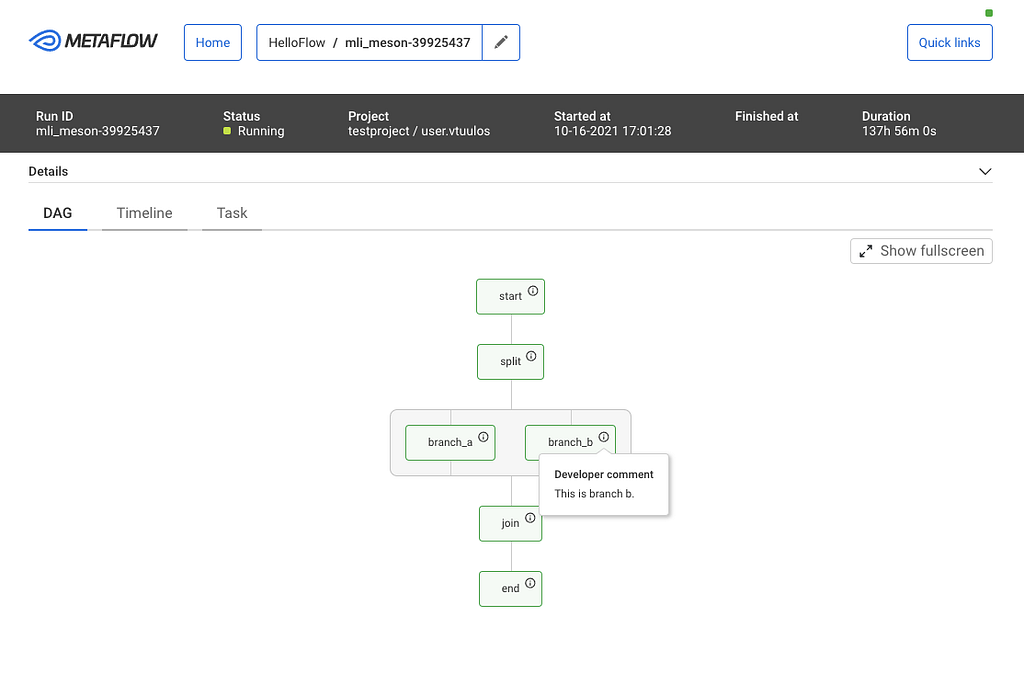
While the CLI is great, it is challenging to visualize flows. Each flow can be represented as a Directed Acyclic Graph (DAG), and so the GUI provides a much better way to visualize a flow. The DAG view presents all the steps of a flow and how they are related. Each step may have developer comments. They are colored to indicate the current state. Split steps are grouped by shaded boxes, while steps that participated in a foreach are grouped by a double shade box. Clicking on a step will take you to the Task view.
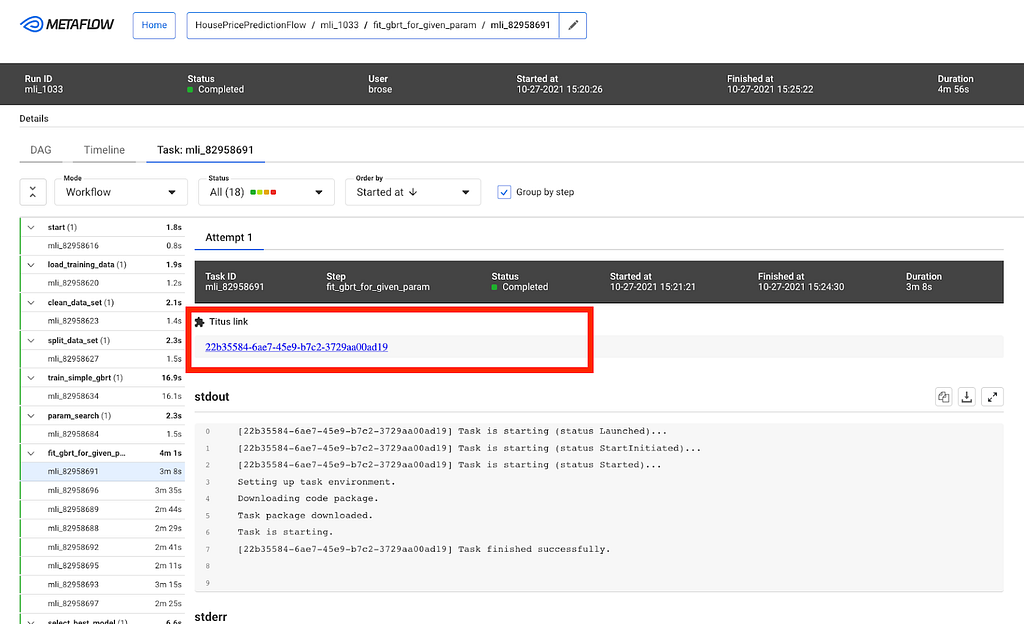
Users at different organizations will likely have some special use cases that are not directly supported. The Metaflow GUI is extensible through its plugin API. For example, Netflix has its container orchestration platform called Titus. Users can configure tasks to utilize Titus to scale up or out. When failures happen, users will need to access their Titus containers for more information, and within the task view, a simple plugin provides a link for further troubleshooting.
Try it at home!
We know that our user stories and requirements for a Metaflow GUI are not unique to Netflix. A number of companies in the Metaflow community have requested GUI for Metaflow in the past. To support the thriving community and invite 3rd party contributions to the GUI, we are open-sourcing our Monitoring GUI for Metaflow today!
You can find detailed instructions for how to deploy the GUI here. If you want to see the GUI in action before deploying it, Outerbounds, a new startup founded by our ex-colleagues, has deployed a public demo instance of the GUI. Outerbounds also hosts an active Slack community of Metaflow users where you can find support for GUI-related issues and share feedback and ideas for improvement.
With the new GUI, data scientists don’t have to fly blind anymore. Instead of reaching out to a platform team for support, they can easily see the state of their workflows on their own. We hope that Metaflow users outside Netflix will find the GUI equally beneficial, and companies will find creative ways to improve the GUI with new plugins.
For more context on the development process and motivation for the GUI, you can watch this recording of the GUI launch meetup.
![]()
Open-Sourcing a Monitoring GUI for Metaflow was originally published in Netflix TechBlog on Medium, where people are continuing the conversation by highlighting and responding to this story.
Identifying optimal locations for flexible workloads with Spot placement score
Post Syndicated from Pranaya Anshu original https://aws.amazon.com/blogs/compute/identifying-optimal-locations-for-flexible-workloads-with-spot-placement-score/
This post is written by Jessie Xie, Solutions Architect for EC2 Spot, and Peter Manastyrny, Senior Product Manager for EC2 Auto Scaling and EC2 Fleet.
Amazon EC2 Spot Instances let you run flexible, fault-tolerant, or stateless applications in the AWS Cloud at up to a 90% discount from On-Demand prices. Since we introduced Spot Instances back in 2009, we have been building new features and integrations with a single goal – to make Spot easy and efficient to use for your flexible compute needs.
Spot Instances are spare EC2 compute capacity in the AWS Cloud available for steep discounts. In exchange for the discount, Spot Instances are interruptible and must be returned when EC2 needs the capacity back. The location and amount of spare capacity available at any given moment is dynamic and changes in real time. This is why Spot workloads should be flexible, meaning they can utilize a variety of different EC2 instance types and can be shifted in real time to where the spare capacity currently is. You can use Spot Instances with tools such as EC2 Fleet and Amazon EC2 Auto Scaling which make it easy to run workloads on multiple instance types.
The AWS Cloud spans 81 Availability Zones across 25 Regions with plans to launch 21 more Availability Zones and 7 more Regions. However, until now there was no way to find an optimal location (either a Region or Availability Zone) to fulfill your Spot capacity needs without trying to launch Spot Instances there first. Today, we are excited to announce Spot placement score, a new feature that helps you identify an optimal location to run your workloads on Spot Instances. Spot placement score recommends an optimal Region or Availability Zone based on the amount of Spot capacity you need and your instance type requirements.
Spot placement score is useful for workloads that could potentially run in a different Region. Additionally, because the score takes into account your instance type selection, it can help you determine if your request is sufficiently instance type flexible for your chosen Region or Availability Zone.
How Spot placement score works
To use Spot placement score you need to specify the amount of Spot capacity you need, what your instance type requirements are, and whether you would like a recommendation for a Region or a single Availability Zone. For instance type requirements, you can either provide a list of instance types, or the instance attributes, like the number of vCPUs and amount of memory. If you choose to use the instance attributes option, you can then use the same attribute configuration to request your Spot Instances in the recommended Region or Availability Zone with the new attribute-based instance type selection feature in EC2 Fleet or EC2 Auto Scaling.
Spot placement score provides a list of Regions or Availability Zones, each scored from 1 to 10, based on factors such as the requested instance types, target capacity, historical and current Spot usage trends, and time of the request. The score reflects the likelihood of success when provisioning Spot capacity, with a 10 meaning that the request is highly likely to succeed. Provided scores change based on the current Spot capacity situation, and the same request can yield different scores when ran at different times. It is important to note that the score serves as a guideline, and no score guarantees that your Spot request will be fully or partially fulfilled.
You can also filter your score by Regions or Availability Zones, which is useful for cases where you can use only a subset of AWS Regions, for example any Region in the United States.
Let’s see how Spot placement score works in practice through an example.
Using Spot placement score with AWS Management Console
To try Spot placement score, log into your AWS account, select EC2, Spot Requests, and click on Spot placement score to open the Spot placement score window.

Here, you need provide your target capacity and instance type requirements by clicking on Enter requirements. You can enter target capacity as a number of instances, vCPUs, or memory. vCPUs and memory options are useful for vertically scalable workloads that are sized for a total amount of compute resources and can utilize a wide range of instance sizes. Target capacity is limited and based on your recent Spot usage with accounting for potential usage growth. For accounts that do not have recent Spot usage, there is a default limit aligned with the Spot Instances limit.
For instance type requirements, there are two options. First option is to select Specify instance attributes that match your compute requirements tab and enter your compute requirements as a number of vCPUs, amount of memory, CPU architecture, and other optional attributes. Second option is to select Manually select instance types tab and select instance types from the list.
Please note that you need to select at least three different instance types (that is, different families, generations, or sizes). If you specify a smaller number of instance types, Spot placement score will always yield a low score. Spot placement score is designed to help you find an optimal location to request Spot capacity tailored to your specific workload needs, but it is not intended to be used for getting high-level Spot capacity information across all Regions and instance types.
Let’s try to find an optimal location to run a workload that can utilize r5.8xlarge, c5.9xlarge, and m5.8xlarge instance types and is sized at 2000 instances.

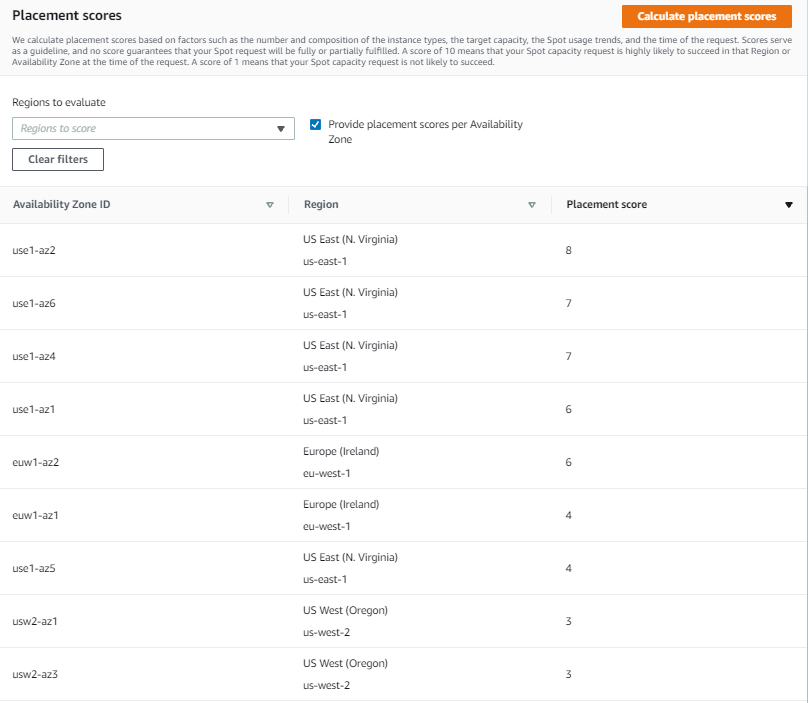
Once you select 2000 instances under Target capacity, select r5.8xlarge, c5.9xlarge, and m5.8xlarge instances under Select instance types, and click Load placement score button, you will get a list of Regions sorted by score in a descending order. There is also an option to filter by specific Regions if needed.
The highest rated Region for your requirements turns out to be US East (N. Virginia) with a score of 8. The second closest contender is Europe (Ireland) with a score of 5. That tells you that right now the optimal Region for your Spot requirements is US East (N. Virginia).

Let’s now see if it is possible to get a higher score. Remember, the key best practice for Spot is to be flexible and utilize as many instance types as possible. To do that, press the Edit button on the Target capacity and instance type requirements tab. For the new request, keep the same target capacity at 2000, but expand the selection of instance types by adding similarly sized instance types from a variety of instance families and generations, i.e., r5.4xlarge, r5.12xlarge, m5zn.12xlarge, m5zn.6xlarge, m5n.8xlarge, m5dn.8xlarge, m5d.8xlarge, r5n.8xlarge, r5dn.8xlarge, r5d.8xlarge, c5.12xlarge, c5.4xlarge, c5d.12xlarge, c5n.9xlarge. c5d.9xlarge, m4.4xlarge, m4.16xlarge, m4.10xlarge, r4.8xlarge, c4.8xlarge.
After requesting the scores with updated requirements, you can see that even though the score in US East (N. Virginia) stays unchanged at 8, the scores for Europe (Ireland) and US West (Oregon) improved dramatically, both raising to 9. Now, you have a choice of three high-scored Regions to request your Spot Instances, each with a high likelihood to succeed.
To request Spot Instances based on the score, you can use EC2 Fleet or EC2 Auto Scaling. Please note, that the score implies that you use capacity-optimized Spot allocation strategy when requesting the capacity. If you use other allocation strategies, such as lowest-price, the result in the recommended Region or Availability Zone will not align with the score provided.

You can also request the scores at the Availability Zone level. This is useful for running workloads that need to have all instances in the same Availability Zone, potentially to minimize inter-Availability Zone data transfer costs. Workloads such as Apache Spark, which involve transferring a high volume of data between instances, would be a good use case for this. To get scores per Availability Zone you can check the box Provide placement scores per Availability Zone.
When requesting instances based on Availability Zone recommendation, you need to make sure to configure EC2 Fleet or EC2 Auto Scaling request to only use that specific Availability Zone.
With Spot placement score, you can test different instance type combinations at different points in time, and find the most optimal Region or Availability Zone to run your workloads on Spot Instances.
Availability and pricing
You can use Spot placement score today in all public and AWS GovCloud Regions with the exception of those based in China, where we plan to release later. You can access Spot placement score using the AWS Command Line Interface (CLI), AWS SDKs, and Management Console. There is no additional charge for using Spot placement score, you will only pay EC2 standard rates if provisioning instances based on recommendation.
To learn more about using Spot placement score, visit the Spot placement score documentation page. To learn more about best practices for using Spot Instances, see Spot documentation.
New – Attribute-Based Instance Type Selection for EC2 Auto Scaling and EC2 Fleet
Post Syndicated from Danilo Poccia original https://aws.amazon.com/blogs/aws/new-attribute-based-instance-type-selection-for-ec2-auto-scaling-and-ec2-fleet/
The first AWS service I used, more than ten years ago, was Amazon Elastic Compute Cloud (Amazon EC2). Over time, EC2 has added a wide selection of instance types optimized to fit different use cases, with a varying combination of CPU/GPU, memory, storage, and networking capacity to give you the flexibility to choose the appropriate mix of resources for your applications.
One of the key advantages of the cloud is elasticity. With EC2 Fleet, you can synchronously request capacity across multiple instance types and purchase options, launching your instances across multiple Availability Zones, using the On-Demand, Reserved, and Spot Instances together. With EC2 Auto Scaling, you can automatically add or remove EC2 instances according to conditions you define and add advanced instance management capabilities such as warm pools, instance refresh, and health checks. With these tools, you need to manually update your configurations to benefit from the newest EC2 instances. Also, when you use EC2 Spot Instances to optimize your costs, it is important that you select multiple instance types to access the highest amount of Spot capacity. Until now, there was no easy way to build and maintain instance type configurations in a flexible way.
Today, I am happy to share that we are introducing attribute-based instance type selection (ABS), a new feature that lets you express your instance requirements as a set of attributes, such as vCPU, memory, and storage. Your requirements are translated by ABS to all matching instance types, simplifying the creation and maintenance of instance type configurations. This also allows you to automatically use newer generation instance types when they are released and access a broader range of capacity via EC2 Spot Instances. EC2 Fleet and EC2 Auto Scaling select and launch instances that fit the specified attributes, removing the need to manually pick instance types.
ABS is ideal for flexible workloads and frameworks, such as when running containers or web fleets, processing big data, and implementing continuous integration and deployment (CI/CD) tooling. When using Spot Instances, instead of picking and entering tens of instance types and sizes, you can now just use a simple attribute config to cover all of them and include new ones as they come out.
How Attribute-Based Instance Type Selection Works
With ABS, you replace the list of instance types with your instance requirements. You can specify instance requirements inside a launch template or in the EC2 Fleet or EC2 Auto Scaling requests as a launch template override.
ABS works in two steps:
- First, ABS determines a list of instance types based on specified attributes, AWS Region, Availability Zone, and price.
- Then, EC2 Auto Scaling or EC2 Fleet applies the selected allocation strategy to that list.
For Spot Instances, ABS supports the capacity-optimized and the lowest-price allocation strategies.
For On-Demand Instances, ABS supports the lowest-price allocation strategy. EC2 Auto Scaling or EC2 Fleet will resolve ABS attributes to a list of instance types and will launch the lowest priced instance first to fulfill the On-Demand portion of the capacity request, moving to the next lowest priced instance if needed.
By default ABS enables price protection to keep your spending under control. Price protection makes ABS avoid provisioning overly expensive instance types even if they happen to fit the attributes you selected and keeps the prices of provisioned instances within certain boundaries. With price protection enabled, ABS doesn’t select instance types whose price is above price protection thresholds. There are two separate thresholds for Spot and On-Demand instances that you can optionally customize.
Let’s see how ABS works in practice with a couple of examples.
Using Attribute-Based Instance Type Selection with EC2 Auto Scaling
I use the AWS Command Line Interface (CLI) with the --generate-cli-skeleton parameter to generate a file in YAML format with all the parameters accepted by the CreateAutoScalingGroup API.
In the YAML file, there is a new InstanceRequirements section that can be used to override the configuration of the launch template. These are all the attributes I can choose from with some sample values:
InstanceRequirements:
  VCpuCount:  # [REQUIRED]
    Min: 0
    Max: 0
  MemoryMiB: # [REQUIRED]
    Min: 0
    Max: 0
  CpuManufacturers:
  - amd
  MemoryGiBPerVCpu:
    Min: 0.0
    Max: 0.0
  ExcludedInstanceTypes:
  - ''
  InstanceGenerations:
  - previous
  SpotMaxPricePercentageOverLowestPrice: 0
  OnDemandMaxPricePercentageOverLowestPrice: 0
  BareMetal: required  #  Valid values are: included, excluded, required.
  BurstablePerformance: excluded #  Valid values are: included, excluded, required.
  RequireHibernateSupport: true
  NetworkInterfaceCount:
    Min: 0
    Max: 0
  LocalStorage: required  #  Valid values are: included, excluded, required.
  LocalStorageTypes:
  - ssd
  TotalLocalStorageGB:
    Min: 0.0
    Max: 0.0
  BaselineEbsBandwidthMbps:
    Min: 0
    Max: 0
  AcceleratorTypes:
  - inference
  AcceleratorCount:
    Min: 0
    Max: 0
  AcceleratorManufacturers:
  - amazon-web-services
  AcceleratorNames:
  - a100
  AcceleratorTotalMemoryMiB:
    Min: 0
    Max: 0
Instead of providing a list of overrides, each having an InstanceType attribute with a single instance type selected, I can now select the instance types based on my requirements. I can specify the minimum and maximum amount of vCPUs, and the range of memory. Optionally, I can ask for a minimum amount of memory per vCPUs.
There are many more attributes that I can select from. For example, I can include, exclude, or require the use of bare metal or burstable instances. I can add networking or storage requirements. If necessary, I can ask for GPU or FPGA accelerators, and so on.
In my case, I ask for instances with two to four vCPUs and at least 2048 MiB of memory. Previously, it would have taken about 40 overrides, one for each instance type that meets these requirements, but with ABS, I just have to specify three parameters in the InstanceRequirements section. This is the full configuration file I am going to use to create the Auto Scaling group:
I create the Auto Scaling group passing the configuration file with the --cli-input-yaml parameter:
After a few minutes, four EC2 instances (corresponding to my DesiredCapacity) are running in the EC2 console. In the list, I find both C3 and C5a instances, spanning both time and CPU manufacturer.

Of those instances, 50 percent is On-Demand (based on the OnDemandPercentageAboveBaseCapacity option in the InstancesDistribution section). In the Spot Request tab of the EC2 console, I see the two requests:

As expected, all instance types follow my requirements and have size large. However, I quickly realize my application needs more compute capacity in each instance. I update the Auto Scaling group with the new requirements, asking for more vCPUs (between four and six):
Then, I start the instance refresh of the Auto Scaling group:
EC2 Auto Scaling performs a rolling replacement of the instances based on the new requirements. After a few minutes, all instances have been replaced by new ones with size xlarge, and I have a mix of C5, C5a, and M3 instances running. All previous instances have been terminated.

Similar to before, two of the new instances are launched using Spot requests. The previous Spot requests have been closed.

How to Preview Matching Instances without Launching Them
To better understand how the new ABS works, I use the new EC2 GetInstanceTypesFromInstanceRequirements API. This API returns the list of instance types matching my requirements.
First, I create the YAML parameter file:
I edit the file with the same requirements I used to update the Auto Scaling group. This time, I also ask to use current generation instances:
ArchitectureTypes:  # [REQUIRED]
- x86_64
VirtualizationTypes: # [REQUIRED]
- hvm
InstanceRequirements: # [REQUIRED]
  VCpuCount:
    Min: 4
    Max: 6
  MemoryMiB:
    Min: 2048
  InstanceGenerations:
    - current
Note that here I had to specify the type of architecture (x86_64) and virtualization (hvm). When creating the Auto Scaling group, this information was provided by the Amazon Machine Images (AMI) used by the launch template.
Now, let’s preview all the instance types selected by these requirements:
Using this new EC2 API, I can quickly test different requirements and see how they map to instance types. When new instance types are released, they are automatically added to the list if they match my requirements.
Availability and Pricing
You can use attribute-based instance type selection (ABS) with EC2 Auto Scaling and EC2 Fleet today in all public and GovCloud AWS Regions, with the exception of those based in China where we need more time. You can configure ABS using the AWS Command Line Interface (CLI), AWS SDKs, AWS Management Console, and AWS CloudFormation. There is no additional charge for using ABS; you only pay the standard EC2 pricing for the provisioned instances. For more information on price protection, see the EC2 Auto Scaling documentation.
This new feature makes it easy to use flexible instance type configurations instead of long lists of instance types. In this way, you can automatically use newer generation instance types when they are released in the Region. Also, you can easily access more capacity with your Spot requests.
Simplify your EC2 instance type configurations with attribute-based instance type selection.
— Danilo
Field Notes: Understanding Carrier Codes, Message Structure, and Interaction Analytics with Amazon Pinpoint
Post Syndicated from Edward Schaefer original https://aws.amazon.com/blogs/architecture/field-notes-understanding-carrier-codes-message-structure-and-interaction-analytics-with-amazon-pinpoint/
IT developers are frequently looking for an analytics system that tracks app user behavior and engagement with various marketing campaigns. It can be challenging to differentiate between use cases and advantages of utilizing Long Codes, Short Codes and Toll-Free numbers to feed into interaction analytics. With Amazon Pinpoint, developers can learn how each user prefers to engage and can personalize their end-user’s experience to increase engagement.
In this blog post, we’ll evaluate the differences between Long Codes, Short Codes and Toll-Free and we’ll also discuss messaging templates and creating journeys to customize events handling in Amazon Pinpoint.
Typical use cases of Amazon Pinpoint include:
- Sending timely and targeted message to your customers promoting your products and services with basic templates or highly-personalized messages.
- Event-based campaigns can be used to send a message when a customer creates a new account or when they add an item to their cart but don’t purchase it. These communications are transactional in nature and can be sent on customer activities within your application.
- You can create customer outreach with millions in user communities and use built-in analytics to observe your campaign performance.
SMS messaging forms one of the most critical communication channels with customers. Both one way and two-way messaging are supported by Amazon Pinpoint when you enable the SMS channel in your project.
Architecture overview
The following diagram illustrates a typical architecture for how Pinpoint integrates with various AWS services.
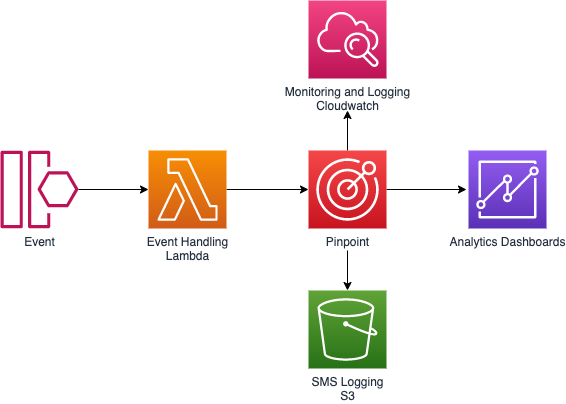
Long codes, short codes, and toll-free numbers
Dedicated long codes and 10DLC
A dedicated long code, also referred to as a long virtual number or LVN, is a standard phone number that contains up to 12 digits, depending on the country that it’s based in. You cannot request a long code for A2P messaging within the United States. Instead, you’ll need to request a 10DLC.
Typically used for customer service-related communications, long codes also allow businesses to establish consistent experiences. This is done by using the same number to send both SMS text messages as well as voice messages to customers.
In the United States, 10-digit long code (10DLC) numbers are designed specifically for high-volume Application-to-Person (A2P) messaging. Before purchasing a 10DLC, you must first register your company and create a campaign using the Amazon Pinpoint console. Since Jun 1, 2021, United States mobile carriers require 10DLC for A2P messages.
Common use cases: Customer service, appointment reminders, two-way communications, fraud, or emergency notifications (10DLC), promotional messaging (10DLC).
Advantages:
- Customer Trust and Brand recognition: 10DLC and dedicated long codes are registered and dedicated to individual companies and campaigns. This means that if you send multiple messages to a recipient each message will appear to come from the same number.
- SMS and Voice capable: Businesses can use the same long code numbers for both SMS and voice communications to provide consistent contact experiences to their customers.
- High reliability and delivery rate (10DLC): 10DLC has been adopted by United States wireless carriers specifically for business messaging. By requiring a registration and pre-vetting process, wireless carriers can support higher message volumes and better deliverability while protecting consumers from potential abuse.
- Low costs: 10DLC and dedicated long code numbers cost less than dedicate short codes.
- Fast provisioning: Dedicated long codes are typically provisioned within 24-hours. 10DLC numbers are provisioned in about 1 week. These timelines are much shorter than the 10+ weeks needed for short code provisioning.
Disadvantages:
- Carrier specific limits (10DLC): United States mobile carriers have announced varying throughput and volume limits depending on the tier assigned to your company. This can make planning more difficult. See 10DLC capabilities for an outline of carrier-specific limits.
- Limited Throughput (Long Codes): Mobile carriers limit the throughput rate of dedicated long codes to 1 message part per second (MPS) in Canada and 10 MPS in all other countries and regions. This creates a bottleneck when messaging thousands of recipients.
- Transactional messaging only (Long Codes): Mobile carriers prohibit the use of long codes for promotional or marketing messages. Violations could cause carriers to block messages, impose fines, or shut down service.
- Difficult to remember: Compared to 5-digit to 6-digit short codes, 10-digit numbers are more difficult for customers to remember and to enter into their devices.
Toll-free numbers
Similar to dedicated long codes, toll-free numbers are 10-digit phone numbers beginning with one of the following area codes: 800, 888, 877, 866, 855, 844, or 833. Toll-free numbers are primarily used for transactional messages but they can be used promotional messaging if recipients opt-in to receiving messages and the opt-out rate is low.
Common use cases: Customer service, appointment reminders, two-way communications, fraud or emergency notifications.
Advantages:
- SMS and Voice capable: Businesses can use the same toll-free numbers for both SMS and voice communications to provide consistent contact experiences to their customers.
- Low costs: Like 10DLC and dedicated long code numbers, toll-free numbers cost significantly less than dedicate short codes.
- Fast Provisioning: Typically, toll-free numbers are available immediately after request submission.
Disadvantages:
- Supported in United States Only: Currently Amazon Pinpoint only supports SMS-enabled toll-free numbers in the United States. A toll-free number cannot be used to send messages outside of the US.
- Limited Throughput: Mobile carriers limit the throughput rate of toll-free numbers to 3 MPS.
Dedicated short codes
Dedicated short codes are 3-digit to 8-digit numbers are commonly used for high-throughput application-to-person (A2P) messaging workloads. Mobile carriers review and approve all new short code requests before making them active. This vetting process allows messages sent using short codes to bypass carrier filters.
Common use-cases: Promotional messaging, emergency alert systems, mass communications, contest and voting submissions, and two-factor authentication.
Advantages:
- High-throughput and high-volume messaging: Short codes are designed to be used for high volume messaging campaigns. The vetting and approval process required before activating short codes allows carriers to provide increased MPS throughput and daily message volume quotas while still protecting consumers from abuse.
- High reliability and delivery rate: Due to the lengthy approval and audit process required to acquire a dedicated short code, short codes are not subject to carrier filtering resulting in reliable message delivery.
- Easy to remember: Short codes are commonly 5–6 digits in length. This short length allows users to easily recognize and remember codes, increasing campaign effectiveness.
Disadvantages:
- Lengthy Provisioning Time: It can take 8–12 weeks for short codes to become active on all carrier networks.
- High Cost: Short code numbers have high one-time setup and monthly fees compared to other originating identities. For example, in the United States, there’s a $650 one-time setup fee plus an additional recurring charge of $995.00 per month for each short code.
- Strict rules and regulations: Short codes are governed by different regulatory bodies depending on the country and region. For example, in the United States short codes are regulated by the Federal Communications Commission (FCC), Federal Trade Commission (FTC), and Cellular Telecommunications Industry Association (CTIA). Review Best Practices to learn about the key SMS messaging laws around the world.
| Number type | Number format | Channel support | Two-way capable | Requires registration | Estimated Provisioning time | SMS throughput (message segments per-second)² | Pricing³ | |
| 1 | Long Code/10DLC | 10DLC: 10 digits Long Codes: up to 12 digits |
SMS Voice |
Yes* | Yes | 1 week | United States (US): Varies¹ Canada (CA): 1 MPS All other countries and regions: 10 MPS |
$1/mo + registration |
| 2 | Short code | 3–8 digits | SMS | Yes* | Yes | United States (US): 12 weeks Canada (CA): 16 weeks All other countries and regions: Varies |
United States (US) 100 MPS Canada (CA): 100 MPS All other countries and regions: Varies by country |
United States (US): $650 setup + $995/mo Canada (CA): $3,000 setup + $995/mo All other countries and regions: Varies |
| 3 | Toll-free | 10 digits | SMS Voice |
Yes* | No | Available immediately | United States (US): 3 MPS Canada (CA): N/A All other countries and regions: N/A |
$2/mo |
¹ https://docs.aws.amazon.com/pinpoint/latest/userguide/settings-10dlc.html
² https://docs.aws.amazon.com/pinpoint/latest/userguide/channels-sms-limitations-characters.html
³ https://aws.amazon.com/pinpoint/pricing/#Numbers
*visit Supported countries and regions (SMS channel) to check the SMS capabilities in your recipients’ countries.
Message templates
When you start using Amazon Pinpoint, you’ll want to think about your message templates. These templates are the context of your messages and can be used for any of the four supported messaging channels–SMS, Voice, Push Notifications, and Voice.
When creating your templates, you can use custom attributes that you imported when building your segment. We won’t be going into building your segments as that’s covered in Building segments.
We’ll outline how to create a template for SMS messages as that’s focus for this blog post. The first section we have to fill out is our template details. You can access template creation page by navigating to the Message templates section in the left ‘hamburger’ menu when on the pinpoint service page.
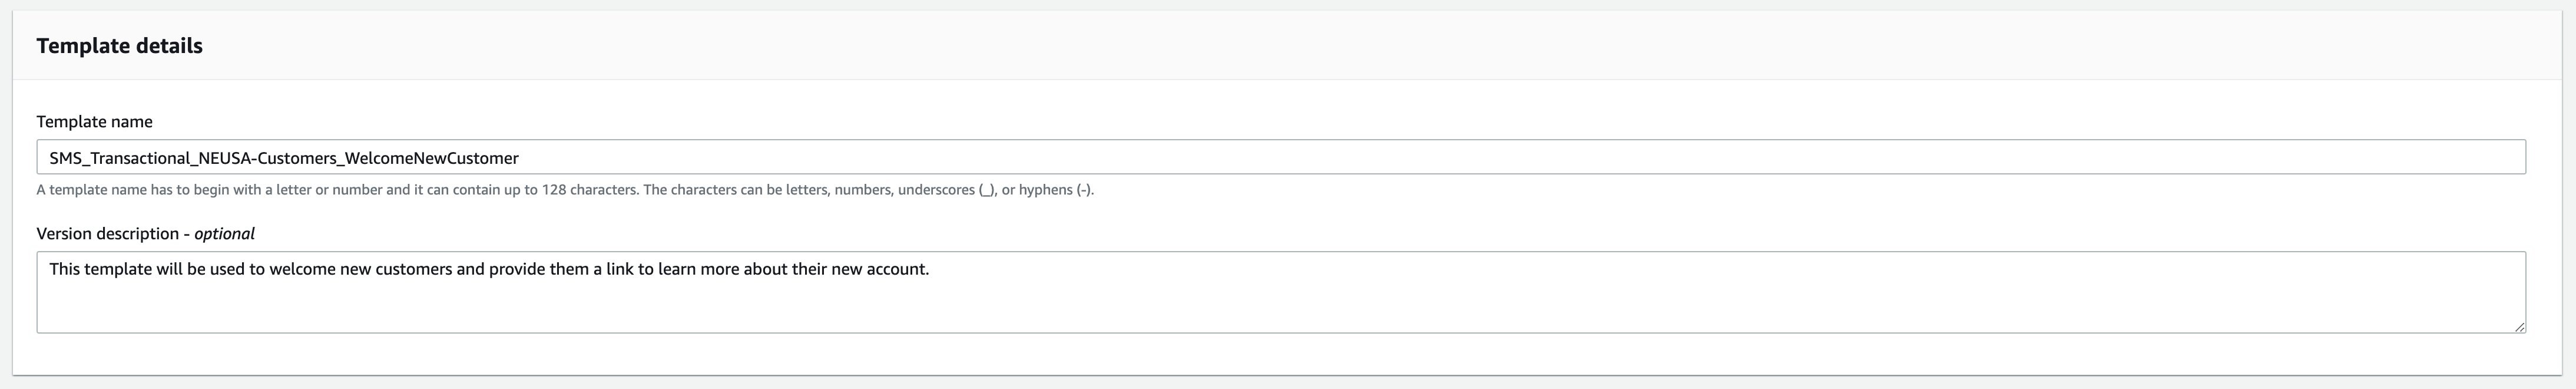
Here you’ll start by naming your template and giving this initial version a description. A sample format you can follow for naming your template names is channel_message-type_segment_target-campaign. For our example we’ll be using the name SMS_Transactional_NEUSA-Customers_WelcomeNewCustomer.
Next, we’ll build our template. We open the attribute finder by clicking on ‘Case attribute finder’ on the top right of that section and then loading our “Custom Attributes.”

When writing your message templates, you need to think through how these are perceived by the reader and if any words or phrases appear to be a spam message. We’ll examine what makes a message to appear like spam in the next section as we cover message structure.
Visit the documentation to learn the latest guidance on templates.
Message structure
The key part of building an Amazon Pinpoint template is the message.
First, there are a few components that make up your SMS message; the greeting, body, and closing. We’ll start with the greeting section as this is the first thing our recipients will read. When you build out your campaign in Amazon Pinpoint, more on Amazon Pinpoint campaigns by visiting Amazon Pinpoint campaigns, you choose the type of message you’ll be sending. This is one of the reasons why our naming convention contains “message-type” portion. You choose between Transactional or Promotional Messages.
When sending out promotional messages you’ll want to avoid directly addressing the person by name in the greeting.
The reason for this is when sending out promotional messages they are traditionally sent in bulk through various carriers around the world. Therefore, using the recipient’s name in the greeting could be viewed as a targeted spam message and something you should avoid when creating templates for your promotional messages. Instead consider using your company name for the greeting as this quickly tells readers who the message is from upfront.
Transactional messages have a bit more leeway when it comes to the greeting section and the recipient’s name can be used, with some caveats. You’ll still want to avoid using language that indicates spam, for example, punctuation like “Hi Bob-” or “Greetings Jane!” and instead greet your customers with a purpose “Bob’s order record:” or “Jane: Account Update”. Otherwise, you can leave out the name all together or substitute it with your company name. The goal with the greeting in a transactional message is to give the user an idea what the message is about.
Now that we have an idea of our greeting, we move onto the body which will contain the context of your message and any links or data you may want to pass on to the customer. Let’s start off with introducing randomness and taking advantage of the “Attributes Finder” panel we enabled earlier. We can use attributes for common things like the customer’s name, account identifier, payment due, city, or any other information we may have on the recipient as part of our segment for our template as well.
If a URL is needed for the user to perform some action once they receive that message, this is an easy way to achieve randomness. We’ll want each URL to be unique which we can do by using a URL shortener like the one described by Eric Johnson @ https://aws.amazon.com/blogs/compute/building-a-serverless-url-shortener-app-without-lambda-part-1/. Other options to add uniqueness to our message might be a timestamp with the seconds, an anti-phishing phrase, city or zip-code, or any other unique information that’s ideally not something personally identifiable.
In the example below, we’ve used the following template:
[Attributes.CompanyName] Purchase the items today and receive
[Attributes.DiscountAmount] of your next order. Visit
[Attributes.ShortURL] to checkout and complete your order.
When messages are sent that use this template, Amazon Pinpoint will use the custom attributes provided in the segment data to populate the custom fields.
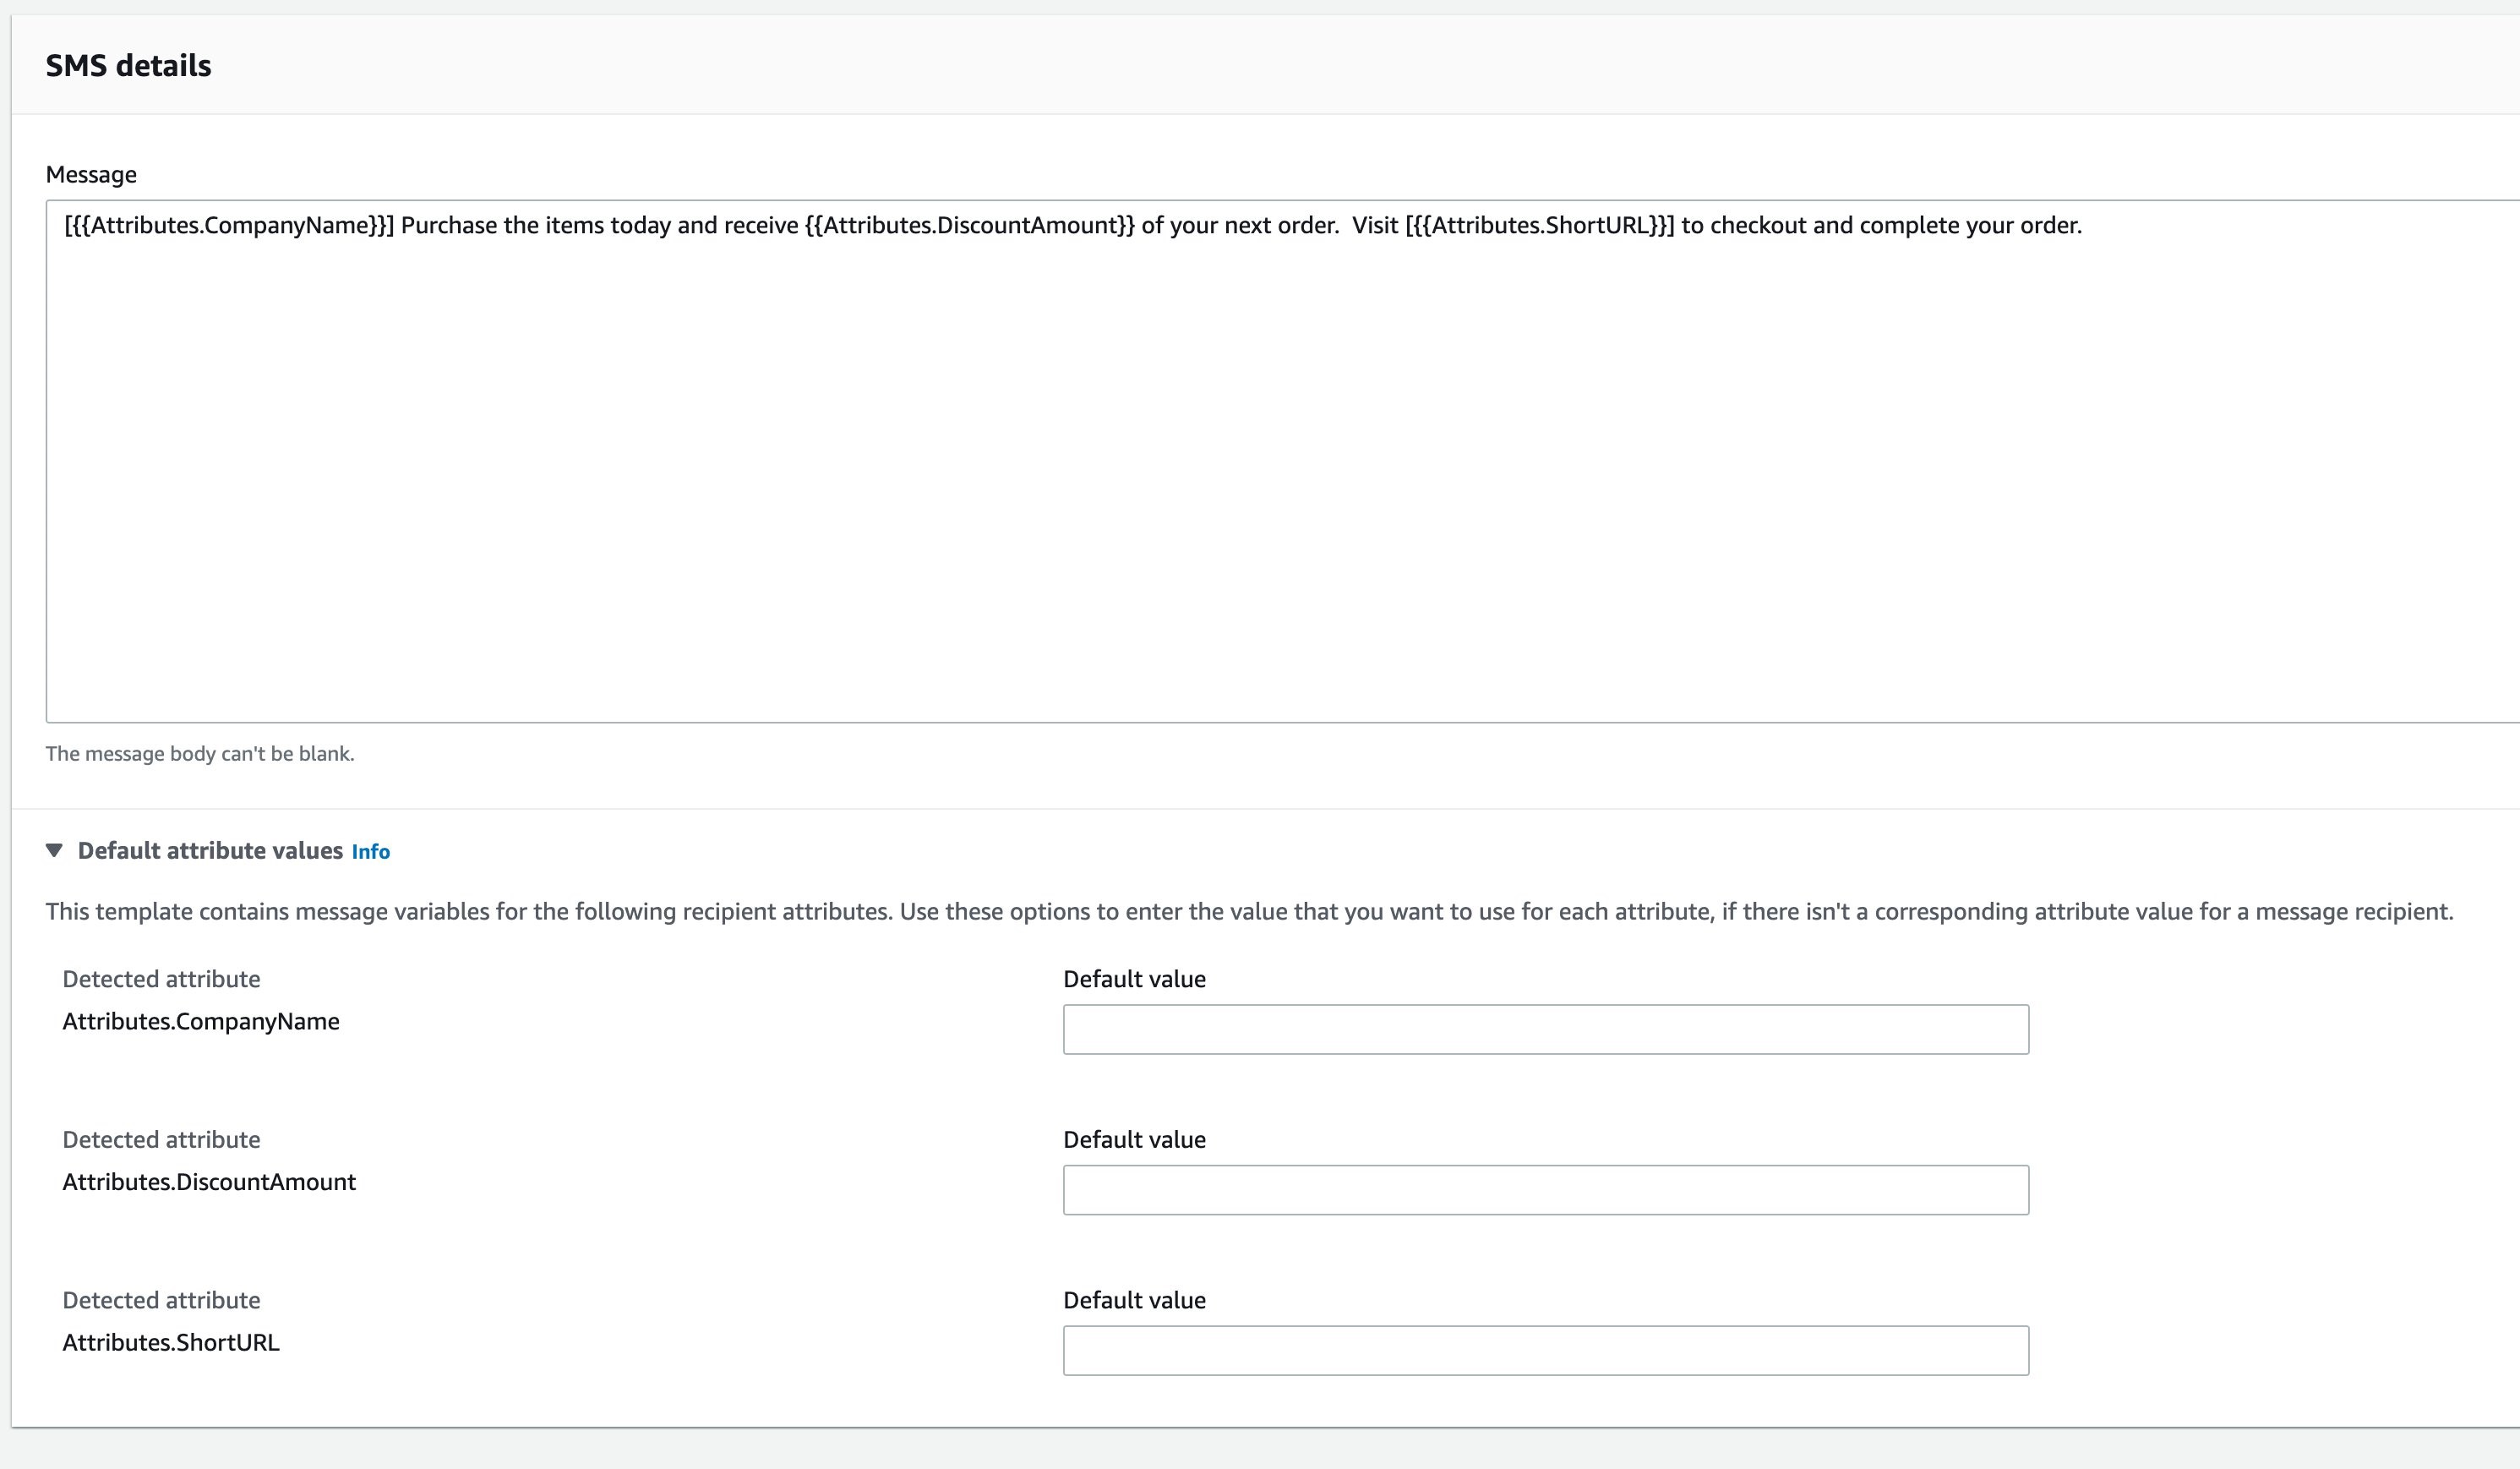
Proactive interactions
When sending messages to customers, it’s important to think about how to handle certain events that may come back from a message sent to a customer. These include common events such as a customer opting out of messages or a message failure. We’ll start by handling opt-outs as this is a common one and sometimes unintentional.
In the below screenshot, we’ve setup a Amazon Pinpoint journey (for more information about journeys, visit Amazon Pinpoint journeys to take actions based a customer’s response to a message. If the customer responds back to the message with “stop”, we’ve setup the yes/no split to invoke a Lambda function and send the customer an email. In this case our email may include a message like “You have opted out of SMS messaging, if this was unintentional, please visit your account to reactivate.”
We invoke a Lambda function to update the customer record with their SMS status. On the customer portal, you could then have a button next to the SMS status, that when clicked, calls the appropriate APIs to opt-in the customer. Another way to achieve this is to validate phone number using Pinpoint’s validation API even before the page loads and then show the same button the customer.

Another common scenario are message failures, which we can address in the same manner. Our journey is configured with the same entry, SMS send, and yes/no split. However, this time we evaluate if the message failed, and if it does, we send an email to the customer. Similar to opt-outs, we can use a Lambda trigger to update the customer database and then prompt the user to update their phone number. This scenario is commonly caused when phone numbers are incorrect or entered in wrong format. So, a great way to reduce errors is to validate the phone number after the customer enters it in (more information about how to validate numbers in Amazon Pinpoint can be found in the Developer Guide)
The following flow shows a typical Pinpoint journey and integration with your application backend.
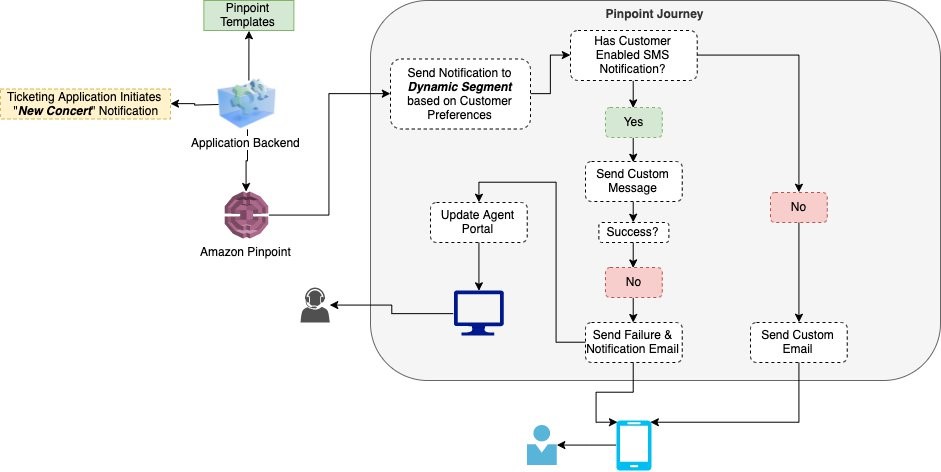
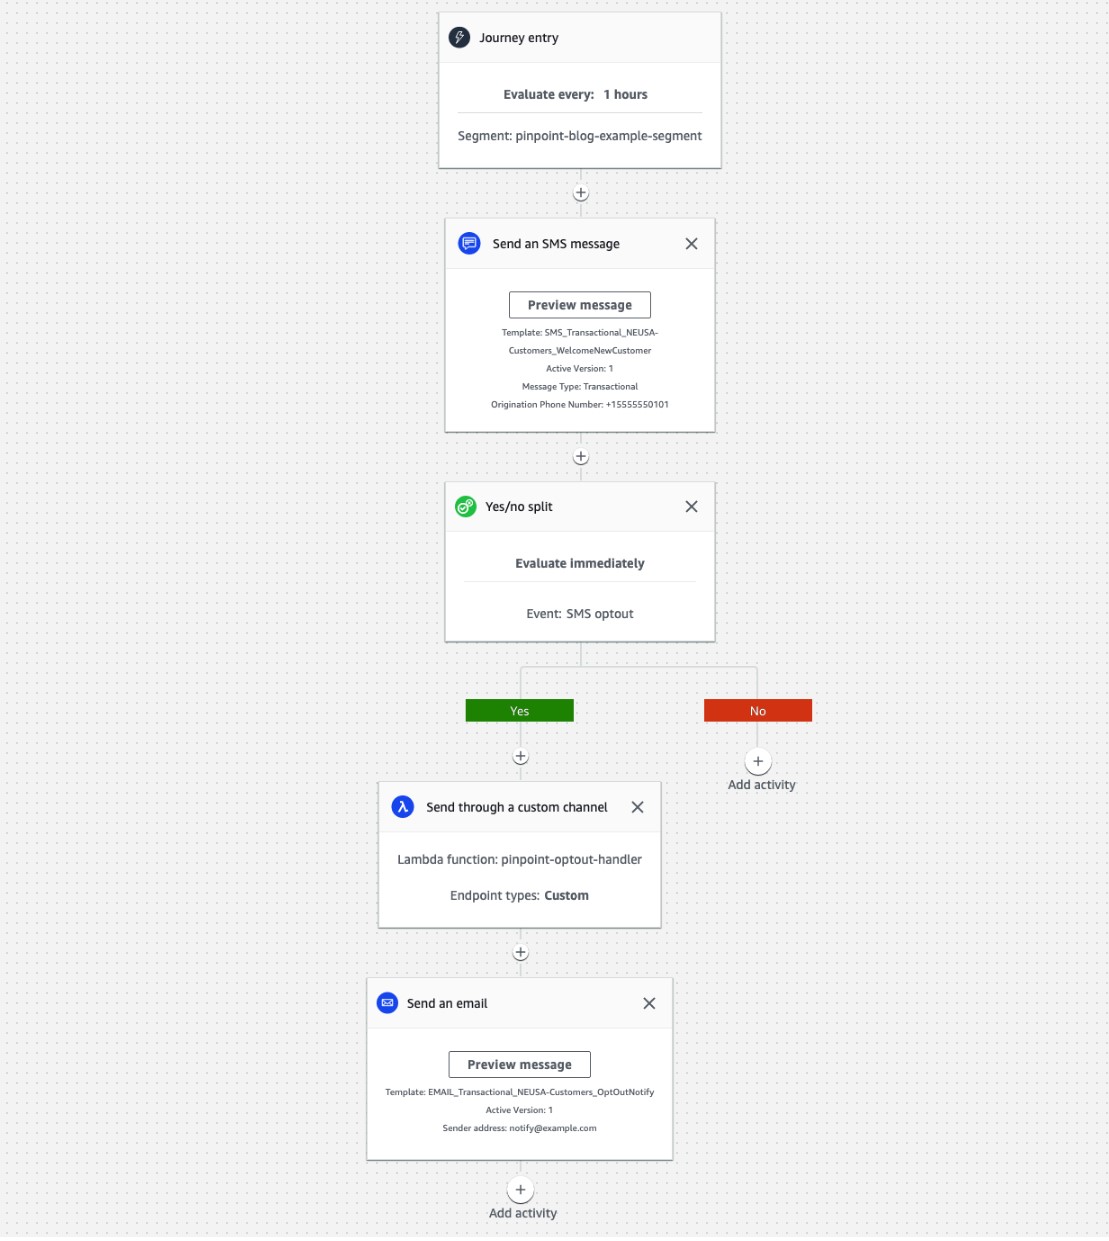
Conclusion
In this blog post, we showed you how to use features of Amazon Pinpoint like templates, and then journeys, to automatically resolve failed messages, opt-outs, and other events. We also reviewed the various types of phone number options available in Amazon Pinpoint, as well as how to monitor your usage.
From here, navigate to the console, setup your project in Amazon Pinpoint, and begin testing the various channels. We recommend watching a video on building immersive experiences with Amazon Pinpoint and Journeys. We have only just begun showing you what is possible with Amazon Pinpoint today.
Field Notes provides hands-on technical guidance from AWS Solutions Architects, consultants, and technical account managers, based on their experiences in the field solving real-world business problems for customers.
[$] Lessons from the linux-distros mailing list
Post Syndicated from original https://lwn.net/Articles/874069/rss
The oss-security
mailing list is specifically set up for reports and discussion of security flaws in
open-source software after their embargo, if any, has expired. But the
response to a recent
report
of the fix for a security flaw in the Linux kernel went in a different
direction than usual. The report did not break the two-week embargo
period, instead it was “late”, which has highlighted some problems in the
management of flaws of this nature.