Prioritizing XDR in 2023: Stronger Detection and Response With Less Complexity

Post Syndicated from KJ McCann original https://blog.rapid7.com/2022/09/21/prioritizing-xdr-in-2023-stronger-detection-and-response-with-less-complexity/

Prioritizing XDR in 2023: Stronger Detection and Response With Less Complexity

As we get closer to closing out 2022, the talk in the market continues to swirl around extended detection and response (XDR) solutions. What are they? What are the benefits? Should my team adopt XDR, and if yes, how do we evaluate vendors to determine the best approach?

While there continue to be many different definitions of XDR in the market, the common themes around this technology consistently are:

  • Tightly integrated security products delivering common threat prevention, detection, and incident response capabilities
  • Out-of-the-box operational efficiencies that require minimal customization
  • Security orchestration and automation functions to streamline repetitive processes and accelerate response
  • High-quality detection content with limited tuning required
  • Advanced analytics that can correlate alerts from multiple sources into incidents

Simply put, XDR is an evolution of the security ecosystem in order to provide elevated and stronger security for resource-constrained security teams.

XDR for 2023

Why is XDR the preferred cybersecurity solution? With an ever-expanding attack surface and diverse and complex threats, security operations centers (SOCs) need more visibility and stronger threat coverage across their environment – without creating additional pockets of siloed data from point solutions.

A 2022 study of security leaders found that the average security team is now managing 76 different tools – with sprawl driven by a need to keep pace with cloud adoption and remote working requirements. Because of the exponential growth of tools, security teams are spending more than half their time manually producing reports, pulling in data from multiple siloed tools. An XDR solution offers significant operational efficiency benefits by centralizing all that data to form a cohesive picture of your environment.

Is XDR the right move for your organization?

When planning your security for the next year, consider what outcomes you want to achieve in 2023.

Security product and vendor consolidation

To combat increasing complexity, security and risk leaders are looking for effective ways to consolidate their security stack – without compromising the ability to detect threats across a growing attack surface. In fact, 75% of security professionals are pursuing a vendor consolidation strategy today, up from just 29% two years ago. An XDR approach can be an effective path for minimizing the number of tools your SOC needs to manage while still bringing together critical telemetry to power detection and response. For this reason, many teams are prioritizing XDR in 2023 to spearhead their consolidation movement. It’s predicted that by year-end 2027, XDR will be used by up to 40% of end-user organizations to reduce the number of security vendors they have in place.

As you explore prioritizing XDR in 2023, it’s important to remember that all XDR is not created equal. A hybrid XDR approach may enable you to select top products across categories but will still require significant deployment, configuration, and ongoing management to bring these products together (not to mention multiple vendor relationships and expenses to tackle). A native XDR approach delivers a more inclusive suite of capabilities from a single vendor. For resource-constrained teams, a native approach may be superior to hybrid as there is likely to be less work on behalf of the customer. A native XDR does much of the consolidation work for you, while a hybrid XDR helps you consolidate.

Improved security operations efficiency and productivity

“Efficiency” is a big promise of XDR, but this can look different for many teams. How do you measure efficiency today? What areas are currently inefficient and could be made faster or easier? Understanding this baseline and where your team is losing time today will help you know what to prioritize when you pursue an XDR strategy in 2023.

A strong XDR replaces existing tools and processes with alternative, more efficient working methods. Example processes to evaluate as you explore XDR:

  • Data ingestion: As your organization grows, you want to be sure your XDR can grow with it. Cloud-native XDR platforms will be especially strong in this category, as they will have the elastic foundation necessary to keep pace with your environment. Consider also how you’ll add new event sources over time. This can be a critical area to improve efficiency.
  • Dashboards and reporting: Is your team equipped to create and manage custom queries, reports, and dashboards? Creating and distributing reports can be extremely time-consuming – especially for newer analysts. If your team doesn’t have the time for constant dashboard creation, consider XDR approaches that offer prebuilt content and more intuitive experiences that will satisfy these use cases.
  • Detections: With a constant evolution of threat actors and behaviors, it’s important to evaluate if your team has the time to bring together the necessary threat intelligence and detection rule creation to stay ahead of emergent threats. Effective XDR can greatly reduce or potentially eliminate the need for your team to manually create and manage detection rules by offering built-in detection libraries. It’s important to understand the breadth and fidelity of the detections library offered by your vendor and ensure that this content addresses the needs of your organization.
  • Automation: Finding the right balance for your SOC between technology and human expertise will allow analysts to apply their skills and training in critical areas without having to maintain repetitive and mundane tasks additionally. Because different XDR solutions offer different instances of automation, prioritize workflows that will provide the most benefit to your team. Some example use cases would be connecting processes across your IT and security teams, automating incident response to common threats, or reducing any manual or repetitive tasks.

Accelerated investigations and response

While XDR solutions claim to host a variety of features that can accelerate your investigation and response process, it’s important to understand how your team currently functions. Start by identifying your mean time to respond (MTTR) at present, then what your goal MTTR is for the future. Once you lay that out, look back at how analysts currently investigate and respond to attacks and note any skill or knowledge gaps, so you can understand what capabilities will best assist your team. XDR aims to paint a fuller picture of attacker behavior, so security teams can better analyze and respond to it.

Some examples of questions that can build out the use cases you require to meet your target ROI for next year.

  • During an investigation, where is your team spending the majority of their time?
  • What established processes are currently in place for threat response?
  • How adaptable is your team when faced with new and unknown threat techniques?
  • Do you have established playbooks for specific threats? Does your team know what to do when these fire?

Again, having a baseline of where your organization is today will help you define more realistic goals and requirements going forward. When evaluating XDR products, dig into how they will shorten the window for attackers to succeed and drive a more effective response for your team. For a resource-constrained team, you may especially want to consider how an XDR approach can:

  • Reduce the amount of noise that your team needs to triage and ensure analysts zero in on top priority threats
  • Shorten the time for effective investigation by providing relevant events, evidence, and intelligence around a specific attack
  • Provide effective playbooks that maximize autonomy for analysts, enabling them to respond to threats confidently without the need to escalate or do excessive investigation
  • Deliver one-click automation that analysts can leverage to accelerate a response after they have accessed the situation

Unlock the potential of XDR with Rapid7

If you and your team prioritize XDR in 2023, we’d love to help. Rapid7’s native XDR approach unlocks advanced threat detection and accelerated response for resource-constrained teams. With 360-degree attack surface coverage, teams have a sophisticated view across both the internal – and external – threat landscape. Rapid7 Threat Intelligence and Detection Engineering curate an always up-to-date library of threat detections – vetted in the field by our MDR SOC experts to ensure high-fidelity, actionable alerts. And with recommended response playbooks and pre-built workflows, your team will always be ready to respond to threats quickly and confidently.

To learn more about the current market for XDR and receive additional perspectives, check out Gartner’s Market Guide for Extended Detection and Response.

Additional reading:

NEVER MISS A BLOG

Get the latest stories, expertise, and news about security today.

Let’s Architect! Architecting with custom chips and accelerators

Post Syndicated from Luca Mezzalira original https://aws.amazon.com/blogs/architecture/lets-architect-custom-chips-and-accelerators/

It’s hard to imagine a world without computer chips. They are at the heart of the devices that we use to work and play every day. Currently, Amazon Web Services (AWS) is offering customers the next generation of computer chip, with lower cost, higher performance, and a reduced carbon footprint.

This edition of Let’s Architect! focuses on custom computer chips, accelerators, and technologies developed by AWS, such as AWS Nitro System, custom-designed Arm-based AWS Graviton processors that support data-intensive workloads, as well as AWS Trainium, and AWS Inferentia chips optimized for machine learning training and inference.

In this post, we discuss these new AWS technologies, their main characteristics, and how to take advantage of them in your architecture.

Deliver high performance ML inference with AWS Inferentia

As Deep Learning models become increasingly large and complex, the training cost for these models increases, as well as the inference time for serving.

With AWS Inferentia, machine learning practitioners can deploy complex neural-network models that are built and trained on popular frameworks, such as Tensorflow, PyTorch, and MXNet on AWS Inferentia-based Amazon EC2 Inf1 instances.

This video introduces you to the main concepts of AWS Inferentia, a service designed to reduce both cost and latency for inference. To speed up inference, AWS Inferentia: selects and shares a model across multiple chips, places pieces inside the on-chip cache, then streams the data via pipeline for low-latency predictions.

Presenters discuss through the structure of the chip, software considerations, as well as anecdotes from the Amazon Alexa team, who uses AWS Inferentia to serve predictions. If you want to learn more about high throughput coupled with low latency, explore Achieve 12x higher throughput and lowest latency for PyTorch Natural Language Processing applications out-of-the-box on AWS Inferentia on the AWS Machine Learning Blog.

AWS Inferentia shares a model across different chips to speed up inference

AWS Inferentia shares a model across different chips to speed up inference

AWS Lambda Functions Powered by AWS Graviton2 Processor – Run Your Functions on Arm and Get Up to 34% Better Price Performance

AWS Lambda is a serverless, event-driven compute service that enables code to run from virtually any type of application or backend service, without provisioning or managing servers. Lambda uses a high-availability compute infrastructure and performs all of the administration of the compute resources, including server- and operating-system maintenance, capacity-provisioning, and automatic scaling and logging.

AWS Graviton processors are designed to deliver the best price and performance for cloud workloads. AWS Graviton3 processors are the latest in the AWS Graviton processor family and provide up to: 25% increased compute performance, two-times higher floating-point performance, and two-times faster cryptographic workload performance compared with AWS Graviton2 processors. This means you can migrate AWS Lambda functions to Graviton in minutes, plus get as much as 19% improved performance at approximately 20% lower cost (compared with x86).

Comparison between x86 and Arm/Graviton2 results for the AWS Lambda function computing prime numbers

Comparison between x86 and Arm/Graviton2 results for the AWS Lambda function computing prime numbers (click to enlarge)

Powering next-gen Amazon EC2: Deep dive on the Nitro System

The AWS Nitro System is a collection of building-block technologies that includes AWS-built hardware offload and security components. It is powering the next generation of Amazon EC2 instances, with a broadening selection of compute, storage, memory, and networking options.

In this session, dive deep into the Nitro System, reviewing its design and architecture, exploring new innovations to the Nitro platform, and understanding how it allows for fasting innovation and increased security while reducing costs.

Traditionally, hypervisors protect the physical hardware and bios; virtualize the CPU, storage, networking; and provide a rich set of management capabilities. With the AWS Nitro System, AWS breaks apart those functions and offloads them to dedicated hardware and software.

AWS Nitro System separates functions and offloads them to dedicated hardware and software, in place of a traditional hypervisor

AWS Nitro System separates functions and offloads them to dedicated hardware and software, in place of a traditional hypervisor

How Amazon migrated a large ecommerce platform to AWS Graviton

In this re:Invent 2021 session, we learn about the benefits Amazon’s ecommerce Datapath platform has realized with AWS Graviton.

With a range of 25%-40% performance gains across 53,000 Amazon EC2 instances worldwide for Prime Day 2021, the Datapath team is lowering their internal costs with AWS Graviton’s improved price performance. Explore the software updates that were required to achieve this and the testing approach used to optimize and validate the deployments. Finally, learn about the Datapath team’s migration approach that was used for their production deployment.

AWS Graviton2: core components

AWS Graviton2: core components

See you next time!

Thanks for exploring custom computer chips, accelerators, and technologies developed by AWS. Join us in a couple of weeks when we talk more about architectures and the daily challenges faced while working with distributed systems.

Other posts in this series

Looking for more architecture content?

AWS Architecture Center provides reference architecture diagrams, vetted architecture solutions, Well-Architected best practices, patterns, icons, and more!

Talk to your data: Query your data lake with Amazon QuickSight Q

Post Syndicated from Ying Wang original https://aws.amazon.com/blogs/big-data/talk-to-your-data-query-your-data-lake-with-amazon-quicksight-q/

Amazon QuickSight Q uses machine learning (ML) and natural language technology to empower you to ask business questions about your data and get answers instantly. You can simply enter your questions (for example, “What is the year-over-year sales trend?”) and get the answer in seconds in the form of a QuickSight visual.

Some business questions can’t be answered through existing business intelligence (BI) dashboards. It can take days or weeks for the BI team to accommodate these needs and refine their solution. Because Q doesn’t depend on prebuilt dashboards or reports to answer questions, it removes the need for BI teams to create or update dashboards every time a new business question arises. You can ask questions and receive answers in the form of visuals in seconds directly from within QuickSight or from web applications and portals. Q empowers every business user to self-serve and get insights faster, regardless of their background or skillset.

In this post, we walk you through the steps to configure Q using an Olympic Games public dataset and demonstrate how an end-user can ask simple questions directly from Q in an interactive manner and receive answers in seconds.

You can interactively play with the Olympic dashboard and Q search bar in the following interactive demo.

Solution overview

We use Olympic games public datasets to configure a Q topic and discuss tips and tricks on how to make further configurations on the topic that enable Q to provide prompt answers using ML-powered, natural language query (NLQ) capabilities that empower you to ask questions about data using everyday business language.

The video from Data Con LA provides a high-level demonstration of the capabilities covered in this post.

Additionally, we discuss the following:

  • Best practices for data modeling of a Q topic
  • How to perform data cleansing using AWS Glue DataBrew, SQL, or an Amazon SageMaker Jupyter notebook on datasets to build a Q topic

We use multiple publicly available datasets from Kaggle. The datasets have historical information about athletes, including name, ID, age, weight, country, and medals.

We use the 2020 Olympic datasets and historical data. We also use the datasets Introduction of Women Olympic Sport and Women of Olympic Games to determine the participation of women athletes in Olympics and discover trends. The QuickSight datasets created using these public data files are added to a Q topic, as shown in the following screenshot. We provide details on creating QuickSight datasets later in this post.

Prerequisites

To follow along with the solution presented in this post, you must have access to the following:

Create solution resources

The public datasets in Kaggle can’t be directly utilized to create a Q topic. We have already cleansed the raw data and have provided the cleansed datasets in the GitHub repo. If you are interested in learning more about data cleansing, we discussed three different data cleansing methods at the end of this post.

To create your resources, complete the following steps:

  1. Create an S3 bucket called olympicsdata.
  2. Create a folder for each data file, as shown in the following screenshot.
  3. Upload the data files from the GitHub repo into their respective folders.
  4. Deploy the provided CloudFormation template and provide the necessary information.

The template creates an Athena database and tables, as shown in the following screenshot.

The template also creates the QuickSight data source athena-olympics and datasets.

Create datasets in QuickSight

To build the Q topic, we need to combine the datasets, because each table contains only partial data. Joining these tables helps answer questions across all the features of the 2020 Olympics.

We create the Olympics 2021 dataset by joining the tables Medals_athletes_2021, Athletes_full_2021, Coach_full_2021, and Tech_official_2021.

The following screenshot shows the joins for our complete dataset.

Medals_athletes_2021 is the main table, with the following join conditions:

  • Left outer join athletes_full_2021 on athlete_name, discipline_code, and country_code
  • Left outer join coach_full_2021 on country, discipline, and event
  • Left outer join tech_official_2021 on discipline

Finally, we have the following datasets that we use for our Q topic:

  • Olympics 2021 Details
  • Medals 2021
  • Olympics History (created using the Olympics table)
  • Introduction of Women Olympics Sports
  • Women in the Olympic Movement

Create a Q topic

Topics are collections of one or more datasets that represent a subject area that your business users can ask questions about. In QuickSight, you can create and manage topics on the Topics page. When you create a topic, your business users can ask questions about it in the Q search bar.

When you create topics in Q, you can add multiple datasets to them and then configure all the fields in the datasets to make them natural language-friendly. This enables Q to provide your business users with the correct visualizations and answers to their questions.

The following are data modeling best practices for Q topics:

  • Reduce the number of datasets by consolidating the data. Any given question can only hit one data set, so only include multiple datasets if they are related enough to be part of the same topic, but distinct enough that you can ask a question against them independently.
  • For naming conventions, provide a meaningful name or alias (synonym) of a field to allow the end-user to easily query it.
  • If a field appears in different datasets, make sure that this field has the same name across different datasets.
  • Validate data consistency. For example, the total value of a metric that aggregates from different datasets should be consistent.
  • For fields that don’t request on-the-fly calculations, for example, metrics with distributive functions (sum, max, min, and so on), push down the calculation into a data warehouse.
  • For fields that request on-the-fly calculations, create the calculated field in the QuickSight dataset or Q topic. If other topics or dashboards might reuse the same field, create it in the datasets.

To create a topic, complete the following steps:

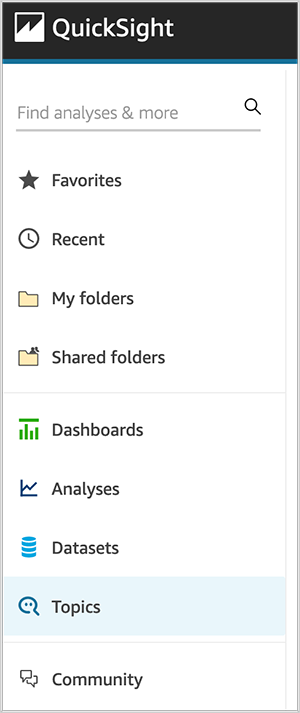
  1. On the QuickSight console, choose Topics in the navigation pane.
  2. Choose New topic.
  3. For Topic name, enter a name.
  4. For Description, enter a description.
  5. Choose Save.
  6. On the Add data to topic page that opens, choose Datasets, and then select the datasets that we created in the previous section.
  7. Choose Add data to create the topic.

Enhance the topic

In this section, we discuss various ways that you can enhance the topic.

Add calculated fields to a topic dataset

You can add new fields to a dataset in a topic by creating calculated fields.

For example, we have the column Age in our Olympics dataset. We can create a calculated field to group age into different ranges using the ifelse function. This calculated field can help us ask a question like “How many athletes for each age group?”

  1. Choose Add calculated field.
  2. In the calculation editor, enter the following syntax:
    ifelse(
    Age<=20, '0-20',
    Age>20 and Age <=40, '21-40',
    Age>40 and Age<=60, '41-60',
    '60+'
    )

  3. Name the calculated field Age Groups.
  4. Choose Save.

The calculated field is added to the list of fields in the topic.

Add filters to a topic dataset

Let’s say lot of analysis is expected on the dataset for the summer season. We can add a filter to allow for easy selection of this value. Furthermore, if we want to allow analysis against data for the summer season only, we can choose to always apply this filter or apply it as the default choice, but allow users to ask questions about other seasons as well.

  1. Choose Add filter.
  2. For Name, enter Summer.
  3. Choose the Women in the Olympic Movement dataset.
  4. Choose the Olympics Season field.
  5. Choose Custom filter list for Filter type and set the rule as include.
  6. Enter Summer under Values.
  7. Choose Apply always, unless a question results in an explicit filter from the dataset.
  8. Choose Save.

The filter is added to the list of fields in the topic.

Add named entities to a topic dataset

We can define named entities if we need to show users a combination of fields. For example, when someone asks for player details, it makes sense to show them player name, age, country, sport, and medal. We can make this happen by defining a named entity.

  1. Choose Add named entity.
  2. Choose the Olympics dataset.
  3. Enter Player Profile for Name.
  4. Enter Information of Player for Description.
  5. Choose Add field.
  6. Choose Player Name from the list.
  7. Choose Add field again and add the fields Age, Countries, Sport, and Medal.
    The fields listed are the order they appear in answers. To move a field, choose the six dots next to the name and drag and drop the field to the order that you want.
  8. Choose Save.

The named entity is added to the list of fields in the topic.

Make Q topics natural language-friendly

To help Q interpret your data and better answer your readers’ questions, provide as much information about your datasets and their associated fields as possible.

To make the topic more natural language-friendly, use the following procedures.

Rename fields

You can make your field names more user-friendly in your topics by renaming them and adding descriptions.

Q uses field names to understand the fields and link them to terms in your readers’ questions. When your field names are user-friendly, it’s easier for Q to draw links between the data and a reader’s question. These friendly names are also presented to readers as part of the answer to their question to provide additional context.

Let’s rename the birth date field from the athlete dataset as Athlete Birth Date. Because we have multiple birth date fields in the topics for coach, athlete, and tech roles, renaming the athletes’ birth date field helps Q easily link to the data field when we ask questions regarding athletes’ birth dates.

  1. On the Fields page, choose the down arrow at far right of the Birth Date field to expand it.
  2. Choose the pencil icon next to the field name.
  3. Rename the field to Athlete Birth Date.

Add synonyms to fields in a topic

Even if you update your field names to be user-friendly and provide a description for them, your readers might still use different names to refer to them. For example, a player name field might be referred to as player, players, or sportsman in your reader’s questions.

To help Q make sense of these terms and map them to the correct fields, you can add one or more synonyms to your fields. Doing this improves Q’s accuracy.

  1. On the Fields page, under Synonyms, choose the pencil icon for Player Name.
  2. Enter player and sportsman as synonyms.

Add synonyms to field values

Like we did for field names, we can add synonyms for category values as well.

  1. Choose the Gender field’s row to expand it.
  2. Choose Configure value synonyms, then choose Add.
  3. Choose the pencil icon next to the F value.
  4. Add the synonym Female.
  5. Repeat these steps to add the synonym Male for M.
  6. Choose Done.

Assign field roles

Every field in your dataset is either a dimension or a measure. Knowing whether a field is a dimension or a measure determines what operations Q can and can’t perform on a field.

For example, setting the field Age as a dimension means that Q doesn’t try to aggregate it as it does measures.

  1. On the Fields page, expand the Age field.
  2. For Role, choose Dimension.

Set field aggregations

Setting field aggregations tells Q which function should or shouldn’t be used when those fields are aggregated across multiple rows. You can set a default aggregation for a field, and specify aggregations that aren’t allowed.

A default aggregation is the aggregation that’s applied when there’s no explicit aggregation function mentioned or identified in a reader’s question. For example, let’s ask Q “Show total number of events.” In this case, Q uses the field Total Events, which has a default aggregation of Sum, to answer the question.

  1. On the Fields page, expand the Total Events field.
  2. For Default aggregation, choose Sum.
  3. For Not allowed aggregation, choose Average.

Specify field semantic types

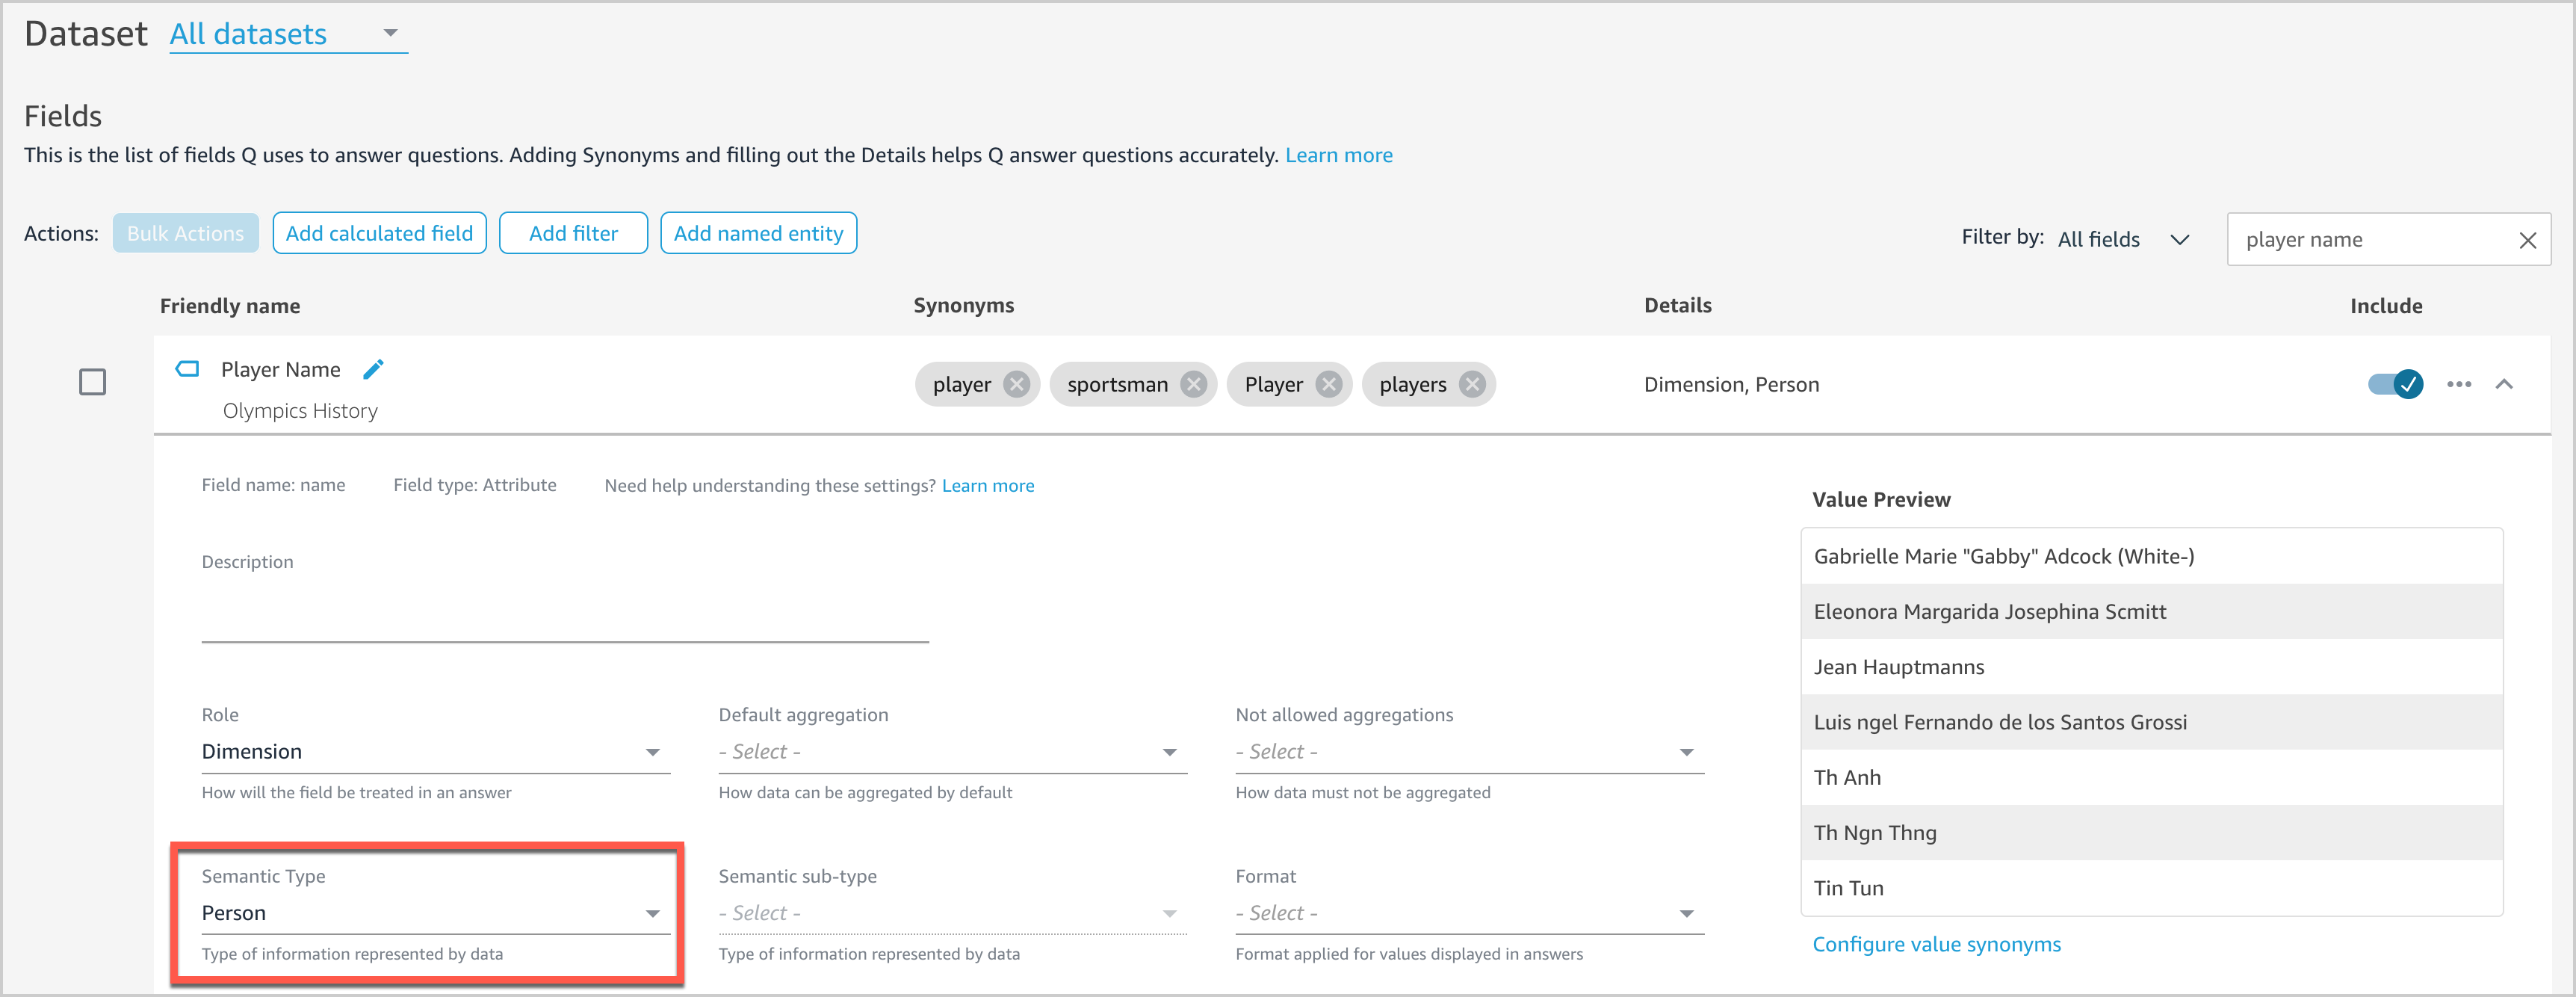
Providing more details on the field context will help Q answer more natural language questions. For example, users might ask “Who won the most medals?” We haven’t set any semantic information for any fields in our dataset yet, so Q doesn’t know what fields to associate with “who.” Let’s see how we can enable Q to tackle this question.

  1. On the Fields page, expand the Player Name field.
  2. For Semantic Type, choose Person.

This enables Q to surface Player Name as an option when answering “who”-based questions.

Exclude unused or unnecessary fields

Fields from all included datasets are displayed by default. However, we have a few fields like Short name of Country, URL Coach Full 2021, and URL Tech Official 2021 that we don’t need in our topic. We can exclude unnecessary fields from the topic to prevent them from showing up in results by choosing the slider next to each field.

Ask questions with Q

After we create and configure our topic, we can now interact with Q by entering questions in the Q search bar.

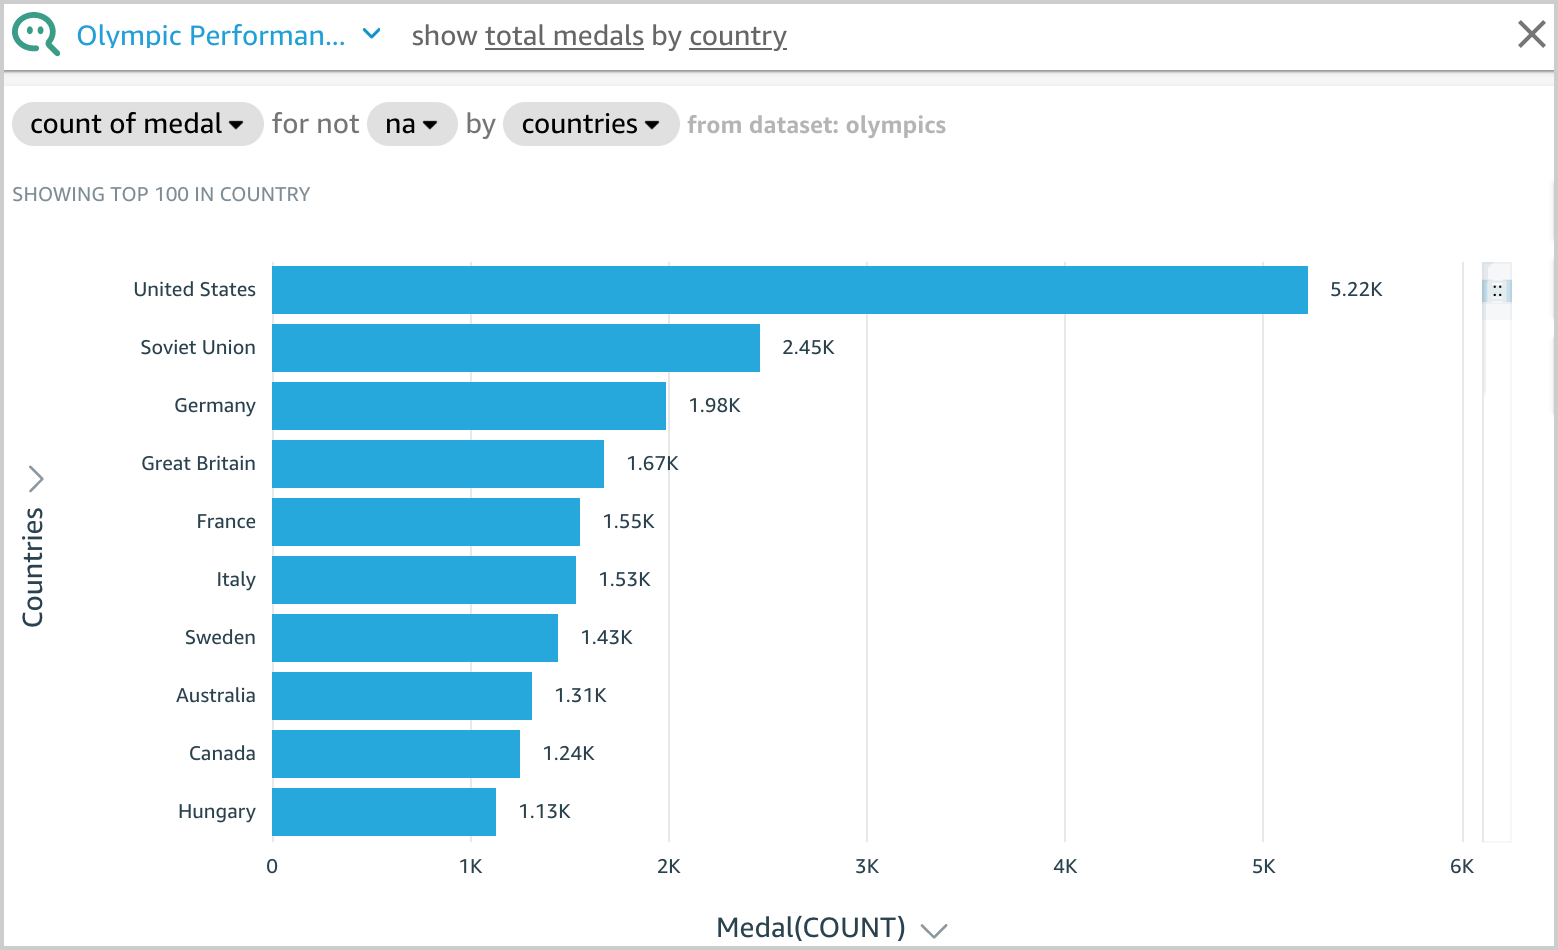
For example, let’s enter show total medals by country. Q presents an answer to your question as a visual.

You can see how Q interpreted your question in the description at the visual’s upper left. Here you can see the fields, aggregations, topic filters, and datasets used to answer the question. The topic filter na is applied on the Medal attribute, which excludes na values from the aggregation. For more information on topic filters, see Adding filters to a topic dataset.

Q displays the results using the visual type best suited to convey the information. However, Q also gives you the flexibility to view results in other visual types by choosing the Visual icon.

Another example, let’s enter who is the oldest player in basketball. Q presents an answer to your question as a visual.

Sometimes Q might not interpret your question the way you wanted. When this happens, you can provide feedback on the answer or make suggestions for corrections to the answer. For more information about providing answer feedback, see Providing feedback about QuickSight Q topics. For more information about correcting answers, see Correcting wrong answers provided by Amazon QuickSight Q.

Conclusion

In this post, we showed you how to configure Q using an Olympic games public dataset and so end-users can ask simple questions directly from Q in an interactive manner and receive answers in seconds. If you have any feedback or questions, please leave them in the comments section.

Appendix 1: Types of questions supported by Q

Let’s look at samples of each question type that Q can answer using the topic created earlier in this post.

Try the following questions or your own questions and continue enhancing the topic to improve accuracy of responses.

Question Type Example
Dimensional Group Bys show total medals by country
Dimensional Filters (Include) show total medals for united states
Date Group Bys show yearly trend of women participants
Multi Metrics number of women events compared to total events
KPI-Based Period over Periods (PoPs) how many women participants in 2018 over 2016
Relative Date Filters show total medals for united states in the last 5 years
Time Range Filters list of women sports introduced since 2016
Top/Bottom Filter show me the top 3 player with gold medal
Sort Order show top 3 countries with maximum medals
Aggregate Metrics Filter show teams that won more than 50 medals
List Questions list the women sports by year in which they are introduced
OR filters Show player who got gold or silver medal
Percent of Total Percentage of players by country
Where Questions where are the most number of medals
When Questions when women volleyball introduced into olympic games
Who Questions who is the oldest player in basketball
Exclude Questions show countries with highest medals excluding united states

Appendix 2: Data cleansing

In this section, we provide three options for data cleansing: SQL, DataBrew, and Python.

Option 1: SQL

For our first option, we discuss how to create Athena tables on the downloaded Excel or CSV files and then perform the data cleansing using SQL. This option is suitable for those who use Athena tables as a data source for QuickSight datasets and are comfortable using SQL.

The SQL queries to create Athena tables are available in the GitHub repo. In these queries, we perform data cleansing by renaming, changing the data type of some columns, as well as removing the duplicates of rows. Proper naming conventions and accurate data types help Q efficiently link the questions to the data fields and provide accurate answers.

Use the following sample DDL query to create an Athena table for women_introduction_to_olympics:

CREATE EXTERNAL TABLE women_introduction_to_olympics(
year string,
sport string)
ROW FORMAT DELIMITED
FIELDS TERMINATED BY ','
STORED AS INPUTFORMAT
'org.apache.hadoop.mapred.TextInputFormat'
OUTPUTFORMAT
'org.apache.hadoop.hive.ql.io.HiveIgnoreKeyTextOutputFormat'
LOCATION
's3://<<s3 bucket name>>/womeninolympics/introduction_of_women_olympic_sports'
TBLPROPERTIES (
'has_encrypted_data'='false')

In our data files, there are few columns that are common across more than one dataset that have different column names. For example, gender is available as gender or sex, country is available as country or team or team/noc, and person names have a role prefix in one dataset but not in other datasets. We rename such columns using SQL to maintain consistent column names.

Additionally, we need to change other demographic columns like age, height, and weight to the INT data type, so that they don’t get imported as String.

The following columns from the data files have been transformed using SQL.

Data File Original Column New Column
medals Discipline
Medal_date (timestamp)
Sport
Medal_date (date)
Athletes name
gender
birth_date
birth_place
birth_country
athlete_name
athlete_gender
athlete_birth_date
athlete_birth_place
athlete_birth_country
Coaches name
gender
birth_date
function
coach_name
coach_gender
coach_birth_date
coach_function
Athlete_events (history) Team
NOC
Age (String)
Height (String)
Weight (String)
country
country_code
Age (Integer)
Height (Integer)
Weight (Integer)

Option 2: DataBrew

In this section, we discuss a data cleansing option using DataBrew. DataBrew is a visual data preparation tool that makes it easy to clean and prepare data with no prior coding knowledge. You can directly load the results into an S3 bucket or load the data by uploading an Excel or CSV file.

For our example, we walk you through the steps to implement data cleansing on the medals_athletes_2021 dataset. You can follow the same process to perform any necessary data cleaning on other datasets as well.

Create a new dataset in DataBrew using medals_athletes.csv and then create a DataBrew project and implement the following recipes to cleanse the data in the medals_athletes_2021 dataset.

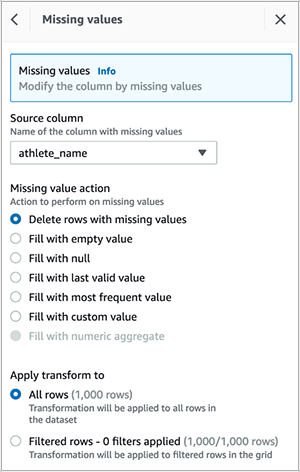
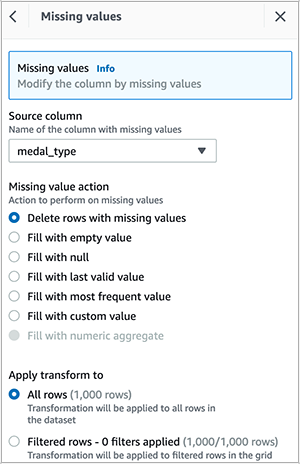
  1. Delete empty rows in the athlete_name column.
  2. Delete empty rows in the medal_type column.
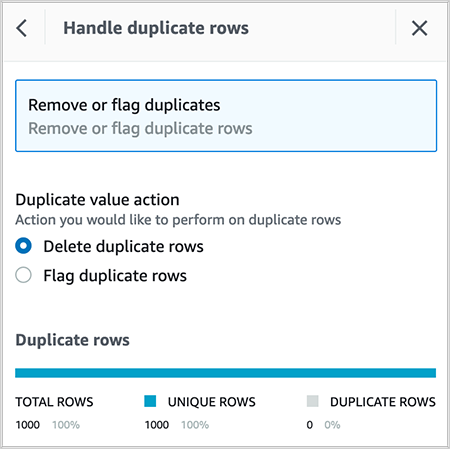
  3. Delete duplicate rows in the dataset.
  4. Rename discipline to Sport.
  5. Delete the column discipline_code.
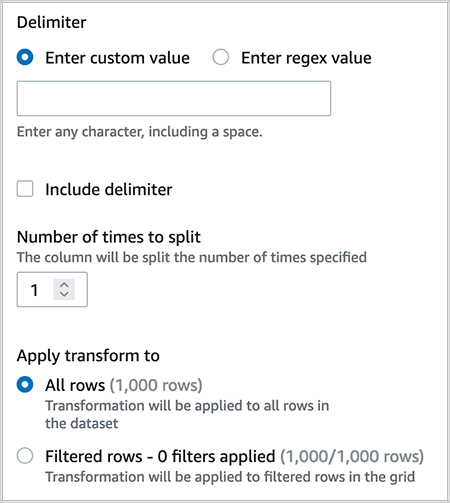
  6. Split the column medal_type on a single delimiter.
  7. Delete the column medal_type_2, which was created as a result of step 6.
  8. Rename medal_type_1 to medal_type.
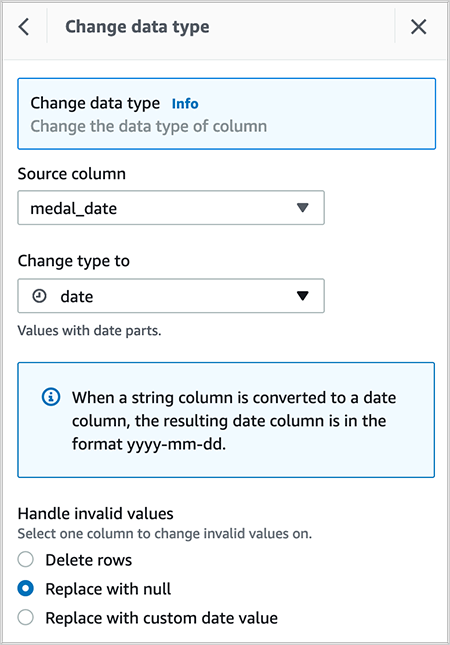
  9. Change the data type of column medal_date from timestamp to date.

After you create the recipe, publish it and create a job to output the results in your desired destination. You can create QuickSight SPICE datasets by importing the cleaned CSV file.

Option 3: Python

In this section, we discuss data cleansing using NumPy and Pandas of Python on the medals_athletes_2021 dataset. You can follow the same process to perform any necessary data cleansing on other datasets as well. The sample Python code is available on GitHub. This option is suitable for someone who is comfortable processing the data using Python.

  1. Delete the column discipline_code:
    olympic.drop(columns='discipline_code')

  2. Rename the column discipline to sport:
    olympic.rename(columns={'discipline': 'sport'})

You can create QuickSight SPICE datasets by importing the cleansed CSV.

Appendix 3: Data cleansing and modeling in the QuickSight data preparation layer

In this section, we discuss one more method of data cleansing that you can perform from the QuickSight data preparation layer, in addition to the methods discussed previously. Using SQL, DataBrew, or Python have advantages because you can prepare and clean the data outside QuickSight so other AWS services can use the cleansed results. Additionally, you can automate the scripts. However, Q authors have to learn other tools and programming languages to take advantage of these options.

Cleansing data in the QuickSight dataset preparation stage allows non-technical Q authors to build the application end to end in QuickSight with a codeless method.

The QuickSight dataset stores any data preparation done on the data, so that the prepared data can be reused in multiple analyses and topics.

We have provided a few examples for data cleansing in the QuickSight data preparation layer.

Change a field name

Let’s change the name data field from Athletes_full_2021 to athlete_name.

  1. In the data preview pane, choose the edit icon on the field that you want to change.
  2. For Name, enter a new name.
  3. Choose Apply.

Change a field data type

You can change the data type of any field from the data source in the QuickSight data preparation layer using the following procedure.

  1. In the data preview pane, choose the edit icon on the field you want to change (for example, birth_date).
  2. Choose Change data type and choose Date.

This converts the string field to a date field.

Appendix 4: Information about the tables

The following table illustrates the scope of each table in the dataset.

Table Name Link Table Data Scope
medals https://www.kaggle.com/piterfm/tokyo-2020-olympics?select=medals.csv Information about medals won by each athlete and the corresponding event and country details
athletes https://www.kaggle.com/piterfm/tokyo-2020-olympics?select=athletes.csv Details about each athlete, such as demographic and country
coaches https://www.kaggle.com/piterfm/tokyo-2020-olympics?select=coaches.csv Details about each coach, such as demographic and country
technical_officials https://www.kaggle.com/piterfm/tokyo-2020-olympics?select=technical_officials.csv Details about each technical official, such as demographic and country
athlete_events https://www.kaggle.com/heesoo37/120-years-of-olympic-history-athletes-and-results Historical information of Olympic games
Introduction_of_Women_Olympics_Sports https://data.world/sports/women-in-the-olympic-games Information on when the women Olympic sports were introduced
womens_participation_in_the_olympic https://data.world/sports/women-in-the-olympic-games Information on participation of women in Olympic sports

About the authors

Ying Wang is a Manager of Software Development Engineer. She has 12 years experience in data analytics and data science. In her data architect life, she helped customer on enterprise data architecture solutions to scale their data analytics in the cloud. Currently, she helps customer to unlock the power of Data with QuickSight from engineering/product by delivering new features.

Ginni Malik is a Data & ML Engineer with AWS Professional Services. She assists customers by architecting enterprise level data lake solutions to scale their data analytics in the cloud. She is a travel enthusiast and likes to run half-marathons.

Niharika Katnapally is a QuickSight Business Intelligence Engineer with AWS Professional Services. She assists customers by developing QuickSight dashboards to help them gain insights into their data and make data driven business decisions.

Design considerations for Amazon EMR on EKS in a multi-tenant Amazon EKS environment

Post Syndicated from Lotfi Mouhib original https://aws.amazon.com/blogs/big-data/design-considerations-for-amazon-emr-on-eks-in-a-multi-tenant-amazon-eks-environment/

Many AWS customers use Amazon Elastic Kubernetes Service (Amazon EKS) in order to take advantage of Kubernetes without the burden of managing the Kubernetes control plane. With Kubernetes, you can centrally manage your workloads and offer administrators a multi-tenant environment where they can create, update, scale, and secure workloads using a single API. Kubernetes also allows you to improve resource utilization, reduce cost, and simplify infrastructure management to support different application deployments. This model is beneficial for those running Apache Spark workloads, for several reasons. For example, it allows you to have multiple Spark environments running concurrently with different configurations and dependencies that are segregated from each other through Kubernetes multi-tenancy features. In addition, the same cluster can be used for various workloads like machine learning (ML), host applications, data streaming and thereby reducing operational overhead of managing multiple clusters.

AWS offers Amazon EMR on EKS, a managed service that enables you to run your Apache Spark workloads on Amazon EKS. This service uses the Amazon EMR runtime for Apache Spark, which increases the performance of your Spark jobs so that they run faster and cost less. When you run Spark jobs on EMR on EKS and not on self-managed Apache Spark on Kubernetes, you can take advantage of automated provisioning, scaling, faster runtimes, and the development and debugging tools that Amazon EMR provides

In this post, we show how to configure and run EMR on EKS in a multi-tenant EKS cluster that can used by your various teams. We tackle multi-tenancy through four topics: network, resource management, cost management, and security.

Concepts

Throughout this post, we use terminology that is either specific to EMR on EKS, Spark, or Kubernetes:

  • Multi-tenancy – Multi-tenancy in Kubernetes can come in three forms: hard multi-tenancy, soft multi-tenancy and sole multi-tenancy. Hard multi-tenancy means each business unit or group of applications gets a dedicated Kubernetes; there is no sharing of the control plane. This model is out of scope for this post. Soft multi-tenancy is where pods might share the same underlying compute resource (node) and are logically separated using Kubernetes constructs through namespaces, resource quotas, or network policies. A second way to achieve multi-tenancy in Kubernetes is to assign pods to specific nodes that are pre-provisioned and allocated to a specific team. In this case, we talk about sole multi-tenancy. Unless your security posture requires you to use hard or sole multi-tenancy, you would want to consider using soft multi-tenancy for the following reasons:
    • Soft multi-tenancy avoids underutilization of resources and waste of compute resources.
    • There is a limited number of managed node groups that can be used by Amazon EKS, so for large deployments, this limit can quickly become a limiting factor.
    • In sole multi-tenancy there is high chance of ghost nodes with no pods scheduled on them due to misconfiguration as we force pods into dedicated nodes with label, taints and tolerance and anti-affinity rules.
  • Namespace – Namespaces are core in Kubernetes and a pillar to implement soft multi-tenancy. With namespaces, you can divide the cluster into logical partitions. These partitions are then referenced in quotas, network policies, service accounts, and other constructs that help isolate environments in Kubernetes.
  • Virtual cluster – An EMR virtual cluster is mapped to a Kubernetes namespace that Amazon EMR is registered with. Amazon EMR uses virtual clusters to run jobs and host endpoints. Multiple virtual clusters can be backed by the same physical cluster. However, each virtual cluster maps to one namespace on an EKS cluster. Virtual clusters don’t create any active resources that contribute to your bill or require lifecycle management outside the service.
  • Pod template – In EMR on EKS, you can provide a pod template to control pod placement, or define a sidecar container. This pod template can be defined for executor pods and driver pods, and stored in an Amazon Simple Storage Service (Amazon S3) bucket. The S3 locations are then submitted as part of the applicationConfiguration object that is part of configurationOverrides, as defined in the EMR on EKS job submission API.

Security considerations

In this section, we address security from different angles. We first discuss how to protect IAM role that is used for running the job. Then address how to protect secrets use in jobs and finally we discuss how you can protect data while it is processed by Spark.

IAM role protection

A job submitted to EMR on EKS needs an AWS Identity and Access Management (IAM) execution role to interact with AWS resources, for example with Amazon S3 to get data, with Amazon CloudWatch Logs to publish logs, or use an encryption key in AWS Key Management Service (AWS KMS). It’s a best practice in AWS to apply least privilege for IAM roles. In Amazon EKS, this is achieved through IRSA (IAM Role for Service Accounts). This mechanism allows a pod to assume an IAM role at the pod level and not at the node level, while using short-term credentials that are provided through the EKS OIDC.

IRSA creates a trust relationship between the EKS OIDC provider and the IAM role. This method allows only pods with a service account (annotated with an IAM role ARN) to assume a role that has a trust policy with the EKS OIDC provider. However, this isn’t enough, because it would allow any pod with a service account within the EKS cluster that is annotated with a role ARN to assume the execution role. This must be further scoped down using conditions on the role trust policy. This condition allows the assume role to happen only if the calling service account is the one used for running a job associated with the virtual cluster. The following code shows the structure of the condition to add to the trust policy:

{
    "Version": "2012-10-17",
    "Statement": [
        {
            "Effect": "Allow",
            "Principal": {
                "Federated": <OIDC provider ARN >
            },
            "Action": "sts:AssumeRoleWithWebIdentity"
            "Condition": { "StringLike": { “<OIDC_PROVIDER>:sub": "system:serviceaccount:<NAMESPACE>:emr-containers-sa-*-*-<AWS_ACCOUNT_ID>-<BASE36_ENCODED_ROLE_NAME>”} }
        }
    ]
}

To scope down the trust policy using the service account condition, you need to run the following the command with AWS CLI:

aws emr-containers update-role-trust-policy \
–cluster-name cluster \
–namespace namespace \
–role-name iam_role_name_for_job_execution

The command will the add the service account that will be used by the spark client, Jupyter Enterprise Gateway, Spark kernel, driver or executor. The service accounts name have the following structure emr-containers-sa-*-*-<AWS_ACCOUNT_ID>-<BASE36_ENCODED_ROLE_NAME>.

In addition to the role segregation offered by IRSA, we recommend blocking access to instance metadata because a pod can still inherit the rights of the instance profile assigned to the worker node. For more information about how you can block access to metadata, refer to Restrict access to the instance profile assigned to the worker node.

Secret protection

Sometime a Spark job needs to consume data stored in a database or from APIs. Most of the time, these are protected with a password or access key. The most common way to pass these secrets is through environment variables. However, in a multi-tenant environment, this means any user with access to the Kubernetes API can potentially access the secrets in the environment variables if this access isn’t scoped well to the namespaces the user has access to.

To overcome this challenge, we recommend using a Secrets store like AWS Secrets Manager that can be mounted through the Secret Store CSI Driver. The benefit of using Secrets Manager is the ability to use IRSA and allow only the role assumed by the pod access to the given secret, thereby improving your security posture. You can refer to the best practices guide for sample code showing the use of Secrets Manager with EMR on EKS.

Spark data encryption

When a Spark application is running, the driver and executors produce intermediate data. This data is written to the node local storage. Anyone who is able to exec into the pods would be able to read this data. Spark supports encryption of this data, and it can be enabled by passing --conf spark.io.encryption.enabled=true. Because this configuration adds performance penalty, we recommend enabling data encryption only for workloads that store and access highly sensitive data and in untrusted environments.

Network considerations

In this section we discuss how to manage networking within the cluster as well as outside the cluster. We first address how Spark handle cross executors and driver communication and how to secure it. Then we discuss how to restrict network traffic between pods in the EKS cluster and allow only traffic destined to EMR on EKS. Last, we discuss how to restrict traffic of executors and driver pods to external AWS service traffic using security groups.

Network encryption

The communication between the driver and executor uses RPC protocol and is not encrypted. Starting with Spark 3 in the Kubernetes backed cluster, Spark offers a mechanism to encrypt communication using AES encryption.

The driver generates a key and shares it with executors through the environment variable. Because the key is shared through the environment variable, potentially any user with access to the Kubernetes API (kubectl) can read the key. We recommend securing access so that only authorized users can have access to the EMR virtual cluster. In addition, you should set up Kubernetes role-based access control in such a way that the pod spec in the namespace where the EMR virtual cluster runs is granted to only a few selected service accounts. This method of passing secrets through the environment variable would change in the future with a proposal to use Kubernetes secrets.

To enable encryption, RPC authentication must also be enabled in your Spark configuration. To enable encryption in-transit in Spark, you should use the following parameters in your Spark config:

--conf spark.authenticate=true

--conf spark.network.crypto.enabled=true

Note that these are the minimal parameters to set; refer to Encryption from the complete list of parameters.

Additionally, applying encryption in Spark has a negative impact on processing speed. You should only apply it when there is a compliance or regulation need.

Securing Network traffic within the cluster

In Kubernetes, by default pods can communicate over the network across different namespaces in the same cluster. This behavior is not always desirable in a multi-tenant environment. In some instances, for example in regulated industries, to be compliant you want to enforce strict control over the network and send and receive traffic only from the namespace that you’re interacting with. For EMR on EKS, it would be the namespace associated to the EMR virtual cluster. Kubernetes offers constructs that allow you to implement network policies and define fine-grained control over the pod-to-pod communication. These policies are implemented by the CNI plugin; in Amazon EKS, the default plugin would be the VPC CNI. A policy is defined as follows and is applied with kubectl:

Kind: NetworkPolicy
metadata:
  name: default-np-ns1
  namespace: <EMR-VC-NAMESPACE>
spec:
  podSelector: {}
  policyTypes:
  - Ingress
  - Egress
  ingress:
  - from:
    - namespaceSelector:
        matchLabels:
          nsname: <EMR-VC-NAMESPACE>

Network traffic outside the cluster

In Amazon EKS, when you deploy pods on Amazon Elastic Compute Cloud (Amazon EC2) instances, all the pods use the security group associated with the node. This can be an issue if your pods (executor pods) are accessing a data source (namely a database) that allows traffic based on the source security group. Database servers often restrict network access only from where they are expecting it. In the case of a multi-tenant EKS cluster, this means pods from other teams that shouldn’t have access to the database servers, would be able to send traffic to it.

To overcome this challenge, you can use security groups for pods. This feature allows you to assign a specific security group to your pods, thereby controlling the network traffic to your database server or data source. You can also refer to the best practices guide for a reference implementation.

Cost management and chargeback

In a multi-tenant environment, cost management is a critical subject. You have multiple users from various business units, and you need to be able to precisely chargeback the cost of the compute resource they have used. At the beginning of the post, we introduced three models of multi-tenancy in Amazon EKS: hard multi-tenancy, soft multi-tenancy, and sole multi-tenancy. Hard multi-tenancy is out of scope because the cost tracking is trivial; all the resources are dedicated to the team using the cluster, which is not the case for sole multi-tenancy and soft multi-tenancy. In the next sections, we discuss these two methods to track the cost for each of model.

Soft multi-tenancy

In a soft multi-tenant environment, you can perform chargeback to your data engineering teams based on the resources they consumed and not the nodes allocated. In this method, you use the namespaces associated with the EMR virtual cluster to track how much resources were used for processing jobs. The following diagram illustrates an example.

Diagram to illustrate soft multi-tenancy

Diagram -1 Soft multi-tenancy

Tracking resources based on the namespace isn’t an easy task because jobs are transient in nature and fluctuate in their duration. However, there are partner tools available that allow you to keep track of the resources used, such as Kubecost, CloudZero, Vantage, and many others. For instructions on using Kubecost on Amazon EKS, refer to this blog post on cost monitoring for EKS customers.

Sole multi-tenancy

For sole multi-tenancy, the chargeback is done at the instance (node) level. Each member on your team uses a specific set of nodes that are dedicated to it. These nodes aren’t always running, and are spun up using the Kubernetes auto scaling mechanism. The following diagram illustrates an example.

Diagram to illustrate Sole tenancy

Diagram -2 Sole tenancy

With sole multi-tenancy, you use a cost allocation tag, which is an AWS mechanism that allows you to track how much each resource has consumed. Although the method of sole multi-tenancy isn’t efficient in terms of resource utilization, it provides a simplified strategy for chargebacks. With the cost allocation tag, you can chargeback a team based on all the resources they used, like Amazon S3, Amazon DynamoDB, and other AWS resources. The chargeback mechanism based on the cost allocation tag can be augmented using the recently launched AWS Billing Conductor, which allows you to issue bills internally for your team.

Resource management

In this section, we discuss considerations regarding resource management in multi-tenant clusters. We briefly discuss topics like sharing resources graciously, setting guard rails on resource consumption, techniques for ensuring resources for time sensitive and/or critical jobs, meeting quick resource scaling requirements and finally cost optimization practices with node selectors.

Sharing resources

In a multi-tenant environment, the goal is to share resources like compute and memory for better resource utilization. However, this requires careful capacity management and resource allocation to make sure each tenant gets their fair share. In Kubernetes, resource allocation is controlled and enforced by using ResourceQuota and LimitRange. ResourceQuota limits resources on the namespace level, and LimitRange allows you to make sure that all the containers are submitted with a resource requirement and a limit. In this section, we demonstrate how a data engineer or Kubernetes administrator can set up ResourceQuota as a LimitRange configuration.

The administrator creates one ResourceQuota per namespace that provides constraints for aggregate resource consumption:

apiVersion: v1
kind: ResourceQuota
metadata:
  name: compute-resources
  namespace: teamA
spec:
  hard:
    requests.cpu: "1000"
    requests.memory: 4000Gi
    limits.cpu: "2000"
    limits.memory: 6000Gi

For LimitRange, the administrator can review the following sample configuration. We recommend using default and defaultRequest to enforce the limit and request field on containers. Lastly, from a data engineer perspective while submitting the EMR on EKS jobs, you need to make sure the Spark parameters of resource requirements are within the range of the defined LimitRange. For example, in the following configuration, the request for spark.executor.cores=7 will fail because the max limit for CPU is 6 per container:

apiVersion: v1
kind: LimitRange
metadata:
  name: cpu-min-max
  namespace: teamA
spec:
  limits:
  - max:
      cpu: "6"
    min:
      cpu: "100m"
    default:
      cpu: "500m"
    defaultRequest:
      cpu: "100m"
    type: Container

Priority-based resource allocation

Diagram Illustrates an example of resource allocation with priority

Diagram – 3 Illustrates an example of resource allocation with priority.

As all the EMR virtual clusters share the same EKS computing platform with limited resources, there will be scenarios in which you need to prioritize jobs in a sensitive timeline. In this case, high-priority jobs can utilize the resources and finish the job, whereas low-priority jobs that are running gets stopped and any new pods must wait in the queue. EMR on EKS can achieve this with the help of pod templates, where you specify a priority class for the given job.

When a pod priority is enabled, the Kubernetes scheduler orders pending pods by their priority and places them in the scheduling queue. As a result, the higher-priority pod may be scheduled sooner than pods with lower priority if its scheduling requirements are met. If this pod can’t be scheduled, the scheduler continues and tries to schedule other lower-priority pods.

The preemptionPolicy field on the PriorityClass defaults to PreemptLowerPriority, and the pods of that PriorityClass can preempt lower-priority pods. If preemptionPolicy is set to Never, pods of that PriorityClass are non-preempting. In other words, they can’t preempt any other pods. When lower-priority pods are preempted, the victim pods get a grace period to finish their work and exit. If the pod doesn’t exit within that grace period, that pod is stopped by the Kubernetes scheduler. Therefore, there is usually a time gap between the point when the scheduler preempts victim pods and the time that a higher-priority pod is scheduled. If you want to minimize this gap, you can set a deletion grace period of lower-priority pods to zero or a small number. You can do this by setting the terminationGracePeriodSeconds option in the victim Pod YAML.

See the following code samples for priority class:

apiVersion: scheduling.k8s.io/v1
kind: PriorityClass
metadata:
  name: high-priority
value: 100
globalDefault: false
description: " High-priority Pods and for Driver Pods."

apiVersion: scheduling.k8s.io/v1
kind: PriorityClass
metadata:
  name: low-priority
value: 50
globalDefault: false
description: " Low-priority Pods."

One of the key considerations while templatizing the driver pods, especially for low-priority jobs, is to avoid the same low-priority class for both driver and executor. This will save the driver pods from getting evicted and lose the progress of all its executors in a resource congestion scenario. In this low-priority job example, we have used a high-priority class for driver pod templates and low-priority classes only for executor templates. This way, we can ensure the driver pods are safe during the eviction process of low-priority jobs. In this case, only executors will be evicted, and the driver can bring back the evicted executor pods as the resource becomes freed. See the following code:

apiVersion: v1
kind: Pod
spec:
  priorityClassName: "high-priority"
  nodeSelector:
    eks.amazonaws.com/capacityType: ON_DEMAND
  containers:
  - name: spark-kubernetes-driver # This will be interpreted as Spark driver container

apiVersion: v1
kind: Pod
spec:
  priorityClassName: "low-priority"
  nodeSelector:
    eks.amazonaws.com/capacityType: SPOT
  containers:
  - name: spark-kubernetes-executors # This will be interpreted as Spark executor container

Overprovisioning with priority

Diagram Illustrates an example of overprovisioning with priority

Diagram – 4 Illustrates an example of overprovisioning with priority.

As pods wait in a pending state due to resource availability, additional capacity can be added to the cluster with Amazon EKS auto scaling. The time it takes to scale the cluster by adding new nodes for deployment has to be considered for time-sensitive jobs. Overprovisioning is an option to mitigate the auto scaling delay using temporary pods with negative priority. These pods occupy space in the cluster. When pods with high priority are unschedulable, the temporary pods are preempted to make the room. This causes the auto scaler to scale out new nodes due to overprovisioning. Be aware that this is a trade-off because it adds higher cost while minimizing scheduling latency. For more information about overprovisioning best practices, refer to Overprovisioning.

Node selectors

EKS clusters can span multiple Availability Zones in a VPC. A Spark application whose driver and executor pods are distributed across multiple Availability Zones can incur inter- Availability Zone data transfer costs. To minimize or eliminate the data transfer cost, you should configure the job to run on a specific Availability Zone or even specific node type with the help of node labels. Amazon EKS places a set of default labels to identify capacity type (On-Demand or Spot Instance), Availability Zone, instance type, and more. In addition, we can use custom labels to meet workload-specific node affinity.

EMR on EKS allows you to choose specific nodes in two ways:

  • At the job level. Refer to EKS Node Placement for more details.
  • In the driver and executor level using pod templates.

When using pod templates, we recommend using on demand instances for driver pods. You can also consider including spot instances for executor pods for workloads that are tolerant of occasional periods when the target capacity is not completely available. Leveraging spot instances allow you to save cost for jobs that are not critical and can be terminated. Please refer Define a NodeSelector in PodTemplates.

Conclusion

In this post, we provided guidance on how to design and deploy EMR on EKS in a multi-tenant EKS environment through different lenses: network, security, cost management, and resource management. For any deployment, we recommend the following:

  • Use IRSA with a condition scoped on the EMR on EKS service account
  • Use a secret manager to store credentials and the Secret Store CSI Driver to access them in your Spark application
  • Use ResourceQuota and LimitRange to specify the resources that each of your data engineering teams can use and avoid compute resource abuse and starvation
  • Implement a network policy to segregate network traffic between pods

Lastly, if you are considering migrating your spark workload to EMR on EKS you can further learn about design patterns to manage Apache Spark workload in EMR on EKS in this blog and about migrating your EMR transient cluster to EMR on EKS in this blog.


About the Authors

author - lotfiLotfi Mouhib is a Senior Solutions Architect working for the Public Sector team with Amazon Web Services. He helps public sector customers across EMEA realize their ideas, build new services, and innovate for citizens. In his spare time, Lotfi enjoys cycling and running.

author - peter ajeebAjeeb Peter is a Senior Solutions Architect with Amazon Web Services based in Charlotte, North Carolina, where he guides global financial services customers to build highly secure, scalable, reliable, and cost-efficient applications on the cloud. He brings over 20 years of technology experience on Software Development, Architecture and Analytics from industries like finance and telecom.

How to Accelerate Your SOAR Program to Full Speed in Less Than a Year

Post Syndicated from Ryan Fried original https://blog.rapid7.com/2022/09/21/how-to-accelerate-your-soar-program-to-full-speed-in-less-than-a-year/

How to Accelerate Your SOAR Program to Full Speed in Less Than a Year

Every new technology comes with a learning curve specific to your organization. First you learn the basics, then you accelerate. Rapid7’s offerings are no different.

As a Senior Information Security Engineer at Brooks, I have firsthand experience with this process. I oversaw the implementation of Rapid7’s security orchestration, automation, and response (SOAR) product, InsightConnect, within my organization. We went from zero to 20+ workflows in just one year. Here are some reflections and advice about setting up a SOAR program, through the lens of my story about that successful and innovative year.

Workflow 1: Let Rapid7 hold your hand

In a previous blog regarding our initial deployment of InsightConnect, I shared key advice about how to set up a SOAR tool and get the program started. Looking back on that successful process, I believe that you should start with a goal that’s manageable – and delivers immediate value to help prove and cement the value of the initiative. For example, a phishing-related workflow is a great place to start. But there are other options as well, depending on your organization’s needs. Consider the following questions:

  • What pain point within your organization presents an immediate need?
  • What processes do you already want or need to try to automate?

Consider your team’s key technologies as well, but as you think through these questions, approach the solution in a technology-agnostic way. Instead, focus on the process, which can usually be applied to multiple technologies, and the corresponding desired outcome.

After that, you’ll want to work with your security analysts (assuming you’re not the security analyst!) to determine their pain points as well. What are the most common alerts they get? Where do they spend the most time? Or my favorite question to ask, “What requires the most browser tabs?” Your immediate focus should be how to make their job easier and more efficient.

From there, lean heavily on Rapid7’s product resources and services, and especially existing workflows that you can find in the Rapid7 Extensions Library – this will cut your work in half.

Workflows 2 to 5: Integrate with Slack and Teams

Once you’ve gone live with your first workflow, continue to look to the Rapid7 Extensions Library for workflows you can download and adapt to your needs. Some of the best examples of that use Slack or Microsoft Teams as the primary interface – you can find them easily by searching for workflows by category. And when you find an appropriate workflow, don’t get caught up on the specific technologies in the workflow. Again, focus on the process that you’re automating – after all, blocking an IP on one firewall is essentially the same as blocking an IP on another firewall, as it’s just a matter of swapping the integration plugin.

A major reason I advise starting with Slack and Teams-related workflows is that they’re the most numerous in the library and are valuable to most organizations. But this is the point where buy-in from key stakeholders across your organization becomes essential. Work with whoever runs your Teams or enterprise Slack account to input the appropriate API keys – they’re an extended part of your security automation team.

From there, look into workflows for incident response and enrichment – again, in the extensions library. Searching Virustotal or forcing a password reset or revoking Office 365 access can be very useful areas of automation, since you likely conduct those processes a lot. They can take a lot of time because they often rely on other teams when integration and automations aren’t already in place. Since time is of the essence in a phishing-related compromise, they’re super impactful.

One reason response and enrichment workflows are so useful for Workflows 2 to 5 is that it helps you understand that SOAR is not just about full automation. In fact, it’s about supporting human decision-making. So many security decisions require human insight and experience to make the right decision. What SOAR can do is to automatically collect the necessary context, tee up the decision to the security analyst, and then broadly automate the execution of those decisions.

Workflows 6 to 10: Hone in on your analysts’ pain points

At this point, it’s going to become easier for you and your team to build and implement your own, more heavily customized workflows. You’ll understand things like decisions trees, loops, and markdown cards – essential tools to take your security automation workflows to the next level. You’ll then be prepared to start customizing more workflows specifically catered to the needs of your organization and your analysts. Start here:

  1. Find out what your analysts’ top 5 alerts are. They’ll likely be something along the lines of DNS, EDR, Firewalls, or email-related alerts.
  2. Return to the Rapid7 workflow library to find existing workflows you can adopt and customize to address those alert categories.

Expect to commit a couple of hours here and there over a couple of weeks to perfect each workflow to fit your organization. This may sound like a lot, but I promise – the lift isn’t too hard. The Rapid7 extensions library and tool does a lot of lifting for you!

Workflows 10 to 20: Take your workflows to the next level

Once you’ve implemented roughly 10 workflows, you’re ready to start honing in on specific pain points that likely require a bit more and customization – for example, ad-hoc actions for investigations like revoking active Office 365 sessions, searching for and deleting specific emails, or automatically blocking likely malicious URLs based on threat intelligence feeds you’re subscribed to.

The more you create, the more comfortable you’ll be  creating workflows from scratch. In my experience, by the time you get to 20 workflows, you should expect that you or a team member could get a typical workflow designed and shipped in 1 to 2 weeks, assuming they spend 4 to 8 hours a week on it. Check out two of my team’s prized custom workflows:

However, that’s not to say that you can’t still make existing workflows your own. It’s to your benefit to keep up with the latest developments in Rapid7’s marketplace. I check the marketplace every few weeks and subscribe to the newsletter for new workflows or plugins. I’ve also learned to use the plugin API to make custom API calls for plugins Rapid7 doesn’t yet have!

In my next blog, I’ll take a deeper dive into the why and how of high-value security automation workflows. I’ll also give you some insights into the benefits we’ve seen at Brooks thanks to our SOAR program.

Additional reading:

NEVER MISS A BLOG

Get the latest stories, expertise, and news about security today.

Store and retrieve your logs on R2

Post Syndicated from Shelley Jones original https://blog.cloudflare.com/store-and-retrieve-logs-on-r2/

Store and retrieve your logs on R2

Store and retrieve your logs on R2

Following today’s announcement of General Availability of Cloudflare R2 object storage, we’re excited to announce that customers can also store and retrieve their logs on R2.

Cloudflare’s Logging and Analytics products provide vital insights into customers’ applications. Though we have a breadth of capabilities, logs in particular play a pivotal role in understanding what occurs at a granular level; we produce detailed logs containing metadata generated by Cloudflare products via events flowing through our network, and they are depended upon to illustrate or investigate anything (and everything) from the general performance or health of applications to closely examining security incidents.

Until today, we have only provided customers with the ability to export logs to 3rd-party destinations – to both store and perform analysis. However, with Log Storage on R2 we are able to offer customers a cost-effective solution to store event logs for any of our products.

The cost conundrum

We’ve unpacked the commercial impact in a previous blog post, but to recap, the cost of storage can vary broadly depending on the volume of requests Internet properties receive. On top of that – and specifically pertaining to logs – there’s usually more expensive fees to access that data whenever the need arises. This can be incredibly problematic, especially when customers are having to balance their budget with the need to access their logs – whether it’s to mitigate a potential catastrophe or just out of curiosity.

With R2, not only do we not charge customers egress costs, but we also provide the opportunity to make further operational savings by centralizing storage and retrieval. Though, most of all, we just want to make it easy and convenient for customers to access their logs via our Retrieval API – all you need to do is provide a time range!

Logs on R2: get started!

Why would you want to store your logs on Cloudflare R2? First, R2 is S3 API compatible, so your existing tooling will continue to work as is. Second, not only is R2 cost-effective for storage, we also do not charge any egress fees if you want to get your logs out of Cloudflare to be ingested into your own systems. You can store logs for any Cloudflare product, and you can also store what you need for as long as you need; retention is completely within your control.

Storing Logs on R2

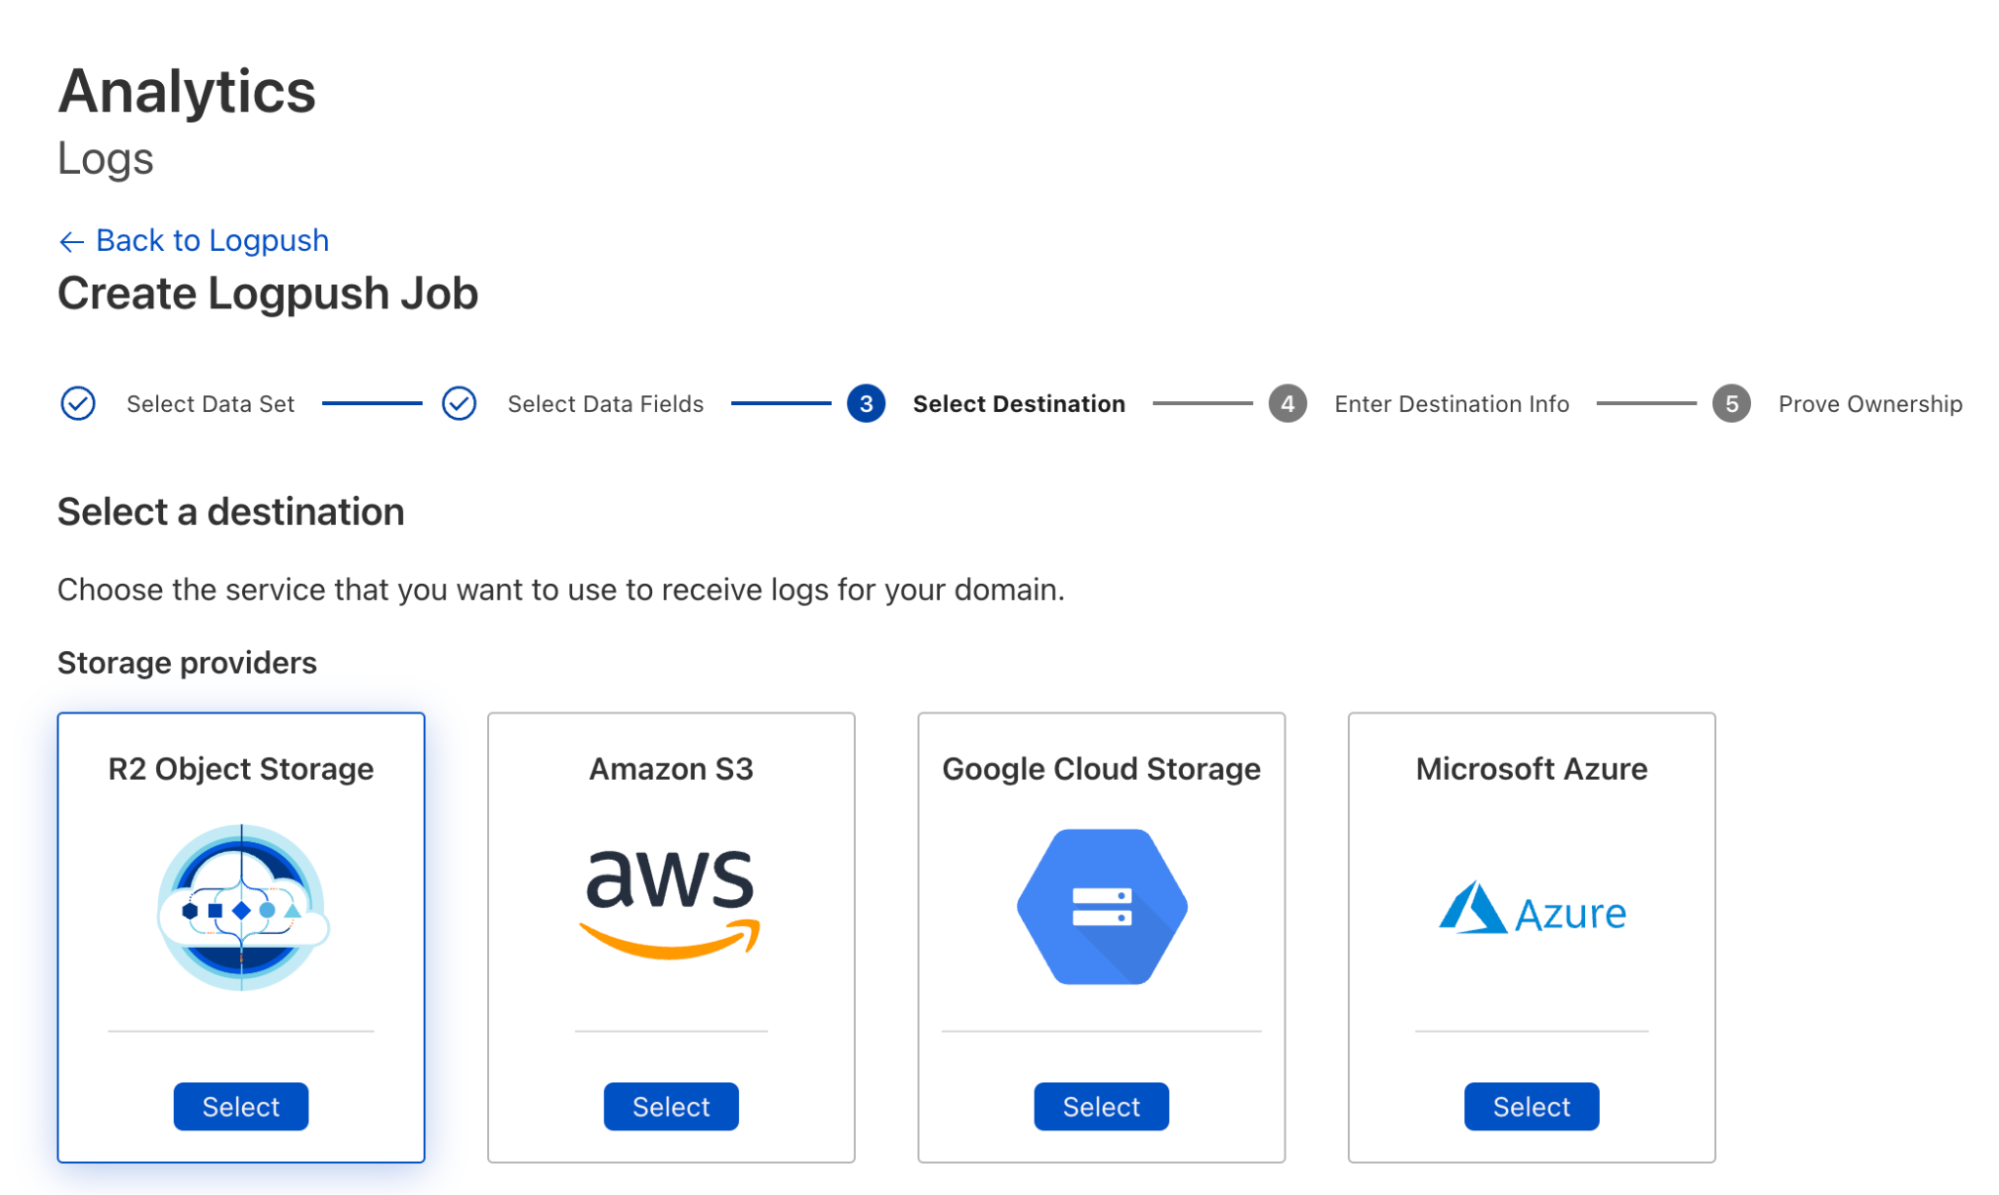
To create Logpush jobs pushing to R2, you can use either the dashboard or Cloudflare API. Using the dashboard, you can create a job and select R2 as the destination during configuration:

Store and retrieve your logs on R2

To use the Cloudflare API to create the job, do something like:

curl -s -X POST 'https://api.cloudflare.com/client/v4/zones/<ZONE_ID>/logpush/jobs' \
-H "X-Auth-Email: <EMAIL>" \
-H "X-Auth-Key: <API_KEY>" \
-d '{
 "name":"<DOMAIN_NAME>",
"destination_conf":"r2://<BUCKET_PATH>/{DATE}?account-id=<ACCOUNT_ID>&access-key-id=<R2_ACCESS_KEY_ID>&secret-access-key=<R2_SECRET_ACCESS_KEY>",
 "dataset": "http_requests",
"logpull_options":"fields=ClientIP,ClientRequestHost,ClientRequestMethod,ClientRequestURI,EdgeEndTimestamp,EdgeResponseBytes,EdgeResponseStatus,EdgeStartTimestamp,RayID&timestamps=rfc3339",
 "kind":"edge"
}' | jq .

Please see Logpush over R2 docs for more information.

Log Retrieval on R2

If you have your logs pushed to R2, you could use the Cloudflare API to retrieve logs in specific time ranges like the following:

curl -s -g -X GET 'https://api.cloudflare.com/client/v4/accounts/<ACCOUNT_ID>/logs/retrieve?start=2022-09-25T16:00:00Z&end=2022-09-25T16:05:00Z&bucket=<YOUR_BUCKET>&prefix=<YOUR_FILE_PREFIX>/{DATE}' \
-H "X-Auth-Email: <EMAIL>" \
-H "X-Auth-Key: <API_KEY>" \ 
-H "R2-Access-Key-Id: R2_ACCESS_KEY_ID" \
-H "R2-Secret-Access-Key: R2_SECRET_ACCESS_KEY" | jq .

See Log Retrieval API for more details.

Now that you have critical logging infrastructure on Cloudflare, you probably want to be able to monitor the health of these Logpush jobs as well as get relevant alerts when something needs your attention.

Looking forward

While we have a vision to build out log analysis and forensics capabilities on top of R2 – and a roadmap to get us there – we’d still love to hear your thoughts on any improvements we can make, particularly to our retrieval options.

Get setup on R2 to start pushing logs today! If your current plan doesn’t include Logpush, storing logs on R2 is another great reason to upgrade!

SVG support in Cloudflare Images

Post Syndicated from Paulo Costa original https://blog.cloudflare.com/svg-support-in-cloudflare-images/

SVG support in Cloudflare Images

SVG support in Cloudflare Images

Cloudflare Images was announced one year ago on this very blog to help you solve the problem of delivering images in the right size, right quality and fast. Very fast.

It doesn’t really matter if you only run a personal blog, or a portal with thousands of vendors and millions of end-users. Doesn’t matter if you need one hundred images to be served one thousand times each at most, or if you deal with tens of millions of new, unoptimized, images that you deliver billions of times per month.

We want to remove the complexity of dealing with the need to store, to process, resize, re-encode and serve the images using multiple platforms and vendors.

At the time we wrote:

Images is a single product that stores, resizes, optimizes and serves images. We built Cloudflare Images, so customers of all sizes can build a scalable and affordable image pipeline in minutes.

We supported the most common formats, such as JPG, WebP, PNG and GIF.

We did not feel the need to support SVG files. SVG files are inherently scalable, so there is nothing to resize on the server side before serving them to your audience. One can even argue that SVG files are documents that can generate images through mathematical formulas of vectors and nodes, but are not images per se.

There was also the clear notion that SVG files were a potential risk due to known and well documented vulnerabilities. We knew we could do something from the security angle, but still, why go through that workload if it didn’t make sense in the first place to consider an SVG as a supported format.

Not supporting SVG files, though, did bring a set of challenges to an increasing number of our customers. Some stats already show that around 50% of websites serve SVG files, which matches the pulse we got from talking with many of you, customers and community.

If you relied on SVGs, you had to select a second storage location or a second image platform elsewhere. That commonly resulted in an egress fee when serving an uncached file from that source, and it goes against what we want for our product: one image pipeline to cover all your needs.

We heard loud and clear, and starting from today, you can store and serve SVG files, safely, with Cloudflare Images.

SVG, what is so special about them?

The Scalable Vector Graphics file type is great for serving all kinds of illustrations, charts, logos, and icons.

SVG files don’t represent images as pixels, but as geometric shapes (lines, arcs, polygons) that can be drawn with perfect sharpness at any resolution.

Let’s use now a complex image as an example, filled with more than four hundred paths and ten thousand nodes:

SVG support in Cloudflare Images

Contrary to the bitmaps where pixels arrange together to create the visual perception of an image to the human eye, that vector image can be resized with no quality loss. That happens because resizing that SVG to 300% of its original size is redefining the size of the vectors to 300%, not expanding pixels to 300%.

This becomes evident when we’re dealing with small resolution images.

Here is the 100px width SVG from the Toroid shown above:

SVG support in Cloudflare Images

and the correspondent 100 pixels width PNG:

SVG support in Cloudflare Images

Now here is the same SVG with the HTML width attribute set at 300px:

SVG support in Cloudflare Images

and the same PNG you saw before, but, upscaled by 3x, so the width is also 300px:

SVG support in Cloudflare Images

The visual quality loss on the PNG is obvious when it gets scaled up.

Keep in mind: The Toroid shown above is stored in an SVG file of 142Kb. And that is a very complex and heavy SVG file already.

Now, if you do want to display a PNG with an original width of 1024px to present a high quality image of the same Toroid above, the size will become an issue:

SVG support in Cloudflare Images

The new 1024px PNG, however, weighs 344 KB. That’s about 2.4 times the weight of the unique SVG that you could use in any size.

Think about the storage and bandwidth savings when all you need to do with an SVG, to get the exact same displayed image is use a width=”1024” in your HTML. It requires less than half of the kilobytes used on the PNG.

Couple all of this with the flexibility of using attributes like viewbox in your HTML code, and you can pan, zoom, crop, scale, all without ever needing anything other than the one and original SVG file.

Here’s an example of an SVG being resized on the client side, with no visual quality loss:

Let’s do a quick summary of what we covered so far: SVG files are wonderful for vector images like illustrations, charts, logos, and are infinitely scalable with no need to resize on the server side;

the same generated image, but on a bitmap is either heavier than the SVG when used in high resolutions, or with very noticeable loss of visual quality when scaled up from a lower resolution.

So, what are the downsides of using SVG files?

SVG files aren’t just images. They are XML-based documents that are as powerful as HTML pages. They can contain arbitrary JavaScript, fetch external content from other URLs or embed HTML elements. This gives SVG files much more power than expected from a simple image.

Throughout the years, numerous exploits have been known, identified and corrected.

Some old attacks were very rudimentary, yet effective. The famous Billion Laughs exploited how XML uses Entities and declares them in the Document Type Definition, and how it handles recursion.

Entities can be something as simple as a declaration of a text string, or a nested reference to other previous entities.

If you defined a first entity with a simple string, and then created a second entity calling 10 times the first one, and then a third entity calling 10 times the second one up until a 10th one of the same kind, you were requiring a parser to generate an output of a billion strings as defined on the very simple first entity. This would most commonly exhaust resources on the server parsing the XML, and form a DoS. While that particular limitation from the XML parsing got widely addressed through XML parser memory caps and lazy loading of entities, more complex attacks became a regular thing in recent years.

The common themes in these more recent attacks have been XSS (cross-site-scripting) and foreign objects referenced in the XML content. In both cases, using SVG inside <object> tags in your HTML is an invitation for any ill-intended file to reach your end-users. So, what exactly can we do about it and make you trust any SVG file you serve?

The SVG filter

We’ve developed a filter that simplifies SVG files to only features used for images, so that serving SVG images from any source is just as safe as serving a JPEG or PNG, while preserving SVG’s vector graphics capabilities.

  • We remove scripting. This prevents SVG files from being used for cross-site scripting attacks. Although browsers don’t allow scripts in <img>, they would run scripts when SVG files are opened directly as a top-level document.
  • We remove hyperlinks to other documents. This makes SVG files less attractive for SEO spam and phishing.
  • We remove references to cross-origin resources. This stops 3rd parties from tracking who is viewing the image.

What’s left is just an image.

SVG files can also contain embedded images in other formats, like JPEG and PNG, in the form of Data URLs. We treat these embedded images just like other images that we process, and optimize them too. We don’t support SVG files embedded in SVG recursively, though. It does open the door to recursive parsing leading to resource exhaustion on the parser. While the most common browsers are already limiting SVG recursion to one level, the potential to exploit that door led us to not include, at least for now, this capability on our filter.

We do set Content-Security-Policy (CSP) headers in all our HTTP response headers to disable unwanted features, and that alone acts as first defense, but filtering acts in more depth in case these headers are lost (e.g. if the image was saved as a file and served elsewhere).

Our tool is open-source. It’s written in Rust and can filter SVG files in a streaming fashion without buffering, so it’s fast enough for filtering on the fly.

The SVG format is pretty complex, with lots of features. If there is safe SVG functionality that we don’t support yet, you can report issues and contribute to development of the filter.

You can see how the tool actually works by looking at the tests folder in the open-source repository,  where a sample unfiltered XML and the already filtered version are present.

Here’s how a diff of those files looks like:

SVG support in Cloudflare Images

Removed are the external references, foreignObjects and any other potential threats.

How you can use SVG files in Cloudflare Images

Starting now you can upload SVG files to Cloudflare Images and serve them at will. Uploading the images can be done like for any other supported format, via UI or API.

Variants, named or flexible, are intended to transform bitmap (raster) images into whatever size you want to serve them.

SVG files, as vector images, do not require resizing inside the Images pipeline.

This results in a banner with the following message when you’re previewing an SVG in the UI:

SVG support in Cloudflare Images

And as a result, all variants listed will show the exact same image in the exact same dimensions.
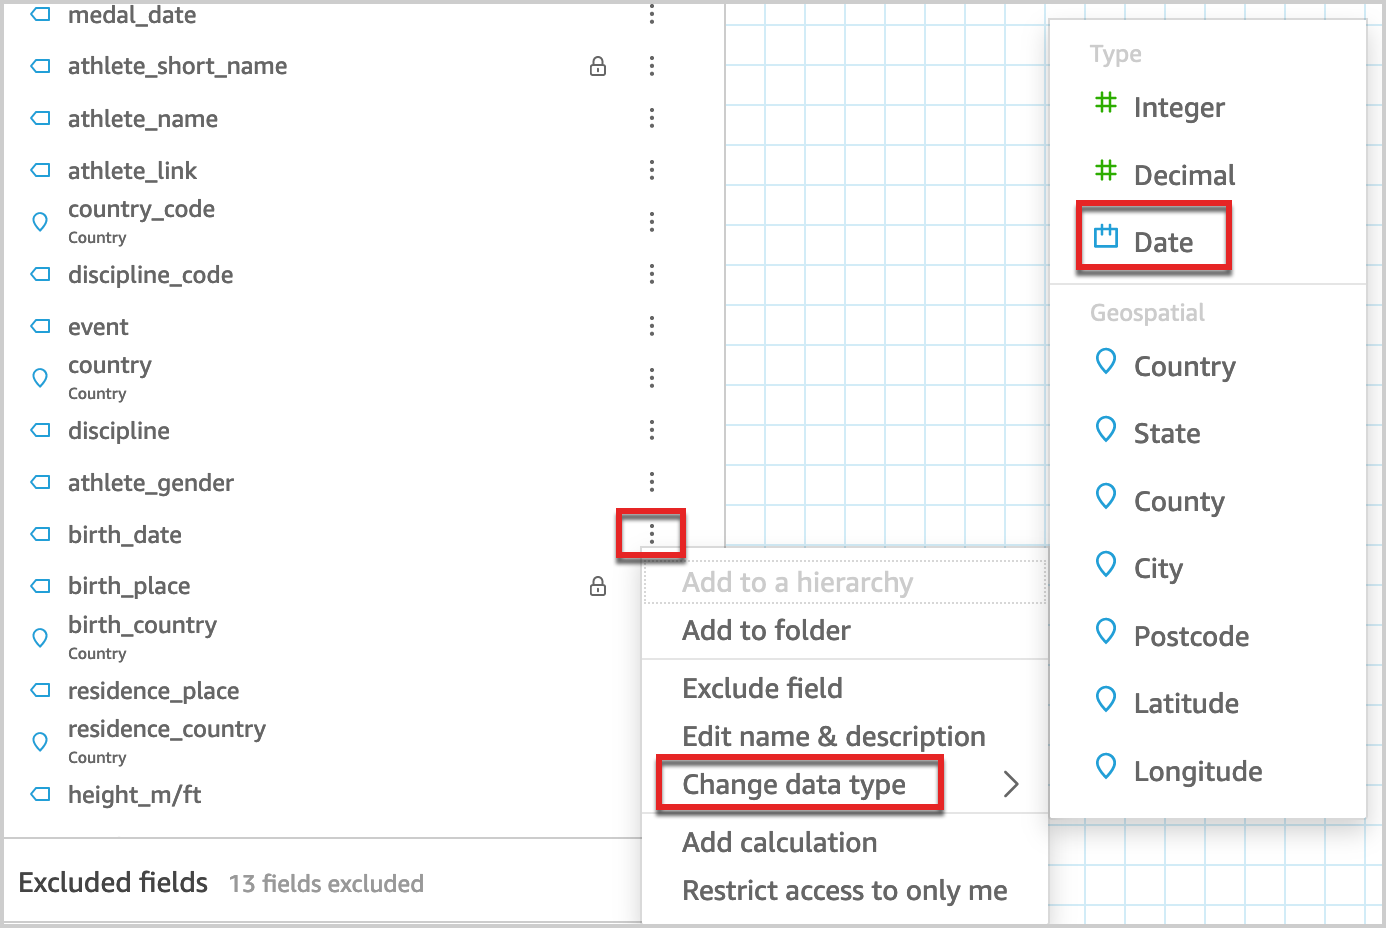
Because an image is worth a thousand words, especially when trying to describe behaviors, here is what will it look like if you scroll through the variants preview:

With Cloudflare Images you do get a default Public Variant listed when you start using the product, and so you can immediately start serving your SVG files using it, just like this:

https://imagedelivery.net/<your_account_hash>/<your_SVG_ID>/public

And, as shown from above, you can use any of your variant names to serve the image, as it won’t affect the output at all.

If you’re an Image Resizing customer, you can also benefit from serving your files with our tool. Make sure you head to the Developer Documentation pages to see how.

What’s next?

You can subscribe to Cloudflare Images directly in the dashboard, and starting from today you can use the product to store and serve SVG files.

If you want to contribute to further developments of the filtering too and help expand its abilities, check out our SVG-Hush Tool repo.

You can also connect directly with the team in our Cloudflare Developers Discord Server.

Going originless with Cloudflare Workers – Building a Todo app – Part 1: The API

Post Syndicated from Kabir Sikand original https://blog.cloudflare.com/workers-todo-part-1/

Going originless with Cloudflare Workers – Building a Todo app – Part 1: The API

Going originless with Cloudflare Workers – Building a Todo app – Part 1: The API

A few months ago we launched Custom Domains into an open beta. Custom Domains allow you to hook up your Workers to the Internet, without having to deal with DNS records or certificates – just enter a valid hostname and Cloudflare will do the rest! The beta’s over, and Custom Domains are now GA.

Custom Domains aren’t just about a seamless developer experience; they also allow you to build a globally distributed instantly scalable application on Cloudflare’s Developer Platform. That’s because Workers leveraging Custom Domains have no concept of an ‘Origin Server’. There’s no ‘home’ to phone to – and that also means your application can use the power of Cloudflare’s global network to run your application, well, everywhere. It’s truly serverless.

Let’s build “Todo”, but without the servers

Today we’ll start a series of posts outlining a simple todo list application. We’ll start with an API and hook it up to the Internet using Custom Domains.

With Custom Domains, you’re treating the whole network as the application server. Any time a request comes into a Cloudflare data center, Workers are triggered in that data center and connect to resources across the network as needed. Our developers don’t need to think about regions, or replication, or spinning up the right number of instances to handle unforeseen load. Instead, just deploy your Workers and Cloudflare will handle the rest.

For our todo application, we begin by building an API Gateway to perform routing, any authorization checks, and drop invalid requests. We then fan out to each individual use case in a separate Worker, so our teams can independently make updates or add features to each endpoint without a full redeploy of the whole application. Finally, each Worker has a D1 binding to be able to create, read, update, and delete records from the database. All of this happens on Cloudflare’s global network, so your API is truly available everywhere. The architecture will look something like this:

Going originless with Cloudflare Workers – Building a Todo app – Part 1: The API

Bootstrap the D1 Database

First off, we’re going to need a D1 database set up, with a schema for our todo application to run on. If you’re not familiar with D1, it’s Cloudflare’s serverless database offering – explained in more detail here. To get started, we use the wrangler d1 command to create a new database:

npx wrangler d1 create <todo | custom-database-name>

After executing this command, you will be asked to add a snippet of code to your wrangler.toml file that looks something like this:

[[ d1_databases ]]
binding = "db" # i.e. available in your Worker on env.db
database_name = "<todo | custom-database-name>"
database_id = "<UUID>"

Let’s save that for now, and we’ll put these into each of our private microservices in a few moments. Next, we’re going to create our database schema. It’s a simple todo application, so it’ll look something like this, with some seeded data:

db/schema.sql

DROP TABLE IF EXISTS todos;
CREATE TABLE todos (id INTEGER PRIMARY KEY, todo TEXT, todoStatus BOOLEAN NOT NULL CHECK (todoStatus IN (0, 1)));
INSERT INTO todos (todo, todoStatus) VALUES ("Fold my laundry", 0),("Get flowers for mum’s birthday", 0),("Find Nemo", 0),("Water the monstera", 1);

You can bootstrap your new D1 database by running:

npx wrangler d1 execute <todo | custom-database-name> --file=./schema.sql

Then validate your new data by running a query through Wrangler using the following command:

npx wrangler d1 execute <todo | custom-database-name> --command='SELECT * FROM todos';

Great! We’ve now got a database running entirely on Cloudflare’s global network.

Build the endpoint Workers

To talk to your database, we’ll spin up a series of private microservices for each endpoint in our application. We want to be able to create, read, update, delete, and list our todos. The full source code for each is available here. Below is code from a Worker that lists all our todos from D1.

list/src/list.js

export default {
   async fetch(request, env) {
     const { results } = await env.db.prepare(
       "SELECT * FROM todos"
     ).all();
     return Response.json(results);
   },
 };

The Worker ‘todo-list’ needs to be able to access D1 from the environment variable db. To do this, we’ll define the D1 binding in our wrangler.toml file. We also specify that workers_dev is false, preventing a preview from being generated via workers.dev (we want this to be a private microservice).

list/wrangler.toml

name = "todo-list"
main = "src/list.js"
compatibility_date = "2022-09-07"
workers_dev = false
usage_model = "unbound"

[[ d1_databases ]]
binding = "db" # i.e. available in your Worker on env.db
database_name = "<todo | custom-database-name>"
database_id = "UUID"

Finally, use wrangler publish to deploy this microservice.

todo/list on ∞main [!] 
› wrangler publish
 ⛅️ wrangler 0.0.0-893830aa
-----------------------------------------------------------------------
Retrieving cached values for account from ../../../node_modules/.cache/wrangler
Your worker has access to the following bindings:
- D1 Databases:
  - db: todo (UUID)
Total Upload: 4.71 KiB / gzip: 1.60 KiB
Uploaded todo-list (0.96 sec)
No publish targets for todo-list (0.00 sec)

Notice that wrangler mentions there are no ‘publish targets’ for todo-list. That’s because we haven’t hooked todo-list up to any HTTP endpoints. That’s fine! We’re going to use Service Bindings to route requests through a gateway worker, as described in the architecture diagram above.

Next, reuse these steps to create similar microservices for each of our create, read, update, and delete endpoints. The source code is available to follow along.

Tying it all together with an API Gateway

Each of our Workers are able to talk to the D1 database, but how can our application talk to our API? We’ll build out a simple API gateway to route incoming requests to the appropriate microservice. For the purposes of our application, we’re using a combination of URL pathname and request method to detect which endpoint is appropriate.

gateway/src/gateway.js

export default {
 async fetch(request, env) {
   try{
     const url = new URL(request.url)
     const idPattern = new URLPattern({ pathname: '/:id' })
     if (idPattern.test(request.url)) {
       switch (request.method){
         case 'GET':
           return await env.get.fetch(request.clone())
         case 'PATCH':
           return await env.update.fetch(request.clone())
         case 'DELETE':
           return await env.delete.fetch(request.clone())
         default:
           return new Response("Unsupported method for endpoint /:id", {status: 405})
       }
     } else if (url.pathname == '/') {
       switch (request.method){
         case 'GET':
           return await env.list.fetch(request.clone())
         case 'POST':
           return await env.create.fetch(request.clone())
         default:
           return new Response("Unsupported method for endpoint /", {status: 405})
       }
     }
     return new Response("Not found. Supported endpoints are /:id and /", {status: 404})
   } catch(e) {
     return new Response(e, {status: 500})
   }
 },
};

With our API gateway all set, we just need to expose our application to the Internet using a Custom Domain, and hook up our Service Bindings, so the gateway Worker can access each appropriate microservice. We’ll set this up in a wrangler.toml.

gateway/wrangler.toml

name = "todo-gateway"
main = "src/gateway.js"
compatibility_date = "2022-09-07"
workers_dev = false
usage_model = "unbound"
 
routes =  [
   {pattern="todos.radiobox.tv", custom_domain=true, zone_name="radiobox.tv"}
]
 
services = [
   {binding = "get",service = "todo-get"},
   {binding = "delete",service = "todo-delete"},
   {binding = "create",service = "todo-create"},
   {binding = "update",service = "todo-update"},
   {binding = "list",service = "todo-list"}
]

Next, use wrangler publish to deploy your application to the Cloudflare network. Seconds later, you’ll have a simple, functioning todo API built entirely on Cloudflare’s Developer Platform!

› wrangler publish
 ⛅️ wrangler 0.0.0-893830aa
-----------------------------------------------------------------------
Retrieving cached values for account from ../../../node_modules/.cache/wrangler
Your worker has access to the following bindings:
- Services:
  - get: todo-get
  - delete: todo-delete
  - create: todo-create
  - update: todo-update
  - list: todo-list
Total Upload: 1.21 KiB / gzip: 0.42 KiB
Uploaded todo-gateway (0.62 sec)
Published todo-gateway (0.51 sec)
  todos.radiobox.tv (custom domain - zone name: radiobox.tv)

Natively Global

Since it’s built natively on Cloudflare, you can also include Cloudflare’s security suite in front of the application. If we want to prevent SQL Injection attacks for this endpoint, we can enable the appropriate Managed WAF rules on our todos API endpoint. Alternatively, if we wanted to prevent global access to our API (only allowing privileged clients to access the application), we can simply put Cloudflare Access in front, with custom Access Rules.

Going originless with Cloudflare Workers – Building a Todo app – Part 1: The API

With Custom Domains on Workers, you’re able to easily create applications that are native to Cloudflare’s global network, instantly. Best of all, your developers don’t need to worry about maintaining DNS records or certificate renewal – Cloudflare handles it all on their behalf. We’d like to give a huge shout out to the 5,000+ developers who used Custom Domains during the open beta period, and those that gave feedback along the way to make this possible. Can’t wait to see what you build next! As always, if you have any questions or would like to get involved, please join us on Discord.

Tune in next time to see how we can build a frontend for our application. In the meantime, you can play around with the todos API we built today at todos.radiobox.tv.

The easiest way to build a modern SaaS application

Post Syndicated from Tanushree Sharma original https://blog.cloudflare.com/workers-for-platforms-ga/

The easiest way to build a modern SaaS application

The easiest way to build a modern SaaS application

The Software as a Service (SaaS) model has changed the way we work – 80% of businesses use at least one SaaS application. Instead of investing in building proprietary software or installing and maintaining on-prem licensed software, SaaS vendors provide businesses with out-of-the-box solutions.

SaaS has many benefits over the traditional software model: cost savings, continuous updates and scalability, to name a few. However, any managed solution comes with trade-offs. As a business, one of the biggest challenges in adopting SaaS tooling is loss of customization. Not every business uses software in the same way and as you grow as a SaaS company it’s not long until you get customers saying “if only I could do X”.

Enter Workers for Platforms – Cloudflare’s serverless functions offering for SaaS businesses. With Workers for Platforms, your customers can build custom logic to meet their requirements right into your application.

We’re excited to announce that Workers for Platforms is now in GA for all Enterprise customers! If you’re an existing customer, reach out to your Customer Success Manager (CSM) to get access. For new customers, fill out our contact form to get started.

The conundrum of customization

As a SaaS business invested in capturing the widest market, you want to build a universal solution that can be used by customers of different sizes, in various industries and regions. However, every one of your customers has a unique set of tools and vendors and best practices. A generalized platform doesn’t always meet their needs.

For SaaS companies, once you get in the business of creating customizations yourself, it can be hard to keep up with seemingly never ending requests. You want your engineering teams to focus on building out your core business instead of building and maintaining custom solutions for each of your customer’s use cases.

With Workers for Platforms, you can give your customers the ability to write code that customizes your software. This gives your customers the flexibility to meet their exact use case while also freeing up internal engineering time  – it’s a win-win!

How is this different from Workers?

Workers is Cloudflare’s serverless execution environment that runs your code on Cloudflare’s global network. Workers is lightning fast and scalable; running at data centers in 275+ cities globally and serving requests from as close as possible to the end user. Workers for Platforms extends the power of Workers to our customer’s developers!

So, what’s new?

Dispatch Worker: As a platform customer, you want to have full control over how end developer code fits in with your APIs. A Dispatch Worker is written by our platform customers to run their own logic before dispatching (aka routing) to Workers written by end developers. In addition to routing, it can be used to run authentication, create boilerplate functions and sanitize responses.

User Workers: User Workers are written by end developers, that is, our customers’ developers. End developers can deploy User Workers to script automated actions, create integrations or modify response payload to return custom content. Unlike self-managed Function-as-a-Service (FaaS) options, with Workers for Platforms, end developers don’t need to worry about setting up and maintaining their code on any 3rd party platform. All they need to do is upload their code and you – or rather Cloudflare – takes care of the rest.

Unlimited Scripts: Yes, you read that correctly! With hundreds-plus end developers, the existing 100 script limit for Workers won’t cut it for Workers for Platforms customers. Some of our Workers for Platforms customers even deploy a new script each time their end developers make a change to their code in order to maintain version control and to easily revert to a previous state if a bug is deployed.

Dynamic Dispatch Namespaces: If you’ve used Workers before, you may be familiar with a feature we released earlier this year, Service Bindings. Service Bindings are a way for two Workers to communicate with each other. They allow developers to break up their applications into modules that can be chained together. Service Bindings explicitly link two Workers together, and they’re meant for use cases where you know exactly which Workers need to communicate with each other.

Service Bindings don’t work in the Workers for Platforms model because User Workers are uploaded ad hoc. Dynamic Dispatch Namespaces is our solution to this! A Dispatch Namespace is composed of a collection of User Workers. With Dispatch Namespaces, a Dispatch Worker can be used to call any User Worker in a namespace (similar to how Service Bindings work) but without needing to explicitly pre-define the relationship.

Read more about how to use these features below!

How to use Workers for Platforms

The easiest way to build a modern SaaS application

Dispatch Workers

Dispatch Workers are the entry point for requests to Workers in a Dispatch Namespace. The Dispatch Worker can be used to run any functions ahead of User Workers. They can make a request to any User Workers in the Dispatch Namespace, and they ultimately handle the routing to User Workers.

Dispatch Workers are created the same way as a regular Worker, except they need a Dispatch Namespace binding in the project’s wrangler.toml configuration file.

[[dispatch_namespaces]]
binding = "dispatcher"
namespace = "api-prod"

In the example below, this Dispatch Worker reads the subdomain from the path and calls the appropriate User Worker. Alternatively you can use KV, D1 or your data store of choice to map identifying parameters from an incoming request to a User Worker.

export default {
 async fetch(request, env) {
   try {
       // parse the URL, read the subdomain
       let worker_name = new URL(request.url).host.split('.')[0]
       let user_worker = env.dispatcher.get(worker_name)
       return user_worker.fetch(request)
   } catch (e) {
       if (e.message == 'Error: Worker not found.') {
           // we tried to get a worker that doesn't exist in our dispatch namespace
           return new Response('', {status: 404})
       }
       // this could be any other exception from `fetch()` *or* an exception
       // thrown by the called worker (e.g. if the dispatched worker has
       // `throw MyException()`, you could check for that here).
       return new Response(e.message, {status: 500})
   }
 }

}

Uploading User Workers

User Workers must be uploaded to a Dispatch Namespace through the Cloudflare API (wrangler support coming soon!). This code snippet below uses a simple HTML form to take in a script and customer id and then uploads it to the Dispatch Namespace.

export default {
 async fetch(request: Request) {
   try {
     // on form submit
     if (request.method === "POST"){
       const str = JSON.stringify(await request.json())
       const upload_obj = JSON.parse(str)
       await upload(upload_obj.customerID, upload_obj.script)
   }
   //render form
     return new Response (html, {
       headers: {
         "Content-Type": "text/html"
       }
     })
   } catch (e) {
       // form error
       return new Response(e.message, {status: 500})
   }
 }
}

async function upload(customerID:string, script:string){
 const scriptName = customerID;
 const scriptContent = script;
 const accountId = "<ACCOUNT_ID>";
 const dispatchNamespace = "api-prod";
 const url = `https://api.cloudflare.com/client/v4/accounts/${accountId}/workers/dispatch/namespaces/${dispatchNamespace}/scripts/${scriptName}`;
 // construct and send request
 const response = await fetch(url, {
   method: "PUT",
   body: scriptContent,
   headers: {
     "Content-Type": "application/javascript",
     "X-Auth-Email": "<EMAIL>",
     "X-Auth-Key": "<API_KEY>"
   }
 });

 const result = (await response.json());
 if (response.status != 200) {
   throw new Error(`Upload error`);
 }
}

It’s that simple. With Dispatch Namespaces and Dispatch Workers, we’re giving you the building blocks to customize your SaaS applications. Along with the Platforms APIs, we’re also releasing a Workers for Platforms UI on the Cloudflare dashboard where you can view your Dispatch Namespaces, search scripts and view analytics for User Workers.

The easiest way to build a modern SaaS application

To view an end to end example, check out our Workers for Platforms example application.

Get started today!

We’re releasing Workers for Platforms to all Cloudflare Enterprise customers. If you’re interested, reach out to your Customer Success Manager (CSM) to get access. To get started, take a look at our Workers for Platforms starter project and developer documentation.

We also have plans to release this down to the Workers Paid plan. Stay tuned on the Cloudflare Discord (channel name: workers-for-platforms-beta) for updates.

What’s next?

We’ve heard lots of great feature requests from our early Workers for Platforms customers. Here’s a preview of what’s coming next on the roadmap:

  • Fine-grained controls over User Workers: custom script limits, allowlist/blocklist for fetch requests
  • GraphQL and Logs: Metrics for User Workers by tag
  • Plug and play Platform Development Kit
  • Tighter integration with Cloudflare for SaaS custom domains

If you have specific feature requests in mind, please reach out to your CSM or get in touch through the Discord!

Security updates for Wednesday

Post Syndicated from original https://lwn.net/Articles/908893/

Security updates have been issued by Fedora (libconfuse, moodle, rizin, and thunderbird), Oracle (ELS kernel, gnupg2, ruby, and webkit2gtk3), Red Hat (booth, dbus-broker, gnupg2, kernel, kernel-rt, kpatch-patch, mysql, nodejs, nodejs-nodemon, ruby, and webkit2gtk3), Slackware (expat and mozilla), SUSE (kubevirt, virt-api-container, virt-controller-container, virt-handler-container, virt-launcher-container, virt-libguestfs-tools-container, virt-operator-container and vsftpd), and Ubuntu (bind9, ghostscript, linux, linux-aws, linux-aws-5.15, linux-azure, linux-azure-5.15, linux-kvm, linux-lowlatency, linux, linux-aws, linux-aws-5.4, linux-azure, linux-azure-5.4, linux-bluefield, linux-gkeop, linux-hwe-5.4, linux-ibm, linux-ibm-5.4, linux-kvm, linux-oracle, linux-oracle-5.4, linux-raspi, linux, linux-aws, linux-aws-hwe, linux-azure-4.15, linux-dell300x, linux-gcp, linux-gcp-4.15, lnux-hwe, inux-kvm, linux-oracle, linux-raspi2, linux-snapdragon, linux-hwe-5.15, linux-lowlatency-hwe-5.15, and mako).

Stream Live is now Generally Available

Post Syndicated from Brendan Irvine-Broque original https://blog.cloudflare.com/stream-live-ga/

Stream Live is now Generally Available

Stream Live is now Generally Available

Today, we’re excited to announce that Stream Live is out of beta, available to everyone, and ready for production traffic at scale. Stream Live is a feature of Cloudflare Stream that allows developers to build live video features in websites and native apps.

Since its beta launch, developers have used Stream to broadcast live concerts from some of the world’s most popular artists directly to fans, build brand-new video creator platforms, operate a global 24/7 live OTT service, and more. While in beta, Stream has ingested millions of minutes of live video and delivered to viewers all over the world.

Bring your big live events, ambitious new video subscription service, or the next mobile video app with millions of users — we’re ready for it.

Streaming live video at scale is hard

Live video uses a massive amount of bandwidth. For example, a one-hour live stream at 1080p at 8Mbps is 3.6GB. At typical cloud provider egress prices, even a little egress can break the bank.

Live video must be encoded on-the-fly, in real-time. People expect to be able to watch live video on their phone, while connected to mobile networks with less bandwidth, higher latency and frequently interrupted connections. To support this, live video must be re-encoded in real-time into multiple resolutions, allowing someone’s phone to drop to a lower resolution and continue playback. This can be complex (Which bitrates? Which codecs? How many?) and costly: running a fleet of virtual machines doesn’t come cheap.

Ingest location matters — Live streaming protocols like RTMPS send video over TCP. If a single packet is dropped or lost, the entire connection is brought to a halt while the packet is found and re-transmitted. This is known as “head of line blocking”. The further away the broadcaster is from the ingest server, the more network hops, and the more likely packets will be dropped or lost, ultimately resulting in latency and buffering for viewers.

Delivery location matters — Live video must be cached and served from points of presence as close to viewers as possible. The longer the network round trips, the more likely videos will buffer or drop to a lower quality.

Broadcasting protocols are in flux — The most widely used protocol for streaming live video, RTMPS, has been abandoned since 2012, and dates back to the era of Flash video in the early 2000s. A new emerging standard, SRT, is not yet supported everywhere. And WebRTC has only recently evolved into an option for high definition one-to-many broadcasting at scale.

The old way to solve this has been to stitch together separate cloud services from different vendors. One vendor provides excellent content delivery, but no encoding. Another provides APIs or hardware to encode, but leaves you to fend for yourself and build your own storage layer. As a developer, you have to learn, manage and write a layer of glue code around the esoteric details of video streaming protocols, codecs, encoding settings and delivery pipelines.

Stream Live is now Generally Available

We built Stream Live to make streaming live video easy, like adding an <img> tag to a website. Live video is now a fundamental building block of Internet content, and we think any developer should have the tools to add it to their website or native app.

With Stream, you or your users stream live video directly to Cloudflare, and Cloudflare delivers video directly to your viewers. You never have to manage internal encoding, storage, or delivery systems — it’s just live video in and live video out.

Our network, our hardware = a solution only Cloudflare can provide

We’re not the only ones building APIs for live video — but we are the only ones with our own global network and hardware that we control and optimize for video. That lets us do things that others can’t, like sub-second glass-to-glass latency using RTMPS and SRT playback at scale.

Newer video codecs require specialized hardware encoders, and while others are beholden to the hardware limitations of public cloud providers, we’re already hard at work installing the latest encoding hardware in our own racks, so that you can deliver high resolution video with even less bandwidth. Our goal is to make what is otherwise only available to video giants available directly to you — stay tuned for some exciting updates on this next week.

Most providers limit how many destinations you can restream or simulcast to. Because we operate our own network, we’ve never even worried about this, and let you restream to as many destinations as you need.

Operating our own network lets us price Stream based on minutes of video delivered — unlike others, we don’t pay someone else for bandwidth and then pass along their costs to you at a markup. The status quo of charging for bandwidth or per-GB storage penalizes you for delivering or storing high resolution content. If you ask why a few times, most of the time you’ll discover that others are pushing their own cost structures on to you.

Encoding video is compute-intensive, delivering video is bandwidth intensive, and location matters when ingesting live video. When you use Stream, you don’t need to worry about optimizing performance, finding a CDN, and/or tweaking configuration endlessly. Stream takes care of this for you.

Free your live video from the business models of big platforms

Nearly every business uses live video, whether to engage with customers, broadcast events or monetize live content. But few have the specialized engineering resources to deliver live video at scale on their own, and wire together multiple low level cloud services. To date, many of the largest content creators have been forced to depend on a shortlist of social media apps and streaming services to deliver live content at scale.

Unlike the status quo, who force you to put your live video in their apps and services and fit their business models, Stream gives you full control of your live video, on your website or app, on any device, at scale, without pushing your users to someone else’s service.

Free encoding. Free ingestion. Free analytics. Simple per-minute pricing.

Others Stream
Encoding $ per minute Free
Ingestion $ per GB Free
Analytics Separate product Free
Live recordings Minutes or hours later Instant
Storage $ per GB per minute stored
Delivery $ per GB per minute delivered

Other platforms charge for ingestion and encoding. Many even force you to consider where you’re streaming to and from, the bitrate and frames per second of your video, and even which of their datacenters you’re using.

With Stream, encoding and ingestion are free. Other platforms charge for delivery based on bandwidth, penalizing you for delivering high quality video to your viewers. If you stream at a high resolution, you pay more.

With Stream, you don’t pay a penalty for delivering high resolution video. Stream’s pricing is simple — minutes of video delivered and stored. Because you pay per minute, not per gigabyte, you can stream at the ideal resolution for your viewers without worrying about bandwidth costs.

Other platforms charge separately for analytics, requiring you to buy another product to get metrics about your live streams.

With Stream, analytics are free. Stream provides an API and Dashboard for both server-side and client-side analytics, that can be queried on a per-video, per-creator, per-country basis, and more. You can use analytics to identify which creators in your app have the most viewed live streams, inform how much to bill your customers for their own usage, identify where content is going viral, and more.

Other platforms tack on live recordings or DVR mode as a separate add-on feature, and recordings only become available minutes or even hours after a live stream ends.

With Stream, live recordings are a built-in feature, made available instantly after a live stream ends. Once a live stream is available, it works just like any other video uploaded to Stream, letting you seamlessly use the same APIs for managing both pre-recorded and live content.

Build live video into your website or app in minutes

Stream Live is now Generally Available

Cloudflare Stream enables you or your users to go live using the same protocols and tools that broadcasters big and small use to go live to YouTube or Twitch, but gives you full control over access and presentation of live streams.

Step 1: Create a live input

Create a new live input from the Stream Dashboard or use use the Stream API:

Request

curl -X POST \
-H "Authorization: Bearer <YOUR_API_TOKEN>" \
-d "{"recording": { "mode": "automatic" } }" \
https://api.cloudflare.com/client/v4/accounts/<YOUR_CLOUDFLARE_ACCOUNT_ID>/stream/live_inputs

Response

{
"result": {
"uid": "<UID_OF_YOUR_LIVE_INPUT>",
"rtmps": {
"url": "rtmps://live.cloudflare.com:443/live/",
"streamKey": "<PRIVATE_RTMPS_STREAM_KEY>"
},
...
}
}

Step 2: Use the RTMPS key with any live broadcasting software, or in your own native app

Copy the RTMPS URL and key, and use them with your live streaming application. We recommend using Open Broadcaster Software (OBS) to get started, but any RTMPS or SRT compatible software should be able to interoperate with Stream Live.

Enter the Stream RTMPS URL and the Stream Key from Step 1:

Stream Live is now Generally Available

Step 3: Preview your live stream in the Cloudflare Dashboard

In the Stream Dashboard, within seconds of going live, you will see a preview of what your viewers will see, along with the real-time connection status of your live stream.

Stream Live is now Generally Available

Step 4: Add live video playback to your website or app

Stream your video using our Stream Player embed code, or use any video player that supports HLS or DASH — live streams can be played in both websites or native iOS and Android apps.

For example, on iOS, all you need to do is provide AVPlayer with the URL to the HLS manifest for your live input, which you can find via the API or in the Stream Dashboard.

import SwiftUI
import AVKit

struct MyView: View {
    // Change the url to the Cloudflare Stream HLS manifest URL
    private let player = AVPlayer(url: URL(string: "https://customer-9cbb9x7nxdw5hb57.cloudflarestream.com/8f92fe7d2c1c0983767649e065e691fc/manifest/video.m3u8")!)

    var body: some View {
        VideoPlayer(player: player)
            .onAppear() {
                player.play()
            }
    }
}

struct MyView_Previews: PreviewProvider {
    static var previews: some View {
        MyView()
    }
}

To run a complete example app in XCode, follow this guide in the Stream Developer docs.

Companies are building whole new video platforms on top of Stream

Developers want control, but most don’t have time to become video experts. And even video experts building innovative new platforms don’t want to manage live streaming infrastructure.

Switcher Studio’s whole business is live video — their iOS app allows creators and businesses to produce their own branded, multi camera live streams. Switcher uses Stream as an essential part of their live streaming infrastructure. In their own words:

“Since 2014, Switcher has helped creators connect to audiences with livestreams. Now, our users create over 100,000 streams per month. As we grew, we needed a scalable content delivery solution. Cloudflare offers secure, fast delivery, and even allowed us to offer new features, like multistreaming. Trusting Cloudflare Stream lets our team focus on the live production tools that make Switcher unique.”

While Stream Live has been in beta, we’ve worked with many customers like Switcher, where live video isn’t just one product feature, it is the core of their product. Even as experts in live video, they choose to use Stream, so that they can focus on the unique value they create for their customers, leaving the infrastructure of ingesting, encoding, recording and delivering live video to Cloudflare.

Start building live video into your website or app today

It takes just a few minutes to sign up and start your first live stream, using the Cloudflare Dashboard, with no code required to get started, but APIs for when you’re ready to start building your own live video features. Give it a try — we’re ready for you, no matter the size of your audience.

R2 is now Generally Available

Post Syndicated from Aly Cabral original https://blog.cloudflare.com/r2-ga/

R2 is now Generally Available

R2 is now Generally Available

R2 gives developers object storage, without the egress fees. Before R2, cloud providers taught us to expect a data transfer tax every time we actually used the data we stored with them. Who stores data with the goal of never reading it? No one. Yet, every time you read data, the egress tax is applied. R2 gives developers the ability to access data freely, breaking the ecosystem lock-in that has long tied the hands of application builders.

In May 2022, we launched R2 into open beta. In just four short months we’ve been overwhelmed with over 12k developers (and rapidly growing) getting started with R2. Those developers came to us with a wide range of use cases from podcast applications to video platforms to ecommerce websites, and users like Vecteezy who was spending six figures in egress fees. We’ve learned quickly, gotten great feedback, and today we’re excited to announce R2 is now generally available.

We wouldn’t ask you to bet on tech we weren’t willing to bet on ourselves. While in open beta, we spent time moving our own products to R2. One such example, Cloudflare Images, proudly serving thousands of customers in production, is now powered by R2.

What can you expect from R2?

S3 Compatibility

R2 gives developers a familiar interface for object storage, the S3 API. WIth S3 Compatibility, you can easily migrate your applications and start taking advantage of what R2 has to offer right out of the gate.

Let’s take a look at some basic data operations in javascript. To try this out on your own, you’ll need to generate an Access Key.

// First we import our bindings as usual
import {
  S3Client,
  ListBucketsCommand,
} from "@aws-sdk/client-s3";

// Then we create a new client. Note that while R2 requires a region for S3 compatibility, only “auto” is supported
const S3 = new S3Client({
  region: "auto",
  endpoint: `https://${ACCOUNT_ID}.r2.cloudflarestorage.com`,
  credentials: {
    accessKeyId: ACCESS_KEY_ID, //  fill in your own
    secretAccessKey: SECRET_ACCESS_KEY, // fill in your own
  },
});

// And now we can use our client to list associated buckets just like we would with any other S3 compatible object storage
console.log(
  await S3.send(
    new ListBucketsCommand('')
  )
);

Regardless of the language, the S3 API offers familiarity. We have examples in Go, Java, PHP, and Ruby.

Region: Automatic

We don’t want to live in a world where developers are spending time looking into a crystal ball and predicting where application traffic might come from. Choosing a region as the first step in application development forces optimization decisions long before the first users show up.

While S3 compatibility requires you to specify a region, the only region we support is ‘auto’. Today, R2 automatically selects a bucket location in the closest available region to the create bucket request. If I create a bucket from my home in Austin, that bucket will live in the closest available R2 region to Austin.

In the future, R2 will use data access patterns to automatically optimize where data is stored for the best user experience.

Cloudflare Workers Integration

The Workers platform offers developers powerful compute across Cloudflare’s network. When you deploy on Workers, your code is deployed to Cloudflare’s 280+ locations across the globe, automatically. When paired with R2, Workers allows developers to add custom logic around their data without any performance overhead. Workers is built on isolates and not containers, and as a result you don’t have to deal with lengthy cold starts.

Let’s try creating a simple REST API for an R2 bucket! First, create your bucket and then add an R2 binding to your worker.

export default {
  async fetch(request, env) {
    const url = new URL(request.url);
    const key = url.pathname.slice(1); // we’ll derive a key from the url path

    switch (request.method) {
      // For writes, we capture the request body and write that out to our bucket under the associated key
      case 'PUT':
        await env.MY_BUCKET.put(key, request.body);
        return new Response(`Put ${key} successfully!`);

      // For reads, we’ll use our key to perform a lookup
      case 'GET':
        const object = await env.MY_BUCKET.get(key);

        // if we don’t find the given key we’ll return a 404 error
        if (object === null) {
          return new Response('Object Not Found', { status: 404 });
        }

        const headers = new Headers();
        object.writeHttpMetadata(headers);
        headers.set('etag', object.httpEtag);

        return new Response(object.body, {
          headers,
        });
    }
  },
};

Through this Workers API, we can add all sorts of useful logic to the hot path of a R2 request.

Presigned URLs

Sometimes you’ll want to give your users permissions to specific objects in R2 without requiring them to jump through hoops. Through pre-signed URLs you can delegate your permissions to your users for any unique combination of object and action. Mint a pre-signed URL to let a user upload a file or share a file without giving access to the entire bucket.

import {
  S3Client,
  PutObjectCommand
} from "@aws-sdk/client-s3";

import { getSignedUrl } from "@aws-sdk/s3-request-presigner";

const S3 = new S3Client({
  region: "auto",
  endpoint: `https://${ACCOUNT_ID}.r2.cloudflarestorage.com`,
  credentials: {
    accessKeyId: ACCESS_KEY_ID,
    secretAccessKey: SECRET_ACCESS_KEY,
  },
});

// With getSignedUrl we can produce a custom url with a one hour expiration which will allow our end user to upload their dog pic
console.log(
  await getSignedUrl(S3, new PutObjectCommand({Bucket: 'my-bucket-name', Key: 'dog.png'}), { expiresIn: 3600 })
)

Presigned URLs make it easy for developers to build applications that let end users safely access R2 directly.

Public buckets

Enabling public access for a R2 bucket allows you to expose that bucket to unauthenticated requests. While doing so on its own is of limited use, when those buckets are linked to a domain under your account on Cloudflare you can enable other Cloudflare features such as Access, Cache and bot management seamlessly on top of your data in R2.

Bottom line: public buckets help to bridge the gap between domain oriented Cloudflare features and the buckets you have in R2.

Transparent Pricing

R2 will never charge for egress. The pricing model depends on three factors alone: storage volume, Class A operations (writes, lists) and Class B operations (reads).

  • Storage is priced at $0.015 / GB, per month.
  • Class A operations cost $4.50 / million.
  • Class B operations cost $0.36 / million.

But before you’re ready to start paying for R2, we allow you to get up and running at absolutely no cost. The included usage is as follows:

  • 10 GB-months of stored data
  • 1,000,000 Class A operations, per month
  • 10,000,000 Class B operations, per month

What’s next?

Making R2 generally available is just the beginning of our object storage journey. We’re excited to share what we plan to build next.

Object Lifecycles

In the future R2 will allow developers to set policies on objects. For example, setting a policy that deletes an object 60 days after it was last accessed. Object Lifecycles pushes object management down to the object store.

Jurisdictional Restrictions

While we don’t have plans to support regions explicitly, we know that data locality is important for a good deal of compliance use cases. Jurisdictional restrictions will allow developers to set a jurisdiction like the ‘EU’ that would prevent guarantee data from leavingwould not leave the jurisdiction.

Live Migration without Downtime

For large datasets, migrations are live and ongoing, as it takes time to move data over. Cache reserve is an easy way to quickly migrate your assets into a managed R2 instance to reduce your egress costs at the touch of a button. In the future, we’ll be extending this mechanism so that you can migrate any of your existing S3 object storage buckets to R2.

We invite everyone to sign up and get started with R2 today. Join the growing community of developers building on Cloudflare. If you have any feedback or questions, find us on our Discord server here! We can’t wait to see what you build.

Automatic Cheating Detection in Human Racing

Post Syndicated from Bruce Schneier original https://www.schneier.com/blog/archives/2022/09/automatic-cheating-detection-in-human-racing.html

This is a fascinating glimpse of the future of automatic cheating detection in sports:

Maybe you heard about the truly insane false-start controversy in track and field? Devon Allen—a wide receiver for the Philadelphia Eagles—was disqualified from the 110-meter hurdles at the World Athletics Championships a few weeks ago for a false start.

Here’s the problem: You can’t see the false start. Nobody can see the false start. By sight, Allen most definitely does not leave before the gun.

But here’s the thing: World Athletics has determined that it is not possible for someone to push off the block within a tenth of a second of the gun without false starting. They have science that shows it is beyond human capabilities to react that fast. Of course there are those (I’m among them) who would tell you that’s nonsense, that’s pseudoscience, there’s no way that they can limit human capabilities like that. There is science that shows it is humanly impossible to hit a fastball. There was once science that showed human beings could not run a four-minute mile.

Besides, do you know what Devon Allen’s reaction time was? It was 0.99 seconds. One thousandth of a second too fast, according to World Athletics’ science. They’re THAT sure that .01 seconds—and EXACTLY .01 seconds—is the limit of human possibilities that they will disqualify an athlete who has trained his whole life for this moment because he reacted one thousandth of a second faster than they think possible?

We in the computer world are used to this sort of thing. “The computer is always right,” even when it’s obviously wrong. But now computers are leaving the world of keyboards and screens, and this sort of thing will become more pervasive. In sports, computer systems are used to detect when a ball is out of bounds in tennis and other games and when a pitch is a strike in baseball. I’m sure there’s more—are computers detecting first downs in football?—but I’m not enough of a sports person to know them.

Юбилейното издание на надпреварата дава още една възможност за участие – чрез видео разказ Център „Алеф” обявява Десетия международен литературен ученически конкурс „Който спаси един човешки живот, спасява цяла вселена”

Post Syndicated from original https://bivol.bg/%D1%86%D0%B5%D0%BD%D1%82%D1%8A%D1%80-%D0%B0%D0%BB%D0%B5%D1%84-%D0%BE%D0%B1%D1%8F%D0%B2%D1%8F%D0%B2%D0%B0-%D0%B4%D0%B5%D1%81%D0%B5%D1%82%D0%B8%D1%8F-%D0%BC%D0%B5%D0%B6%D0%B4%D1%83-2.html

сряда 21 септември 2022


Център за еврейско-българско сътрудничество „Алеф” дава старт на Десетия международен литературен ученически конкурс „Който спаси един човешки живот, спасява цяла вселена”. Десетият конкурс на „Алеф”  е посветен на 80-та годишнина…

The collective thoughts of the interwebz