Post Syndicated from LastWeekTonight original https://www.youtube.com/watch?v=1d1_wPJqeIY
Firefox 153 released
Post Syndicated from jzb original https://lwn.net/Articles/1083981/
Version
153.0 of the Firefox web browser has been released. Notable
changes in this release include a change to the default
local-file-access permissions for extensions, enabling LAN
restrictions by default for all users, a visual indicator when a web
site has access to the user’s location, the ability to merge PDFs and
add images as pages within PDFs, as well as experimental support for
the JPEG XL image format.
See the
release
notes for developers for all changes that affect web developers,
and security
advisories for vulnerabilities fixed in this release.
Diving Deeper on NVIDIA’s Vera CPU: New Architectural Details and SPEC CPU 2026 Benchmarks
Post Syndicated from Ryan Smith original https://www.servethehome.com/diving-deeper-on-nvidias-vera-cpu-new-architectural-details-and-spec-cpu-2026-benchmarks/
NVIDIA this morning has released a trove of new technical details on Vera, their upcoming server CPU, as well as the Olympus CPU core. The company is also publishing the first SPEC CPU 2026 benchmarks, giving us our best look yet at the performance of the chip
The post Diving Deeper on NVIDIA’s Vera CPU: New Architectural Details and SPEC CPU 2026 Benchmarks appeared first on ServeTheHome.
R2 is now Generally Available
Post Syndicated from Aly Cabral original https://blog.cloudflare.com/r2-ga/
R2 gives developers object storage, without the egress fees. Before R2, cloud providers taught us to expect a data transfer tax every time we actually used the data we stored with them. Who stores data with the goal of never reading it? No one. Yet, every time you read data, the egress tax is applied. R2 gives developers the ability to access data freely, breaking the ecosystem lock-in that has long tied the hands of application builders.
In May 2022, we launched R2 into open beta. In just four short months we’ve been overwhelmed with over 12k developers (and rapidly growing) getting started with R2. Those developers came to us with a wide range of use cases from podcast applications to video platforms to ecommerce websites, and users like Vecteezy who was spending six figures in egress fees. We’ve learned quickly, gotten great feedback, and today we’re excited to announce R2 is now generally available.
We wouldn’t ask you to bet on tech we weren’t willing to bet on ourselves. While in open beta, we spent time moving our own products to R2. One such example, Cloudflare Images, proudly serving thousands of customers in production, is now powered by R2.
What can you expect from R2?
S3 Compatibility
R2 gives developers a familiar interface for object storage, the S3 API. With S3 Compatibility, you can easily migrate your applications and start taking advantage of what R2 has to offer right out of the gate.
Let’s take a look at some basic data operations in javascript. To try this out on your own, you’ll need to generate an Access Key.
Regardless of the language, the S3 API offers familiarity. We have examples in Go, Java, PHP, and Ruby.
Region: Automatic
We don’t want to live in a world where developers are spending time looking into a crystal ball and predicting where application traffic might come from. Choosing a region as the first step in application development forces optimization decisions long before the first users show up.
While S3 compatibility requires you to specify a region, the only region we support is ‘auto’. Today, R2 automatically selects a bucket location in the closest available region to the create bucket request. If I create a bucket from my home in Austin, that bucket will live in the closest available R2 region to Austin.
In the future, R2 will use data access patterns to automatically optimize where data is stored for the best user experience.
Cloudflare Workers Integration
The Workers platform offers developers powerful compute across Cloudflare’s network. When you deploy on Workers, your code is deployed to Cloudflare’s more than 275 locations across the globe, automatically. When paired with R2, Workers allows developers to add custom logic around their data without any performance overhead. Workers is built on isolates and not containers, and as a result you don’t have to deal with lengthy cold starts.
Let’s try creating a simple REST API for an R2 bucket! First, create your bucket and then add an R2 binding to your worker.
Through this Workers API, we can add all sorts of useful logic to the hot path of a R2 request.
Presigned URLs
Sometimes you’ll want to give your users permissions to specific objects in R2 without requiring them to jump through hoops. Through pre-signed URLs you can delegate your permissions to your users for any unique combination of object and action. Mint a pre-signed URL to let a user upload a file or share a file without giving access to the entire bucket.
Presigned URLs make it easy for developers to build applications that let end users safely access R2 directly.
Public buckets
Enabling public access for a R2 bucket allows you to expose that bucket to unauthenticated requests. While doing so on its own is of limited use, when those buckets are linked to a domain under your account on Cloudflare you can enable other Cloudflare features such as Access, Cache and bot management seamlessly on top of your data in R2.
Bottom line: public buckets help to bridge the gap between domain oriented Cloudflare features and the buckets you have in R2.
Transparent Pricing
R2 will never charge for egress. The pricing model depends on three factors alone: storage volume, Class A operations (writes, lists) and Class B operations (reads).
- Storage is priced at $0.015 / GB, per month.
- Class A operations cost $4.50 / million.
- Class B operations cost $0.36 / million.
But before you’re ready to start paying for R2, we allow you to get up and running at absolutely no cost. The included usage is as follows:
- 10 GB-months of stored data
- 1,000,000 Class A operations, per month
- 10,000,000 Class B operations, per month
What’s next?
Making R2 generally available is just the beginning of our object storage journey. We’re excited to share what we plan to build next.
Object Lifecycles
In the future R2 will allow developers to set policies on objects. For example, setting a policy that deletes an object 60 days after it was last accessed. Object Lifecycles pushes object management down to the object store.
Jurisdictional Restrictions
While we don’t have plans to support regions explicitly, we know that data locality is important for a good deal of compliance use cases. Jurisdictional restrictions will allow developers to set a jurisdiction like the ‘EU’ that would prevent data from leaving the jurisdiction.
Live Migration without Downtime
For large datasets, migrations are live and ongoing, as it takes time to move data over. Cache reserve is an easy way to quickly migrate your assets into a managed R2 instance to reduce your egress costs at the touch of a button. In the future, we'll be extending this mechanism so that you can migrate any of your existing S3 object storage buckets to R2.
We invite everyone to sign up and get started with R2 today. Join the growing community of developers building on Cloudflare. If you have any feedback or questions, find us on our Discord server here! We can’t wait to see what you build.
Watch on Cloudflare TV
[$] Debating the role of large language models in the kernel community
Post Syndicated from corbet original https://lwn.net/Articles/1083275/
Like many development communities, the kernel community has been struggling
to determine how large language models will be used in its development
process. The news has been dominated recently by a strongly worded missive
from Linus Torvalds on the subject, but the discussion has been rather more
wide-ranging and nuanced than that. Topics that have been considered
recently include the LLM attribution requirement, code-review tools,
dependence on proprietary tools, and whether there is a place for concerns
about the ethics of LLMs.
Какво (не) знаем за сексуалните злоупотреби с деца
Post Syndicated from original https://www.toest.bg/kakvo-ne-znaem-za-seksualnite-zloupotrebi-s-detsa/

През лятото на 2023 г. бяха приети изменения в Закона за закрила на детето (ЗЗД), според които се създават Национална информационна система за превенция и защита от педофилия и Национален регистър за случаите на педофилия. В началото на 2026 г. се прие поправка, с която достъпът до регистъра става публичен. До този момент обаче не може да се намери такъв регистър, нито информация как да се стигне до него.
Според вносителите на двете предложения в България съществува проблем с повишаващия се брой сексуални посегателства над деца, а вписването на извършителите в единна информационна система е най-добрият вариант за превенция. Целта е гражданите да могат да се информират дали в обкръжението им има потенциално опасни хора. Всичко се прави „за доброто на българските деца“.
Наистина ли им пука за децата?
Светла Енчева с паралел между два нашумели случая, в които са намесени деца. В единия ги намесиха от „голяма загриженост“, но без реална нужда, институциите и политиците, а в другия пак институциите и политиците си затварят очите за истинския проблем – насилие над малко дете от учителката му.
Какво обаче са сексуалните посегателства над деца от гледна точка на закона? С каква информация разполага държавата за тях? И ще се реши ли проблемът с един публичен регистър?
Педофилията според българското законодателство
За вносителите от „Възраждане“ „педофилия“ е всяко престъпление по раздел VIII (озаглавен „Разврат“) в глава II от Наказателния кодекс (НК). Адвокат Силвия Петкова обаче, с която „Тоест“ разговаря, е на друго мнение. Тя обръща внимание, че понятието е не правен, а медицински термин и че за него не е посочена ясна дефиниция в НК, в който се описва само какви могат да бъдат пострадалите малолетни и непълнолетни.
Кои са педофилите?
Макар в НК да не става дума за това, по логиката на „Възраждане“ педофили би следвало да са осъдените по раздел VIII за престъпления срещу малолетни и непълнолетни. С тази подробност, че както пострадалите, така и извършителите могат да са малолетни или непълнолетни. Според разпоредбите в ЗЗД, където са описани функциите на т.нар. регистър, в него се вписват „актовете на сексуално посегателство срещу малолетни и непълнолетни, по които има постановени присъди“. По тази логика, ако 17-годишен ученик изнасили своя 15-годишна съученичка и има влязла в сила присъда, той ще бъде вписан в регистъра на педофилите, тъй като е извършил престъпление спрямо непълнолетно лице.
Следва обаче да се прави разлика между изнасилване и престъпно съвкупление, обръща внимание адв. Петкова. При първото е приложена сила, а пострадалият или е в безпомощно състояние, или е приведен в такова. Престъпното съвкупление се извършва спрямо лице ненавършило 16 години, без да са налице горните обстоятелства. Но то отново ще се води престъпление, тъй като според закона лицата под тази възраст не могат да дадат съгласие за секс. Следователно, в случай че 14-годишен се съвкупи с 15-годишна по взаимно съгласие, може да се започне наказателна процедура срещу него, ако се прецени, че е бил наясно какво върши. И ако съдът го признае за виновен, ще бъде вписан в регистъра. По същата логика впрочем на съд може да бъде дадено и момичето.
Този абсурд може да се избегне с въвеждане на долна граница за възрастовата разлика между партньорите – например партньорите на тийнейджъри на 14–15 години да не може да са с повече от 5 години по-възрастни от тях или пък да са навършили пълнолетие. Въпреки липсата на разлика в годините за българското законодателство адв. Петкова посочва, че може да се прецени за всеки отделен случай индивидуално наличието или липсата на обществена опасност.
С новите промени в НК възрастта за съгласие се вдигна до 16 години вместо досегашните 14. Ограничението на възрастта има за цел да предпази децата от сексуална злоупотреба от страна на по-възрастни хора, смята Силвия Петкова, като в същото време го определя като „законодателна недомислица“. Според нея е от огромно значение дали извършителят е пълнолетен, или не. При пълнолетните лица има неравнопоставеност в опита, интелектуалното и емоционалното развитие спрямо подрастващите и те може да се възползват от незрелостта им. При непълнолетните тази асиметрия липсва.
Ако законът третира като тежки престъпници абсолютно всички тийнейджъри, които изследват своята сексуалност помежду си по взаимно съгласие, това би означавало да се криминализира естествено човешко поведение. Вместо да защити младежите, държавата би съсипала живота им с присъди и съдебни досиета в най-ранна възраст,
казва Петкова и добавя, че в много държави съществуват т.нар. Romeo and Juliet закони, според които, ако и двамата партньори са под възрастта на съгласие, деянието не се криминализира.
Педофилия и домашно насилие
Първоначално предложението за регистър на педофилите (впоследствие оттеглено от вносителите от „Възраждане“) е предвидено да влезе в Закона за защита от домашното насилие. В мотивите вносителите отбелязват:
Има случаи, в които насилието срещу детето е предизвикано и съпроводено от насилие срещу майката. […] Именно затова е тясна и неразривна връзката между педофилията, в частност инцестът [сексуална връзка между роднини – б.а.] от една страна и домашното насилие, от друга.
Посочва се и че един от факторите за нарастващия брой сексуални престъпления срещу деца са „дисфункционални семейства“.
Често извършителите са членове на семейството и в по-голяма степен са мъже – баща, пастрок, дядо, чичо, разказа пред „Тоест“ Стела Билева, психоложка към Асоциация „Анимус“. Наблюдава се и разлика в подходите на насилниците спрямо възрастта на детето. Когато пострадалият е между 11–14-годишна възраст, подходът е по-фин и манипулативен, а извършителите рядко прибягват до директна принуда. Децата в тази възраст могат ясно да разказват за преживяванията си, затова извършителите
се представят за подкрепящ детето възрастен, някой, с когото те могат да споделят, някой, който много се интересува от това дете. И лека-полека почват да тестват границите, докато извършат най-рязката злоупотреба,
казва Билева и добавя, че този тип извършители се представят за „много мили, много хрисими, много добри хора“. Така, ако някога детето проговори, е много вероятно да не му повярват заради положителната обществена репутация на извършителя. В тази връзка Билева припомня класическия стереотип „Но той беше много добър съсед, винаги поздравяваше“.
Агресивно поведение от страна на насилника според психоложката се среща в семейства, в които сексуалната злоупотреба е извършена спрямо дете под 10-годишна възраст,
особено когато злоупотребата се случва в рамките на семейството. При по-малките деца извършителите са по-склонни да използват пряка принуда, тъй като разчитат на възрастовите особености на детето и ограничената му способност да разбере и разкаже за преживяното.
Разследване и присъди
По данни на Висшия съдебен съвет (ВСС), които „Тоест“ получи по Закона за достъп до обществена информация (ЗДОИ), 106 души са съдени за блудство с малолетни и непълнолетни в районните съдилища през 2024 г. От тях с осъдителна присъда са 85, 9 от които са непълнолетни. Лишаване от свобода до 3 години са получили 76 души, вкл. 40 условно. Четирима са получили между 3 и 15 години лишаване от свобода, а петима – пробация.
Данните на районните съдилища за 2025 г. включват 56 осъдени за блудство с малолетно лице, сред които трима непълнолетни. На лишаване от свобода до 3 години са осъдени 51 души, 38 от тях – условно. Двама получават присъда от 3 до 15 години, трима са с пробация и двама – със споразумение. За блудство с непълнолетно лице са осъдени 35 души, като двама са непълнолетни. От тях 31 са с присъда до 3 години, 20 от тях – условни. Трима са лишени от свобода до 15 години, а един е наказан с глоба.
От тези данни следва, че ако регистърът на случаите на педофилия се прилага, само за 2024 и 2025 г. 14 от включените „педофили“ в него биха били все още деца.
| Година | Престъпления по раздел VIII от НК („Разврат“) | Осъдени непълнолетни |
|---|---|---|
| 2024 | Блудство с лице, ненавършило 14 г. | 8 |
| Блудство с лице, навършило 14 г. | 1 | |
| 2025 | Блудство с лице, ненавършило 14 г. | 3 |
| Блудство с лице, навършило 14 г. | 2 | |
| Общо | 14 | |
Окръжните съдилища са осъдили 9 души за блудство с малолетно лице през 2025 г., като от тях трима са лишени от свобода до 3 години, но две от присъдите са условни. Четирима получават до 10 години, а двама – до 30 години лишаване от свобода. През 2024 г. са осъдени 11 души: трима – до 3 години, един от тях – условно. Лишените от свобода до 10 години са 7, а един е осъден на между 10 и 30 години.
Продължителността на наказателното производство се смята за смекчаващо отговорността обстоятелство, смята Силвия Петкова. Тоест някои присъди са по-ниски, защото наказателното производство срещу тях е продължило твърде дълго. С други думи, тези присъди са
форма на компенсация в полза на извършителя за нарушаването на правото му наказателното дело да завърши в „разумен срок“ – основно човешко право съгласно Европейската конвенция за защита правата на човека.
Ниските присъди обаче не се отразяват добре на пострадалите, които имат нужда да знаят, че са получили някаква справедливост, смята Стела Билева. Според нея те забавят възстановяването след преживяното и могат да се превърнат в спирачка за сигнализиране на престъпления в бъдеще. Разпитите в т.нар. сини стаи може допълнително да травматизират децата, въпреки че идеята на сините стаи е да предоставят щадяща среда. Експертите препоръчват тези разпити да са сведени до минимум, а в идеалния случай разпитът да е само един. В България обаче се правят често между два и три: един, когато се разбере за престъплението – т.нар. беседа в полицията, още един в досъдебното производство и е възможно да има трети по време на делото, ако съдията прецени, казаха и Билева, и Петкова.
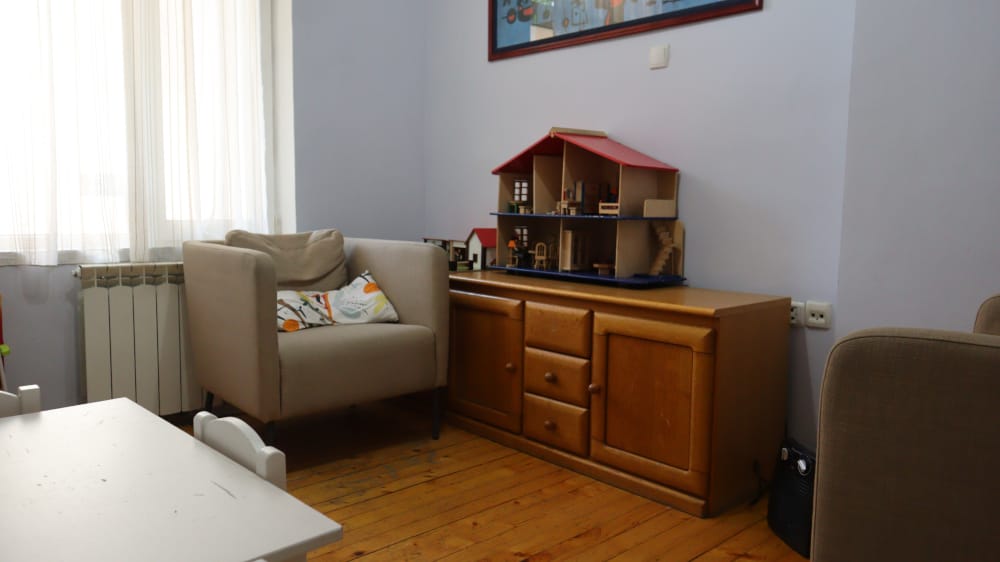

Синя стая © Теодора Станимирова
Какво знаят институциите?
Освен от ВСС, „Тоест“ изиска по ЗДОИ информация, свързана със сексуалните престъпления срещу деца, и от МВР, Агенцията за социално подпомагане (АСП), Министерството на здравеопазването (МЗ) и Държавната агенция за закрила на детето (ДАЗД).
По данни на МВР през 2024 и 2025 г. общият брой малолетни, за които е подаван сигнал, е 530. По-малко са сигналите за непълнолетни – 310. През първите 5 месеца на 2026 г. са подадени сигнали за 146 малолетни и 87 непълнолетни.
Данните на МВР се отнасят само до случаи, в които е подаден сигнал за пострадало дете. Не се знае колко са недокладваните сексуални престъпления срещу малолетни и непълнолетни. Концепциите за „разврат“, „блудствени действия“ и „насилствен хомосексуализъм“ не са осъвременени в НК и затова днес звучат неестествено и неразбираемо.
| Престъпления по раздел VIII от НК („Разврат“) |
2024 и 2025 г. | Януари–май 2026 г. | ||
|---|---|---|---|---|
| За малолетни | За непълнолетни | За малолетни | За непълнолетни | |
| Изнасилване | 16 | 43 | 5 | 6 |
| Опит за изнасилване | 1 | – | – | – |
| Блудствени действия | 189 | 77 | 37 | 20 |
| Разврат | 304 | 171 | 88 | 53 |
| Сводничество и отвличане за разврат |
11 | 11 | 14 | 6 |
| Насилствен хомосексуализъм | 9 | 8 | 2 | 2 |
| Общо | 530 | 310 | 146 | 87 |
АСП е регистрирала 1079 пострадали от домашно насилие през 2024 г. От тях 757 са били деца, което е малко над 70%. През 2025 г. са идентифицирани 1051 пострадали от домашно насилие, като 679 (близо 65%) са били деца. За първите три месеца на 2026 г. са установени 254 случая на домашно насилие и 200 пострадали деца (почти 79% от случаите).
| Година | Дял на децата |
|---|---|
| 2024 | 70,56% |
| 2025 | 64,61% |
| Януари–март 2026 | 78,74% |
Интересно е с какви данни институциите не разполагат.
МВР не успя да отговори – защото не събира такава информация – на въпросите: в колко от случаите извършител е бил роднина или член на семейството, дали сигналът за насилие над дете е бил предхождан от сигнали за домашно насилие в дома и колко от осъдените са включени в Националния регистър на случаите на педофилия.
Нито АСП, нито МВР водят статистика за пола на пострадалото дете. Следователно не е ясно какъв е профилът на извършителя, нито този на пострадалия, не се знае в какво домакинство са живели и каква е връзката между тях. Вносителите на законопроекта за педофилия твърдят, че тези случаи се наблюдават в условия на домашно насилие, но МВР не може да подкрепи това твърдение с данни, а е видно, че най-често пострадали от домашно насилие са децата. Не е задължително обаче, както отбелязва и Стела Билева, пострадалото дете да живее в условия на домашно насилие.
Как институциите (не) идентифицират сексуалната злоупотреба с деца?
МЗ разполага с данни за общо 10 007 раждания на момичета, ненавършили пълнолетие, в периода от 2022 г. до началото на юни 2026 г. От тях 861 са на малолетни родилки, като най-младите майки са на 11 години – и петте раждания на тези момичета са в периода 2022–2023 г. Сексуалните контакти с лице под 14-годишна възраст са забранени от НК, следователно всички тези 861 раждания са знак за извършено престъпление. Ражданията от 15-годишни майки са 1580. Следователно след промените в НК, според които сексуалните контакти с лица под 16 години са незаконни, тези раждания също са доказателство за нарушаване на закона.
| Възраст | Брой раждания | ||||
|---|---|---|---|---|---|
| 2022 г. | 2023 г. | 2024 г. | 2025 г. | Ян.–юни 2026 г. |
|
| 11 г. | 1 | 4 | – | – | – |
| 12 г. | 3 | 5 | 3 | 1 | 1 |
| 13 г. | 24 | 33 | 30 | 30 | 17 |
| 14 г. | 83 | 196 | 180 | 175 | 75 |
| 15 г. | 194 | 488 | 527 | 471 | 192 |
| 16 г. | 332 | 811 | 820 | 854 | 311 |
| 17 г. | 462 | 1086 | 1122 | 1045 | 431 |
| Общо | 1099 | 2623 | 2682 | 2576 | 1027 |
В действащото законодателство не е предвидена правна норма, която да въвежда задължение на медицинските специалисти да сигнализират органите на Министерството на вътрешните работи при постъпване на родилка под 16 години и под 14 години в лечебно заведение,
подчертаха от МЗ. И добавиха, че в задълженията им влиза информиране на Дирекция „Социално подпомагане“ за всяко дете, родено в лечебно заведение, за което съществува риск от изоставяне. Това включва случаи с майки без документ за самоличност, самотни, многодетни и майки с увреждания или множество заболявания. Здравните специалисти са длъжни и да уведомят за дете, пострадало от насилие, и за такова, за което преценят, че се нуждае от закрила.
ДАЗД поддържа Националната телефонна линия за деца – 116 111. Разговорите, свързани със сексуално посегателство спрямо дете, са 122 за 2024 г., 109 за 2025 г. и 47 за първите 6 месеца на 2026 г. И тази институция, също като МВР и АСП, не събира и не обработва информация за връзката между извършител и пострадал.
При постъпване на информация за сексуално посегателство над дете се образува сигнал, който се изпраща до МВР, отдел „Закрила на детето“ и Дирекция „Социално подпомагане“. За периода 2024–2025 г. са извършени 14 проверки по сигнали за нарушени права, подадени на телефонната линия. За първите три месеца на 2026 г. проверките са две. Това означава, че за огромната част от сигналите за 2024 и 2025 г. – общо 262, или близо 94% – не е извършена проверка.
„Зона ЗаКрила“ предлага психологическа подкрепа, юридическа помощ и застъпничество на деца, преживели насилие, и техните родители. Услугата е държавно делегирана, безплатна и се предоставя от Асоциация „Анимус“. До тях може да се стигне чрез молба в отдел „Закрила на детето“ за издаване на насочващ документ. При телефонен разговор с рецепцията, кризисния център или Националната гореща телефонна линия за пострадали от насилие случаят се насочва към отдел „Закрила на детето“ за документ и се разпределя, за да започне работа по случая в „Зона ЗаКрила“.
Не може да се осъществи превенция на проблем, който не познаваме.
Борбата с педофилията е приела истерична форма, при която държавата дори не се опитва трезво да проучи проблема и да предложи информирана политика за превенция. Единственият източник на „Тоест“ например, който потвърди връзката между домашно насилие и сексуални злоупотреби с деца, работи в неправителствения сектор. Вместо това институционалните усилия за спиране на сексуалната злоупотреба с деца се изчерпват с публичен регистър на осъдените, който всъщност не е публичен. И може да включва малолетни и непълнолетни, каквито уж защитава. Наказанията за извършителите са ниски, докато на пострадалите се налага да изживяват травмата неколкократно – по време на делото и след това.
Не съществува и механизъм за защита на малолетни родилки, които също са деца в риск и може да са пострадали от сексуални злоупотреби. Подаването на сигнал до компетентните институции невинаги води до проверки в семейството, което се оказва най-сериозната заплаха за детето.
Какво коментират експерти по отношение на превенцията на сексуалните престъпления срещу деца, какви са знаците, че едно дете може да се намира в ситуация на насилие, и какви са обществените и институционалните реакции на подобни случаи, ще разгледаме в следващата статия по темата.
Security updates for Tuesday
Post Syndicated from jzb original https://lwn.net/Articles/1083948/
Security updates have been issued by AlmaLinux (capstone, fence-agents, gimp, glib2, hplip, httpd, jackson-annotations, jackson-core, jackson-databind, jackson-jaxrs-providers, and jackson-modules-base, libtiff, maven:3.8, pacemaker, python3.14, and webkit2gtk3), Debian (samba), Fedora (c-ares, dnsx, freerdp, gpsd, libreswan, libseccomp, libtiff, mingw-python-idna, mingw-python-pip, openssh, python-pillow, wget1, and wireshark), Mageia (golang, graphicsmagick, haveged, libssh2, nginx, nilfs-utils, perl-CGI-Session, perl-Imager, perl-JavaScript-Minifier-XS, php, php8.4, php8.5, python-nltk, sqlite3, and xmlstarlet), Oracle (.NET 10.0, .NET 9.0, container-tools:ol8, firefox, giflib, glibc, go-fdo-client, go-fdo-server, golang-github-openprinting-ipp-usb, grafana, grafana-pcp, hplip, httpd, image-builder, kernel, libtiff, mod_http2, pacemaker, perl-DBI:1.641, perl-HTTP-Daemon, php:8.2, python-markdown, ruby4.0, systemd, and thunderbird), Red Hat (buildah, container-tools:rhel8, dracut, golang-github-openprinting-ipp-usb, libtiff, osbuild-composer, python-urllib3, python3.12-urllib3, python3.14-urllib3, and runc), SUSE (389-ds, chromedriver, gstreamer-plugins-bad, libreoffice, libsuricata8_0_6, podman, python311, and sssd), and Ubuntu (apache2, freerdp3, freetype, libde265, libxfont, linux, linux-gcp, linux-gcp-6.8, linux-gke, linux-gkeop, linux-realtime, linux-realtime-6.8, linux, linux-gcp, linux-gcp-fips, linux-gke, linux-gkeop, linux-hwe-5.15, linux-kvm, linux-lowlatency, linux-lowlatency-hwe-5.15, linux-realtime, linux-xilinx-zynqmp, linux, linux-gcp, linux-gke, linux-realtime, linux-gcp-6.17, linux-realtime-6.17, linux-gcp-fips, linux-hwe-7.0, linux-nvidia-tegra-5.15, linux-oem-7.0, nginx, php8.1, php8.3, php8.5, rlottie, sqlite3, and wget).
Intel Foundry Nabs A Custom ASIC Win with Fortinet
Post Syndicated from Patrick Kennedy original https://www.servethehome.com/intel-foundry-nabs-a-custom-asic-win-with-fortinet-fortisp6-sp6/
Fortinet is the latest Intel Foundry customer as the companies disclosed that the FortiSP6 will be a collaboration with Intel
The post Intel Foundry Nabs A Custom ASIC Win with Fortinet appeared first on ServeTheHome.
How the 2026 World Cup affected Internet traffic
Post Syndicated from Sabina Zejnilovic original https://blog.cloudflare.com/2026-world-cup-internet-traffic/
For 96 years, the World Cup has been a global phenomenon, uniting nations and communities through a shared love of sportsmanship. While its popularity is nothing new, what is novel today is how rare a truly collective global experience has become. In an era defined by microtrends and algorithmic bubbles, it is increasingly uncommon for people across most countries to engage in the exact same event.
That is precisely the unifying power of the World Cup. Fans from all over the globe reshape their daily routines around these once-in-a-lifetime matchups and storylines — and because Cloudflare operates a global network with 330+ points of presence worldwide, we are in a unique position to see exactly how this global ritual reshaped the world’s online activity throughout June and July 2026.
Cloudflare Radar tracks HTTP traffic, DNS, security, and more to highlight global Internet trends. In this blog post we’ll use that data to explore how the World Cup impacted global traffic patterns throughout the tournament’s run.
How did the World Cup change our behavior online?
To understand how traffic changes throughout a match, we had to establish what it is “normally.” One way to do this is by looking at raw request volumes, or the amount of traffic we see on our network per country. But these amounts vary per country (the amount of daily traffic in the United States is always a larger number than the traffic in Portugal), which makes it difficult to establish a globally applicable baseline. Instead, we defined "normal" using the median traffic of the four preceding weeks: a month-long window that provided a stable, per-minute reference and smoothed out day-to-day noise.
We also wanted to know whether traffic rose or fell relative to that baseline, but a plain difference wouldn't let us compare a high-volume country against a low-volume one. Instead, we used the ratio of current to baseline traffic, expressed as a log₂ value: the log makes increases and decreases symmetric around zero (+1 = twice normal, −1 = half). In other words, a score of zero means traffic is perfectly normal, a positive number shows a spike, and a negative number shows a drop.
Whether you’re staying up late or waking up early, kickoff time impacts traffic
One factor shaping how traffic changes is simply what time the match kicks off locally. The largest changes in activity happen when a match is played in the overnight and early-morning hours — roughly midnight to 8am local time. These are the hours when very few people are normally online, so fans staying up (or waking early) to watch push traffic well above its usual level, more than doubling it in some cases. As the graph shows, this is where the deviation peaks on both workdays and weekends.
By contrast, matches played during normal daytime and working hours — around 9 a.m. to mid-afternoon — don’t show such an impact: traffic stays close to its usual level, likely because the people watching would already have been online anyway. In the early evening there's a smaller, second lift, most visible on weekdays, as a match keeps people connected at a time when usage would normally start to wind down. Weekends follow a similar shape, with the strong early-morning rise but a gentler evening bump.
The impact of kickoff time is easiest to see when comparing matches within a single country that take place at very different hours. Bosnia and Herzegovina provides a clear example. As seen in the graph shown above, when Bosnia played at 2 a.m. local time, people stayed awake to watch and traffic during the game jumped to well above its normal level, at times more than doubling. When Bosnia played in the evening, the opposite happened: traffic dipped below normal (falling to about 70% of typical value), as people put their devices aside and focused on the match itself.
When Brazil played Japan in the Round of 32 (Brazil won 2–1 on June 29, 2026), the two countries watched the very same game 12 hours apart: kickoff in Brasília (GMT−3) fell during normal waking hours in Rio de Janeiro (GMT−3), while in Tokyo (GMT+9) it landed in the dead of night.
The result is two nearly parallel curves for the same 90 minutes: one higher than normal, one lower. Japan's traffic (red) sits well above normal, around +1, roughly double its usual level, because the match aired in the small hours, when almost no one would ordinarily be online. Brazil's traffic (green), by contrast, runs below normal, around −0.4, as the game fell in the middle of an ordinary active day. In this case, watching the match pulled people away from their usual browsing rather than adding to it.
Which matches moved the Internet most?
One of the most compelling aspects of the World Cup is seeing which storylines and teams capture the attention of fans across the world. We’ve discussed how regional traffic patterns change as a result of matches. But who are they watching? Which matches made the most impact on Internet traffic?
Here's how we calculated this: for each match, we took the two-hour window after kickoff and, for every country with enough baseline traffic to give stable measurements (small, noisy markets are excluded), computed how far traffic strayed from normal. We then took the absolute value of each country's deviation, so we're measuring how much traffic changed, not in which direction (a surge and a drop both count as impact), and for each match we took the median of those absolute deviations across all countries. Because several group-stage matches were played simultaneously, making it impossible to attribute a country's traffic swing to one game or the other, we dropped those concurrent matches to avoid ambiguity.
The result is this ranking of the matches that moved the Internet most, worldwide. And there's a surprise: the very top spot wasn’t snagged by a final or semifinal. It was Argentina vs. Switzerland on July 11, a quarterfinal that saw Argentina win 3-1 — and that moved Internet traffic by a factor of about 1.26. That put it ahead of the France vs. Spain semifinal, which had a factor of 1.21. The rest of the top matches were a mix of quarterfinals, round-of-16 and even round-of-32 ties.
The teams that moved the Internet: Argentina, followed by France and Norway
To decide which team the world watched most, we looked at each team's matches and aggregated the median worldwide impact across all countries. In other words, when a given team took the field, how much did the typical country's traffic move away from normal? Not surprisingly, Argentina topped the list at 1.17x, meaning that when Argentina played, the typical country's traffic swung about 17% away from its normal level, the strongest global pull of any team. This comes as no surprise, since they were the defending champions and each knockout game could have been Lionel Messi's last dance for his national team. Love them or hate them, people were watching them.
Not far behind were nations packed with superstars such as France, Brazil, Portugal, Morocco, Spain — and Norway, fueled by the Erling Haaland phenomenon. Haiti and Iraq appear in the top as outliers due to their high deviation scores relative to their typical traffic, suggesting matches against major teams drove disproportionate engagement.
Sharp increase in traffic to sports betting sites
Compared to HTTP request data in the month preceding the World Cup, there was an overall increase in requests to gambling industry websites since the opening game. Additionally, whereas pre-tournament traffic followed a clear weekly pattern, after the Cup’s opening game, the trend flattened into a more constant profile, likely a consequence of the high, near-daily regularity of matches.
Divergent Behavior: Why Traffic Patterns Varied by Country.
Because Cloudflare is present in 120+ countries and handles traffic from Internet users worldwide, we can see distinct behavioral patterns across the globe. For example, when examining the deviation trends during the Algeria vs. Austria group stage game on June 28, we noticed something peculiar: Austria’s traffic (in red) increased during halftime, while Algeria's (in green) decreased. The former follows the pattern described above of people spending more time online while not watching the game, while Algeria’s is the complete opposite — and they’re not the only ones.
Algeria, in green and denoted as DZ, saw a much higher uptick in Internet traffic during the match than Austria, in red.
Countries clustered by behavior
To understand patterns in behavior across countries we grouped every country's match-day behavior by the shape of its traffic curve and let the patterns cluster together.
Grouping match-day traffic shapes this way, three distinct patterns emerge. The largest group (44 countries playing 101 matches) shows Internet usage rising during hydration breaks and halftime, the natural pauses in play, as people reach for their phones. A second, smaller group (8 countries playing 18 matches)) is its near mirror image: traffic falls at exactly those same moments, dipping during the breaks instead of climbing. The third group is a clear outlier, made up entirely of Iran's three matches. The explanation is simple: the May baseline was measured while Iran was still coming back online after the shutdown, so its match-day traffic sits far above that depressed reference, producing a deviation unlike any other country's. You can read more about Iran’s Internet shutdowns and partial restoration throughout 2026 on our blog.
Streaming makes some countries appear more online
To better understand the second cluster, which included Algeria, Tunisia, Jordan, Egypt and DR Congo, we looked more closely at the traffic mix for these countries. We broke down traffic patterns by Multipurpose Internet Mail Extensions, or MIME type, and grouped it in families to easily distinguish clusters of content types. MIME types act like digital labels that tell browsers exactly what kind of file they are receiving, whether it's an HTML page, a JPEG image, or an MP4 video stream. By tracking these labels, we can infer what kinds of content users are consuming.
Our hypothesis was that this behavior could be explained by a disproportionate amount of people watching the games via streaming in those countries. To test this, we compared traffic pattern distribution in games with teams of both clusters. In the following example, we see traffic distribution of Algeria and Austria respectively in the match between both countries.
In Algeria, traffic was far above normal, then dipped at halftime. Note the large increase in streaming traffic, in orange.
In Austria, where streaming services were used less, Internet traffic increased at halftime.
In the Algeria graph above, we can see that the bulk of the increase during the match window indeed was driven by requests to multimedia and streaming services. This supports our hypothesis that the traffic trendlines correlate with use of streaming to watch the match.
In Algeria, traffic rose sharply at kickoff, dropped during half-time, and returned to elevated levels once the second half began. Hydration breaks, by contrast, had little to no visible effect, which suggests that viewers don't meaningfully change their Internet or social behavior for short, in-play pauses, but do so during the longer halftime interval. Other countries in this cluster show similar behavior. This might be because a viewer is unlikely to close a stream for a three-minute cooling break, but a fifteen-minute halftime is long enough to close the stream and step away.
What do people do during halftime?
A minority of countries, including Tunisia and Algeria, disconnect during halftime, with traffic dropping below its in-play level (the blue boxes, sitting under the 1.0 line). The majority of countries go the other way: traffic rises during the break as people pick up their phones the moment play stops, then settles again when the second half begins. Croatia and Bosnia and Herzegovina show this most strongly, with halftime traffic running well above their in-play baseline.
And hydration breaks?
Halftime is a long, familiar pause, but what about the much shorter hydration breaks? These last only about three minutes, taken midway through each half. Is three minutes really enough to change how people behave online? It turns out it is. Just as at halftime, the moment play briefly stops, traffic in most countries ticks up before falling again when the game resumes.
We measured this by taking, for each match, the peak number of requests in a window around the middle of each half (where the hydration break falls) and comparing it to the five minutes immediately before the break. The pattern lines up with everything we've seen so far: the same audiences that surge at halftime also spike during these brief pauses, while the few countries that tend to disconnect during breaks show little or no lift. Even a three-minute gap in play is enough for a large share of viewers to glance back at their phones.
The final matches
At the scale of Radar’s global HTTP requests, it is genuinely hard for any single event to leave a visible mark. Even so, the 2026 World Cup Final, which pitted Europe’s and American football champions against each other, had enough social impact to affect the Internet’s footprint. When looking at the volume of HTTP bytes from June 20 to June 22 we can immediately identify the final match kicking off at 21:00 UTC on June 19, as well as England vs. France for the Bronze medal at 23:00 UTC on June 18.
During the final match, Argentina and Spain's traffic volume increased up to 20 percentage points when compared to a similar period. The bronze medal match also coincided with a traffic increase, although at a smaller scale.
HTTP request volume during the final match also appeared correlated not only with the timeline of the game, but with each individual stage as well. Looking at the graph, we can roughly pinpoint moments such as the kickoff, halftime break, hydration breaks, as well as the final whistle.
Keep up with world events on Cloudflare Radar
Across every time zone, match, and goal, Cloudflare Radar provides a front-row seat to how the world connects during landmark cultural moments. To explore more interactive traffic insights and track how major worldwide events shape internet activity every day, visit Cloudflare Radar or follow us on social media at @CloudflareRadar (X), https://noc.social/@cloudflareradar (Mastodon), and radar.cloudflare.com (Bluesky).
Островът на прокудените. Травми от миналото изплуват по бреговете на Гьокчеада (трета част)
Post Syndicated from Георги Тотев original https://www.toest.bg/ostrovut-na-prokudenite-treta-chast/
<<Към втора част

Махмуд се премества на острова и започва да работи в малък ресторант в село Ешелек, само на няколко километра от плажа за кайтсърф. Помага в кухнята, обслужва клиентите и върши всякаква обща работа срещу храна, легло и скромно възнаграждение.
Казах си: „Добре, ще остана за седмица.“ После минаха пет месеца. Когато реших, че ще си тръгвам, баба едва не се разплака: „Не си тръгвай!“
Махмуд се усмихва искрено при спомена.
„Баба“ е обръщението, с което той нарича собственичката на ресторанта – Майде Шах. На турски думата означава „баща“, но Махмуд я използва в българския ѝ смисъл. Потомка на по-ранна вълна бежанци, Майде говори свободно български език. Корените на семейството ѝ водят към Кърджалийско. След Освобождението турското малцинство неведнъж става обект на преследване, а бабата и дядото на Майде напускат България по време на една от по-ранните миграционни вълни.

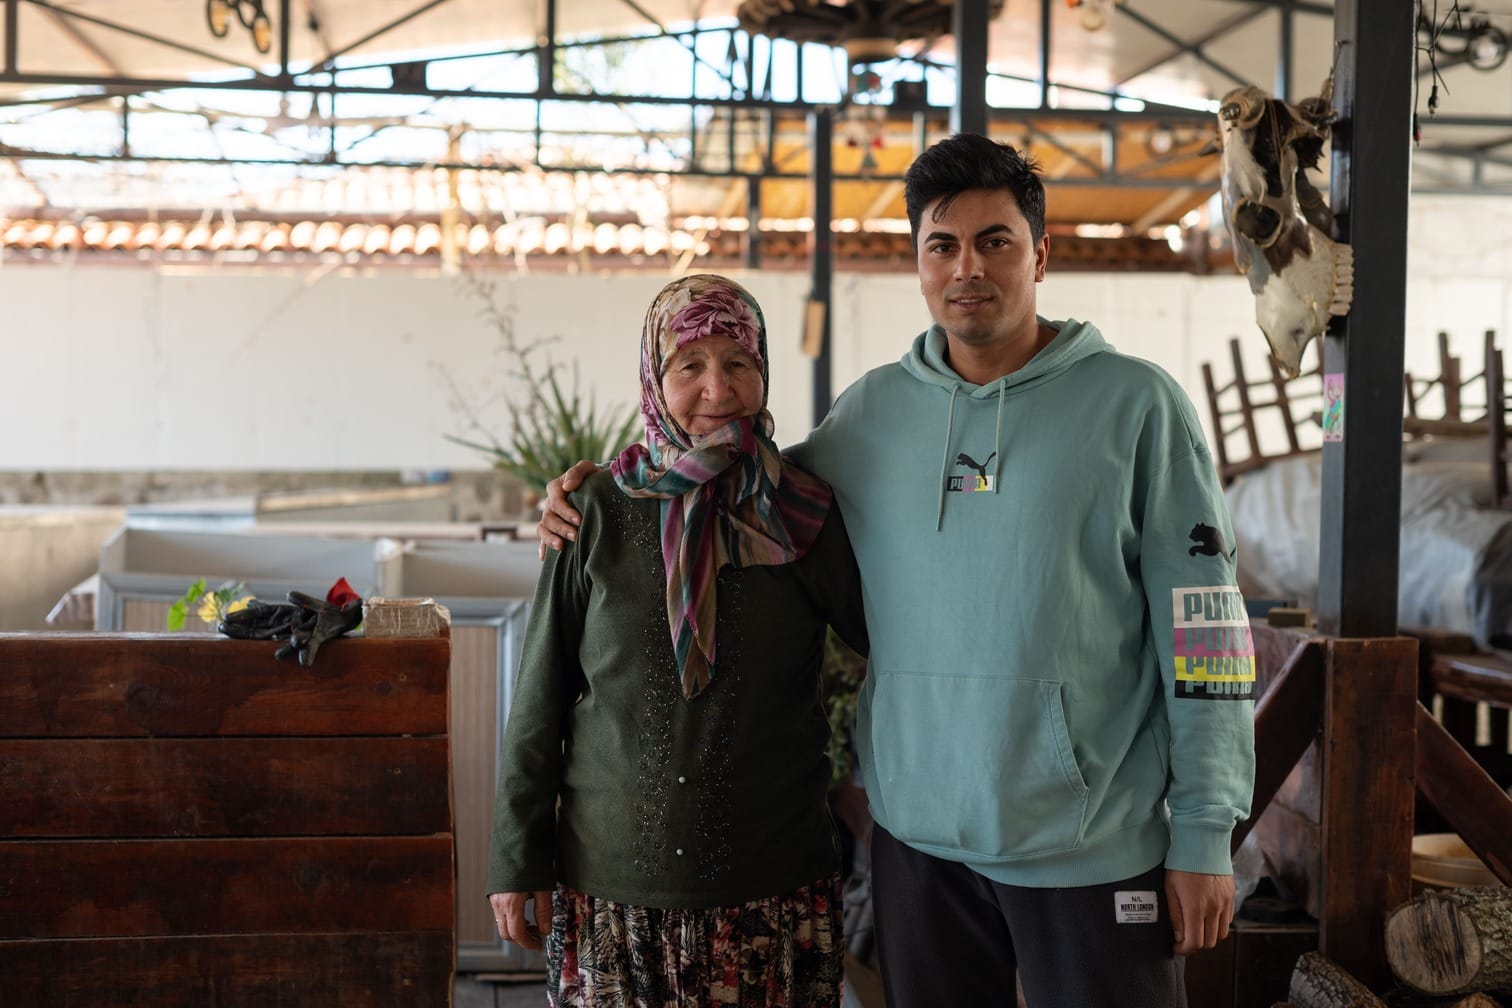
Майде и Махмуд © Георги Тотев
Махмуд се съгласява да остане в ресторанта още една година. После тя става две, двете стават три, а след това четири. След смъртта на съпруга на Майде – Хасан, Махмуд вижда колко много разчита тя на помощта му.
И когато ме помоли да остана още веднъж, останах.
Отначало Махмуд не обръща особено внимание на морето. Но гледката на десетките кайтове, танцуващи над водата, постепенно го запленява. В Афганистан съществува вековна традиция на състезателно пускане на хвърчила. Те са малки, направени от тънка хартия и управлявани с дълъг конец, покрит с абразивна смес, която го прави остър като нож. Опитните участници водят същински въздушни двубои, опитвайки се да прережат конците на своите противници. А когато някое хвърчило падне, децата се втурват по улиците, за да го приберат като трофей.
По време на управлението на талибаните това занимание е забранено като „неислямско“. След падането на режима през 2001 г. хвърчилата отново изпълват небето с цветове. Но след завръщането на талибаните на власт през 2021 г. забраната пак влиза в сила.
Кайтовете напомнят на Махмуд за детството му, за свободата, приятелствата и безгрижните дни. Постепенно започва да прекарва все повече време около едно от кайтсърф училищата на плажа, наблюдавайки инструкторите и усвоявайки началните стъпки в спорта. „Всички ми помагаха. Казваха ми: „Махмуд, направи това, направи онова.“ Гледах и се учех.“

Казва, че кайтсърфът му дава нова причина да живее. Става по изгрев, прекарва часове във водата, след което бърза обратно към ресторанта. Когато работата поутихне, отново се измъква към плажа. Мечтае един ден да стане инструктор. Но без документи и законен статус необходимият лиценз остава недостижим.
—
Христос Талиядурос се завръща на острова през 2019 г., след повече от четвърт век отсъствие. Междувременно много от неговите роднини вече са го напуснали и са се установили трайно в Гърция. Като млад той също получава гръцко гражданство, без да се отказва от турското. И Гърция, и Турция позволяват двойно гражданство.
Когато обаче идва време за военна служба, задължителна и в двете държави, Христос избира да служи в турската армия. По план службата му трябвало да продължи 15 месеца, но по неговите думи, остава под пагон две години заради своя „непокорен характер“.
Замесвах се в много сбивания… Беше трудно, защото бях грък и християнин.
Не всички обаче успяват да запазят връзката си и с двете страни. Някои от хората на острова, които се опитват да получат гръцко гражданство, в крайна сметка се отказват обезкуражени от продължителните административни процедури. Подозрението сякаш ги следва навсякъде. За гърците често са прекалено турци, а за турците – прекалено гърци.
Гръцкоговорещата общност на острова – имбрийците, често възприема себе си като отделна група. Те не се чувстват турци, но не се определят съвсем и като гърците от континентална Гърция. Дори местният традиционен гръцки диалект носи сериозни следи от турско влияние.



Някои от представителите на гръцката общност на острова © Георги Тотев
„Имбрийците не са просто гърци – казва Виолета. – Те са ромеи – православни християни от Османската империя, а по-късно и от Турция.“ Терминът произлиза от същия корен като Румелия – названието, което Османската империя използва за балканските си владения, буквално „земята на ромеите или римляните“. „И аз донякъде се определям като ромейка“, казва Виолета.
В Гърция често ни възприемат като чужди, а същото важи и за Турция.
Толкова пъстър е и турският облик на острова. Хората, които през последните десетилетия са се установили тук, идват от най-различни краища на страната – някои от Истанбул, други от вътрешността на Анадола, трети от черноморското крайбрежие, има и представители на кюрдите. Всички те допринасят за усещането, че островът е изградил собствена култура и традиции, различни както от тези на континентална Турция, така и на Гърция.
През 70-те години Гьокчеада е обявен за зона със специален режим и на практика се превръща в огромна военна база.
Гражданският живот остава силно ограничен до 90-те години, когато забраните започват постепенно да отпадат. В началото на новия век част от бившите гръцки жители и техните потомци започват да се завръщат. Отварят отново родовите си къщи, възстановяват стари празници и местни традиции.
Хората, които се върнаха, просто се прибираха у дома,
казва Виолета. Тя обаче смята, че възраждането на гръцкото присъствие на острова остава крехко. „Няма открит конфликт, но разделението между общностите все още съществува. Хората не общуват особено много помежду си, а езикът също е пречка.“ Виолета признава, че гръцката общност може да бъде доста затворена. „Когато пристигнах тук със съпруга си, някои хора шушукаха: „Омъжила си се за турчин?“ Едва след като се разведох, започнаха да ме приемат като една от тях.“

Следите от някогашното оживено гръцко присъствие са навсякъде. Каменни къщи стоят изоставени, без покриви, с отворени от вятъра прозорци и с бурени, катерещи се по рушащите се стени. Христос всекидневно минава покрай останките на селища, които някога са били изпълнени с гласовете на имбрийците, но предпочита да не живее в миналото. „Обичам да съм сам край морето“, казва той.
Животът ми е пълен с хубави неща и се старая да ги ценя. Хората ме уважават, здрав съм, семейството ми е наблизо – какво повече мога да искам?
После се усмихва: „Животът е като табла. Много зависи от заровете, но много зависи и от това как играеш.“
—
Раиф и Кание заедно с малката си дъщеря са в непозната държава – страна, която дотогава познават единствено от картата и разказите.
„В България бяхме „турците“ – казва Раиф, докато разбърква втората си чаша чай. – А тук изведнъж станахме „българите“.“ С добро образование и работна етика двамата успяват да намерят държавна работа: Раиф – към Министерството на енергетиката, а Кание – към Министерството на земеделието. Пътят им минава през Чорлу и Истанбул, а след това ги отвежда повече от хиляда километра на изток – към Ерзурум. В крайна сметка са изпратени в Байбурт, отдалечен планински град, близо до границата с Грузия.
Когато пристигнахме, нямаше ток, нямаше хладилник, нямаше печка, нямаше телевизор – само бедност,
спомня си Раиф. В Байбурт остават седем години, спестявайки всяка възможна лира. По-късно ги преназначават на различни места и за известно време живеят разделени. През 1998 г. новото назначение на Раиф ги отвежда на Гьокчеада. Кание си спомня как колегите ѝ недоумявали защо се мести на този „забравен остров“. „Казваха ми: „Там има повече кози, отколкото хора.“
Докато Раиф и Кание пристигат на острова заради работа, други жертви на Възродителния процес получават възможност да се заселят в новоизградено село в слабо населената западна част на Гьокчеада. Държавата им предоставя земя и жилища, които трябва да изплатят в продължение на 20 години. Важното условие е едно – новите едноетажни къщи да бъдат обитавани целогодишно.
Селището Ширинкьой е завършено в края на хилядолетието и е изградено в близост до останките на някогашния затвор. Местните често го наричат „българското село“. Голяма част от него е построена върху земя, която десетилетия по-рано е принадлежала на гръцките жители на Имброс, принудени да напуснат острова.
Кание си спомня първите години на Гьокчеада като непрекъснат водовъртеж от работа. „Нямахме собствен дом, започнахме от нулата. Дъщеря ни трябваше да ходи на училище. В продължение на шест години бях единственият ветеринарен лекар на острова. Нямаше почивни дни, нямаше отпуска – само овце, крави и кози.“
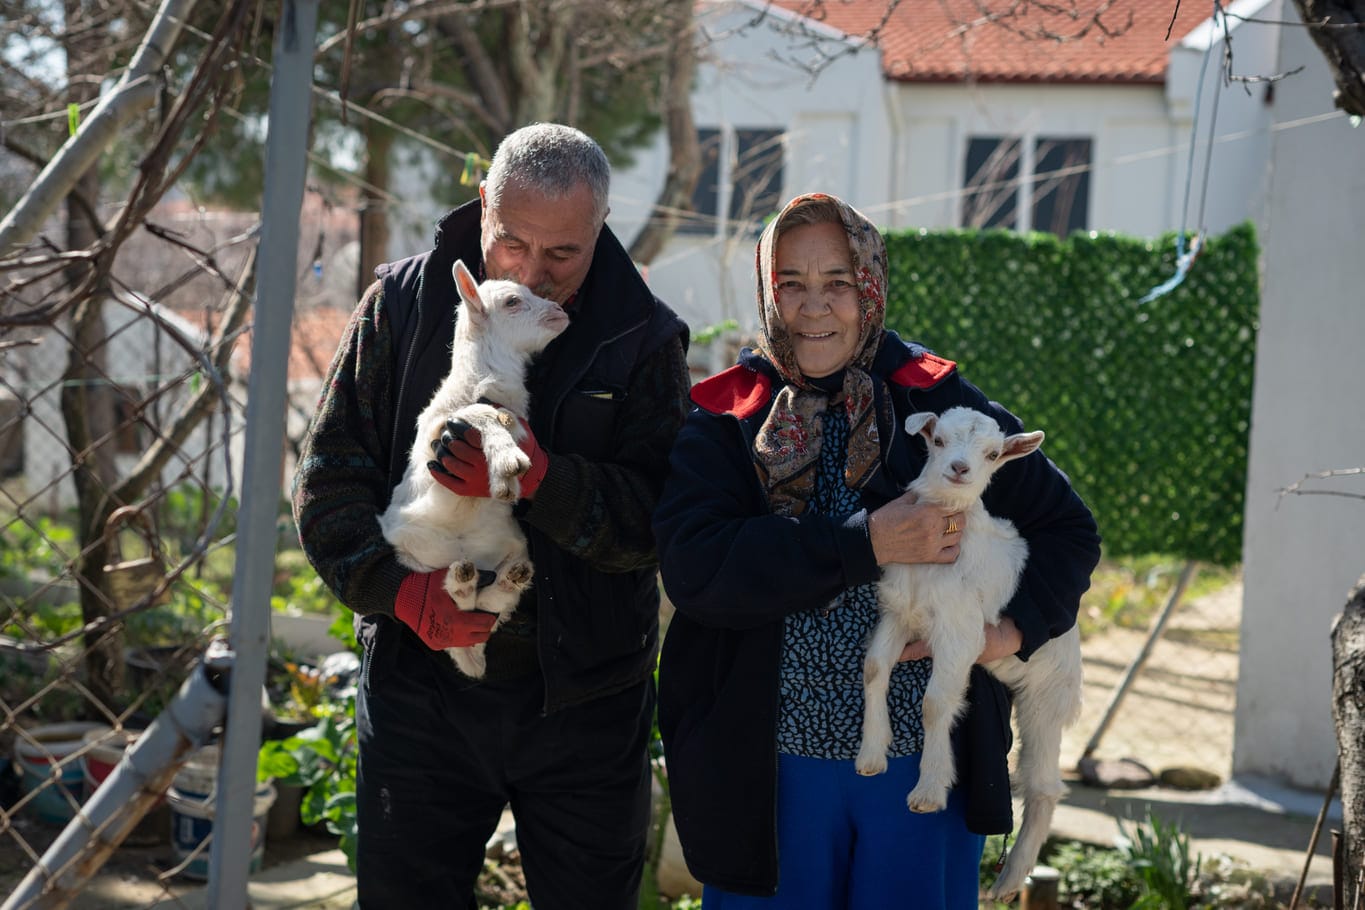
Раиф кимва в знак на съгласие. „В началото не познавахме никого, но с времето хората ни приеха. Тогава не можех да си представя, че един ден ще имам животни, градина, кола.“ Той поглежда през прозореца и дръпва от цигарата си.
Но съжалявам, че вложихме толкова много усилия, време и пари тук. А сега, дори да искаме да си тръгнем, вече е твърде късно.
—
По време на сезона за кайтсърф Махмуд се чувства истински жив. Обграден е от приятели, които споделят същата страст към морето и вятъра. Когато настъпи есента, туристите си тръгват, островът притихва и светът му сякаш се свива. Всяка зима започва да мисли за заминаване. „Млад съм и точно сега трябва да работя, да спестявам за бъдещето. Но през зимата няма нищо. Това ме кара да се чувствам безполезен. Искам просто да мога да работя законно и да водя нормален живот.“ Той замълчава за момент и поглежда към неспокойното море. Силата, която издига кайта му във въздуха, едновременно го тегли напред и сякаш го задържа на място.
Трябва да работиш упорито. Всеки ден да се опитваш да ставаш по-добър. Да намериш нещо, което придава смисъл на живота ти, нещо, което ти носи свобода и щастие.
През март 2025 г., по време на пътуване до Истанбул, Махмуд е задържан от турските власти и е депортиран обратно в Афганистан. По това време вече е прекарал над шест години в Турция. Няма възможност дори да събере най-ценните си вещи – оборудването за кайтсърф. В продължение на седмици не казва на Майде какво се е случило, защото не иска да я тревожи. Така отново се озовава в Кандахар – града, от който някога е тръгнал към Европа.
„Кандидатствах за турска виза, но ми отказаха – разказва той. – Нямам проблеми с талибаните. Те са заети с възстановяването на Афганистан.“ После добавя: „Много афганистанци се връщат от Турция, Иран и Пакистан. Някои са доволни, защото намират работа по възстановяването на страната. Но след толкова години война нищо не е лесно.“
По-рано тази година приятелката на Махмуд пристига от Турция. Двамата бързо сключват брак в Афганистан. „Най-щастливият момент в живота ми“, както сам го описва. Това лято той се връща на острова, за да отпразнува сватбата си с близки и приятели. Днес ежедневието му се движи в познат ритъм: между „Шах Бюфе“ – ресторанта на Майде, която отдавна го е приела като свой син, и плажа. Изглежда, че вятърът, който го пренася през морето, сега го е върнал обратно.
—
Според Виолета много от новодошлите на острова дълго време са възприемали Гьокчеада като спирка по пътя към нещо друго. Това обаче започва да се променя със завръщането на потомците на някогашните жители. „Има хора, които живеят тук от 40 години и все още не го чувстват като свой дом – казва тя. – Но новите поколения и последната вълна от завърнали се променят това. Моите деца също са част от този процес, част от новата идентичност на острова.“
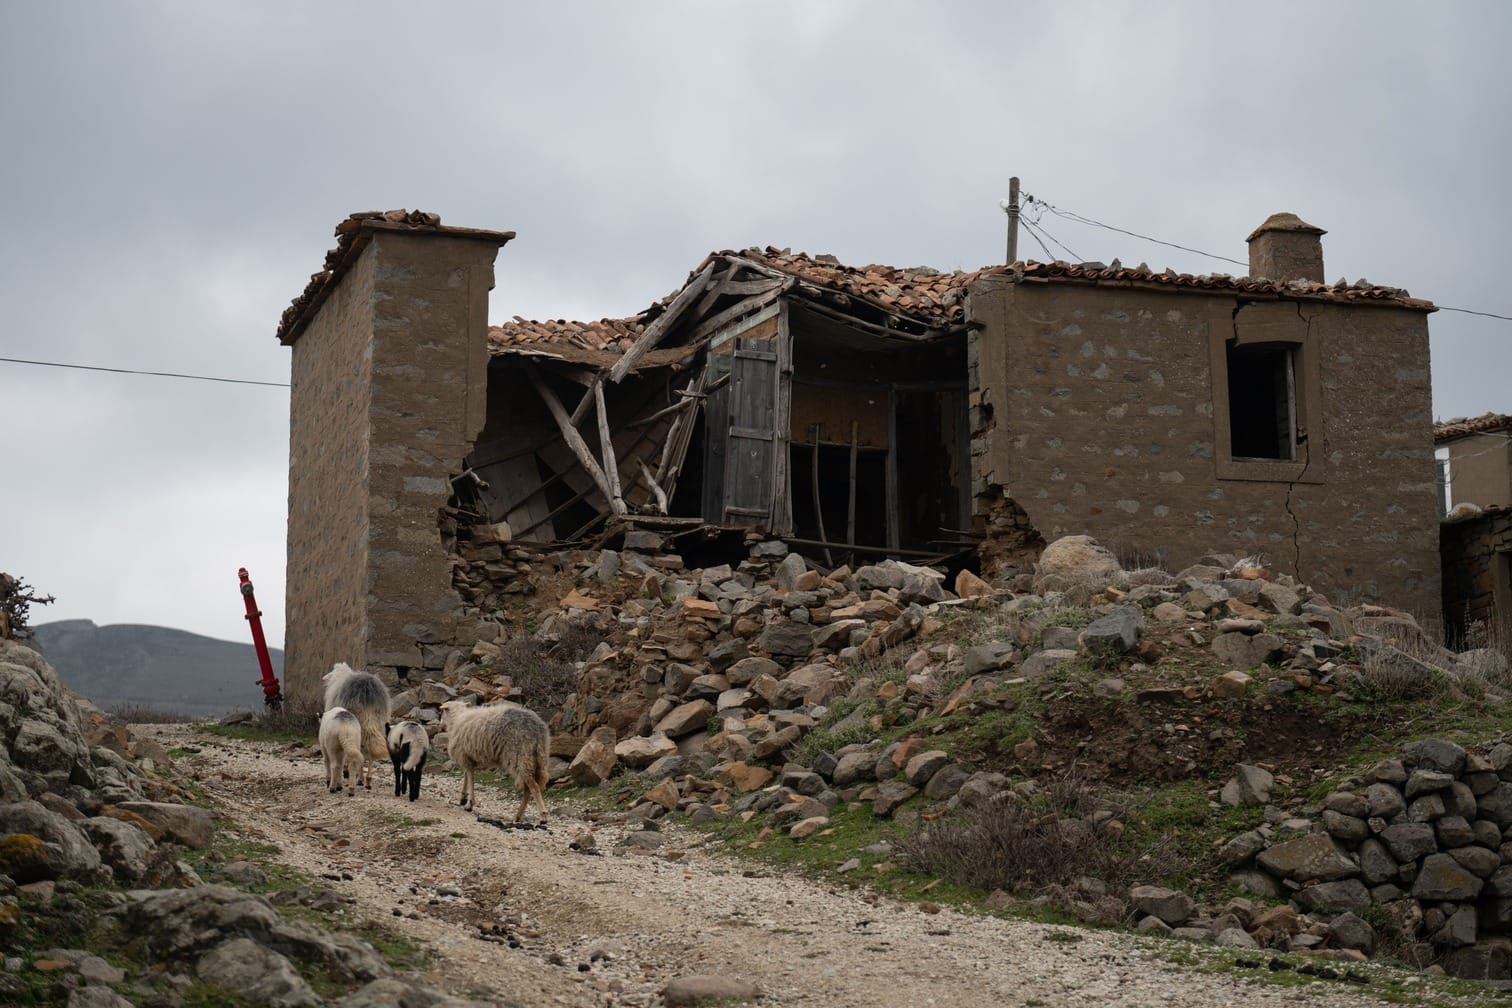

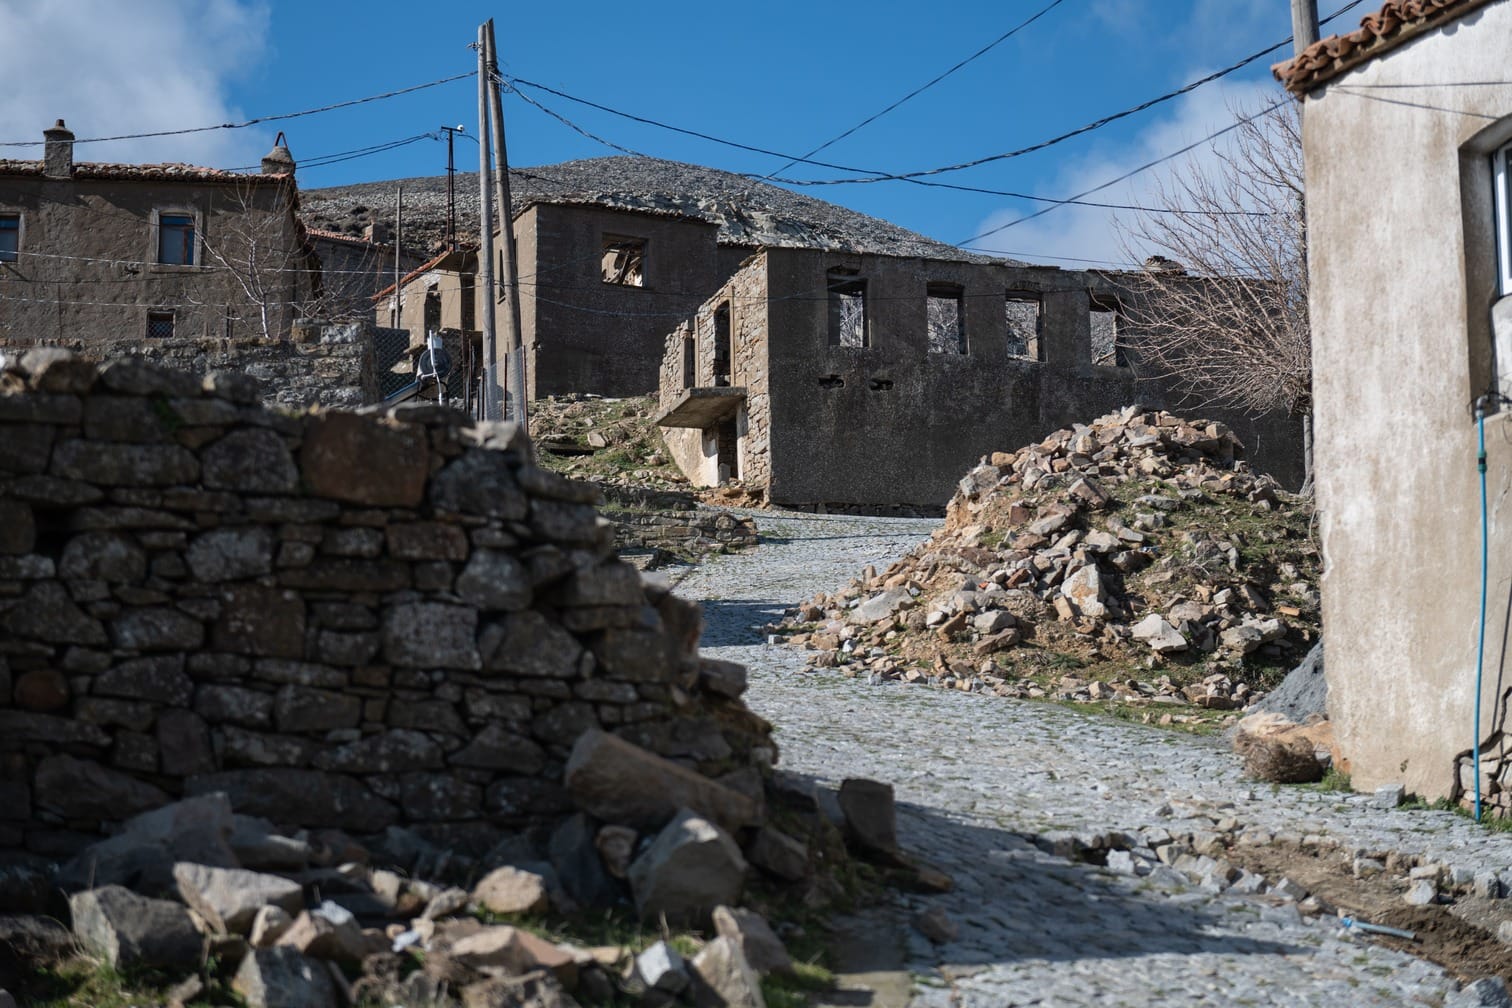

Някои от изоставените сгради в село Дерекьой – едно от местата на острова, на които е съсредоточена гръцката общност © Георги Тотев
Христос споделя това усещане. „Излизам с гърци, с кюрди, с турци. Работим заедно, живеем заедно. Всъщност няма голяма разлика между гръцкото и турското кафе. Независимо дали живееш в голям град, или на остров, в крайна сметка животът се свежда до петима истински приятели, които наистина те познават. Ако ги имаш, целият свят е твой.“
—
В двора Раиф товари пикапа си, преди да тръгне да нахрани животните. Излъчва сила, непрекъснато е в движение, но малко особената му походка издава възрастта му. След живот, прекаран „в движение и работа“, той и Кание са си представяли, че ще остареят близо до дъщеря си. Когато строят къщата, предвиждат достатъчно спални и бани, за да могат да събират цялото семейство под един покрив. Днес дъщеря им идва само веднъж годишно, когато довежда внука за няколко дни. Двамата също я посещават, но с напредването на възрастта дори 90-минутното пътуване с ферибот започва да им се струва изпитание.
На острова има болница, но при по-сериозни здравословни проблеми пациентите трябва да пътуват до Чанаккале на отсрещния бряг. Раиф си спомня период, в който всеки ден му се налага да прекосява пролива за лечение. За да хване сутрешния ферибот, става в пет часа. „Все едно си пиян – казва той. – Връщаш се вечерта напълно изтощен.“ Замълчава за миг и въздъхва.
Писна ми. Така ще си отидем от този свят – работейки до последно, по дяволите.
Преди години Раиф едва не загива по време на работа. През 2007 г. ремонтира повреда по електропреносната мрежа от вишка, когато платформата внезапно пропада. Гръбнакът му е счупен на три места. Следват четири месеца, през които лежи неподвижно. През цялото това време домът на семейството остава с отворени врати. Съседите непрекъснато идват и си отиват – носят храна, помагат с каквото могат и не ги оставят сами. „Те ни помогнаха да преминем през всичко това“, казва Кание.

Зад суровото вечно усмихнато лице на Раиф се крие много. Някога той бил по-гневен човек. В началото на века, когато островът започва да се отваря за туризъм, един ден забелязва автомобил с българска регистрация. Старите рани изведнъж се отварят отново. Започва да крещи на шофьора на български и да му нарежда да напусне острова:
Вие ни сменихте имената! Вие ни изгонихте! Вие съсипахте живота ни!
Шофьорът отговаря тихо: „Извинявай, братко. Не аз ти смених името. Съжалявам за това, което се е случило.“ Но Раиф не успява да овладее гнева си. „Казах му, че ако го видя отново, ще го пребия до смърт.“
След това идва срамът. А по-късно и освобождението от натрупаната болка. „Това беше последният път, когато изпитах подобна болка – казва Раиф. – Сега всичко е простено, всичко е забравено. Едва си го спомням.“
Този материал е създаден в рамките на Програмата за журналистически постижения (Fellowship for Journalistic Excellence) с подкрепата на ERSTE Foundation и в сътрудничество с Balkan Investigative Reporting Network (BIRN).
Редактор на оригиналния текст: Нийл Арън
Превод: Георги Тотев
Robots, games, AI, and more at Coolest Projects UK 2026
Post Syndicated from Sophie Ashford original https://www.raspberrypi.org/blog/robots-games-ai-and-more-at-coolest-projects-uk-2026/
Coolest Projects UK returned to Bradford in May, with more than 200 young people showcasing digital projects they had designed and built themselves.
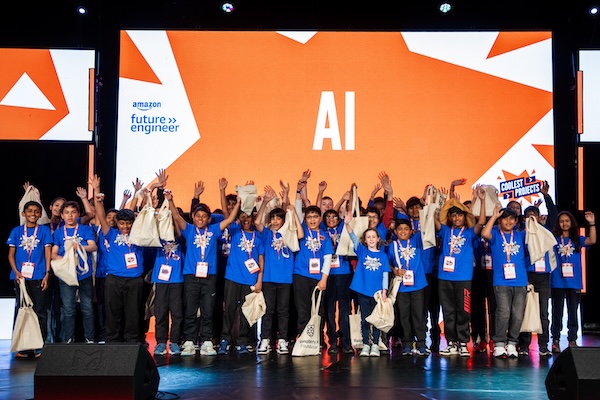
Visitors at the showcase event had the chance to explore an amazing range of projects across categories, from Scratch and Python to AI, hardware, web design, and game development. Every participant had the opportunity to speak with judges and industry professionals, receive personalised feedback, and connect with other young people passionate about technology and creativity.
Throughout the day, participants also got stuck into hands-on digital activities designed to encourage collaboration and creative thinking.
A showcase built by young people
This year’s creators came from a wide range of backgrounds, including Code Clubs, schools, Scout groups, CoderDojos, and independent learning environments. Some had spent months refining their projects, while others had only recently started their coding journey. What connected them all was a shared excitement for creating with technology.

Ahead of the event, local workshops held in Bradford gave young people additional opportunities to explore digital making, develop project ideas, and gain confidence ahead of showcasing their work publicly. These sessions helped many first-time participants take their first steps into coding and creative technology.
Scouts level up their skills at a hands-on digital making workshop
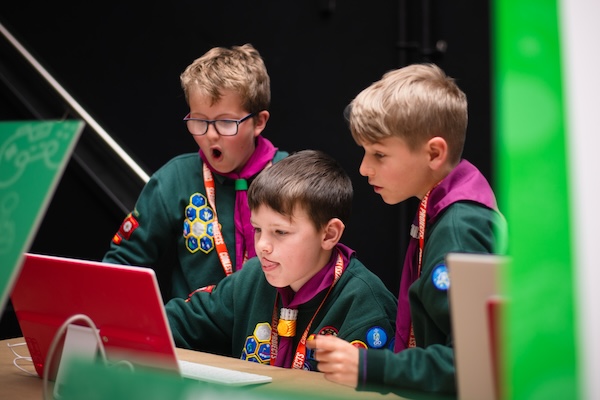
A key part of this year’s event was the involvement of 57 Scouts from across the region. Young people from six Yorkshire-based Scout groups attended digital making workshops. During the sessions, they learned how to create their own selfie filters using Scratch’s AI-facial recognition tools, earning their DM1 Digital Maker badges. After developing their own ideas and projects during the workshops, they exhibited a selection of them in the Coolest Projects showcase alongside the wider community of young creators.
For many of the Scouts attending, this was their first experience of presenting a technology project to the public. It gave them a fantastic opportunity to build confidence, talk about their ideas, and see how digital making turns imagination into reality.
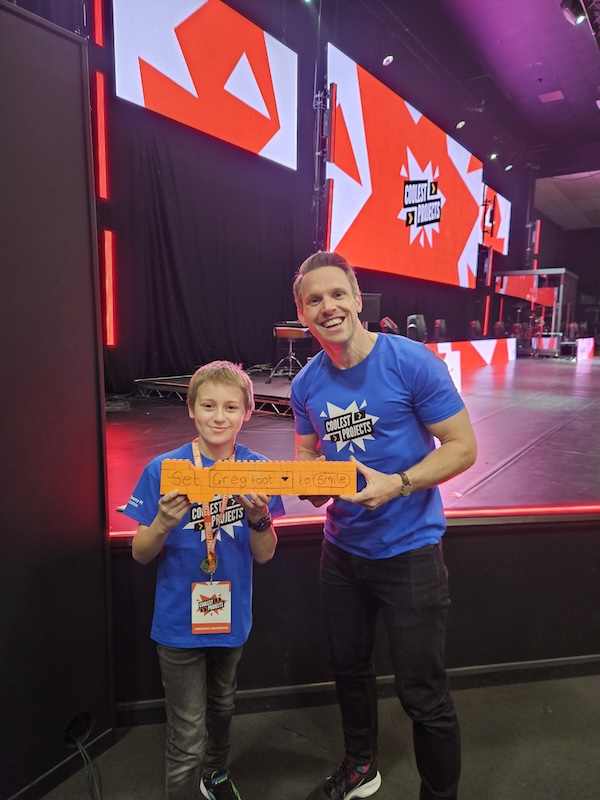
Throughout the event, Greg Foot, BBC science presenter, brought energy and enthusiasm to the stage, interviewing creators, celebrating achievements, and highlighting the stories behind the projects on display. The day concluded with a celebration ceremony where every participant received recognition for their work, with creators of the judges’ favourite projects also receiving additional awards.
The showcase featured an inspiring range of ideas and inventions created by young people from across the UK. Here are just a few of the projects presented during the event:
Seth | Pop Bot, Hardware
This project is a robotic reminder system that recognises people’s faces and plays a personalised reminder message. Using sensors, lights, sounds, and moving parts, the robot reacts when someone comes close and activates a camera for face recognition. Seth built the robot using boxes and tubes, while also using AI face recognition and recorded audio messages to create an interactive experience. Seth shared some of the challenges he faced with the facial recognition system.
“Our facial recognition system kept getting confused, so we took more photos to help it recognise better. We used different backgrounds, clothes and lighting to help it recognise our faces better, but we also took new photos when we got to Coolest Projects, so it would work better in front of the judges.”
Seth wasn’t just excited to share his project with his fellow creators, but with host Greg Foot too, bringing a little surprise along for Greg on the day.
“I have always wanted to go to an event which has lots of people and showcases everyone’s work, and wanted to meet Greg Foot too. I built a giant Scratch block made from Duplo and Lego to give to Greg Foot. I didn’t have all the right sizes so I made a custom part with modelling clay and I reinforced it using sticky back plastic, then I asked my mum to write on it so that it looked like it coded Greg to smile.”
Chinemerem | Immune System Defence, Games
Immune System Defence is a Roblox game where players protect the human heart from waves of incoming viruses. Using white blood cells, vitamin boosts and other defensive towers, players must stop the spread of infection while learning about how the immune system works. The game is designed to be both fun and educational, combining strategy and science in an exciting gameplay experience.
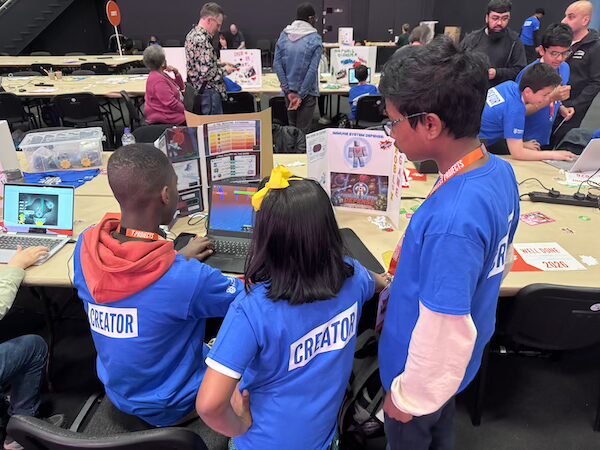
“I got the idea for the project from my Science lessons at school — specifically the ones where we’d learned the parts of blood and the functions of the heart as a related topic on how white blood cells and the immune system protects the body. One of my favourite parts was seeing people scan my QR code and actually play my game live during the showcase.”
Gabriel | Fossil Roulette, Scratch
Gabriel created a Scratch game that teaches players how rare the fossilisation process is. Players choose between an ammonite, belemnite, or trilobite and then spin three roulette wheels representing different stages of fossilisation. Gabriel was inspired by a board game he saw at the Fossil Festival in Lyme Regis and adapted the idea into his own interactive game with new features such as the roulette wheels.

“The roulette wheel was the hardest to code because I had to make it spin faster at the beginning and then slow down. I found the event [Coolest Projects] very exciting because at one point I had a queue of people wanting to try out my game!”
More Coolest Projects showcases
Each year, Coolest Projects highlights the creativity, curiosity, and technical skills young people bring to digital making. From games and AI experiments to interactive hardware builds, the event continues to inspire more young people to see themselves as creators of technology, not just consumers of it.
While the UK event has now wrapped up for 2026, Coolest Projects showcases continue around the world throughout the year.
Keep creating with Code Club
Coolest Projects is part of our wider work to help every young person gain access to computing and digital creativity opportunities. At thousands of free Code Clubs running across the UK, Ireland, and around the world, young people can continue building projects, learning new skills, and creating alongside others in supportive community spaces.
To find a local club or learn how to volunteer, visit the Code Club website.
The post Robots, games, AI, and more at Coolest Projects UK 2026 appeared first on Raspberry Pi Foundation.
THG Podcast: Counterfactuals – Did Ketchup Save the World?
Post Syndicated from The History Guy: History Deserves to Be Remembered original https://www.youtube.com/watch?v=VXMFckUF9Z8
MIT to Become Hotbed of AI Video Surveillance
Post Syndicated from Bruce Schneier original https://www.schneier.com/blog/archives/2026/07/mit-to-become-hotbed-of-ai-video-surveillance.html
It’s a lot:
According to information obtained by The Tech, MIT is spending over $3 million on more than 500 AI surveillance cameras in academic buildings, residence halls, and outdoor areas along Memorial Drive. Installation of the new cameras, along with the wiring and infrastructure that will support them, began November 2025 and will likely continue until September 2026.
Technical specifications for the cameras suggest that they will be capable of collecting real-time face and object classification data, including detection of motion, loitering, crowds, face masks, and camera tampering. Individuals can also be automatically classified on the basis of clothing color, gender, and age, up to a distance of 35 feet (11 meters) from the camera. According to a statement from MIT spokesperson Kimberly Allen, any collected data is “retained up to 30 days,” unless an exception is granted.
[…]
Most of the new cameras, which are part of Hanwha’s Wisenet AI line, are marketed for their ability to identify and classify multiple objects with deep learning algorithms. They support resolutions ranging from 2MP to 4K while also recognizing faces, license plates, vehicles, and other objects in real time.
Nearly all cameras will accommodate a wide range of pan, tilt, rotate, and zoom motion and will be monitored continually with Ai-RGUS, an AI camera software.
Yikes.
The Canoeist Accused of Destroying the Reflecting Pool
Post Syndicated from The Atlantic original https://www.youtube.com/shorts/B9nz-ZiRMXM
Introducing the Amazon GuardDuty investigation agent: on-demand AI-powered threat assessment
Post Syndicated from Allan Holmes original https://aws.amazon.com/blogs/security/introducing-the-amazon-guardduty-investigation-agent-on-demand-ai-powered-threat-assessment/
The new Amazon GuardDuty investigation agent (now in public preview) investigates security findings across your Amazon Web Services (AWS) environment, reducing investigation time from hours to minutes.
GuardDuty is our managed threat detection service that continuously monitors your AWS accounts and workloads for suspicious, potentially malicious activity, and unauthorized behavior, delivering detailed security findings for visibility and remediation.
Whether you’re investigating a single suspicious finding or assessing security posture across your entire organization, the investigation agent provides structured assessments providing risk levels, confidence scores, and actionable recommendations.
Security teams can spend hours investigating security findings and correlating data across multiple tools. The GuardDuty investigation agent automates this correlation, providing actionable intelligence, built directly into GuardDuty and accessible on demand through the AWS Management Console, AWS Command Line Interface (AWS CLI), AWS APIs, or AWS SDKs.
This post shows you how to:
- Enable the investigation agent in your GuardDuty console.
- Create your first investigation through the console or AWS CLI.
- Use the investigation agent with the AWS MCP server for AI-assisted security operations
Key features of the GuardDuty investigation agent
The GuardDuty investigation agent provides APIs using the same patterns you already know from GuardDuty. Each completed investigation returns a risk level, confidence assessment, MITRE ATT&CK® technique mapping, resource mapping, and prioritized recommendations.
You can scope investigations from the console for a specific finding, an account, or all accounts across your organization. Alternatively, the AWS CLI and API accept a free-form trigger prompt of up to 2,048 characters, so you can describe what to investigate in natural language and guide the analysis of the agent by specifying areas of concern, suspected root causes, or priorities for the investigation.
The investigation agent APIs are also available through the official AWS MCP server, part of the Agent Toolkit for AWS, enabling integration into your existing security toolchains and AI-powered workflows. You don’t need to manage or interact with the agent directly. Call API endpoints, and the agent investigates findings, correlates evidence, and delivers an assessment without the overhead of managing complex configurations.
How the investigation agent analyzes findings
When you create an investigation, the agent uses cross-Region inference to process your findings based on scope and produces a structured output.
Cross-Region inference – GuardDuty investigation uses the Cross-Region Inference Service (CRIS), which selects the optimal AWS Region within your geography to process the investigation assessment. Your data remains stored only in the Region where the investigation request originates. However, investigation data and summary results might be processed outside that Region. Data is transmitted encrypted across the secure network provided by Amazon.
For more information about which inference Regions your request might be routed to see the Cross-Region inference routing table located in the investigation section of the Amazon GuardDuty User Guide.
Investigation output – Each completed investigation produces the following insights: Risk level (Info, Low, Medium, High, or Critical), Confidence (Unknown, Low, Medium, or High), Summary (description of findings and key observations), Investigation Details (additional context), and Recommended Actions (detailed actions including AWS CLI commands).
Account scoping – Account specification is required only when investigating a specific member account. For broader scopes such as your entire organization, no account ID is needed. The agent will only investigate findings within accounts you’re authorized to access per the authorization model that follows.
Prerequisites
Before you get started, make sure you have the following prerequisites in place:
- Amazon GuardDuty enabled in your account
- AWS account in a supported Region (see Availability section)
Required IAM permissions
You will need three new permissions: guardduty:CreateInvestigation to start new investigations, guardduty:GetInvestigation to retrieve results, and guardduty:ListInvestigations to view investigations for a given detector.
Example IAM policy:
Authorization model
Administrator accounts can create investigations, retrieve results, and view investigation lists for themselves and their member accounts. Member accounts can only retrieve results and view investigation lists for their own account. Member accounts can’t create investigations and can’t access investigations belonging to other accounts or the administrator account. Account specification is required only when investigating a specific member account. For your own account or accounts across your organization, no account ID is needed.
To enable and create your first investigation
Before you begin, verify you have the required IAM permissions as described in the prerequisites .
- Open the AWS Management Console in the desired supported Region and navigate to Amazon GuardDuty.
- In the navigation pane, choose Investigations.
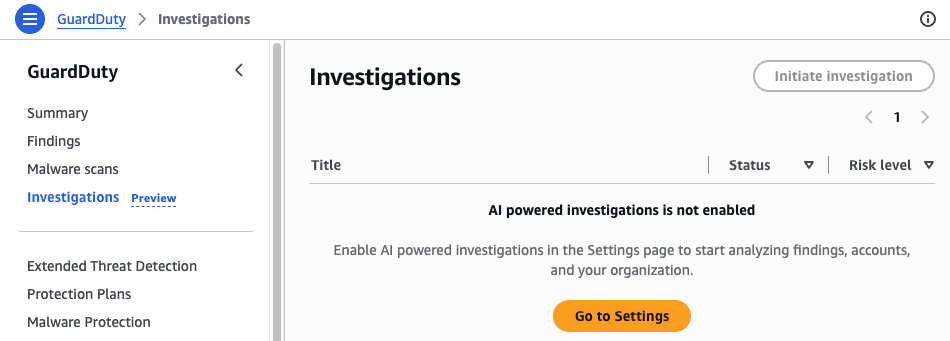
Figure 1: GuardDuty investigation dashboard
- If investigations aren’t enabled choose Go to Settings and then enable investigations by choosing Enable.
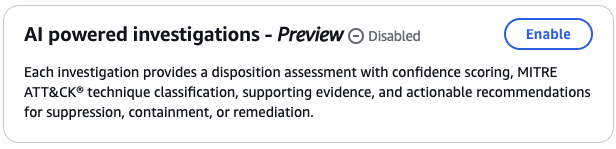
Figure 2: GuardDuty investigations enablement screen
- After investigations are enabled, navigate back to the investigations page.
- In the navigation pane, choose Initiate Investigation.
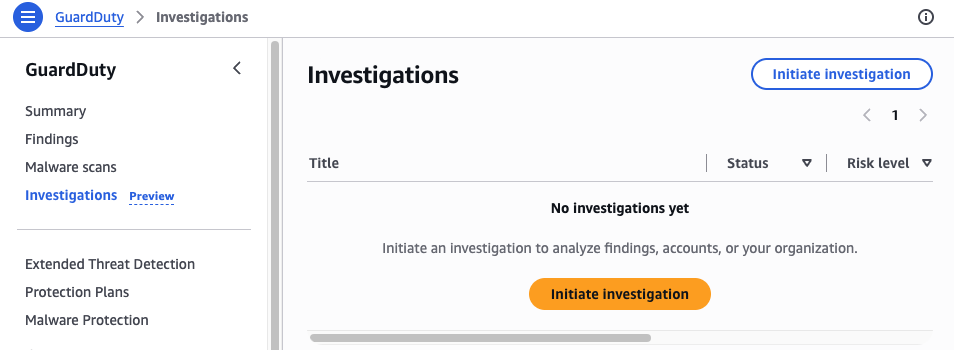
Figure 3: GuardDuty initiate investigation
- Select a scope for your investigation:
- Enter a GuardDuty Finding ID: Use when you want to investigate a specific GuardDuty finding in depth
- Enter an AWS Account ID: Use when you want to assess the overall security posture of a specific AWS account
- All accounts: Use for organization-wide security assessment or when investigating potential lateral movement
- Choose Initiate investigation.
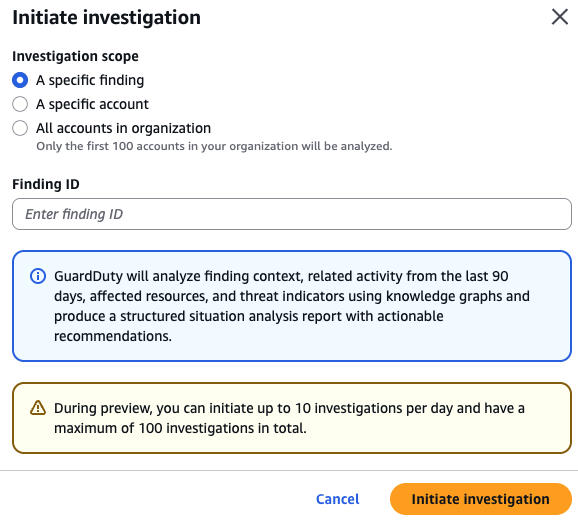
Figure 4: GuardDuty investigation setup
- Wait for the investigation to complete (typically 2–5 minutes for account level and 10–12 minutes for specific finding investigations during preview). The status updates automatically.
- When the investigation completes, select the investigation title to view the full assessment.

Figure 5: GuardDuty investigation completed menu
The investigation assessment contains detailed information about the investigation including general information, a summary of the investigation, mapping, assessment of the threat, and recommended actions.
The General Information section displays the investigation ID, status, triggered-by account, and creation timestamp.
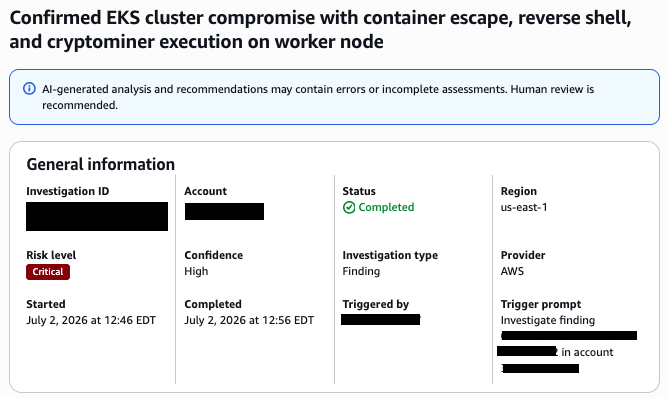
Figure 6: General information section of the assessment
The summary section provides a narrative of key observations and findings.
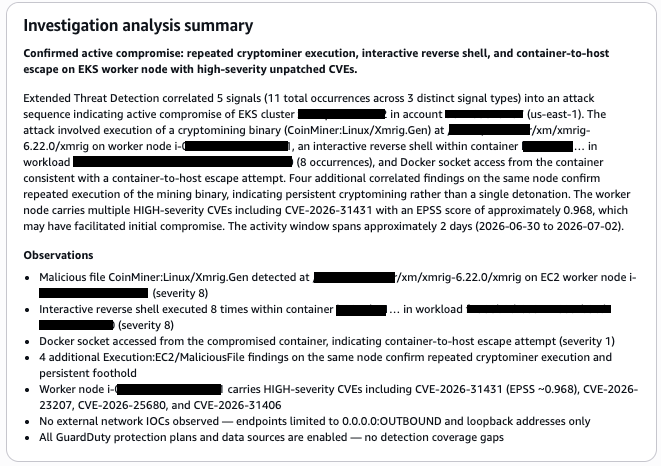
Figure 7: Summary section of the assessment
The mapping section shows attack techniques and affected AWS resources.
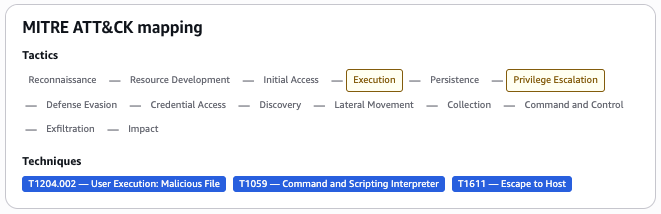
Figure 8: MITRE ATT&CK mapping section of the assessment
The Threat Assessment section displays the risk level, confidence score, and detailed threat analysis.
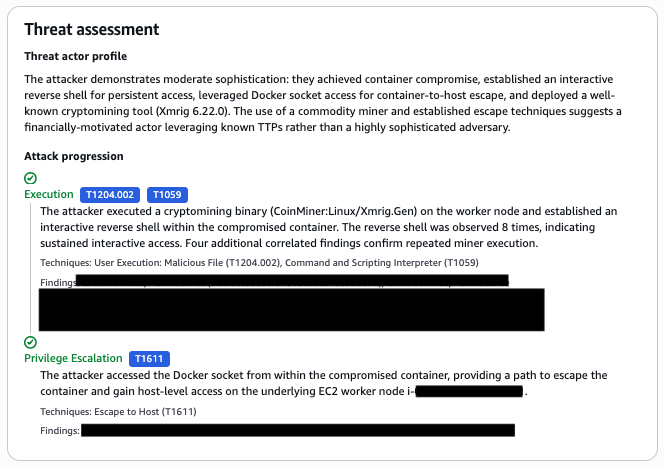
Figure 9: Threat assessment section
The Recommended Actions section lists prioritized remediation steps.
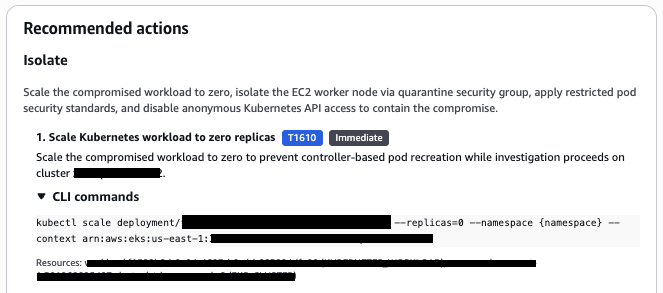
Figure 10: Recommended actions section of the assessment
Investigations can also be conducted with the AWS CLI or SDK using the following API endpoints:
- CreateInvestigation – Initiates a GuardDuty investigation that automatically analyzes security findings, correlates related activity, performs account-level analysis, and produces a structured investigation summary with recommended next steps.
- GetInvestigation – Retrieve the status and results of a specific investigation, including the assessment from the agent, correlated evidence, and recommended actions when completed.
- ListInvestigations – View investigations across your environment with filtering and pagination.
To run investigations using the AWS CLI
Investigations are asynchronous because the agent queries multiple data sources, correlates findings across services, and performs AI-based analysis. After creating an investigation, you’ll need to check its status periodically until it completes.
Step 1: Find your detector ID
Each GuardDuty deployment has a unique detector ID per-account and per-Region that identifies your specific GuardDuty configuration. You will need this for all AWS CLI operations, especially if you have GuardDuty enabled in multiple Regions. You can find your detector ID in the GuardDuty console under Settings, or by running the following command and specifying the Region. For example, if the GuardDuty detector of interest were in the us-east-1 (N. Virginia) Region
aws guardduty list-detectors –-region=us-east-1
Expected response:
Note: the
DetectorIDvalue from the response, you will use it in all subsequent commands.
Or if working only in the same Region, the session can be set as an environment variable to avoid repetition, for example on Linux:
export AWS_DEFAULT_REGION=us-east-1
See the AWS CLI documentation for guidance on configuring this for additional operating systems.
Step 2: Create an investigation
The following is an example of code to investigate a specific finding:
The --trigger-prompt parameter is useful when you have context that isn’t captured in GuardDuty metadata or consumable through the API.
Expected response:
To investigate findings across an entire AWS account, use the following example:
To investigate findings across an entire organization:
Step 3: Check investigation status
Check the status of the investigation shown here using the AWS CLI query command to filter and list only the Status section of the output for simplicity:
Repeat this command until the Status field shows COMPLETED.
Example completed response output:
- Status values –
RUNNING,COMPLETED,FAILED - Timing – Investigation times can very. Checking status every 30 seconds should be sufficient to yield results.
- If status shows FAILED – Review the error message in the response and verify your permissions match the authorization model requirements.
To list all investigations for a given detector run the following, the max-results command is optional but useful to filter the number of returned results.
Beyond running investigations manually, the API-first design addresses a common customer pattern: sending GuardDuty findings to third-party tools. You can now add automated investigation to those existing pipelines, so your team receives enriched, prioritized intelligence rather than raw alerts.
Consider a customer that routes GuardDuty findings through Amazon EventBridge to their Security Information and Event Management (SIEM) platform, where analysts manually investigate each alert. With the investigation agent, an AWS Lambda function can be placed into the pipeline that calls CreateInvestigation with the finding ID, waits for completion, and forwards the enriched results (risk level, confidence score, MITRE ATT&CK mapping, and recommended actions) to their SIEM alongside the original finding. Critical findings route directly to the customer incident response queue for further analysis or automation. Low-risk findings with high confidence get auto-closed or batched for weekly review. The analyst’s time shifts from repetitive log correlation to validating assessments and acting on confirmed threats.
This pattern works with SIEMs, ticketing systems, or automation platforms that can be customized to use the API or EventBridge messaging. The investigation agent fits into the pipeline as a processing step, not a destination.
The agent is fine-tuned on investigating GuardDuty findings. It’s distinct from other AWS frontier agents such as the AWS Security Agent and AWS DevOps Agent. The scope of the investigation agent is focused to deliver specialized analysis of GuardDuty findings.
Integration with the AWS MCP server
The Model Context Protocol (MCP) is an open standard that allows AI assistants to securely connect to external data sources and tools. Because the AWS MCP server implements this standard for AWS services, you can use it to add GuardDuty investigations into AI-powered workflows using tools like Kiro, Anthropic’s Claude, or other MCP-compatible clients.
To configure the AWS MCP server
- Configure your MCP client to connect to the AWS MCP server.
- Use natural language to invoke investigations (for example,“Investigate the recent Unauthorized Access finding for account 123456789012″).
- Review the investigation results returned through your MCP client. These results can vary depending on the model or agent being used, configuration, and the non-deterministic nature of AI.
Integrate the results into your existing agent automation or take manual action based on the findings.
Additional usage examples
- “Investigate the latest high-severity finding in my production account”
- “Create an investigation for finding ID abc123 in account 987654321098 and summarize what happened”
- “List investigations from the last 24 hours and flag those that need human review”
How the investigation agent relates to AWS Security Incident Response
At re:Invent 2024, AWS launched AWS Security Incident Response (AWS SIR), a managed service that you can use to quickly prepare for, respond to, and recover from security incidents. AWS SIR and the GuardDuty investigation agent address different stages of your security workflow. The GuardDuty investigation agent provides an on-demand assessment capability. When your team needs deeper context on a specific finding, an account security posture, or the overall security posture of your organization. You create an investigation and receive a structured assessment with risk levels, confidence scores, MITRE ATT&CK® technique mappings, and actionable recommendations. Security analysts can use this to quickly understand the scope and severity of what GuardDuty has detected.
When you create an AWS-supported case through AWS SIR, a SIR investigation agent activates, working in parallel with AWS Security Incident Response engineers to gather evidence and deliver an investigation summary within minutes. AWS SIR is purpose-built for active security events where you need both AI-powered automation and human expertise to coordinate containment and recovery.
Security teams can use these capabilities to assess and prioritize findings on demand using the GuardDuty investigation agent, escalate confirmed issues to stakeholders with supporting evidence, and create or update an AWS-supported case to accelerate involvement from the AWS SIR team when additional support is needed.
Availability and pricing
Public preview of the GuardDuty investigation agent is available in 10 AWS Regions including US East (N. Virginia), US East (Ohio), US West (Oregon), Canada (Central), Europe (Frankfurt), Europe (Ireland), Europe (London), Europe (Paris), Europe (Stockholm), and Asia Pacific (Tokyo).
During public preview, the investigation agent is available at no charge. Usage is limited to 10 investigations per account per day, with a cumulative limit of 100 investigations per account during the preview period. Failed investigations do not count toward these quotas.
Start investigating findings today
The Amazon GuardDuty investigation agent reduces investigation time from hours to minutes, letting your security team focus on confirmed security events rather than manual correlation.
Get started by:
- Enabling the investigation agent in your GuardDuty console
- Creating your first investigation using a recent GuardDuty finding
- Reviewing the structured assessment, including risk level and recommended next steps
For organizations using the AWS MCP server, you can also invoke investigations through natural language in your AI assistant of choice.
Learn more
- Amazon GuardDuty Investigation Agent documentation – Detailed configuration and usage guidance
- IAM permissions reference for GuardDuty – Required permissions for investigation operations
- Amazon EventBridge User Guide – Learn how to route investigation events to downstream systems
- MITRE ATT&CK®Framework – Getting started resources
- AWS Security Incident Response – AWS Security Blog article
- AWS Activation Days – Information about upcoming complimentary events that provide you prescriptive guidance to achieve outcomes when using AWS
If you have feedback about this post, submit comments in the Comments section below.
Cloudflare Internal DNS is now generally available
Post Syndicated from Enrique Somoza original https://blog.cloudflare.com/internal-dns/
Starting today, Cloudflare Internal DNS is generally available. Cloudflare Internal DNS provides authoritative and recursive DNS for private networks on the same global network and control plane customers already use for public DNS, Zero Trust, networking, and application services.
Internal DNS — sometimes also referred to as private DNS — is one of the last pieces of enterprise infrastructure still managed separately from the rest of the network. Many organizations operate one platform for public DNS, another for internal DNS, and use cloud-native DNS services inside each cloud environment with separate security policies layered on top. None of these systems share a common control plane. Split-horizon DNS adds another layer of complexity, often requiring multiple DNS environments to remain synchronized so internal and external users receive different answers for the same hostname. When those systems drift, outages follow.
With Cloudflare Internal DNS, you get a single platform to manage public and private DNS resources, enforcing DNS policies and gaining visibility across your entire DNS stack. For Enterprise customers, this is included with Cloudflare Gateway without any additional charge.
Why customers are adopting Internal DNS
Consolidate DNS operations. Public and private DNS run on one platform, with one API, one audit trail, and one place to set policy. The appliance refresh cycle and the scaling bottlenecks that came with legacy DNS go away.
Simplify split-horizon DNS. Internal and external resolution are defined as separate views over shared zones, managed from a single control plane. There are no parallel systems to keep in sync, so there's no drift to chase down.
Extend Zero Trust to DNS. Resolver policies decide which users and devices resolve against which view, enforced by the same Cloudflare Gateway that already governs the rest of your traffic. Private name resolution stops being the gap in an otherwise Zero Trust architecture.
Modernize legacy infrastructure. Retire hardware appliances, legacy DNS servers, and cloud-locked resolvers. Cloudflare Internal DNS runs on the infrastructure behind 1.1.1.1, with no hardware to rack and no capacity to provision.
What we built
Cloudflare Internal DNS consists of two components: Gateway Resolver and Internal Authoritative DNS. Authoritatively managing zones is a different job from enforcing DNS security and routing policies.
The Gateway Resolver handles recursive resolution and policy evaluation. Launched in 2020 and powered by 1.1.1.1 for public resolution, it comes with a built-in policy engine that can filter DNS queries and redirect queries to different upstream sources — all based on flexible expressions, with comprehensive logging and audits feeding a single pane of glass.
Internal Authoritative DNS serves records for internal zones built on the same authoritative platform Cloudflare has operated for over a decade and that serves more domains than any other provider.
There are three primary objects customers work with:
- Internal Zones hold the authoritative records for private resources: environment-specific apps, service endpoints, databases.
- DNS Views group zones into the resolution context a given set of users or devices should see. This is what makes split-horizon work without parallel systems.
- Resolver Policies sit in Gateway and route matching queries to a specific view.
Zone references let administrators reuse a shared zone across multiple views rather than copying its records into each one. A common zone like intranet.local is defined once and referenced everywhere it's needed, which is the difference between a Don't-Repeat-Yourself configuration and the duplicated, drift-prone setup that split-horizon usually forces.
How a query resolves
A DNS query from a client first hits the Gateway Resolver, where policy is evaluated. From there, one of three things happens. If a resolver policy matches and points at an internal view, the query is routed to Internal Authoritative DNS and answered from the matching view's zones. If policy blocks the query, it is dropped at the resolver. Otherwise, the query follows the public path, with 1.1.1.1 resolving it against the public DNS hierarchy. Views can also fall back to public resolution when a name isn't found internally, so a single resolver can serve both private and public names without the client needing to know which is which.
How a change propagates
Record changes follow a predictable, high-speed path from input to edge.
Every change enters through the same DNS Records API, whether it originates in the dashboard, in Terraform, or in a direct API call. That unified ingress means there is exactly one write path to reason about and audit, regardless of how the change was made. The change is persisted in Cloudflare's core data centers for durability and validated before it propagates.
From there, changes replicate across Cloudflare's global network and affected cached entries are invalidated as the updates arrive, so edited records take effect in seconds rather than waiting on TTL expiry.
Getting started
If you're an Enterprise customer using Cloudflare Gateway, you have access to Internal DNS today. Open the Cloudflare dashboard, navigate to Networking, then Internal DNS.
Setting up Internal DNS typically takes three steps: create a zone, create a view, and define a resolver policy that determines which users and devices should resolve against that view.
Create an internal zone and your first internal record:
Then create a DNS view and link your zone to it:
Finally, create a Gateway resolver policy in the Zero Trust dashboard that routes matching traffic to your view. Create a Gateway location, set your conditions, select Internal DNS View as the resolution method, and choose your view. That's it. Queries matching your policy now resolve against your internal zones.
Terraform support is available, and because Terraform writes through the same DNS Records API as everything else, infrastructure-as-code changes follow the identical ingestion and propagation path. Full documentation and end-to-end configuration examples are available in our developer documentation.
Internal DNS as part of the Connectivity Cloud
Internal DNS works with any Cloudflare connectivity method that routes DNS traffic through the Gateway Resolver, including the Cloudflare One Client (formerly WARP), DNS over HTTPS (DoH), DNS over TLS (DoT), standard DNS on port 53, PAC file deployments, and Cloudflare WAN.
For organizations running Cloudflare WAN, every device on the connected network can resolve internal hostnames through Cloudflare without requiring the Cloudflare One Client on individual devices. The result is a consistent DNS experience across remote users, branch offices, data centers, and cloud environments using a single control plane.
More importantly, Internal DNS is not a standalone DNS service. It extends the same Connectivity Cloud platform that organizations already use to secure users with Zero Trust, connect networks with Cloudflare WAN, accelerate applications, and protect Internet-facing services.
Bringing private DNS onto the same global network as everything else is just the starting point. Tighter integration across DNS, networking, and Zero Trust policy is where this goes next — so resolving an internal hostname, reaching the service behind it, and enforcing who is allowed to access it become decisions made through a single platform, rather than multiple disconnected systems.
Ready to consolidate your DNS? Open the dashboard, head to Networking, then Internal DNS, and create your first zone today. Questions or want to compare notes with other operators? Join the conversation in the Cloudflare Community.
[$] Fedora grapples with change
Post Syndicated from jzb original https://lwn.net/Articles/1081557/
The Fedora Project is known for,
among other things, having a well-defined set of processes for just about
everything. It has extensive packaging
guidelines that deal with the complexities of creating RPMs to install
software, as well as processes for managing the legal questions that
arise around shipping software. Fedora also has a well-defined change
process for dealing with self-contained technical changes as well as major
changes to the distribution, and other issues as they arise. At the moment,
though, the project seems to be experiencing a sort of midlife crisis as it
re-examines several of its change processes at once to determine if they are
still effective.
Intel To Add Support for Gen 2 MRDIMMs and Faster DDR5 RDIMMs to Xeon 6 Platform
Post Syndicated from Ryan Smith original https://www.servethehome.com/intel-to-add-support-for-gen-2-mrdimms-and-faster-ddr5-rdimms-to-xeon-6-platform/
Intel this morning is announcing that parts of the Xeon 6 family are going to be getting mid-generation memory upgrades with support for DDR5-8000 RDIMMs as well as Gen 2 MRDIMMs
The post Intel To Add Support for Gen 2 MRDIMMs and Faster DDR5 RDIMMs to Xeon 6 Platform appeared first on ServeTheHome.
How Alight Solutions achieved 55% cost savings with Amazon OpenSearch Service
Post Syndicated from Mark Larson original https://aws.amazon.com/blogs/big-data/how-alight-solutions-achieved-55-cost-savings-with-amazon-opensearch-service/
This is a guest post by Mark Larson, Andrew Kummerow, and Tim Razik at Alight Solutions, in partnership with AWS.
Alight Solutions is a leading cloud-based human capital technology and services provider focused on integrated benefits administration, healthcare navigation, and employee experience solutions. The company serves hundreds of enterprise customers globally, with services that support millions of people worldwide.
Alight’s technology stack generates over 1 billion log records per day across their containerized microservices architecture, with peaks reaching 100,000 records per second during Annual Enrollment periods. Previously, Alight relied on a self-managed Elastic Stack (Elasticsearch, Logstash, Kibana) deployment that had been in production since 2018. As their logging volumes grew and Elasticsearch 7.x approached end of support, the operational burden of maintaining this infrastructure consumed their entire operational budget, leaving no capacity for innovation.
In this post, we share how Alight Solutions migrated from self-managed Elasticsearch to Amazon OpenSearch Service. The migration achieved a 55% cost reduction, alleviated approximately 2,000 hours per year of operational overhead, and gave Alight access to advanced observability features they could not prioritize before.
Challenges with self-managed Elasticsearch
Alight’s self-managed Elastic Stack infrastructure presented compounding technical and operational challenges. Their production environment consisted of 15 Elasticsearch nodes with 168 TB of EBS storage, handling log ingestion from their flagship Alight Worklife system and supporting applications. The infrastructure required an Elastic Platinum subscription, though the team’s operational bandwidth was fully consumed by maintenance, leaving limited capacity to adopt advanced features included in the license.
The operational pain points included:
- Security vulnerability patching required working over Christmas holidays to address critical fixes, with no flexibility on timing.
- Elastic upgrades were time-consuming and required depth of knowledge to manage at scale.
- Logstash using TCP-socket shipping was unreliable, experiencing log loss at high volumes.
- Backpressure from Logstash caused two P1 incidents over two years, where the logging subsystem directly impacted microservice tasks.
- Elasticsearch 7.x approaching end of support created urgency to act before the next Annual Enrollment period (September through January).
Alight was spending more than $100,000 per month on self-managed infrastructure and Elastic licensing across all environments. All operational budget was consumed by cluster maintenance, leaving zero capacity for innovation.
Evaluating alternatives
Alight evaluated several alternatives before selecting OpenSearch Service:
- New Relic and Dynatrace were evaluated for log aggregation but proved prohibitively expensive at Alight’s volume.
- Amazon CloudWatch was evaluated but did not meet requirements for complex log research at their volume and visualization complexity.
Amazon OpenSearch Service is a managed service that makes it straightforward to deploy, operate, and scale OpenSearch clusters in the AWS Cloud. You can use it for use cases such as log analytics and real-time application monitoring. It provisions cluster resources, automatically detects and replaces failed nodes, and scales with a single API call or a few clicks, reducing the operational overhead associated with self-managed infrastructure. It won the evaluation based on five factors:
- Cost: significantly cheaper than self-managed Elastic Stack and competing solutions.
- Minimal change management: as a fork of Elasticsearch 7.10, engineers were already familiar with the query syntax and dashboards.
- Compliance: using a native AWS service avoided hundreds of hours of vendor compliance, audit, and regulatory work. The team spent a few hours getting approval compared to potentially weeks for an external vendor.
- Cloud-native strategy: aligned with Alight’s overarching strategy to use cloud-native services.
- Security and data privacy: keeping everything within their AWS landing zone alleviated data egress concerns.
Solution overview
Alight partnered with AWS to design a cloud-native log aggregation architecture that replaced self-managed Elasticsearch and Logstash with Amazon OpenSearch Service and Amazon OpenSearch Ingestion (OSIS), alleviating the operational burden, including the Logstash backpressure that had caused two P1 incidents.
The architecture uses a cross-account model with two primary account types:
- Application accounts: where Amazon Elastic Container Service (Amazon ECS) and Amazon Elastic Compute Cloud (Amazon EC2) workloads run, generating logs.
- Shared services account: hosting the OpenSearch domain, OSIS pipelines, and OpenSearch Dashboards.
The following diagram illustrates the solution architecture.
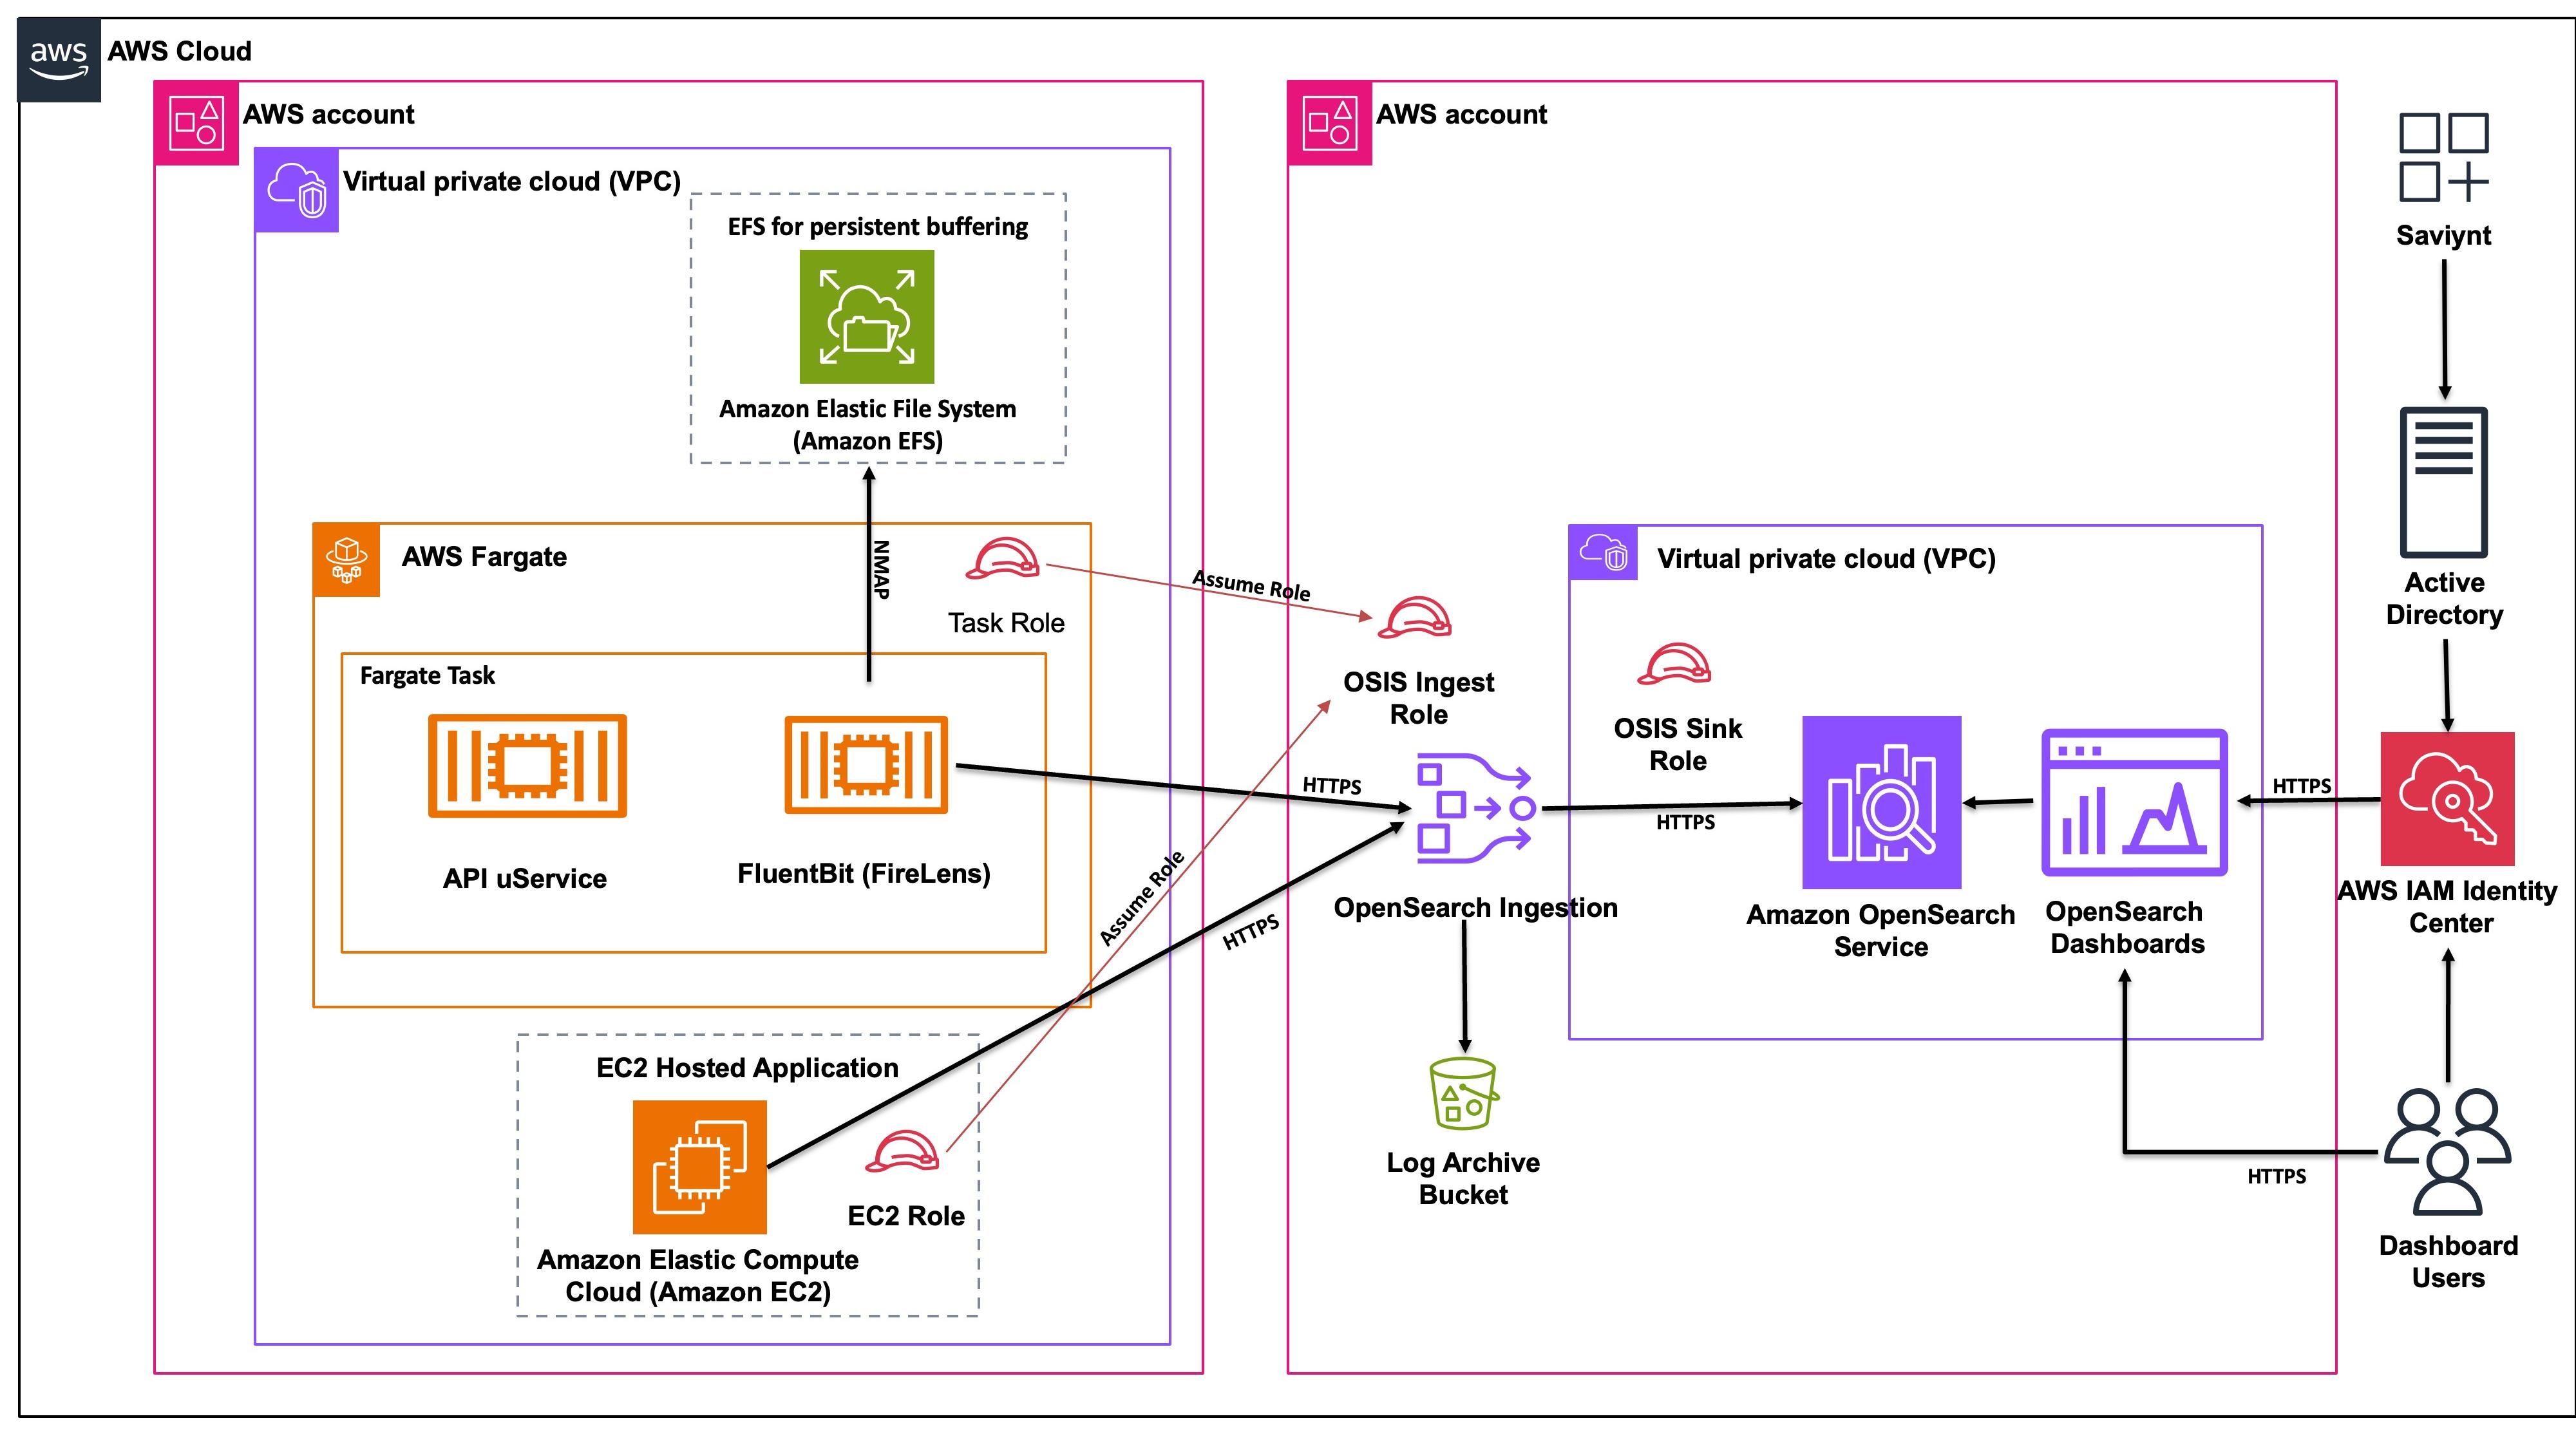
Alight OpenSearch Service architecture showing cross-account log ingestion from Amazon ECS and Amazon EC2 workloads through OpenSearch Ingestion to Amazon OpenSearch Service
Ingestion paths
The solution supports multiple ingestion paths depending on the application hosting model:
- ECS applications: FireLens/Fluent Bit sidecar containers capture stdout/stderr through the awsfirelens log driver, then ship logs over HTTPS directly to OSIS in the shared services account. ECS task roles assume a cross-account OSIS Ingest Role for authentication.
- EC2 applications: Open-source Fluent Bit (RPM-based, non-containerized) uses tail input to read log files, then ships to OSIS through an EC2 IAM Role with cross-account trust.
- S3-based ingestion (planned): Some applications write to Amazon Simple Storage Service (Amazon S3) with Amazon Simple Queue Service (Amazon SQS) notifications triggering OSIS pipelines.
Spring Boot microservices use a custom logging framework built on Logback (not Log4j) that formats logs as JSON and flushes to console, which FireLens picks up.
Security model
Traffic flows over HTTPS. The security model uses role separation with least privilege:
- OSIS Ingest Role: write-only access to OSIS pipelines, assumed by application account roles via cross-account trust.
- OSIS Sink Role: used by OSIS to write into the OpenSearch domain, with full index access scoped to the ingestion pipeline.
- Security groups: restrict OSIS traffic to known CIDRs and VPCs.
Each application has its own indices, and access is governed by application-specific roles.
Persistent buffering
Amazon Elastic File System (Amazon EFS) provides persistent filesystem buffering for the Fluent Bit sidecar, helping prevent log loss during transient failures or backpressure events. This directly addresses the P1 incidents Alight experienced with Logstash. For the next Annual Enrollment period, Alight plans to also enable persistent buffering at the OSIS layer to handle burst ingestion without log loss.
User access
End-user access to OpenSearch Dashboards is managed through AWS IAM Identity Center with System for Cross-domain Identity Management (SCIM) synchronization from Alight’s enterprise Identity Provider. Users navigate to the Applications tab in Identity Center to access OpenSearch Dashboards over SAML/HTTPS.
At Alight, IAM Identity Center and SCIM are configured in the payer account. They use the same synchronization and entitlement request and approval process that governs Alight’s user and entitlement provisioning into AWS. With this setup, the team uses the same single sign-on (SSO) and entitlement workflow for OpenSearch Dashboards access as for the AWS Management Console, in conjunction with fine-grained access control (FGAC) defined within the OpenSearch domains.
OpenSearch domain configuration
For their production workload, Alight deployed:
| Component | Configuration |
| Data nodes | 18 im4gn.2xlarge.search |
| UltraWarm nodes | 9 |
| Dedicated leader nodes | 3 |
| Hot tier storage | 25 TB |
| UltraWarm storage | 180 TB |
| Primary logical data | 80 TB |
| Total with replicas | 100-105 TB |
Additional environments include a secondary production cluster (12 hot nodes, 3 UltraWarm, 3 dedicated leader nodes), plus client test and engineering clusters with 3 hot nodes each.
Migration process
The migration was completed over seven months (February through August 2025), with five applications migrated including the flagship Alight Worklife application.
Infrastructure as code
The team built new Terraform modules to manage deployment of OSIS pipelines, OpenSearch domains, and FireLens sidecar additions to ECS applications. Onboarding new applications is now templatized, resulting in significant time savings compared to adding new indices in Elasticsearch. Onboarding a new application now takes between 4-8 hours, whereas before we would spend 80-120 hours per application.
Migration timeline
Alight first enabled Amazon OpenSearch Service in production for two smaller applications, to make sure operational processes were up and running before migrating the highest volume log producers. For each application, logging to OpenSearch was enabled while continuing to write logs to the existing logging infrastructure. This parallel run allowed fine-tuning of OSIS pipeline configuration, OpenSearch cluster size and configuration before doing a full cutover. This approach also validated that logs were being ingested properly into OpenSearch. It confirmed that the performance of OpenSearch Dashboards and queries was as good as or better than the existing self-managed Elasticsearch cluster.
For historical data, Alight migrated the most recent 30 days of live data from Elasticsearch into OpenSearch just prior to cutover. They also retained a full archive of older log data in an Amazon S3 bucket, so that data older than 30 days could be loaded into OpenSearch on request if a user needs it.
AWS partnership
Alight engaged the AWS team during the evaluation phase. Through AWS Enterprise Support, their Technical Account Manager (TAM) served as the dedicated point of contact throughout the journey. The TAM coordinated sessions with OpenSearch Service subject matter experts to address specific service capabilities, help with design, troubleshoot issues, and provide performance guidance.
Results
The migration to Amazon OpenSearch Service delivered results across cost, operations, and capability dimensions.
“Alight’s mission critical applications are built on hundreds of interdependent microservices, so effective application logging is critical for analyzing system behaviors, performance tuning, and troubleshooting. Amazon OpenSearch Service provides us with great log analytics, very cost effectively at scale, and integrates seamlessly with our IAM strategy for granular access control and authorization. The ability to reconfigure, resize, and upgrade OpenSearch domains with a few clicks and zero downtime is a game changer for us.”
— Mark Larson, Enterprise Architect
Cost and licensing
| Metric | Before | After | Improvement |
| Monthly infrastructure + licensing cost | Self-managed EC2/EBS + Elastic Platinum licensing | Fully managed OpenSearch Service, no separate licensing | ~55% cost reduction |
| Licensing model | Elastic Platinum (fixed) | Zero licensing cost | No longer needed |
Not all Elasticsearch clusters are decommissioned yet. Once decommissioning is complete, savings will reach approximately 65%. Additionally, more applications have been added to OpenSearch than were originally on Elasticsearch, making the per-application cost even more favorable. Beyond compute and licensing, the migration also reduced data transfer costs previously incurred across the self-managed cross-account architecture, adding further to the overall savings.
Operational improvements
| Metric | Before | After |
| Engineering hours on cluster management | 2,000 hours/year (≈1 FTE) | Near zero (managed service) |
| Security vulnerability patching | Manual, including holiday work | Handled by AWS |
| Application onboarding | Manual index creation and configuration | Templatized via Terraform |
| P1 incidents from logging subsystem | 2 in past 2 years | Zero since migration |
Performance and scale
| Metric | Value |
| Daily log volume | 1 billion records |
| Peak ingestion rate | 100,000 records/second |
| Applications migrated | 5 (including Alight Worklife) |
| Total data under management | 100–105 TB with replicas |
Lessons learned and best practices
Through their migration journey, Alight gained the following insights:
- Use your account team relationship to advocate: When Fluent Bit had a blocking issue, the AWS account team relationship helped push for the fix and provided workaround guidance.
- Separate concerns for data durability: Do not put 100% delivery guarantees on logging infrastructure. Use a separate event stream (such as Amazon SQS) for critical data that cannot tolerate loss.
- Templatize everything: Terraform modules for OSIS, OpenSearch domains, and FireLens sidecars reduce the time to onboard new applications.
- Security architecture matters: Separating ingest roles from sync roles (least privilege) and using cross-account trust provides strong security without complexity.
- Plan around business-critical periods: Pausing the production rollout during Annual Enrollment was the right call. The risk of introducing changes during peak was not worth the schedule pressure.
What’s next
Alight has several initiatives planned to expand their OpenSearch Service usage:
- Anomaly detection: top priority, a feature they paid for with Elastic Platinum but never had capacity to implement.
- Amazon OpenSearch Serverless: evaluating for new log sources, particularly interested in zero-OCU baseline for cost optimization.
- OSIS persistent buffer: planned for next Annual Enrollment to handle burst ingestion without log loss.
- Amazon Bedrock AgentCore logging: new artificial intelligence (AI) workloads will send logs to OpenSearch.
- AI-assisted log analytics: adopting the agentic AI capabilities now built into Amazon OpenSearch Service. These include the Investigation Agent for autonomous, hypothesis-driven root cause analysis, which helps site reliability engineering (SRE) and engineering teams gain deeper insights from application logs.
- Vector database: already using OpenSearch as a vector store for a conversational AI assistant (separate team).
- Migration progress: All workloads previously logging to Elasticsearch have been migrated to OpenSearch, plus an additional eight applications.
- Enterprise Logging Service: All new applications will now log to Amazon OpenSearch Service by default using the templatized approach.
- Decommission: All existing Elasticsearch instances will be decommissioned by July 2026.
Conclusion
Alight’s migration from self-managed Elasticsearch to Amazon OpenSearch Service demonstrates how enterprises can alleviate operational burden while achieving significant cost savings. By using Amazon OpenSearch Ingestion and FireLens, Alight built a scalable log aggregation system that handles 1 billion records per day with zero P1 incidents since deployment.
The 55% cost reduction and approximately 2,000 hours per year of recovered engineering time have freed Alight to pursue advanced observability capabilities like anomaly detection and AI-powered log analytics, features they paid for but could never use under the operational weight of self-managed infrastructure.
To learn more, see the Amazon OpenSearch Service documentation. To get started with ingestion pipelines, see Amazon OpenSearch Ingestion. For migration guidance, see Migrating to Amazon OpenSearch Service.
About the authors
Govern Amazon Redshift Data Warehouses Data Across Accounts using Amazon SageMaker Unified Studio
Post Syndicated from Bandana Das original https://aws.amazon.com/blogs/big-data/govern-amazon-redshift-data-across-accounts-with-sagemaker-unified-studio/
Managing data governance across multiple Amazon Redshift clusters in different AWS accounts presents significant challenges. Organizations operating multiple Amazon Redshift clusters across AWS accounts often rely on manual processes for secure data sharing, which increases operational overhead and governance requirements. In this post, we show you how to use Amazon SageMaker Unified Studio to implement cross-account data sharing in Amazon Redshift using data mesh principles. We demonstrate how to build a scalable data mesh architecture that supports secure, auditable data sharing across AWS accounts while reducing operational burden.
Amazon SageMaker Unified Studio as the backbone of our data mesh
Amazon SageMaker Unified Studio is a data and AI development service which brings together functionality and tools from existing AWS Analytics and AI and machine learning (ML) services, including Amazon EMR, AWS Glue, Amazon Athena, Amazon Redshift, Amazon Bedrock and Amazon SageMaker AI. With the service, organizations can catalog, discover, share, and govern data stored across Amazon Web Services (AWS) without relying on manual coordination between AWS accounts.
A data mesh is an architectural approach that treats data as a product, with decentralized ownership by data producers while maintaining centralized governance. This architecture separates source systems, data producers (data publishers), data consumers (data subscribers), and central governance. The solution we present is tailored for cross-AWS account usage, creating a foundation for data governance so you can share data across Amazon Redshift clusters in different AWS accounts.
Our proposed solution addresses the following common challenges that organizations face when sharing data across AWS accounts:
- Manual, ad-hoc data sharing processes are replaced with automated, event-driven data publishing to the SageMaker Unified Studio catalog.
- Inconsistent governance across different use cases is resolved through a consistent governance framework with proper access controls.
- High load on producer Amazon Redshift clusters is reduced through decoupled publishing that lowers the operational burden on data producers.
- Complex credential management is simplified using AWS Secrets Manager and AWS KMS encryption.
- Lack of auditable data publishing is addressed with full traceability of access and permissions supported by the SageMaker Unified Studio service.
With this approach, you can help reduce the time and effort required for cross-account data sharing while maintaining security and governance standards.
Architectural overview
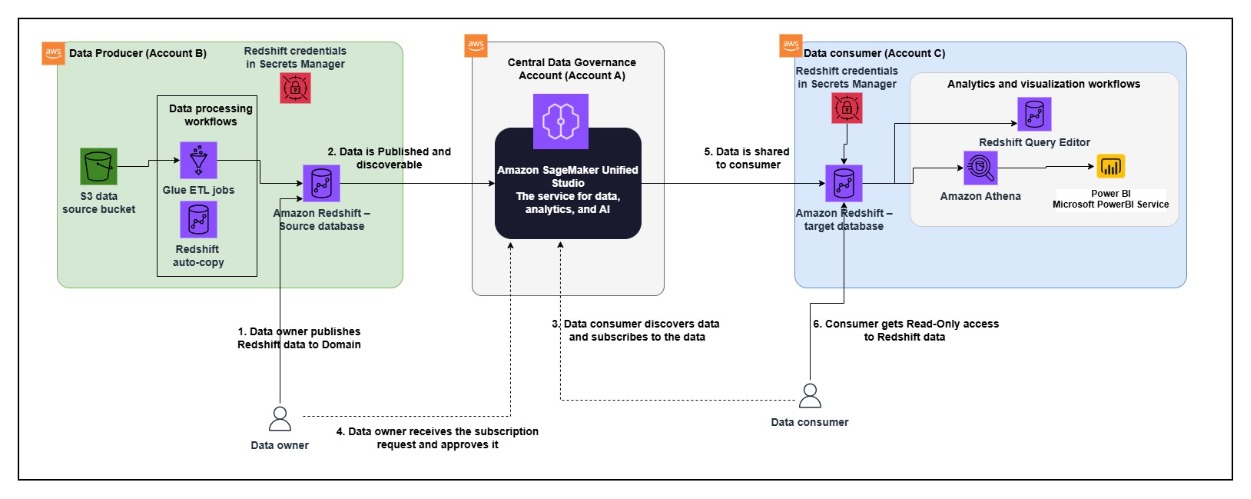
The architecture spans three AWS accounts, each with a distinct role in the data mesh:
Central Data Governance Account (Account A) hosts the Amazon SageMaker Unified Studio domain, which serves as the unified catalog and governance layer for data discovery, access control, and subscription management across accounts.
Data Producer (Account B) hosts the source of data and processing workflows. Raw data lands in an Amazon Simple Storage Service (Amazon S3) source bucket and is processed through AWS Glue extract, transform, and load (ETL) jobs or Amazon Redshift auto copy into the Amazon Redshift source database. Amazon Redshift credentials are securely stored in AWS Secrets Manager.
Data Consumer (Account C) hosts the target Amazon Redshift database and analytics workflows. After access is granted, consumers can query shared data and connect downstream visualization tools.
While this diagram shows a single producer and consumer for simplicity, in a real-world deployment there might be hundreds of producer and consumer accounts connecting through the central governance layer. Amazon SageMaker Unified Studio scales to support this by providing a single place for managing data products regardless of the number of participating accounts.
The data sharing workflow is driven by Amazon SageMaker Unified Studio. The data owner publishes data to the catalog, where it becomes discoverable by consumers across accounts. Consumers browse the catalog, subscribe to data products, and the data owner approves the request. After approval, Amazon SageMaker Unified Studio handles the cross-account sharing, granting the consumer access without requiring direct connectivity between producer and consumer Amazon Redshift clusters.
Publishing Amazon Redshift data assets to the data mesh
In a data mesh architecture, data producers need to make their data products discoverable and accessible across the organization. Amazon SageMaker Unified Studio provides a centralized catalog where data assets can be published for consumer subscription.
In practice, this means registering your data sources with the catalog so they can be discovered, governed, and subscribed to by consuming teams. This section walks through the steps required to register Amazon Redshift data sources with SageMaker Unified Studio.
Before you can publish data assets from your producer account, you need to complete several configuration steps across your Amazon Redshift cluster, AWS Secrets Manager, and Amazon SageMaker Unified Studio.
Prerequisites
- Install the AWS Command Line Interface (AWS CLI) (v2.15+ recommended).
- Obtain temporary credentials with permissions to administer each account (producer, consumer, and domain account)
- IAM permissions required:
redshift:*on the relevant clusters,secretsmanager:CreateSecret / PutResourcePolicy / TagResource,kms:CreateKey / PutKeyPolicy / TagResource,datazone:*for subscription-target creation, andiam:PassRolefor the Amazon Redshift cluster role. - Amazon Redshift clusters must use RA3 node types (ra3.xlplus, ra3.4xlarge, or ra3.16xlarge). Data sharing is not supported on other node types.
- Amazon SageMaker Unified Studio domain must already be created in Account A with the Tooling and LakeHouseCatalog blueprints available.
- All resources must be in an AWS Region where Amazon SageMaker Unified Studio is available.
Step 1: Account association and blueprint enablement
To implement the data mesh architecture described in the previous section, you need to set up the following accounts and enable the required blueprints. This ensures that the central governance layer can discover and manage data assets across your producer and consumer accounts.
This post uses three separate AWS accounts to illustrate the cross-account data sharing pattern. However, Amazon SageMaker Unified Studio also supports publishing and subscribing to data within a single account or across any number of accounts depending on your organizational setup. Additionally, this walkthrough uses a provisioned Amazon Redshift cluster, but Amazon SageMaker Unified Studio also supports Amazon Redshift Serverless for both publishing and subscribing to data assets.
- Amazon SageMaker Unified Studio Domain account (Account A) – This is the central data governance account, which will have the Amazon SageMaker Unified Studio Domain and Project.
- Data producer account (Account B) – This account acts as the data domain producer. It has been added as an associated account to Account A.
- Data consumer account (Account C) – This account acts as the data consumer. It has been added as an associated account to Account A.
- Log in to Data producer account (Account B) and Data consumer account (Account C).Open the Amazon SageMaker AI console, choose Associated domains, choose your domain, and enable the following blueprints: Tooling and LakeHouseCatalog
- Create a project profile for each associated account (Account B and Account C). Make sure you can log in to the SageMaker Unified Studio domain portal and create a corresponding project with relevant project profile within Amazon SageMaker Unified Studio Domain. You must be added as a member of the corresponding project
Step 2: Configure your Amazon Redshift cluster and credentials
- In the producer account (Account B), the data to be shared resides in an Amazon Redshift cluster.
- Verify that your Amazon Redshift cluster uses node types from the RA3 family.
- Add the following tags to your Amazon Redshift cluster.
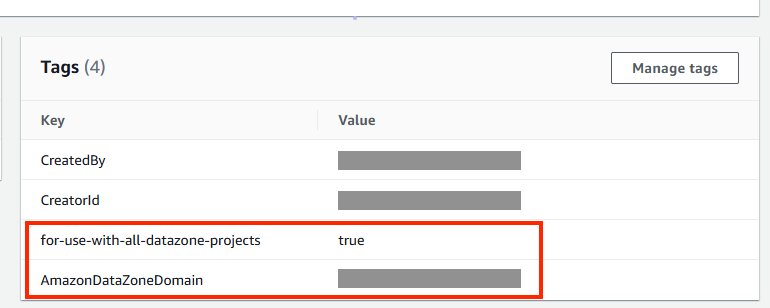
- Create a superuser in Amazon Redshift for Amazon SageMaker Unified Studio. For the Amazon Redshift cluster, the database user you provide in AWS Secrets Manager must have superuser permissions. With superuser permission, your Amazon Redshift cluster can publish data and subscribe from the data mesh created with Amazon SageMaker Unified Studio, and it manages the subscriptions (access) on your behalf. For reference, see the note section in this QuickStart guide with sample Amazon Redshift data.
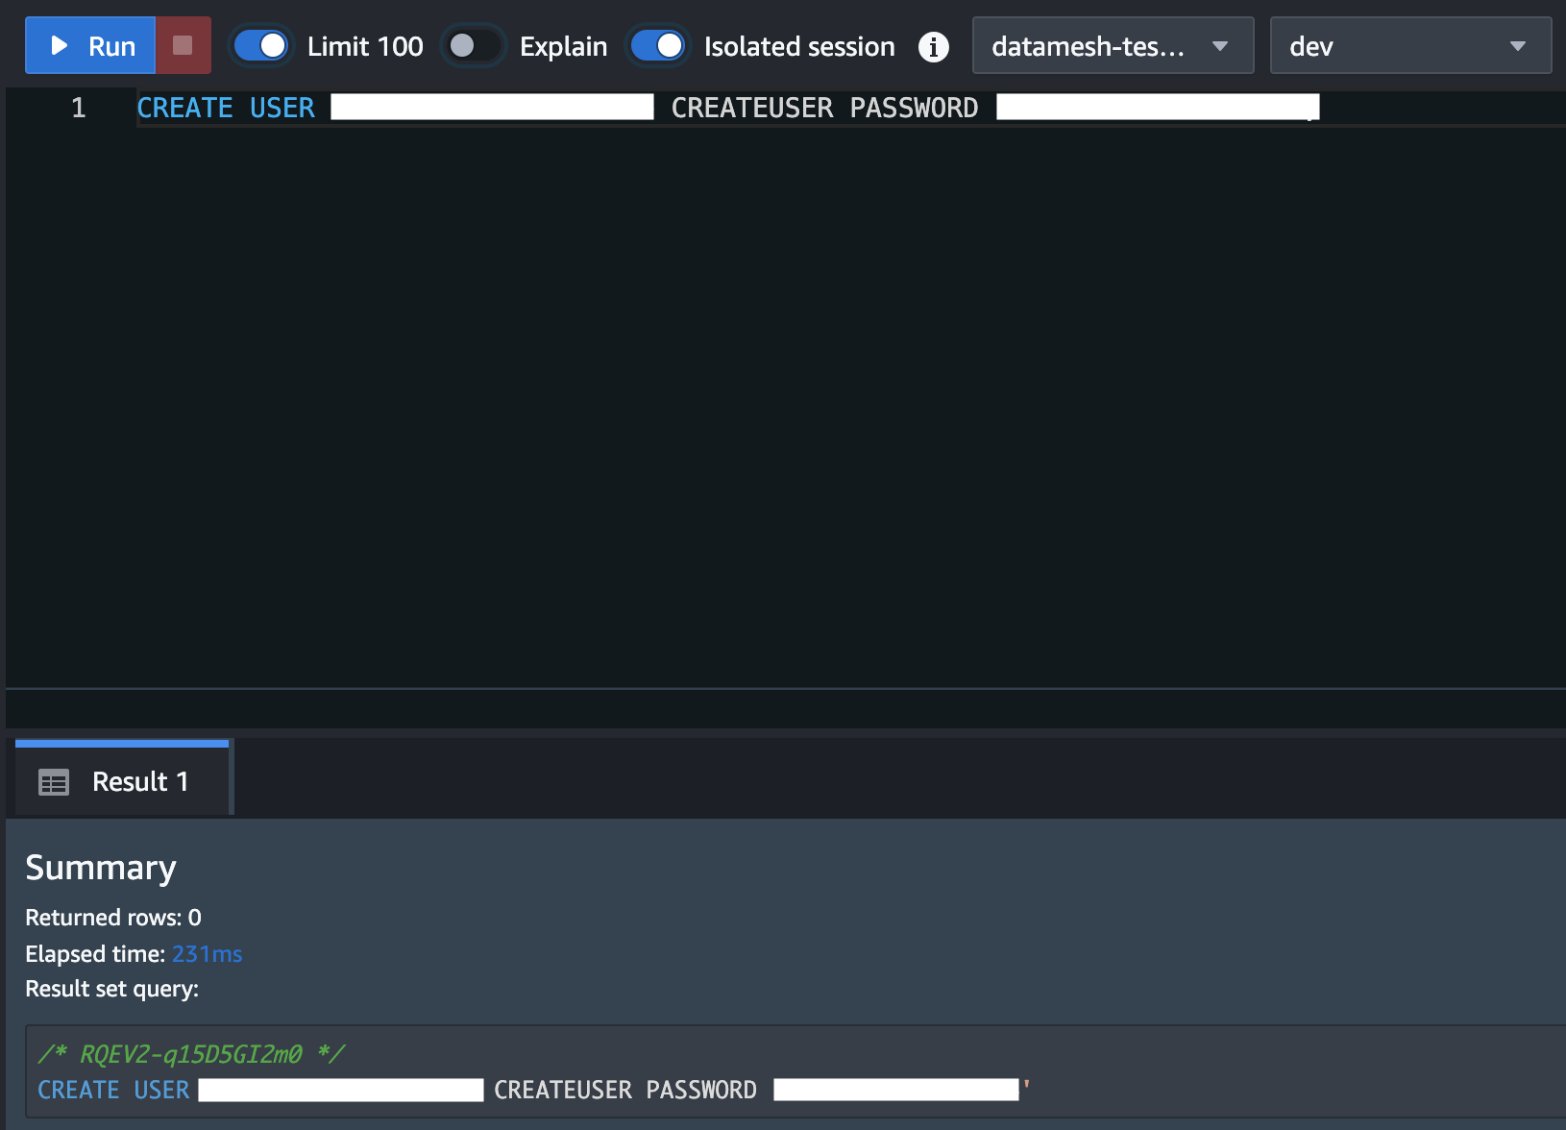
- Store the user’s credentials in Secrets Manager. Select the credential type, enter the credential values, and choose the AWS Key Management Service (AWS KMS) key with which to encrypt the secret
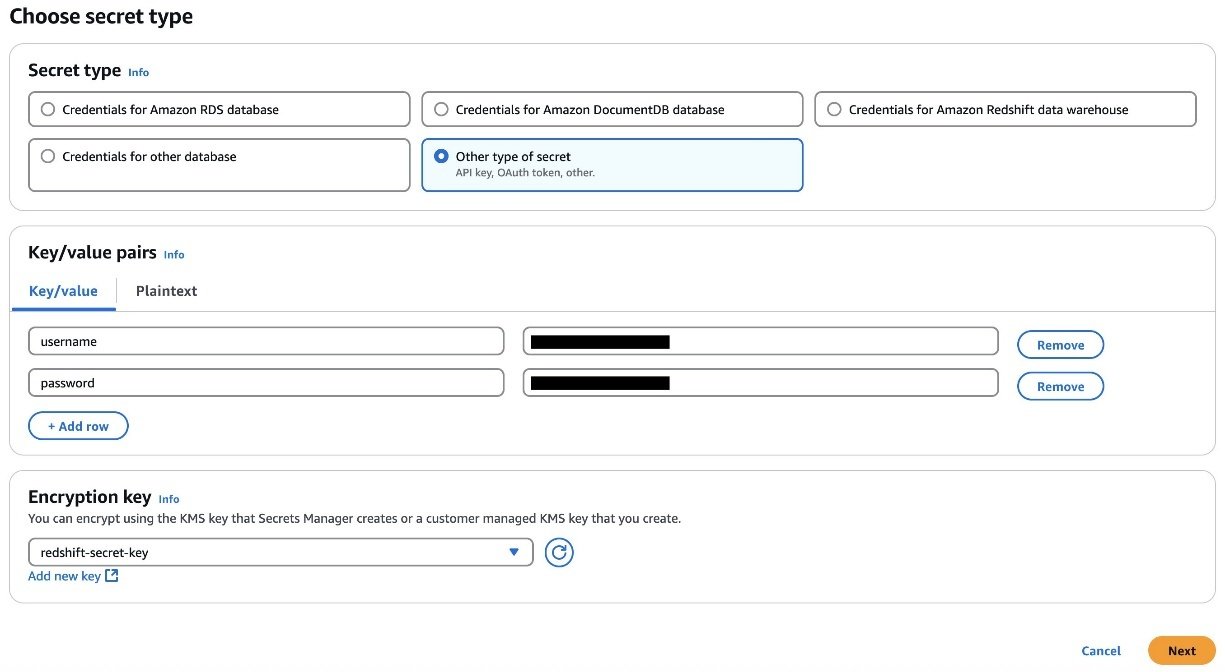
- Add the tags to the AWS Secrets Manager secret to allow Amazon SageMaker Unified Studio to find this secret and limit the access to a particular Amazon SageMaker Unified Studio domain. The Amazon Redshift cluster Amazon Resource Name (ARN) must be added as a tag. For reference, see the QuickStart guide with sample Amazon Redshift data.
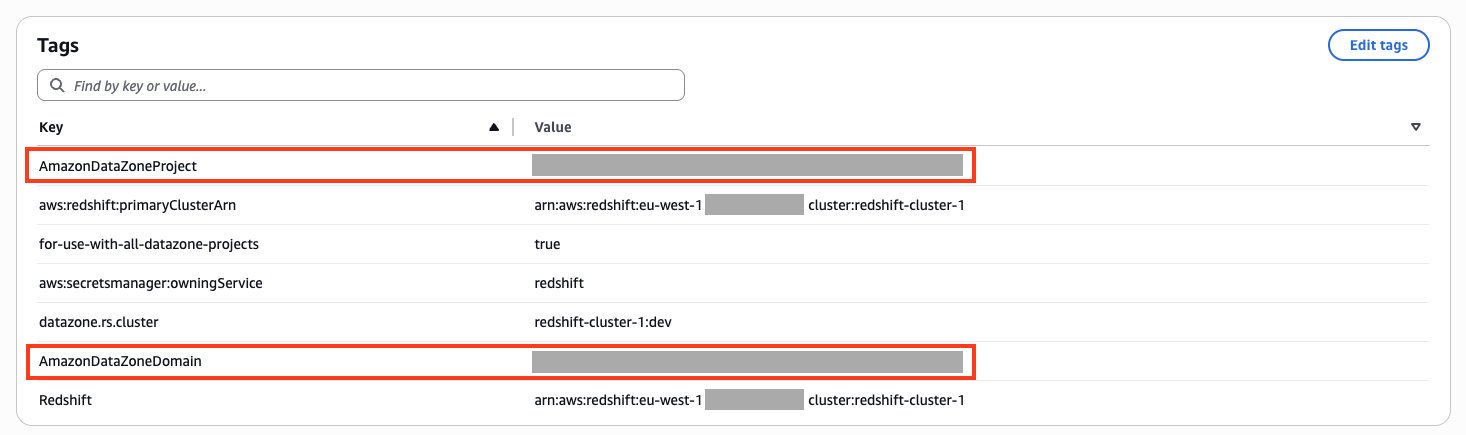
- Add the following resource policy to the secret. See the Amazon SageMaker Unified Studio Provisioning guide for the full reference.
- If your secret is encrypted with a customer managed AWS KMS key, append the key policy with the following statement and add a tag to the key:
AmazonDataZoneEnvironment = All. You can skip this step if you’re using an AWS managed KMS key.
Note: Enable automatic rotation. Configure Secrets Manager automatic rotation for this secret with a rotation interval appropriate to your security policy (for example, every 30 days). When implementing rotation, verify that the rotation Lambda function updates the credentials in both Secrets Manager and Amazon Redshift database users simultaneously. Note that Amazon SageMaker Unified Studio retrieves the secret at connection time, so rotation must produce credentials that are valid immediately upon storage: use the alternating-users rotation strategy if you need to avoid downtime during rotation. See the Secrets Manager rotation documentation for setup instructions.
Using Amazon Redshift Serverless?
- Add the following Tags to the Amazon Redshift Serverless namespace and workgroup.

- In the Secrets Manager secret, verify the host points to your Serverless endpoint.
- Add the following tags to the AWS Secrets Manager secret.
Publish Amazon Redshift data to the data mesh
With prerequisites complete, you can now register your Amazon Redshift cluster as a data source in Amazon SageMaker Unified Studio.
Step 1: Create an Amazon Redshift type connection
- Sign in to Account B, navigate to your Amazon SageMaker Unified Studio associated domain, and open the Amazon SageMaker Unified Studio URL.
- Follow the instruction here to Add an Amazon Redshift Connection
- The newly created Amazon Redshift connection appears here.
Step 2: Create the data source for your Amazon Redshift data warehouse
- Follow the instruction here to Add an Amazon Redshift data source
- For Publishing settings, choose whether assets are immediately discoverable in Amazon SageMaker Catalog.
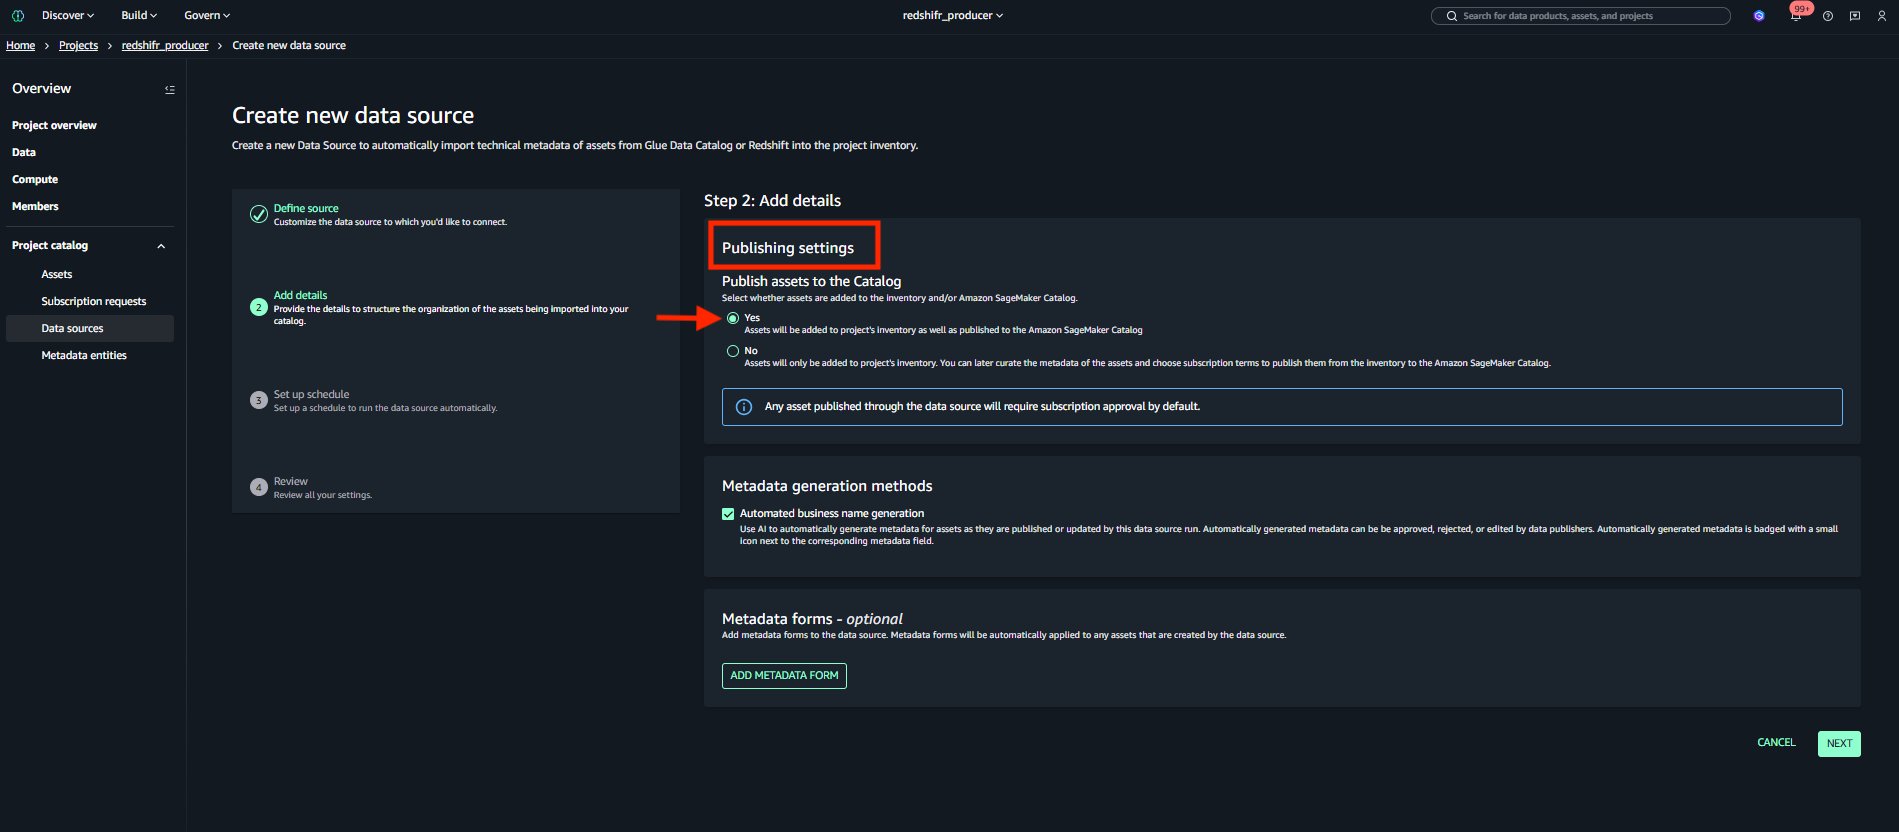
Using Amazon Redshift Serverless?
When creating the connection and data source, use your workgroupName instead of clusterName. The rest of the data source configuration remains the same.
Step 3: Run the data source and publish the data asset to the data mesh
- After the Data source is created, run the Data source. The data source run adds the data.
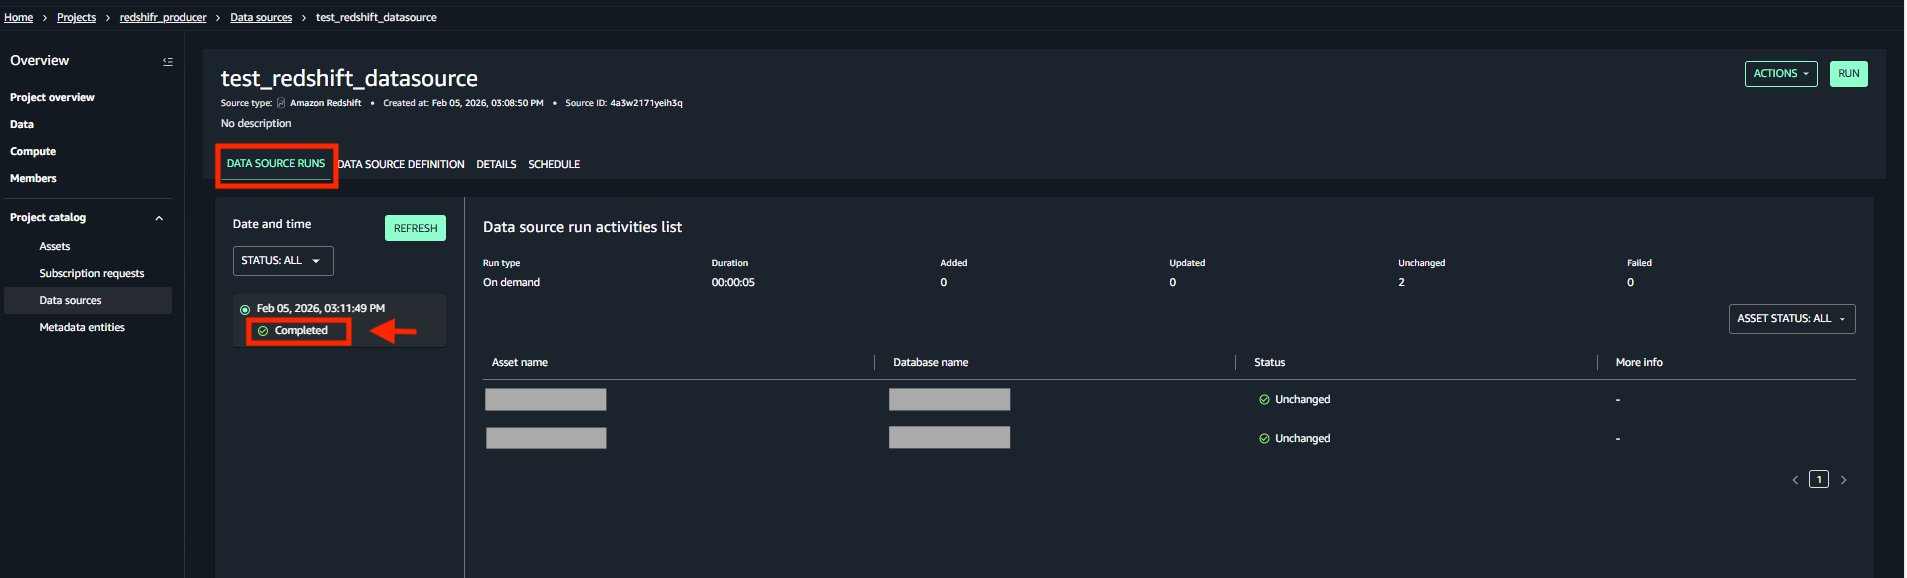
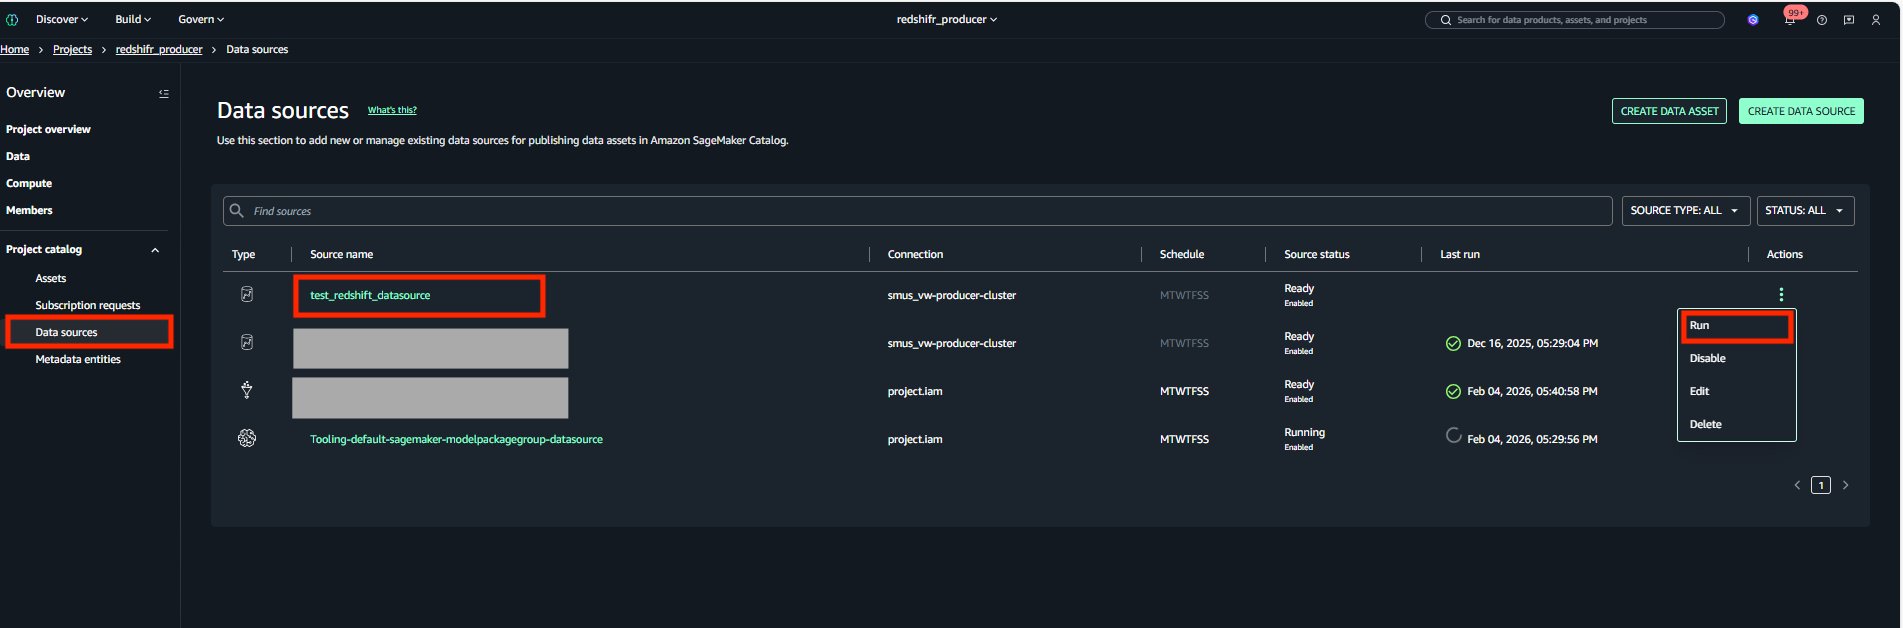
- During creation of data source if you choose Publishing settings such as assets are immediately discoverable, the Amazon Redshift tables and views appear in the catalog as Published, ready for discovery and subscription by data consumers.
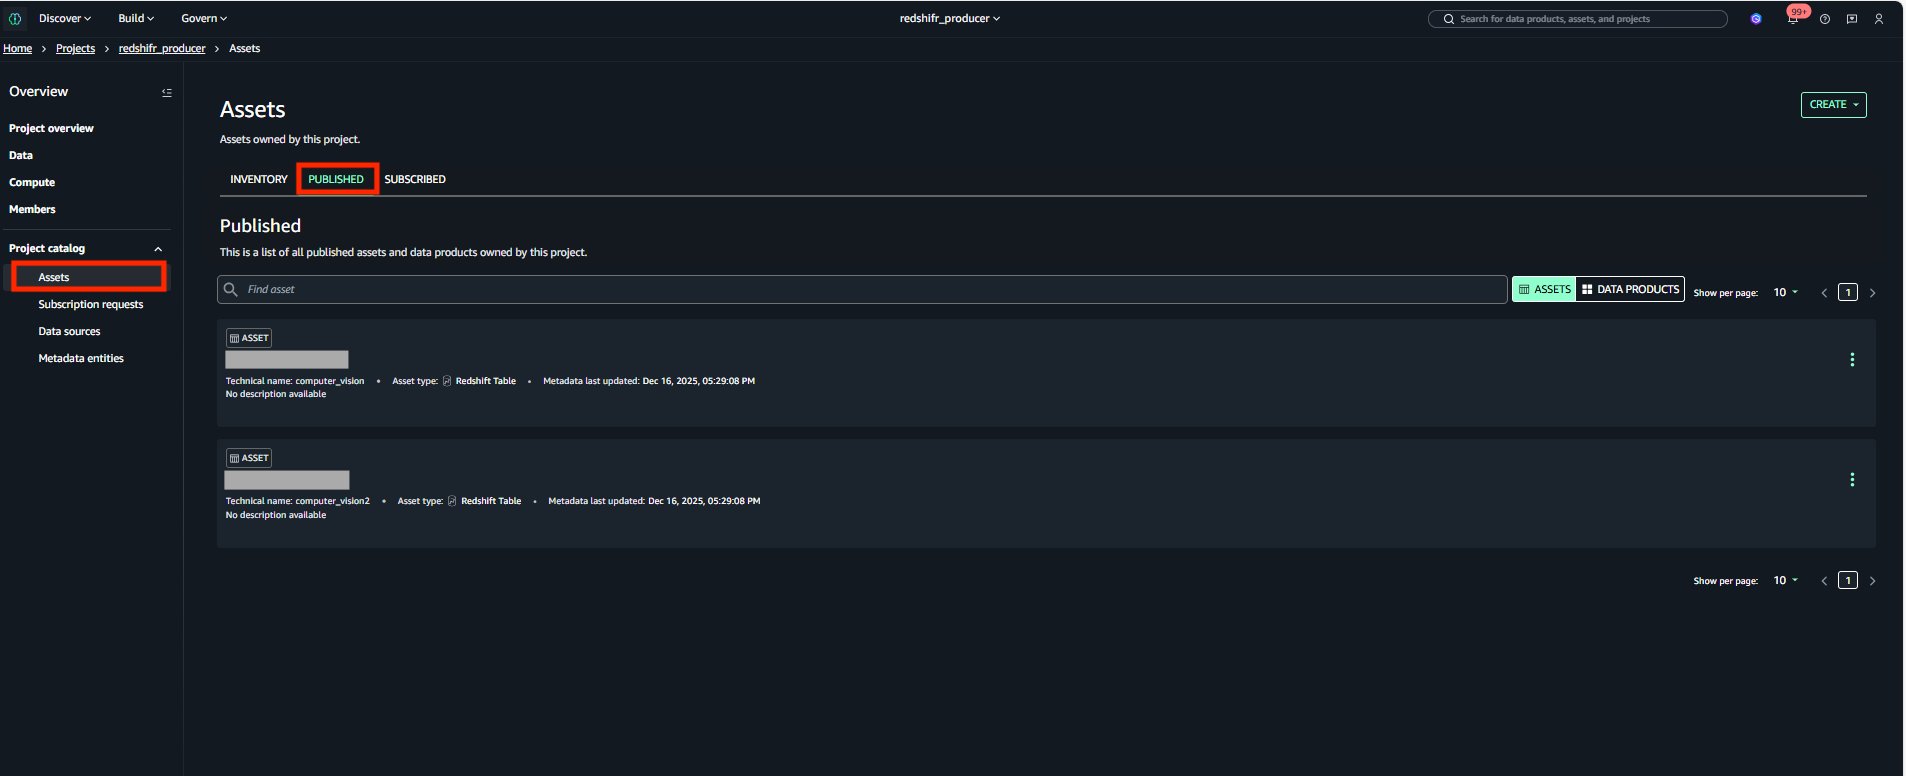
- After the data sources are published, users can discover the published data and submit a subscription request. The data producer can approve or reject requests. After approval, users can consume the data by querying it in the Amazon Redshift query editor. The following screenshot illustrates data discovery in the Amazon SageMaker Unified Studio portal.
Subscribe Amazon Redshift data through the data mesh
To complete the end-to-end test, you need to set up a consumer Amazon Redshift cluster in Account C.
Step 1: Setting up the consumer cluster
- Follow the prerequisites from Steps 1 and 2 in the previous section, make sure the cluster and secret are properly tagged as in the following screenshots:
- Amazon Redshift cluster tags:
- Tags for the AWS Secrets Manager secret that stores the user credentials for the Amazon Redshift cluster:
Step 2: Connect the consumer cluster to the data mesh
- Log into Amazon SageMaker Unified Studio and navigate to your consumer project.
- In the Compute section of your project, choose Add compute, then choose Connect to existing compute resources.
- Choose Amazon Redshift Provisioned.
- Select your consumer Amazon Redshift cluster from the dropdown list and enter the Secrets Manager name.
- Choose Add compute.
- Your newly added Amazon Redshift cluster should now show as available.
- The newly added Amazon Redshift cluster shows an Available state.
- In the Data section you can see that objects (table/views) from Amazon Redshift cluster are visible and you can query them.
Step 3: Creating a subscription target
- Find the tooling environment ID: in your local terminal after obtaining correct credentials as a project member, run this command to find the tooling environment ID.
- In the response, find and copy the tooling environment ID as shown in the following example.
- Locate the Manage Access Role: In Account C, navigate to SageMaker Unified Studio and find the Tooling blueprint. In the Provisioning Tab you will find the Manage Access role and copy the value, as it is needed for the next CLI call.
- Create the Subscription Target.
With all the information collected, you can create the subscription target for the Amazon Redshift cluster as shown by the CLI call.
- Verify the Subscription Target.
To verify that the subscription target was created successfully, make a last CLI call. You should find in the return a new subscription target with the name RedshiftCluster-default-target.
Step 4: Subscribing to data assets
- Open the data catalog inside SageMaker Unified Studio and search for the assets you want to subscribe to.
- Submit your subscription request
- After approval, the subscribed assets appear as views in your consumer Amazon Redshift cluster.
Adding multiple databases and schemas
To publish assets from entirely different databases on the same Amazon Redshift cluster, you need to create a separate data source for each database, meaning repeating the steps mentioned in the section before. Each data source points to the same cluster connection but specifies a different database name. This approach gives you independent control over scheduling, publishing settings, and metadata generation for each database’s assets.
On the consumer side, each subscription target is bound to a specific database and schema combination. This is the target location where SageMaker Unified Studio will create views that give the consumer access to subscribed assets. To receive subscribed data in multiple databases or schemas, you create one subscription target per database-schema combination. For example, different teams within the consumer account might want the data materialized in their own schema. The following example shows this pattern:
Verifying the audit trail
To substantiate the governance and traceability claims in this architecture, enable AWS CloudTrail in all three accounts with data events for Secrets Manager and KMS. Enable Amazon Redshift audit logging on clusters to capture connection and query activity through STL_CONNECTION_LOG and STL_QUERY. Subscription approvals and rejections are recorded by SageMaker Unified Studio and emitted to CloudTrail under the datazone.amazonaws.com event source. Look for CreateSubscriptionRequest, AcceptSubscriptionRequest, and RejectSubscriptionRequest events.
Clean up
If you deployed this solution for testing or evaluation purposes and no longer need the resources, we recommend cleaning up to avoid unnecessary costs. Amazon Redshift clusters, Secrets Manager secrets, and SageMaker Unified Studio projects all incur charges when left running. The following steps guide you through a structured teardown in the correct order: subscriptions first, then data assets, and finally the infrastructure itself. This order verifies that no orphaned resources remain.
- Remove all subscriptions
- Revoke subscriptions from the data assets you have subscribed to in the consumer project.
- Delete your data assets
- Remove the data assets you published on the producer side to avoid leaving unnecessary resources behind.
- Delete the projects
- Delete the project within your SageMaker Unified Studio Domain after all subscriptions are removed. Make sure to delete both the consumer and producer projects.
- Delete the SageMaker Unified Studio Domain in Account A.
Conclusion
In this post, we demonstrated how Amazon SageMaker Unified Studio simplifies cross-account data governance for Amazon Redshift. By implementing this solution, organizations can move away from ad-hoc, non-auditable data sharing processes to a secure, scalable, and fully governed approach. Amazon SageMaker Unified Studio serves as the central governance layer that data producers and consumers use to publish, discover, and subscribe to data products across AWS accounts. This turns a fragmented data landscape into a well-governed data mesh without the need for custom tooling or manual coordination.
With cross-account data sharing and governance in place, the natural next step is to use this well-governed data for machine learning and generative AI workloads. Because Amazon SageMaker Unified Studio brings together data, analytics, and AI capabilities in a single environment, teams can more efficiently transition from discovering and subscribing to data products to building ML models and generative AI applications, all within the same environment. This reduces the traditional friction between data engineering and data science, accelerating time to value. To get started with establishing your organization’s data mesh using Amazon SageMaker Unified Studio, follow the guidance for Setting up Amazon SageMaker Unified Studio.