Post Syndicated from The Metasploit Team original https://www.rapid7.com/blog/post/pt-metasploit-wrap-up-payloads-exploits-scanners
Ultimate Smart Lock Review 2026: Face, Palm, and Ultra Wide Band
Post Syndicated from The Hook Up original https://www.youtube.com/watch?v=l2iUb-VqHCE
Eight stable kernels with fix for a single vulnerability
Post Syndicated from jzb original https://lwn.net/Articles/1091118/
Greg Kroah-Hartman has announced the release of the 7.2.2, 7.1.12, 6.18.48, 6.12.107, 6.6.155, 6.1.186,
5.15.219, and 5.10.268 stable kernels.
Each of these contains a
single fix for a
vulnerability (CVE-2026-80590)
that allows marking IPv4 or IPv6 fragments as GSO,
which can allow an unprivileged user to cause a kernel panic. This vulnerability
has been present since Linux 2.6.27. Users are advised to upgrade.
Build your own continuous modernization pipeline with AWS Transform custom
Post Syndicated from Janardhan Molumuri original https://aws.amazon.com/blogs/devops/build-your-own-continuous-modernization-pipeline-with-aws-transform-custom/
Introduction
Development velocity has reached new heights with AI-driven development tools and practices. Organizations are generating code faster than ever before. But that speed carries risk. Researchers Anderson, Parker, and Tan warned in MIT Sloan Management Review, “Legacy systems tend to carry hidden debt; layering AI-generated code on top of them creates additional tangled dependencies.” The faster you generate code, the faster technical debt compounds — especially in brownfield environments where outdated frameworks, deprecated libraries, and undocumented services already carry years of accumulated risk.
As organizations accelerate their software development, manual or periodic processes to synchronize dependencies and update documentation no longer keep pace, and technical debt piles up faster than ever. Continuous modernization built into your pipeline enables you to maintain up-to-date dependencies and documentation across repositories on every commit, preventing future tech debt and improving AI agent accuracy and accountability.“
You can embed AI-powered code transformations directly into your CI/CD pipelines, turning modernization from a periodic project into an automated, ongoing practice. AWS gives you two ways to get there. AWS Transform – continuous modernization is the fully managed option, delivering continuous modernization automatically with no pipeline for you to build or maintain. The Do-It-Yourself (DIY) approach assembles the same practices yourself using AWS Transform custom and your existing CI/CD platform. Choose DIY when you need to fit modernization into a specific pipeline (GitHub Actions, AWS CodePipeline, Jenkins, GitLab CI, and so on), or want to customize the workflow with existing tools like Dependabot.
In this post, we cover the DIY approach on how to set up a continuous modernization pipeline using AWS Transform custom and demonstrate it in action.
The Do It Yourself (DIY) path – continuous modernization pipeline with AWS Transform custom
Sample application: instrumentShop
For this walkthrough, we use a dated Java application called instrumentShop (Figure 1) — a Java microservices application built with Spring Boot that simulates an online instrument shop to demonstrate four practices: automated dependency remediation, auto-documentation on every commit, scaling transformations across repositories, and continual learning.
Architecture overview

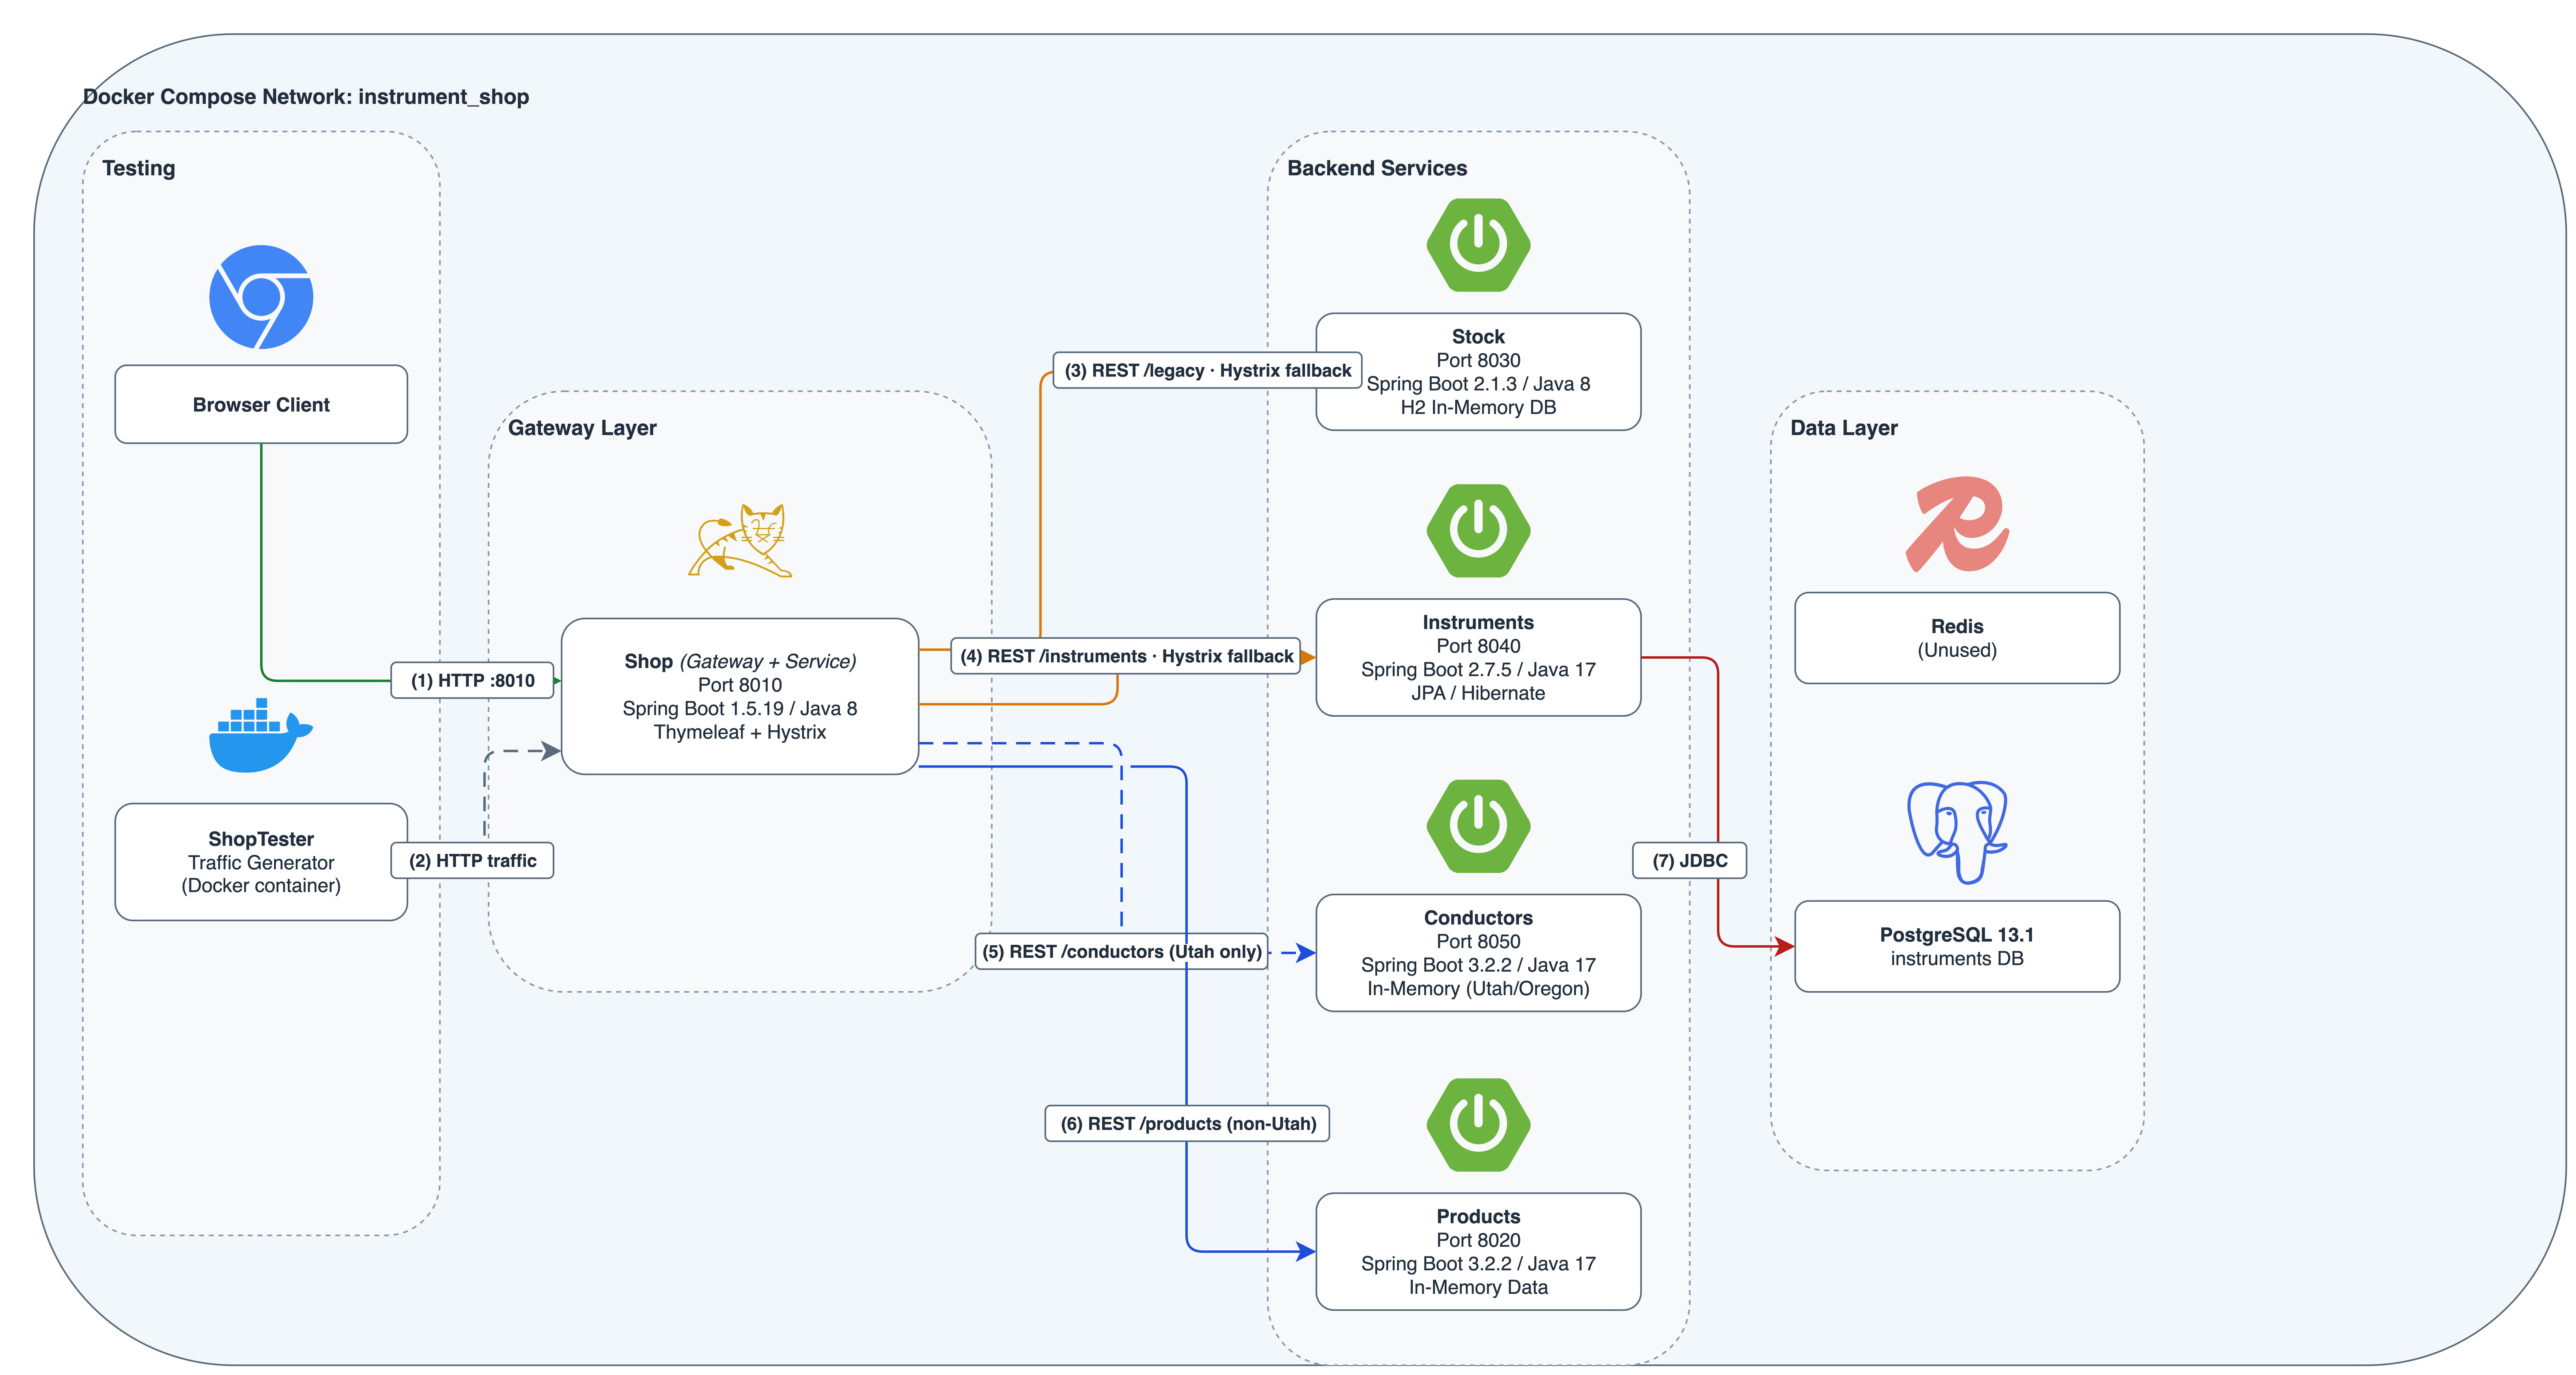
Figure 1: instrumentShop Java application architecture
The instrumentShop application is a Spring Boot microservices application with a Spring Gateway (v1.5.19) routing traffic from a single HTTP/8010 entry point to four REST services: Agents, Instruments, Consumers, and Products. A Thymeleaf client provides server-side rendering, PostgreSQL 13.1 handles persistence via JDBC, and Hystrix provides circuit-breaking for inter-service calls. A ShopTester utility generates HTTP traffic for testing.
This application is a strong candidate for continuous modernization:
- Spring Boot 1.5.19 is years past end of life and carries known CVEs
- Hystrix has been in maintenance mode since Netflix deprecated it in 2018
- Cross-service coordination — dependency updates must propagate across multiple microservices
- Transitive dependency risk — PostgreSQL JDBC drivers and other transitive dependencies accumulate security advisories over time
A typical workflow for the continuous modernization pipeline is shown below (Figure 2):
- A developer pushes code to main — GitHub Actions triggers the auto-documentation workflow, generating updated architecture docs and technical debt reports.
- Dependabot detects a vulnerable dependency — A PR opens automatically. GitHub Actions triggers the dependency remediation workflow, runs AWS Transform custom to remediate the code, validates with tests, and pushes the result back to the PR.
- A platform team defines a new transformation (e.g., “Upgrade Spring Boot to the latest stable release “) — The scheduled GitHub Actions workflow runs the transformation weekly in non-interactive mode across all instrumentShop microservices and other repositories in the portfolio.
- The agent learns — Knowledge items from each execution improve future runs, reducing manual intervention over time.
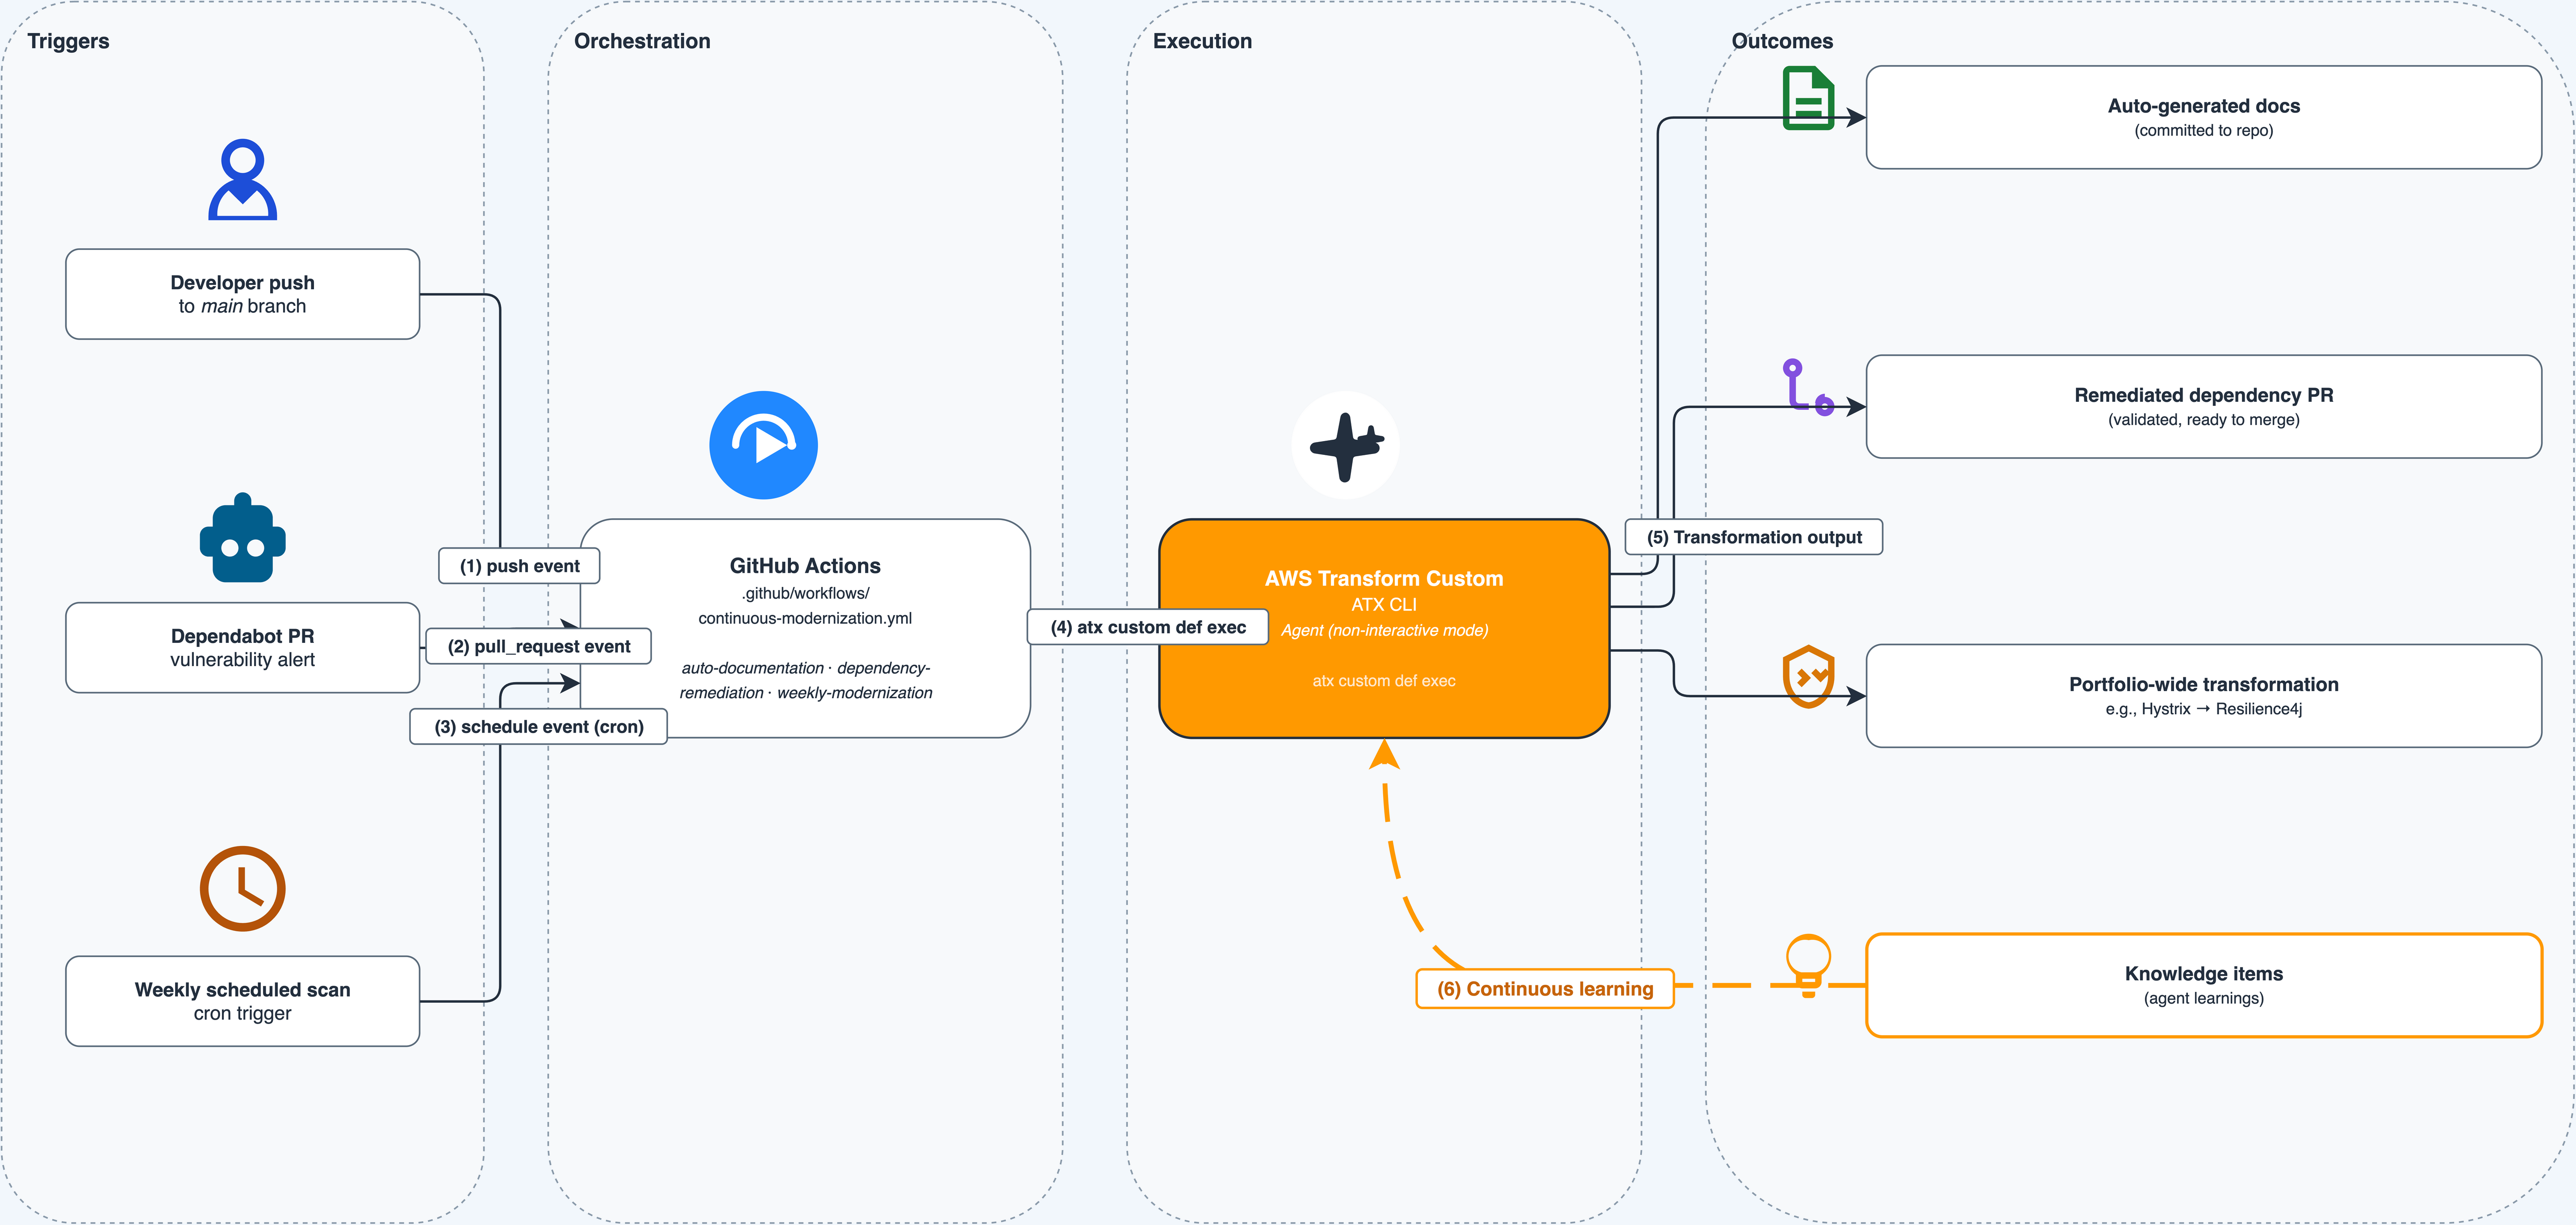
Figure 2: AWS Transform continuous code modernization workflow
Prerequisites
- Before setting up the continuous modernization pipeline, ensure you have the following:
- An active AWS account with permissions for AWS Transform custom
- AWS Transform CLI installed and configured in your development environment
- Authentication with AWS credentials configured locally and proper IAM permissions to call AWS Transform
- Git installed for cloning sample repositories
- GitHub Dependabot enabled on your repository for automated vulnerability detection
Continuous modernization through CI/CD in action
Continuous modernization shifts code transformation from a periodic project into an automated, pipeline-driven practice. Instead of scheduling a “modernization sprint” once a year, your CI/CD pipeline identifies and remediates technical debt on every commit, every dependency alert, and across every repository.
We implement this through four practices, each powered by AWS Transform custom running as a step in GitHub Actions workflows.
Note: This post uses GitHub Actions because the instrumentShop demo repository is built with it. The same AWS Transform CLI (atx) commands work with AWS CodePipeline, Jenkins, GitLab CI, CircleCI, or any CI/CD system that runs shell commands. Continuous modernization is a practice, not a tool choice.
Important: Every atx custom def exec invocation in this post uses the –trust-all-tools flag, which allows the agent to execute tools without interactive confirmation. This is required for non-interactive CI/CD execution. Review your organization’s security policies before enabling this flag in production pipelines.
1. Dependency analysis and remediation
GitHub Dependabot scans your repository for known vulnerabilities and generates alerts when a new vulnerability is added or your dependency graph changes—for example, when you push commits that update packages or versions. However, resolving these alerts requires more than bumping a version number. Upgrading a dependency can introduce breaking API changes, require code modifications, or demand configuration updates.
AWS Transform custom helps handle the code changes needed to resolve the alerts. It runs via a GitHub Actions workflow that triggers automatically to:
- Fetch the list of latest Dependabot alerts
- Run AWS Transform custom to analyze the alerts and apply code transformations
- Run your build and test suite to validate the changes
- Create a new pull request for each resolved alert
The workflow calls a shell script that invokes the AWS Transform CLI in headless mode with retry logic. Place this script at the root of your repository:
run_dependabot_alert_fixes.sh:
#!/usr/bin/env bash
set -euo pipefail

# -------------------------------------------------------------------
# run_dependabot_alert_fixes.sh
# Runs the Dependabot alert remediation transformation in headless mode.
# Retries up to MAX_RETRIES times on failure.
#
# Usage:
#   ./run_dependabot_alert_fixes.sh [-n <transformation-name>] [-p <path>] [-c <build-command>]
#
# Defaults:
#   -n  Remediate-Critical-GitHub-Dependabot-Alerts-Java-Maven
#   -p  .                   (current directory)
#   -c  mvn clean install   (Maven build)
# -------------------------------------------------------------------

TRANSFORMATION_NAME="Remediate-Critical-GitHub-Dependabot-Alerts-Java-Maven"
CODE_PATH="."
BUILD_CMD="mvn clean install"
MAX_RETRIES=3

while getopts "n:p:c:" opt; do
  case $opt in
    n) TRANSFORMATION_NAME="$OPTARG" ;;
    p) CODE_PATH="$OPTARG" ;;
    c) BUILD_CMD="$OPTARG" ;;
    *) echo "Usage: $0 [-n <transformation-name>] [-p <path>] [-c <build-command>]" && exit 1 ;;
  esac
done

echo "=== AWS Transform Custom ==="
echo "Transformation: $TRANSFORMATION_NAME"
echo "Code path:      $CODE_PATH"
echo "Build command:  $BUILD_CMD"
echo "============================"

attempt=1
while [ $attempt -le $MAX_RETRIES ]; do
  echo "--- Attempt $attempt of $MAX_RETRIES ---"

  if atx custom def exec \
    -n "$TRANSFORMATION_NAME" \
    -p "$CODE_PATH" \
    -c "$BUILD_CMD" \
    -x -t; then
    echo "=== Transformation completed successfully ==="
    exit 0
  fi

  echo "Attempt $attempt failed."
  attempt=$((attempt + 1))

  if [ $attempt -le $MAX_RETRIES ]; then
    echo "Retrying in 10 seconds..."
    sleep 10
  fi
done

echo "=== All $MAX_RETRIES attempts failed ==="
exit 1
This script accepts optional flags to override the transformation name (-n), code path (-p), and build command (-c). The -x flag enables non-interactive mode and -t enables --trust-all-tools, both required for CI/CD execution. On failure, it retries up to three times with a 10-second backoff.
Your CI/CD workflow must configure AWS credentials and install the AWS Transform CLI before invoking this script. With this setup, Dependabot alerts are reviewed continuously for any changes — not just a version bump, but the complete code adaptation required to make the upgrade work.
2. Auto documentation
Documentation is one of the most neglected aspects of modern software development. Documentation increases accuracy and acts as a contract between requirements and implementation. AWS Transform custom codebase analysis capability generates structured documentation covering architecture, technical debt, code metrics, and migration planning on every incremental update ensuring every Agent or human that modifies the codebase is working from a true “current state”.
By embedding this as a post-push step in your CI/CD pipeline, your documentation stays current automatically. The workflow triggers on every pull request to main, runs your build and test suite, then calls a shell script that invokes AWS Transform custom to generate documentation and commits it back to the PR branch.
Place this script at the root of your repository:
run_code_analysis.sh:
#!/usr/bin/env bash
set -euo pipefail

# -------------------------------------------------------------------
# run_code_analysis.sh
# Runs an AWS Transform custom transformation in headless mode.
# Retries up to MAX_RETRIES times on failure.
#
# Usage:
#   ./run_code_analysis.sh [-n <name>] [-p <path>] [-c <build-cmd>] [-U <pr-url>]
#
# Defaults:
#   -n  GitHub-PR-Context-Codebase-Analysis
#   -p  .                   (current directory)
#   -c  mvn clean install   (Maven build)
#   -U  (empty)             PR URL
# -------------------------------------------------------------------

TRANSFORMATION_NAME="GitHub-PR-Context-Codebase-Analysis"
CODE_PATH="."
BUILD_CMD="mvn clean install"
PR_URL=""
MAX_RETRIES=3

while getopts "n:p:c:U:" opt; do
  case $opt in
    n) TRANSFORMATION_NAME="$OPTARG" ;;
    p) CODE_PATH="$OPTARG" ;;
    c) BUILD_CMD="$OPTARG" ;;
    U) PR_URL="$OPTARG" ;;
    *) echo "Usage: $0 [-n <name>] [-p <path>] [-c <build-cmd>] [-U <pr-url>]" && exit 1 ;;
  esac
done

echo "=== AWS Transform Custom ==="
echo "Transformation: $TRANSFORMATION_NAME"
echo "Code path:      $CODE_PATH"
echo "Build command:  $BUILD_CMD"
echo "PR URL:         $PR_URL"
echo "============================"

attempt=1
while [ $attempt -le $MAX_RETRIES ]; do
  echo "--- Attempt $attempt of $MAX_RETRIES ---"

  if atx custom def exec \
    -n "$TRANSFORMATION_NAME" \
    -p "$CODE_PATH" \
    -c "$BUILD_CMD" \
    -g "additionalPlanContext=$PR_URL" \
    -x -t; then
    echo "=== Transformation completed successfully ==="
    exit 0
  fi

  echo "Attempt $attempt failed."
  attempt=$((attempt + 1))

  if [ $attempt -le $MAX_RETRIES ]; then
    echo "Retrying in 10 seconds..."
    sleep 10
  fi
done

echo "=== All $MAX_RETRIES attempts failed ==="
exit 1
This script accepts optional flags for the transformation name (-n), code path (-p), build command (-c), and PR URL (-U). Pass the PR URL to the agent via the -g flag as additionalPlanContext, giving it awareness of the pull request context when generating documentation. On failure, it retries up to three times with a 10-second backoff.
Your CI/CD workflow must configure AWS credentials and install the AWS Transform CLI before invoking this script. The workflow commits the generated documentation back to the PR branch automatically, keeping your architecture docs and technical debt reports current with every code change.
Every push now updates the documentation (Figures 3 and 4) — reducing knowledge silos and preserving institutional knowledge.
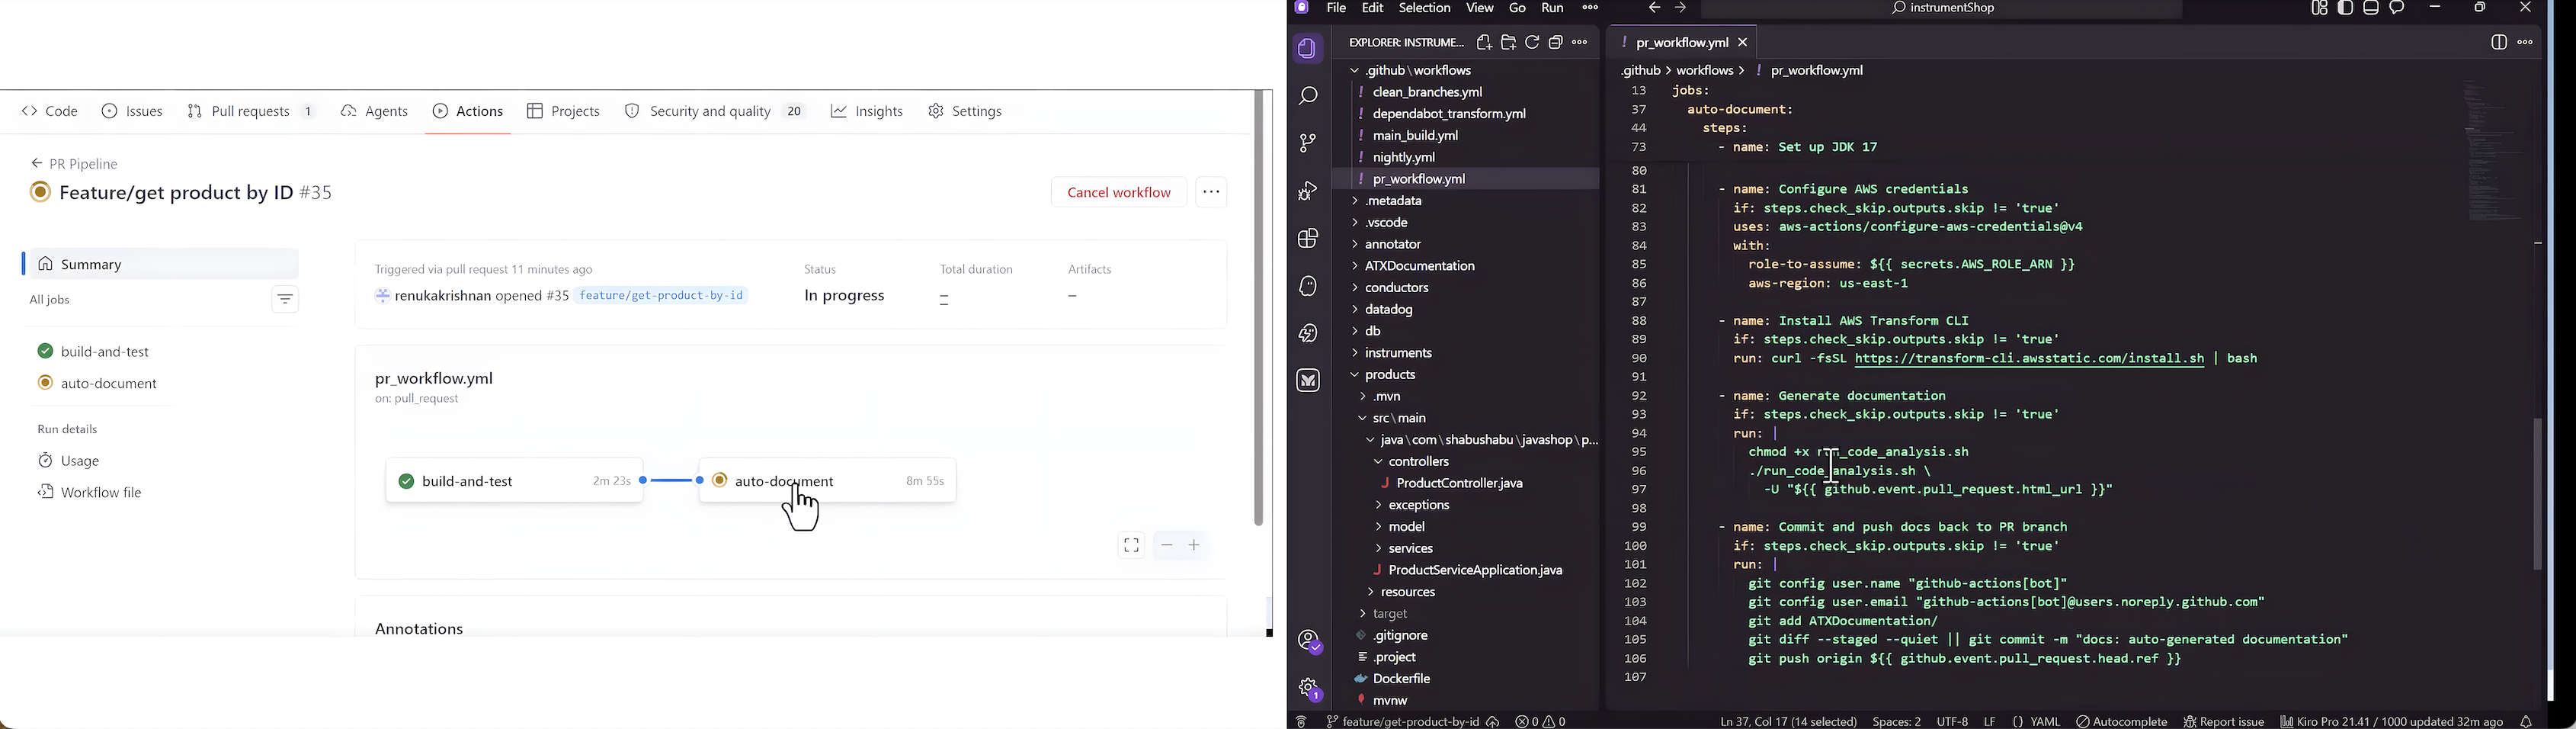
Figure 3: PR triggering auto-documentation
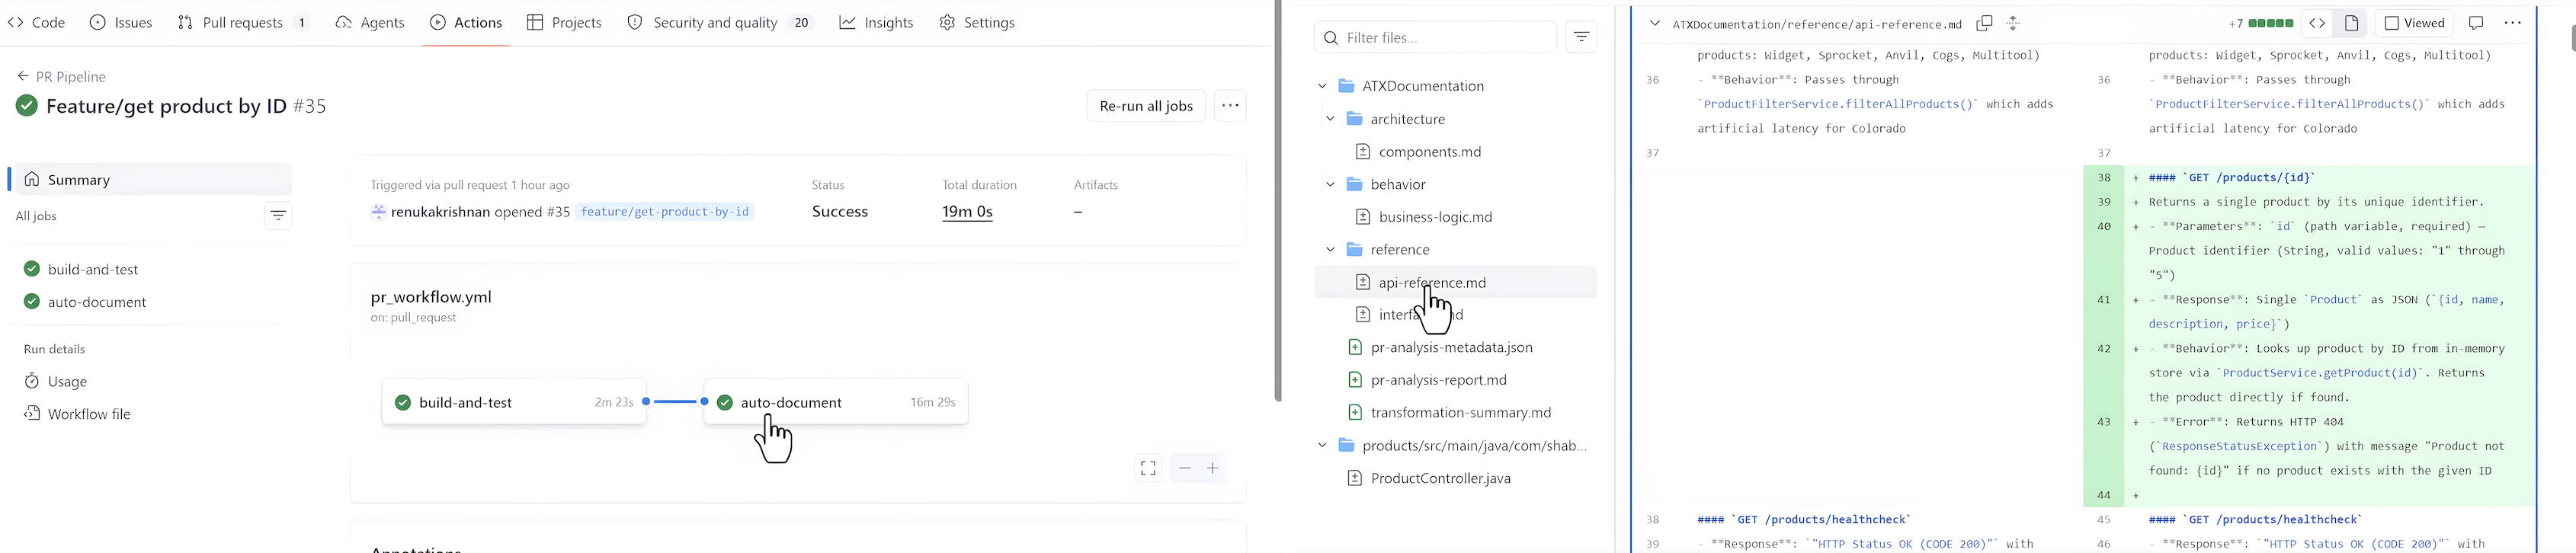
Figure 4 – Generated documentation output
3. Scale across repositories
For organizations with hundreds of microservices, transforming one repository at a time doesn’t scale. AWS Transform custom non-interactive mode combined with GitHub Actions matrix strategy allows you to orchestrate transformations across your entire portfolio in parallel. You can run them on demand or on a recurring schedule, so modernization runs as a continuous practice rather than a one-time project.
# .github/workflows/scale-modernization.yml
name: Scale Modernization
on:
  schedule:
    - cron: '0 6 * * 1'
  workflow_dispatch:

jobs:
  transform-repos:
    runs-on: ubuntu-latest
    strategy:
      matrix:
        repo:
          - magnefique-studios/instrumentShop
          - magnefique-studios/orderService
          - magnefique-studios/paymentGateway
    steps:
      - name: Checkout ${{ matrix.repo }}
        uses: actions/checkout@v4
        with:
          repository: ${{ matrix.repo }}
          token: ${{ secrets.GH_PAT }}

      - name: Configure AWS credentials
        uses: aws-actions/configure-aws-credentials@v4
        with:
          role-to-assume: ${{ secrets.AWS_ROLE_ARN }}
          aws-region: us-east-1

      - name: Install ATX CLI
        run: curl -fsSL https://transform-cli.awsstatic.com/install.sh | bash

      - name: Run transformation
        run: |
          atx custom def exec \
            --transformation-name "spring-boot-3-upgrade" \
            --code-repository-path "." \
            --build-command "mvn clean install" \
            --non-interactive \
            --trust-all-tools
Tip: GitHub Actions matrix strategy runs each repository in parallel automatically — no separate orchestration layer needed. For larger portfolios, you can also wrap this in AWS Batch or AWS Fargate for large-scale parallel execution. The AWS Transform web console tracks progress across all repositories in a single view.
4. Continual learning
Each time AWS Transform custom completes a transformation, a memory agent scans the full execution trajectory and extracts lessons. Lessons include patterns that the agent learned, decisions that the agent made during planning, and feedback you provide during execution. AWS Transform custom automatically attaches these lessons to your transformation definition, which improves accuracy in subsequent runs.
AWS Transform custom applies lessons automatically, and each lesson belongs to a category that groups related lessons for review. You can browse and archive any lesson you do not want AWS Transform custom to apply to future runs.This keeps a human in the loop on what the agent “remembers” which matters when the same transformation runs across many repositories with different conventions.
In practice, this means your “Spring Boot 3 Upgrade” transformation gets sharper with each execution. The first repository surfaces the edge cases; once you review the resulting lessons and archive the ones that do not fit, subsequent runs handle those edge cases without intervention.
For production use, you can combine these practices into a single workflow file:
Note: The individual workflows shown in Practices 1–3 are presented separately for clarity. Combine them into a single workflow file as shown here, or keep them as separate workflow files depending on your team’s preference.
# .github/workflows/continuous-modernization.yml
name: Continuous Modernization
on:
  push:
    branches: [main]
  pull_request:
    types: [opened]
  schedule:
    - cron: '0 6 * * 1'

jobs:
  dependency-remediation:
    if: github.actor == 'dependabot[bot]'
    runs-on: ubuntu-latest
    steps:
      - uses: actions/checkout@v4
        with:
          ref: ${{ github.head_ref }}
      - name: Configure AWS credentials
        uses: aws-actions/configure-aws-credentials@v4
        with:
          role-to-assume: ${{ secrets.AWS_ROLE_ARN }}
          aws-region: us-east-1
      - name: Install ATX CLI
        run: curl -fsSL https://transform-cli.awsstatic.com/install.sh | bash
      - name: Remediate dependency changes
        run: |
          atx custom def exec \
            --transformation-name "dependency-remediation" \
            --code-repository-path "." \
            --build-command "mvn clean install" \
            --non-interactive \
            --trust-all-tools

  auto-documentation:
    if: github.event_name == 'push'
    runs-on: ubuntu-latest
    steps:
      - uses: actions/checkout@v4
      - name: Configure AWS credentials
        uses: aws-actions/configure-aws-credentials@v4
        with:
          role-to-assume: ${{ secrets.AWS_ROLE_ARN }}
          aws-region: us-east-1
      - name: Install ATX CLI
        run: curl -fsSL https://transform-cli.awsstatic.com/install.sh | bash
      - name: Generate documentation
        run: |
          atx custom def exec \
            --transformation-name "codebase-documentation" \
            --code-repository-path "." \
            --build-command "echo 'docs-only'" \
            --non-interactive \
            --trust-all-tools

  weekly-modernization:
    if: github.event_name == 'schedule'
    runs-on: ubuntu-latest
    steps:
      - uses: actions/checkout@v4
      - name: Configure AWS credentials
        uses: aws-actions/configure-aws-credentials@v4
        with:
          role-to-assume: ${{ secrets.AWS_ROLE_ARN }}
          aws-region: us-east-1
      - name: Install ATX CLI
        run: curl -fsSL https://transform-cli.awsstatic.com/install.sh | bash
      - name: Run modernization scan
        run: |
          atx custom def exec \
            --transformation-name "tech-debt-analysis" \
            --code-repository-path "." \
            --build-command "mvn clean install" \
            --non-interactive \
            --trust-all-tools
Conclusion
Continuous modernization moves code transformation out of periodic sprints and into your CI/CD pipeline. By combining GitHub Dependabot’s vulnerability detection with AWS Transform custom agent, orchestrated through GitHub Actions, you can:
- Remediate dependency vulnerabilities automatically — beyond version bumps to full code adaptation
- Keep documentation current with every commit, preserving institutional knowledge
- Scale transformations across hundreds of repositories with consistent quality
- Improve continuously as the agent accumulates knowledge items from each execution
The instrumentShop sample application demonstrates that even a moderately complex microservices architecture — with end-of-life Spring Boot versions, deprecated libraries like Hystrix, and multiple interconnected services — can be continuously modernized without dedicated modernization sprints.
Ready to get started? This post walked through the do-it-yourself path with AWS Transform custom. If you would rather have continuous modernization delivered as a fully managed service, explore AWS Transform continuous modernization. Either way, visit the AWS Transform documentation to start your continuous modernization journey.
Security updates for Friday
Post Syndicated from jzb original https://lwn.net/Articles/1091117/
Security updates have been issued by AlmaLinux (assertj-core, golang, httpd, kernel, and libxml2), Debian (chromium and suricata-update), Fedora (rust-h2), Mageia (avahi and python-django), Oracle (kernel and mingw-openssl), SUSE (c-ares-devel, dracut, gh, gstreamer-plugins-bad, java-11-openjdk, liboqs, librest0_7, openssl, openssl-3, pcp, python313-mistune, python36-pip, qt6-svg, rmt-server, rsync, suseconnect-ng, texlive, tor, wicked, and xmlrpc-c), and Ubuntu (linux-azure, linux-azure-4.15, linux-azure-fips, linux-azure-6.8, linux-ibm, linux-ibm-6.8, linux-oracle-6.8, linux-raspi,
linux-raspi-realtime, linux-azure-fde-5.15, linux-fips, linux-gke, linux-gcp-fips, opencryptoki, and pam).
BotBase for Operators: A clearer path to joining Cloudflare’s directory of bots and agents
Post Syndicated from Julian Laxman original https://blog.cloudflare.com/botbase-for-operators/
Last month, on our second Content Independence Day, we announced a couple of features designed to give website owners more visibility and control over automated traffic: BotBase added a searchable directory of known bots to the Cloudflare dashboard, while Business Insights helped owners understand how crawlers interact with their content. We know that the ecosystem of bots is vast, making it all the more important for site owners to be able to manage bot traffic sustainably.
But this ecosystem goes both ways. While website owners need to decide which automated traffic they allow, bot operators need a clear way to identify themselves, explain what their bots do, and keep that information current. BotBase works best when both sides can participate.
When we launched BotBase, we said we would build tools to bring bot operators into this ecosystem. Until now, their experience largely ended at submission. After pressing submit, an operator had no easy way to check the submission's status, understand why it was rejected, or update an existing entry. Today, we start to change that with the launch of BotBase for Operators, tackling what bot operators need first: transparency.
A new home for bot submissions
Imagine you’re a bot operator looking to submit your bot to BotBase. Where on the dashboard would you look for such a submission form? Previously, the form lived under Manage Account → Configurations, which tied the bot clearly to your account, but didn’t acknowledge its connection to the bots ecosystem.
Starting today, the bot submission experience has a home next to the rest of your bot and trust tools: Protect & Connect → Application Security → BotBase (new!). All customers can access this today directly from the Cloudflare dashboard.
Here, we’ve split BotBase for Operators by use case:
- Bots directory — browse, search, and filter the bots Cloudflare already tracks (the same catalogue you can explore on Cloudflare Radar).
- Submission form — submit a new bot.
- Submission history — track everything you have submitted.
Finding BotBase solves the "where" problem. The "what happens next" problem is the one that we’ve heard is deeply important to bot operators, so we’ll cover that in the rest of this post.
See where your submission stands
We spoke to many bot operators, and the resounding feedback was this: submitting a bot feels like a black box. You fill in the form, press submit, and wait, with no way to tell whether anything happened next.
Now, the Submission history tab shows every bot submitted from your account, each with a clear status:
- Waiting for review — we have received your submission and it is in our queue.
- Accepted — we have reviewed it and your bot is now tracked in the directory.
- Rejected — something in the submission needs to change. We tell you why, with steps you can act on, so you can fix it and resubmit.
Open any submission to see its full details. If it was rejected, you will see the reason why. If it was accepted but we adjusted how your bot is classified, you will see what we changed.
Previously, operators would need to email support just to ask whether their bot got reviewed or to check on their submission's progress. That's exactly the gap we’re closing with this new tab.
Today, the submission form is no longer a black box. Every operator can now view the record of every bot they've submitted starting from today’s launch, with a status you can check anytime. We also provide a way to filter “My bots,” from the Bots directory screen, so you can see all bots that have been submitted under the account with which you’re currently logged in.
Keep your bot's information up to date
A bot's identification details can change over time. You might redesign your website and end up hosting your IP list at a new endpoint. Or you might move from an IP allowlist to signing your traffic with Web Bot Auth, and need your entry to match. Before today, the only way to reflect either change was to fill out the whole form again and submit a brand-new entry. Now, you can edit a submission you have already made.
You can also cancel a submission that is still waiting for review.
We encourage every operator to keep their bot's information current. Accurate details are a key component of how a bot earns and keeps Verified status, which increasingly determines whether sites across Cloudflare's network can easily allow it based on its behavior. Of course, it is ultimately up to the individual site owner to decide what traffic is allowed and what is not.
A submission form built on an updated, pragmatic taxonomy
Picture a bot. Maybe it only crawls pages to build a search index. Maybe it also acts on a user's behalf, or pulls in data for something else entirely. How it uses what it reads matters just as much as what it does.
The new intake form asks you to describe your bot the way it actually behaves. It follows the same behavior and content use model we introduced on July 1, so instead of squeezing your bot into a single label, you now tell us three things.
First, what your bot does. Maybe it only does one thing, like indexing pages for search. Maybe it's an agent acting on a user's behalf, or it collects data, trains models, or supports SEO tools. You can select every behavior that applies, not just the closest match.
Second, how it uses what it reads. A crawler that skims a page for a search snippet is not the same as one that stores that page to train a model. You tell us the level of content use your bot needs, using the same Content Signals model website owners already use to set their own rules. For example, a site's robots.txt might read Content-Signal: search=yes, ai-train=no, use=reference, telling every crawler it's fine to index the page for search and keep a reference, but not to train a model on it. Your bot's content-use declaration is what gets checked against exactly that kind of preference.
Third, who's actually running it. If you operate your bot yourself, straight from your own infrastructure, like a search engine crawling the web to build its own index, that's direct. If you run a platform other companies build on, carrying their traffic without being the one who decided to send it, that's an intermediary. Picture a general-purpose AI assistant fetching a page because someone typed a question into a different company's app built on that assistant's API: the assistant operator runs the infrastructure, but it was someone else's product that decided to send the request. (You can read more about these classifications here.)
That's the full picture: what your bot does, how it treats what it reads, and who's behind it, described as it actually is instead of squeezed into one label. The clearer that picture, the more accurately website owners can decide how to treat your bot.
Faster, more consistent review
Operators also asked for faster reviews. We hear you on this, too.
The number of new bots submitted each year has grown sharply — increasing about 7 times in volume since 2023 — and reviewing every one of them by hand doesn't scale at that pace. Until now, every submission followed the same fully manual path: someone on our team checks it against an internal rubric and makes a judgment call. That kind of review is thorough, but it doesn't scale.
We rebuilt that process to run automatically. Your bot runs through a series of checks — is it a duplicate of one we already track, is your user-agent pattern specific enough to identify your bot without overlapping one that's already registered, and, most importantly, does your claimed verification method actually hold up? We fetch your IP list, confirm your reverse DNS, or validate your Web Bot Auth signature automatically, instead of a person doing it by hand. If everything checks out, your bot can be tracked right away. If something needs a closer look, it's routed to our team with the specific reason already flagged, instead of landing as a blank entry in a queue.
For operators, that means most submissions move faster than before.
Submit your bot today
To join hundreds of bots in BotBase who declare their behavior and content use, and be part of an ecosystem where website owners and bot operators can coexist:
- Go to Protect & Connect → Application Security → BotBase in the Cloudflare dashboard.
- Open the Submission form and declare your bot: who operates it, what it does, how it uses content, and how it proves its identity.
- Submit. Your submission appears in Submission history as Waiting for review.
What's next
This launch is about visibility; there's more coming. Here are our guiding goals:
- Visibility, targeted by this launch. This gives operators the ability to see, understand, and edit submissions.
- Ownership and observability, being targeted soon. This gives operators the ability to claim bot ownership, manage its live directory entry, and better understand how websites are treating their bot.
- Conversation, a longer-term goal. This would open a more sustainable way for bot operators to ask websites to be let in if they can show they provide value rather than harm.
Our vision is to keep expanding BotBase so operators can understand exactly how their bot is treated and get guidance on how to crawl the web more politely, turning a one-way submission into an ongoing relationship.
BotBase started as a directory for website owners. It is becoming a place where bot operators take part in the ecosystem, understand where they stand, and keep their information accurate. If you run a bot, submit it and tell us what you need next. We are building the operator side alongside the operators who use it.
Best of The History Guy : Weirdos
Post Syndicated from The History Guy: History Deserves to Be Remembered original https://www.youtube.com/watch?v=7R3OTARA3mY
Comic for 2026.08.28 – Galaxy Note
Post Syndicated from Explosm.net original https://explosm.net/comics/galaxy-note
New Cyanide and Happiness Comic
AI Doesn’t Mean the End of Mathematics—at Least Not Yet
Post Syndicated from Bruce Schneier original https://www.schneier.com/blog/archives/2026/08/ai-doesnt-mean-the-end-of-mathematics-at-least-not-yet.html
This essay was written with Kasra Rafi, and originally appeared in The Guardian.
Earlier this month, about 40 top mathematicians gathered at OpenAI’s offices to discuss the future of their profession. The meeting was off-the-record, but if recent articles by mathematicians are any guide, it was mostly pretty glum. People fear for their jobs, their careers and the work they love.
We think the contrary view is more likely, at least in the short-term. AI models are nowhere near as capable as experienced academic mathematicians.
This isn’t to say that AIs aren’t producing stunning mathematical results at the level of PhD researchers. In mid-May, OpenAI announced that its frontier AI model disproved the unit distance conjecture, a famous 80-year-old problem in discrete geometry. In July, Anthropic’s published two AI-derived results in academic cryptanalysis. Earlier this month, OpenAI published 10 new mathematical results from its latest AI model. And Anthropic published Claude’s attempt to prove the century-and-a-half-old Riemann hypothesis.
These results are both a vivid demonstration of the amazing capabilities of frontier AI in 2026 and an illustration of their limitations. In general, these AI-powered advances in mathematics fall into one of two categories. Some are counterexamples to mathematical statements that people had been trying to prove. Others are novel applications of known techniques to existing problems that human experts either did not know or did not think of using.
The counterexample to the Jacobian conjecture is the most notable example of the first kind. Once it had been found, checking it was quick and straightforward. The difficult part was finding it among a large number of possibilities. The AI seems to have combined some sort of intuition acquired through machine learning with extensive computational search, in order to find the right example.
An example of the second kind is the unit-distance conjecture. It was motivated by an elegant construction, and most mathematicians expected it to be essentially optimal—so they generally tried to prove rather than disprove it. The counterexample brings in ideas from elsewhere in mathematics: algebraic number theory. If an expert with that background deliberately set out to find a counterexample, they would probably have succeeded. But there was no reason for someone with precisely that expertise to focus on this problem. Because of its scope, AIs don’t have those same limitations.
These results are relatively low-hanging fruit for AI; none of them required developing an extensive new theory. This does not make the discoveries trivial, or the AI’s achievements less impressive. Choosing the right direction, and recognizing an unexpected connection between subjects, are themselves forms of creativity. They are the same sorts of capabilities that led to AIs playing the game of Go at the grandmaster level, or doing Nobel-prize level chemistry in the area of protein folding.
What we have not yet seen is an AI developing a substantial new conceptual framework in order to solve a mathematical problem. Much of mathematics proceeds by identifying the objects that are truly central to a question and then developing a theory that helps us understand them. Current AIs are very strong at searching and recombining existing ideas, but they are weak at building any deep and sustained new theory.
This speaks to a more general limitation of current AI systems. They are creative in the sense that they can recombine existing ideas in novel ways. But they are not creative in others: they have not yet developed conceptually new theories or structures. And while they have larger working memories than humans do, know more about more different things than any particular human does, and can process information faster than humans, can, true novelty is still largely beyond their reach.
Of course, that distinction may not survive for very long. Predictions are notoriously hard, especially about the future of AI. None of these mathematical capabilities were explicitly designed for, or planned. They’re all emergent properties of increasingly capable AI models. We are both confident that someday we will see AI models that are capable of the type of creativity required to do novel mathematics. Will that be in a few months, a few years or a few decades? Of course we don’t know, but our guess is sooner rather than later.
PaperCut NG/MF Critical Zero-Day Exploited in the Wild
Post Syndicated from Rapid7 original https://www.rapid7.com/blog/post/etr-papercut-ng-mf-critical-zero-day-exploited-in-the-wild
Overview
On August 27, 2026, PaperCut Software published an urgent security advisory stating that it is investigating active exploitation of a vulnerability affecting PaperCut NG and PaperCut MF. PaperCut has confirmed customer incidents and is treating the issue as a security emergency. At the time of writing, the vulnerability has not been assigned a CVE identifier, and PaperCut has not publicly disclosed a CVSS score, vulnerability class, authentication requirements, or the technical details of the exploit path.
PaperCut NG and PaperCut MF are print management platforms commonly deployed within enterprise, education, and other organizational environments. Because the PaperCut Application Server provides web-accessible administrative and application functionality, organizations with servers exposed to the public internet should prioritize remediation and access restriction.
PaperCut stated in its advisory that information supplied by a university customer’s security team and digital forensics and incident response team enabled its security response team to reproduce the vulnerability in PaperCut NG and PaperCut MF. On August 28, 2026 at 02:10 AEST, PaperCut released emergency patches for PaperCut NG and PaperCut MF versions 25 and 26.
PaperCut has been targeted in the past; in 2023, CVE-2023-27350 was broadly exploited in the wild by multiple threat-actor groups, including ransomware operators. This prior history increases the urgency organizations should address this new zero-day with.
PaperCut currently considers all versions of PaperCut NG and PaperCut MF potentially impacted. Customers operating internet-accessible PaperCut Application Servers should take immediate action even if no suspicious activity has been observed.
Technical overview
The vulnerability is an authentication bypass that lets attackers invoke privileged PaperCut components. This can be leveraged to reconfigure an external database lookup. When this lookup is triggered, malicious SQL can be executed, resulting in remote code execution.
PaperCut uses the Apache Tapestry framework, whose “complex direct” request format can identify one page to display and a different page containing the component to execute. PaperCut validates access only to the displayed page. By selecting either the public Error page or Exception page for display, an attacker can bypass authentication while invoking administrative components belonging to ConfigEditor or UserList.
The attack uses HTTP POST requests to the following URIs (Note that the path segment with the value 1 shown below can be any value for this path segment, and the Error path segment may also be the Exception path segment):
/app?service=direct/1/Error/ConfigEditor/quickFindForm
/app?service=direct/1/Error/ConfigEditor/$Form
/app?service=direct/1/Error/UserList/$QuickFind.$Form
The first two URIs provide unauthenticated access to PaperCut’s configuration editor. The third can invoke a user or card search that triggers the configured external database lookup.
An attacker first uses the ConfigEditor requests to modify four external user-lookup settings:
user-lookup.db-driver
user-lookup.db-url
user-lookup.id-to-username-sql
user-lookup.enabled
These settings normally allow administrators to connect PaperCut to an external card database. After bypassing authentication, however, the attacker can configure them with a malicious JDBC connection and a malicious SQL statement.
By leveraging PaperCut’s bundled Apache Derby database driver and supplying a Derby CALL statement that activates its foreignViews feature, Derby opens an attacker-controlled H2 JDBC URL. H2 processes an inline INIT statement that creates a JavaScript-backed database trigger. PaperCut includes the Nashorn JavaScript engine, allowing that trigger to start an operating-system process. However it is expected that other mechanisms to execute an arbitrary command can also be used instead of Nashorn. Finally, the attacker submits a search through the forged UserList request. This activates the external lookup and executes the malicious SQL.
Mitigation guidance
Organizations running PaperCut NG or PaperCut MF should prioritize patching on an emergency basis, particularly where the PaperCut Application Server is accessible from the public internet.
PaperCut has released emergency patches for PaperCut NG and PaperCut MF versions 25 and 26.
The vendor notes that these builds have not undergone their normal release process and are intended as emergency fixes for customers with public-facing servers that cannot otherwise sufficiently mitigate exposure. An emergency patch for version 24 is still in development at the time of the vendor’s latest update.
PaperCut recommends that administrators immediately restrict web access to trusted IP addresses only, such as internal corporate network ranges. Firewall rules, network access controls, reverse-proxy restrictions, or equivalent measures should be used to prevent untrusted internet hosts from reaching PaperCut web interfaces.
Please read the PaperCut security advisory for the latest remediation guidance, updated indicators of compromise, and additional release information.
Artifacts/Evidence Sources and IOCs
For detection and forensic analysis, PaperCut has identified several preliminary artifacts and evidence sources that may indicate compromise.
-
Application activity: Alerts from intrusion-detection, endpoint-security, or network-monitoring products involving the PaperCut Application Server, particularly suspicious post-exploitation activity associated with pc-app.exe.
-
Log integrity: Missing, unexpectedly truncated, or deleted PaperCut server.log files.
-
PaperCut server.log entries:
-
ERROR No suitable driver found for jdbc:no:x
-
ERROR DatabaseUtils – Database error looking up cardID: VALUES CAST
PaperCut has not yet published validated network-based indicators such as malicious IP addresses, domains, or URLs.
The vendor specifically warns that the absence of these indicators should not be interpreted as evidence that a system has not been affected.
Rapid7 customers
Exposure Command, InsightVM, and Nexpose
Exposure Command, InsightVM, and Nexpose customers can assess exposure to this new PaperCut zero-day, with an authenticated vulnerability check expected to be available in the August 28 (today’s) content release.
Updates
-
August 28, 2026: Initial publication.
Озеленяването при нови строежи – два завършени анти-примера
Post Syndicated from Боян Юруков original https://yurukov.net/blog/2026/ozelenyavane-2/
В предишната част от материала описах какви са изискванията, причините да търся публичност на плановете за озеленяване, защо и как се предотвратява това. За щастие, Столична община разпозна надделяващия публичен интерес и предостави плановете. За съжаление, не мога да ги споделя директно заради това, което аз смятам за лобистки текстове в закона.
Мога обаче да опиша със снимки какво се вижда на място и какво е трябвало да бъде. Избрах тези четири обекта по няколко причини. Първо, защото инвеститорите се рекламират основно със заявки за окъпани в зелени сгради, коректност и лукс. Второ, защото всяка от тях показва различни аспекти от неспазването на изискванията и ефектът от тях. Трето защото те са в различни фази на строеж и експлоатация позволяваща ни да разискваме възможностите за реакция. Четвърто – просто защото минавам почти всеки ден покрай тях, което освен че ми позволява да следя развитието им, ме връща редовно към мисълта, че така повече не може да се продължава.
Това в никакъв случай не значи, че по някакъв начин инвеститорите, сградите или нарушенията, които може би са били допуснати, са специални или уникални по някакъв начин. Виждаме същите в цяла София и цяла България. Докато има премного строежи въобще без разрешение или надвишили етажите, усвоили покриви или дори имоти публична собственост, при озеленяването нещата са далеч по-разпознаваеми и лесни за доказване. Поне би трябвало са, ако се упражняваше контрол. Ако имате други такива примери, бих се радвал да ги споделите в коментарите с описание какво разпознавате, че липсва.
На снимката долу съм отбелязал първите два, на които се спрях – Диамант 2 и East Plasa Hotel. Тъй като предпочетох да съм изчерпателен, се налага да разделя примерите в два текста. Следващите два примера на сгради все още в строеж ще опиша утре. Снимките в галериите долу се сменят автоматично. Може да ги спрете с бутона за пауза горе вдясно.
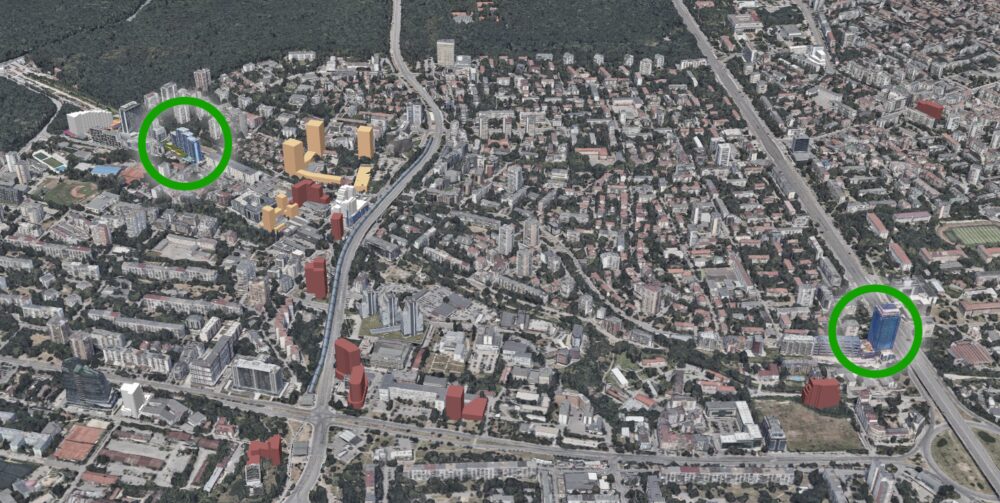
Диамант 2
Сградата беше рекламирана като изключително зелена от инвеститора. Гледайки плановете за озеленяване, наистина изглежда така – 86 широколистни и 52 иглолистни дървета, 168 високи иглолистни храсти, над 6000 цветя и други храсти. Заявяват, че 41% от площта ще е в озеленяване, минимум 25% от която са високи дървета. Сградата се намира на поземлени имоти 68134.803.4008, 68134.803.4005 и 68134.803.4050 с обща площ малко над 7 декара. Те имат две отделни разрешителни за строеж с отделни изисквания за озеленяване. Това означава, че поне 2824 кв.м. от площта трябва да е в зеленина и трябва да има поне 59 високи дървета като минимум общо за двата строежа.
На място виждаме, че въпреки заявките на инвеститора, има 76 широколистни дървета, 7 иглолистни и не повече от 100 храсти от какъвто и да е вид. Отделно има 18 дървета, които не отговарят на изискванията, тъй като са долепени до бордюра с отстояние под два метра от улицата и под 70 см от тротоара (снимки 13 и 14 и всички отбелязани в жълто). Няколко други са твърде близо до фасадата или балкони, които отново ги дисквалифицира (снимка 16). Има още 23 дървета, които са всъщност в общински имот, който инвеститорът е на практика приобщил към комплекса (снимка 10). Там има и тяхна рекламна табела без разрешение за поставяне.
Споменатите над 40 дървета не може да се считат към озеленяването. От останалите обаче високите са не повече от 50, което е крайно недостатъчно, за да покрие изискванията. Друго любопитно нещо е, че половината са в първият етап на строежа, който е с отделно разрешение за строеж в парцел 4005. Там нещата изглеждат добре и отговарят на изискванията. Другият парцел 4008, който е значително по-голям и има отделно разрешение с отделно изчисление на озеленяването. Там липсват поне 55 дървета и коефициентът на високи дървета е значително под 25%.
-

Липсват четири дървета в паркинг, който е трябвало да бъде зелена площ. -
лед акт 16. още зелени алеи в съседния паркинг бяха покрити с плочи -

Снимката е от 2021 г. и показва лехи, които после бяха бетонирани. -
Тук броят дървета е правилен, но както в голяма част от строежа почвеният слой е минимален и не отговаря на изискванията -

Снимката е от 2024 и показва място с премахнато дърво и бетонирана зелена площ. -
Тук липсват две дървета -
Липсва едно дърво, а други две са на 30 см. от пътя -
Пет дървета са близо до бордюра, а три са в общински имот -
Само две от дърветата са в имота на сградата -
Всички дървета тук са в общински имот. Табелата на Артекс няма разрешение за поставяне. -
Отбелязаният в жълто имот е общински -
Има пет дървета, а трябва да са поне девет -
По цялото продължение на имота дърветата са долепени до бордюра. -
Вижда се разстоянието от ствола до бордюра и недостатъчно оставената почва. -
Налага се напоителна система, защото отдолу е бетон и дърветата не могат да оцелеят -
Аналогично в другия край на сградата -

Дори това дърво няма достатъчно отстояние от терасата -
Липсват половината дървета -
Липсват половината дървета -
Тук са правилният брой, но отново има съмнения за почвения слой. -
Липсват повечето дървета във вътрешния двор. -
Не съм отбелязал местата на повечето липсващи -
Тези са на ръба на имота. Няколко са изсъхнали
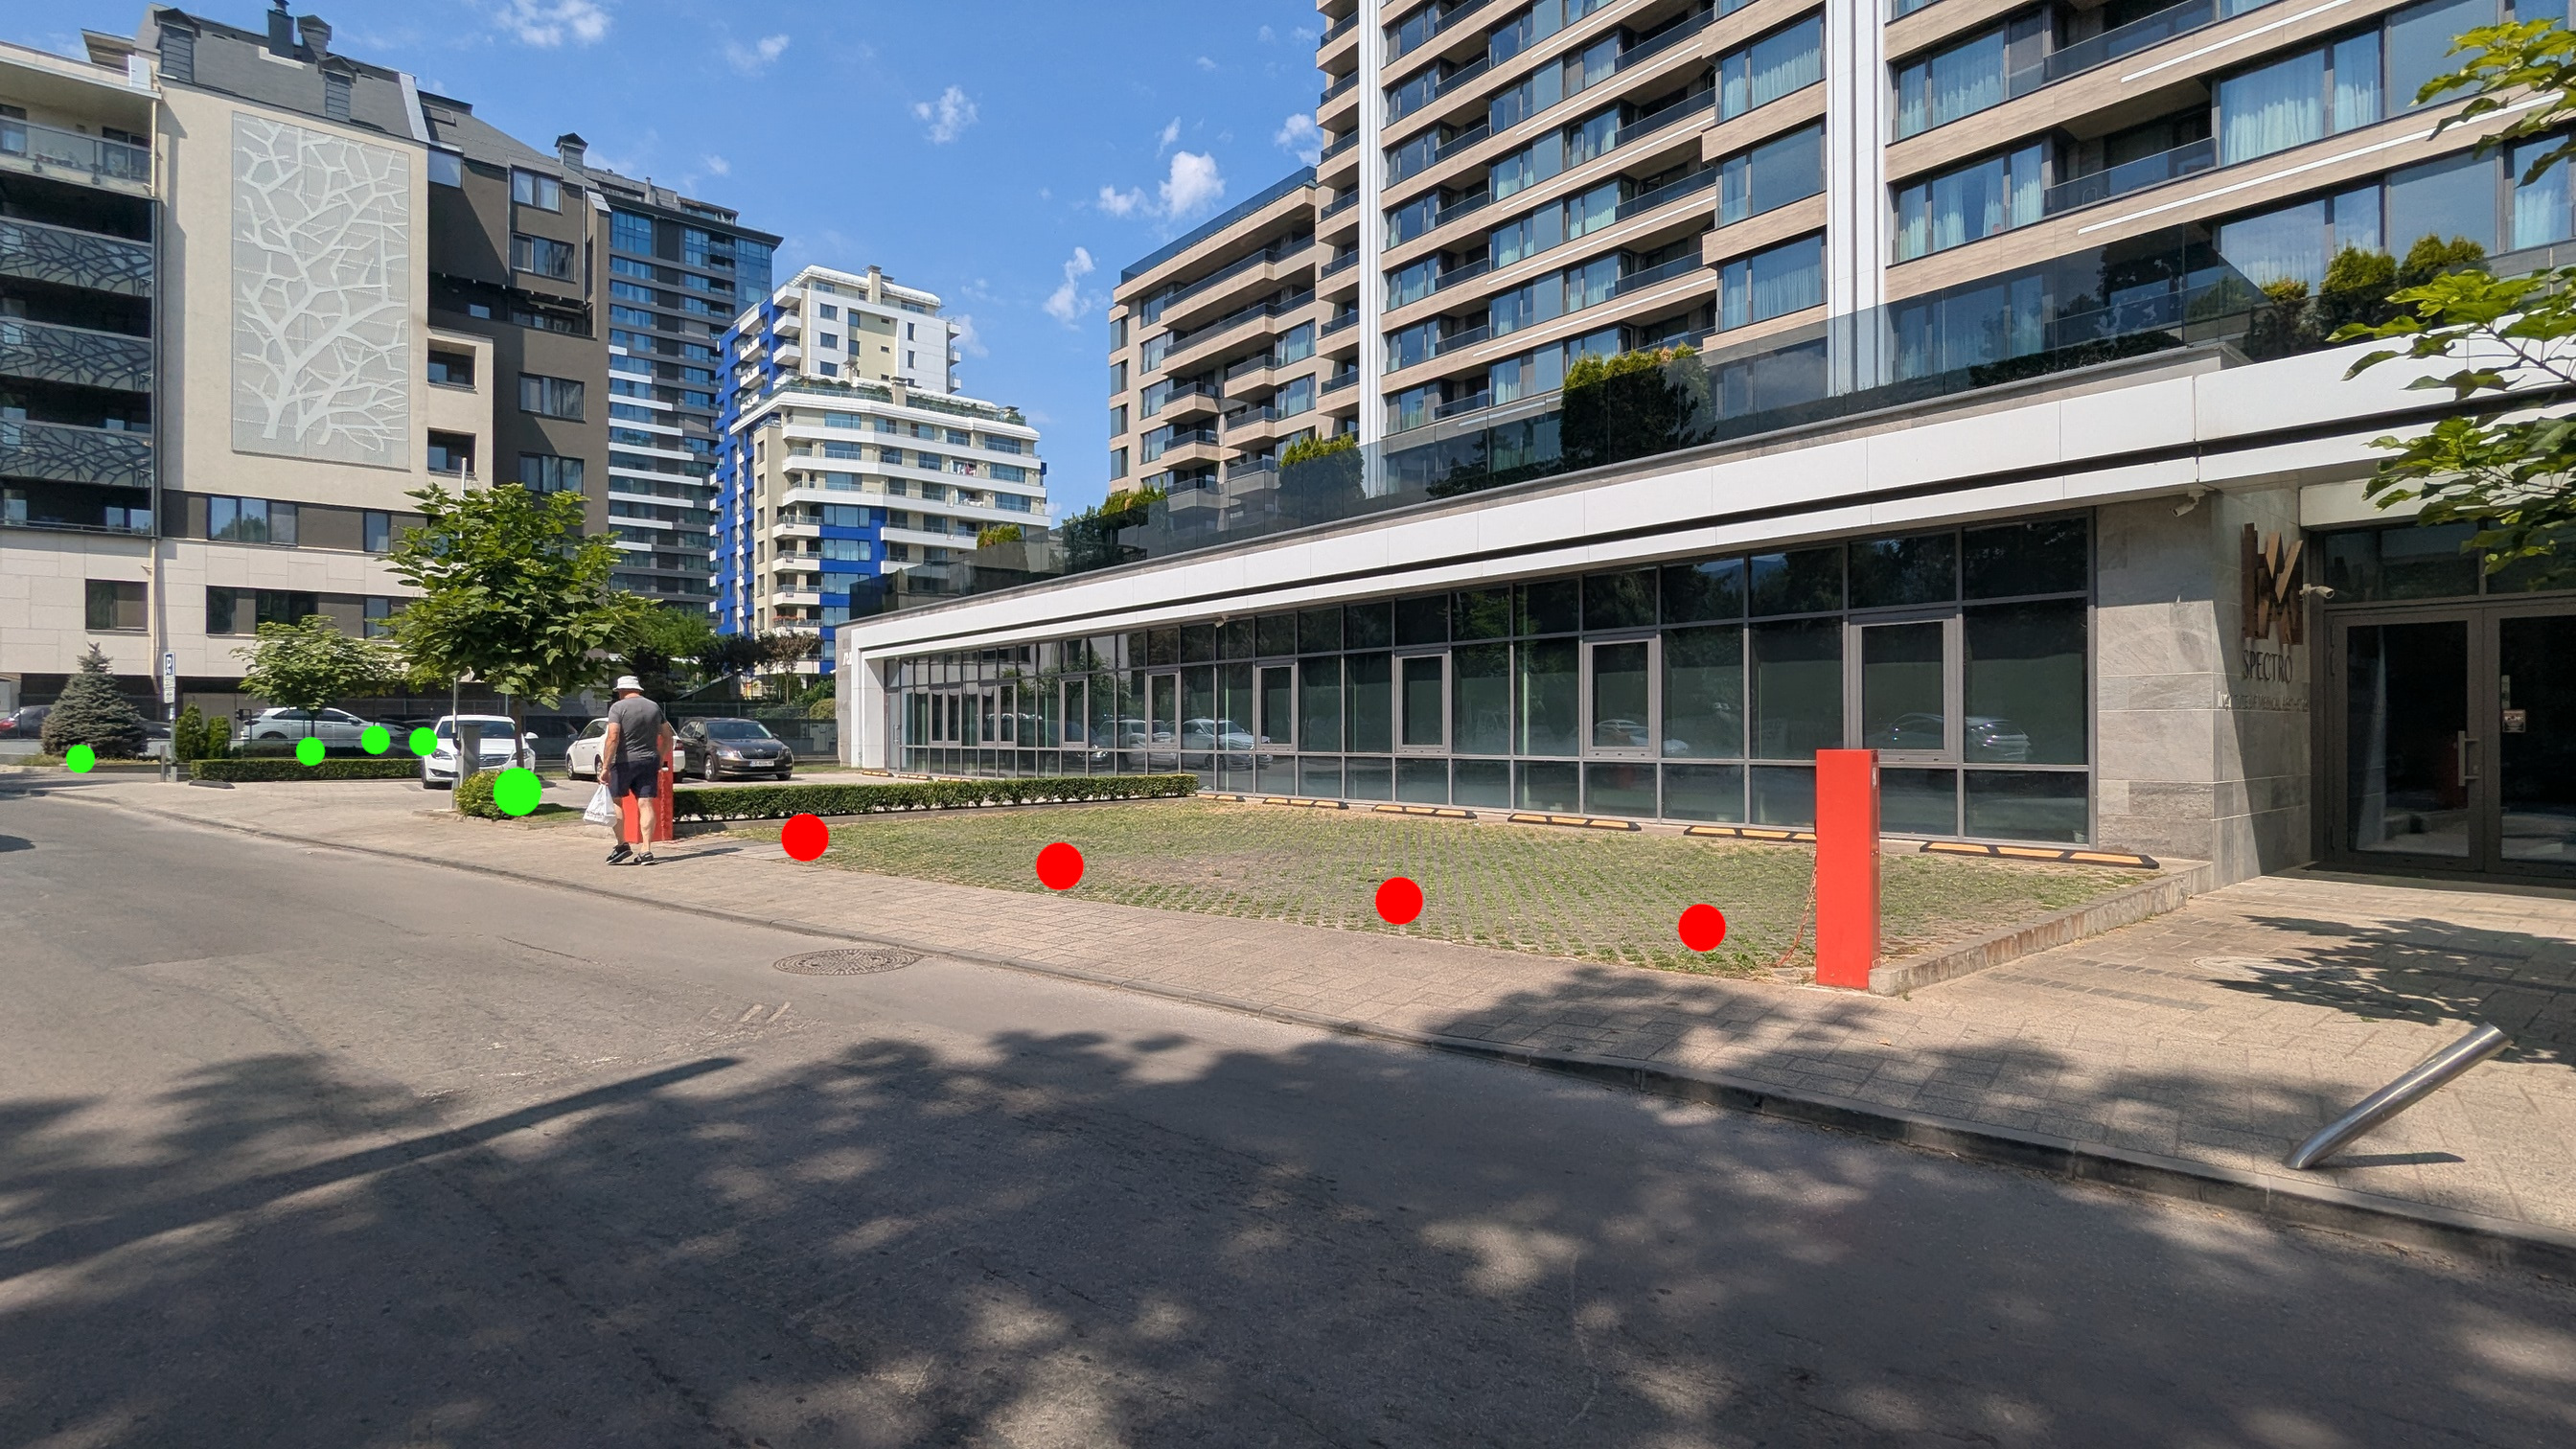
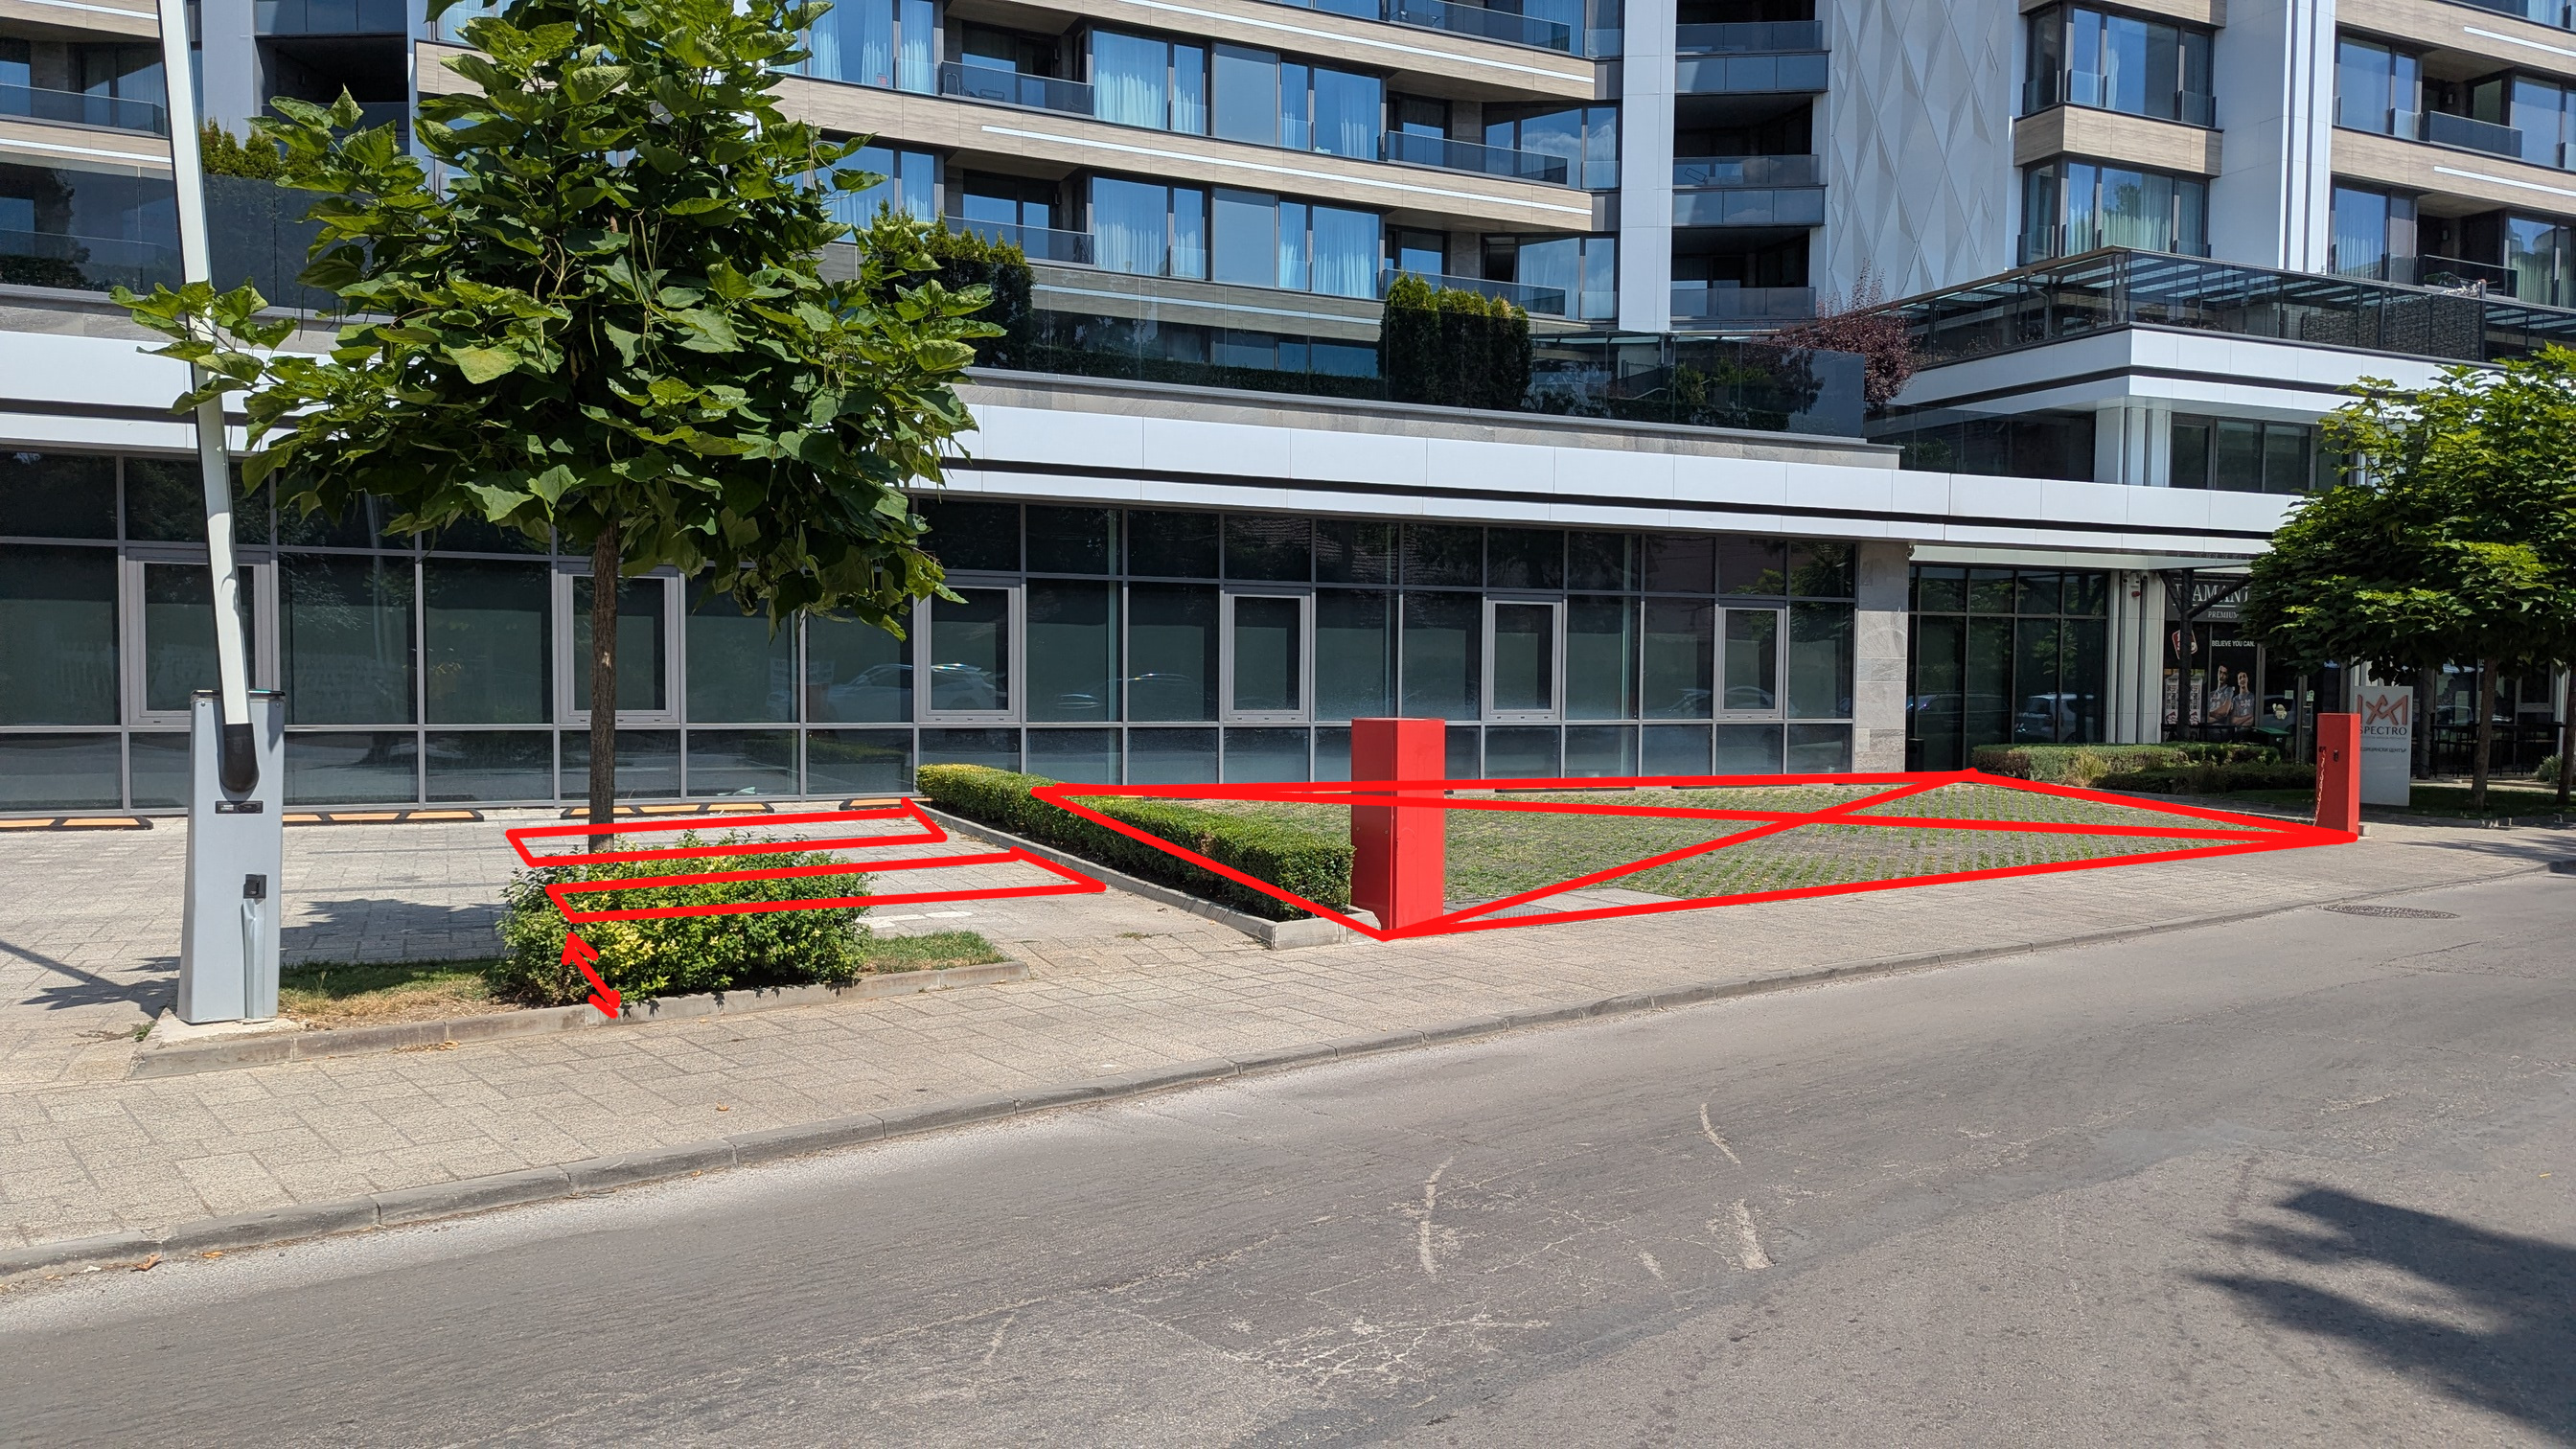
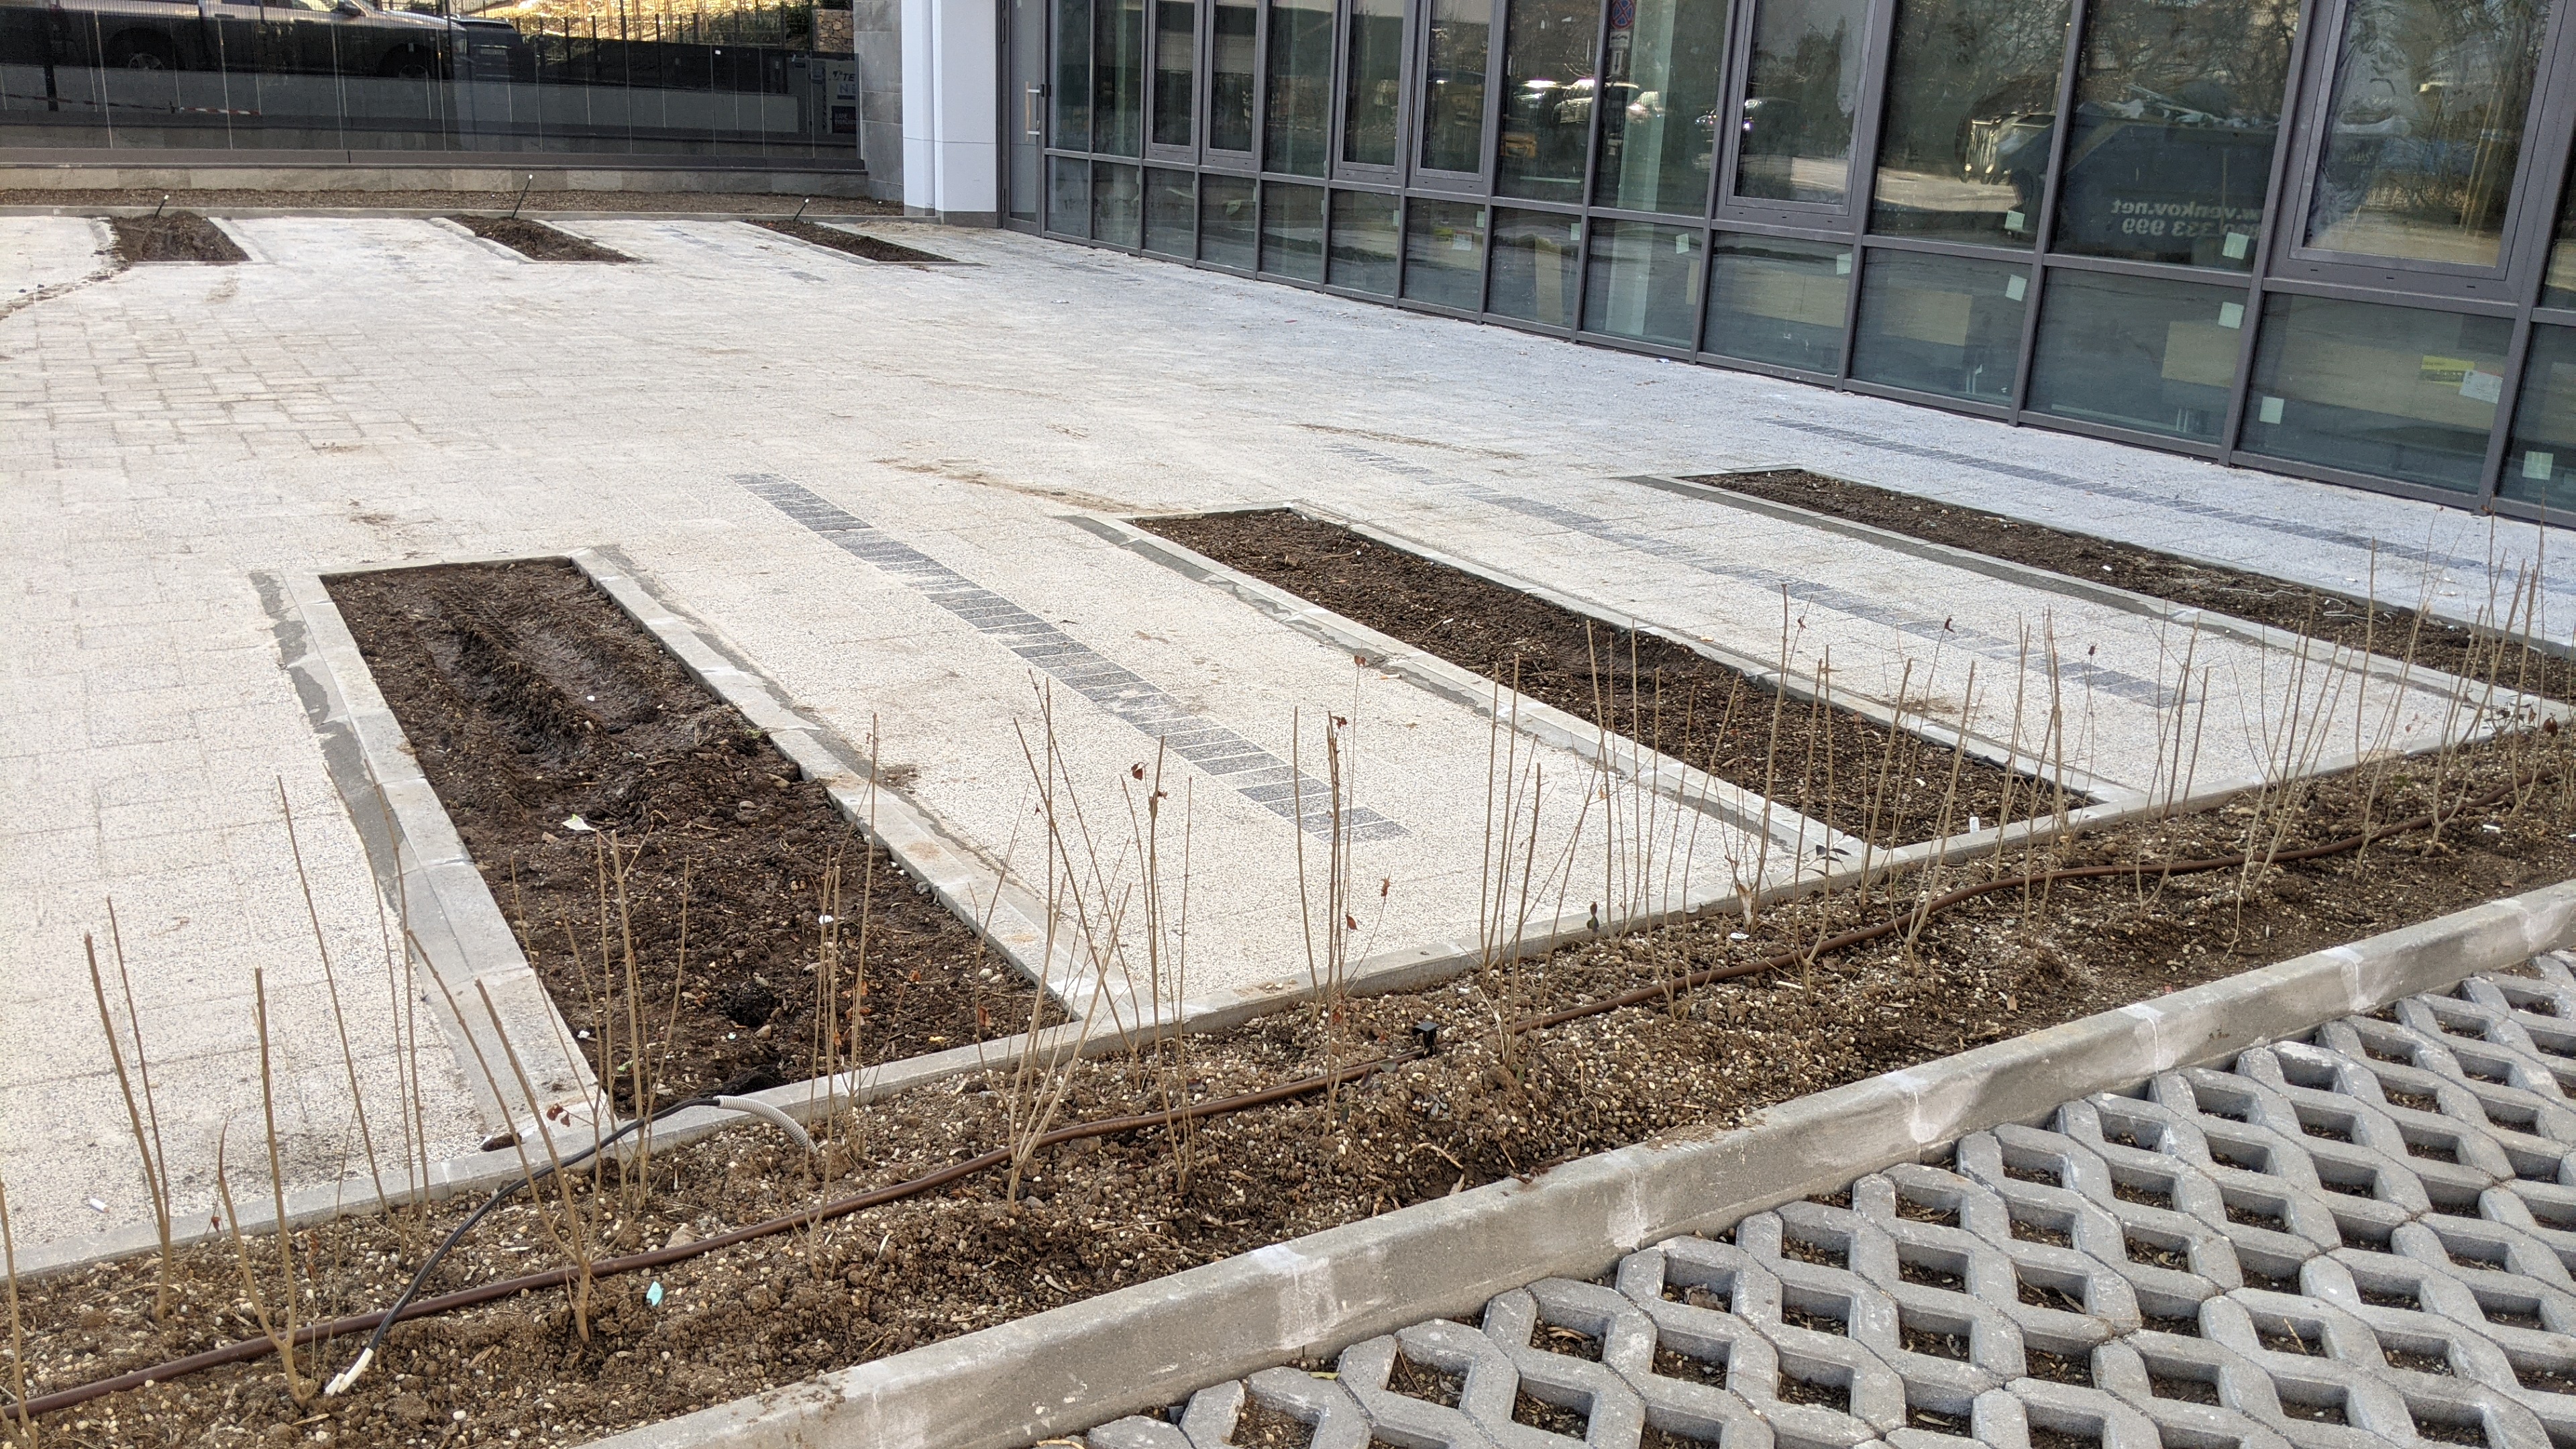
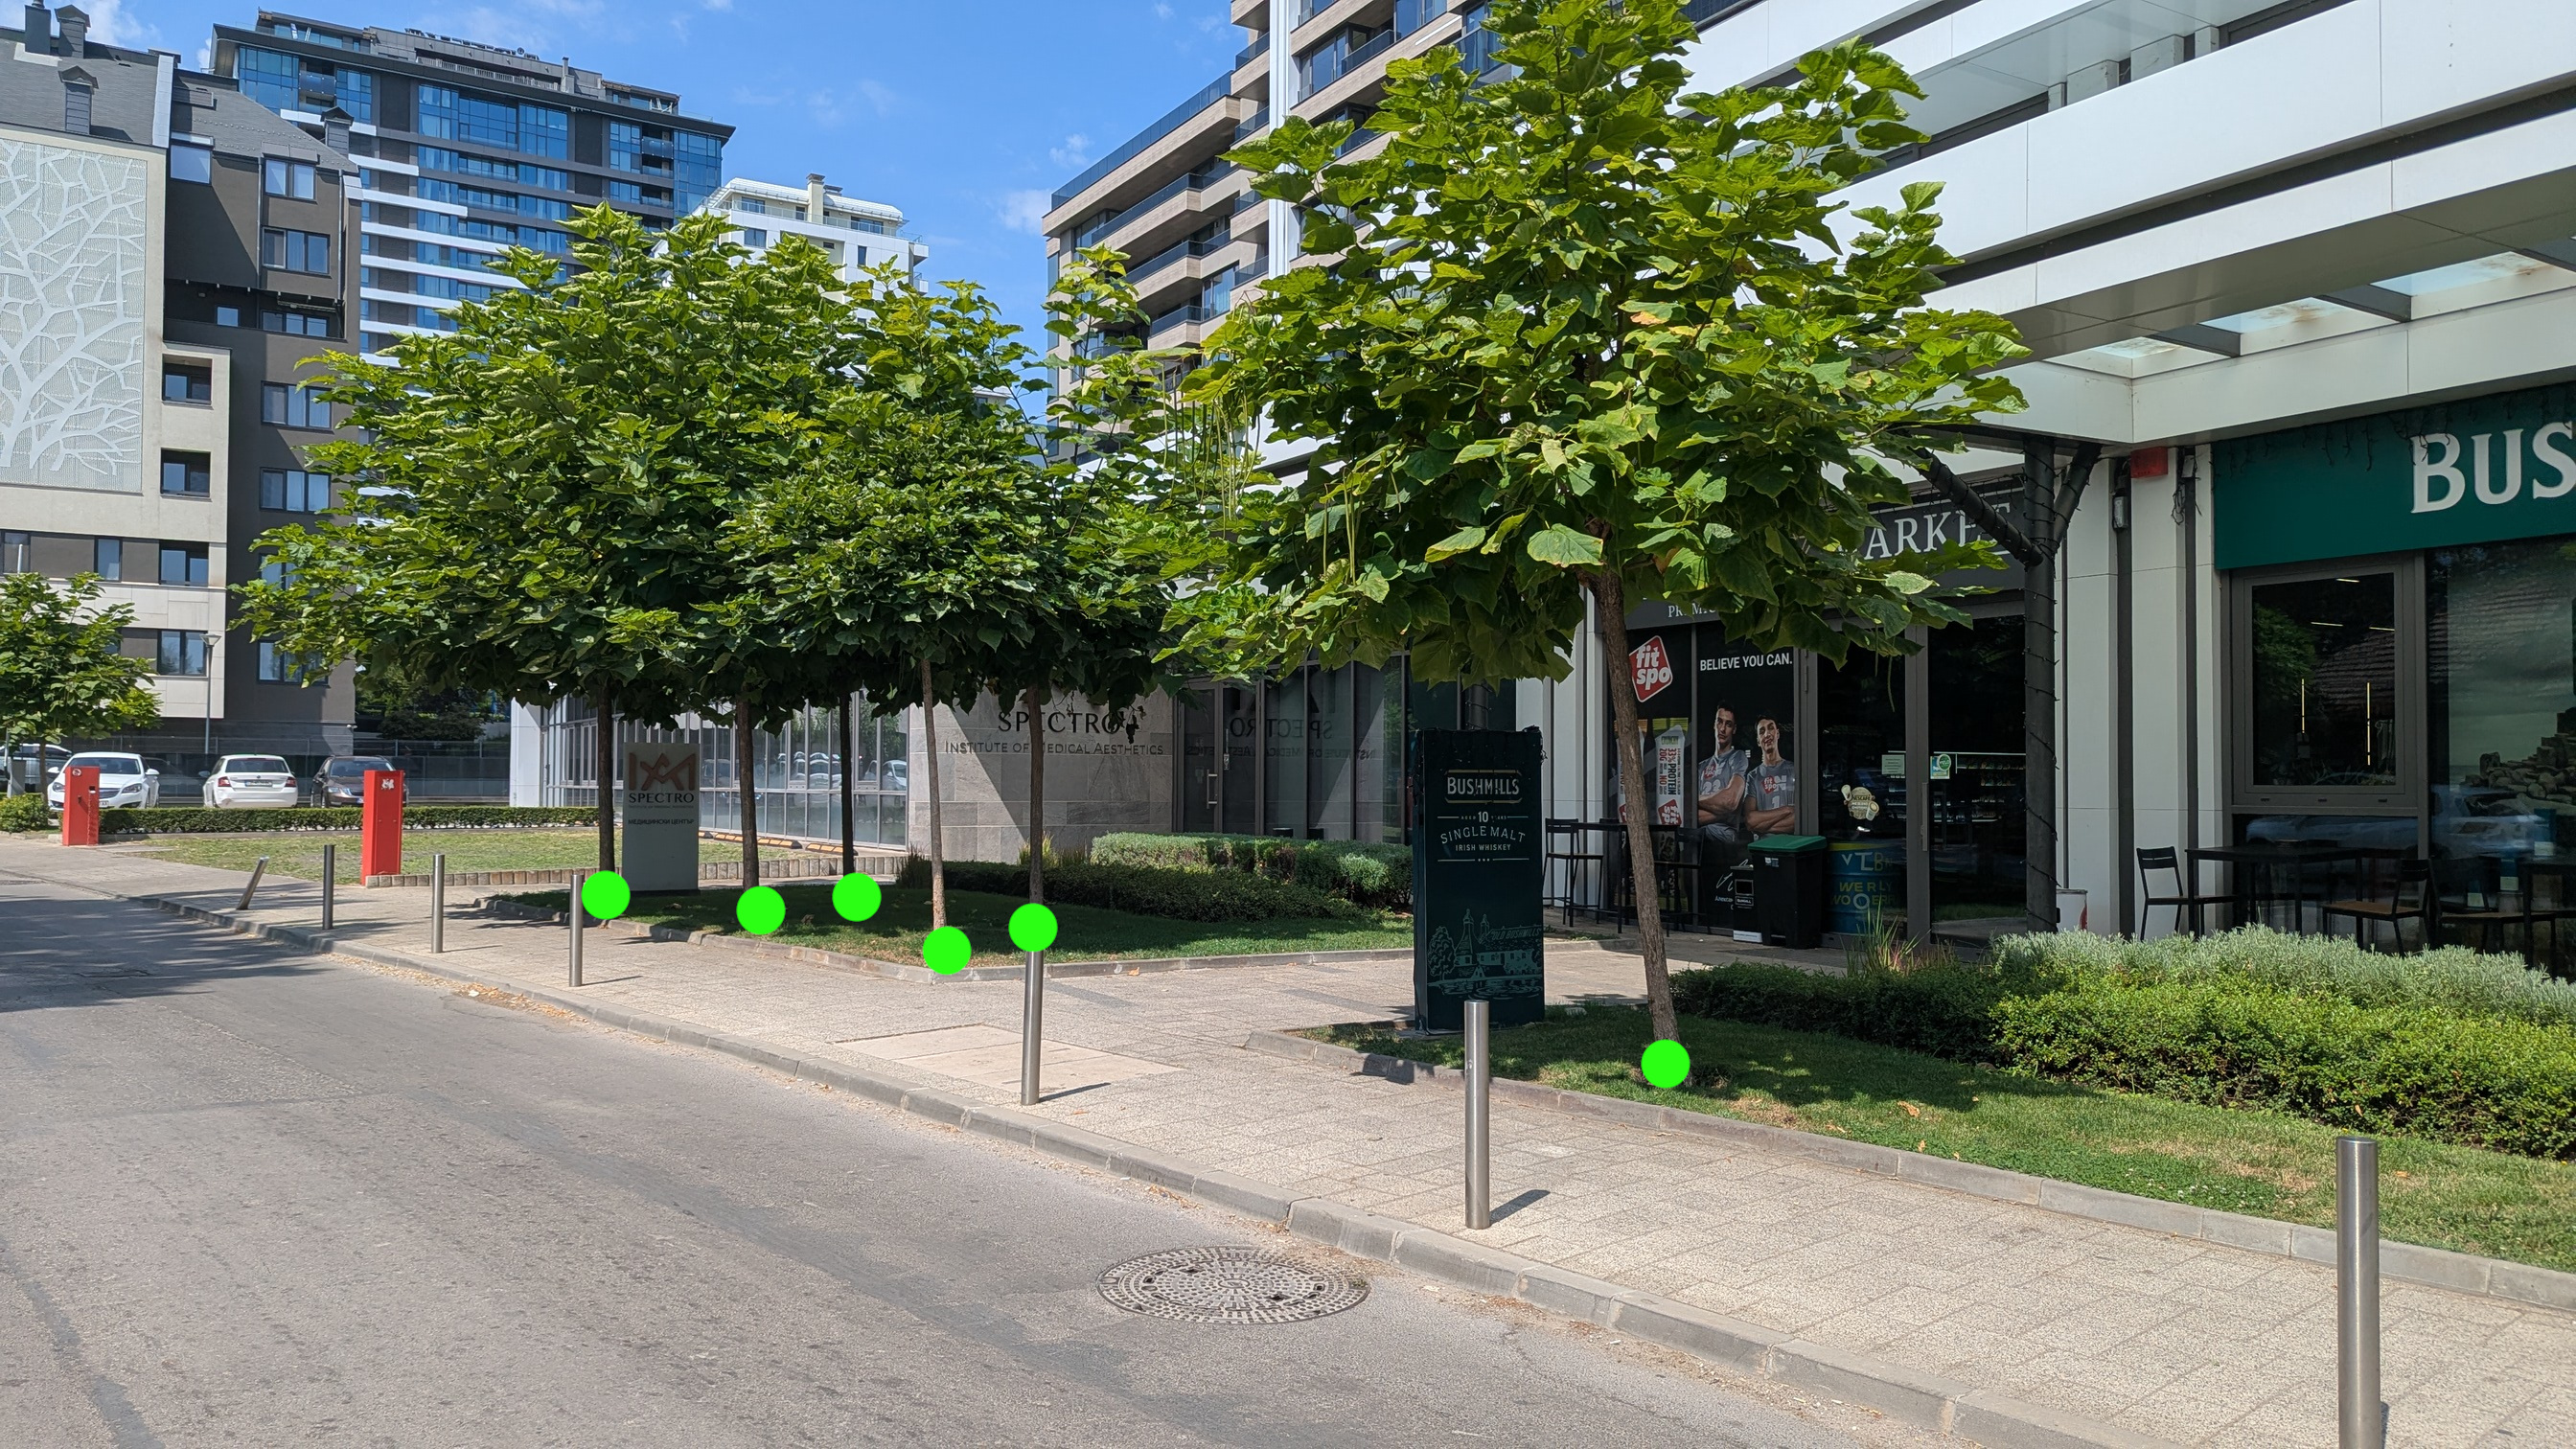

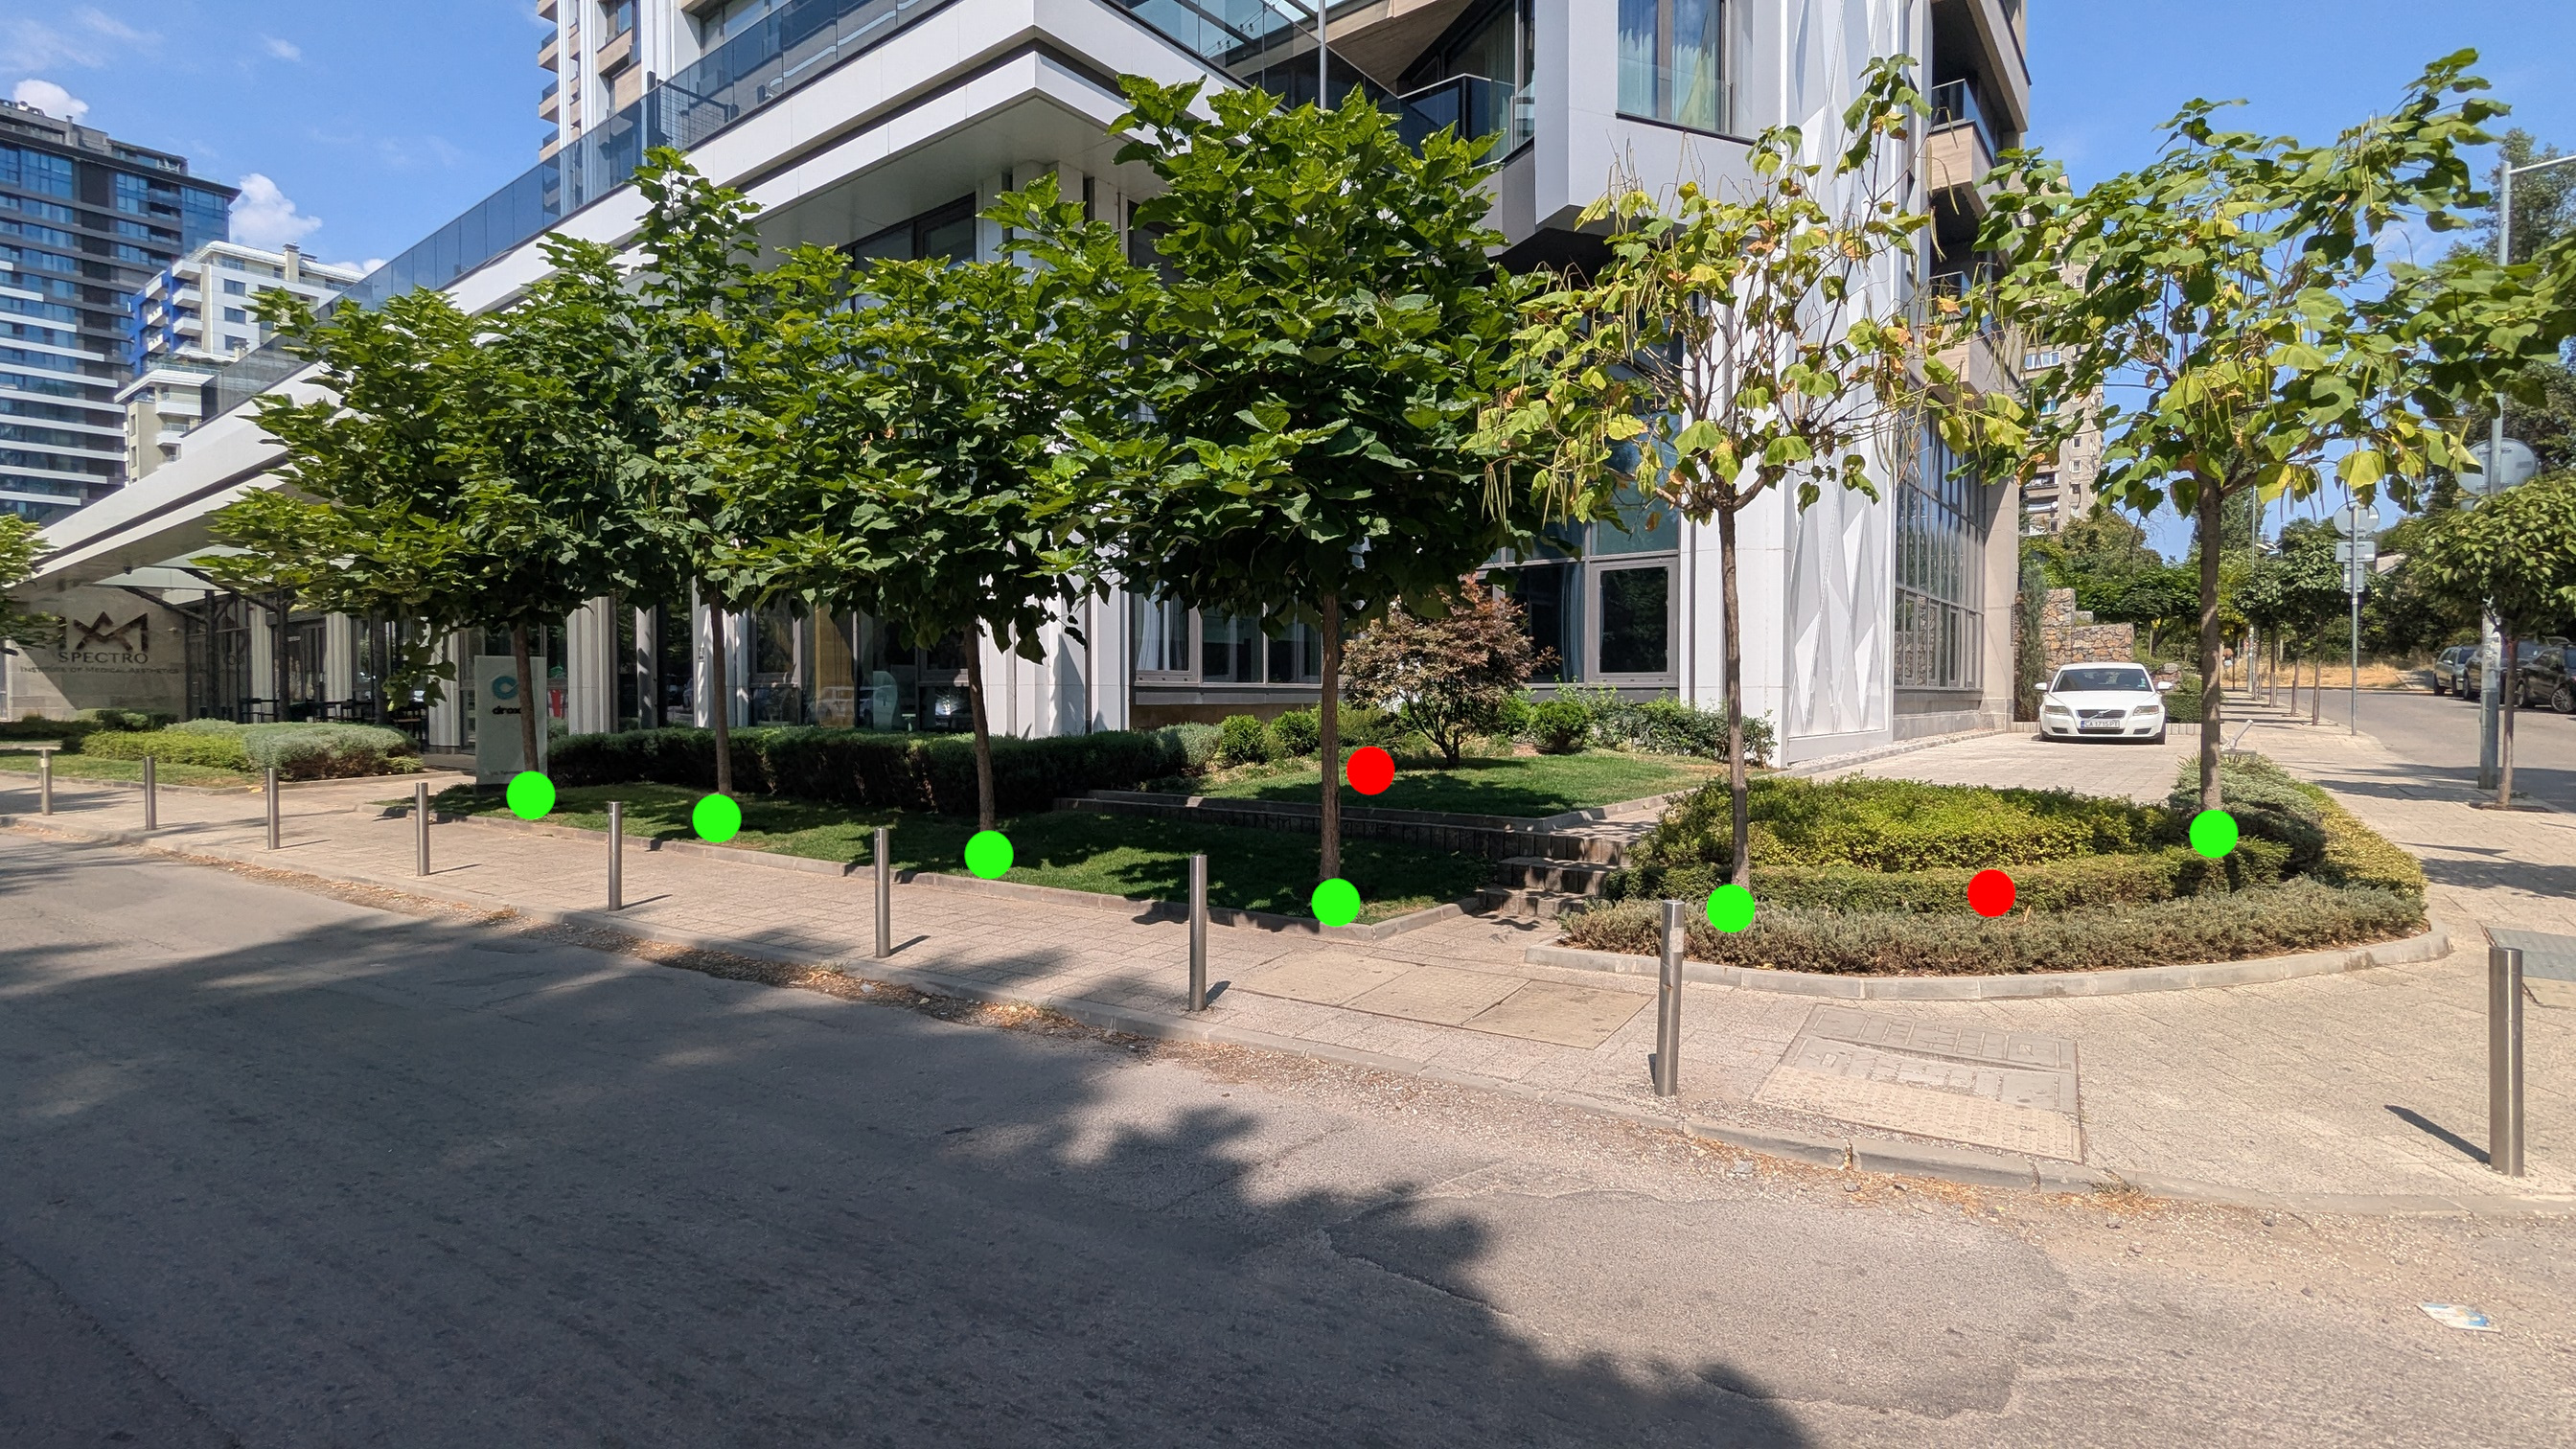
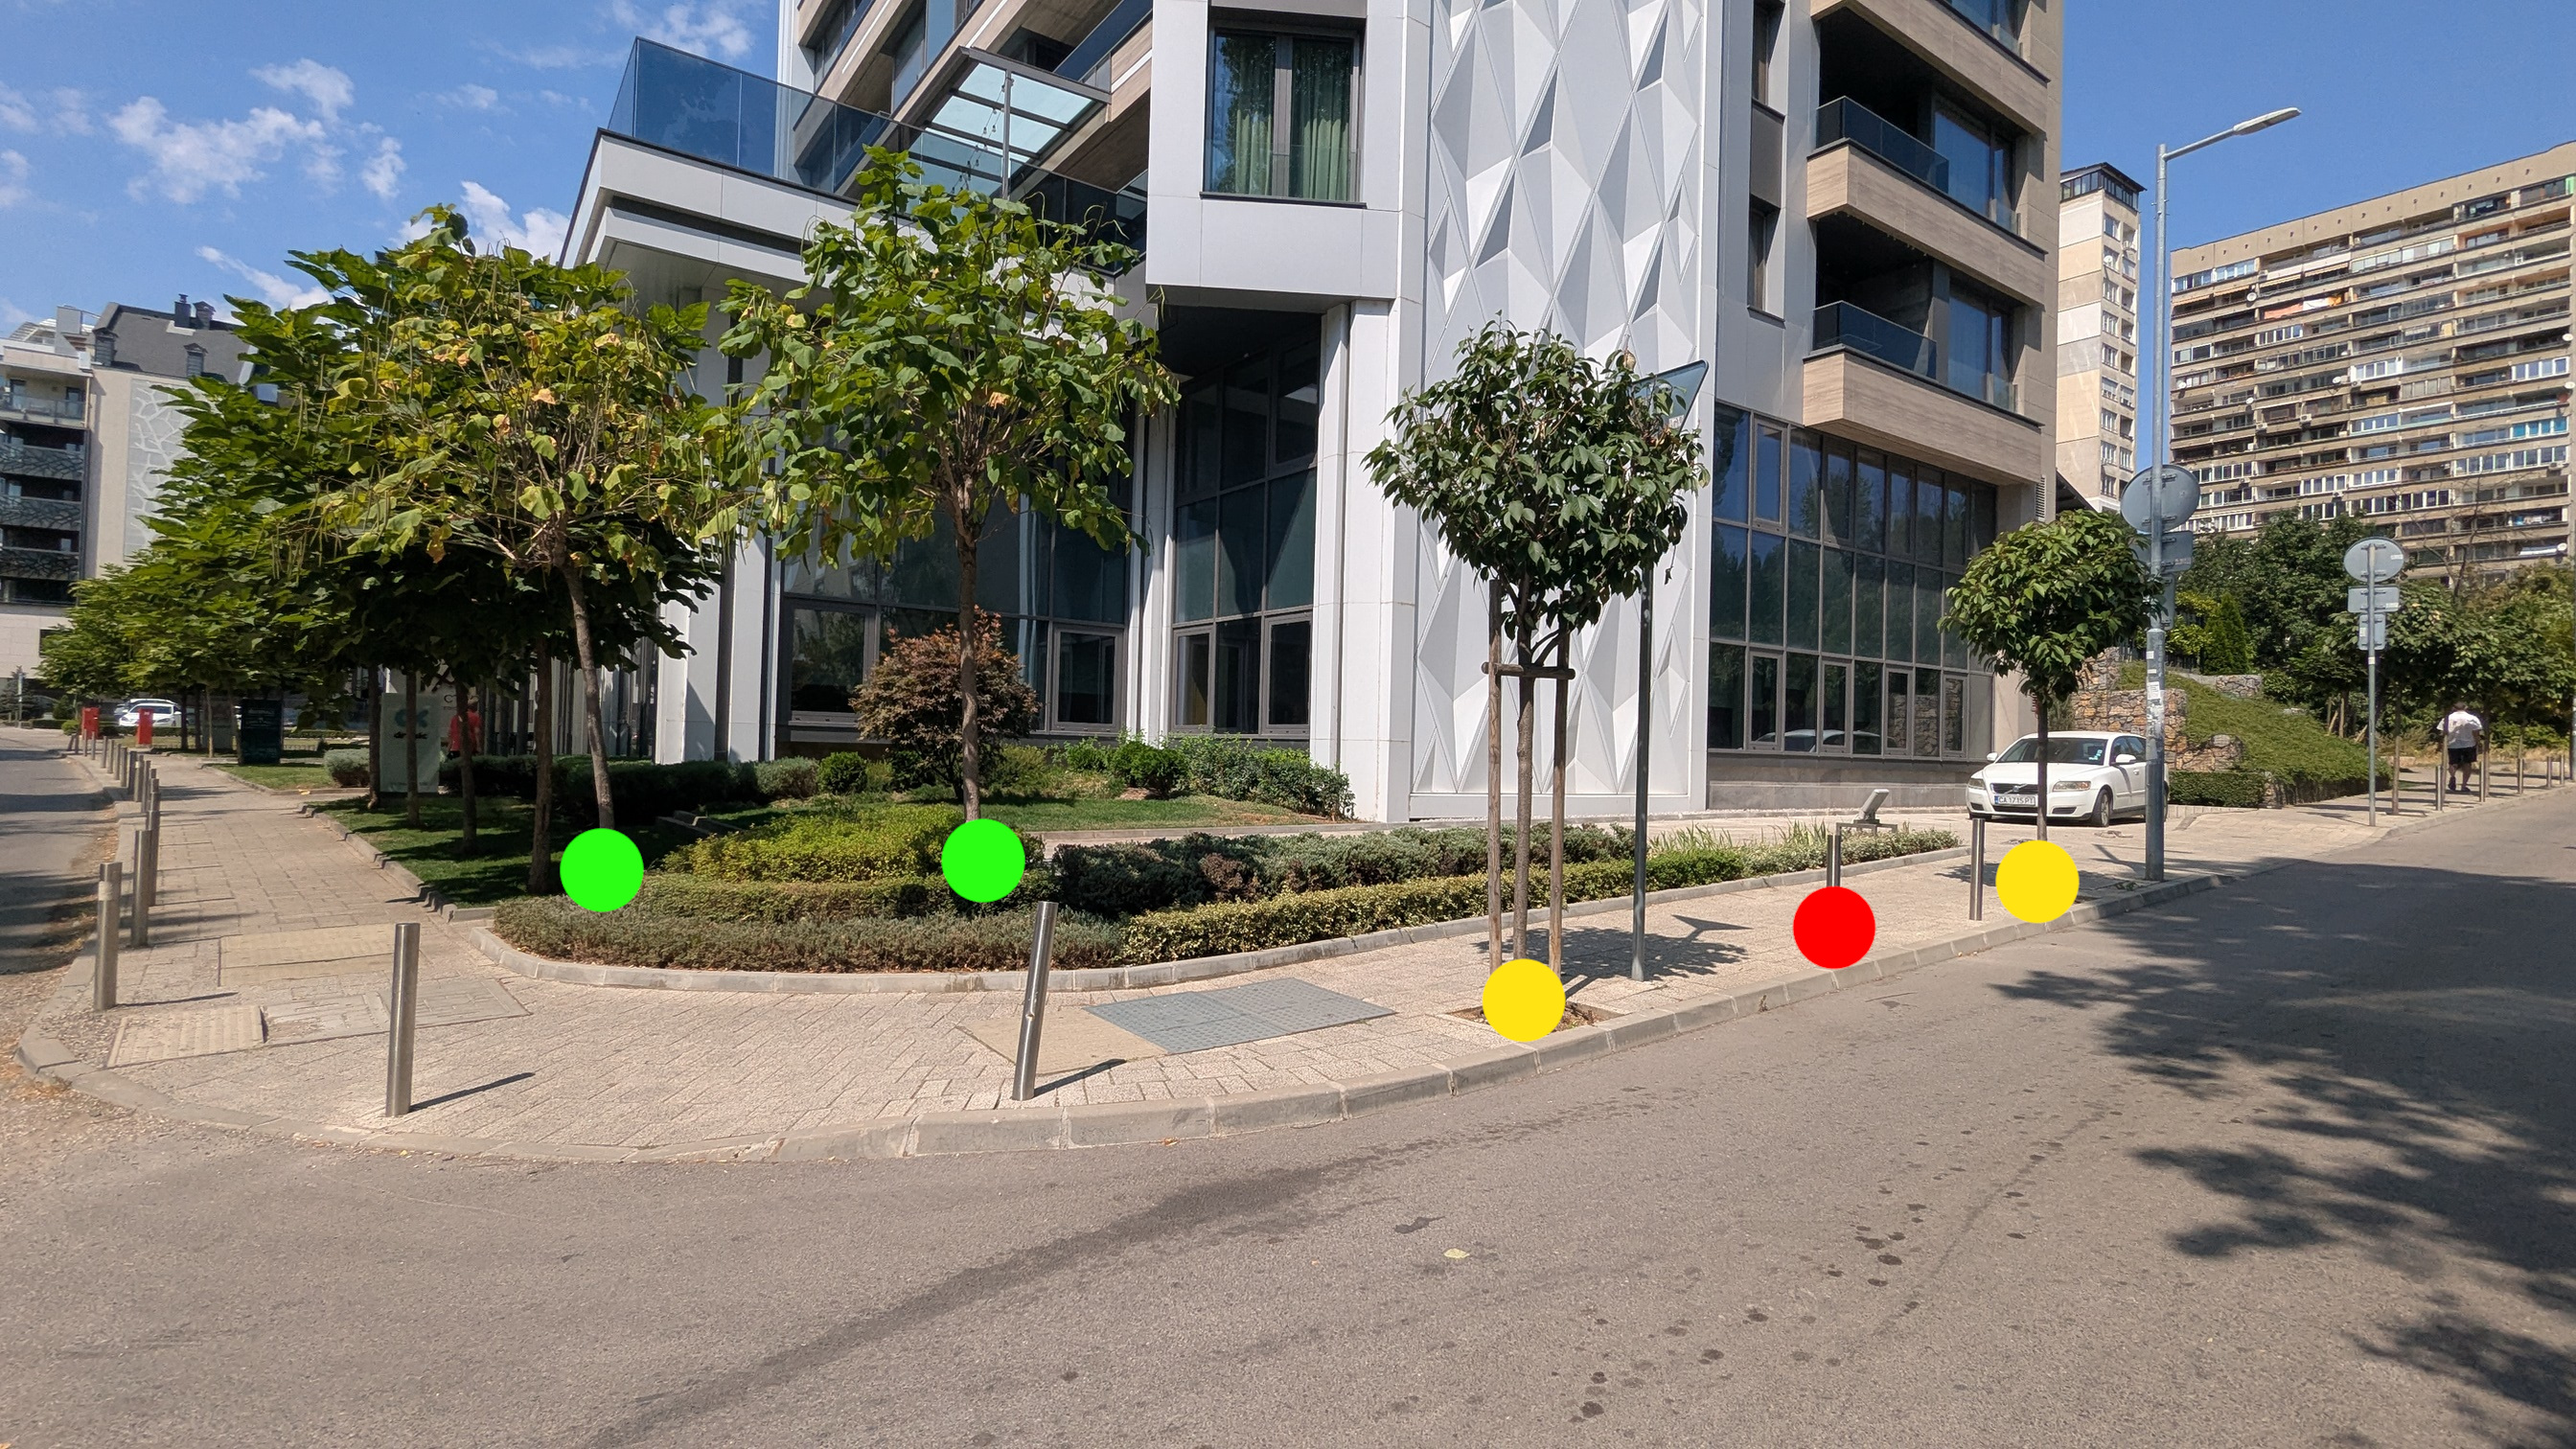
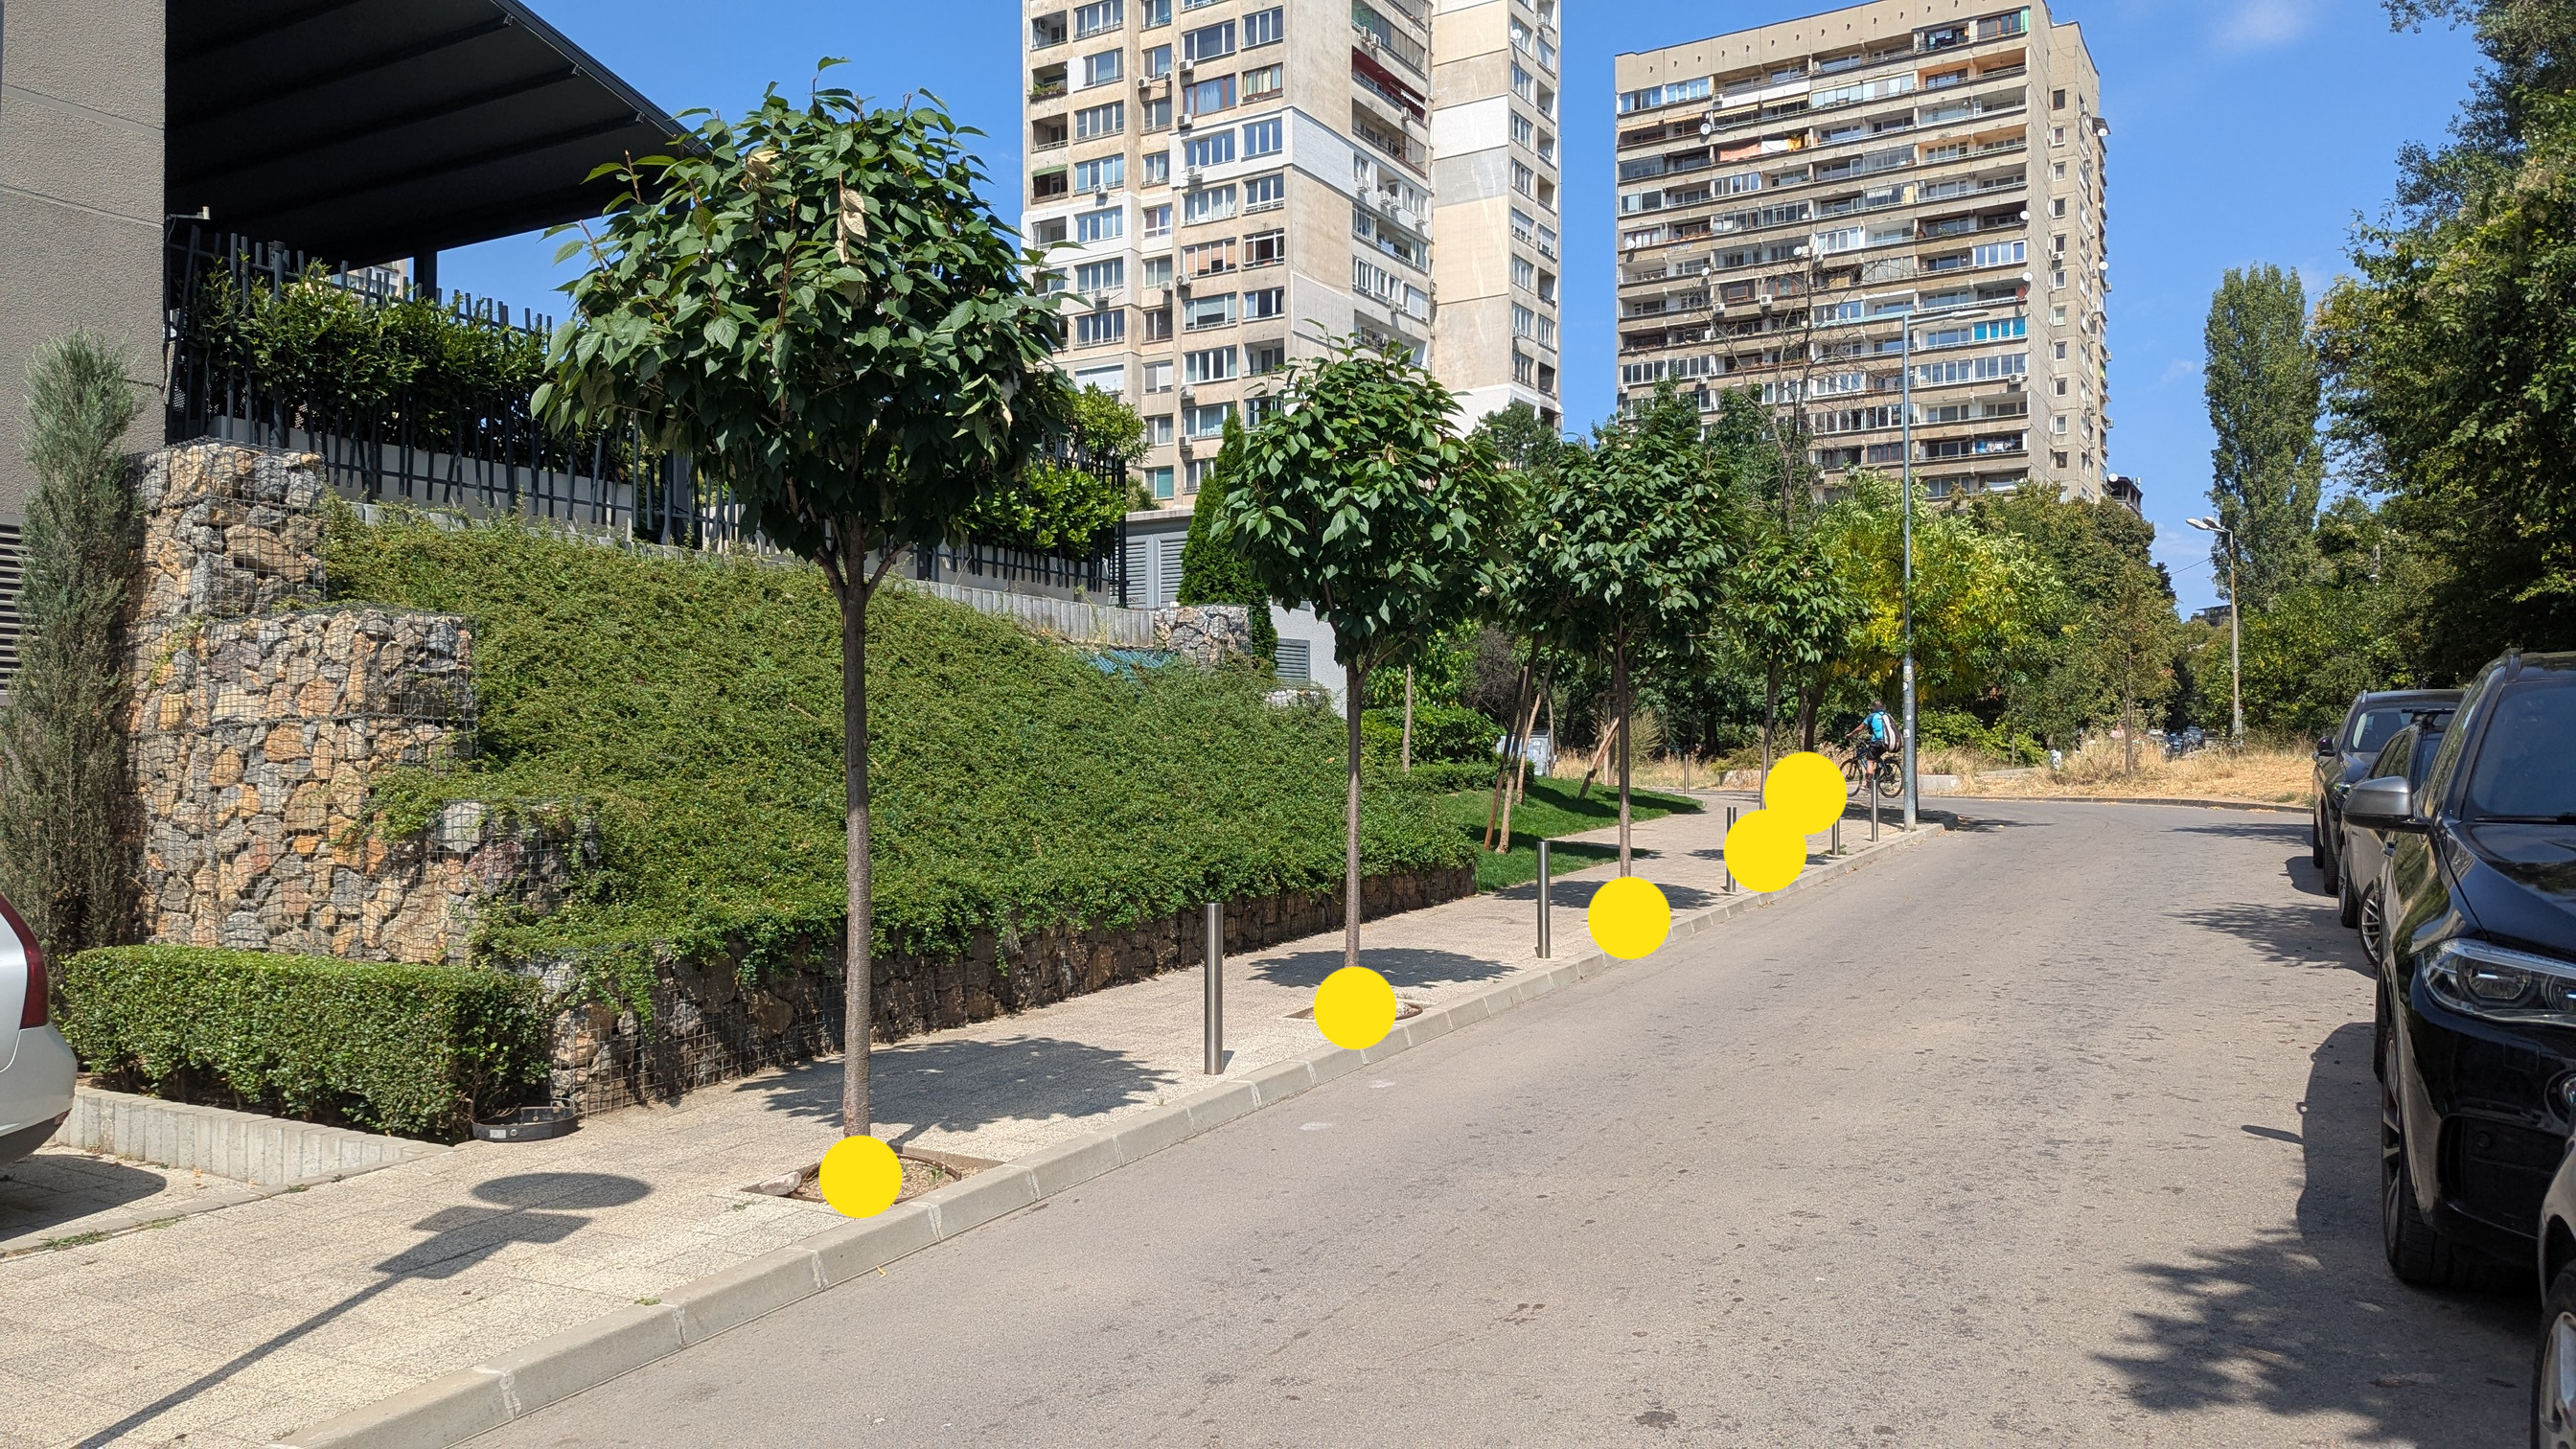

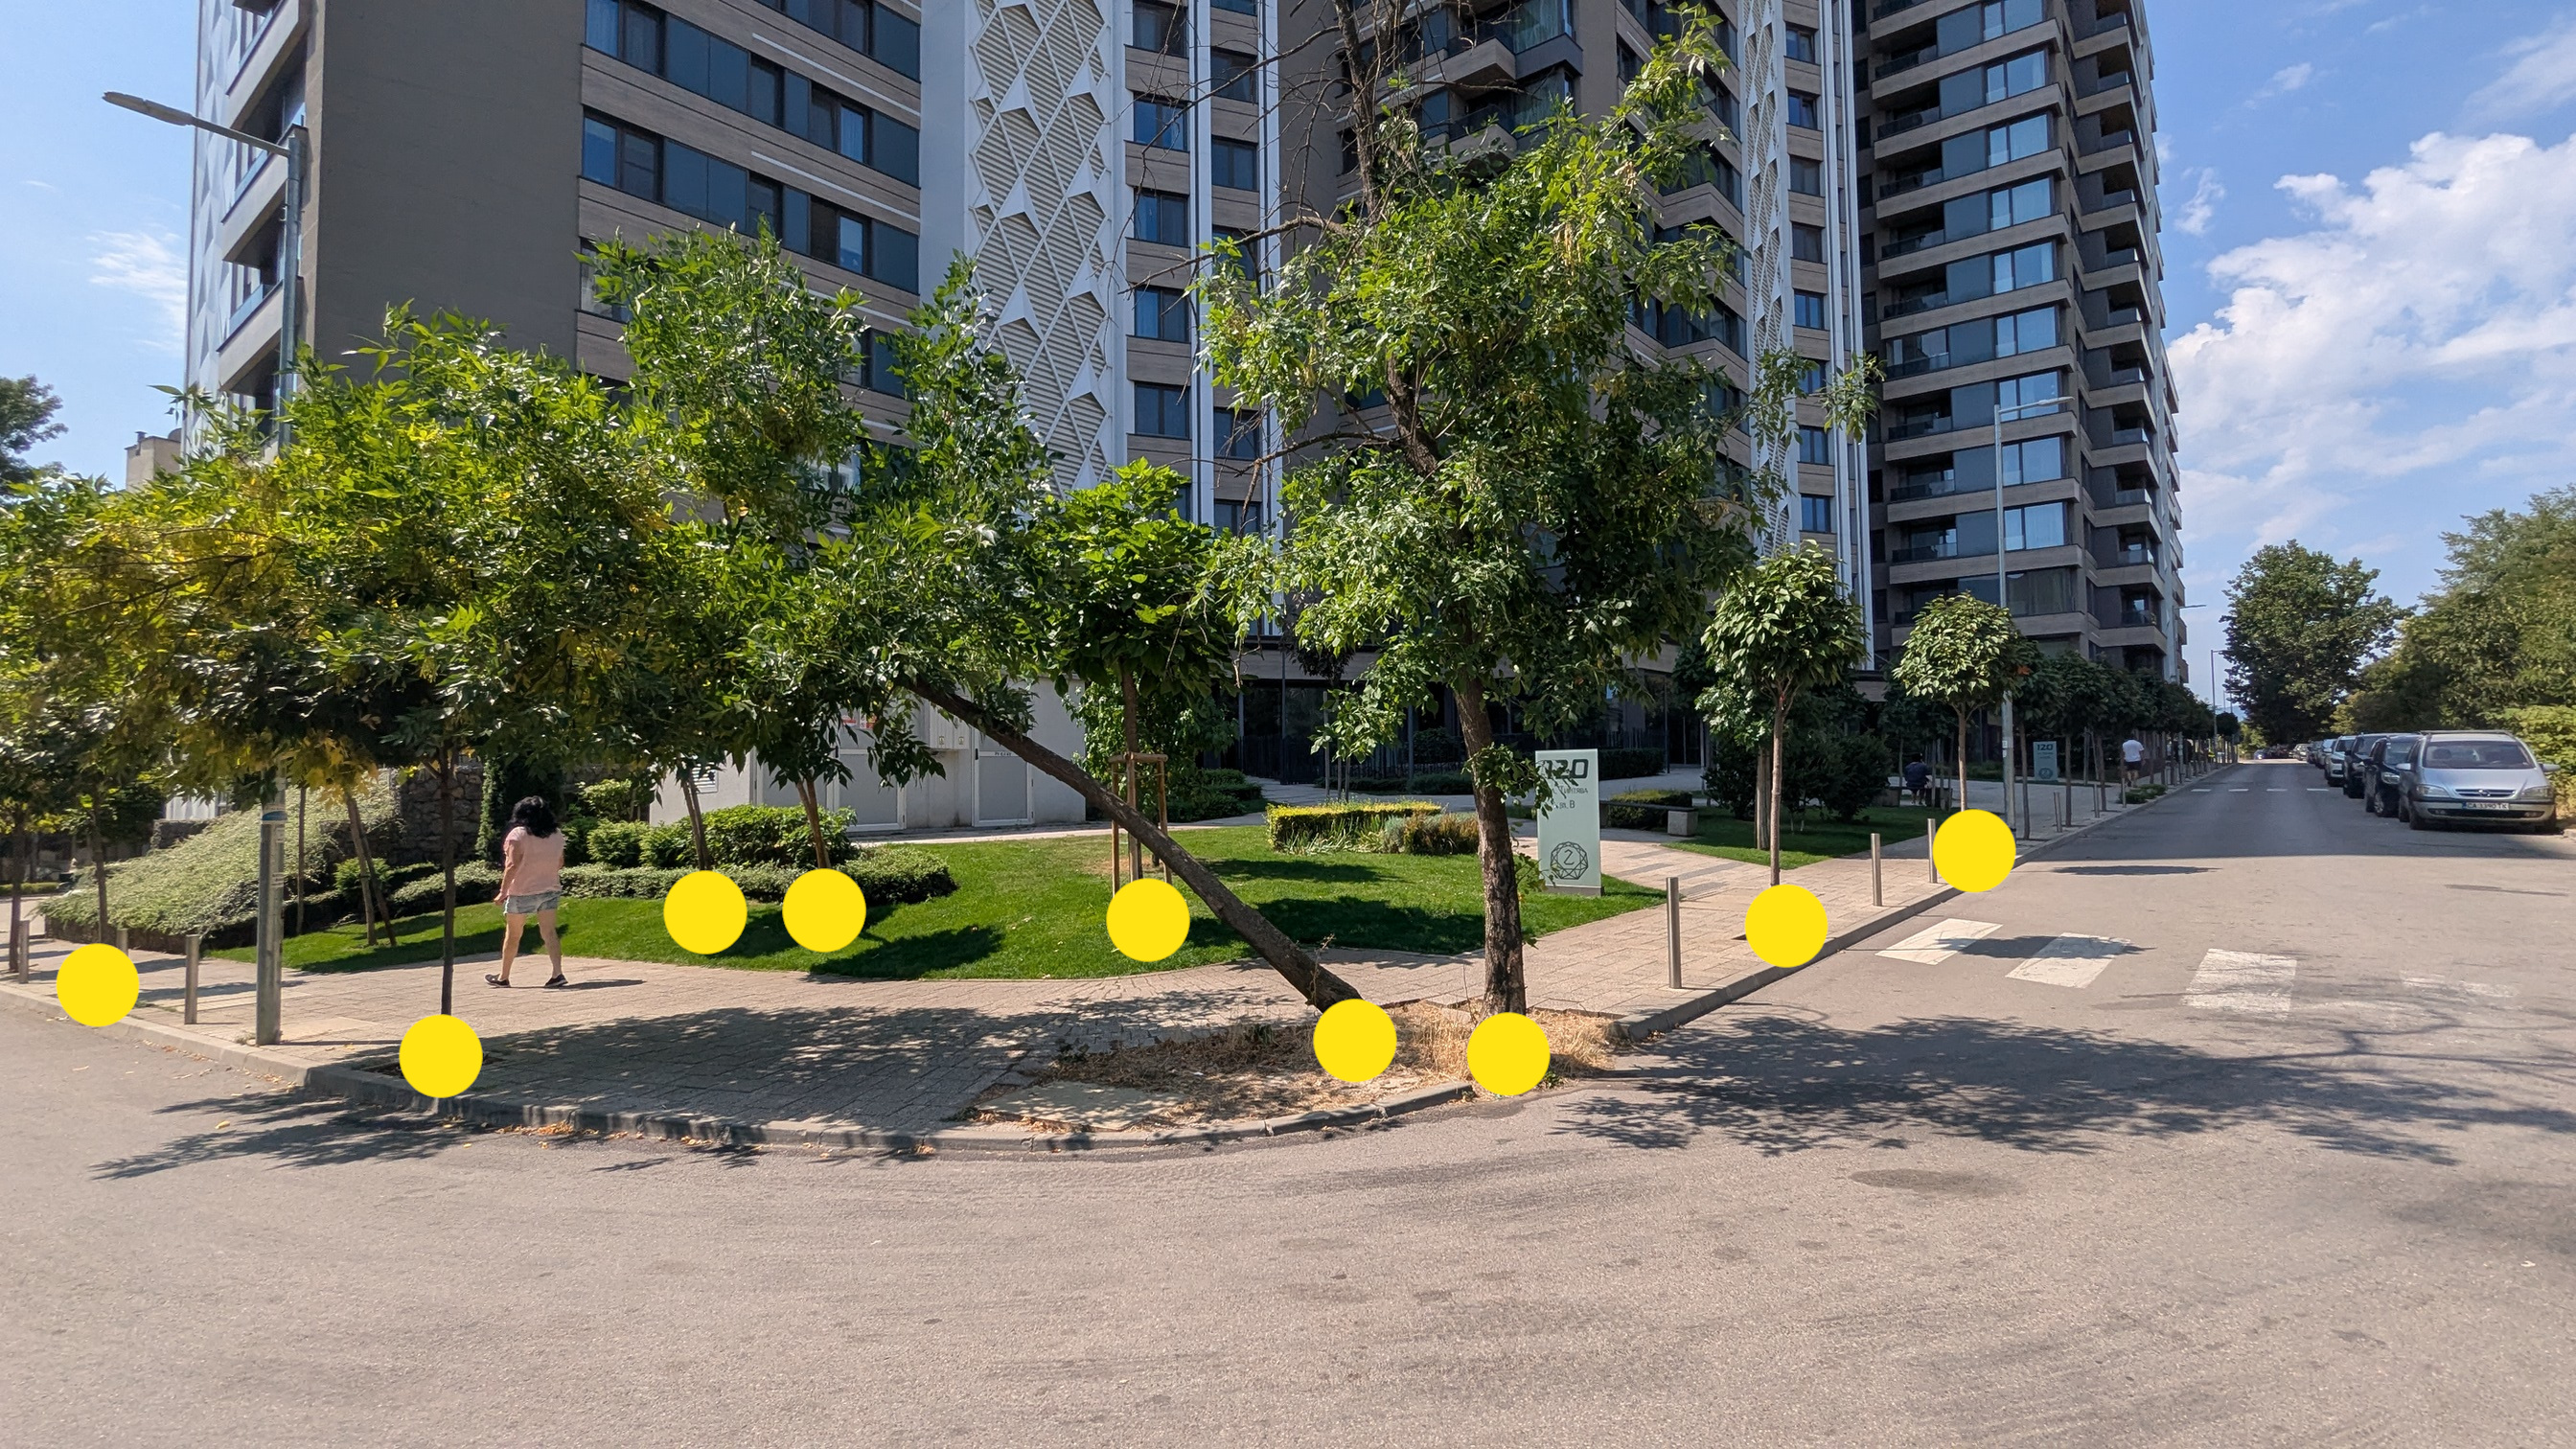

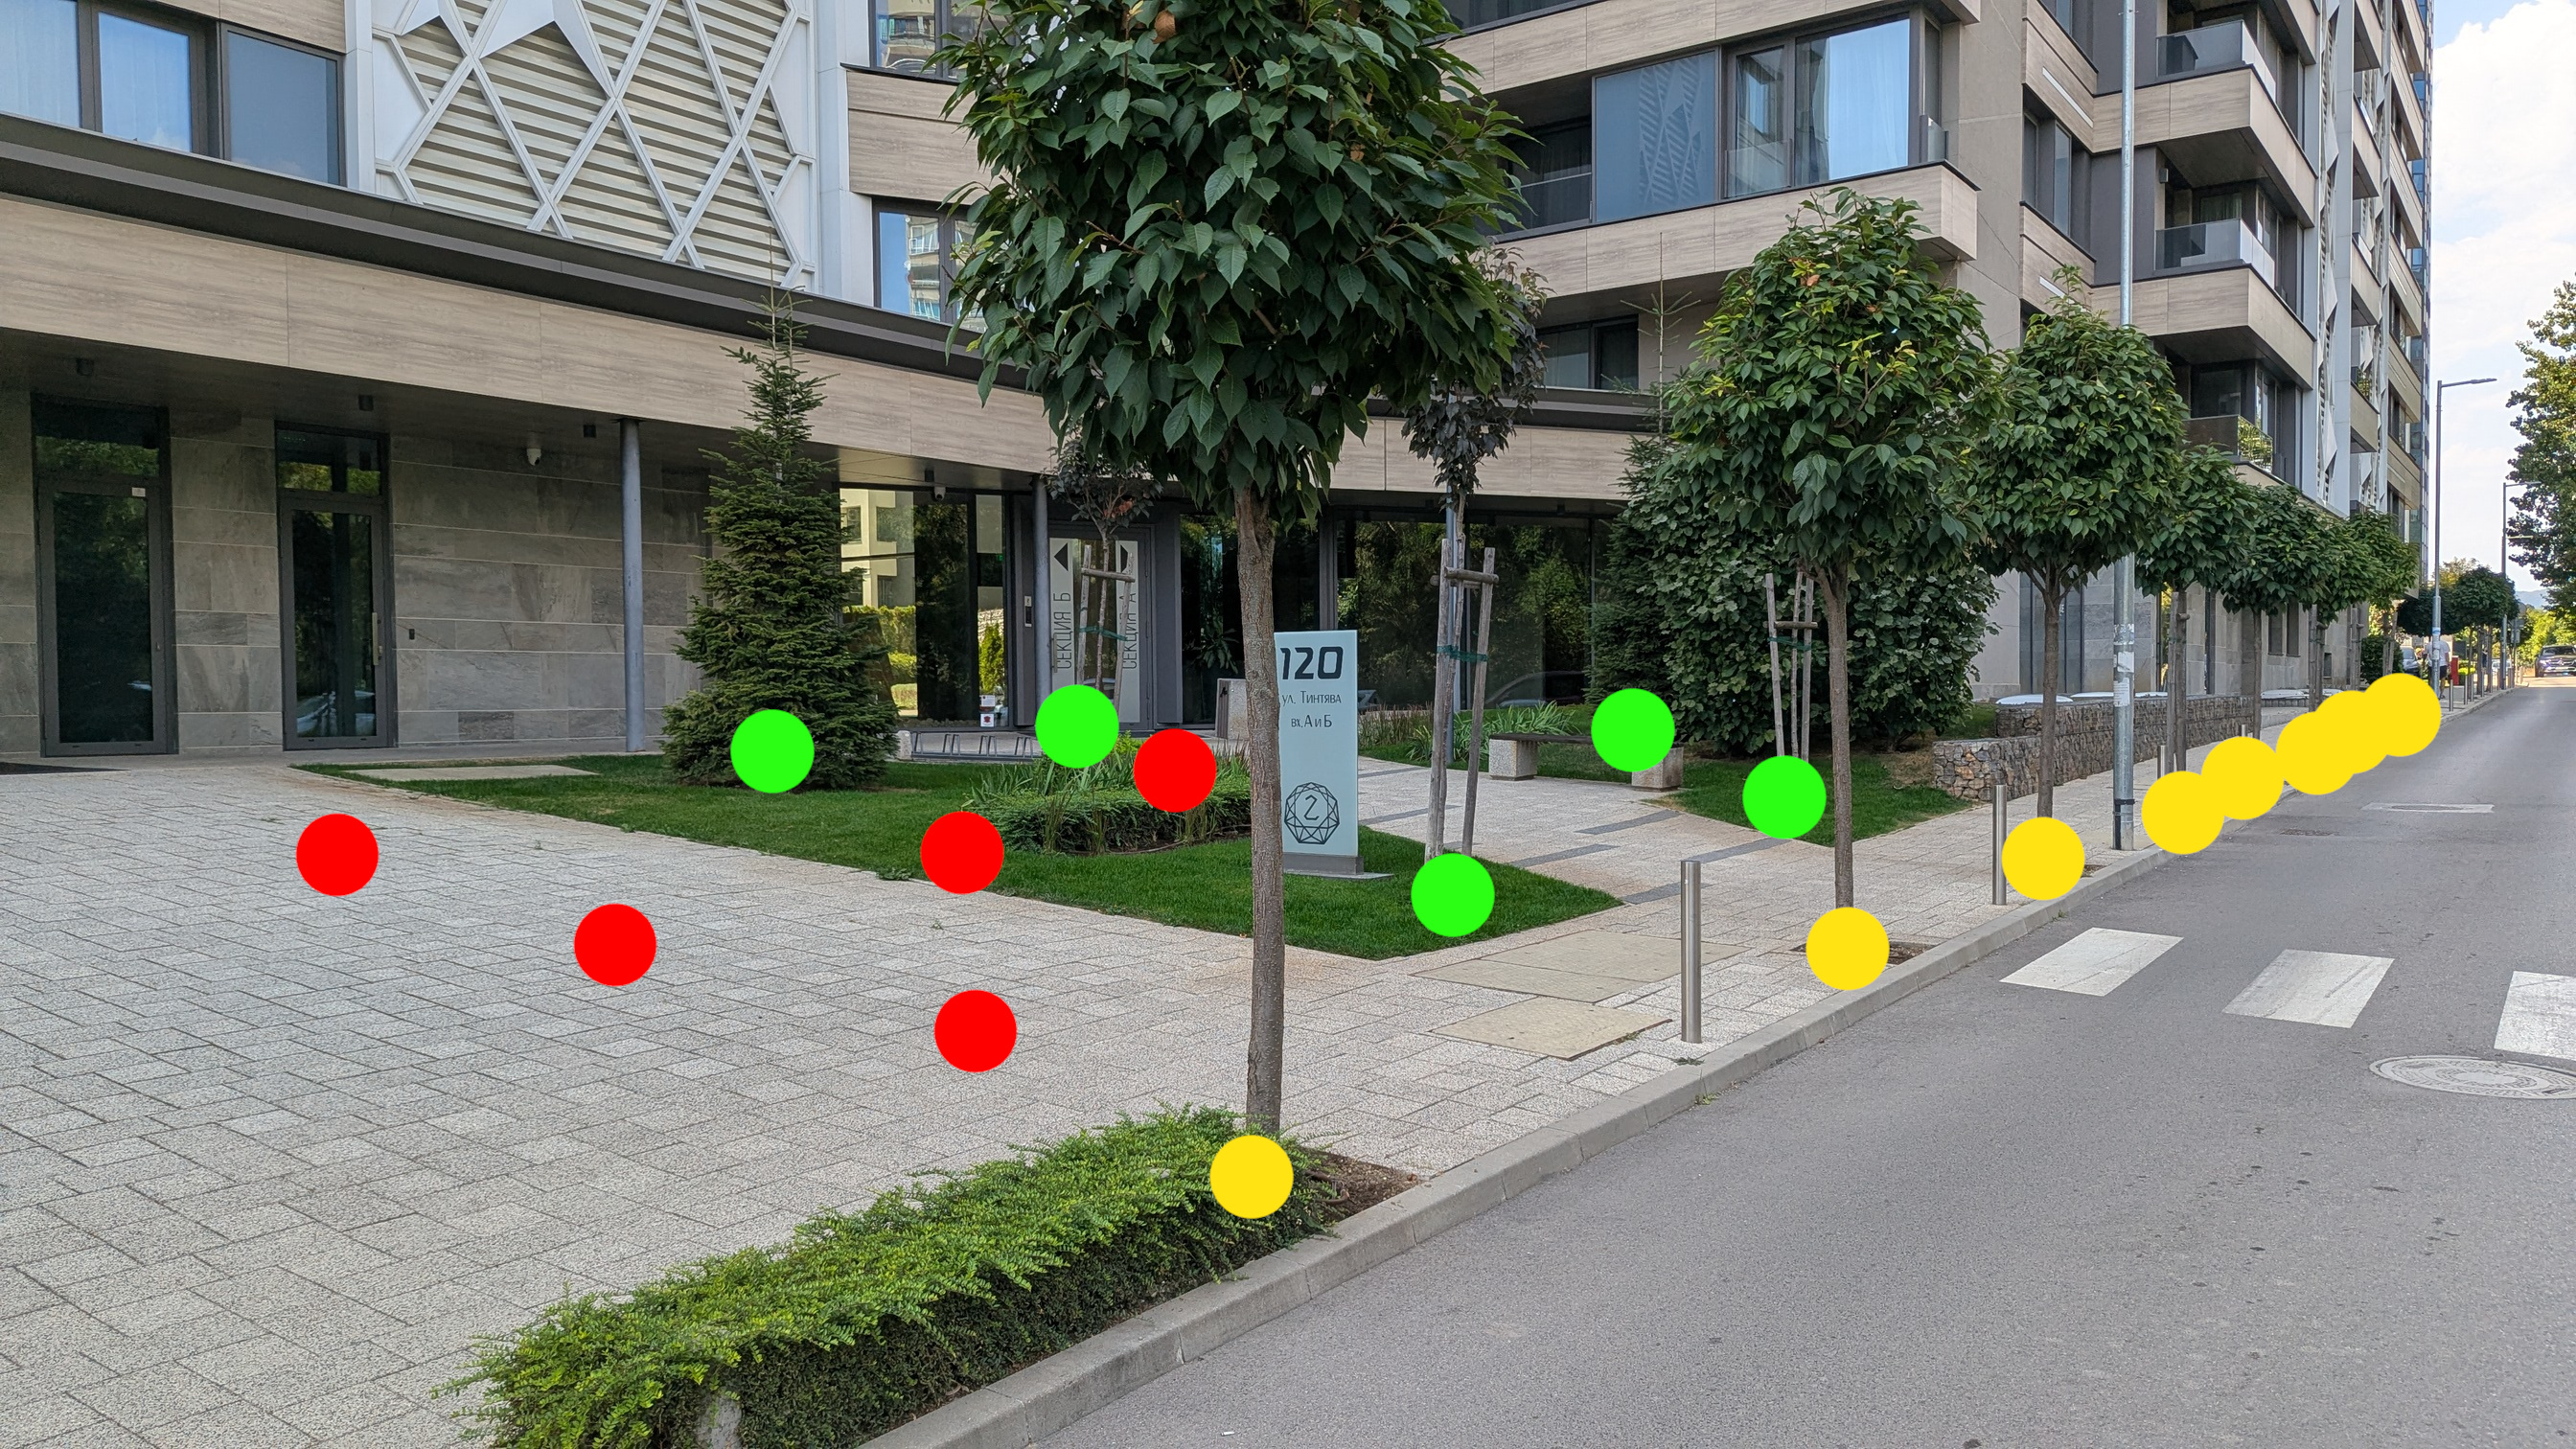
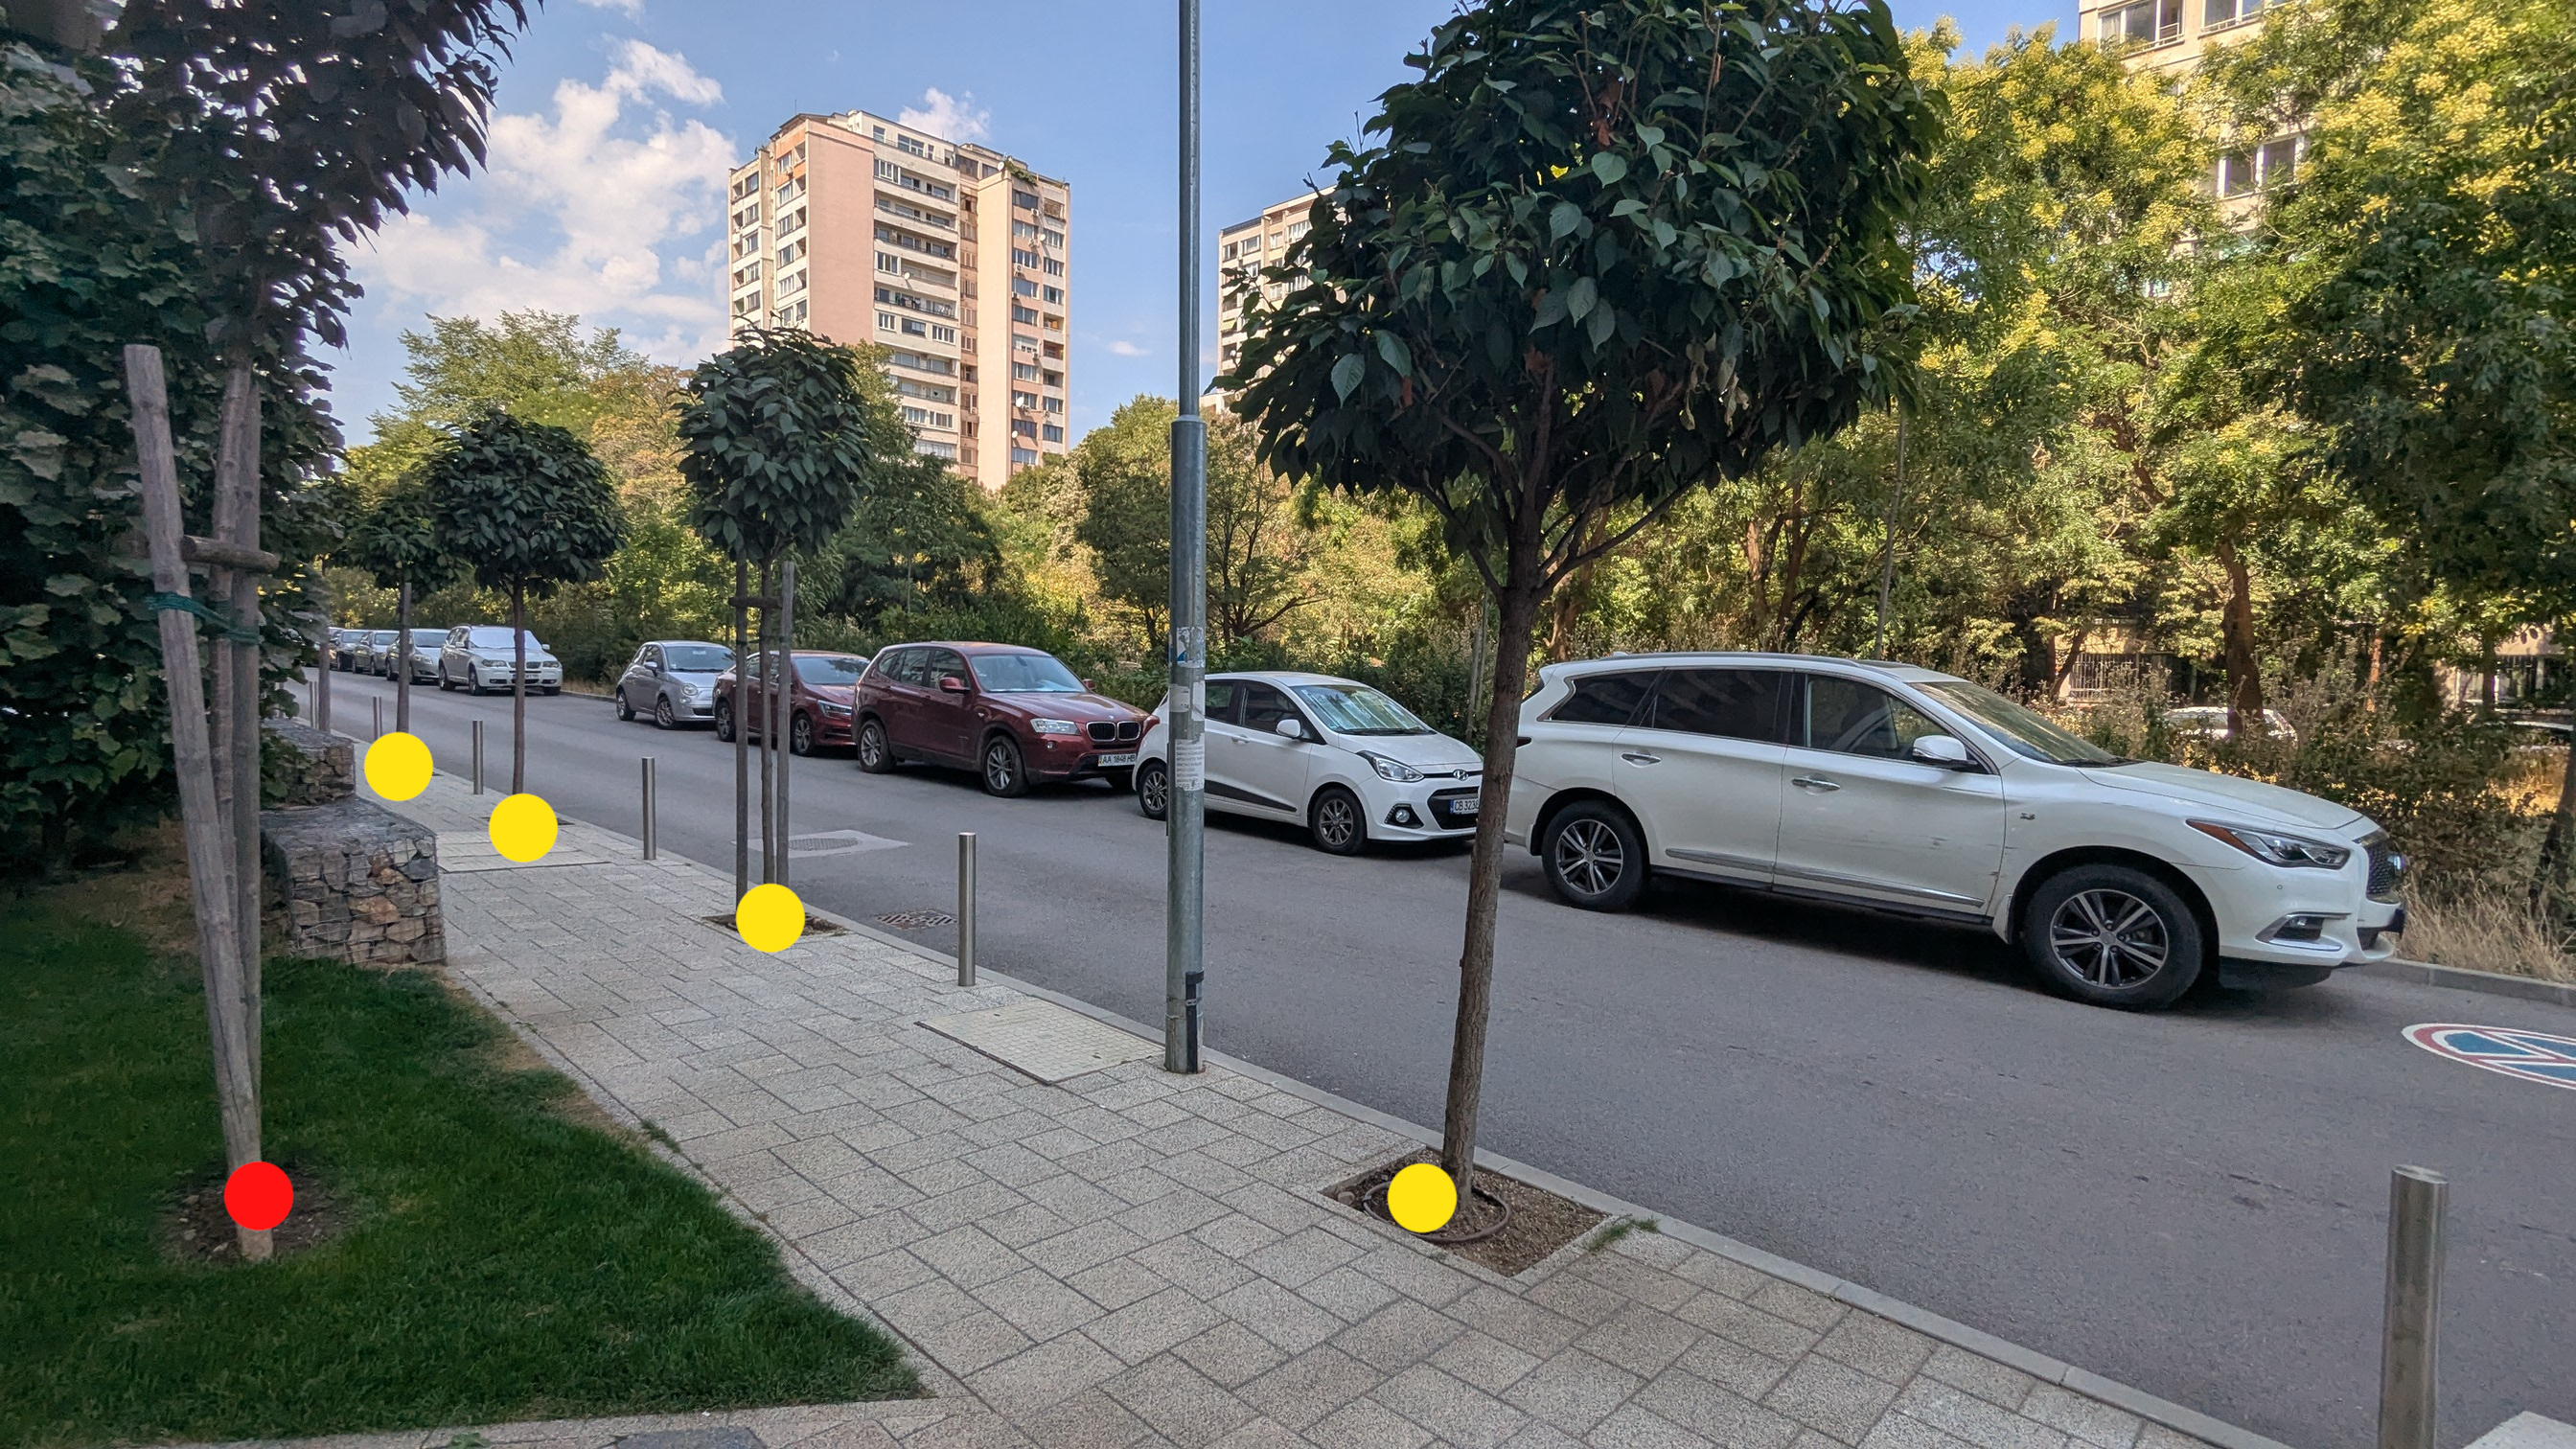
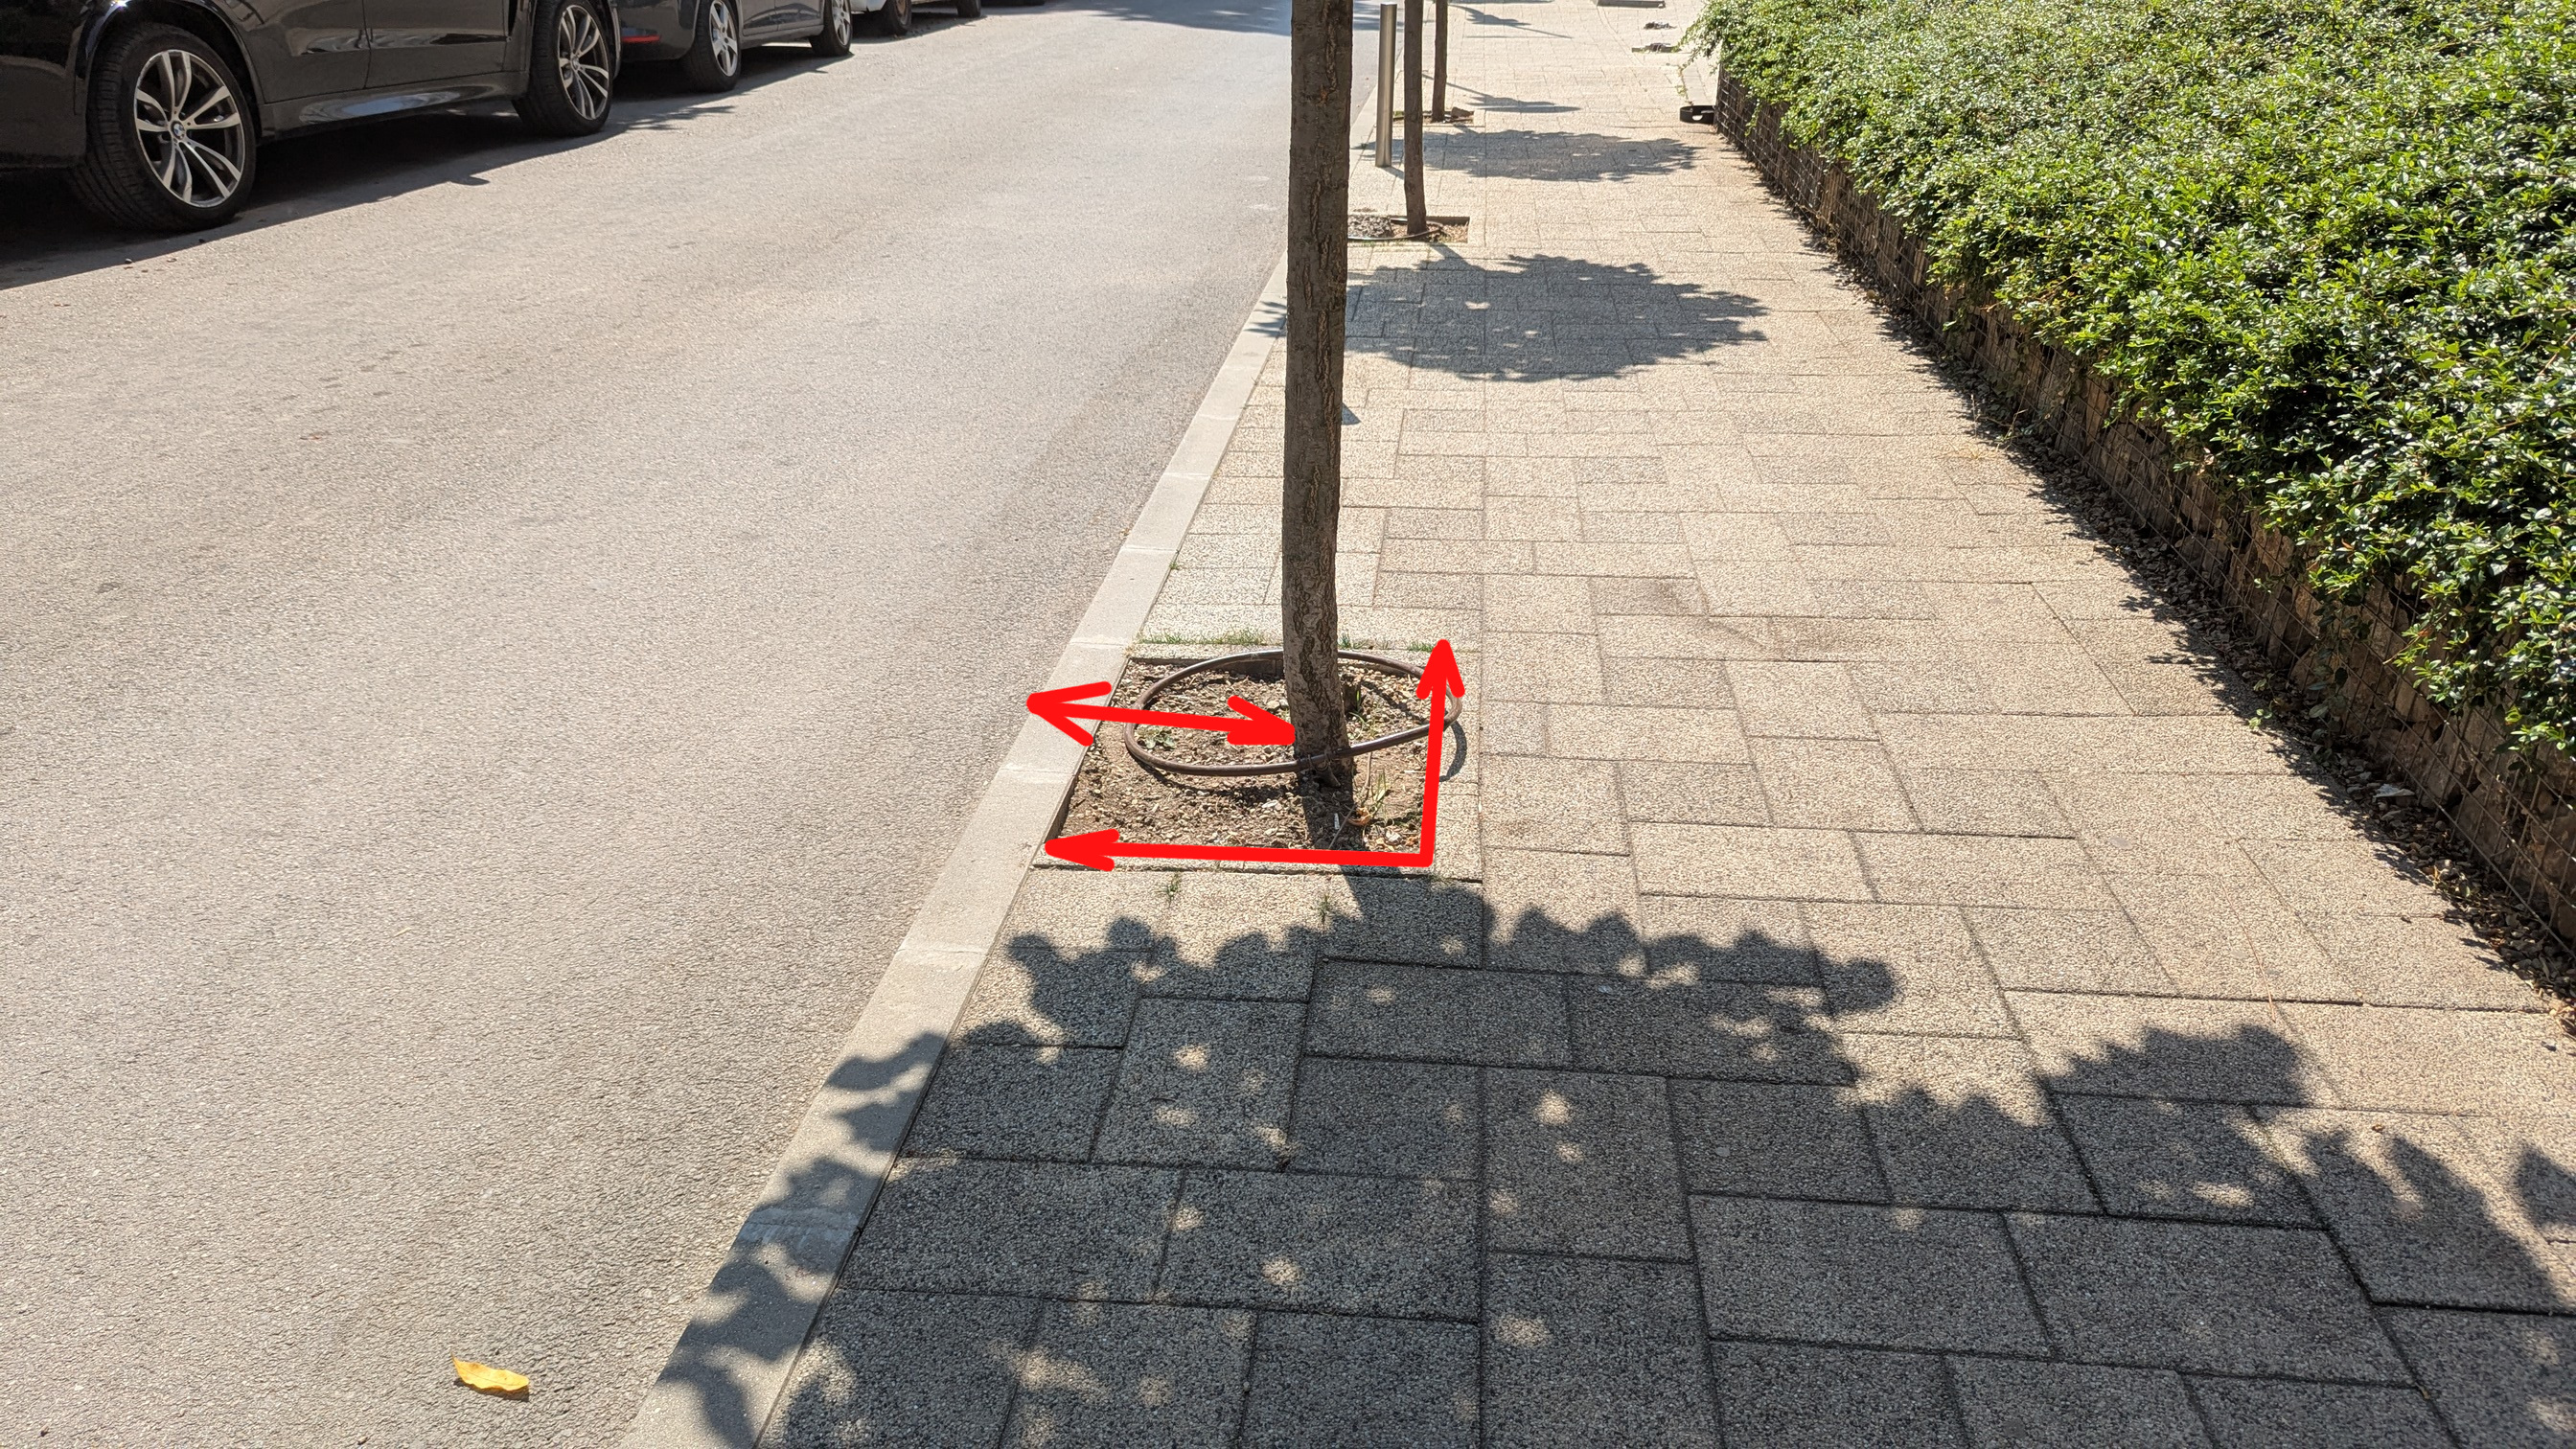
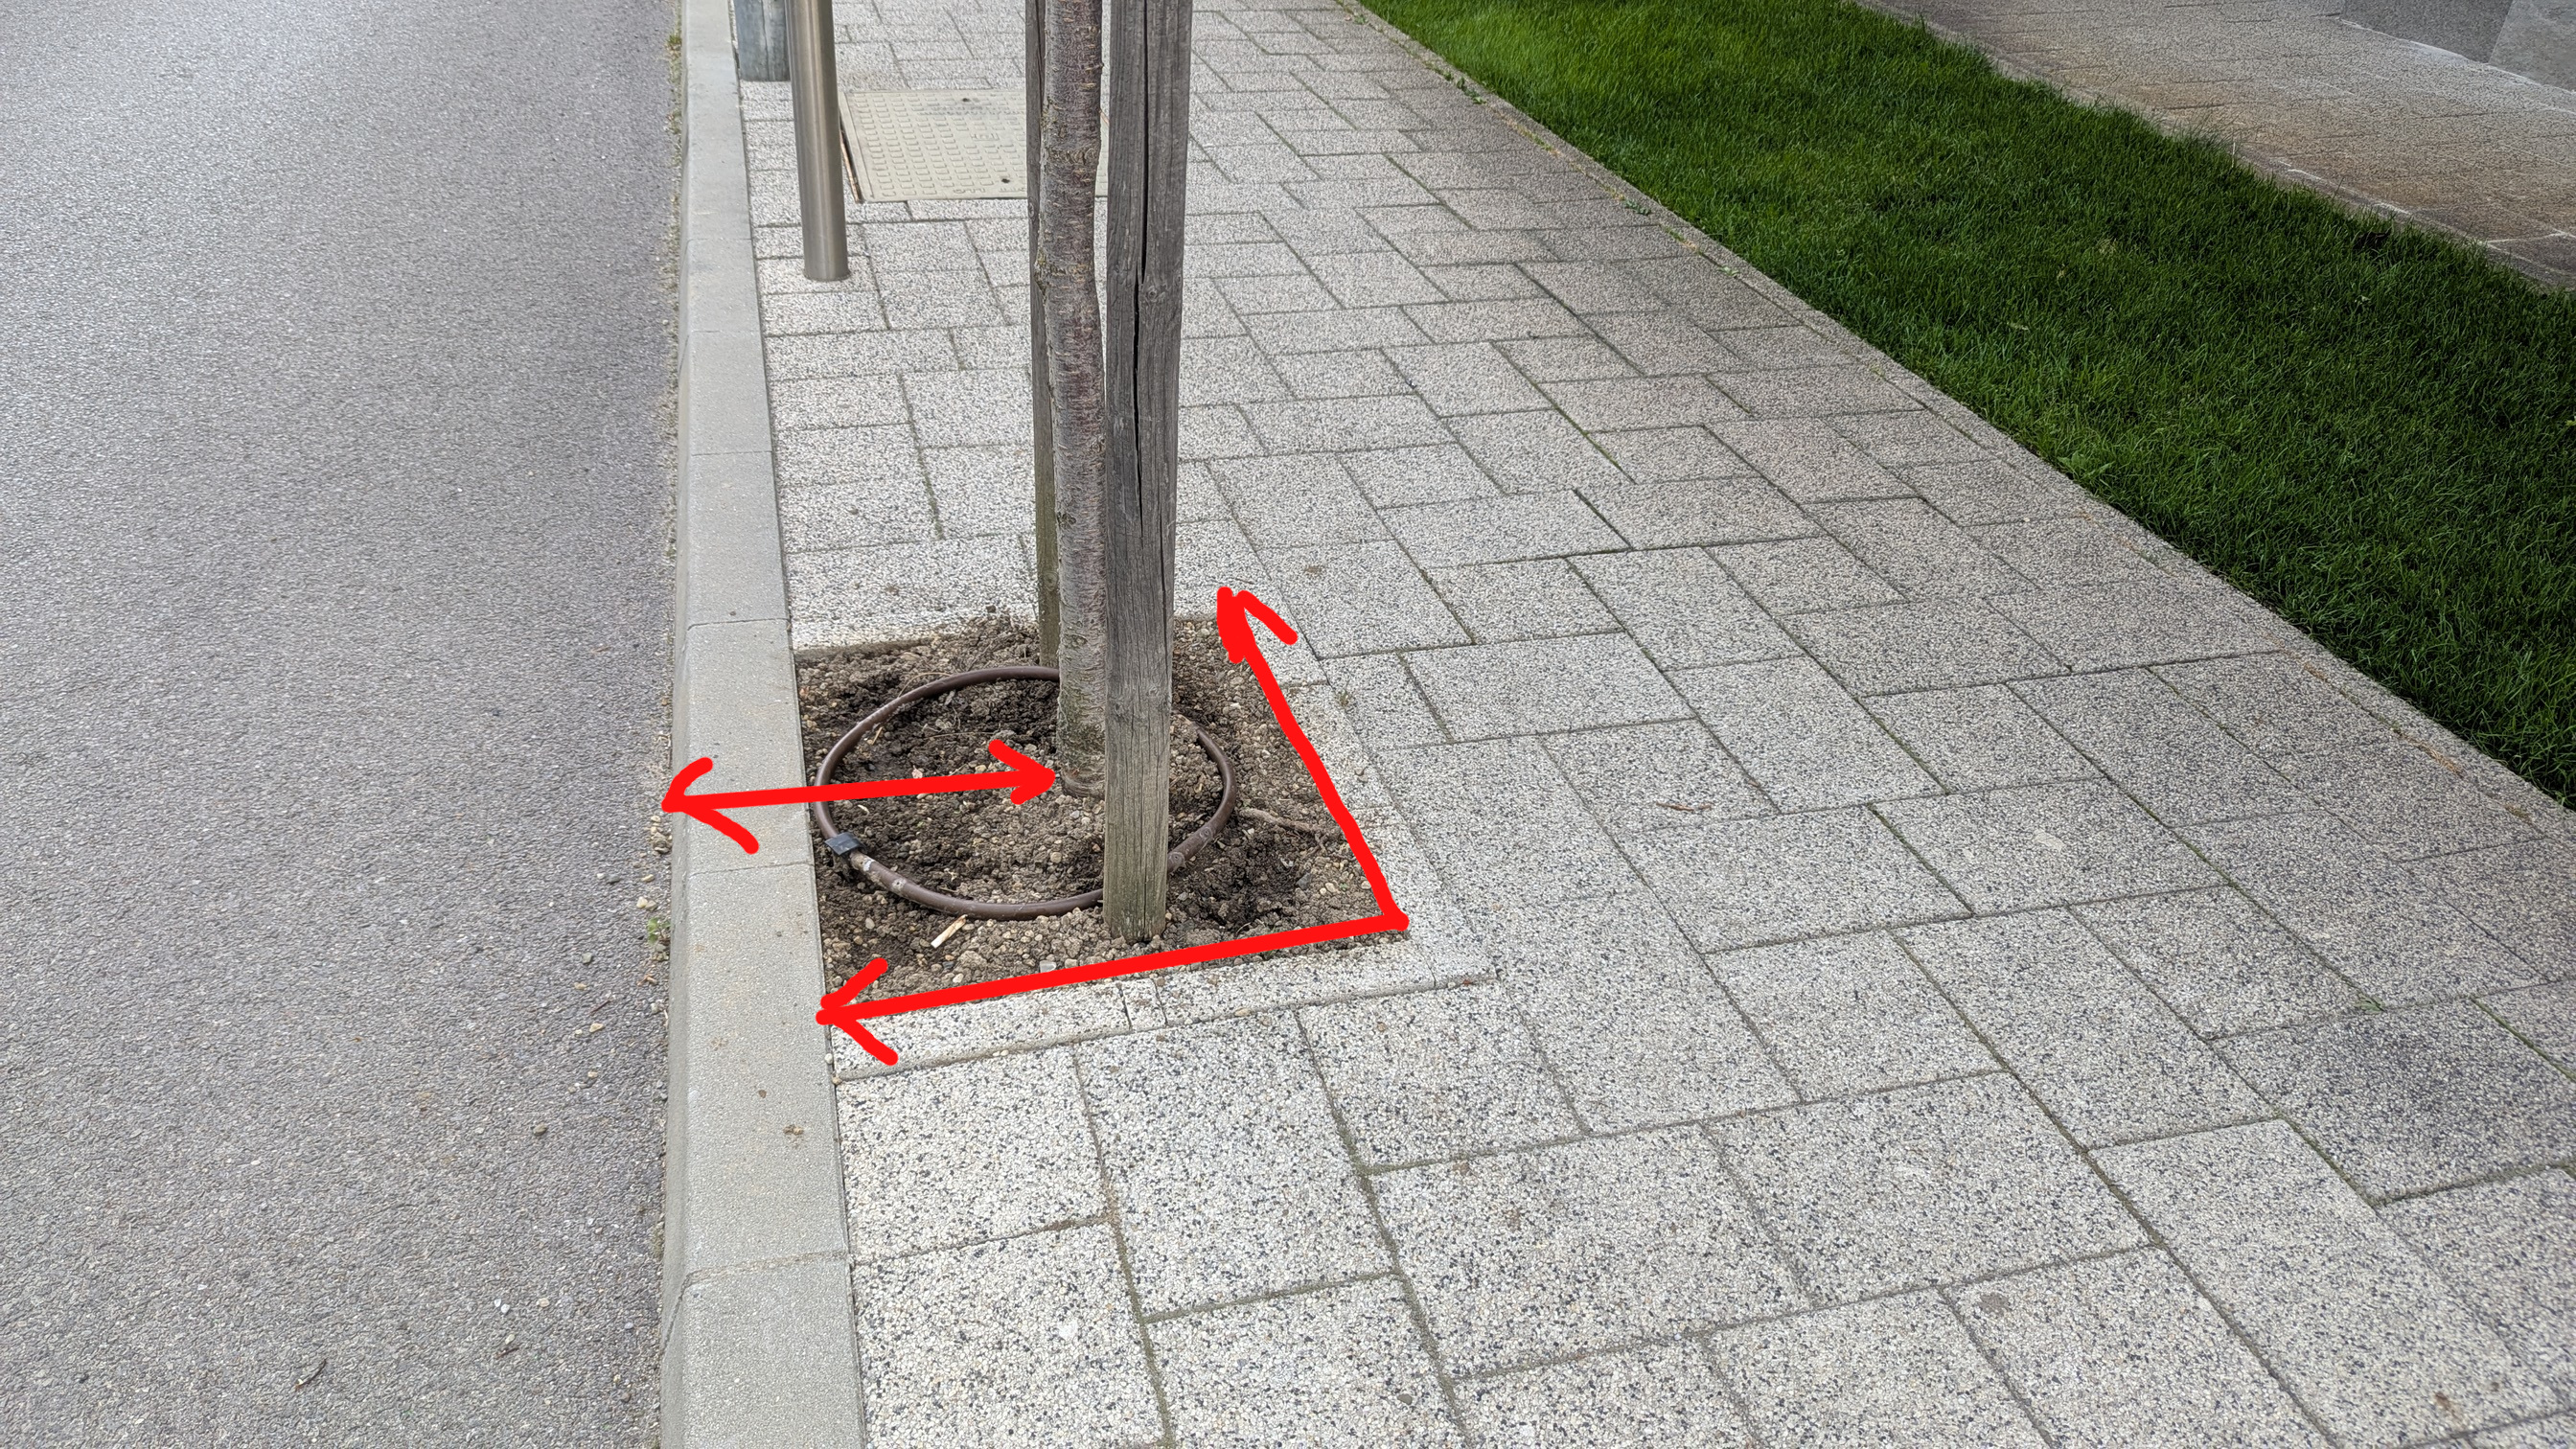
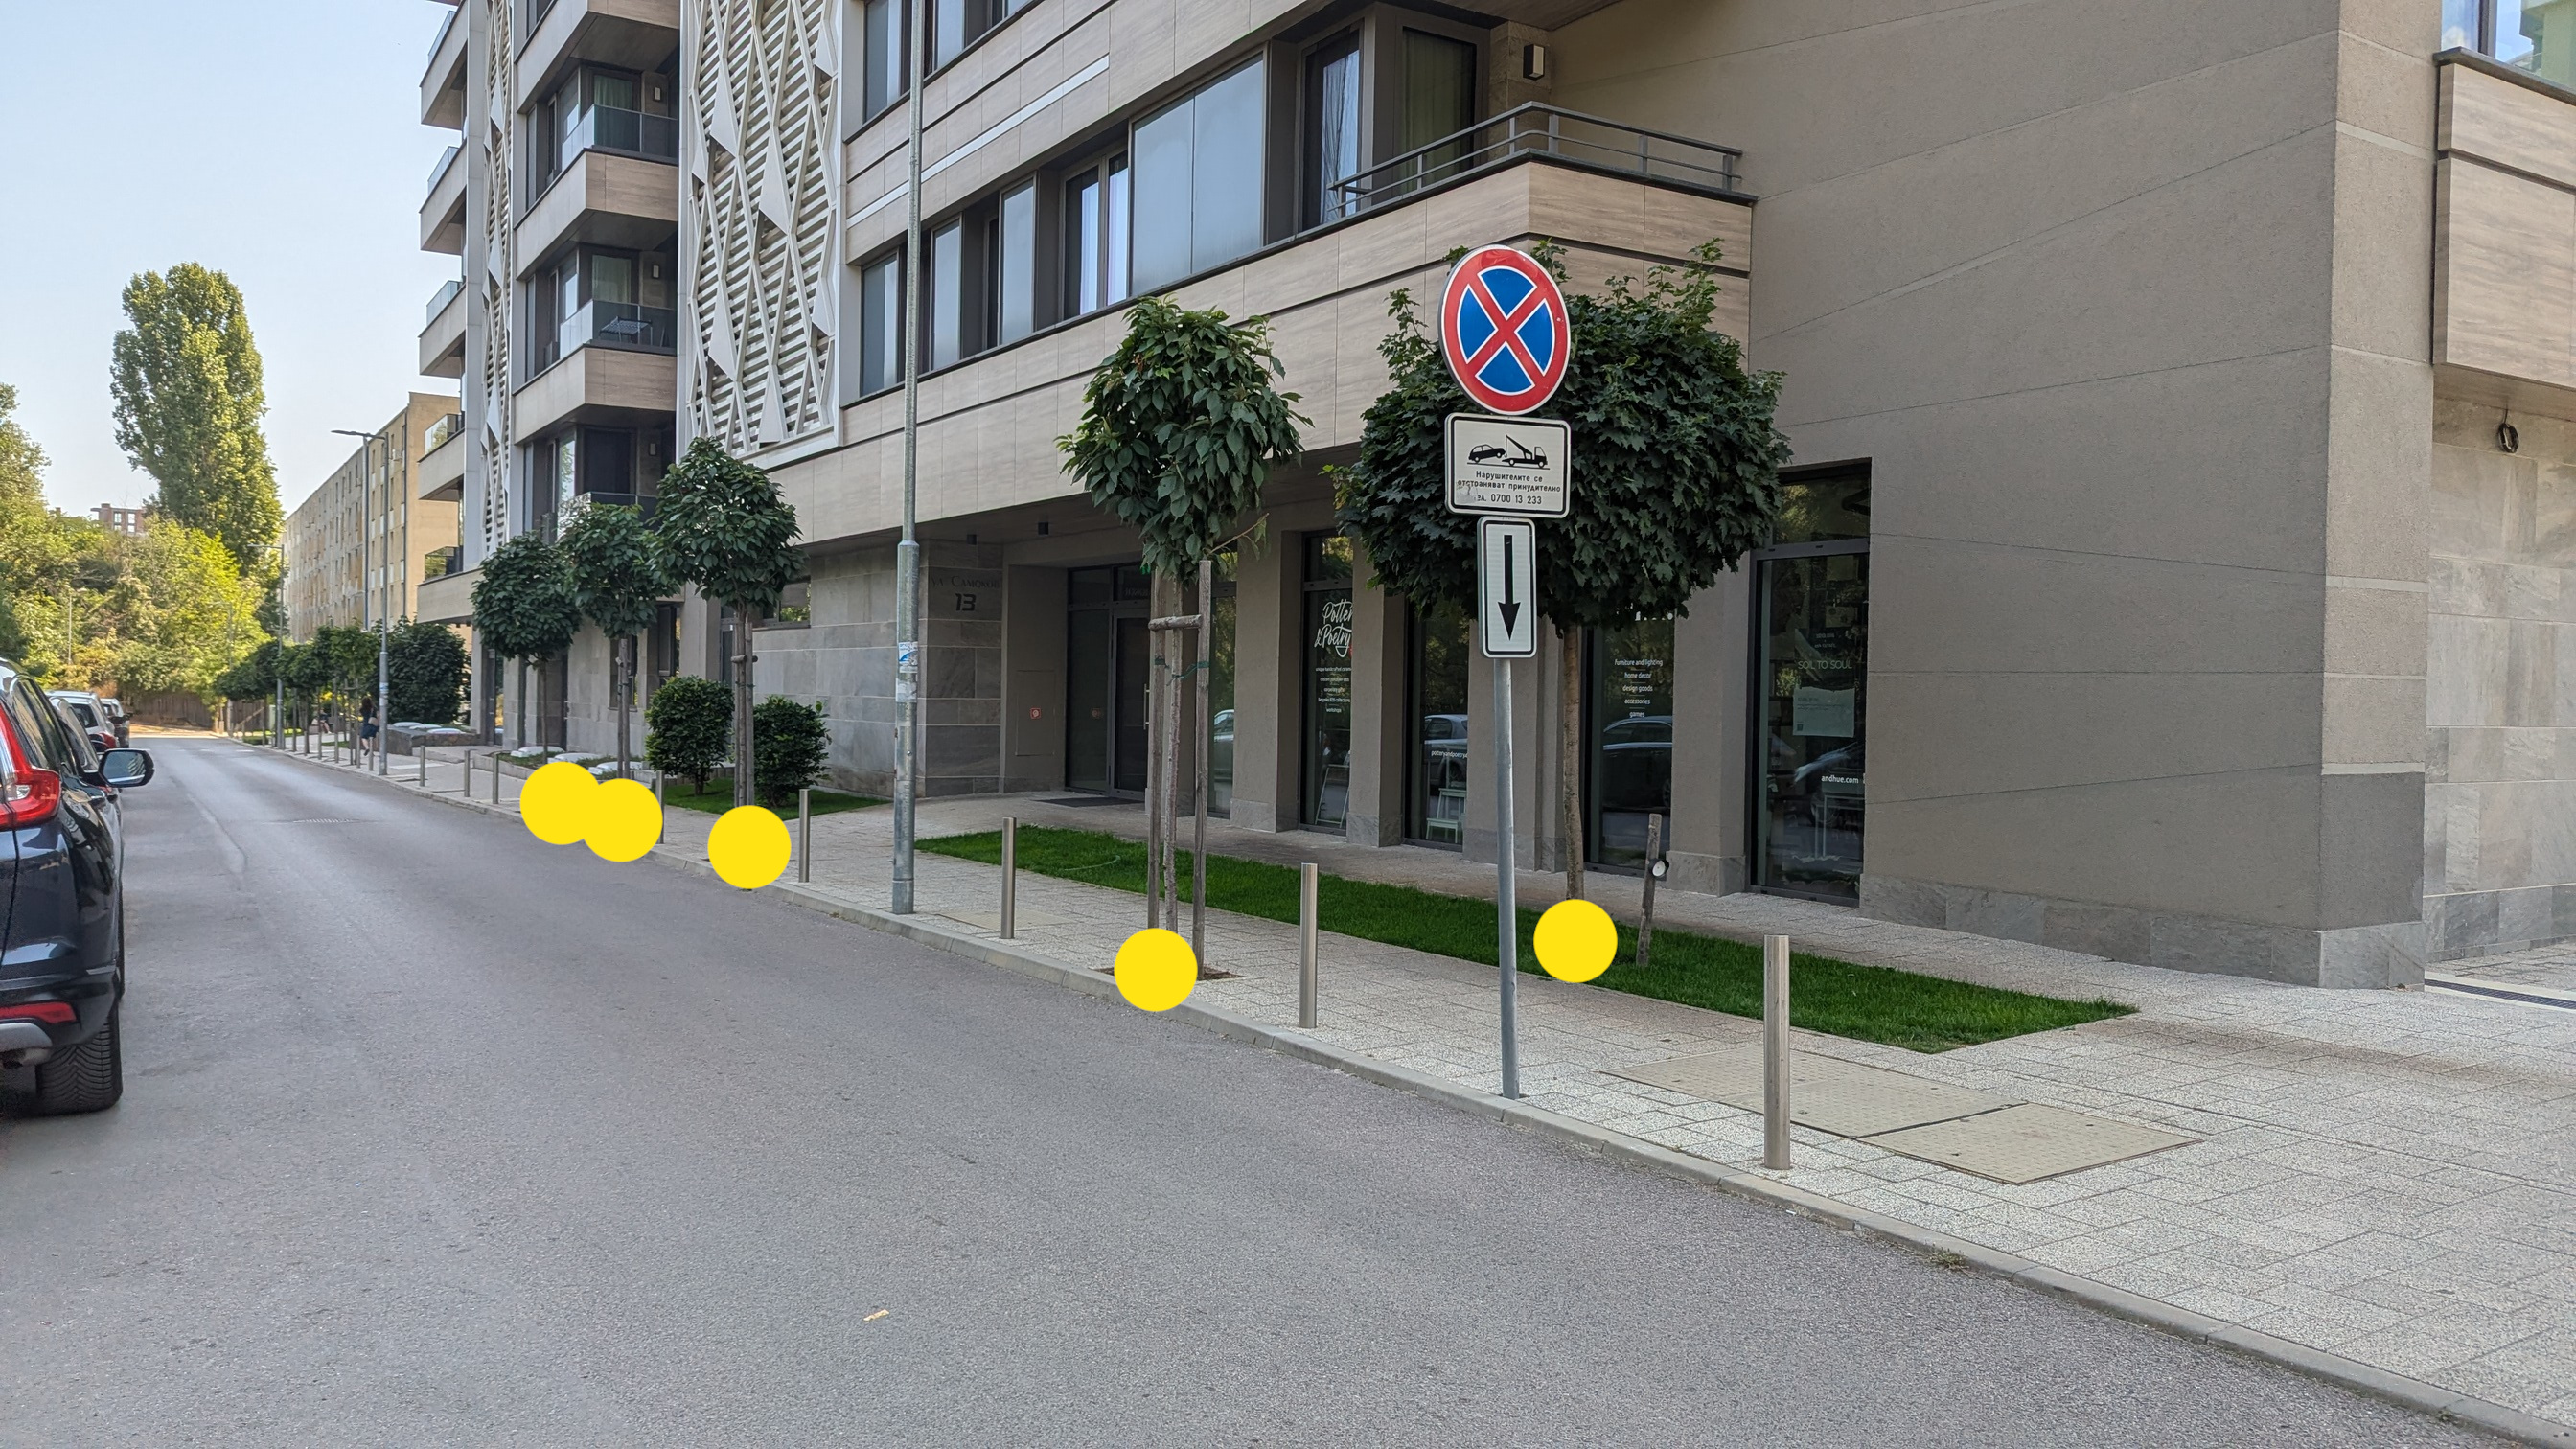

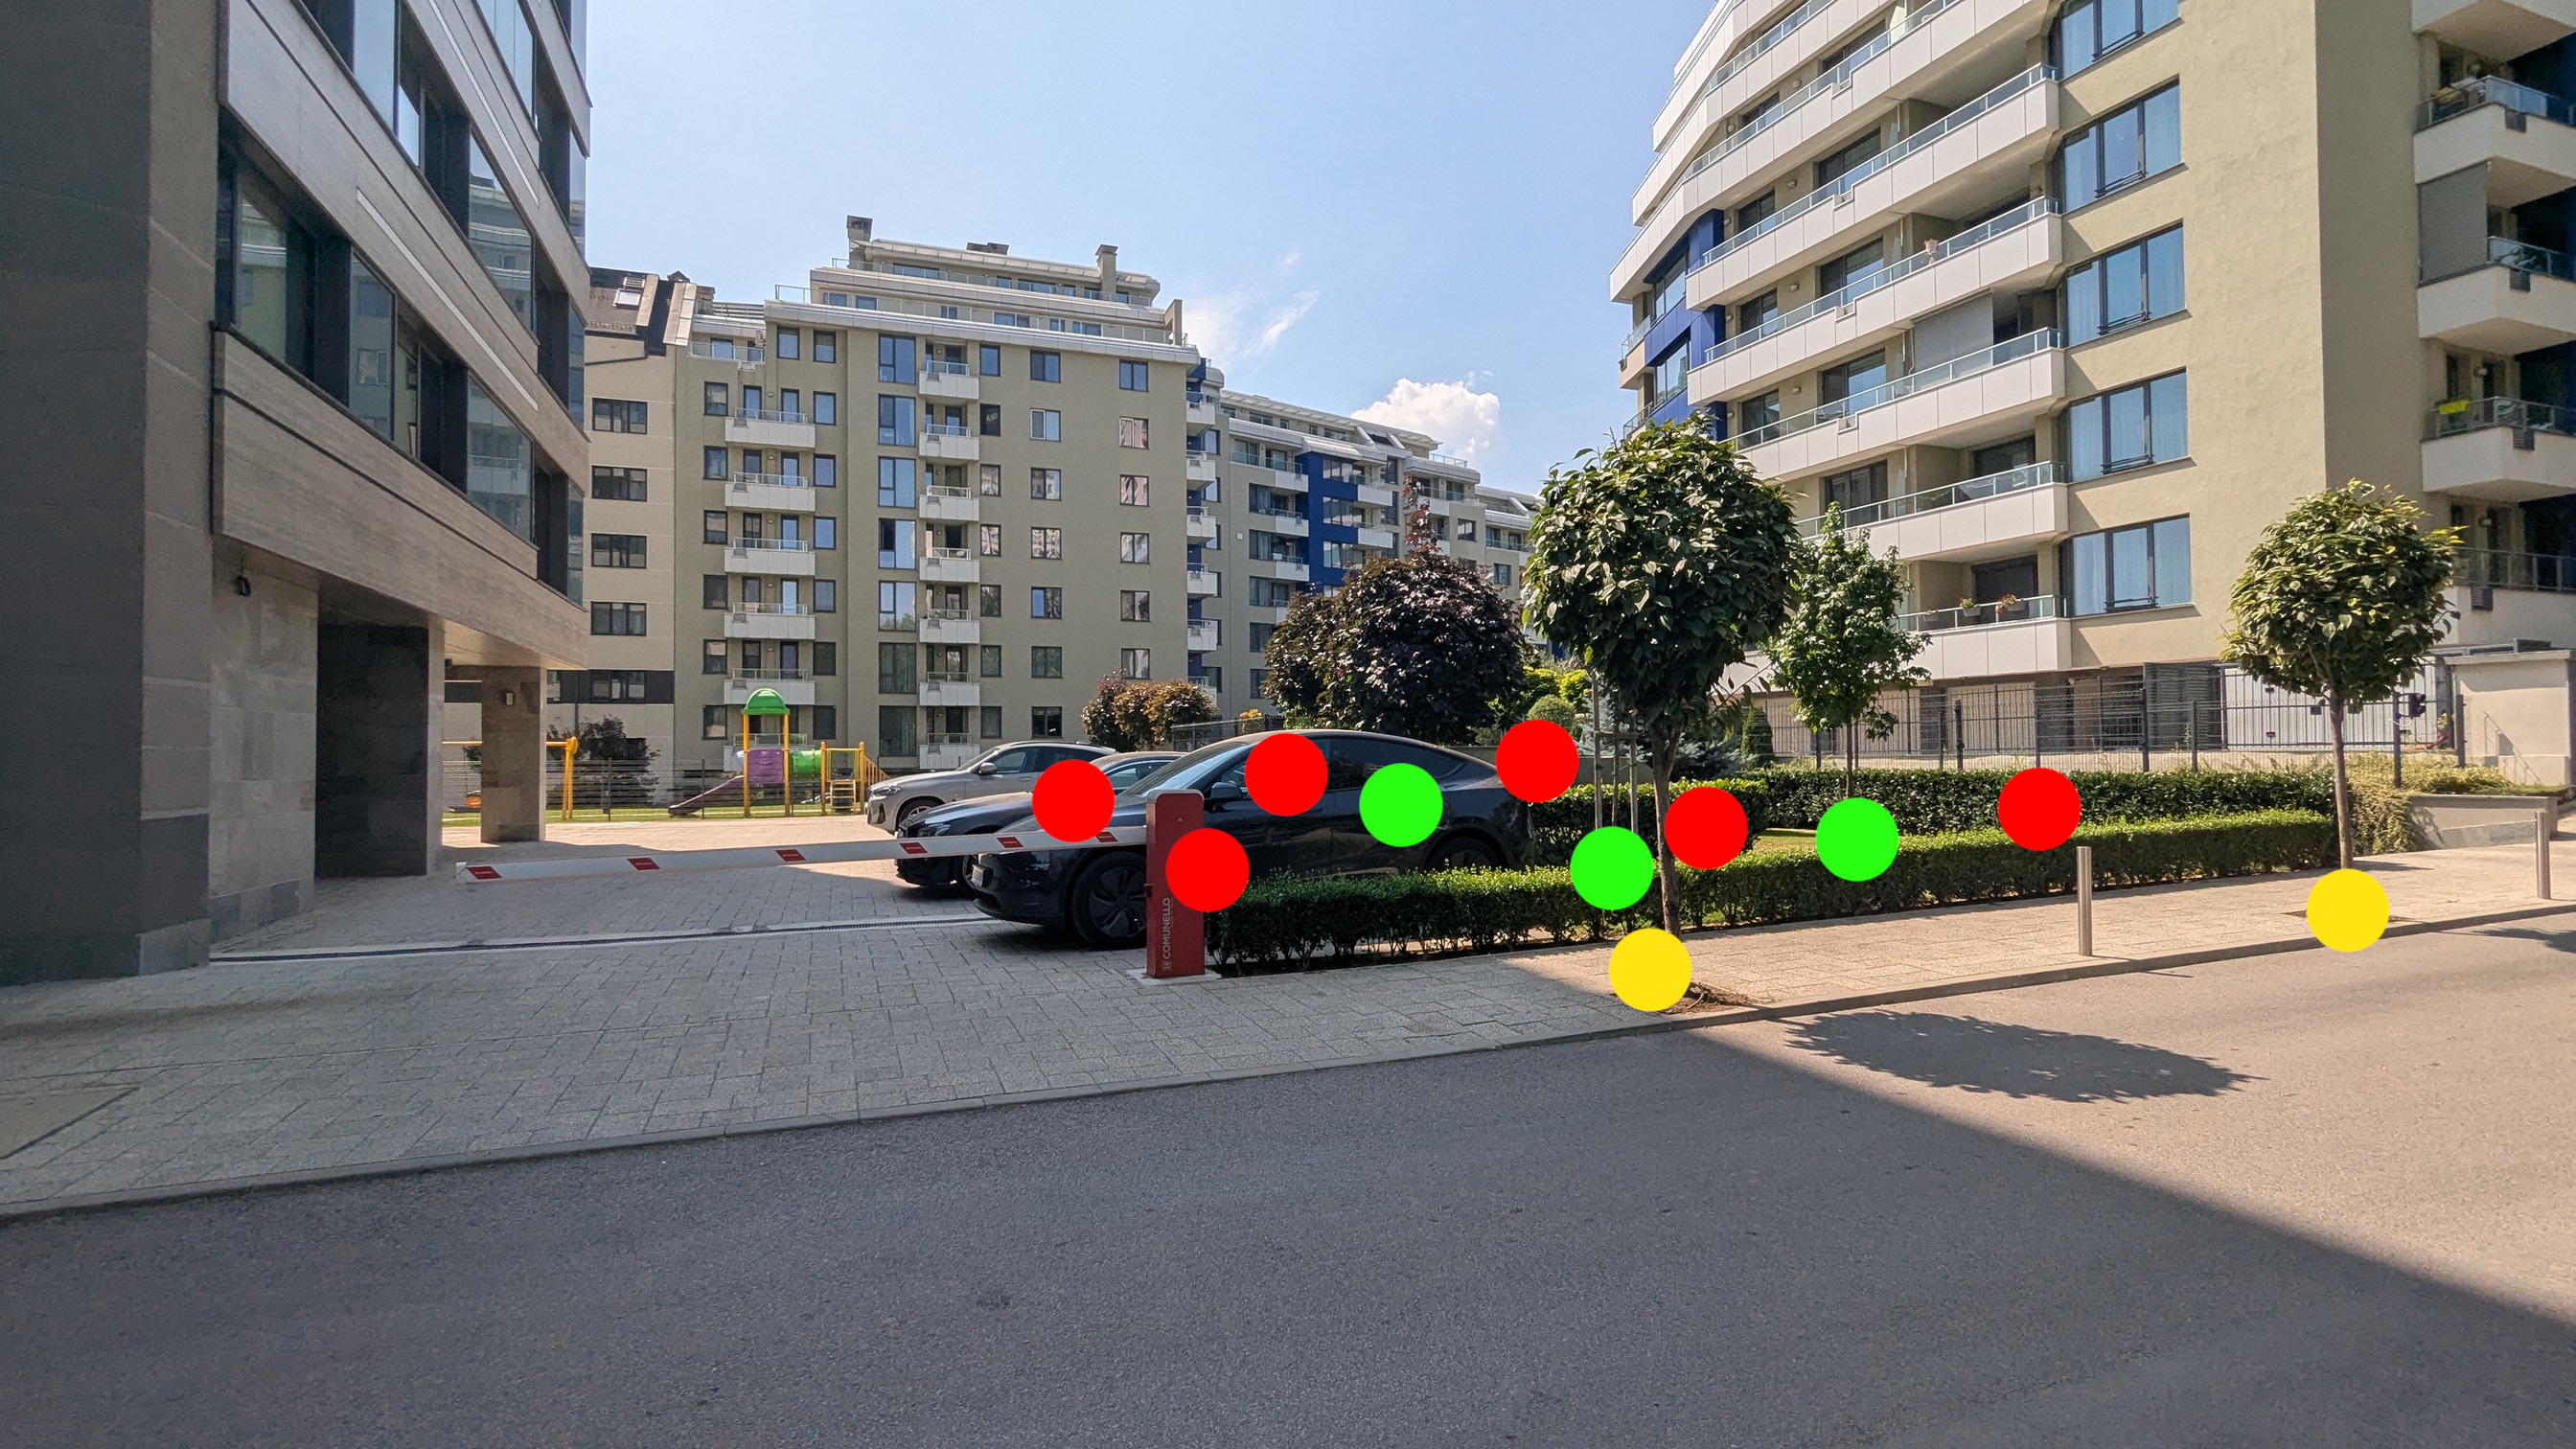
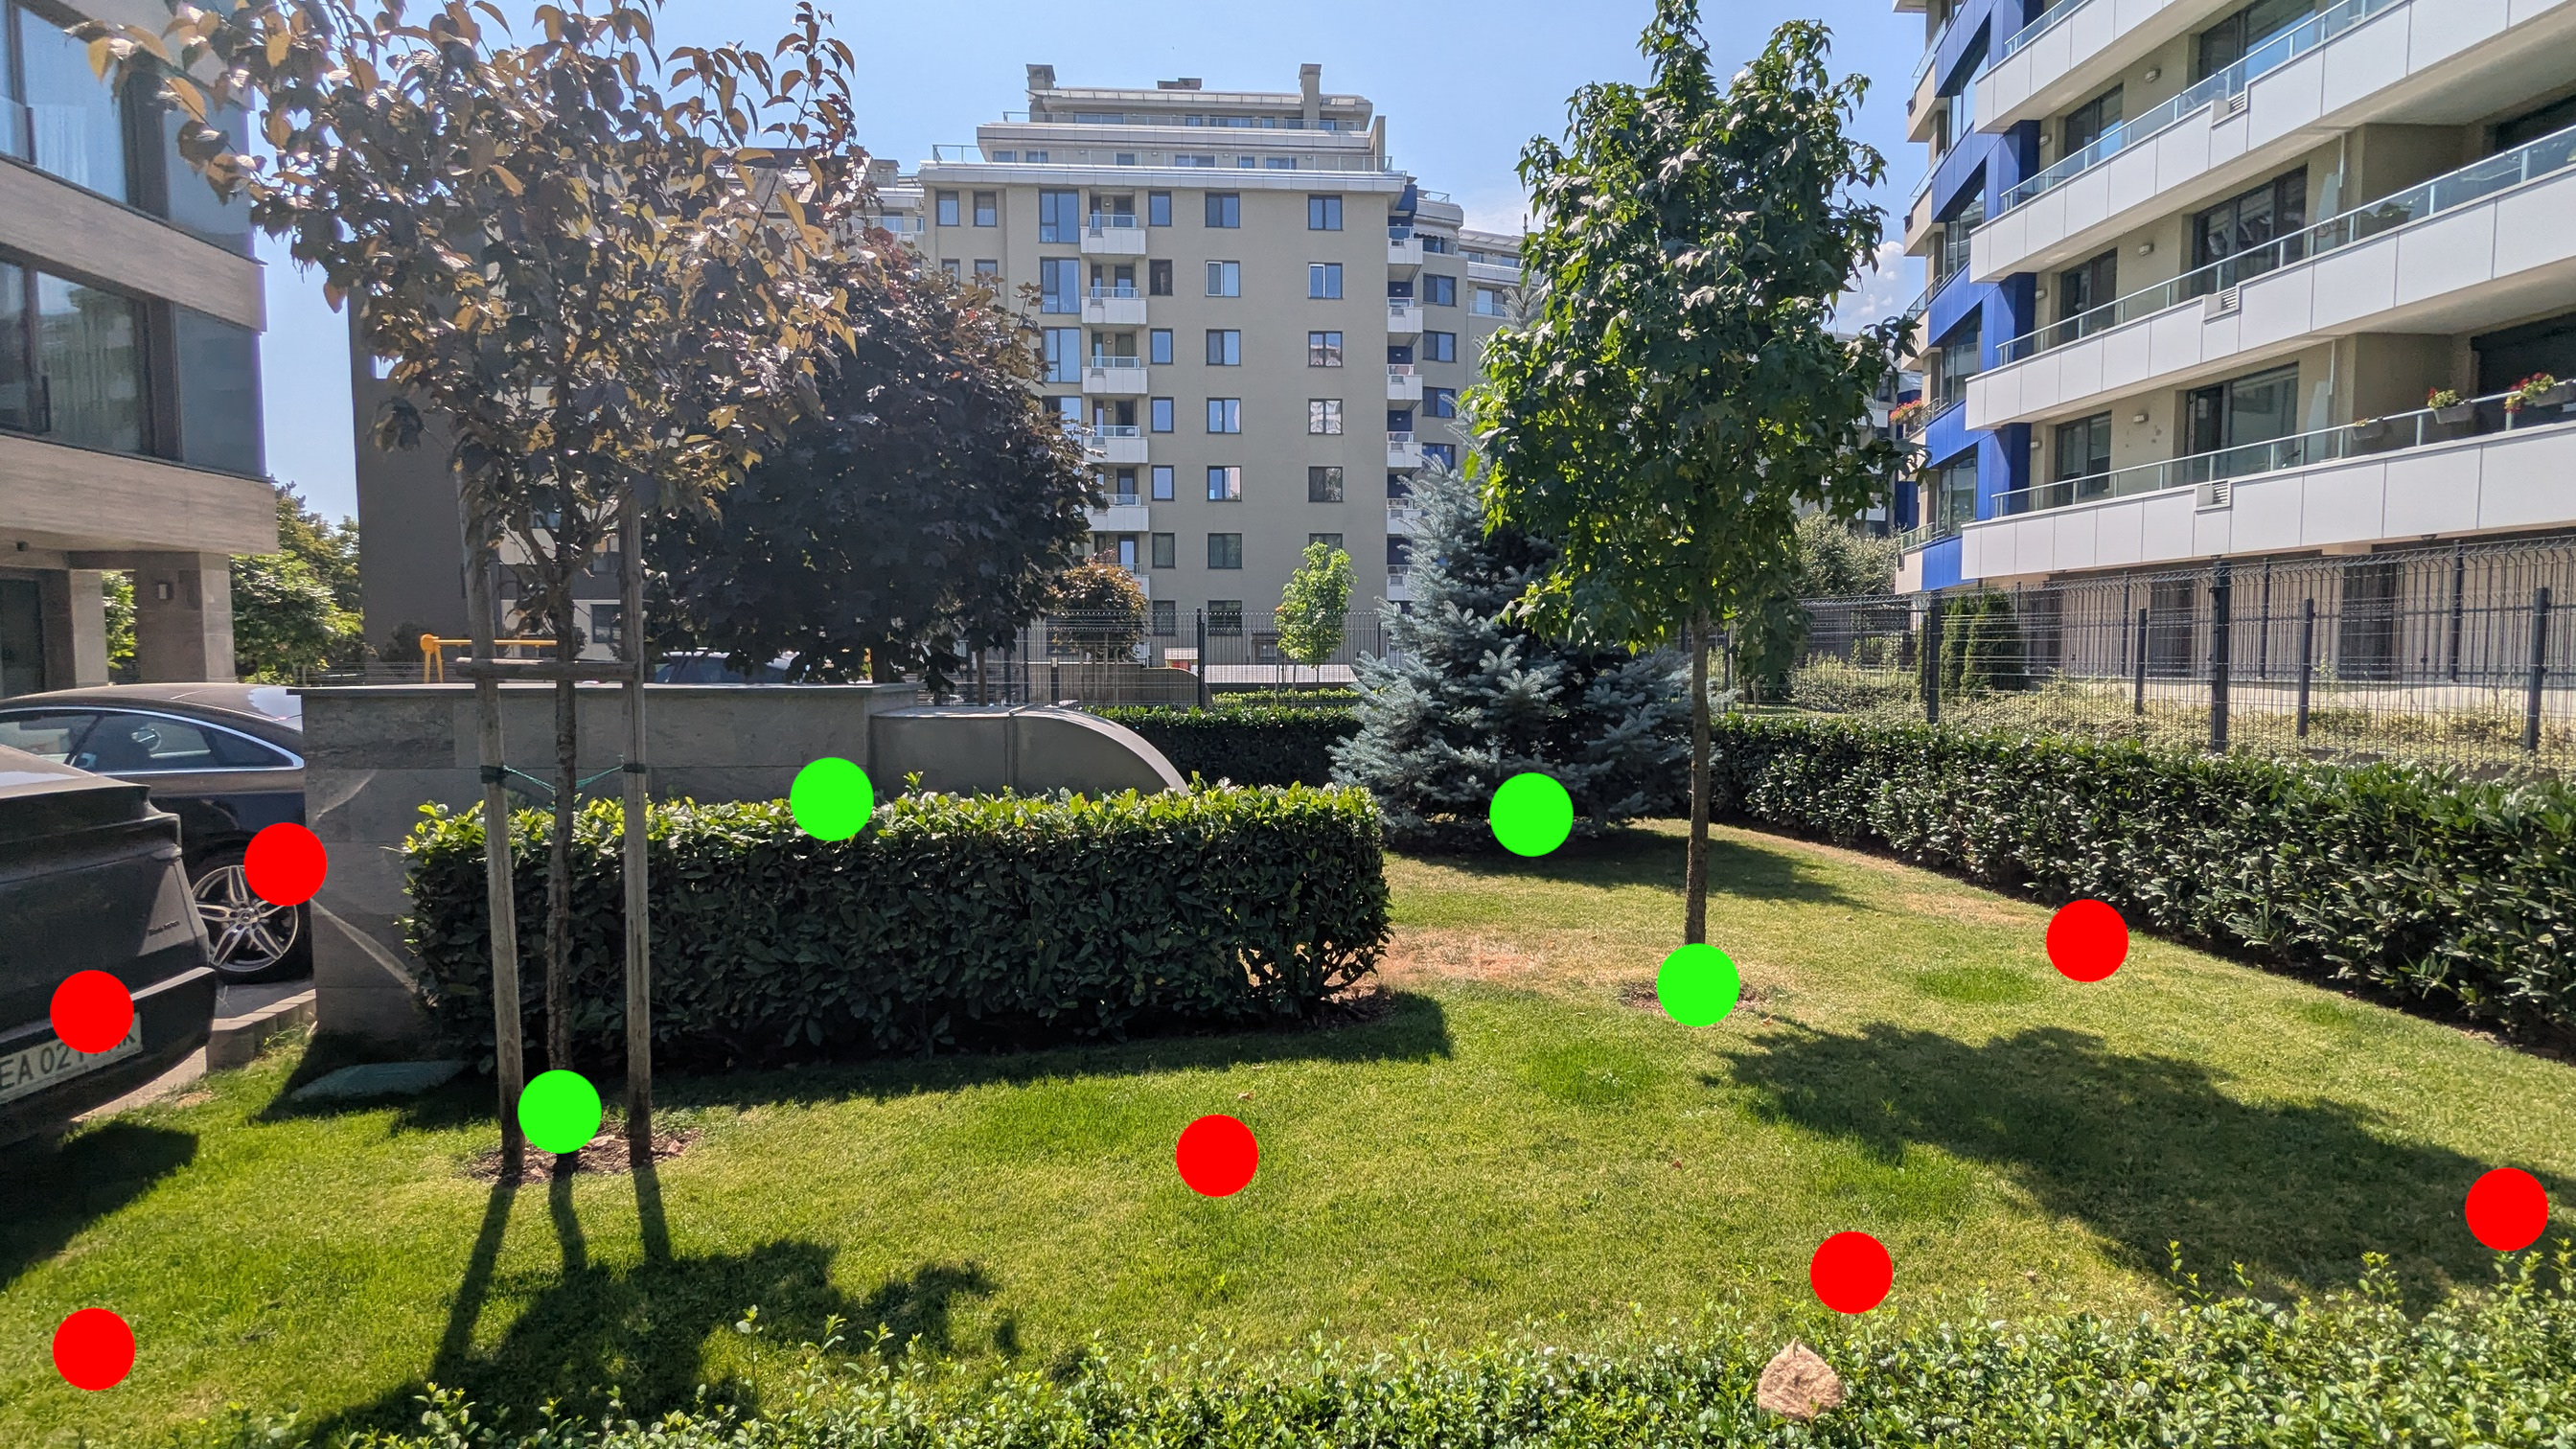
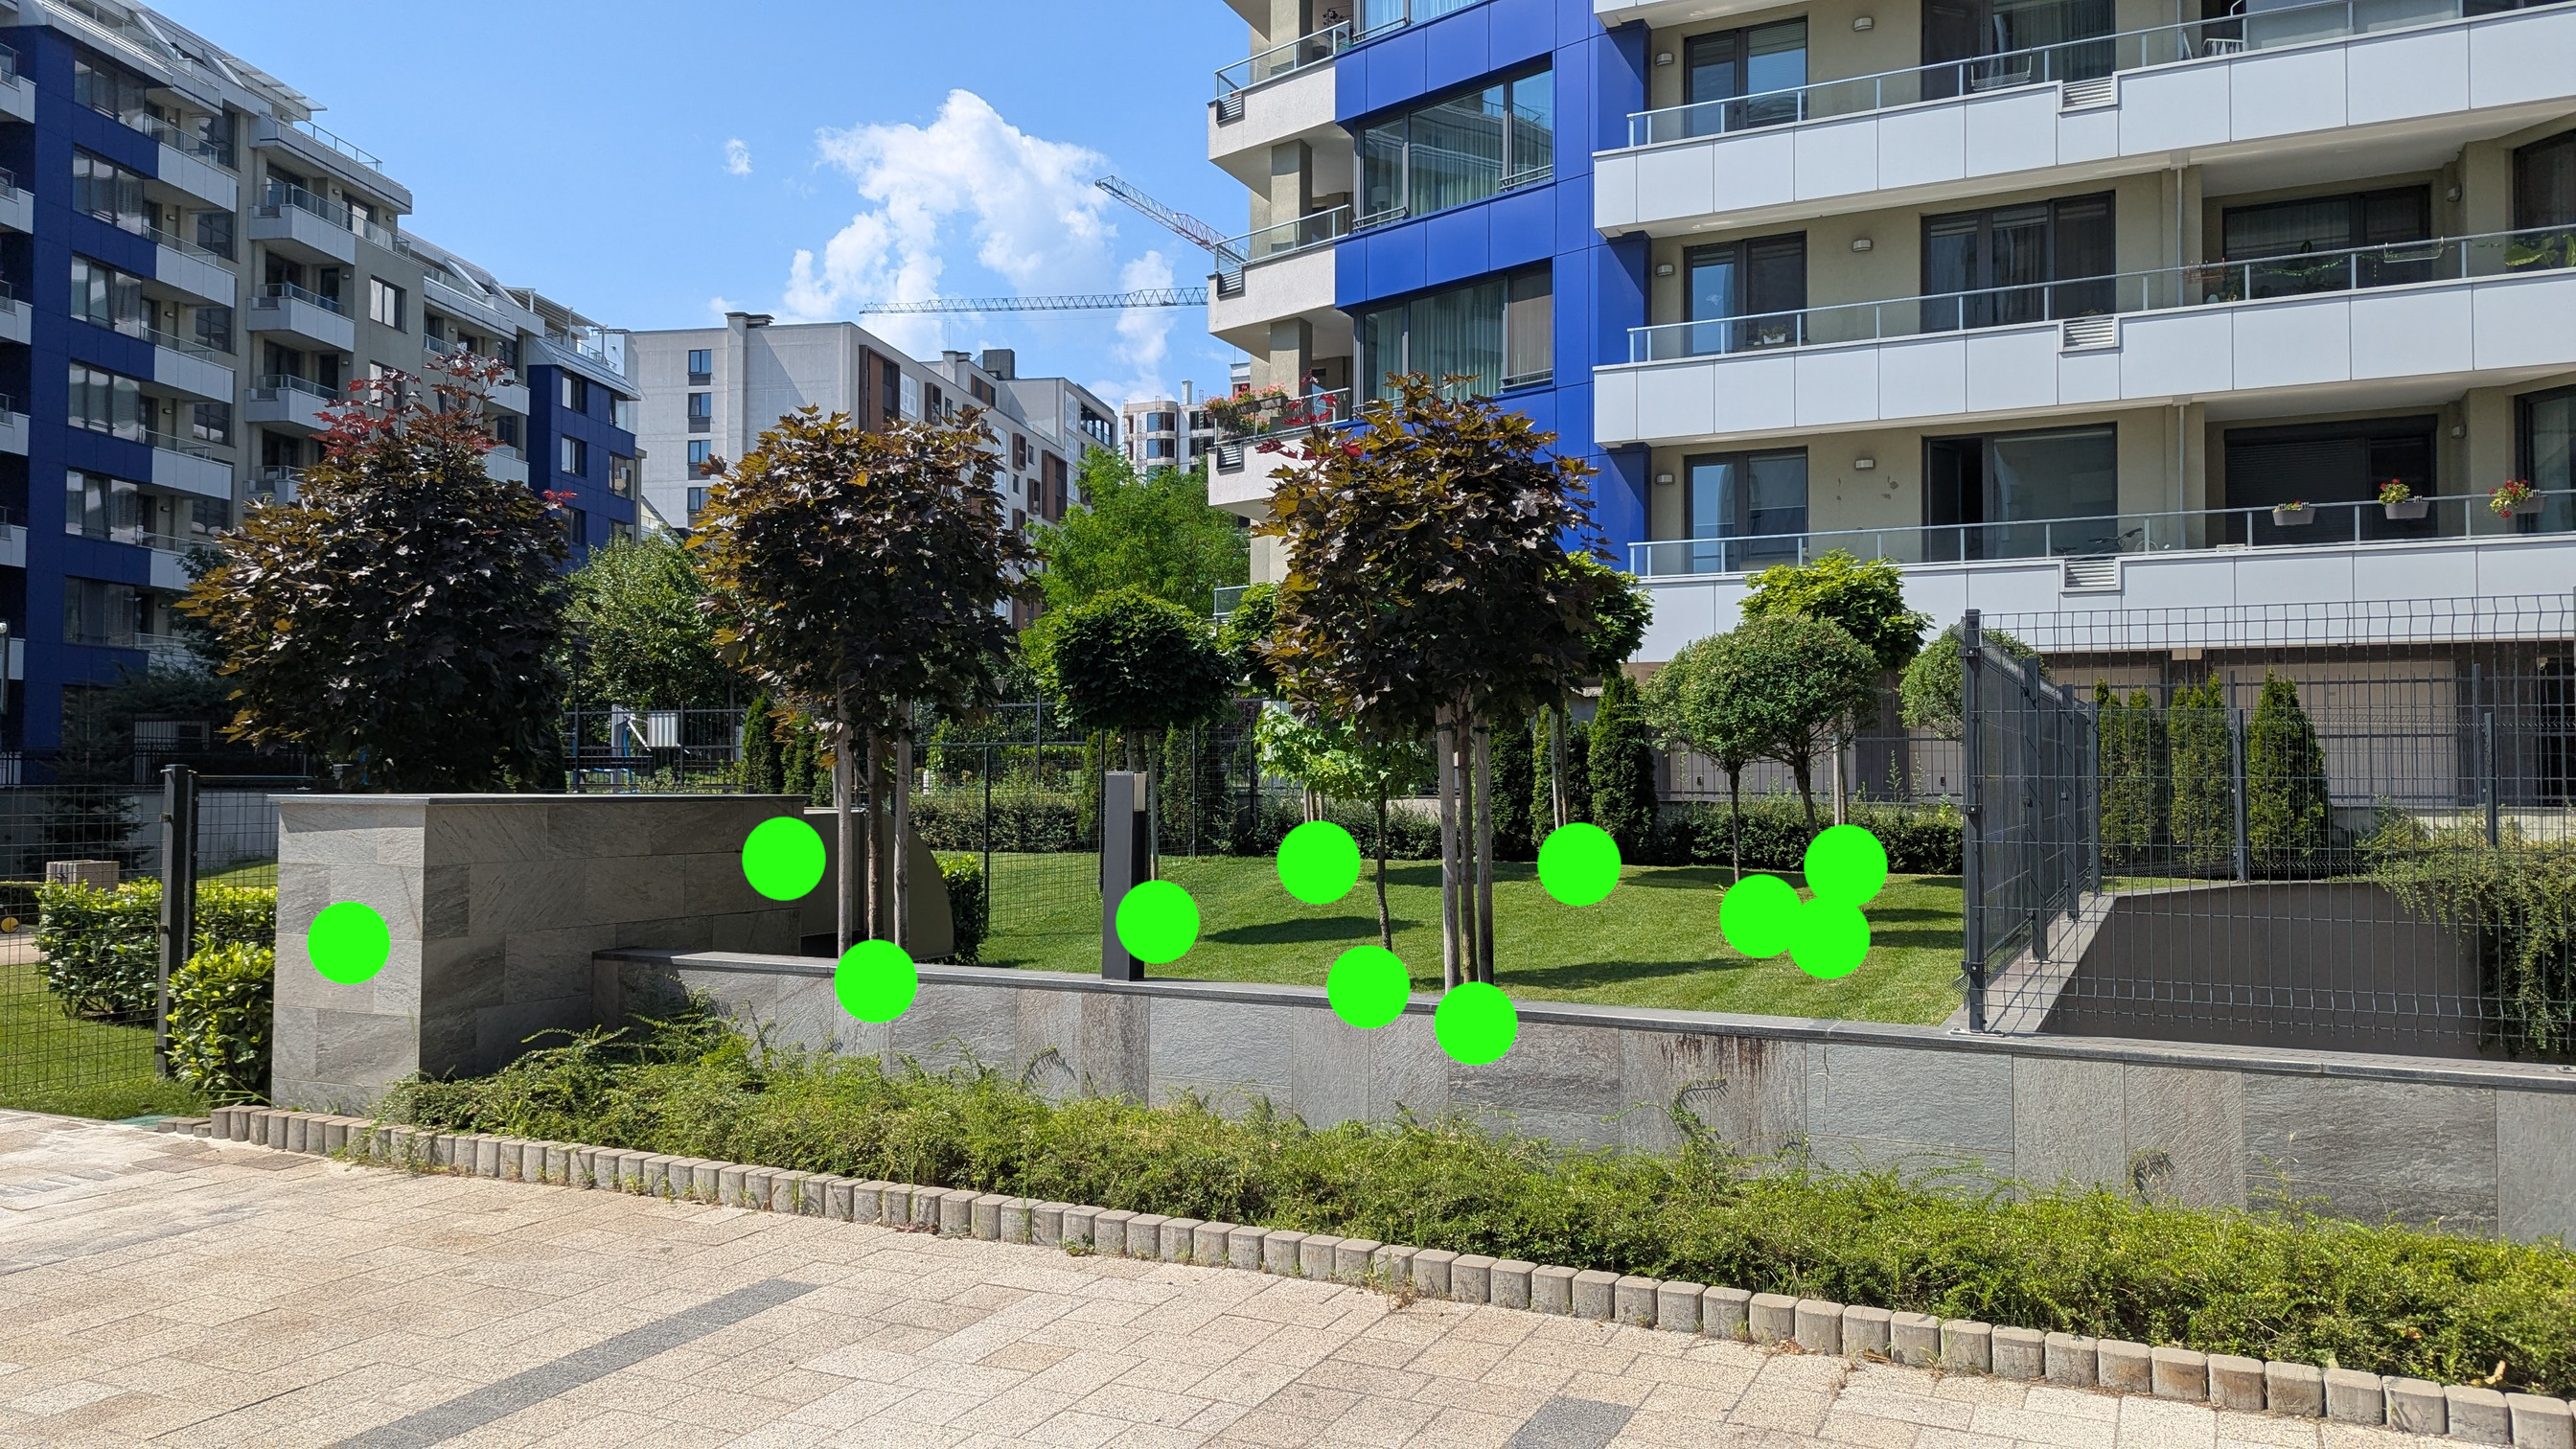
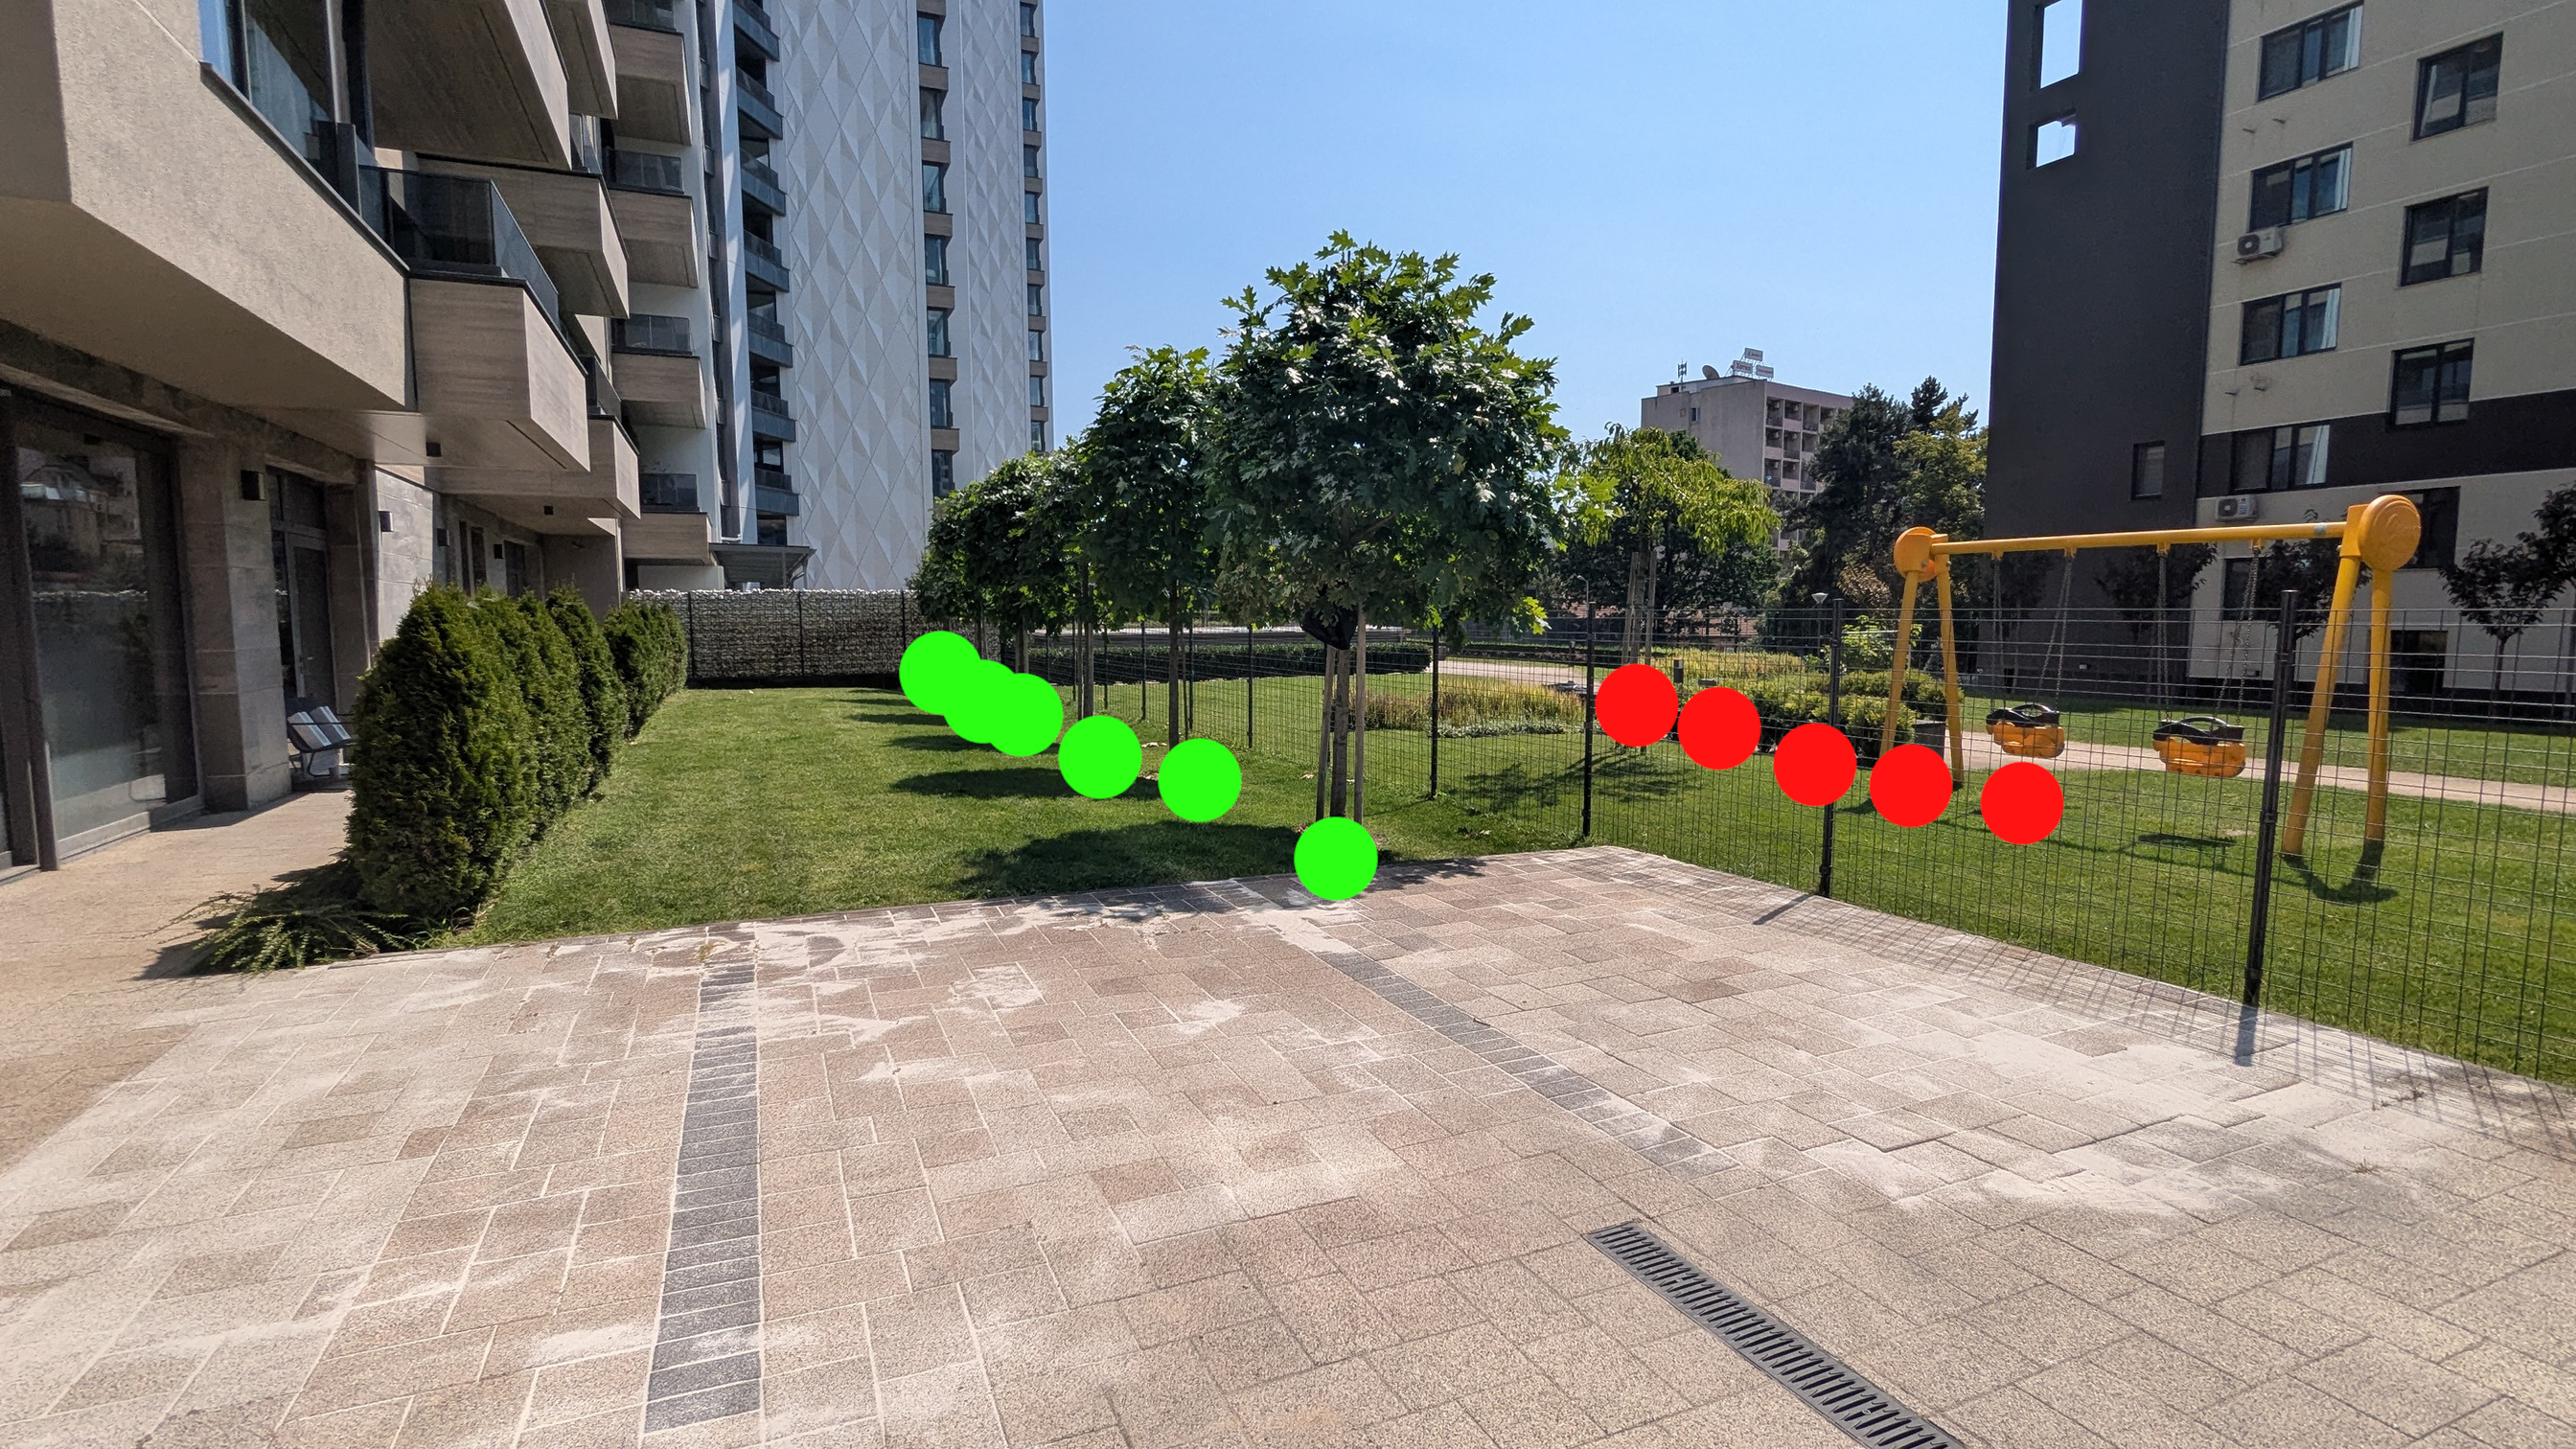
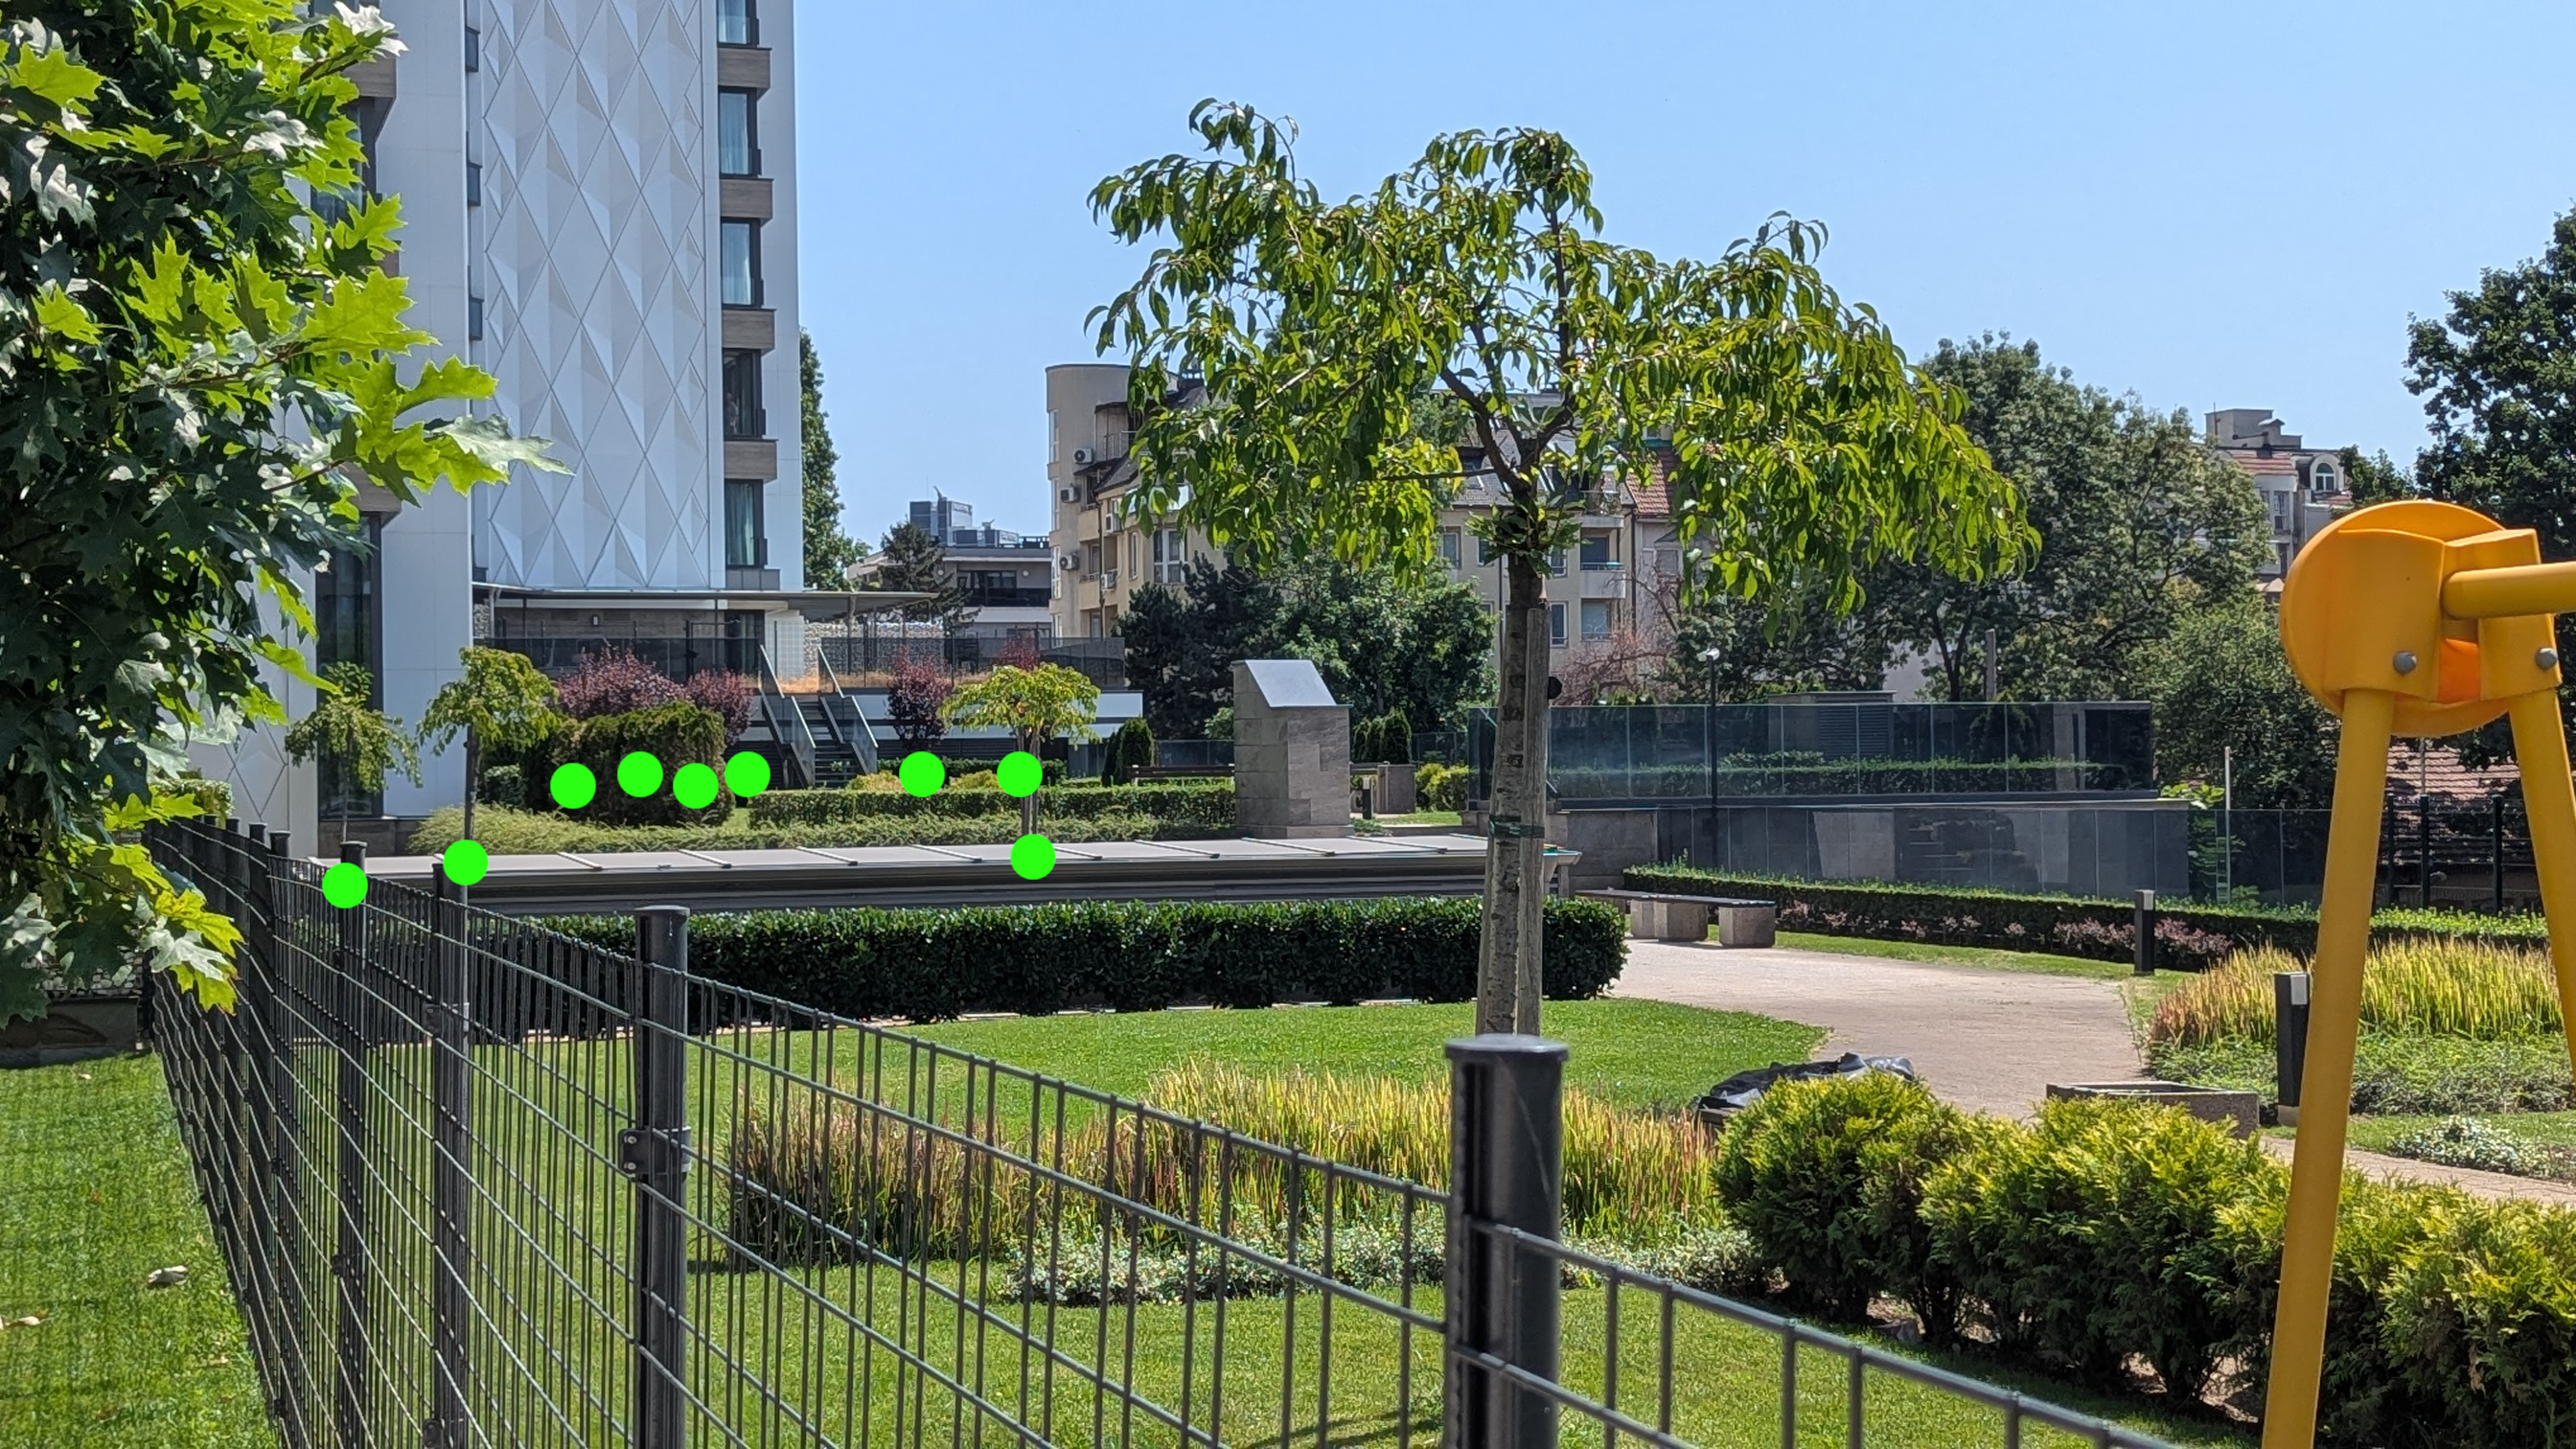
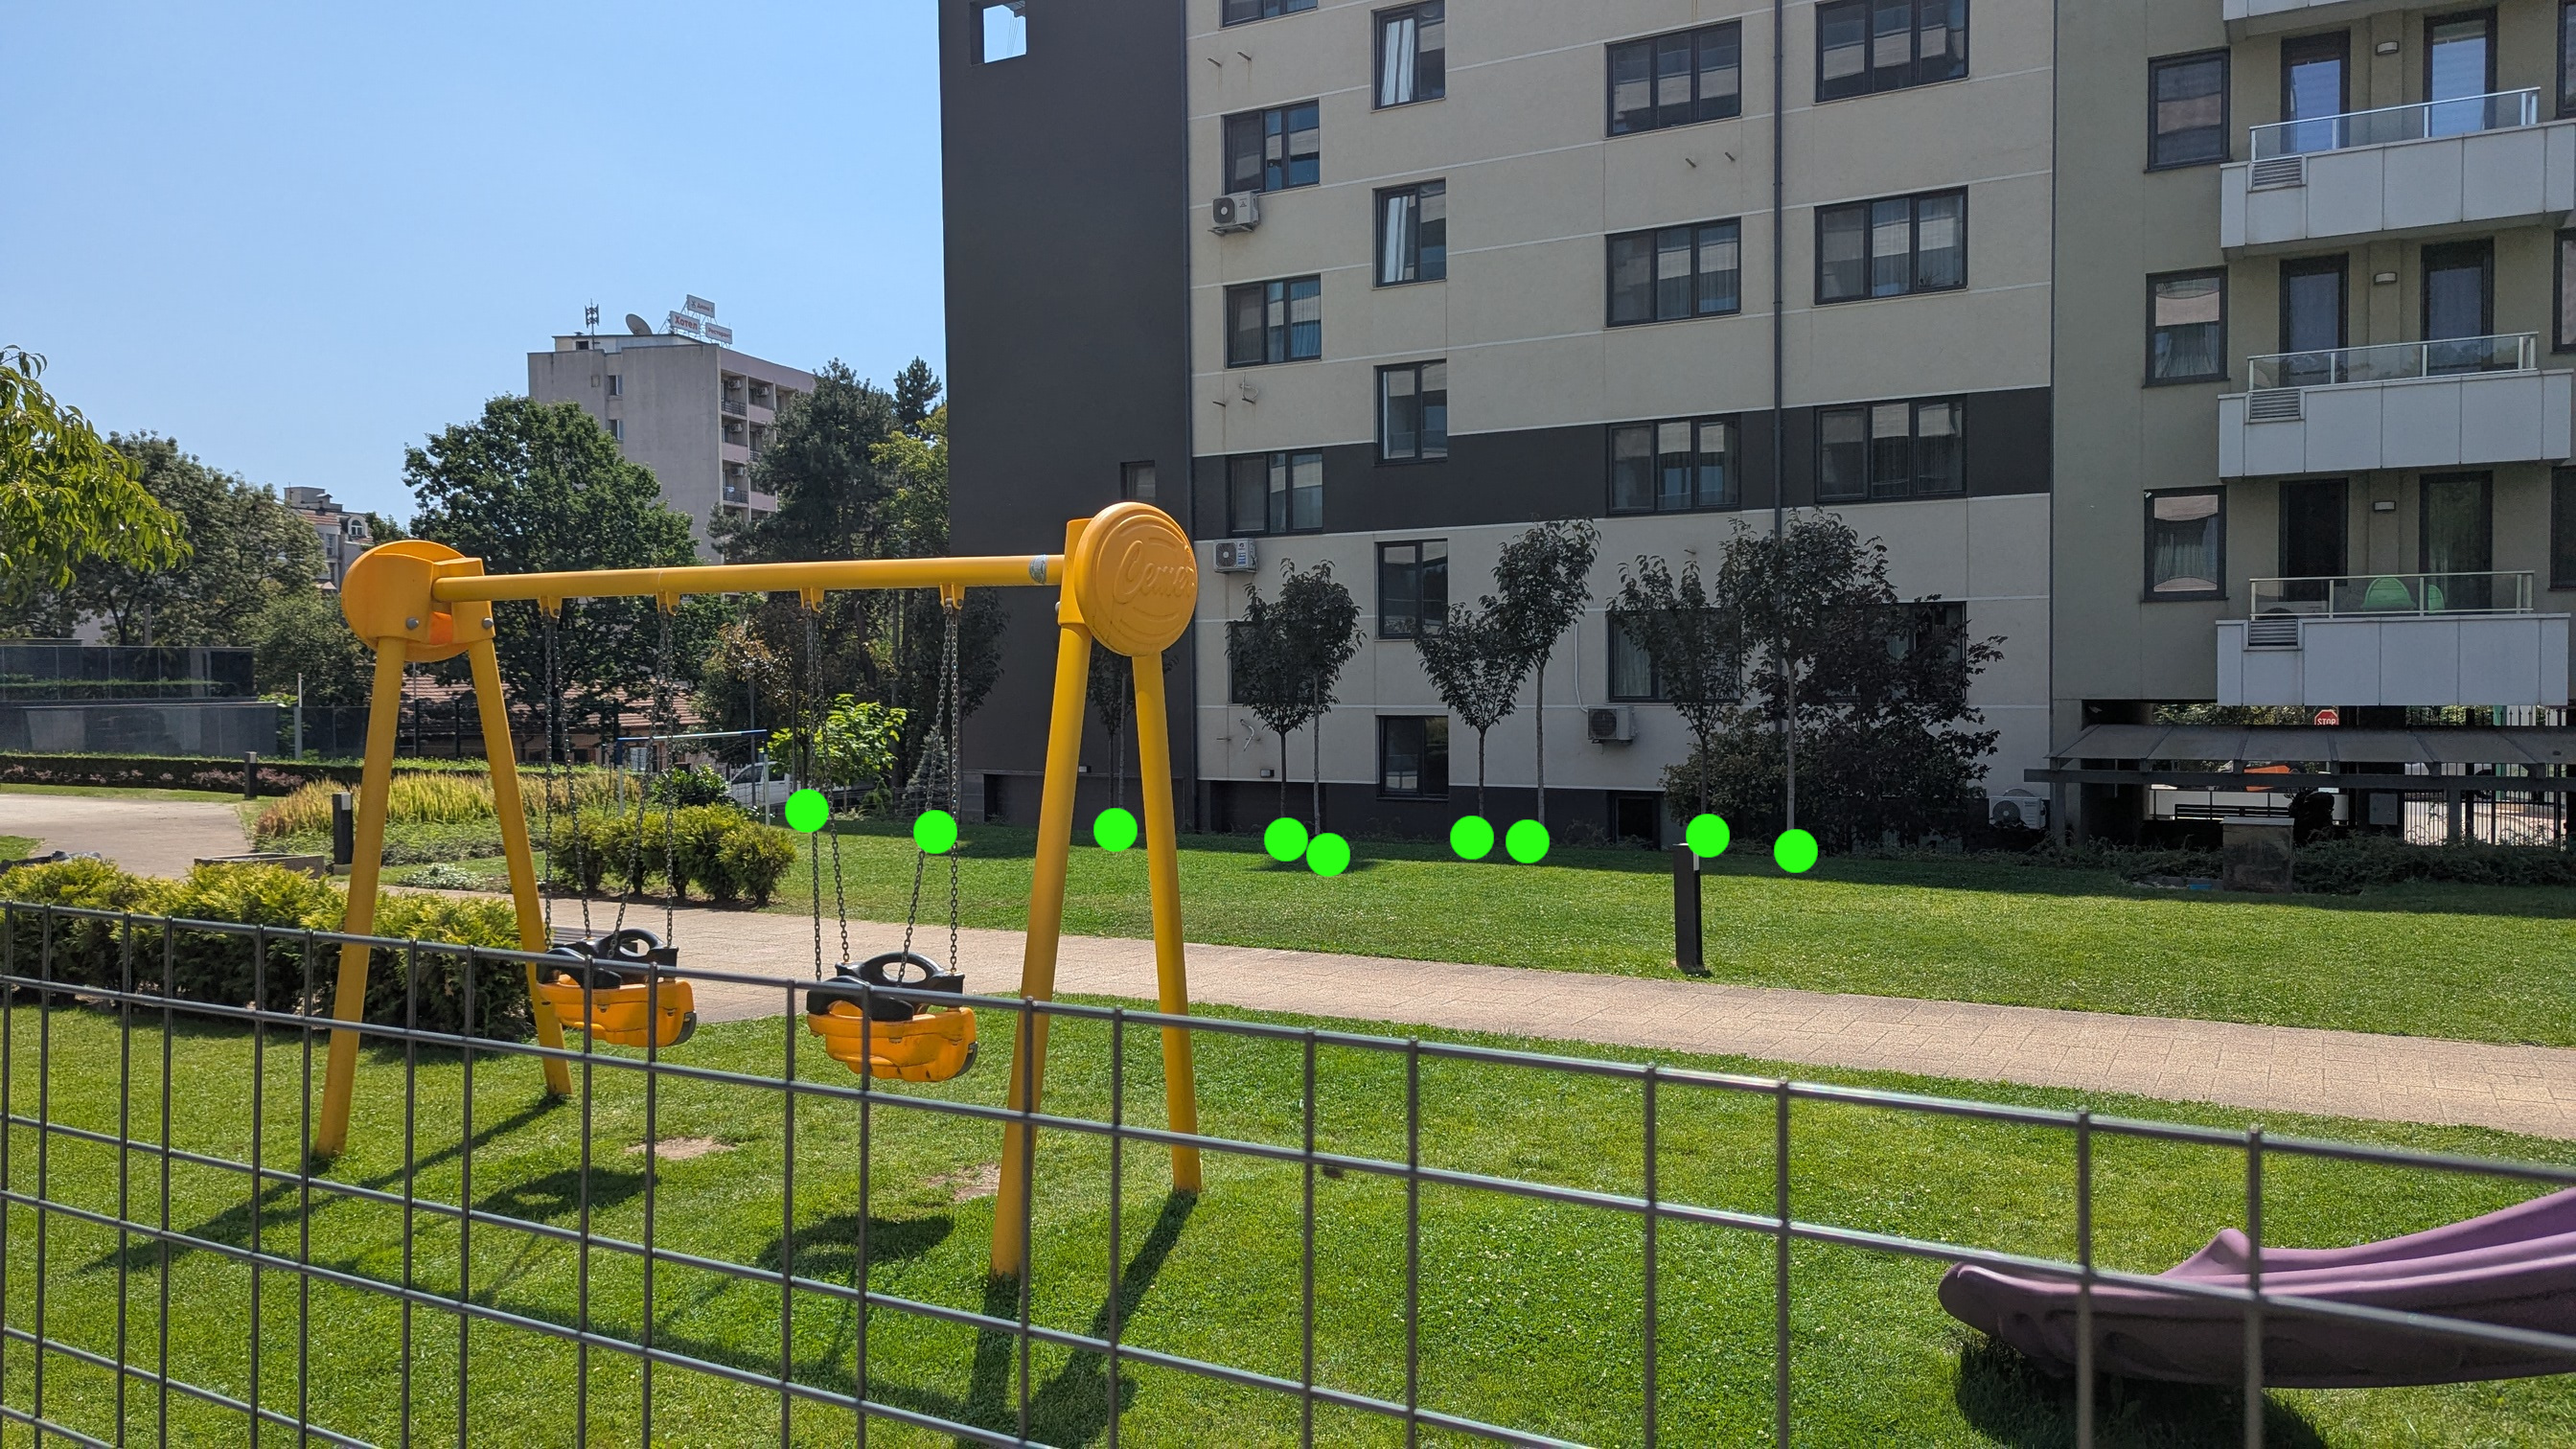
Отделен проблем е самата зелена площ. На много места се вижда, че почвата е не повече от 5 до 10 см. дълбочина. Изискването по старата наредба е поне 30 см. и 60 см. където има дървета и храсти. Пример за това е инцидент от 2024 г., когато едно от и без това малките дървета беше премахнато и част от градинката пред него беше превърната в паркомясто. Под него личеше, че е оставено малко малко дълбочина, но и това беше бетонирано и бяха сложени плочи направо на бетона симулираща, че има почва отдолу (снимка 4). В последствие след множество сигнали и месеци напомняне на районния кмет все пак върнаха дървото и сложиха трева. Дървото обаче сега е в малка вкопана кашпа, а тревата е с не повече от 5 см. почва под нея. Т.е. дефиницията на бутафорно озеленяване.
Аналогична е ситуацията вляво, където предвидена за зелена площ има отново бетонна плоча точно над паркингите и същите плочи за паркинг. Пред същото място по план трябва да има пет дървета, но има само едно, което също няма достатъчно отстояние или почва, за да оцелее. На това и на други места части от задължителното озеленяване е изчезнало спрямо когато са получили акт 16. В някои случаи това се е случило след година. В други – в рамките на последващи разрешения за строеж с цел промяна на предназначение, където е имало промени в озеленяването на имота. Последното е дори документирано от районната община като част от сигнали.
На няколко стари сигнала за описаните случаи районната община на Изгрев отговаряше, че всичко е наред и отговаря на проекта и изискванията. Отказваха на няколко пъти да предоставят плана за озеленяване като част от този проект. Сега разбираме защо – липсват десетки дървета и не са изпълнили дори базисните изисквания за отстояния, дълбочина на почвен слой и висока дървесна растителност. В крайна сметка пет годишният срок по ЗУТ от оригиналното разрешение за строеж, в който имат задължение да правят проверки изтече в началото на 2026 г.
За щастие, има две последващи разрешения за строеж на това място за преустройство на помещения с изходи към улицата – медицински център и магазин. Извинението на районната община този път е, че срокът от първото разрешение за строеж е изтекъл, а новите разрешения не предвиждали промени по озеленяването. Това не значи, че такива промени не е имало и отговори на стари сигнали го доказва. Изискване в последвалите разрешения за строеж е да не се променя нищо по имота, включително параметрите на озеленяването. Към него задължително се прилагат оригиналните планове.
Особеното тук е, че чл. 63, ал. 5 от ЗУТ не разграничава разрешенията за строеж и срокът от пет години започва да тече отново. Конкретно районната община следва да установи към днешна дата дали озеленяването отговаря като дълбочина на почвения слой във всички лехи, като брой дървета и отстояние на оригиналния план и изискванията. При липса на документация какво са установили при проверки между 2021 и 2024 г. единствената хипотеза е, че промените са се случили във връзка и след промените на предназначението на двата обекта. Това се подкрепя от случая в края на 2024-та, където именно това беше установено, но не и възстановено според изискванията. Тогава изрично районният кмет описа, че е ограничил проверката си до тези няколко квадрата и е установил проблем свързан с преустройството на магазина. Длъжен е да го направи за целия имот и има срок от още поне три години.
East Plasa Hotel
За разлика от предишната сграда, тази влиза в експлоатация през ноември 2024-та и районната администрация има задължение до края на 2029 г. да следи дали всичко отговаря на изискванията. Разрешението за строеж обаче е от 2019 г., т.е. важи старата наредба за озеленяването.
Тук първоначално е важало изискването за 40% озеленяване и това е отчетено в първите скици, които видях. Там предвиждаха значително по-малка интензивност на строежа, дървета и градинки по високите етажи и прочие. Заради един отчетливо лобисти текст в чл. 27 на ЗУТ това се променя. Имотът изкуствено се разделя на две през 2020 от Здравков. По-малката част е от страната на бъдещият зелен ринг и се застроява почти напълно (с изключение на 4 дървета от снимка 9). Така основната сграда се води ъглова, отпадат всички ограничения и успяват да постигнат тази височина и степен на застрояване. На практика сградата е една и без каквато и да е възможност за разграничение.
Все пак, в проекта, разрешението на строеж и при влизане в експлоатация твърдят, че имат 33.28% озеленяване, 34.75% от които са висока дървесна растителност. Това е важно, защото това би трябвало да видим на място и както сами се досещате не е съвсем така.
При дърветата има проблем, но не толкова голям, колкото при Диамант 2. По план трябва да имат 56 дървета. Десет от тях следва да по терасите на 6-тия етаж. Трудно се виждат, а височината и структурата на терасите не позволява да са спазени изискванията за кашпите. Трудно е, но нека предположим, че там всичко в наред.
С тях дърветата на място стават 50. Голяма част от тях не отговарят на изискванията за отстояние едно от друго или размер на кашпа или клоц (снимки 13, 14, 15 и 23). Същото важи впрочем и за храстите в снимки 16, 17 и 18. В края на 2024 г. имаше още едно място с озеленяване отбелязано на снимка 19, което обаче после беше бетонирано. Дори с тези липси обаче покриват сериозно намалените изисквания при условие, че дърветата на 6-тия етаж съществуват и си затворим очите за отстоянията и почвения слой.
-
Изглед от бъдещия Зелен ринг -
Украсили са фасадата с идеята, че отдолу ще се минава -
Отбелязано е в зелено къде трябва да има над 100 кв.м. вертикално озеленяване по ограда. -
Отбелязано е къде трябва да има озеленяване над и под перога -
Изглед от началото на фактическото озеленяване -
Отбелязана е частта от озеленяването, която попада в имота на малката „съседна“ сграда. -
Отбелязана е частта от озеленяването, която попада в имота на малката „съседна“ сграда. -
Близкото дърво е към имота. Останалите са в общински имот. -
Четирите дървета към „съседската“ малка сграда. -
Изглед към бъдещия Зелен ринг -
Отбелязано е къде трябва да има поне 150 кв.м. зеленина. -
Отбелязано е вертикално озеленяване на ограда и къде трябвало да има перога над дърветата с още вертикално озеленяване. -
-
Ниски храсти на мястото на вертикално озеленяване върху ограда от няколко метра. -
Кашпите на дърветата с вътрешна страна от 70 см. -
Ниските лехи пред сградата. Вътре са още по-плитки. -
Лехите отпред. Вижда се, че част не са дори с пръст. -
Лехите отпред. -
Отбелязано е липсващо вече озеленяване. -
Дърветата отпред в кашпи -
Дърветата отпред в кашпи -
Височината на почвения слой не отговаря на изискванията. -
Къде се забелязват дървета и къде изглежда, че липсват. -
Липсващо вертикално озеленяване върху перога. -
Входът разделя „съседната сграда“ -
Изглед към незаконния билборд -
Паркът направен скоро след пускането на хотела -
Частта от улицата направена скоро след пускането на хотела -

Наводнението на същата улица заляло фоайето -

Наводнението на същата улица заляло фоайето





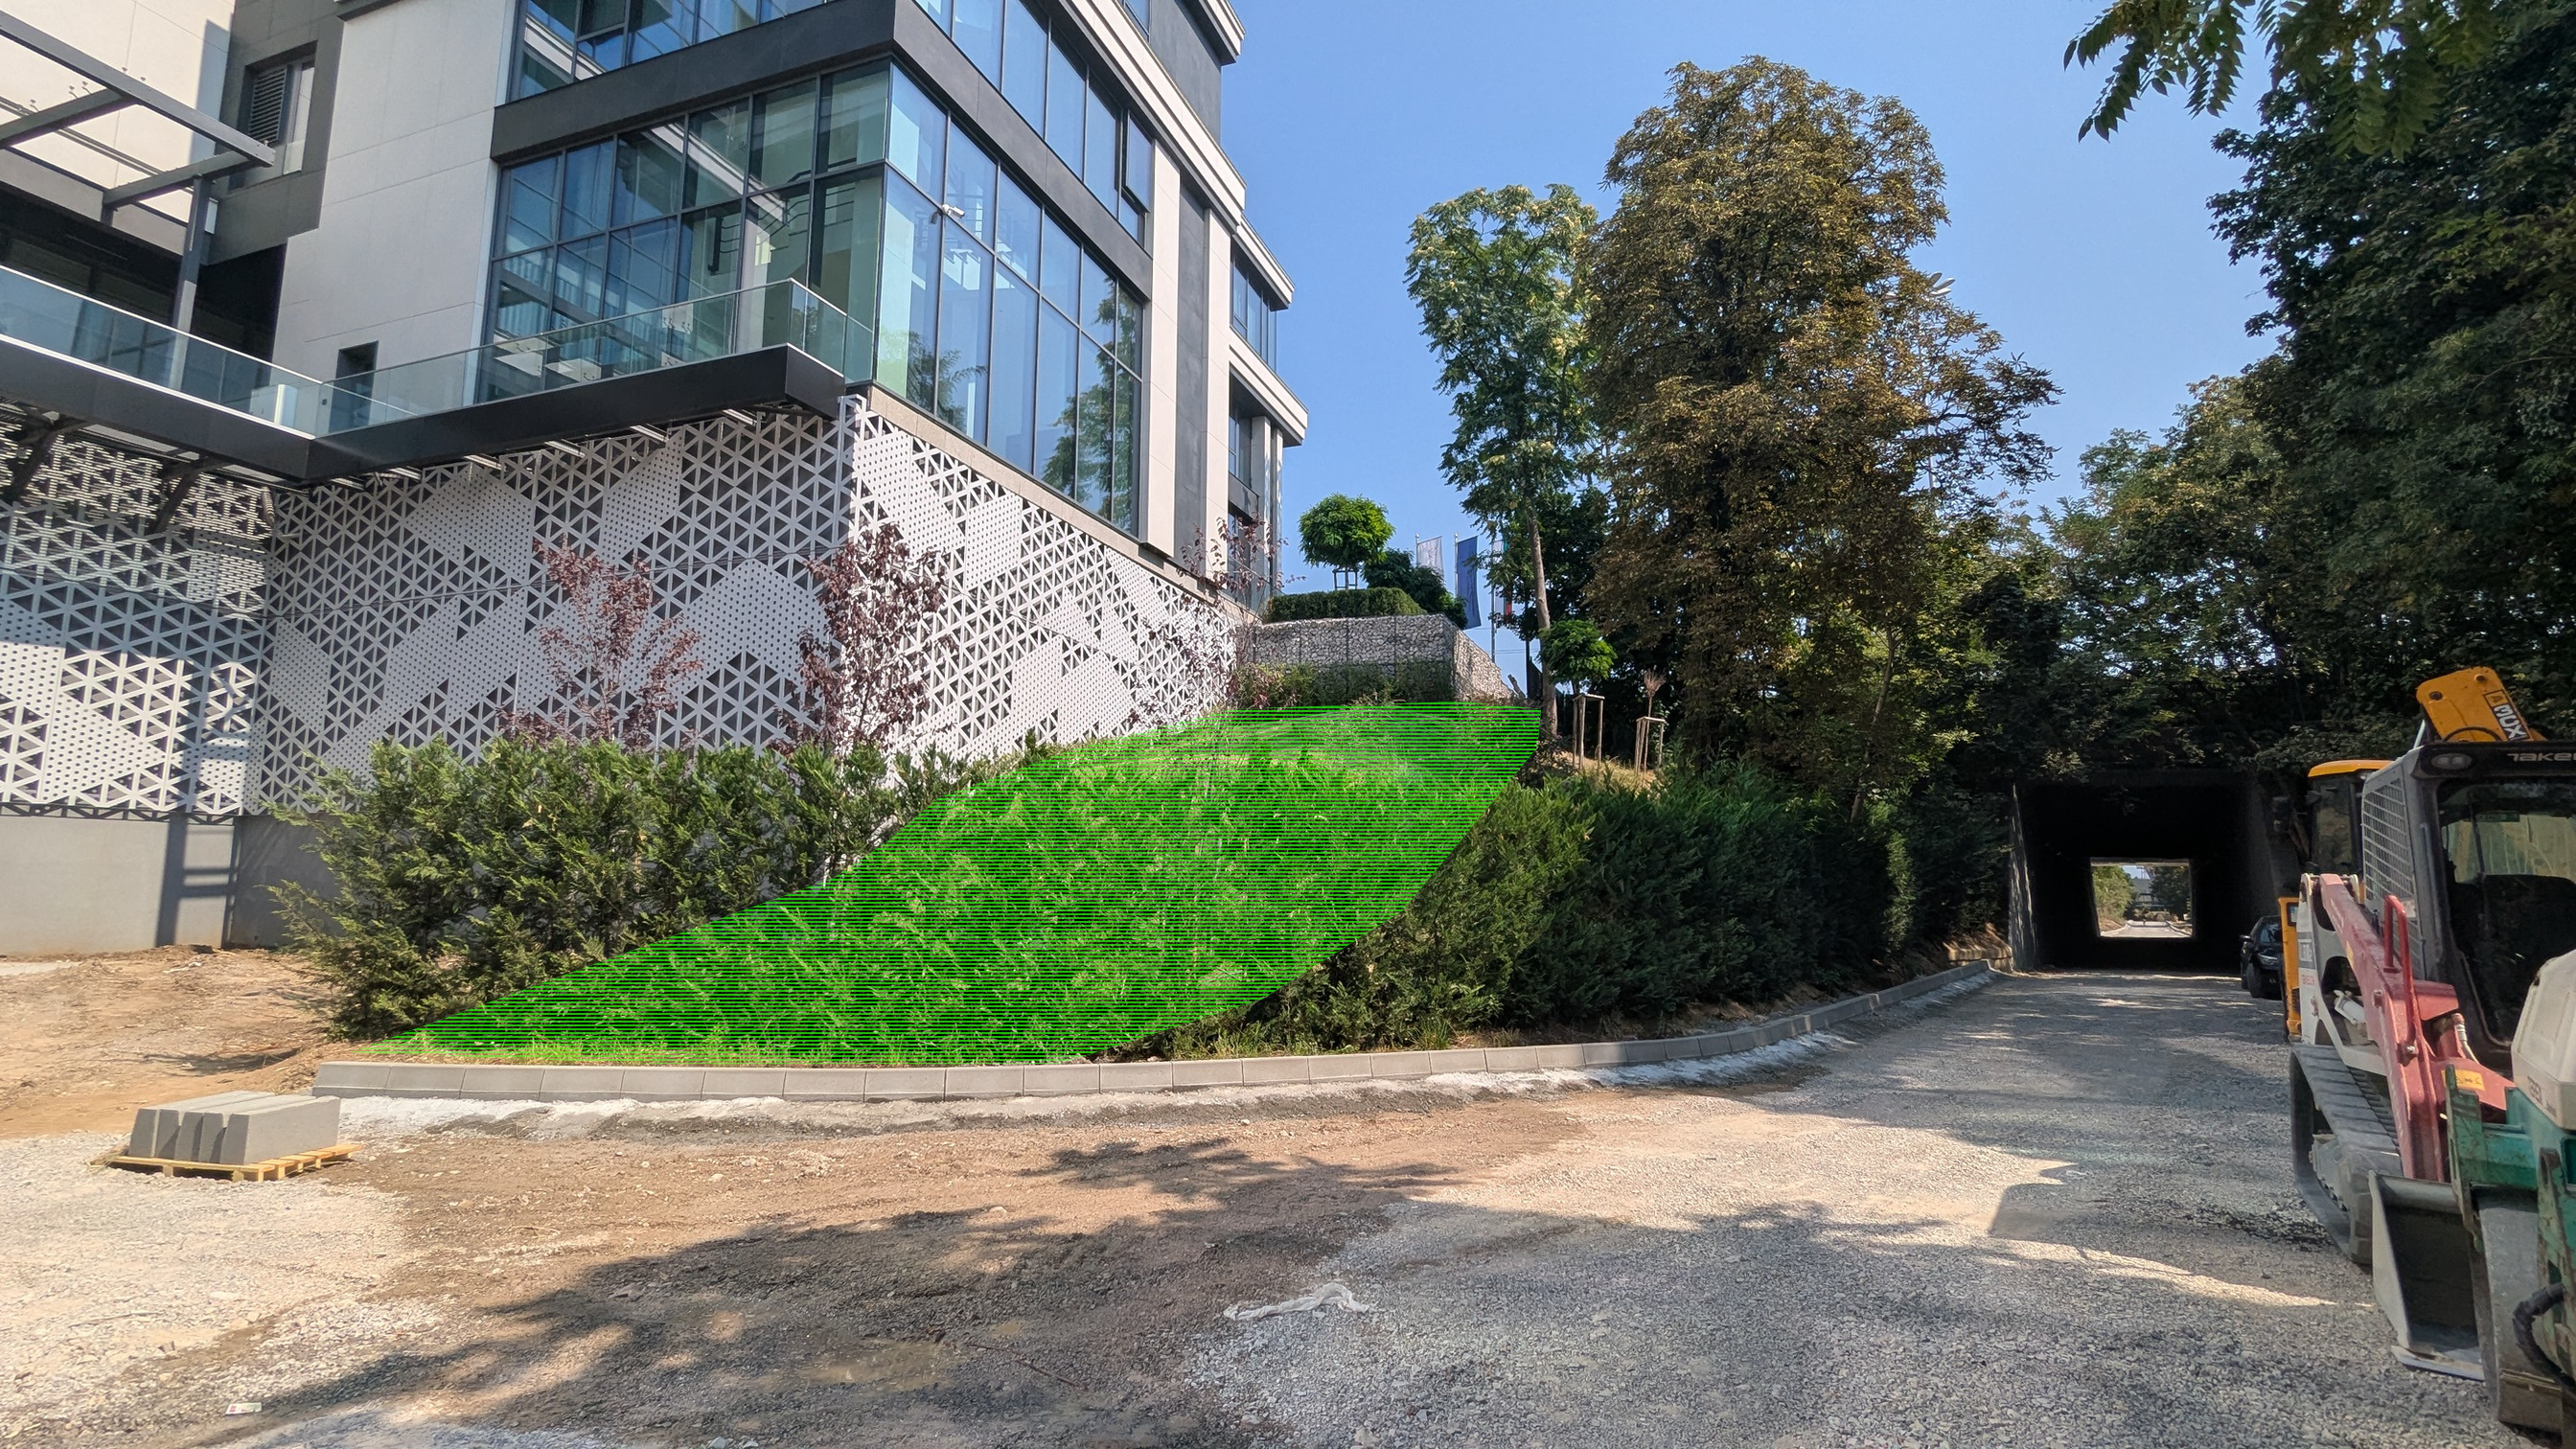

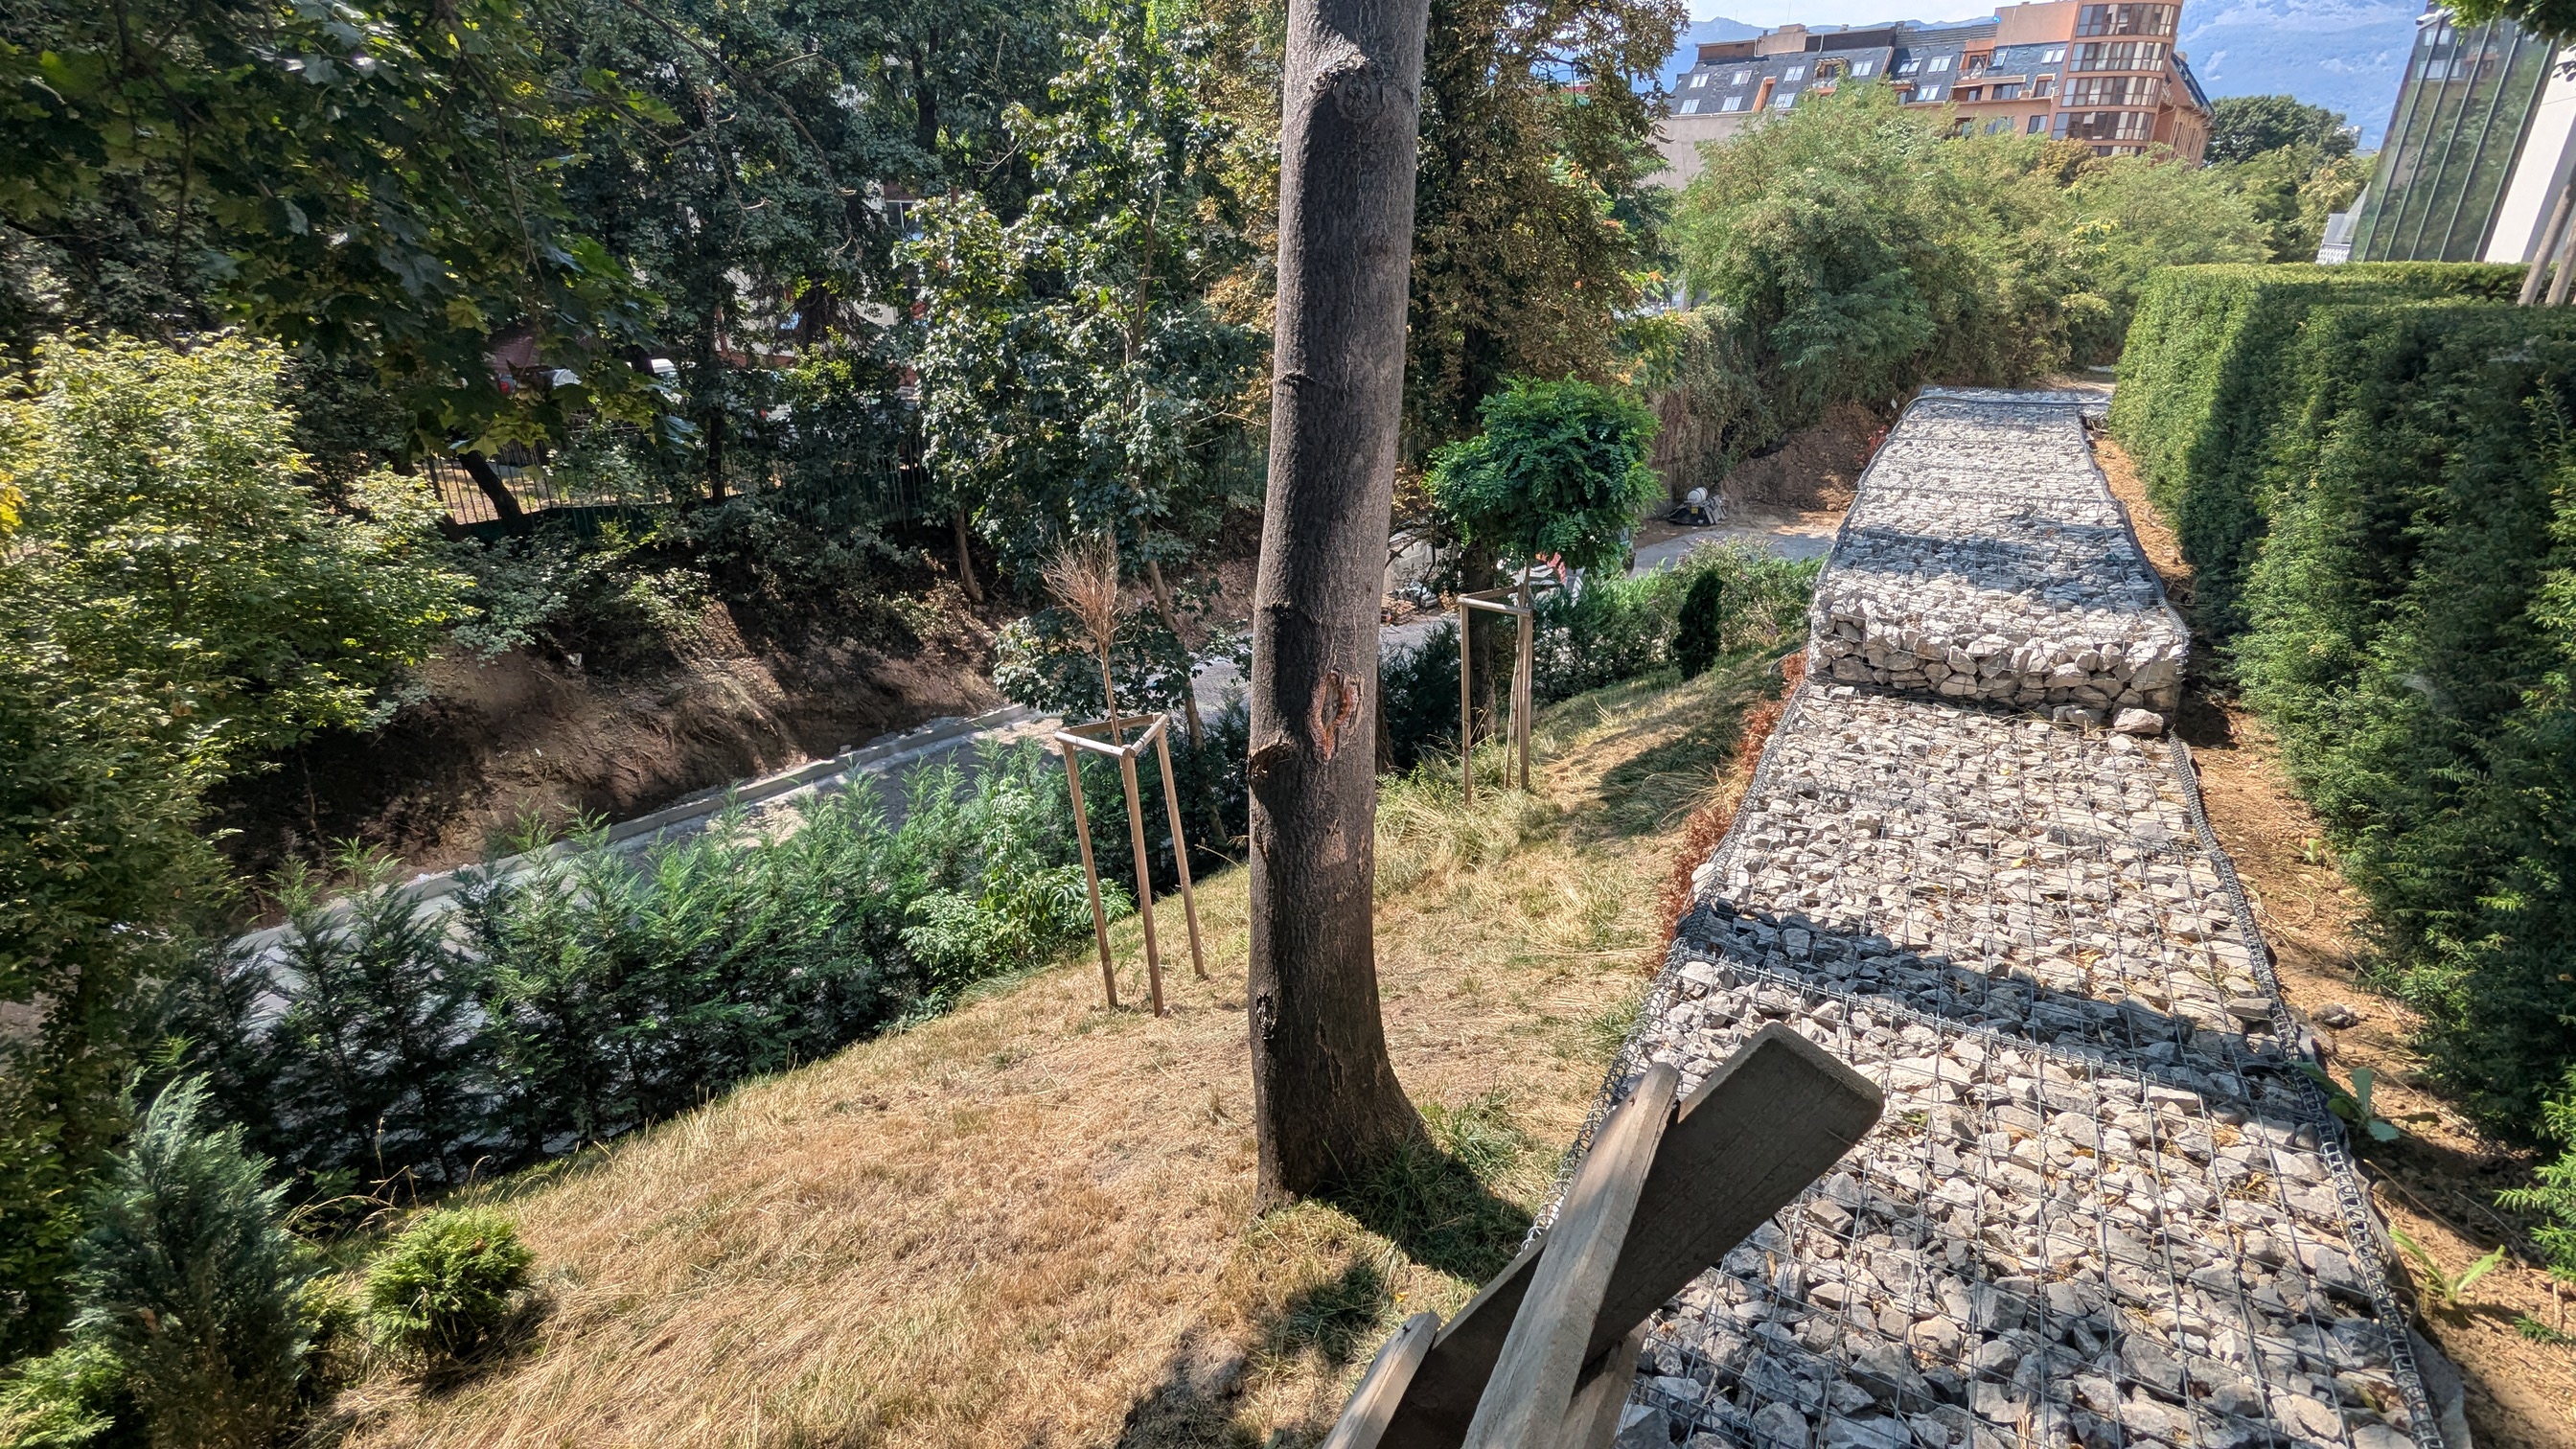


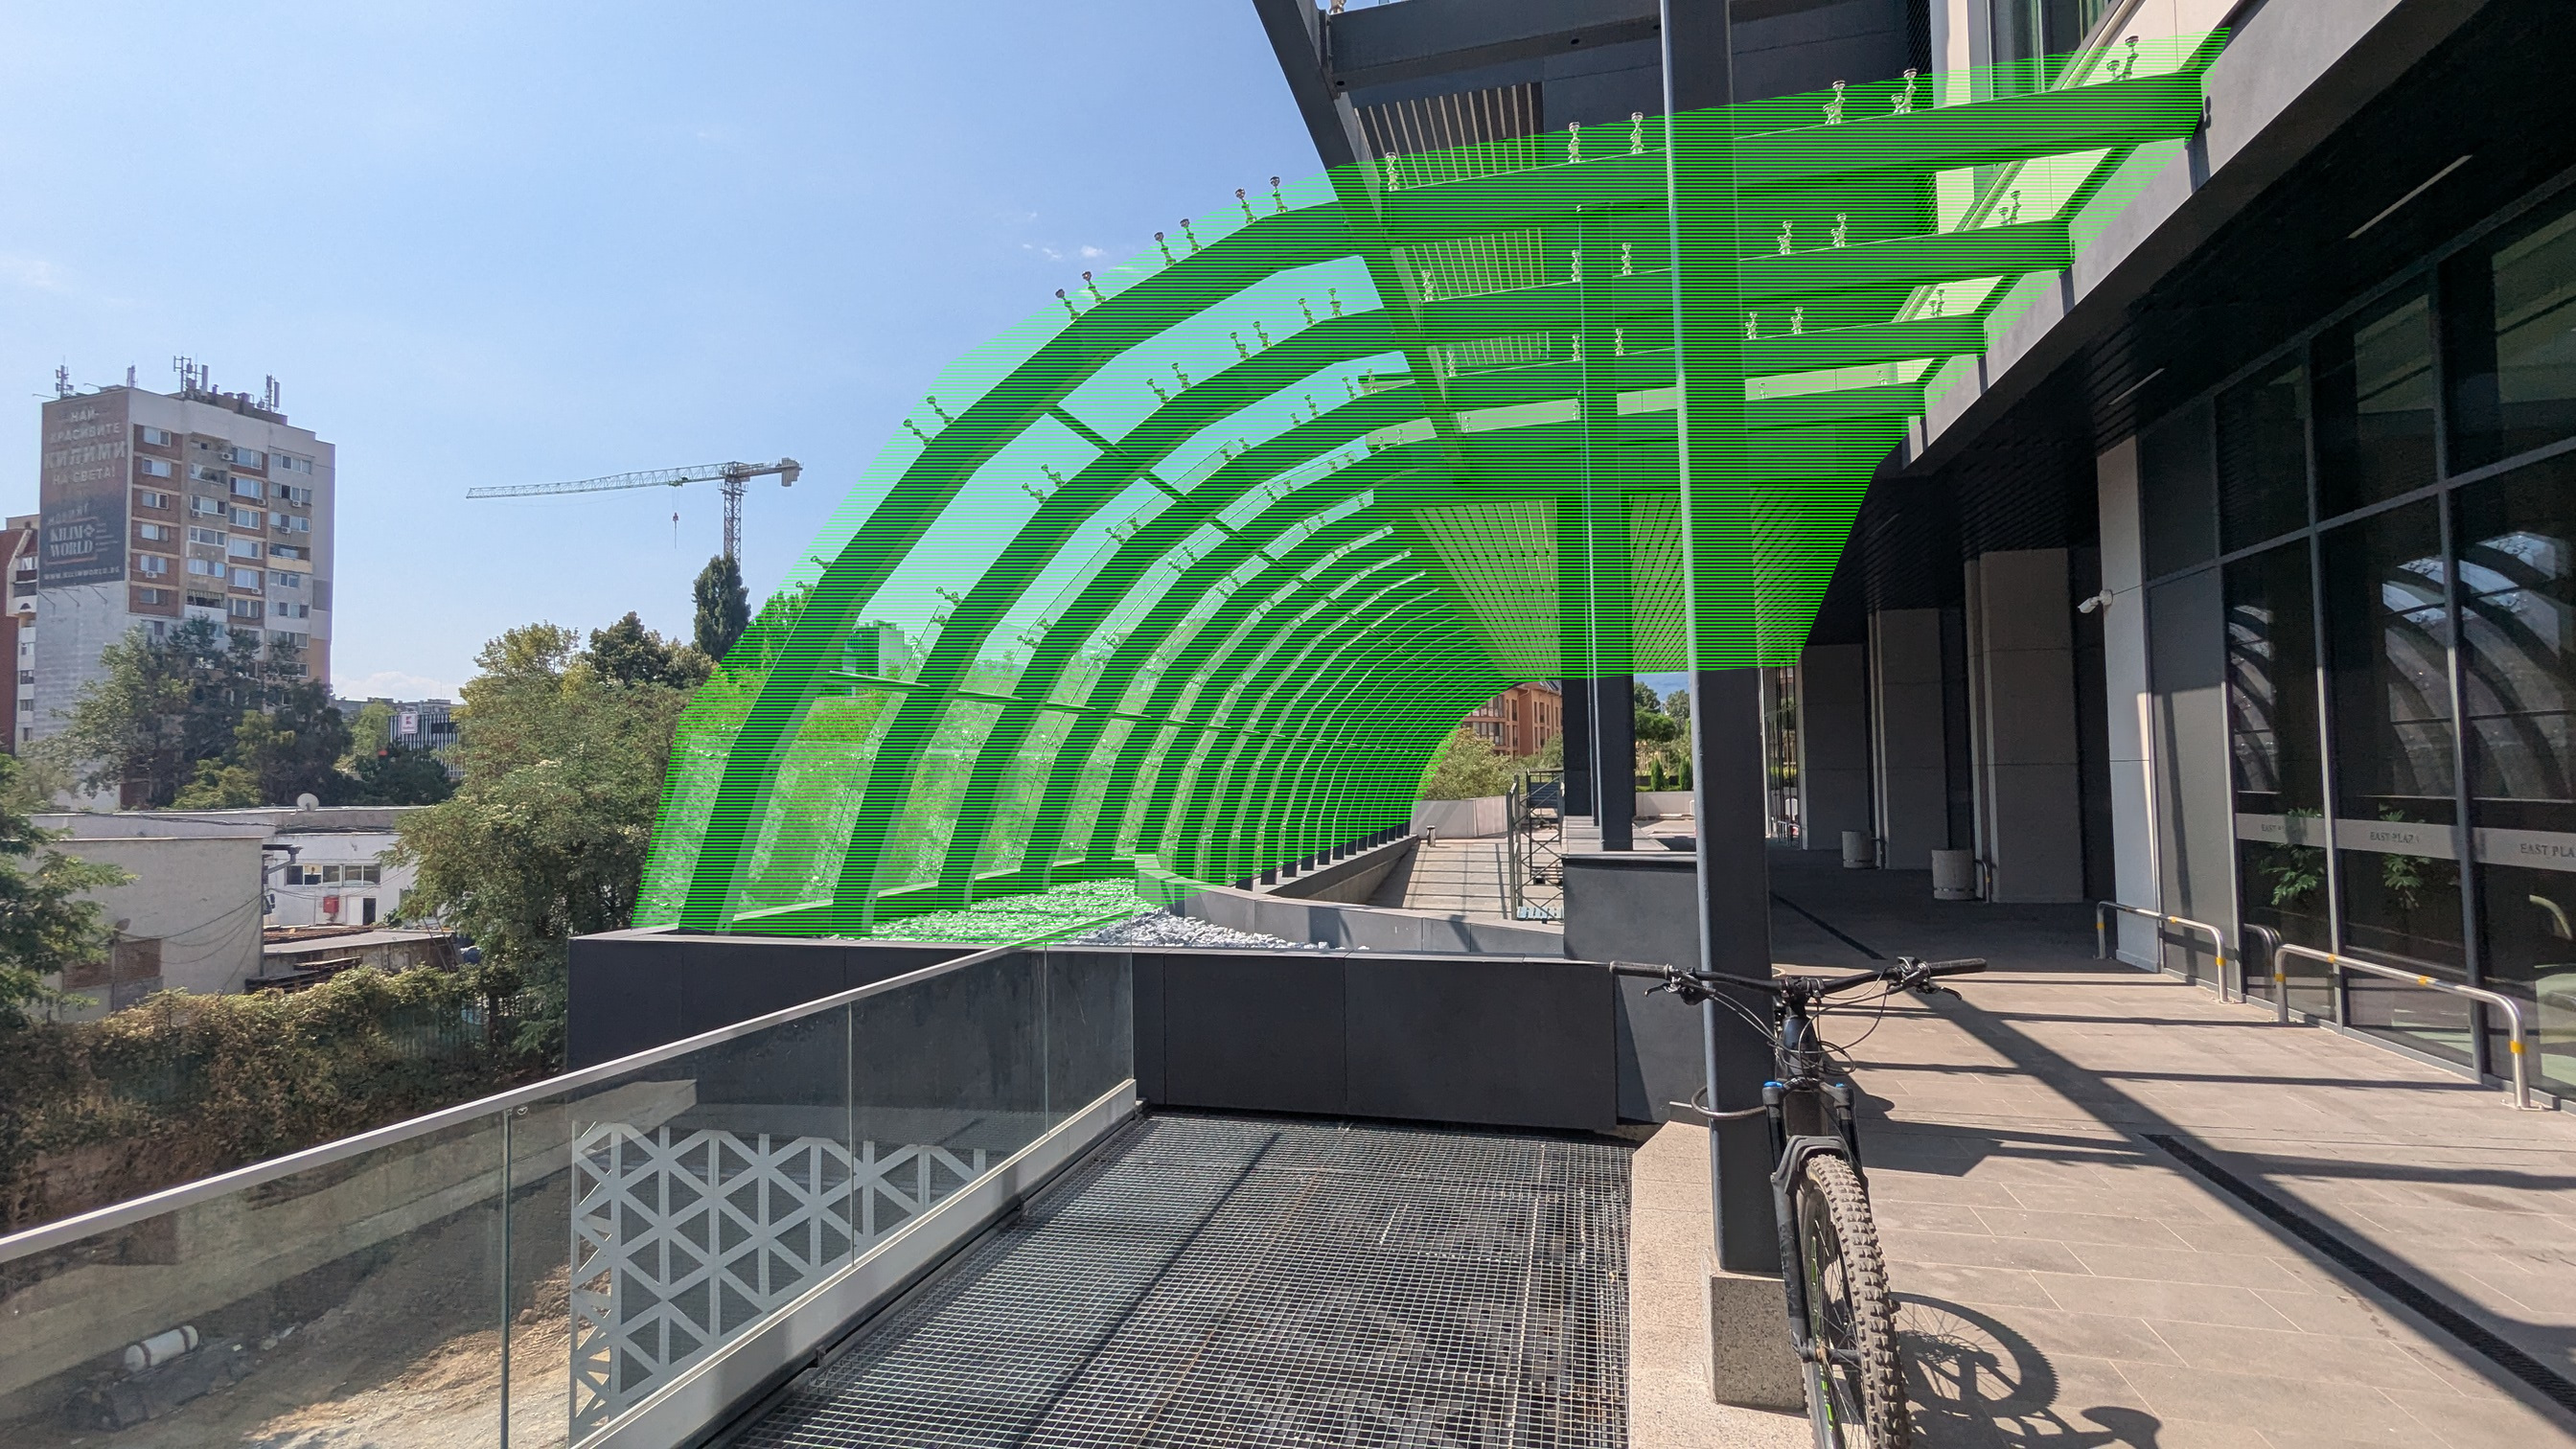
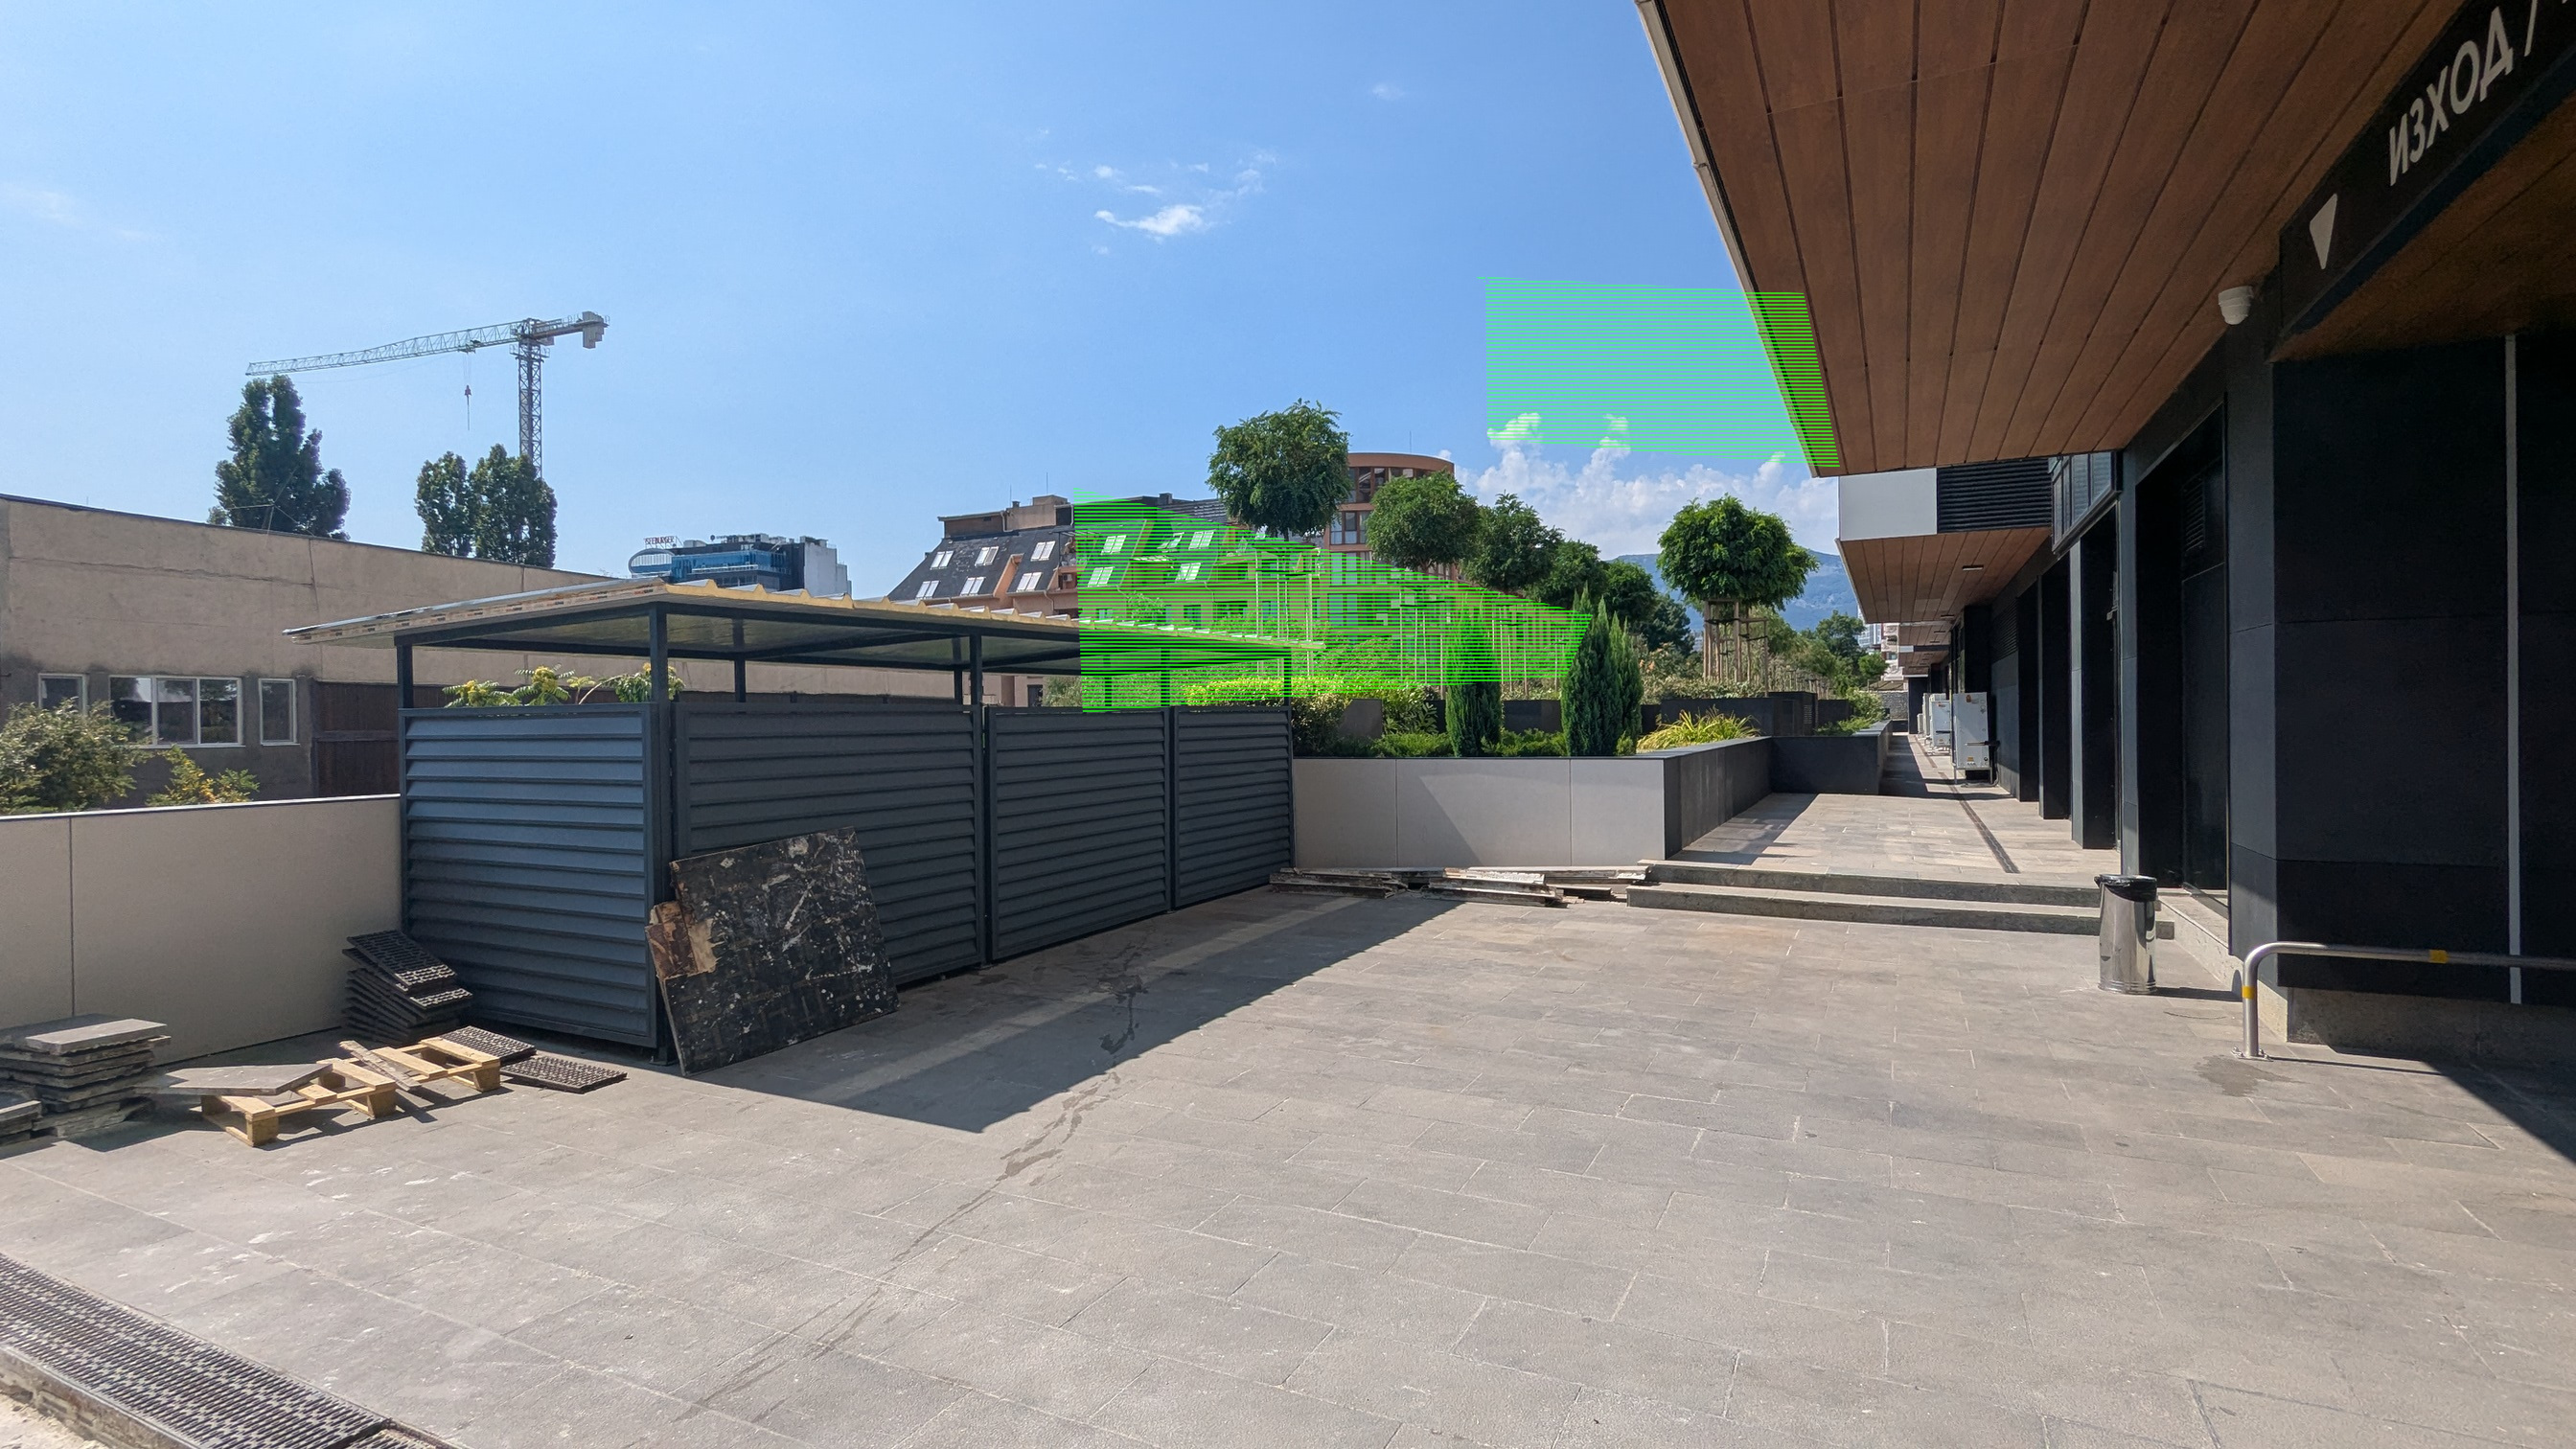

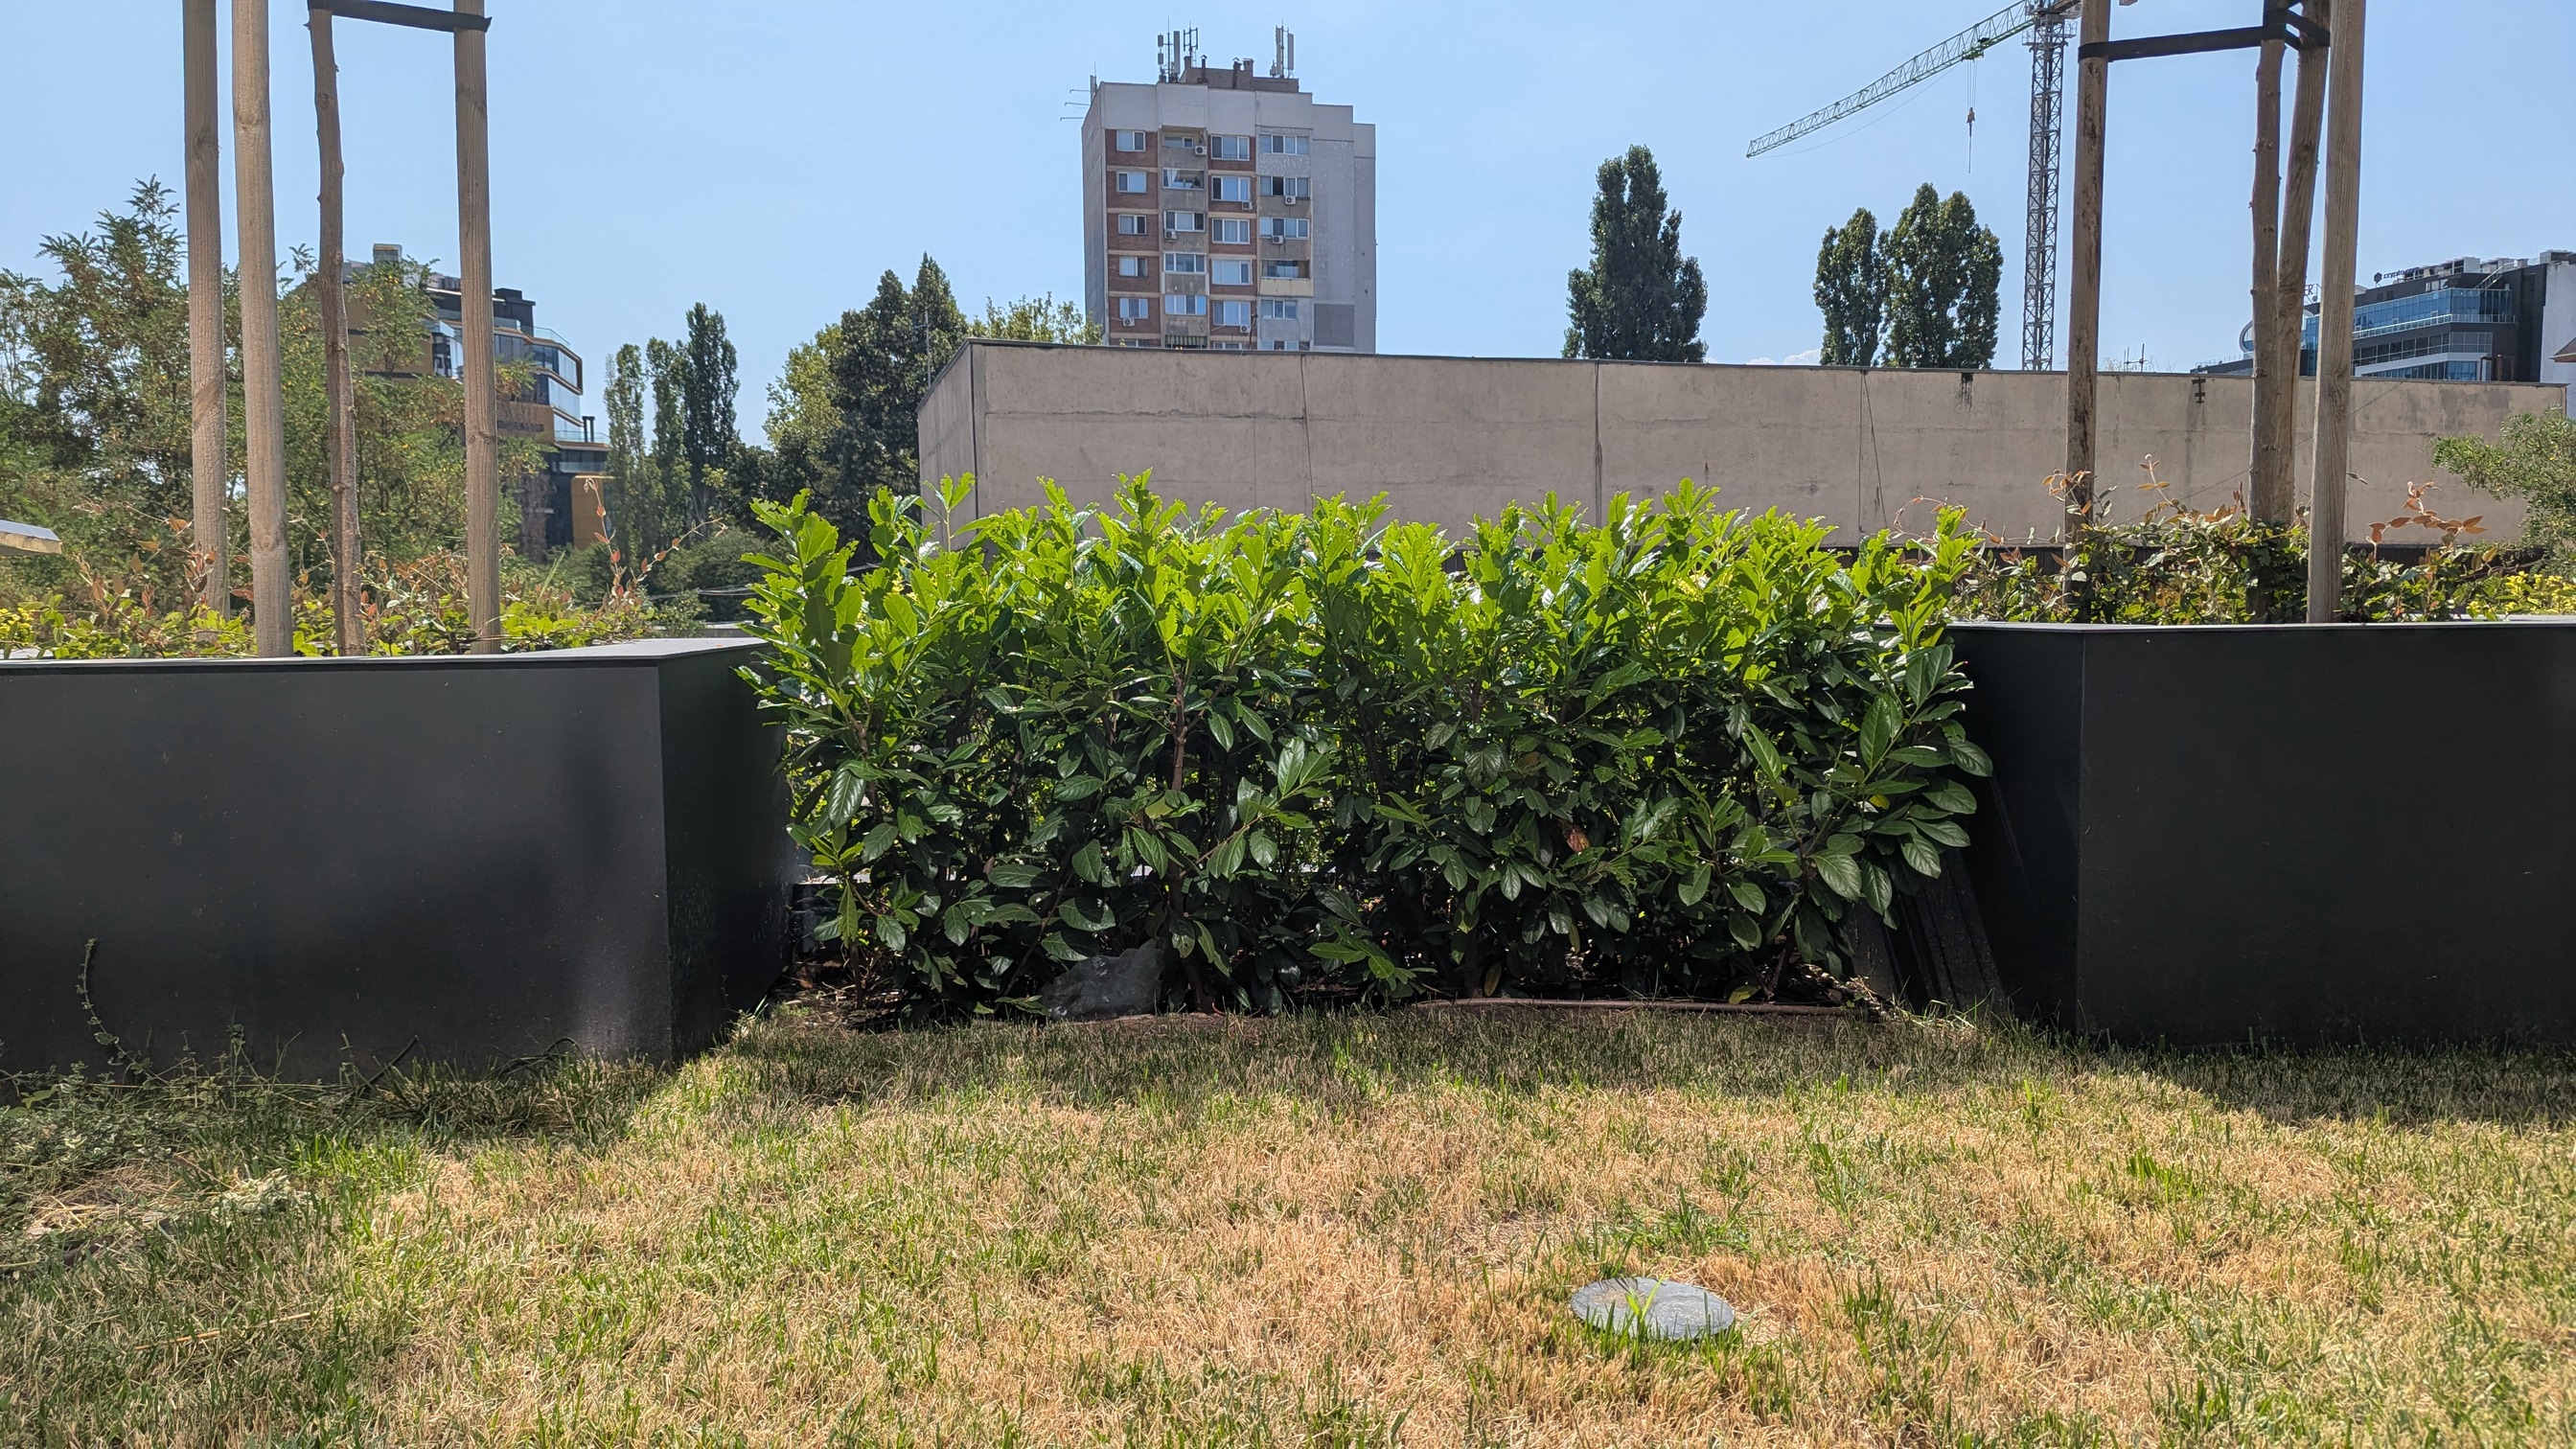




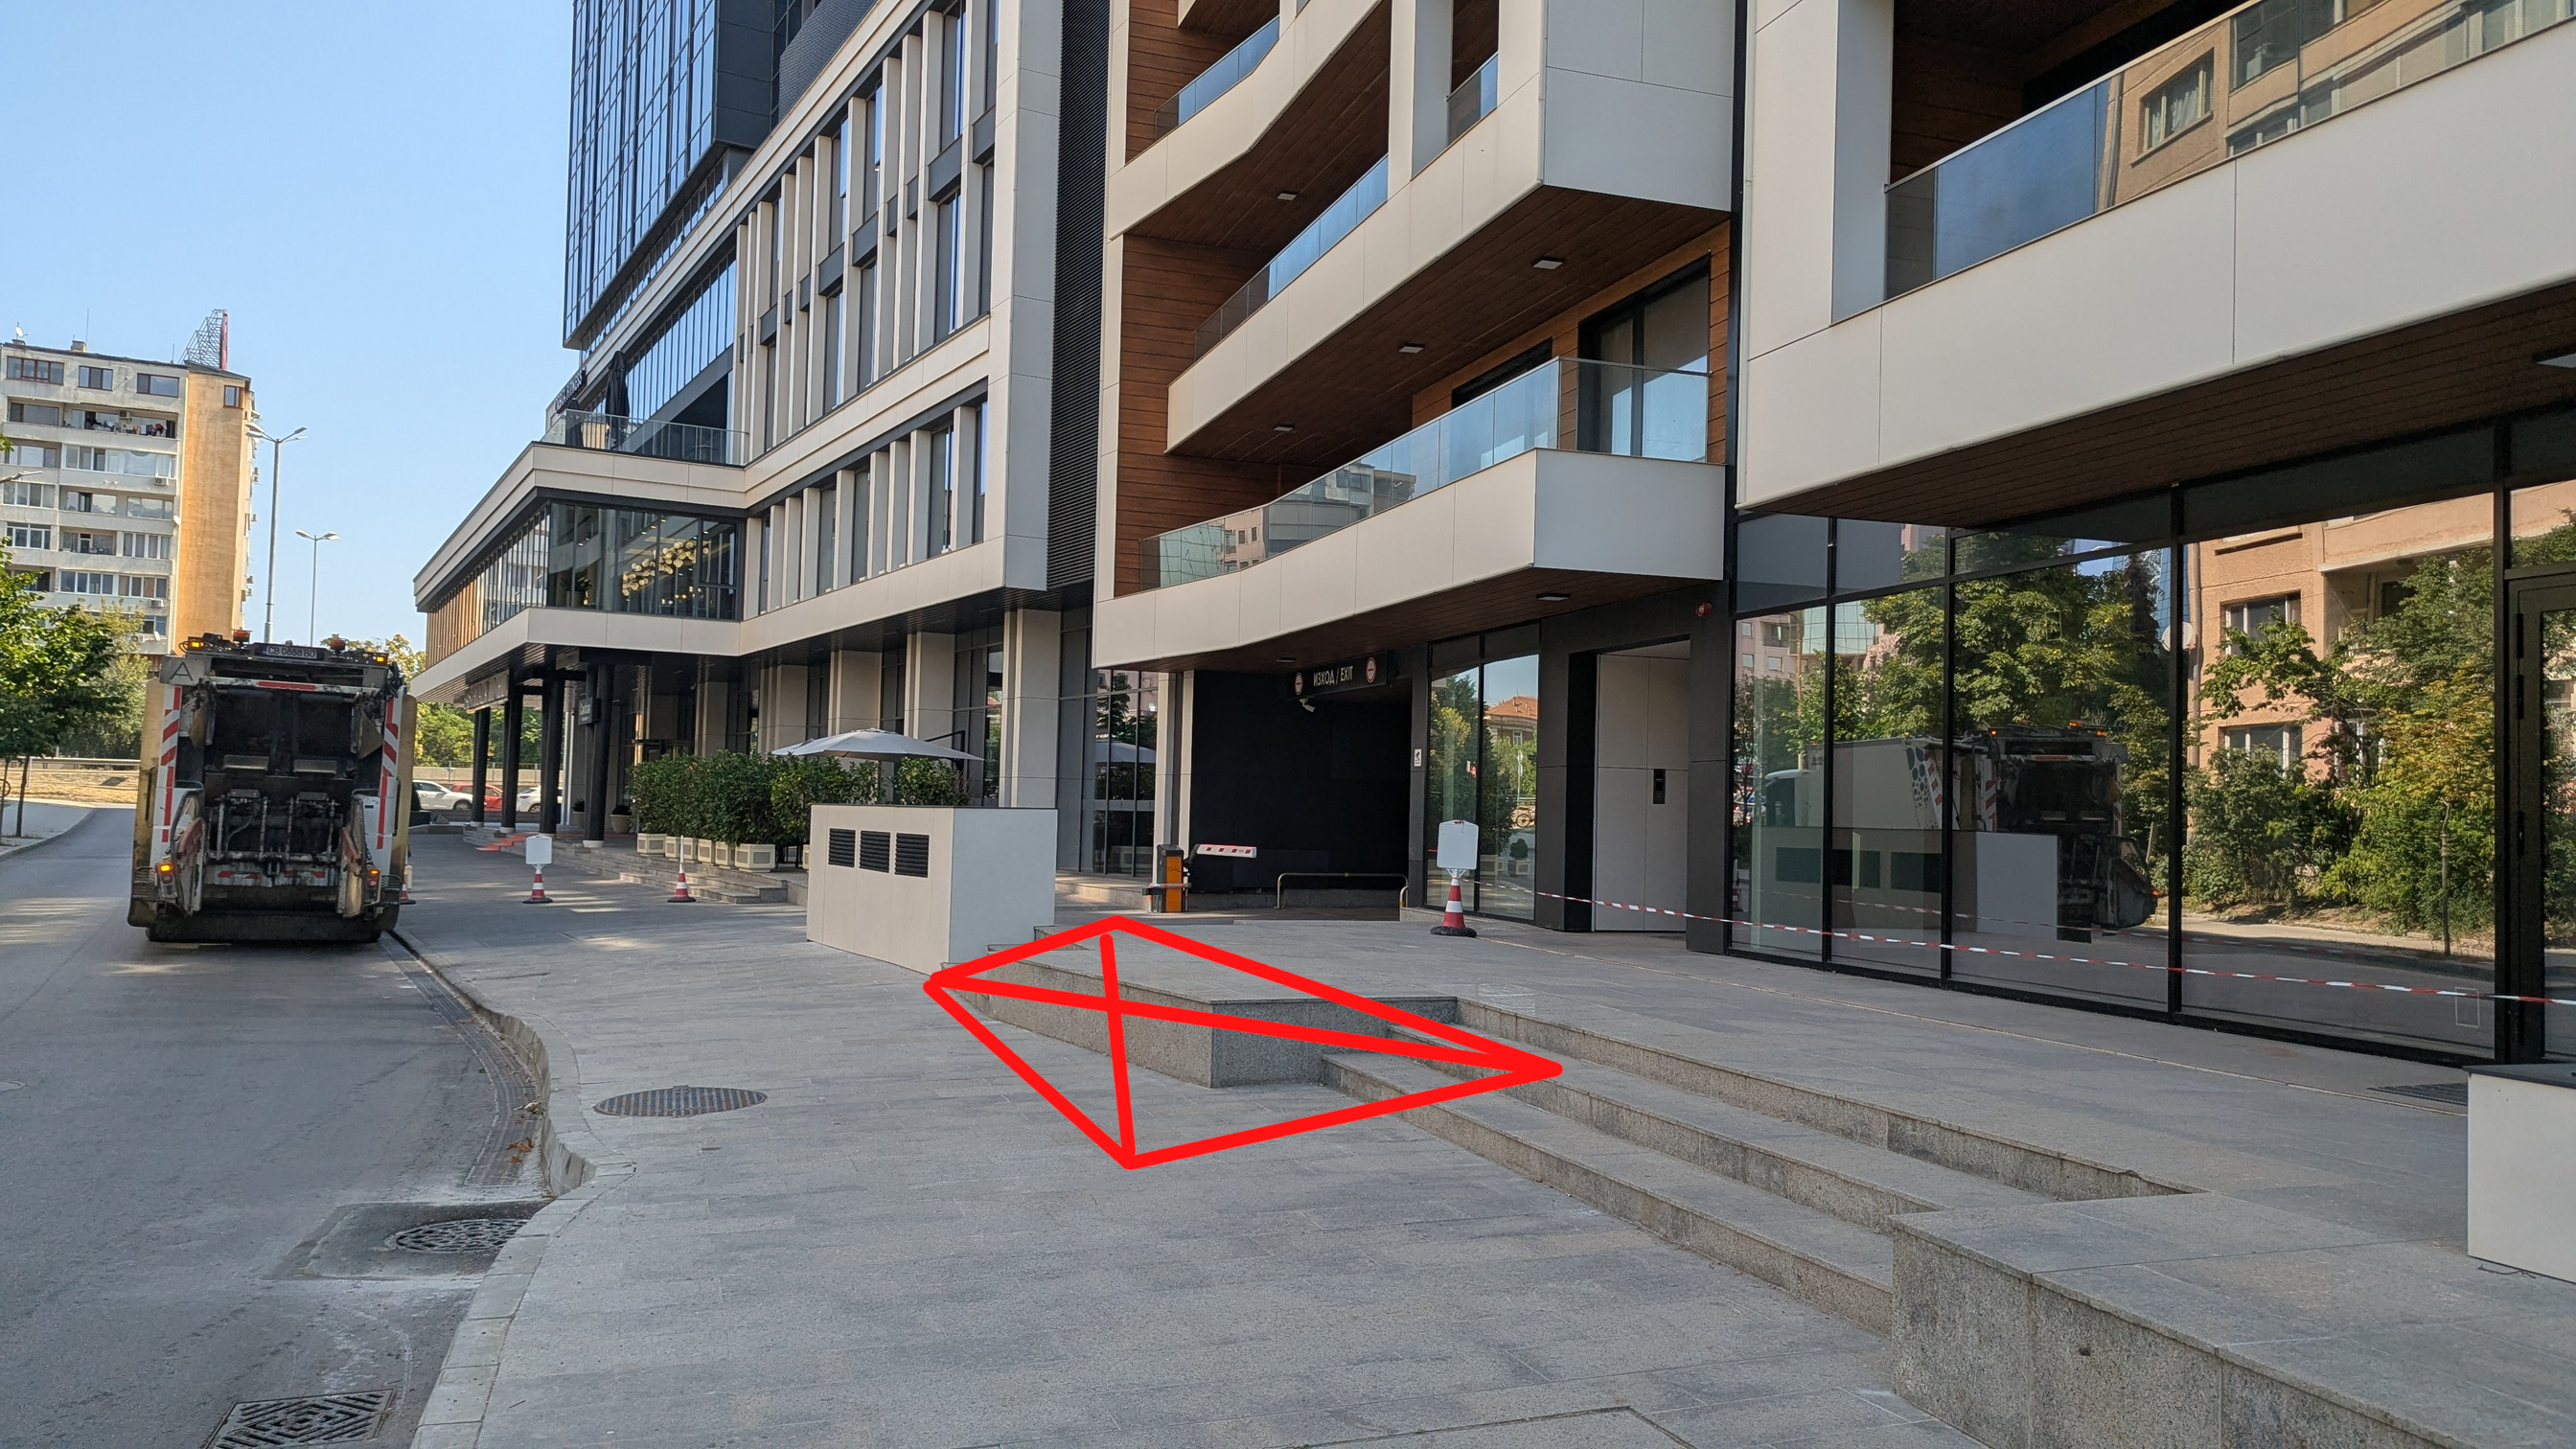



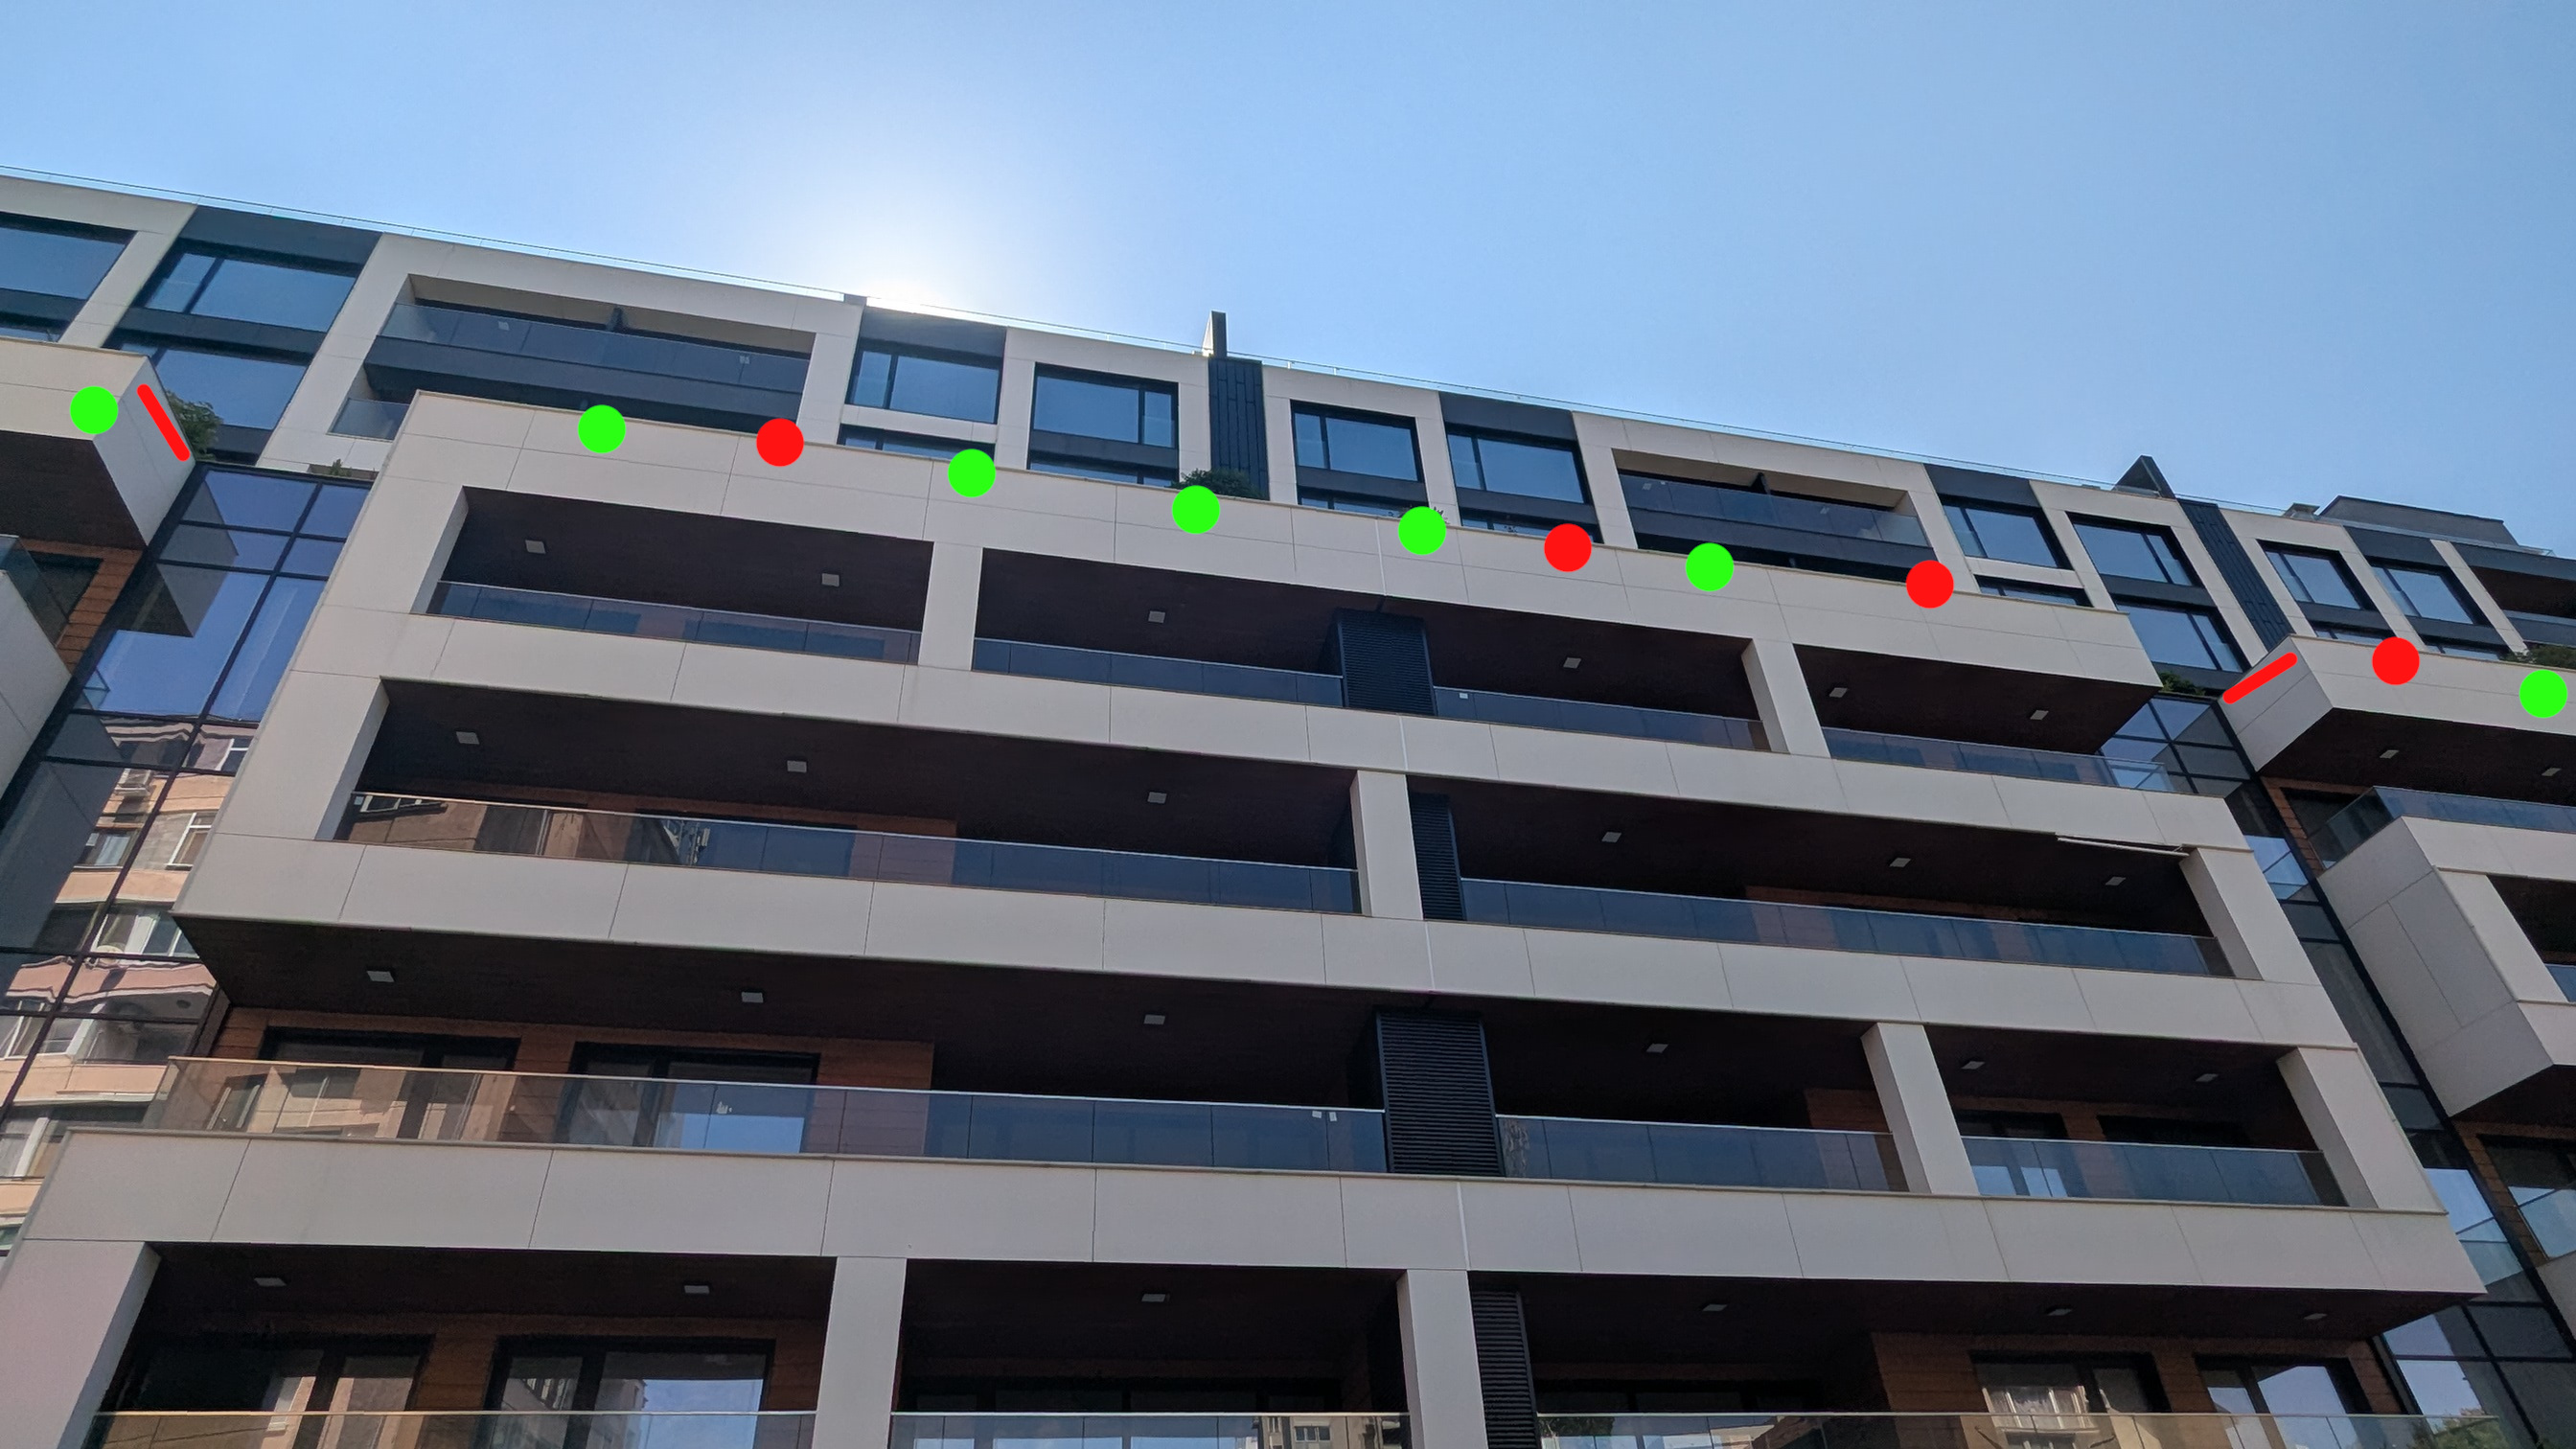







Тук фрапантното нарушение е друго. За да постигнат дори малкия дял от 33.28%, тази сграда залага много на вертикално озеленяване. Това значи увивни и други растения, които покриват няколко пероги, вертикално по огради и стени на сградата. Общо в плана има 7 такива места, които да допринасят цели 48% от общия коефициент на озеленяване.
На място не виждаме нито едно от тези вертикални озеленявания. На снимка 3 виждате озеленяване, което трябва да е значително по-високо по оградата, но представлява ниски храсти с почвен слой от около 20 см. На снимки 4 и 11 виждате нещо, което е трябвало да бъде перога покрита изцяло в зеленина допринасяйки над 350 кв.м. към общото озеленяване. Това включва както по самата конструкция, така и вертикално на оградата пред нея и пълзяща още 160 кв.м. по стените наоколо. На снимка 12 виждате, че над дърветата по план е трябвало да има още озеленяване, вероятно на мястото на терасите, както и пълзящо по стените. На снимка 24 виждате място, където е трябвало да има над 120 кв.м. вертикално озеленяване по същия начин върху перога, което липсва.
Така изпълненото озеленяване не надвишава 20% дори с много уговорки за недостатъчния почвен слой. В края 2024, но преди пускането в експлоатация имаше сигнал, че почти готовата сграда видимо не може да отговаря на изискванията на озеленяване, че кашпите са твърде малки и плитки, а дърветата и храстите няма как да оцелеят и да се развият. Тогава отговорът от районната администрация беше, че щели да видят като е готово. Месец по-късно са подписали протокол като част от приемателна комисия, че всичко е наред. Поисках този протокол като административен акт на публична институция, но районната община ми отговори, че го нямали, което не би следвало да е вярно. Поисках го от ДНСК, които също отказаха, защото засягало интересите на инвеститора, а той изрично отказал да бъде публикуван. Обжалвах това решение в съда и предстои заседание.
Под тази сграда ще минава скоро новият Зелен ринг. Липсата на озеленяване и способност да се задържа дъждовна вода означава, че рингът ще се превръща в река. Това вече се случва постоянно на улицата пред въпросния хотел. При последните дъждове беше толкова зле положението, че зеленикавата вода влезе право във фоайето на хотела (снимки 29 и 30). Въпросната отсечка от улица Тинтява, но само до входа на гаражите на въпросния хотел, както и паркът срещу хотела (снимки 27 и 28) бяха ремонтирани приоритетно с публични средства от районната община. На въпроси от жителите на района беше настоявано, че няма връзка. Същият хотел има проблем и с огромният видео билборд, който е незаконен по три различни начина (снимка 26). Сигналите към районният кмет отново остават без отговор.
Какво от това?
Това са само два примера, но типични за новото строителство в София и в цялата страна. Често изниква въпросът има ли възможност да се засичат тези проблеми още докато се строи сградата. Отговорът често е да. Доколкото озеленяването се „забожда“ и „постила“ малко преди пускане в експлоатация, много преди това се разпознават плитките кашпи, бетонните плочи на нивото на бъдещата зелена площ, липсата на резервоари за дъждовна вода или въобще място за дървета. Затова в следващата част ще споделя два примера на строящи се сгради с подобен преглед и сравнение с плана им.
Несъмнено задължение е на приемателната комисия да разпознае тези проблеми предвид, че има експерти в нея. От примерите виждаме, че това не се случва. Натрупването на такива случаи води пряко и непряко до доста от проблемите в градска среда, включително риск за безопасността и здравето на хората. Никой строеж сам по себе си не е виновен за това, но в съвкупност общото нехайство, неспазване на изискванията и дори грубо нарушаване на закона прикривани със съмнения за корупция допринасят до това, което наричаме презастрояване.
Разбира се, единствено циничността като типично българско качество ни води към предположението, че е намесена корупция. Не може да твърдим, че подобни практики е имало при който и да е от описаните тук примери. Ако прочитът ми на документите е неправилен, което би било също разумно предположение, то не може да говорим дори за административно нарушение, с което се изчерпва личното ми мнение относно разминаването между видяното на място и плановете, до които ми беше даден достъп.
Очаквайте утре следващата част от темата с още такива примери. В първата част от серията бях описал трудностите да стигна до тези документи.
AI IR Overlay – Incident Response Specification for AI Agents
Post Syndicated from Darknet original https://www.darknet.org.uk/2026/08/ai-ir-overlay-incident-response-specification-for-ai-agents/
AI IR Overlay specifies containment for agents using valid credentials, with a working kill-switch contract and an admitted gap when no SOC is staffed.
Launchpad
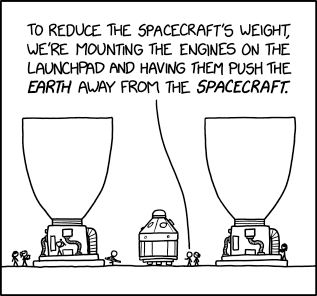
Post Syndicated from xkcd.com original https://xkcd.com/3291/
Data Mesh at Grab (Part III): Operationalizing data reliability with automated DPIs
Post Syndicated from Grab Tech original https://engineering.grab.com/data-mesh-at-grab-part-three
Introduction
In the first two parts of this series, we described how Grab approaches data mesh through the Signals Marketplace: a way for teams to publish, discover, and reuse trusted data products across domains. Part II introduced the foundational tools behind certification: Hubble for metadata and ownership, Genchi for data quality observability, and the Data Contract Registry for explicit producer-consumer guarantees.
Certification is the starting point for a trusted data marketplace. It gives downstream consumers confidence in an asset’s ownership, documentation, lineage, and quality controls. Certification does not eliminate runtime failure. A certified table can still arrive late. A certified metric can still be affected by a broken dependency. A certified Kafka stream can still violate a freshness expectation.
Keeping certified data products reliable in production requires more than defining standards upfront. Teams need a consistent way to detect failures, diagnose the root cause, fix the issue, and verify recovery. That is where Data Production Issues (DPIs) come in. At Grab, DPIs turn data quality signals into an operational workflow.
The DPI lifecycle
A good DPI should be clear enough to act on, and it should close automatically when the underlying condition recovers. From the beginning, we designed the DPI lifecycle to be automated, with minimal human-in-the-loop.
The lifecycle starts when Kinabalu, Grab’s incident orchestrator, observes that a data asset may no longer satisfy its contract. The contract captures the reliability expectations that matter for the asset, along with the health checks, exposed through Test Health application programming interfaces (APIs), that evaluate those expectations.
The orchestrator stays decoupled from platform internals. It does not need to know how each platform computes freshness, completeness, or other quality dimensions. It only needs to ask whether the relevant contract tests are healthy. If one or more contract tests are unhealthy, the contract is considered breached, and the DPI lifecycle begins.
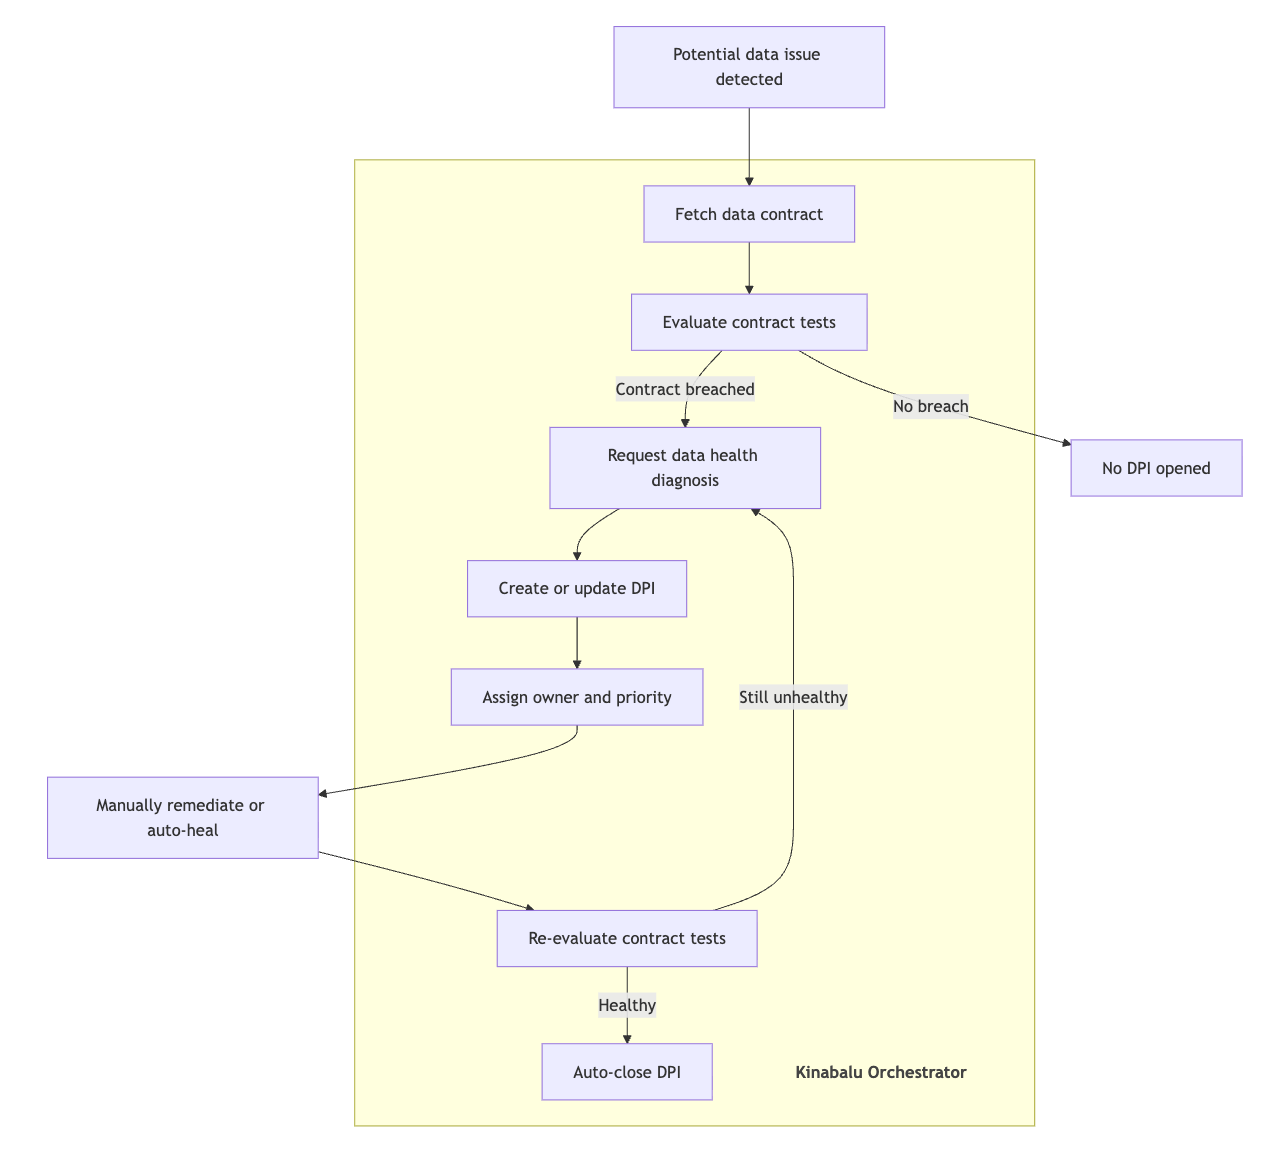
Triaging DPIs: From alerts to confirmed contract breaches
Data platforms emit many alerts. An Airflow schedule may be delayed, a data quality test may fail, or a pipeline job may exit unexpectedly. These alerts are useful, but they are not automatically DPIs. Triage decides whether an alert represents a real contract breach for a data asset.
As introduced in Part II, a data contract is an explicit, versioned agreement between a data producer and its consumers. It outlines the data’s schema, freshness, completeness, and other semantic guarantees. These guarantees are codified and enforced through data quality tests in Genchi.
When the incident orchestrator evaluates contract tests, it distinguishes an individual test run result from the overall health of a test. A test run can pass or fail at a point in time, but the test itself may only be considered healthy after the underlying issue has been fully resolved. For example, consider a completeness test that checks whether the T-1 daily partition is complete. If the test failed two days ago but passed yesterday and today, the test may still be considered unhealthy until the partition from two days ago has been backfilled and verified as complete.
The orchestrator also deduplicates around the active unhealthy condition. If an asset already has an open DPI for the same breach, new signals update the existing DPI with additional context rather than creating parallel issues. DPIs that share the same underlying root cause can also be grouped. This keeps responders focused on solving the underlying issue rather than chasing a stream of repetitive alerts.
During triage, the workflow also gathers context for the DPI: affected asset, breached contract, unhealthy tests, data interval, and upstream and downstream dependencies. Not every alert becomes a DPI. Triage protects the operational workflow from noise by promoting only meaningful contract breaches into production issues.
Diagnosing DPIs: Assigning owners with root cause analysis (RCA)
Once a DPI is created, the system must answer why the data is unhealthy, who should fix it, and how.
Not every data issue should be assigned to the data asset owner. A data product may be unhealthy because of a platform incident, a failed producing job, or a delayed upstream dependency. Assigning every issue to the asset owner creates unnecessary handoffs and slows down resolution.
This is where the Data Health API matters. It answers the question: “What kind of failure made this asset unhealthy?” The Data Health API keeps the error taxonomy small:
UPSTREAM_ERROR: the asset is unhealthy because an upstream dependency is late, failed, or unavailable.PLATFORM_ERROR: the asset is unhealthy because the underlying platform or infrastructure is impaired.JOB_ERROR: the asset is unhealthy because the producing job or pipeline failed.DATA_ERROR: the asset is unhealthy because the produced data violates quality expectations.
The taxonomy is not meant to replace platform-specific diagnostics. The high-level Data Health API gives the orchestrator just enough structure to assign DPIs and manage their lifecycle consistently. An ingestion platform, streaming platform, metrics platform, or machine learning (ML) platform can still maintain detailed internal error catalogs, logs, retry states, and debugging tools. Platforms remain free to evolve their internals, while the incident orchestrator consumes a stable API contract, so the DPI workflow can interoperate across heterogeneous systems.
A simplified Data Health API response might look like this:
Disclaimer: The fields in this API response are mock data generated for demonstration purposes and do not represent real operational metrics.
{
  "assetId": "urn:li:dataset:(urn:li:dataPlatform:hive,schema.table_A,PROD)",
  "healthStatus": "UNHEALTHY",
  "errorCategory": "UPSTREAM_ERROR",
  "context": {
    "upstreamAsset": "urn:li:dataset:(urn:li:dataPlatform:hive,schema.table_B,PROD)",
    "reason": "upstream data has not arrived for the expected data interval."
  },
  "lastCheckedAt": "2026-06-15T08:30:00Z"
}
From this response, the orchestrator can see that table_A is unhealthy because of an upstream dependency rather than a problem in the asset itself. It then traces the active DPI for the upstream asset and links the table_A DPI to that upstream issue. The downstream DPI can inherit the same owner as the upstream DPI, keeping related failures grouped under the team best positioned to resolve the root cause.
The DPI process works only when the issues it raises can be assigned and fixed. If DPIs are frequently noisy, duplicated, or difficult to act on, users will eventually learn to ignore them. Diagnostic accuracy matters because it keeps DPIs useful for the people who receive them. It also creates a forcing function for each data-producing platform to improve its diagnostics. To produce accurate RCA, platforms need to incorporate signals from their dependencies and surrounding systems, not just their own local failure state.
Grab operationalizes DPI diagnosis across its internal data platforms. Our ingestion platform, Hugo, is a primary example of this approach, as outlined in a previous tech blog. Hugo’s intelligent diagnosis architecture uses a three-layered system to automatically detect, analyze, and troubleshoot data pipeline failures within its domain, as shown in Figure 2.
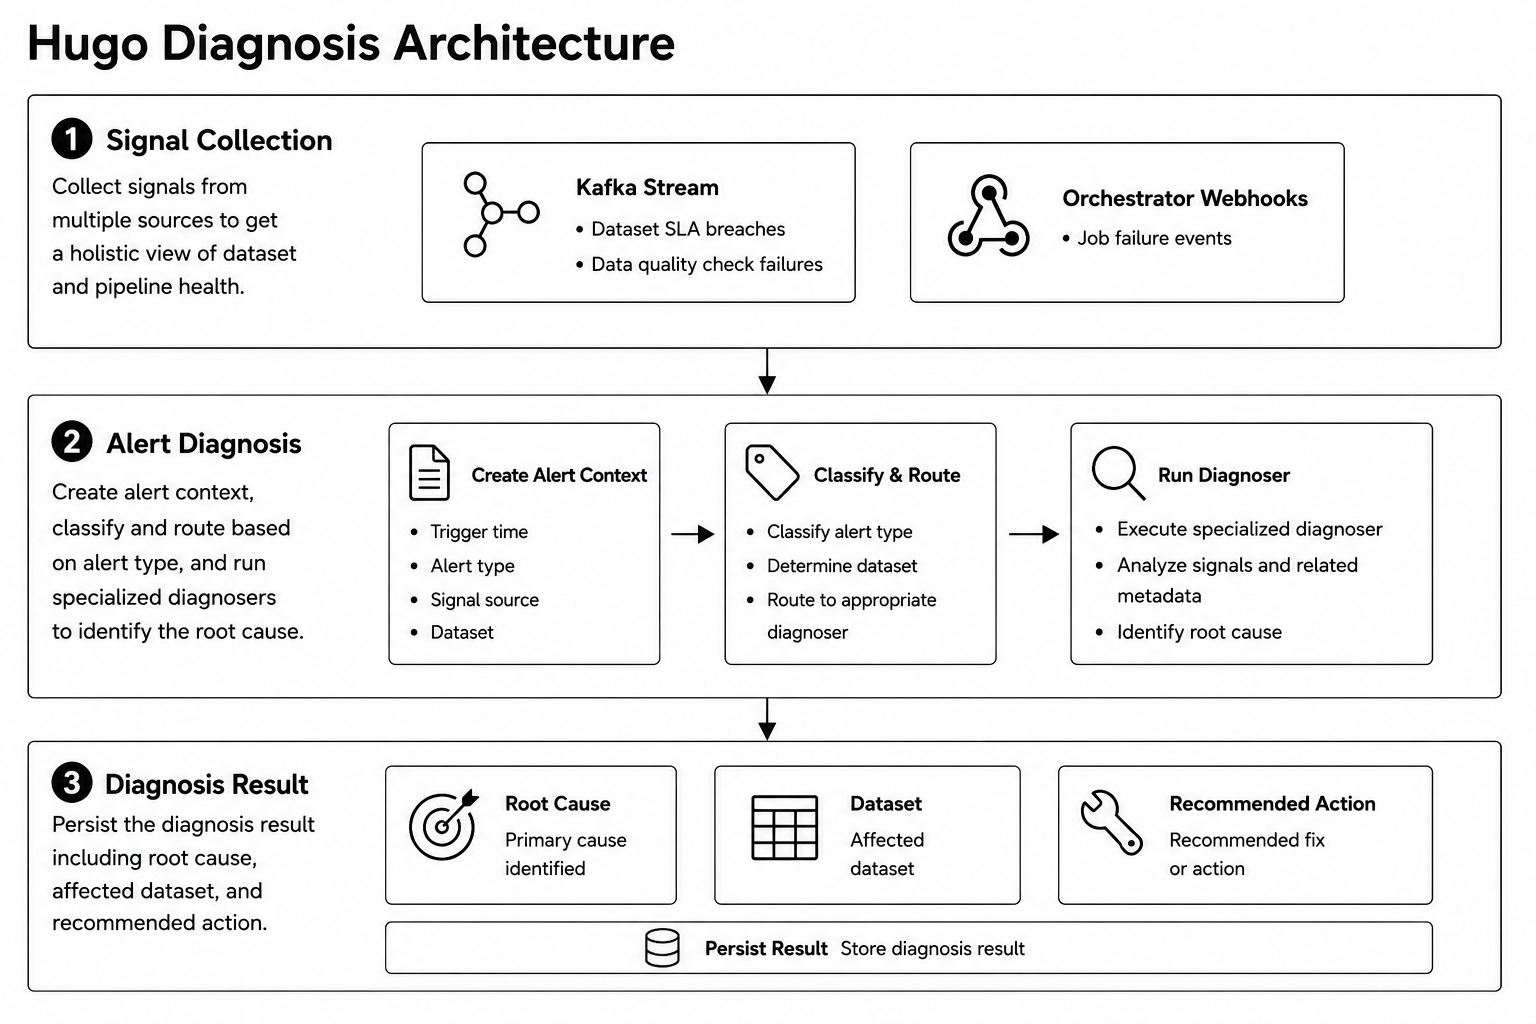
Modern data platforms generate alerts from many independent systems. Individually, these signals show only a partial view of a dataset. Hugo consolidates platform-specific signals into a unified diagnostic workflow to pinpoint root causes and recommend pipeline remediations. The diagnosis architecture consists of three stages:
- Signal collection collects events from multiple signal sources to build a full view of the dataset and pipeline health.
- Alert diagnosis creates a structured alert context, classifies the alert, routes it to the appropriate diagnoser, and identifies the root cause using specialized diagnosis logic.
- Diagnosis result persists the structured diagnosis output, including the identified root cause, affected dataset, and recommended fix or action.
For example, when a dataset fails, the workflow orchestrator notifies Hugo with a job failure event. Hugo then routes the alert to its internal diagnostic layer to check for conditions such as upstream database replica lag, storing both the diagnosis and recommended fix alongside the affected dataset.
Decoupling signal ingestion, diagnosis, and result management makes it straightforward to add new signal sources and specialized diagnosers. Immediate RCA removes the need for manual log inspection, which shortens remediation and feeds directly into automated resolution workflows.
Resolving DPIs: Auto-healing first, human judgment when needed
After triage and RCA, the final stage of the DPI lifecycle is resolution. The lifetime of a DPI is a proxy for data downtime: it begins when a contract breach is detected and ends when the affected dataset becomes healthy again. Reducing that window requires more than identifying the correct issue. It also depends on recovering safely and consistently from recurring failure modes.
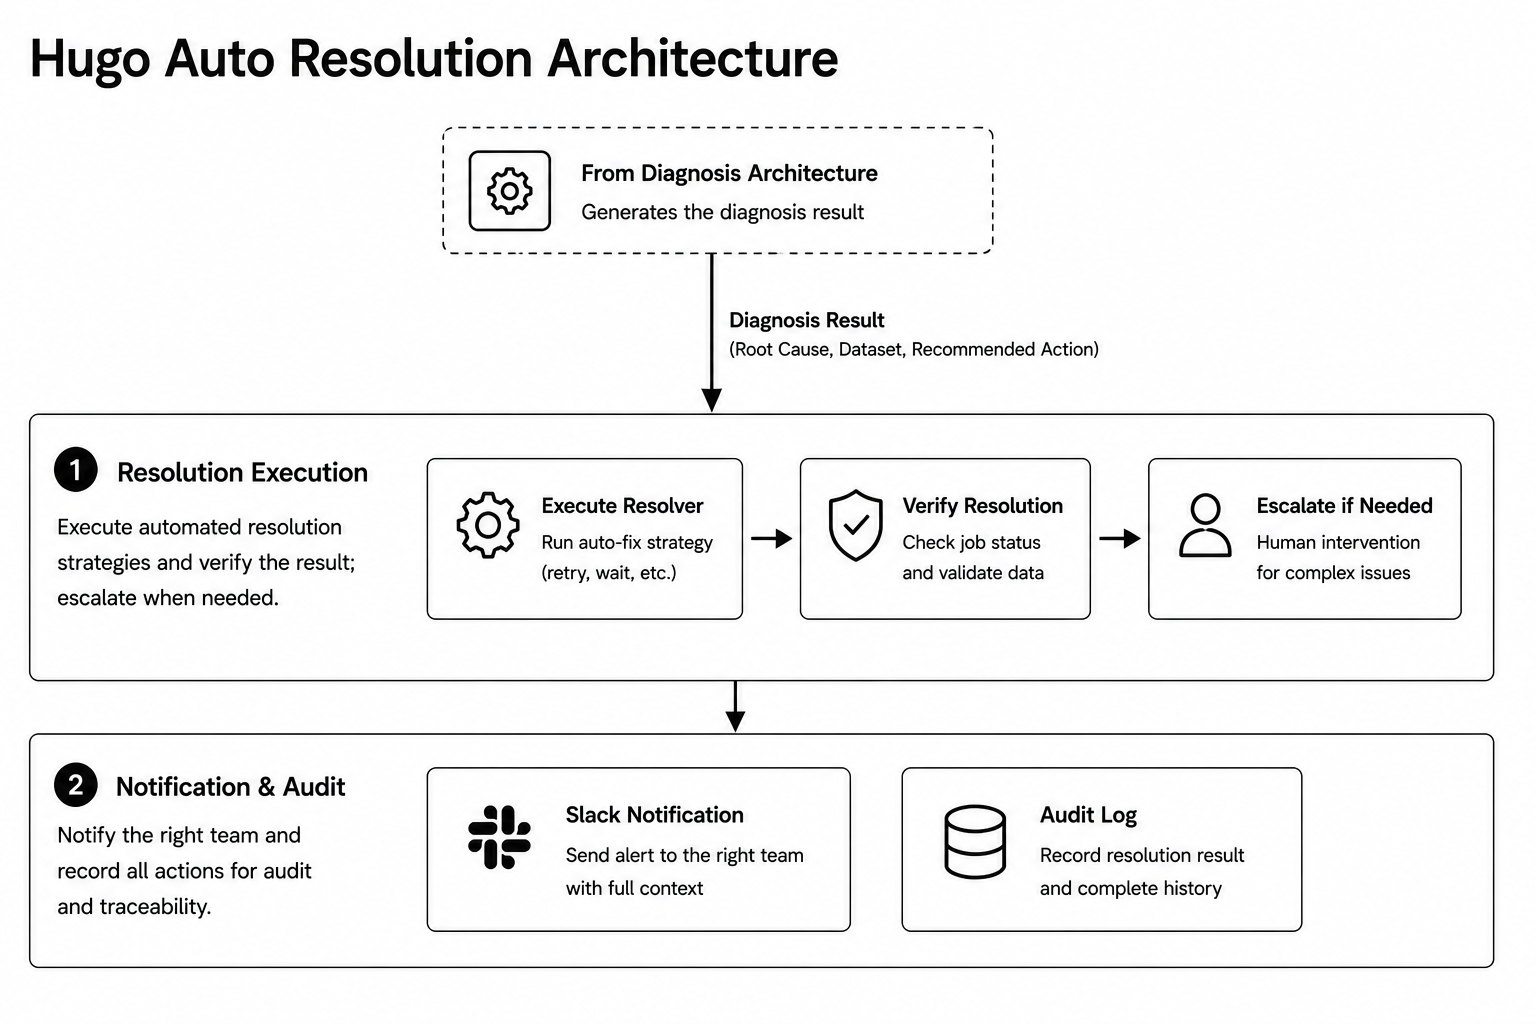
Many incidents are routine and recoverable, such as transient compute interruptions, database connection timeouts, S3 throttling, or upstream pipelines that are delayed rather than permanently broken. Instead of relying on manual intervention for every incident, Hugo automates recovery for these well-understood failure patterns. Once the diagnosis workflow identifies the root cause, it produces a structured diagnosis result containing the affected dataset, the root cause, and the recommended resolution strategy. The auto-resolution workflow then consumes this result to execute the appropriate remediation automatically. Figure 3 shows Hugo’s auto-resolution architecture in two stages.
-
Resolution execution applies the recommended resolution strategy, such as retrying a failed job, waiting for an upstream dependency, or executing a custom resolver. After the action completes, the system verifies both pipeline health and data correctness to confirm the issue has been fully resolved. If a failure cannot be resolved safely through automation, such as in cases of data corruption, invalid records, or application code defects, the workflow escalates the incident for human intervention.
-
Notification and audit records every resolution attempt and its outcome, while notifying the appropriate engineering teams. That record supports operational analysis, auditing, and later improvements to resolution policies.
For example, a dataset may miss its freshness Service Level Agreement (SLA) because the workflow orchestrator becomes temporarily unresponsive and fails to submit the scheduled ingestion job. The diagnosis workflow identifies the incident as a pipeline execution failure and recommends a retry strategy. Hugo automatically retries the job, verifies that the pipeline completes and data health is restored, then logs the recovery and notifies the responsible team. This end-to-end process, from incident detection to resolution, runs automatically without manual intervention.
Hugo closes the loop between detection, diagnosis, and recovery. Rather than stopping at identification, the platform turns diagnosis results into targeted remediation, so routine operational issues can be resolved automatically while preserving human oversight for complex or high-risk incidents. Separating diagnosis from execution also lets new diagnosis capabilities and resolution strategies evolve independently without changing the overall architecture.
The impact is already evident in production. 86.9% of DPI incidents were automatically resolved, significantly reducing manual operational effort. By automating routine recoveries, engineers spend less time performing repetitive operational tasks and more time building new platform capabilities, while overall data downtime is significantly reduced.
Conclusion
Certified data products still need to prove their reliability in production. Freshness delays, upstream failures, platform incidents, and data quality violations can all break consumer trust, even when an asset has already met certification standards.
Automated DPIs are the operating model for managing these failures. By turning contract breaches into structured production issues, the DPI lifecycle makes data reliability operational: triage separates real breaches from alert noise, diagnosis identifies the likely failure domain, ownership routing reduces handoffs, and resolution closes the loop through auto-healing or human intervention when needed.
The most important outcome is not simply that issues are detected faster. It is that data downtime becomes visible, measurable, and reducible. With every DPI tracked from detection to recovery, teams can understand where time is spent, which failure modes repeat, and where automation can safely reduce operational toil. To date, more than 95% of DPIs are raised automatically rather than by humans, with a mean time to resolve (MTTR) that is 6 times faster for automated DPIs than for manually raised ones.
For Grab, this shifts data reliability from reactive firefighting to a managed production workflow. Automated DPIs help keep trusted data products trustworthy after certification, so downstream teams can depend on them with greater confidence.
What’s next
Across the three-blog series, the story is how Grab turns data mesh from an operating principle into an artificial intelligence (AI)-ready foundation for the company.
-
Part I: Building trust through certification. Grab needed the Signals Marketplace because the business had scaled across mobility, deliveries, financial services, and many data-producing domains. The old model of relying on a central Data Engineering team could no longer keep up. Certification became the mechanism for making high-quality data products visible, reusable, and accountable. With clear ownership, data contracts, and measurable adoption, Grab moved more consumption toward trusted assets, reduced duplication, and created stronger incentives for teams to curate the data they publish.
-
Part II: The foundational tools behind certification. Trust becomes operational through platforms. Hubble covers discovery, lineage, ownership, and the certification engine. Genchi runs continuous data quality observability across freshness, completeness, schema, and business-rule checks. The Data Contract Registry formalizes producer-consumer expectations as versioned, enforceable contracts. Combined, these systems keep data certification an actively maintained standard rather than a static label.
-
Part III: Operationalizing data reliability with automated DPIs. Certification tells consumers which data products should be trusted; DPIs keep that trust true in production. Kinabalu evaluates contract breaches, deduplicates noisy alerts, assigns ownership, and tracks recovery. Data Health APIs make RCA portable across platforms, while Hugo’s diagnosis and auto-resolution patterns show how common failures can be remediated faster and with less operational toil. The result is a measurable reduction in time to resolve and a stronger feedback loop back into certification.
The bigger takeaway is that Grab’s data moat is not just the volume of data we have. It is the system that makes our data trustworthy, discoverable, reusable, and continuously reliable. This foundation is what lets us embrace the agentic world: AI agents can search certified assets, reason over contracts and lineage, trust quality signals, detect production issues, draft RCA, and eventually suggest or execute safe remediation. In that world, data reliability becomes a compounding advantage. The better our foundations are, the more confidently Grab can build agentic experiences on top of them.
We would like to thank all the data practitioners across Grab, including engineers and analysts to data scientists and product teams, who have invested in certification, contracts, and data quality to build a solid foundation for AI agents and AI-powered experiences. We are equally grateful for the unwavering sponsorship, strategic guidance, and hands-on support from our leadership (Mohan Krishnan and Nikhil Dwarakanath), without which this long-term data foundation initiative would not have been possible.
Join us
Grab is Southeast Asia’s leading superapp, serving over 900 cities across eight countries (Cambodia, Indonesia, Malaysia, Myanmar, the Philippines, Singapore, Thailand, and Vietnam). Through a single platform, millions of users access mobility, delivery, and digital financial services, including ride-hailing, food delivery, payments, lending, and digital banking via GXS Bank and GXBank. Founded in 2012, Grab’s mission is to drive Southeast Asia forward by creating economic empowerment for everyone while delivering sustainable financial performance and positive social impact.
Powered by technology and driven by heart, our mission is to drive Southeast Asia forward by creating economic empowerment for everyone. If this mission speaks to you, join our team today!
Bill Gates On His Interactions with Jeffrey Epstein
Post Syndicated from The Atlantic original https://www.youtube.com/shorts/tNTROyZ5G_U
What Dolly Parton Meant to the South by Annie Joy Williams
Post Syndicated from The Atlantic original https://www.youtube.com/shorts/Ge-xC9Wup5k
Atlantic Archives: Du Bois and Washington
Post Syndicated from The Atlantic original https://www.youtube.com/watch?v=a547sd2pJU0
How we saved 100 terabytes of memory by optimizing 1.1.1.1’s DNS cache
Post Syndicated from Sebastiaan Neuteboom original https://blog.cloudflare.com/dns-cache-memory-optimization-1111/
Big Pineapple, the platform behind 1.1.1.1, Gateway DNS, DNS Firewall, AS112, and several other Cloudflare DNS services, stores over 250 billion DNS cache entries at any given time. At that scale, wasting a single byte per entry costs more than 250 gigabytes of memory across our fleet.
Five successive changes to how cache entries are stored in memory cut the per-entry footprint by over 50%. Across our fleet, these changes freed up roughly 100 terabytes of memory, equivalent to the amount of RAM in 130 of our Gen 13 servers. The cache also got faster. Insert throughput rose 43% and lookup latency dropped 19%, as fewer allocations and better memory locality meant we did not trade speed for space.
What we cache
On cold start, Big Pineapple starts out with an empty cache. As DNS queries arrive, the cache fills until it hits its maximum entry count, at which point we evict older or less popular items to make room.
The exact cache size varies by data center. When EDNS Client Subnet (ECS) is in use, authoritative servers return different answers depending on the client's network, so we cache multiple versions of the same query. This increases both the number of entries and the memory each one consumes, making the optimizations in this post especially impactful for ECS-heavy locations.
Each item in the cache is a key-value pair. The key identifies what was queried:
The value stores the DNS response itself: the answer, authority, and additional record sections, along with metadata like the creation time, a hit counter, and the Time-to-Live (TTL).
Both structs have room for improvement. Several fields use types that carry overhead we don't need once the entry is stored.
Benchmarking memory usage
To measure the impact of each change, we benchmark by filling the cache with randomly generated entries that roughly match the traffic distribution we see in production: 56% A records, 25% AAAA, and 19% TXT. Each entry contains between one and four records.
TXT records serve as a stand-in for all non-A/AAAA record types in the benchmark. Their size is randomized between 64 and 224 bytes, close to the average response size we see for variable-length record types.
We track memory usage using a custom allocator that wraps Rust’s System allocator and records the number and size of allocations per cache entry. Alongside memory, we measure insert throughput and lookup latency across the full cache flow to make sure memory savings don’t come at the cost of performance.
These inputs approximate production rather than reproduce it exactly. Process memory also depends on traffic mix, cache occupancy, allocator state, and memory used outside the cache. We therefore measured resident memory across production instances during the rollout.
The cost of capacity
Vec<T> stores three fields: a pointer to heap-allocated data, the current length, and the total capacity. When you push an item, Vec checks whether the length exceeds the capacity and reallocates if needed. If there’s room, it just appends the item and increments the length.
Once we store a DNS response in the cache, however, we never modify it again. The capacity field serves no purpose, but still costs 8 bytes per Vec. The over-allocated heap space is wasted as well, as a Vec with capacity for eight items but only five stored leaves three slots unused on the heap.
Using Box<[T]> solves both problems. It can’t grow after creation, so it doesn’t need a capacity field or reserve space for future elements. The same applies to String, which also carries a capacity field. Box<str> drops it.
Each cache entry stores 8 Vec and String fields. Replacing them with Box<[T]> and Box<str> saves 8 bytes per field, 64 bytes per entry. It also eliminates the excess heap memory that Vec reserves for future growth. The combined savings add up to over 15 terabytes with over 250 billion cache entries.
Fewer lists, fewer pointers
Rather than storing the answer, authority, and additional sections in separate lists, we can store a single list with offsets to the start of each section. Since DNS record counts per section fit in a u16, we can use a u16 (2 bytes) for each offset, compared to the 8-byte pointer and 8-byte length that each separate Box<[T]> requires.
This removes two lists, each with an 8-byte pointer and 8-byte length, and replaces them with two 2-byte offsets, saving 28 bytes per entry.
These savings do not always map directly to the number of bytes removed from individual fields. Rust inserts padding to satisfy alignment requirements and rounds a struct’s size up to a multiple of its alignment. Removing a small field can therefore eliminate additional padding. For example, we also packed several boolean fields into a single bitflag. This reduced the surrounding padding, causing the struct to shrink by more than the size of the individual booleans.
Dropping the owner
Each DNS record has an owner, the domain the record belongs to. In many cases, this owner is identical to the domain being queried. For example, a query for example.com A returns two records with the same owner:
But when a CNAME is involved, for example, the record owner can differ from the queried domain:
The DNS wire format handles repeated owners using name compression, as defined in RFC 1035. Rather than encoding the same domain twice, subsequent occurrences store a 2-byte pointer to the first occurrence. A domain like www.example.com can encode just www followed by a pointer to where example.com already appeared in the message.
This works well on the wire, but in our cache we store the full owner name alongside each record. Following compression pointers during cache lookups is expensive on the hot path, so we trade memory for speed.
Most records, however, have an owner identical to the queried domain. For those, we can drop the owner entirely and infer it at read time. When the owner differs, such as the A records behind a CNAME, we store the full name.
When owner is None, response construction restores the queried domain from the cache key, avoiding a heap allocation. This means the record is no longer self-contained, but the cache key is already available during every lookup. When the owner differs, Some stores a pointer to the full name on the heap.
In practice, most cached records have an owner identical to the queried domain, so the majority require no heap allocation for the owner field.
Enum sizing
Rust enums are sum types: each variant can carry different data, but the enum is always the size of its largest variant.
Option is either Some and holds a value, or None and holds nothing. Both variants take the same amount of memory. The enum stores a tag indicating the active variant, followed by space large enough for the largest variant’s data. When the variant is None, that space is unused.
For record data, it seems natural to store each DNS record type as an enum variant:
But the enum is always as large as its largest variant. In our case, that’s NAPTR at 136 bytes. It stores three variable-length text fields, a domain name, and two integers. As a result, the full enum, including the variant tag and padding, becomes 144 bytes.
An A record only needs 4 bytes, and an AAAA record needs 16 bytes. A and AAAA make up over 80% of our traffic, so most records waste over 120 bytes on padding. Since a single cache entry can store many records this quickly adds up.
Boxing the variants
To solve this problem, we can box the larger variants of the enum, moving them to a separate heap allocation. The enum then stores an 8-byte pointer to the heap, where the data takes up only the size it actually requires.
For A and AAAA records, this saves 120 bytes per record. Smaller variant types like TXT and CNAME also benefit. They still occupy the 24-byte enum, but their heap allocation is sized to their actual data rather than padded to 144 bytes. NAPTR, the largest variant, actually pays slightly more. It now adds the cost of a heap pointer and allocation overhead. But NAPTR records are rare in practice, so the tradeoff is worth it.
But boxing the larger record variants introduces costs of its own.
The costs of boxing
Boxing has two costs. The first is allocator overhead. Each boxed variant becomes a separate heap allocation, and allocators round up to the nearest size class. Big Pineapple uses jemalloc, an allocator designed for multithreaded, allocation-heavy workloads. jemalloc groups allocations of similar sizes into fixed-size bins. A TXT record requests 32 bytes and fits exactly into a 32-byte bin, wasting nothing, but an MX record requests 40 bytes and rounds up to 48, wasting 8 bytes.
The second cost is poor memory locality. Without boxing, the record enum values for a cache entry sit in a single contiguous allocation. With boxing, data for each boxed variant lives in a separate heap region. Reading it requires following a pointer, and when that pointer lands far from the rest of the entry, the CPU has to fetch a new cache line. With millions of cache entries, boxed data ends up scattered across the heap rather than packed together.
Neither cost is catastrophic on its own, but eliminating both, as the next section shows, yields a measurable improvement in both memory usage and lookup latency.
Storing records in wire format
An obvious next step would be to store the full DNS response in wire format, patching only per-client fields like the message ID on each lookup. But this has drawbacks. DNSSEC records are only included when the client sets the DO (DNSSEC OK) flag. Storing a complete wire format message means either caching two variants, one with DNSSEC and one without, or filtering them out of an already-built message. There is also a cost to parsing the full message on every lookup, which the enum approach we just described avoids by storing already-parsed records.
As a middle ground, we store just the record data as raw bytes, while keeping the rest of the cache entry as structured fields. Instead of a list of parsed enum variants, we store the records as a single Box<[u8]> containing each record encoded as a 2-byte length prefix followed by its raw bytes.
This eliminates the per-variant enum overhead and the boxed heap allocations from the previous optimization. The data also becomes packed contiguously, which improves CPU cache locality. The tradeoff is that records can no longer be randomly indexed. We have to iterate through the buffer sequentially. This adds some complexity for features like round-robin rotation of A/AAAA records, but since record counts per entry are small, the cost is negligible.
When building a DNS response from cached records, most record types can be copied directly from the buffer into the outgoing message. Previously, each parsed record had to be serialized field by field back into DNS wire format. The new layout skips that work for A, AAAA, TXT, and all DNSSEC record types by copying their encoded bytes directly. Only records containing domain names, such as CNAME, NS, MX, and SOA, still require parsing so we can apply DNS name compression. Since records that support direct copying make up the vast majority of our traffic, this change reduces work on the lookup path. Combined with improved memory locality, this reduced cache lookup latency by 5% in our benchmarks.
To build the record data buffer, we write into a reusable scratchspace buffer that persists across cache insertions. Since previous writes have already grown it, the buffer rarely needs to be reallocated. Records vary in size, so we do not know the exact buffer size until they have been serialized. Once the records are in the scratchspace buffer, we allocate a Box<[u8]> and memcpy the data into it. This replaces the separate allocation for each boxed record with one allocation for all record data. It also avoids the waste from shrinking a Vec<u8>, where the allocator may not be able to reclaim the unused tail of the original allocation. In our benchmark, this change alone increased cache insert throughput by 13%.
The results
The production measurements show how the benchmarked per-entry savings translated to whole-process resident memory. The graph below shows p90, p98, and p99 memory usage across Big Pineapple instances. The first dashed line marks the start of the rollout on May 18, 2026, and the second marks its completion across all services on July 6, 2026. Each release introduced one or more of the optimizations described above, so memory usage dropped in steps rather than all at once.
As each release rolled out, restarted instances began with empty caches and consumed more memory as those caches filled. The stable plateaus therefore represent steady-state memory usage better than the initial dips.
Per-instance memory usage dropped across all percentiles. At p99, memory dropped from 9.3 GB to 5.3 GB, a 43% reduction in resident memory. At p90, memory dropped from 6.5 GB to 3.8 GB, a 42% reduction. Instances with fuller caches saw the largest absolute savings.
In our benchmarks, these five optimizations reduced the per-entry memory footprint from 953 bytes to 420 bytes, a 56% reduction. Per-entry allocations dropped from 1.1 KB to 461 bytes. The reductions measured in production are smaller because resident memory includes the cache alongside all other process data. After the rollouts settled, aggregate working-set memory across the fleet was roughly 100 terabytes lower.
Performance also improved. Cache insert throughput increased by 43%, while lookup latency dropped by 19%.
We plan to reinvest the freed memory into increasing cache capacity without increasing our memory usage, which improves cache hit rates and reduces upstream query volume. We're also exploring further optimizations to the cache itself.
To learn more about Big Pineapple, see How Rust and Wasm power Cloudflare's 1.1.1.1. If you work on DNS or other large systems, share the optimizations that have worked for you in the Cloudflare Community or on the Cloudflare Developers Discord.
Why Your Cellular Signal Bars Are Lying to You
Post Syndicated from Crosstalk Solutions original https://www.youtube.com/shorts/elReW93A71Q
Extend Amazon Bedrock Guardrails to Tool Interactions Using the Strands Agents SDK
Post Syndicated from Stephan Traub original https://aws.amazon.com/blogs/security/extend-amazon-bedrock-guardrails-to-tool-interactions-using-the-strands-agents-sdk/
If you’re running AI agents in production, Amazon Bedrock Guardrails protects the model boundary. But your agents also invoke tools, fetch external data, and communicate with other systems. That data flows outside the model boundary, where model-level guardrails can’t reach.
You can extend guardrail coverage to those interactions using three validation checkpoints built with the Strands Agents SDK lifecycle hooks and Amazon Bedrock guardrails. You implement each checkpoint using a Strands life-cycle hook, which validates data at a critical trust boundary without changing your existing tools or agent logic.
Agents can communicate with other systems through the Model Context Protocol (MCP), a standard for connecting AI systems to data sources and tools. You will learn how to implement three validation checkpoints, scope different guardrails to specific tools, and scale them to other agents.
Extending guardrails beyond the model boundary
Amazon Bedrock Guardrails provides protection at the model boundary. Every model invocation is checked: the input prompt is validated before inference, and the model response is validated after inference. You can enforce guardrail use at the account level using AWS Identity and Access Management (IAM) policies, making guardrails mandatory for model calls across your account. You can further refine this by using Amazon Bedrock Guardrails input tagging to mark specific portions of the prompt for evaluation, so trusted content like system prompts can be skipped.
Guardrails cover what the model sees, but agents do more than call models. They invoke tools, pull data from external sources, communicate with MCP servers, and return results to users. These interactions happen outside the model boundary by design, because model-level guardrails focus on the prompts and responses the model itself handles. Adding validation at the tool boundary complements, rather than replaces, that model-level protection.
Model-level guardrails alone leave you exposed in four ways:
- Tool parameters pass through unchecked. The model decides which tool to use and what parameters to pass. The agent then calls the tool with those parameters. No validation sits between the model’s decision and the tool’s execution. If the parameters inadvertently contain personally identifiable information (PII) or policy-violating content, the tool runs with that content.
- External data enters without validation. Agents consume data from tool responses, MCP server outputs, and API calls. Without validation at the tool boundary, content from external sources can influence the agent’s behavior before model-level guardrails have a chance to evaluate it.
- Misleading content can affect reasoning. An agent that retrieves inaccurate or misleading content from an external source might treat it as authoritative, producing skewed recommendations in lending, healthcare, or legal advice.
- Multi-agent systems can spread bad data downstream. In multi-agent systems, a misconfigured or poorly designed upstream component can pass policy-violating content to downstream agents. Model-level guardrails at each agent’s boundary don’t inspect data flowing between agents at the tool layer.
Three validation checkpoints
To close these gaps, add three validation checkpoints at each trust boundary where data crosses into or out of your agent as shown in Figure 1.
- Checkpoint 1: Inbound data validation – Check data before it reaches the model—user input, data from other agents, MCP tool servers, and RAG pipelines. You catch policy-violating or biased content before it enters the model’s context window. In the Strands Agents SDK, you implement this using a
BeforeInvocationEventhook that fires before model inference or tool execution occurs. The hook inspects incoming messages and blocks the request if the content violates policies. The model doesn’t see blocked content. - Checkpoint 2: Tool interaction supervision – Before the agent calls a tool, a
BeforeToolCallEventhook checks the parameters it’s about to pass. This is the gap model-level guardrails don’t cover. The model has already decided what to send, but nothing has verified whether that content is safe to act on. If the hook flags the input, the call is canceled before the real-world action occurs. - Checkpoint 3: Outbound data validation – Validate results before returning them to the user or passing them to downstream systems. You need this most for tools that ingest external content, like a web search tool fetching web pages from sites outside your control. In Strands, an
AfterToolCallEventhook validates the tool’s return value and replaces it with a block message if the content violates policies.
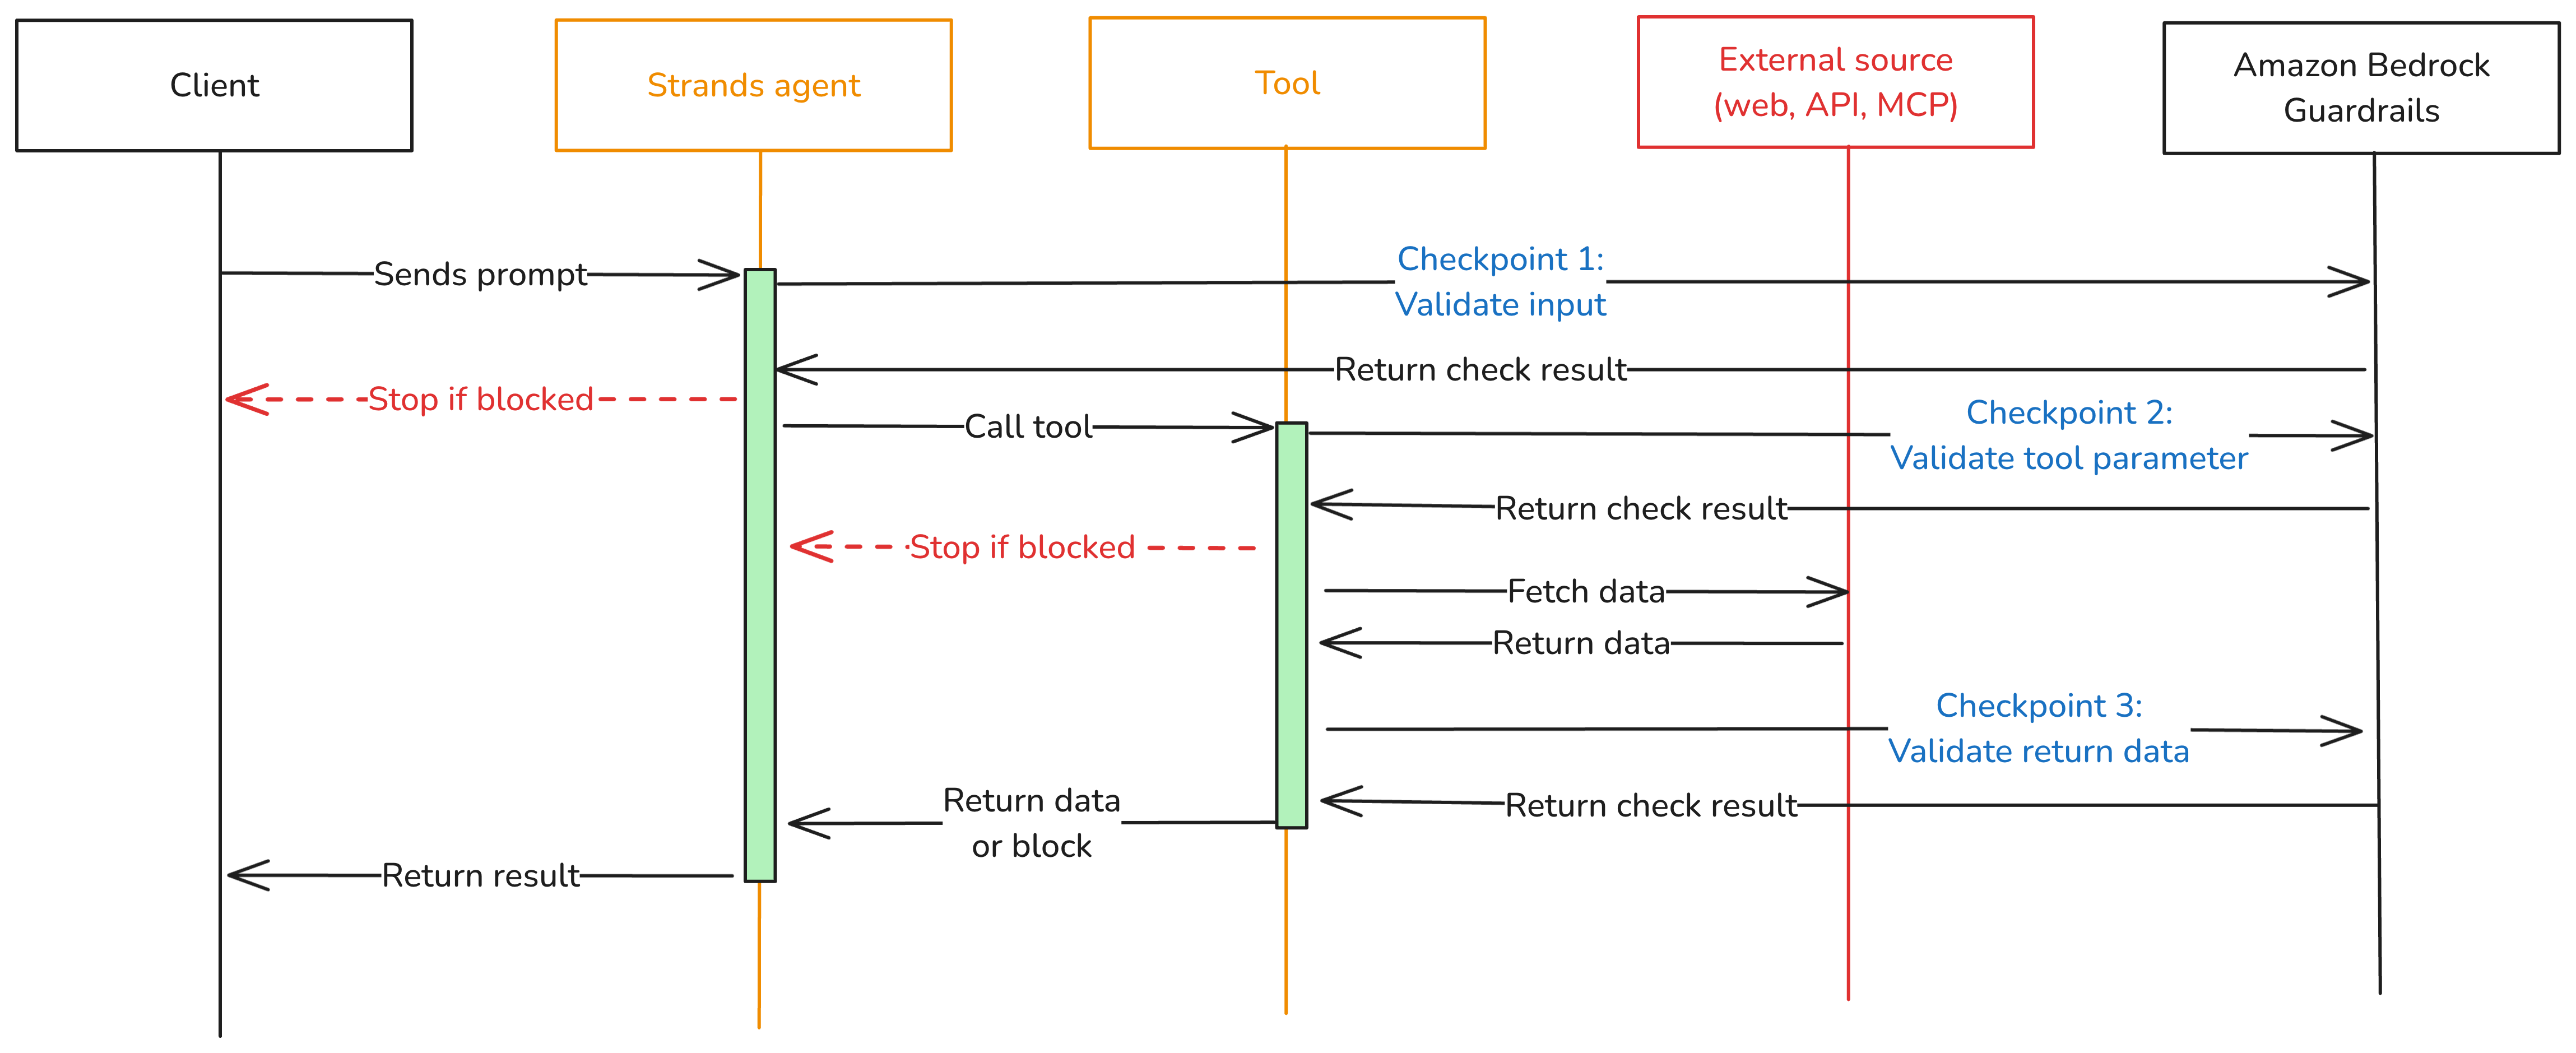
Figure 1: Three validation checkpoints extend Amazon Bedrock Guardrails from the model boundary to the tool boundary.
You can adjust the validation intensity of each checkpoint:
- At Checkpoint 1, use a full Amazon Bedrock guardrail with PII detection, content filtering, and topic enforcement.
- Checkpoint 2 can be lighter. Configure a separate Amazon Bedrock guardrail with rules tailored to the specific tool being called, or run local checks like regex validation or schema enforcement.
- For Checkpoint 3, focus on unwanted content detection for tool outputs that return external data.
Mix fast deterministic checks (regex, schema validation, allowlists) with AI-based guardrail evaluations. This keeps latency low.
Implementation
The implementation uses boto3, the AWS SDK for Python, to call the ApplyGuardrail API. The Strands Agents SDK exposes one life-cycle event per checkpoint. Here’s how to implement each one.
Prerequisites
This post assumes you already have a working Strands agent. Your agent should use least-privilege tool access, scoped system prompts, and validated business logic. If you’re starting from scratch, see Strands Agents SDK: A technical deep dive into agent architectures and observability for a step-by-step walk through of building and deploying a Strands agent with Amazon Bedrock Agent Core.
Before implementing the multi-checkpoint approach, you’ will need:
- An AWS account with access to Amazon Bedrock
- Amazon Bedrock Guardrails configured (see Creating a guardrail)
- Python 3.11 or later installed
- The Strands Agents SDK installed: pip install strands-agents
- AWS credentials configured with permissions for
bedrock:ApplyGuardrailandbedrock:InvokeModel - Your guardrail ID and version from the AWS Management Console for Amazon Bedrock (navigate to Guardrails, select your guardrail, and copy the ID)
Create the guardrail validation hook
The GuardrailHook class is a Strands HookProvider. It registers three callbacks, one for each lifecycle event. When Strands triggers an event, the matching callback runs validate_inbound checks user messages, validate_input checks tool parameters before execution, and validate_output checks tool results. All three use the shared _check method, which calls the Amazon Bedrock ApplyGuardrail API.
Create a guardrail_hook.py file and add this implementation. Use the optional tool_names parameter to scope a hook to specific tools, or pass None to apply it everywhere:
Define tools
Strands discovers tools through the @tool decorator. The decorator turns a plain Python function into a tool the model can call, using the function’s docstring and type hints as the tool’s contract. Here are two simple examples used in the registration sections below. A web search tool and a customer data tool:
If you don’t have existing tools, create a tools.py file and copy in the example code above.
Register the hook
Strands activates hooks through the hooks parameter on the Agent constructor. After being registered, the hook’s callbacks run automatically on every matching lifecycle event. No changes are needed in your tools or agent logic. For a single guardrail applied to all tools, create one hook instance and pass it to your agent:
Use different guardrails per tool
Different tools carry different risks. A web search tool fetches external content from untrusted sites and needs strict output filtering. A customer data tool returns internal records and might need PII detection configured differently. The tool_names parameter scopes a hook to specific tools. Strands still runs every registered hook on each event, but hooks skip the call when the tool name doesn’t match. Register one hook per guardrail:
Each guardrail is configured independently in the Amazon Bedrock console. You can match validation strictness to each tool’s risk level instead of applying one policy across your entire agent.
Test your implementation
Run a quick test with the preceding examples:
- Create a project folder and add the following files:
guardrail_hook.pytheGuardrailHookclasstools.pytheweb_searchandget_customer_datatool definitions as examplesagent.pythe agent setup from the Register the hook section
- In
agent.py, add a test prompt at the end:
- Update the guardrail IDs, AWS Region, and model ID in
agent.pyto match your configuration. - Run the agent from your project folder:
python agent.py
The guardrail hook runs at each checkpoint. If the prompt or any tool output is flagged, you’ll see the block message in the response instead of the tool result.
Use the hook across your organization
The GuardrailHook is a standalone HookProvider. Build it once, then attach it to Strands agents by passing it to the hooks parameter. The same hook package can be published as an internal library and consumed by
- Multiple agents within a single application
- Agents deployed across different runtimes (AWS Lambda, Amazon Elastic Container Service (Amazon ECS), Amazon Bedrock Agent Core Runtime)
- Teams across an organization, with environment-specific guardrail IDs injected through configuration (for example, dev, staging, prod)
You can swap guardrail configurations or add checks like regex or schema validation without touching agent or tool code.
Conclusion
Amazon Bedrock Guardrails protects the model boundary, but agents also call tools, consume external data, and return results that never pass through model-level checks. The three validation checkpoints in this post close that gap using Strands Agents SDK lifecycle hooks: BeforeInvocationEvent validates user input, BeforeToolCallEvent validates tool parameters, and AfterToolCallEvent validates tool output. The same GuardrailHook class supports one shared guardrail or different guardrails scoped per tool, and deploys unchanged from local testing to Amazon Bedrock Agent Core Runtime.
To learn more, see:
- Amazon Bedrock Guardrails
- Amazon Bedrock Agent Core
- Strands Agents SDK
- OWASP Top 10 for Agentic Applications
If you have feedback about this post, submit comments in the Comments section below.