The Internet isn’t a single lane of traffic. For a long time, the rule of thumb in web security was that bots are bad, while humans are good. Of course, we’re far past this generalization. Humans can be fraudulent, and bots can be helpful at different levels. Site owners actively want some automated traffic to interact with our sites to make the Internet functional and discoverable.
To complicate things further, the line between "human" and "bot" is blurring more and more. Now, we have a type of “hybrid” traffic where a single session shifts from human to agentic and back again. (Think of a user browsing a store, and then handing off the checkout process to an automated shopping assistant.)
So, how do website owners manage this kind of complexity? What matters here is assessing behaviors. Is this behavior abusive? Malicious? What’s the risk presented here, and can I trust this visitor based on their actions? Solving this requires moving beyond static, point-in-time checks. It requires analyzing continuous behaviors to evaluate Trust.
In this post, we’ll share an inside look into the strategy of the Web Integrity & Trust team (covering the bots and fraud problem spaces) around detecting and analyzing good and bad behaviors, providing tools to help site owners tackle emerging challenges in the shifting Agentic Internet. We’ll also share findings around agentic traffic since the launch of Precursor, and a simulation where you can see how your own cursor movements would be assessed as human or bot — plus some exciting launch updates to expect in the near future.
Defining Risk and Trust
Let’s talk about the distinction between Risk and Trust, the way we discuss it within the teams at Cloudflare who work in bot detection. These are often viewed as polar opposites of a continuum. At Cloudflare, we look at them as independent, but reciprocal, values. Trust is the essential ingredient in making informed decisions on what to do about your traffic.
Risk is how likely something like a request or action is to be harmful, and it’s often ephemeral. Trust, however, is built up over time, and it’s based on reputation.
We can illustrate this with an example from real life: say that you’re enjoying some evening television at home, when suddenly, you hear the doorbell being rung repeatedly. Besides being annoying, this behavior is strange. Frantic doorbell rings late at night are alarming.
You check through your door camera and see that the person ringing your doorbell is your best friend who lives next door. Of course, you trust your best friend, and we’d bet you would let them in.
In this example, it wouldn’t be enough for you to say, “Reject anyone who rings my doorbell at night” or “Reject anyone who rings my doorbell more than 10 times.” Again, Trust is the essential ingredient.
Going back to traffic on the Internet, the strategy as we build products in the bots and fraud space focuses on building an entire ecosystem based on Trust. And our goal is to provide the incentives and primitives for site owners to use to incentivize behavior that makes the Internet safer for everyone: starting with blocking malicious activity at the bottom, to encouraging participation in a safer Internet at the top.
Good behaviors, rooted in transparency
Starting at the top: what counts as good behavior? We can draw clear examples from the Verified bots and agents within BotBase. Last month, we announced an updated pragmatic taxonomy for the good bots we track in our system, boiling down the definition of “Verified” to two things: 1) you declare yourself honestly, and 2) you don’t abuse the trust you’ve earned.
Transparency between a site owner and a bot operator allows for a symbiotic relationship: site owners can note what behaviors and data uses they want to allow on their websites, and bot operators can be granted access more easily. The transparency allows for Trust in the relationship; if you have nothing to hide, declaring who you are should reduce friction from the sites who want to allow your behaviors.
BotBase is not meant to only make declarations of “who is good”. It is intended to be a directory of all known bots and agents, and provide the facts. Compared to our previous Bots Directory, which only included known good bots, BotBase is also capable of tracking less-than-good bots and agents. Why? Because our systems track and validate behavior for known good actors, meaning we have the tools to identify when these expectations aren’t met. If you abuse trust on the Cloudflare network, you should not be easily allowed, so you will be unverified.
Bad behaviors: blatant, stealthy, and everything in between
A few weeks ago, we announced Precursor, a continuous client-side system to detect even subtly inhuman bot traffic that can fly under the radar when assessing network signals alone. When a customer enables Precursor, the JavaScript detection is CDN-injected, so it doesn’t require sitting at the computer and figuring out where or how to rerun these detections. What's more, Precursor evaluates user behavior continuously throughout the session, so no more free hall passes for abusive traffic that found a way to pass client and browser-side checks just once.
Applying our Risk and Trust framework to these client-side detections, we can point out that CAPTCHAs or one-time hurdles are Risk-based, meaning they lack context. On the other hand, verification using behavioral tells is Trust-based, since it can capture more context clues from the full user session. Precursor is the tool for us to analyze this behavior. To sum it up, Precursor is so powerful because it:
Provides Trust-based detection over the entire user session.
Drives up the cost for bot developers to replicate human behavior over a multipage timeline.
By making it economically disadvantageous for bot developers to outrun these detections, we win the adversarial game.
Now, what have we learned since we’ve launched? Looking at just a 24-hour period at the time of writing this blog, we can see 206 million Precursor evaluation events, across 73,438 zones on the Cloudflare network.
We can see patterns in the data that reveal things that we had suspected when launching the detection, but can now validate across tens of thousands of domains:
Suspicious behavior often happens mid-session, which point-in-time detection wouldn’t catch.
Behavior often shifts from human to agentic and back over a session. In these cases, it’s important to understand the intent so that site owners don’t block user flows that they actually want.
This highlights the importance of a bot classification system that allows website owners to handle traffic by use case, purpose, and data use. This is precisely why we prioritized taxonomy updates for BotBase.
For those curious to learn more on how Precursor actually works, we shared a sneak peek — how the signals we analyze showed us that to err is human — in our announcement blog post. Today, we’re going a step further: giving anyone on the Internet an interactive demo simulating how Precursor would trace your cursor movements.
Precursor Traceis live now, sharing how we’d assess your cursor movements using (part of) Precursor’s detection mechanism. Here, you can see whether you’re accelerating or correcting yourself, the rhythm and texture of your cursor movement, and more — all things you’ve probably never thought about as a real human being interacting with a computer. Try it out!
Adaptive Intelligence is coming soon
Cloudflare’s bot detection engines can produce different outcomes when assessing if a given request is automated or not. For requests that are deemed to be automated, the assessment can be 1) definitely automated, based on proven, deterministic methods or fingerprints of bots, or 2) likely automated, based on predictive scoring from Cloudflare’s Bots ML.
Historically, Bots ML has been updated in versions, meaning we announced each new model version as a product launch. This pacing doesn’t work when bots adapt on the scale of hours or even minutes.
Adaptive Intelligence, a completely new detection engine, is different from anything we’ve built before in the Bots ML space. The model itself is adaptive. It has learned from everything we’ve seen in the past, but more importantly, it will continue to learn and self-adjust based on what it sees. Adaptive Intelligence will upgrade itself based on a wide range of traffic patterns we identify, from good to bad behaviors, and customers will no longer need to upgrade to a formal new model version to have the latest predictive bot detections working for them.
All Bot Management customers will have access to Adaptive Intelligence in the near future — stay tuned for the launch announcement coming soon.
Moving beyond determinism to influence bot behavior
So far, we’ve focused on Cloudflare’s side of things: strategy, detection, and taxonomy. All of this allows Cloudflare to equip website owners with the tools they need to set the traffic policies they want on their sites. Zooming in on the website owner side, we want to take this chance to discuss some advanced mitigations that allow website owners themselves to influence bot behavior.
With more blatant mitigation techniques, we face something that we’ve nicknamed the “Bot Antibiotic Problem.” Always sending bots a deterministic response (like a 403 block) makes it easy for a malicious developer bot to probe, observe, and reverse-engineer your defenses.
We know this, so we’re designing mitigations specifically made for throttling bots — with different approaches for malicious bots vs. benign bots. We can break them down into three approaches:
Approach 1: Unpredictability and Random Actions. Applying random responses (between block, challenge, or allow) to suspected automated traffic breaks a bot's automated retry logic and fingerprinting.
Approach 2: AI Labyrinth, a defensive response that traps unauthorized bots in an endless maze of AI-generated web pages. You can waste malicious bots' compute and crawl budgets by using misdirection. Site owners will be given three options within AI Labyrinth, depending on their preference:
Maze: Generates an endless web of linked pages for bots to follow.
Summary: Feeds crawlers an LLM-generated summary of a page that looks real but is entirely useless as AI training data.
Poison: Serves deliberately fake content (like fake prices or inventory) to a bot, polluting the data it collects for AI training.
Approach 3: Queuing for Good Bots. Not all agentic traffic is bad; queuing manages throughput for legitimate automated traffic (like user-directed shopping agents) without denying them service entirely.
These advanced, bot-specific mitigations are set to roll out closer towards the end of the year, and will be available for the website owner to choose how strict they want their mitigations to be.
We also know that a great defense is a predictive one — one that self-learns and course-corrects without needing multiple security experts on a call to reactively set a fix that accounts for the latest stealth attack. This might look like having a system of “disposable” rules, in which the ruleset is dynamic in nature. This is by design: if attacks constantly evolve, the defenses should, too. That’s why we’re working to keep both detections and mitigations a step ahead.
Establish the Trust ecosystem that works for you
Anyone and everyone can take steps to define how automated agents interact with their infrastructure.
By moving away from static, point-in-time checks and embracing continuous trust evaluation, we reduce the game of whack-a-mole with bot operators. If you’re not already using Cloudflare’s bot detection, check it out and establish the Trust ecosystem that works for you.
Since launching in 2020, Cloudflare Radar has provided one-of-a-kind insight into Internet traffic on a global scale. The open data that Radar publishes from our global network is used by a variety of experts in different domains: human rights advocates, journalists, academic researchers, network operators, and more.
Today, as part of Agents Week, Radar is beta-launching a new tool: Radar Researcher.
Now, if you want to answer a question with Radar’s data, you can just ask in plain language and get an answer back with real, interactive charts, all built on Cloudflare's developer platform. You no longer need to find the right page, choose the right filters, or read the API documentation to write a query.
Why we built Radar Researcher
Over the past six years, the Radar team has worked to provide clear, accessible, reliable data visualizations of complex datasets. This is not without its challenges: our user base is vast and ranges from curious novices to technical network experts. Even so, we publish as much insight into the Internet as seen from our network as we can: DNS queries from our public resolver 1.1.1.1, HTTP traffic from across our global network, network quality data collected from Cloudflare Speed Test, and so much more. We also believe in the power of open, public data, which is why everything you see in Radar’s data visualizations is available via our free API. Every year we make more and more of the Internet visible.
But as Radar has evolved, so has the technology for working with data. AI tools are lowering the barrier to expertise: you no longer need to know a dataset's structure or vocabulary to get useful answers from it. Subject-matter experts become collaborators rather than gatekeepers.
Radar has always wanted to do more for users who shouldn't need to master our entire catalog and its vocabulary to fully appreciate our insights. (See our recent blog post on how the Internet responded to the 2026 FIFA World Cup.)
We also know that many of our users are in a hurry. For example, a journalist writing about the latest Internet outage likely does not have the time to search through each page for the perfect graph to tell their story. This is why we built Radar Researcher.
Meet Radar Researcher
Radar Researcher is built to make accessing data as easy as describing what you’re looking for. All information is provided via Radar’s API, which ensures that the underlying LLM relies on real data, and can answer your questions quickly and in the same format as you would articulate them to a human.
It's available on every Radar page. Open the Radar Researcher panel from the header, and it docks beside whatever you're looking at, so you can keep browsing while you chat. Here are some examples of how you can use it:
Get an answer in plain language, with real charts: Ask a question and get the same interactive visualizations you see across Radar, plus a short explanation.
Choose your depth: Pick a concise, direct answer or a fuller, multi-topic report.
Keep the analysis going: After each answer, it suggests useful follow-up questions.
Pick up where you left off: Conversations are saved in a searchable history you can pin and revisit, and you can share any conversation with a link. (Shared links expire automatically after 30 days.)
Audit the reasoning: Check how the LLM interpreted your question, which datasets it looked up and queried, and how it worked through the results to reach its answer.
Ask your way: Type, use voice input, or launch it straight from Radar's search bar.
Turn any chart into a conversation
Researcher doesn't only start from a blank prompt. Anywhere you see a chart on Radar, an Explain with AI action opens the assistant with that exact visualization already in hand.
Instead of asking you to describe what you're looking at, it captures the exact visualization you're viewing and starts the conversation there. As you can see below, Radar Researcher takes the visualization in context, then analyzes the data and responds with an explanation.
Under the hood, the assistant hands the model three things at once: a screenshot of the chart (a vision-capable model reads the image directly), the exact data behind it from Radar's API, and the parameters of your current view, including location, date range, and any filters you've applied. The screenshot enables Radar Researcher to see what you see. The raw data keeps every number it cites precise instead of estimated from pixels, and the filters mean the explanation is about your exact view, not a generic version of the chart.
Use Case No. 1: What’s Internet quality like in Portugal?
Say you're curious how good the home Internet is in a given country. You can just ask:
Instead of manually calling the API, choosing parameters, or hunting through Radar's pages, Radar Researcher interprets the question and does the work for you. You can follow each step in the screenshot: it reads what you asked, queries Radar's Internet quality API, then analyzes the results and answers in plain language. And rather than a wall of numbers, it renders the same interactive charts you'd see on the Radar Internet Quality section.
From here you might ask a natural follow-up, like comparing Portugal to a neighbor, and Radar Researcher fetches fresh data for each one. It even suggests useful next steps of its own, such as how Portugal stacks up against Spain or the country's most common Internet outages. By letting you find what you're looking for in plain language, we hope applying Radar's data to your own analysis is easier than ever.
Use Case No. 2: Investigating an Internet disruption
Radar Researcher is also built with technical experts in mind. If we know one thing about engineers, researchers, and network operators, it’s that automation is key to their workflows. Looking at the same data with manual actions can be cumbersome and limiting: how do you ensure you're always looking at the most relevant data?
Consider a real event. In early 2026, Iran went through a series of government-directed Internet shutdowns, including one that lasted nearly three months before traffic partially returned in May. Reporting a story like that means pulling several views and refreshing them as the situation develops. To investigate it, you can just ask Radar Researcher:
This time the question is open-ended, so Radar Researcher runs a short investigation. It looks up the outage events Cloudflare Radar recorded for Iran and gathers the matching traffic data, then explains the timeline in plain language: Iran's HTTP traffic index collapsed from around 0.58 on January 7 to effectively zero by January 9, began a partial recovery around January 17, and returned close to pre-shutdown levels by January 27. It presents this as an HTTP traffic index chart with the outage window annotated directly on the line, plus a table of the recorded outages that also flags a second shutdown starting February 28.
From there it suggests where to take the investigation next, such as how the traffic compared with neighboring countries.
How we built it
Radar Researcher is built entirely on Cloudflare's own developer platform. It's a showcase of the same tools any developer can use to build an AI agent.
At its core is a Cloudflare Worker running the Cloudflare Agents SDK. Each conversation is a stateful Durable Object with its own SQLite database, so your chat history, titles, and streaming responses persist. They even survive you leaving the page mid-answer, because generation continues server-side and resumes when you reconnect. The "brain" is Workers AI, running open models like Kimi K2.7. Rather than betting on a single model, we run an ordered fallback chain across three different model families. If one model is momentarily at capacity, the request transparently cascades to the next, so an incident at any single provider doesn’t take Researcher down. Every call routes through AI Gateway for logging, cost tracking, caching, and safety guardrails.
The most interesting part is how Researcher reaches Radar's data. Instead of hand-writing a tool for every one of Radar's hundreds of endpoints, we connect the agent to the unified Cloudflare MCP server using Code Mode. The model gets just three tools (search, execute, and docs) and writes code to query the Radar API directly. It searches the OpenAPI spec to find the right endpoint, then executes a small snippet that fetches live data. Because the full API spec lives on the MCP server, nothing about Radar's API is hard-coded into the prompt. As Radar adds datasets, Researcher can use them with no code changes.
This is visible to you, too: every answer includes an expandable trace of the model's reasoning and the exact tool calls it made to gather the data, so you can always see how it got there.
From Markdown to real Radar charts
There was one problem to solve along the way. Language models answer in Markdown: text, tables, and bullet points. But we didn't want walls of numbers; we wanted the same rich, interactive charts you see everywhere else on Radar. Worse, when a model tries to write data directly into its answer, it tends to round, summarize, or truncate it, which is exactly what you don't want from a data tool.
Our solution keeps the data out of the model's prose entirely. When Radar Researcher fetches data, its code returns a small envelope that pairs the API path with the result. Then, instead of pasting numbers, the model emits a lightweight chart specification that simply references that same path:
Radar's frontend matches the chart's dataFrom to the fetched result and renders it with the exact same visualization components used across the rest of the site. The chart is always faithful to the API, and Radar Researcher can draw on our whole visual vocabulary: time series and stacked areas, donuts, bar charts, maps, histograms, etc.
A few small touches
Not everything needs the big model. Small, fast models handle the side tasks: one writes a short title for each new conversation, and another suggests the follow-up questions under each answer. Both run off to the side, so they never slow down your actual reply.
Radar Researcher also gets a little context about the here and now. We pass it the current date and time, plus the same high-level details about your connection that you'll find on Radar's IP page, such as your IP location and network. That way, when you ask something like "how's traffic here?", it can tailor the answer to where you are.
Everything reaches you through Radar's frontend (also a Worker) over a service binding, with per-IP rate limiting and shareable conversations stored in R2. Every layer, from compute to inference to gateway to storage to data, is Cloudflare.
Powered by agents — and ready for them
Radar Researcher shows how we use an AI agent to help people explore our data. But there's another side to the agent story: what happens when the agent isn't ours, but a general-purpose assistant running in your browser, acting on your behalf?
Today, an agent that wants to use a website mostly has to scrape the page and guess at how it works, which is brittle, slow, and error-prone. WebMCP is an emerging web standard that fixes this: a page can register a small set of well-defined tools that any browser agent can discover and call directly, instead of reverse-engineering the DOM (Document Object Model).
We've added WebMCP support to Radar, using both flavors the standard offers:
The imperative API lets us register tools in JavaScript that call straight into the same code that powers the UI, so an agent can drive Radar directly. Filter to a country, region, continent, or ASN; change the date range; search pages, sections, and entities (domains, ASNs, IPs, and more); jump to any section.
The declarative API turns Radar's existing HTML forms into tools by annotating them with a couple of attributes, so an agent can scan a URL with the URL Scanner, look up a domain's report, or test a website's post-quantum TLS key exchange support.
Every one of these simply drives functionality already available in the user interface, and it's pure progressive enhancement: in a browser without WebMCP, the tools just aren't there and nothing changes.
It’s also a case of practicing what we preach. Radar’s own URL Scanner evaluates how agent-ready a site is, and one of those checks looks for exactly this kind of WebMCP integration. By implementing it ourselves, Radar now passes its own agent-readiness check, and, more importantly, becomes a site that both people and agents can navigate with ease.
Try it out
Radar Researcher is available in beta today on Cloudflare Radar. Look for the Researcher button in the header on any page. It's built entirely on Cloudflare's developer platform, and it's just getting started: we'll keep expanding the datasets it understands, sharpening its analysis, and adding new ways to interact with data.
Tell us what works, what doesn’t, the insights you’re finding, what still feels beyond reach, and everything in between. Your feedback will help us improve and make Radar Researcher even better for our full launch. We can’t wait to see what you do with it!
As a platform for helping build a better Internet, Cloudflare helps turn ideas into real products and experiences around the world. Across communities and backgrounds, developers build with Cloudflare using the tools they love, shaping what comes next for the Internet while inspiring, collaborating with, and teaching others.
The community is where some of Cloudflare’s best moments happen. Students show their friends how to deploy Workers for the first time. Discord users answer questions from other developers via working code samples, instead of links to documentation. Open-source contributors build novel solutions to solve their own problems, then share them with the world. Organizers host events that give builders from all backgrounds the space to start building their dream project.
All of these represent a community at its best: people helping other people build.
This spirit of community is an exciting and vital part of helping to build the Internet. Those who step up to educate and support others, or to invent, build, or maintain tools shared across the ecosystem, make lasting contributions to the health and potential of the Internet.
We want to have their backs.
That's why today we’re announcing an improved community program, designed to better support, recognize, and empower the people getting involved, while working with them to shape what comes next. The program has two main tracks:
Cloudflare Ambassadors: Bringing Cloudflare to their own communities.
Cloudflare Community Engineers: Contributing to open-source projects that improve the Internet.
We’re launching a new home for the program where you can learn more and get involved: cloudflare.com/community.
Cloudflare Ambassadors
Cloudflare Ambassadors are people who bring Cloudflare into their own communities. You can probably think of people in the communities you value who share a genuine passion for a product or technology. It’s inspiring and we love to see it. When that enthusiasm includes the tools we’re building here at Cloudflare, it’s especially exciting for us.
Following our annual application process (more below), we’ll announce the year’s Cloudflare Ambassadors cohort. Selected Ambassadors will receive support, resources, and benefits to help their community thrive and bring their ideas to life. Ambassadors can serve for up to two years, giving them meaningful time to build momentum while helping us support more communities over time.
What Ambassadors do and what we provide
Being an Ambassador might mean organizing a local event, leading a student group, creating spaces where builders can learn together, publishing tutorials or sharing content online, or being the person others turn to when they want to understand what’s possible with Cloudflare.
Ambassadors will take the lead on events in their communities, whether on campus, through local organizations, or across their city. When hosting meetups, hackathons, workshops, or talks, they will be able to apply for support in the form of credits, marketing assets, technical resources, and more.
We’ll also give them a visible role in Cloudflare’s online community spaces, including Discord, so that other developers know who they are, and that they’re here to help.
Applications are open now, and will be accepted through September 6. Those selected as Ambassadors will be informed of their selection by October 5. Apply to become a Cloudflare Ambassador
A great example of the enthusiasm we’re looking for comes from Sruthi Pereddy, a Computer Science major at University of Michigan and a current intern on Cloudflare’s Recruiting Ops team. Sruthi’s work within Cloudflare has created a drive to share and explore more with others:
“Whether it’s hackathons, startup venture funds, or coursework, I want to show my peers that Cloudflare is a go-to developer platform for whatever they’re building,” Pereddy says. “Students are ready to build, but often feel constrained by resources. I’m excited to bridge that gap and make sure they have the infrastructure to turn their ideas into reality from day one.”
Cloudflare Community Engineers
Some community work happens in person, but a great deal of community work also happens in code. Much of Cloudflare’s Developer Platform is built on open-source work, or is open-source, like workerd and quiche. Open-source contributors, especially maintainers, do wonderful work and embody so much passion and determination. We’re eager to support them, especially since their work can sometimes feel thankless. So we’re doubling down on our efforts to build stronger incentives and directly support the maintainers doing this important work.
Last year, we announced our sponsorship of the web framework TanStack. TanStack creator Tanner Linsley says that sponsorship has had a major impact.
“Cloudflare’s sponsorship has given us room to keep investing in foundational open-source work that’s hard to tie to a single product or launch, maintaining the core libraries, improving docs and tooling, supporting contributors, and putting real time into bigger bets like TanStack Router and Start,” Linsley says. “It’s also helped us make sure TanStack apps have a really solid path onto Cloudflare’s platform. More than anything, that support buys stability, which is kind of everything when you’re building open source for the long haul.”
Today, we’re expanding on our previous open-source investments by introducing Cloudflare Community Engineers. Earlier this year, we announced a $1M fund as part of our acquisition of VoidZero to support the Vite community. We’re committing an additional $1M in funding to sponsor and support open-source projects over the next two years, with eligible Community Engineers receiving grants from the fund to support their continuing work in open source.
The Community Engineer program does not have a maximum term. Open source work doesn’t neatly fit into annual cycles. Some projects require maintenance for years, while other times, contributors do the work that is needed at exactly the right moment. This program is intended to support that.
To begin, we’ll focus on developers working on things in the orbit of our own open-source projects — projects like Astro, Agents SDK, EmDash, Hono, and Vinext. We’ll also grant our Community Engineers a special designation in Cloudflare’s Discord server and other online spaces.
Applications for Community Engineer grants will open at a later date.
Making our Discord better as it grows
Since we launched Cloudflare’s Discord server in 2020, almost 100,000 Cloudflare users have joined. Our Discord server has become one of the main places where developers ask questions, share projects, and provide valuable feedback. But of course, the more a Discord community grows, the more effort is required to keep it healthy and approachable.
To address this, a new Discord committee will help to maintain and grow our Discord community, with Cloudflare Ambassadors joining Cloudflare staff on the committee.
This is not about being on hand to perform moderation and admin tasks. We’ve been building tools and automations to help us do that with far less human intervention. Our new automated protections against spam and malicious links are starting to relieve this burden, allowing our Developer Relations team to help manage things where some human insight is needed.
In fact, we’ll be open-sourcing and sharing those tools soon because we think every Discord server could benefit from less spam and malicious content.
The committee will help provide a useful connection to those building and managing products at Cloudflare. They’ll be able to steer people and conversations to domain experts and convene conversations and sessions with internal teams and makers around the community. They’ll be much more focused on content and opportunities than on the type of Discord administrivia that can otherwise swallow so much time and energy.
We want our Discord to be easier to use, contribute to, and trust. It should be a place where builders find each other, help each other, and shape the future of the platform together. We believe this is the way.
Ready, set, go!
To learn more about the community program, and to apply for a role, visit the new community site at cloudflare.com/community.
AI Gateway and Workers AI first started as distinct products, but over time, we noticed our users were converging. With AI Gateway, you can proxy requests to any model provider and get built-in observability, logging, access, and security. On Workers AI, we host models on the GPU infrastructure that we manage, exposing an API endpoint you can leverage to access inference-as-a-service.
The architecture of these products looks different, but to an end user, it achieves the same goal: connecting you to models with a sophisticated control plane. Today, we're excited to share our plans on how these products converge into one unified path, so you can connect to any model provider (including Workers AI), while managing things like observability, billing, security, and logging from a single control plane.
It’s the next step toward some big plans we have — read on to learn what a unified control plane means for the future of model routing.
Merging the binding and API
We've been hinting at the fact that these products are becoming more unified through our entrypoints: the Workers binding and the REST API. We have an AI binding that you can use to call AI Gateway and Workers AI. There's no concept of a separate AI Gateway and Workers AI binding: it all goes through the same path. We shipped the idea of a “default” gateway a few months ago, so that if you have never set up an AI Gateway before, you could still automatically inherit the AI Gateway observability and logging. Of course, you can still specify your own gateway if you'd like to split up applications into multiple projects.
Here's what the binding call looks like, if you are calling Workers AI via AI Gateway:
We’ve also announced a single unified REST API — the /ai/ endpoint that allows you to make similar calls to Workers AI via AI Gateway.
Doing this allows us to unify the entrypoints to AI Gateway and Workers AI, so you don't need to make a choice between which product to use first: it all comes with batteries included.
Automatic observability and control for all Workers AI users
One of the most immediate benefits of this convergence is that you no longer need to explicitly create an AI Gateway before you start getting visibility into your inference traffic. If you've never set up a gateway before, just pass default as the gateway ID in your binding or REST API calls, and AI Gateway will create it automatically on the first authenticated request.
With this, every request is logged with full request and response payloads, token counts are tracked per model, and you get cost attribution without any dashboard setup. If you later outgrow the default gateway — if you want custom caching rules or to split traffic by application — you can create a named gateway and point your requests at it with a single parameter change.
Here's how it looks in the binding. Before, you called Workers AI directly:
Now, add a third argument to route through AI Gateway and get full observability:
Head to the Cloudflare AI Gateway dashboard and you'll see every request: latency breakdowns, token usage, error rates, and the exact prompts and responses. For teams debugging model behavior or auditing AI output, this is a huge upgrade from flying blind.
New: using AI Gateway credits for Workers AI
A new thing we're launching today is the ability to use AI Gateway credits for Workers AI. Before, you could only use AI Gateway credits on external model providers (e.g., OpenAI, Anthropic) but you couldn't apply your AI Gateway credits to Workers AI usage just yet. We've finally enabled our systems to allow unified billing for Workers AI. This means that you can load a wallet full of credits, and then choose to spend that across OpenAI, Anthropic, Workers AI, or any provider that we support.
Since we're now offering pre-paid billing for Workers AI and want to encourage users to use this new path, we're also offering elevated rate limits on Workers AI models if you use AI Gateway unified billing. Please refer to the developer docs for up-to-date information regarding rate limits, as well as how to request a higher rate limit.
Coming soon: model-first routing
With all your inference traffic flowing through a single control plane, we can start making smarter decisions about how to serve each request starting with the model you want, not the provider you have to manage. Provider-first routing forces you to think about infrastructure: "Which provider do I call? What if they're down?" Model-first routing flips that. You think about what you need — a capable reasoning model, a fast summarizer, a cheap embedding model — and the control plane handles provider selection, failover, and load balancing.
Today, if you want to call a model, you have to know which provider hosts it. If that provider is down or rate-limiting you, your application breaks. We're moving toward a world where you specify the model, and AI Gateway handles the rest.
This way, you can request Kimi K2.7 Code and not care whether it comes from Workers AI, Moonshot's own API, or another provider that hosts the same weights. If Workers AI has capacity, you get the benefit of our managed infrastructure. If Workers AI is at capacity, the gateway transparently load balances you to another provider that can serve the same model. You can still choose to stick to a single provider if you’d like, but model-first routing enables you to get more flexibility if you care about resiliency. We work with vetted providers, so the quality of model outputs remains top priority, and will also be able to respect requirements such as Zero Data Retention (ZDR).
This also means better resiliency by default. If one provider's version of a model is having issues, traffic shifts to another without application-level retries or complex fallback logic in your Workers. The gateway treats model availability as a routing problem. We hope to pilot this in the coming months for all AI Gateway and Workers AI users.
Next: smart routing
The next evolution of routing goes beyond simple failover. We're building intelligent routing that understands what you're asking for and picks the right model for the job without any configuration required.
Instead of specifying a model, you can let the gateway decide. Under the hood, a classifier running on Workers AI reads your prompt and predicts what kind of task it is (coding, research, summarization, general Q&A), how complex it is, and how much context matters. A heuristic scorer then maps that to the best model from a curated pool. For teams that want control, you can still specify exact models. For everyone else, the zero-config path means you get better economics and performance without maintaining your own routing logic. We are currently piloting this internally, and we’ll be actively testing and iterating in the next few weeks before release.
Get started today
If you're already using Workers AI, the easiest way to try this out is to start routing your existing calls through a default gateway. You'll immediately get request logging, token tracking, and cost attribution without changing anything else about how you call the models.
If you're already using AI Gateway, adding Workers AI to the mix is as simple as calling a Workers AI model. Load up your AI Gateway wallet and you'll get unified billing across every provider we support, plus elevated rate limits on Workers AI models.
When you move AI agents from prototype to production, the infrastructure challenges multiply. Your agents need to persist state across multi-step workflows that run for hours or days. They need to coordinate with other agents, share context, and sometimes access GPUs for specialized tasks. Amazon Bedrock AgentCore runtime microVMs provide a fully managed environment for invocations that can run for up to 8 hours and support stateful workflows through managed session storage. Some workloads also benefit from dedicated, larger-capacity environments — for example, when agents need to run continuously for multiple days, access GPUs or the underlying OS, or run multiple collaborating agents on the same host.
Today, I’m happy to announce runtime instances, a new complementary compute option in Amazon Bedrock AgentCore Runtime that gives your agents persistent, managed infrastructure purpose-built for complex agent workloads.
What you get Runtime instances provides AWS-managed EC2 infrastructure where you deploy multiple agents in a single runtime, each with their own dependencies and artifact types. Your agents can collaborate on the same host within shared sessions that persist for up to 14 days. The service supports GPU acceleration for compute-intensive tasks, session stop/restart to save costs during idle periods, and containerized deployments for teams that want to ship independently. For knowledge that needs to survive beyond a session, runtime instances pairs naturally with Amazon Elastic Block Store (Amazon EBS) and AgentCore Memory, which gives your agents long-term recall across sessions and environments.
Before today, if you wanted to keep your agents running for days or they needed GPU access, or multi-agent coordination, you had to build and manage that infrastructure yourself. You provisioned EC2 instances, configured networking, set up session management, handled scaling, and stitched together monitoring. Runtime instances handles all of that for you while integrating with the same AgentCore APIs, identity controls, and observability you already use with AgentCore Runtime microVMs.
A few things that should make agent developers smile: your agents can call each other as tools within a shared session, iterating autonomously until the job is done. You bring any framework (CrewAI, LangGraph, LlamaIndex, Strands) and any model. Packaging is minimal, a @app.entrypoint decorator and a zip file or container image. And if your workflow spans days, hibernate Monday night and resume Wednesday morning with everything intact.
Runtime microVMs and runtime instances are complementary compute options that you can use independently or together through the same AgentCore runtime APIs. A lightweight orchestrator agent on runtime microVM can coordinate and dispatch work to specialized worker agents running on instances. The orchestrator handles API calls, task routing, and result aggregation using runtime microVM’s fast scaling, while workers on Instances perform compute-intensive tasks like code compilation, security scanning, or GUI automation that require persistent state and direct OS access.
Let me show you how it works I built two agents for this demo: a code writer agent that generates Python code from natural language descriptions, and a code reviewer agent that analyzes the generated code for bugs, security issues, and style improvements. Both agents share the same file system, so the reviewer can read whatever the writer produces without any data transfer or API calls between them.
Here is the code writer (simplified, no error handling):
writer = Agent(
    model="us.anthropic.claude-sonnet-4-5-20250929-v1:0",
    system_prompt=(
        "You are a senior Python engineer. "
        "Given a task, return ONLY a single Python code block — no prose."
    ),
)

@app.entrypoint
def handler(event, context):
    task = event.get("task") or event.get("prompt")
    session_id = getattr(context, "session_id", None) or event.get("session_id")
    session_dir = SHARED_DIR / session_id
    session_dir.mkdir(parents=True, exist_ok=True)

    code = str(writer(task))
    (session_dir / "code.py").write_text(code)

    return {"agent": "writer", "wrote": str(session_dir / "code.py"), "code": code}
Here is the code reviewer agent (simplified, no error handling):
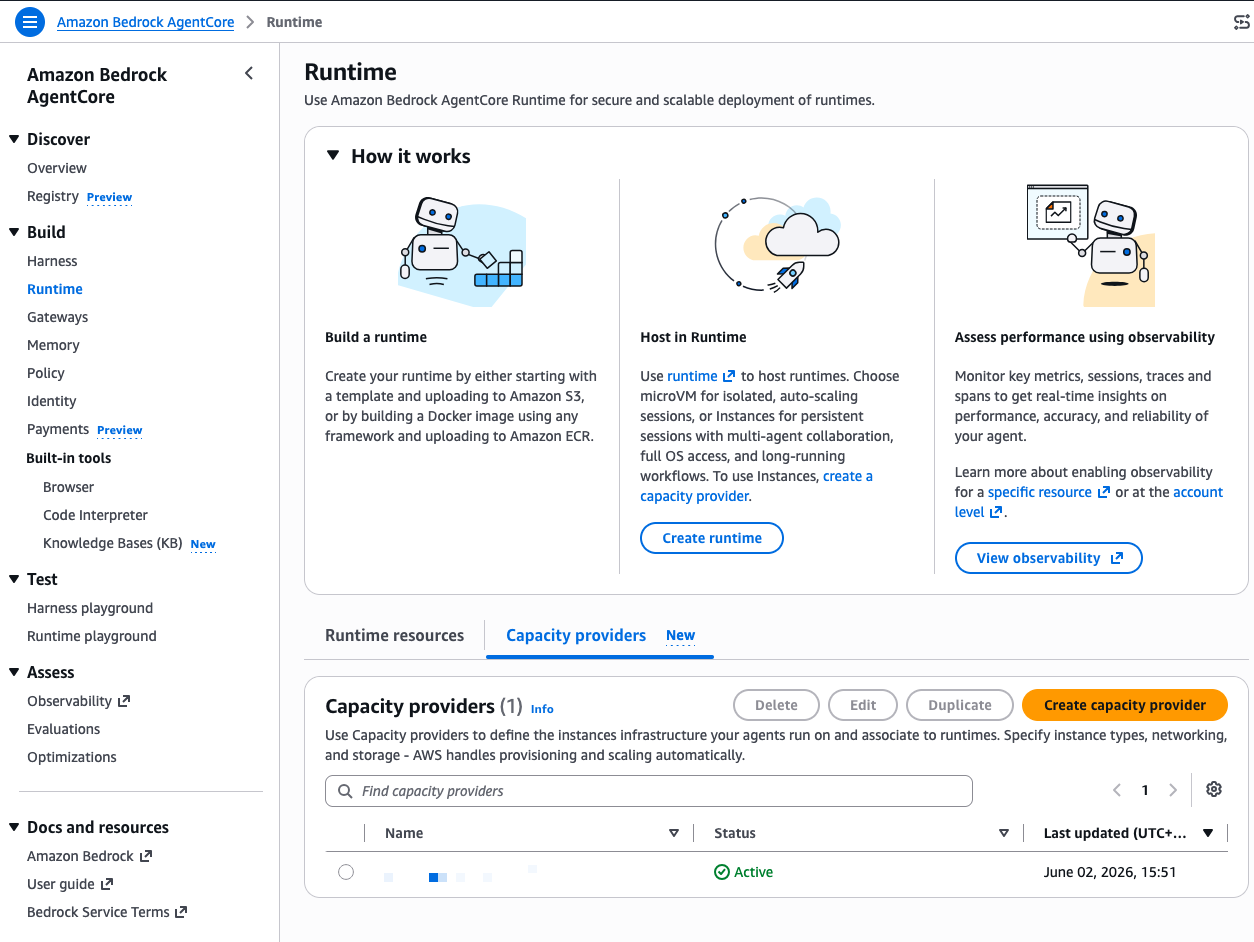
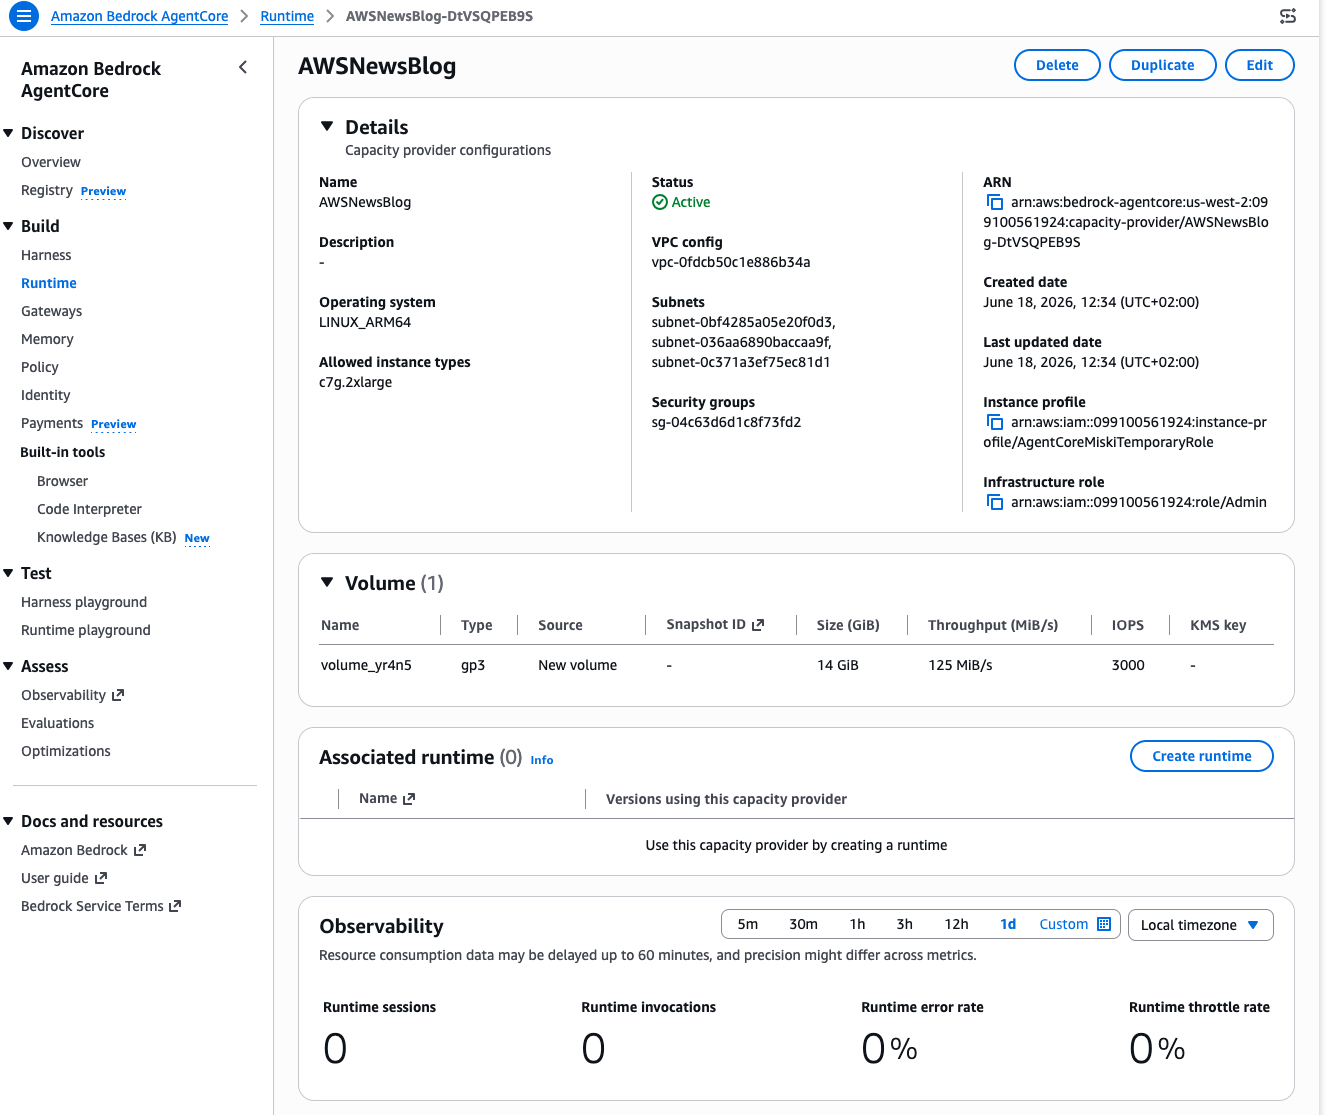
A capacity provider defines the EC2 infrastructure your agents run on. In the AgentCore console, I select Runtime in the left navigation, then select the Capacity providers tab and Create capacity provider.
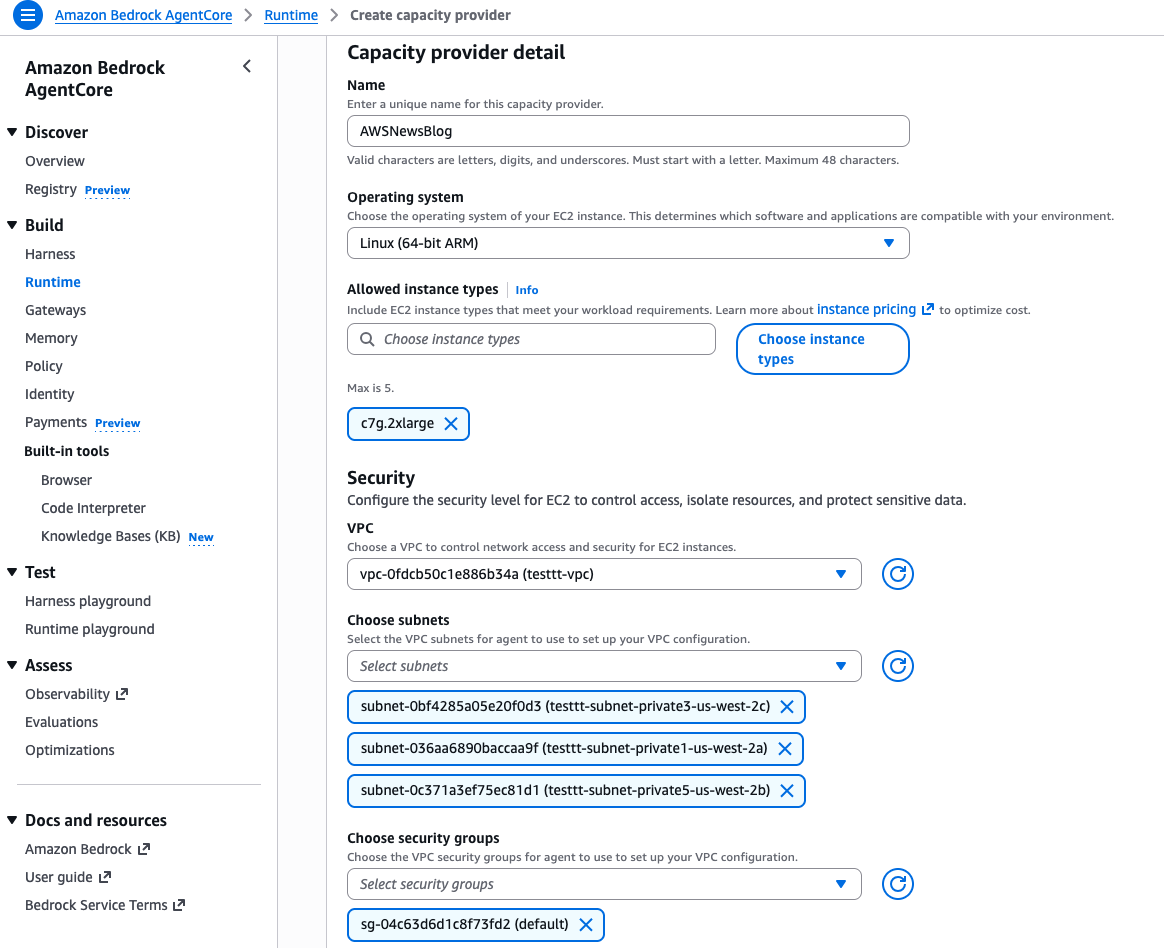
I give it a Name, select Linux (64-bit ARM) as the Operating system, and choose c7g.2xlarge as the Allowed instance types. This gives me 8 vCPUs and 16 GiB of memory, enough for both agents to run comfortably side by side.
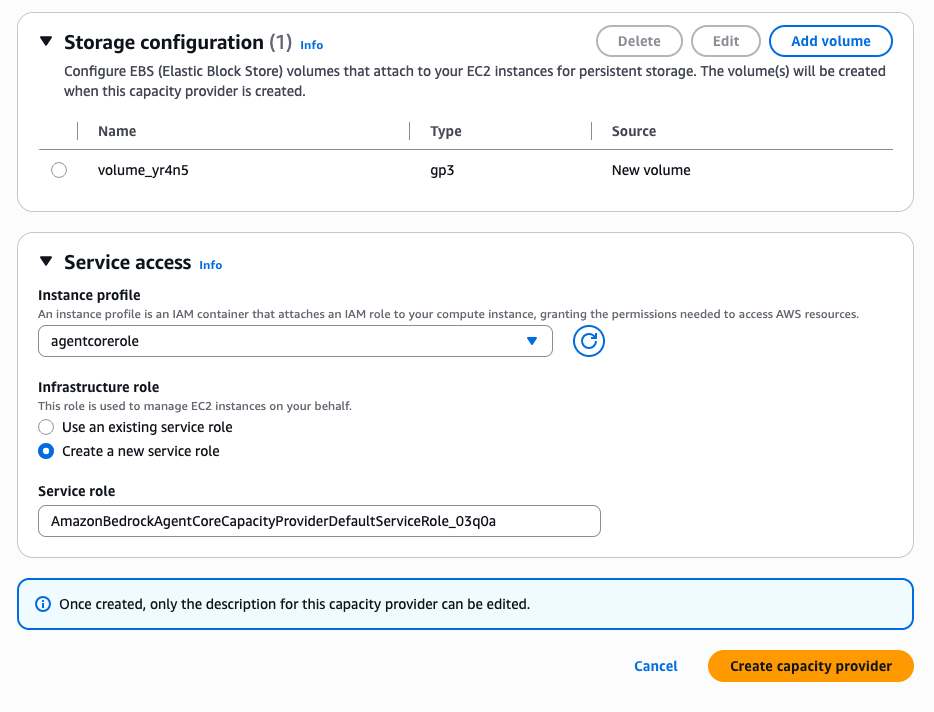
Further down, I configure the VPC, subnets, and security groups for network access. Under Storage configuration, I keep the default gp3 volume. Under Service access, I select Create a new service role and let the console create the infrastructure role that manages EC2 instances on my behalf.
I select Create capacity provider and wait a few seconds. The status moves to Active.
Note the capacity provider configuration summary: operating system, instance type, subnets, security group, instance profile, and infrastructure role. Once created, only the description can be edited, so verify your settings before you proceed.
Step 2: Create a runtime and deploy the first agent.
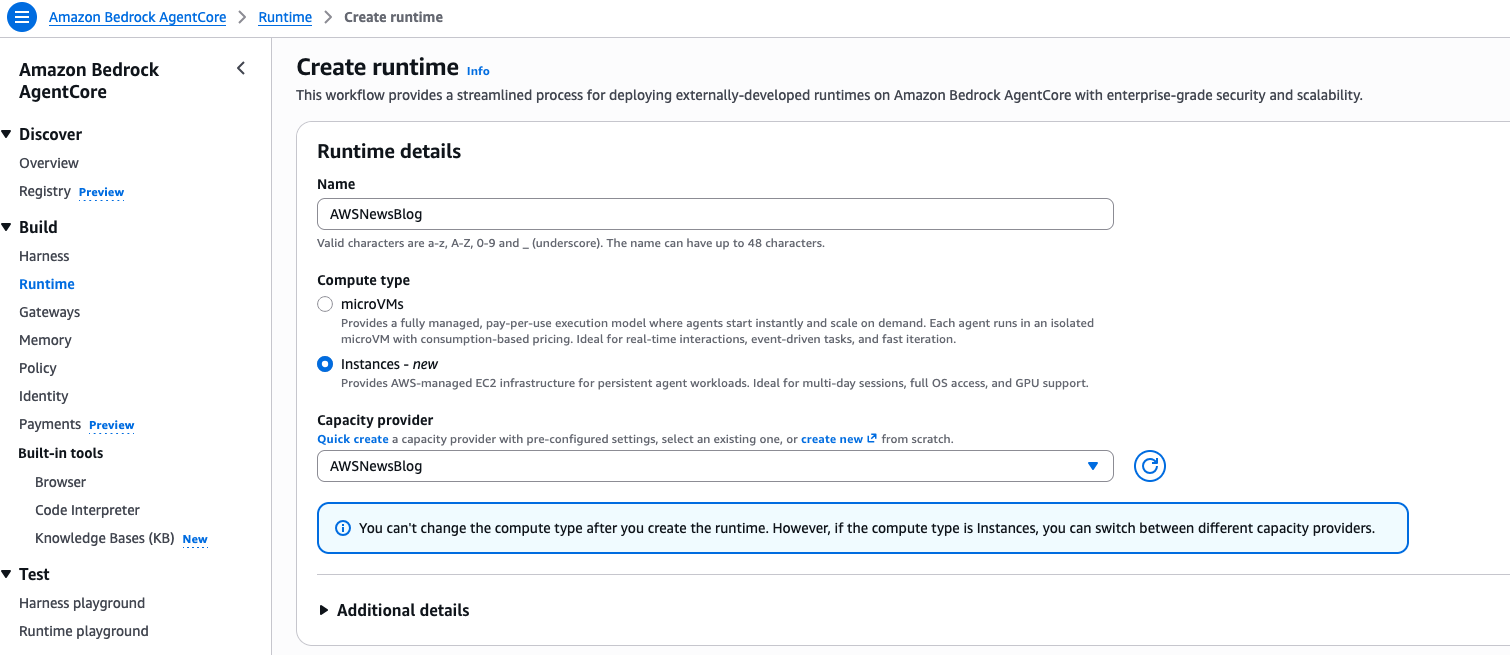
Back on the Runtime page, I select Create runtime. I give it a Name, select Instances as the Compute type, and choose the Capacity provider I created in the previous step.
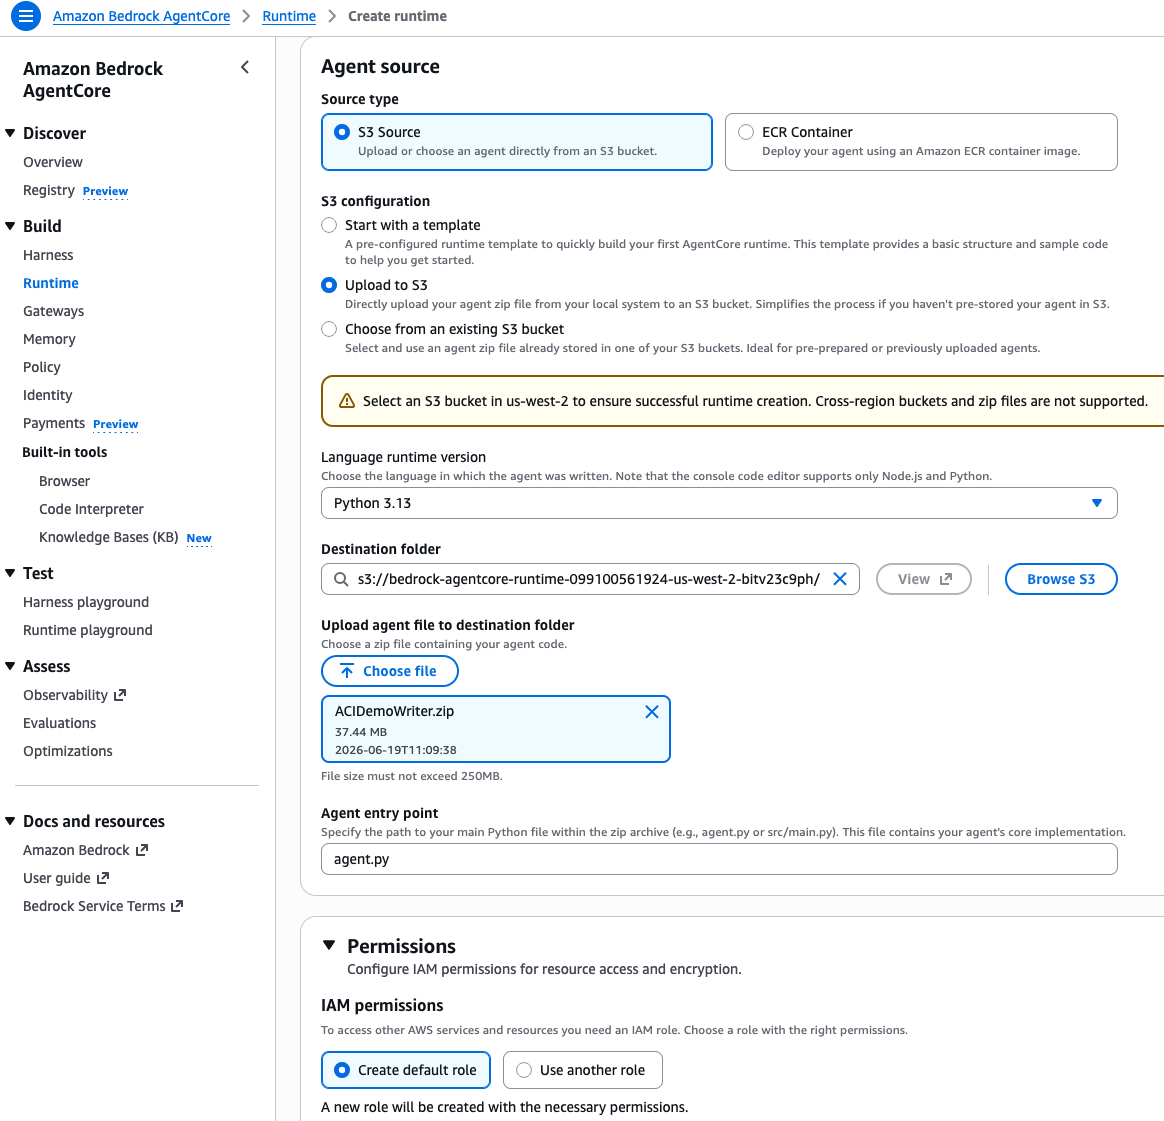
Under Agent source, I select S3 Source, then Upload to S3. I choose my agent zip file (ACIDemoWriter.zip), set the Language runtime to Python 3.13, and specify agent.py as the Agent entry point. This is the file that contains my @app.entrypoint decorated function. Under Permissions, I select Create default role to let the console provision the IAM role my agent needs.
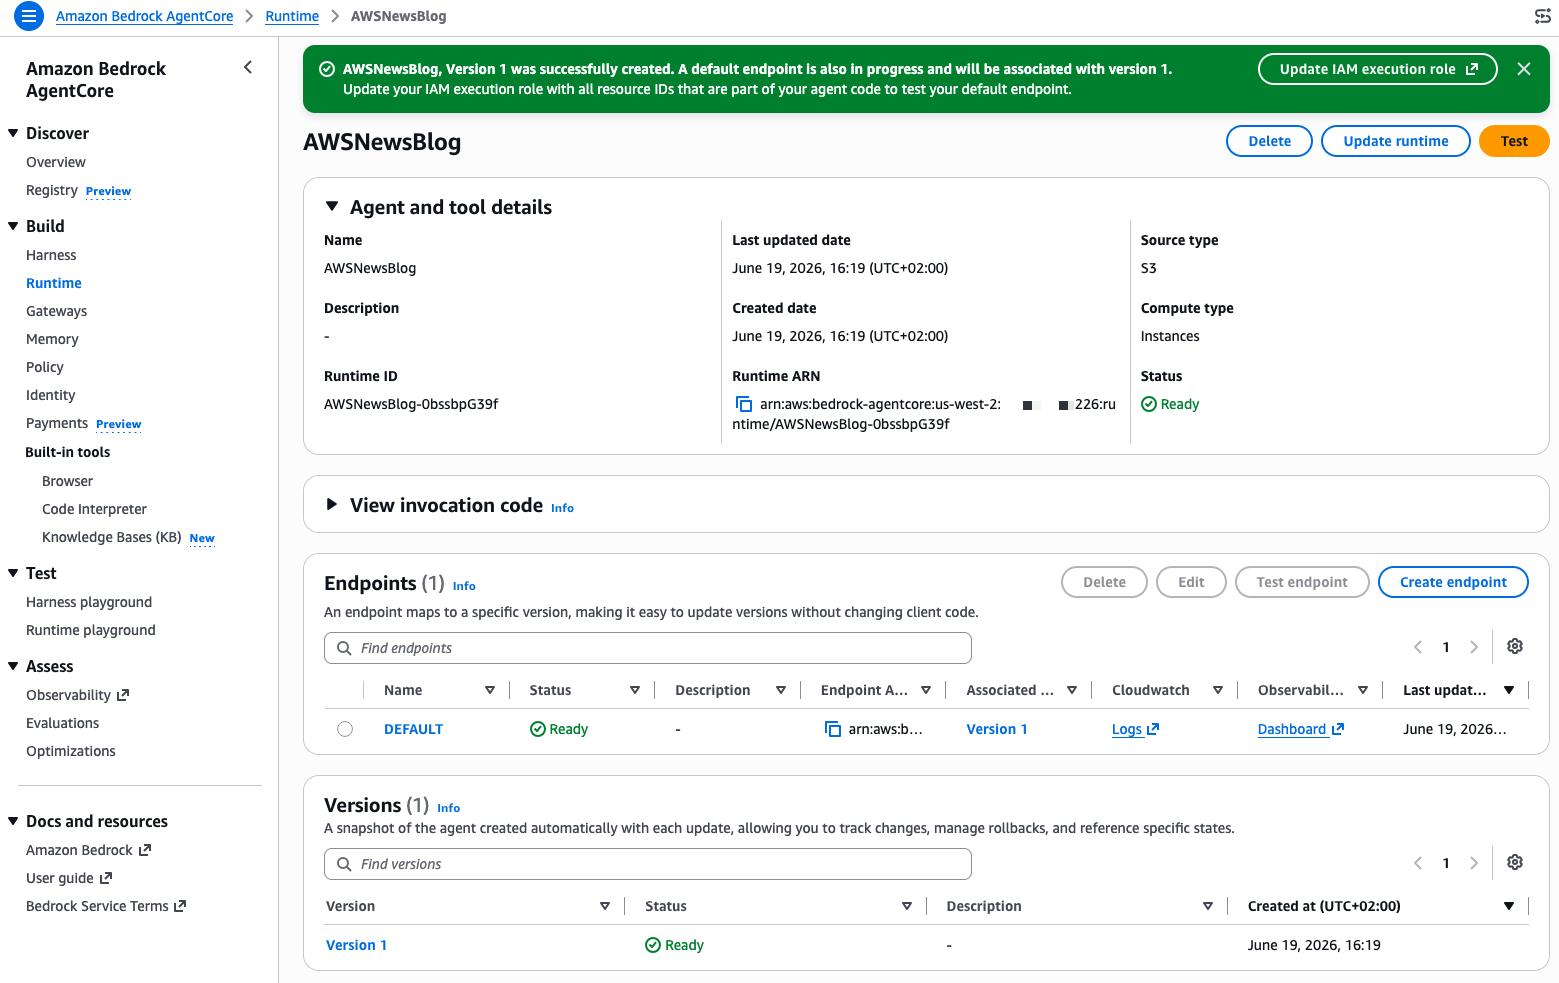
I select Create runtime and wait for the status to become Ready.
I repeat the same process for my code reviewer agent. I create a second runtime, select the same capacity provider, upload my reviewer agent zip file, and wait for it to become Ready. Both agents now share the same underlying EC2 infrastructure.
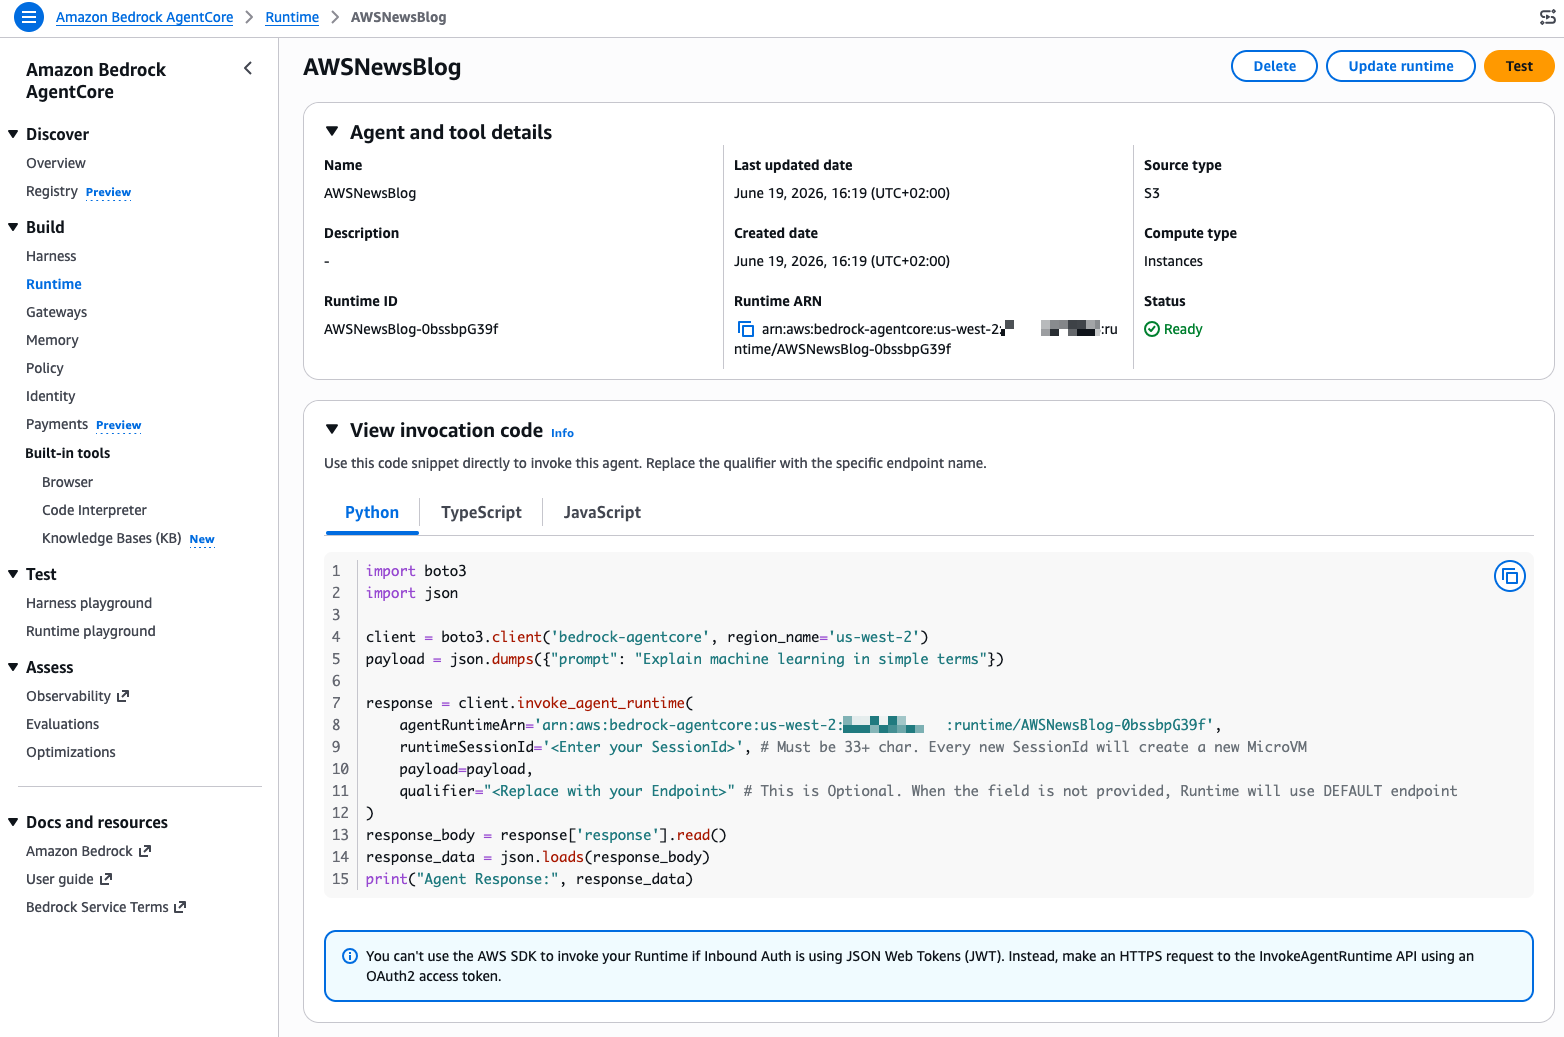
The console shows me a View invocation code section with ready-to-use Python, TypeScript, and JavaScript snippets to invoke my agent programmatically. But for this demo, I use the built-in test feature. I select Test on the writer agent’s page.
Step 3: Invoke agents and observe collaboration.
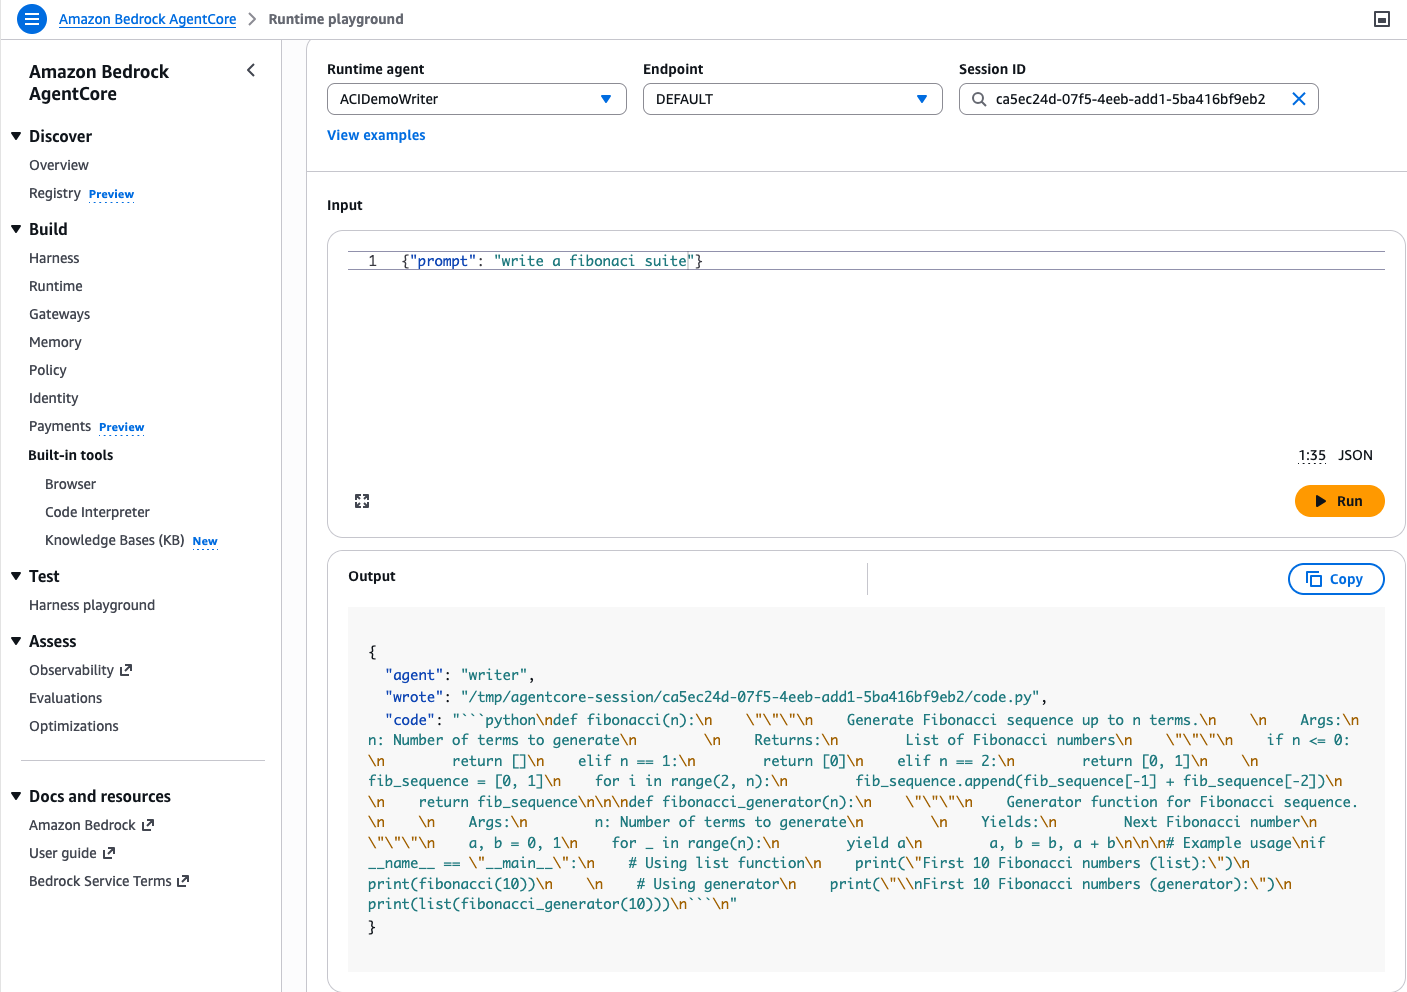
The Runtime playground opens. At the top, I see three fields: Runtime agent, Endpoint, and Session ID. The console generates a session ID automatically. I take note of it because I will reuse it with the reviewer agent.
In the Input field, I type a JSON payload asking the writer agent to generate code:
{"prompt": "write a fibonacci suite"}
I select Run. After a few seconds, the Output panel shows the agent’s response. The writer agent generated a Python module with two implementations of a Fibonacci sequence (a list-based function and a generator) and wrote it to /tmp/agentcore-session/ca5ec24d-07f5-4eeb-add1-5ba416bf9eb2/code.py. Notice the session ID in the file path. That directory is the shared file system for this session.
Step 4: Invoke the reviewer agent in the same session.
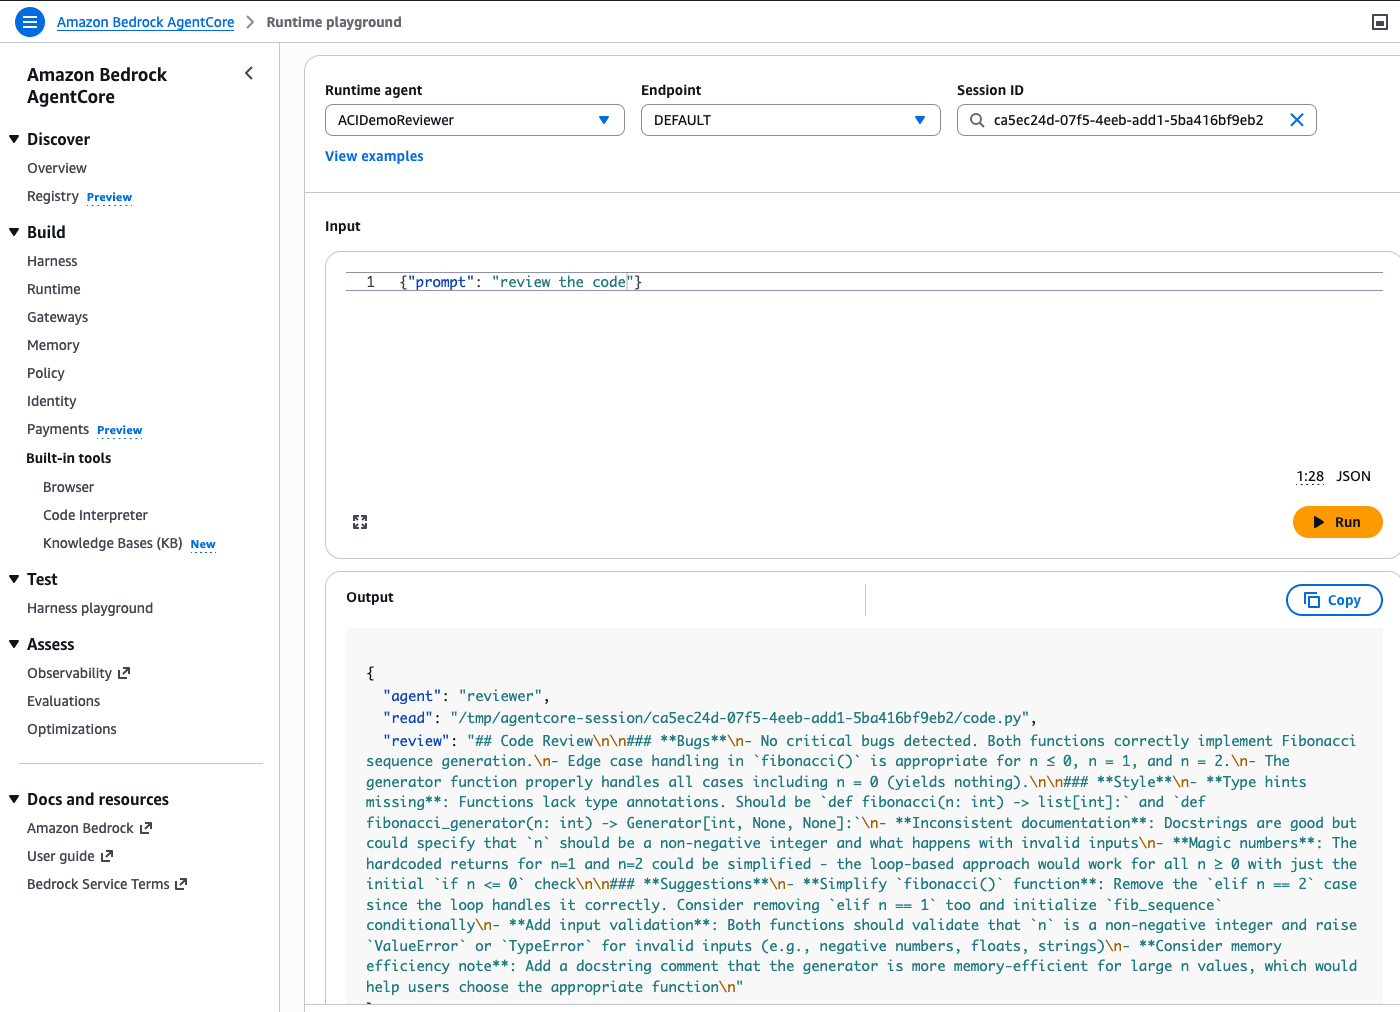
Now I switch the Runtime agent dropdown to ACIDemoReviewer. The important part: I paste the same session ID (ca5ec24d-07f5-4eeb-add1-5ba416bf9eb2) in the Session ID field. This is what connects the two agents.
I type a simple prompt:
{"prompt": "review the code"}
I select Run. The reviewer agent reads the file the writer produced from the shared session directory and returns a detailed code review. It finds no critical bugs but suggests adding type hints, input validation, and simplifying the edge case handling.
The two agents never exchanged messages or called each other’s APIs. They collaborated through the shared file system that runtime instances provide within a session. You can extend this pattern to any number of agents: a test agent that runs the code, a documentation agent that generates README files, a security agent that scans for vulnerabilities, all sharing the same working directory.
Key details Here are a few things to know as you get started:
Supported OS: Linux (ARM64 and x86_64) at launch.
Session persistence: Sessions persist for up to 14 days.
Runtimes: Python 3.11-14 with native code support. Container images also supported.
GPU: Support for GPU-accelerated instance types.
Integration: Uses the same AgentCore APIs, identity, observability, and policy controls as AgentCore Runtime.
Pricing: Standard EC2 pricing plus a management fee for AgentCore orchestration.
Regions: US East (Ohio, N. Virginia), US West (Oregon), Asia Pacific (Mumbai, Singapore, Sydney, Tokyo), and Europe (Frankfurt, Ireland)
Customers tell us that managing TLS certificates at scale is one of their biggest operational concerns. The Certification Authority Browser Forum (CA/Browser Forum) has mandated a phased reduction in maximum certificate validity for public certificates. By March 2027, the maximum validity drops to 100 days. By March 2029, it lasts for 47 days. For an organization managing 1,000 certificates, the final transition means roughly 30 renewal events every day. Renewal and rotations of renewed certificates at that cadence isn’t something manual processes or ticket-driven workflows can sustain at scale.
We recently announced Automated Certificate Management Environment (ACME) protocol support in AWS Certificate Manager (ACM). With this launch, you can use the ACME clients your teams already know, including popular open source tools like certbot, cert-manager, acme.sh, and win-acme, to automate public certificate issuance and renewal for your infrastructure. Customers that are using third-party certificate authorities (CAs) can point their existing ACME-compatible clients at ACM instead of their current CA, with minimal reconfiguration. This applies whether it’s running on Amazon Web Services (AWS), on premises, or in a hybrid environment. Certificates created through ACME are registered in ACM, giving you a unified view of your entire certificate inventory.
This post covers how the feature works, how to get started, and the controls and best practices to help you manage certificate issuance at scale.
Background
ACME is an open source protocol that automates the process of verifying domain ownership and issuing certificates and has become a standard mechanism for certificate automation. While ACM has long provided managed certificate issuance and renewal for AWS-integrated services such as Elastic Load Balancing (ELB), Amazon CloudFront, and Amazon API Gateway, many customers also need to automate certificates for their own infrastructure, including servers they manage in their data centers, Kubernetes clusters, Internet of Things (IoT) fleets, and hybrid environments. Until now, those customers had to turn to external providers. This launch brings the ACM automation model to that same infrastructure, using the standard ACME protocol with AWS managed certificate endpoints.
How it works
The feature introduces a new centrally provisioned and managed resource type: the ACME endpoint. Each endpoint is an AWS resource with a unique ACME directory URL and AWS Identity and Access Management (IAM)-based access controls. You create and manage endpoints through the ACM API or AWS Management Console, and point your existing ACME clients at the endpoint URL. Certificates issued through your endpoint are automatically registered with ACM, appearing in your certificate inventory alongside certificates created by the RequestCertificate and ImportCertificate API calls.
The architecture separates into two planes. In the control plane, PKI administrators use ACM APIs to create ACME endpoints, pre-approve the domains an endpoint is allowed to issue for, and generate external account binding (EAB) credentials. In the data plane, ACME clients register with an endpoint using EAB credentials and request certificates for domains the administrator has already validated. This architecture is how we provide customers the ability to scale. Instead of each client proving domain ownership on every request, a principal with appropriate ACM permissions (typically your PKI administrator) validates domains once at the endpoint level, and then application owners don’t need DNS credentials to get a certificate.
Adding to the data plane, EABs control client access to the endpoints. Each EAB is bound to an IAM role that controls what certificate operations the ACME client can perform, and credentials you generate in ACM are distributed to authorized ACME clients. An ACME client authorized for one endpoint can’t use a different endpoint. This creates security boundaries between environments. For example, a client authorized for your development endpoint can’t obtain certificates from your production endpoint.
Figure 1 shows the ACME request flow through ACM. An ACME client authenticates to an ACME endpoint using EAB credentials. The endpoint routes certificate orders to Amazon Trust Services for issuance. Issued certificates are registered in ACM inventory, where Amazon EventBridge and AWS CloudTrail provide expiration alerting and audit logging.
Figure 1: An ACME architecture and workflow
Getting started
Getting started with the new ACME feature in ACM is straightforward. Use the following steps to create your first ACME-generated certificate.
Prerequisites
An AWS account with permissions to create and manage ACM resources
An ACME client installed on your infrastructure (for example, Certbot, cert-manager, acme.sh, or others)
Amazon Route 53 hosted zone for your domain, or the ability to create a CNAME record with your DNS provider
Step 1: Create an ACME endpoint
Before you can use ACME clients with ACM, you need to create an ACME endpoint. This endpoint provides the URL that your ACME clients will use to request certificates.
Run the following command from the AWS CLI to create an ACME endpoint:
Before ACME clients can request a certificate, the administrator validates the domain using DNS once at the endpoint level. Use DomainScope to control exactly which certificate patterns are allowed:
Enabling only ExactDomain restricts clients to that specific name,
Subdomains enabled allows names like api.example.com,
Wildcards enabled allows *.example.com.
Leave a scope disabled to block that pattern outright, even if an otherwise-valid ACME request asks for it. For a production endpoint, consider enabling only ExactDomain and Subdomains and leaving Wildcards disabled for a stricter posture.
If your domain is hosted in Route 53, specifying HostedZoneId lets ACM create the required CNAME record automatically. If your domain is hosted elsewhere, omit it and create the provided CNAME record manually with your DNS provider. Validation typically completes within a few seconds after the record is in place.
EAB credentials authenticate your ACME clients to your endpoint. Generate a unique set of credentials for each client or environment to maintain security boundaries.
Run the following command to generate your EAB credentials, adjusting your expiration to fit your organization’s risk profile:
With your endpoint URL and EAB credentials ready, you can now configure your preferred ACME client. The following examples show configuration for two popular clients. As a reminder, the server information was retrieved in step 1, part 4 as the EndpointUrl.
After the initial registration, your ACME client handles renewals.
Enterprise controls
Other ACME alternatives can provide certificates but don’t give the same amount of control and governance for customers that need to scale their certificate environment. The following controls are available to help reduce risk across your organization.
Domain validation
Customers managing large numbers of domains told us they need a way to prevent unauthorized certificate issuance across their domain space. Domain validation gives you this control. For each domain you validate, you enable the certificate patterns it should be allowed to issue, whether it’s ExactDomain, Subdomains, or Wildcards. For example, if you validate internal.example.com and enable only Wildcards, an ACME client can request *.internal.example.com but a request for internal.example.com itself or api.internal.example.com is rejected. This enforcement happens at the endpoint level, before requests reach the ACM certificate authority, and you can validate multiple domains under a single endpoint, each with its own scope.
Centralized certificate visibility
Certificates issued through your ACME endpoints are registered with ACM. You can use the aws acm list-certificates command to see all your issued certificates.
IAM authorization, CloudTrail audit logging and observability
Endpoint management operations are authorized through IAM and logged to CloudTrail. You can use IAM policies to control which principals can create endpoints, generate EAB credentials, and manage domain constraints.
Best practices
For customers implementing ACME certificates for the first time, consider the following best practices for your organizations.
Segment endpoints along organizational or environment boundaries
The endpoint serves as a useful method of isolation for larger organizations. A large enterprise can create one endpoint per organizational boundary (business unit, subsidiary, or environment) instead of a single shared endpoint company-wide. Each endpoint has its own pre-approved domains and its own set of EABs, so a compromised credential in one business unit has no path to certificates in another.
However, weigh this against your operational overhead as well. A reasonable starting point is one endpoint per environment (dev, staging, andprod) within a business unit, expanding to per-business-unit endpoints only where compliance or organizational requirements call for it.
Manage EAB credentials securely
Anyone holding a validKeyIdandMacKeyfor an endpoint can obtain certificates for any domain pre-approved on that endpoint, so these credentials deserve the same handling you’d give an access key.
Avoid hard coding theMacKeywhere possible by using a secret store such as AWS Secrets Manager. Distribute it only to the ACME clients that you authorize to use the endpoint.
Set the expiration of the EAB to an acceptable level. While EAB supports long-lived credentials, not all scenarios require an indefinitely long EAB.
When creating the role for each EAB, adhere to concept of least privilege. Creating a role per EAB, rather than sharing a role across all bindings, can help reduce risk in your AWS environment.
Audit CreateAcmeExternalAccountBinding and GetAcmeExternalAccountBindingCredentials calls in CloudTrail separately. Because retrieving the actual key material is a distinct API call from creating the binding, alerting on retrieval events is a stronger signal of real credential distribution than binding creation alone.
Automate how EABs are associated with clients at runtime
Generate a unique set of EAB credentials for each client or environment rather than sharing one binding across multiple ACME clients. As you begin to scale with multiple endpoints, usesome of the following patterns to reduce operational toil.
Name each EAB and its bound IAM role after the client it belongs to (team, application, environment), so the binding’s purpose is obvious from DescribeAcmeExternalAccountBinding output alone, without cross-referencing a spreadsheet.
Store each client’s KeyId and MacKey under a secrets path scoped to that client (for example, a Secrets Manager path per team and environment), and let the client’s provisioning pipeline retrieve its own credentials.
In Kubernetes, use one ClusterIssuer or namespace-scoped Issuer per EAB rather than one shared issuer across teams. This keeps the client-to-EAB association explicit in cluster config, and lets you revoke one team’s access without touching anyone else’s.
For ephemeral infrastructure (build agents, autoscaled fleets), provision EAB credentials as part of your infrastructure-as-code or continuous integration and deployment (CI/CD) pipeline instead of a one-time manual handoff, so credential lifecycle tracks infrastructure lifecycle.
Monitor your deployment of ACME
ACME’s power is through automation, and organizations should monitor their ACME usage for anomalies.
Alarm on issuance failures, not just successes. At 45-day certificate validity, a silent renewal failure gives you far less runway to react than the months of time you might be used to with longer-lived certificates.
Test renewal automation before you depend on it. Force a manual renewal against a non-production endpoint and confirm your client, monitoring, and on-call runbooks behave as expected, before the CA/Browser Forum’s shortened validity windows turn a failed renewal into a disruptive event for your organization.
Availability and pricing
ACME support in AWS Certificate Manager is available today in all commercial AWS Regions and will be available in AWS GovCloud (US), the China Regions, and the AWS European Sovereign Cloudpartitions at a later date. See the ACM pricing page for more information on ACME pricing.
Conclusion
The phased reduction in certificate validity can’t easily be solved without automation. ACME support in ACM gives you that automation through a standard protocol and standard tooling, while keeping the visibility and governance controls your security teams rely on from ACM.
This post is co-written with Govind Menon, Head of MCP Product at ServiceNow.
Introduction
Enterprise teams managing applications on AWS often rely on ServiceNow as their IT service management (ITSM) system for incident tracking, change management, and configuration management. When incidents occur, engineers must context-switch between AWS, third party observability tools and ServiceNow, manually correlating data across those sources before updating ServiceNow incident records. This fragmented workflow delays resolution, increases mean time to resolution (MTTR), and introduces the risk of missed signals.
AWS DevOps Agent is a frontier agent that resolves and proactively helps prevent incidents, continuously improving reliability and performance of applications in AWS, and hybrid environments. In this post, we demonstrate how to integrate AWS DevOps Agent with ServiceNow using the Model Context Protocol (MCP) and ServiceNow Action Fabric, enabling autonomous incident investigation and resolution workflows that are governed by ServiceNow and that execute and record authorized actions directly on the application.
By the end of this post, you will be able to:
Configure AWS DevOps Agent as an MCP client connecting to ServiceNow MCP Server created in the MCP Server Console
Authenticate securely via OAuth 2.0 between AWS DevOps Agent and ServiceNow
Enable dynamic discovery of ServiceNow tools exposed through Action Fabric and governed through the ServiceNow MCP Server Console
Automate root cause analysis directly within ServiceNow incidents
Integrating ServiceNow MCP Server with AWS DevOps Agent
The integration between ServiceNow MCP Server and AWS DevOps Agent connects ITSM workflows with automated incident response through the Model Context Protocol (MCP), an open standard for AI agent-to-tool communication.
ServiceNow MCP Server Console lets you create a ServiceNow MCP Server and configure the tools it exposes, capabilities such as incident management, CMDB queries, and change requests as discoverable tools. The console governs what the agent can see and do through tool-level scoping, access control lists, and role masking. It is the access channel for ServiceNow Action Fabric, the application’s governed action layer: ServiceNow does not merely store the agent’s output, it controls and executes the actions the agent is authorized to perform.
AWS DevOps Agent acts as an MCP client that dynamically discovers available ServiceNow tools at runtime. You can create tools based on existing capabilities, such as ServiceNow NowAssist Skills.
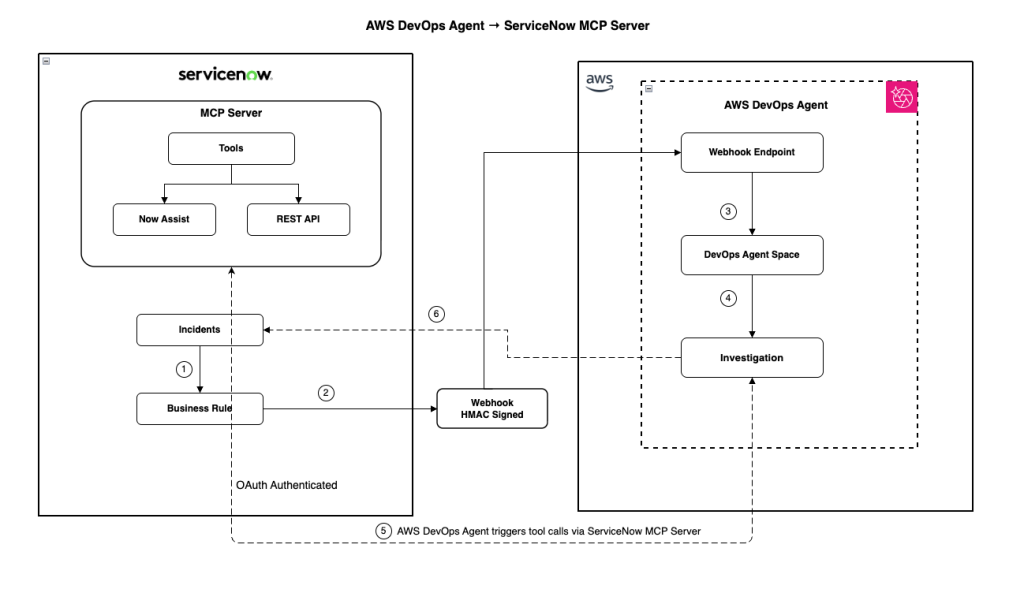
When a ServiceNow incident triggers AWS DevOps Agent, the following happens:
Correlates telemetry from Amazon CloudWatch, deployment data, and code changes
Discovers available ServiceNow tools through the ServiceNow MCP Server
Queries ServiceNow for related incidents, change records, and CMDB context
Identifies root cause by correlating AWS telemetry with ServiceNow operational data
Writes findings, root cause analysis, and mitigation plans directly into the ServiceNow incident
Executes governed actions on the application (for example, creating a change request) through the tools the ServiceNow MCP Server Console exposes, where authorized
Security is built into every interaction. Communication uses OAuth 2.0 authentication with scoped
Permissions. The ServiceNow MCP Server Console governs which tools the agent can access and what actions it can perform, with every invocation authenticated, authorized at the tool and skill level, and recorded in an auditable trail that ServiceNow AI Control Tower can observe.
Figure 1: Integration architecture showing AWS DevOps Agent connecting to ServiceNow via MCP Server
Prerequisites
Before you begin, make sure you have access to and understanding of the following:
An AWS account with permissions to create AWS Identity and Access Management (IAM) roles:
Created AWS DevOps Agent Space role and Web app role
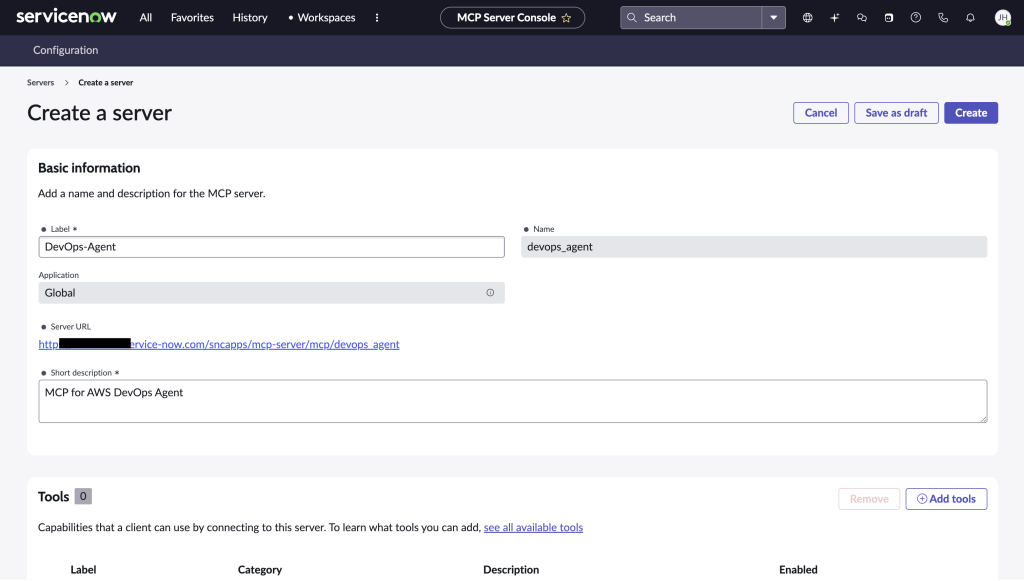
Step 1: Configure the ServiceNow MCP Server and its Tools in the MCP Server Console
As first step, configure the ServiceNow instance to expose capabilities through the MCP Server:
Navigate to the MCP Server Console in the ServiceNow Instance
Create a new MCP Server (or select the MCP server provisioned).
Figure 2: MCP Server Console in ServiceNow Instance
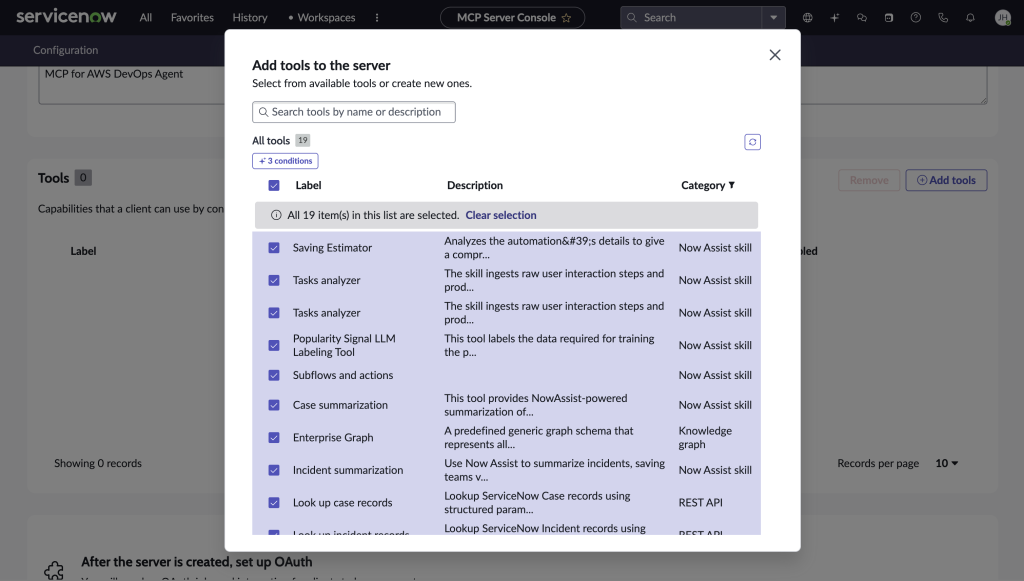
Add Tools for the capabilities the agent needs (for example, incident read and update, CMDB query, change request creation), and scope each with ACLs and role masking so the agent can perform only authorized actions.
Figure 3: Tool selection in ServiceNow MCP Server
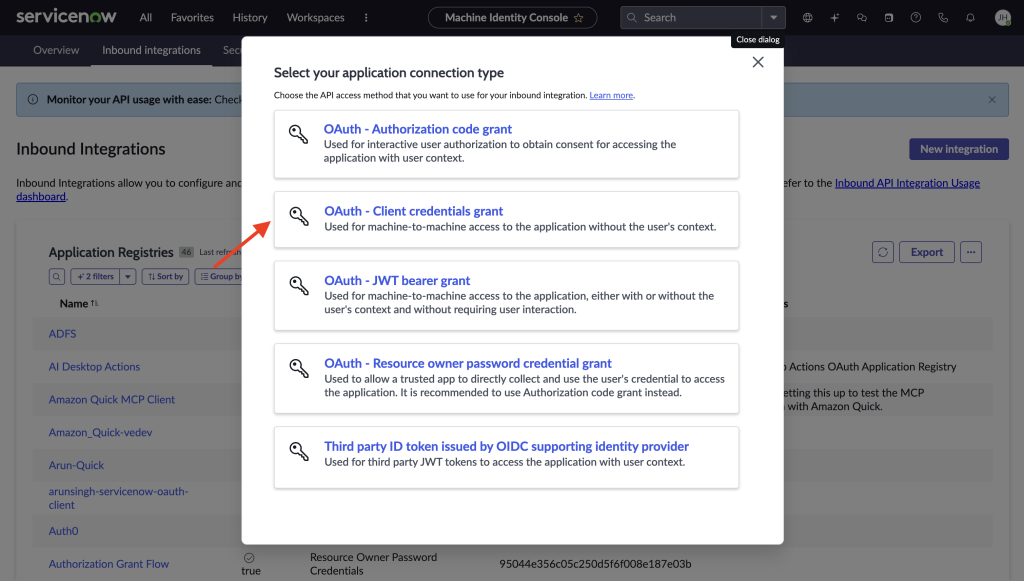
Configure inbound authentication for the MCP Server.
Figure 4: Create Inbound Integration – OAuth Client Credentials grant
Step 2: Create and configure a DevOps Agent Space
Create an AWS DevOps Agent Space in your AWS account to define the scope of resources the agent will monitor and investigate:
Access the AWS DevOps Agent console
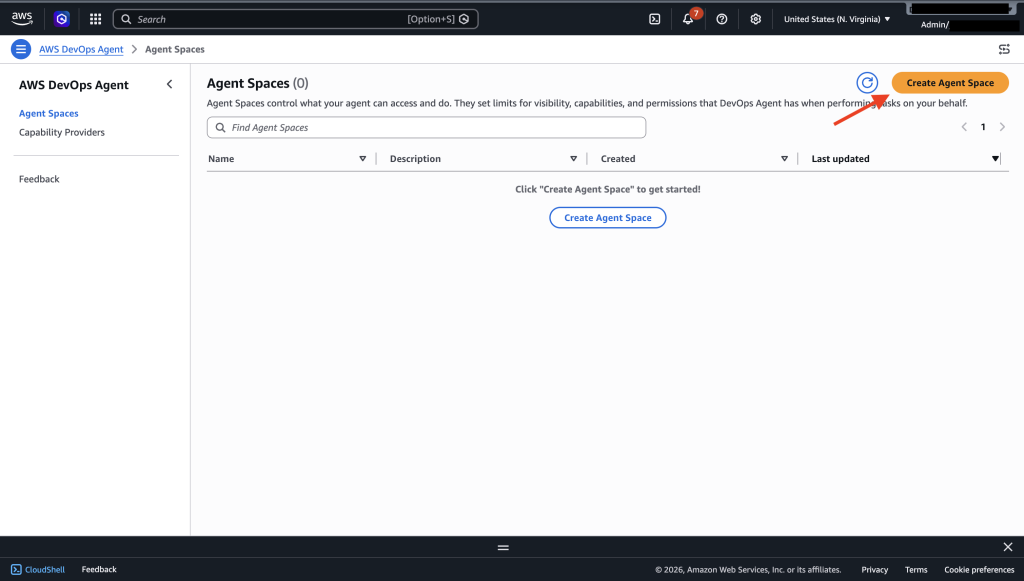
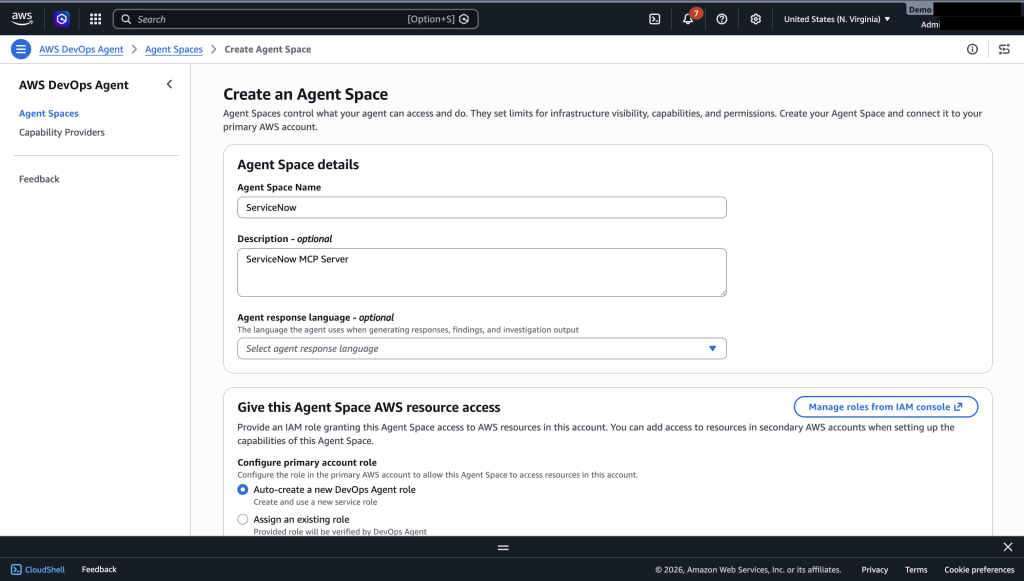
Choose Create Agent Space and provide a name and description, and configure the required IAM roles (automated or manual setup)
Figure 5: Creating an Agent Space in the AWS DevOps Agent console
Figure 6: Agent Space Name and IAM role configuration
Confirm creation of AWS DevOps Agent Space.
Step 3: Register ServiceNow MCP Server in the AWS DevOps Agent console
Register your ServiceNow MCP Server connection to enable tool discovery in the AWS DevOps Agent console.
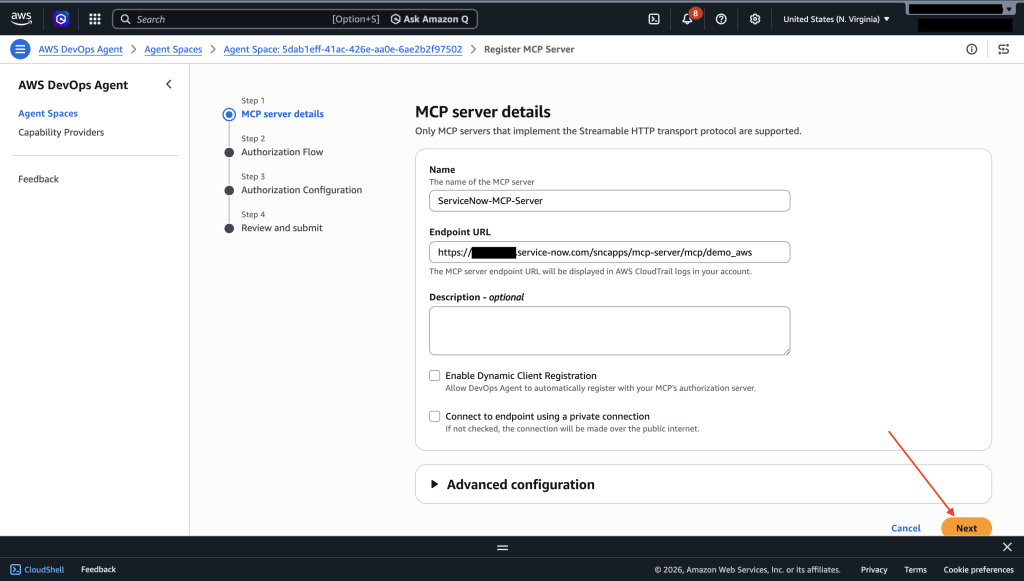
Navigate to Capability Providers in the AWS DevOps Agent console. Under MCP Server, select Add source, then Register New MCP Server.
Enter your ServiceNow MCP Server endpoint URL:https://<instance>.service-now.com/sncapps/mcp-server/mcp/<server_label>
Figure 7: Entering the ServiceNow MCP Server endpoint URL
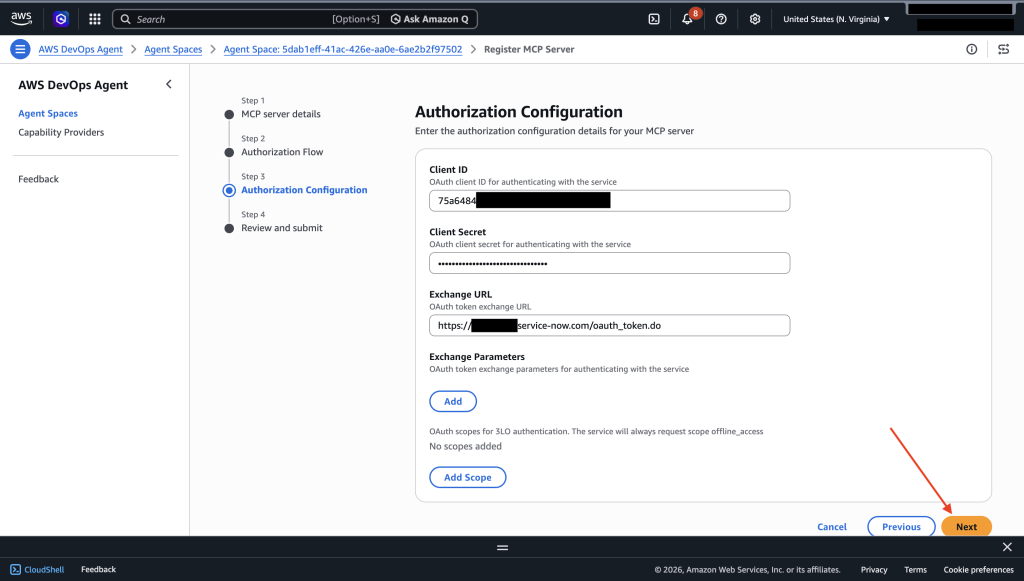
Select OAuth Client Credentials as the authorization flow. Enter the Client ID, Client Secret, and Exchange URL (https://<instance>.service-now.com/oauth_token.do) from Step 1.
Figure 8: OAuth Client Credentials configuration for the ServiceNow MCP Server
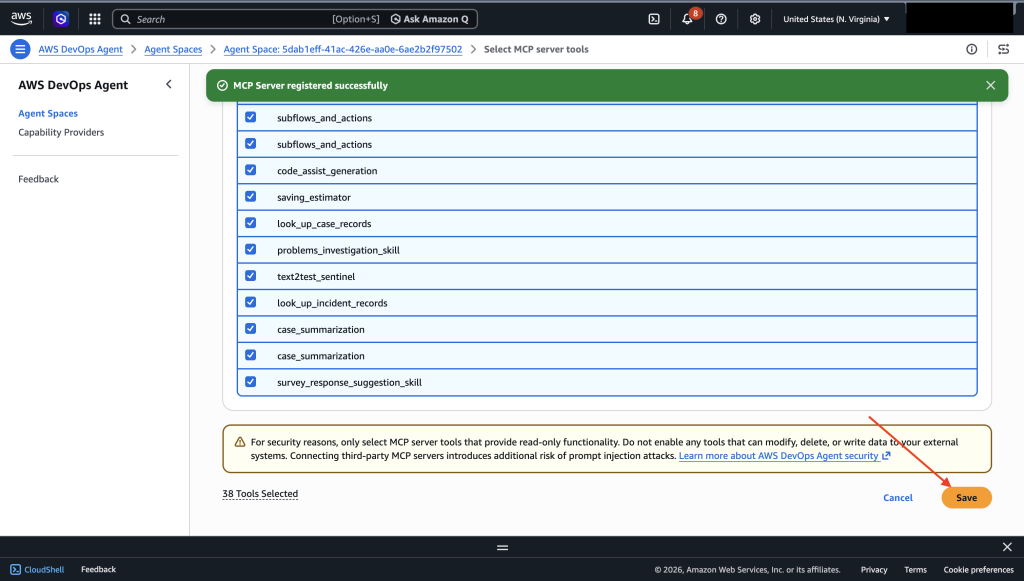
Submit the registration. AWS DevOps Agent validates the connection and discovers available tools. Select the tools to add to your Agent Space.
Figure 9: Selecting ServiceNow MCP tools to add to the Agent Space
Confirm the MCP Server is associated and tools are connected.
Putting It All Together: End-to-End Test
Once the setup is complete, we need to make sure the connection is working.
Navigate to Operator Access in the AWS DevOps Agent Space.
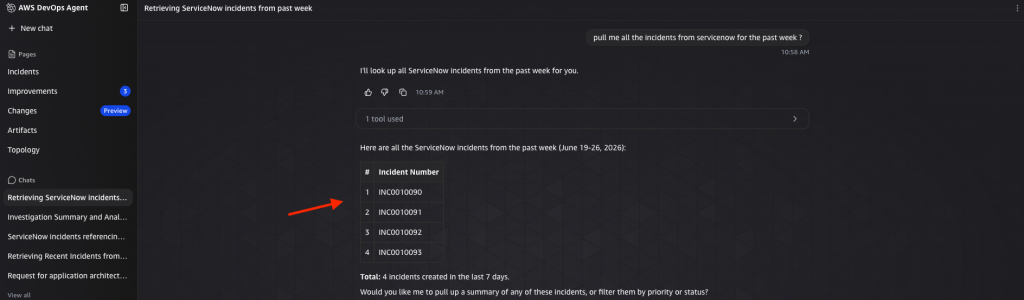
Open a new chat window, and type “Can you show me all the incident in the past week from ServiceNow”
Make sure the Agent calls the ServiceNow tools and shows the right results.
Figure 10: Test the ServiceNow MCP connection from AWS DevOps Agent
You can also configure your environment so that the creation of an incident in ServiceNow automatically triggers the AWS DevOps Agent. To set up this integration, follow the AWS documentation to establish the connection between AWS DevOps Agent and your ServiceNow instance. Then, create a Business Rule in ServiceNow. This enables incident creation to seamlessly trigger the DevOps Agent without manual intervention.
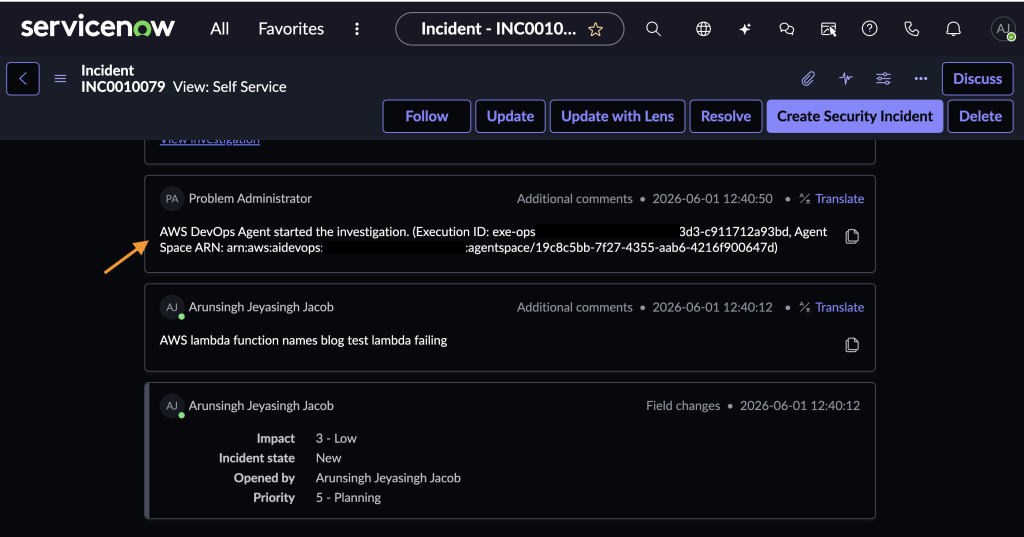
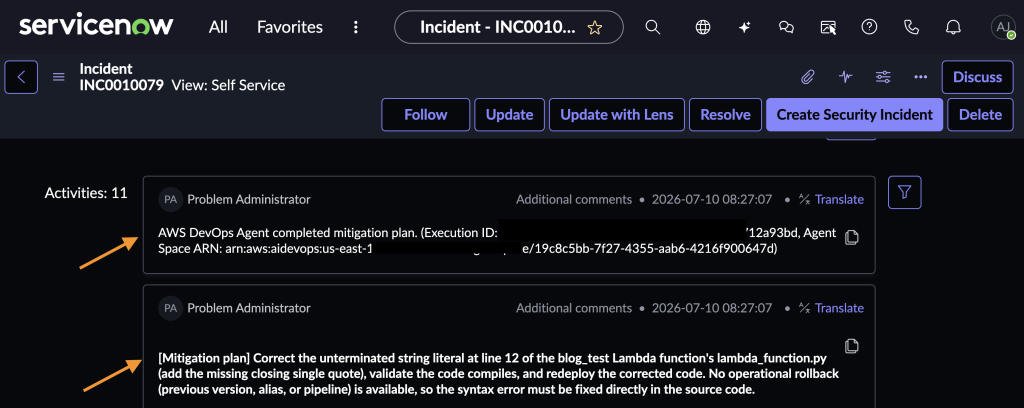
Once this setup is complete, here’s how the workflow comes together: when an incident is created, the DevOps Agent automatically investigates and adds relevant context such as root cause analysis, related changes, and affected resources directly back into the incident record. This means that by the time your Operations or SRE team picks up the incident, they already have the context they need to begin resolution, significantly reducing triage time and accelerating mean time to recovery (MTTR).
Figure 11: AWS DevOps Agent initiating an automated investigation on the ServiceNow incident
Figure 12: AWS DevOps Agent mitigation plan posted to the ServiceNow incident
Clean up
To avoid incurring ongoing costs, clean up your resources when you are done using the integration. For details on pricing, visit the AWS DevOps Agent pricing page.
When you are done using the integration, clean up your resources:
Delete your Agent Space from the AWS DevOps Agent console
Remove the ServiceNow MCP Server connection from your settings
Delete the IAM roles created for the Agent Space
(Optional) Disable the MCP Server configuration in your ServiceNow instance
Conclusion
For organizations running workloads on AWS and managing operations through ServiceNow, incident response has long meant toggling between systems and racing to document findings before context fades. The integration between AWS DevOps Agent and ServiceNow through MCP and Action Fabric alleviates that gap. The agent investigates autonomously, correlates telemetry with operational context, and documents root cause and mitigation directly in the incident record, compressing resolution times from hours to minutes.
And because the connection is built on MCP, an open protocol for agent-to-tool communication, what you configure today continues to expand as your ServiceNow workflows evolve. New tools exposed through Action Fabric are discovered and available to the agent immediately. To get started, visit the AWS DevOps Agent product page and ServiceNow MCP Server Console page.
Security teams investigating AI-related incidents need guardrail intervention data alongside their existing security telemetry. Routing Amazon Bedrock Guardrails violations to Amazon Security Lake makes this possible. With this integration, you can query guardrail events alongside identity, network, and application security data in a single layer. When a guardrail blocks a prompt injection attempt or redacts sensitive data, that intervention carries investigative value comparable to a failed sign-in or a network intrusion alert. Amazon Bedrock publishes this telemetry to Amazon CloudWatch metrics and model invocation logs for operational monitoring. By using Security Lake, organizations can extend this telemetry into their security data lake for unified correlation.
In this post, I show you how to build an automated pipeline that transforms Amazon Bedrock Guardrails intervention events into Open Cybersecurity Schema Framework (OCSF) records and delivers them to Security Lake as a custom source. You can query the data using Amazon Athena or any Security Lake subscriber.
Use case
Consider a financial services organization deploying Amazon Bedrock across multiple business units. Each unit uses guardrails to enforce content policies (blocking harmful content), topic policies (preventing off-topic queries about competitors), sensitive information policies (redacting personally identifiable information (PII) such as account numbers), and prompt injection detection.
The security team needs to:
Identify which user accounts trigger the most guardrail interventions and whether those accounts also have unusual AWS Identity and Access Management (IAM) activity
Track the organization-wide trend of guardrail violations across all business units and compare it against the baseline from 30 days ago
With guardrail events routed to Security Lake, a single Athena query covers all three.
Solution overview
The pipeline architecture routes Amazon Bedrock security events to Security Lake as OCSF-compliant records. The same infrastructure—subscription filter, AWS Lambda transformation, Parquet writer, Amazon Simple Storage Service (Amazon S3) partitioning—supports multiple event types by changing the filter pattern and OCSF mapping:
This post demonstrates the guardrail interventions implementation as a working example. The solution captures Amazon Bedrock model invocation logs that contain guardrail trace data and filters for intervention events. It transforms matching events into OCSF-compliant Detection Finding records (class_uid 2004) and delivers them to Security Lake as Parquet files. Guardrail interventions are detection events: the guardrail detected and blocked prohibited content, so OCSF class 2004 (Detection Finding) under the Findings category is the appropriate classification.
Architecture
The following diagram shows the end-to-end pipeline from guardrail intervention to Security Lake ingestion.
Figure 1: Guardrail intervention routing
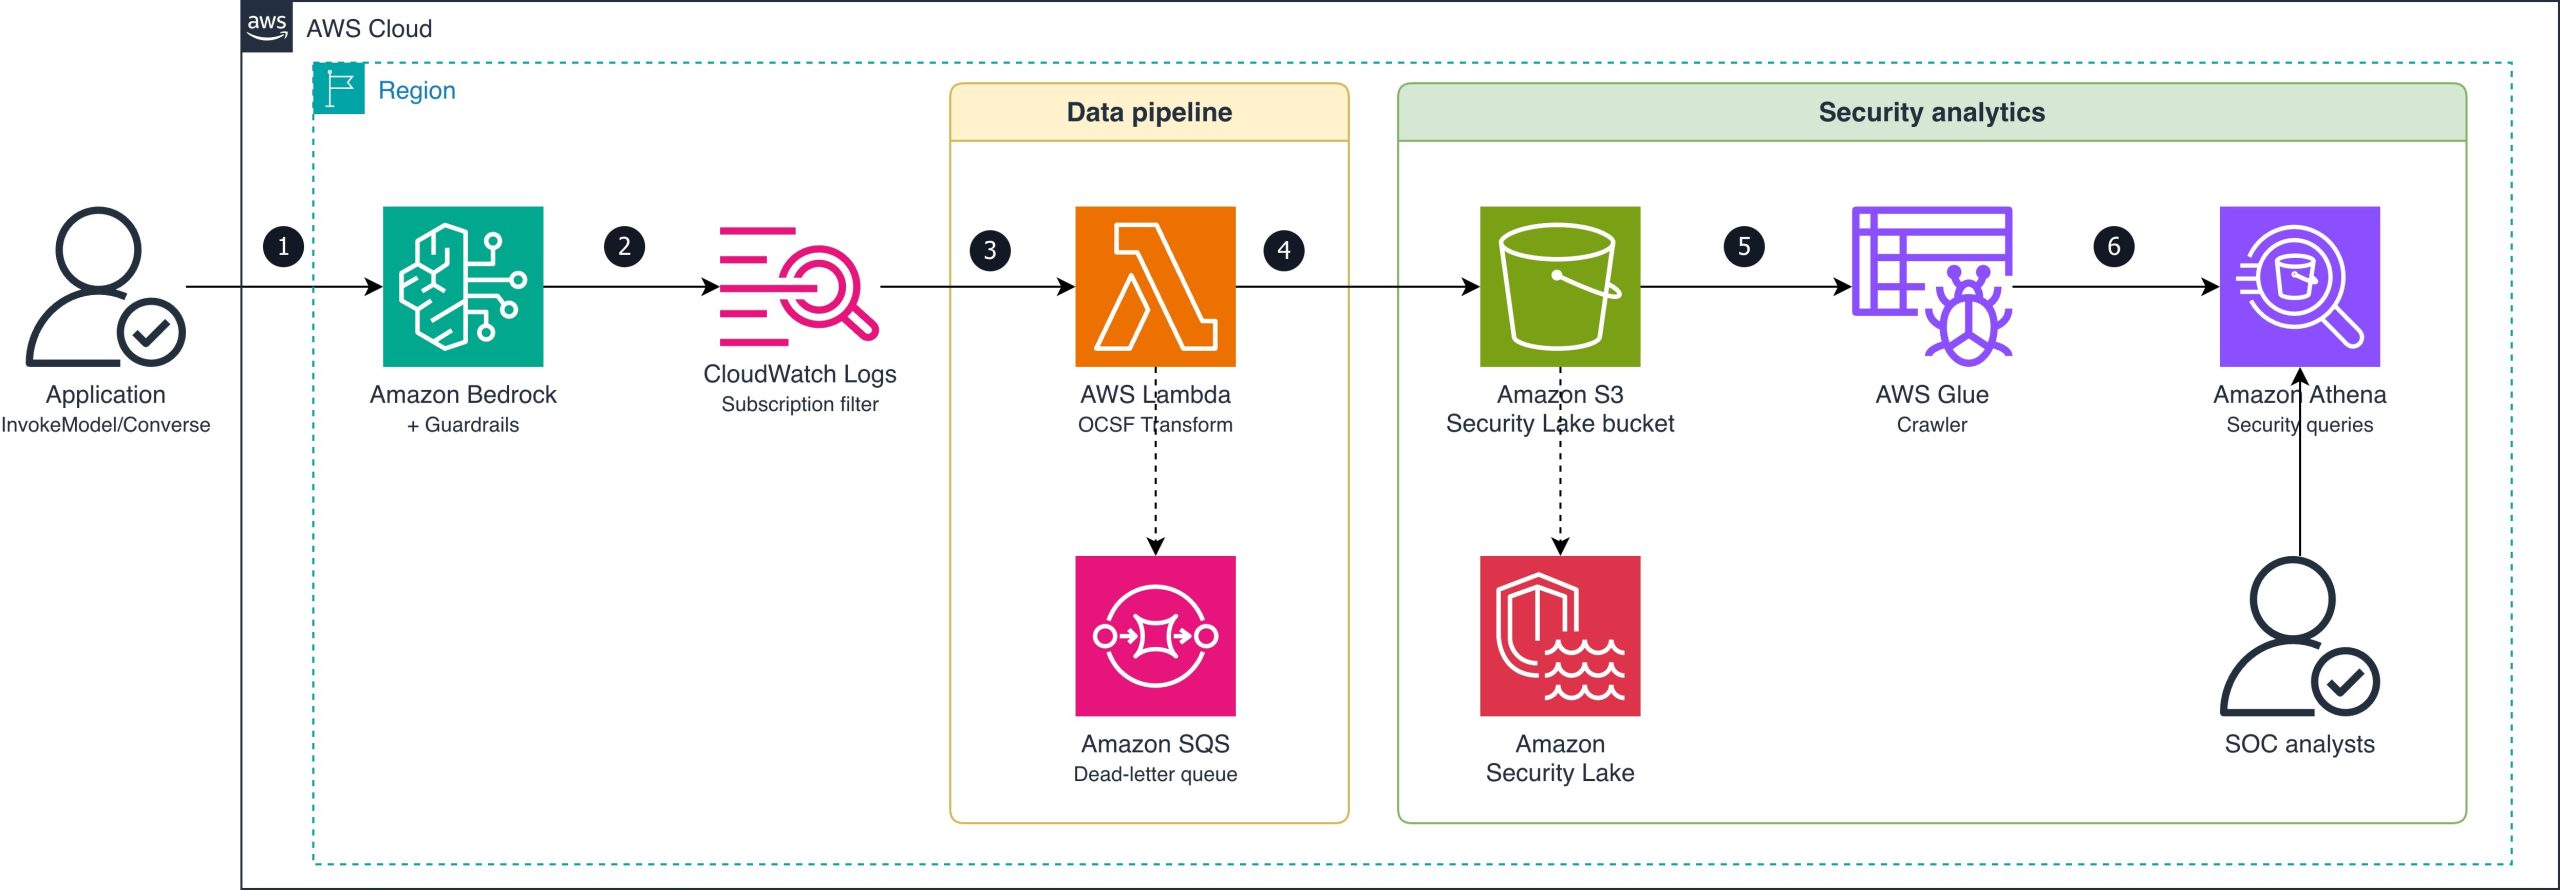
The data flow consists of the following steps:
An application calls Amazon Bedrock (InvokeModel or Converse API) with a guardrail attached.
Amazon Bedrock evaluates the guardrail and logs the invocation (including guardrail trace data) to a CloudWatch Logs log group using model invocation logging. The subscription filter matches log entries where the guardrail action is INTERVENED (blocked or masked content).
The subscription filter delivers matching records to a Lambda function (OCSF Transform).
The Lambda function transforms each intervention event into an OCSF Detection Finding record (class_uid 2004), batches records, and converts them to Zstandard (zstd)-compressed Apache Parquet format. It writes the Parquet file to the Amazon S3 Security Lake bucket using the required partition path (ext/BedrockGuardrails/region=/accountId=/eventDay=/). If the Lambda function fails to process a record, the message routes to an Amazon Simple Queue Service (Amazon SQS) dead-letter queue for later analysis and redrive.
Security Lake manages the ingested Parquet data in the S3 bucket.
AWS Glue crawler detects new partitions and catalogs the Parquet files for query access.
SOC analysts query guardrail violation data alongside other security sources using Athena.
OCSF mapping
The following table shows how Amazon Bedrock Guardrails intervention fields map to OCSF Detection Finding (class_uid 2004) attributes.
OCSF field
Source
Example value
class_uid
Static
2004 (Detection Finding)
category_uid
Static
2 (Findings)
severity_id
Derived from policy type
3 (Medium) for content/topic; 4 (High) for prompt injection
An existing Amazon Bedrock guardrail (or create one during deployment)
Model invocation logging enabled on Amazon Bedrock (with guardrail trace data enabled)
Implementation
The reference implementation deploys three CloudFormation stacks: SecurityLakeSourceStack, TransformPipelineStack and MonitoringStack. The following commands deploy the stacks in dependency order:
Model invocation logging captures the guardrail trace data you need. Turn on full request and response logging to a CloudWatch Logs log group. Configure textDataDeliveryEnabled to capture text request and response bodies, which include the guardrail trace output when a guardrail is attached to the invocation.
Register Security Lake custom source
Register BedrockGuardrails as a custom source with Security Lake using the DETECTION_FINDING event class. Security Lake creates the Amazon S3 prefix and IAM role for your source. The stack configures the AWS Glue crawler role for partition discovery.
Create the subscription filter
Create a CloudWatch Logs subscription filter on your model invocation log group with the filter pattern { $.output.guardrailAction = “INTERVENED” }. This captures only the events where a guardrail blocked or modified content, not the successful pass-through events. This reduces Lambda invocations and cost.
Transform to OCSF and write Parquet
The Lambda function performs three operations: parse the CloudWatch Logs event, transform each intervention to an OCSF Detection Finding record (class_uid 2004), and write batched records as Parquet files. The files are written to the Security Lake S3 bucket using the required partition path (ext/BedrockGuardrails/region=<region>/accountId=<accountId>/eventDay=<YYYYMMDD>/).
The transformation maps guardrail trace fields to OCSF attributes as described in the OCSF mapping table. Severity is set to High for prompt injection interventions and Medium for content, topic, or sensitive information interventions. For a concrete before-and-after example, see the sample invocation log and corresponding OCSF output in the companion repository.
Scaling considerations: At low intervention volumes (tens of events per hour), direct Lambda writes produce acceptably sized Parquet files. For higher volumes, consider buffering through Amazon Data Firehose with its native Parquet conversion and 5-minute buffering interval to produce fewer, larger files that optimize Athena query performance.
Multi-account deployment: The partition scheme (accountId=<account>) already supports multi-account environments. Deploy the subscription filter and transform pipeline in each workload account where model invocation logging is enabled. Each pipeline writes cross-account to the delegated-administrator Security Lake bucket. Distribute the pipeline using CloudFormation StackSets across the organization.
Query violations in Athena
After deployment, guardrail violations typically appear in your Security Lake tables within 5–10 minutes, depending on the AWS Glue crawler schedule. You can then run cross-service correlation queries. The following example identifies users who trigger both prompt injection interventions and unusual IAM activity:
WITH guardrail_violators AS (
    SELECT actor.user.uid AS user_arn, COUNT(*) AS violation_count
    FROM "amazon_security_lake_glue_db_us_east_1"."amazon_security_lake_table_us_east_1_bedrockguardrails"
    WHERE eventDay >= '20260701'
      AND unmapped.guardrail_policy_type = 'PromptAttack'
    GROUP BY actor.user.uid
),
iam_failures AS (
    SELECT actor.user.uid AS user_arn, COUNT(*) AS failure_count
    FROM "amazon_security_lake_glue_db_us_east_1"."amazon_security_lake_table_us_east_1_cloud_trail_mgmt_2_0"
    WHERE eventDay >= '20260701'
      AND status_id = 2
    GROUP BY actor.user.uid
)
SELECT g.user_arn, g.violation_count, i.failure_count
FROM guardrail_violators g
JOIN iam_failures i ON g.user_arn = i.user_arn
ORDER BY g.violation_count DESC;
You can also track violation trends by policy type over time to establish baselines and detect spikes. The following query shows the 30-day trend:
SELECT eventDay,
       unmapped.guardrail_policy_type AS policy_type,
       COUNT(*) AS violation_count
FROM "amazon_security_lake_glue_db_us_east_1"."amazon_security_lake_table_us_east_1_bedrockguardrails"
WHERE eventDay >= '20260623'
GROUP BY eventDay, unmapped.guardrail_policy_type
ORDER BY eventDay, violation_count DESC;
The OCSF mapping has been validated against schema version 1.3.0, and the Security Lake AWS Glue crawler correctly detects the partitioned Parquet files for querying.
Alternative for teams not yet using Security Lake: If your organization hasn’t adopted Security Lake, you can query guardrail intervention events directly in CloudWatch Logs Insights using the same subscription filter log group. CloudWatch Logs Insights supports cross-log-group queries, so you can correlate guardrail events with other CloudWatch log sources without the OCSF transformation step. Security Lake adds value when you need to join with non-CloudWatch sources in a single query layer. Examples include Amazon VPC Flow Logs, Amazon Route 53 DNS logs, and third-party findings.
Clean up
To avoid ongoing charges, destroy the stacks in reverse dependency order:
In this post, you learned how to route Amazon Bedrock Guardrails intervention events to Amazon Security Lake as OCSF-compliant Detection Finding records. This integration extends guardrail telemetry from Amazon CloudWatch into your security data lake. Security analysts can then run cross-service correlation of AI intervention events with IAM, network, and application telemetry.
The pipeline filters for intervention events only, keeping costs low while capturing the security-relevant signals. The records use OCSF event class 2004 (Detection Finding), which integrates with supported Security Lake subscribers such as Amazon OpenSearch Service and third-party SIEM tools.
Clone the reference implementation and adapt the OCSF mapping and subscription filter to your organization’s guardrail configuration.
As enterprise lakehouses grow to thousands of tables across multiple business domains and regions, scaling fine-grained access control becomes a critical governance challenge. Data governance teams spend significant time manually granting table-level permissions, only to face permission drift, inconsistent enforcement, and limited auditability. Without a scalable approach, each new dataset requires manual policy updates, increasing the risk of unauthorized access and slowing time-to-insight for analysts and data scientists.
As organizations mature their lakehouse environments, governance complexity increases with each new dataset. Several challenges commonly emerge:
Explosive dataset growth: Iceberg-based lakehouses often contain thousands of tables distributed across raw, curated, and conformed zones. Each new dataset introduces additional governance requirements, making table-level permission grants operationally expensive.
Multi-domain data ownership: Enterprise lakehouses typically serve multiple business domains such as commercial analytics, clinical research, and regulatory reporting. These domains require strict isolation while still supporting controlled data sharing.
Regional data sovereignty: Organizations operating globally must enforce geographic boundaries for sensitive datasets. EU clinical trial data might be restricted by GDPR regulations, whereas US commercial datasets follow different compliance frameworks.
Sensitivity-based access controls: Within each domain, datasets vary in sensitivity. Pricing strategies, drug discovery research, and patient-related datasets require stricter access controls than standard operational data.
Role explosion: Pure RBAC approaches attempt to encode these dimensions into roles, leading to role proliferation. Manual Lake Formation grants at the table level create permission drift and limited scalability.
To address these challenges, enterprise lakehouse governance must satisfy several criteria:
Least-privilege access.
Dynamic scalability as new datasets are onboarded.
Multi-dimensional enforcement across domain, region, and sensitivity.
Auditability traceable to individual users.
Automation-ready, configuration-driven workflows.
TBAC addresses each of these challenges directly. Instead of granting permissions on individual tables, you define tag-based policies that automatically apply to any resource matching the tag expression. New datasets inherit access rules through tag inheritance, eliminating manual policy updates (solving explosive dataset growth). Domain and region tags enforce strict isolation between business units (solving multi-domain ownership and regional sovereignty). Sensitivity tags control access within domains without role proliferation (solving sensitivity-based controls and role explosion). The following sections describe the architecture that implements this model and walk you through deploying it end to end.
Reference architecture overview
The governance model integrates identity, metadata, and lakehouse services into a unified access architecture that enforces fine-grained permissions consistently across analytics and machine learning (ML) workloads. The architecture consists of five layers, each handling a distinct responsibility in the access control flow.
The following diagram illustrates the end-to-end architecture, showing how user identity flows from IAM Identity Center through SageMaker Unified Studio to Lake Formation for tag-based policy evaluation against the AWS Glue Data Catalog and Amazon S3 storage layer.
Figure 1: End-to-end governance architecture for the enterprise lakehouse
1. Identity and authentication layer: IAM Identity Center manages user identities and group memberships, integrates with corporate identity providers, and provides centralized lifecycle management for enterprise users. IAM Identity Center groups represent business roles and serve as the principals that receive Lake Formation permissions.
2. Unified analytics and ML access layer: Amazon SageMaker Unified Studio serves as the primary interface where analysts, data scientists, and ML engineers discover datasets, run queries, and build ML workflows. Because SageMaker Unified Studio integrates with multiple compute engines, including Amazon Athena, AWS Glue, Amazon EMR, and Amazon Redshift, users can access data using their preferred analytics tools while maintaining consistent governance.
3. Governance and authorization layer: AWS Lake Formation provides fine-grained access control across AWS Glue catalog resources using LF-Tags. Instead of granting permissions directly on databases and tables, Lake Formation evaluates LF-Tag policies dynamically and grants or denies access at query time. Governance teams define access rules once, and Lake Formation automatically applies them to new datasets as they are onboarded.
4. Governance automation layer: Two AWS Lambda functions automate tag assignment and permission provisioning. JSON metadata configuration files drive both pipelines, so governance teams manage access control through configuration rather than manual console operations.
5. Metadata and storage layer: Apache Iceberg tables stored in Amazon S3 form the foundation of the lakehouse. You register these tables in the AWS Glue Data Catalog, which provides centralized metadata management and interoperability across analytics services. Lake Formation evaluates governance decisions at the catalog level rather than independently by each analytics engine.
End-to-end access flow
When a user queries a dataset from SageMaker Unified Studio, the following sequence occurs:
The user authenticates through IAM Identity Center and accesses SageMaker Unified Studio.
SageMaker passes the user’s identity context to downstream analytics services using trusted identity propagation.
The analytics engine requests data access from Lake Formation.
Lake Formation evaluates LF-Tag policies against the user’s IAM Identity Center group membership.
Access is granted or denied dynamically at query time.
Because authorization decisions are centralized in Lake Formation, governance remains consistent regardless of which analytics engine the user employs.
Hybrid RBAC + ABAC governance model
The governance model combines identity context from IAM Identity Center with metadata-driven classification using LF-Tags. The following table summarizes how each layer contributes to the overall governance workflow.
Governance capability
IAM Identity Center contribution
Lake Formation LF-Tag contribution
Governance outcome
Identity context
Organizes users into groups aligned with business roles
Evaluates permissions using group membership
Role-aligned access boundaries
Data classification
Provides role eligibility for data access
Classifies datasets by domain, region, sensitivity, and layer
Attribute-aware authorization
Scalability
Simplifies user lifecycle management
Automatically applies policies to newly tagged datasets
Governance that scales with dataset growth
Operational model
Centralizes role lifecycle operations
Enables metadata-driven policy automation
Reduced administrative overhead
IAM Identity Center defines who can request access, LF-Tags define what datasets are eligible, and Lake Formation enforces policies dynamically at query time.
Enterprise LF-Tag data model
A structured tagging strategy is the foundation of scalable Lake Formation governance. In this solution, the solution classifies datasets across four governance dimensions.
Tag Key
Tag Values
Purpose
Example Usage
region
us, eu, global
Geographic data location
Enforce GDPR compliance for EU data
domain
commercial, clinical_research, regulatory
Business domain
Separate commercial from clinical data
data_class
standard, sensitive, regulated
Data sensitivity level
Restrict access to sensitive pricing data
layer
raw, curated, conformed
Data processing stage
Grant analysts access to curated data only
Together, these dimensions enable multi-dimensional authorization policies that reflect both organizational structure and regulatory requirements.
Tag inheritance and evaluation
LF-Tags can be applied at three resource levels within the Glue Data Catalog: database, table, and column. In this implementation, database-level tags define broad governance attributes (domain, region, layer), table-level tags capture dataset-specific sensitivity (data_class), and column-level tags can further restrict access to individual fields. Lake Formation evaluates the effective tag set at query time by combining inherited and explicitly assigned tags.
For example, a database tagged domain=commercial, region=us, layer=raw automatically applies those tags to all tables within it. A table-level data_class=sensitive tag supplements the inherited tags to distinguish sensitive pricing data from standard sales data. This inheritance model means new tables automatically receive governance coverage without manual tag assignment. To learn more, refer to Lake Formation tag-based access control best practices.
Prerequisites
Before deploying the solution, complete the following setup in the us-east-1 Region. Use the same AWS Region throughout all steps.
AWS account and IAM Identity Center: Enable IAM Identity Center and create test users. Note your Identity Store ID from the IAM Identity Center console under Settings. For setup guidance, see Getting started with IAM Identity Center.
Lake Formation configuration: Complete the following setup in the Lake Formation console:2.1. Change Data Catalog default permissions. In the navigation pane under Administration, choose Data Catalog settings. Uncheck Use only IAM access control for new databases and uncheck Use only IAM access control for new tables in new databases. Choose Save. This makes sure Lake Formation permissions govern access to databases and tables created by the CDK stacks.
Figure 2: Lake Formation Data Catalog settings with both IAM-only access control checkboxes unchecked
2.2. Integrate with IAM Identity Center. Complete the prerequisites for IAM Identity Center integration with Lake Formation, including enabling trusted identity propagation.You don’t need to manually create a Lake Formation administrator. The CDK deployment in Step 2: Deploy all stacks automatically registers the required administrators via the LfAdminStack (see lf-admin-stack.ts). S3 data location registration is a post-deployment console step covered after the CDK creates the buckets.
Local tooling: Install AWS Command Line Interface (AWS CLI), Python 3.x, Node.js 18+, AWS CDK CLI (npm install -g aws-cdk), and Git.
Solution overview
Now that you understand the governance model and tag taxonomy, the following section walks you through deploying the complete infrastructure and configuring access control.
The deployment uses AWS CDK (TypeScript) and consists of seven stacks that create the complete governance infrastructure. The CDK app manages stack dependencies automatically, so a single cdk deploy --all command deploys everything in the correct order.
The architecture uses a two-layer data lake pattern. The raw layer stores data as CSV files in Amazon S3, registered as external tables in the AWS Glue Data Catalog. The curated layer uses Apache Iceberg v2 tables for ACID transactions and schema evolution. Three business domains (US Commercial, EU Clinical Research, and Global Regulatory) each have one representative table per layer, giving six tables total.
Lake Formation tag-based access control (TBAC) governs all access using four tag dimensions:
Tag Key
Values
Purpose
domain
commercial, clinical_research, regulatory
Business domain isolation
region
us, eu
Geographic data boundary
data_class
standard, sensitive, regulated
Sensitivity classification
layer
raw, curated
Data layer identification
Step 1: Clone the repository and install dependencies
Clone the accompanying repository and install the CDK project dependencies:
git clone https://github.com/aws-samples/sample-aws-smus-governance-automation
cd aws-smus-governance-automation/cdk
npm install
The CDK project is written in TypeScript and uses aws-cdk-lib v2. The lib/ directory contains seven stack definitions, and bin/app.ts wires them together with explicit dependency ordering.
If this is your first CDK deployment in this account and Region, bootstrap the CDK environment. Bootstrapping provisions an S3 bucket and IAM roles that CDK uses to deploy assets:
cdk bootstrap aws://<ACCOUNT_ID>/us-east-1
Step 2: Deploy all stacks
Deploy the entire infrastructure with a single command. Pass your IAM Identity Center Identity Store ID as a CDK context variable:
cdk deploy --all -c identityStoreId=d-xxxxxxxxxx --require-approval never --region us-east-1
CDK will prompt for IAM permission changes on each stack. The --require-approval never flag auto-approves these so the deployment runs unattended.
GlueRawTablesStack: S3 bucket + three Glue databases + three CSV-backed tables.
GlueCuratedTablesStack: S3 bucket + three Glue databases + three Iceberg v2 tables.
SsoGroupsStack: three IAM Identity Center groups (DataLake-US-Commercial, DataLake-EU-Clinical-Research-Sensitive, DataLake-Regulatory)The three groups map to specific tag combinations that control data access:
LfAdminStack: Registers CDK + Lambda roles as Lake Formation admins.
After deployment completes, review the CloudFormation stack outputs. They include S3 bucket names, database names, SSO group IDs, and Lambda function ARNs.
The following figure shows all seven CDK stacks deployed successfully in the CloudFormation console.
Figure 3: CloudFormation console showing all seven CDK stacks in CREATE_COMPLETE status
Register S3 data locations with Lake Formation: Now that the S3 buckets exist, register them with Lake Formation. In the Lake Formation console, under Administration, choose Data lake locations, then choose Register location. Register both buckets from the stack outputs (for example, s3://datalake-raw-data-<ACCOUNT_ID>-us-east-1 and s3://datalake-curated-data-<ACCOUNT_ID>-us-east-1). For IAM role, use the default AWSServiceRoleForLakeFormationDataAccess and choose Lake Formation as the permission mode. See Registering an Amazon S3 location for step-by-step instructions.
The following figure shows both data lake S3 locations registered in the Lake Formation console.
Figure 4: Lake Formation Data lake locations page with raw and curated S3 buckets registered
Step 3: Populate sample datasets
The scripts use Amazon Athena to insert sample data. Athena stores query results under the athena-results/ prefix in the shared governance metadata bucket (lf-governance-metadata-<ACCOUNT_ID>-<REGION>) created by the CDK deployment.
Populate the raw and curated tables:
cd ../scripts
python3 populate_raw_layer.py
python3 populate_curated_layer.py
Each script executes INSERT INTO statements through the Athena StartQueryExecution API and waits for completion. You should see success messages for all six tables (three raw, three curated).
After populating the tables, you can verify the data in the Glue Data Catalog. The following figure shows the six tables across the three raw and three curated databases.
Figure 5: AWS Glue Data Catalog showing the six databases and tables created by the CDK deployment
You can also preview the data by querying a table. The following figure shows sample data from the us_sales_summary table.
Figure 6: Query results for the us_sales_summary table with sample commercial data
Step 4: Apply LF-Tags to data assets
The following diagram illustrates the governance automation flow, showing how metadata JSON configuration files drive the two Lambda pipelines for asset tagging and SSO permission management.
Figure 7: Governance automation flow showing the asset tagging and SSO permission Lambda pipelines
The diagram shows two parallel pipelines, each following three steps:
Asset tagging pipeline (left):
Metadata upload – A data governance administrator uploads metadata JSON files (metadata-raw-tables.json and metadata-curated-tables.json) to the asset-tagging/ prefix in the shared S3 governance metadata bucket. These files define which LF-Tags to assign to each AWS Glue database and table.
Lambda processing – The S3 upload triggers the LakeFormationTagAutomation Lambda function, which reads the metadata and calls the Lake Formation API.
Tag operations – The Lambda creates or updates LF-Tags, then assigns them to the target databases and tables in the AWS Glue Data Catalog.
SSO permission pipeline (right):
Permission upload – Three permission JSON files (one per IAM Identity Center group) are uploaded to the sso-permissions/ prefix. These files define the LF-Tag policy expressions that control data access.
Lambda processing – The upload triggers the LakeFormationSSOPermissionAutomation Lambda function.
Permission operations – The Lambda grants tag-based permissions to the corresponding IAM Identity Center groups through the Lake Formation API.
Both pipelines log execution details to Amazon CloudWatch for monitoring and troubleshooting.
Two metadata JSON configuration files drive the asset tagging Lambda that declaratively define which LF-Tags to apply to each AWS Glue resource:
metadata-raw-tables.json: Tag definitions for the three raw layer databases and tables.
metadata-curated-tables.json: Tag definitions for the three curated layer databases and tables.
Each entry in these files specifies the following fields:
Field
Description
Example
catalog_id
Your AWS account ID (Glue Data Catalog ID)
123456789012
resource_type
DATABASE or TABLE
DATABASE
database_name
AWS Glue database name
raw_us_commercial_db
table_name
AWS Glue table name (only for TABLE entries)
us_sales_summary
lf_tags
Array of LF-Tag key/value pairs to assign
[{“TagKey”:“domain”,“TagValues”:[“commercial”]}]
access_type
Action to perform (GRANT)
GRANT
Parameters you must update before invoking: Replace the catalog_id value in every entry of both files with your own AWS account ID. The database and table names match the resources created by the CDK stacks, so those should not be changed unless you customized the stack parameters.
The following snippet from metadata-raw-tables.json shows a database-level entry and a table-level entry:
The Lambda applies tags at two levels: database-level entries assign domain, region, and layer tags, while table-level entries assign the data_class tag (standard, sensitive, or regulated). Because of two-level tagging, new tables added to a tagged database automatically inherit the database-level tags. Only the table-specific data_class tag needs explicit assignment. To learn more about this pattern, refer to Lake Formation tag-based access control best practices.
You should see domain=commercial, region=us, layer=raw, and data_class=standard in the response.
The following figure shows the LF-Tags assigned to the us_sales_summary table in the Lake Formation console, confirming that both database-level inherited tags and table-level tags are applied correctly.
Figure 8: LF-Tags on the us_sales_summary table showing inherited and table-level tags
Step 5: Provision SSO group permissions
Three permission JSON files (one per IAM Identity Center group) define the LF-Tag policy expressions. Update sso_group with the group UUID from the SsoGroupsStack outputs and identity_center_account_id with your AWS account ID. For detailed configuration, see the repository README.
With all permissions in place, validate that Lake Formation TBAC enforces the correct access boundaries by signing in to SageMaker Unified Studio as different IAM Identity Center users.
Test as Sarah (US Commercial Analyst) — Sarah belongs to DataLake-US-Commercial, which grants access to standard commercial data only.
SELECT * FROM raw_us_commercial_db.us_sales_summary LIMIT 10;
Sarah sees all rows and columns successfully:
Figure 9: Sarah’s successful query on us_sales_summary in SageMaker Unified Studio
Querying outside her authorized domain returns an access denied error:
SELECT * FROM raw_eu_clinical_research_db.eu_drug_discovery LIMIT 10;
Figure 10: Access denied when Sarah queries eu_drug_discovery, confirming TBAC enforcement
Test as Dr. Chen (EU Clinical Research Lead) — Dr. Chen can access sensitive and regulated EU clinical research data (eu_drug_discovery) but is denied access to US commercial data (us_sales_summary), confirming regional and domain isolation.
Figure 11: Dr. Chen’s successful query on eu_drug_discovery
Figure 12: Access denied when Dr. Chen queries us_sales_summary
Test as Alex (Regulatory Affairs Specialist) — Alex’s tag expression uses only domain=regulatory without a region constraint, granting cross-regional access to regulatory data while maintaining strict isolation from commercial and clinical research domains.
Figure 13: Alex’s successful query on fda_submissions
Figure 14: Access denied when Alex queries us_sales_summary
These tests demonstrate that TBAC enforces fine-grained permissions based on user identity, data classification, regional boundaries, and domain separation, without per-table permission grants. As new tables are added and tagged, existing groups automatically gain or are denied access based on their tag expressions. This is the core advantage of TBAC over named resource permissions.
Audit user access with CloudTrail
A key benefit of integrating Lake Formation with IAM Identity Center is the detailed audit trail available through AWS CloudTrail. Filter Event history by Event name GetDataAccess to see every data access event. Each record includes the IAM Identity Center user UUID (userIdentity.onBehalfOf.userId), the specific table accessed (requestParameters.tableArn), and confirmation that trusted identity propagation was used (additionalEventData.LakeFormationTrustedCallerInvocation: true).
Figure 15: CloudTrail GetDataAccess event showing Identity Center user identity and table access details
To resolve the user UUID to a human-readable name, query the Identity Store:
This audit capability provides the detailed access logs required for HIPAA, GDPR, and FDA compliance, showing exactly which users accessed which data and when. Learn about configuring CloudTrail for Lake Formation in Logging Lake Formation API calls with CloudTrail.
Cleanup
Run cdk destroy --all to remove all stacks. Manually delete the retained S3 data buckets (datalake-raw-data-* and datalake-curated-data-*) and revoke any remaining Lake Formation permissions. For detailed cleanup steps, see the repository README.
Conclusion
In this post, we showed you how to implement scalable fine-grained access control for an enterprise lakehouse by combining AWS Lake Formation tag-based access control, IAM Identity Center, and trusted identity propagation in SageMaker Unified Studio. The four-dimension LF-Tag taxonomy, hybrid RBAC + ABAC governance model, and metadata-driven Lambda automation together create a governance architecture where new datasets automatically inherit access policies through tag inheritance, permissions scale without per-table grants, and every data access event is auditable to the individual user through CloudTrail.
To extend this solution, consider adding new business domains, implementing column-level security with LF-Tags, scaling to multi-account architectures with Lake Formation cross-account sharing, or integrating additional analytics services such as Amazon Redshift Spectrum or Amazon EMR.
Data engineering teams running Apache Airflow across multiple AWS accounts face a persistent coordination problem. They have no built-in way to coordinate workflows between their separate Amazon Managed Workflows for Apache Airflow (Amazon MWAA) environments, where each team or business unit manages its own isolated environment. Cross-environment orchestration has traditionally relied on time-based polling, complex custom sensors, or API-based triggers that introduce latency and reliability concerns. The Apache Airflow Datasets feature (introduced in version 2.4) added data-aware scheduling of Directed Acyclic Graphs (DAGs, the workflow definitions that specify tasks and their execution order) within a single Amazon MWAA environment. However, teams running Airflow across multiple accounts still had no way to coordinate workflows between environments.
With Apache Airflow 3.0, now available on Amazon MWAA 3.0, you get event-driven cross-account orchestration that responds to upstream events as they happen, without polling overhead or tight environment coupling. Using Amazon Simple Queue Service (Amazon SQS) as the message broker, Asset Watchers replace polling-based sensors with event-driven triggers. This approach reduces orchestration latency from minutes to seconds and reclaims worker resources previously consumed by polling sensors. It also improves message reliability, because Amazon SQS retains coordination signals even when the consumer environment is temporarily unavailable.
In this post, you learn how to design and deploy cross-account orchestration patterns using asset-based scheduling in Airflow 3.0 with Amazon SQS integration. You learn about Asset Watchers, how to publish asset events from producer DAGs, and how to trigger dependent workflows in downstream Amazon MWAA environments, creating responsive, decoupled pipelines that span multiple accounts.
If you use AI coding assistants to build and deploy infrastructure, the solution repository includes an agent skill built on the Agent Skills standard that encodes the architecture and best practices from this post.
Solution overview
This solution demonstrates a multi-MWAA orchestration architecture where:
Producer Amazon MWAA Environment (Account A) runs data processing workflows that publish asset events to an Amazon SQS queue when datasets are created or updated.
Amazon SQS Queue acts as a message broker, decoupling producer and consumer environments.
Consumer Amazon MWAA Environment (Account B) monitors the Amazon SQS queue using Asset Watchers and automatically triggers downstream DAGs when relevant asset events arrive.
Key benefits
This event-driven approach offers several advantages over traditional polling:
No more polling overhead: You replace continuous sensor polling with event-driven Asset Watchers that respond as events arrive.
Near real-time response: Downstream DAGs trigger within seconds rather than waiting for a scheduled polling interval.
Independent environments: Producer and consumer Amazon MWAA environments have no direct dependencies, so each team can scale and update their environment without affecting the other.
Reliable message delivery: Amazon SQS provides durable message delivery, even if the consumer environment is temporarily unavailable.
Clear team ownership: You and your team maintain your own Amazon MWAA environment while still coordinating complex cross-account workflows.
Faster implementation: Describe requirements in natural language and the agent skill generates deployment-ready producer and consumer DAGs with the best practices from this post built in.
Architecture overview
The following architecture shows how you can connect separate Amazon MWAA environments across AWS accounts so that a completed pipeline in one environment automatically triggers dependent workflows in another, without direct environment coupling or polling overhead.
Figure 1: Cross-account event-driven orchestration between Amazon MWAA environments using Amazon SQS
Architecture components
The architecture has four main components. The producer DAG defines assets as outlets and publishes events to an Amazon SQS queue when tasks complete successfully. The Amazon SQS queue acts as a durable message broker between accounts, with AWS Identity and Access Management (IAM) policies granting the producer permission to send messages and the consumer permission to receive them. On the consumer side, an Asset Watcher monitors the queue and updates asset state when messages arrive, which automatically triggers the consumer DAG scheduled on that asset.
Prerequisites
Before implementing this solution, you need:
Two Amazon MWAA environments running Apache Airflow 3.0 or later, in the same or different AWS accounts. Each environment must have the triggerer component enabled.
Intermediate knowledge of IAM policies, including cross-account role trust relationships and resource-based policies.
Intermediate knowledge of Apache Airflow DAG authoring, including Python-based DAG definitions and task operators.
Basic Python experience (Python 3.8 or later) to read and adapt the provided code samples.
An Amazon SQS standard queue with cross-account permissions configured (see the Cross-account IAM section).
AWS Command Line Interface (AWS CLI) configured with credentials that have permission to access both Amazon MWAA environments and the Amazon SQS queue.
Time to complete: Approximately 90 minutes (following the GitHub repository instructions).
Estimated cost: Running two Amazon MWAA environments and an Amazon SQS queue will incur AWS charges. Refer to the Amazon MWAA pricing page and Amazon SQS pricing page to estimate costs for your Region and usage. Remember to delete resources when you finish to avoid ongoing charges.
Implementation
The post includes a GitHub repository where you can deploy the solution described in this post. You will follow the implementation steps from setting up Amazon MWAA environments and cross-account Amazon SQS queues to deploying producer and consumer DAGs with Asset Watchers. This post provides the code samples, including the DAG files, IAM policies, and requirements configuration, for demonstration purposes only. Before deploying to production, verify that you conduct thorough testing, security reviews, and validation against the specific requirements and compliance standards.
Considerations
Asset Watchers run as background processes in the Airflow triggerer, not the scheduler. Verify that the triggerer is healthy and running in consumer Amazon MWAA environment before expecting event-driven DAG triggers. If the triggerer is down, Amazon SQS messages will accumulate in the queue but won’t trigger downstream DAGs until the triggerer recovers. For more information, read the Asset Watchers documentation.
Amazon SQS messages have a default retention period of 4 days (configurable up to 14 days). If the consumer environment is unavailable for longer than the retention period, messages will be lost. Consider configuring a dead-letter queue to capture messages that fail processing, and adjust the MessageRetentionPeriod based on recovery requirements.
Cross-account Amazon SQS access requires both an IAM identity policy on the producer’s execution role and a resource-based policy on the Amazon SQS queue. If either policy is missing or misconfigured, message delivery will silently fail. For guidance on cross-account access patterns, refer to Four ways to grant cross-account access on AWS.
Set the Amazon SQS VisibilityTimeout higher than the expected time for the Asset Watcher to process a message. If the timeout is too short, messages might be redelivered and trigger duplicate DAG runs. Review the Amazon SQS visibility timeout documentation when tuning this value.
Each Amazon MWAA environment has limits on the number of DAGs, triggerers, and concurrent DAG runs. If you plan to scale to multiple Asset Watchers monitoring different Amazon SQS queues, check the current Amazon MWAA quotas before making design decisions.
Asset URIs must match exactly between the Asset Watcher definition and the consumer DAG’s schedule parameter. A mismatch, even in casing or trailing characters, will prevent the consumer DAG from being triggered. Define assets in a single DAG file to avoid inconsistencies.
Pin the provider packages apache-airflow-providers-amazon and apache-airflow-providers-common-messaging to versions compatible with Airflow. Incompatible versions might cause import errors that prevent the triggerer from starting. Use a constraints file as described in this post to avoid dependency conflicts.
Agent skills
AI coding assistants are most useful when they have context about your specific architecture and constraints, not only general programming patterns. Agent Skills, originally developed by Anthropic and released as a public standard in December 2025, provides a portable format for this need. SKILL.md files encode procedural knowledge, best practices, and workflows so that compatible AI coding agents can discover and apply them on demand. The standard is now supported by Kiro, Strands Agents, Anthropic Claude Code, OpenAI Codex, Cursor, Gemini CLI, and other tools. The solution provided here includes an agent skill (agent-skill/) built on this standard that encodes the cross-account orchestration architecture and operational best practices from this post. When you tell the AI coding assistant something like “Write cross-account Amazon MWAA DAGs for my orders pipeline”, the skill guides the agent through the complete workflow:
Collecting Amazon SQS queue URL.
Generating correctly structured producer and consumer DAG files.
Optionally deploying them to Amazon MWAA environments.
The skill doesn’t require you to provide AWS account IDs or Amazon MWAA environment names upfront. Instead, it auto-discovers your environments by running aws mwaa list-environments and aws sts get-caller-identity using the locally configured AWS CLI credentials, then asks you to confirm which environment is the producer and which is the consumer.
The skill works in two modes:
Sample mode: Generates the reference producer and consumer DAGs for quick cross-account validation, requiring only the Amazon SQS queue URL as input.
Custom mode: Adapts the DAG templates to specific business logic. For example, the producer runs an AWS Glue extract, transform, and load (ETL) job and the consumer triggers a data build tool (dbt) model refresh. This mode customizes DAG IDs, task names, schedules, and processing logic while preserving the correct Asset Watcher patterns.
Beyond code generation, the skill includes an auto-deploy flow. This flow discovers existing Amazon MWAA environments, runs pre-flight checks (Amazon Virtual Private Cloud (Amazon VPC) networking, provider versions, triggerer health, and Amazon SQS queue accessibility), uploads DAGs to the correct Amazon Simple Storage Service (Amazon S3) buckets, and verifies end-to-end readiness. Each step that modifies infrastructure requires explicit user confirmation. Also refer to the GitHub repository for instructions on using it.
Best practices
Airflow Asset Watchers with Amazon SQS are not always the right fit. When they are, they introduce operational considerations that differ from sensor-based polling approaches.
This section covers how to choose the right cross-environment orchestration pattern, how to configure the infrastructure that Asset Watchers depend on (IAM, Amazon VPC, dependencies), and how to design producer and consumer DAGs that are reliable in production.
Cross-account IAM
Producer execution role needs sqs:SendMessage and sqs:GetQueueUrl scoped to the specific queue ARN to avoid sqs:*.
Amazon SQS queue resource policy must allow the producer role for sqs:SendMessage and consumer role for sqs:ReceiveMessage, sqs:DeleteMessage, sqs:GetQueueAttributes, and sqs:GetQueueUrl.
Test cross-account access with the AWS CLI before deploying DAGs. Debugging AWS IAM through Airflow task logs is much harder and slower than catching misconfigurations at the CLI level.
Enable Amazon SQS server-side encryption for production queues.
Triggerer health
Airflow Asset Watchers run in the triggerer, not the scheduler. Verify triggerer health in the Airflow UI after deploying consumer DAGs.
The health API can report healthy even when components are broken. Cross-check by verifying Amazon CloudWatch log streams exist for the Triggerer log group.
Monitor airflow-<ENV>-Triggerer CloudWatch logs for ClientError, QueueDoesNotExist, or ImportError.
Set Amazon CloudWatch alarms on Amazon SQS ApproximateNumberOfMessagesVisible and the depth of your dead-letter queue (DLQ), which captures messages that fail processing after the maximum number of receive attempts.
Pin provider versions with a constraints file to prevent dependency conflicts.
Amazon VPC networking
Private subnets must route 0.0.0.0/0 to a NAT Gateway. Without it, workers and triggerers silently fail while the web server appears healthy.
Use two NAT Gateways (one per Availability Zone) for production high availability.
For private routing mode, use Amazon VPC Endpoints (Amazon S3, Amazon SQS, Amazon CloudWatch Logs, and Amazon Elastic Container Registry (Amazon ECR)) instead of NAT.
Confirm Amazon CloudWatch log streams exist for Scheduler, Worker, DAGProcessing, and Triggerer. Empty log groups mean containers aren’t running.
Security group must allow self-referencing inbound traffic and unrestricted outbound.
Dependency management
Pin provider versions with == and use a constraints file. Unpinned versions break on environment updates.
Check the requirements_install_ip log stream after updates. If networking was unavailable at creation, force reinstall with a new requirements-s3-object-version.
Review pre-installed base packages before adding to requirements.txt to avoid version conflicts.
Choosing an orchestration pattern
Not every cross-environment dependency warrants an Asset Watcher. Airflow 3.0 offers three main orchestration patterns: Asset Watchers with Amazon SQS, the MwaaTriggerDagRunOperator, and sensor-based polling, each with different trade-offs in response time, coupling, and resource consumption. Use the following table to match your use case to the right pattern before committing to an implementation.
Pattern
How it works
Response time
Coupling
Occupies a worker?
Good fit
1
Asset Watchers + SQS (this post)
Consumer’s triggerer listens on SQS, triggers DAG on message arrival
Avoid wiring persistent-state triggers (for example, S3KeyTrigger) into Asset Watchers. They fire continuously because the condition never clears.
DAG authoring
Minimize module-level code. DAG files are re-parsed every cycle, and heavy imports slow the entire parsing loop.
Design tasks so they produce the same result whether they run once or multiple times (a property called idempotency). Duplicate Amazon SQS messages can occur on retries, so prefer UPSERT (insert or update) over INSERT to avoid duplicate records.
Keep secrets out of DAG files and message bodies. Use Airflow Connections (aws_conn_id) instead.
Test DAG imports locally with python your_dag.py before uploading to S3.
Allow time for DAG parsing after S3 upload, or force with dags reserialize.
Producer DAG design
Include dag_id, run_id, logical_date, and dataset-specific context in Amazon SQS messages so consumers can route without calling back.
Use SqsHook instead of the raw boto3 package. It respects aws_conn_id and integrates with Airflow logging.
Let publish failures raise so the Airflow retry mechanism handles redelivery.
Consumer DAG design
Access messages through triggering_asset_events, not by reading the queue directly. The Asset Watcher has already consumed the Amazon SQS messages.
Validate message payloads defensively. Producers might evolve their schema over time.
Use conditional asset scheduling (& / |) for complex multi-asset dependencies.
Clean up resources
To avoid ongoing AWS charges, delete the resources you created as part of this solution when you are done. The GitHub repository includes step-by-step cleanup instructions for removing the Amazon SQS queue, Amazon MWAA environments, IAM roles and policies, and Amazon S3 buckets.
Asset-based scheduling in Apache Airflow 3.0, with Asset Watchers, gives you a practical way to coordinate workflows across Amazon MWAA environments without polling overhead or tight coupling. By using Amazon SQS as a reliable message broker, you can build responsive, decoupled data pipelines that span multiple Amazon MWAA environments and AWS accounts without the operational overhead of traditional polling mechanisms.
This approach reduces cross-environment orchestration latency from minutes to seconds, replaces custom sensors with declarative asset-based scheduling, and gives you and your team the flexibility to maintain independent Amazon MWAA environments while still coordinating complex workflows. Amazon SQS durable message delivery reduces the risk of lost signals, even during temporary environment outages.
To get started:
Review the architecture (5 minutes): Open the architecture diagram in the repository and confirm which Amazon MWAA environments will be the producer and which will be the consumer.
Set up the Amazon SQS queue (15 minutes): Create a cross-account Amazon SQS standard queue and apply the IAM identity and resource-based policies from the Cross-account IAM section. Verify access with the AWS CLI before proceeding.
Deploy and validate the DAG examples (30 minutes): Copy the producer and consumer DAG snippets from the Implementation section into Amazon MWAA environments, trigger the producer DAG manually, and confirm the consumer DAG runs automatically.
Run pre-flight checks (20 minutes): Work through the Amazon VPC networking, provider version, and triggerer health checks in the Best Practices section. Confirm Amazon CloudWatch log streams exist for the Triggerer log group before declaring the environment ready.
Optionally, use the agent skills: If you use an AI coding assistant, install the skill from the repository and describe the business logic in natural language to generate deployment-ready DAGs tailored to your pipeline.
As you scale data operations across multiple accounts and AWS Regions, asset-based scheduling with Asset Watchers provides the foundation for building modern, event-driven data architectures on AWS. Start with basic producer-consumer patterns and gradually evolve to complex multi-asset dependencies as orchestration requirements grow.
When your encryption system generates millions of duplicate API calls per hour, costs spiral and performance degrades. That’s exactly the challenge NICE Actimize faced while operating their global-scale, event-driven financial crime detection platform on Amazon Web Services (AWS).
NICE Actimize, a leading provider of financial crime, risk, and compliance solutions, processes millions of encrypted messages daily across hundreds of tenants. By rethinking how they cache encryption keys, they reduced their AWS Key Management Service (AWS KMS) costs by 77% while maintaining strict security guarantees and per-tenant encryption isolation.
In this post, we explore the cache stampede problem that emerges when envelope encryption meets high-concurrency, multi-tenant architectures. We walk through two solutions: the AWS-recommended hierarchical keyring pattern and a custom caching approach that NICE Actimize built for their regulated environment. These patterns apply to multi-tenant software as a service (SaaS) environments and high-throughput systems where per-tenant encryption generates significant KMS API volume.
Why per-tenant encryption matters
Financial services systems operate under strict regulatory requirements. You must encrypt data at rest and in transit. For multi-tenant SaaS providers, this requirement might go further: each tenant’s data must be encrypted with separate keys to provide complete cryptographic isolation. If one tenant’s key is compromised, no other tenant’s data is at risk.
Consider an enterprise SaaS environment built on an event-driven architecture using Amazon Managed Streaming for Apache Kafka (Amazon MSK), with many different databases for storing data and Amazon Simple Queue Service (Amazon SQS) for messaging. Messages flow continuously between producers and consumers, and each message must be encrypted with the correct tenant-specific key. At scale with millions of messages daily across hundreds of tenants, this creates a massive volume of encryption and decryption operations.
To handle this volume efficiently, the standard approach is envelope encryption: a two-tier model where an AWS KMS key encrypts short-lived data keys, and those data keys encrypt the actual data. Your application can encrypt large volumes of data locally without calling AWS KMS for every operation, reducing latency and costs.
The cache stampede problem
Envelope encryption reduces AWS KMS calls, but it doesn’t eliminate them. Each encrypt operation still requires a data key, either generated fresh using GenerateDataKey or retrieved from a cache, and each decrypt operation must unwrap an encrypted data key (EDK) by calling Decrypt. In high-throughput systems processing millions of messages, these calls add up quickly.
The AWS Encryption SDK provides a built-in solution for this: the CachingCryptoMaterialsManager. This component caches data encryption materials (data keys) locally, so your application can reuse them across multiple operations without calling AWS KMS each time. You configure a time-to-live (TTL), a maximum message-use limit, and a local cache, and the SDK handles the rest.
This approach works well under moderate load when you partition the cache by tenant AWS KMS key Amazon Resource Name (ARN) so that each tenant’s encryption materials remain cryptographically isolated. However, a critical problem emerges as concurrency scales to hundreds of threads processing millions of encrypted messages in parallel: the cache stampede, also known as the thundering herd problem.
How the stampede occurs
The CachingCryptoMaterialsManager caches the result of the SDK’s internal getMaterialsForEncrypt and decryptMaterials calls at the materials level. The cache stampede, however, happens at the KMS API call level. When a cached data key expires or a new, previously-unseen EDK arrives, the following sequence unfolds:
On encrypt – data key explosion: Multiple threads simultaneously call encrypt() for the same tenant. Each thread finds the cache entry expired and independently calls GenerateDataKey against AWS KMS. Instead of one thread generating a data key while others wait, N threads create N distinct data keys. Each new data key produces a unique EDK, which inflates the EDK cardinality across the system.
On decrypt – redundant unwrap calls: Those extra unique EDKs propagate downstream. When consumers later read encrypted records, each distinct EDK is a separate cache key. Multiple threads encountering the same EDK simultaneously each trigger an independent Decrypt call to AWS KMS because the cache has no coordination mechanism to make competing threads wait for a single in-flight request.
Compounding effect: The encrypt-side stampede creates excess EDK cardinality, which degrades the decrypt-side cache hit ratio, which triggers more KMS calls, which drives up costs further. In the NICE Actimize case, this produced a ratio of 30% unique data keys to data records in DynamoDB tables, meaning nearly one in three records was encrypted with a different data key.
At enterprise SaaS scale, this compounding effect can generate millions of redundant AWS KMS GenerateDataKey and Decrypt calls per hour, even with the SDK’s built-in caching enabled. The following figure shows the pattern leading to a stampede.
Figure 1: Cache stampede – multiple threads independently calling AWS KMS for the same encrypted data key, creating duplicate requests
The stampede follows this sequence on the encrypt side:
Multiple threads call encrypt() for the same tenant concurrently.
Each thread checks the CachingCryptoMaterialsManager and finds the cache entry expired.
With no coordination mechanism, each thread independently calls GenerateDataKey.
AWS KMS returns N distinct data keys (one per thread).
Each data key produces a unique EDK, inflating cardinality across the system.
On the decrypt side, the inflated EDK cardinality compounds the problem:
Consumer threads encounter unique EDKs that were never cached.
Multiple threads hitting the same EDK simultaneously each trigger a separate Decrypt call. AWS KMS returns the same plaintext data key N times, doing redundant work.
Two paths forward
We evaluated two approaches to solve the cache stampede problem. Each fits different architectural requirements and regulatory constraints.
Option A: Hierarchical keyring with DynamoDB (AWS-recommended)
AWS addresses the cache stampede challenge through the hierarchical keyring pattern, which introduces an additional level of key hierarchy that significantly reduces how often cache stampedes occur.
In this architecture, branch keys serve as intermediate wrapping keys stored in a DynamoDB table. This DynamoDB table acts as a shared cache layer that coordinates across all instances in your distributed fleet.
Figure 2: Hierarchical keyring architecture – branch keys in DynamoDB coordinating across distributed instances
The architecture (shown in Figure 2) works as follows:
The application requests encryption through the hierarchical keyring.
The keyring checks the local cache for the tenant’s branch key.
On a cache miss, it queries the DynamoDB Key Store table for the active branch key.
AWS KMS decrypts the branch key (this is the only KMS call in the flow).
The decrypted branch key is returned to the keyring.
The keyring stores the branch key in the local cache for subsequent requests.
The keyring derives a unique wrapping key from the branch key and generates the data key locally.
The key insight is that the cache is thread-aware. When the cache expires, threads coordinate to make a single request to refresh the cache. Only a single thread is used to make a call to the branch key, rather than all the threads acting independently. Additionally, by adding an additional key into the key hierarchy, branch keys don’t live within AWS KMS. This means cache misses and the stampedes they trigger interact with the branch key, and don’t make as many calls to the AWS KMS service at the top of the hierarchy:
Without hierarchical keyrings: Your local cache needs to store all the data encryption keys, and has constant misses as new, unique data keys arrive with each encrypted message. A miss can trigger a stampede.
With hierarchical keyrings: The same branch key wraps thousands or millions of data keys. A cache miss only occurs when a branch key expires or is first requested, which happens orders of magnitude less frequently than without hierarchical keyrings.
The DynamoDB table acts as a coordination point. The first thread to request a missing branch key retrieves it from AWS KMS and stores it in DynamoDB (the Key Store table). Subsequent requests from instances in the fleet retrieve the cached branch key from DynamoDB instead of making duplicate AWS KMS calls.
Beyond reducing cache miss frequency, the hierarchical keyring provides built-in stampede protection within its local cache implementation. The SDK offers multiple cache types, and the Default cache, designed for heavily multi-threaded environments, prevents multiple threads from calling AWS KMS on cache expiry by notifying a single thread that the branch key materials entry is about to expire 10 seconds in advance. That one thread refreshes the cache while all other threads continue serving requests using the still-valid entry.
This solution integrates with the AWS Encryption SDK and requires minimal code changes to existing applications. For event-driven architectures processing encrypted Kafka streams, this approach reduces KMS call volume by orders of magnitude while preserving per-tenant cryptographic isolation.
Option B: Custom KMS client caching – Solving the stampede at the API layer
While the hierarchical keyring (Option A) addresses the stampede by reducing how often cache misses occur, there’s a complementary approach: eliminating the stampede at its source by caching KMS API responses directly, using atomic, single-flight cache loading that prevents concurrent threads from issuing duplicate calls. This is the path NICE Actimize took.
The IClientSupplier extension point in AWS Encryption SDK v3
In the AWS Encryption SDK v2, decorating the AWS KMS client on a per-request basis was possible through the RegionalClientSupplier interface, but it was an advanced and undocumented use case. Without explicit guidance or a supported pattern, caching strategies typically operated above the SDK layer, making it difficult to prevent duplicate KMS calls at their source. The AWS Encryption SDK v3 introduced the IClientSupplier interface, which the AwsKmsMrkMultiKeyring accepts at construction time. This interface is called by the SDK whenever it needs a KMS client for a given AWS Region, and you control what it returns, making it possible to insert a caching layer between the SDK and AWS KMS.
Architecture: A decorated KMS client with two Caffeine caches The solution is a CachedKmsClient—a decorator that wraps the standard AWS SDK KmsClient and interposes two Caffeine LoadingCache instances between the application and AWS KMS:
Cache
Key
Value
Purpose
GenerateDataKey cache
GenerateDataKeyRequest (tenant KMS key ARN and key spec)
GenerateDataKeyResponse (EDK and plaintext data key)
Ensures encrypt operations on the same node reuse the same data key for a given tenant KMS key during the cache window
Decrypt cache
DecryptRequest (EDK and key ARN)
DecryptResponse (plaintext data key)
Ensures decrypt operations for the same EDK share a single KMS call result
Both caches are configured with refreshAfterWrite (default: 1 hour, configurable), which means:
During the refresh window, concurrent threads receive the cached response instantly resulting in zero KMS calls.
When a cache entry expires, Caffeine’s LoadingCache.get() guarantees that exactly one thread executes the loader function (the actual KMS API call), while all other concurrent threads block and wait for that single result. This is the atomic, single-flight property that eliminates the stampede.
Security consideration: Caching plaintext data keys in memory means the keys exist in process memory for the duration of the cache TTL. The TTL acts as a security control: shorter TTLs reduce the window of exposure in the event of a memory dump, while longer TTLs reduce KMS call volume. Choose a TTL that balances your security requirements with your cost and performance goals. Key rotation at the KMS key level remains unaffected by the cache, because rotated keys produce new data keys on the next cache refresh.
Integration with the AWS Encryption SDK v3
The integration is minimal. The IClientSupplierAWS Lambda function returns a CachedKmsClient singleton for each AWS Region, this singleton is passed into the AwsKmsMrkMultiKeyring at keyring construction time. From that point forward, each GenerateDataKey and Decrypt call the SDK makes flows through the caching decorator transparently, with no changes to the encrypt or decrypt call sites.
The CachedKmsClient is a singleton per Region (managed using a ConcurrentHashMap), so all tenants on the same node share the same caching layer but their data keys remain fully isolated because the cache keys include the tenant-specific AWS KMS key ARN.
Why Caffeine?
Caffeine is a high-performance, near-optimal Java caching library well-suited for this pattern for several reasons:
Atomic loading: LoadingCache.get() guarantees that on a cache miss, only one thread executes the loader while others wait. This is the core property that eliminates the stampede.
refreshAfterWrite semantics: Unlike expireAfterWrite (which blocks all threads during refresh), refreshAfterWrite allows one thread to asynchronously reload the entry while other threads continue to serve the stale-but-valid cached value. This eliminates latency spikes during key rotation.
Observability: Cache eviction listeners and Micrometer metric counters can be wired in to track actual KMS call volume per tenant KMS key, enabling real-time cost monitoring.
Choosing between the two options
The hierarchical keyring with DynamoDB (Option A) is a production-ready, AWS-recommended solution that reduces stampede frequency by introducing longer-lived branch keys. It’s the best choice for most organizations. Particularly when starting fresh or when the operational overhead of an additional data store is acceptable.
NICE Actimize chose the custom caching approach (Option B) for a pragmatic reason: it avoided introducing a new infrastructure dependency into the encryption critical path. Their platform already operated at scale across hundreds of tenants, and adding a DynamoDB table as a key coordination layer would have meant taking on additional operational responsibility: provisioning, monitoring, backup, access control, and ensuring high availability for a component that sits directly in the encrypt/decrypt hot path. In a regulated financial services environment, each new stateful component in the security chain requires its own resilience planning, failure-mode analysis, and compliance review. The Caffeine cache used in Option B, by contrast, is an in-process library (a JAR on the classpath). It is stateless, requires no network calls, no provisioning and no operational overhead. It makes a lighter dependency than a managed cloud resource in the critical path. There is no shared state to lose, no additional infrastructure to protect, and no new failure mode beyond what already exists with AWS KMS itself. If a node restarts, the cache rebuilds on the next KMS call.
Results
By implementing a rotation policy with the optimized caching approach, NICE Actimize achieved the following results:
77% reduction in AWS KMS costs – Eliminating millions of redundant API calls translated directly into significant cost savings.
Maintained strict per-tenant isolation – Per-tenant encryption isolation remained fully intact, with no compromise to their security posture.
Improved system performance – Removing the stampede of duplicate AWS KMS calls reduced latency and freed up system resources for core processing.
The cache stampede problem compounds in multi-tenant encryption systems: excess data key generation on the encrypt side degrades cache hit ratios on the decrypt side, creating a feedback loop of redundant KMS calls. The AWS-recommended hierarchical keyring pattern with DynamoDB provides a production-ready solution that integrates with the AWS Encryption SDK with minimal code changes. For regulated environments requiring additional control, a custom caching approach can deliver similar results.
If you operate a multi-tenant SaaS platform or a high-throughput system with per-tenant encryption requirements, consider these patterns to optimize your encryption costs and performance.
To provide the best experiences, we use technologies like cookies to store and/or access device information. Consenting to these technologies will allow us to process data such as browsing behavior or unique IDs on this site. Not consenting or withdrawing consent, may adversely affect certain features and functions.
Functional
Always active
The technical storage or access is strictly necessary for the legitimate purpose of enabling the use of a specific service explicitly requested by the subscriber or user, or for the sole purpose of carrying out the transmission of a communication over an electronic communications network.
Preferences
The technical storage or access is necessary for the legitimate purpose of storing preferences that are not requested by the subscriber or user.
Statistics
The technical storage or access that is used exclusively for statistical purposes.The technical storage or access that is used exclusively for anonymous statistical purposes. Without a subpoena, voluntary compliance on the part of your Internet Service Provider, or additional records from a third party, information stored or retrieved for this purpose alone cannot usually be used to identify you.
Marketing
The technical storage or access is required to create user profiles to send advertising, or to track the user on a website or across several websites for similar marketing purposes.