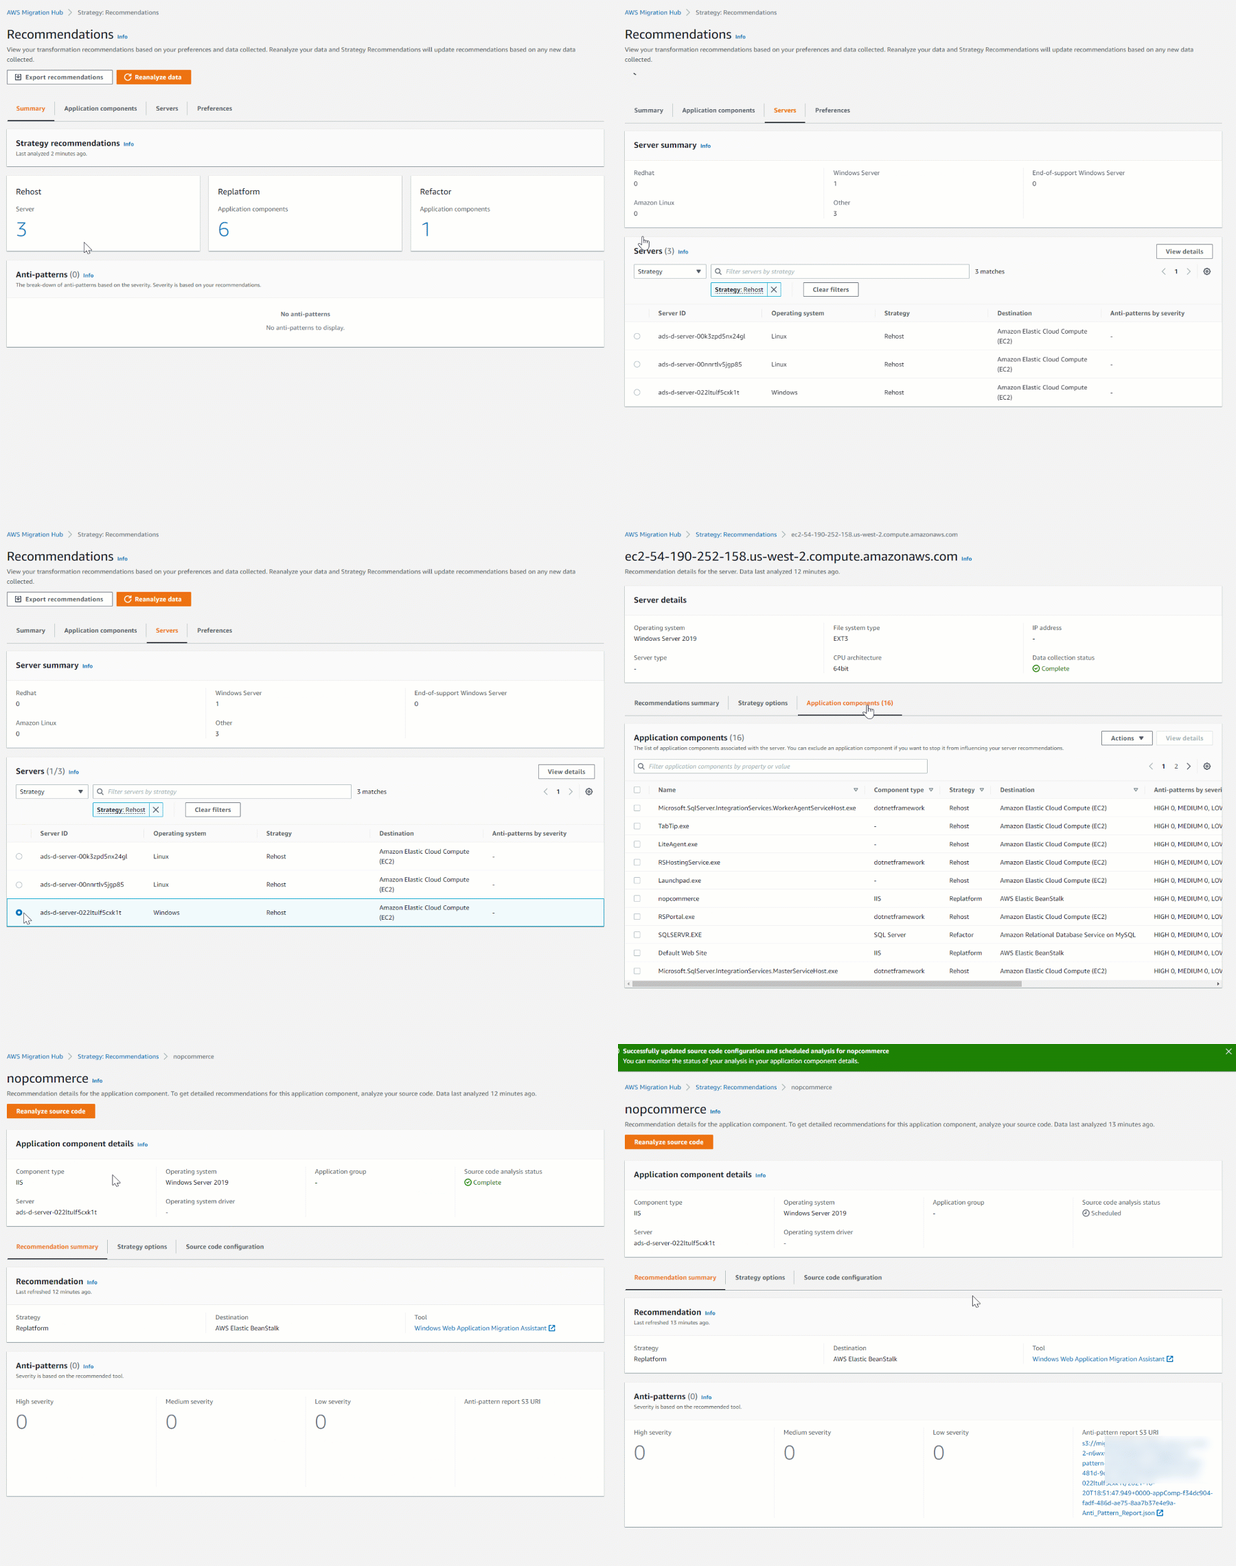
Accelerate large-scale data migration validation using PyDeequ

Post Syndicated from Mahendar Gajula original https://aws.amazon.com/blogs/big-data/accelerate-large-scale-data-migration-validation-using-pydeequ/

Many enterprises are migrating their on-premises data stores to the AWS Cloud. During data migration, a key requirement is to validate all the data that has been moved from on premises to the cloud. This data validation is a critical step and if not done correctly, may result in the failure of the entire project. However, developing custom solutions to determine migration accuracy by comparing the data between the source and target can often be time-consuming.

In this post, we walk through a step-by-step process to validate large datasets after migration using PyDeequ. PyDeequ is an open-source Python wrapper over Deequ (an open-source tool developed and used at Amazon). Deequ is written in Scala, whereas PyDeequ allows you to use its data quality and testing capabilities from Python and PySpark.

Prerequisites

Before getting started, make sure you have the following prerequisites:

Solution overview

This solution uses the following services:

  • Amazon RDS for My SQL as the database engine for the source database.
  • Amazon Simple Storage Service (Amazon S3) or Hadoop Distributed File System (HDFS) as the target.
  • Amazon EMR to run the PySpark script. We use PyDeequ to validate data between MySQL and the corresponding Parquet files present in the target.
  • AWS Glue to catalog the technical table, which stores the result of the PyDeequ job.
  • Amazon Athena to query the output table to verify the results.

We use profilers, which is one of the metrics computation components of PyDeequ. We use this to analyze each column in the given dataset to calculate statistics like completeness, approximate distinct values, and data types.

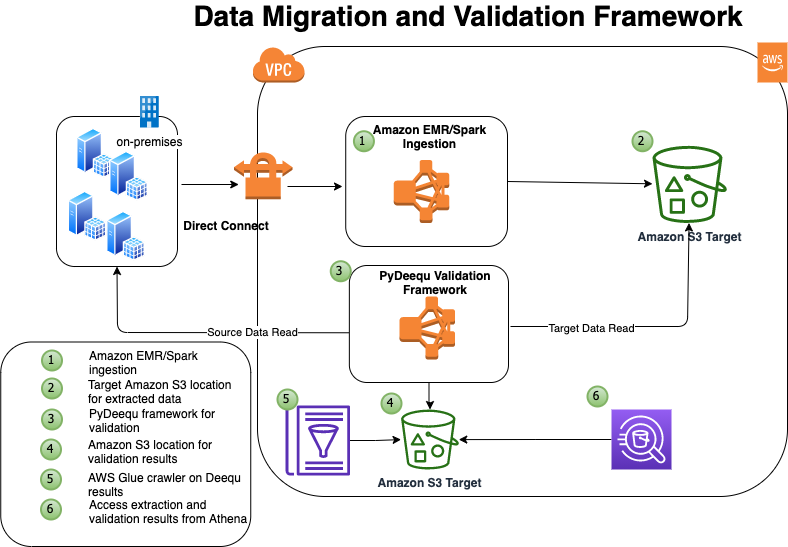
The following diagram illustrates the solution architecture.

In this example, you have four tables in your on-premises database that you want to migrate: tbl_books, tbl_sales, tbl_venue, and tbl_category.

Deploy the solution

To make it easy for you to get started, we created an AWS CloudFormation template that automatically configures and deploys the solution for you.

The CloudFormation stack performs the following actions:

  • Launches and configures Amazon RDS for MySQL as a source database
  • Launches Secrets Manager for storing the credentials for accessing the source database
  • Launches an EMR cluster, creates and loads the database and tables on the source database, and imports the open-source library for PyDeequ at the EMR primary node
  • Runs the Spark ingestion process from Amazon EMR, connecting to the source database, and extracts data to Amazon S3 in Parquet format

To deploy the solution, complete the following steps:

  1. Choose Launch Stack to launch the CloudFormation template.

The template is launched in the US East (N. Virginia) Region by default.

  1. On the Select Template page, keep the default URL for the CloudFormation template, then choose Next.
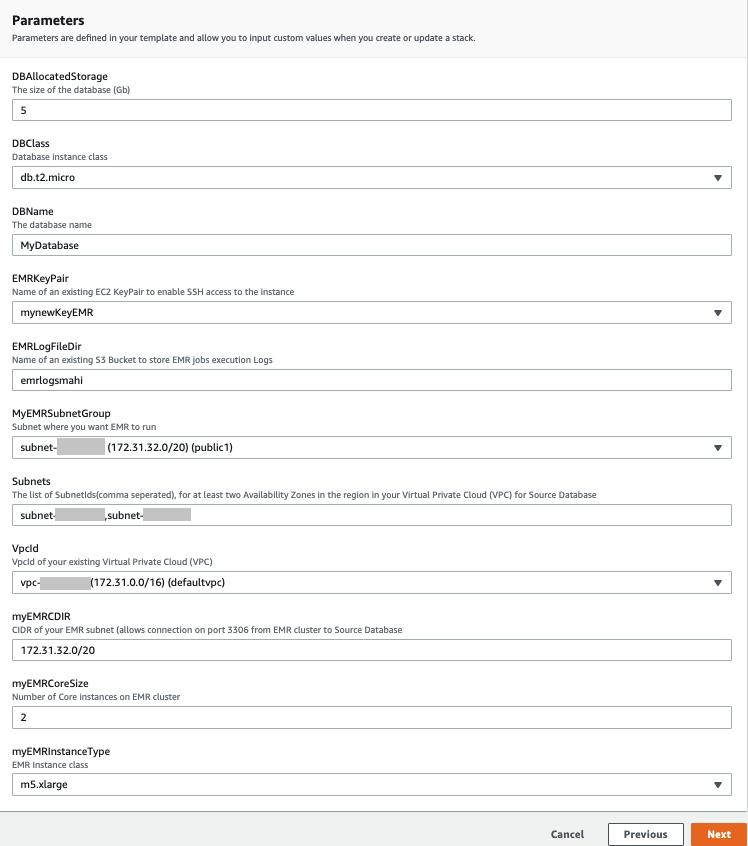
  2. On the Specify Details page, provide values for the parameters that require input (see the following screenshot).
  3. Choose Next.
  4. Choose Next again.
  5. On the Review page, select I acknowledge that AWS CloudFormation might create IAM resources with custom names.
  6. Choose Create stack.

You can view the stack outputs on the AWS Management Console or by using the following AWS Command Line Interface (AWS CLI) command:

aws cloudformation describe-stacks --stack-name <stack-name> --region us-east-1 --query Stacks[0].Outputs

It takes approximately 20–30 minutes for the deployment to complete. When the stack is complete, you should see the resources in the following table launched and available in your account.

Resource Name Functionality
DQBlogBucket The S3 bucket that stores the migration accuracy results for the AWS Glue Data Catalog table
EMRCluster The EMR cluster to run the PyDeequ validation process
SecretRDSInstanceAttachment Secrets Manager for securely accessing the source database
SourceDBRds The source database (Amazon RDS)

When the EMR cluster is launched, it runs the following steps as part of the post-cluster launch:

  • DQsetupStep – Installs the Deequ JAR file and MySQL connector. This step also installs Boto3 and the PyDeequ library. It also downloads sample data files to use in the next step.
  • SparkDBLoad – Runs the initial data load to the MySQL database or table. This step creates the test environment that we use for data validation purposes. When this step is complete, we have four tables with data on MySQL and respective data files in Parquet format on HDFS in Amazon EMR.

When the Amazon EMR step SparkDBLoad is complete, we verify the data records in the source tables. You can connect to the source database using your preferred SQL editor. For more details, see Connecting to a DB instance running the MySQL database engine.

The following screenshot is a preview of sample data from the source table MyDatabase.tbl_books.

Validate data with PyDeequ

Now the test environment is ready and we can perform data validation using PyDeequ.

  1. Use Secure Shell (SSH) to connect to the primary node.
  2. Run the following Spark command, which performs data validation and persists the results to an AWS Glue Data Catalog table (db_deequ.db_migration_validation_result):
spark-submit --jars deequ-1.0.5.jar pydeequ_validation.py 

The script and JAR file are already available on your primary node if you used the CloudFormation template. The PySpark script computes PyDeequ metrics on the source MySQL table data and target Parquet files in Amazon S3. The metrics currently calculated as part of this example are as follows:

  • Completeness to measure fraction of not null values in a column
  • Approximate number of distinct values
  • Data type of column

If required, we can compute more metrics for each column. To see the complete list of supported metrics, see the PyDeequ package on GitHub.

The output metrics from the source and target are then compared using a PySpark DataFrame.

When that step is complete, the PySpark script creates the AWS Glue table db_deequ.db_migration_validation_result in your account, and you can query this table from Athena to verify the migration accuracy.

Verify data validation results with Athena

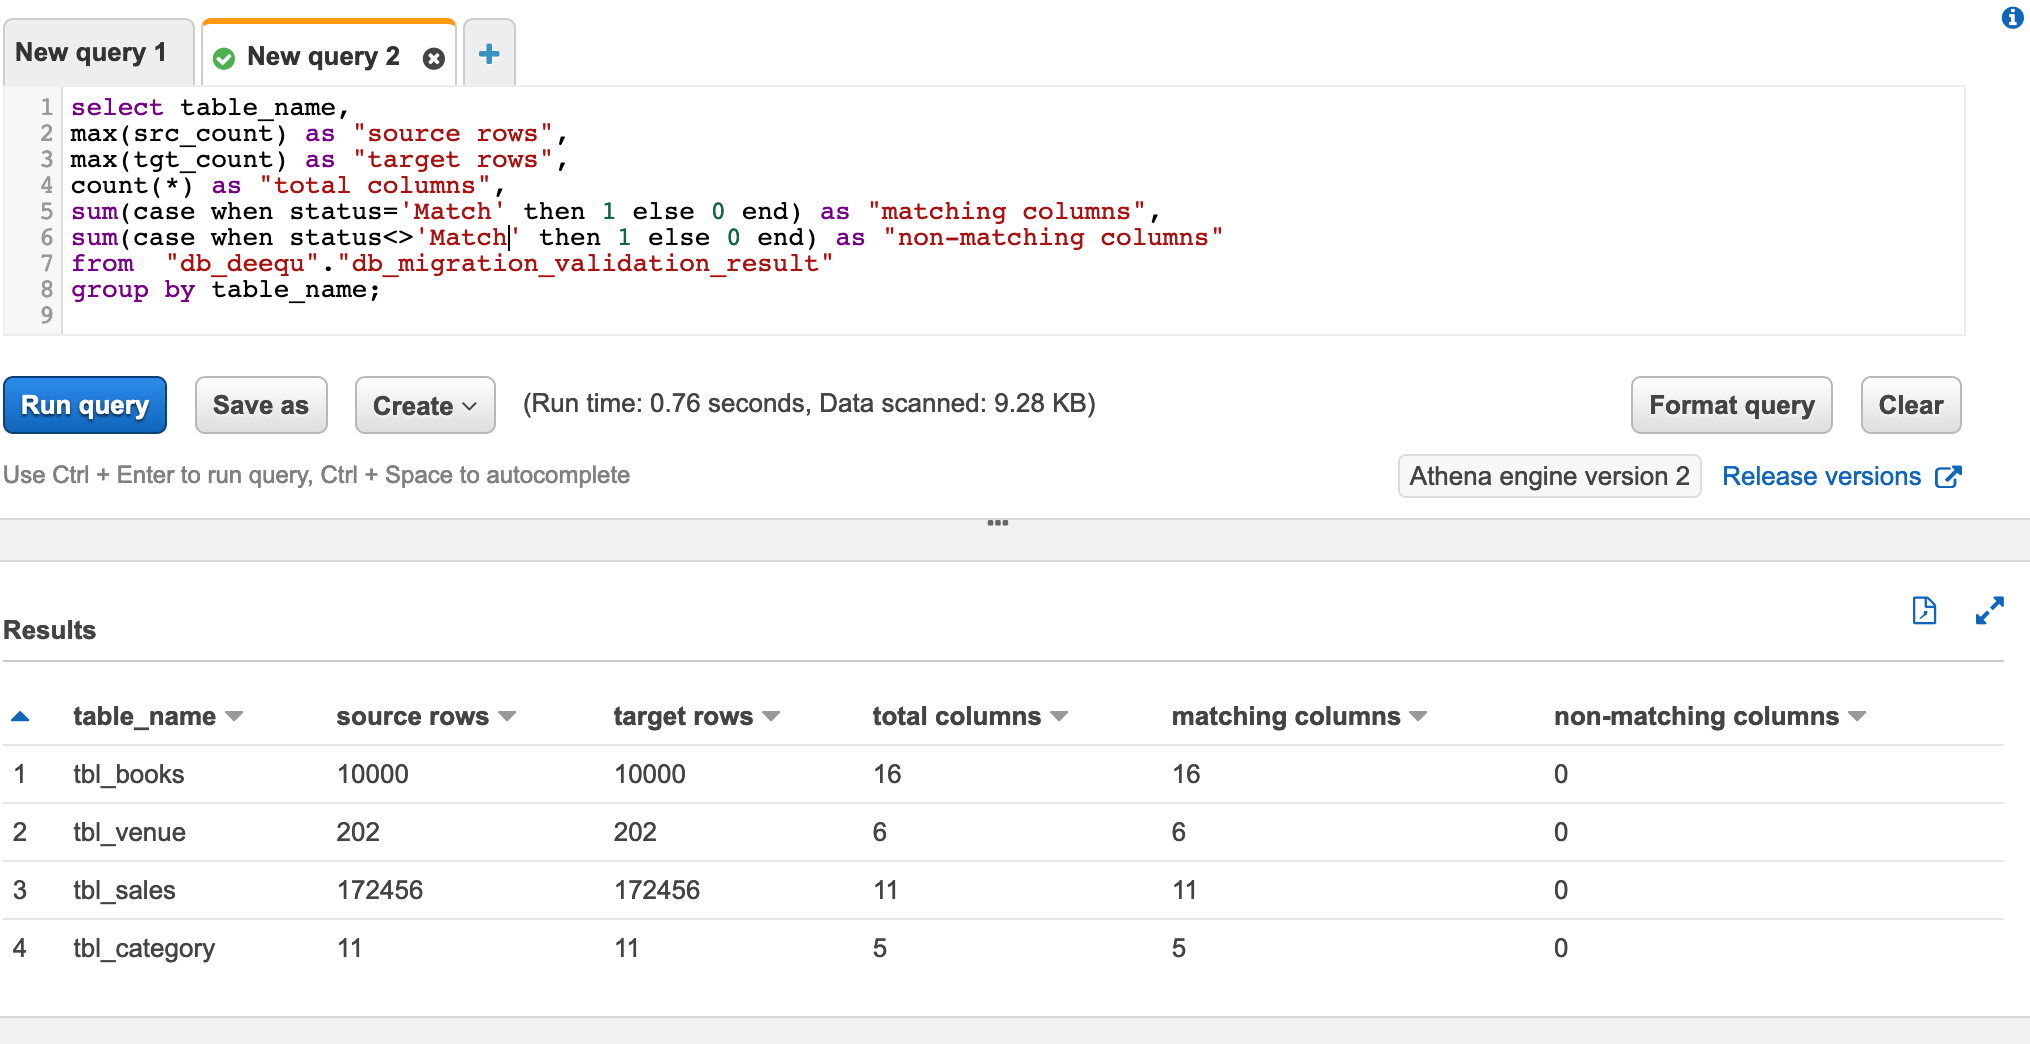
You can use Athena to check the overall data validation summary of all the tables. The following query shows you the aggregated data output. It lists all the tables you validated using PyDeequ and how many columns match between the source and target.

select table_name,
max(src_count) as "source rows",
max(tgt_count) as "target rows",
count(*) as "total columns",
sum(case when status='Match' then 1 else 0 end) as "matching columns",
sum(case when status<>'Match' then 1 else 0 end) as "non-matching columns"
from  "db_deequ"."db_migration_validation_result"
group by table_name;

The following screenshot shows our results.

Because all your columns match, you can have high confidence that the data has been exported correctly.

You can also check the data validation report for any table. The following query gives detailed information about any specific table metrics captured as part of PyDeequ validation:

select col_name,src_datatype,tgt_datatype,src_completeness,tgt_completeness,src_approx_distinct_values,tgt_approx_distinct_values,status 
from "db_deequ"."db_migration_validation_result"
where table_name='tbl_sales'

The following screenshot shows the query results. The last column status is the validation result for the columns in the table.

Clean up

To avoid incurring additional charges, complete the following steps to clean up your resources when you’re done with the solution:

  1. Delete the AWS Glue database and table db_deequ.db_migration_validation_result.
  2. Delete the prefixes and objects you created from the bucket dqblogbucket-${AWS::AccountId}.
  3. Delete the CloudFormation stack, which removes your additional resources.

Customize the solution

The solution consists of two parts:

  • Data extraction from the source database
  • Data validation using PyDeequ

In this section, we discuss ways to customize the solution based on your needs.

Data extraction from the source database

Depending on your data volume, there are multiple ways of extracting data from on-premises database sources to AWS. One recommended service is AWS Data Migration Service (AWS DMS). You can also use AWS Glue, Spark on Amazon EMR, and other services.

In this post, we use PySpark to connect to the source database using a JDBC connection and extract the data into HDFS using an EMR cluster.

The primary reason is that we’re already using Amazon EMR for PyDeequ, and we can use the same EMR cluster for data extraction.

In the CloudFormation template, the Amazon EMR step SparkDBLoad runs the PySpark script blogstep3.py. This PySpark script uses Secrets Manager and a Spark JDBC connection to extract data from the source to the target.

Data validation using PyDeequ

In this post, we use ColumnProfilerRunner from the pydeequ.profiles package for metrics computation. The source data is from the database using a JDBC connection, and the target data is from data files in HDFS and Amazon S3.

To create a DataFrame with metrics information for the source data, use the following code:

df_readsrc = spark.read.format('jdbc').option('url',sqlurl).option('dbtable',tbl_name).option('user',user).option('password',pwd).load()

result_rds = ColumnProfilerRunner(spark).onData(df_readsrc).run()
a=[]
for col, profile in result_rds.profiles.items():
    b=[]
    b.append(""+col +","+ str(profile.completeness)+","+ str(profile.approximateNumDistinctValues)+","+ str(profile.dataType)+"")
    a.append(b[0])

rdd1 = spark.sparkContext.parallelize(a)
row_rdd = rdd1.map(lambda x: Row(x))
df=spark.createDataFrame(row_rdd,['column'])

finalDataset = df.select(split(df.column,",")).rdd.flatMap(lambda x: x).toDF(schema=['column','completeness','approx_distinct_values','inferred_datatype'])

Similarly, the metrics is computed for the target (the data file).

You can create a temporary view from the DataFrame to use in the next step for metrics comparison.

After we have both the source (vw_Source) and target (vw_Target) available, we use the following query in Spark to generate the output result:

df_result = spark.sql("select t1.table_name as table_name,t1.column as col_name,t1.inferred_datatype as src_datatype,t2.inferred_datatype as tgt_datatype,t1.completeness as src_completeness,t2.completeness as tgt_completeness,t1.approx_distinct_values as src_approx_distinct_values,t2.approx_distinct_values as tgt_approx_distinct_values,t1.count as src_count,t2.count as tgt_count,case when t1.inferred_datatype=t2.inferred_datatype and t1.completeness=t2.completeness and t1.approx_distinct_values=t2.approx_distinct_values and t1.count=t2.count then 'Match' else 'No Match' end as status from vw_Source t1 left outer join vw_Target t2 on t1.column = t2.column")

The generated result is stored in the db_deequ.db_migration_validation_result table in the Data Catalog.

If you used the CloudFormation template, the entire PyDeequ code used in this post is available at the path /home/hadoop/pydeequ_validation.py in the EMR cluster.

You can modify the script to include or exclude tables as per your requirements.

Conclusion

This post showed you how you can use PyDeequ to accelerate the post-migration data validation process. PyDeequ helps you calculate metrics at the column level. You can also use more PyDeequ components like constraint verification to build a custom data validation framework.

For more use cases on Deequ, check out the following:


About the Authors

Mahendar Gajula is a Sr. Data Architect at AWS. He works with AWS customers in their journey to the cloud with a focus on Big data, Data Lakes, Data warehouse and AI/ML projects. In his spare time, he enjoys playing tennis and spending time with his family.

Nitin Srivastava is a Data & Analytics consultant at Amazon Web Services. He has more than a decade of datawarehouse experience along with designing and implementing large scale Big Data and Analytics solutions. He works with customers to deliver the next generation big data analytics platform using AWS technologies.
Amazon RDS Custom for Oracle – New Control Capabilities in Database Environment

Post Syndicated from Channy Yun original https://aws.amazon.com/blogs/aws/amazon-rds-custom-for-oracle-new-control-capabilities-in-database-environment/

Managing databases in self-managed environments such as on premises or Amazon Elastic Compute Cloud (Amazon EC2) requires customers to spend time and resources doing database administration tasks such as provisioning, scaling, patching, backups, and configuring for high availability. So, hundreds of thousands of AWS customers use Amazon Relational Database Service (Amazon RDS) because it automates these undifferentiated administration tasks.

However, there are some legacy and packaged applications that require customers to make specialized customizations to the underlying database and the operating system (OS), such as Oracle industry specialized applications for healthcare and life sciences, telecom, retail, banking, and hospitality. Customers with these specific customization requirements cannot get the benefits of a fully managed database service like Amazon RDS, and they end up deploying their databases on premises or on EC2 instances.

Today, I am happy to announce the general availability of Amazon RDS Custom for Oracle, new capabilities that enable database administrators to access and customize the database environment and operating system. With RDS Custom for Oracle, you can now access and customize your database server host and operating system, for example by applying special patches and changing the database software settings to support third-party applications that require privileged access.

You can easily move your existing self-managed database for these applications to Amazon RDS and automate time-consuming database management tasks, such as software installation, patching, and backups. Here is a simple comparison of features and responsibilities between Amazon EC2, RDS Custom for Oracle, and RDS.

Features and Responsibilities Amazon EC2 RDS Custom for Oracle Amazon RDS
Application optimization Customer Customer Customer
Scaling/high availability Customer Shared AWS
DB backups Customer Shared AWS
DB software maintenance Customer Shared AWS
OS maintenance Customer Shared AWS
Server maintenance AWS AWS AWS

The shared responsibility model of RDS Custom for Oracle gives you more control than in RDS, but also more responsibility, similar to EC2. So, if you need deep control of your database environment where you take responsibility for changes that you make and want to offload common administration tasks to AWS, RDS Custom for Oracle is the recommended deployment option over self-managing databases on EC2.

Getting Started with Amazon RDS Custom for Oracle
To get started with RDS Custom for Oracle, you create a custom engine version (CEV), the database installation files of supported Oracle database versions and upload the CEV to Amazon Simple Storage Service (Amazon S3). This launch includes Oracle Enterprise Edition allowing Oracle customers to use their own licensed software with bring your own license (BYOL).

Then with just a few clicks in the AWS Management Console, you can deploy an Oracle database instance in minutes. Then, you can connect to it using SSH or AWS Systems Manager.

Before creating and connecting your DB instance, make sure that you meet some prerequisites such as configuring the AWS Identity and Access Management (IAM) role and Amazon Virtual Private Cloud (VPC) using the pre-created AWS CloudFormation template in the Amazon RDS User Guide.

A symmetric AWS Key Management Service (KMS) key is required for RDS Custom for Oracle. If you don’t have an existing symmetric KMS key in your account, create a KMS key by following the instructions in Creating keys in the AWS KMS Developer Guide.

The Oracle Database installation files and patches are hosted on Oracle Software Delivery Cloud. If you want to create a CEV, search and download your preferred version under the Linux x86/64 platform and upload it to Amazon S3.

$ aws s3 cp install-or-patch-file.zip \ s3://my-oracle-db-files

To create CEV for creating a DB instance, you need a CEV manifest, a JSON document that describes installation .zip files stored in Amazon S3. RDS Custom for Oracle will apply the patches in the order in which they are listed when creating the instance by using this CEV.

{
    "mediaImportTemplateVersion": "2020-08-14",
    "databaseInstallationFileNames": [
        "V982063-01.zip"
    ],
    "opatchFileNames": [
        "p6880880_190000_Linux-x86-64.zip"
    ],
    "psuRuPatchFileNames": [
        "p32126828_190000_Linux-x86-64.zip"
    ],
    "otherPatchFileNames": [
        "p29213893_1910000DBRU_Generic.zip",
        "p29782284_1910000DBRU_Generic.zip",
        "p28730253_190000_Linux-x86-64.zip",
        "p29374604_1910000DBRU_Linux-x86-64.zip",
        "p28852325_190000_Linux-x86-64.zip",
        "p29997937_190000_Linux-x86-64.zip",
        "p31335037_190000_Linux-x86-64.zip",
        "p31335142_190000_Generic.zip"
] }

To create a CEV in the AWS Management Console, choose Create custom engine version in the Custom engine version menu.

You can set Engine type to Oracle, choose your preferred database edition and version, and enter CEV manifest, the location of the S3 bucket that you specified. Then, choose Create custom engine version. Creation takes approximately two hours.

To create your DB instance with the prepared CEV, choose Create database in the Databases menu. When you choose a database creation method, select Standard create. You can set Engine options to Oracle and choose Amazon RDS Custom in the database management type.

In Settings, enter a unique name for the DB instance identifier and your master username and password. By default, the new instance uses an automatically generated password for the master user. To learn more in the remaining setting, see Settings for DB instances in the Amazon RDS User Guide. Choose Create database.

Alternatively, you can create a CEV by running create-custom-db-engine-version command in the AWS Command Line Interface (AWS CLI).

$ aws rds create-db-instances \
      --engine my-oracle-ee \
      --db-instance-identifier my-oracle-instance \ 
      --engine-version 19.my_cev1 \ 
      --allocated-storage 250 \ 
      --db-instance-class db.m5.xlarge \ 
      --db-subnet-group mydbsubnetgroup \ 
      --master-username masterawsuser \ 
      --master-user-password masteruserpassword \ 
      --backup-retention-period 3 \ 
      --no-multi-az \ 
              --port 8200 \
      --license-model bring-your-own-license \
      --kms-key-id my-kms-key

After you create your DB instance, you can connect to this instance using an SSH client. The procedure is the same as for connecting to an Amazon EC2 instance. To connect to the DB instance, you need the key pair associated with the instance. RDS Custom for Oracle creates the key pair on your behalf. The pair name uses the prefix do-not-delete-ssh-privatekey-db-. AWS Secrets Manager stores your private key as a secret.

For more information, see Connecting to your Linux instance using SSH in the Amazon EC2 User Guide.

You can also connect to it using AWS Systems Manager Session Manager, a capability that lets you manage EC2 instances through a browser-based shell. To learn more, see Connecting to your RDS Custom DB instance using SSH and AWS Systems Manager in the Amazon RDS User Guide.

Things to Know
Here are a couple of things to keep in mind about managing your DB instance:

High Availability (HA): To configure replication between DB instances in different Availability Zones to be resilient to Availability Zone failures, you can create read replicas for RDS Custom for Oracle DB instances. Read replica creation is similar to Amazon RDS, but with some differences. Not all options are supported when creating RDS Custom read replicas. To learn how to configure HA, see Working with RDS Custom for Oracle read replicas in the AWS Documentation.

Backup and Recovery: Like Amazon RDS, RDS Custom for Oracle creates and saves automated backups during the backup window of your DB instance. You can also back up your DB instance manually. The procedure is identical to taking a snapshot of an Amazon RDS DB instance. The first snapshot contains the data for the full DB instance just like in Amazon RDS. RDS Custom also includes a snapshot of the OS image, and the EBS volume that contains the database software. Subsequent snapshots are incremental. With backup retention enabled, RDS Custom also uploads transaction logs into an S3 bucket in your account to be used with the RDS point-in-time recovery feature. Restore DB snapshots, or restore DB instances to a specific point in time using either the AWS Management Console or the AWS CLI. To learn more, see Backing up and restoring an Amazon RDS Custom for Oracle DB instance in the Amazon RDS User Guide.

Monitoring and Logging: RDS Custom for Oracle provides a monitoring service called the support perimeter. This service ensures that your DB instance uses a supported AWS infrastructure, operating system, and database. Also, all changes and customizations to the underlying operating system are automatically logged for audit purposes using Systems Manager and AWS CloudTrail. To learn more, see Troubleshooting an Amazon RDS Custom for DB instance in the Amazon RDS User Guide.

Now Available
Amazon RDS Custom for Oracle is now available in US East (N. Virginia), US East (Ohio), US West (Oregon), EU (Frankfurt), EU (Ireland), EU (Stockholm), Asia Pacific (Singapore), Asia Pacific (Sydney), and Asia Pacific (Tokyo) regions.

To learn more, take a look at the product page and documentations of Amazon RDS Custom for Oracle. Please send us feedback either in the AWS forum for Amazon RDS or through your usual AWS support contacts.

Channy

Three ways to improve your cybersecurity awareness program

Post Syndicated from Stephen Schmidt original https://aws.amazon.com/blogs/security/three-ways-to-improve-your-cybersecurity-awareness-program/

Raising the bar on cybersecurity starts with education. That’s why we announced in August that Amazon is making its internal Cybersecurity Awareness Training Program available to businesses and individuals for free starting this month. This is the same annual training we provide our employees to help them better understand and anticipate potential cybersecurity risks. The training program will include a getting started guide to help you implement a cybersecurity awareness training program at your organization. It’s aligned with NIST SP 800-53rev4, ISO 27001, K-ISMS, RSEFT, IRAP, OSPAR, and MCTS.

I also want to share a few key learnings for how to implement effective cybersecurity training programs that might be helpful as you develop your own training program:

  1. Be sure to articulate personal value. As humans, we have an evolved sense of physical risk that has developed over thousands of years. Our bodies respond when we sense danger, heightening our senses and getting us ready to run or fight. We have a far less developed sense of cybersecurity risk. Your vision doesn’t sharpen when you assign the wrong permissions to a resource, for example. It can be hard to describe the impact of cybersecurity, but if you keep the message personal, it engages parts of the brain that are tied to deep emotional triggers in memory. When we describe how learning a behavior—like discerning when an email might be phishing—can protect your family, your child’s college fund, or your retirement fund, it becomes more apparent why cybersecurity matters.
  2. Be inclusive. Humans are best at learning when they share a lived experience with their educators so they can make authentic connections to their daily lives. That’s why inclusion in cybersecurity training is a must. But that only happens by investing in a cybersecurity awareness team that includes people with different backgrounds, so they can provide insight into different approaches that will resonate with diverse populations. People from different cultures, backgrounds, and age cohorts can provide insight into culturally specific attack patterns as well as how to train for them. For example, for social engineering in hierarchical cultures, bad actors often spoof authority figures, and for individualistic cultures, they play to the target’s knowledge and importance, and give compliments. And don’t forget to make everything you do accessible for people with varying disability experiences, because everyone deserves the same high-quality training experience. The more you connect with people, the more they internalize your message and provide valuable feedback. Diversity and inclusion breeds better cybersecurity.
  3. Weave it into workflows. Training takes investment. You have to make time for it in your day. We all understand that as part of a workforce we have to do it, but in addition to compliance training, you should be providing just-in-time reminders and challenges to complete. Try working with tooling teams to display messaging when critical tasks are being completed. Make training short and concise—3 minutes at most—so that people can make time for it in their day.

Cybersecurity training isn’t just a once-per-year exercise. Find ways to weave it into the daily lives of your workforce, and you’ll be helping them protect not only your company, but themselves and their loved ones as well.

Get started by going to learnsecurity.amazon.com and take the Cybersecurity Awareness training.

Want more AWS Security how-to content, news, and feature announcements? Follow us on Twitter.

Steve Schmidt

Steve is Vice President and Chief Information Security Officer for AWS. His duties include leading product design, management, and engineering development efforts focused on bringing the competitive, economic, and security benefits of cloud computing to business and government customers. Prior to AWS, he had an extensive career at the Federal Bureau of Investigation, where he served as a senior executive and section chief. He currently holds 11 patents in the field of cloud security architecture. Follow Steve on Twitter.

Drive Failure Over Time: The Bathtub Curve Is Leaking

Post Syndicated from original https://www.backblaze.com/blog/drive-failure-over-time-the-bathtub-curve-is-leaking/

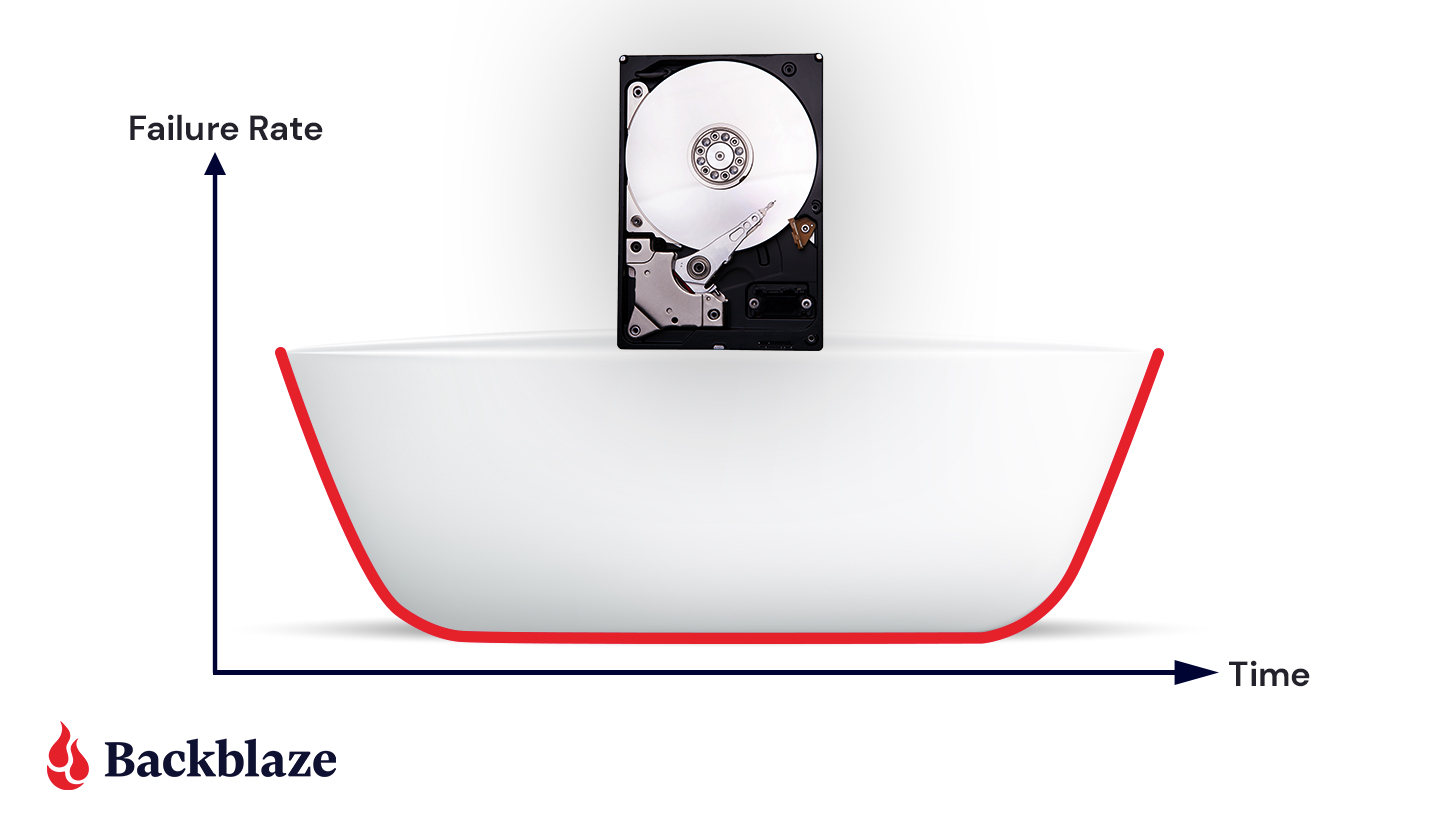
From time to time, we will reference the “bathtub curve” when talking about hard drive and SSD failure rates. This normally includes a reference or link back to a post we did in 2013 which discusses the topic. It’s time for an update. Not because the bathtub curve itself has changed, but because we have nearly seven times the number of drives and eight more years of data than we did in 2013.

In today’s post, we’ll take an updated look at how well hard drive failure rates fit the bathtub curve, and in a few weeks we’ll delve into the specifics for different drive models and even do a little drive life expectancy analysis.

Once Upon a Time, There Was a Bathtub Curve

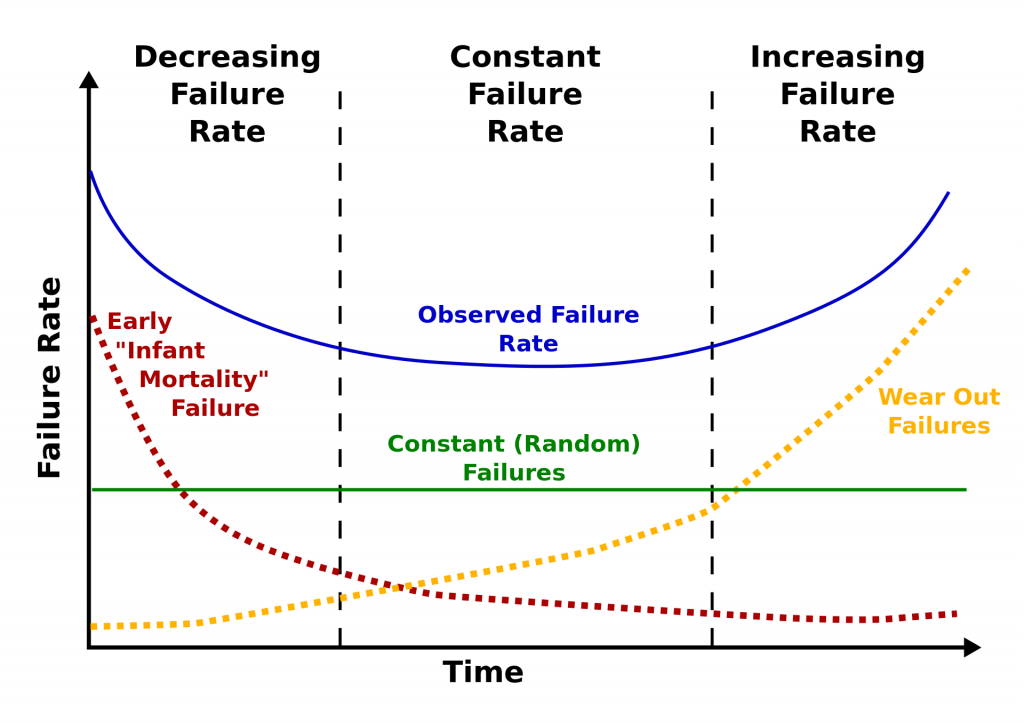
Here is the classic version of the bathtub curve.

Source: Public domain, https://commons.wikimedia.org/w/index.php?curid=7458336.

The curve is divided into three sections: decreasing failure rate, constant failure rate, and increasing failure rate. Using our 2013 drive stats data, we computed a failure rate and a timeframe for each of the three sections as follows:

2013 Drive Failure Rates

Curve Section Failure Rate Length
Decreasing 5.1% 0 to 18 Months
Constant 1.4% 18 Months to 3 Years
Increasing 11.8% 3 to 4 Years

Furthermore, we computed that at four years, the life expectancy of a hard drive in our system was about 80%, and forecasting that out, at six years, the life expectancy was 50%. In other words, we would expect a hard drive we installed to have a 50% chance of being alive after six years.

Drive Failure and the Bathtub Curve Today

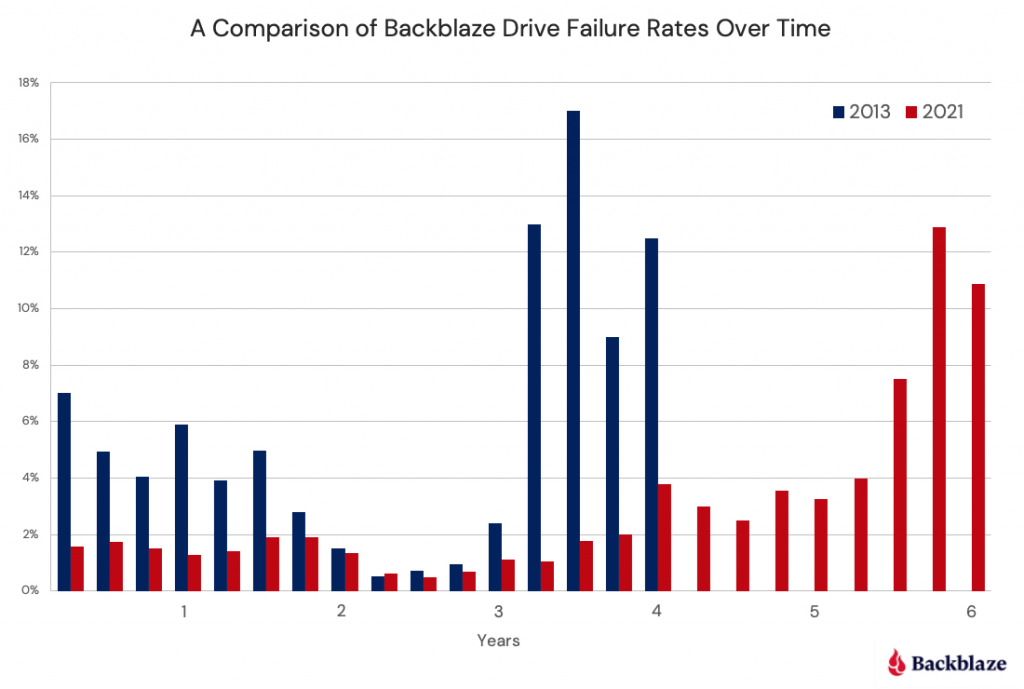
Let’s begin by comparing the drive failure rates over time based on the data available to us in 2013 and the data available to us today in 2021.

Observations and Thoughts

  • Let’s start with an easy one: We have six years worth of data for 2021 versus four years for 2013. We have a wider bathtub. In reality, it is even wider, as we have more than six years of data available to us, but after six years the number of data points (drive failures) is small, less than 10 failures per quarter.
  • The left side of the bathtub, the area of “decreasing failure rate,” is dramatically lower in 2021 than in 2013. In fact, for our 2021 curve, there is almost no left side of the bathtub, making it hard to take a bath, to say the least. We have reported how Seagate breaks in and tests their newly manufactured hard drives before shipping in an effort to lower the failure rates of their drives. Assuming all manufacturers do the same, that may explain some or all of this observation.
  • The right side of the bathtub, the area of “increasing failure rate,” moves right in 2021. Obviously, drives installed after 2013 are not failing as often in years three and four, or most of year five for that matter. We think this may have something to do with the aftermath of the Thailand drive crisis back in 2011. Drives got expensive, and quality (in the form of reduced warranty periods) went down. In addition, there was a fair amount of manufacturer consolidation as well.
  • It is interesting that for year two, the two curves, 2013 and 2021, line up very well. We think this is so because there really is a period in the middle in which the drives just work. It was just shorter in 2013 due to the factors noted above.

The Life Expectancy of Drives Today

As noted earlier, back in 2013, the 80% of the drives installed would be expected to survive four years. That fell to 50% after six years. In 2021, the life expectancy of a hard drive being alive at six years is 88%. That’s a substantial increase, but it basically comes down to the fact that hard drives are failing less in our system. We think it is a combination of better drives, better storage servers, and better practices by our data center teams.

What’s Next

For 2021, our bathtub curve looks more like a hockey stick, although saying, “When you review our hockey stick curve…” doesn’t sound quite right. We’ll try to figure out something by our next post on the topic. One thing we also want to do in that next post is to break down the drive failure data by model and see if the different drive models follow the bathtub curve, the hockey stick curve, or some other unnamed curve. We’ll also chart out the life expectancy curves for all the drives as a whole and by drive model as well.

Well, time to get back to the data, our next Drive Stats report is coming up soon.

The post Drive Failure Over Time: The Bathtub Curve Is Leaking appeared first on Backblaze Blog | Cloud Storage & Cloud Backup.

Interpreting A/B test results: false negatives and power

Post Syndicated from Netflix Technology Blog original https://netflixtechblog.com/interpreting-a-b-test-results-false-negatives-and-power-6943995cf3a8

Martin Tingley with Wenjing Zheng, Simon Ejdemyr, Stephanie Lane, and Colin McFarland

This is the fourth post in a multi-part series on how Netflix uses A/B tests to inform decisions and continuously innovate on our products. Need to catch up? Have a look at Part 1 (Decision Making at Netflix), Part 2 (What is an A/B Test?), Part 3 (False positives and statistical significance). Subsequent posts will go into more details on experimentation across Netflix, how Netflix has invested in infrastructure to support and scale experimentation, and the importance of the culture of experimentation within Netflix.

In Part 3: False positives and statistical significance, we defined the two types of mistakes that can occur when interpreting test results: false positives and false negatives. We then used simple thought exercises based on flipping coins to build intuition around false positives and related concepts such as statistical significance, p-values, and confidence intervals. In this post, we’ll do the same for false negatives and the related concept of statistical power.

Figure 1: As in Part 3, we’ll use thought exercises based on flipping coins, such as this one displaying Caesar Augustus, to build up intuition about core statistical concepts.

False negatives and power

A false negative occurs when the data do not indicate a meaningful difference between treatment and control, but in truth there is a difference. Continuing on an example from Part 3, a false negative corresponds to labeling the photo of the cat as a “not cat.” False negatives are closely related to the statistical concept of power, which gives the probability of a true positive given the experimental design and a true effect of a specific size. In fact, power is simply one minus the false negative rate.

Power involves thinking about possible outcomes given a specific assumption about the actual state of the world — similar to how in Part 3 we defined significance by first assuming the null hypothesis is true. To build intuition about power, let’s go back to the same coin example from Part 3, where the goal is to decide if the coin is unfair using an experiment that calculates the fraction of heads in 100 flips. The distribution of outcomes under the null hypothesis that the coin is fair is shown in black in Figure 2. To make the diagram easier to interpret, we’ve smoothed over the tops of the histograms.

What would happen in this experiment if the coin is not fair? To make the thought exercise more specific, let’s work through what happens when we have a coin where heads occurs, on average, 64% of the time (the choice of that peculiar number will become clear later on). Because there is uncertainty or noise in our experiment, we don’t expect to see exactly 64 heads in 100 flips. But as with the null hypothesis that the coin is fair, we can calculate all the possible outcomes if this specific alternative hypothesis is true. This distribution is shown with the red curve in Figure 2.

Figure 2: Illustrating power using the example of flipping a coin 100 times and calculating the fraction of heads. The black and red dashed lines show, respectively, the distribution of outcomes assuming the probability of heads is 50% (null hypothesis) and 64% (specific value of the alternative hypothesis). Here, the power against this alternative is 80% (red shading).

Visually, power is the fraction of this alternative (red) distribution that lies beyond the critical values under the null hypothesis (the blue lines and black curve; see Part 3). Here, 80% of the alternative distribution (red) falls to the right of the taller blue line that demarcates the critical value of the upper rejection region. Assuming that the truth about the coin is that the probability of heads is 64%, then the power of this test is 80%. To be complete, there is also a negligibly small part of the alternative (red) distribution that falls within the lower rejection region (to the left of the short blue line).

The power of a test corresponds to a specific, postulated effect size. In our example, the test has 80% power to detect that a coin is unfair, if that unfair coin in truth has a probability of heads equal to 64%. The interpretation is as follows: if the coin has probability of heads equal to 64%, and we repeatedly run the experiment of flipping 100 times and making a decision at the 5% significance level, then we will correctly reject the null hypothesis that the coin is fair in about 4 out of every 5 experiments. And 20% of those repeated experiments will result in a false negative: we’ll not reject the null hypothesis that the coin is fair, even though it is unfair.

Ways to increase power

In designing an A/B test, we first fix the significance level (the convention is 5%: if there is no difference between treatment and control, we’ll see false positives 5% of the time), and then design the experiment to control false negatives. There are three primary levers we can pull to increase power and reduce the probability of false negatives:

  1. Effect size. Simply put, the larger the effect size — the difference in metric values between Groups A and B — the higher the probability that we’ll be able to correctly detect that difference. To build intuition, think about running an experiment to determine if a coin is unfair, where the data we collect is the fraction of heads in 100 flips. Now think of two scenarios. In the first scenario, the true probability of heads is 55%, and in the second it is 75%. Intuitively (and mathematically!) it is more likely that our experiment identifies the coin as unfair in the second scenario. The true probability of heads is further from the null value of 50%, so it’s more likely that an experiment will produce an outcome that falls in the rejection region. In the product development context, we can increase the expected magnitude of metric movements by being bold vs incremental with the hypotheses we test. Another strategy to increase effect sizes is to test in new areas of the product, where there may be room for larger improvements in member satisfaction. That said, one of the joys of learning through experimentation is the element of surprise: at times, seemingly small changes can have a major impact on top-line metrics.
  2. Sample size. The more units in the experiment, the higher the power and the easier it is to correctly identify smaller effects. To build intuition, think again about running an experiment to determine if a coin is unfair, where the data we collect is the fraction of heads in a fixed number of flips and the true probability of heads is 64%. Consider two scenarios: in the first, we flip the coin 20 times, and in the second, we flip the coin 100 times. Intuitively (and mathematically!), it is more likely that our experiment identifies the coin as unfair in the second scenario. With more data, the result from the experiment is going to be closer to the true rate of 64% heads, while the outcomes under the assumption of a fair coin concentrate around 0.50, causing the rejection region to encroach on the 50% value. These effects combine, so that with more data there is a greater probability that the result from the experiment with the unfair coin will fall in that rejection region, resulting in a true positive. In the product development context, we can increase the power by allocating more members (or other units) to the test or by reducing the number of test groups, though there is a tradeoff between the sample size in each test and the number of non-overlapping tests that can be run at the same time.
  3. The variability of the metric in the underlying population. The more homogenous the metric within the population we are testing on, the easier it is to correctly identify true effects. The intuition for this one is a bit trickier, and our simple coin examples finally break down. Say at Netflix that we run a test that aims to reduce some measure of latency, such as the delay between a member pressing play and video playback commencing. Given the variety of devices and internet connections that people use to access Netflix, there is a lot of natural variability in this metric across our users. As a result, if the test treatment results in a small reduction in the latency metric, it’s hard to successfully identify — the “noise” from the variability across members overwhelms the small signal. In contrast, if we ran the test on a set of members that used similar devices with similar web connections, then the small signal is easier to identify — there is less noise that might drown out the signal. We spend a lot of time at Netflix building statistical analysis models that exploit this intuition, and increase power by effectively lowering the variability; see here for a technical description of our approach.

Powering for reasonable and meaningful effects

Power and the false negative rate are functions of a postulated effect size. Much like how the 5% false positive rate is a widely-accepted convention, the rule of thumb with power is to aim for 80% power for a reasonable and meaningful effect size (we’ll get to each of those below). That is, we postulate an effect size and then design the experiment, primarily through setting the sample size, such that, if the true impact of the treatment experience is as we’ve postulated, the test will correctly identify that there is an effect 80% of the time. And 20% of the time the result from the test will be a false negative: in truth, there is an effect, but our observation from the test does not lie in the rejection region and we fail to conclude that there is an effect. That’s why the examples above used a 64% probability of heads: an experiment with 100 flips then has 80% power.

What constitutes a reasonable effect size can be tricky, as tests can surprise us. But a mix of domain knowledge and common sense can generally provide solid estimates. In an area where testing has a long history, such as optimizing the recommendation systems that help Netflix members choose content that’s great for them, we have a solid idea about the effect sizes that our tests tend to produce (be they positive or negative). Given an understanding of past effect sizes, as well as the analysis strategy, we can set the sample size to ensure the test has 80% power for a reasonable metric movement.

The second consideration, both in this experimental design phase and in deciding where to invest efforts, is to determine what constitutes a meaningful impact to the primary metrics used to decide the test. What is meaningful will depend on the impact area of the experiment (member satisfaction, playback latency, technical performance of back end systems, etc.), and potentially the effort or costs associated with the new product experience. As a hypothetical, say that, for effect sizes smaller than a 0.1% change in the primary metric, the cost of supporting the new product feature outweighs the benefits. In this case, there’s little point in powering a test to detect a 0.01% change in the metric, as successfully identifying an effect of that size won’t result in a meaningful change in decisions. Likewise, if the effect sizes seen in tests in a given innovation area are consistently immaterial to the user experience or the business, that’s a sign that experimentation resources can be more efficiently deployed elsewhere.

Summary

Parts 3 and 4 of this series have focussed on defining and building intuition around the core concepts used to analyze test results: false positives and negatives, statistical significance, p-values, and power.

An uncomfortable truth about experimentation is that we can’t simultaneously minimize both false positives and false negatives. In fact, false positives and negatives trade off with one another. If we used a more stringent false positive rate, such as 0.01%, we’d reduce the number of false positives for tests where there is no difference between A and B — but we’d also reduce the power of the test, increasing the rate of false negatives, for those tests where there is a meaningful difference. Using a 5% false positive rate and targeting 80% power are well-established conventions that balance between limiting false discovery and enabling true discovery. However, in instances where a false positive (or false negative) poses a larger risk, researchers may deviate from these rules of thumb to minimize one type of uncertainty over another.

Our goal is not to eliminate uncertainty, but to understand and quantify the uncertainty in order to make sound decisions. In many cases, results from A/B tests require nuanced interpretation, and in fact the test result itself is only one input into a business decision. In the next post, we’ll cover how to build confidence in a decision using test results. Follow the Netflix Tech Blog to stay up to date.


Interpreting A/B test results: false negatives and power was originally published in Netflix TechBlog on Medium, where people are continuing the conversation by highlighting and responding to this story.

Monitoring and tuning federated GraphQL performance on AWS Lambda

Post Syndicated from James Beswick original https://aws.amazon.com/blogs/compute/monitoring-and-tuning-federated-graphql-performance-on-aws-lambda/

This post is written by Krzysztof Lis, Senior Software Development Engineer, IMDb.

Our federated GraphQL at IMDb distributes requests across 19 subgraphs (graphlets). To ensure reliability for customers, IMDb monitors availability and performance across the whole stack. This article focuses on this challenge and concludes a 3-part federated GraphQL series:

  • Part 1 presents the migration from a monolithic REST API to a federated GraphQL (GQL) endpoint running on AWS Lambda.
  • Part 2 describes schema management in federated GQL systems.

This presents an approach towards performance tuning. It compares graphlets with the same logic and different runtime (for example, Java and Node.js) and shows best practices for AWS Lambda tuning.

The post describes IMDb’s test strategy that emphasizes the areas of ownership for the Gateway and Graphlet teams. In contrast to the legacy monolithic system described in part 1, the federated GQL gateway does not own any business logic. Consequently, the gateway integration tests focus solely on platform features, leaving the resolver logic entirely up to the graphlets.

Monitoring and alarming

Efficient monitoring of a distributed system requires you to track requests across all components. To correlate service issues with issues in the gateway or other services, you must pass and log the common request ID.

Capture both error and latency metrics for every network call. In Lambda, you cannot send a response to the client until all work for that request is complete. As a result, this can add latency to a request.

The recommended way to capture metrics is Amazon CloudWatch embedded metric format (EMF). This scales with Lambda and helps avoid throttling by the Amazon CloudWatch PutMetrics API. You can also search and analyze your metrics and logs more easily using CloudWatch Logs Insights.

Lambda configured timeouts emit a Lambda invocation error metric, which can make it harder to separate timeouts from errors thrown during invocation. By specifying a timeout in-code, you can emit a custom metric to alarm on to treat timeouts differently from unexpected errors. With EMF, you can flush metrics before timing out in code, unlike the Lambda-configured timeout.

Running out of memory in a Lambda function also appears as a timeout. Use CloudWatch Insights to see if there are Lambda invocations that are exceeding the memory limits.

You can enable AWS X-Ray tracing for Lambda with a small configuration change to enable tracing. You can also trace components like SDK calls or custom sub segments.

Gateway integration tests

The Gateway team wants tests to be independent from the underlying data served by the graphlets. At the same time, they must test platform features provided by the Gateway – such as graphlet caching.

To simulate the real gateway-graphlet integration, IMDb uses a synthetic test graphlet that serves mock data. Given the graphlet’s simplicity, this reduces the risk of unreliable graphlet data. We can run tests asserting only platform features with the assumption of stable and functional, improving confidence that failing tests indicate issues with the platform itself.

This approach helps to reduce false positives in pipeline blockages and improves the continuous delivery rate. The gateway integration tests are run against the exposed endpoint (for example, a content delivery network) or by invoking the gateway Lambda function directly and passing the appropriate payload.

The former approach allows you to detect potential issues with the infrastructure setup. This is useful when you use infrastructure as code (IaC) tools like AWS CDK. The latter further narrows down the target of the tests to the gateway logic, which may be appropriate if you have extensive infrastructure monitoring and testing already in place.

Graphlet integration tests

The Graphlet team focuses only on graphlet-specific features. This usually means the resolver logic for the graph fields they own in the overall graph. All the platform features – including query federation and graphlet response caching – are already tested by the Gateway Team.

The best way to test the specific graphlet is to run the test suite by directly invoking the Lambda function. If there is any issue with the gateway itself, it does cause a false-positive failure for the graphlet team.

Load tests

It’s important to determine the maximum traffic volume your system can handle before releasing to production. Before the initial launch and before any high traffic events (for example, the Oscars or Golden Globes), IMDb conducts thorough load testing of our systems.

To perform meaningful load testing, the workload captures traffic logs to IMDb pages. We later replay the real customer traffic at the desired transaction-per-second (TPS) volume. This ensures that our tests approximate real-life usage. It reduces the risk of skewing test results due to over-caching and disproportionate graphlet usage. Vegeta is an example of a tool you can use to run the load test against your endpoint.

Canary tests

Canary testing can also help ensure high availability of an endpoint. The canary produces the traffic. This is a configurable script that runs on a schedule. You configure the canary script to follow the same routes and perform the same actions as a user, which allows you to continually verify the user experience even without live traffic.

Canaries should emit success and failure metrics that you can alarm on. For example, if a canary runs 100 times per minute and the success rate drops below 90% in three consecutive data points, you may choose to notify a technician about a potential issue.

Compared with integration tests, canary tests run continuously and do not require any code changes to trigger. They can be a useful tool to detect issues that are introduced outside the code change. For example, through manual resource modification in the AWS Management Console or an upstream service outage.

Performance tuning

There is a per-account limit on the number of concurrent Lambda invocations shared across all Lambda functions in a single account. You can help to manage concurrency by separating high-volume Lambda functions into different AWS accounts. If there is a traffic surge to any one of the Lambda functions, this isolates the concurrency used to a single AWS account.

Lambda compute power is controlled by the memory setting. With more memory comes more CPU. Even if a function does not require much memory, you can adjust this parameter to get more CPU power and improve processing time.

When serving real-time traffic, Provisioned Concurrency in Lambda functions can help to avoid cold start latency. (Note that you should use max, not average for your auto scaling metric to keep it more responsive for traffic increases.) For Java functions, code in static blocks is run before the function is invoked. Provisioned Concurrency is different to reserved concurrency, which sets a concurrency limit on the function and throttles invocations above the hard limit.

Use the maximum number of concurrent executions in a load test to determine the account concurrency limit for high-volume Lambda functions. Also, configure a CloudWatch alarm for when you are nearing the concurrency limit for the AWS account.

There are concurrency limits and burst limits for Lambda function scaling. Both are per-account limits. When there is a traffic surge, Lambda creates new instances to handle the traffic. “Burst limit = 3000” means that the first 3000 instances can be obtained at a much faster rate (invocations increase exponentially). The remaining instances are obtained at a linear rate of 500 per minute until reaching the concurrency limit.

An alternative way of thinking this is that the rate at which concurrency can increase is 500 per minute with a burst pool of 3000. The burst limit is fixed, but the concurrency limit can be increased by requesting a quota increase.

You can further reduce cold start latency by removing unused dependencies, selecting lightweight libraries for your project, and favoring compile-time over runtime dependency injection.

Impact of Lambda runtime on performance

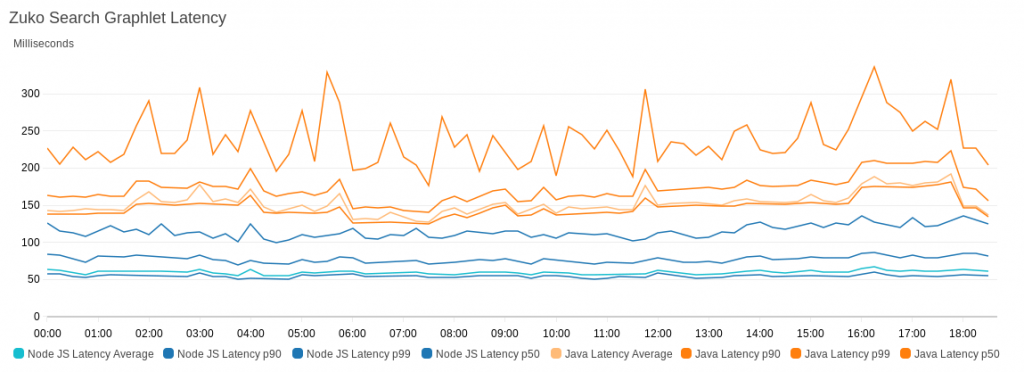
Choice of runtime impacts the overall function performance. We migrated a graphlet from Java to Node.js with complete feature parity. The following graph shows the performance comparison between the two:

Performance graph

To illustrate the performance difference, the graph compares the slowest latencies for Node.js and Java – the P80 latency for Node.js was lower than the minimal latency we recorded for Java.

Conclusion

There are multiple factors to consider when tuning a federated GQL system. You must be aware of trade-offs when deciding on factors like the runtime environment of Lambda functions.

An extensive testing strategy can help you scale systems and narrow down issues quickly. Well-defined testing can also keep pipelines clean of false-positive blockages.

Using CloudWatch EMF helps to avoid PutMetrics API throttling and allows you to run CloudWatch Logs Insights queries against metric data.

For more serverless learning resources, visit Serverless Land.

Securely Advancing in the Sunshine State: Rapid7 Announces Tampa Office Opening

Post Syndicated from Rapid7 original https://blog.rapid7.com/2021/10/26/securely-advancing-in-the-sunshine-state-rapid7-announces-tampa-office-opening/

Securely Advancing in the Sunshine State: Rapid7 Announces Tampa Office Opening

In our quest to create a safer digital world for all, Rapid7 is also on a mission to reimagine the future of work, culture, and talent — admittedly, we’ve set the bar pretty high for ourselves. But that’s part of the spirit of Never Done, one of our core values. We’re always striving to do better, be bolder, and think bigger as we help organizations across the globe securely advance.

That’s why we’re thrilled to announce that we’re expanding our US office footprint by opening our newest location in Tampa, Florida. With its fast-growing community of professionals — supported by a diverse population, great universities, and a strong veteran community — Tampa represents the next step in our quest to build the workplace of the future.

Building the next tech hub

We want to do something unprecedented in Tampa by taking an emerging center of tech activity to new heights as the next national hub of technology and innovation.

Tampa is fertile ground for this bold vision. The city recently ranked as one of the top 10 US metro areas for tech industry growth, and technology jobs have been increasing steadily here since 2015, with another 2% growth slated for 2021. This high concentration of tech jobs — and the talent to fill them — should come as little surprise, given the wealth of higher-learning institutions nearby, with 23 colleges and universities in the Tampa metro area. Tampa is also home to a strong military and veteran community centered around MacDill Air Force Base.

We want to take the seeds of potential in Tampa and grow them into a full-fledged tech ecosystem. To do that, we’re not just building an office and creating jobs — we’re putting a stake in the ground to help shape the future of Tampa.

To bring this vision to life, Rapid7 is partnering with Tampa-area colleges and universities to keep fueling the growth of local talent and build a stronger security community in the city than ever before. Our goal is to have 30% or more of our Tampa team be local college graduates and/or recently retired military. We’re also planning to partner with inclusion-focused STEM programs to help create a more diverse and supportive tech community through leadership and service.

Walking the walk on diversity

Rapid7 believes everyone deserves an equal opportunity to build the career they want — and that diversity of experience and viewpoints helps drive the innovation on which a healthy technology culture thrives. By boosting creativity and bringing a wider range of insights to inform better decision-making, diverse teams help drive business outcomes. In Tampa, we’re excited to walk the walk in our commitment to diversity and continue to bring this vision to life.

We believe a diverse workforce is integral to the success of our organization and the culture we want to build. That’s why we’re building something truly unique and putting diversity first in our hiring plan in order to build a team that reflects the rich, diverse character of Tampa.

We have ambitious goals to hire, retain, and develop talent with diverse backgrounds and experiences, with targets set for Black, Latinx, and female hires that we intend not only to meet, but to exceed. We’re aiming for a team that is 50% or more from diverse backgrounds.

With a diverse team that is empowered to be their one-of-a-kind, authentic selves in their day-to-day work — in keeping with our core value of Bring You — the Rapid7 Tampa office will truly help push the city forward as a hub of tech growth.

Build the workplace of the future with us

The task of securing the digital world is more complex and challenging than ever before. At a time when data breaches are increasing in frequency and severity, people need best-in-class security tools that are easy to use and deliver results. But as the challenge increases, so does the opportunity — and having the right people on board is all the more critical.

Our vision of the workplace of the future is not only diverse and rooted in the community, but also flexible, with a hybrid model that accommodates work-life balance while providing a collaborative in-office experience to promote teaming. In our effort to build the workplace of the future, we want to think ahead of the curve — taking the best of what we’ve learned from remote work in 2020 and 2021 while allowing talented team members to collaborate in person. We think the future of work involves flexible in-office policies while also allowing teams to spend time face-to-face. This makes room for serendipitous collaboration, fosters stronger relationships, and helps us support employees in developing their careers through learning and mentorship, which are enhanced by the in-office experience.

In Tampa, we have an exciting opportunity to build a model for the workplace of the future, blazing the trail rather than playing catch-up. This involves bringing a flexible, hybrid work model together with a diverse, dynamic culture that makes building a safer digital world rewarding and fun, while giving back to the community and setting the pace of growth and innovation in emerging centers of tech talent.

At our new location at Water Street Tampa, we’re adding more than 100 positions in data and software engineering, business development, customer support, IT, and people strategy.

Ready to help us meet today’s security needs, reimagine the future of work, and pave a path for the future of tech in Tampa? Check out our open roles.

Engaging Black students in computing at UK schools — interview with Joe Arday

Post Syndicated from Janina Ander original https://www.raspberrypi.org/blog/engaging-black-students-in-computing-uk-schools-joe-arday/

Joe Arday.

On the occasion of Black History Month UK, we speak to Joe Arday, Computer Science teacher at Woodbridge High School in Essex, UK, about his experiences in computing education, his thoughts about underrepresentation of Black students in the subject, and his ideas about what needs to be done to engage more Black students.

To start us off, can you share some of your thoughts about Black History Month as an occasion?

For me personally it’s an opportunity to celebrate our culture, but my view is it shouldn’t be a month — it should be celebrated every day. I am of Ghanaian descent, so Black History Month is an opportunity to share my culture in my school and my community. Black History Month is also an opportunity to educate yourself about what happened to the generations before you. For example, my parents lived through the Brixton riots. I was born in 1984, and I got to secondary school before I heard about the Brixton riots from a teacher. But my mother made sure that, during Black History Month, we went to a lot of extracurricular activities to learn about our culture.

For me it’s about embracing the culture I come from, being proud to be Black, and sharing that culture with the next generation, including my two kids, who are of mixed heritage. They need to know where they come from, and know their two cultures.

Tell us a bit about your own history: how did you come to computing education?

So I was a tech professional in the finance sector, and I was made redundant when the 2008 recession hit. I did a couple of consulting jobs, but I thought to myself, “I love tech, but in five years from now, do I really want to be going from job to job? There must be something else I can do.”

At that time there was a huge drive to recruit more teachers to teach what was called ICT back then and is now Computing. As a result, I started my career as a teacher in 2010. As a former software consultant, I had useful skills for teaching ICT. When Computing was introduced instead, I was fortunate to be at a school that could bring in external CPD (continued professional development) providers to teach us about programming and build our understanding and skills to deliver the new curriculum. I also did a lot of self-study and spoke to lots of teachers at other schools about how to teach the subject.

What barriers or support did you encounter in your teaching career? Did you have role models when you went into teaching?

Not really — I had to seek them out. In my environment, there are very few Black teachers, and I was often the only Black Computer Science teacher. A parent once said to me, “I hope you’re not planning to leave, because my son needs a role model in Computer Science.” And I understood exactly what she meant by that, but I’m not even a role model, I’m just someone who’s contributing to society the best way I can. I just want to pave the way for the next generation, including my children.

My current school is supporting me to lead all the STEM engagement for students, and in that role, some of the things I do are running a STEM club that focuses a lot on computing, and running new programmes to encourage girls into tech roles. I’ve also become a CAS Master Teacher and been part of a careers panel at Queen Mary University London about the tech sector, for hundreds of school students from across London. And I was selected by the National Centre for Computing Education as one of their facilitators in the Computer Science Accelerator CPD programme.

But there’s been a lack of leadership opportunities for me in schools. I’ve applied for middle-leadership roles and have been told my face doesn’t fit in an interview in a previous school. And I’m just as skilled and experienced as other candidates: I’ve been acting Head of Department, acting Head of Year — what more do I need to do? But I’ve not had access to middle-leadership roles. I’ve been told I’m an average teacher, but then I’ve been put onto dealing with “difficult” students if they’re Black, because a few of my previous schools have told me that I was “good at dealing with behaviour”. So that tells you about the role I was pigeonholed into.

It is very important for Black students to have role models, and to have a curriculum that reflects them.

Joe Arday

I’ve never worked for a Black Headteacher, and the proportion of Black teachers in senior leadership positions is very low, only 1%. So I am considering moving into a different area of computing education, such as edtech or academia, because in schools I don’t have the opportunities to progress because of my ethnicity.

Do you think this lack of leadership opportunities is an experience other Black teachers share?

I think it is, that’s why the number of Black teachers is so low. And as a Black student of Computer Science considering a teaching role, I would look around my school and think, if I go into teaching, where are the opportunities going to come from?

Black students are underrepresented in computing. Could you share your thoughts about why that’s the case?

There’s a lack of role models across the board: in schools, but also in tech leadership roles, CEOs and company directors. And the interest of Black students isn’t fostered early on, in Year 8, Year 9 (ages 12–14). If they don’t have a teacher who is able to take them to career fairs or to tech companies, they’re not going to get exposure, they’re not going to think, “Oh, I can see myself doing that.” So unless they have a lot of interest already, they’re not going to pick Computer Science when it comes to choosing their GCSEs, because it doesn’t look like it’s for them.

But we need diverse people in computing and STEM, especially girls. As the father of a boy and a girl of mixed heritage, that’s very important to me. Some schools I’ve worked in, they pushed computer science into the background, and it’s such a shame. They don’t have the money or the time for their teachers to do the CPD to teach it properly. And if attitudes at the top are negative, that’s going to filter down. But even if students don’t go into the tech industry, they still need digital skills to go into any number of sectors. Every young person needs them.

It is very important for Black students to have role models, and to have a curriculum that reflects them. Students need to see themselves in their lessons and not feel ignored by what is being taught. I was very fortunate to be selected for the working group for the Raspberry Pi Foundation’s culturally relevant teaching guidelines, and I’m currently running some CPD for teachers around this. I bet in the future Ofsted will look at how diverse the curriculum of schools is.

What do you think tech organisations can do in order to engage more Black students in computing?

I think tech organisations need to work with schools and offer work experience placements. When I was a student, 20 years ago, I went on a placement, and that set me on the right path. Nowadays, many students don’t do work experience, they are school leavers before they do an internship. So why do so many schools and organisations not help 14- or 15-year-olds spend a week or two doing a placement and learning some real-life skills?

A mentor explains Scratch code using a projector in a coding club session.

And I think it’s very important for teachers to be able to keep up to date with the latest technologies so they can support their students with what they need to know when they start their own careers, and can be convincing doing it. I encourage my GCSE Computer Science students to learn about things like cloud computing and cybersecurity, about the newest types of technologies that are being used in the tech sector now. That way they’re preparing themselves. And if I was a Headteacher, I would help my students gain professional certifications that they can use when they apply for jobs.

What is a key thing that people in computing education can do to engage more Black students?

Teachers could run a STEM or computing club with a Black History Month theme to get Black students interested — and it doesn’t have to stop at Black History Month. And you can make computing cross-curricular, so there could be a project with all teachers, where each one runs a lesson that involves a bit of coding, so that all students can see that computing really is for everyone.

What would you say to teachers to encourage them to take up Computer Science as a subject?

Because of my role working for the NCCE, I always encourage teachers to join the NCCE’s Computer Science Accelerator programme and to retrain to teach Computer Science. It’s a beautiful subject, all you need to do is give it a chance.

Thank you, Joe, for sharing your thoughts with us!

Joe was part of the group of teachers we worked with to create our practical guide on culturally relevant teaching in the computing classroom. You can download it as a free PDF now to help you think about how to reflect all your students in your lessons.

The post Engaging Black students in computing at UK schools — interview with Joe Arday appeared first on Raspberry Pi.

Разследване на Валя Ахчиева: Плуване без касов бон

Post Syndicated from Екип на Биволъ original https://bivol.bg/%D0%BF%D0%BB%D1%83%D0%B2%D0%B0%D0%BD%D0%B5-%D0%B1%D0%B5%D0%B7-%D0%BA%D0%B0%D1%81%D0%BE%D0%B2-%D0%B1%D0%BE%D0%BD.html

вторник 26 октомври 2021


Град Пловдив е известен като „градът на плувните шампиони”. Но, си нямат истински басейн. Два плувни басейна в Пловдив предизвикаха доста вълнения сред родители и деца през последните месеци. Единият…

Help Make BugBusting History at AWS re:Invent 2021

Post Syndicated from Sean M. Tracey original https://aws.amazon.com/blogs/aws/help-make-bugbusting-history-at-aws-reinvent-2021/

Earlier this year, we launched the AWS BugBust Challenge, the world’s first global competition to fix one million code bugs and reduce technical debt by over $100 million. As part of this endeavor, we are launching the first AWS BugBust re:Invent Challenge at this year’s AWS re:Invent conference, from 10 a.m. (PST) November 29 to 2 p.m (PST) December 2, and in doing so, hope to create a new World Record for “Largest Bug Fixing Competition” as recognized by Guinness World Records.

To date, AWS BugBust events have been run internally by organizations that want to reduce the number of code bugs and the impact they have on their external customers. At these events, an event administrator from within the organization invites internal developers to collaborate in a shared AWS account via a unique link allowing them to participate in the challenge. While this benefits the organizations, it limits the reach of the event, as it focuses only on their internal bugs. To increase the impact that the AWS BugBust events have, at this year’s re:Invent we will open up the challenge to anybody with Java or Python knowledge to help fix open-source code bases.

Historically, finding bugs has been a labor-intensive challenge. 620 million developer hours are wasted each year searching for potential bugs in a code base and patching them before they can cause any trouble in production – or worse yet, fix them on-the-fly when they’re already causing issues. The AWS BugBust re:Invent Challenge uses Amazon CodeGuru, an ML-powered developer tool that provides intelligent recommendations to improve code quality and identify an application’s most expensive lines of code. Rather than reacting to security and operational events caused by bugs, Amazon CodeGuru proactively highlights any potential issues in defined code bases as they’re being written and before they can make it into production. Using CodeGuru, developers can immediately begin picking off bugs and earning points for the challenge.

As part of this challenge, AWS will be including a myriad of open source projects that developers will be able to patch and contribute to throughout the event. Bugs can range from security issues, to duplicate code, to resource leaks and more. Once each bug has been submitted and CodeGuru determines that the issue is resolved, all of the patched software will be released back to the open source projects so that everyone can benefit from the combined efforts to squash software bugs.

The AWS BugBust re:Invent Challenge is open to all developers who have Python or Java knowledge regardless of whether or not they’re attending re:Invent. There will be an array of prizes, from hoodies and fly swatters to Amazon Echo Dots, available to all who participate and meet certain milestones in the challenge. There’s also the coveted title of “Ultimate AWS BugBuster” accompanied by a cash prize of $1500 for whomever earns the most points by squashing bugs during the event.

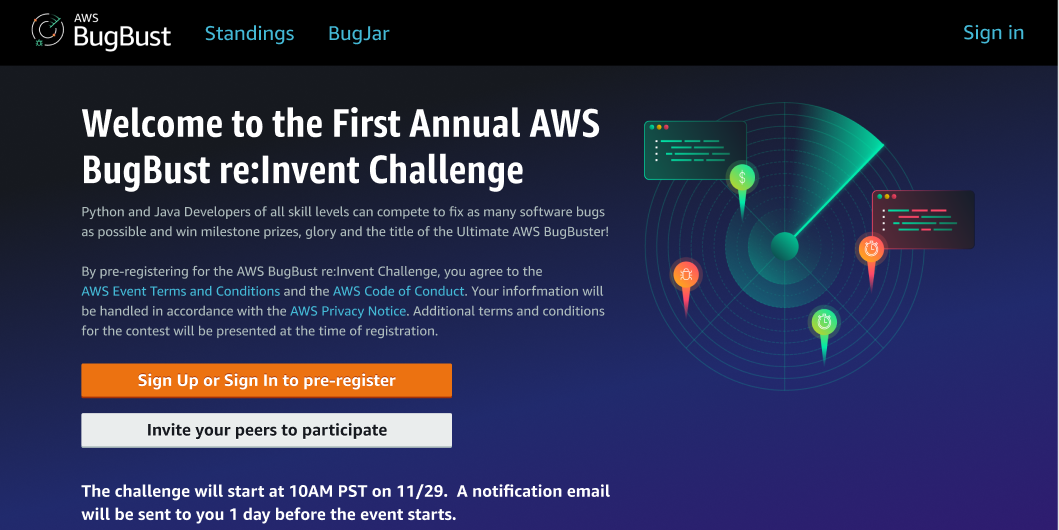
A screenshot of the AWS BugBust re:Invent challenge registration page

For those attending in-person, we have created the AWS BugBust Hub, a 500 square-foot space in the main exhibition hall. This space will give developers a place to join in with the challenge and track their progress on the AWS BugBust leadership board while maintaining appropriate social-distancing. In addition to the AWS BugBust Hub, there will be an AWS BugBust kiosk located within the event space where developers will be able to sign up to contribute toward the Largest Bug Fixing Challenge World Record attempt. Attendees will also be able to speak with Amazonians from the AWS BugBust SWAT team who will be able to answer questions about the event and provide product demos.

To take part in the AWS BugBust re:Invent Challenge, developers must have an AWS BugBust player account and a GitHub account. Pre-registration for the competition can be done online, or if you’re at re:Invent 2021 in-person you can register to participate at our AWS BugBust Hub or kiosk. If you’re not planning on joining us in person at re:Invent, you can still join us online, fix bugs and earn points to win prizes.

New Strategy Recommendations Service Helps Streamline AWS Cloud Migration and Modernization

Post Syndicated from Steve Roberts original https://aws.amazon.com/blogs/aws/new-strategy-recommendations-service-helps-streamline-aws-cloud-migration-and-modernization/

Determining viable strategies for successful application migration and modernization to the cloud takes time. It can also require significant effort, depending on the size and complexity of the application portfolio to analyze. To date, the analysis process has been largely manual and nonstandard in nature, making it difficult to apply at scale on large portfolios. Limited time to make decisions, a lack of domain knowledge and cloud expertise, and low awareness of the available modernization tools and services can compound the effort and complexity.

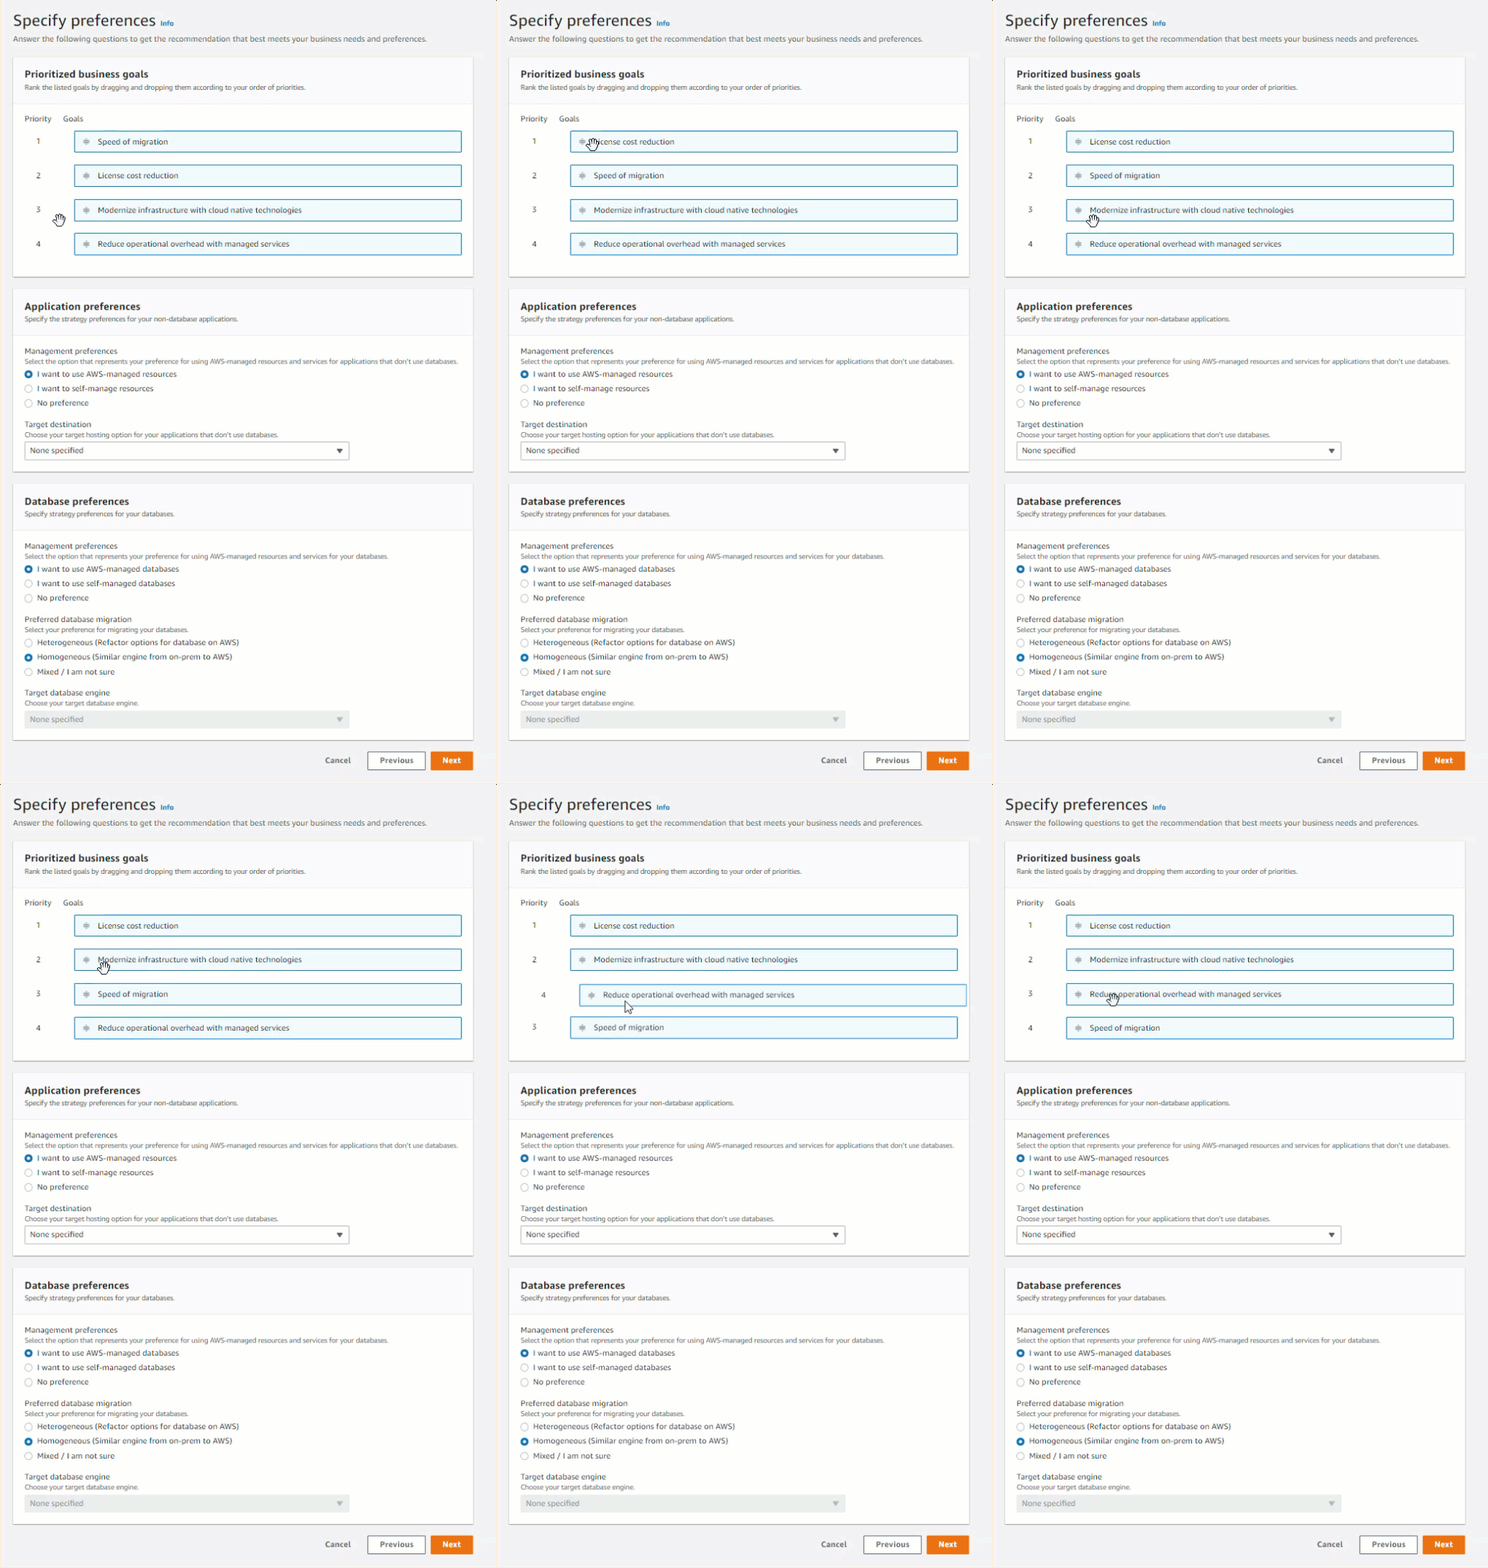
Today, I’m pleased to announce AWS Migration Hub Strategy Recommendations to help automate the analysis of your application portfolios. Strategy Recommendations analyzes your running applications to determine runtime environments and process dependencies, optionally analyzes source code and databases, and more. The data collected from analysis is assessed against a set of business objectives that you prioritize, such as license cost reduction, speed of migration, reducing operational overhead from using managed services, or modernizing infrastructure using cloud-native technologies. Then, it produces recommendations of viable paths to migrate and modernize your applications.

Any given application could have multiple paths for migration and modernization, including rehosting, replatforming, or refactoring. You’ll get recommendations on all viable paths, and you can elect to override the recommendations as you see fit. Everyone can use Strategy Recommendations, regardless of experience, to lower the effort and time required and complexity involved in assessing application portfolios, whether they’re on premises awaiting migration or already in the AWS Cloud pending further modernization.

Taking as an example a typical N-tier application, an ASP.NET web application with a Microsoft SQL Server database, Strategy Recommendations helps you analyze the various components such as the servers hosting the web front end, the backend servers, and the database itself to determine viable paths and tools you can use to migrate and modernize onto the AWS Cloud. For instance, if your goal is to reduce licensing costs for the application, Strategy Recommendations may recommend you to refactor your application to .NET on Linux using the Porting Assistant for .NET.

Registering your Application Servers for Strategy Recommendations
Registration of the servers hosting your application portfolio with AWS Application Discovery Service is a prerequisite for Strategy Recommendations. The servers to register can be running on-premises as physical servers or virtual machines (VMs), or they can be Amazon Elastic Compute Cloud (Amazon EC2) instances for applications you’ve already migrated with a “lift-and-shift” process. You can find details on the different options for registering your application servers in the AWS Application Discovery Service User Guide.

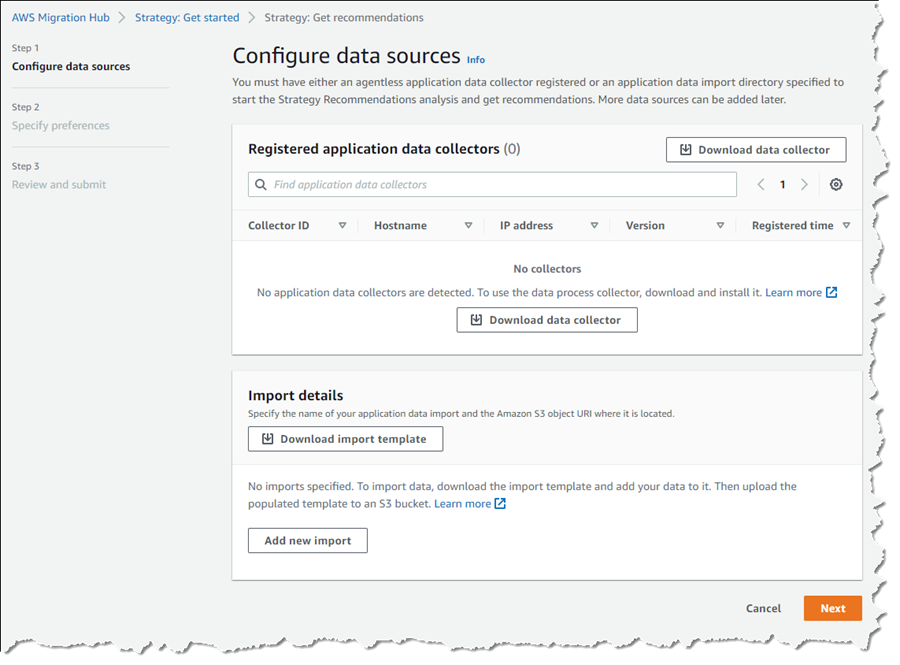
Automated Data Collection for Analysis
With your servers registered in AWS Application Discovery Service, you can set up automated collection of the process level analysis of your application portfolio using an agentless data collector provided by Strategy Recommendations. The agentless collector can be downloaded as an Open Virtualization Appliance (OVA) for VMWare vCenter environments. If you’ve already migrated some or all of your applications to EC2, there’s also an EC2 Amazon Machine Image (AMI), which includes the collector, to help further analyze these applications for modernization opportunities.

If you don’t want, or cannot use, automated collection methods, or you’ve already collected this data using another tool or service, then you can instead manually import the data for analysis. However, the recommendations you obtain for manually imported data won’t be as in-depth as those originating from automated data collection. One additional benefit of automated collection is that it’s much easier to refresh the data as you progress, too.

Application and process discovery on your servers is language-agnostic. For .NET and Java applications in GitHub and GitHub Enterprise repositories and Microsoft SQL Server databases, you can optionally include detection of cloud anti-patterns. It’s important to note that if you elect to have source code or database analysis performed, no actual code or data is uploaded to Strategy Recommendations; only the results of the analysis are sent. By the way, if you elect to manually import your data for analysis, the option to perform deeper source code and database analysis is not supported.

Analyzing your Application Portfolio
Full details on how to set up automated data collection, the analysis options, and other important prerequisites can be found in the Strategy Recommendations User Guide, so I won’t go into further detail here. Instead, I want to look at how you can start analyzing an application portfolio that’s already been migrated to EC2, with an intent to modernize further, using the agentless collector. As mentioned earlier, Strategy Recommendations supports analysis of application portfolios hosted on physical on-premises servers or virtual machines, or (as shown in this post) on EC2 instances.

To start collection of data for analysis, I need to follow a small number of steps:

  1. Start and configure the Strategy Recommendations agentless collector, using either the downloadable OVA or the provided EC2 AMI.
  2. Configure each of the Windows and Linux instances hosting my applications to allow access from the collector.
  3. Configure my initial business priorities and other application and database preferences to get my initial recommendations. I can fine-tune these options later.
My first stop is at the Migration Hub console, where I click Strategy in the navigation panel to take me to the Get started page. On clicking any of the Download data collector, Download import template, or Get recommendations buttons, I’m first asked to agree to the creation of a service-linked role, granting Strategy Recommendations the necessary permissions to access other services on my behalf. Once I agree, I start at the Configure data sources page of a short wizard. Here, I can view a list of any previously registered collectors. I can also download the OVA version of the data collector and an import template for any application data I want to import manually, outside of automated collection.

Initial data source configuration page

I’m going to use the EC2 AMI-based collector so, before proceeding with this wizard, I open the EC2 console in a new browser tab to launch it. To find the image for the Strategy Recommendations data collector I can either go to the AMIs page, select Public images, and filter by owner 703163444405, or, from the Launch Instances wizard, enter the name AWSMHubApplicationDataCollector in the Search field. Once I’ve found the image, I proceed through the launch wizard as I would for any other AMI.

Configuration of the collector is a simple process, and I’m guided using a series of questions. As I mentioned earlier, full information is in the user guide that I linked to, so I won’t go into every detail here. To start the configuration process, I first use SSH to connect to my collector instance and then run a Docker container, using the command docker exec -it application-data-collector bash. In the running container, I start the configuration Q&A with the command collector setup. During the process, you’re asked to supply data for the following items of information:

  1. Usage agreement and confirmation that all required roles have been set up, followed by a set of AWS access and secret keys.
  2. For on-premises Windows application servers that are not managed by vCenter, or EC2 Windows instances, I need to provide a user ID and password that will allow the collector to connect to my servers using WinRM.
  3. If I have any Linux application servers, I can choose whether the collector connects using SSH or certificate-based authentication.
  4. Finally, I can configure source code analysis for .NET and Java applications in repositories on GitHub or GitHub Enterprise. These require a Git username and personal access token (PAT). I can also configure additional, deeper, source code analysis for C# applications. This does, however, require a separate server running Windows, on which I’ve installed the Porting Assistant for .NET.

Once I have completed these steps, my data collector is registered and ready to start inspecting my servers. Back on the Strategy Recommendations Configure data sources page, I refresh the page and can now see my collector listed.

Registered data collector

The second step is to enable access from the collector to my application servers, details for which can be found in the Step 4: Set up the Strategy Recommendations collector topic of the user guide. For my Windows Server, I used RDP to connect and then downloaded and ran two PowerShell scripts from links provided in the guide to configure WinRM. For larger server fleets, you might consider using AWS Systems Manager Automation to perform this task. For my Linux servers, having chosen to use SSH authentication for the collector, I needed to copy public key material generated during collector configuration process to each server.

At this point, the servers to be analyzed are known to AWS Application Discovery Service, the Strategy Recommendations data collector is configured, and each server is configured to allow access from the collector. It’s now time for my third and final step; namely, to set my business and other priorities for the analysis and let the service get to work to generate my recommendations.

Back in the Get started page in Strategy Recommendations, since my collector is registered and I have no manual application data to import, I just choose Next. This takes me to the Specify Preferences page, where I set my business priorities and other preferences. I can revise these and reanalyze at any time, but for now, I use drag and drop to set License cost reduction, Modernizing infrastructure using cloud-native technologies, and Reduce operational overhead with managed services as my highest priorities. I leave the remaining options, for application and database preferences, unchanged.

Configuring my business priorities and other settings for the analysis recommendations

Choosing Next, I reach the Review page, summarizing my choices, then choose Start data analysis. One item of note, the analysis runs against all servers that you’ve configured in Application Discovery Service, so you may see more servers being processed than you imported in the earlier step (servers not configured to allow access by the collector show up in results with a collection status of “data collection failed”).

With analysis complete, my recommendations are summarized (no anti-pattern analysis has been run yet).

Initial recommendations from server analysis

One of my servers is running Windows and hosts an older version of nopCommerce, originally a .NET Framework-based application, and a related SQL Server database. As my highest business priority was license cost reduction, I start my inspection at that server. The recommendations available so far are based on inspection of just the server itself. Analysis of the source code and components comprising the application may likely influence those recommendations, so I request further analysis of the application source code by drilling down to the server and application of interest.

Adding source code analysis for the server application

Code analysis creates a JSON-format report file in Amazon Simple Storage Service (Amazon S3), which when I open it, shows anti-patterns such as accessing log files using Windows file system paths instead of a cloud-based service such as Amazon CloudWatch, fixed IP addresses, a server-specific database connection, and more.

Following code analysis, the suggested recommendations update slightly from those based on just inspection of the servers. One application component that was originally recommended for a replatforming approach is now a candidate for refactoring.

Revised recommendations

Returning to my server of interest, clicking the Strategy options tab shows me the recommendations. The results of the code analysis have played a part in the weightings, along with my business priorities. The image below shows the initial recommendations, which are based on just analysis of the server itself.

The initial recommendations

Below are the revised recommendations for the server, following source code analysis.

Revised recommendations following source code analysis

The recommendations for the server also include replatforming the application’s SQL Server database to MySQL on Amazon Relational Database Service (RDS). This is suggested because in my priorities, I requested consideration of managed services. Before following this recommendation I may want to perform an additional anti-pattern analysis of the database, which I can do after creating a secret in AWS Secrets Manager to hold the database credentials (check the user guide topic on database analysis for more details). Analysis of databases, which is currently only available for SQL Server, identifies migration incompatibilities such as unsupported data types.

In the screenshots, you’ll notice additional viable paths for migration and modernization. This applies to both servers and application components. I can choose a viable path over the recommended strategy if I so want by selecting the viable strategy option and clicking Set preferred. In the screenshot below, for the nopCommerce application component, I’ve chosen to prefer the replatform route to containers for the application, using AWS App2Container. And of course, I can always rewind to the start and adjust my business priorities and other options and reanalyze my data.

Setting a preferred approach for a recommendation

Taking the initial recommendations, then using code and database analysis, or revising your priorities for analysis and the suggested recommendations, provides scope to experiment with multiple “what if” options to discover the optimal strategy for migrating and modernizing application portfolios to the cloud. Once that optimal strategy is determined, you can communicate it to downstream teams to begin the migration and modernization process for your application portfolio.

Get Recommendations for Migration and Modernization Today
You can get started analyzing your servers and application portfolios today with AWS Migration Hub Strategy Recommendations, at no extra charge, in the US East (N. Virginia), US West (Oregon), Asia Pacific (Sydney), Asia Pacific (Tokyo), Europe (Frankfurt), Europe (Ireland), and Europe (London) Regions. You can, of course, deploy the applications you choose to migrate and modernize based on recommendations from the tool to all Regions. As I noted earlier, you can find more details on prerequisites, getting started with the collector, and working with recommendations in the user guide.

— Steve

NPM Library (ua-parser-js) Hijacked: What You Need to Know

Post Syndicated from Glenn Thorpe original https://blog.rapid7.com/2021/10/25/npm-library-ua-parser-js-hijacked-what-you-need-to-know/

NPM Library (ua-parser-js) Hijacked: What You Need to Know

For approximately 4 hours on Friday, October 22, 2021, a widely utilized NPM package, ua-parser-js, was embedded with a malicious script intended to install a coinminer and harvest user/credential information. This package is used “to detect Browser, Engine, OS, CPU, and Device type/model from User-Agent data,” with nearly 8 million weekly downloads and 1,200 dependencies.

The malicious package was available for download starting on October 22, 2021, at 12:15 PM GMT, and ending October 22, 2021, between 4:16 PM and 4:26 PM GMT. During that time, 3 versions of the package were compromised with a script that would execute on Windows and Linux machines:

Affected Version Patched Version
0.7.29 0.7.30
0.8.0 0.8.1
1.0.0 1.0.1

Both GitHub and CISA issued advisories urging users to upgrade right away and review systems for suspicious or malicious activity.

Due to the quick reporting of issues by GitHub users and action by the developer, development exposure will be limited to teams who had a pull/build during that (roughly) 4-hour timeframe.

At this time, the source of the attack is unconfirmed. However, with the use of IntSights, recently acquired by Rapid7, a suspicious thread has been identified, created on October 5, 2021, in a prominent Russian hacking forum. There, a threat actor offered access to a developer account of an undisclosed package on npmjs.com, indicating that the package has “more than 7 million installations every week, more than 1,000 others are dependent on this.” With the requested price of $20,000 dollars, the threat actor stated that the account does not have 2-factor authentication.

NPM Library (ua-parser-js) Hijacked: What You Need to Know

While there is no definitive evidence that the compromise of ua-parser-js is related to the above-mentioned dark-web activity, the weekly installs and dependency numbers appear to match and align with the developers’ post of an account hijack.

Rapid7 guidance

Rapid7 recommends development teams immediately heed the advice for organizations to review for the use of these versions and remediate accordingly. Additionally, organizations’ security teams need to be on the lookout for users who visited a site infected with the malicious script. Several anti-malware programs have (or have since added) detections for this, and organizations should keep an eye open for network traffic that is hitting domains/IPs associated with coin mining.

Rapid7 customers

InsightVM

InsightVM users will be able to assess their exposure to malicious versions of the ua-parser-js package via Container Security functionality in an upcoming release. No Scan Engine or Insight Agent-based checks are currently planned.

InsightIDR

InsightIDR customers, including Managed Detection & Response customers, were already equipped with detections that may be indicative of related malicious activity:

  • Cryptocurrency Miner – XMRig
  • Suspicious Process – Curl to External IP Address
  • Wget to External IP Address

Additionally, Rapid7 has updated the following rule to provide additional coverage:

  • Cryptocurrency Miner – Mining Pool URL in Command Line

NEVER MISS A BLOG

Get the latest stories, expertise, and news about security today.

Sudan woke up without Internet

Post Syndicated from Celso Martinho original https://blog.cloudflare.com/sudan-woke-up-without-internet/

Sudan woke up without Internet

Sudan woke up without Internet

Today, October 25, following political turmoil, Sudan woke up without Internet access.

In our June blog, we talked about Sudan when the country decided to shut down the Internet to prevent cheating in exams.

Now, the disruption seems to be for other reasons. AP is reporting that “military forces … detained at least five senior Sudanese government figures.”. This afternoon (UTC) several media outlets confirmed that Sudan’s military dissolved the transitional government in a coup that shut down mobile phone networks and Internet access.

Cloudflare Radar allows anyone to track Internet traffic patterns around the world. The dedicated page for Sudan clearly shows that this Monday, when the country was waking up, the Internet traffic went down and continued that trend through the afternoon (16:00 local time, 14:00 UTC).

Sudan woke up without Internet

We dug in a little more on the HTTP traffic data. It usually starts increasing after 06:00 local time (04:00 UTC). But this Monday morning, traffic was flat, and the trend continued in the afternoon (there were no signs of the Internet coming back at 18:00 local time).

Sudan woke up without Internet

When comparing today with the last seven days’ pattern, we see that today’s drop is abrupt and unusual.

Sudan woke up without Internet

We can see the same pattern when looking at HTTP traffic by ASN (Autonomous Systems Number). The shutdown affects all the major ISPs from Sudan.

Sudan woke up without Internet

Two weeks ago, we compared mobile traffic worldwide using Cloudflare Radar, and Sudan was one of the most mobile-friendly countries on the planet, with 83% of Internet traffic coming from mobile devices. Today, both mobile and desktop traffic was disrupted.

Sudan woke up without Internet

Using Cloudflare Radar, we can also see a change in Layer 3&4 DDoS attacks because of the lack of data.

Sudan woke up without Internet

You can keep an eye on Cloudflare Radar to monitor how we see the Internet traffic globally and in every country.

The collective thoughts of the interwebz

By continuing to use the site, you agree to the use of cookies. more information

The cookie settings on this website are set to "allow cookies" to give you the best browsing experience possible. If you continue to use this website without changing your cookie settings or you click "Accept" below then you are consenting to this.

Close