Building secure websites: a guide to Cloudflare Pages and Turnstile Plugin

Post Syndicated from Sally Lee original https://blog.cloudflare.com/guide-to-cloudflare-pages-and-turnstile-plugin


Balancing developer velocity and security against bots is a constant challenge. Deploying your changes as quickly and easily as possible is essential to stay ahead of your (or your customers’) needs and wants. Ensuring your website is safe from malicious bots — without degrading user experience with alien hieroglyphics to decipher just to prove that you are a human — is no small feat. With Pages and Turnstile, we’ll walk you through just how easy it is to have the best of both worlds!

Cloudflare Pages offer a seamless platform for deploying and scaling your websites with ease. You can get started right away with configuring your websites with a quick integration using your git provider, and get set up with unlimited requests, bandwidth, collaborators, and projects.

Cloudflare Turnstile is Cloudflare’s CAPTCHA alternative solution where your users don’t ever have to solve another puzzle to get to your website, no more stop lights and fire hydrants. You can protect your site without having to put your users through an annoying user experience. If you are already using another CAPTCHA service, we have made it easy for you to migrate over to Turnstile with minimal effort needed. Check out the Turnstile documentation to get started.

Alright, what are we building?

In this tutorial, we’ll walk you through integrating Cloudflare Pages with Turnstile to secure your website against bots. You’ll learn how to deploy Pages, embed the Turnstile widget, validate the token on the server side, and monitor Turnstile analytics. Let’s build upon this tutorial from Cloudflare’s developer docs, which outlines how to create an HTML form with Pages and Functions. We’ll also show you how to secure it by integrating with Turnstile, complete with client-side rendering and server-side validation, using the Turnstile Pages Plugin!
Step 1: Deploy your Pages

On the Cloudflare Dashboard, select your account and go to Workers & Pages to create a new Pages application with your git provider. Choose the repository where you cloned the tutorial project or any other repository that you want to use for this walkthrough.
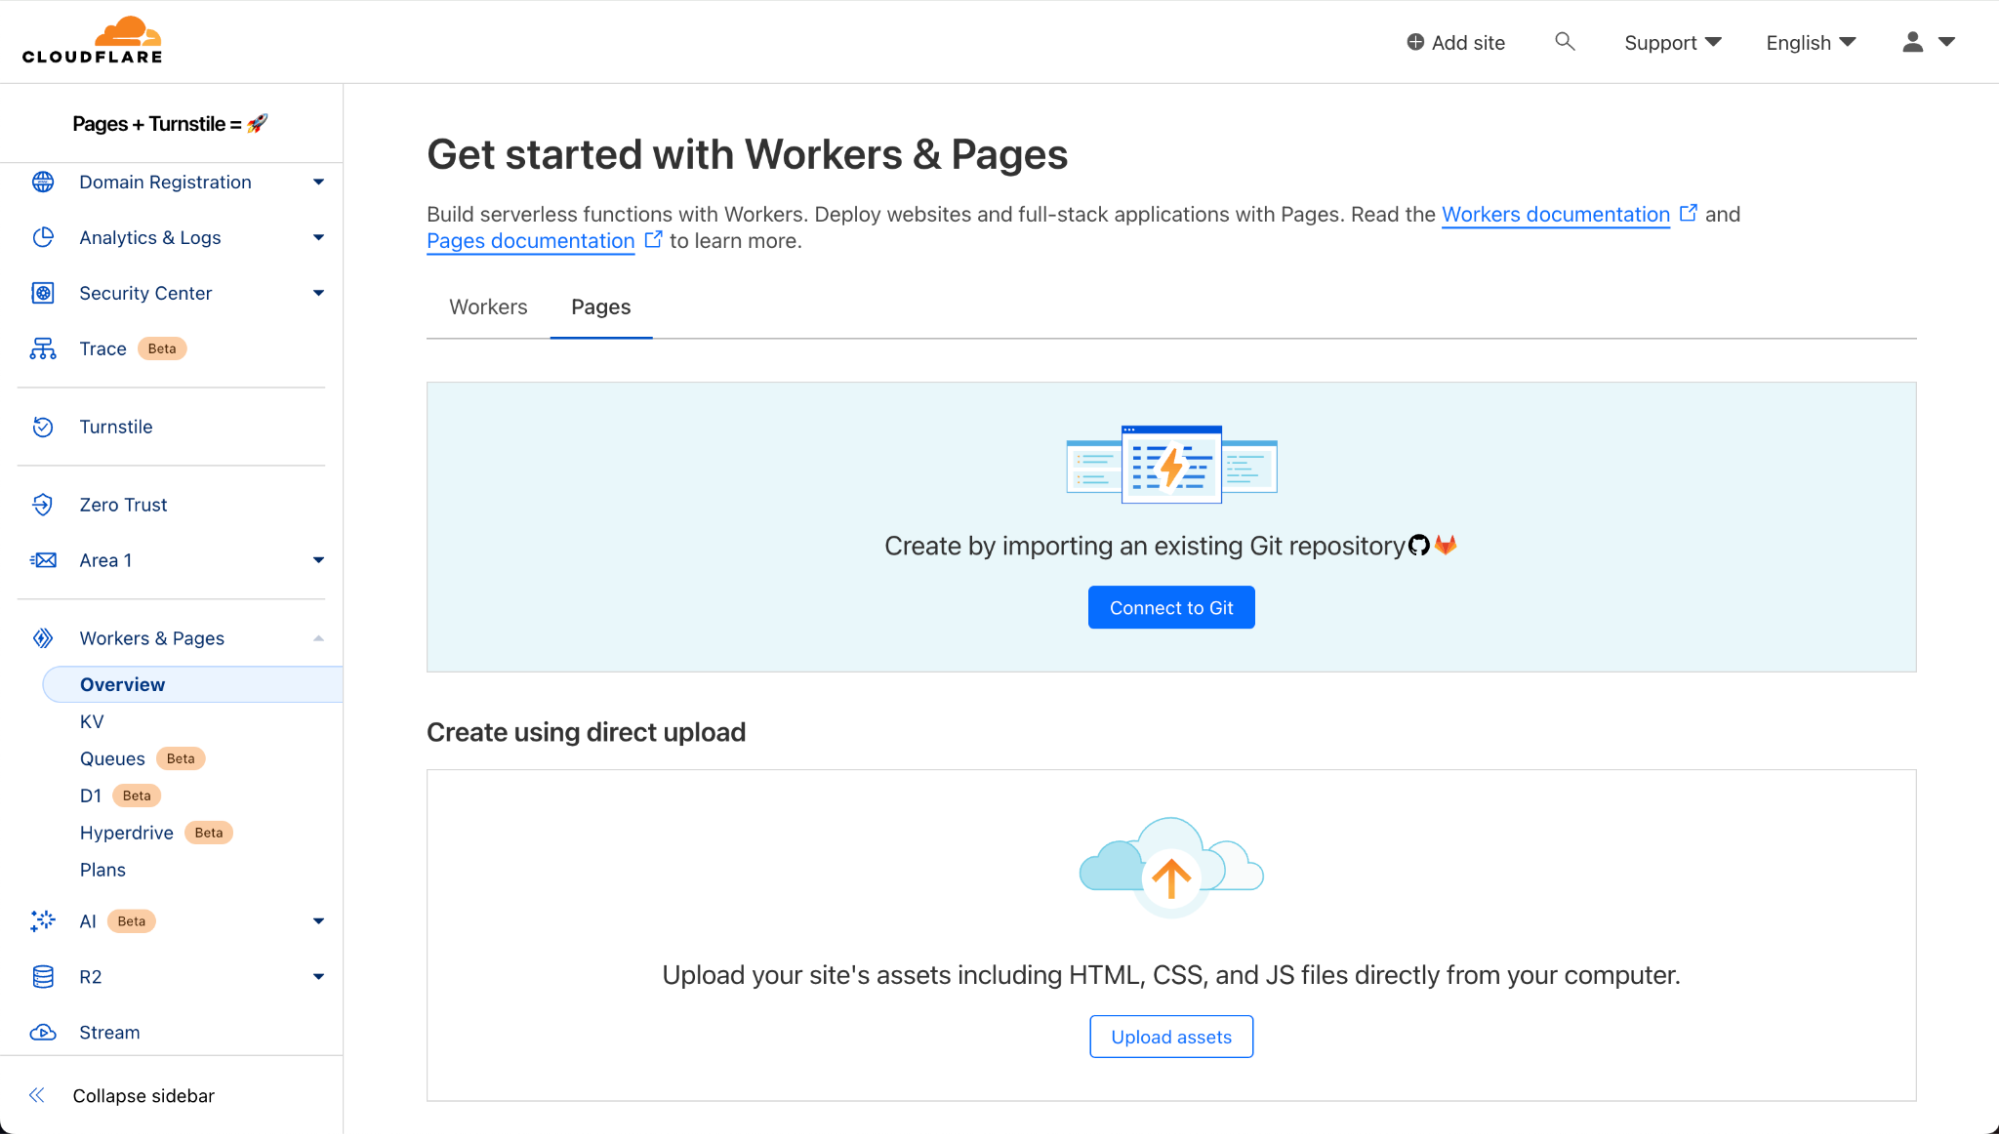
The Build settings for this project is simple:

  • Framework preset: None
  • Build command: npm install @cloudflare/pages-plugin-turnstile
  • Build output directory: public

Once you select “Save and Deploy”, all the magic happens under the hood and voilà! The form is already deployed.
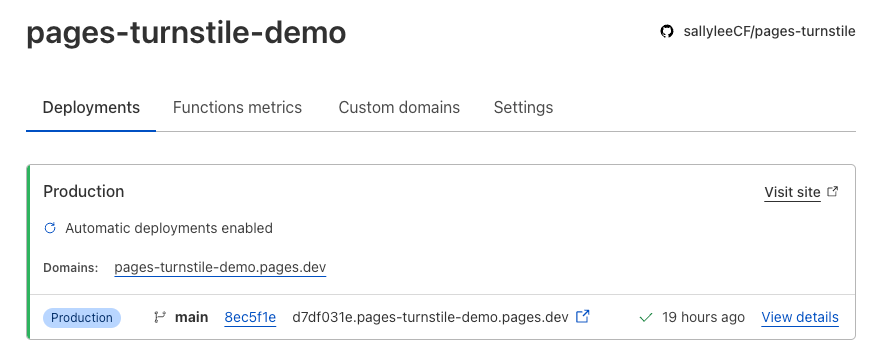
Step 2: Embed Turnstile widget

Now, let’s navigate to Turnstile and add the newly created Pages site.
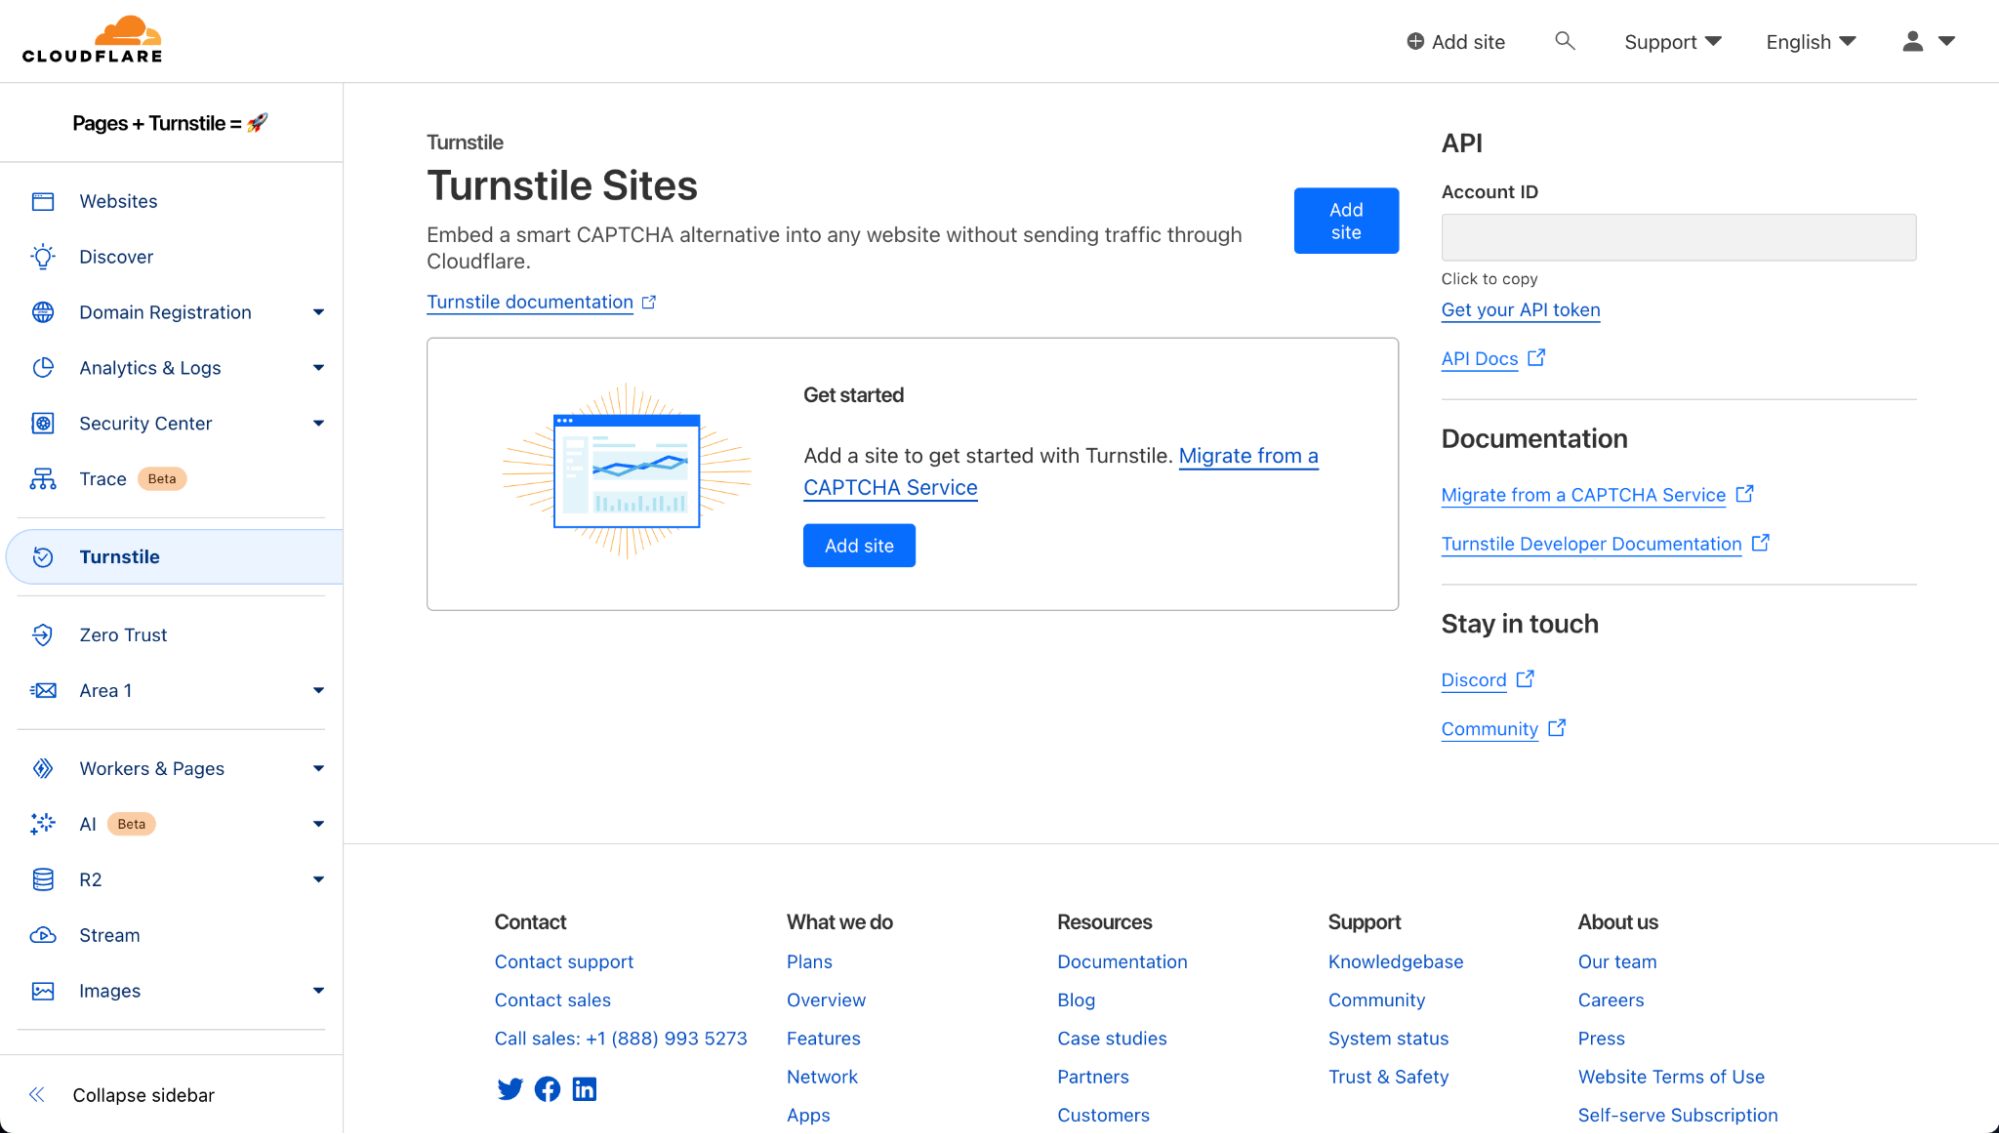
Here are the widget configuration options:

  • Domain: All you need to do is add the domain for the Pages application. In this example, it’s “pages-turnstile-demo.pages.dev”. For each deployment, Pages generates a deployment specific preview subdomain. Turnstile covers all subdomains automatically, so your Turnstile widget will work as expected even in your previews. This is covered more extensively in our Turnstile domain management documentation.
  • Widget Mode: There are three types of widget modes you can choose from.
  • Managed: This is the recommended option where Cloudflare will decide when further validation through the checkbox interaction is required to confirm whether the user is a human or a bot. This is the mode we will be using in this tutorial.

  • Non-interactive: This mode does not require the user to interact and check the box of the widget. It is a non-intrusive mode where the widget is still visible to users but requires no added step in the user experience.

  • Invisible: Invisible mode is where the widget is not visible at all to users and runs in the background of your website.
  • Pre-Clearance setting: With a clearance cookie issued by the Turnstile widget, you can configure your website to verify every single request or once within a session. To learn more about implementing pre-clearance, check out this blog post.

Once you create your widget, you will be given a sitekey and a secret key. The sitekey is public and used to invoke the Turnstile widget on your site. The secret key should be stored safely for security purposes.

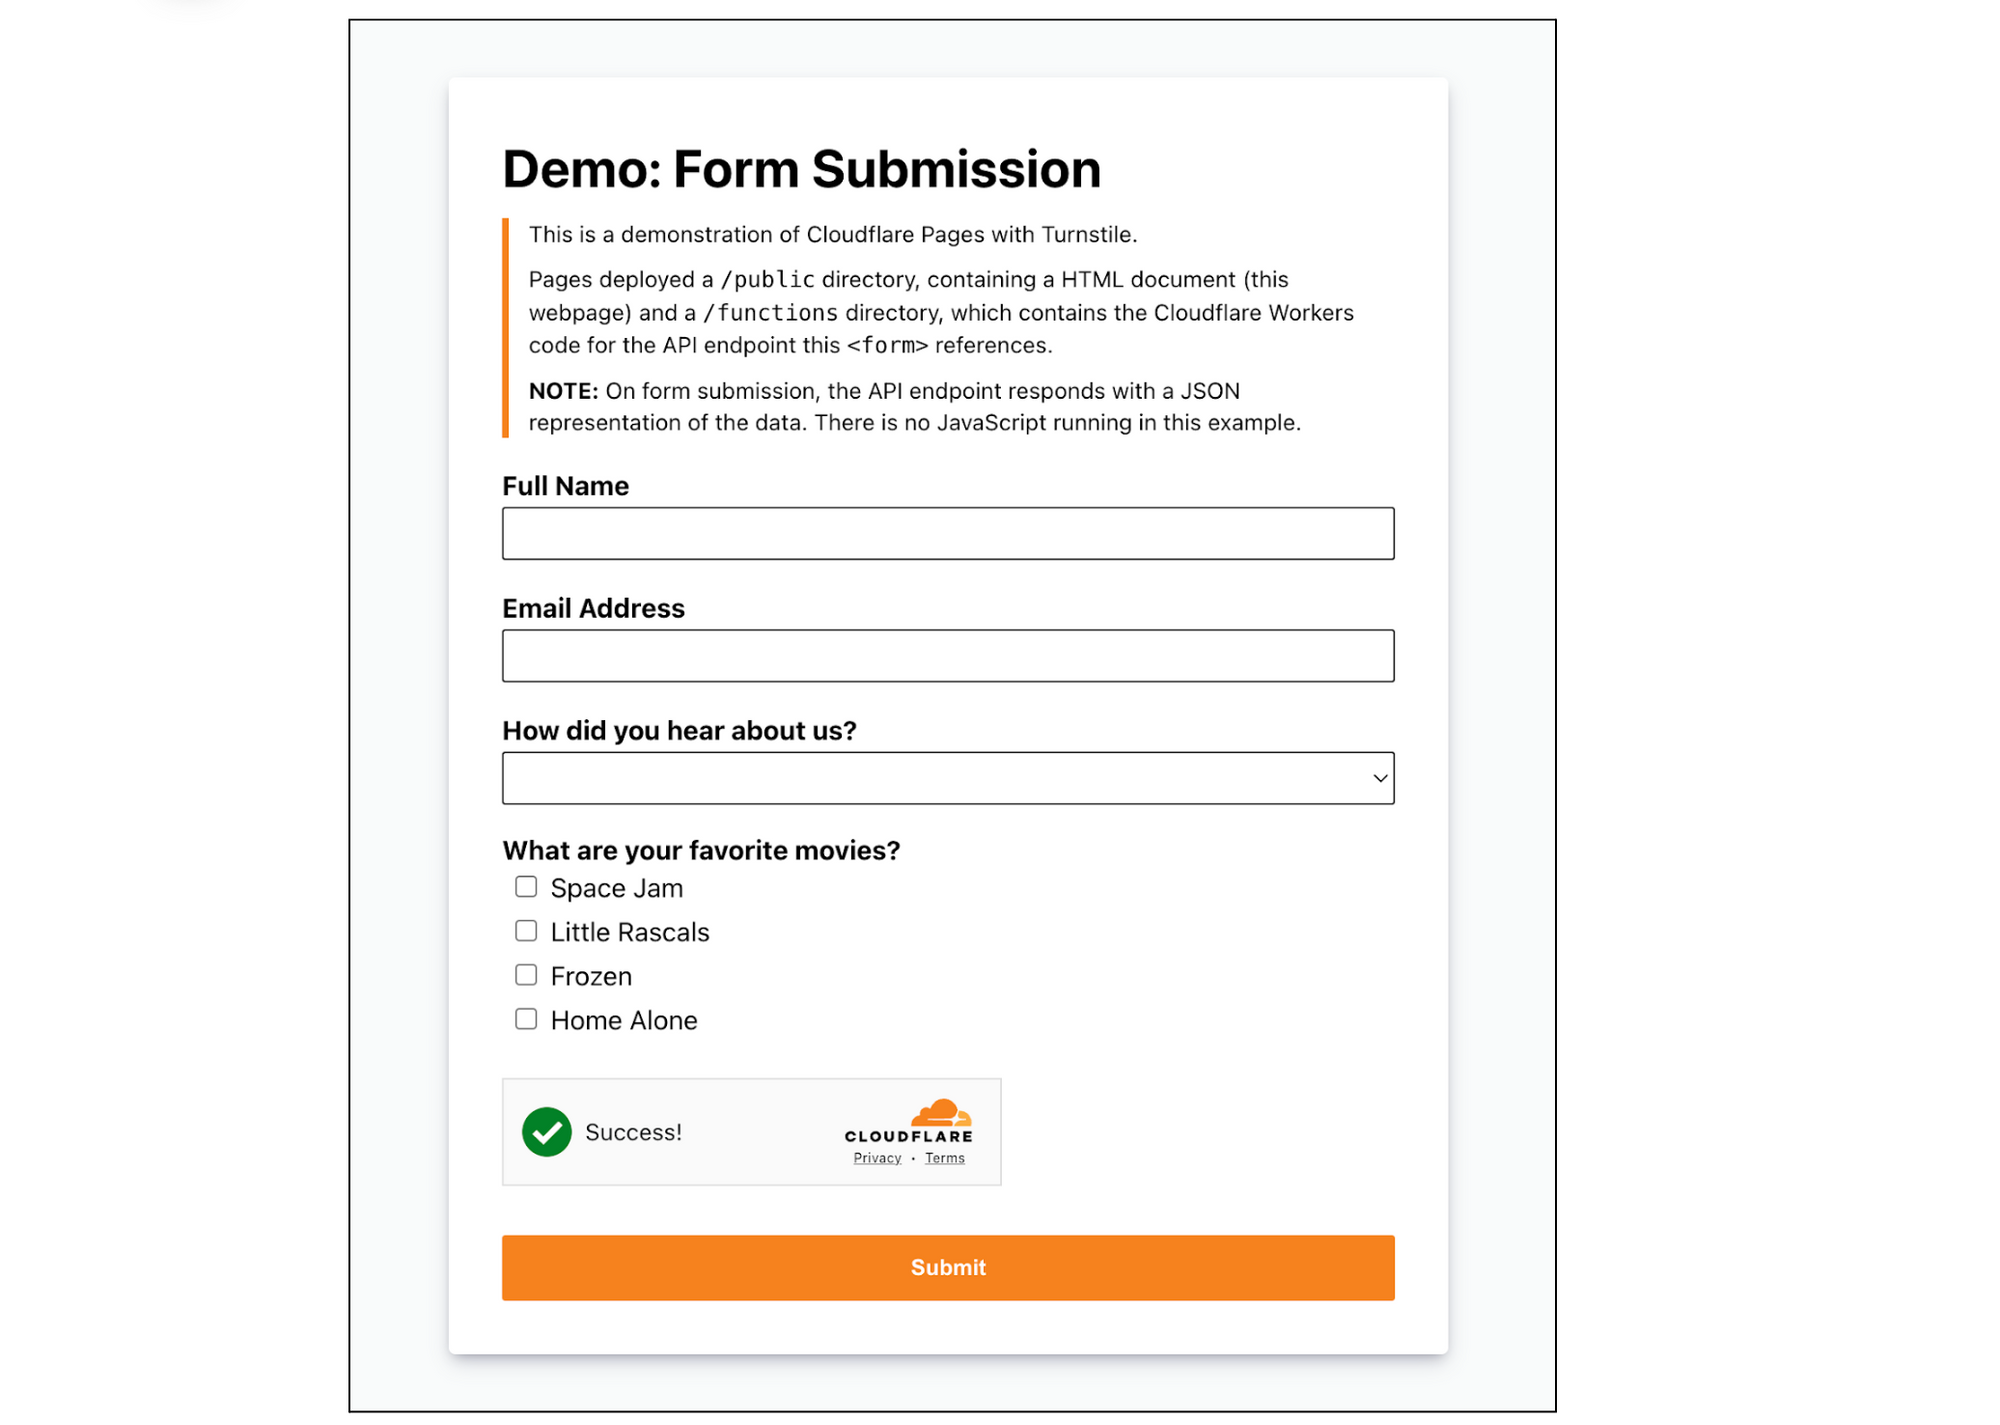
Let’s embed the widget above the Submit button. Your index.html should look like this:

<!doctype html>
<html lang="en">
	<head>
		<meta charset="utf8">
		<title>Cloudflare Pages | Form Demo</title>
		<meta name="theme-color" content="#d86300">
		<meta name="mobile-web-app-capable" content="yes">
		<meta name="apple-mobile-web-app-capable" content="yes">
		<meta name="viewport" content="width=device-width,initial-scale=1">
		<link rel="icon" type="image/png" href="https://www.cloudflare.com/favicon-128.png">
		<link rel="stylesheet" href="/index.css">
		<script src="https://challenges.cloudflare.com/turnstile/v0/api.js?onload=_turnstileCb" defer></script>
	</head>
	<body>

		<main>
			<h1>Demo: Form Submission</h1>

			<blockquote>
				<p>This is a demonstration of Cloudflare Pages with Turnstile.</p>
				<p>Pages deployed a <code>/public</code> directory, containing a HTML document (this webpage) and a <code>/functions</code> directory, which contains the Cloudflare Workers code for the API endpoint this <code>&lt;form&gt;</code> references.</p>
				<p><b>NOTE:</b> On form submission, the API endpoint responds with a JSON representation of the data. There is no JavaScript running in this example.</p>
			</blockquote>

			<form method="POST" action="/api/submit">
				<div class="input">
					<label for="name">Full Name</label>
					<input id="name" name="name" type="text" />
				</div>

				<div class="input">
					<label for="email">Email Address</label>
					<input id="email" name="email" type="email" />
				</div>

				<div class="input">
					<label for="referers">How did you hear about us?</label>
					<select id="referers" name="referers">
						<option hidden disabled selected value></option>
						<option value="Facebook">Facebook</option>
						<option value="Twitter">Twitter</option>
						<option value="Google">Google</option>
						<option value="Bing">Bing</option>
						<option value="Friends">Friends</option>
					</select>
				</div>

				<div class="checklist">
					<label>What are your favorite movies?</label>
					<ul>
						<li>
							<input id="m1" type="checkbox" name="movies" value="Space Jam" />
							<label for="m1">Space Jam</label>
						</li>
						<li>
							<input id="m2" type="checkbox" name="movies" value="Little Rascals" />
							<label for="m2">Little Rascals</label>
						</li>
						<li>
							<input id="m3" type="checkbox" name="movies" value="Frozen" />
							<label for="m3">Frozen</label>
						</li>
						<li>
							<input id="m4" type="checkbox" name="movies" value="Home Alone" />
							<label for="m4">Home Alone</label>
						</li>
					</ul>
				</div>
				<div id="turnstile-widget" style="padding-top: 20px;"></div>
				<button type="submit">Submit</button>
			</form>
		</main>
	<script>
	// This function is called when the Turnstile script is loaded and ready to be used.
	// The function name matches the "onload=..." parameter.
	function _turnstileCb() {
	    console.debug('_turnstileCb called');

	    turnstile.render('#turnstile-widget', {
	      sitekey: '0xAAAAAAAAAXAAAAAAAAAAAA',
	      theme: 'light',
	    });
	}
	</script>
	</body>
</html>

You can embed the Turnstile widget implicitly or explicitly. In this tutorial, we will explicitly embed the widget by injecting the JavaScript tag and related code, then specifying the placement of the widget.

<script src="https://challenges.cloudflare.com/turnstile/v0/api.js?onload=_turnstileCb" defer></script>
<script>
	function _turnstileCb() {
	    console.debug('_turnstileCb called');

	    turnstile.render('#turnstile-widget', {
	      sitekey: '0xAAAAAAAAAXAAAAAAAAAAAA',
	      theme: 'light',
	    });
	}
</script>

Make sure that the div id you assign is the same as the id you specify in turnstile.render call. In this case, let’s use “turnstile-widget”. Once that’s done, you should see the widget show up on your site!

<div id="turnstile-widget" style="padding-top: 20px;"></div>

Step 3: Validate the token

Now that the Turnstile widget is rendered on the front end, let’s validate it on the server side and check out the Turnstile outcome. We need to make a call to the /siteverify API with the token in the submit function under ./functions/api/submit.js.

First, grab the token issued from Turnstile under cf-turnstile-response. Then, call the /siteverify API to ensure that the token is valid. In this tutorial, we’ll attach the Turnstile outcome to the response to verify everything is working well. You can decide on the expected behavior and where to direct the user based on the /siteverify response.

/**
 * POST /api/submit
 */

import turnstilePlugin from "@cloudflare/pages-plugin-turnstile";

// This is a demo secret key. In prod, we recommend you store
// your secret key(s) safely. 
const SECRET_KEY = '0x4AAAAAAASh4E5cwHGsTTePnwcPbnFru6Y';

export const onRequestPost = [
    turnstilePlugin({
    	secret: SECRET_KEY,
    }),
    (async (context) => {
    	// Request has been validated as coming from a human
    	const formData = await context.request.formData()

    	var tmp, outcome = {};
	for (let [key, value] of formData) {
		tmp = outcome[key];
		if (tmp === undefined) {
			outcome[key] = value;
		} else {
			outcome[key] = [].concat(tmp, value);
		}
	}

	// Attach Turnstile outcome to the response
	outcome["turnstile_outcome"] = context.data.turnstile;

	let pretty = JSON.stringify(outcome, null, 2);

      	return new Response(pretty, {
      		headers: {
      			'Content-Type': 'application/json;charset=utf-8'
      		}
      	});
    })
];

Since Turnstile accurately decided that the visitor was not a bot, the response for “success” is “true” and “interactive” is “false”. The “interactive” being “false” means that the checkbox was automatically checked by Cloudflare as the visitor was determined to be human. The user was seamlessly allowed access to the website without having to perform any additional actions. If the visitor looks suspicious, Turnstile will become interactive, requiring the visitor to actually click the checkbox to verify that they are not a bot. We used the managed mode in this tutorial but depending on your application logic, you can choose the widget mode that works best for you.

{
  "name": "Sally Lee",
  "email": "[email protected]",
  "referers": "Facebook",
  "movies": "Space Jam",
  "cf-turnstile-response": "0._OHpi7JVN7Xz4abJHo9xnK9JNlxKljOp51vKTjoOi6NR4ru_4MLWgmxt1rf75VxRO4_aesvBvYj8bgGxPyEttR1K2qbUdOiONJUd5HzgYEaD_x8fPYVU6uZPUCdWpM4FTFcxPAnqhTGBVdYshMEycXCVBqqLVdwSvY7Me-VJoge7QOStLOtGgQ9FaY4NVQK782mpPfgVujriDAEl4s5HSuVXmoladQlhQEK21KkWtA1B6603wQjlLkog9WqQc0_3QMiBZzZVnFsvh_NLDtOXykOFK2cba1mLLcADIZyhAho0mtmVD6YJFPd-q9iQFRCMmT2Sz00IToXz8cXBGYluKtxjJrq7uXsRrI5pUUThKgGKoHCGTd_ufuLDjDCUE367h5DhJkeMD9UsvQgr1MhH3TPUKP9coLVQxFY89X9t8RAhnzCLNeCRvj2g-GNVs4-MUYPomd9NOcEmSpklYwCgLQ.jyBeKkV_MS2YkK0ZRjUkMg.6845886eb30b58f15de056eeca6afab8110e3123aeb1c0d1abef21c4dd4a54a1",
  "turnstile_outcome": {
    "success": true,
    "error-codes": [],
    "challenge_ts": "2024-02-28T22:52:30.009Z",
    "hostname": "pages-turnstile-demo.pages.dev",
    "action": "",
    "cdata": "",
    "metadata": {
      "interactive": false
    }
  }
}

Wrapping up

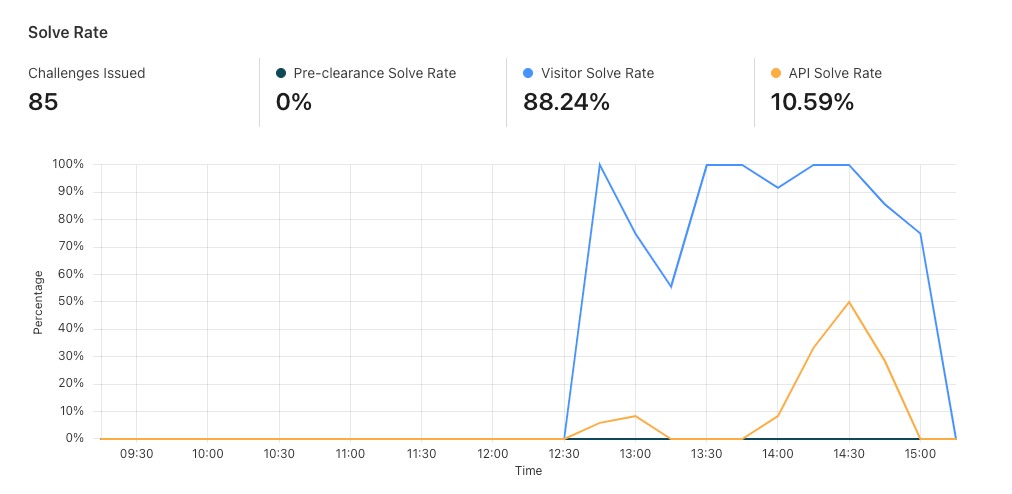
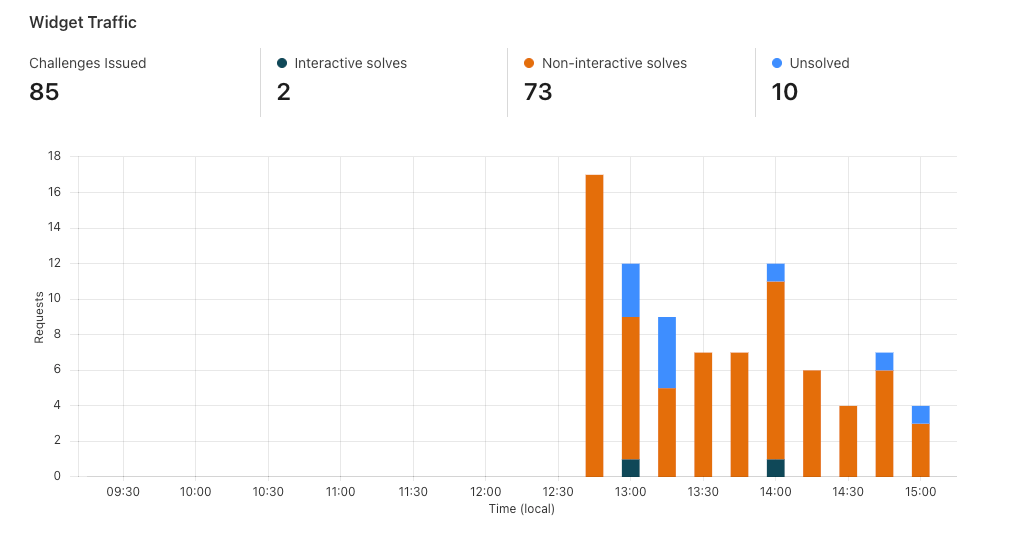
Now that we’ve set up Turnstile, we can head to Turnstile analytics in the Cloudflare Dashboard to monitor the solve rate and widget traffic. Visitor Solve Rate indicates the percentage of visitors who successfully completed the Turnstile widget. A sudden drop in the Visitor Solve Rate could indicate an increase in bot traffic, as bots may fail to complete the challenge presented by the widget. API Solve Rate measures the percentage of visitors who successfully validated their token against the /siteverify API. Similar to the Visitor Solve Rate, a significant drop in the API Solve Rate may indicate an increase in bot activity, as bots may fail to validate their tokens. Widget Traffic provides insights into the nature of the traffic hitting your website. A high number of challenges requiring interaction may suggest that bots are attempting to access your site, while a high number of unsolved challenges could indicate that the Turnstile widget is effectively blocking suspicious traffic.
And that’s it! We’ve walked you through how to easily secure your Pages with Turnstile. Pages and Turnstile are currently available for free for every Cloudflare user to get started right away. If you are looking for a seamless and speedy developer experience to get a secure website up and running, protected by Turnstile, head over to the Cloudflare Dashboard today!

Free network flow monitoring for all enterprise customers

Post Syndicated from Chris Draper original https://blog.cloudflare.com/free-network-monitoring-for-enterprise


A key component of effective corporate network security is establishing end to end visibility across all traffic that flows through the network. Every network engineer needs a complete overview of their network traffic to confirm their security policies work, to identify new vulnerabilities, and to analyze any shifts in traffic behavior. Often, it’s difficult to build out effective network monitoring as teams struggle with problems like configuring and tuning data collection, managing storage costs, and analyzing traffic across multiple visibility tools.

Today, we’re excited to announce that a free version of Cloudflare’s network flow monitoring product, Magic Network Monitoring, is available to all Enterprise Customers. Every Enterprise Customer can configure Magic Network Monitoring and immediately improve their network visibility in as little as 30 minutes via our self-serve onboarding process.

Enterprise Customers can visit the Magic Network Monitoring product page, click “Talk to an expert”, and fill out the form. You’ll receive access within 24 hours of submitting the request. Over the next month, the free version of Magic Network Monitoring will be rolled out to all Enterprise Customers. The product will automatically be available by default without the need to submit a form.

How it works

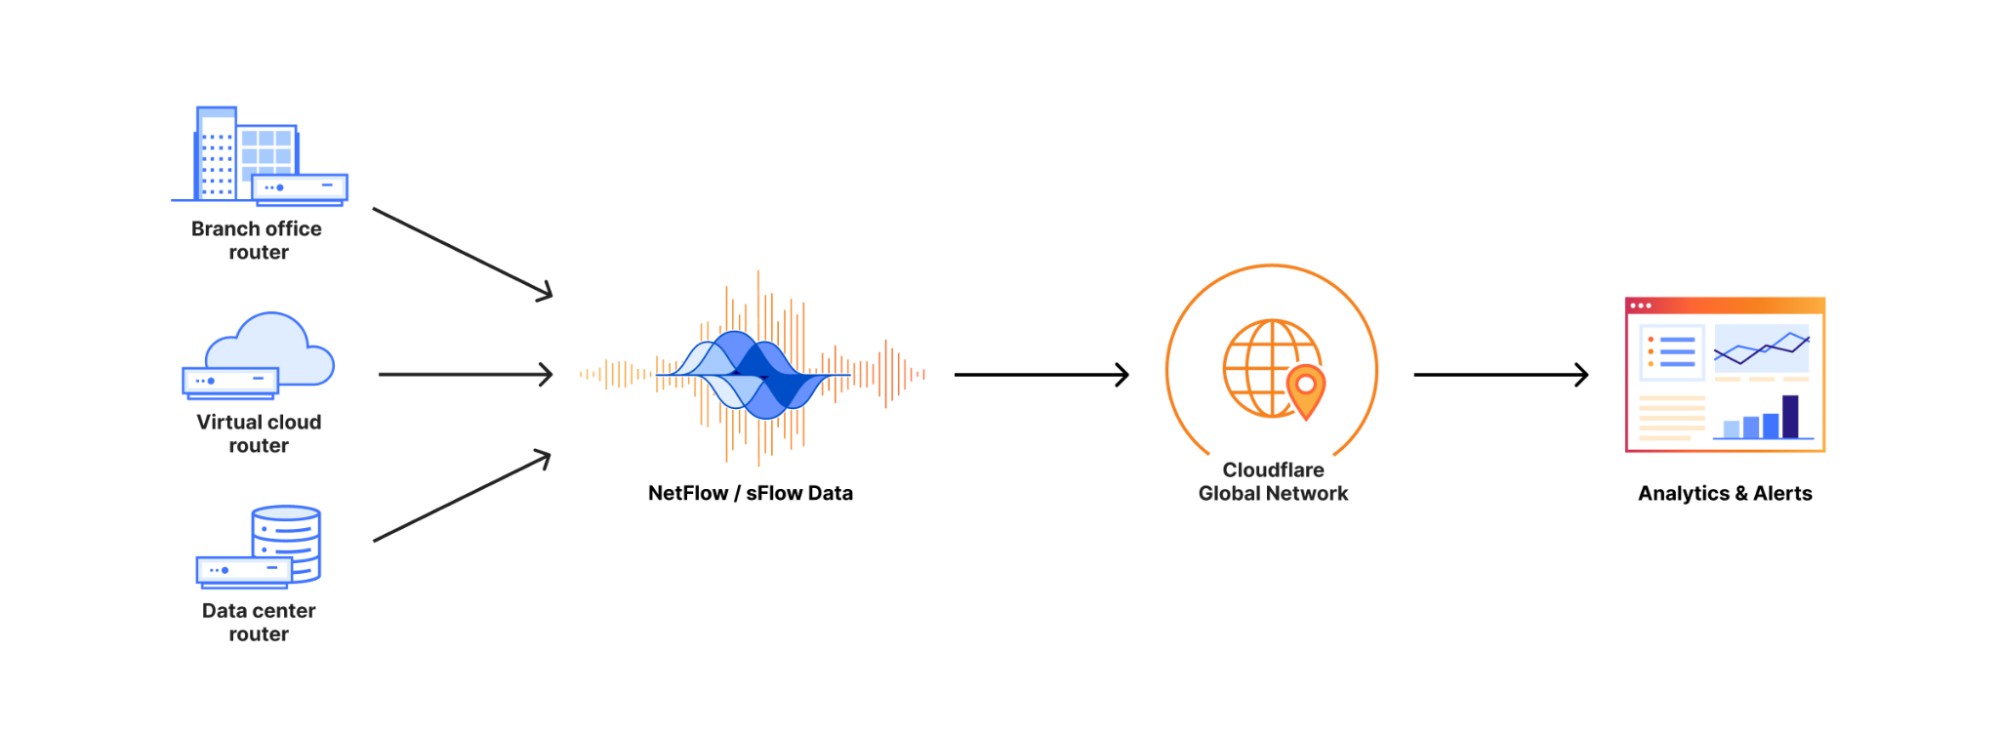
Cloudflare customers can send their network flow data (either NetFlow or sFlow) from their routers to Cloudflare’s network edge.

Magic Network Monitoring will pick up this data, parse it, and instantly provide insights and analytics on your network traffic. These analytics include traffic volume overtime in bytes and packets, top protocols, sources, destinations, ports, and TCP flags.

Dogfooding Magic Network Monitoring during the remediation of the Thanksgiving 2023 security incident

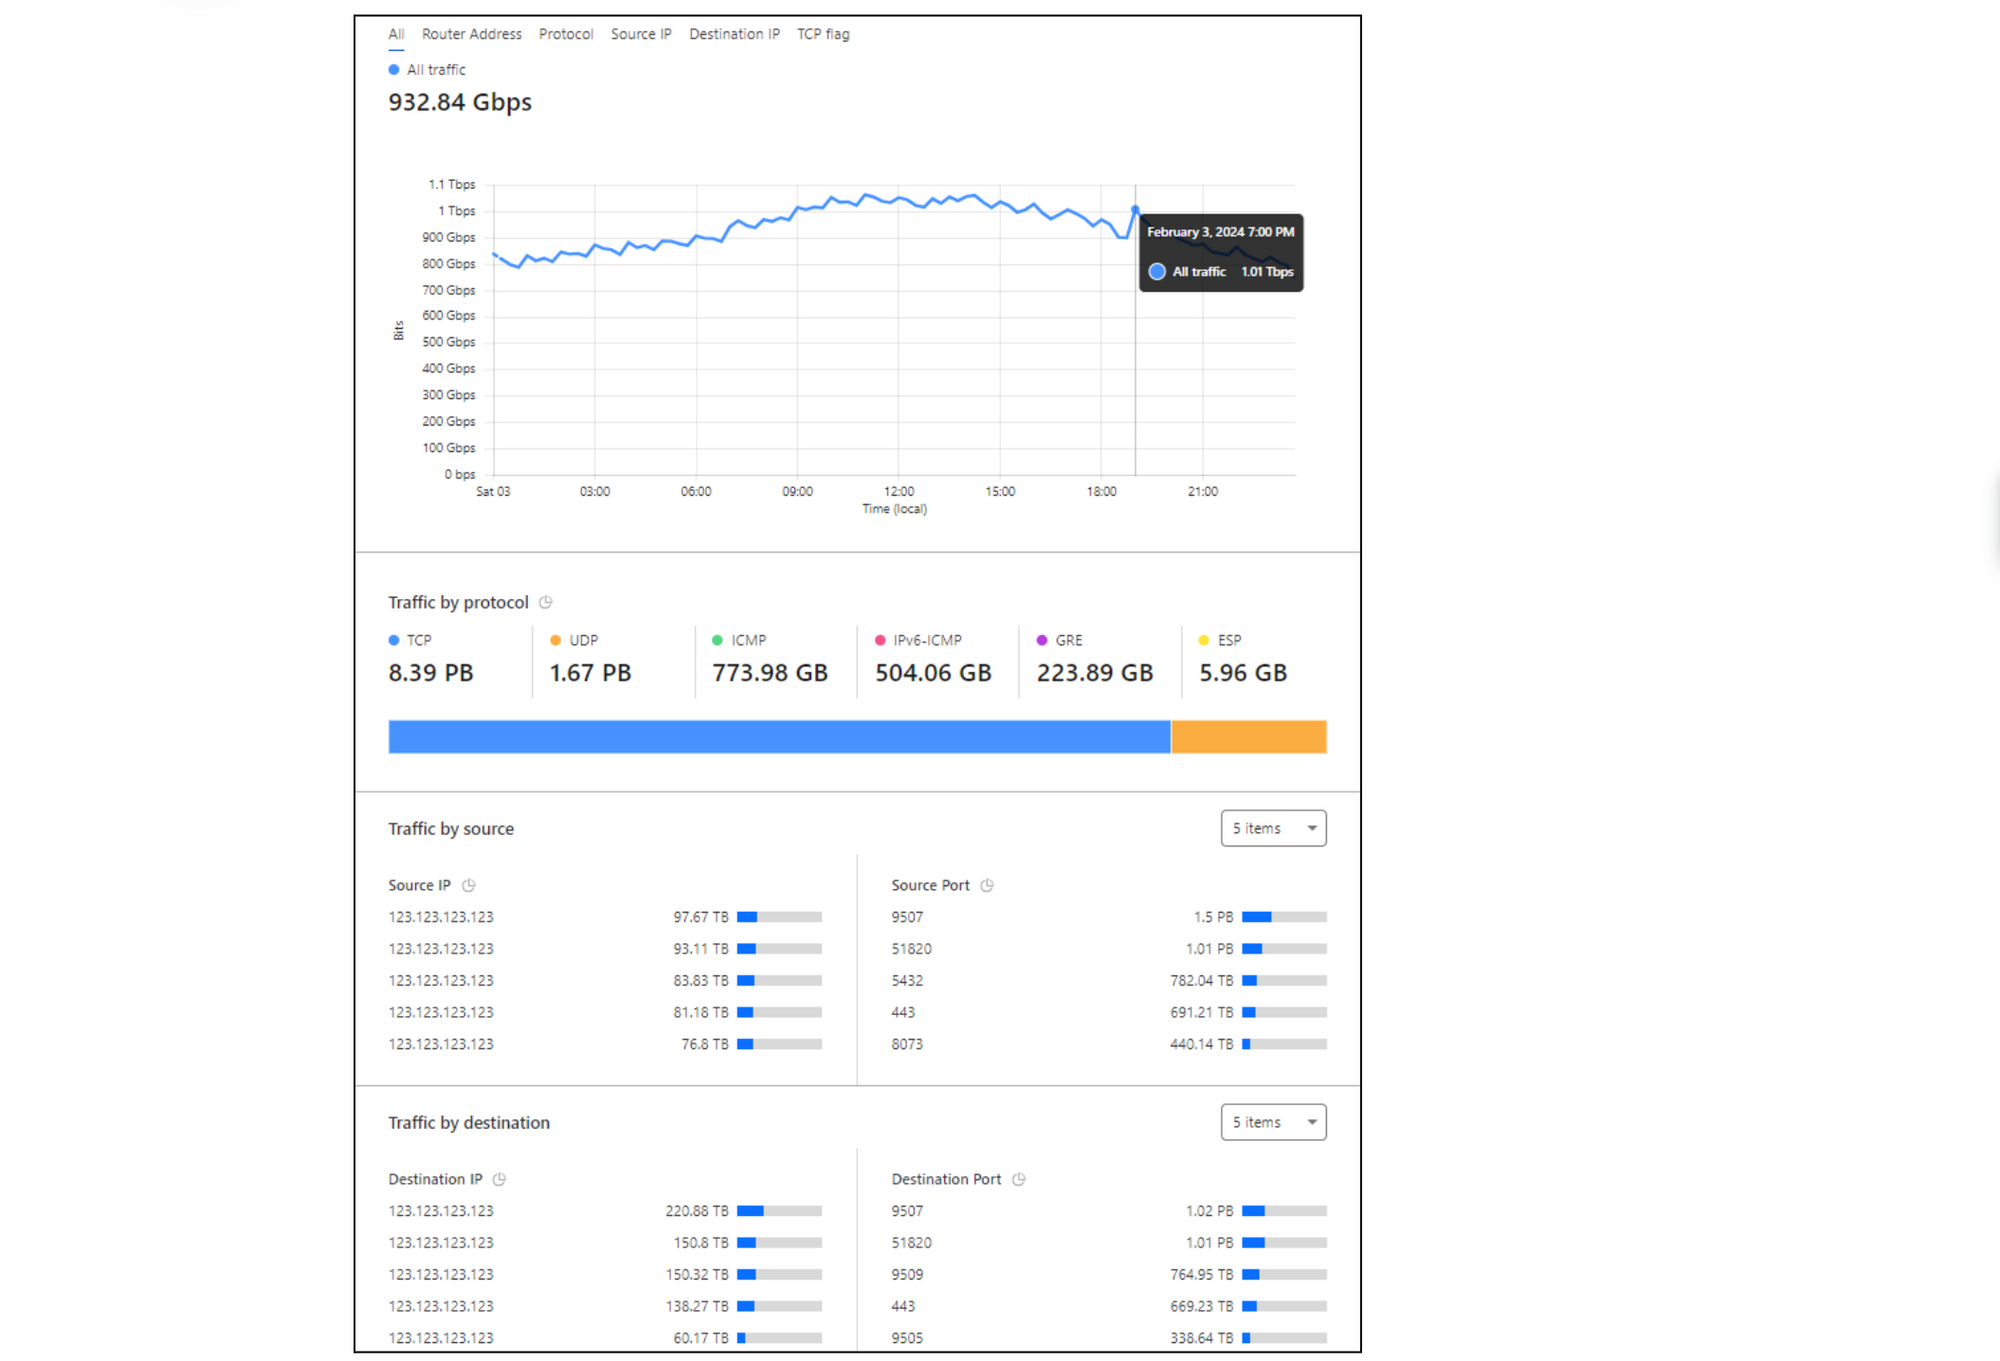
Let’s review a recent example of how Magic Network Monitoring improved Cloudflare’s own network security and traffic visibility during the Thanksgiving 2023 security incident. Our security team needed a lightweight method to identify malicious packet characteristics in our core data center traffic. We monitored for any network traffic sourced from or destined to a list of ASNs associated with the bad actor. Our security team setup Magic Network Monitoring and established visibility into our first core data center within 24 hours of the project kick-off. Today, Cloudflare continues to use Magic Network Monitoring to monitor for traffic related to bad actors and to provide real time traffic analytics on more than 1 Tbps of core data center traffic.

Magic Network Monitoring – Traffic Analytics

Monitoring local network traffic from IoT devices

Magic Network Monitoring also improves visibility on any network traffic that doesn’t go through Cloudflare. Imagine that you’re a network engineer at ACME Corporation, and it’s your job to manage and troubleshoot IoT devices in a factory that are connected to the factory’s internal network. The traffic generated by these IoT devices doesn’t go through Cloudflare because it is destined to other devices and endpoints on the internal network. Nonetheless, you still need to establish network visibility into device traffic over time to monitor and troubleshoot the system.

To solve the problem, you configure a router or other network device to securely send encrypted traffic flow summaries to Cloudflare via an IPSec tunnel. Magic Network Monitoring parses the data, and instantly provides you with insights and analytics on your network traffic. Now, when an IoT device goes down, or a connection between IoT devices is unexpectedly blocked, you can analyze historical network traffic data in Magic Network Monitoring to speed up the troubleshooting process.

Monitoring cloud network traffic

As cloud networking becomes increasingly prevalent, it is essential for enterprises to invest in visibility across their cloud environments. Let’s say you’re responsible for monitoring and troubleshooting your corporation’s cloud network operations which are spread across multiple public cloud providers. You need to improve visibility into your cloud network traffic to analyze and troubleshoot any unexpected traffic patterns like configuration drift that leads to an exposed network port.

To improve traffic visibility across different cloud environments, you can export cloud traffic flow logs from any virtual device that supports NetFlow or sFlow to Cloudflare. In the future, we are building support for native cloud VPC flow logs in conjunction with Magic Cloud Networking. Cloudflare will parse this traffic flow data and provide alerts plus analytics across all your cloud environments in a single pane of glass on the Cloudflare dashboard.

Improve your security posture today in less than 30 minutes

If you’re an existing Enterprise customer, and you want to improve your corporate network security, you can get started right away. Visit the Magic Network Monitoring product page, click “Talk to an expert”, and fill out the form. You’ll receive access within 24 hours of submitting the request. You can begin the self-serve onboarding tutorial, and start monitoring your first batch of network traffic in less than 30 minutes.

Over the next month, the free version of Magic Network Monitoring will be rolled out to all Enterprise Customers. The product will be automatically available by default without the need to submit a form.

If you’re interested in becoming an Enterprise Customer, and have more questions about Magic Network Monitoring, you can talk with an expert. If you’re a free customer, and you’re interested in testing a limited beta of Magic Network Monitoring, you can fill out this form to request access.

Advanced DNS Protection: mitigating sophisticated DNS DDoS attacks

Post Syndicated from Omer Yoachimik original https://blog.cloudflare.com/advanced-dns-protection


We’re proud to introduce the Advanced DNS Protection system, a robust defense mechanism designed to protect against the most sophisticated DNS-based DDoS attacks. This system is engineered to provide top-tier security, ensuring your digital infrastructure remains resilient in the face of evolving threats.

Our existing systems have been successfully detecting and mitigating ‘simpler’ DDoS attacks against DNS, but they’ve struggled with the more complex ones. The Advanced DNS Protection system is able to bridge that gap by leveraging new techniques that we will showcase in this blog post.

Advanced DNS Protection is currently in beta and available for all Magic Transit customers at no additional cost. Read on to learn more about DNS DDoS attacks, how the new system works, and what new functionality is expected down the road.

Register your interest to learn more about how we can help keep your DNS servers protected, available, and performant.

A third of all DDoS attacks target DNS servers

Distributed Denial of Service (DDoS) attacks are a type of cyber attack that aim to disrupt and take down websites and other online services. When DDoS attacks succeed and websites are taken offline, it can lead to significant revenue loss and damage to reputation.

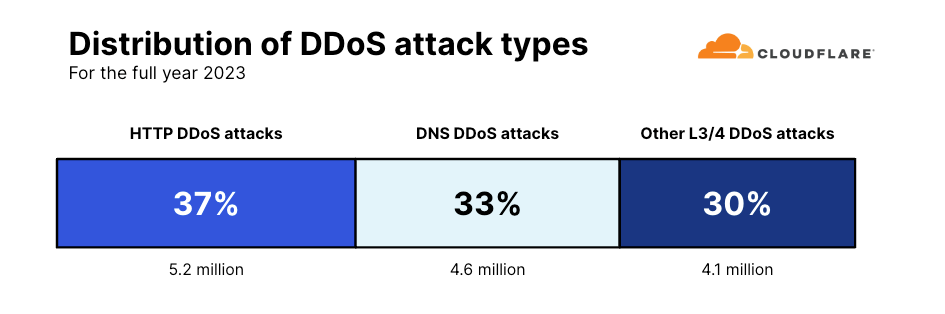
Distribution of DDoS attack types for 2023

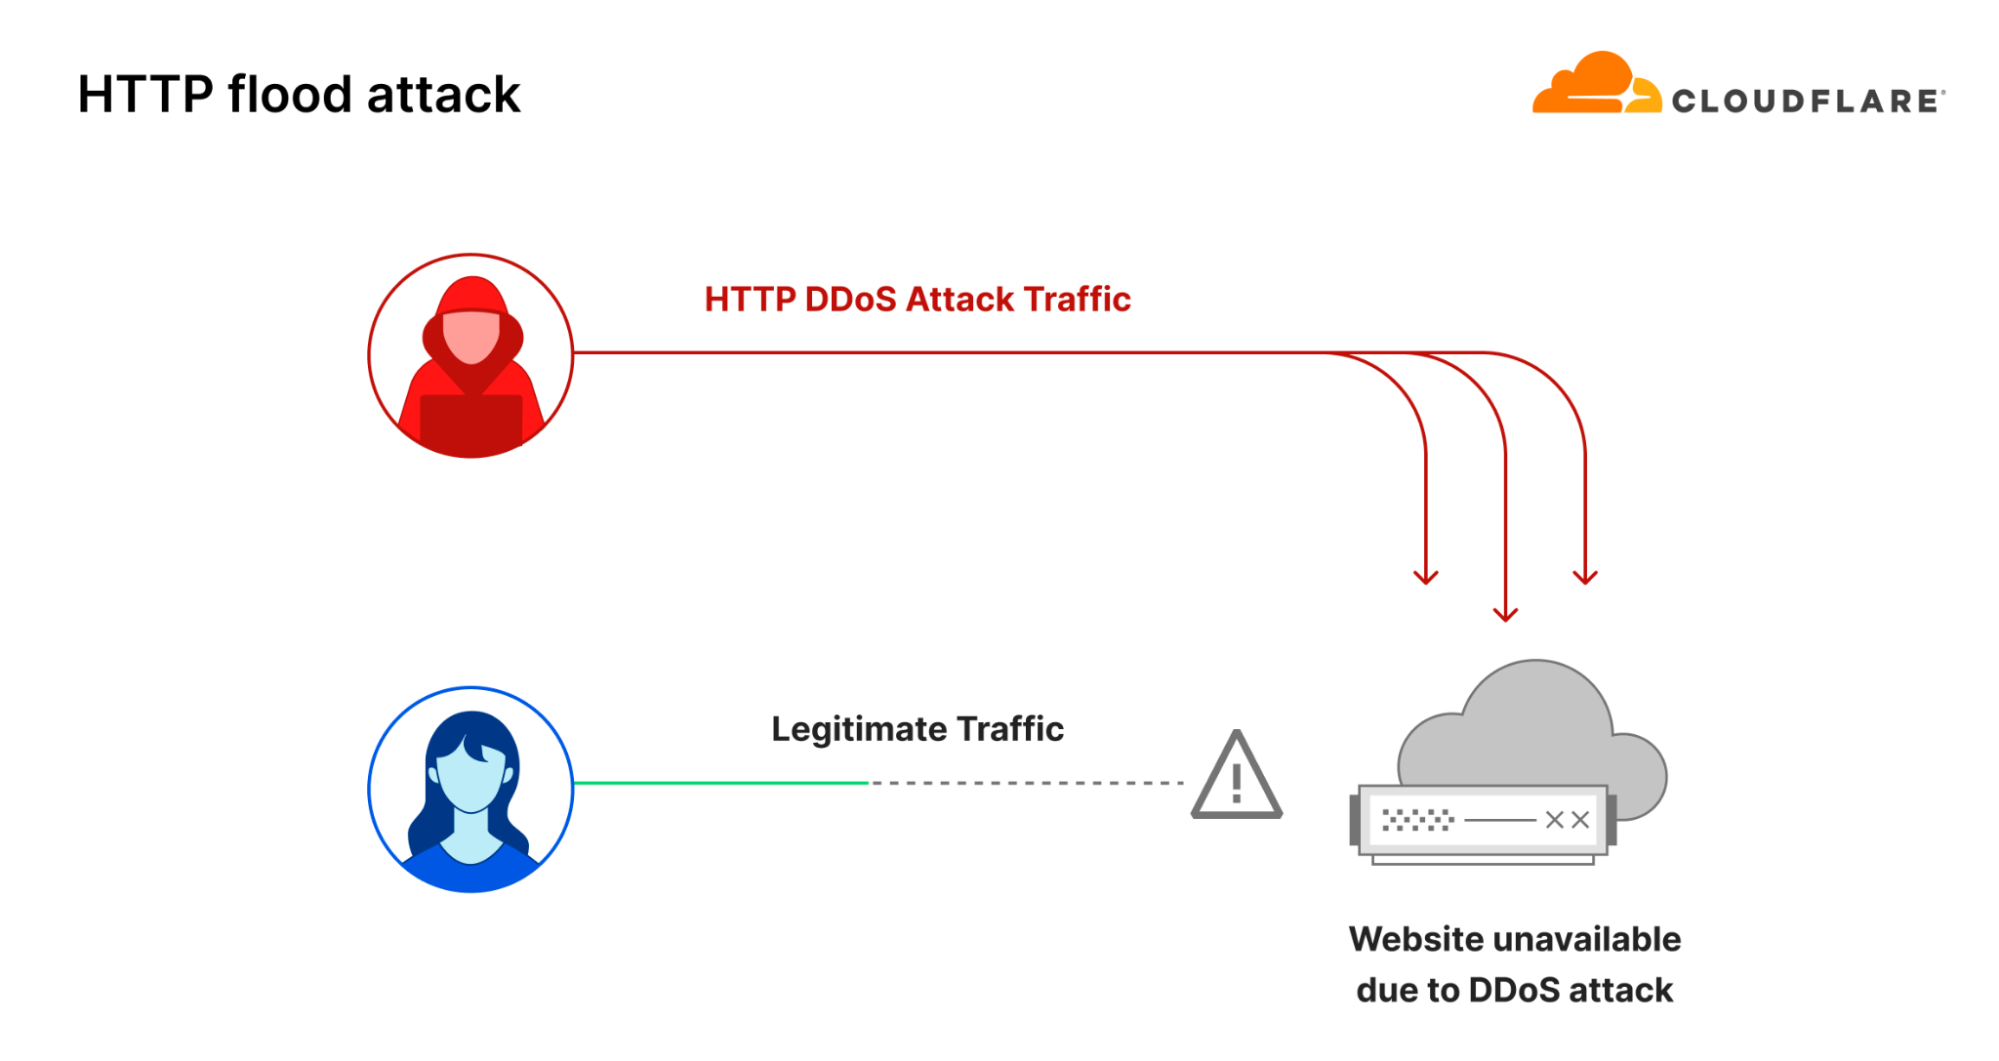
One common way to disrupt and take down a website is to flood its servers with more traffic than it can handle. This is known as an HTTP flood attack. It is a type of DDoS attack that targets the website directly with a lot of HTTP requests. According to our last DDoS trends report, in 2023 our systems automatically mitigated 5.2 million HTTP DDoS attacks — accounting for 37% of all DDoS attacks.

Diagram of an HTTP flood attack

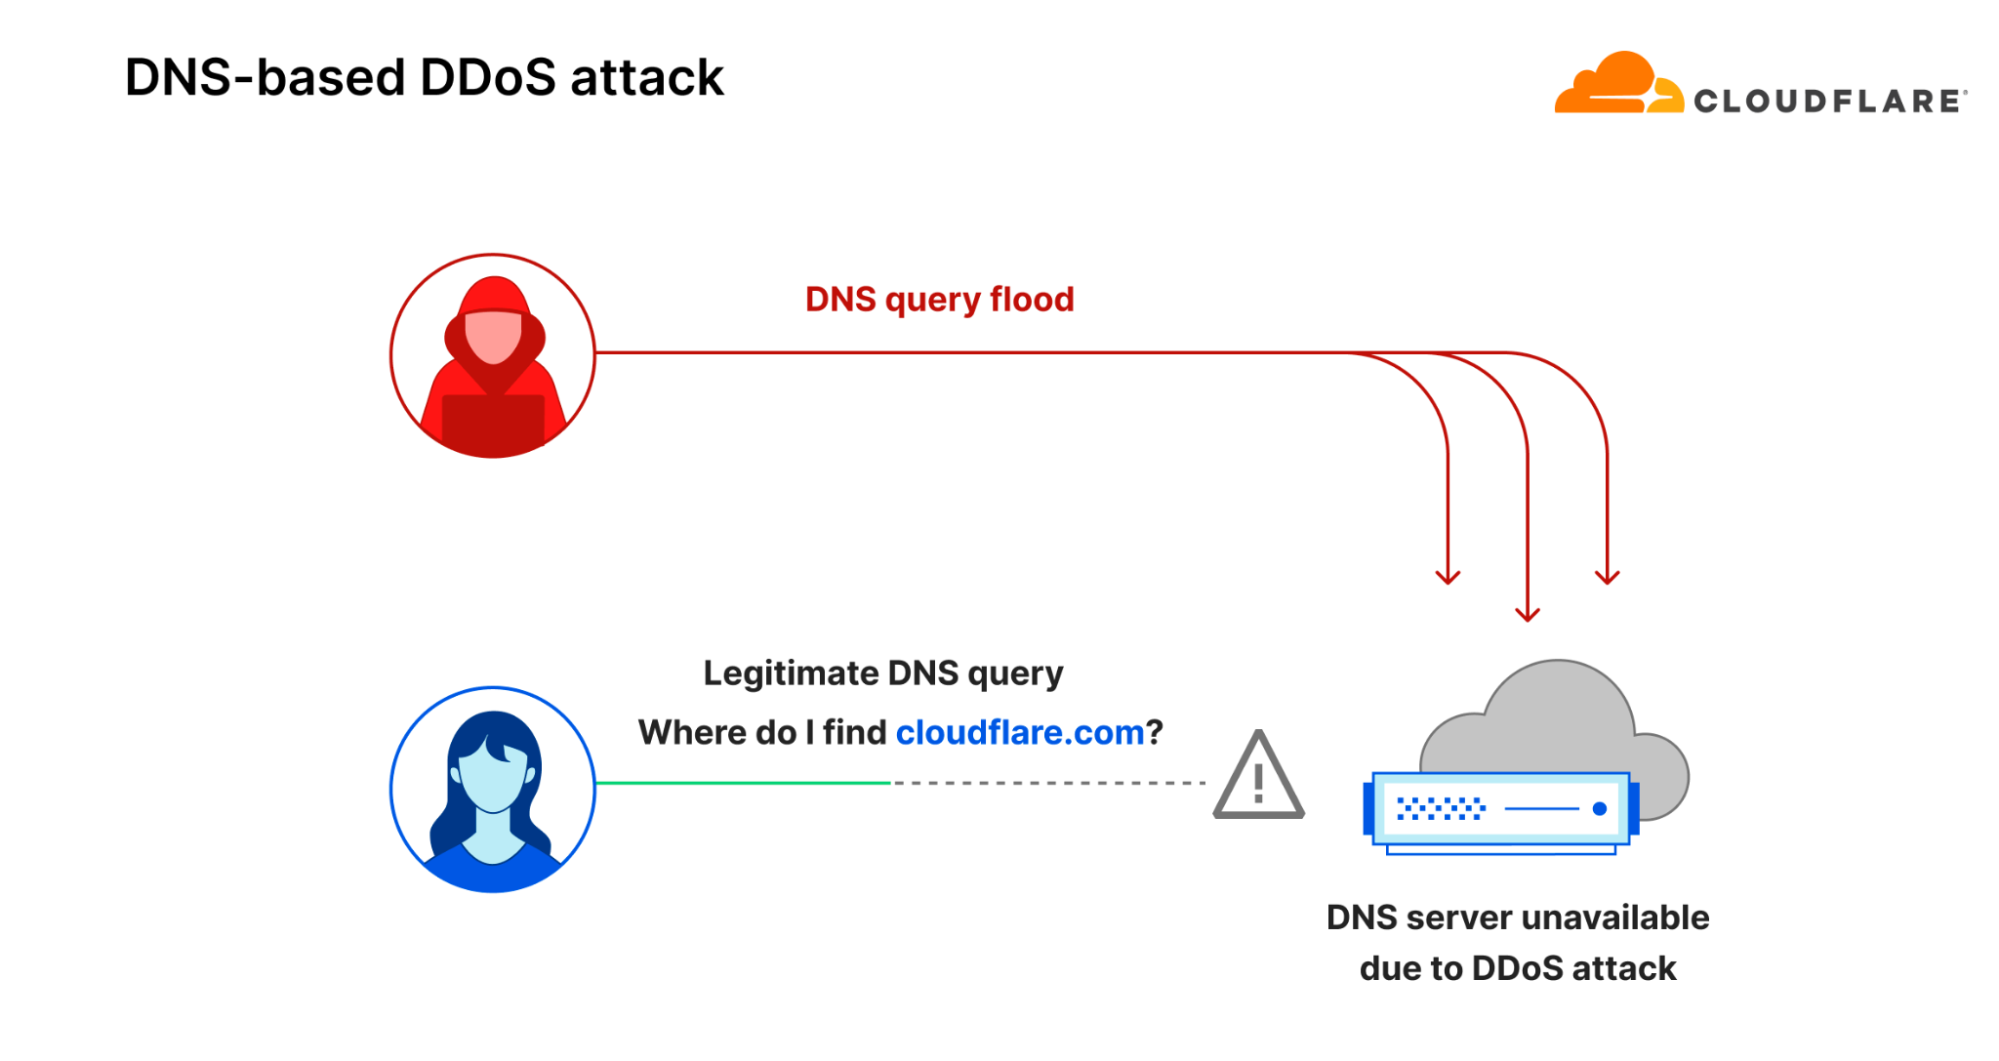
However, there is another way to take down websites: by targeting them indirectly. Instead of flooding the website servers, the threat actor floods the DNS servers. If the DNS servers are overwhelmed with more queries than their capacity, hostname to IP address translation fails and the website experiences an indirectly inflicted outage because the DNS server cannot respond to legitimate queries.

One notable example is the attack that targeted Dyn, a DNS provider, in October 2016. It was a devastating DDoS attack launched by the infamous Mirai botnet. It caused disruptions for major sites like Airbnb, Netflix, and Amazon, and it took Dyn an entire day to restore services. That’s a long time for service disruptions that can lead to significant reputation and revenue impact.

Over seven years later, Mirai attacks and DNS attacks are still incredibly common. In 2023, DNS attacks were the second most common attack type — with a 33% share of all DDoS attacks (4.6 million attacks). Attacks launched by Mirai-variant botnets were the fifth most common type of network-layer DDoS attack, accounting for 3% of all network-layer DDoS attacks.

Diagram of a DNS query flood attack

What are sophisticated DNS-based DDoS attacks?

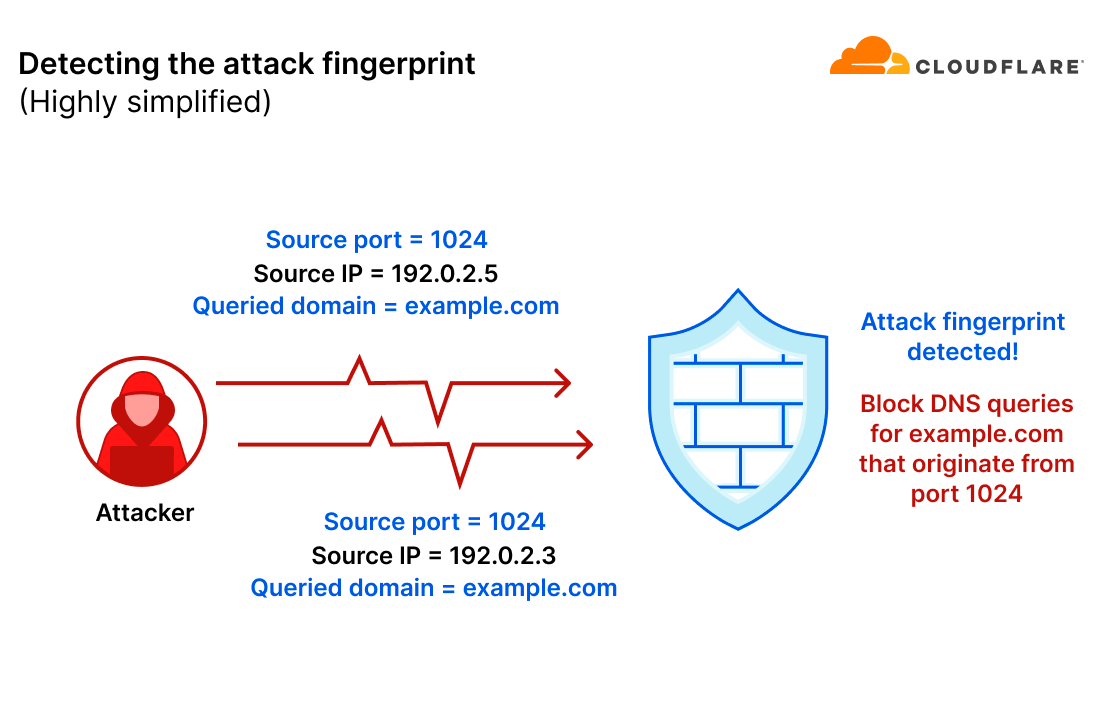
DNS-based DDoS attacks can be easier to mitigate when there is a recurring pattern in each query. This is what’s called the “attack fingerprint”. Fingerprint-based mitigation systems can identify those patterns and then deploy a mitigation rule that surgically filters the attack traffic without impacting legitimate traffic.

For example, let’s take a scenario where an attacker sends a flood of DNS queries to their target. In this example, the attacker only randomized the source IP address. All other query fields remained consistent. The mitigation system detected the pattern (source port is 1024 and the queried domain is example.com) and will generate an ephemeral mitigation rule to filter those queries.

A simplified diagram of the attack fingerprinting concept

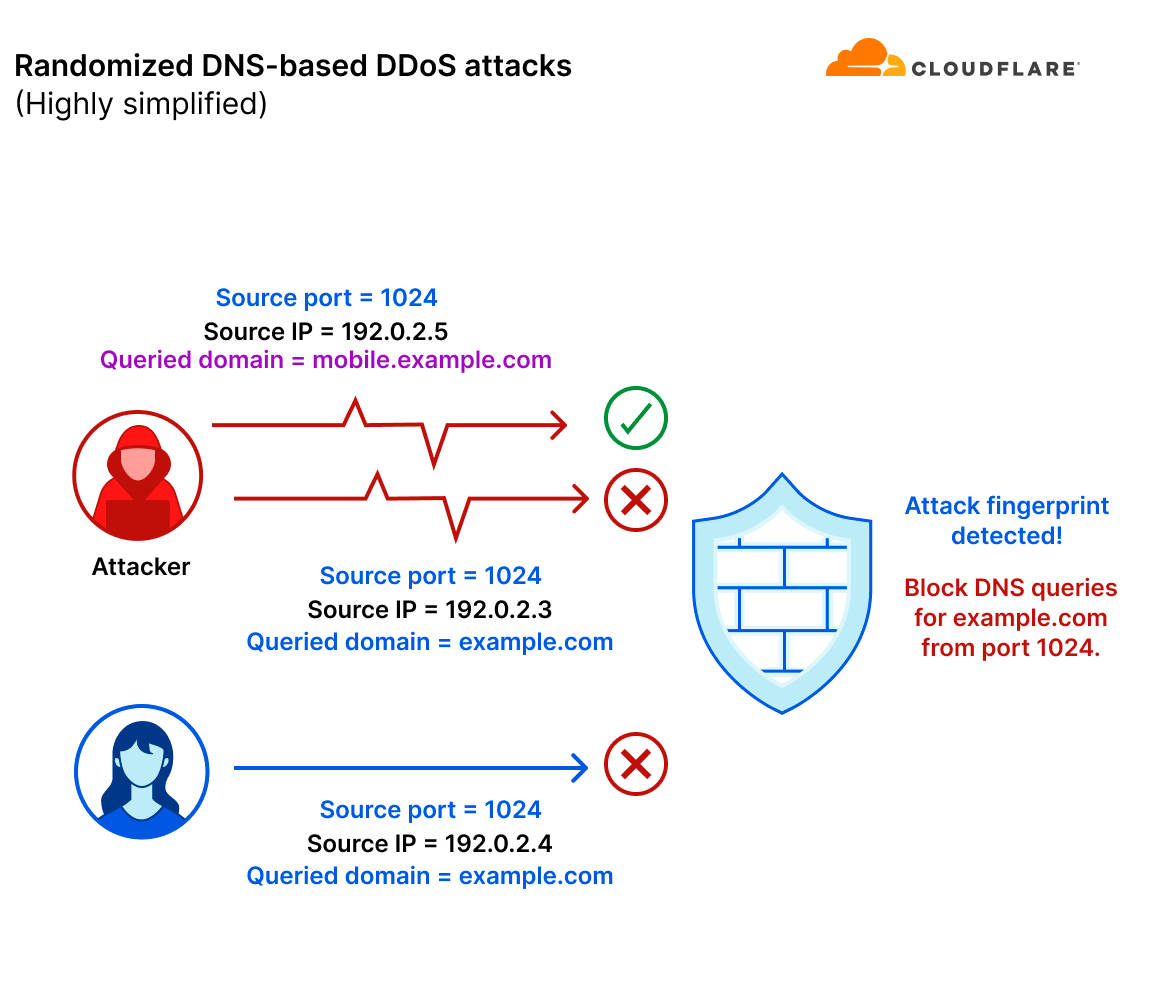
However, there are DNS-based DDoS attacks that are much more sophisticated and randomized, lacking an apparent attack pattern. Without a consistent pattern to lock on to, it becomes virtually impossible to mitigate the attack using a fingerprint-based mitigation system. Moreover, even if an attack pattern is detected in a highly randomized attack, the pattern would probably be so generic that it would mistakenly mitigate legitimate user traffic and/or not catch the entire attack.

In this example, the attacker also randomized the queried domain in their DNS query flood attack. Simultaneously, a legitimate client (or server) is also querying example.com. They were assigned a random port number which happened to be 1024. The mitigation system detected a pattern (source port is 1024 and the queried domain is example.com) that caught only the part of the attack that matched the fingerprint. The mitigation system missed the part of the attack that queried other hostnames. Lastly, the mitigation system mistakenly caught legitimate traffic that happened to appear similar to the attack traffic.

A simplified diagram of a randomized DNS flood attack

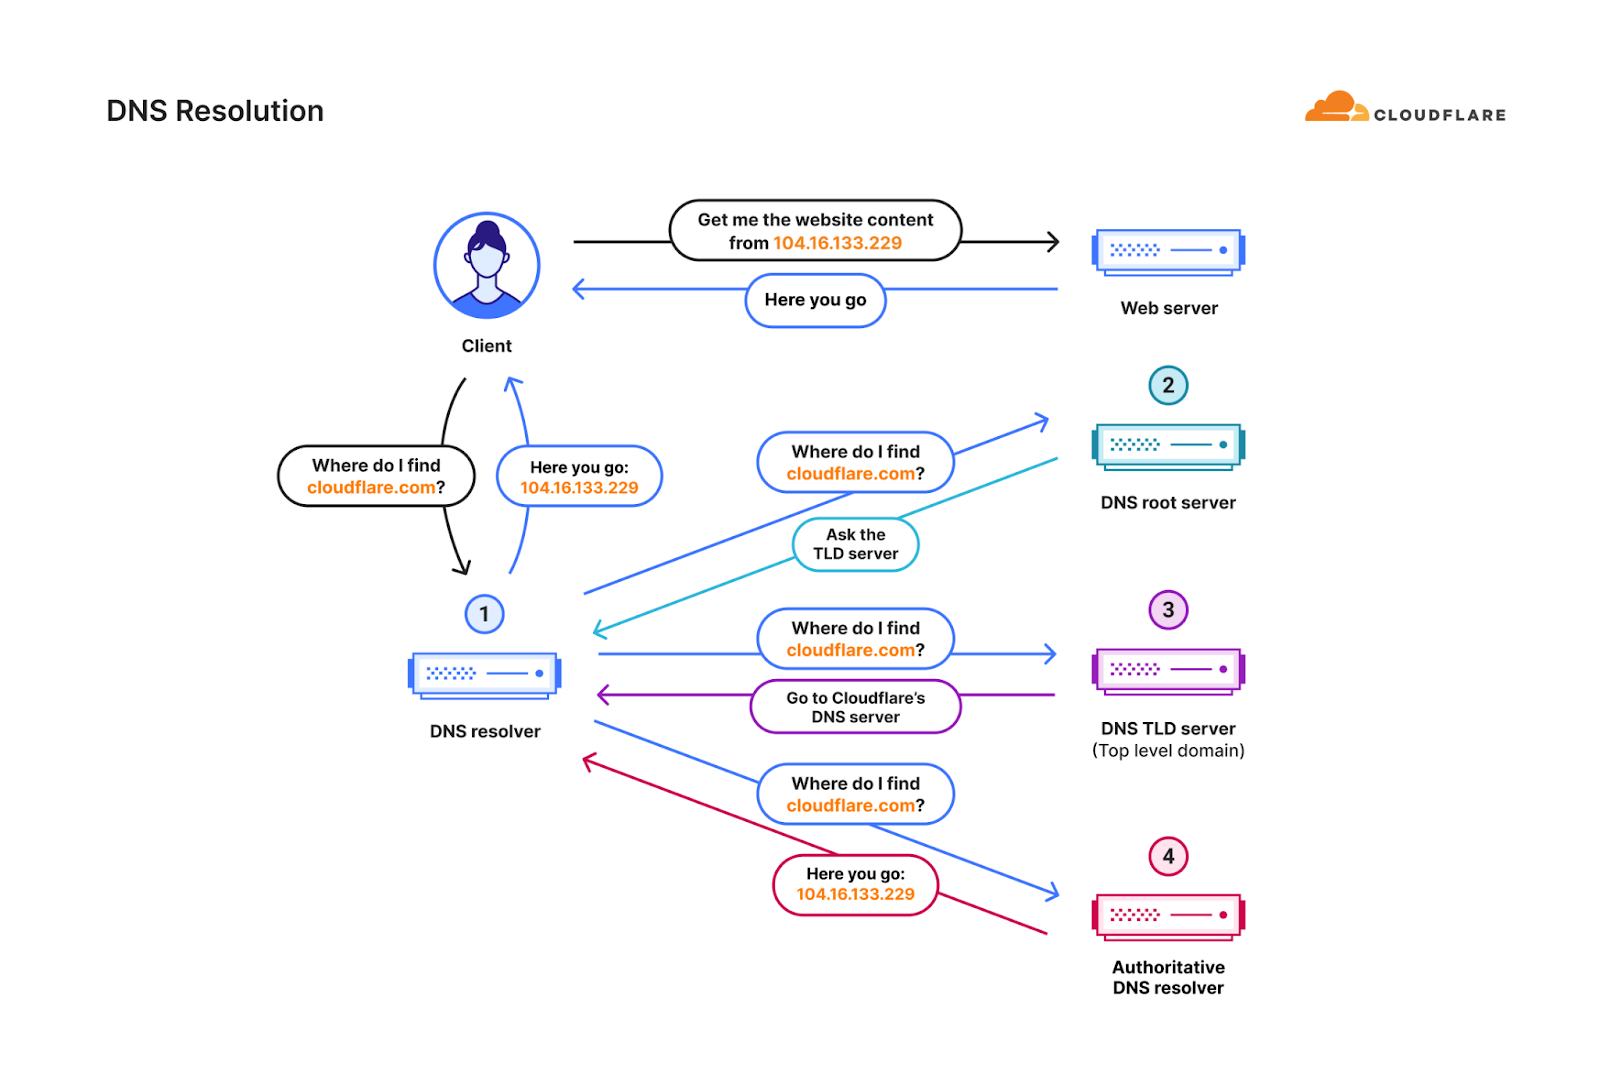
This is just one very simple example of how fingerprinting can fail in stopping randomized DDoS attacks. This challenge is amplified when attackers “launder” their attack traffic through reputable public DNS resolvers (a DNS resolver, also known as a recursive DNS server, is a type of DNS server that is responsible for tracking down the IP address of a website from various other DNS servers). This is known as a DNS laundering attack.

Diagram of the DNS resolution process

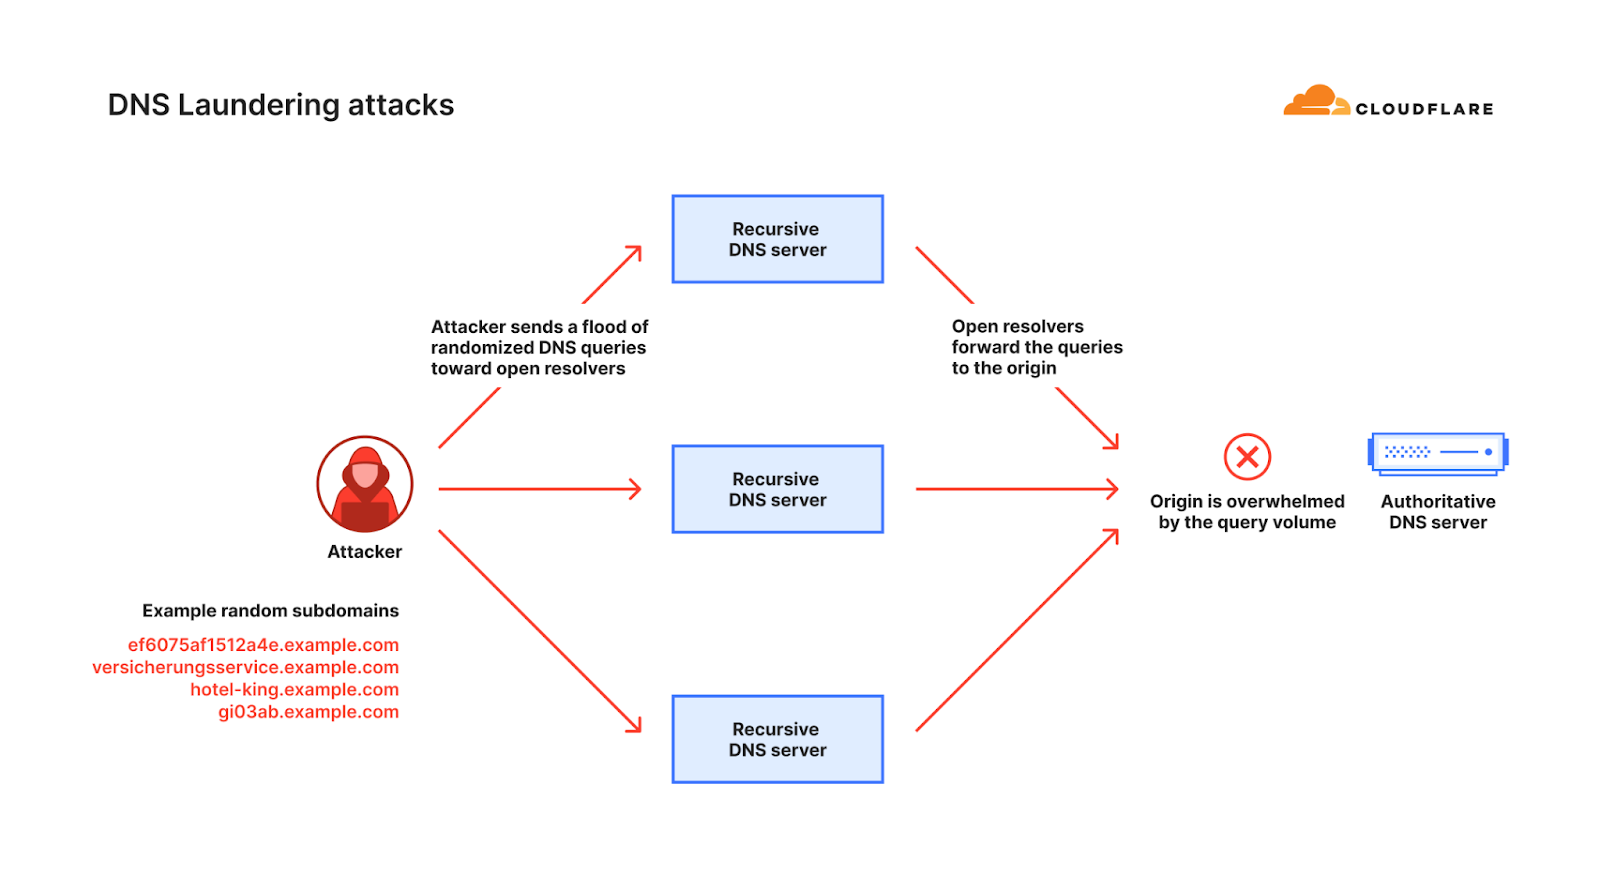
During a DNS laundering attack, the attacker queries subdomains of a real domain that is managed by the victim’s authoritative DNS server. The prefix that defines the subdomain is randomized and is never used more than once. Due to the randomization element, recursive DNS servers will never have a cached response and will need to forward the query to the victim’s authoritative DNS server. The authoritative DNS server is then bombarded by so many queries until it cannot serve legitimate queries or even crashes altogether.

Diagram of a DNS Laundering attack

The complexity of sophisticated DNS DDoS attacks lies in their paradoxical nature: while they are relatively easy to detect, effectively mitigating them is significantly more difficult. This difficulty stems from the fact that authoritative DNS servers cannot simply block queries from recursive DNS servers, as these servers also make legitimate requests. Moreover, the authoritative DNS server is unable to filter queries aimed at the targeted domain because it is a genuine domain that needs to remain accessible.

Mitigating sophisticated DNS-based DDoS attacks with the Advanced DNS Protection system

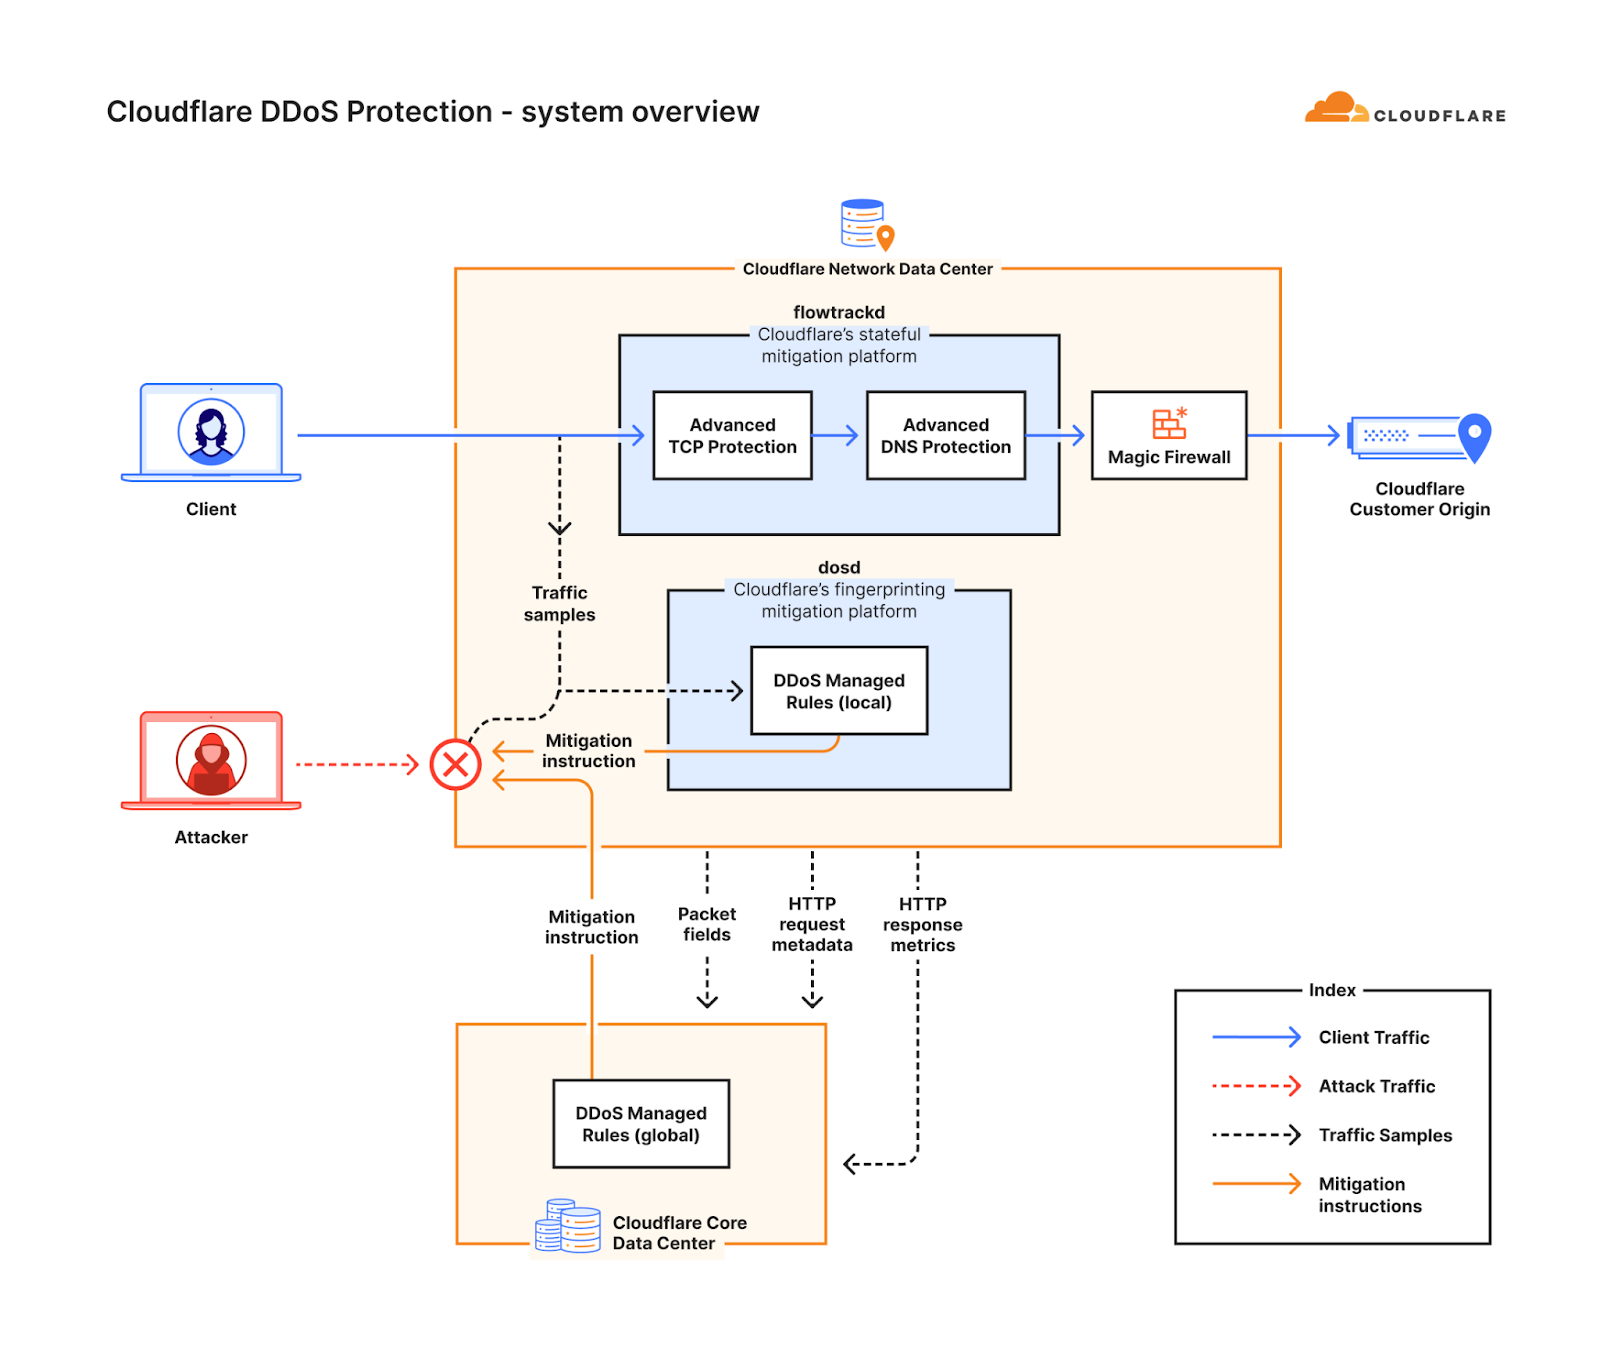
The rise in these types of sophisticated DNS-based DDoS attacks motivated us to develop a new solution — a solution that would better protect our customers and bridge the gap of more traditional fingerprinting approaches. This solution came to be the Advanced DNS Protection system. Similar to the Advanced TCP Protection system, it is a software-defined system that we built, and it is powered by our stateful mitigation platform, flowtrackd (flow tracking daemon).

The Advanced DNS Protection system complements our existing suite of DDoS defense systems. Following the same approach as our other DDoS defense systems, the Advanced DNS Protection system is also a distributed system, and an instance of it runs on every Cloudflare server around the world. Once the system has been initiated, each instance can detect and mitigate attacks autonomously without requiring any centralized regulation. Detection and mitigation is instantaneous (zero seconds). Each instance also communicates with other instances on other servers in a data center. They gossip and share threat intelligence to deliver a comprehensive mitigation within each data center.

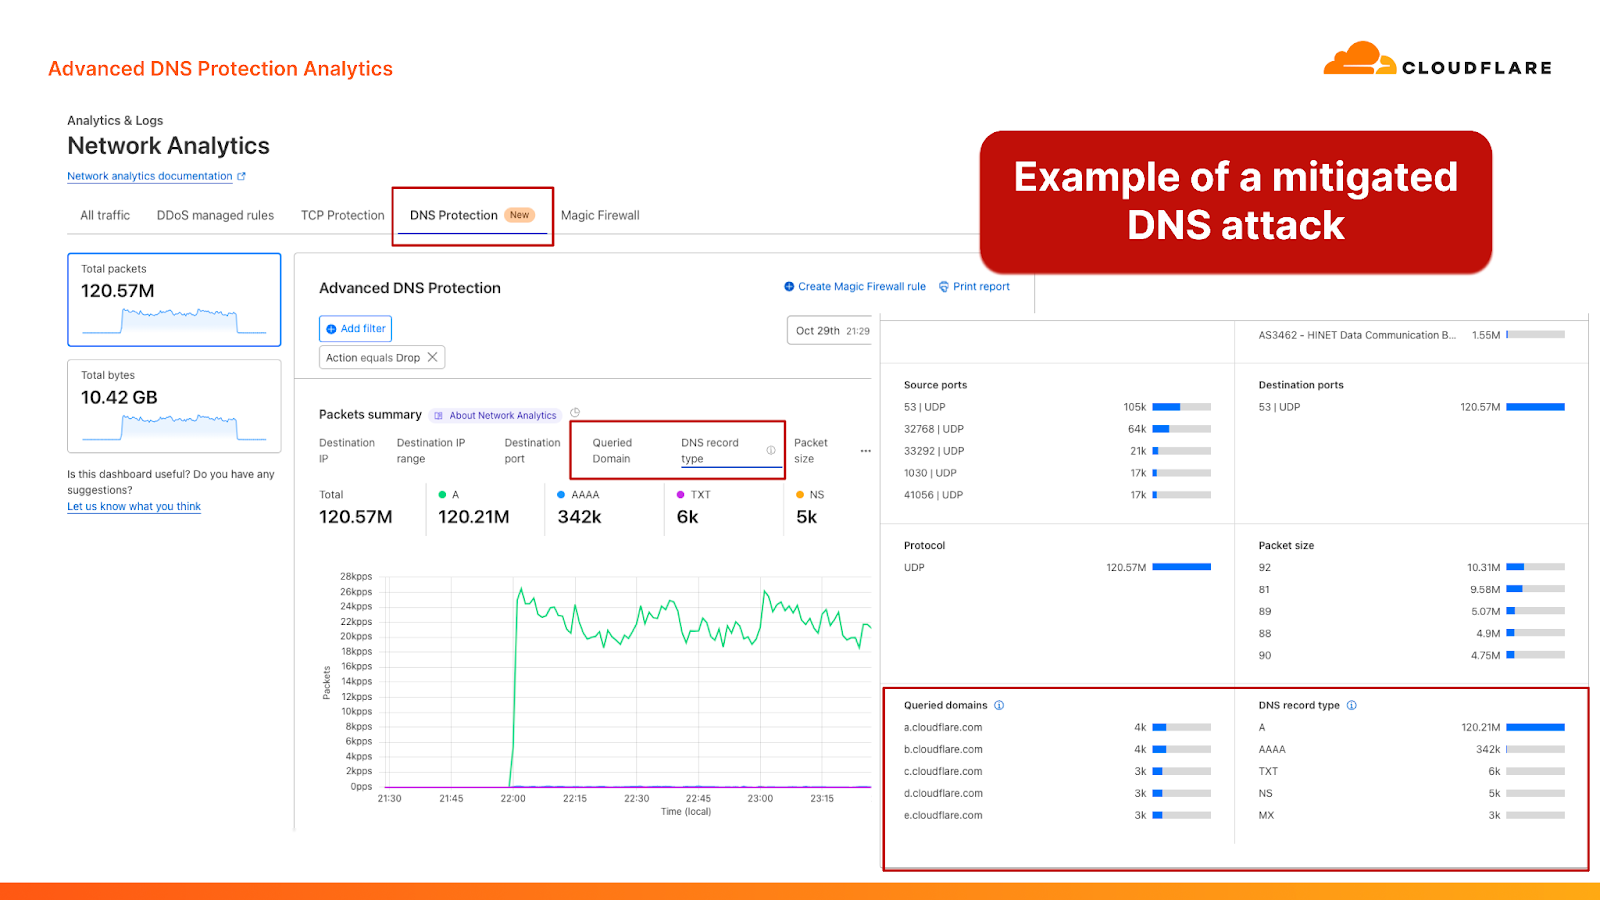
Screenshots from the Cloudflare dashboard showcasing a DNS-based DDoS attack that was mitigated by the Advanced DNS Protection system 

Together, our fingerprinting-based systems (the DDoS protection managed rulesets) and our stateful mitigation systems provide a robust multi-layered defense strategy to defend against the most sophisticated and randomized DNS-based DDoS attacks. The system is also customizable, allowing Cloudflare customers to tailor it for their needs. Review our documentation for more information on configuration options.

Diagram of Cloudflare’s DDoS protection systems

We’ve also added new DNS-centric data points to help customers better understand their DNS traffic patterns and attacks. These new data points are available in a new “DNS Protection” tab within the Cloudflare Network Analytics dashboard. The new tab provides insights about which DNS queries are passed and dropped, as well as the characteristics of those queries, including the queried domain name and the record type. The analytics can also be fetched by using the Cloudflare GraphQL API and by exporting logs into your own monitoring dashboards via Logpush.

DNS queries: discerning good from bad

To protect against sophisticated and highly randomized DNS-based DDoS attacks, we needed to get better at deciding which DNS queries are likely to be legitimate for our customers. However, it’s not easy to infer what’s legitimate and what’s likely to be a part of an attack just based on the query name. We can’t rely solely on fingerprint-based detection mechanisms, since sometimes seemingly random queries, like abc123.example.com, can be legitimate. The opposite is true as well: a query for mailserver.example.com might look legitimate, but can end up not being a real subdomain for a customer.

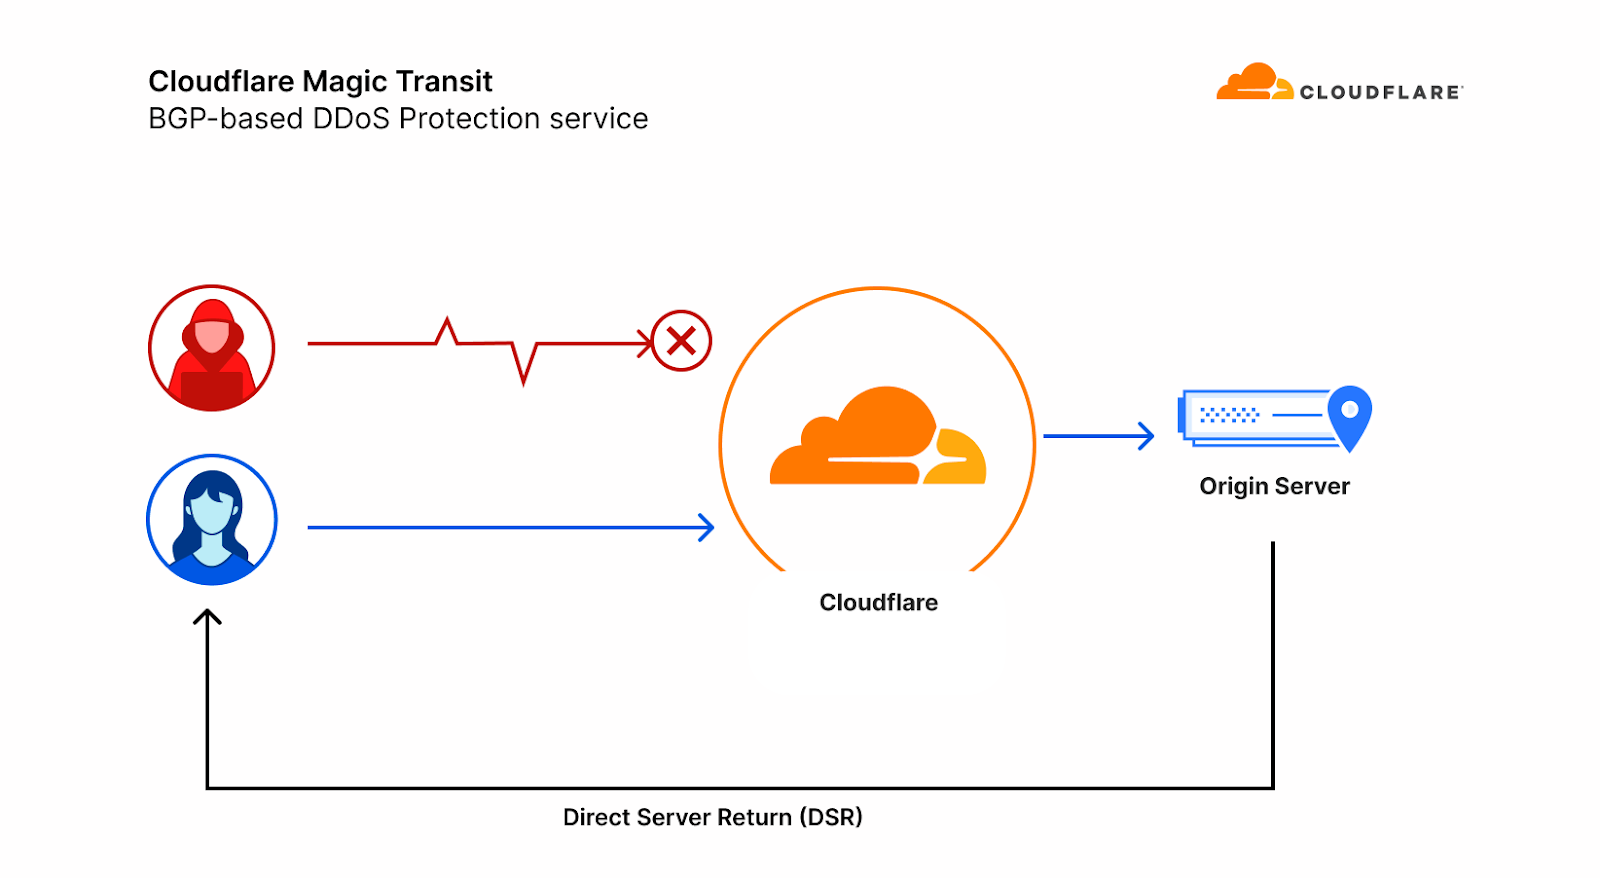
To make matters worse, our Layer 3 packet routing-based mitigation service, Magic Transit, uses direct server return (DSR), meaning we can not see the DNS origin server’s responses to give us feedback about which queries are ultimately legitimate.

Diagram of Magic Transit with Direct Server Return (DSR)

We decided that the best way to combat these attacks is to build a data model of each customer’s expected DNS queries, based on a historical record that we build. With this model in hand, we can decide with higher confidence which queries are likely to be legitimate, and drop the ones that we think are not, shielding our customer’s DNS servers.

This is the basis of Advanced DNS Protection. It inspects every DNS query sent to our Magic Transit customers, and passes or drops them based on the data model and each customer’s individual settings.

To do so, each server at our global network continually sends certain DNS-related data such as query type (for example, A record) and the queried domains (but not the source of the query) to our core data centers, where we periodically compute DNS query traffic profiles for each customer. Those profiles are distributed across our global network, where they are consulted to help us more confidently and accurately decide which queries are good and which are bad. We drop the bad queries and pass on the good ones, taking into account a customer’s tolerance for unexpected DNS queries based on their configurations.

Solving the technical challenges that emerged when designing the Advanced DNS Protection system

In building this system, we faced several specific technical challenges:

Data processing

We process tens of millions of DNS queries per day across our global network for our Magic Transit customers, not counting Cloudflare’s suite of other DNS products, and use the DNS-related data mentioned above to build custom query traffic profiles. Analyzing this type of data requires careful treatment of our data pipelines. When building these traffic profiles, we use sample-on-write and adaptive bitrate technologies when writing and reading the necessary data, respectively, to ensure that we capture the data with a fine granularity while protecting our data infrastructure, and we drop information that might impact the privacy of end users.

Compact representation of query data

Some of our customers see tens of millions of DNS queries per day alone. This amount of data would be prohibitively expensive to store and distribute in an uncompressed format. To solve this challenge, we decided to use a counting Bloom filter for each customer’s traffic profile. This is a probabilistic data structure that allows us to succinctly store and distribute each customer’s DNS profile, and then efficiently query it at packet processing time.

Data distribution

We periodically need to recompute and redistribute every customer’s DNS traffic profile between our data centers to each server in our fleet. We used our very own R2 storage service to greatly simplify this task. With regional hints and custom domains enabled, we enabled caching and used only a handful of R2 buckets. Each time we need to update the global view of the customer data models across our edge fleet, 98% of the bits transferred are served from cache.

Built-in tolerance

When new domain names are put into service, our data models will not immediately be aware of them because queries with these names have never been seen before. This and other reasons for potential false positives mandate that we need to build a certain amount of tolerance into the system to allow through potentially legitimate queries. We do so by leveraging token bucket algorithms. Customers can configure the size of the token buckets by changing the sensitivity levels of the Advanced DNS Protection system. The lower the sensitivity, the larger the token bucket — and vice versa. A larger token bucket provides more tolerance for unexpected DNS queries and expected DNS queries that deviate from the profile. A high sensitivity level translates to a smaller token bucket and a stricter approach.

Leveraging Cloudflare’s global software-defined network

At the end of the day, these are the types of challenges that Cloudflare is excellent at solving. Our customers trust us with handling their traffic, and ensuring their Internet properties are protected, available and performant. We take that trust extremely seriously.

The Advanced DNS Protection system leverages our global infrastructure and data processing capabilities alongside intelligent algorithms and data structures to protect our customers.

If you are not yet a Cloudflare customer, let us know if you’d like to protect your DNS servers. Existing Cloudflare customers can enable the new systems by contacting their account team or Cloudflare Support.

General availability for WAF Content Scanning for file malware protection

Post Syndicated from Radwa Radwan original https://blog.cloudflare.com/waf-content-scanning-for-malware-detection


File upload is a common feature in many web applications. Applications may allow users to upload files like images of flood damage to file an insurance claim, PDFs like resumes or cover letters to apply for a job, or other documents like receipts or income statements. However, beneath the convenience lies a potential threat, since allowing unrestricted file uploads can expose the web server and your enterprise network to significant risks related to security, privacy, and compliance.

Cloudflare recently introduced WAF Content Scanning, our in-line malware file detection and prevention solution to stop malicious files from reaching the web server, offering our Enterprise WAF customers an additional line of defense against security threats.

Today, we’re pleased to announce that the feature is now generally available. It will be automatically rolled out to existing WAF Content Scanning customers before the end of March 2024.

In this blog post we will share more details about the new version of the feature, what we have improved, and reveal some of the technical challenges we faced while building it. This feature is available to Enterprise WAF customers as an add-on license, contact your account team to get it.

What to expect from the new version?

The feedback from the early access version has resulted in additional improvements. The main one is expanding the maximum size of scanned files from 1 MB to 15 MB. This change required a complete redesign of the solution’s architecture and implementation. Additionally, we are improving the dashboard visibility and the overall analytics experience.

Let’s quickly review how malware scanning operates within our WAF.

Behind the scenes

WAF Content Scanning operates in a few stages: users activate and configure it, then the scanning engine detects which requests contain files, the files are sent to the scanner returning the scan result fields, and finally users can build custom rules with these fields. We will dig deeper into each step in this section.

Activate and configure

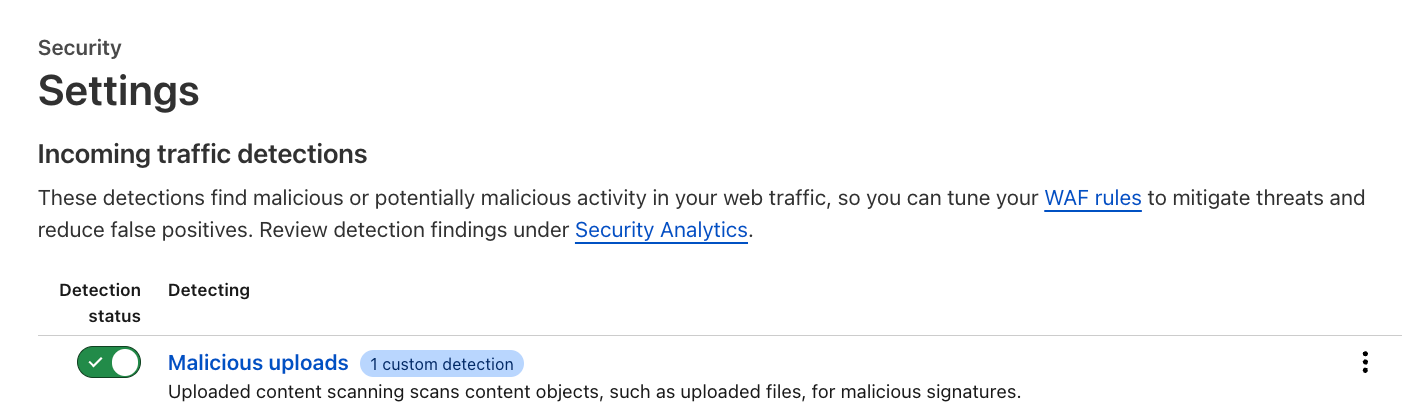
Customers can enable the feature via the API, or through the Settings page in the dashboard (Security → Settings) where a new section has been added for incoming traffic detection configuration and enablement. As soon as this action is taken, the enablement action gets distributed to the Cloudflare network and begins scanning incoming traffic.

Customers can also add a custom configuration depending on the file upload method, such as a base64 encoded file in a JSON string, which allows the specified file to be parsed and scanned automatically.

In the example below, the customer wants us to look at JSON bodies for the key “file” and scan them.

This rule is written using the wirefilter syntax.

Engine runs on traffic and scans the content

As soon as the feature is activated and configured, the scanning engine runs the pre-scanning logic, and identifies content automatically via heuristics. In this case, the engine logic does not rely on the Content-Type header, as it’s easy for attackers to manipulate. When relevant content or a file has been found, the engine connects to the antivirus (AV) scanner in our Zero Trust solution to perform a thorough analysis and return the results of the scan. The engine uses the scan results to propagate useful fields that customers can use.

Integrate with WAF

For every request where a file is found, the scanning engine returns various fields, including:

cf.waf.content_scan.has_malicious_obj,
cf.waf.content_scan.obj_sizes,
cf.waf.content_scan.obj_types, 
cf.waf.content_scan.obj_results

The scanning engine integrates with the WAF where customers can use those fields to create custom WAF rules to address various use cases. The basic use case is primarily blocking malicious files from reaching the web server. However, customers can construct more complex logic, such as enforcing constraints on parameters such as file sizes, file types, endpoints, or specific paths.

In-line scanning limitations and file types

One question that often comes up is about the file types we detect and scan in WAF Content Scanning. Initially, addressing this query posed a challenge since HTTP requests do not have a definition of a “file”, and scanning all incoming HTTP requests does not make sense as it adds extra processing and latency. So, we had to decide on a definition to spot HTTP requests that include files, or as we call it, “uploaded content”.

The WAF Content Scanning engine makes that decision by filtering out certain content types identified by heuristics. Any content types not included in a predefined list, such as text/html, text/x-shellscript, application/json, and text/xml, are considered uploaded content and are sent to the scanner for examination. This allows us to scan a wide range of content types and file types without affecting the performance of all requests by adding extra processing. The wide range of files we scan includes:

  • Executable (e.g., .exe, .bat, .dll, .wasm)
  • Documents (e.g., .doc, .docx, .pdf, .ppt, .xls)
  • Compressed (e.g., .7z, .gz, .zip, .rar)
  • Image (e.g., .jpg, .png, .gif, .webp, .tif)
  • Video and audio files within the 15 MB file size range.

The file size scanning limit of 15 Megabytes comes from the fact that the in-line file scanning as a feature is running in real time, which offers safety to the web server and instant access to clean files, but also impacts the whole request delivery process. Therefore, it’s crucial to scan the payload without causing significant delays or interruptions; namely increased CPU time and latency.

Scaling the scanning process to 15 MB

In the early design of the product, we built a system that could handle requests with a maximum body size of 1 MB, and increasing the limit to 15 MB had to happen without adding any extra latency. As mentioned, this latency is not added to all requests, but only to the requests that have uploaded content. However, increasing the size with the same design would have increased the latency by 15x for those requests.

In this section, we discuss how we previously managed scanning files embedded in JSON request bodies within the former architecture as an example, and why it was challenging to expand the file size using the same design, then compare the same example with the changes made in the new release to overcome the extra latency in details.

Old architecture used for the Early Access release

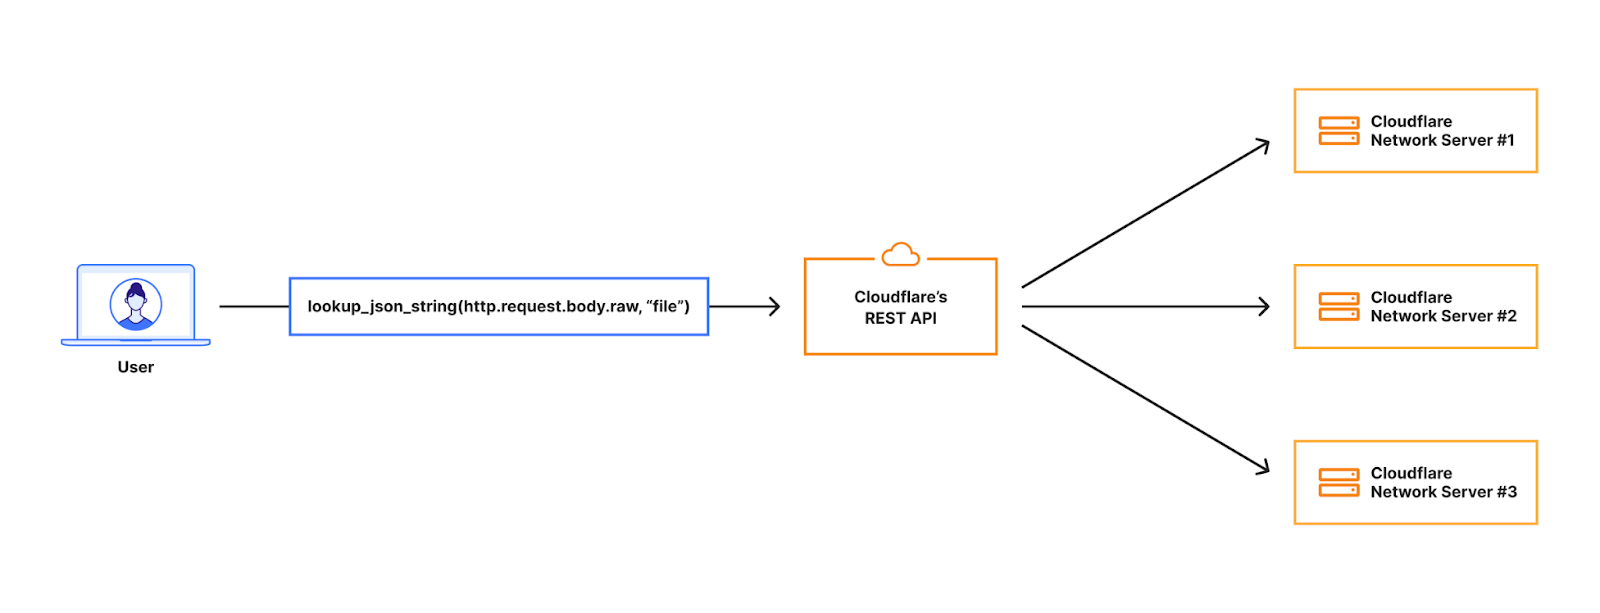
In order for customers to use the content scanning functionality in scanning files embedded in JSON request bodies, they had to configure a rule like:

lookup_json_string(http.request.body.raw, “file”)

This means we should look in the request body but only for the “file” key, which in the image below contains a base64 encoded string for an image.

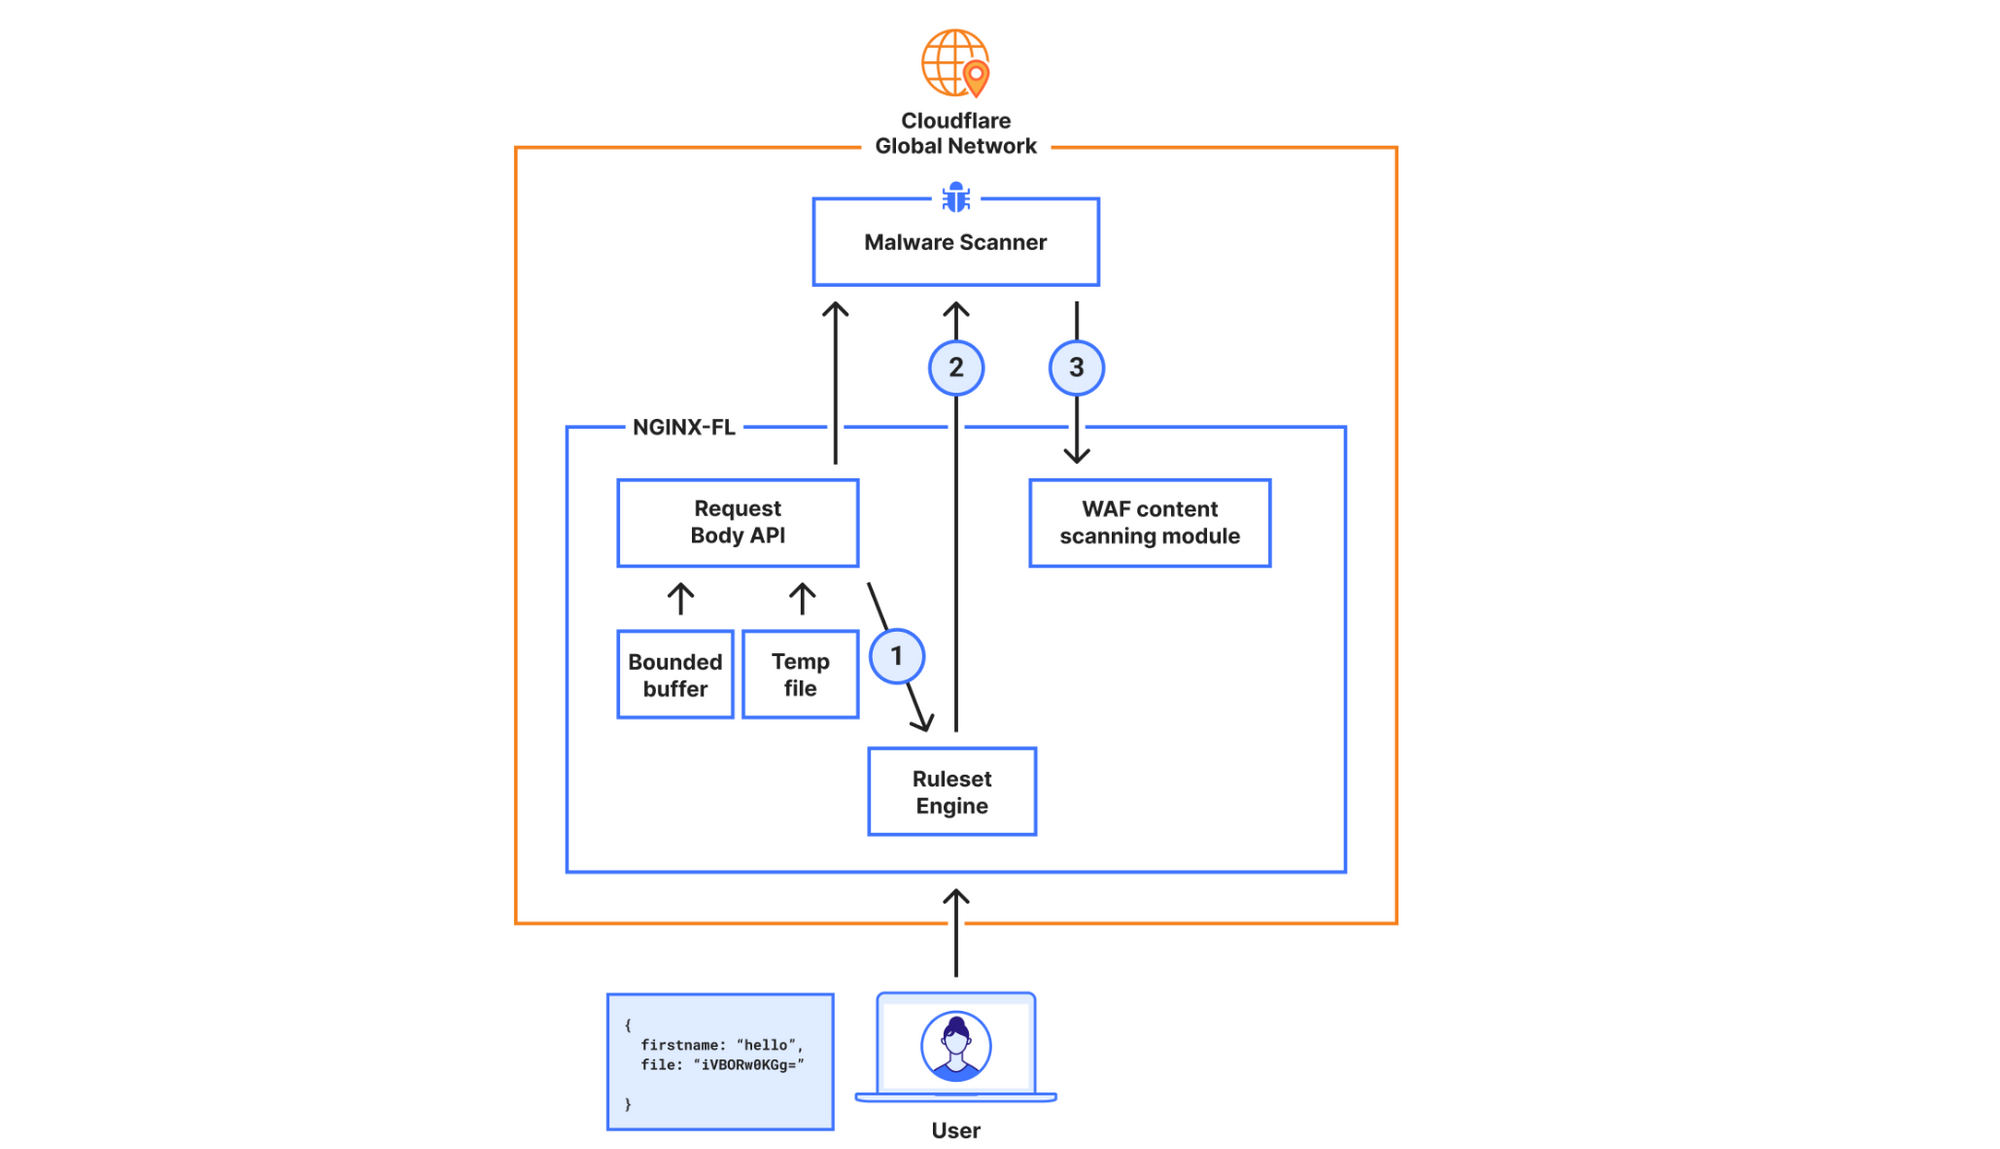
When the request hits our Front Line (FL) NGINX proxy, we buffer the request body. This will be in an in-memory buffer, or written to a temporary file if the size of the request body exceeds the NGINX configuration of client_body_buffer_size. Then, our WAF engine executes the lookup_json_string function and returns the base64 string which is the content of the file key. The base64 string gets sent via Unix Domain Sockets to our malware scanner, which does MIME type detection and returns a verdict to the file upload scanning module.

This architecture had a bottleneck that made it hard to expand on: the expensive latency fees we had to pay. The request body is first buffered in NGINX and then copied into our WAF engine, where rules are executed. The malware scanner will then receive the execution result — which, in the worst scenario, is the entire request body — over a Unix domain socket. This indicates that once NGINX buffers the request body, we send and buffer it in two other services.

New architecture for the General Availability release

In the new design, the requirements were to scan larger files (15x larger) while not compromising on performance. To achieve this, we decided to bypass our WAF engine, which is where we introduced the most latency.

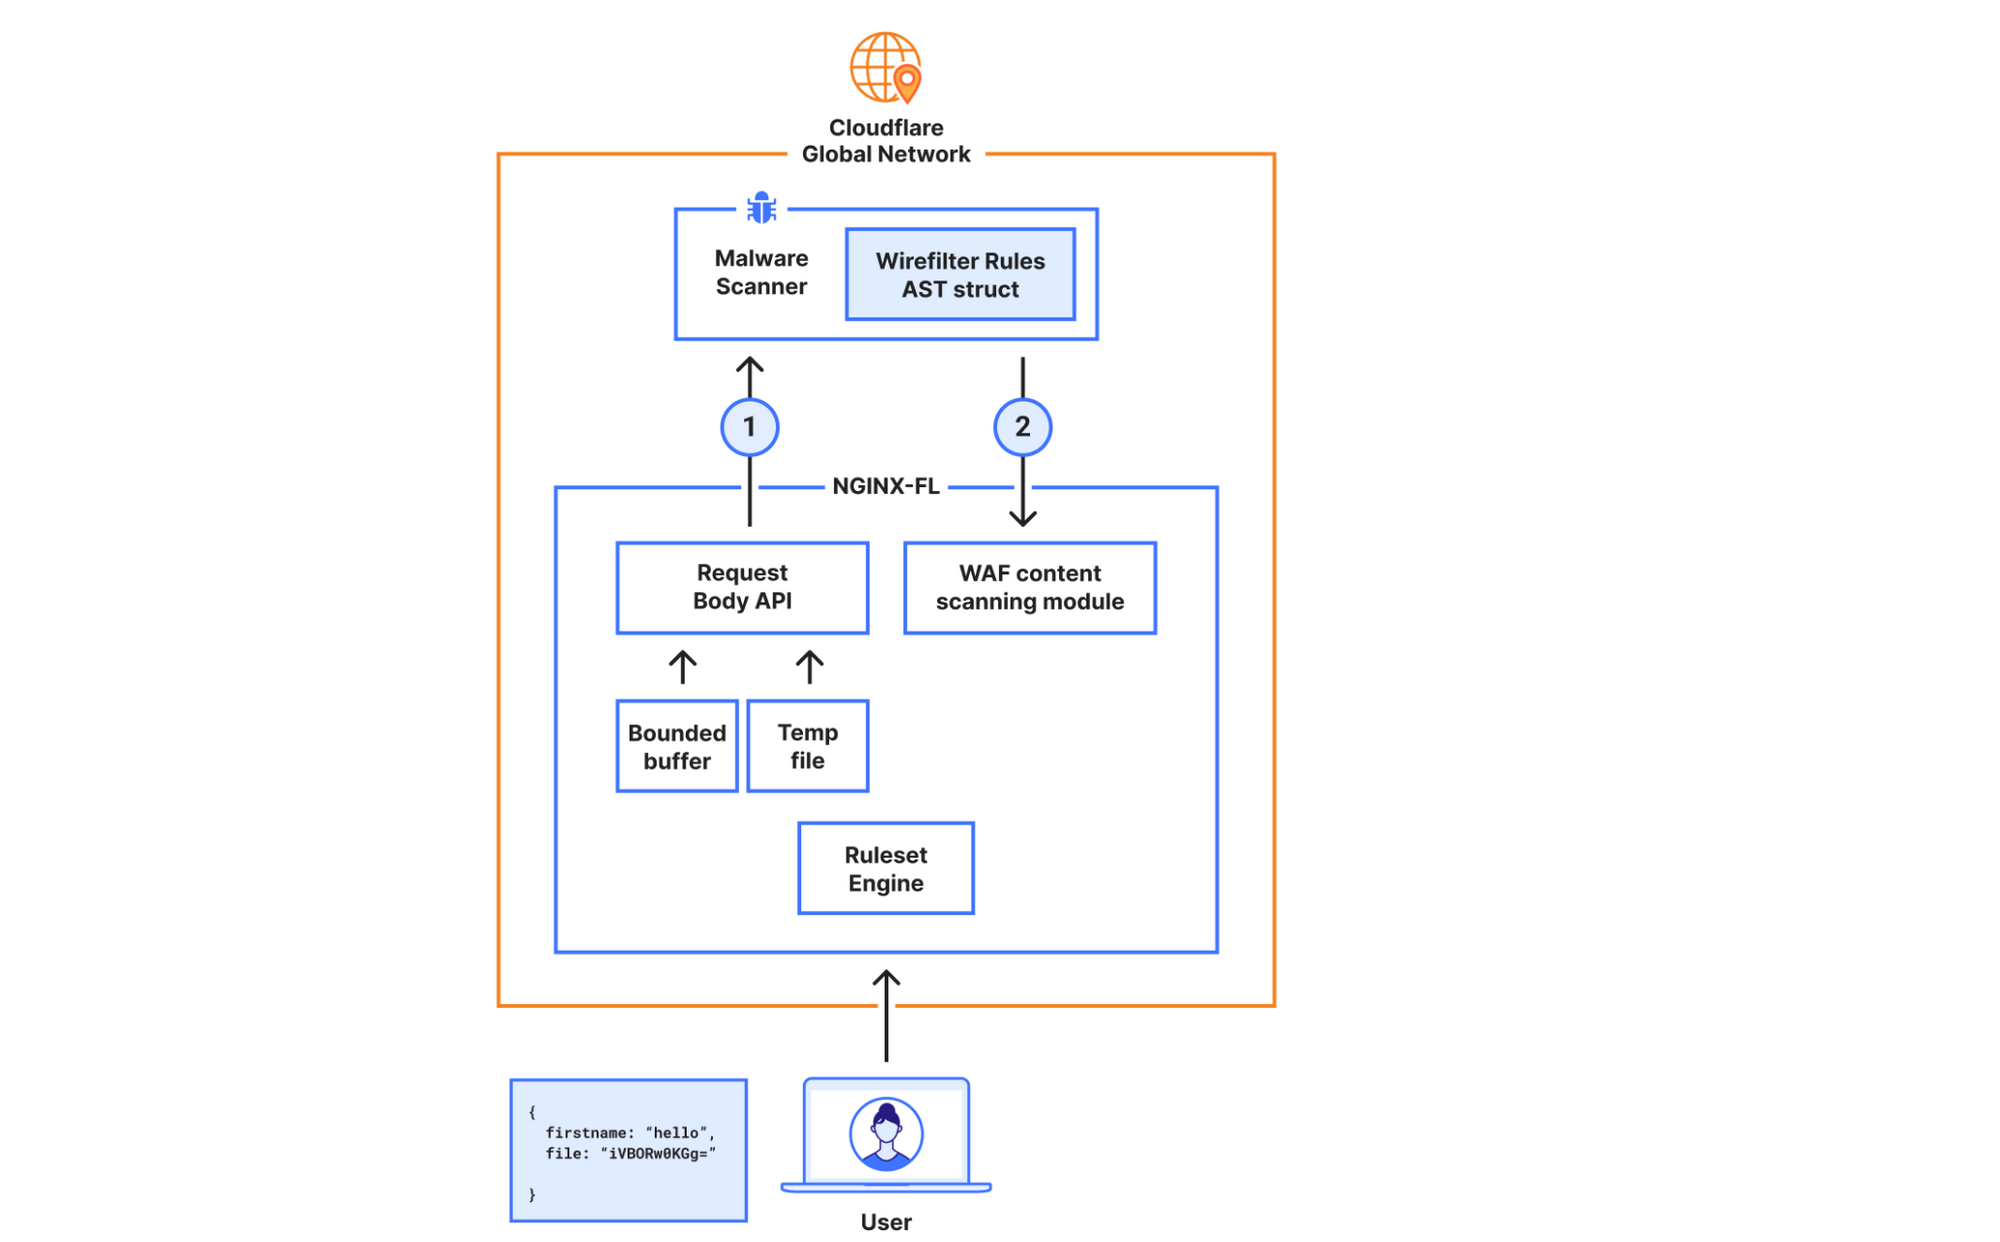
In the new architecture, we made the malware scanner aware of what is needed to execute the rule, hence bypassing the Ruleset Engine (RE). For example, the configuration “lookup_json_string(http.request.body.raw, “file”)”, will be represented roughly as:

{
   Function: lookup_json_string
   Args: [“file”]
}

This is achieved by walking the Abstract Syntax Tree (AST) when the rule is configured, and deploying the sample struct above to our global network. The struct’s values will be read by the malware scanner, and rule execution and malware detection will happen within the same service. This means we don’t need to read the request body, execute the rule in the Ruleset Engine (RE) module, and then send the results over to the malware scanner.

The malware scanner will now read the request body from the temporary file directly, perform the rule execution, and return the verdict to the file upload scanning module.

The file upload scanning module populates these fields, so they can be used to write custom rules and take actions. For example:

all(cf.waf.content_scan.obj_results[*] == "clean")

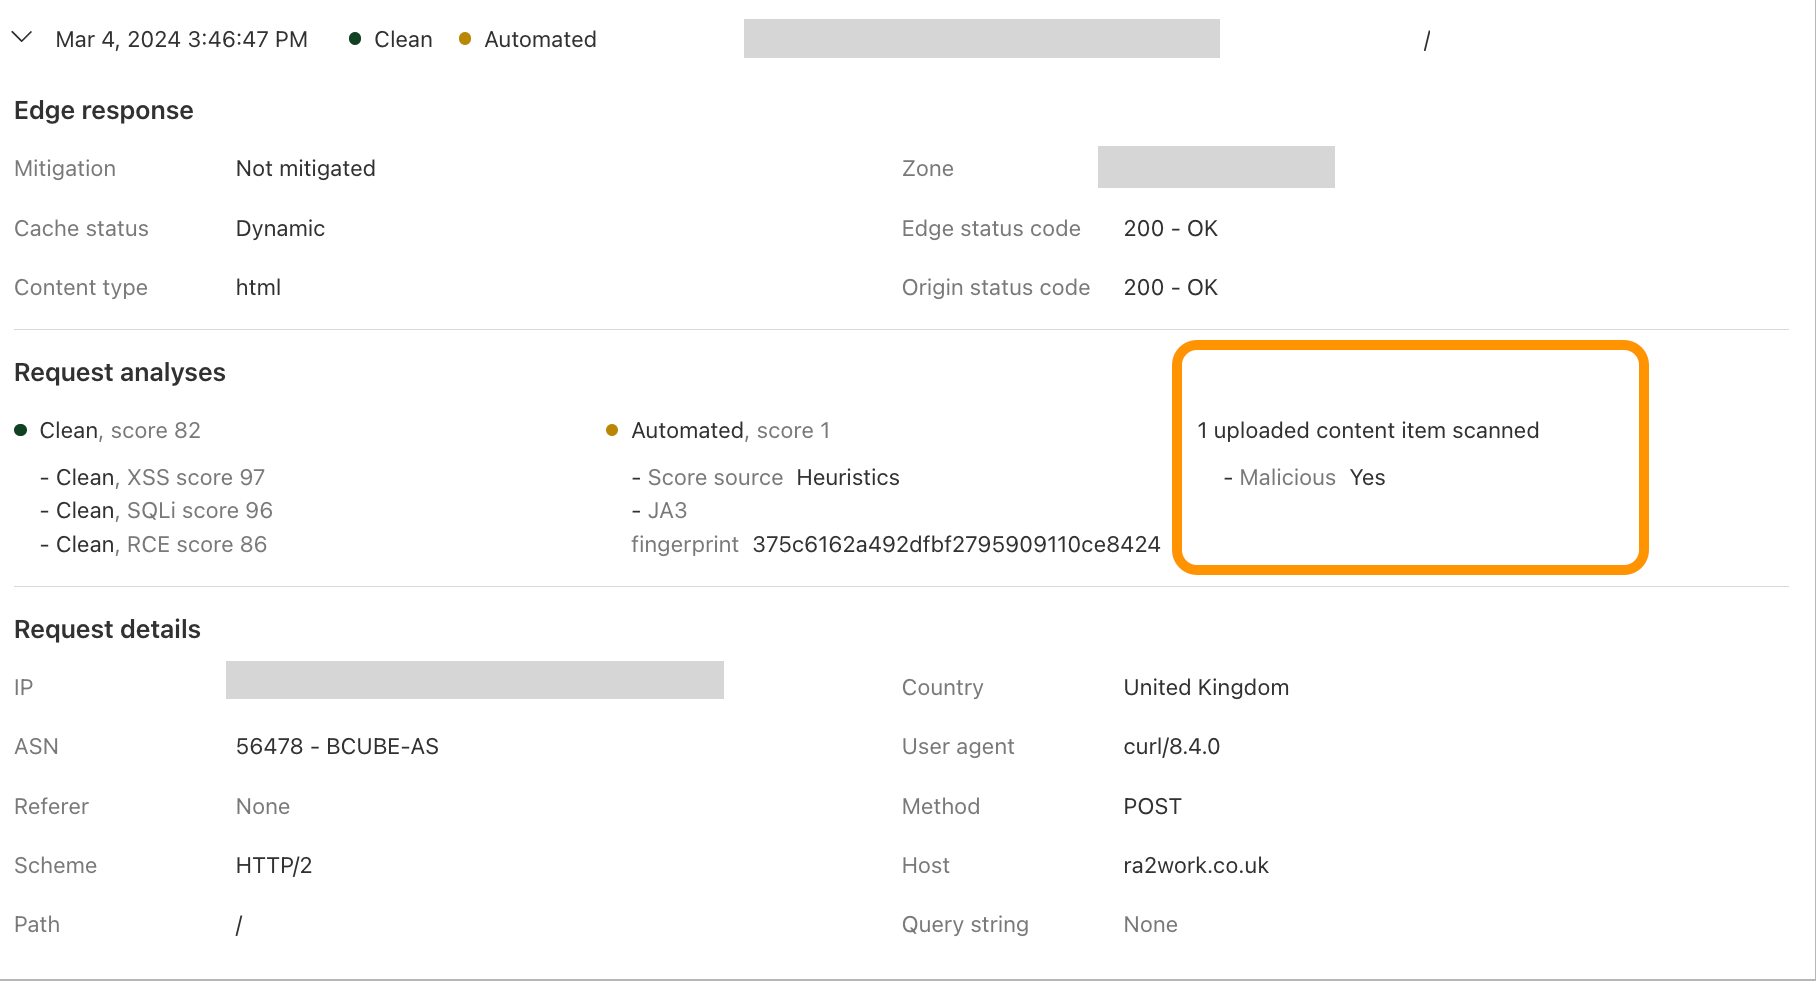
This module also enriches our logging pipelines with these fields, which can then be read in Log Push, Edge Log Delivery, Security Analytics, and Firewall Events in the dashboard. For example, this is the security log in the Cloudflare dashboard (Security → Analytics) for a web request that triggered WAF Content Scanning:

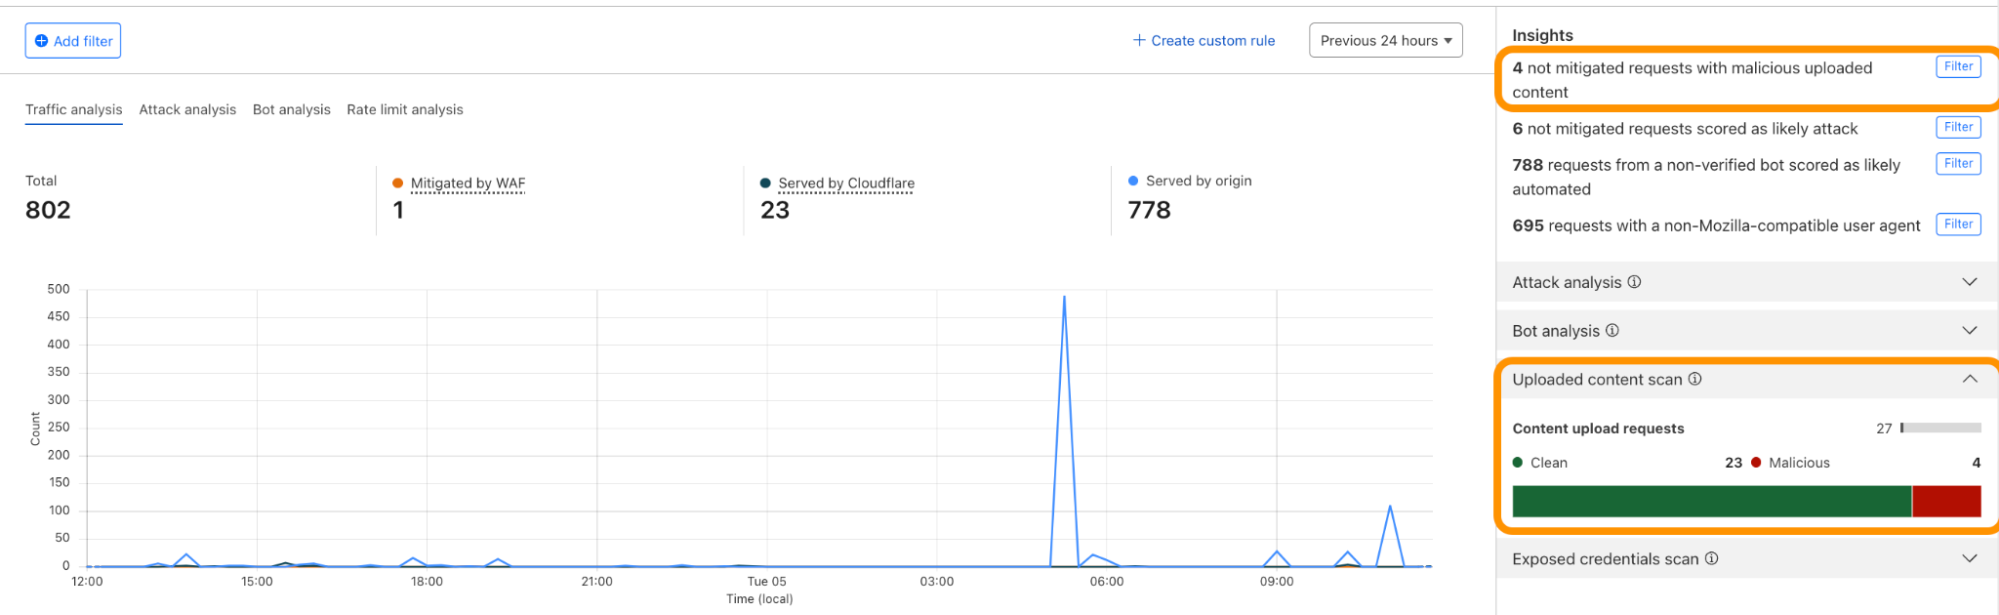
WAF content scanning detection visibility

Using the concept of incoming traffic detection, WAF Content Scanning enables users to identify hidden risks through their traffic signals in the analytics before blocking or mitigating matching requests. This reduces false positives and permits security teams to make decisions based on well-informed data. Actually, this isn’t the only instance in which we apply this idea, as we also do it for a number of other products, like WAF Attack Score and Bot Management.

We have integrated helpful information into our security products, like Security Analytics, to provide this data visibility. The Content Scanning tab, located on the right sidebar, displays traffic patterns even if there were no WAF rules in place. The same data is also reflected in the sampled requests, and you can create new rules from the same view.

On the other hand, if you want to fine-tune your security settings, you will see better visibility in Security Events, where these are the requests that match specific rules you have created in WAF.

Last but not least, in our Logpush datastream, we have included the scan fields that can be selected to send to any external log handler.

What’s next?

Before the end of March 2024, all current and new customers who have enabled WAF Content Scanning will be able to scan uploaded files up to 15 MB. Next, we’ll focus on improving how we handle files in the rules, including adding a dynamic header functionality. Quarantining files is also another important feature we will be adding in the future. If you’re an Enterprise customer, reach out to your account team for more information and to get access.

Collect all your cookies in one jar with Page Shield Cookie Monitor

Post Syndicated from Zhiyuan Zheng original https://blog.cloudflare.com/collect-all-your-cookies-in-one-jar


Cookies are small files of information that a web server generates and sends to a web browser. For example, a cookie stored in your browser will let a website know that you are already logged in, so instead of showing you a login page, you would be taken to your account page welcoming you back.

Though cookies are very useful, they are also used for tracking and advertising, sometimes with repercussions for user privacy. Cookies are a core tool, for example, for all advertising networks. To protect users, privacy laws may require website owners to clearly specify what cookies are being used and for what purposes, and, in many cases, to obtain a user’s consent before storing those cookies in the user’s browser. A key example of this is the ePrivacy Directive.

Herein lies the problem: often website administrators, developers, or compliance team members don’t know what cookies are being used by their website. A common approach for gaining a better understanding of cookie usage is to set up a scanner bot that crawls through each page, collecting cookies along the way. However, many websites requiring authentication or additional security measures do not allow for these scans, or require custom security settings to allow the scanner bot access.

To address these issues, we developed Page Shield Cookie Monitor, which provides a full single dashboard view of all first-party cookies being used by your websites. Over the next few weeks, we are rolling out Page Shield Cookie Monitor to all paid plans, no configuration or scanners required if Page Shield is enabled.

HTTP cookies

HTTP cookies are designed to allow persistence for the stateless HTTP protocol. A basic example of cookie usage is to identify a logged-in user. The browser submits the cookie back to the website whenever you access it again, letting the website know who you are, providing you a customized experience. Cookies are implemented as HTTP headers.

Cookies can be classified as first-party or third-party.

First-party cookies are normally set by the website owner1, and are used to track state against the given website. The logged in example above falls into this category. First party cookies are normally restricted and sent to the given website only and won’t be visible by other sites.

Third-party cookies, on the other hand, are often set by large advertising networks, social networks, or other large organizations that want to track user journeys across the web (across domains). For example, some websites load advertisement objects from a different domain that may set a third-party cookie associated with that advertising network.

Cookies are used for tracking

Growing concerns around user privacy has led browsers to start blocking third-party cookies by default. Led by Firefox and Safari a few years back, Google Chrome, which currently has the largest browser market share, and whose parent company owns Google Ads, the dominant advertising network, started restricting third-party cookies beginning in January of this year.

However, this does not mean the end of tracking users for advertising purposes; the technology has advanced allowing tracking to continue based on first-party cookies. Facebook Pixel, for example, started offering to set first-party cookies alongside third-party cookies in 2018 when being embedded in a website, in order “to be more accurate in measurement and reporting”.

Scanning for cookies?

To inventory all the cookies used when your website is accessed, you can open up any modern browser’s developer console and review which cookie is being set and sent back per HTTP request. However, collecting cookies with this approach won’t be practical unless your website is rather static, containing few external snippets.

Screen capture of Chrome’s developer console listing cookies being set and sent back when visiting a website.

To resolve this, a cookie scanner can be used to automate cookie collection. Depending on your security setup, additional configurations are sometimes required in order to let the scanner bots pass through protection and/or authentication. This may open up a potential attack surface, which isn’t ideal.

Introducing Page Shield Cookie Monitor

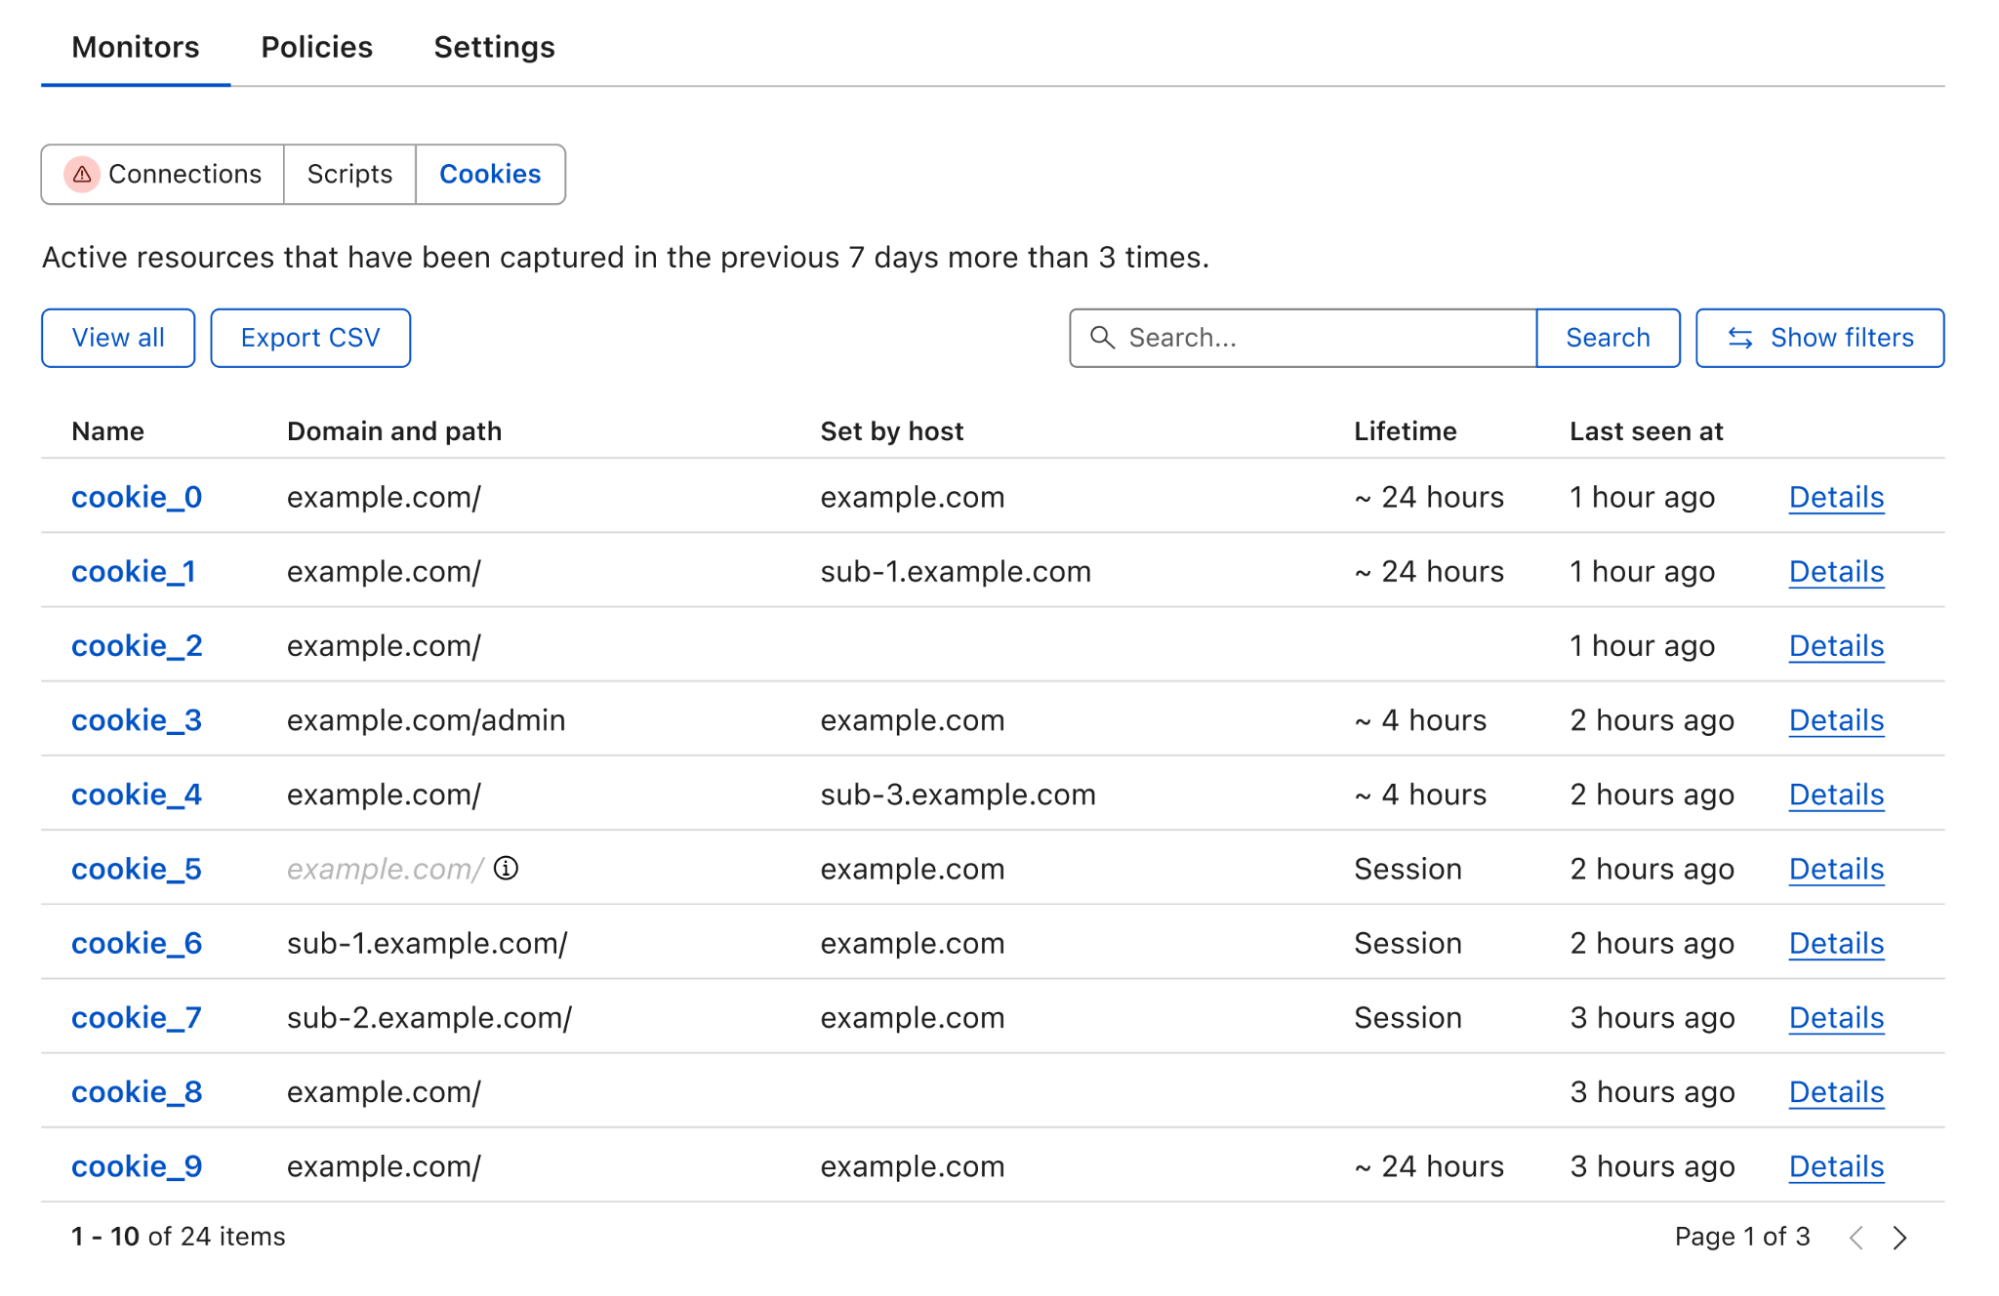
With Page Shield enabled, all the first-party cookies, whether set by your website or by external snippets, are collected and displayed in one place, no scanner required. With the click of a button, the full list can be exported in CSV format for further inventory processing.

If you run multiple websites like a marketing website and an admin console that require different cookie strategies, you can simply filter the list based on either domain or path, under the same view. This includes the websites that require authentication such as the admin console.

Dashboard showing a table of cookies seen, including key details such as cookie name, domain and path, and which host set the cookie.

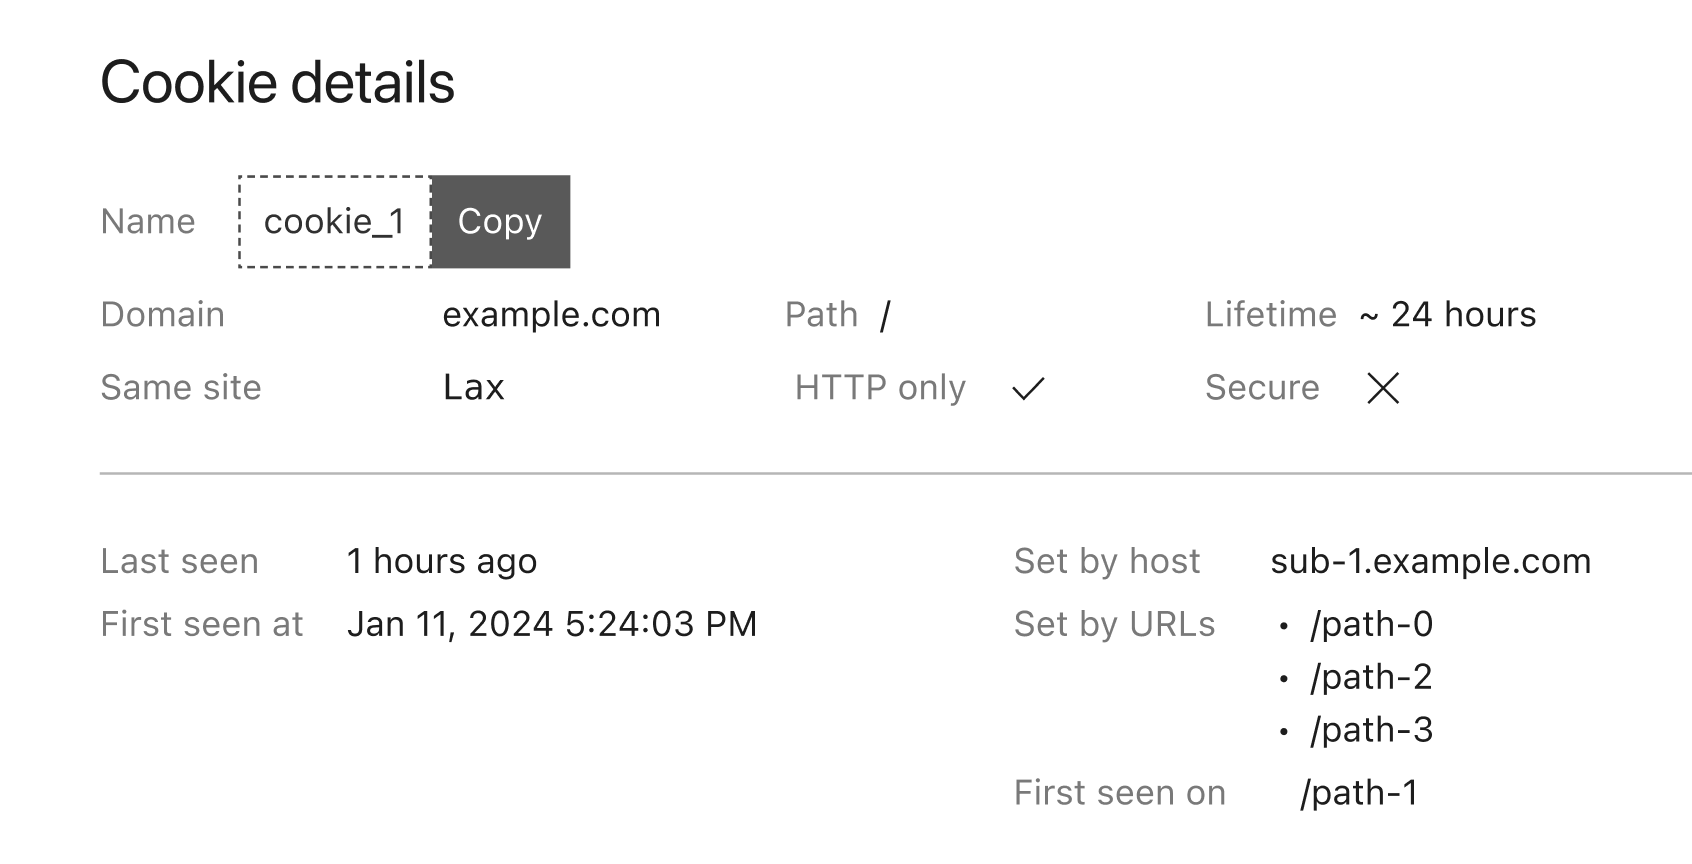
To examine a particular cookie, clicking on its name takes you to a dedicated page that includes all the cookie attributes. Furthermore, similar to Script Monitor and Connection Monitor, we collect the first seen and last seen time and pages for easier tracking of your website’s behavior.

Detailed view of a captured cookie in the dashboard, including all cookie attributes as well as under which host and path this cookie has been set.

Last but not least, we are adding one more alert type specifically for newly seen cookies. When subscribed to this alert, we will notify you through either email or webhook as soon as a new cookie is detected with all the details mentioned above. This allows you to trigger any workflow required, such as inventorying this new cookie for compliance.

How Cookie Monitor works

Let’s imagine you run an e-commerce website example.com. When a user logs in to view their ongoing orders, your website would send a header with key Set-Cookie, and value to identify each user’s login activity:

  • login_id=ABC123; Domain=.example.com

To analyze visitor behaviors, you make use of Google Analytics that requires embedding a code snippet in all web pages. This snippet will set two more cookies after the pages are loaded in the browser:

  • _ga=GA1.2; Domain=.example.com;
  • _ga_ABC=GS1.3; Domain=.example.com;

As these two cookies from Google Analytics are considered first-party given their domain attribute, they are automatically included together with the logged-in cookie sent back to your website. The final cookie sent back for a logged-in user would be Cookie: login_id=ABC123; _ga=GA1.2; _ga_ABC=GS1.3 with three cookies concatenated into one string, even though only one of them is directly consumed by your website.

If your website happens to be proxied through Cloudflare already, we will observe one Set-Cookie header with cookie name of login_id during response, while receiving three cookies back: login_id, _ga, and _ga_ABC. Comparing one cookie set with three returned cookies, the overlapping login_id cookie is then tagged as set by your website directly. The same principle applies to all the requests passing through Cloudflare, allowing us to build an overview of all the first-party cookies used by your websites.

All cookies in one jar

Inventorying all cookies set through using your websites is a first step towards protecting your users’ privacy, and Page Shield makes this step just one click away. Sign up now to be notified when Page Shield Cookie Monitor becomes available!

…

1Technically, a first-party cookie is a cookie scoped to the given domain only (so not cross domain). Such a cookie can also be set by a third party snippet used by the website to the given domain.

How Public AI Can Strengthen Democracy

Post Syndicated from Bruce Schneier original https://www.schneier.com/blog/archives/2024/03/how-public-ai-can-strengthen-democracy.html

With the world’s focus turning to misinformation,  manipulation, and outright propaganda ahead of the 2024 U.S. presidential election, we know that democracy has an AI problem. But we’re learning that AI has a democracy problem, too. Both challenges must be addressed for the sake of democratic governance and public protection.

Just three Big Tech firms (Microsoft, Google, and Amazon) control about two-thirds of the global market for the cloud computing resources used to train and deploy AI models. They have a lot of the AI talent, the capacity for large-scale innovation, and face few public regulations for their products and activities.

The increasingly centralized control of AI is an ominous sign for the co-evolution of democracy and technology. When tech billionaires and corporations steer AI, we get AI that tends to reflect the interests of tech billionaires and corporations, instead of the general public or ordinary consumers.

To benefit society as a whole we also need strong public AI as a counterbalance to corporate AI, as well as stronger democratic institutions to govern all of AI.

One model for doing this is an AI Public Option, meaning AI systems such as foundational large-language models designed to further the public interest. Like public roads and the federal postal system, a public AI option could guarantee universal access to this transformative technology and set an implicit standard that private services must surpass to compete.

Widely available public models and computing infrastructure would yield numerous benefits to the U.S. and to broader society. They would provide a mechanism for public input and oversight on the critical ethical questions facing AI development, such as whether and how to incorporate copyrighted works in model training, how to distribute access to private users when demand could outstrip cloud computing capacity, and how to license access for sensitive applications ranging from policing to medical use. This would serve as an open platform for innovation, on top of which researchers and small businesses—as well as mega-corporations—could build applications and experiment.

Versions of public AI, similar to what we propose here, are not unprecedented. Taiwan, a leader in global AI, has innovated in both the public development and governance of AI. The Taiwanese government has invested more than $7 million in developing their own large-language model aimed at countering AI models developed by mainland Chinese corporations. In seeking to make “AI development more democratic,” Taiwan’s Minister of Digital Affairs, Audrey Tang, has joined forces with the Collective Intelligence Project to introduce Alignment Assemblies that will allow public collaboration with corporations developing AI, like OpenAI and Anthropic. Ordinary citizens are asked to weigh in on AI-related issues through AI chatbots which, Tang argues, makes it so that “it’s not just a few engineers in the top labs deciding how it should behave but, rather, the people themselves.”

A variation of such an AI Public Option, administered by a transparent and accountable public agency, would offer greater guarantees about the availability, equitability, and sustainability of AI technology for all of society than would exclusively private AI development.

Training AI models is a complex business that requires significant technical expertise; large, well-coordinated teams; and significant trust to operate in the public interest with good faith. Popular though it may be to criticize Big Government, these are all criteria where the federal bureaucracy has a solid track record, sometimes superior to corporate America.

After all, some of the most technologically sophisticated projects in the world, be they orbiting astrophysical observatories, nuclear weapons, or particle colliders, are operated by U.S. federal agencies. While there have been high-profile setbacks and delays in many of these projects—the Webb space telescope cost billions of dollars and decades of time more than originally planned—private firms have these failures too. And, when dealing with high-stakes tech, these delays are not necessarily unexpected.

Given political will and proper financial investment by the federal government, public investment could sustain through technical challenges and false starts, circumstances that endemic short-termism might cause corporate efforts to redirect, falter, or even give up.

The Biden administration’s recent Executive Order on AI opened the door to create a federal AI development and deployment agency that would operate under political, rather than market, oversight. The Order calls for a National AI Research Resource pilot program to establish “computational, data, model, and training resources to be made available to the research community.”

While this is a good start, the U.S. should go further and establish a services agency rather than just a research resource. Much like the federal Centers for Medicare & Medicaid Services (CMS) administers public health insurance programs, so too could a federal agency dedicated to AI—a Centers for AI Services—provision and operate Public AI models. Such an agency can serve to democratize the AI field while also prioritizing the impact of such AI models on democracy—hitting two birds with one stone.

Like private AI firms, the scale of the effort, personnel, and funding needed for a public AI agency would be large—but still a drop in the bucket of the federal budget. OpenAI has fewer than 800 employees compared to CMS’s 6,700 employees and annual budget of more than $2 trillion. What’s needed is something in the middle, more on the scale of the National Institute of Standards and Technology, with its 3,400 staff, $1.65 billion annual budget in FY 2023, and extensive academic and industrial partnerships. This is a significant investment, but a rounding error on congressional appropriations like 2022’s $50 billion  CHIPS Act to bolster domestic semiconductor production, and a steal for the value it could produce. The investment in our future—and the future of democracy—is well worth it.

What services would such an agency, if established, actually provide? Its principal responsibility should be the innovation, development, and maintenance of foundational AI models—created under best practices, developed in coordination with academic and civil society leaders, and made available at a reasonable and reliable cost to all US consumers.

Foundation models are large-scale AI models on which a diverse array of tools and applications can be built. A single foundation model can transform and operate on diverse data inputs that may range from text in any language and on any subject; to images, audio, and video; to structured data like sensor measurements or financial records. They are generalists which can be fine-tuned to accomplish many specialized tasks. While there is endless opportunity for innovation in the design and training of these models, the essential techniques and architectures have been well established.

Federally funded foundation AI models would be provided as a public service, similar to a health care private option. They would not eliminate opportunities for private foundation models, but they would offer a baseline of price, quality, and ethical development practices that corporate players would have to match or exceed to compete.

And as with public option health care, the government need not do it all. It can contract with private providers to assemble the resources it needs to provide AI services. The U.S. could also subsidize and incentivize the behavior of key supply chain operators like semiconductor manufacturers, as we have already done with the CHIPS act, to help it provision the infrastructure it needs.

The government may offer some basic services on top of their foundation models directly to consumers: low hanging fruit like chatbot interfaces and image generators. But more specialized consumer-facing products like customized digital assistants, specialized-knowledge systems, and bespoke corporate solutions could remain the provenance of private firms.

The key piece of the ecosystem the government would dictate when creating an AI Public Option would be the design decisions involved in training and deploying AI foundation models. This is the area where transparency, political oversight, and public participation could affect more democratically-aligned outcomes than an unregulated private market.

Some of the key decisions involved in building AI foundation models are what data to use, how to provide pro-social feedback to “align” the model during training, and whose interests to prioritize when mitigating harms during deployment. Instead of ethically and legally questionable scraping of content from the web, or of users’ private data that they never knowingly consented for use by AI, public AI models can use public domain works, content licensed by the government, as well as data that citizens consent to be used for public model training.

Public AI models could be reinforced by labor compliance with U.S. employment laws and public sector employment best practices. In contrast, even well-intentioned corporate projects sometimes have committed labor exploitation and violations of public trust, like Kenyan gig workers giving endless feedback on the most disturbing inputs and outputs of AI models at profound personal cost.

And instead of relying on the promises of profit-seeking corporations to balance the risks and benefits of who AI serves, democratic processes and political oversight could regulate how these models function. It is likely impossible for AI systems to please everybody, but we can choose to have foundation AI models that follow our democratic principles and protect minority rights under majority rule.

Foundation models funded by public appropriations (at a scale modest for the federal government) would obviate the need for exploitation of consumer data and would be a bulwark against anti-competitive practices, making these public option services a tide to lift all boats: individuals’ and corporations’ alike. However, such an agency would be created among shifting political winds that, recent history has shown, are capable of alarming and unexpected gusts. If implemented, the administration of public AI can and must be different. Technologies essential to the fabric of daily life cannot be uprooted and replanted every four to eight years. And the power to build and serve public AI must be handed to democratic institutions that act in good faith to uphold constitutional principles.

Speedy and strong legal regulations might forestall the urgent need for development of public AI. But such comprehensive regulation does not appear to be forthcoming. Though several large tech companies have said they will take important steps to protect democracy in the lead up to the 2024 election, these pledges are voluntary and in places nonspecific. The U.S. federal government is little better as it has been slow to take steps toward corporate AI legislation and regulation (although a new bipartisan task force in the House of Representatives seems determined to make progress). On the state level, only four jurisdictions have successfully passed legislation that directly focuses on regulating AI-based misinformation in elections. While other states have proposed similar measures, it is clear that comprehensive regulation is, and will likely remain for the near future, far behind the pace of AI advancement. While we wait for federal and state government regulation to catch up, we need to simultaneously seek alternatives to corporate-controlled AI.

In the absence of a public option, consumers should look warily to two recent markets that have been consolidated by tech venture capital. In each case, after the victorious firms established their dominant positions, the result was exploitation of their userbases and debasement of their products. One is online search and social media, where the dominant rise of Facebook and Google atop a free-to-use, ad supported model demonstrated that, when you’re not paying, you are the product. The result has been a widespread erosion of online privacy and, for democracy, a corrosion of the information market on which the consent of the governed relies. The other is ridesharing, where a decade of VC-funded subsidies behind Uber and Lyft squeezed out the competition until they could raise prices.

The need for competent and faithful administration is not unique to AI, and it is not a problem we can look to AI to solve. Serious policymakers from both sides of the aisle should recognize the imperative for public-interested leaders not to abdicate control of the future of AI to corporate titans. We do not need to reinvent our democracy for AI, but we do need to renovate and reinvigorate it to offer an effective alternative to untrammeled corporate control that could erode our democracy.

Building a Serverless Streaming Pipeline to Deliver Reliable Messaging

Post Syndicated from Chris McPeek original https://aws.amazon.com/blogs/compute/building-a-serverless-streaming-pipeline-to-deliver-reliable-messaging/

This post is written by Jeff Harman, Senior Prototyping Architect, Vaibhav Shah, Senior Solutions Architect and Erik Olsen, Senior Technical Account Manager.

Many industries are required to provide audit trails for decision and transactional systems. AI assisted decision making requires monitoring the full inputs to the decision system in near real time to prevent fraud, detect model drift, and discrimination. Modern systems often use a much wider array of inputs for decision making, including images, unstructured text, historical values, and other large data elements. These large data elements pose a challenge to traditional audit systems that deal with relatively small text messages in structured formats. This blog shows the use of serverless technology to create a reliable, performant, traceable, and durable streaming pipeline for audit processing.

Overview

Consider the following four requirements to develop an architecture for audit record ingestion:

  1. Audit record size: Store and manage large payloads (256k – 6 MB in size) that may be heterogeneous, including text, binary data, and references to other storage systems.
  2. Audit traceability: The data stored has full traceability of the payload and external processes to monitor the process via subscription-based events.
  3. High Performance: The time required for blocking writes to the system is limited to the time it takes to transmit the audit record over the network.
  4. High data durability: Once the system sends a payload receipt, the payload is at very low risk of loss because of system failures.

The following diagram shows an architecture that meets these requirements and models the flow of the audit record through the system.

The primary source of latency is the time it takes for an audit record to be transmitted across the network. Applications sending audit records make an API call to an Amazon API Gateway endpoint. An AWS Lambda function receives the message and an Amazon ElastiCache for Redis cluster provides a low latency initial storage mechanism for the audit record. Once the data is stored in ElastiCache, the AWS Step Functions workflow then orchestrates the communication and persistence functions.

Subscribers receive four Amazon Simple Notification Service (Amazon SNS) notifications pertaining to arrival and storage of the audit record payload, storage of the audit record metadata, and audit record archive completion. Users can subscribe an Amazon Simple Queue Service (SQS) queue to the SNS topic and use fan out mechanisms to achieve high reliability.

  1. The Ingest Message Lambda function sends an initial receipt notification
  2. The Message Archive Handler Lambda function notifies on storage of the audit record from ElastiCache to Amazon Simple Storage Service (Amazon S3)
  3. The Message Metadata Handler Lambda function notifies on storage of the message metadata into Amazon DynamoDB
  4. The Final State Aggregation Lambda function notifies that the audit record has been archived.

Any failure by the three fundamental processing steps: Ingestion, Data Archive, and Metadata Archive triggers a message in an SQS Dead Letter Queue (DLQ) which contains the original request and an explanation of the failure reason. Any failure in the Ingest Message function invokes the Ingest Message Failure function, which stores the original parameters to the S3 Failed Message Storage bucket for later analysis.

The Step Functions workflow provides orchestration and parallel path execution for the system. The detailed workflow below shows the execution flow and notification actions. The transformer steps convert the internal data structures into the format required for consumers.

Data structures

There are types three events and messages managed by this system:

  1. Incoming message: This is the message the producer sends to an API Gateway endpoint.
  2. Internal message: This event contains the message metadata allowing subsequent systems to understand the originating message producer context.
  3. Notification message: Messages that allow downstream subscribers to act based on the message.

Solution walkthrough

The message producer calls the API Gateway endpoint, which enforces the security requirements defined by the business. In this implementation, API Gateway uses an API key for providing more robust security. API Gateway also creates a security header for consumption by the Ingest Message Lambda function. API Gateway can be configured to enforce message format standards, see Use request validation in API Gateway for more information.

The Ingest Message Lambda function generates a message ID that tracks the message payload throughout its lifecycle. Then it stores the full message in the ElastiCache for Redis cache. The Ingest Message Lambda function generates an internal message with all the elements necessary as described above. Finally, the Lambda function handler code starts the Step Functions workflow with the internal message payload.

If the Ingest Message Lambda function fails for any reason, the Lambda function invokes the Ingestion Failure Handler Lambda function. This Lambda function writes any recoverable incoming message data to an S3 bucket and sends a notification on the Ingest Message dead letter queue.

The Step Functions workflow then runs three processes in parallel.

  • The Step Functions workflow triggers the Message Archive Data Handler Lambda function to persist message data from the ElastiCache cache to an S3 bucket. Once stored, the Lambda function returns the S3 bucket reference and state information. There are two options to remove the internal message from the cache. Remove the message from cache immediately before sending the internal message and updating the ElastiCache cache flag or wait for the ElastiCache lifecycle to remove a stale message from cache. This solution waits for the ElastiCache lifecycle to remove the message.
  • The workflow triggers the Message Metadata Handler Lambda function to write all message metadata and security information to DynamoDB. The Lambda function replies with the DynamoDB reference information.
  • Finally, the Step Functions workflow sends a message to the SNS topic to inform subscribers that the message has arrived and the data persistence processes have started.

After each of the Lambda functions’ processes complete, the Lambda function sends a notification to the SNS notification topic to alert subscribers that each action is complete. When both Message Metadata and Message Archive Lambda functions are done, the Final Aggregation function makes a final update to the metadata in DynamoDB to include S3 reference information and to remove the ElastiCache Redis reference.

Deploying the solution

Prerequisites:

  1. AWS Serverless Application Model (AWS SAM) is installed (see Getting started with AWS SAM)
  2. AWS User/Credentials with appropriate permissions to run AWS CloudFormation templates in the target AWS account
  3. Python 3.8 – 3.10
  4. The AWS SDK for Python (Boto3) is installed
  5. The requests python library is installed

The source code for this implementation can be found at  https://github.com/aws-samples/blog-serverless-reliable-messaging

Installing the Solution:

  1. Clone the git repository to a local directory
  2. git clone https://github.com/aws-samples/blog-serverless-reliable-messaging.git
  3. Change into the directory that was created by the clone operation, usually blog_serverless_reliable_messaging
  4. Execute the command: sam build
  5. Execute the command: sam deploy –-guided. You are asked to supply the following parameters:
    1. Stack Name: Name given to this deployment (example: serverless-streaming)
    2. AWS Region: Where to deploy (example: us-east-1)
    3. ElasticacheInstanceClass: EC2 cache instance type to use with (example: cache.t3.small)
    4. ElasticReplicaCount: How many replicas should be used with ElastiCache (recommended minimum: 2)
    5. ProjectName: Used for naming resources in account (example: serverless-streaming)
    6. MultiAZ: True/False if multiple Availability Zones should be used (recommend: True)
    7. The default parameters can be selected for the remainder of questions

Testing:

Once you have deployed the stack, you can test it through the API gateway endpoint with the API key that is referenced in the deployment output. There are two methods for retrieving the API key either via the AWS console (from the link provided in the output – ApiKeyConsole) or via the AWS CLI (from the AWS CLI reference in the output – APIKeyCLI).

You can test directly in the Lambda service console by invoking the ingest message function.

A test message is available at the root of the project test_message.json for direct Lambda function testing of the Ingest function.

  1. In the console navigate to the Lambda service
  2. From the list of available functions, select the “<project name> -IngestMessageFunction-xxxxx” function
  3. Under the “Function overview” select the “Test” tab
  4. Enter an event name of your choosing
  5. Copy and paste the contents of test_message.json into the “Event JSON” box
  6. Click “Save” then after it has saved, click the “Test”
  7. If successful, you should see something similar to the below in the details:
    {
    "isBase64Encoded": false,
    "statusCode": 200,
    "headers": {
    "Access-Control-Allow-Headers": "Content-Type",
    "Access-Control-Allow-Origin": "*",
    "Access-Control-Allow-Methods": "OPTIONS,POST"
    },
    "body": "{\"messageID\": \"XXXXXXXXXXXXXX\"}"
    }
  8. In the S3 bucket “<project name>-s3messagearchive-xxxxxx“, find the payload of the original json with a key based on the date and time of the script execution, e.g.: YEAR/MONTH/DAY/HOUR/MINUTE with a file name of the messageID
  9. In a DynamoDB table named metaDataTable, you should find a record with a messageID equal to the messageID from above that contains all of the metadata related to the payload

A python script is included with the code in the test_client folder

  1. Replace the <Your API key key here> and the <Your API Gateway URL here (IngestMessageApi)> values with the correct ones for your environment in the test_client.py file
  2. Execute the test script with Python 3.8 or higher with the requests package installed
    Example execution (from main directory of git clone):
    python3 -m pip install -r ./test_client/requirements.txt
    python3 ./test_client/test_client.py
  3. Successful output shows the messageID and the header JSON payload:
    {
    "messageID": " XXXXXXXXXXXXXX"
    }
  4. In the S3 bucket “<project name>-s3messagearchive-xxxxxx“, you should be able to find the payload of the original json with a key based on the date and time of the script execution, e.g.: YEAR/MONTH/DAY/HOUR/MINUTE with a file name of the messageID
  5. In a DynamoDB table named metaDataTable, you should find a record with a messageID equal to the messageID from above that contains all of the meta data related to the payload

Conclusion

This blog describes architectural patterns, messaging patterns, and data structures that support a highly reliable messaging system for large messages. The use of serverless services including Lambda functions, Step Functions, ElastiCache, DynamoDB, and S3 meet the requirements of modern audit systems to be scalable and reliable. The architecture shared in this blog post is suitable for a highly regulated environment to store and track messages that are larger than typical logging systems, records sized between 256k and 6MB. The architecture serves as a blueprint that can be extended and adapted to fit further serverless use cases.

For serverless learning resources, visit Serverless Land.

[$] MySQL and MariaDB changes coming in Fedora 40

Post Syndicated from jzb original https://lwn.net/Articles/960630/

The Fedora Project switched
to MariaDB
as the default implementation of MySQL in Fedora 19 in 2013. Once a drop-in
replacement for MySQL, MariaDB has diverged enough that this is no longer
the case—and, despite concerns about Oracle
and optimism that MariaDB would supplant MySQL, the reality is that MySQL
and MariaDB seem to be here to stay. With that in mind, Fedora developer
Michal Schorm
proposed that the project revise the way MySQL and MariaDB
are packaged in Fedora starting with Fedora 40.

Adding systemd to postmarketOS

Post Syndicated from jzb original https://lwn.net/Articles/964574/

The postmarketOS project, which produces
a Linux distribution for phones and mobile devices,
has announced
that it is in the early stages of adding systemd to make it easier to support GNOME and KDE.

Users who prefer the OpenRC
init system are assured they will still have that option when building their own
images “as long as OpenRC is in Alpine Linux (on which postmarketOS is
based)
“:

As with text editors, some people are really passionate about their favorite init
systems. When discussing this announcement, please keep a friendly tone. Remember
that we all share the love for free and open source software, and that our
communities work best if we focus on shared values instead of fighting over what
implementations to use.

Proof-of-concept images
are available now for a limited set of devices. Users are warned these images are “buggy,
unreliable, and NOT suitable for use on a device you rely on
“. Those interested
in helping with testing and development are encouraged to follow along and report
bugs on the systemd
issue at GitLab
.

Amazon RDS now supports io2 Block Express volumes for mission-critical database workloads

Post Syndicated from Abhishek Gupta original https://aws.amazon.com/blogs/aws/amazon-rds-now-supports-io2-block-express-volumes-for-mission-critical-database-workloads/

Today, I am pleased to announce the availability of Provisioned IOPS (PIOPS) io2 Block Express storage volumes for all database engines in Amazon Relational Database Service (Amazon RDS). Amazon RDS provides you the flexibility to choose between different storage types depending on the performance requirements of your database workload. io2 Block Express volumes are designed for critical database workloads that require high performance and high throughput at low latency.

Lower latency and higher availability for I/O intensive workloads
With io2 Block Express volumes, your database workloads will benefit from consistent sub-millisecond latency, enhanced durability to 99.999 percent over io1 volumes, and drive 20x more IOPS from provisioned storage (up to 1,000 IOPS per GB) at the same price as io1. You can upgrade from io1 volumes to io2 Block Express volumes without any downtime, significantly improving the performance and reliability of your applications without increasing storage cost.

“We migrated all of our primary Amazon RDS instances to io2 Block Express within 2 weeks,” said Samir Goel, Director of Engineering at Figma, a leading platform for teams that design and build digital products. “Io2 Block Express has had a profound impact on the availability of the database layer at Figma. We have deeply appreciated the consistency of performance with io2 Block Express — in our observations, the latency variability has been under 0.1ms.”

io2 Block Express volumes support up to 64 TiB of storage, up to 256,000 Provisioned IOPS, and a maximum throughput of 4,000 MiB/s. The throughput of io2 Block Express volumes varies based on the amount of provisioned IOPS and volume storage size. Here is the range for each database engine and storage size:

Database engine Storage size Provisioned IOPS Maximum throughput
Db2, MariaDB, MySQL, and PostgreSQL Between 100 and 65,536 GiB 1,000–256,000 IOPS 4,000 MiB/s
Oracle Between 100 and 199 GiB 1,000–199,000 IOPS 4,000 MiB/s
Oracle Between 200 and 65,536 GiB 1,000–256,000 IOPS 4,000 MiB/s
SQL Server Between 20 and 16,384 GiB 1,000–64,000 IOPS 4,000 MiB/s

Getting started with io2 Block Express in Amazon RDS
You can use the Amazon RDS console to create a new RDS instance configured with an io2 Block Express volume or modify an existing instance with io1, gp2, or gp3 volumes.

Here’s how you would create an Amazon RDS for PostgreSQL instance with io2 Block Express volume.

Start with the basic information such as engine and version. Then, choose Provisioned IOPS SDD (io2) from the Storage type options:

Use the following AWS CLI command to create a new RDS instance with io2 Block Express volume:

aws rds create-db-instance --storage-type io2 --db-instance-identifier new-db-instance --db-instance-class db.t4g.large --engine mysql --master-username masteruser --master-user-password <enter password> --allocated-storage 400 --iops 3000

Similarly, to modify an existing RDS instance to use io2 Block Express volume:

aws rds modify-db-instance --db-instance-identifier existing-db-instance --storage-type io2 --allocated-storage 500 --iops 3000 --apply-immediately

Things to know

  • io2 Block Express volumes are available on all RDS databases using AWS Nitro System instances.
  • io2 Block Express volumes support an IOPS to allocated storage ratio of 1000:1. As an example, With an RDS for PostgreSQL instance, the maximum IOPS can be provisioned with volumes 256 GiB and larger (1,000 IOPS × 256 GiB = 256,000 IOPS).
  • For DB instances not based on the AWS Nitro System, the ratio of IOPS to allocated storage is 500:1. In this case, maximum IOPS can be achieved with 512 GiB volume (500 IOPS x 512 GiB = 256,000 IOPS).

Available now
Amazon RDS io2 Block Express storage volumes are supported for all RDS database engines and are available in US East (Ohio, N. Virginia), US West (N. California, Oregon), Asia Pacific (Hong Kong, Mumbai, Osaka, Seoul, Singapore, Sydney, Tokyo), Canada (Central), Europe (Frankfurt, Ireland, London, Stockholm), and Middle East (Bahrain) Regions.

In terms of pricing and billing, io1 volumes and io2 Block Express storage volumes are billed at the same rate. For more information, see the Amazon RDS pricing page.

Learn more by reading about Provisioned IOPS SSD storage in the Amazon RDS User Guide.

— Abhishek

Introducing the newest Heroes of the year – March 2024

Post Syndicated from Taylor Jacobsen original https://aws.amazon.com/blogs/aws/introducing-the-newest-heroes-of-the-year-march-2024/

AWS Heroes are inspirational thought leaders who go above and beyond to knowledge share in a variety of ways. You can find them speaking at local meetups, AWS Community Days, or even at re:Invent. And these technical experts are never done learning—they’re passionate about solving problems and creating content to enable the community to build faster on AWS. We’re excited to announce the first cohort of Heroes in 2024…

Let’s give a round of applause to our new Heroes!

Awedis Keofteian – Beirut, Lebanon

Community Hero Awedis Keofteian is a DevOps Engineer at Anghami. He has a strong background in DevOps practices, and he leverages modern technologies to enhance scalability, reliability, and efficiency in Anghami’s cloud-based architecture. His journey began as an AWS Community Builder, and over time, he took the helm as the leader of the AWS User Group in Beirut. Awedis is passionate about nurturing and supporting the growth of AWS communities, and shares his knowledge across DevOps, automation, serverless, and cloud technologies.

Daniel Aniszkiewicz – Wrocław, Poland

Security Hero Daniel Aniszkiewicz is a Senior Software Engineer at Algoteque International Hub. He co-organizes the Wrocław AWS User Group, and is passionate about contributing to the growth and engagement of the local AWS community. Daniel is also a seasoned speaker and loves to share his knowledge with others, such as presenting at re:Invent, AWS meetups, and AWS Community Days. He is particularly focused on promoting Amazon Verified Permissions and Cedar through workshops, blog posts, IaC templates, and open source projects.

Hazel Sáenz – Guatemala

Serverless Hero Hazel Sáenz is a Software Architect at Cognits. Her primary focus is modernizing on-premises applications to cloud environments using AWS, and predominantly designs high workload architectures in serverless frameworks. Hazel enjoys sharing her knowledge with the community through technical talks at local and international events, participating in AWS Summits, AWS Community Days, and meetups, as well as writing technical articles in both English and Spanish. Additionally, she is the leader of the AWS User Group Guatemala, where she excels at organizing inclusive events and sharing her knowledge with the community.

Kenta Goto – Tokyo, Japan

DevTools Hero Kenta Goto is a Backend Tech Lead and an enthusiastic contributor to AWS CDK. He has been selected as a top contributor and a trusted reviewer in AWS CDK, and serves as a maintainer for the community-driven CDK Construct Library. Kenta is also a conference speaker, having presented at the AWS Dev Day in Japan in 2022 and 2023. Furthermore, he actively contributes to the open source community by developing and publishing his self-made AWS tools and AWS CDK Construct libraries, which are used worldwide.

Martin Damovsky – Prague, Czech Republic

Community Hero Martin Damovsky is a Cloud Governance Lead at Ataccama.com, an AWS Partner providing Unified Data Management Solutions. He has been particularly interested in AWS Control Tower Account Factory for Terraform, Cloud Intelligence Dashboard, and security and govern tools, such as AWS Security Hub, Amazon GuardDuty, and AWS Config. Martin is a leader for AWS User Group Prague, and he enjoys sharing his knowledge with the greater AWS community through his blog and speaking at meetups, podcasts, and conferences.

Rafał Mituła – Warsaw, Poland

Community Hero Rafał Mituła is a Cloud Data Engineer and Architect within the Data & AI division at Chaos Gears. He is actively involved in the AWS community, co-organizing the AWS User Group Warsaw meetups and the AWS Community Day Poland conference. In addition to his technical and organizational roles, Rafał shares his expertise by speaking at conferences and leading workshops aimed at introducing new builders to AWS and data analytics, such as the AWS Data Engineering Immersion Days.

Sena Yakut – Izmir, Turkey

Security Hero Sena Yakut is a Senior Cloud Security Engineer at Lyrebird Studio. She has a master’s degree in cloud security, and builds security requirements for architectural designs, providing threat management and security concepts and services using AWS. Sena shares her knowledge through blog posts across various platforms, and engaging in discussions about cloud security at events, such as AWS Community Day Türkiye, and DevOpsDays Istanbul. As an active blogger and speaker, she enjoys learning new security features on AWS and informing others about them.

Tiago Rodrigues – Lisbon, Portugal

Community Hero Tiago Rodrigues is a Senior Cloud Consultant at tecRacer.com, an AWS Premier Partner and AWS Advanced Training Partner. He specializes in migrations from on-premises environments to the cloud, as well as modernizing architectures and implementing serverless solutions. Beyond his role, Tiago is deeply committed to knowledge sharing and actively contributes to the AWS community through engagements, such as the AWS User Group Lisbon, educational workshops, and guest lectures at universities. He is passionate about education and innovation, and developed an open source mobile app, AWSary, which is an AWS dictionary designed to provide solution architect diagram drawings and quick insights into AWS services.

Learn More

Please visit the AWS Heroes website if you’d like to learn more about the AWS Heroes program or to connect with a Hero near you.

— Taylor

[$] Not so quickly extending QUIC

Post Syndicated from daroc original https://lwn.net/Articles/964377/


QUIC
is a UDP-based transport protocol that forms the foundation of
HTTP/3.
It was initially developed at Google in 2012, and became an
IETF standard in
2021. Work on the protocol did not stop with its standardization, however. The
QUIC working group
published several follow-up standards. Now, it is working on
four more extensions to QUIC intended to patch over various shortcomings in the
current protocol — although progress has not been quick.

How GitHub uses merge queue to ship hundreds of changes every day

Post Syndicated from Will Smythe original https://github.blog/2024-03-06-how-github-uses-merge-queue-to-ship-hundreds-of-changes-every-day/


At GitHub, we use merge queue to merge hundreds of pull requests every day. Developing this feature and rolling it out internally did not happen overnight, but the journey was worth it—both because of how it has transformed the way we deploy changes to production at scale, but also how it has helped improve the velocity of customers too. Let’s take a look at how this feature was developed and how you can use it, too.

Merge queue is generally available and is also now available on GitHub Enterprise Server! Find out more.

Why we needed merge queue

In 2020, engineers from across GitHub came together with a goal: improve the process for deploying and merging pull requests across the GitHub service, and specifically within our largest monorepo. This process was becoming overly complex to manage, required special GitHub-only logic in the codebase, and required developers to learn external tools, which meant the engineers developing for GitHub weren’t actually using GitHub in the same way as our customers.

To understand how we got to this point in 2020, it’s important to look even further back.

By 2016, nearly 1,000 pull requests were merging into our large monorepo every month. GitHub was growing both in the number of services deployed and in the number of changes shipping to those services. And because we deploy changes prior to merging them, we needed a more efficient way to group and deploy multiple pull requests at the same time. Our solution at this time was trains. A train was a special pull request that grouped together multiple pull requests (passengers) that would be tested, deployed, and eventually merged at the same time. A user (called a conductor) was responsible for handling most aspects of the process, such as starting a deployment of the train and handling conflicts that arose. Pipelines were added to help manage the rollout path. Both these systems (trains and pipelines) were only used on our largest monorepo and were implemented in our internal deployment system.

Trains helped improve velocity at first, but over time started to negatively impact developer satisfaction and increase the time to land a pull request. Our internal Developer Experience (DX) team regularly polls our developers to learn about pain points to help inform where to invest in improvements. These surveys consistently rated deployment as the most painful part of the developer’s daily experience, highlighting the complexity and friction involved with building and shepherding trains in particular. This qualitative data was backed by our quantitative metrics. These showed a steady increase in the time it took from pull request to shipped code.

Trains could also grow large, containing the changes of 15 pull requests. Large trains frequently “derailed” due to a deployment issue, conflicts, or the need for an engineer to remove their change. On painful occasions, developers could wait 8+ hours after joining a train for it to ship, only for it to be removed due to a conflict between two pull requests in the train.

Trains were also not used on every repository, meaning the developer experience varied significantly between different services. This led to confusion when engineers moved between services or contributed to services they didn’t own, which is fairly frequent due to our inner source model.

In short, our process was significantly impacting the productivity of our engineering teams—both in our large monorepo and service repositories.

Building a better solution for us and eventually for customers

By 2020, it was clear that our internal tools and processes for deploying and merging across our repositories were limiting our ability to land pull requests as often as we needed. Beyond just improving velocity, it became clear that our new solution needed to:

  1. Improve the developer experience of shipping. Engineers wanted to express two simple intents: “I want to ship this change” and “I want to shift to other work;” the system should handle the rest.
  2. Avoid having problematic pull requests impact everyone. Those causing conflicts or build failures should not impact all other pull requests waiting to merge. The throughput of the overall system should be favored over fairness to an individual pull request.
  3. Be consistent and as automated as possible across our services and repositories. Manual toil by engineers should be removed wherever possible.

The merge queue project began as part of an overall effort within GitHub to improve availability and remove friction that was preventing developers from shipping at the frequency and level of quality that was needed. Initially, it was only focused on providing a solution for us, but was built with the expectation that it would eventually be made available to customers.

By mid-2021, a few small, internal repositories started testing merge queue, but moving our large monorepo would not happen until the next year for a few reasons.

For one, we could not stop deploying for days or weeks in order to swap systems. At every stage of the project we had to have a working system to ship changes. At a maximum, we could block deployments for an hour or so to run a test or transition. GitHub is remote-first and we have engineers throughout the world, so there are quieter times but never a free pass to take the system offline.

Changing the way thousands of developers deploy and merge changes also requires lots of communication to ensure teams are able to maintain velocity throughout the transition. Training 1,000 engineers on a new system overnight is difficult, to say the least.

By rolling out changes to the process in phases (and sometimes testing and rolling back changes early in the morning before most developers started working) we were able to slowly transition our large monorepo and all of our repositories responsible for production services onto merge queue by 2023.

How we use merge queue today

Merge queue has become the single entry point for shipping code changes at GitHub. It was designed and tested at scale, shipping 30,000+ pull requests with their associated 4.5 million CI runs, for GitHub.com before merge queue was made generally available.

For GitHub and our “deploy the merge process,” merge queue dynamically forms groups of pull requests that are candidates for deployment, kicks off builds and tests via GitHub Actions, and ensures our main branch is never updated to a failing commit by enforcing branch protection rules. Pull requests in the queue that conflict with one another are automatically detected and removed, with the queue automatically re-forming groups as needed.

Because merge queue is integrated into the pull request workflow (and does not require knowledge of special ChatOps commands, or use of labels or special syntax in comments to manage state), our developer experience is also greatly improved. Developers can add their pull request to the queue and, if they spot an issue with their change, leave the queue with a single click.

We can now ship larger groups without the pitfalls and frictions of trains. Trains (our old system) previously limited our ability to deploy more than 15 changes at once, but now we can now safely deploy 30 or more if needed.

Every month, over 500 engineers merge 2,500 pull requests into our large monorepo with merge queue, more than double the volume from a few years ago. The average wait time to ship a change has also been reduced by 33%. And it’s not just numbers that have improved. On one of our periodic developer satisfaction surveys, an engineer called merge queue “one of the best quality-of-life improvements to shipping changes that I’ve seen a GitHub!” It’s not a stretch to say that merge queue has transformed the way GitHub deploys changes to production at scale.

How to get started

Merge queue is available to public repositories on GitHub.com owned by organizations and to all repositories on GitHub Enterprise (Cloud or Server).

To learn more about merge queue and how it can help velocity and developer satisfaction on your busiest repositories, see our blog post, GitHub merge queue is generally available.

Interested in joining GitHub? Check out our open positions or learn more about our platform.

The post How GitHub uses merge queue to ship hundreds of changes every day appeared first on The GitHub Blog.

Build a pseudonymization service on AWS to protect sensitive data: Part 2

Post Syndicated from Edvin Hallvaxhiu original https://aws.amazon.com/blogs/big-data/build-a-pseudonymization-service-on-aws-to-protect-sensitive-data-part-2/

Part 1 of this two-part series described how to build a pseudonymization service that converts plain text data attributes into a pseudonym or vice versa. A centralized pseudonymization service provides a unique and universally recognized architecture for generating pseudonyms. Consequently, an organization can achieve a standard process to handle sensitive data across all platforms. Additionally, this takes away any complexity and expertise needed to understand and implement various compliance requirements from development teams and analytical users, allowing them to focus on their business outcomes.

Following a decoupled service-based approach means that, as an organization, you are unbiased towards the use of any specific technologies to solve your business problems. No matter which technology is preferred by individual teams, they are able to call the pseudonymization service to pseudonymize sensitive data.

In this post, we focus on common extract, transform, and load (ETL) consumption patterns that can use the pseudonymization service. We discuss how to use the pseudonymization service in your ETL jobs on Amazon EMR (using Amazon EMR on EC2) for streaming and batch use cases. Additionally, you can find an Amazon Athena and AWS Glue based consumption pattern in the GitHub repo of the solution.

Solution overview

The following diagram describes the solution architecture.

The account on the right hosts the pseudonymization service, which you can deploy using the instructions provided in the Part 1 of this series.

The account on the left is the one that you set up as part of this post, representing the ETL platform based on Amazon EMR using the pseudonymization service.

You can deploy the pseudonymization service and the ETL platform on the same account.

Amazon EMR empowers you to create, operate, and scale big data frameworks such as Apache Spark quickly and cost-effectively.

In this solution, we show how to consume the pseudonymization service on Amazon EMR with Apache Spark for batch and streaming use cases. The batch application reads data from an Amazon Simple Storage Service (Amazon S3) bucket, and the streaming application consumes records from Amazon Kinesis Data Streams.

PySpark code used in batch and streaming jobs

Both applications use a common utility function that makes HTTP POST calls against the API Gateway that is linked to the pseudonymization AWS Lambda function. The REST API calls are made per Spark partition using the Spark RDD mapPartitions function. The POST request body contains the list of unique values for a given input column. The POST request response contains the corresponding pseudonymized values. The code swaps the sensitive values with the pseudonymized ones for a given dataset. The result is saved to Amazon S3 and the AWS Glue Data Catalog, using Apache Iceberg table format.

Iceberg is an open table format that supports ACID transactions, schema evolution, and time travel queries. You can use these features to implement the right to be forgotten (or data erasure) solutions using SQL statements or programming interfaces. Iceberg is supported by Amazon EMR starting with version 6.5.0, AWS Glue, and Athena. Batch and streaming patterns use Iceberg as their target format. For an overview of how to build an ACID compliant data lake using Iceberg, refer to Build a high-performance, ACID compliant, evolving data lake using Apache Iceberg on Amazon EMR.

Prerequisites

You must have the following prerequisites:

  • An AWS account.
  • An AWS Identity and Access Management (IAM) principal with privileges to deploy the AWS CloudFormation stack and related resources.
  • The AWS Command Line Interface (AWS CLI) installed on the development or deployment machine that you will use to run the provided scripts.
  • An S3 bucket in the same account and AWS Region where the solution is to be deployed.
  • Python3 installed in the local machine where the commands are run.
  • PyYAML installed using pip.
  • A bash terminal to run bash scripts that deploy CloudFormation stacks.
  • An additional S3 bucket containing the input dataset in Parquet files (only for batch applications). Copy the sample dataset to the S3 bucket.
  • A copy of the latest code repository in the local machine using git clone or the download option.

Open a new bash terminal and navigate to the root folder of the cloned repository.

The source code for the proposed patterns can be found in the cloned repository. It uses the following parameters:

  • ARTEFACT_S3_BUCKET – The S3 bucket where the infrastructure code will be stored. The bucket must be created in the same account and Region where the solution lives.
  • AWS_REGION – The Region where the solution will be deployed.
  • AWS_PROFILE – The named profile that will be applied to the AWS CLI command. This should contain credentials for an IAM principal with privileges to deploy the CloudFormation stack of related resources.
  • SUBNET_ID – The subnet ID where the EMR cluster will be spun up. The subnet is pre-existing and for demonstration purposes, we use the default subnet ID of the default VPC.
  • EP_URL – The endpoint URL of the pseudonymization service. Retrieve this from the solution deployed as Part 1 of this series.
  • API_SECRET – An Amazon API Gateway key that will be stored in AWS Secrets Manager. The API key is generated from the deployment depicted in Part 1 of this series.
  • S3_INPUT_PATH – The S3 URI pointing to the folder containing the input dataset as Parquet files.
  • KINESIS_DATA_STREAM_NAME – The Kinesis data stream name deployed with the CloudFormation stack.
  • BATCH_SIZE – The number of records to be pushed to the data stream per batch.
  • THREADS_NUM – The number of parallel threads used in the local machine to upload data to the data stream. More threads correspond to a higher message volume.
  • EMR_CLUSTER_ID – The EMR cluster ID where the code will be run (the EMR cluster was created by the CloudFormation stack).
  • STACK_NAME – The name of the CloudFormation stack, which is assigned in the deployment script.

Batch deployment steps

As described in the prerequisites, before you deploy the solution, upload the Parquet files of the test dataset to Amazon S3. Then provide the S3 path of the folder containing the files as the parameter <S3_INPUT_PATH>.

We create the solution resources via AWS CloudFormation. You can deploy the solution by running the deploy_1.sh script, which is inside the deployment_scripts folder.

After the deployment prerequisites have been satisfied, enter the following command to deploy the solution:

sh ./deployment_scripts/deploy_1.sh \
-a <ARTEFACT_S3_BUCKET> \
-r <AWS_REGION> \
-p <AWS_PROFILE> \
-s <SUBNET_ID> \
-e <EP_URL> \
-x <API_SECRET> \
-i <S3_INPUT_PATH>

The output should look like the following screenshot.

The required parameters for the cleanup command are printed out at the end of the run of the deploy_1.sh script. Make sure to note down these values.

Test the batch solution

In the CloudFormation template deployed using the deploy_1.sh script, the EMR step containing the Spark batch application is added at the end of the EMR cluster setup.

To verify the results, check the S3 bucket identified in the CloudFormation stack outputs with the variable SparkOutputLocation.

You can also use Athena to query the table pseudo_table in the database blog_batch_db.

Clean up batch resources

To destroy the resources created as part of this exercise,

in a bash terminal, navigate to the root folder of the cloned repository. Enter the cleanup command shown as the output of the previously run deploy_1.sh script:

sh ./deployment_scripts/cleanup_1.sh \
-a <ARTEFACT_S3_BUCKET> \
-s <STACK_NAME> \
-r <AWS_REGION> \
-e <EMR_CLUSTER_ID>

The output should look like the following screenshot.

Streaming deployment steps

We create the solution resources via AWS CloudFormation. You can deploy the solution by running the deploy_2.sh script, which is inside the deployment_scripts folder. The CloudFormation stack template for this pattern is available in the GitHub repo.

After the deployment prerequisites have been satisfied, enter the following command to deploy the solution:

sh deployment_scripts/deploy_2.sh \
-a <ARTEFACT_S3_BUCKET> \
-r <AWS_REGION> \
-p <AWS_PROFILE> \
-s <SUBNET_ID> \
-e <EP_URL> \
-x <API_SECRET>

The output should look like the following screenshot.

The required parameters for the cleanup command are printed out at the end of the output of the deploy_2.sh script. Make sure to save these values to use later.

Test the streaming solution

In the CloudFormation template deployed using the deploy_2.sh script, the EMR step containing the Spark streaming application is added at the end of the EMR cluster setup. To test the end-to-end pipeline, you need to push records to the deployed Kinesis data stream. With the following commands in a bash terminal, you can activate a Kinesis producer that will continuously put records in the stream, until the process is manually stopped. You can control the producer’s message volume by modifying the BATCH_SIZE and the THREADS_NUM variables.

python3 -m pip install kiner
python3 \
consumption-patterns/emr/1_pyspark-streaming/kinesis_producer/producer.py \
<KINESIS_DATA_STREAM_NAME> \
<BATCH_SIZE> \
<THREADS_NUM>

To verify the results, check the S3 bucket identified in the CloudFormation stack outputs with the variable SparkOutputLocation.

In the Athena query editor, check the results by querying the table pseudo_table in the database blog_stream_db.

Clean up streaming resources

To destroy the resources created as part of this exercise, complete the following steps:

  1. Stop the Python Kinesis producer that was launched in a bash terminal in the previous section.
  2. Enter the following command:
sh ./deployment_scripts/cleanup_2.sh \
-a <ARTEFACT_S3_BUCKET> \
-s <STACK_NAME> \
-r <AWS_REGION> \
-e <EMR_CLUSTER_ID>

The output should look like the following screenshot.

Performance details

Use cases might differ in requirements with respect to data size, compute capacity, and cost. We have provided some benchmarking and factors that may influence performance; however, we strongly advise you to validate the solution in lower environments to see if it meets your particular requirements.

You can influence the performance of the proposed solution (which aims to pseudonymize a dataset using Amazon EMR) by the maximum number of parallel calls to the pseudonymization service and the payload size for each call. In terms of parallel calls, factors to consider are the GetSecretValue calls limit from Secrets Manager (10.000 per second, hard limit) and the Lambda default concurrency parallelism (1,000 by default; can be increased by quota request). You can control the maximum parallelism adjusting the number of executors, the number of partitions composing the dataset, and the cluster configuration (number and type of nodes). In terms of payload size for each call, factors to consider are the API Gateway maximum payload size (6 MB) and the Lambda function maximum runtime (15 minutes). You can control the payload size and the Lambda function runtime by adjusting the batch size value, which is a parameter of the PySpark script that determines the number of items to be pseudonymized per each API call. To capture the influence of all these factors and assess the performance of the consumption patterns using Amazon EMR, we have designed and monitored the following scenarios.

Batch consumption pattern performance

To assess the performance for the batch consumption pattern, we ran the pseudonymization application with three input datasets composed of 1, 10, and 100 Parquet files of 97.7 MB each. We generated the input files using the dataset_generator.py script.

The cluster capacity nodes were 1 primary (m5.4xlarge) and 15 core (m5d.8xlarge). This cluster configuration remained the same for all three scenarios, and it allowed the Spark application to use up to 100 executors. The batch_size, which was also the same for the three scenarios, was set to 900 VINs per API call, and the maximum VIN size was 5 bytes.

The following table captures the information of the three scenarios.

Execution ID Repartition Dataset Size Number of Executors Cores per Executor Executor Memory Runtime
A 800 9.53 GB 100 4 4 GiB 11 minutes, 10 seconds
B 80 0.95 GB 10 4 4 GiB 8 minutes, 36 seconds
C 8 0.09 GB 1 4 4 GiB 7 minutes, 56 seconds

As we can see, properly parallelizing the calls to our pseudonymization service enables us to control the overall runtime.

In the following examples, we analyze three important Lambda metrics for the pseudonymization service: Invocations, ConcurrentExecutions, and Duration.

The following graph depicts the Invocations metric, with the statistic SUM in orange and RUNNING SUM in blue.

By calculating the difference between the starting and ending point of the cumulative invocations, we can extract how many invocations were made during each run.

Run ID Dataset Size Total Invocations
A 9.53 GB 1.467.000 – 0 = 1.467.000
B 0.95 GB 1.467.000 – 1.616.500 = 149.500
C 0.09 GB 1.616.500 – 1.631.000 = 14.500

As expected, the number of invocations increases proportionally by 10 with the dataset size.

The following graph depicts the total ConcurrentExecutions metric, with the statistic MAX in blue.

The application is designed such that the maximum number of concurrent Lambda function runs is given by the amount of Spark tasks (Spark dataset partitions), which can be processed in parallel. This number can be calculated as MIN (executors x executor_cores, Spark dataset partitions).

In the test, run A processed 800 partitions, using 100 executors with four cores each. This makes 400 tasks processed in parallel so the Lambda function concurrent runs can’t be above 400. The same logic was applied for runs B and C. We can see this reflected in the preceding graph, where the amount of concurrent runs never surpasses the 400, 40, and 4 values.

To avoid throttling, make sure that the amount of Spark tasks that can be processed in parallel is not above the Lambda function concurrency limit. If that is the case, you should either increase the Lambda function concurrency limit (if you want to keep up the performance) or reduce either the amount of partitions or the number of available executors (impacting the application performance).

The following graph depicts the Lambda Duration metric, with the statistic AVG in orange and MAX in green.

As expected, the size of the dataset doesn’t affect the duration of the pseudonymization function run, which, apart from some initial invocations facing cold starts, remains constant to an average of 3 milliseconds throughout the three scenarios. This because the maximum number of records included in each pseudonymization call is constant (batch_size value).

Lambda is billed based on the number of invocations and the time it takes for your code to run (duration). You can use the average duration and invocations metrics to estimate the cost of the pseudonymization service.

Streaming consumption pattern performance

To assess the performance for the streaming consumption pattern, we ran the producer.py script, which defines a Kinesis data producer that pushes records in batches to the Kinesis data stream.

The streaming application was left running for 15 minutes and it was configured with a batch_interval of 1 minute, which is the time interval at which streaming data will be divided into batches. The following table summarizes the relevant factors.

Repartition Cluster Capacity Nodes Number of Executors Executor’s Memory Batch Window Batch Size VIN Size
17

1 Primary (m5.xlarge),

3 Core (m5.2xlarge)

6 9 GiB 60 seconds 900 VINs/API call. 5 Bytes / VIN

The following graphs depict the Kinesis Data Streams metrics PutRecords (in blue) and GetRecords (in orange) aggregated with 1-minute period and using the statistic SUM. The first graph shows the metric in bytes, which peaks 6.8 MB per minute. The second graph shows the metric in record count peaking at 85,000 records per minute.

We can see that the metrics GetRecords and PutRecords have overlapping values for almost the entire application’s run. This means that the streaming application was able to keep up with the load of the stream.

Next, we analyze the relevant Lambda metrics for the pseudonymization service: Invocations, ConcurrentExecutions, and Duration.

The following graph depicts the Invocations metric, with the statistic SUM (in orange) and RUNNING SUM in blue.

By calculating the difference between the starting and ending point of the cumulative invocations, we can extract how many invocations were made during the run. In specific, in 15 minutes, the streaming application invoked the pseudonymization API 977 times, which is around 65 calls per minute.

The following graph depicts the total ConcurrentExecutions metric, with the statistic MAX in blue.

The repartition and the cluster configuration allow the application to process all Spark RDD partitions in parallel. As a result, the concurrent runs of the Lambda function are always equal to or below the repartition number, which is 17.

To avoid throttling, make sure that the amount of Spark tasks that can be processed in parallel is not above the Lambda function concurrency limit. For this aspect, the same suggestions as for the batch use case are valid.

The following graph depicts the Lambda Duration metric, with the statistic AVG in blue and MAX in orange.

As expected, aside the Lambda function’s cold start, the average duration of the pseudonymization function was more or less constant throughout the run. This because the batch_size value, which defines the number of VINs to pseudonymize per call, was set to and remained constant at 900.

The ingestion rate of the Kinesis data stream and the consumption rate of our streaming application are factors that influence the number of API calls made against the pseudonymization service and therefore the related cost.

The following graph depicts the Lambda Invocations metric, with the statistic SUM in orange, and the Kinesis Data Streams GetRecords.Records metric, with the statistic SUM in blue. We can see that there is correlation between the amount of records retrieved from the stream per minute and the amount of Lambda function invocations, thereby impacting the cost of the streaming run.

In addition to the batch_interval, we can control the streaming application’s consumption rate using Spark streaming properties like spark.streaming.receiver.maxRate and spark.streaming.blockInterval. For more details, refer to Spark Streaming + Kinesis Integration and Spark Streaming Programming Guide.

Conclusion

Navigating through the rules and regulations of data privacy laws can be difficult. Pseudonymization of PII attributes is one of many points to consider while handling sensitive data.

In this two-part series, we explored how you can build and consume a pseudonymization service using various AWS services with features to assist you in building a robust data platform. In Part 1, we built the foundation by showing how to build a pseudonymization service. In this post, we showcased the various patterns to consume the pseudonymization service in a cost-efficient and performant manner. Check out the GitHub repository for additional consumption patterns.


About the Authors

Edvin Hallvaxhiu is a Senior Global Security Architect with AWS Professional Services and is passionate about cybersecurity and automation. He helps customers build secure and compliant solutions in the cloud. Outside work, he likes traveling and sports.

Rahul Shaurya is a Principal Big Data Architect with AWS Professional Services. He helps and works closely with customers building data platforms and analytical applications on AWS. Outside of work, Rahul loves taking long walks with his dog Barney.

Andrea Montanari is a Senior Big Data Architect with AWS Professional Services. He actively supports customers and partners in building analytics solutions at scale on AWS.

María Guerra is a Big Data Architect with AWS Professional Services. Maria has a background in data analytics and mechanical engineering. She helps customers architecting and developing data related workloads in the cloud.

Pushpraj Singh is a Senior Data Architect with AWS Professional Services. He is passionate about Data and DevOps engineering. He helps customers build data driven applications at scale.

The collective thoughts of the interwebz