Post Syndicated from original https://dni.li/2022/12/24/darove-bez-kraj/
Хо-хо-хо!

Post Syndicated from Bruce Schneier original https://www.schneier.com/blog/archives/2022/12/friday-squid-blogging-injured-giant-squid-and-paddleboarder.html
Here’s a video—I don’t know where it’s from—of an injured juvenile male giant squid grabbing on to a paddleboard.
As usual, you can also use this squid post to talk about the security stories in the news that I haven’t covered.
Read my blog posting guidelines here.
Post Syndicated from Daniel Fuertes original https://aws.amazon.com/blogs/security/2022-pitukri-isae-3000-type-ii-attestation-report-available-with-154-services-in-scope/
Amazon Web Services (AWS) is pleased to announce the second issuance of the Criteria to Assess the Information Security of Cloud Services (PiTuKri) International Standard on Assurance Engagements (ISAE) 3000 Type II attestation report. The scope of the report covers a total of 154 services and 24 global AWS Regions.
The Finnish Transport and Communications Agency (Traficom) Cyber Security Centre published PiTuKri, which consists of 52 criteria that provide guidance when assessing the security of cloud service providers. The criteria are organized into the following 11 subdivisions:
It is our pleasure to announce the addition of 16 new services and two new Regions to our PiTuKri attestation scope. A few examples of the new security services included are:
The latest report covers the period from October 1, 2021 to September 30, 2022. It was issued by an independent third-party audit firm to assure customers that the AWS control environment is appropriately designed and implemented in accordance with PiTuKri requirements. This attestation demonstrates the AWS commitment to meet security expectations for cloud service providers set by Traficom.
Customers can find the full PiTuKri ISAE 3000 report on AWS Artifact. To learn more about the complete list of certified services and Regions, customers can also refer to AWS Compliance Programs and AWS Services in Scope for PiTuKri.
AWS strives to continuously bring new services into scope of its compliance programs to help customers meet their architectural and regulatory needs. Please reach out to your AWS account team for any questions about the PiTuKri report.
If you have feedback about this post, please submit them in the Comments section below.
Want more AWS Security news? Follow us on Twitter.
Post Syndicated from Daniel Fuertes original https://aws.amazon.com/blogs/security/2022-finma-isae-3000-type-ii-attestation-report-now-available-with-154-services-in-scope/
Amazon Web Services (AWS) is pleased to announce the third issuance of the Swiss Financial Market Supervisory Authority (FINMA) International Standard on Assurance Engagements (ISAE) 3000 Type II attestation report. The scope of the report covers a total of 154 services and 24 global AWS Regions.
The latest FINMA ISAE 3000 Type II report covers the period from October 1, 2021, to September 30, 2022. AWS continues to assure Swiss financial industry customers that our control environment is capable of effectively addressing key operational, outsourcing, and business continuity management risks.
The report covers the five core FINMA circulars regarding outsourcing arrangements to the cloud. FINMA circulars help Swiss-regulated financial institutions to understand the approaches FINMA takes when implementing due diligence, third-party management, and key technical and organizational controls for cloud outsourcing arrangements, particularly for material workloads.
The scope of the report covers the following requirements of the FINMA circulars:
It is our pleasure to announce the addition of 16 services and two Regions to the FINMA ISAE 3000 Type II attestation scope. The following are a few examples of the additional security services in scope:
Customers can continue to reference the FINMA workbooks, which include detailed control mappings for each FINMA circular covered under this audit report, through AWS Artifact. Customers can also find the entire FINMA report on AWS Artifact. To learn more about the list of certified services and Regions, see AWS Compliance Programs and AWS Services in Scope for FINMA.
As always, AWS is committed to adding new services into our future FINMA program scope based on your architectural and regulatory needs. If you have questions about the FINMA report, contact your AWS account team.
If you have feedback about this post, please submit them in the Comments section below.
Want more AWS Security news? Follow us on Twitter.
Post Syndicated from Ignasi Nogués original https://aws.amazon.com/blogs/big-data/clickedu-uses-amazon-quicksight-embedded-to-empower-school-administrators-with-key-educational-institution-health-insights/
This is a guest post by Ignasi Nogués and Georgina Valls from Clickedu.
 With more than 1.5 million unique users across 700 schools and core values that include connectivity, reliability, and innovation, Clickedu is the leading educational platform in Spain. Offering both a school administration system and a digital learning environment, Clickedu is one of the most comprehensive education tools in the European market for K–12 schools. Founded in 2000, Clickedu was acquired by Finland-based Sanoma Learning Group, a leading European learning and media company, in 2019.
Having originally started as an IT company, Clickedu has always been focused on providing products and services designed specifically for the education sector. Through continuous partnership with school administrators and education professionals, our development process is firmly rooted in listening to feedback and making prioritization decisions based on what customers tell us is most important to them. Because schools are the central focus of our research and development efforts, our service and product quality standards remain high.
Our mission is to help schools invest their time in educational objectives, with as little time as possible dedicated to bureaucratic tasks. To help administrators in human resources (HR), finance, and academic departments make more strategic, data-driven decisions across networks of educational centers, we launched Clickedu Analytics. This product provides data analysis and presents insights in easy-to-understand dashboards with insightful visualizations. When researching business intelligence (BI) tools that would meet our needs for what we wanted Clickedu Analytics to do, we needed look no further than Amazon QuickSight.
In this post, we discuss why we chose QuickSight and will cover some of the post-implementation outcomes.
Clickedu provides a cloud-based school platform that includes academic, administrative, and economic management tools and a virtual learning management system (LMS) with a connection to digital books and free content. For administrators, Clickedu’s software provides an interface to manage teachers, tutors, and heads of studies, as well as a communication environment for messaging families.
With so many data points spanning the full scope of the platform’s centralized capabilities across HR, finance, and academics, the untapped potential in that data presented a huge opportunity. We set out with the goal of building a BI experience that would enable us to quickly and efficiently analyze that data, visualize the results, and use those insights to better serve our customers.
The following screenshot shows a dashboard visualization of student distribution based on several different factors.
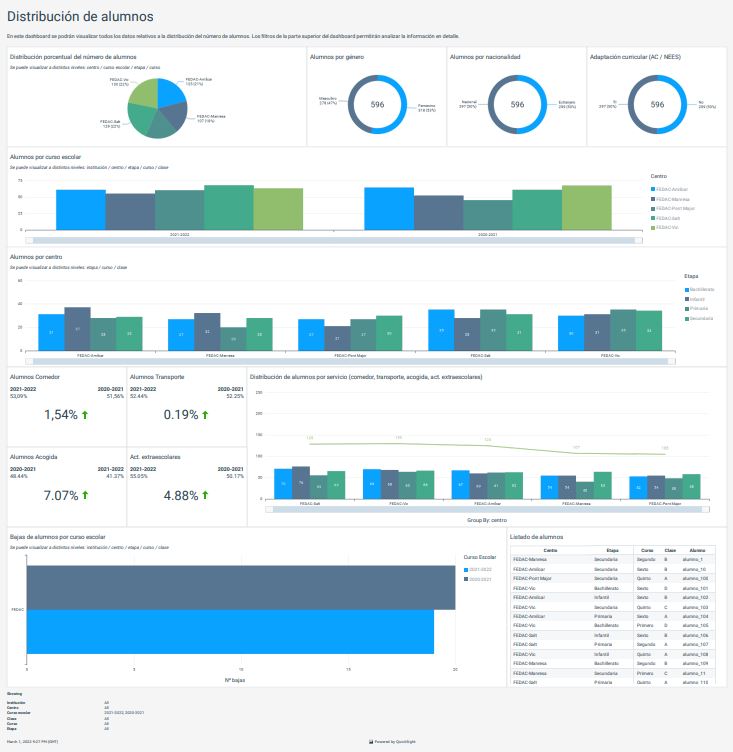
With dashboards built specifically to surface helpful information, school administrators are better able to make informed decisions based on clear, easy-to-understand insights. Reports can be generated to show academic results, pre-registrations, absences, etc., and all of it can be filtered by school year, institution, center, stage, courses, and classes.
Thanks to the information QuickSight delivers via Clickedu Analytics, our HR teams can see how many teachers in a group are likely to retire soon, or academic teams can see how language qualifications are progressing. Having fast, easy access to key insights like these help us be more proactive in identifying areas that might need attention before they become issues that demand a reaction.
The biggest challenge our customers were facing was a lack of visibility into aggregate data points that impacted several schools within a group. Speed, agility, and responsiveness are crucial when it comes to spotting trends in data points that signal issues in need of attention or wins deserving of celebration. Prior to implementing QuickSight, it would take time and resources to research whether something identified at one school was also showing up in the data points for the others. Now, administrators have full visibility to all relevant data across an entire network of schools with just a few clicks on their Clickedu Analytics dashboards.
After reviewing several other BI vendor products and evaluating the pros and cons of each, Amazon QuickSight was chosen as our Clickedu Analytics BI tool for these reasons.
Being able to export reports into PDFs, add new datasets, and the ease of combining with third-party data all contributed to swaying our decision to QuickSight.
QuickSight has empowered us to bring our Clickedu Analytics platform to the next level in providing the visibility and scalability we need to best serve our customers. We’re very excited to continue to iterate on what we’ve built with plans to expand access from the school groups and institutions who are currently using Clickedu Analytics to have it available to all schools that are in need of data management solutions.
Looking to the future, we see potential to do more with QuickSight in the learning management system (LMS) space. We are considering Amazon QuickSight Q, a machine learning-powered natural language capability that gives anyone in an organization the ability to ask business questions in natural language and receive accurate answers with relevant visualizations instantly without needing to go back to the dashboard author. There is ample potential to implement QuickSight Q as a means of querying and receiving information on our digital content.
To learn more about how you can embed customized data visuals, interactive dashboards, and natural language querying into any application, visit Amazon QuickSight Embedded.
To learn more about Clickedu, Spain’s leading platform for school administration, visit www.clickedu.net.
 Ignasi Nogués is the founder and the CTO of Clickedu. He is, by definition, a big entrepreneur and a dreamer. He drove the company since 2000 to success due to hard work. He always wants to take the next step.
 Georgina Valls is the Marketing Manager of Clickedu. She is a hardworker, dedicated to letting others know about Clickedu and its capabilities. As the daughter of teachers, she is very passionate about creating a brighter future in education.
Post Syndicated from original https://lwn.net/Articles/918344/
The kernel project tries hard to avoid duplicating functionality within its
code base; whenever possible, a single subsystem is made to serve all use
cases. There is one notable exception to this rule, though: there are
three object-level memory allocators (“slab allocators”) in the kernel.
The desire to reduce the count has been growing stronger over the years,
and some steps have been taken in 6.2 to eliminate the least-loved
allocator — SLOB — in the relatively near future.
Post Syndicated from Crosstalk Solutions original https://www.youtube.com/watch?v=OgC-4KlKFYU
Post Syndicated from Michelle Mannering original https://github.blog/2022-12-23-whats-with-all-the-ducks/
Black eyes.
Orange beak.
Large yellow body.
Rubbery texture…
…often seen floating in baths.
What are we talking about? Rubber ducks, of course. Now the question you might be asking, “Why is everyone obsessed with rubber ducks?” You may have seen our new “What is GitHub?” video making its way around the internet. Outside of the famous comedian, whom you may recognize, you saw a new character floating around (literally). And if you were at GitHub Universe this year or tuned into the livestream, you probably saw lots of physical rubber ducks dispersed throughout.
So, what in the world do rubber ducks have to do with programming? And why were they everywhere? A lot of you asked, so I’m here to help explain.

Our story starts back in 1999, when a book was released, The Pragmatic Programmer by Andrew Hunt. The story describes a computer programmer who sat a rubber duck down one fine day, and explained his code to the duck—line by line!
The process of speaking the code out loud helped the developer understand the code and gain greater insight into his work. After all, rubber ducks don’t talk back!
The technique stuck. It’s now called rubber duck debugging or rubberducking. Of course, it doesn’t need to be only rubber ducks, but the term stuck and is part of developer lingo. So, in our effort to explain all the things GitHub can do for developers and businesses, we used this same technique, with our own special rubber duck. Our duck takes a journey through all the elements of GitHub that make it the most complete developer platform to build, scale, and deliver secure software.
If anyone missed the significance of rubber ducks, @film_girl and @anjuan explained it during the live stream at #GitHubUniverse
Sound (or subs) on! pic.twitter.com/p7G3eZwqBc
— Mish


If rubber duck debugging is new to you, try it out! It doesn’t just work with code, either. If you’re ever stuck, try talking through your problem or challenge out loud, whether it’s to that plant on your desk, a roommate, your family, or even your dog. In the meantime, your code on GitHub is waiting to be explained to your new yellow friend.
Post Syndicated from BeardedTinker original https://www.youtube.com/watch?v=S8nGS9nrQC0
Post Syndicated from Talks at Google original https://www.youtube.com/watch?v=1lJm-Rfh3sk
Post Syndicated from Steven Warren original https://aws.amazon.com/blogs/architecture/an-elastic-deployment-of-stable-diffusion-with-discord-on-aws/
Stable Diffusion is a state-of-the-art text-to-image model that generates images from text. Deploying text-to-image models such as Stable Diffusion can be difficult. Currently, Stable Diffusion requires specific computer hardware known as graphical processing units (GPUs). You can lower the bar to entry by offloading the text-to-image generation onto Amazon Web Services (AWS).
Discord is a popular voice, video, and text communication service. It provides a user interface that people can use to make text-to-image requests. When deployed, all members of a Discord server can create images by using Discord Slash Commands.
In this post, we discuss how to deploy a highly available solution on AWS. This solution will perform text-to-image generation with Stable Diffusion and use Discord as the user interface.
Many of the services selected are serverless, which will offer many benefits. At the time of writing, Stable Diffusion requires a GPU for inference. Amazon Elastic Compute Cloud (Amazon EC2) was selected because it provides GPUs. The solution architecture is shown in the Figure 1.

Figure 1. Solution architecture diagram
Let us walk through the architecture of this solution.
To properly scale the system, a custom Amazon CloudWatch metric is created. This custom CloudWatch metric calculates the number of Amazon Elastic Container Service (Amazon ECS) tasks required to adequately handle the amount of Amazon Simple Queue Service (Amazon SQS) messages. You should have a high-resolution CloudWatch metric to scale up quickly. For this use case, a high-resolution CloudWatch metric of every 10 seconds was implemented.
Next, let’s create the custom CW metric. Amazon EventBridge rules provide a serverless solution for starting actions on a schedule. Here we use an Amazon EventBridge rule, which initiates an AWS Step Function Express Workflow every minute. With the Express Workflow, we can create serverless workflows that take less than five minutes, which helps us avoid long running AWS Lambda functions. The Express Workflow runs a Lambda function every 10 seconds over a one-minute period, which generates the custom CloudWatch metric.
Two high-resolution CloudWatch alarms scale the system up and down, and are initiated by the custom CloudWatch metric. One CloudWatch alarm increases the ECS tasks and EC2 machines. The other alarm decreases the ECS tasks and EC2 machines.
Someone on Discord sends a request. The Amazon API Gateway HTTP API receives the request and passes the information to an AWS Lambda function. The HTTP API provides a cost-effective option compared to REST APIs and provides tools for authentication and authorization. The HTTP API uses cross-origin resource sharing (CORS), which provides security because it only allows discord.com as an origin.
The AWS Lambda function provides a serverless solution for responding to the HTTP API requests. It transforms the HTTP API request and sends a message to the SQS First-In-First-Out (FIFO) queue. SQS seamelessly decouples the architecture between user requests and backend processing. A FIFO queue ensures that user requests are processed in the order they were requested. The AWS Lambda function sends a response back to the HTTP API within three seconds, which is a requirement of Discord Slash Commands.
When scaling up, an EC2 instance is registered with the ECS cluster. The EC2 instance type was selected because it provides GPU instances. ECS provides a repeatable solution to deploy the container across a variety of instance types. This solution currently only uses the g4dn.xlarge instance type. The ECS service will then place an ECS task onto the eligible EC2 instance. The ECS task will use the Amazon Elastic Container Registry (Amazon ECR) private registry to pull the image, perform text-to-image processing, and respond to the Discord request. The ECR private registry is a managed container registry that manages the image.
Once there is an ECS task running on an Amazon EC2 instance, the ECS task will consume messages from the queue using long polling. This reduces the amount of ReceiveMessage requests the ECS task needs to send. When the ECS task receives a message from the queue, it will then processes the request.
The example assumes 1,000 requests per month and each request takes 16 seconds to complete. Extra EC2 time was added for the time to begin processing messages (seven minutes) and auto scaling cooldown time (30 minutes). You can adjust the pricing calculations with the AWS Pricing Calculator to reflect your usage and estimated cost.
This blog assumes familiarity with Terraform, Docker, Discord, Amazon EC2, Amazon Elastic Block Store (Amazon EBS), Amazon Virtual Private Cloud (Amazon VPC), AWS Identity and Access Management (IAM), Amazon API Gateway, AWS Lambda, Amazon SQS, Amazon Elastic Container Registry (Amazon ECR), Amazon ECS, Amazon EventBridge, AWS Step Functions, and Amazon CloudWatch.
For this walkthrough, you should have the following prerequisites:
Complete the following steps to deploy this solution on AWS.
This solution uses the g4dn.xlarge instance type, which might require you to request an EC2 limit increase. Check your current limit of Running On-Demand All G and VT instances. Make sure you have more than 4 vCPU; a single g4dn.xlarge requires 4 vCPU. We suggest requesting 8 vCPU so that you can access 2 g4dn.xlarge instances.
aws configure. If you are using an EC2 instance, create and use an instance profile rather than using the AWS CLI.git clone https://github.com/aws-samples/amazon-scalable-infra-discord-diffusion.gitcd amazon-scalable-infra-discord-diffusionterraform.tfvars to match your deployment.export TF_VAR_discord_bot_secret='DISCORD_BOT_SECRET_HERE'export TF_VAR_huggingface_password='HUGGINGFACE_PASSWORD_HERE'terraform initterraform applyThis setup adds the Discord interactions URL to your Discord application. After terraform apply comes back successfully, move onto these steps.
discord_interactions_endpoint_url into the Interactions Endpoint URL, and then save the changes.If successful, there should be a green box with All your edits have been carefully recorded.
In this section, you will create a docker image with the Stable Diffusion model.
cd ..git clone https://github.com/aws-samples/amazon-scalable-discord-diffusion.gitcd amazon-scalable-discord-diffusion
Figure 2. View push commands for Amazon ECR
This is a large image (10GB) and can take over 20 minutes to push depending on your machine’s internet connection.
This section will describe how to request a text to image response with Discord.
/sparkle.COMMANDS MATCHING /sparkle will appear. Select the /sparkle command box.
Figure 3. Writing a Discord Slash Command
a corgi, style of monet.YourBotName should appear with the response Submitted to Sparkle: YourPromptHere, as shown in Figure 4.
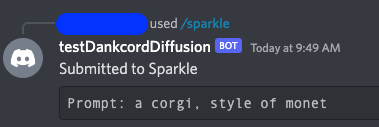
Figure 4. First response from AWS Lambda function
It will take 10 minutes for an EC2 instance to start with an ECS Task running on the instance. Once an ECS Task is running on the instance, inference times should reduce to under 30 seconds, depending on the request.
When an ECS Task is running your request, you will see a Processing your Sparkle message, as shown in Figure 5.
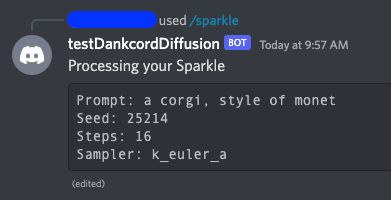
Figure 5. Amazon ECS task processing a request
The message is complete when it says Completed your Sparkle! as shown in Figure 6.

Figure 6. Amazon ECS task returning the final response
To avoid incurring future charges, delete the resources created by the Terraform script.
terraform destroy.yes and press Enter.In summary, we created a solution that allows members of a Discord server to create images from text with a Stable Diffusion model. With this implementation, the deployment can scale to many Discord Servers and handle over one hundred requests per second.
Create projects on AWS that lower the bar to entry for people wanting to try text to image models.
Post Syndicated from original https://lwn.net/Articles/918486/
Security updates have been issued by Debian (node-hawk and node-trim-newlines), Fedora (insight, ntfs-3g, and suricata), and SUSE (conmon, helm, kernel, and mbedtls).
Post Syndicated from original https://lwn.net/Articles/918469/
Intel’s graphical processors have been well supported in the mainline for
years, but it seems that the i915 driver may be approaching the end of its
development life. Matthew Brost has just posted a new
driver called “Xe” that looks to be (eventually) a replacement for
i915:
The intention of this new driver is to have a fresh base to work
from that is unencumbered by older platforms, whilst also taking
the opportunity to rearchitect our driver to increase sharing
across the drm subsystem, both leveraging and allowing us to
contribute more towards other shared components like TTM and
drm/scheduler.
Post Syndicated from The History Guy: History Deserves to Be Remembered original https://www.youtube.com/watch?v=wxzYgO2p6PQ
Post Syndicated from Bruce Schneier original https://www.schneier.com/blog/archives/2022/12/hacking-the-jfk-airport-taxi-dispatch-system.html
Two men have been convicted of hacking the taxi dispatch system at the JFK airport. This enabled them to reorder the taxis on the list; they charged taxi drivers $10 to cut the line.
Post Syndicated from original https://xkcd.com/2715/

Post Syndicated from Michael Fischer original https://aws.amazon.com/blogs/devops/unlock-the-power-of-ec2-graviton-with-gitlab-ci-cd-and-eks-runners/
Many AWS customers are using GitLab for their DevOps needs, including source control, and continuous integration and continuous delivery (CI/CD). Many of our customers are using GitLab SaaS (the hosted edition), while others are using GitLab Self-managed to meet their security and compliance requirements.
Customers can easily add runners to their GitLab instance to perform various CI/CD jobs. These jobs include compiling source code, building software packages or container images, performing unit and integration testing, etc.—even all the way to production deployment. For the SaaS edition, GitLab offers hosted runners, and customers can provide their own runners as well. Customers who run GitLab Self-managed must provide their own runners.
In this post, we’ll discuss how customers can maximize their CI/CD capabilities by managing their GitLab runner and executor fleet with Amazon Elastic Kubernetes Service (Amazon EKS). We’ll leverage both x86 and Graviton runners, allowing customers for the first time to build and test their applications both on x86 and on AWS Graviton, our most powerful, cost-effective, and sustainable instance family. In keeping with AWS’s philosophy of “pay only for what you use,” we’ll keep our Amazon Elastic Compute Cloud (Amazon EC2) instances as small as possible, and launch ephemeral runners on Spot instances. We’ll demonstrate building and testing a simple demo application on both architectures. Finally, we’ll build and deliver a multi-architecture container image that can run on Amazon EC2 instances or AWS Fargate, both on x86 and Graviton.
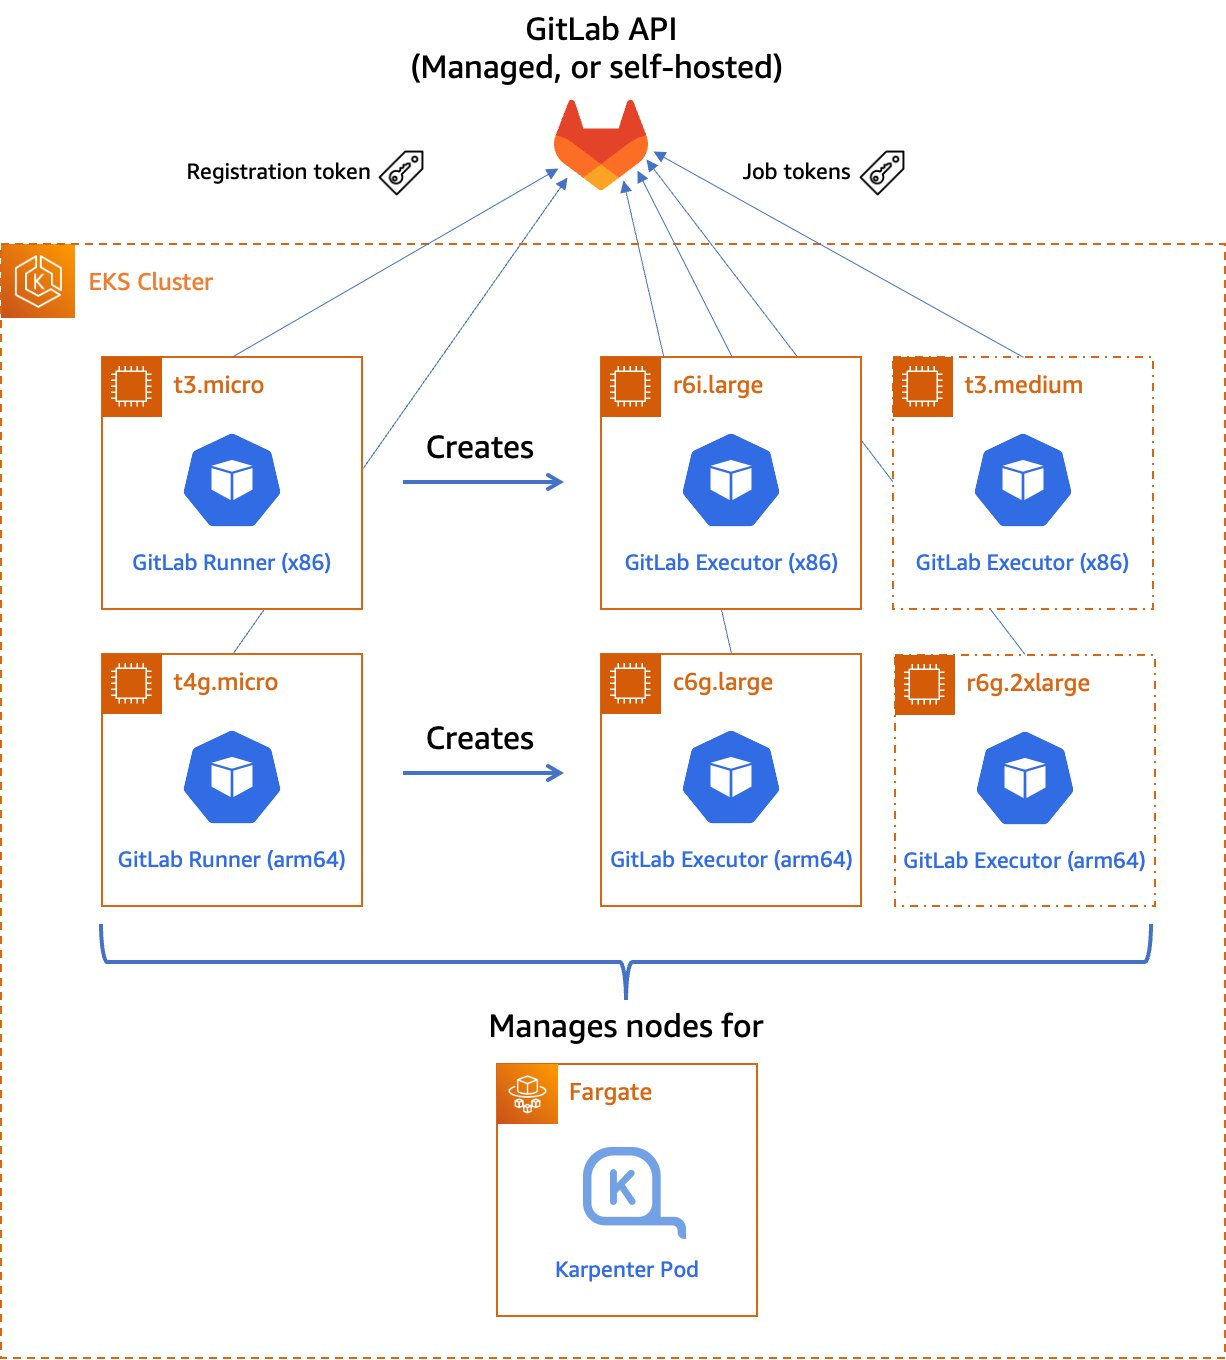
Figure 1. Managed GitLab runner architecture overview.
Let’s go through the components:
A runner is an application to which GitLab sends jobs that are defined in a CI/CD pipeline. The runner receives jobs from GitLab and executes them—either by itself, or by passing it to an executor (we’ll visit the executor in the next section).
In our design, we’ll be using a pair of self-hosted runners. One runner will accept jobs for the x86 CPU architecture, and the other will accept jobs for the arm64 (Graviton) CPU architecture. To help us route our jobs to the proper runner, we’ll apply some tags to each runner indicating the architecture for which it will be responsible. We’ll tag the x86 runner with x86, x86-64, and amd64, thereby reflecting the most common nicknames for the architecture, and we’ll tag the arm64 runner with arm64.
Currently, these runners must always be running so that they can receive jobs as they are created. Our runners only require a small amount of memory and CPU, so that we can run them on small EC2 instances to minimize cost. These include t4g.micro for Graviton builds, or t3.micro or t3a.micro for x86 builds.
To save money on these runners, consider purchasing a Savings Plan or Reserved Instances for them. Savings Plans and Reserved Instances can save you up to 72% over on-demand pricing, and there’s no minimum spend required to use them.
In GitLab CI/CD, the executor’s job is to perform the actual build. The runner can create hundreds or thousands of executors as needed to meet current demand, subject to the concurrency limits that you specify. Executors are created only when needed, and they are ephemeral: once a job has finished running on an executor, the runner will terminate it.
In our design, we’ll use the Kubernetes executor that’s built into the GitLab runner. The Kubernetes executor simply schedules a new pod to run each job. Once the job completes, the pod terminates, thereby freeing the node to run other jobs.
The Kubernetes executor is highly customizable. We’ll configure each runner with a nodeSelector that makes sure that the jobs are scheduled only onto nodes that are running the specified CPU architecture. Other possible customizations include CPU and memory reservations, node and pod tolerations, service accounts, volume mounts, and much more.
For most customers, CI/CD jobs aren’t likely to be running all of the time. To save cost, we only want to run worker nodes when there’s a job to run.
To make this happen, we’ll turn to Karpenter. Karpenter provisions EC2 instances as soon as needed to fit newly-scheduled pods. If a new executor pod is scheduled, and there isn’t a qualified instance with enough capacity remaining on it, then Karpenter will quickly and automatically launch a new instance to fit the pod. Karpenter will also periodically scan the cluster and terminate idle nodes, thereby saving on costs. Karpenter can terminate a vacant node in as little as 30 seconds.
Karpenter can launch either Amazon EC2 on-demand or Spot instances depending on your needs. With Spot instances, you can save up to 90% over on-demand instance prices. Since CI/CD jobs often aren’t time-sensitive, Spot instances can be an excellent choice for GitLab execution pods. Karpenter will even automatically find the best Spot instance type to speed up the time it takes to launch an instance and minimize the likelihood of job interruption.
To deploy our solution, we’ll write a small application using the AWS Cloud Development Kit (AWS CDK) and the EKS Blueprints library. AWS CDK is an open-source software development framework to define your cloud application resources using familiar programming languages. EKS Blueprints is a library designed to make it simple to deploy complex Kubernetes resources to an Amazon EKS cluster with minimum coding.
The high-level infrastructure code – which can be found in our GitLab repo – is very simple. I’ve included comments to explain how it works.
For security reasons, we store the GitLab registration token in a Kubernetes Secret – never in our source code. For additional security, we recommend encrypting Secrets using an AWS Key Management Service (AWS KMS) key that you supply by specifying the encryption configuration when you create your Amazon EKS cluster. It’s a good practice to restrict access to this Secret via Kubernetes RBAC rules.
To create the Secret, run the following command:
Now that we’ve launched our GitLab runners and configured the executors, we can build and test a simple multi-architecture container image. If the tests pass, we can then upload it to our project’s GitLab container registry. Our application will be pretty simple: we’ll create a web server in Go that simply prints out “Hello World” and prints out the current architecture.
Find the source code of our sample app in our GitLab repo.
In GitLab, the CI/CD configuration lives in the .gitlab-ci.yml file at the root of the source repository. In this file, we declare a list of ordered build stages, and then we declare the specific jobs associated with each stage.
Our stages are:
docker build to produce our images, we use Kaniko to build them. This lets us build our images in an unprivileged container environment and improve the security posture considerably.The assembly stage, in which we create a multi-architecture image manifest from the two architecture-specific images. Then, we push the manifest into the image registry so that we can refer to it in future deployments.
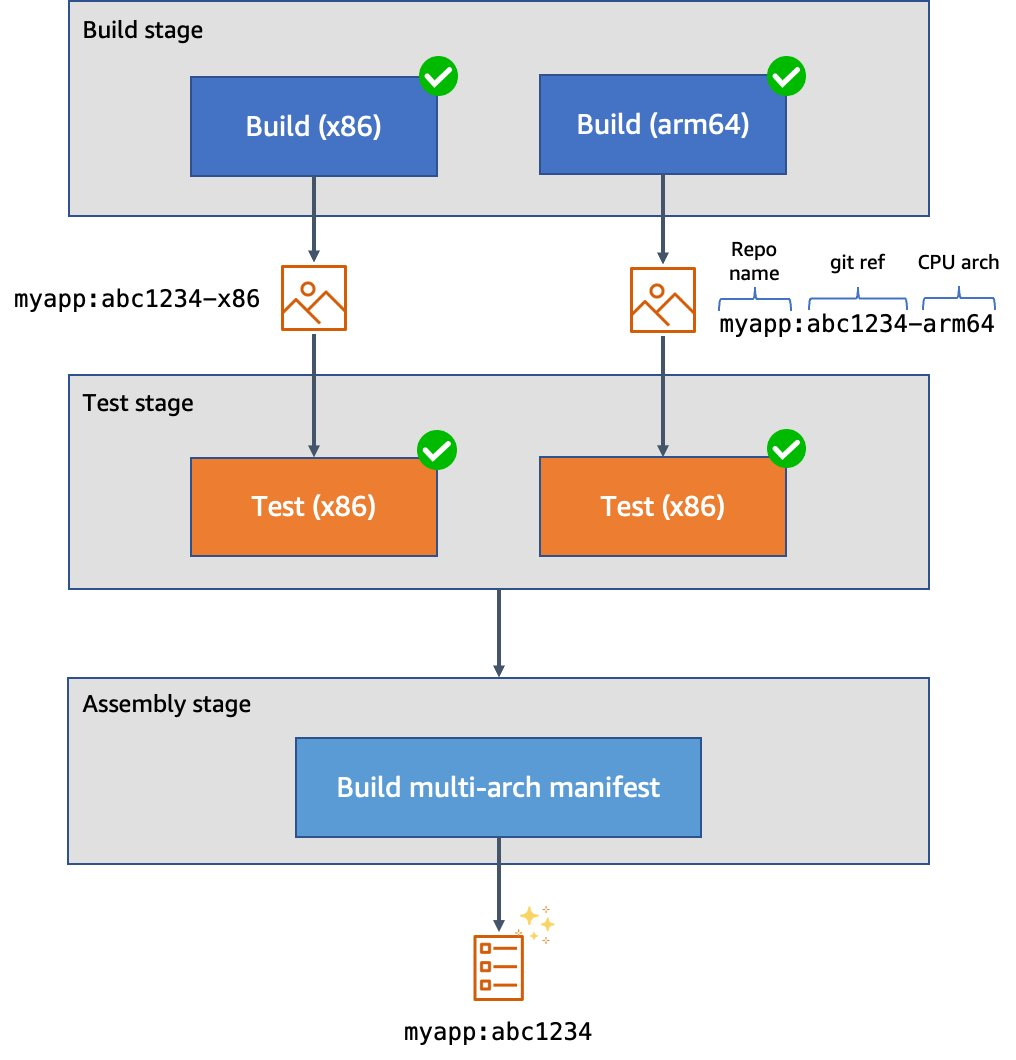
Figure 2. Example CI/CD pipeline for multi-architecture images.
Here’s what our top-level configuration looks like:
Here’s what our test stage job looks like. This time we use the image that we just produced. Our source code is copied into the application container. Then, we can run make test-api to execute the server test suite.
Finally, here’s what our assembly stage looks like. We use Podman to build the multi-architecture manifest and push it into the image registry. Traditionally we might have used docker buildx to do this, but using Podman lets us do this work in an unprivileged container for additional security.
I’ve created a public test GitLab project containing the sample source code, and attached the runners to the project. We can see them at Settings > CI/CD > Runners:
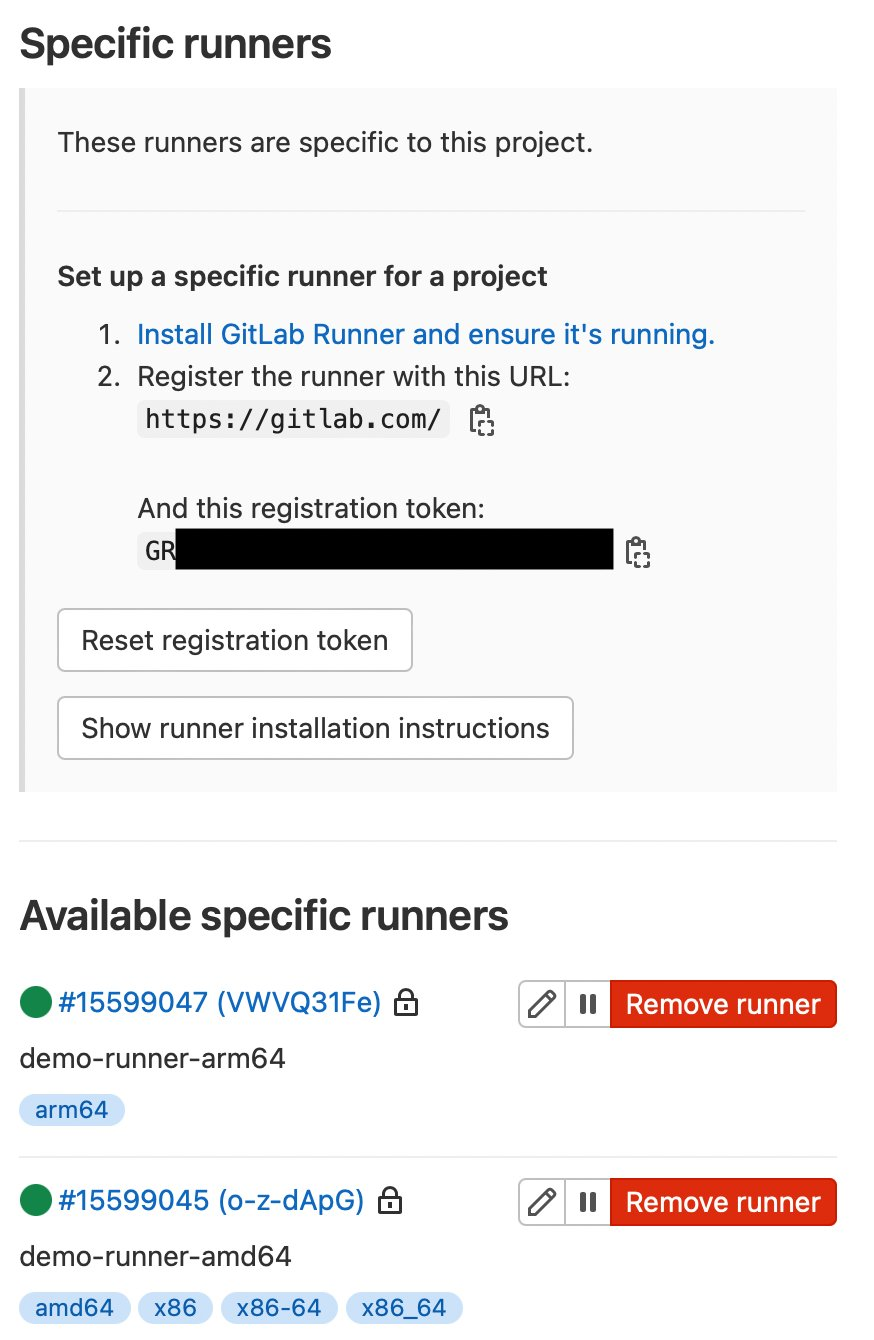
Figure 3. GitLab runner configurations.
Here we can also see some pipeline executions, where some have succeeded, and others have failed.
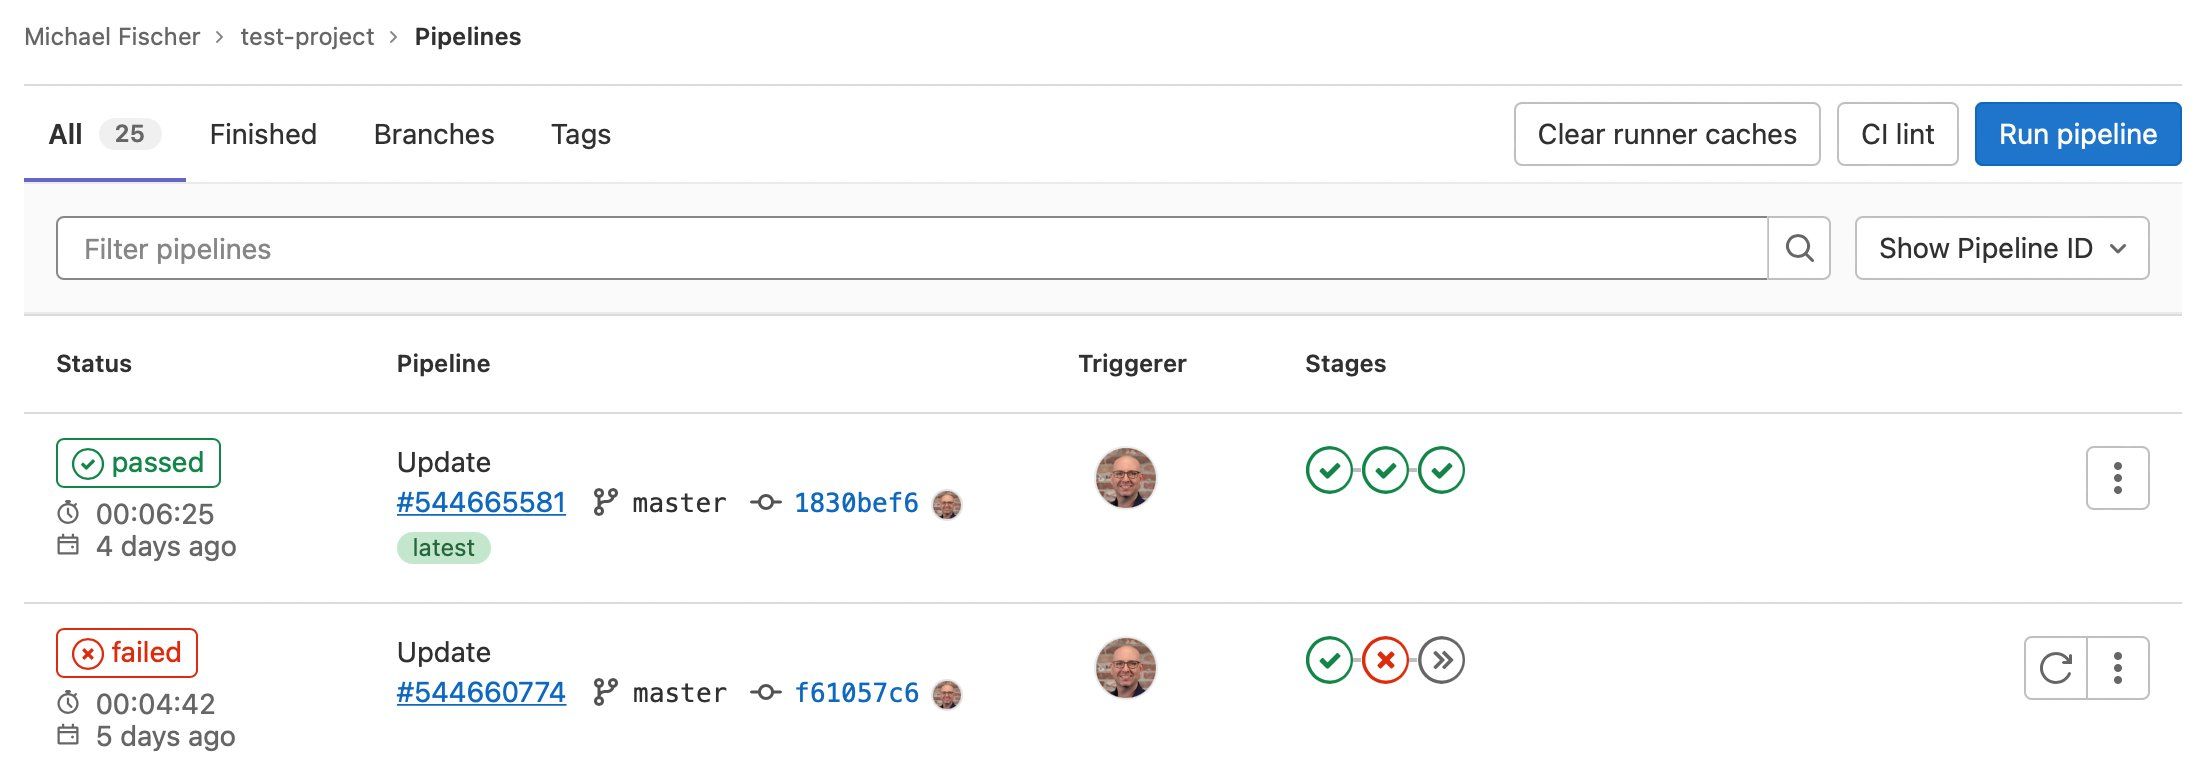
Figure 4. GitLab sample pipeline executions.
We can also see the specific jobs associated with a pipeline execution:
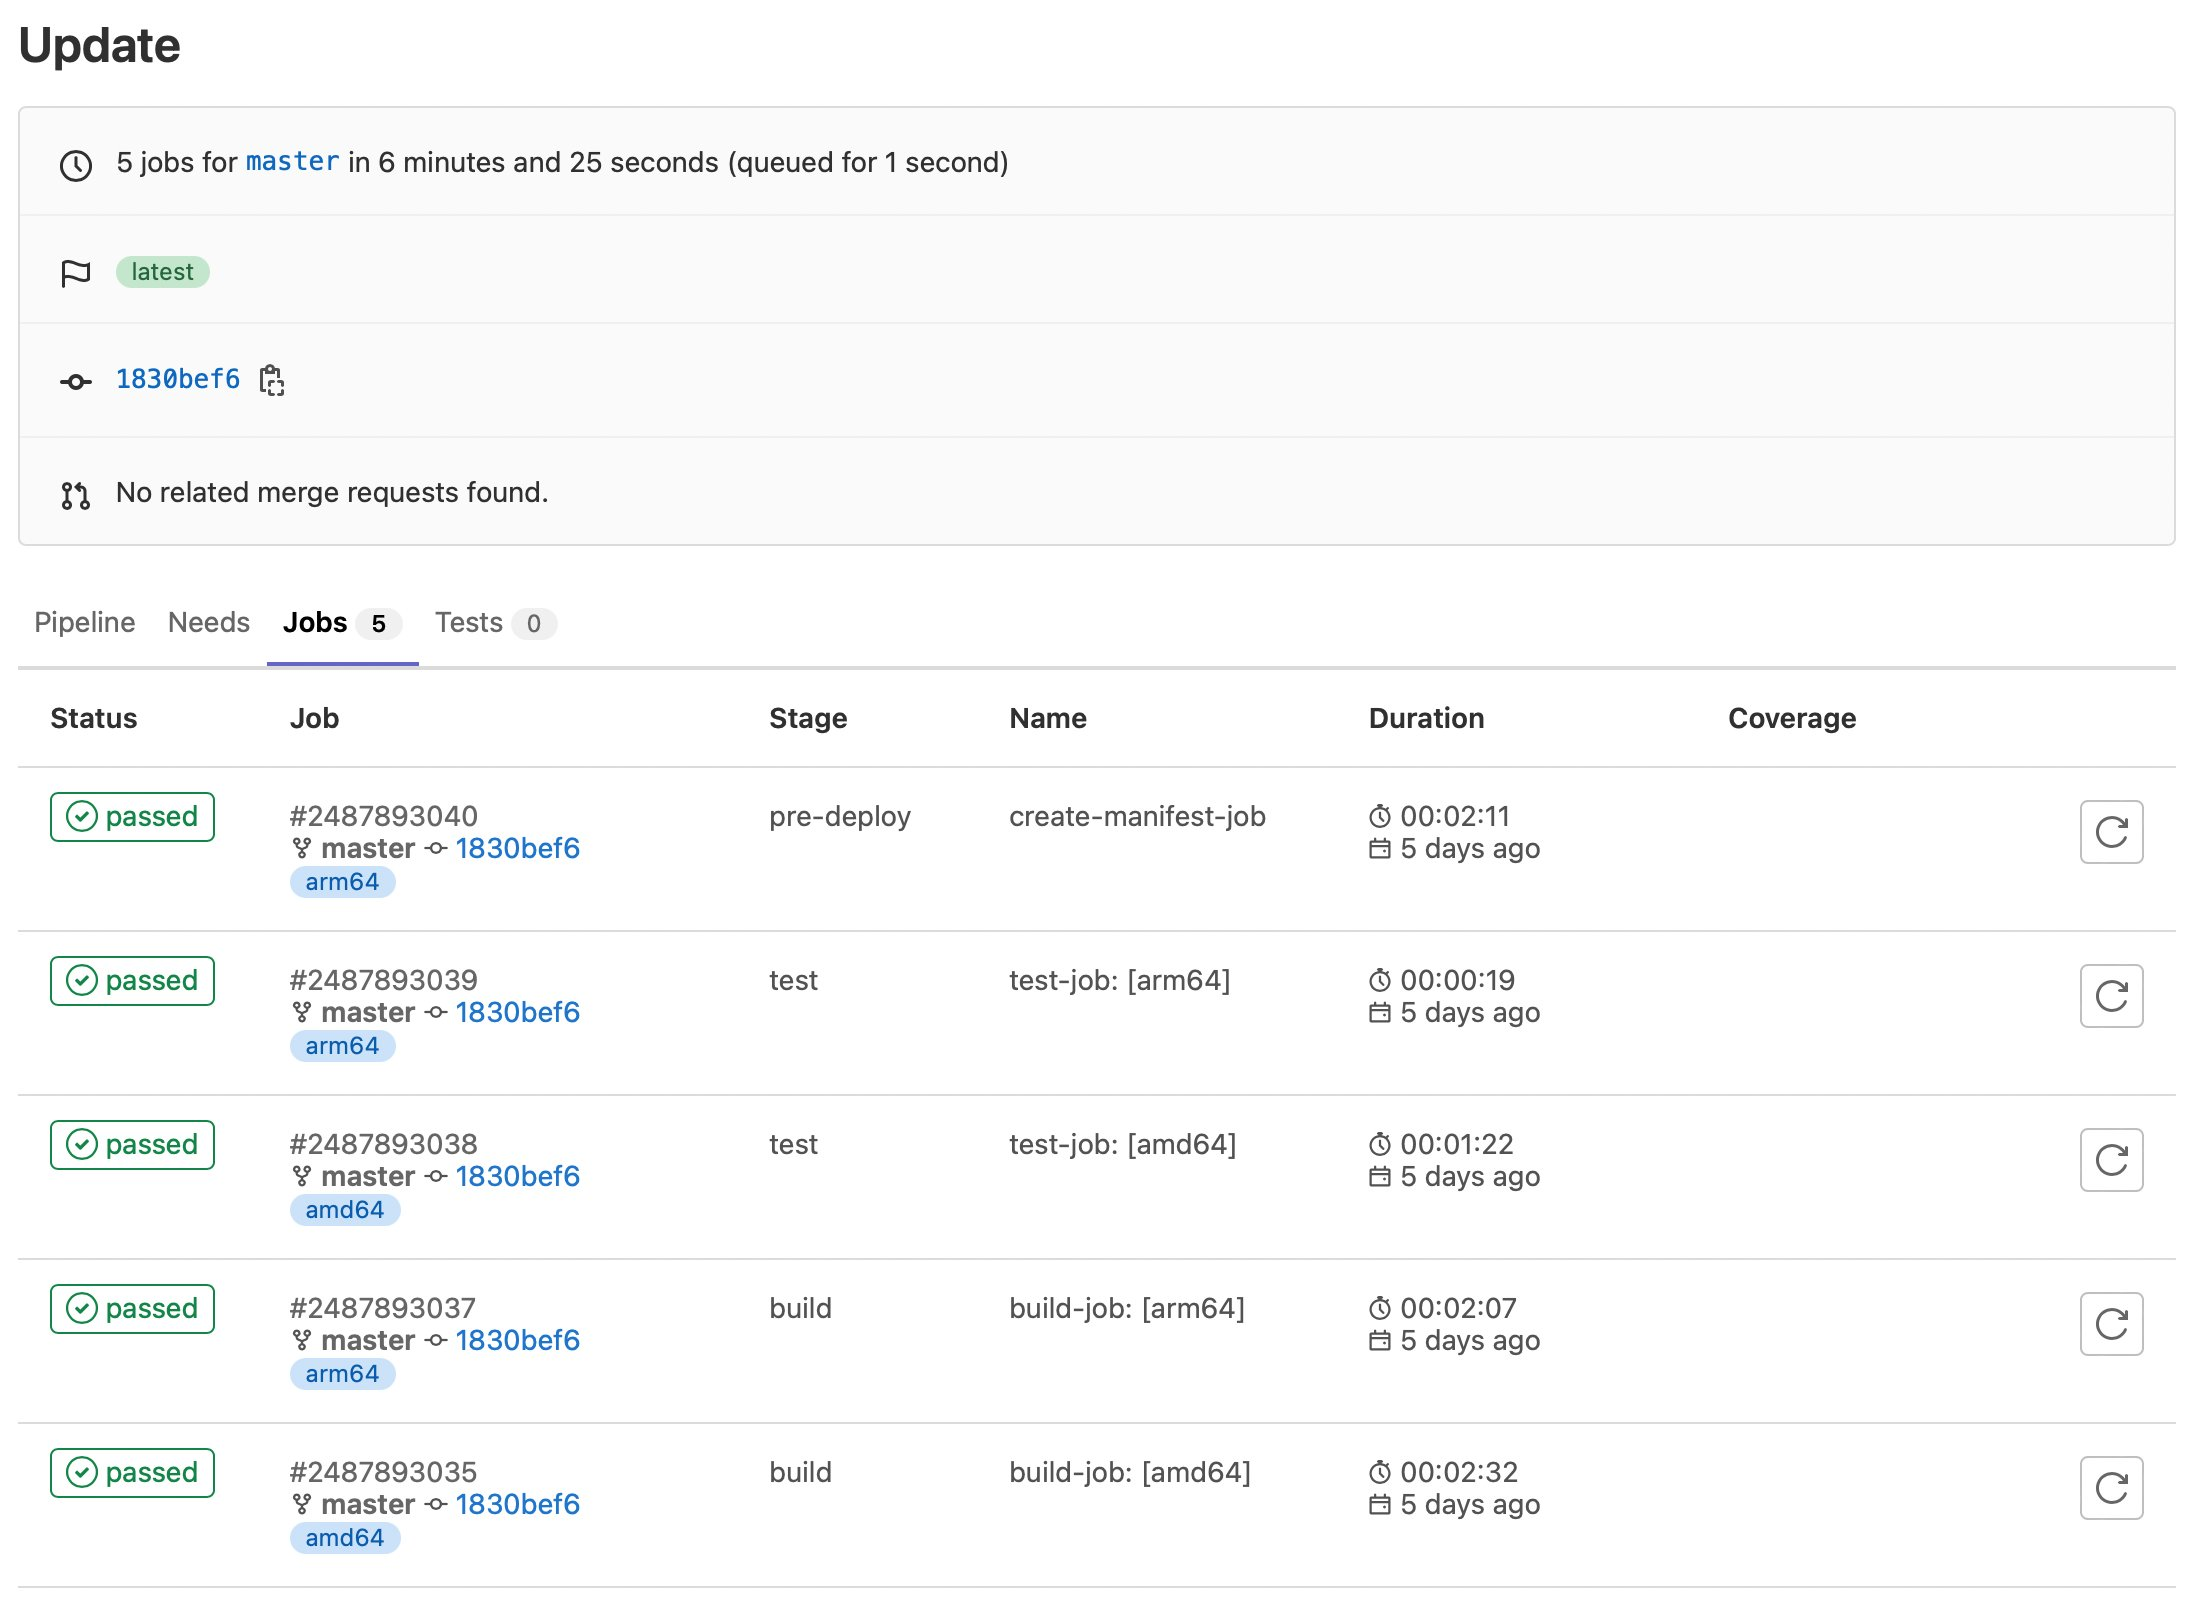
Figure 5. GitLab sample job executions.
Finally, here are our container images:
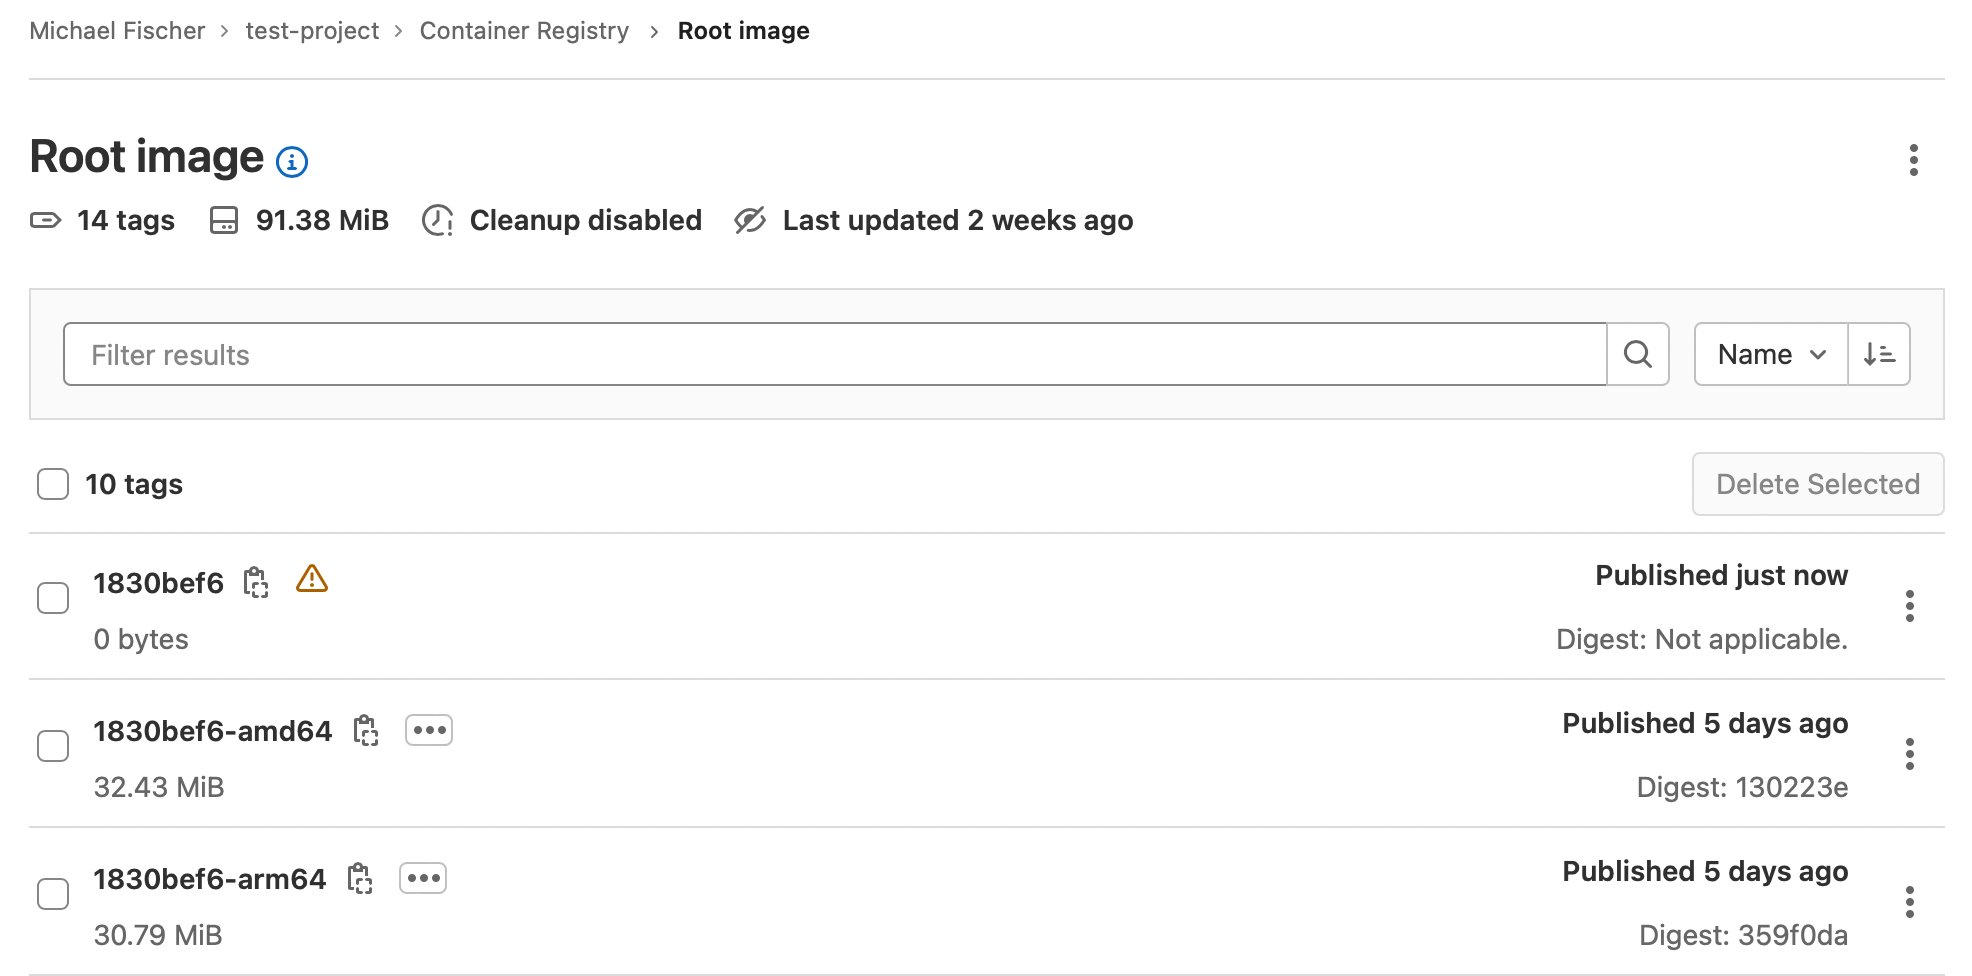
Figure 6. GitLab sample container registry.
In this post, we’ve illustrated how you can quickly and easily construct multi-architecture container images with GitLab, Amazon EKS, Karpenter, and Amazon EC2, using both x86 and Graviton instance families. We indexed on using as many managed services as possible, maximizing security, and minimizing complexity and TCO. We dove deep on multiple facets of the process, and discussed how to save up to 90% of the solution’s cost by using Spot instances for CI/CD executions.
Find the sample code, including everything shown here today, in our GitLab repository.
Building multi-architecture images will unlock the value and performance of running your applications on AWS Graviton and give you increased flexibility over compute choice. We encourage you to get started today.
About the author:
Post Syndicated from Iris Kraja original https://aws.amazon.com/blogs/devops/multi-branch-pipeline-management-and-infrastructure-deployment-using-aws-cdk-pipelines/
This post describes how to use the AWS CDK Pipelines module to follow a Gitflow development model using AWS Cloud Development Kit (AWS CDK). Software development teams often follow a strict branching strategy during a solutions development lifecycle. Newly-created branches commonly need their own isolated copy of infrastructure resources to develop new features.
CDK Pipelines is a construct library module for continuous delivery of AWS CDK applications. CDK Pipelines are self-updating: if you add application stages or stacks, then the pipeline automatically reconfigures itself to deploy those new stages and/or stacks.
The following solution creates a new AWS CDK Pipeline within a development account for every new branch created in the source repository (AWS CodeCommit). When a branch is deleted, the pipeline and all related resources are also destroyed from the account. This GitFlow model for infrastructure provisioning allows developers to work independently from each other, concurrently, even in the same stack of the application.
The following diagram provides an overview of the solution. There is one default pipeline responsible for deploying resources to the different application environments (e.g., Development, Pre-Prod, and Prod). The code is stored in CodeCommit. When new changes are pushed to the default CodeCommit repository branch, AWS CodePipeline runs the default pipeline. When the default pipeline is deployed, it creates two AWS Lambda functions.
These two Lambda functions are invoked by CodeCommit CloudWatch events when a new branch in the repository is created or deleted. The Create Lambda function uses the boto3 CodeBuild module to create an AWS CodeBuild project that builds the pipeline for the feature branch. This feature pipeline consists of a build stage and an optional update pipeline stage for itself. The Destroy Lambda function creates another CodeBuild project which cleans all of the feature branch’s resources and the feature pipeline.

Figure 1. Architecture diagram.
Before beginning this walkthrough, you should have the following prerequisites:
Download the repository from GitHub:
Create a new CodeCommit repository in the AWS Account and region where you want to deploy the pipeline and upload the source code from above to this repository. In the config.ini file, change the repository_name and region variables accordingly.
Make sure that you set up a fresh Python environment. Install the dependencies:
Run the initial-deploy.sh script to bootstrap the development and production environments and to deploy the default pipeline. You’ll be asked to provide the following parameters: (1) Development account ID, (2) Development account AWS profile name, (3) Production account ID, and (4) Production account AWS profile name.
In the CI/CD pipeline, we set up an if condition to deploy the default branch resources only if the current branch is the default one. The default branch is retrieved programmatically from the CodeCommit repository. We deploy an Amazon Simple Storage Service (Amazon S3) Bucket and two Lambda functions. The bucket is responsible for storing the feature branches’ CodeBuild artifacts. The first Lambda function is triggered when a new branch is created in CodeCommit. The second one is triggered when a branch is deleted.
Then, the CodeCommit repository is configured to trigger these Lambda functions based on two events:
(1) Reference created
(2) Reference deleted
The two Lambda functions build and destroy application environments mapped to each feature branch. An Amazon CloudWatch event triggers the LambdaTriggerCreateBranch function whenever a new branch is created. The CodeBuild client from boto3 creates the build phase and deploys the feature pipeline.
The create function deploys a feature pipeline which consists of a build stage and an optional update pipeline stage for itself. The pipeline downloads the feature branch code from the CodeCommit repository, initiates the Build and Test action using CodeBuild, and securely saves the built artifact on the S3 bucket.
The Lambda function handler code is as follows:
Create branch CodeBuild project’s buildspec.yaml content:
The second Lambda function is responsible for the destruction of a feature branch’s resources. Upon the deletion of a feature branch, an Amazon CloudWatch event triggers this Lambda function. The function creates a CodeBuild Project which destroys the feature pipeline and all of the associated resources created by that pipeline. The source property of the CodeBuild Project is the feature branch’s source code saved as an artifact in Amazon S3.
The Lambda function handler code is as follows:
Destroy the branch CodeBuild project’s buildspec.yaml content:
On your machine’s local copy of the repository, create a new feature branch using the following git commands. Replace user-feature-123 with a unique name for your feature branch. Note that this feature branch name must comply with the CodePipeline naming restrictions, as it will be used to name a unique pipeline later in this walkthrough.
The first Lambda function will deploy the CodeBuild project, which then deploys the feature pipeline. This can take a few minutes. You can log in to the AWS Console and see the CodeBuild project running under CodeBuild.

Figure 2. AWS Console – CodeBuild projects.
After the build is successfully finished, you can see the deployed feature pipeline under CodePipelines.

Figure 3. AWS Console – CodePipeline pipelines.
The Lambda S3 trigger project from AWS CDK Samples is used as the infrastructure resources to demonstrate this solution. The content is placed inside the src directory and is deployed by the pipeline. When visiting the Lambda console page, you can see two functions: one by the default pipeline and one by our feature pipeline.

Figure 4. AWS Console – Lambda functions.
There are two common ways for removing feature branches. The first one is related to a pull request, also known as a “PR”. This occurs when merging a feature branch back into the default branch. Once it’s merged, the feature branch will be automatically closed. The second way is to delete the feature branch explicitly by running the following git commands:
The CodeBuild project responsible for destroying the feature resources is now triggered. You can see the project’s logs while the resources are being destroyed in CodeBuild, under Build history.

Figure 5. AWS Console – CodeBuild projects.
To avoid incurring future charges, log into the AWS console of the different accounts you used, go to the AWS CloudFormation console of the Region(s) where you chose to deploy, and select and click Delete on the main and branch stacks.
This post showed how you can work with an event-driven strategy and AWS CDK to implement a multi-branch pipeline flow using AWS CDK Pipelines. The described solutions leverage Lambda and CodeBuild to provide a dynamic orchestration of resources for multiple branches and pipelines.
For more information on CDK Pipelines and all the ways it can be used, see the CDK Pipelines reference documentation.
About the authors:
Post Syndicated from Aaron Wells original https://blog.rapid7.com/2022/12/22/hallmark-channel-securing-the-season/

It’s that time of year again…chestnuts roasting on an open-fire, kids making wish-lists, and company holiday parties where you can showcase your most outlandish ugly sweater. It’s also the time of year we all get a little bit less cynical and take in a cheesy holiday movie or two. Enter Crown Media Family Networks and its holiday hitmaker, Hallmark Channel.
Hallmark Channel—and its streaming counterparts like Hallmark Movies Now—are unique in the entertainment world. The company provides year-round programming and has many fans the world over, but the end-of-the-year holiday season is when its content really pops off. Holiday-season die-hards show up for cheesily-wistful-yet-earnest films that have become a cottage industry and an annual jingle-bell juggernaut.
In 2021, Hallmark Channel finished as the number one network among “women 18 and above”, which led to $147.8 million in revenue generated from holiday programming alone. It’s safe to assume the company doesn’t want intellectual property (IP) theft cutting into those kinds of returns.
Here’s a scary-sounding sentence for those wary of vulnerabilities: Hallmark Channel’s entire content library is managed in the cloud. Cloud has obvious advantages for any organization, like quick-scaling and not having to build on-prem systems from the ground up. However, it can also increase risk to intellectual property:
Holidays are a particularly busy time for threat actors. So, how do media companies like Hallmark Channel (or any organization) protect their intellectual property?
Making film and TV projects is a painstaking, long, and laborious process. All of the hard work by hundreds of people that goes into each project can be devalued by attackers in the blink of an eye. So to all cybersecurity professionals who are also major fans of holiday films and TV shows, let’s take up the call: Protect the IP!
You can read the previous entry in this blog series here.
Post Syndicated from Steve de Vera original https://aws.amazon.com/blogs/security/aws-cirt-announces-the-release-of-five-publicly-available-workshops/
Greetings from the AWS Customer Incident Response Team (CIRT)! AWS CIRT is dedicated to supporting customers during active security events on the customer side of the AWS Shared Responsibility Model.
Over the past year, AWS CIRT has responded to hundreds of such security events, including the unauthorized use of AWS Identity and Access Management (IAM) credentials, ransomware and data deletion in an AWS account, and billing increases due to the creation of unauthorized resources to mine cryptocurrency.
We are excited to release five workshops that simulate these security events to help you learn the tools and procedures that AWS CIRT uses on a daily basis to detect, investigate, and respond to such security events. The workshops cover AWS services and tools, such as Amazon GuardDuty, Amazon CloudTrail, Amazon CloudWatch, Amazon Athena, and AWS WAF, as well as some open source tools written and published by AWS CIRT.
To access the workshops, you just need an AWS account, an internet connection, and the desire to learn more about incident response in the AWS Cloud! Choose the following links to access the workshops.
Unauthorized IAM Credential Use – Security Event Simulation and Detection
During this workshop, you will simulate the unauthorized use of IAM credentials by using a script invoked within AWS CloudShell. The script will perform reconnaissance and privilege escalation activities that have been commonly seen by AWS CIRT and that are typically performed during similar events of this nature. You will also learn some tools and processes that AWS CIRT uses, and how to use these tools to find evidence of unauthorized activity by using IAM credentials.
Ransomware on S3 – Security Event Simulation and Detection
During this workshop, you will use an AWS CloudFormation template to replicate an environment with multiple IAM users and five Amazon Simple Storage Service (Amazon S3) buckets. AWS CloudShell will then run a bash script that simulates data exfiltration and data deletion events that replicate a ransomware-based security event. You will also learn the tools and processes that AWS CIRT uses to respond to similar events, and how to use these tools to find evidence of unauthorized S3 bucket and object deletions.
Cryptominer Based Security Events – Simulation and Detection
During this workshop, you will simulate a cryptomining security event by using a CloudFormation template to initialize three Amazon Elastic Compute Cloud (Amazon EC2) instances. These EC2 instances will mimic cryptomining activity by performing DNS requests to known cryptomining domains. You will also learn the tools and processes that AWS CIRT uses to respond to similar events, and how to use these tools to find evidence of unauthorized creation of EC2 instances and communication with known cryptomining domains.
SSRF on IMDSv1 – Simulation and Detection
During this workshop, you will simulate the unauthorized use of a web application that is hosted on an EC2 instance configured to use Instance Metadata Service Version 1 (IMDSv1) and vulnerable to server side request forgery (SSRF). You will learn how web application vulnerabilities, such as SSRF, can be used to obtain credentials from an EC2 instance. You will also learn the tools and processes that AWS CIRT uses to respond to this type of access, and how to use these tools to find evidence of the unauthorized use of EC2 instance credentials through web application vulnerabilities such as SSRF.
AWS CIRT Toolkit For Automating Incident Response Preparedness
During this workshop, you will install and experiment with some common tools and utilities that AWS CIRT uses on a daily basis to detect security misconfigurations, respond to active events, and assist customers with protecting their infrastructure.
If you have feedback about this post, submit comments in the Comments section below. If you have questions about this post, contact AWS Support.
Want more AWS Security news? Follow us on Twitter.

 Michelle Mannering (@MishManners)