Tag Archives: Advanced (300)

Secure file sharing solutions in AWS: A security and cost analysis guide: Part 2

Post Syndicated from Swapnil Singh original https://aws.amazon.com/blogs/security/secure-file-sharing-solutions-in-aws-a-security-and-cost-analysis-guide-part-2/

As introduced in Part 1 of this series, implementing secure file sharing solutions in AWS requires a comprehensive understanding of your organization’s needs and constraints. Before selecting a specific solution, organizations must evaluate five fundamental areas: access patterns and scale, technical requirements, security and compliance, operational requirements, and business constraints. These areas cover everything from how files will be shared and what protocols are needed, to security measures, day-to-day operations, and business limitations.

See Part 1 of this series for detailed information about each of these fundamental areas and their specific considerations. Part 1 also covers solutions including AWS Transfer Family, Transfer Family web apps, and Amazon Simple Storage Service (Amazon S3) pre-signed URLs. This part continues our analysis with additional AWS file sharing solutions to help you make an informed decision based on your specific requirements.

Solutions

Let’s start by looking at the various file sharing mechanisms that AWS supports. The following table identifies the key AWS services needed for each solution, describes the security and cost implications of the solutions, and describes their complexity and protocol support capabilities.

Solution AWS services Security features Cost* Region control
CloudFront signed URLs CloudFront, Amazon S3, and Lambda Optional edge security using AWS Lambda@Edge, WAF integration, SSL/TLS, geo restrictions, and AWS Shield Standard (included automatically) Content delivery network (CDN) costs, request pricing, and data transfer fees Global service by design; origin can be AWS Region-specific
Amazon VPC endpoint service AWS PrivateLink, Amazon VPC, and Network Load Balancer (NLB) Complete network isolation, private connectivity, and multi-layer security Endpoint hourly charges, NLB costs, and data processing fees Service endpoints are strictly Region-specific; must create endpoints in each Region where access is needed
S3 Access Points Amazon S3, IAM, Amazon VPC (for VPC-specific access points)
  • Dedicated IAM policies per access point
  • VPC-only access restrictions available
  • Works with bucket policies for layered security
  • Supports PrivateLink for private network access
  • Compatible with S3 Block Public Access settings
  • No additional charge for S3 Access Points
  • Standard S3 request pricing applies
  • Data transfer fees apply based on standard S3 rates
  • Amazon VPC endpoint charges apply when using VPC endpoints with access points
  • Access points are Region-specific
  • Each access point is created in the same Region as its S3 bucket
  • Cross-Region access requires separate access points in each Region
  • VPC-specific access points are limited to the VPC’s Region

The following table shows the solutions described in Part 1.

Solution AWS services Security features Cost* Region control
AWS Transfer Family Transfer Family, Amazon S3, API Gateway, and Lambda Managed security, encryption in transit and at rest, IAM integration, and custom authentication $0.30 per hour per protocol, data transfer fees, and storage costs Can deploy to specific AWS Regions, can only transfer files to and from S3 buckets in the same Region
Transfer Family web apps Transfer Family, S3, and CloudFront Browser-based access, IAM Identity Center integration, and S3 Access Grants Pay-per-file operation, CloudFront costs, and storage costs Uses CloudFront (global) for web access, but backend components can be Region-specific
Amazon S3 pre-signed URLs S3 Time-limited URLs, IAM controls for URL generation, and HTTPS S3 request and data transfer fees Can be restricted to specific Regions
Serverless application with Amazon S3 presigned URLs S3, Lambda, and API Gateway Time-limited URLs, HTTPS, IAM controls, customizable authentication Pay per request and minimal infrastructure cost Components can be Region-specific

* Pricing information provided is based on AWS service rates at the time of publication and is intended as an estimation only. Additional costs may be incurred depending on your specific implementation and usage patterns. For the most current and accurate pricing details, please consult the official AWS pricing pages for each service mentioned.

Let’s examine each of the solutions in detail. Part 1 talked about AWS Transfer Family, Transfer Family web apps, and Amazon S3 pre-signed URLs. Here in Part 2, we explain the remaining solutions to help you make the right choice for your use case.

CloudFront signed URLs with Amazon S3

Amazon CloudFront signed URLs combine Amazon S3 storage with the global edge network of CloudFront to deliver files securely with lower latency.

CloudFront edge locations cache content geographically closer to users, which usually reduces latency and gives better performance for users. CloudFront also reduces the number of origin requests to Amazon S3. CloudFront integration with AWS Shield and AWS WAF provides options for additional security layers, helping to protect against DDoS events and unintended requests. You can use custom domains with AWS-provided or your own SSL/TLS certificates managed through AWS Certificate Manager (ACM), helping to facilitate secure connections from users to edge locations.

When a user requests a file, the system generates a signed URL using either a CloudFront key pair or a custom trusted signer (such as Lambda Edge) that includes security parameters such as IP restrictions, time windows, and custom policies. The major difference is the content distribution network (CDN) making performance faster by caching data geographically close to the user downloading it.

The built-in logging and monitoring capabilities of CloudFront provide detailed insights into content access patterns, cache hit ratios, and security events. CloudFront integrates seamlessly with Amazon S3 to support origin access identity (OAI), helping to make sure that the S3 objects can be accessed only through CloudFront and not directly through S3 APIs.
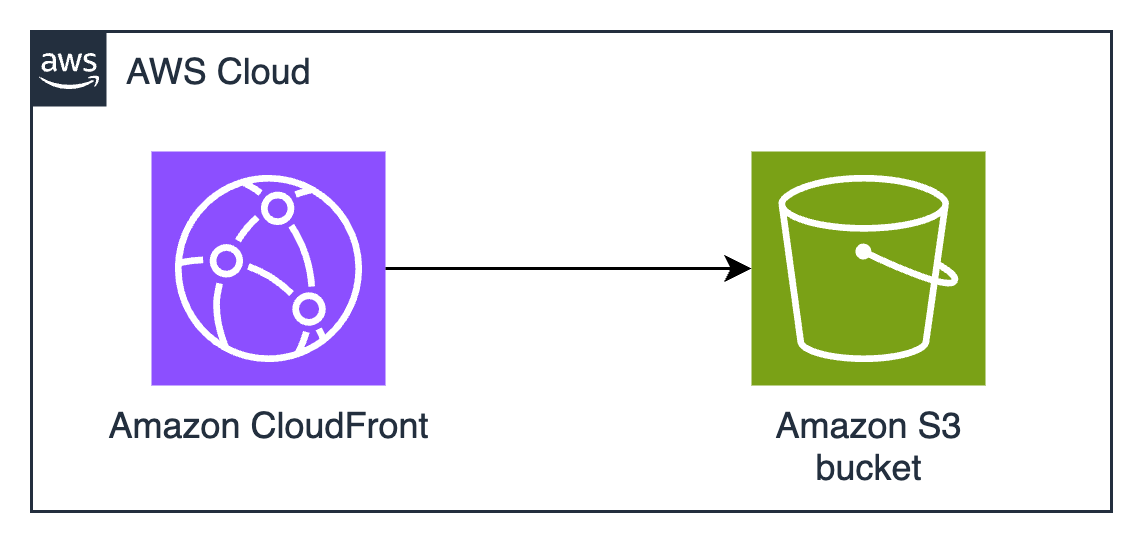
Figure 1: CloudFront signed URLs with Amazon S3 architecture

Figure 1: CloudFront signed URLs with Amazon S3 architecture

Pros

If Amazon S3 pre-signed URLs sound good, but you need higher performance at a global scale, CloudFront signed URLs are the right choice. The AWS global edge network has points of presence (POPs) all over the world, which significantly reduces latency for users and minimizes data transfer costs through caching. This architecture provides substantial cost savings for frequently accessed content, because edge locations serve cached copies without retrieving objects from the S3 origin. The integration with AWS security services offers protection against various threats, including sophisticated distributed denial of service (DDoS) events and web application issues, making it particularly suitable for public-facing file sharing applications. Choose CloudFront instead of S3 if you tend to make the same file available to many people who download it many times, such as in software distribution or documentation distribution.

The solution’s security model provides extensive flexibility in access control implementation. You can define granular permissions through custom policies, implement geo-restriction rules, and enforce IP-based access controls. The ability to use custom TLS certificates and domains maintains brand consistency while helping to facilitate secure communications. The integration with AWS WAF enables advanced request filtering and rate limiting, while detailed access logging and real-time metrics provide visibility into content delivery and security events. The solution’s support for both signed URLs and signed cookies offers flexibility in implementing various access control scenarios. Signed cookies are used when you want to provide access to multiple restricted files. For example, if you need to provide access to many files in a private directory, you can use signed cookies to avoid having to create individual signed URLs for each file. When choosing between CloudFront signed URLs (ideal for individual file access) or signed cookies (better for providing access to multiple files, like a subscriber’s content library), consider your content distribution needs and whether your clients support cookies.

Cons

If you implement CloudFront, you must develop expertise in its configuration options, including robust key management processes and secure key rotation procedures. Self-managed certificates don’t automatically renew. You must track expiration dates and make sure you renew on time, or your users will get warnings and errors when they try to download. ACM can simplify TLS certificate management and automatically renew certificates before they expire. while trusted signer workflows enhance your security posture.

Note: To create signed URLs, you need a signer. A signer is either a trusted key group that you create in CloudFront, or an AWS account that contains a CloudFront key pair.

Misconfigured web caches have many surprising and frustrating effects for users. Understanding and configuring CloudFront cache behavior is key to helping to prevent unintended content exposure or availability issues. You need to add cache invalidation to your publication workflows so that old versions are no longer available from the cache. This might introduce additional costs and operational overhead, especially in scenarios with frequent content changes. If you frequently change the content that you share, if the content is unique to an individual (such as a personalized report), or if the same content isn’t downloaded many times by many people in many locations, you won’t realize much cost savings or reduced latency from CloudFront caching. The additional complexity added by cache configuration might not be justified unless the cache is used a lot.

If you use the CloudFront global content delivery network, your content will be stored in caches in hundreds of locations around the world. ACM will store your TLS certificates for CloudFront (whether ACM is issuing them or you manage them yourself) in the us-east-1 AWS Region. Because CloudFront is a global service, it automatically distributes the certificate from the us-east-1 Region to the Regions associated with your CloudFront distribution. Caching data and keys around the world might not be acceptable if you have data sovereignty requirements to keep your data in one country.

From a cost perspective, while CloudFront can provide savings through caching, the pricing model has other variables to consider. Data transfer costs vary by Region and can be significant for large-scale distributions. If you need custom domain names and custom TLS certificates, that might introduce additional costs. Implementation expertise is needed when dealing with dynamic content or when specific origin request handling is required. CloudFront only delivers via HTTPS and HTTP protocols, so you won’t be able to use it if you require support for other file transfer protocols. CloudFront distributions provide statistics on cache hit-and-miss rates—pay attention to these because low cache hit rates mean that you’re pulling data from the origin frequently, which limits the possible cost savings.

Amazon VPC endpoint service with custom application

Amazon VPC endpoint services, powered by AWS PrivateLink, enable private connectivity between VPCs without requiring internet access, VPN connections, or direct physical connections. This solution creates a highly secure, private network path for file sharing by exposing services through Network Load Balancers (NLB) and allowing other VPCs to access them through interface endpoints. The architecture isolates the file sharing service from the public internet, operating entirely within the AWS private network infrastructure.

The best use cases for this architecture involve sharing data or distributing software around your AWS infrastructure without exposing it to the public internet.
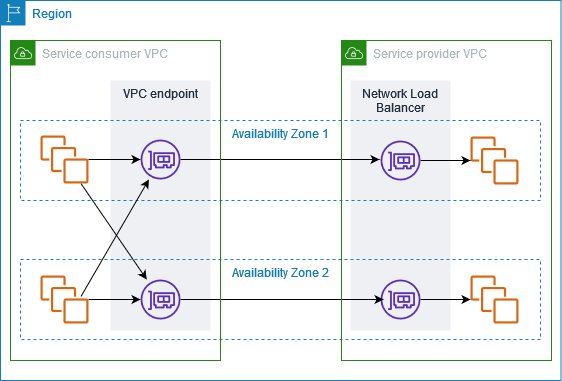
Figure 2: Amazon VPC endpoint service architecture

Figure 2: Amazon VPC endpoint service architecture

The solution, shown in Figure 2, typically involves deploying a custom file sharing application behind an NLB in the service VPC, which is then exposed as an endpoint service. Consumer VPCs create interface endpoints to connect to this service, establishing private connectivity through the AWS backbone network. Traffic remains within the AWS network, is encrypted in transit, and is subject to security controls at both the endpoint and VPC levels. The architecture supports many TCP-based protocols, making it versatile for various file transfer requirements.

This architecture provides secure pathways for data to travel by using multiple layers, including VPC security groups, network access control lists (ACLs), endpoint policies, and the custom application’s authentication mechanisms. The built-in security features of PrivateLink are designed so that only approved AWS principals can create interface endpoints to connect to the service, while detailed VPC flow logs provide network traffic visibility.

Pros

Amazon VPC endpoint services provide complete network isolation and private connectivity that’s inaccessible from the public internet. This reduces the exposure footprint and helps meet security requirements for sensitive data transfer operations. The solution maintains private connectivity across different AWS accounts and Regions while keeping traffic within the AWS network infrastructure.

This solution also provides the most flexible protocol support. Other solutions require you to use HTTPS, AWS API calls (which are HTTPS), or one of the protocols supported by Transfer Family (such as SFTP). If you have software that uses custom protocols, and you need security controls and network isolation, this architecture provides predictable performance through dedicated network paths and supports high throughput requirements without internet bandwidth constraints. The granular control over network security through VPC security groups, network ACLs, and endpoint policies enables organizations to implement defense-in-depth strategies effectively. Additionally, the solution’s integration with AWS Organizations facilitates centralized management and governance across multiple accounts.

Cons

Setting up and maintaining VPC endpoints requires significant expertise in AWS networking, including VPC design, PrivateLink configuration, and network security controls. The initial architecture design must carefully consider IP address management, service quotas, and Regional availability to provide scalability and reliability. Organizations must also develop and maintain the custom file sharing application in addition to the VPC endpoints.

This solution has many components that incur hourly and bandwidth-related charges. Each interface endpoint incurs hourly charges and data processing fees, which can accumulate significantly in multi-VPC or multi-Region deployments. NLBs add another cost component, and you must maintain sufficient capacity for peak loads. The solution also has operational costs because of the need for specialized expertise and ongoing maintenance. Additionally, while the private connectivity model provides superior security, it can make troubleshooting more challenging and might require additional tooling for effective monitoring and diagnostics. The Regional nature of VPC endpoints might necessitate additional architecture for multi-Region deployments, potentially increasing both costs and operational overhead. This solution is most suitable when private network security considerations are the highest priority, and cost considerations are secondary.

Amazon S3 Access Points

Amazon S3 Access Points simplify managing data access at scale for applications using shared data sets on S3. Access points are named network endpoints attached to S3 buckets that streamline managing access to shared datasets. Each access point has its own AWS Identity and Access Management (IAM) policy that controls access to the data, allowing you to create custom access permissions for different applications or user groups accessing the same bucket.

The architecture uses S3 buckets with access points providing dedicated access paths to the data. Each access point has its own hostname (URL) and access policy that works in conjunction with the bucket policy. You can create access points that only allow connections from your Amazon Virtual Private Cloud (Amazon VPC) for private network access to Amazon S3 or create access points with Internet connectivity. You can use this flexibility to implement sophisticated access control patterns while maintaining a single source of truth in S3.
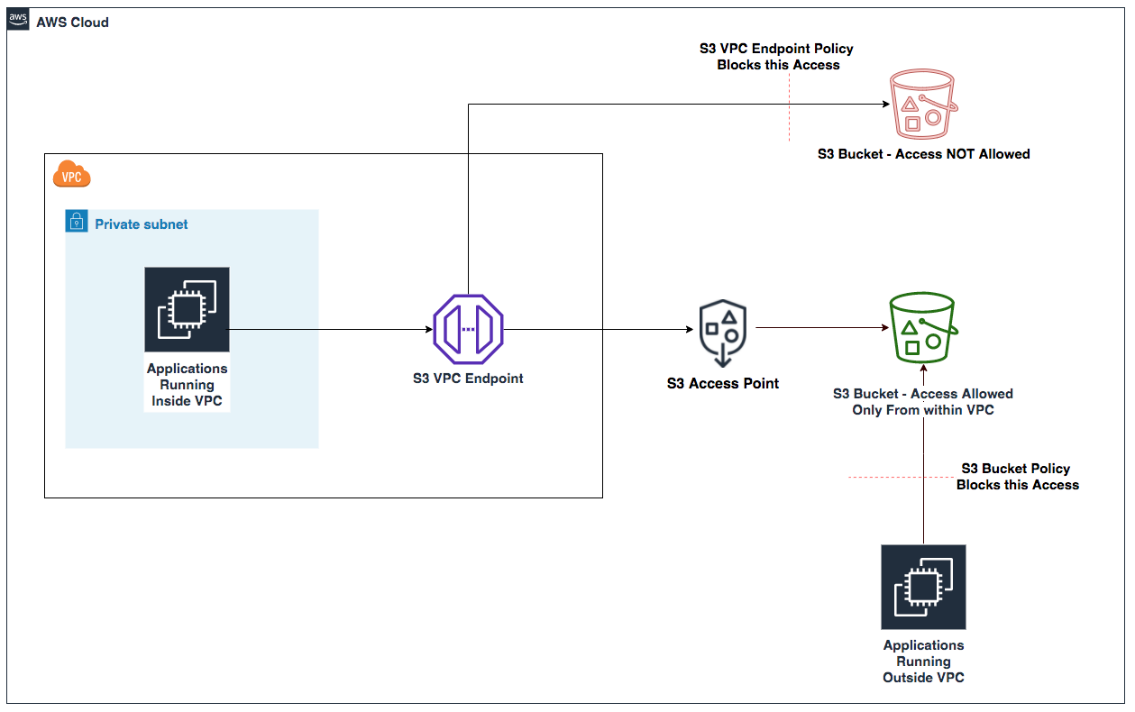
Figure 3: S3 Access Points with VPC endpoints

Figure 3: S3 Access Points with VPC endpoints

Pros

Amazon S3 Access Points simplify permissions management and security to accommodate multiple access patterns and use cases. For example, if an S3 bucket contains data that needs to be accessed by multiple applications, each requiring different levels of access, you can create a dedicated access point for each application with precisely the permissions it needs, rather than managing a long monolithic bucket policy.

You can implement access control workflows, such as restricting access to specific VPCs, encryption, or limit access to specific objects or prefixes. The service requires no new infrastructure management, reducing operational overhead and allowing you to focus on business logic implementation.

Access points provide a way to enforce network controls through VPC-only access points, helping to make sure that data can only be accessed from within your private network. IAM permissions management becomes more granular and straightforward to audit when each application or user group has its own access point with a dedicated policy. You can associate different access points with different network origins.

Another possible use case is when you need to provide temporary access to specific data within a bucket without modifying the bucket policy. You can create a temporary access point with the necessary permissions and delete it when the access is no longer needed.

Cons

Access points add another layer to your Amazon S3 architecture that needs to be managed and monitored. Each access point has its own Amazon Resource Name (ARN) and hostname that applications need to use instead of the bucket name, which might require changes to your application code.

There are limits to the number of access points you can create for each bucket, which might be a constraint for large-scale applications. Access points can only control access to the bucket they’re associated with, not across multiple buckets, so if your application needs to access data across buckets, you’ll need multiple access points.

When implementing this solution, you need to design your access point policies to make sure that they work correctly with your bucket policy. Think of your S3 bucket policy as the primary security framework, while access point policies act as specialized gatekeepers. These two layers of security must work in harmony. The bucket policy takes precedence. For example, if your bucket policy explicitly denies access from specific IP ranges, an access point policy can’t override this restriction. This hierarchical relationship requires strategic planning. Start by defining your broad security boundaries in the bucket policy—perhaps allowing access only from specific VPCs or requiring encryption. Then create your access point policies within these boundaries.

While Amazon S3 Access Points offer powerful flexibility, understanding their boundaries is crucial. Cross-account scenarios, common in large enterprises or partner collaborations, require careful configuration. Imagine you’re working with an external auditing firm that needs temporary access to your financial data stored in S3. Setting up a cross-account access point requires creating the access point in your account, configuring a trust policy to allow the external account, verifying that the bucket policy permits access from the access point, and providing the auditors with the access point ARN and necessary IAM permissions in their account. This process maintains tight control over your data while enabling secure cross-account access.

Some Amazon S3 operations are only controlled at the bucket level and can’t be controlled by access points. Core bucket operations such as configuring versioning, logging, managing lifecycle policies, and setting up cross-Region replication require direct bucket access. For these operations, you need to interact directly with the bucket through the appropriate permissions. This limitation helps make sure that fundamental bucket configurations remain centralized and controlled by bucket owners.

Creating a dedicated IAM role for bucket administration tasks—separate from the roles that interact with data through access points—enhances security and aligns with the principle of least privilege.

Conclusion

In this second part of a two-part post, you’ve learned about multiple solutions for secure file sharing using AWS services and the pros and cons of each. You can find additional options and a full decision matrix in Part 1. The optimal solution depends on your specific organizational requirements, technical capabilities, and budget constraints. You don’t have to choose just one option, you can implement multiple solutions to address different use cases, creating a file sharing strategy that balances security, cost, and operational efficiency.

Additional resources:

If you have feedback about this post, submit comments in the Comments section below.
Swapnil Singh

Swapnil Singh

Swapnil is a Senior Solutions Architect for AWS World Wide Public Sector. As a Product Acceleration Solutions Architect at AWS, she currently works with GovTech customers to ideate, design, validate, and launch products using cloud-native technologies and modern development practices.

Sumit Bhati

Sumit Bhati

Sumit is a Senior Customer Solutions Manager at AWS, specializing in expediting the cloud journey for enterprise customers. Sumit is dedicated to assisting customers through every phase of their cloud adoption, from accelerating migrations to modernizing workloads and facilitating the integration of innovative practices.

How to migrate your Amazon EC2 Oracle Transparent Data Encryption database encryption keystore to AWS CloudHSM

Post Syndicated from Bhushan Bhale original https://aws.amazon.com/blogs/security/how-to-migrate-your-ec2-oracle-transparent-data-encryption-tde-database-encryption-wallet-to-cloudhsm/

July 30, 2025: This post has been republished to migrate the Amazon EC2 Oracle Transparent Data Encryption database encryption keystore to AWS CloudHSM using AWS CloudHSM Client SDK 5.


Encrypting databases is crucial for protecting sensitive data, helping you to be aligned with security regulations and safeguarding against data loss. Oracle Transparent Data Encryption (TDE) is a feature that you can use to encrypt data at rest within an Oracle database. TDE uses envelope encryption. Envelope encryption is when the encryption key used to encrypt the tables of your database is encrypted by a primary key that resides either in a software keystore or on a hardware keystore, such as a hardware security module (HSM). This primary key is non-exportable by design to protect the confidentiality and integrity of your database operation. This gives you a more granular encryption scheme on your data. Hence, TDE for Oracle is a common use case for HSM devices such as AWS CloudHSM.

Oracle TDE supports keystores to securely store the TDE primary encryption keys. You can use either the TDE wallet (software keystore) or external key managers such as an HSM device. In this solution, we show you how to migrate a TDE keystore for an Oracle 19c database installed on Amazon Elastic Compute Cloud (Amazon EC2) from a software-based TDE wallet to AWS CloudHSM.

Using an external key manager, such as CloudHSM, offers several benefits over keeping keys on the Oracle wallet on the host:

  • Enhanced security: CloudHSM provides FIPS 140 validated hardware security, keeping the encryption key in a tamper-resistant module.
  • Centralized key management: CloudHSM supports centralized management of encryption keys, making it straightforward to rotate, back up, and audit keys.
  • Compliance: Your regulatory requirements may include encryption, and using CloudHSM can help you meet these compliance needs.

When you move from one type of keystore to another, new TDE primary keys are created inside the new keystore. To make sure that you have access to backups that rely on your past encryption keys, consider leaving the keystore running for your normal recovery window period or copying existing keys to the new keystore with exact key labels. Being able to access prior primary keys will help avoid data re-encryption.

You can use TDE to encrypt data online or offline. Encrypting TDE tablespace online minimizes disruption to database operations; however, it requires twice the storage space as the tablespace being encrypted, because the encryption process happens on a copy of the original tablespace.

Solution overview

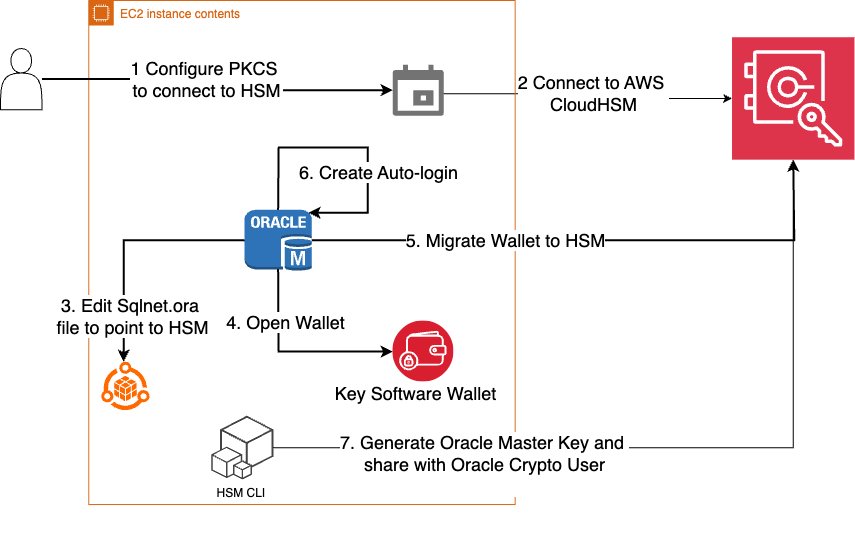
In this solution, you migrate a TDE keystore for an Oracle 19c database from a software-based TDE wallet to CloudHSM, using the steps shown in Figure 1. Start by moving the current encryption keystore, which is your original TDE wallet, to a software wallet. This is done by replacing the PKCS#11 provider of your original HSM with the CloudHSM PKCS#11 software library (steps 1–2), next you reverse migrate to a local wallet (steps 3–5). The third step is to switch the encryption wallet for your database to your CloudHSM cluster (steps 6 and 7). After this process is complete, your database will automatically re-encrypt the data keys using the new primary key.

Figure 1: Steps to migrate your EC2 Oracle TDE database encryption wallet to CloudHSM

Figure 1: Steps to migrate your EC2 Oracle TDE database encryption wallet to CloudHSM

Note: The following instructions were tested using Oracle version 19c.

Prerequisites

You must have the following prerequisites in place to complete the solution in this post.

  • AWS CloudHSM cluster: You need to have a CloudHSM cluster set up and configured with an admin EC2 instance for interacting with CloudHSM following steps and best practices covered in Getting started with AWS CloudHSM.
  • Oracle database: Make sure that your Oracle database is up and running. This post assumes that you have an Oracle Database 19c database running on an EC2 Linux instance and there is network connectivity set up to CloudHSM as explained in this Configure the Client Amazon EC2 instance security groups for AWS CloudHSM.

Migrate an Oracle database keystore to a CloudHSM external keystore

As the first step in the migration, you need to migrate your Oracle database keystore to a CloudHSM external keystore. You do this by installing the CloudHSM client and the PKCS#11 library and then configuring the PKCS#11 library to connect to the HSM cluster.

Install the CloudHSM client:

  1. Install the latest CloudHSM client software on your EC2 instance.
  2. Configure the client to connect to HSMs in your cluster. For Linux EC2, use the following command:
    sudo /opt/cloudhsm/bin/configure-cli -a <The ENI IPv4 / IPv6 addresses of the HSM>
    

  3. Copy the CloudHSM issuing certificate created when you initialized the cluster (customerCA.crt) to the /opt/cloudhsm/etc folder. For more information, see Activate the cluster in AWS CloudHSM.
  4. Validate connectivity to the CloudHSM cluster.
    /opt/cloudhsm/bin/cloudhsm-cli interactive
    

  5. Sign in to the cluster as admin and create a crypto user (e.g. hsm-crypto-user) and assign it the role crypto-user.
    aws-cloudhsm > login --username hsm-crypto-user --role admin
    aws-cloudhsm > user create --username hsm-crypto-user --role crypto-user
    

  6. Sign in as hsm-crypto-user and validate the configuration


Install the PKCS#11 Library

  1. Install the PKCS #11 library for AWS CloudHSM Client SDK 5.
  2. Configure Oracle to use the PKCS library:
    1. Copy the PKCS#11 library to the appropriate Oracle folder. Typically, this is:
           cp /opt/cloudhsm/libcloudhsm_pkcs11.so /opt/oracle/extapi/[32,64]/hsm/aws/{VERSION}/libcloudhsm_pkcs11.so
      

    2. Make sure that the folder /opt/oracle has the correct ownership, usually oracle:dba as owner:group.

Configure PKCS#11 library to connect to the HSM cluster

Use the following commands:

  1. sudo /opt/cloudhsm/bin/configure-pkcs11 -a <HSM IP addresses>
  2. sudo /opt/cloudhsm/bin/configure-pkcs11 --hsm-ca-cert <customerCA certificate file>

Configure the Oracle wallet location

In this section, you configure Oracle to point to CloudHSM using the sqlnet.ora file.

To configure the Oracle wallet location:

  1. Edit the sqlnet.ora parameter ENCRYPTION_WALLET_LOCATION to point to the HSM:
    ENCRYPTION_WALLET_LOCATION=
      (SOURCE=(METHOD=HSM)
      )
    

  2. Verify that the WALLET_ROOT parameter is pointing to the current file-based TDE wallet location. This parameter defines the location where the TDE wallet (and other related files) will be stored. You can set it to an existing directory, preferably one in your $ORACLE_BASE or $ORACLE_HOME directory, but other locations are also possible.
    show parameter wallet_root
    show parameter tde_configuration
    

  3. Use the following commands to set WALLET_ROOT if it hasn’t already been set.
    ALTER SYSTEM SET WALLET_ROOT = '/u01/app/oracle/admin/orcl/wallet' SCOPE=BOTH SID='*';
    ALTER SYSTEM SET TDE_CONFIGURATION=“KEYSTORE_CONFIGURATION=FILE” SCOPE=BOTH SID=“*”
    

Note:

  • In Oracle Database 19c and later, the ENCRYPTION_WALLET_LOCATION. parameter in sqlnet.ora is deprecated in favor of using WALLET_ROOT and TDE_CONFIGURATION.
  • You can also use the V$ENCRYPTION_WALLET view to check the current keystore location and status.

Point the Oracle database to use a local file-based keystore and CloudHSM

The KEYSTORE_CONFIGURATION attribute within TDE_CONFIGURATION determines the keystore type.

To point the Oracle database:

  1. Use the following code to point the database to the local keystore and CloudHSM.
    ALTER SYSTEM SET TDE_CONFIGURATION="KEYSTORE_CONFIGURATION=HSM|FILE" SCOPE = BOTH SID = '*'; 
    

  2. Restart the database to have consistent results.

Verify that the keystore file-based wallet is open

To proceed with encryption key migration, you need to check the current keystore status and make sure that the file-based wallet is open.

To verify that the wallet is open:

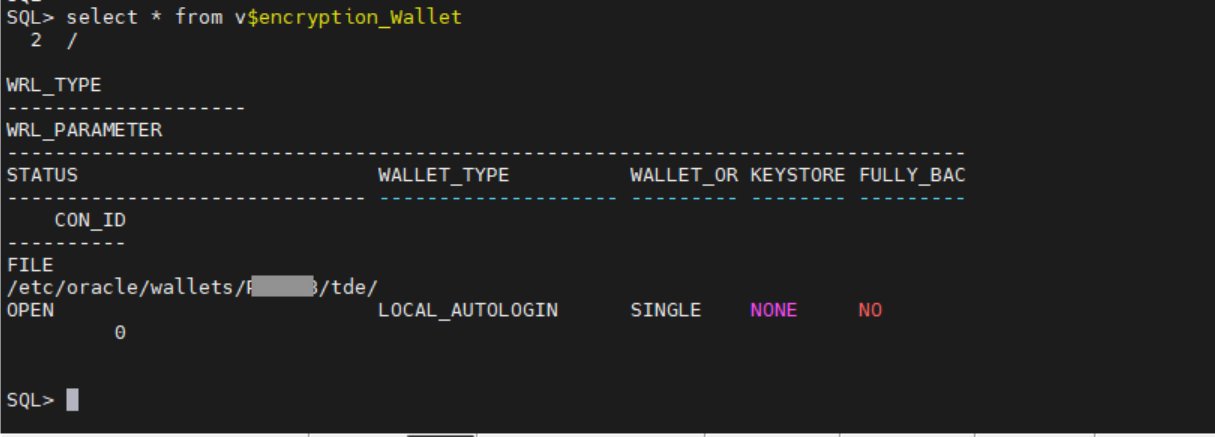
  1. Check to see if the file-based wallet is open.
    Select * from V$encryption_wallet;
    

    Figure 2: Verify that the wallet status is OPEN

    Figure 2: Verify that the wallet status is OPEN

  2. If the wallet status is not OPEN, use the following command to open it:
      ALTER SYSTEM SET ENCRYPTION WALLET OPEN IDENTIFIED BY "wallet_password";
    

Migrate the encryption key to CloudHSM

Use the ADMINISTER KEY MANAGEMENT SET ENCRYPTION KEY command to initiate the TDE primary encryption key migration.

To migrate the encryption key:

  • Use the following command to migrate the encryption key:
    ADMINISTER KEY MANAGEMENT SET ENCRYPTION KEY IDENTIFIED BY "hsm-crypto-user:password" MIGRATE USING "wallet-password" WITH BACKUP USING 'backup_tag';
    

The parameters used to migrate the encryption key are:

  • SET ENCRYPTION KEY: Specifies that the command is related to the TDE primary encryption key
  • IDENTIFIED BY: Specifies the details for migrating the keystore, including the external keystore user and password
  • MIGRATE USING: Specifies the password for the file-based wallet containing the primary encryption key
  • WITH BACKUP: Creates a backup of the keystore before the migration

Verify that the migration is complete

At this point, the migration from Oracle to Cloud HSM should be complete. Use the following steps to verify it.

To verify the migration:

  1. Check the wallet status again. If the migration was successful, the WALLET_TYPE will be HSM and the WALLET_OR will be PRIMARY.
    Select * from V$encryption_wallet;
    

    Figure 3: Verify that WALLET_TYPE and WALLET_OR are correct

    Figure 3: Verify that WALLET_TYPE and WALLET_OR are correct

  2. In the wallet is not open, use:
    SQL>administer key management set keystore open identified by "hsm-crypto-user:password"
    

  3. Verify that the database can access encrypted data without issues, confirming that the migration was successful.

Setup auto-login

Create auto-login to open the wallet during database restarts to connect to AWS CloudHSM.

To set up auto_login:

  1. Create a new file-based keystore with the same username and password as the CloudHSM crypto user.
    ADMINISTER KEY MANAGEMENT CREATE KEYSTORE '/etc/oracle/wallets/<path>/tde' IDENTIFIED BY "hsm-crypto-user:password";
    

  2. Add the CloudHSM crypto user password to a keystore (TDE wallet).
    ADMINISTER KEY MANAGEMENT ADD SECRET 'hsm-crypto-user:password' FOR CLIENT 'HSM_PASSWORD' TO KEYSTORE '/etc/oracle/wallets/<path>/tde' IDENTIFIED BY "hsm-crypto-user:password" WITH BACKUP;
    

  3. The following command creates a new auto-login keystore. This is useful for scenarios where the keystore needs to be accessed without human intervention.
    ADMINISTER KEY MANAGEMENT CREATE AUTO_LOGIN KEYSTORE FROM KEYSTORE '/etc/oracle/wallets/<path>/tde' IDENTIFIED BY "<hsm-crypto-user:password>";
    

  4. Open the newly created file based keystore.
    ADMINISTER KEY MANAGEMENT SET KEYSTORE OPEN IDENTIFIED BY "<hsm-crypto-user:password>" 
    

Key rotation

Key rotation helps you to adhere to security best practices by providing several data security benefits. Regular rotation of TDE keys reduces the window of opportunity for a bad actor who might have obtained a key, thereby minimizing the impact of a potential breach.

Many established security frameworks and compliance standards—such as PCI DSS and HIPAA—recommend or require regular key rotation to maintain the integrity and confidentiality of encrypted data. By making sure that keys aren’t used indefinitely, you can help reduce the risk of exposure or compromise, which reinforces overall security.

Encryption algorithms can become less secure over time because of advancements in computing power or newly discovered vulnerabilities. By rotating keys regularly, you can transition to stronger encrypting methods as needed, and so improve protection against emerging risks.

When to rotate TDE keys

The frequency of key rotation depends on several factors, including organizational policies, regulatory requirements, and the sensitivity of the data being protected. Here are some common practices:

  • Annually: Many organizations rotate TDE keys once a year to align with common compliance requirements.
  • Quarterly: For higher-security environments or more sensitive data, rotating keys every quarter can provide an additional layer of security.
  • If keys are compromised or suspected to be compromised: If you believe a key to be compromised, rotating that key as soon as possible is recommended to reduce the impact window.

Oracle TDE primary key rotation with an HSM key

In this section, you choose a 32-bit hex value to use as a prefix when generating a key, then use that key to update the Oracle database to use the new primary key.

  1. Sign in to the database instance as a user who has the ADMINISTER KEY MANAGEMENT or SYSKM privilege and execute following command:
    ADMINISTER KEY MANAGEMENT SET ENCRYPTION KEY IDENTIFIED BY "<hsm-crypto-user:password>"
    

  2. Decide on a 32-bit hex value pattern to be used. We used 15A5142C9E2D3C2F18FD435814257DFD in this example.
  3. Add the prefix ORACLE.TDE.HSM.MK to the hex pattern.
    ORACLE.TDE.HSM.MK.0615A5142C9E2D3C2F18FD435814257DFD
    

  4. Sign in to CloudHSM and generate a key using the label generated in the previous step.
    key generate-symmetric aes --label 'ORACLE.TDE.HSM.MK.0615A5142C9E2D3C2F18FD435814257DFD' --key-length-bytes 32 —attributes encrypt=true decrypt=true“
    

  5. Share the key with the Oracle hsm-crypto-user in case the original key was generated through another user.
     key share --filter attr.label=""ORACLE.TDE.HSM.MK.0615A5142C9E2D3C2F18FD435814257DFD"" attr.class=secret-key --username hsm_crypto_user --role crypto-user
    

  6. Update the Oracle database to use the new primary TDE key.
    ADMINISTER KEY MANAGEMENT USE KEY '0615A5142C9E2D3C2F18FD435814257DFD' FORCE KEYSTORE IDENTIFIED BY "hsm-crypto-user:password"
    

By following these guidelines, you can enhance the security of your encrypted data, align with regulatory requirements, and maintain robust key management practices.

Conclusion

In this post, we’ve shown you the importance of Transparent Data Encryption (TDE) and the benefits of using an external key manager such as AWS CloudHSM for storing TDE encryption keys. We’ve discussed the benefits of TDE compared to encrypting underlying storage and why using an external key manager is superior to keeping keys on the Oracle wallet on the host. Following these guidelines can help you enhance the security of your encrypted data, align with regulatory requirements, and maintain robust key management practices.

The key takeaways from this post are:

  • TDE offers granular encryption, compliance benefits, and robust key management.
  • External key managers provide enhanced security, centralized management, improved auditability and scalability.
  • Regular rotation of TDE keys is crucial for maintaining security, aligning with regulations, and following recommended practices in key management.

To start securing your Oracle databases with TDE and AWS CloudHSM, visit the AWS Management Console. Follow the steps outlined in this guide to migrate your TDE encryption keystore to AWS CloudHSM and begin rotating your keys regularly to enhance your data security posture. By taking these actions, you can make sure that your sensitive data remains protected, your organization remains aligned with regulations, and you are following the best practices in data encryption and key management.

For more information, see:

If you have feedback about this post, submit comments in the Comments section below.
Bhushan Bhale

Bhushan Bhale

Bhushan is a Senior ISV Solutions Architect at AWS based in Denver, CO with more than 20 years of experience in the technology, telecommunications, and start-up industry. He is a member of the AWS Security TFC with a focus on Data Privacy and Security.

Sudeesh Veettil

Sudeesh Veettil

Sudeesh is a Senior Technical Account Manager at AWS based in the Dallas, TX area, with over 20 years of experience in the technology industry. He specializes in helping customers design, build, and operate secure, resilient, and efficient solutions on AWS.

Optimize traffic costs of Amazon MSK consumers on Amazon EKS with rack awareness

Post Syndicated from Austin Groeneveld original https://aws.amazon.com/blogs/big-data/optimize-traffic-costs-of-amazon-msk-consumers-on-amazon-eks-with-rack-awareness/

Are you incurring significant cross Availability Zone traffic costs when running an Apache Kafka client in containerized environments on Amazon Elastic Kubernetes Service (Amazon EKS) that consume data from Amazon Managed Streaming for Apache Kafka (Amazon MSK) topics?

If you’re not familiar with Apache Kafka’s rack awareness feature, we strongly recommend starting with the blog post on how to Reduce network traffic costs of your Amazon MSK consumers with rack awareness for an in-depth explanation of the feature and how Amazon MSK supports it.

Although the solution described in that post uses an Amazon Elastic Compute Cloud (Amazon EC2) instance deployed in a single Availability Zone to consume messages from an Amazon MSK topic, modern cloud-native architectures demand more dynamic and scalable approaches. Amazon EKS has emerged as a leading platform for deploying and managing distributed applications. The dynamic nature of Kubernetes introduces unique implementation challenges compared to static client deployments. In this post, we walk you through a solution for implementing rack awareness in consumer applications that are dynamically deployed across multiple Availability Zones using Amazon EKS.

Here’s a quick recap of some key Apache Kafka terminology from the referenced blog. An Apache Kafka client consumer will register to read against a topic. A topic is the logical data structure that Apache Kafka organizes data into. A topic is segmented into a single or many partitions. Partitions are the unit of parallelism in Apache Kafka. Amazon MSK provides high availability by replicating each partition of a topic across brokers in different Availability Zones. Because there are replicas of each partition that reside across the different brokers that make up your MSK cluster, Amazon MSK also tracks whether a replica partition is in sync with the most recent data for that partition. This means there is one partition that Amazon MSK recognizes as containing the most up-to-date data, and this is known as the leader partition. The collection of replicated partitions is called in-sync replicas. This list of in-sync replicas is used internally when the cluster needs to elect a new leader partition if the current leader were to become unavailable.

When consumer applications read from a topic, the Apache Kafka protocol facilitates a network exchange to determine which broker currently has the leader partition that the consumer needs to read from. This means that the consumer could be told to read from a broker in a different Availability Zone than itself, leading to cross-zone traffic charge in your AWS account. To help optimize this cost, Amazon MSK supports the rack awareness feature, using which clients can ask an Amazon MSK cluster to provide a replica partition to read from, within the same Availability Zone as the client, even if it isn’t the current leader partition. The cluster accomplishes this by checking for an in-sync replica on a broker within the same Availability Zone as the consumer.

The challenge with Kafka clients on Amazon EKS

In Amazon EKS, the underlying units of computes are EC2 instances that are abstracted as Kubernetes nodes. The nodes are organized into node groups for ease of management, scaling, and grouping of applications on certain EC2 instance types. As a best practice for resilience, the nodes in a node group are spread across multiple Availability Zones. Amazon EKS uses the underlying Amazon EC2 metadata about the Availability Zone that it’s located in, and it injects that information into the node’s metadata during node configuration. In particular, the Availability Zone (AZ ID) is injected into the node metadata.

When an application is deployed in a Kubernetes Pod on Amazon EKS, it goes through a process of binding to a node that meets the pod’s requirements. As shown in the following diagram, when you deploy client applications on Amazon EKS, the pod for the application can be bound to a node with available capacity in any Availability Zone. Also, the pod doesn’t automatically inherit the Availability Zone information from the node that it’s bound to, a piece of information necessary for rack awareness. The following architecture diagram illustrates Kafka consumers running on Amazon EKS without rack awareness.

AWS Cloud architecture showing MSK brokers, EKS pods, and EC2 instances in three Availability Zones

To set the client configuration for rack awareness, the pod needs to know what Availability Zone it’s located in, dynamically, as it is bound to a node. During its lifecycle, the same pod can be evicted from the node it was bound to previously and moved to a node in a different Availability Zone, if the matching criteria permit that. Making the pod aware of its Availability Zone dynamically sets the rack awareness parameter client.rack during the initialization of the application container that is encapsulated in the pod.

After rack awareness is enabled on the MSK cluster, what happens if the broker in the same Availability Zone as the client (hosted on Amazon EKS or elsewhere) becomes unavailable? The Apache Kafka protocol is designed to support a distributed data storage system. Assuming customers follow the best practice of implementing a replication factor > 1, Apache Kafka can dynamically reroute the consumer client to the next available in-sync replica on a different broker. This resilience remains consistent even after implementing nearest replica fetching, or rack awareness. Enabling rack awareness optimizes the networking exchange to prefer a partition within the same Availability Zone, but it doesn’t compromise the consumer’s ability to operate if the nearest replica is unavailable.

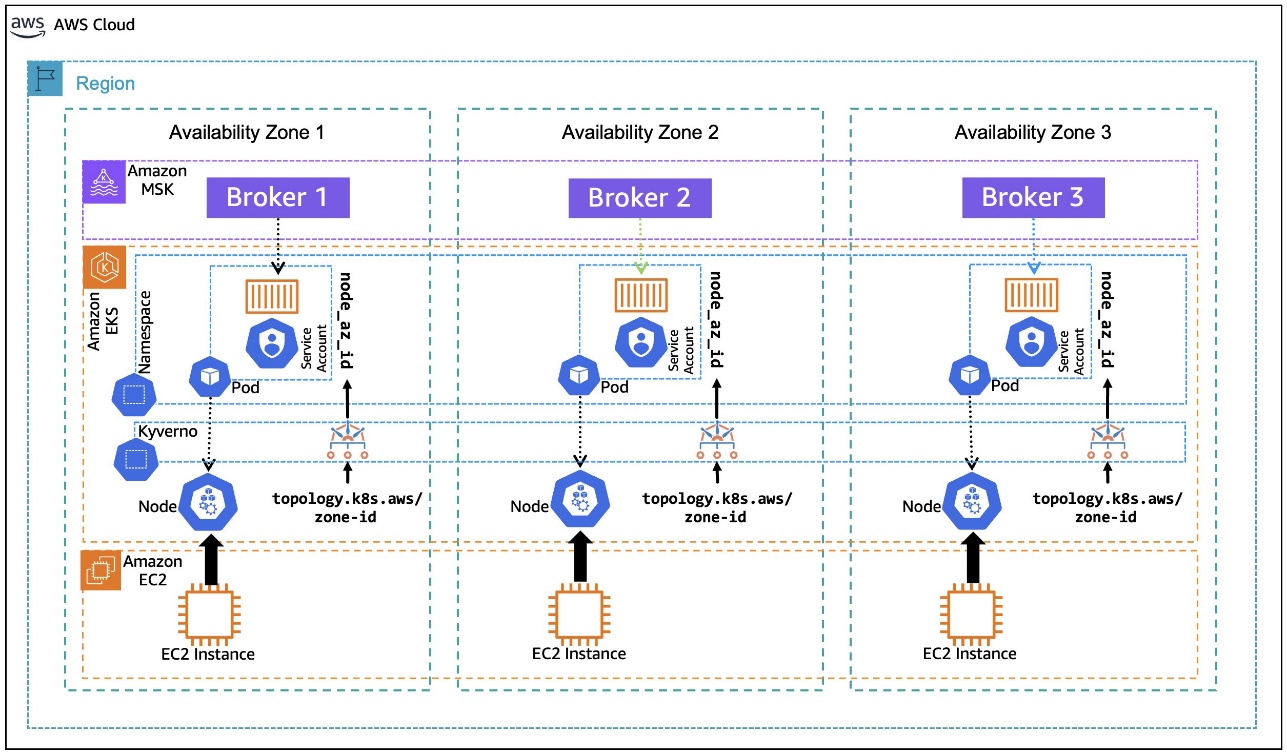
In this post, we walk you through an example of how to use the Kubernetes metadata label, topology.k8s.aws/zone-id, assigned to each node by Amazon EKS, and use an open source policy engine, Kyverno, to deploy a policy that mutates the pods that are in the binding state to dynamically inject the node’s AZ ID into the pod’s metadata as an annotation, as depicted in the following diagram. This annotation, in turn, is used by the container to create an environment variable that is assigned the pod’s annotated AZ ID information. The environment variable is then used in the container postStart lifecycle hook to generate the Kafka client configuration file with rack awareness setting. The following architecture diagram illustrates Kafka consumers running on Amazon EKS with rack awareness.

AWS architecture with MSK, EKS, Kyverno, and EC2 across three Availability Zones, detailing topology

Solution Walkthrough

Prerequisites

For this walkthrough, we use AWS CloudShell to run the scripts that are provided inline as you progress. For a smooth experience, before getting started, make sure to have kubectl and eksctl installed and configured in the AWS CloudShell environment, following the installation instructions for Linux (amd64). Helm is also required to be install on AWS CloudShell, using the instructions for Linux.

Also, check if the envsubst tool is installed in your CloudShell environment by invoking:

which envsubst

If the tool isn’t installed, you can install it using the command:

sudo dnf -y install gettext-devel

We also assume you already have an MSK cluster deployed in an Amazon Virtual Private Cloud (VPC) in three Availability Zones with the name MSK-AZ-Aware. In this walkthrough, we use AWS Identity and Access Management (IAM) authentication for client access control to the MSK cluster. If you’re using a cluster in your account with a different name, replace the instances of MSK-AZ-Aware in the instructions.

We follow the same MSK cluster configuration mentioned in the Rack Awareness blog mentioned previously, with some modifications. (Ensure you’ve set replica.selector.class = org.apache.kafka.common.replica.RackAwareReplicaSelector for the reasons discussed there). In our configuration, we add one line: num.partitions = 6. Although not mandatory, this ensures that topics that are automatically created will have multiple partitions to support clearer demonstrations in subsequent sections.

Finally, we use the Amazon MSK Data Generator with the following configuration:

{
"name": "msk-data-generator",
    "config": {
    "connector.class": "com.amazonaws.mskdatagen.GeneratorSourceConnector",
    "genkp.MSK-AZ-Aware-Topic.with": "#{Internet.uuid}",
    "genv.MSK-AZ-Aware-Topic.product_id.with": "#{number.number_between '101','200'}",
    "genv.MSK-AZ-Aware-Topic.quantity.with": "#{number.number_between '1','5'}",
    "genv.MSK-AZ-Aware-Topic.customer_id.with": "#{number.number_between '1','5000'}"
    }
}

Running the MSK Data Generator with this configuration will automatically create a six-partition topic named MSK-AZ-Aware-Topic on our cluster for us, and it will push data to that topic. To follow along with the walkthrough, we recommend and assume that you deploy the MSK Data Generator to create the topic and populate it with simulated data.

Create the EKS cluster

The first step is to install an EKS cluster in the same Amazon VPC subnets as the MSK cluster. You can modify the name of the MSK cluster by changing that environment variable MSK_CLUSTER_NAME if your cluster is created with a different name than suggested. You can also change the Amazon EKS cluster name by changing EKS_CLUSTER_NAME.

The environment variables that we define here are used throughout the walkthrough.

The last step is to update the kubeconfig with an entry for the EKS cluster:

AWS_ACCOUNT=$(aws sts get-caller-identity --output text --query Account)
export AWS_ACCOUNT
export AWS_REGION=${AWS_DEFAULT_REGION}
export MSK_CLUSTER_NAME=MSK-AZ-Aware
export EKS_CLUSTER_NAME=EKS-AZ-Aware
export EKS_CLUSTER_SIZE=3
export K8S_VERSION=1.32
export POD_ID_VERSION=1.3.5
 
MSK_BROKER_SG=$(aws kafka list-clusters \
  --query  'ClusterInfoList[?ClusterName==`'${MSK_CLUSTER_NAME}'`].BrokerNodeGroupInfo.SecurityGroups'  \
  --output text | xargs)
export MSK_BROKER_SG

MSK_BROKER_CLIENT_SUBNETS=$(aws kafka list-clusters \
  --query  'ClusterInfoList[?ClusterName==`'${MSK_CLUSTER_NAME}'`].BrokerNodeGroupInfo.ClientSubnets'  \
  --output text | xargs)
export MSK_BROKER_CLIENT_SUBNETS
 
VPC_ID=$(aws ec2 describe-subnets \
  --subnet-ids "$(echo "${MSK_BROKER_CLIENT_SUBNETS}" | cut -d' ' -f1)" \
  --query 'Subnets[0].VpcId' \
  --output text)
export VPC_ID

EKS_SUBNETS=$(echo ${MSK_BROKER_CLIENT_SUBNETS} | sed 's/ \+/,/g')
export EKS_SUBNETS

# Create a minimal config file for encrypted node volumes
cat > eks-config.yaml << EOF
apiVersion: eksctl.io/v1alpha5
kind: ClusterConfig
metadata:
  name: ${EKS_CLUSTER_NAME}
  region: ${AWS_REGION}
  version: "${K8S_VERSION}"
vpc:
  id: "${VPC_ID}"
  subnets:
    public:
$(for subnet in ${MSK_BROKER_CLIENT_SUBNETS}; do
  AZ=$(aws ec2 describe-subnets --subnet-ids "$subnet" --query 'Subnets[0].AvailabilityZone' --output text)
  echo "      $AZ: { id: $subnet }"
done)
nodeGroups:
  - name: ng1
    instanceType: m5.xlarge
    desiredCapacity: ${EKS_CLUSTER_SIZE}
    minSize: ${EKS_CLUSTER_SIZE}
    maxSize: ${EKS_CLUSTER_SIZE}
    securityGroups:
      attachIDs: ["${MSK_BROKER_SG}"]
    volumeSize: 100
    volumeType: gp3
    volumeEncrypted: true
EOF

eksctl create cluster -f eks-config.yaml

aws eks update-kubeconfig \
  --region "${AWS_REGION}" \
  --name ${EKS_CLUSTER_NAME}

Next, you need to create an IAM policy, MSK-AZ-Aware-Policy, to allow access from the Amazon EKS pods to the MSK cluster. Note here that we’re using MSK-AZ-Aware as the cluster name.

Create a file, msk-az-aware-policy.json, with the IAM policy template:

cat > msk-az-aware-policy.json << EOF
{
    "Version": "2012-10-17",
    "Statement": [
        {
            "Effect": "Allow",
            "Action": [
                "kafka-cluster:Connect",
                "kafka-cluster:AlterCluster",
                "kafka-cluster:DescribeCluster",
                "kafka-cluster:DescribeClusterDynamicConfiguration",
                "kafka-cluster:AlterClusterDynamicConfiguration"
            ],
            "Resource": [
                "arn:aws:kafka:${AWS_REGION}:${AWS_ACCOUNT}:cluster/${MSK_CLUSTER_NAME}/*"
            ]
        },
        {
            "Effect": "Allow",
            "Action": [
                "kafka-cluster:*Topic*",
                "kafka-cluster:WriteData",
                "kafka-cluster:ReadData"
            ],
            "Resource": [
                "arn:aws:kafka:${AWS_REGION}:${AWS_ACCOUNT}:topic/${MSK_CLUSTER_NAME}/*"
            ]
        },
        {
            "Effect": "Allow",
            "Action": [
                "kafka-cluster:AlterGroup",
                "kafka-cluster:DescribeGroup"
            ],
            "Resource": [
                "arn:aws:kafka:${AWS_REGION}:${AWS_ACCOUNT}:group/${MSK_CLUSTER_NAME}/*"
            ]
        }
    ]
}
EOF

To create the IAM policy, use the following command. It first replaces the placeholders in the policy file with values from relevant environment variables, and then creates the IAM policy:

envsubst < msk-az-aware-policy.json | \
xargs -0 -I {} aws iam create-policy \
            --policy-name MSK-AZ-Aware-Policy \
            --policy-document {}

Configure EKS Pod Identity

Amazon EKS Pod Identity offers a simplified experience for obtaining IAM permissions for pods on Amazon EKS. This requires installing an add-on Amazon EKS Pod Identity Agent to the EKS cluster:

eksctl create addon \
  --cluster ${EKS_CLUSTER_NAME} \
  --name eks-pod-identity-agent \
  --version ${POD_ID_VERSION}

Confirm that the add-on has been installed and its status is ACTIVE and that the status of all the pods associated with the add-on is Running.

eksctl get addon \
  --cluster ${EKS_CLUSTER_NAME} \
  --region "${AWS_REGION}" \
  --name eks-pod-identity-agent -o json

kubectl get pods \
  -n kube-system \
  -l app.kubernetes.io/instance=eks-pod-identity-agent

After you’ve installed the add-on, you need to create a pod identity association between a Kubernetes service account and the IAM policy created earlier:

eksctl create podidentityassociation \
  --namespace kafka-ns \
  --service-account-name kafka-sa \
  --role-name EKS-AZ-Aware-Role \
  --permission-policy-arns arn:aws:iam::"${AWS_ACCOUNT}":policy/MSK-AZ-Aware-Policy \
  --cluster ${EKS_CLUSTER_NAME} \
  --region "${AWS_REGION}"

Install Kyverno

Kyverno is an open source policy engine for Kubernetes that allows for validation, mutation, and generation of Kubernetes resources using policies written in YAML, thus simplifying the enforcement of security and compliance requirements. You need to install Kyverno to dynamically inject metadata into the Amazon EKS pods as they enter the binding state to inform them of Availability Zone ID.

In AWS CloudShell, create a file named kyverno-values.yaml. This file defines the Kubernetes RBAC permissions for Kyverno’s Admission Controller to read Amazon EKS node metadata because the default Kyverno (v. 1.13 onwards) settings don’t allow this:

cat > kyverno-values.yaml << EOF
admissionController:
  rbac:
    clusterRole:
      extraResources:
        - apiGroups:
            - ""
          resources:
            - "nodes"
          verbs:
            - get
            - list
            - watch
EOF

After this file is created, you can install Kyverno using helm and providing the values file created in the previous step:

helm repo add kyverno https://kyverno.github.io/kyverno/
helm repo update

helm install kyverno kyverno/kyverno \
  -n kyverno \
  --create-namespace \
  --version 3.3.7 \
  -f kyverno-values.yaml

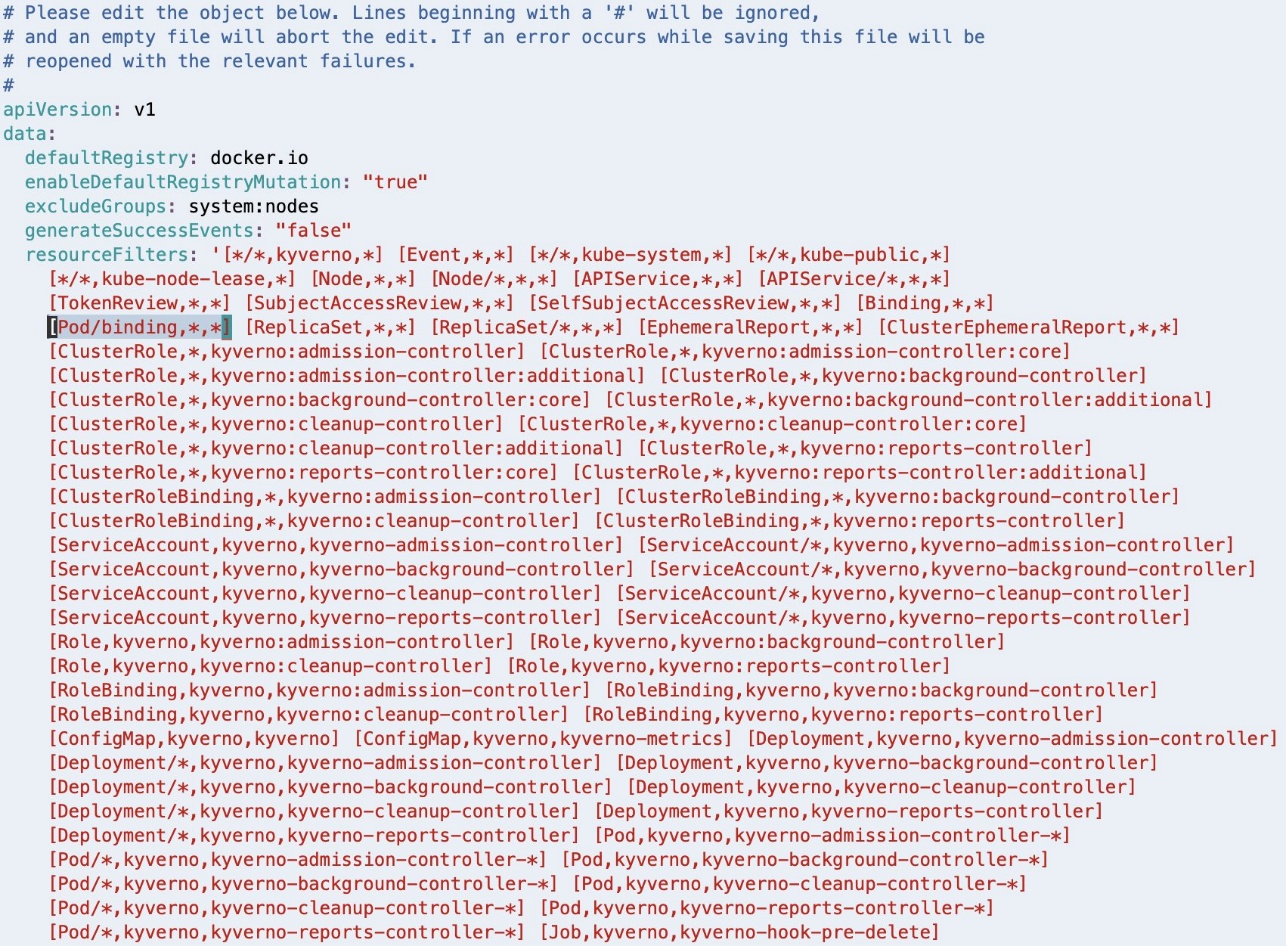
Starting with Kyverno v 1.13, the Admission Controller is configured to ignore the AdmissionReview requests for pods in binding state. This needs to be changed by editing the Kyverno ConfigMap:

kubectl -n kyverno edit configmap kyverno

The kubectl edit command uses the default editor configured in your environment (in our case Linux VIM).

This will open the ConfigMap in a text editor.

As highlighted in the following screenshot, [Pod/binding,*,*] should be removed from the resourceFilters field for the Kyverno Admission Controller to process AdmissionReview requests for pods in binding state.

Kubernetes YAML configuration detailing Kyverno policy resource filters and cluster roles

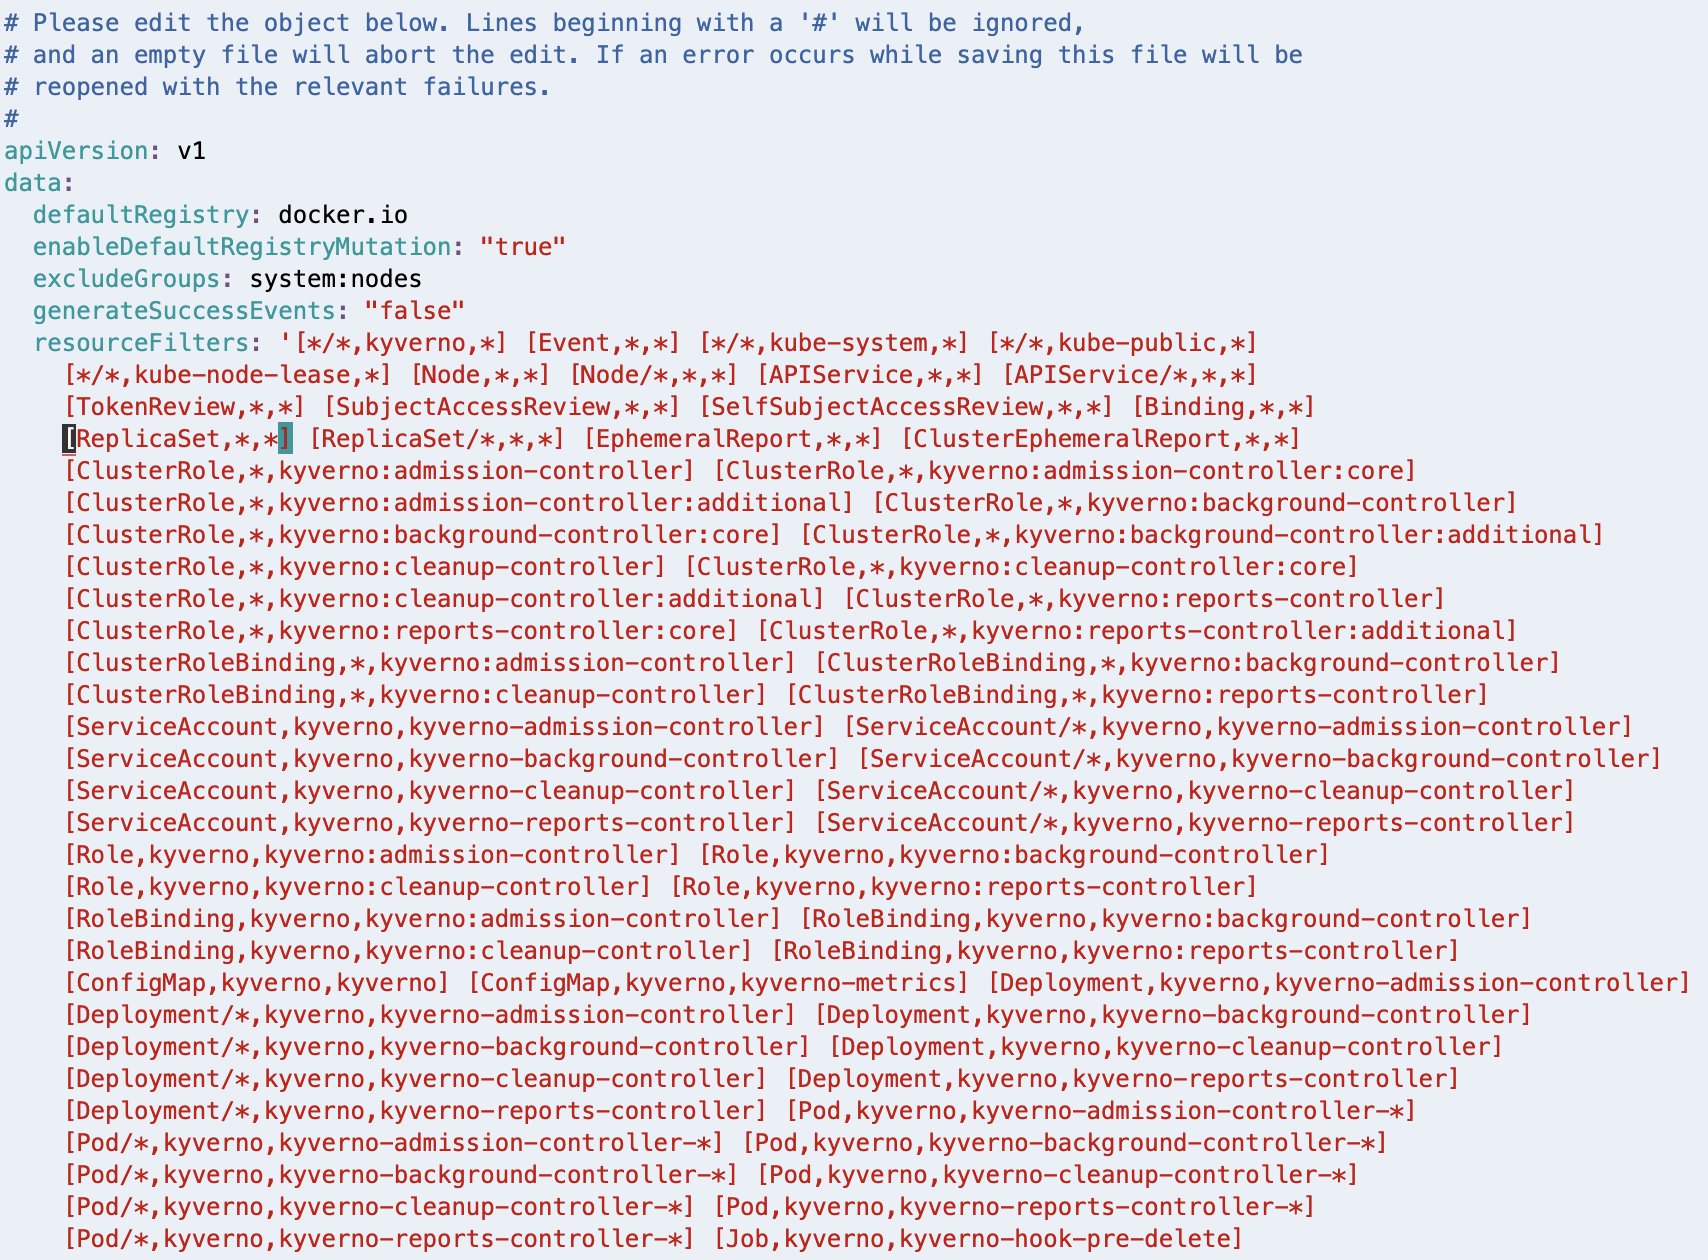
If Linux VIM is your default editor, you can delete the entry using VIM command 18x, meaning delete (or cut) 18 characters from the current cursor position. Save the modified configuration using the VIM command :wq, meaning write (or save) the file and quit.

After deleting, the resourceFilters field should look similar to the following screenshot.

Kubernetes YAML configuration with ReplicaSet resource filter highlighted for Kyverno policy management

If you have a different editor configured in your environment, follow the appropriate steps to achieve a similar outcome.

Configure Kyverno policy

You need to configure the policy that will make the pods rack aware. This policy is adapted from the suggested approach in the Kyverno blog post, Assigning Node Metadata to Pods. Create a new file with the name kyverno-inject-node-az-id.yaml:

cat > kyverno-inject-node-az-id.yaml  << EOF
apiVersion: kyverno.io/v2beta1
kind: ClusterPolicy
metadata:
  name: inject-node-az-id
spec:
  background: false
  rules:
    - name: inject-node-az-id
      match:
        any:
        - resources:
            kinds:
            - Pod/binding
      context:
      - name: node
        variable:
          jmesPath: request.object.target.name
          default: ''
      - name: node_az_id
        apiCall:
          urlPath: "/api/v1/nodes/{{node}}"
          jmesPath: "metadata.labels.\"topology.k8s.aws/zone-id\" || 'empty'"
      mutate:
        patchStrategicMerge:
          metadata:
            annotations:
              node_az_id: "{{ node_az_id }}"
EOF

It instructs Kyverno to watch for pods in binding state. After Kyverno receives the AdmissionReview request for a pod, it sets the variable node to the name of the node to which the pod is being bound. It also sets another variable node_az_id to the Availability Zone ID by calling the Kubernetes API /api/v1/nodes/node to get the node metadata label topology.k8s.aws/zone-id. Finally, it defines a mutate rule to inject the obtained AZ ID into the pod’s metadata as an annotation node_az_id.
After you’ve created the file, apply the policy using the following command:

kubectl apply -f kyverno-inject-node-az-id.yaml

Deploy a pod without rack awareness

Now let’s visualize the problem statement. To do this, connect to one of the EKS pods and check how it interacts with the MSK cluster when you run a Kafka consumer from the pod.

First, get the bootstrap string of the MSK cluster. Look up the Amazon Resource Names (ARNs) of the MSK cluster:

MSK_CLUSTER_ARN=$(
    aws kafka list-clusters \
      --query 'ClusterInfoList[?ClusterName==`'${MSK_CLUSTER_NAME}'`].ClusterArn' \
      --output text)
export MSK_CLUSTER_ARN

Using the cluster ARN, you can get the bootstrap string with the following command:

BOOTSTRAP_SERVER_LIST=$(
    aws kafka get-bootstrap-brokers \
        --cluster-arn "${MSK_CLUSTER_ARN}" \
        --query 'BootstrapBrokerStringSaslIam' \
        --output text)
export BOOTSTRAP_SERVER_LIST

Create a new file named kafka-no-az.yaml:

cat > kafka-no-az.yaml << EOF
apiVersion: v1
kind: Namespace
metadata:
 name: kafka-ns
---
apiVersion: v1
kind: ServiceAccount
metadata:
 name: kafka-sa
 namespace: kafka-ns
automountServiceAccountToken: false
---
apiVersion: apps/v1
kind: Deployment
metadata:
  name: kafka-no-az
  namespace: kafka-ns
  labels:
    app: kafka-no-az
  annotations:
    node_az_id: ''
spec:
  replicas: 3
  selector:
    matchLabels:
      app: kafka-no-az
  template:
    metadata:
      labels:
        app: kafka-no-az
    spec:
      serviceAccountName: kafka-sa
      containers:
      - image: bitnami/kafka:3.8.0
        name: kafka-no-az
        command: ["/bin/sh", "-ec", "while :; do echo '.'; sleep 5 ; done"]
        env:
        - name: BootstrapServerString
          value: ${BOOTSTRAP_SERVER_LIST}
        - name: MSK_TOPIC
          value: "MSK-AZ-Aware-Topic"
        - name: KAFKA_HOME
          value: /opt/bitnami/kafka
        - name: KAFKA_BIN
          value: /opt/bitnami/kafka/bin
        - name: KAFKA_CONFIG
          value: /opt/bitnami/kafka/config
        - name: KAFKA_LIBS
          value: /opt/bitnami/kafka/libs
        - name: KAFKA_LOG4J_OPTS
          value: "-Dlog4j.configuration=file:/opt/bitnami/kafka/config/log4j.properties"
        lifecycle:
          postStart:
            exec:
              command: 
              - "sh"
              - "-c"
              - |
                export KAFKA_HOME=/opt/bitnami/kafka
                export KAFKA_BIN=\${KAFKA_HOME}/bin
                export KAFKA_CONFIG=\${KAFKA_HOME}/config
                cat > \${KAFKA_CONFIG}/client.properties << EOF1
                security.protocol=SASL_SSL
                sasl.mechanism=AWS_MSK_IAM
                sasl.jaas.config=software.amazon.msk.auth.iam.IAMLoginModule required;
                sasl.client.callback.handler.class=software.amazon.msk.auth.iam.IAMClientCallbackHandler
                EOF1
                
                cat >> \${KAFKA_CONFIG}/log4j.properties << EOF2
                #
                # Enable logging of Kafka Client to stderr
                #
                log4j.rootLogger=WARN, stderr
                log4j.logger.org.apache.kafka.clients.consumer.internals.AbstractFetch=DEBUG
                log4j.appender.stderr=org.apache.log4j.ConsoleAppender
                log4j.appender.stderr.layout=org.apache.log4j.PatternLayout
                log4j.appender.stderr.layout.ConversionPattern=[%d] %p %m (%c)%n
                log4j.appender.stderr.Target=System.err
                EOF2
                cd \${KAFKA_HOME}/libs
                /usr/bin/curl -sS -L https://github.com/aws/aws-msk-iam-auth/releases/download/v2.2.0/aws-msk-iam-auth-2.2.0-all.jar --output \${KAFKA_LIBS}/aws-msk-iam-auth-2.2.0-all.jar
EOF

This pod manifest doesn’t make use of the Availability Zone ID injected into the metadata annotation and hence doesn’t add client.rack to the client.properties configuration.

Deploy the pods using the following command:

kubectl apply -f kafka-no-az.yaml

Run the following command to confirm that the pods have been deployed and are in the Running state:

kubectl -n kafka-ns get pods

Select a pod id from the output of the previous command, and connect to it using:

kubectl -n kafka-ns exec -it POD_ID -- sh

Run the Kafka consumer:

"${KAFKA_BIN}"/kafka-console-consumer.sh \
  --bootstrap-server  "${BootstrapServerString}" \
  --consumer.config  "${KAFKA_CONFIG}"/client.properties \
  --topic "${MSK_TOPIC}" \
  --from-beginning /tmp/non-rack-aware-consumer.log 2>&1 &

This command will dump all the resulting logs into the file, non-rack-aware-consumer.log. There’s a lot of information in those logs, and we encourage you to open them and take a deeper look. Next, examine the EKS pod in action. To do this, run the following command to tail the file to view fetch request results to the MSK cluster. You’ll notice a handful of meaningful logs to review as the consumer access various partitions of the Kafka topic:

grep -E "DEBUG.*Added read_uncommitted fetch request for partition MSK-AZ-Aware-Topic-[0-9]+" /tmp/rack-aware-consumer.log | tail -5

Observe your log output, which should look similar to the following:

[2025-03-12 23:59:05,308] DEBUG [Consumer clientId=console-consumer, groupId=console-consumer-24102] Added read_uncommitted fetch request for partition MSK-AZ-Aware-Topic-3 at position FetchPosition{offset=100, offsetEpoch=Optional[0], currentLeader=LeaderAndEpoch{leader=Optional[b-2.mskazaware.hxrzlh.c6.kafka.us-east-1.amazonaws.com:9098 (id: 2 rack: use1-az6)], epoch=0}} to node b-2.mskazaware.hxrzlh.c6.kafka.us-east-1.amazonaws.com:9098 (id: 2 rack: use1-az6) (org.apache.kafka.clients.consumer.internals.AbstractFetch)
[2025-03-12 23:59:05,308] DEBUG [Consumer clientId=console-consumer, groupId=console-consumer-24102] Added read_uncommitted fetch request for partition MSK-AZ-Aware-Topic-0 at position FetchPosition{offset=83, offsetEpoch=Optional[0], currentLeader=LeaderAndEpoch{leader=Optional[b-2.mskazaware.hxrzlh.c6.kafka.us-east-1.amazonaws.com:9098 (id: 2 rack: use1-az6)], epoch=0}} to node b-2.mskazaware.hxrzlh.c6.kafka.us-east-1.amazonaws.com:9098 (id: 2 rack: use1-az6) (org.apache.kafka.clients.consumer.internals.AbstractFetch)
[2025-03-12 23:59:05,542] DEBUG [Consumer clientId=console-consumer, groupId=console-consumer-24102] Added read_uncommitted fetch request for partition MSK-AZ-Aware-Topic-5 at position FetchPosition{offset=100, offsetEpoch=Optional[0], currentLeader=LeaderAndEpoch{leader=Optional[b-1.mskazaware.hxrzlh.c6.kafka.us-east-1.amazonaws.com:9098 (id: 1 rack: use1-az4)], epoch=0}} to node b-1.mskazaware.hxrzlh.c6.kafka.us-east-1.amazonaws.com:9098 (id: 1 rack: use1-az4) (org.apache.kafka.clients.consumer.internals.AbstractFetch)
[2025-03-12 23:59:05,542] DEBUG [Consumer clientId=console-consumer, groupId=console-consumer-24102] Added read_uncommitted fetch request for partition MSK-AZ-Aware-Topic-2 at position FetchPosition{offset=107, offsetEpoch=Optional[0], currentLeader=LeaderAndEpoch{leader=Optional[b-1.mskazaware.hxrzlh.c6.kafka.us-east-1.amazonaws.com:9098 (id: 1 rack: use1-az4)], epoch=0}} to node b-1.mskazaware.hxrzlh.c6.kafka.us-east-1.amazonaws.com:9098 (id: 1 rack: use1-az4) (org.apache.kafka.clients.consumer.internals.AbstractFetch)
[2025-03-12 23:59:05,720] DEBUG [Consumer clientId=console-consumer, groupId=console-consumer-24102] Added read_uncommitted fetch request for partition MSK-AZ-Aware-Topic-4 at position FetchPosition{offset=84, offsetEpoch=Optional[0], currentLeader=LeaderAndEpoch{leader=Optional[b-3.mskazaware.hxrzlh.c6.kafka.us-east-1.amazonaws.com:9098 (id: 3 rack: use1-az2)], epoch=0}} to node b-3.mskazaware.hxrzlh.c6.kafka.us-east-1.amazonaws.com:9098 (id: 3 rack: use1-az2) (org.apache.kafka.clients.consumer.internals.AbstractFetch)
[2025-03-12 23:59:05,720] DEBUG [Consumer clientId=console-consumer, groupId=console-consumer-24102] Added read_uncommitted fetch request for partition MSK-AZ-Aware-Topic-1 at position FetchPosition{offset=85, offsetEpoch=Optional[0], currentLeader=LeaderAndEpoch{leader=Optional[b-3.mskazaware.hxrzlh.c6.kafka.us-east-1.amazonaws.com:9098 (id: 3 rack: use1-az2)], epoch=0}} to node b-3.mskazaware.hxrzlh.c6.kafka.us-east-1.amazonaws.com:9098 (id: 3 rack: use1-az2) (org.apache.kafka.clients.consumer.internals.AbstractFetch)
[2025-03-12 23:59:05,811] DEBUG [Consumer clientId=console-consumer, groupId=console-consumer-24102] Added read_uncommitted fetch request for partition MSK-AZ-Aware-Topic-3 at position FetchPosition{offset=100, offsetEpoch=Optional[0], currentLeader=LeaderAndEpoch{leader=Optional[b-2.mskazaware.hxrzlh.c6.kafka.us-east-1.amazonaws.com:9098 (id: 2 rack: use1-az6)], epoch=0}} to node b-2.mskazaware.hxrzlh.c6.kafka.us-east-1.amazonaws.com:9098 (id: 2 rack: use1-az6) (org.apache.kafka.clients.consumer.internals.AbstractFetch)
[2025-03-12 23:59:05,811] DEBUG [Consumer clientId=console-consumer, groupId=console-consumer-24102] Added read_uncommitted fetch request for partition MSK-AZ-Aware-Topic-0 at position FetchPosition{offset=83, offsetEpoch=Optional[0], currentLeader=LeaderAndEpoch{leader=Optional[b-2.mskazaware.hxrzlh.c6.kafka.us-east-1.amazonaws.com:9098 (id: 2 rack: use1-az6)], epoch=0}} to node b-2.mskazaware.hxrzlh.c6.kafka.us-east-1.amazonaws.com:9098 (id: 2 rack: use1-az6) (org.apache.kafka.clients.consumer.internals.AbstractFetch)

You’ve now connected to a specific pod in the EKS cluster and run a Kafka consumer to read from the MSK topic without rack awareness. Remember that this pod is running within a single Availability Zone.

Reviewing the log output, you find rack: values as use1-az2, use1-az4, and use1-az6 as the pod makes calls to different partitions of the topic. These rack values represent the Availability Zone IDs that our brokers are running within. This means that our EKS pod is creating networking connections to brokers across three different Availability Zones, which would be accruing networking charges in our account.

Also notice that you have no way to check which node, and therefore Availability Zone, this EKS pod is running in. You can observe in the logs that it’s calling to MSK brokers in different Availability Zones, but there is no way to know which broker is in the same Availability Zone as the EKS pod you’ve connected to. Delete the deployment when you’re done:

kubectl -n kafka-ns delete -f kafka-no-az.yaml

Deploy a pod with rack awareness

Now that you have experienced the consumer behavior without rack awareness, you need to inject the Availability Zone ID to make your pods rack-aware.

Create a new file named kafka-az-aware.yaml:

cat > kafka-az-aware.yaml << EOF
apiVersion: v1
kind: Namespace
metadata:
 name: kafka-ns
---
apiVersion: v1
kind: ServiceAccount
metadata:
 name: kafka-sa
 namespace: kafka-ns
automountServiceAccountToken: false
---
apiVersion: apps/v1
kind: Deployment
metadata:
  name: kafka-az-aware
  namespace: kafka-ns
  labels:
    app: kafka-az-aware
  annotations:
    node_az_id: ''
spec:
  replicas: 3
  selector:
    matchLabels:
      app: kafka-az-aware
  template:
    metadata:
      labels:
        app: kafka-az-aware
    spec:
      serviceAccountName: kafka-sa
      containers:
      - image: bitnami/kafka:3.8.0
        name: kafka-az-aware
        command: ["/bin/sh", "-ec", "while :; do echo '.'; sleep 5 ; done"]
        env:
        - name: BootstrapServerString
          value: ${BOOTSTRAP_SERVER_LIST}
        - name: MSK_TOPIC
          value: "MSK-AZ-Aware-Topic"
        - name: KAFKA_HOME
          value: /opt/bitnami/kafka
        - name: KAFKA_BIN
          value: /opt/bitnami/kafka/bin
        - name: KAFKA_CONFIG
          value: /opt/bitnami/kafka/config
        - name: KAFKA_LIBS
          value: /opt/bitnami/kafka/libs
        - name: KAFKA_LOG4J_OPTS
          value: "-Dlog4j.configuration=file:/opt/bitnami/kafka/config/log4j.properties"
        - name: NODE_AZ_ID
          valueFrom:
            fieldRef:
              fieldPath: metadata.annotations['node_az_id']
        lifecycle:
          postStart:
            exec:
              command: 
              - "sh"
              - "-c"
              - |
                export KAFKA_HOME=/opt/bitnami/kafka
                export KAFKA_BIN=\${KAFKA_HOME}/bin
                export KAFKA_CONFIG=\${KAFKA_HOME}/config
                cat > \${KAFKA_CONFIG}/client.properties << EOF1
                security.protocol=SASL_SSL
                sasl.mechanism=AWS_MSK_IAM
                sasl.jaas.config=software.amazon.msk.auth.iam.IAMLoginModule required;
                sasl.client.callback.handler.class=software.amazon.msk.auth.iam.IAMClientCallbackHandler
                EOF1
                if [ \$NODE_AZ_ID ]
                then
                  echo "client.rack=\$NODE_AZ_ID" >> \${KAFKA_CONFIG}/client.properties
                fi
                
                cat >> \${KAFKA_CONFIG}/log4j.properties << EOF2
                #
                # Enable logging of Kafka Client to stderr
                #
                log4j.rootLogger=WARN, stderr
                log4j.logger.org.apache.kafka.clients.consumer.internals.AbstractFetch=DEBUG
                log4j.appender.stderr=org.apache.log4j.ConsoleAppender
                log4j.appender.stderr.layout=org.apache.log4j.PatternLayout
                log4j.appender.stderr.layout.ConversionPattern=[%d] %p %m (%c)%n
                log4j.appender.stderr.Target=System.err
                EOF2
                
                /usr/bin/curl -sS -L https://github.com/aws/aws-msk-iam-auth/releases/download/v2.2.0/aws-msk-iam-auth-2.2.0-all.jar --output \${KAFKA_LIBS}/aws-msk-iam-auth-2.2.0-all.jar
EOF

As you can observe, the pod manifest defines an environment variable NODE_AZ_ID, assigning it the value from the pod’s own metadata annotation node_az_id that was injected by Kyverno. The manifest then uses the pod’s postStart lifecycle script to add client.rack into the client.properties configuration, setting it equal to the value in the environment variable NODE_AZ_ID.

Deploy the pods using the following command:

kubectl apply -f kafka-az-aware.yaml

Run the following command to confirm that the pods have been deployed and are in the Running state:

kubectl -n kafka-ns get pods

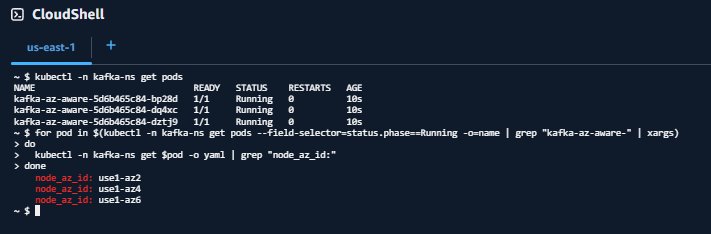
Verify that Availability Zone Ids have been injected into the pods

for pod in $(kubectl -n kafka-ns get pods --field-selector=status.phase==Running -o=name | grep "pod/kafka-az-aware-" | xargs)
do
  kubectl -n kafka-ns get "$pod" -o yaml | grep "node_az_id:"
done

Your output should look similar to:

node_az_id: use1-az2
node_az_id: use1-az4
node_az_id: use1-az6

Or:

AWS CloudShell showing Kafka namespace pods and node assignments in Kubernetes cluster

Select a pod id from the output of the get pods command and shell-in to it.

kubectl -n kafka-ns exec -it POD_ID -- sh

The output of the get $pod command matches the order of results from the get pods command. This matching will help you understand what Availability Zone your pod is running in so you can compare it to log outputs later.

After you’ve connected to your pod, run the Kafka consumer:

"${KAFKA_BIN}"/kafka-console-consumer.sh \
  --bootstrap-server  "${BootstrapServerString}" \
  --consumer.config  "${KAFKA_CONFIG}"/client.properties \
  --topic "${MSK_TOPIC}" \
  --from-beginning /tmp/non-rack-aware-consumer.log 2>&1 &

Similar to before, this command will dump all the resulting logs into the file, rack-aware-consumer.log. You create a new file so there’s no overlap between the Kafka consumers you’ve run. There’s a lot of information in those logs, and we encourage you to open them and take a deeper look. If you want to see the rack awareness of your EKS pod in action, run the following command to tail the file to view fetch request results to the MSK cluster. You can observe a handful of meaningful logs to review here as the consumer access various partitions of the Kafka topic:

grep -E "DEBUG.*Added read_uncommitted fetch request for partition MSK-AZ-Aware-Topic-[0-9]+" /tmp/rack-aware-consumer.log | tail -5

Observe your log output, which should look similar to the following:

[2025-03-13 00:47:51,695] DEBUG [Consumer clientId=console-consumer, groupId=console-consumer-86303] Added read_uncommitted fetch request for partition MSK-AZ-Aware-Topic-5 at position FetchPosition{offset=527, offsetEpoch=Optional[0], currentLeader=LeaderAndEpoch{leader=Optional[b-1.mskazaware.hxrzlh.c6.kafka.us-east-1.amazonaws.com:9098 (id: 1 rack: use1-az4)], epoch=0}} to node b-2.mskazaware.hxrzlh.c6.kafka.us-east-1.amazonaws.com:9098 (id: 2 rack: use1-az6) (org.apache.kafka.clients.consumer.internals.AbstractFetch)
[2025-03-13 00:47:51,695] DEBUG [Consumer clientId=console-consumer, groupId=console-consumer-86303] Added read_uncommitted fetch request for partition MSK-AZ-Aware-Topic-4 at position FetchPosition{offset=509, offsetEpoch=Optional[0], currentLeader=LeaderAndEpoch{leader=Optional[b-3.mskazaware.hxrzlh.c6.kafka.us-east-1.amazonaws.com:9098 (id: 3 rack: use1-az2)], epoch=0}} to node b-2.mskazaware.hxrzlh.c6.kafka.us-east-1.amazonaws.com:9098 (id: 2 rack: use1-az6) (org.apache.kafka.clients.consumer.internals.AbstractFetch)
[2025-03-13 00:47:51,695] DEBUG [Consumer clientId=console-consumer, groupId=console-consumer-86303] Added read_uncommitted fetch request for partition MSK-AZ-Aware-Topic-3 at position FetchPosition{offset=527, offsetEpoch=Optional[0], currentLeader=LeaderAndEpoch{leader=Optional[b-2.mskazaware.hxrzlh.c6.kafka.us-east-1.amazonaws.com:9098 (id: 2 rack: use1-az6)], epoch=0}} to node b-2.mskazaware.hxrzlh.c6.kafka.us-east-1.amazonaws.com:9098 (id: 2 rack: use1-az6) (org.apache.kafka.clients.consumer.internals.AbstractFetch)
[2025-03-13 00:47:51,695] DEBUG [Consumer clientId=console-consumer, groupId=console-consumer-86303] Added read_uncommitted fetch request for partition MSK-AZ-Aware-Topic-2 at position FetchPosition{offset=522, offsetEpoch=Optional[0], currentLeader=LeaderAndEpoch{leader=Optional[b-1.mskazaware.hxrzlh.c6.kafka.us-east-1.amazonaws.com:9098 (id: 1 rack: use1-az4)], epoch=0}} to node b-2.mskazaware.hxrzlh.c6.kafka.us-east-1.amazonaws.com:9098 (id: 2 rack: use1-az6) (org.apache.kafka.clients.consumer.internals.AbstractFetch)
[2025-03-13 00:47:51,695] DEBUG [Consumer clientId=console-consumer, groupId=console-consumer-86303] Added read_uncommitted fetch request for partition MSK-AZ-Aware-Topic-1 at position FetchPosition{offset=533, offsetEpoch=Optional[0], currentLeader=LeaderAndEpoch{leader=Optional[b-3.mskazaware.hxrzlh.c6.kafka.us-east-1.amazonaws.com:9098 (id: 3 rack: use1-az2)], epoch=0}} to node b-2.mskazaware.hxrzlh.c6.kafka.us-east-1.amazonaws.com:9098 (id: 2 rack: use1-az6) (org.apache.kafka.clients.consumer.internals.AbstractFetch)
[2025-03-13 00:47:51,695] DEBUG [Consumer clientId=console-consumer, groupId=console-consumer-86303] Added read_uncommitted fetch request for partition MSK-AZ-Aware-Topic-0 at position FetchPosition{offset=520, offsetEpoch=Optional[0], currentLeader=LeaderAndEpoch{leader=Optional[b-2.mskazaware.hxrzlh.c6.kafka.us-east-1.amazonaws.com:9098 (id: 2 rack: use1-az6)], epoch=0}} to node b-2.mskazaware.hxrzlh.c6.kafka.us-east-1.amazonaws.com:9098 (id: 2 rack: use1-az6) (org.apache.kafka.clients.consumer.internals.AbstractFetch)

For each log line, you can now observe two rack: values. The first rack: value shows the current leader, the second rack: shows the rack that is being used to fetch messages.

For example, look at MSK-AZ-Aware-Topic-5. The leader is identified as rack: use1-az4, but the fetch request is sent to use1-az6 as indicated by to node b-2.mskazaware.hxrzlh.c6.kafka.us-east-1.amazonaws.com:9098 (id: 2 rack: use1-az6) (org.apache.kafka.clients.consumer.internals.AbstractFetch)

You’ll notice something similar in all other log lines. The fetch is always to the broker in use1-az6, which maps to our expectation, given the pod we connected to was in this Availability Zone.

Congratulations! You’re consuming from the closest replica on Amazon EKS.

Clean Up

Delete the deployment when finished:

kubectl -n kafka-ns delete -f kafka-az-aware.yaml

To delete the EKS Pod Identity association:

eksctl delete podidentityassociation \
--cluster ${EKS_CLUSTER_NAME} \
--namespace kafka-ns \
--service-account-name kafka-sa

To delete the IAM policy:

aws iam delete-policy \
  --policy-arn arn:aws:iam::"${AWS_ACCOUNT}":policy/MSK-AZ-Aware-Policy

To delete the EKS cluster:

eksctl delete cluster -n ${EKS_CLUSTER_NAME} --disable-nodegroup-eviction

If you followed along with this post using the Amazon MSK Data Generator, be sure to delete your deployment so it’s no longer attempting to generate and send data after you delete the rest of your resources.

Clean up will depend on which deployment option you used. To read more about the deployment options and the resources created for the Amazon MSK Data Generator, refer to Getting Started in the GitHub repository.

Creating an MSK cluster was a prerequisite of this post, and if you’d like to clean up the MSK cluster as well, you can use the following command:

aws kafka delete-cluster --cluster-arn "${MSK_CLUSTER_ARN}"

There is no additional cost to using AWS CloudShell, but if you’d like to delete your shell, refer to the Delete a shell session home directory in the AWS CloudShell User Guide.

Conclusion

Apache Kafka nearest replica fetching, or rack awareness, is a strategic cost-optimization technique. By implementing it for Amazon MSK consumers on Amazon EKS, you can significantly reduce cross-zone traffic costs while maintaining robust, distributed streaming architectures. Open source tools such as Kyverno can simplify complex configuration challenges and drive meaningful savings.The solution we’ve demonstrated provides a powerful, repeatable approach to dynamically injecting Availability Zone information into Kubernetes pods, optimize Kafka consumer routing, and minimize reduce transfer costs.

Additional resources

To learn more about rack awareness with Amazon MSK, refer to Reduce network traffic costs of your Amazon MSK consumers with rack awareness.


About the authors

Austin Groeneveld is a Streaming Specialist Solutions Architect at Amazon Web Services (AWS), based in the San Francisco Bay Area. In this role, Austin is passionate about helping customers accelerate insights from their data using the AWS platform. He is particularly fascinated by the growing role that data streaming plays in driving innovation in the data analytics space. Outside of his work at AWS, Austin enjoys watching and playing soccer, traveling, and spending quality time with his family.

Farooq Ashraf is a Senior Solutions Architect at AWS, specializing in SaaS, Generative AI, and MLOps. He is passionate about blending multi-tenant SaaS concepts with Cloud services to innovate scalable solutions for the digital enterprise, and has several blog posts, and workshops to his credit.

How to automatically disable users in AWS Managed Microsoft AD based on GuardDuty findings

Post Syndicated from Tim Kingdon original https://aws.amazon.com/blogs/security/how-to-automatically-disable-users-in-aws-managed-microsoft-ad-based-on-guardduty-findings/

Organizations are facing an increasing number of security threats, especially in the form of compromised user accounts. Manually monitoring and acting on suspicious activities is not only time-consuming but also prone to human error. The lack of automated responses to security incidents can lead to disastrous consequences, such as data breaches and financial loss.

In this blog post, I show you how to detect suspicious events using Amazon GuardDuty and create an automation from those findings to disable user accounts in AWS Directory Service for Microsoft Active Directory.

This post addresses scenarios where, for example, you have a web server that uses a Microsoft Active Directory user account (service account) to access an application or database resources on other servers, and you want to automate disabling the user account if suspicious activity is detected.

I walk you through how to deploy Microsoft Active Directory in AWS Directory Services, set up GuardDuty to monitor Amazon Elastic Compute Cloud (Amazon EC2) instances, and configure Amazon EventBridge with AWS Step Functions to trigger AWS Systems Manager Run Command to obtain the username and disable the user in Active Directory.

Solution overview

In this example, shown in Figure 1, you deploy a test EC2 instance and enable GuardDuty runtime monitoring. Findings will trigger an EventBridge rule that executes a Step Functions state machine, which runs two Systems Manager Run Command documents that discover the username and disable that user using the directory administration EC2 instance.

Figure 1: Solution architecture

Figure 1: Solution architecture

GuardDuty

GuardDuty is an automated threat detection service that continuously monitors for suspicious activity and unauthorized behavior to protect your AWS accounts, workloads, and data stored in Amazon Simple Storage Service (Amazon S3).

To activate GuardDuty:

  1. Go to GuardDuty on the AWS Management Console.
    1. If you’re activating GuardDuty for the first time, under Try threat detection with GuardDuty, select All Features and then choose Get Started.
    2. If you’ve used GuardDuty before, select Runtime Monitoring and then choose Enable under Runtime Monitoring.
    Figure 2: GuardDuty Runtime Monitoring enabled with EC2 monitoring

    Figure 2: GuardDuty Runtime Monitoring enabled with EC2 monitoring

AWS Managed Microsoft AD

AWS Managed Microsoft AD provides a fully managed service for Microsoft Active Directory (AD) in the AWS Cloud. When you create your directory, AWS deploys two domain controllers in separate Availability Zones that are exclusively yours for high availability. For use cases that require even higher resilience and performance in a specific AWS Region or during specific hours, you can scale AWS Managed Microsoft AD by deploying additional domain controllers to meet your needs. These domain controllers can help load balance, increase overall performance, or provide additional nodes to protect against temporary availability issues. Using AWS Managed Microsoft AD, you can define the correct number of domain controllers for your directory based on your use case.

To deploy a new AWS Managed Microsoft AD:

  1. Go to the Directory Service console.
  2. Choose Set up directory and select AWS Managed Microsoft AD.
  3. Select Standard Edition and enter a Directory DNS name and password.
  4. Select a virtual private cloud (VPC), for this example use the Default VPC.
  5. Choose Create directory.

Directory administration EC2 instance

This directory administration EC2 instance will be used to control the Microsoft Active Directory using AWS Systems Manager.

To deploy the directory administration EC2 instance:

  1. If you have deployed a new directory, you might need to wait 20–45 minutes until the directory status is Active.
  2. Select the Directory ID.
  3. Choose Actions and select Launch directory Administration EC2 Instance, using the default options.

Alternatively, you can build your own Windows EC2 instances with a role that has the AmazonSSMManagedInstanceCore policy, join it to the Active Directory domain, and install Active Directory management tools.

To remotely connect to the directory administration EC2 instance:

  1. Go to the Systems Manager console.
  2. Open Fleet Manager from the navigation pane.
  3. Select the Node ID for the instance with the name ending managementInstance.
  4. Choose Node Actions (top right), select Connect, and then choose Connect with Remote Desktop.
  5. Enter the username admin and the directory password that you set earlier.

Create a test Active Directory user

You will use this test user account to sign in to an EC2 instance and initiate a command that simulates suspicious activity that results in this account being disabled.

To use the directory administration EC2 instance to create a test user on the Active Directory:

  1. From the management EC2 instance, open the start menu, select Windows Administrative Tools and then open Active Directory Users and Computers.
  2. Browse to your Domain, the Domain OU, and then the Users OU, right-click and choose New and then select User.
  3. Create a TestUser user, making sure that you don’t select Account is disabled.

Create a privileged domain service account

You will create this domain user account with delegated permissions to be used by Systems Manager Windows Service.

To use the directory administration EC2 instance to create a service account in AD:

  1. From the management EC2 instance, open the start menu, select Windows Administrative Tools, and then open Active Directory Users and Computers.
  2. Browse to your Domain, the Domain OU, and then the Users OU. Right-click and select New, and then select User
  3. Create an SSMService user, making sure that you don’t select Account is disabled.

To delegate permission to the service account in AD:

  1. Right-click on the Users OU and select Delegate Control.
  2. Choose Next on the Delegation of Control Wizard.
  3. Add the new service user you created earlier and choose Next.
  4. Select Create a custom task to delegate and choose Next.
  5. Select Only the following objects in the folder and select User Objects, then choose Next.
  6. Select General and Property-specific to show the permissions, select Read userAccountControl and Write userAccountControl (near the end of the list), then choose Next and Finish.

To add a service account to the local administrators group:

  1. From the management EC2 instance, open the start menu, select Windows Administrative Tools, and then open Computer Management.
  2. Browse to Local Users and Groups, then to Groups.
  3. Right-click on Administrators and select Properties.
  4. Choose Add to add the new service user you created earlier and choose OK.

Configure Systems Manager

Configure Systems Manager on the directory administration EC2 instance with permission to manage the Active Directory.

To configure Systems Manager:

  1. From the management EC2 instance from the Start Menu, select Windows Administrative Tools, and then open Services.
  2. Locate the Amazon SSM Agent, right-click, and select Properties.
  3. Select the Log On tab and select This account.
  4. Within This account enter the privileged domain username you created earlier followed by @ and then the domain name, for example [email protected]. Enter your password and choose OK.
    Figure 3: Microsoft Windows Services showing Systems Manager Agent settings

    Figure 3: Microsoft Windows Services showing Systems Manager Agent settings

  5. Choose OK on the This account has been granted Log On As A Service right and The new logon name will not take effect until you stop and restart the service popups.
  6. Right-click Amazon SSM Agent and select Restart.

Systems Manager Run Command

Run Command is a feature of Systems Manager that can remotely and securely manage the configuration of your managed nodes. You can use Run Command to automate common administrative tasks and perform one-time configuration changes at scale. You can use Run Command from the console, the AWS Command Line Interface (AWS CLI), AWS Tools for PowerShell, or the AWS SDKs. Run Command is offered at no additional cost.

To create a Run Command document with a PowerShell command to disable domain user accounts:

  1. Go to the AWS Systems Manager console.
  2. Select Documents under Change Management Tools.
  3. Choose Create document and select Command or Session.
  4. Enter a name, for example DisableADUser.
  5. Select document type Command.
  6. Select YAML and then enter the following code:
    ---
    schemaVersion: "2.2"
    description: "Disable AD Users"
    parameters:
      UserName:
        type: String
        description: "(Required) The username to disable."
    mainSteps:
    - action: "aws:runPowerShellScript"
      name: "DisableUser"
      inputs:
        runCommand:
        - "import-module activedirectory"
        - "$disableuser = get-aduser {{ UserName }} | select-object -ExpandProperty DistinguishedName"
        - "dsmod user $disableuser -disabled yes"
    

  7. Choose Create document.

To create a Run Command document with a bash command to find a username from a UserID:

  1. Follow steps 1–3 from the previous procedure.
  2. Enter a name, for example GetUsernameFromID.
  3. Select document type Command.
  4. Select YAML and then enter the following code:
    ---
    description: "Get Username from Linux"
    schemaVersion: "2.2"
    parameters:
      UserId:
        type: String
        description: "(Required) The User ID to find."
        default: "1000"
    mainSteps:
    - action: aws:runShellScript
      name: GetLinuxUsername
      precondition:
        StringEquals:
        - platformType
        - Linux
      inputs:
        timeoutSeconds: 7200
        runCommand:
          - "#!/bin/bash"
          - "#"
          - "UserName=$(id -nu {{ UserId }})"
          - "if [[ $UserName == *'@'* ]]; then"
          - "echo ${UserName%@*} "
          - "else if [[ $UserName == *'\\'* ]]; then"
          - "echo $UserName | sed 's/.*\\\\//g'"
          - "fi"
          - "fi"
      outputs:
        - Name: output
          Selector: $.Payload.output
          Type: String
    

  5. Choose Create document.

Step Functions

Step Functions is a serverless orchestration service that you can use to coordinate multiple AWS services, microservices, and third-party integrations into business-critical applications. Step Functions is widely used for orchestrating complex workflows, such as loan processing, fraud detection, risk management, and compliance processes. By breaking down these processes into a series of steps, Step Functions provides a clear overview and control of the entire workflow. This helps make sure that it executes each stage correctly and in the right order. One of the critical aspects of using Step Functions in regulated industries is the importance of security and data protection.

By the end of this section, your state machine should have a sequential flow that starts with a choice that defaults to No UserID found and with the UserID present, includes the steps Find Username, Wait, Get Username, and Disable AD User. If it doesn’t, you can drag the actions into the correct order or change the next state associated with each action. Alternatively, copy this state machine definition JSON and import it directly into Step Functions.

To create a Step Functions state machine to execute the Systems Manager Run Commands:

  1. Go to the Step Functions console.
  2. Choose Get Started.
  3. Choose Create your own.
  4. Enter a name for the state machine, select Standard, and choose Continue.
  5. Select JSONPath as the state machine query language.
  6. From the navigation pane, search for and add the Pass action by dragging the action to the center window.
  7. Add the Systems Manager: SendCommand Action for Finding the Username using Run Command.
  8. Select the SendCommand, change the state name to Find Username, and then enter the following code into API Parameters on the right side of the screen.
    {
      "DocumentName": "GetUsernameFromID",
      "Parameters": {
        "UserId.$": "States.Array(States.JsonToString($.detail.service.runtimeDetails.process.euid))"
      },
      "Targets": [
        {
          "Key": "InstanceIds",
          "Values.$": "States.Array($.detail.resource.instanceDetails.instanceId)"
        }
      ]
    }
    

  9. With SendCommand selected, select the Input/Output tab, select Add original input to output using ResultPath, select Combine original input with result, and enter the following:
    $.RunCommand.State
    

  10. Add a Wait Action and set the number of seconds to wait before resuming the execution to 5 seconds.
  11. Add a Systems Manager: GetCommandInvocation action, which will get the Username value from Run Command and change the state name to Get Username, then enter the following API Parameters.
    {
      "CommandId.$": "$.RunCommand.State.Command.CommandId",
      "InstanceId.$": "$.detail.resource.instanceDetails.instanceId"
    }
    

  12. On the Input/Output tab, select Transform result with ResultSelector and enter the following:
    {
      "StandardOutputContent.$": "States.StringSplit($.StandardOutputContent,'\n')"
    }
    

  13. Add a Systems Manager: SendCommand action which will disable the Active Directory user using Run Command. Change the state name to Disable AD User then enter the following API Parameters, changing the InstanceIds value to the ID of your Active Directory Management server.
    {
      "DocumentName": "DisableADUser",
      "Parameters": {
        "UserName.$": "$.StandardOutputContent"
      },
      "Targets": [
        {
          "Key": "InstanceIds",
          "Values": [
            "i-0b22a22eec53b9321"
          ]
        }
      ]
    }
    

  14. Add a Choice action, choose the pencil icon next to Rule #1, choose Edit conditions, enter the variable $.detail.service.runtimeDetails.process.euid, select operator is present, value true, leave Not as blank, and choose Save Conditions.
  15. Re-arrange the state machine layout to the same structure as displayed in Figure 4, with a sequential flow that starts with a choice that defaults to No UserID found and with the UserID present includes the steps Find Username, Wait, Get Username, and Disable AD User.
    Figure 4: Step Functions state machine structure

    Figure 4: Step Functions state machine structure

  16. Choose Create (top right) and then Confirm to create the step function state machine.

To add permissions to enable the State Machine to run System Manager commands:

  1. Within the newly created state machine, choose Config (top center).
  2. Choose View in IAM, under Permissions, Execution role.
  3. Choose Add permissions, Attach Polices (center right).
  4. Search for and select AmazonSSMAutomationRole and choose Add permission.

EventBridge

EventBridge helps developers build event-driven architectures (EDA) by connecting loosely coupled publishers and consumers using event routing, filtering, and transformation. To create an EventBridge rule that triggers the Systems Manger Run Command document you created earlier:

  1. Go to the Amazon EventBridge console and select Create rule with EventBridge Rule.
  2. Enter a name, for example GuardDutyDisableADuser.
  3. Select Rule with an event pattern and choose Next.
  4. Under the Event pattern JSON window, choose Edit pattern and enter the following:
    {
      "source": ["aws.guardduty"],
      "detail-type": ["GuardDuty Finding"]
    }
    

  5. Choose Next.
  6. Select AWS Service.
  7. Select Step Functions state machine as the target.
  8. Select the state machine you created earlier, for example MyStateMachine-A123456789.
  9. Choose Next twice and choose Create rule

Create a test EC2 instance

To generate alerts on GuardDuty, you create a domain joined Linux EC2 instance. For this example, you’ll use two separate EC2 instances so you can monitor for activity from each instance within GuardDuty and use EventBridge to create automations.

To create an AWS Identity and Access Management (IAM) role to permit the EC2 instance to join the AD:

  1. Go to the IAM console.
  2. Select Policies from the navigation pane.
  3. Choose Create policy (top right).
  4. Select Policy editor JSON, enter the following code and choose Next.
    {
    "Version": "2012-10-17",
    "Statement": [
    	{
    		"Effect": "Allow",
    		"Action": [
    			"secretsmanager:GetSecretValue",
    			"secretsmanager:DescribeSecret"
    			],
    		"Resource": "*"
    	}
    	]
    }
    

  5. Enter the Policy name, for example SecretsManagerGetSecrets, and choose Create policy.
  6. Select Roles from navigation pane.
  7. Choose Create role (top right).
  8. Select AWS service and choose EC2 from the service or use case selection, then choose Next.
  9. Search for and select the following policies and choose Next
    • AmazonSSMDirectoryServiceAccess
    • AmazonSSMManagedInstanceCore
    • SecretsManagerGetSecrets (created earlier)
  10. Enter the role name, for example EC2DomainJoin, and choose Create role.

To create a secret that will be used to store privileged credentials used to join EC2 instances to the domain:

  1. Go to the Secrets Manager console.
  2. Select Store a new secret.
  3. Select Other type of secret.
  4. Add the following keys with the corresponding value of a domain username and password that have permissions to join computers to the domain:
    1. awsSeamlessDomainUsername
    2. awsSeamlessDomainPassword
  5. Choose Next.
  6. Enter the following secret name, replacing <d-1234567890> with your directory ID.
    aws/directory-services/<d-1234567890>/seamless-domain-join
    

  7. Choose Next twice, then Store.

For more information more, see Seamlessly joining an Amazon EC2 Linux instance to your AWS Managed Microsoft AD Active Directory.

To create a domain joined EC2 instance for testing this GuardDuty automation:

  1. Go to the Amazon EC2 console.
  2. Select Instances from navigation pane.
  3. Choose Launch Instances.
  4. Select Amazon Linux AMI.
  5. Select an existing Key Pair or create a new key pair.
  6. Scroll to the bottom and select Advanced details.
  7. Within Domain join directory, select the domain
  8. Within IAM instance profile, select the EC2DomainJoin role that you created earlier.
  9. Choose Launch Instance.

Testing

To simulate a threat, use a GuardDuty test domain that GuardDuty will recognize as a command and control server.

  1. Go to the Amazon EC2 console.
  2. Choose Instances from the navigation pane.
  3. Select the test EC2 instance that you created earlier.
  4. Choose Connect, select the Session Manager tab, and choose Connect
  5. Authenticate with your test user by entering su followed by the test user with the domain name that you created earlier. For example su [email protected], then enter the password.
  6. Enter the command curl guarddutyc2activityb.com.
    • You will receive an error because the page won’t resolve, but GuardDuty will have detected suspicious events.
  7. Go to the GuardDuty console and select Findings from the navigation pane.
  8. Within 3–5 minutes, you should see a high severity finding for Backdoor:EC2/C&CActivity.B!DNS.

Note: You must archive the GuardDuty finding before re-running this test, because the EventBridge rule only runs once against a GuardDuty finding with the same details. To archive the finding, select the check box next to the Backdoor:EC2/C&CActivity.B!DNS finding, choose Actions (top right), and select Archive.

Figure 5: GuardDuty simulated findings

Figure 5: GuardDuty simulated findings

If you go back to Active Directory Users and Computers on the Directory Administration EC2 instance, you should see that the Test User is now disabled. You can enable the user by right-clicking on the user and selecting Enable Account.

Figure 6: Active Directory Users and Computers showing the disabled test use

Figure 6: Active Directory Users and Computers showing the disabled test use

Conclusion

In this post, you learned how to deploy AWS Managed AD, Systems Manager Run Command, EventBridge, Step Functions, and GuardDuty to monitor for suspicious events and disable the associated Active Directory user account.

You can expand this scenario by creating Run Command documents that reset Active Directory passwords, disable computer accounts, or Active Directory tasks supported by Microsoft PowerShell. Additionally, you can add steps within the Step Functions state machine to notify administrators through Amazon Simple Notification Service (Amazon SNS) or add additional checks with AWS Lambda.

Although this post uses AWS Managed Microsoft AD, the same functionality can be achieved with a manual deployment of Active Directory on Amazon EC2 or on-premises, either by using an EC2 instance joined to the Active Directory domain with the Active Directory administration tools installed or by installing Systems Manager agent onto a management server on-premises.

If you have feedback about this post, submit comments in the Comments section below. If you have questions about this post, start a new thread on AWS re:Post GuardDuty or contact AWS Support.
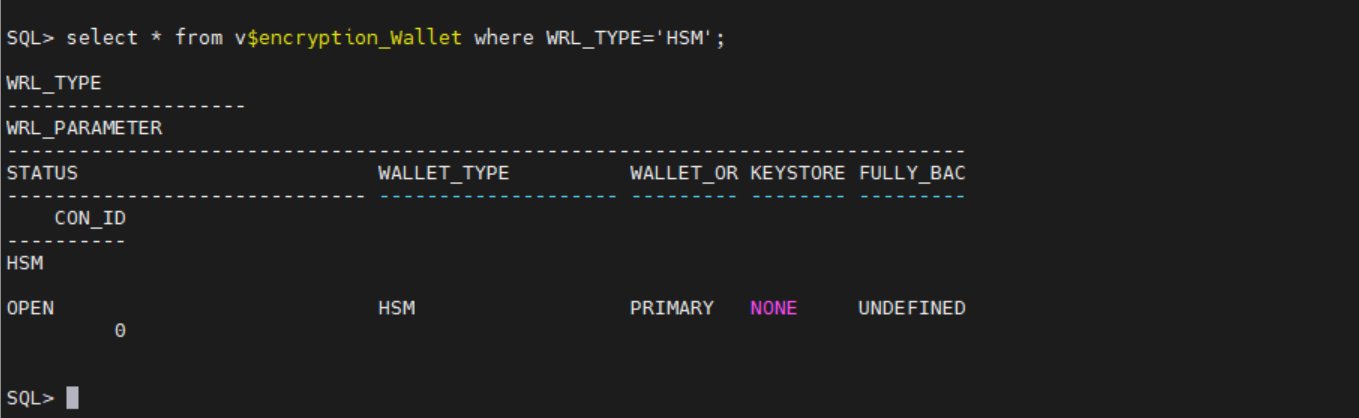
Tim Kingdon

Tim Kingdon

Tim is a Senior Partner Solutions Architect at AWS and has more than 25 years of experience in healthcare, financial, government, and defence industries. In his role, he provides strategic technical guidance to partners and helps drive their success through technical enablement initiatives.

How Zapier runs isolated tasks on AWS Lambda and upgrades functions at scale

Post Syndicated from Anton Aleksandrov original https://aws.amazon.com/blogs/architecture/how-zapier-runs-isolated-tasks-on-aws-lambda-and-upgrades-functions-at-scale/

Zapier is a leading no-code automation provider whose customers use their solution to automate workflows and move data across over 8,000 applications such as Slack, Salesforce, Asana, and Dropbox. Zapier runs these automations through integrations called Zaps, which are implemented using a serverless architecture running on Amazon Web Services (AWS). Each Zap is powered by an AWS Lambda function.

In this post, you’ll learn how Zapier has built their serverless architecture focusing on three key aspects: using Lambda functions to build isolated Zaps, operating over a hundred thousand Lambda functions through Zapier’s control plane infrastructure, and enhancing security posture while reducing maintenance efforts by introducing automated function upgrades and cleanup workflows into their platform architecture.

Architecting a secure and isolated runtime environment

Zaps created by Zapier’s users implement tenant-specific business logic, hence they require cross-tenant compute isolation. Code implementing one Zap can’t share an execution environment with code implementing another Zap. Moreover, the same Zap type used by two different tenants can’t share execution environments as well.

To achieve the required level of isolation, Zapier’s engineering team adopted AWS Lambda, a serverless compute service that runs code in response to events and automatically manages cloud compute resources. Minimal operational overhead, built-in high availability, automated scaling, high level of isolation, and pay-per-use model made Lambda a great fit for this use case. Currently, Zapier’s architecture is running over a hundred thousand Lambda functions to support their customer’s integration workflows.

Because they’re powered by the open source Firecracker microVMs, each function is completely isolated from the others. Moreover, each execution environment belonging to the same function (sometimes referred to as function instances) is also isolated from other execution environments. The following architecture topology diagram uses red lines to represent isolation boundaries. Each execution environment of every function is isolated from its peers and is getting its own virtual resources such as disk, memory, and CPU. For more details, read Security in AWS Lambda.

Isolation boundary

Zapier’s control plane is architected using Amazon Elastic Kubernetes Service (Amazon EKS). A designated database is used to maintain the up-to-date function inventory. Whenever a user creates a new Zap, the control plane creates a corresponding Lambda function and stores a reference in the inventory database. When a Zap is triggered, the control plane retrieves information about a relevant Lambda function and invokes it to facilitate the integration workflow, as illustrated in the following diagram.

Control and Data planes

Understanding the runtime deprecation process

When building architectures using the traditional non-serverless compute, cloud engineers are the ones responsible for keeping operating systems and software on their compute instances up to date and applying security and maintenance patches. With serverless architectures and Lambda functions, security patches and minor runtime upgrades are handled by AWS automatically, which means customers can focus on delivering business value instead of the undifferentiated heavy lifting of infrastructure management.

When a major Lambda managed runtime version reaches end-of-life, AWS initiates a deprecation process through the AWS Health Dashboard and direct email communications to affected customers. Because deprecated runtimes eventually lose access to security updates and support, organizations must upgrade to supported runtime versions to avoid potential security risks. Read more about the shared responsibility model, runtime use after deprecation, and receiving runtime deprecation notifications.

As Zapier’s user base and architectural complexity – and consequently the number of Zaps – were growing, keeping all functions on the most up-to-date major runtime versions became a laborious task. Top contributing factors were:

  • High number of functions. At its peak, the Zapier platform was running Zaps using hundreds of thousands of unique Lambda functions. Approximately 35% of these functions were using a runtime that was scheduled for deprecation in the next 12 months.
  • Zapier architected their data plane environment to be ephemeral – the control plane creates and deletes Lambda functions on demand and manages their lifecycle dynamically. Identifying a specific owner for each affected function wasn’t always straightforward.
  • Security is paramount at Zapier and upgrading affected functions runtime prior to the deprecation date was an absolute must. At no point could Zapier functions use runtimes after their deprecation date. This was a task which required extra resources.
  • The upgrade process shouldn’t have had any impact on the end customer experience. At no point should customer experience be affected.

With a short runway, high-volume workload, and the strict requirements of not impacting customer experience, Zapier’s Platform Engineering team took on this challenge of maintaining high security posture in their platform architecture.

Applying the solution

The solution had three work streams:

  1. Reducing the risk by analyzing the architecture and identifying and cleaning up unused functions.
  2. Prioritizing upgrades by identifying the most critical and impactful functions.
  3. Empowering engineering teams with automated tools and knowledge to streamline the upgrade process in future.

Identify and clean up unused functions

The first step in streamlining the upgrade process was identifying and removing unused functions. This reduced the total number of functions in Zapier’s architecture that required upgrades, eliminating unnecessary work for the team.

Zapier started by augmenting the function inventory with runtime information using AWS Trusted Advisor and Amazon Cloud Intelligence Trusted Advisor dashboards, as illustrated in the following diagram.

Gathering data

This meant the team could build a detailed inventory of functions that were running on soon-to-be deprecated runtimes. Using Amazon CloudWatch, Zapier’s platform team started to monitor metrics such as number of invocations. They identified which functions were active, which functions weren’t used for an extended period, and which functions didn’t have an active owner and could be removed.

One of the primary mechanisms for ownership validation within the organization was using resource tags. Functions that were active, but didn’t have clear ownership, were flagged for additional review before removal. Functions that were confirmed as unused or didn’t have an active owner were marked for deletion. Removing such functions allowed Zapier to significantly simplify their architecture and reduce the number of functions that had to be upgraded.

Prioritizing upgrades

With a smaller volume of functions to upgrade, Zapier’s platform team prioritized function upgrades based on usage patterns, criticality, and potential customer impact. Three primary prioritization categories were:

  • Customer-facing functions – Any functions directly involved in executing user Zaps were marked as high priority. These had to be upgraded first to avoid service disruptions.
  • Backend infrastructure functions – Internal functions that supported system operations were evaluated based on their importance to platform stability.
  • High-volume functions – Functions with the highest execution frequency were prioritized because upgrading them would have the greatest impact on reducing operational risk.

Using these factors, Zapier’s platform team has created an upgrade roadmap, ensuring that critical assets were addressed first while minimizing potential disruptions.

Refer to Retrieve data about Lambda functions that use a deprecated runtime in the Lambda Developer Guide to learn how to identify most commonly and most frequently used Lambda functions in your serverless architecture.

Empowering engineering teams with automated tools and knowledge

To ensure a smooth and efficient upgrade process across their serverless architecture, Zapier’s team empowered engineering teams with clear guidelines and automated solutions. The platform incorporated two main approaches: Terraform-managed functions and a custom-built Lambda runtime canary tool. Implementing and adopting these tools and practices resulted in reducing the number of functions using soon-to-be deprecated runtimes by 95%.

For functions managed through infrastructure-as-code (IaC), Zapier’s team developed standardized Terraform modules that specified supported runtime versions. Development teams implemented these modules in their configurations:

resource "aws_lambda_function" "example" {
    runtime = "python3.13"  # Updated to supported runtime
}

After applying the new module version, teams validated changes by testing the new runtime in staging environments and monitoring Terraform plan outputs to ensure proper runtime version updates.

To efficiently manage most Lambda functions in their architecture, Zapier developed the Lambda runtime canary tool suite. Using this solution, they automated the runtime upgrade process for thousands of active Lambda functions with minimal manual intervention. The tool suite implements several key features:

  • Architected for gradual traffic shifting with the Lambda built-in routing mechanism through function version and aliasing. The tool can gradually shift traffic distribution from an old to a new function version. During this gradual traffic shift, the system monitors CloudWatch metrics for errors and automatically rolls back if error rates exceed acceptable thresholds.
  • Optimistic upgrade strategy implements direct upgrades for infrequently used functions using a flag value stored in a cache to detect potential issues during the first post-upgrade invocation. If this invocation fails, the control plane retries it using the previous function version. If the retried invocation succeeds, Zapier’s control plane initiates a rollback, assuming the error is most likely due to the runtime upgrade. After rollback, it will log the error and alert relevant stakeholders.
  • Integration with existing infrastructure uses an administrative interface and task queue for automated traffic shifting. A database ledger maintains tracking of function states and rollback information.
  • Operational controls provide manual rollback capabilities and implement centralized control switches for process management. After a function was upgraded to a new runtime and no rollback activity was detected within a set time period, an automated pruning task cleans up older versions.

Zapier’s Lambda canary tool, through its integration of gradual traffic shifting, real-time CloudWatch monitoring, and automated rollback mechanisms, established a sustainable framework for managing runtime upgrades across their serverless architecture. This approach not only automated the upgrade process and minimized operational risks but also created a scalable solution that provides continuous runtime upgrades, preventing the use of deprecated runtimes at any point. By allowing continuous function runtime updates with minimal disruption to end user experience, Zapier maintains security and stability while requiring minimal manual intervention. This framework efficiently manages their growing serverless infrastructure, providing both security and operational efficiency for future runtime updates.

Conclusion

In this post, you’ve learned how Zapier architected their software-as-a-service (SaaS) platform to provide secure, isolated execution environments using AWS Lambda and Amazon EKS, enabling their customers to create hundreds of thousands of Zaps. You’ve learned how Zapier’s team implemented the function runtime upgrade process at scale and reduced the number of functions running on soon-to-be deprecated runtimes by 95%. You’ve seen best practices that were established and techniques that helped Zapier to keep high security posture without impacting customer experience.

Use the following links to learn more about Lambda runtimes and upgrading your functions to the latest runtime versions:


About the authors

Implementing message prioritization with quorum queues on Amazon MQ for RabbitMQ

Post Syndicated from Akhil Melakunta original https://aws.amazon.com/blogs/compute/implementing-message-prioritization-with-quorum-queues-on-amazon-mq-for-rabbitmq/

Quorum queues are now available on Amazon MQ for RabbitMQ from version 3.13. Quorum queues are a replicated First-In, First-Out (FIFO) queue type that uses the Raft consensus algorithm to maintain data consistency. Quorum queues on RabbitMQ version 3.13 lack one key feature compared to classic queues: message prioritization. However, RabbitMQ version 4.0 introduced support for message priority, which behaves differently than classic queue message priorities. Migrating applications from classic queues with message priority to quorum queues on Amazon MQ for RabbitMQ presents challenges for customers. This post describes the different approaches to implementing message prioritization in quorum queues in Amazon MQ for RabbitMQ.

Amazon MQ is a managed message broker service for Apache ActiveMQ and RabbitMQ that simplifies setting up and operating message brokers on AWS.

Why message prioritization matters

Modern messaging systems require handling messages differently, depending on the business priority. Some messages are more time-sensitive or critical than others and prioritizing them can enhance the efficiency and responsiveness of applications. Message prioritization allows certain messages to be processed before others, aligning with business priorities and helping to ensure that high-value or time-critical messages receive the attention they need.

Message prioritization addresses critical business challenges across multiple industries. In insurance companies, it can expedite urgent claim processing by prioritizing high-priority messages over routine policy updates, reducing settlement times. Automotive manufacturers can make sure that critical production line alerts and safety notifications take precedence over standard telemetry data, preventing costly downtime. Energy utilities can prioritize real-time grid stability alerts and outage notifications, enabling faster responses to potential blackouts. By implementing message priority, industries can direct immediate attention to time-sensitive operations while efficiently managing routine processes within existing infrastructure. By using this approach to transform their communication strategies, organizations can respond more quickly and effectively to critical events.

Classic queues compared to quorum queues message prioritization

In this section, explore the fundamental differences between classic queues and quorum queues when it comes to message prioritization capabilities. Examine how each queue type handles message priority, the built-in features available, and key considerations.

Message prioritization with classic queues

In classic queues, RabbitMQ supports message priorities ranging from 1 to 255, with 1 being the lowest priority and 255 being the highest. However, it’s generally recommended to use a smaller range (for example, 1–5) for better performance, because RabbitMQ needs to maintain an internal sub-queue for each priority from 1 up to the maximum value configured for a given queue. A wider priority range adds more CPU and memory cost, which can impact broker performance.

Priority queue behavior in classic queues:

  • Classic queues require x-max-priority argument to define the maximum number of priorities for a given queue
  • A procedure sends a message with a priority property value
  • Consumers don’t need special configuration to handle priorities
  • Messages with higher priority are delivered before messages with lower priority
  • Within the same priority level, messages are delivered in FIFO order
  • Messages without a priority property are treated as if their priority is lowest
  • Messages with a priority that is higher than the queue’s maximum are treated as if they were published with the maximum priority

Example Python code for classic queue implementation with message priority:

#!/usr/bin/env python
import pika
import ssl
# Set up SSL context for secure connection
context = ssl.SSLContext(ssl.PROTOCOL_TLSv1_2)
# Define credentials
credentials = pika.PlainCredentials('username', 'password') # Replace with actual credentials
# Set up connection parameters for Amazon MQ RabbitMQ broker
connection_parameters = pika.ConnectionParameters(
    host='b-example.mq.us-west-2.on.aws', # Replace with actual broker endpoint
    port=5671,
    credentials=credentials,
    ssl_options=pika.SSLOptions(context)
)
# Establish connection and create a channel
connection = pika.BlockingConnection(connection_parameters)
channel = connection.channel()
# Declare a direct exchange
# - direct exchanges route messages based on routing key
channel.exchange_declare(
    exchange='priority_exchange',
    exchange_type='direct',
)
# Declare a priority queue
# - x-max-priority=5 sets maximum priority level (0-5)
# - x-queue-type=classic specifies classic queue implementation
channel.queue_declare(
    queue='classic_priority_queue',
    arguments={
        'x-max-priority': 5,
        'x-queue-type': "classic"
    }
)
# Bind queue to exchange with routing key
# - This connects the queue to the exchange
# - Messages sent to the exchange with matching routing key will be routed to this queue
channel.queue_bind(
    queue='classic_priority_queue',
    exchange='priority_exchange',
    routing_key='priority_queue'
)
# Publish messages with different priorities
# Low priority message (priority=1)
channel.basic_publish(
    exchange='priority_exchange',
    routing_key='priority_queue',
    body='Low priority message',
    properties=pika.BasicProperties(priority=1)
)
print(" [x] Sent 'Low priority message'")
# Medium priority message (priority=2)
channel.basic_publish(
    exchange='priority_exchange',
    routing_key='priority_queue',
    body='Medium priority message',
    properties=pika.BasicProperties(priority=2)
)
print(" [x] Sent 'Medium priority message'")
# High priority message (priority=5)
channel.basic_publish(
    exchange='priority_exchange',
    routing_key='priority_queue',
    body='High priority message',
    properties=pika.BasicProperties(priority=5)
)
print(" [x] Sent 'High priority message'")
# Close the connection
connection.close()

The preceding code demonstrates message prioritization in RabbitMQ using a classic queue with built-in priority handling. The implementation connects to a RabbitMQ broker using the Python Pika library and declares a direct exchange, a classic queue with a maximum priority level of 5. Messages are then published to this single queue with explicitly assigned priority values (1 for low, 2 for medium, and 5 for high priority). When consumers fetch messages from this queue, RabbitMQ will deliver higher priority messages first.

Message prioritization with quorum queues

Unlike classic queues, quorum queues in Rabbit MQ 3.13 don’t support message prioritization natively. However, there are effective patterns that you can implement to achieve message priority with Quorum queues.

Using separate queues for different priorities

A straightforward method is to create multiple quorum queues, each dedicated to different priority levels. For example, you might have a high-priority queue and a low-priority queue. Using RabbitMQ exchange and binding key route messages to the appropriate queues based on their priority, allowing the system to process high-priority messages more promptly, as shown in the following figure.

Example to implement priority handling using separate quorum queues:

#!/usr/bin/env python
import pika
import ssl
# Set up SSL context for secure connection
context = ssl.SSLContext(ssl.PROTOCOL_TLSv1_2)
# Define credentials
credentials = pika.PlainCredentials('username', 'password') #Replace with actual credentials
# Set up connection parameters for Amazon MQ RabbitMQ broker
connection_parameters = pika.ConnectionParameters(
    host='b-example.mq.us-west-2.on.aws',
    port=5671,
    credentials=credentials,
    ssl_options=pika.SSLOptions(context)
)
# Establish connection and create a channel
connection = pika.BlockingConnection(connection_parameters)
channel = connection.channel()
# Declare a direct exchange
# - Direct exchanges route messages based on routing key
channel.exchange_declare(
    exchange='priority_exchange_qq',
    exchange_type='direct'
)
# Create separate quorum queues for different priority levels
# Low priority queue
channel.queue_declare(
    queue='low_priority_queue',
    durable=True,
    arguments={
        'x-queue-type': "quorum" 
    }
)
# Bind the low priority queue to the exchange with a specific routing key
# - This creates a rule that messages sent to 'priority_exchange' with routing_key='low_priority_1'
# - will be routed to the 'low_priority_queue'
channel.queue_bind(
    queue='low_priority_queue',
    exchange='priority_exchange_qq',
    routing_key='low_priority_1'
)
# Medium priority queue
channel.queue_declare(
    queue='medium_priority_queue',
    durable=True,
    arguments={
        'x-queue-type': "quorum" 
    }
)
# Bind the medium priority queue to the exchange with a specific routing key
# - Messages with routing_key='medium_priority_2' will be directed to the 'medium_priority_queue'
channel.queue_bind(
    queue='medium_priority_queue',
    exchange='priority_exchange_qq',
    routing_key='medium_priority_2'
)
# High priority queue
channel.queue_declare(
    queue='high_priority_queue',
    durable=True,
    arguments={
        'x-queue-type': "quorum" 
    }
)
# Bind the high priority queue to the exchange with a specific routing key
# - Messages with routing_key='high_priority_2' will be directed to the 'high_priority_queue'
channel.queue_bind(
    queue='high_priority_queue',
    exchange='priority_exchange_qq',
    routing_key='high_priority_5'
)
# Publish messages to different priority queues
print(" [x] Publishing messages to different priority queues")
# Low priority message
channel.basic_publish(
    exchange='priority_exchange_qq',  
    routing_key='low_priority_1',
    body='Low priority message'
)
print(" [x] Sent 'Low priority message'")
# Medium priority message
channel.basic_publish(
    exchange='priority_exchange_qq', 
    routing_key='medium_priority_2',
    body='Medium priority message'
)
print(" [x] Sent 'Medium priority message'")
# High priority message
channel.basic_publish(
    exchange='priority_exchange_qq', 
    routing_key='high_priority_5',
    body='High priority message'
)
print(" [x] Sent 'High priority message'")
# Close the connection
connection.close()
print(" [x] Connection closed")

The preceding code demonstrates a message prioritization approach in RabbitMQ using separate quorum queues for different priority levels (low, medium, and high). The implementation uses the Python Pika library to connect to a RabbitMQ server, a direct exchange and three separate quorum queues for different priority levels, and publish messages to different routing keys with different priority.

Custom priority logic on consumers

Implement custom logic within your application to handle messages based on their priority. For example, you can use headers or metadata to determine the priority of a message and then use this information to route messages to different queues or handle them in a specific order.

Higher priority queues should use more consumers or consumers with higher resources allocated to process messages more quickly than lower priority queues. Use the basic.qos (prefetch) method in manual acknowledgement mode on your consumers to limit the number of messages that can be out for delivery at any time and allow messages to be prioritized. basic.qos is a value a consumer sets when connecting to a queue. It indicates how many messages the consumer can handle at one time. This method is shown in the following figure.

Note: This solution implements message priority on a best-effort basis. There is a possibility that low and medium priority messages may be processed before high priority messages.

Conclusion

Message prioritization in RabbitMQ brokers on Amazon MQ has different considerations for classic and quorum queues. Using quorum queues requires a thoughtful approach because of the lack of native support for message proritization in RabbitMQ. By employing separate queues and custom logic, you can achieve effective prioritization while maintaining the high availability and consistency that quorum queues offer. Embrace these strategies to optimize your messaging infrastructure, enhance application responsiveness, and make sure that critical messages are processed in a timely manner.

We recommend that you adopt quorum queues as the preferred replicated queue type on RabbitMQ 3.13 brokers. For more details, see Amazon MQ documentation. For more information, see quorum queues.

To learn more, see Amazon MQ for Rabbit MQ.

Optimizing vector search using Amazon S3 Vectors and Amazon OpenSearch Service

Post Syndicated from Sohaib Katariwala original https://aws.amazon.com/blogs/big-data/optimizing-vector-search-using-amazon-s3-vectors-and-amazon-opensearch-service/

NOTE: As of July 15, the Amazon S3 Vectors Integration with Amazon OpenSearch Service is in preview release and is subject to change.

The way we store and search through data is evolving rapidly with the advancement of vector embeddings and similarity search capabilities. Vector search has become essential for modern applications such as generative AI and agentic AI, but managing vector data at scale presents significant challenges. Organizations often struggle with the trade-offs between latency, cost, and accuracy when storing and searching through millions or billions of vector embeddings. Traditional solutions either require substantial infrastructure management or come with prohibitive costs as data volumes grow.

We now have a public preview of two integrations between Amazon Simple Storage Service (Amazon S3) Vectors and Amazon OpenSearch Service that give you more flexibility in how you store and search vector embeddings:

  1. Cost-optimized vector storage: OpenSearch Service managed clusters using service-managed S3 Vectors for cost-optimized vector storage. This integration will support OpenSearch workloads that are willing to trade off higher latency for ultra-low cost and still want to use advanced OpenSearch capabilities (such as hybrid search, advanced filtering, geo filtering, and so on).
  2. One-click export from S3 Vectors: One-click export from an S3 vector index to OpenSearch Serverless collections for high-performance vector search. Customers who build natively on S3 Vectors will benefit from being able to use OpenSearch for faster query performance.

By using these integrations, you can optimize cost, latency, and accuracy by intelligently distributing your vector workloads by keeping infrequent queried vectors in S3 Vectors and using OpenSearch for your most time-sensitive operations that require advanced search capabilities such as hybrid search and aggregations. Further, OpenSearch performance tuning capabilities (that is, quantization, k-nearest neighbor (knn) algorithms, and method-specific parameters) help to improve the performance with little compromise of cost or accuracy.

In this post, we walk through this seamless integration, providing you with flexible options for vector search implementation. You’ll learn how to use the new S3 Vectors engine type in OpenSearch Service managed clusters for cost-optimized vector storage and how to use one-click export from S3 Vectors to OpenSearch Serverless collections for high-performance scenarios requiring sustained queries with latency as low as 10ms. By the end of this post, you’ll understand how to choose and implement the right integration pattern based on your specific requirements for performance, cost, and scale.

Service overview

Amazon S3 Vectors is the first cloud object store with native support to store and query vectors with sub-second search capabilities, requiring no infrastructure management. It combines the simplicity, durability, availability, and cost-effectiveness of Amazon S3 with native vector search functionality, so you can store and query vector embeddings directly in S3. Amazon OpenSearch Service provides two complementary deployment options for vector workloads: Managed Clusters and Serverless Collections. Both harness Amazon OpenSearch’s powerful vector search and retrieval capabilities, though each excels in different scenarios. For OpenSearch users, the integration between S3 Vectors and Amazon OpenSearch Service offers unprecedented flexibility in optimizing your vector search architecture. Whether you need ultra-fast query performance for real-time applications or cost-effective storage for large-scale vector datasets, this integration lets you choose the approach that best fits your specific use case.

Understanding Vector Storage Options

OpenSearch Service provides multiple options for storing and searching vector embeddings, each optimized for different use cases. The Lucene engine, which is OpenSearch’s native search library, implements the Hierarchical Navigable Small World (HNSW) method, offering efficient filtering capabilities and strong integration with OpenSearch’s core functionality. For workloads requiring additional optimization options, the Faiss engine (Facebook AI Similarity Search) provides implementations of both HNSW and IVF (Inverted File Index) methods, along with vector compression capabilities. HNSW creates a hierarchical graph structure of connections between vectors, enabling efficient navigation during search, while IVF organizes vectors into clusters and searches only relevant subsets during query time. With the introduction of the S3 engine type, you now have a cost-effective option that uses Amazon S3’s durability and scalability while maintaining sub-second query performance. With this variety of options, you can choose the most suitable approach based on your specific requirements for performance, cost, and accuracy. For instance, if your application requires sub-50 ms query responses with efficient filtering, Faiss’s HNSW implementation is the best choice. Alternatively, if you need to optimize storage costs while maintaining reasonable performance, the new S3 engine type would be more appropriate.

Solution overview

In this post, we explore two primary integration patterns:

OpenSearch Service managed clusters using service-managed S3 Vectors for cost-optimized vector storage.

For customers already using OpenSearch Service domains who want to optimize costs while maintaining sub-second query performance, the new Amazon S3 engine type offers a compelling solution. OpenSearch Service automatically manages vector storage in Amazon S3, data retrieval, and cache optimization, eliminating operational overhead.

One-click export from an S3 vector index to OpenSearch Serverless collections for high-performance vector search.

For use cases requiring faster query performance, you can migrate your vector data from an S3 vector index to an OpenSearch Serverless collection. This approach is ideal for applications that require real-time response times and gives you the benefits that come with Amazon OpenSearch Serverless, including advanced query capabilities and filters, automatic scaling and high availability, and no administration. The export process automatically handles schema mapping, vector data transfer, index optimization, and connection configuration.

The following illustration shows the two integration patterns between Amazon OpenSearch Service and S3 Vectors.

Prerequisites

Before you begin, make sure you have:

  • An AWS account
  • Access to Amazon S3 and Amazon OpenSearch Service
  • An OpenSearch Service domain (for the first integration pattern)
  • Vector data stored in S3 Vectors (for the second integration pattern)

Integration pattern 1: OpenSearch Service managed cluster using S3 Vectors

To implement this pattern:

  1. Create an OpenSearch Service Domain using OR1 instances on OpenSearch version 2.19.
    1. While creating the OpenSearch Service domain, choose the Enable S3 Vectors as an engine option in the Advanced features section.
  2. Sign in to OpenSearch Dashboards and open Dev tools. Then create your knn index and specify s3vector as the engine.
PUT my-first-s3vector-index
{
  "settings": {
    "index": {
      "knn": true
    }
  },
  "mappings": {
    "properties": {
        "my_vector1": {
          "type": "knn_vector",
          "dimension": 2,
          "space_type": "l2",
          "method": {
            "engine": "s3vector"
          }
        },
        "price": {
          "type": "float"
        }
    }
  }
} 
  1. Index your vectors using the Bulk API:
POST _bulk
{ "index": { "_index": "my-first-s3vector-index", "_id": "1" } }
{ "my_vector1": [2.5, 3.5], "price": 7.1 }
{ "index": { "_index": "my-first-s3vector-index", "_id": "3" } }
{ "my_vector1": [3.5, 4.5], "price": 12.9 }
{ "index": { "_index": "my-first-s3vector-index", "_id": "4" } }
{ "my_vector1": [5.5, 6.5], "price": 1.2 }
{ "index": { "_index": "my-first-s3vector-index", "_id": "5" } }
{ "my_vector1": [4.5, 5.5], "price": 3.7 }
{ "index": { "_index": "my-first-s3vector-index", "_id": "6" } }
{ "my_vector1": [1.5, 2.5], "price": 12.2 }
  1. Run a knn query as usual:
GET my-first-s3vector-index/_search
{
  "size": 2,
  "query": {
    "knn": {
      "my_vector1": {
        "vector": [2.5, 3.5],
        "k": 2
      }
    }
  }
}

The following animation demonstrates steps 2-4 above.

Integration pattern 2: Export S3 vector indexes to OpenSearch Serverless

To implement this pattern:

  1. Navigate to the AWS Management Console for Amazon S3 and select your S3 vector bucket.

  1. Select a vector index that you want to export. Under Advanced search export, select Export to OpenSearch.

Alternatively, you can:

  1. Navigate to the OpenSearch Service console.
  2. Select Integrations from the navigation pane.
  3. Here you will see a new Integration Template to Import S3 vectors to OpenSearch vector engine – preview. Select Import S3 vector index.

  1. You will now be brought to the Amazon OpenSearch Service integration console with the Export S3 vector index to OpenSearch vector engine template pre-selected and pre-populated with your S3 vector index Amazon Resource Name (ARN). Select an existing role that has the necessary permissions or create a new service role.

  1. Scroll down and choose Export to start the steps to create a new OpenSearch Serverless collection and copy data from your S3 vector index into an OpenSearch knn index.

  1. You will now be taken to the Import history page in the OpenSearch Service console. Here you will see the new job that was created to migrate your S3 vector index into the OpenSearch serverless knn index. After the status changes from In Progress to Complete, you can connect to the new OpenSearch serverless collection and query your new OpenSearch knn index.

The following animation demonstrates how to connect to the new OpenSearch serverless collection and query your new OpenSearch knn index using Dev tools.

Cleanup

To avoid ongoing charges:

  1. For Pattern 1:
  1. For Pattern 2:
    • Delete the import task from the Import history section of the OpenSearch Service console. Deleting this task will remove both the OpenSearch vector collection and the OpenSearch Ingestion pipeline that was automatically created by the import task.

Conclusion

The innovative integration between Amazon S3 Vectors and Amazon OpenSearch Service marks a transformative milestone in vector search technology, offering unprecedented flexibility and cost-effectiveness for enterprises. This powerful combination delivers the best of both worlds: The renowned durability and cost efficiency of Amazon S3 merged seamlessly with the advanced AI search capabilities of OpenSearch. Organizations can now confidently scale their vector search solutions to billions of vectors while maintaining control over their latency, cost, and accuracy. Whether your priority is ultra-fast query performance with latency as low as 10ms through OpenSearch Service, or cost-optimized storage with impressive sub-second performance using S3 Vectors or implementing advanced search capabilities in OpenSearch, this integration provides the perfect solution for your specific needs. We encourage you to get started today by trying S3 Vectors engine in your OpenSearch managed clusters and testing the one-click export from S3 vector indexes to OpenSearch Serverless.

For more information, visit:


About the Authors

Sohaib Katariwala is a Senior Specialist Solutions Architect at AWS focused on Amazon OpenSearch Service based out of Chicago, IL. His interests are in all things data and analytics. More specifically he loves to help customers use AI in their data strategy to solve modern day challenges.

Mark Twomey is a Senior Solutions Architect at AWS focused on storage and data management. He enjoys working with customers to put their data in the right place, at the right time, for the right cost. Living in Ireland, Mark enjoys walking in the countryside, watching movies, and reading books.

Sorabh Hamirwasia is a senior software engineer at AWS working on the OpenSearch Project. His primary interest include building cost optimized and performant distributed systems.

Pallavi Priyadarshini is a Senior Engineering Manager at Amazon OpenSearch Service leading the development of high-performing and scalable technologies for search, security, releases, and dashboards.

Bobby Mohammed is a Principal Product Manager at AWS leading the Search, GenAI, and Agentic AI product initiatives. Previously, he worked on products across the full lifecycle of machine learning, including data, analytics, and ML features on SageMaker platform, deep learning training and inference products at Intel.

Deploying external boot volumes with AWS Outposts

Post Syndicated from Mark Nguyen original https://aws.amazon.com/blogs/compute/deploying-external-boot-volumes-with-aws-outposts/

Building on our previous announcement, AWS Outposts third-party storage integration for data volumes, AWS is expanding its collaboration with third-party storage solutions by introducing support for boot volumes backed by external storage arrays. In this post we show you how to boot Amazon Elastic Compute Cloud (Amazon EC2) instances on Outposts directly from NetApp on-premise enterprise array and Pure Storage FlashArray, providing greater flexibility to align your workload needs for storage.

With this enhancement, you can now:

  • Launch EC2 instances using boot volumes backed by compatible third-party storage arrays
  • Use existing storage management workflows and tools for both boot and data volumes
  • Take advantage of advanced features like storage efficiencies and cloning for cost reduction
  • Migrate compute of existing workloads that rely on external boot volumes to Outposts
  • Employ High Availability (HA) and Disaster Recover (DR) architectures with technologies such as NetApp’s SnapMirror or Pure Storage’s ActiveDR, enabling quick and easy recovery from failures and streamline DR processes.

The boot volume integration is enabled through AWS-provided launch Amazon Machine Images (AMIs) and sample automation scripts. Two methods are supported:

  • Storage Area Network boot (SANboot), which uses Pre-boot eXecution Environment (iPXE) and Internet Small Computer System Interface (iSCSI) to attach an external volume when booting.
  • Outposts localboot, which hydrates a local Non-Volatile Memory Express (NVMe) volume using iSCSI or NVMe-over-TCP, prior to booting.

The added third-party boot volume support further strengthens the commitment of AWS to providing flexible, enterprise-grade storage options for you while maintaining the automation tenants of the AWS experience.

SANboot solution overview

SANboot is a method of booting an EC2 instance from a block volume stored on a remote storage device. iPXE is an open source boot firmware that allows computers to boot from a network location, and when combined with iSCSI, it enables the start up of an operating system (OS) from a remote iSCSI target. In this case, the iSCSI target is a third-party storage system. The EC2 instance boots from the remote block volume as if it were a local disk. Read/write operations within the OS are written directly to the external storage array.

The instance can be shutdown and the data remains persistent on the third-party storage device. iPXE is stateless by design, thus subsequent boots must go through the full SANboot process. Snapshots of the volumes can be performed by the external storage device.

SANboot prerequisites

The following prerequisites are necessary for SANboot:

  1. An Outposts rack or Outposts 2U server. Outposts 1U server is not supported.
  2. An external storage system with IP reachability to the Outposts local network through a local gateway (LGW) or local network interface (LNI).
  3. An Amazon EC2 bootable image stored as a block volume on the external storage system.
    1. The block volume should be configured with an iSCSI IQN
    2. At the time of this post, only Windows 2022 (or newer) and Red Hat Linux 9 are supported operating systems
  4. (optional) Authentication credentials stored in AWS Secrets Manager if authentication is needed.
    1. If Secrets Manager is used, your EC2 instance profile needs the following minimum required permissions:
      {
          "Version": "2012-10-17",
          "Statement": [
              {
                   "Sid": "SecretsManagerPermissions",
                   "Effect": "Allow",
                   "Action": [
                        "secretsmanager:GetSecretValue"
                   ],
                   "Resource": "<secret name>"
              }
          ] 
      }

  5. (optional) Use Outposts SANboot script from AWS Samples downloaded onto your management computer. Your computer must be capable of running Python scripts and connected to both the external storage system and the AWS Region.

SANboot deployment overview

The following diagram shows the workflow when launching an EC2 instance using SANboot.

Figure 1 - SANboot workflow

Figure 1 – SANboot workflow

  1. The Outposts must have network connectivity to the external storage system through the Outposts local network connection. Specifically, the EC2 instances must communicate to the storage system. This should be a high speed connection with low latency (recommended 10Gbps or more, and under 10ms round trip). The Outposts and storage system do not have to be on the same subnet, instead they just need IP reachability.
    1. For Outposts racks, the EC2 instance connects through the LGW.
    2. For Outposts 2U servers, the EC2 instance connects through the LNI.
  2. The boot volume must be an Amazon EC2 bootable image. This includes the appropriate settings and drivers for the respective OS.
  3. Run the SANboot automation script and follow the prompts to enter the relevant parameters for your boot volume. This information is used to populate the Multipurpose Internet Mail Extension (MIME) multipart user data that iPXE uses for its initial configuration. See the following section on SANboot script walkthrough for more information.
  4. (optional) If iSCSI authentication is enabled, the SANboot automation script retrieves the credentials of the iSCSI target stored in Secrets Manager to be later populated to the iPXE script.
  5. The iPXE boot AMI launches its firmware image and executes the iPXE script. This script contains the necessary information to mount the remote iSCSI block volume. This includes the iSCSI intiator settings, the IP address of the iSCSI target, the credentials, the iSCSI port, and the iSCSI IQN. The iPXE boot AMI is a relatively small image that is pulled down from the Region. The time it takes to launch the iPXE image depends on the bandwidth of the Outposts service link connection to the Region.
  6. The iPXE firmware establishes the iSCSI connection to the target and boots the OS from the remote storage device over the local network. If applicable, then more user data information can be passed to the booting OS. The time it takes for the OS to boot depends on the speed of the local area network.

SANboot sample script walkthrough

The following diagram shows the workflow for executing the SANboot sample script.

These are the questions you step through as you run the SANboot automation script

Figure 2 – SANboot automation script walkthrough

Outposts localboot solution overview

Outposts localboot, using iSCSI or NVMe-over-TCP, is a method of booting an EC2 instance using a copy of a boot volume retrieved from a remote storage device. The original source image is not modified and remains unchanged. First, a localboot AMI is launched as a helper instance to facilitate the copying of the boot volume. The localboot instance acts as the iSCSI initiator or NVMe-over-TCP host, and mounts the remote boot volume from the third-party storage system. Then, the block volume is copied to local instance storage on the EC2 instance. The EC2 instance reboots using the local instance storage volume.

Localboot uses instance store volumes, which are ephemeral in nature. The boot volume is deleted when the EC2 instance that it is attached to is terminated or stopped. This is suitable for temporary guest desktop access or read-only workloads. Data volumes from external storage can also be mounted during the localboot process, which can be used to store data persistently.

Localboot prerequisites

The following prerequisites are necessary for localboot:

  1. An Outposts rack or Outposts 2U server.
  2. An external storage system with IP reachability to the Outposts local network through an LGW or LNI.
  3. An Amazon EC2 bootable image stored as a block volume on the external storage system.
    1. The block volume should be configured with an iSCSI IQN or NVMe-over-TCP NQN.
    2. At the time of this post, Red Hat Linux 9 is the only supported operating system.
  4. If using Outposts rack, instance types must have local NVMe drives to support instance store volumes. These include the C/M/R “d” type instances such as c5d, m5d, or r7d.
  5. Boot volumes on third-party storage systems must fit within the instance store of the instance type chosen. For example, an m5d.xlarge has one 150GB NVMe SSD for the instance store. The boot volume must be under 150GB to fit within an m5d.xlarge instance store. If the boot volume is larger, then a larger instance type must be chosen, such as an m5d.2xlarge (which has a 300GB NVMe SSD).
  6. (optional) Authentication credentials are stored in Secrets Manager if authentication is needed.
    1. If Secrets Manager is used, your EC2 instance profile needs the following minimum required permissions:
      {
          "Version": "2012-10-17",
          "Statement": [
              {
                   "Sid": "SecretsManagerPermissions",
                   "Effect": "Allow",
                   "Action": [
                        "secretsmanager:GetSecretValue"
                   ],
                   "Resource": "<secret name>"
              }
          ] 
      }

  7. (optional) Outposts localboot script from AWS Samples downloaded onto your management computer. Your computer must be capable of running Python scripts and connected to both the external storage system and the Region.

Localboot deployment overview

The following diagram shows the workflow when launching an EC2 instance using localboot.

Figure 3 - Localboot workflow

Figure 3 – Localboot workflow

Steps 1 and 2 are the same as SANboot deployment, see instructions above. Starting with step 3 for localboot:

  1. Run the localboot automation script and follow the prompts to enter the relevant parameters for your boot volume. This information is used to populate the MIME multipart user data that the localboot instance uses to mount the external boot volume. Go to the following localboot script walkthrough. The user data contains the necessary information to mount the remote iSCSI or NVMe-over-TCP block volume.
  2. (Optional) The localboot automation script retrieves the credentials of the external storage appliance stored in Secrets Manager.
  3. The localboot AMI is downloaded from the Region and launched. This can take a few minutes depending on the speed of the Outposts service link connection to the Region. When booting, the localboot AMI runs the user data script to attach the boot volume from the third-party storage system.
  4. The mounted boot volume is then copied to the local instance storage of the EC2 instance and configured as the boot partition. The time it takes to copy depends on the speed of your local network. When the copying is completed, the EC2 instance reboots using the newly configured boot partition.
  5. A copy of the boot volume is booted as a new EC2 instance. If applicable, then more user data information (such as mounting a data volume) can be passed to the booting OS.

Outposts localboot sample script walkthrough

The following diagram shows the workflow for running the localboot sample script.

These are the questions you step through as you run the localboot automation script

Figure 4 – Localboot automation script walkthrough

Conclusion

The introduction of third-party boot volume support allows you to continue getting value from your existing investments in external shared storage by connecting these arrays with Amazon EC2 on Outposts. Both the SANboot and localboot methods allow you to integrate your existing storage solutions with AWS Outposts, enabling them to boot EC2 instances directly from NetApp on-premise enterprise storage arrays and Pure Storage FlashArray volumes. This capability not only enhances storage options for EC2 instances running on Outposts but also streamlines workload migration and offers advanced features such as storage efficiencies for boot volumes. Automated configuration scripts and AWS-provided helper AMIs allow you to maintain the seamless and automated experience expected from AWS, while also giving you the flexibility to use your preferred enterprise storage solutions. Combined with the previously announced support for data volumes, this development further demonstrates the commitment of AWS to offering flexible solutions that can integrate into your existing hybrid environments.

To speak to an Outposts expert and learn more, submit this form.

To learn more about how NetApp and Pure Storage solutions work with Outposts, read the NetApp on-premises storage arrays for AWS Outposts blog post and the Pure Storage FlashArray for AWS Outposts blog post.

Infrastructure as code translation for serverless using AI code assistants

Post Syndicated from Debasis Rath original https://aws.amazon.com/blogs/compute/infrastructure-as-code-translation-for-serverless-using-ai-code-assistants/

Serverless applications commonly use infrastructure as code (IaC) frameworks to define and manage their cloud resources. Teams choose different IaC tools based on their skills, existing tooling, or compliance needs. As applications grow, the need to shift between IaC formats may arise to adopt new features or align with evolving standards. Developers are rapidly adopting AI-powered coding assistants to help with these evolving demands. In this post, we focus on Amazon Q Developer as an example, but the guidance applies broadly to any coding assistant. Amazon Q Developer is an AI-powered assistant that helps developers with code generation, problem-solving, and development tasks within the Amazon Web Services (AWS) ecosystem. Amazon Q Developer command line interface (CLI) allows developers to convert infrastructure definitions between popular IaC frameworks. This post demonstrates how to use Amazon Q CLI to translate a serverless project from a source IaC such as Serverless Framework version 3 to an IaC framework of choice such as the AWS Serverless Application Model (AWS SAM). To make demonstration more accessible, we have chosen a low-complexity project. However, Amazon Q CLI supports bidirectional translation across multiple IaC formats. We walk through how to migrate a reference architecture to show how the process works, as shown in the following figure.

Figure 1. Architecture diagram of example AWS solution to translate

Figure 1. Architecture diagram of example AWS solution to translate

This sample project orchestrates the deployment of a REST API using Amazon API Gateway, acting as an Amazon Simple Storage Service (Amazon S3) proxy for write operations. It includes API-Key setup, basic request validator, AWS Lambda invocation on Amazon S3 events, and enables Amazon CloudWatch Logs and AWS X-Ray tracing for API Gateway and Lambda using the Powertools for Lambda developer toolkit.

Solution overview

Amazon Q Developer is trained on AWS best practices and provides an AI-powered experience through its CLI. It automates IaC translation by reducing manual effort, minimizing errors, and preserving the original intent across frameworks. The translation process follows four steps: assess, translate, test and refine, and deploy. The following figure shows this workflow.

Figure 2. Logical flow for assessment, translation, testing, and deployment

Figure 2. Logical flow for assessment, translation, testing, and deployment

  1. Assess: Analyze existing Serverless Framework projects for compatibility and readiness.
  2. Translate: Convert Serverless Framework configuration into AWS SAM templates using Amazon Q Developer CLI.
  3. Test and refine: Validate and improve translated templates to make sure of functional accuracy and best practices.
  4. Deploy: Package and deploy the finalized AWS SAM templates to AWS environments.

Prerequisites and considerations

The following prerequisites and considerations are necessary to complete this solution.

Define custom rules to guide automation with Amazon Q Developer

Amazon Q Developer uses a rule-based model to automate tasks that is guided by user-defined rules. These rules encode your team’s standards to make sure that the automation is consistent and repeatable. You can create a library of custom rules to enforce best practices when using Amazon Q in your integrated development environment (IDE) or through the CLI. To help you get started, we’ve included a sample rules file that provides a baseline configuration. This file defines the structure of the output, sequence of the automation steps, and best practices to follow during each phase of the project. You can customize these rules to align with your organization’s architectural guidelines, security policies, or compliance needs.

Understand and categorize project complexity

Serverless projects differ in scale and structure, which directly impacts how you assess them. Smaller projects with minimal configuration and a few functions typically present fewer challenges. Larger, more complex projects can include dozens of Lambda functions, shared layers, and integrations across services such as Amazon Simple Queue Service (Amazon SQS), Amazon DynamoDB, or Amazon EventBridge. Start by categorizing the project as low, medium, or high complexity based on factors such as the number of functions, the diversity of event sources, and the presence of shared configurations. Use this categorization to prioritize and scope your assessment efforts. For complex workloads, assess individual components separately to reduce the surface area for troubleshooting and remediation.

Handle framework-specific tooling and plugins

Plugins or dependencies in different IaC frameworks extend core functionality or introduce custom behaviors. AWS SAM supports similar capabilities but in a different way. For example, you may be able to use AWS SAM, but for capabilities not found in AWS SAM, you can use AWS CloudFormation macros or Lambda-backed custom resources. During assessment, identify all active plugins and document their purpose and integration points. Evaluate whether each plugin’s functionality can be replicated using native AWS services or custom resources in AWS SAM. For common patterns—such as packaging optimizations, function warmers, or custom deploy hooks—consider using the CloudFormation macros and custom resources. When plugin functionality cannot be translated directly, annotate it in your assessment report for manual intervention. Clearly mapping each plugin’s role helps maintain parity and reduces surprises during deployment in the new environment.

With all of this you are ready to start the conversion.

Assess with Amazon Q Developer

The animated diagrams included in this post offer step-by-step visuals to explain the Amazon Q behavior throughout the workflow. Remember that you have already set rules for Amazon Q for each phase. Now your prompt to Amazon Q is clear. At this point Amazon Q has enough context to get you crisper and deterministic result. Use the following prompt to start the assessment:

Prompt

Evaluate the readiness of the Serverless Framework v3 project for 
translation to AWS SAM using the provided assessment rules.
Figure 3. Assessment step using Amazon Q Developer

Figure 3. Assessment step using Amazon Q Developer

After the assessment, Amazon Q Developer generates translation recommendations based on AWS best practices. It produces an evaluation_summary.md file with detailed insights, mapping guidance, and technical considerations for converting components to AWS SAM resources. The report serves as the foundation for the next step: automated translation into AWS SAM resources.

Translate using Amazon Q Developer

After completing the assessment, begin the translation using the baseline rules defined in .amazonq/rules/translation_rules.md. These rules guide the conversion and make sure of consistency with the assessment outputs. Amazon Q Developer CLI uses these rules to parse the serverless.yml file, scaffold a new project structure, and generate a complete AWS SAM template. During translation, Amazon Q Developer performs the following actions:

  • Converts each Lambda function into an AWS::Serverless::Function, preserving runtime, handler, memory, timeout, and environment settings.
  • Translates event sources such as HTTP APIs and Amazon SQS into SAM event definitions.
  • Maps AWS Identity and Access Management (IAM) policies and permissions into CloudFormation-compatible resources.
  • Removes development-only settings such as the serverless-offline plugin.

Serverless Framework v3 often uses CloudFormation orchestration and custom resources to deliver certain capabilities. For example, it may use custom resources to provision S3 bucket notifications. Amazon Q detects these patterns during assessment and translates them into explicit, well-structured AWS SAM resources. This makes sure of functional parity in the target IaC.Use the following prompt to begin the translation:

Prompt

Apply the translation rules to migrate this Serverless Framework 
v3 project into an AWS SAM project while maintaining all 
original infrastructure behavior.
Figure 4. Translation using Amazon Q Developer

Figure 4. Translation using Amazon Q Developer

After translation, Amazon Q Developer produces a complete AWS SAM project with test scripts and documentation. The project supports local testing, automated deployment, consistent resource management, and native integration with AWS tools. You also receive a development_summary.md file with a structured project overview and step-by-step testing instructions.

Amazon Q Developer replaces resources created implicitly by Serverless Framework plugins (such as Serverless Lift or custom resources for handling circular dependencies) with explicit CloudFormation definitions. To support custom or unsupported plugins, define the translation logic in .amazonq/rules/development_rules.md. Specify mappings or flag resources for manual review. This maximizes automation while highlighting exceptions early in the workflow.

Test and refine using Amazon Q Developer

Validate the translated AWS SAM application using the local testing rules defined in .amazonq/rules/local_testing_rules.md. These rules guide high-fidelity simulation and verification.

Amazon Q Developer generates test commands that use the AWS SAM CLI to replicate real-world behavior. It uses sam local invoke to test Lambda functions and sam local start-api to simulate HTTP API calls. This makes sure of the translated application behaves as expected when compared to the original Serverless Framework project.

To simulate Amazon S3 events, provision temporary S3 buckets, and instruct Amazon Q Developer to reference them during testing, it enables full end-to-end validation by combining real Amazon S3 interactions with a local function execution.Use the following prompt to begin testing:

Based on the local test rules, test the Lambda function in 
SAM project. Assume S3 bucket name is : <BUCKET_NAME>
Figure 5. Testing and refinement step using Amazon Q Developer

Figure 5. Testing and refinement step using Amazon Q Developer

Use AWS SAM Accelerate with sam sync to run cloud-based integration tests in a lower environment after completing local validation. This complements early testing and helps catch runtime issues before deployment. Combining Amazon Q Developer automation with AWS SAM CLI allows you to speed up feedback cycles and make sure of functional accuracy in the cloud environment.

Deploy

The translated and tested AWS SAM application is ready, thus the final step is deployment. Using AWS SAM CLI, package and deploy the application to an AWS environment where it becomes fully operational. Begin by running the following:sam build

This command prepares the application for deployment by packaging the Lambda function code, resolving dependencies, and creating build artifacts in the .aws-sam directory.Next, deploy the application using the following:

sam deploy --guided

The --guided flag walks you through the initial configuration, such as stack name, AWS Region, and necessary capabilities such as IAM role creation. When it’s complete, CloudFormation provisions all resources defined in the template.yaml, such as Lambda functions, API Gateway endpoints, SQS queues, and IAM policies. Here is how the output looks from the deployment:

Key                 ApiGKeyId
Description         API Gateway Key ID
Value               j5u41XXXXXX

Key                 S3BucketName
Description         Name of the S3 bucket
Value               bb245-sfp-XXXXXXXXXX

Key                 ApiRootUrl
Description         Root URL of the API Gateway
Value               https://XXXXXXXX.execute-api.us-east-1.amazonaws.com/dev/api/{order_object_path+}

Key                 ProcessS3DataFunction
Description         ProcessS3Data Lambda Function ARN
Value               arn:aws:lambda:us-east-1:0123456789012:function:q-generated-stack-ProcessS3DataFunction-
jvXXXXXXXMAT

AWS SAM emphasizes explicit definitions such as resource names and parameters. Therefore, using the AWS SAM guided deployment here helps by presenting change set reviews to verify these changes.Now that you’ve translated and tested your AWS SAM application, verify its parity with the original Serverless Framework stack. Compare CloudFormation outputs—API Gateway endpoints, S3 bucket names, Lambda Amazon Resource Names (ARNs), and queue URLs—and automate integration or A/B tests to confirm functional equivalence. Then, deploy the AWS SAM version using a canary release, monitor performance and user metrics, and shift traffic gradually to minimize risk.

Cleaning up

If you no longer need the AWS resources that you created by running this example, then you can remove them by deleting the CloudFormation stack that you deployed.

To delete the CloudFormation stack, use the sam delete command:

sam delete --stack-name apigw-s3-lambda-sam-stack

Conclusion

In this post you’ve learned how Amazon Q Developer CLI can streamline the translation of IaC by using an example of migrating Serverless Framework to AWS SAM. Using AI-powered conversational interfaces and deep integration with AWS knowledge means that Amazon Q Developer substantially reduces the manual effort and potential errors involved in these translations. Comprehensive assessment, translation, testing, and deployment can be difficult to accelerate, but this can be streamlined with new generative AI tools from AWS.

For more information on Amazon Q, you can check out Amazon Q Developer. For more serverless learning resources, visit Serverless Land. To find more patterns, go directly to the Serverless Patterns Collection.

Modernizing SOAP applications using Amazon API Gateway and AWS Lambda

Post Syndicated from Daniel Abib original https://aws.amazon.com/blogs/compute/modernizing-soap-applications-using-amazon-api-gateway-and-aws-lambda/

This post demonstrates how you can modernize legacy SOAP applications using Amazon API Gateway and AWS Lambda to create bidirectional proxy architectures that enable integration between SOAP and REST systems without disrupting existing business operations.

Many organizations today face the challenge of maintaining critical business systems that were built decades ago. These legacy applications power essential business operations despite relying on outdated technologies and integration patterns. Although complete system replacement would be ideal, practical constraints such as budget limitations, resource availability, technical complexity, and missing documentation often make modernization efforts challenging.

This post first shows proxy architecture patterns to expose a legacy SOAP server over a REST API. It then shows how to integrate a legacy SOAP client with applications using a REST API.

While SOAP and REST APIs share HTTP as their foundation, SOAP has some limitations compared to REST, like limited HTTP methods (GET/POST only) and mandatory XML formatting. REST is more flexible with multiple HTTP methods and diverse payload formats (plain text, binary, HTML, JSON, XML).

Using API Gateway and Lambda to proxy SOAP service

Consider a legacy solution that only supports SOAP. The following diagram shows the architecture for a SOAP proxy server using API Gateway and Lambda.

Figure 1: SOAP Server Proxy for modernized architecture

Figure 1: SOAP Server Proxy for modernized architecture

The proxy exposes the APIs hosted on the SOAP Server (on the right side of the image) over a REST interface. A SOAP service expects the HTTP Content-Type header set to text/xml, and a XML format payload that follows the WSDL specification defined by the server.

In the proposed architecture, the Lambda function is the core transformation engine, handling the bidirectional conversion between JSON and XML formats. Lambda functions can be developed in multiple programming languages such as Python, Node.js, Java, C#, Go, Ruby, and PowerShell, allowing you to use your existing development expertise. The serverless nature of Lambda provides automatic scaling to handle traffic spikes without needing infrastructure management or capacity planning.

API Gateway acts as the intelligent front door, managing all incoming requests and routing them appropriately. It provides enterprise-grade features such as request throttling to protect backend systems from overload, comprehensive authentication and authorization mechanisms, API key management for partner access control, request and response validation, caching capabilities for improved performance, and detailed monitoring and logging. These built-in features remove the need for custom middleware development and provide immediate operational benefits. API Gateway can receive multiple payload format such as XML, JSON, binary data, and plain text. This makes it suitable for diverse integration scenarios.

Using API Gateway and Lambda to support legacy SOAP clients

The previous section focused on exposing SOAP services over REST APIs. Organizations also face the reverse challenge where legacy SOAP client applications must access REST services. The architecture for supporting legacy SOAP clients follows a similar pattern but with reversed data flow. In this case, the legacy SOAP client sends XML-formatted requests to what it believes is a SOAP server. However, behind the scenes API Gateway and Lambda work together to translate these requests into REST API calls.

Figure 2: Legacy SOAP client modernization architecture

Figure 2: Legacy SOAP client modernization architecture

The legacy SOAP client application sends XML SOAP messages to API Gateway. The Lambda function receives these SOAP requests, extracts the relevant data from the XML envelope, and transforms it into JSON format for the modern REST service.

The Lambda function wraps the JSON response from the REST services into the SOAP XML format that the legacy client expects. It recreates the appropriate XML structure, SOAP headers, and ensures that the response conforms to the WSDL specification that the client application was designed to consume.

Example scenario

Let’s suppose our legacy client application needs to send a SOAP request to convert an integer number to its word form. The SOAP envelop to convert the number 1519 to its long form “one thousand, five hundred and nine” looks like this:

<?xml version="1.0" encoding="utf-8"?>
<soap:Envelope xmlns:soap="http://schemas.xmlsoap.org/soap/envelope/">
    <soap:Body> \
        <ConvertNumberToWordsSoapIn>
            <NumberToWordsRequest>1519</NumberToWordsRequest>
        </ConvertNumberToWordsSoapIn>
    </soap:Body>
</soap:Envelope>

The REST conversion service expects a JSON payload the as follownig:

jsonObject = {
	"data" : 1519
}

The following code block shows a sample Lambda function implementation for this. This function converts the SOAP XML envelop to JSON, changes the http header to application/json, and converts response from REST service to SOAP format.

var parseString = require('xml2js').parseString;
const axios = require('axios');

exports.handler = async (event, context) => {
    var valueNumber;
    
    try {
        console.log("Parsing XML string");

        // Parsing the XML to obtain data needed for conversion (number to words)
        parseString(event.body, function (err, result) {
            if (!err) {
                valueNumber = result['soap:Envelope']['soap:Body'][0]
                              ['ConvertNumberToWordsSoapIn'][0]
                              ['NumberToWordsRequest'][0];
            } else { 
                console.log (err);
                throw (err);
            }
        });
        console.log("Creating JSON for calling the service");
        // Creating JSON to call service
        var jsonObject = {
            "data" : valueNumber
        }
        
        console.log("Calling Microservice (NumberToWords)");
        const headers = { 
            'Content-Type': 'Application/json'
        };
        
        console.log ("Parameter for NumberToWords URL:" + 
                    JSON.stringify(process.env.NumberToWordMicroservice));

        // Calling numberToWords REST Server
        var resultNumberToWords = await 
            axios.post(process.env.NumberToWordMicroservice, jsonObject, { headers });
        
        // Creating the response
        console.log("Creating response XML");

        var resp =  create_response (JSON.stringify(resultNumberToWords.data.message));
        console.log("Response in XML: "+ resp);
        
        // Returning the value in XML using text/xml content type
        let response = {'statusCode': 200, headers: {"content-type": "text/xml"}, 
                        'body': JSON.stringify(resp)}
        return response;
        
    } catch (err) {
        console.log ("Error: " + err);
        let response = {'statusCode': 500, 
                        headers: {"content-type": "text/xml"}, 'body': err}
        return response;
    }
};

// Function to create a SOAP XML envelope with the result value
function create_response(numberInWords) {
  return '<?xml version="1.0" encoding="utf-8"?> \
            <soap:Envelope xmlns:soap="http://schemas.xmlsoap.org/soap/envelope/">\
            <soap:Body>\
              <m:ConvertNumberToWordsResponse xmlns:m="http://www.dataaccess.com/webservicesserver/"> \
                  <m:ConvertNumberToWordsResponseResult>' + numberInWords + '</m:ConvertNumberToWordsResponseResult> \
              </m:ConvertNumberToWordsResponse> \
            </soap:Body>\
            </soap:Envelope>';
}

With this approach, you can maintain your existing SOAP client applications without modification, allowing them to consume modern REST services. You can preserve investments in legacy client applications while gradually modernizing the overall system. This architecture is particularly valuable in scenarios where multiple legacy SOAP clients need to access the same modern REST services. This is because a single proxy can serve multiple client applications simultaneously. The serverless nature of the architecture makes sure that it scales automatically based on the number of client requests, providing cost-effective operation regardless of usage patterns.

Alternative approach using API Gateway transformation capabilities

The Lambda-based approach provides maximum flexibility and control. API Gateway also offers built-in transformation capabilities that can handle certain SOAP modernization scenarios without the need for compute resources.

The native API Gateway transformation uses Apache Velocity Template Language mapping templates. It converts the payload directly at the gateway, offering a streamlined solution for specific modernization scenarios.

The VTL approach works by defining mapping templates that handle the conversion process between different payload formats. When modernizing SOAP services, these templates can intercept REST requests with JSON payloads, restructure the data into XML format compatible with your legacy SOAP endpoints, and reverse the process for responses returning to the client.

Figure 3: API Gateway with velocity template language transformation

Figure 3: API Gateway with velocity template language transformation

This gateway-native transformation strategy offers several operational advantages. You benefit from streamlined architecture because the transformation logic resides entirely within the API Gateway service. There are no other infrastructure components to manage or monitor, and the solution avoids the complexity of coordinating between multiple AWS services. Cost efficiency is another key benefit, as there are no compute charges beyond the standard API Gateway pricing.

Consider the previous example of converting a number to its word format. The VTL transformation in API Gateway will look like this:

## Parse the SOAP envelope and extract the number value
#set(\$xmlDoc = \$input.path('\$'))
#set(\$numberToWords = \$xmlDoc.Envelope.Body.ConvertNumberToWordsSoapIn.NumberToWordsRequest)

## Convert to integer if it's a string
#if(\$numberToWords.toString().matches("^\d+\$"))
  #set(\$dataValue = \$numberToWords.toInteger())
#else
  #set(\$dataValue = \$numberToWords)
#end

{
  "data": \$dataValue
}

You should consider VTL transformations when your SOAP services have predictable, stable schemas with relatively direct XML structures. This approach works particularly well for legacy systems that rarely undergo changes and have clear request-response patterns. For more dynamic environments or complex transformation requirements, the Lambda-based solution provides superior flexibility and maintainability.

Security considerations

An important consideration when working with legacy SOAP services is understanding their authentication mechanisms. SOAP protocols often implement authentication through security standards, where authentication credentials and security tokens are embedded directly within the SOAP envelope headers. This includes username tokens, digital signatures, and encryption elements that are part of the XML structure.

When SOAP envelopes contain unencrypted authentication information in the headers, the proxy architecture typically functions without more modifications. This is because the Lambda function can pass through these authentication elements transparently to the backend SOAP service. However, due to the nature of SOAP authentication being tightly integrated with the XML envelope structure, certain scenarios may need custom handling within the Lambda function.

For example, if the SOAP service uses timestamp-based authentication tokens, session management, or needs specific security header modifications, the Lambda function may need customization to properly handle, validate, or refresh these authentication elements during the JSON-to-XML transformation process. Organizations should carefully analyze their SOAP service authentication requirements to determine if more Lambda logic is needed to maintain security compliance.

Moreover, make sure that any SOAP authentication credentials processed by the Lambda function are handled securely and never logged in plain text.

Conclusion

In this post, you learned how cloud-native services can bridge the gap between legacy systems and modern application architectures, allowing you to use your existing investments while adopting contemporary development practices and technologies.

Amazon API Gateway and AWS Lambda enable organizations to create REST services that proxy legacy SOAP servers, allowing modern applications to consume legacy services through JSON payloads while preserving existing SOAP infrastructure. This serverless solution provides cost-effectiveness, automatic scaling, and reduced operational overhead while facilitating company modernization through scalable APIs without abandoning legacy software investments.

This modernization strategy allows you to gradually transition from legacy SOAP services to modern REST APIs without disrupting existing business operations. As your modernization journey progresses, you can extend this pattern to support more SOAP services or implement more sophisticated transformation logic based on your specific business requirements.

For more serverless learning resources, visit Serverless Land.

How Scale to Win uses AWS WAF to block DDoS events

Post Syndicated from Ben "Fuzzy" Shonaldmann original https://aws.amazon.com/blogs/architecture/how-scale-to-win-uses-aws-waf-to-block-ddos-events/

This is a guest post coauthored by Ben “Fuzzy” Shonaldmann of Scale to Win.

Scale to Win was created for organizers by organizers. Born out of the 2020 election cycle, a group of friends and former colleagues came out of a whirlwind presidential primary season with frustrations and ideas to improve campaign technology. With extensive outreach experience on high-profile presidential campaigns such as Biden/Harris 2020, Bernie 2016 and 2020, Warren 2020, and Clinton 2016, we knew the power of organizing. We saw how conversations—neighbor to neighbor, friend to friend, volunteer to voter—could transform communities and drive movements. Yet, the tools available for voter contact programs regularly fell short of our needs. We built and launched our first product in April 2020, a peer-to-peer (P2P) texting tool. We’ve since added a dialer tool that allows organizations to easily call voters, and Scale to Win Text, an all-in-one texting tool for organizing and fundraising.

During the 2024 US presidential election campaign season, we were the target of distributed denial of service (DDoS) events. These events reached peaks of over 2 million requests per second from nearly ten thousand unique IPs. After a brief window of downtime at the start of these events, Scale to Win partnered with Amazon Web Services (AWS) to implement AWS WAF, AWS Shield Advanced, and Amazon CloudFront to mitigate these targeted DDoS events.

One key element of our defense was AWS WAF support for Completely Automated Public Turing test to tell Computers and Humans Apart (CAPTCHA) to automatically present a challenge to suspicious-looking clients. We used this to provide a per-IP rate limit for traffic we expected to see from legitimate clients behind a single IP. For IPs that exceed this rate limit, we present a CAPTCHA and provide a higher rate limit to the maximum amount of traffic we expect to come from a single IP, like a campaign office or college campus.

However, the AWS WAF out-of-the-box CAPTCHA had an important caveat—it doesn’t provide protection against an event using a token that is solved and distributed across a network of machines behind multiple IPs. To prevent this class of event, AWS WAF users need to identify CAPTCHA tokens that are being used from multiple IPs and automatically block this traffic.In this post, you’ll learn how Scale to Win configured our network topology to maximize DDoS protection capacity, configured AWS WAF to block DDoS events, segmented machine-to-machine and browser-to-machine traffic to target CAPTCHA interventions, and blocked token reuse across IP addresses.

Network Topology Overview

The Scale to Win application runs behind an Application Load Balancer (ALB) that serves as the single point of entry to our application servers. Before implementing AWS WAF, our DNS records resolved to the ALB as shown in the following diagram. The diagram shows a path from users to Elastic Load Balancing to an auto scaling group of Amazon Elastic Compute Cloud (Amazon EC2) instances.

Diagram of a VPC with public and private subnets, Elastic Load Balancing, and Amazon EC2 instances

The recommended pattern for using AWS WAF to protect against DDoS events is to instead route traffic through a CloudFront distribution as shown in the following diagram. The diagram shows a path from users to CloudFront with AWS WAF to Elastic Load Balancing to an auto scaling group of EC2 instances.

VPC architecture with AWS WAF, CloudFront, Load Balancing, and EC2 instances

Using this topology, we can take advantage of the following benefits:

  1. The capacity of CloudFront to handle network-layer events sending TCP traffic that aren’t valid HTTP requests is greater than ALB capacity. Network-level protections are strongest when applied by CloudFront before passing traffic to the ALB.
  2. The edge deployment of AWS WAF has higher quotas and capacity than Regional deployments. AWS scales AWS WAF capacity one-to-one with CloudFront capacity, so AWS WAF always has enough capacity to handle incoming traffic.
  3. When implementing a geographic based block strategy, such as blocking specific countries, CloudFront provides a geographic restriction feature. In event patterns we observed, over half of malicious traffic originated from countries that we blocked completely in CloudFront, resulting in cost savings on our AWS WAF deployment.

To prevent threat actors from bypassing our CloudFront distribution and AWS WAF, we implemented a security group that allows traffic only from CloudFront edge IP addresses using the managed prefix list to prevent direct connections to the ALB. We then configured the ALB to require a secret, pre-shared token in a request header, for example, our header x-stw-example-secret. We configured the CloudFront distribution to add that request header when forwarding traffic to the origin. This secret isn’t logged to Application Load Balancer logs but is logged to AWS CloudTrail when setting or updating the CloudFront or ALB configuration. It’s possible to rotate this secret on a schedule by generating a random password with AWS Secrets Manager with an AWS Lambda function to update the CloudFront origin configuration and ALB listener configuration, as shown in the following two screenshots. This shared secret between the CloudFront distribution and ALB means that an event can’t bypass the security group control by configuring its own CloudFront distribution with our ALB as an origin.

The following screenshot shows configuration of the Application Load Balancer, showing a priority-1 rule to route traffic to our target group only if the x-stw-example-secret is correct. A default rule returns a 403 if it’s not correct.

AWS Elastic Load Balancing configuration details, displaying the protocol, port, load balancer name, and SSL/TLS certificate for a listener.

The following screenshot shows CloudFront origin settings, showing a custom header configuration to add the shared secret to requests to the origin.

AWS CloudFront origin settings showing domain, protocol, SSL, and custom header options

Configuring AWS WAF rules

We use two approaches to identify and block malicious DDoS traffic, a heuristic approach and a hard limit approach.

For the heuristic approach, we observe event traffic in AWS WAF sample requests and AWS WAF logs, identify patterns in the event, and block those specific patterns. To use this tactic in your own AWS WAF configuration, first identify a characteristic that is common to all or most event traffic but rare in legitimate traffic, like a HTTP header or query parameter. Create a AWS WAF rule that blocks the traffic. Using the Count rule action is helpful to test your rule and find false-positive and false-negative rates by correlating requests that match the rule with IPs that are sending high volumes of traffic. You can query AWS WAF logs with Amazon Athena to find these correlations. When you’re satisfied with your false-positive and false-negative rates, set the rule action to Block to actively block the matched traffic.

A motivated threat actor will notice the event is being blocked and randomize these parameters to bypass your rules. For example, they might replay legitimate session parameters, so that request URIs, query parameters, and request bodies are identical to legitimate traffic. Ultimately, the heuristic approach is a useful tool, and a good reason to set up logging and Athena to quickly query your AWS WAF logs, but it’s a solution that requires active reconfiguration of your AWS WAF as event patterns change.

One specific heuristic that’s worth calling out is JA4 fingerprints and their predecessor, JA3 fingerprints. A JA4 fingerprint is a hash of several parameters presented by TLS clients in the client hello packet. JA4 fingerprints roughly correspond to the specific TLS client parameters of the request, so they’re usually stable for a specific type of client. For example, a specific version of Google Chrome on a particular operating system has a fingerprint, but a version on a different operating system would have a different fingerprint. This makes JA4 fingerprints a useful heuristic for blocking malicious traffic because the botnet sending the traffic is likely to have a small number of different fingerprints. However, there are two caveats with blocking requests based on JA4 fingerprints:

  1. Threat actors might have the same JA4 fingerprint as legitimate users. In our case, we saw malicious traffic with the same fingerprint as a common NodeJS API client and were unable to block that fingerprint without blocking legitimate API clients.
  2. A sophisticated threat actor can randomize some of the TLS connection parameters, such as the order of TLS extensions in the client hello packet, which is done by threat actors to avoid JA3 fingerprint blocking and some browsers to preserve user privacy. Although the newer JA4 specification reduces some randomization elements, the fundamental challenge remains—because end users maintain control over the client hello packet, this creates an ongoing challenge of adaptation and response.

For the hard limit approach, we take advantage of request parameters that the event can’t fake, such as the source IP of the request. Although the source IP of a packet can be forged, these requests are dropped because they don’t successfully complete the TCP or TLS handshake. You can create AWS WAF rules that limit how much traffic can be sent from a single source IP using rate-based rule statements, setting the limit above what a legitimate user would send but below what the event needs to be effective.

The simplest approach with rate-based rule statements would be to have a single limit in the AWS WAF policy, but this has challenges. First, we have APIs that receive high volumes of machine-to-machine traffic. For example, we place outbound phone calls using Twilio, and Twilio sends tens of thousands of webhooks to our API per second to relay delivery status, sometimes from a single Twilio IP. Also, our application is often used by campaign offices or student-led phone banks on college campuses that might have hundreds of users behind a single or handful of IPs, so we can’t assume that a single IP is being used by a single user to calculate our acceptable rates of traffic.

Segmenting human and machine traffic

To address these challenges, we structure our AWS WAF rules to segment human and machine traffic. We do this by request path: AWS WAF rules can match based on request path, so we have a set of rules for machine traffic based on the webhook URLs or API paths where we expect machine traffic. For all other paths, we assume the traffic originates from a user visiting the site from their browser.

For machine traffic, we can’t use a CAPTCHA. Our API clients and the Twilio webhook infrastructure can’t solve the CAPTCHA, so we validate traffic differently. For our API clients, we set per-IP rate limits to what we expect from a single API client and return a 429 HTTP status when traffic exceeds our limit. We implement automatic retries to handle the occasional 429 error when sending above the limit. For Twilio or other webhook callbacks, we use published IPs from the service provider to create an IP set in AWS WAF. Then, we block requests to our webhook URL that don’t originate from the IP set. Not all service providers use static IPs—for Twilio specifically, we worked with their team to implement their Static Proxy feature to proxy webhook requests from a stable list of IPs. It also makes sense to implement API key authentication, request signing, and certificate-based authentication when possible for your machine traffic. For requests that originate from the IP set, we apply an Allow action in our AWS WAF rule to allow expected machine traffic through, as shown in the following screenshot. These rules allow high-volume machine-to-machine traffic through our AWS WAF configuration before we apply AWS WAF rules to block high volume user-based traffic. The following screenshot shows an example rule allowing expected machine-to-machine traffic.

WAF rule configuration showing machine traffic allow rules with URI path and IP settings

For our browser-based human traffic, we use a tiered rate limit strategy. We implement two tiers of rate limit: a low-level rate limit that corresponds to the maximum rate we expect two to three users to send, and a high-level rate limit that corresponds to the maximum rate we expect from a single IP with hundreds of users sharing the IP. Our low-level rule uses a CAPTCHA rule action when requests exceed the limit. Our high-level rule applies a Block action when requests exceed the limit. We set the high-level rate limit rule priority lower than the low-level rule so it’s processed first, as shown in the following screenshot.

AWS WAF web ACL interface displaying rules for traffic allow, block, and CAPTCHA actions

When a few users are sharing an IP address, they’re unlikely to hit either limit and can use the application without interruption. If a large group of users share an IP address, they’ll need to solve a CAPTCHA. After they solve it, they’re still limited by the high-level rate limit rule, which will prevent a threat actor from solving the CAPTCHA and then sending unlimited traffic using the token issued by AWS WAF.

Handling CAPTCHA on the frontend

For server-rendered applications, AWS WAF handles CAPTCHA challenges automatically through the following process:

  1. When a request matches a CAPTCHA rule without a valid token, AWS WAF presents an AWS managed CAPTCHA challenge page.
  2. Upon successful CAPTCHA completion, AWS WAF issues a Set-Cookie header containing the CAPTCHA token.
  3. Subsequent requests with valid CAPTCHA tokens can pass through AWS WAF for the configured immunity period.

For single-page applications (SPAs) or applications making API requests to a AWS WAF protected backend, additional implementation steps are required:

  1. Configure your frontend to detect blocked requests (HTTP 405 status code indicates CAPTCHA requirement).
  2. Present the CAPTCHA challenge to the user when required.
  3. Resubmit the original request after successful CAPTCHA completion.

The following sample code demonstrates how to implement CAPTCHA handling in a React component using the AWS WAF CAPTCHA JavaScript API:

import { useState, useRef, useEffect, ReactElement } from "react";

declare global {
  class CaptchaError extends Error {
    constructor(message: string);
    kind: "internal_error" | "network_error" | "token_error" | "client_error";
    statusCode?: number;
  }
  interface Window {
    AwsWafCaptcha: {
      renderCaptcha: (
        targetDiv: HTMLElement,
        options: {
          apiKey: string;
          onSuccess: (token: string) => void;
          onError: (err: CaptchaError) => void;
        }
      ) => void;
    };
    AwsWafIntegration: {
      fetch: typeof fetch;
    },
    awsWafCookieDomainList: string[];
  }
}

type DataLoading = {
  state: "loading";
};

type DataError = {
  state: "error";
  message: string;
};

type DataLoaded = {
  state: "loaded";
  data: any;
};

type Data = DataLoading | DataError | DataLoaded;

function MyComponent(): ReactElement {
  const [data, setData] = useState<Data>({ state: "loading" });
  const captchaDiv = useRef<HTMLDivElement>(null);

  useEffect(() => {
    void (async () => {
      try {
        const response = await window.AwsWafIntegration.fetch('/your/api/url');

        if (response.status === 405) {
          // The user needs to solve a captcha. 
          window.AwsWafCaptcha.renderCaptcha(captchaDiv.current!, {
              apiKey: "...API key goes here...",
              onSuccess: async _wafToken => {
                const response = await window.AwsWafIntegration.fetch('/your/api/url');
    
                if (response.status !== 200) {
                  setData({ state: "error", message: "Unable to load data." });
                }
    
                const data = await response.json();
                setData({ state: "loaded", data });
              },
              onError: e => {
                console.error(e);
                setData({ state: "error", message: "Unable to load data." });
              }
              /* ...other configuration parameters as needed... */
          });
          

          return;
        }

        if (response.status !== 200) {
          throw new Error(`Unexpected response status: ${response.status}`);
        }

        const data = await response.json();
        setData({ state: "loaded", data });
      } catch (e) {
        console.error(e);
        setData({ state: "error", message: "Unable to load data." });
      }
    })();
  }, []);

  return (
    <div>
      <div ref={captchaDiv} />
      <div>
        {/* render the data */}
      </div>
    </div>
  );
}

Preventing CAPTCHA token reuse

Although AWS WAF provides built-in CAPTCHA functionality, additional security measures are necessary to prevent token reuse events. In these events, threat actors can solve a CAPTCHA one time and distribute the token across their botnet. AWS WAF Bot Control offers protection against this vulnerability by detecting and blocking CAPTCHA token reuse across multiple IPs, ASNs, or countries.

To implement this protection:

  1. Configure the AWSManagedRulesBotControlRuleSet managed rule group after your rate-limiting rules.
  2. Use the targeted protection level.
  3. Apply Count or Allow actions to specific rules that you don’t want to apply to your traffic instead of a Block or CAPTCHA action.
  4. Monitor and adjust rule actions based on observed traffic patterns.

Conclusion

In this post, you learned how we implemented comprehensive DDoS protection using AWS WAF by:

  • Implementing best practices for AWS WAF network topology using CloudFront
  • Segmenting human and machine traffic in our AWS WAF configuration
  • Using tiered rate limits and CAPTCHA to allow legitimate requests
  • Preventing CAPTCHA token reuse by using AWS WAF Bot Control

To learn more about fine-tuning and optimizing AWS WAF Bot Control, refer to Fine-tune and optimize AWS WAF Bot Control mitigation capability by Dmitriy Novikov in the AWS Security Blog.


About the authors

Orchestrating document processing with AWS AppSync Events and Amazon Bedrock

Post Syndicated from Mehdi Amrane original https://aws.amazon.com/blogs/compute/orchestrating-document-processing-with-aws-appsync-events-and-amazon-bedrock/

Many organizations implement intelligent document processing pipelines in order to extract meaningful insights from an increasing volume of unstructured content (such as insurance claims, loan applications and more). Traditionally, these pipelines require significant engineering efforts, as the implementation often involves using several machine learning (ML) models and orchestrating complex workflows.

As organizations integrate these pipelines to customer facing applications (such as web applications for customers to upload documents such as insurance claims, loan approval documents and more), they set goals to provide insights in real time to increase the end customer experience. These organizations also aim to run and scale these workloads with minimal operational overhead and optimizing on costs. In addition, these organizations require the implementation of common security practices such as identity and access management, to make sure that only authorized and authenticated users are allowed to perform specific actions or access specific resources.

In this post, we show you a solution to simplify the creation of an intelligent document processing pipeline, with a web application for customers to upload their files (documents and images) and derive insights from it (summarization, fields extraction and classification). The solution primarily use serverless technologies, it includes a web socket to receive insights in real time and offers several benefits, such as automatic scaling, built-in high availability, and a pay-per-use billing model to optimize on costs. The solution also includes an authentication layer and an authorization layer to manage identities and permissions.

Solution overview

In this post, we provide an operational overview of the solution, and then describe how to set it up with the following services:

The solution architecture is illustrated in the following diagram:

Step 1: The user authenticates to the web application (hosted in AWS Amplify).
Step 2: Amazon Cognito validates the authentication details. After this, the user is now logged in the web application.
Steps 3aand 3b:

  • Step 3a: The web application (AWS Amplify) subscribes to an AWS AppSync Events web socket.
  • Step 3b: The AWS AppSync Events web socket calls an AWS Lambda authorizer to confirm that the user is authorized to subscribe to the web socket.

Step 4: The user uploads a file (document or image) using the web application.
Step 5: The web application (hosted in AWS Amplify) calls Amazon Cognito (identity pool) to confirm that the user is authorized to upload a file.
Step 6: The file is uploaded in an Amazon S3 bucket.
Steps 7a and 7b: Upon reception of an Amazon S3 upload event (which notifies that the file was uploaded in the Amazon S3 bucket) in the default Amazon Event Bridge bus, an Amazon Event Bridge bus rule triggers the execution of an AWS Step Functions state machine to start the orchestration workflow.
Step 8 (Step to extract fields from a file and classify it):

  • Step 8a: The first AWS Lambda function starts a new Amazon Bedrock Automation job (this job extracts specific fields from the uploaded file and classify it)
  • Step 8b: Once the job is completed, the results are stored in an Amazon S3 bucket.
  • Step 8c and 8d: Upon reception of an Amazon S3 event (which notifies that the results were stored in the Amazon S3 bucket) in the default Amazon Event Bridge, an Amazon Event Bridge bus rule triggers the execution of an AWS Lambda function
  • Step 8e: An AWS Lambda function publishes the results to the web socket.

Steps 9a and 9b: The second AWS Lambda function submits a prompt to an Amazon Bedrock foundation model (Sonnet 3), to request a summarization in streaming of the uploaded file. The AWS Lambda function publishes the streaming data to the web socket.

After Step 8e and Step 9b, the user can now consult the summarization result and extraction insights of the uploaded file in the web application.

Pre-requisites

To follow along and set up this solution, you must have the following:

  • An AWS account
  • A device with access to your AWS account with the following:
    • Python 3.12 installed (including pip)
    • Node.js 20.12.0 installed
  • Enable Model Access to the Claude 3 Sonnet model in Amazon Bedrock


Note: Deploying this solution will incur costs. Review the pricing page of each AWS service used in this post for details on costs. The cost of running this solution will primarily depend on:

  • The number of documents (and the size of each document)
  • The number of active users

Setup Amazon Bedrock Data Automation

In this section, we setup an Amazon Bedrock Data Automation project and an Amazon Bedrock blueprint.

A project contains a list of blueprints, and each blueprint defines the fields to extract from different types of files (such as documents or images). In this post, we define a blueprint for a driving license.

Complete the following steps to create an Amazon Bedrock Data Automation project and a driving license blueprint:

  1. Clone the GitHub repository
    git clone https://github.com/aws-samples/sample-create-idp-with-appsyncevents-and-amazonbedrock.git

  2. Go to the sample-create-idp-with-appsyncevents-and-amazonbedrock folder
    cd sample-create-idp-with-appsyncevents-and-amazonbedrock

  3. Initialize the environment (make the shell script files, from the GitHub repository, ready to be used)
    chmod +x ./init-env.sh && source ./init-env.sh

  4. Run the script setup-bda-project.sh to create an Amazon Bedrock Data Automation project and a sample driving license blueprint:
    ./setup-bda-project.sh

Create the web socket and orchestration backend

In this section, we create the following resources:

  • A user directory for web authentication and authorization, created with an Amazon Cognito user pool. An Amazon Cognito identity pool is also created to validate that users are authorized to upload files via the web application.
  • A web socket using AWS AppSync Events. This allows our web application to receive real time updates for summarization and extraction results. An authorization layer is also created to protect the web socket from unauthorized users. This is implemented with a Lambda authorizer function to validate that incoming requests include valid authorization details.
  • A state machine using AWS Step Functions and AWS Lambda to orchestrate the summarization and extraction operations from the unstructured content
  • Amazon S3 buckets to store files for document processing, and code files for AWS Lambda functions

Complete the following steps to create the web socket and the orchestration backend of the solution, using AWS CloudFormation templates:

  1. Create Amazon S3 buckets used by the solution by running the following script. These buckets will store the files uploaded by users and code files of the AWS Lambda functions used in this solution.
    cd $CURRENT_DIR/s3; ./create-s3-buckets.sh

  2. Create the Amazon Cognito user pool and identity pool by running the create-cognito-userpool.sh script:
    cd $CURRENT_DIR/cognito; ./create-cognito-userpool.sh

  3. Create the AWS AppSync Events web socket by running the following script:
    cd $CURRENT_DIR/appsync/; ./create-appsync-api.sh

  4. Create the AWS Step Functions state machine (including AWS Lambda functions) by running the following scripts:
    cd $CURRENT_DIR/orchestration/; ./create-orchestration.sh

Configure the Amazon Cognito user pool

In this section, we create a user in our Amazon Cognito user pool. This user will log in to our web application.

Run the script create-cognito-testuser.sh to create the user (make sure to provide your email address):

cd $CURRENT_DIR/cognito; ./create-cognito-testuser.sh #your-email-address#

After you create the user, you should receive an email with a temporary password in this format: “Your username is #your-email-address# and temporary password is #temporary-password#.”

Keep note of these login details (email address and temporary password) to use later when testing the web application.

Create the web application

In this section, we build a web application using AWS Amplify and publish it to make it accessible through an endpoint URL.

Complete the following steps to create the web application:

  1. Run the script create-webapp.sh to create the web application with AWS Amplify:
    cd $CURRENT_DIR/amplify/; ./create-webapp.sh

  2. Run the script deploy.sh to deploy the web application
    cd $CURRENT_DIR/amplify/amplify-idp; ./deploy.sh

The web application is now available for testing and a URL should be displayed, as shown in the following screenshot. Take note of the URL to use in the following section.

Test the web application

In this section, we test the web application and upload a file to be processed:

  1. Open the URL of the AWS Amplify application in your web browser.
  2. Enter your login information (your email and the temporary password you received earlier while configuring the user pool in Amazon Cognito) and choose Sign in.
  3. When prompted, enter a new password and choose Change Password.
  4. You should now be able to see a web interface.
  5. Download the sample driving license at this location and upload it via the web application using either your camera or a file in your local device, as illustrated

Once the file is uploaded, you should start receiving responses in the web application. When all the operations are completed, you should see a result equivalent to what is shown in the following screenshot:

Note: If you are planning to use other driving license sample images with other formats, you may have to update the existing Bedrock Data Automation blueprint we created earlier or define a new blueprint in your Bedrock Data Automation project we created earlier for these new images to work. For more information, please review the Bedrock Data Automation documentation.

Clean up

To make sure that no additional cost is incurred, remove the resources provisioned in your account. Make sure you’re in the correct AWS account before deleting the following resources.

Important note: You should exercise caution when performing the preceding steps. Make sure you are deleting the resources in the correct AWS account.

You can either navigate to the AWS CloudFormation console to delete the CloudFormation stacks associated to the resources provisioned or use the cleanup helper script cleanup.sh available at the root of the sample-create-idp-with-appsyncevents-and-amazonbedrock folder:

./cleanup.sh #region#

Conclusion

In this post, we walked through a solution to create a document processing pipeline, with a web application using serverless services. Via the web application, we were able to upload a file and receive responses in real time for different types of operations (summarization, extraction of specific fields and classification). First, we created an Amazon Bedrock Data Automation project (with a driving license blueprint). Then we created a web socket along with an orchestration solution using a state machine (AWS Step Functions and AWS Lambda functions). We also configured a user pool to grant a user access to the web application. Finally, we created the frontend of the web application in AWS Amplify.

To dive deeper into this solution, a self-paced workshop is available in AWS Workshop Studio.

Perform per-project cost allocation in Amazon SageMaker Unified Studio

Post Syndicated from Enrique Salgado Hernández original https://aws.amazon.com/blogs/big-data/perform-per-project-cost-allocation-in-amazon-sagemaker-unified-studio/

Amazon SageMaker Unified Studio is a single data and AI development environment where you can find and access your data and act on it using AWS resources for SQL analytics, data processing, model development, and generative AI application development.

SageMaker Unified Studio is part of the next generation of Amazon SageMaker. SageMaker brings together AWS artificial intelligence and machine learning (AI/ML) and analytics capabilities and delivers an integrated experience for analytics and AI with unified access to data.

With SageMaker Unified Studio, you can create domains and projects, providing a single interface to build, deploy, execute, and monitor end-to-end workflows. This approach helps drive collaboration across teams and facilitates agile development.

SageMaker Unified Studio implements resource tagging when AWS resources are provisioned. You can use these tags to track and allocate costs for the various resources created as part of the domains and projects within SageMaker Unified Studio.

This post demonstrates how to perform cost allocation using these resource tags, so finance analysts and business analysts can implement and follow Financial Operations (FinOps) best practices to control and track cloud infrastructure costs.

Solution overview

The following diagram illustrates how tagging works within SageMaker domains.

High level diagram that illustrates SageMaker Unified Studio entities (domains, projects and environments) are organized and how tags are applied to each of them

Before reviewing the implementation details, let’s explore several key SageMaker concepts: domain, project, project profile, and environment blueprint. For more information, refer to the SageMaker Unified Studio Administrator Guide.

  • Domain – A domain is an organizing entity created by an administrator. Administrators assign users to domains to enable collaboration using similar tools, assets, and resources. A domain can represent a business organization or a business unit containing people who collaborate and share resources. After creating a domain, administrators share the URL with users to access the portal.
  • Projects – Projects exist within each domain. A project provides a boundary where users can collaborate on a business use case. Users can create and share data, computing, and other resources within projects.
  • Project profile – When you create a project, you must select a project profile. A project profile is a template that governs infrastructure for the project, simplifying project creation with preconfigured settings and resources ready for use.
  • Environment blueprints – Environment blueprints are reusable templates for creating environments. They define settings for resource deployment and provide information for provisioning. Each blueprint uses an AWS CloudFormation template to create resources in a repeatable and scalable manner.

For effective cost tracking and allocation, make sure your SageMaker resources have proper tags. You can configure these as cost allocation tags to group and filter across AWS Billing and Cost Management tools (such as AWS Cost Explorer and AWS Data Exports).

As of this writing, SageMaker domains support tagging at the blueprint, domain, project, and environment level. When you create projects or add resources within an existing project, the following tags are automatically added to resources through CloudFormation resource tags, configured for each blueprint stack:

  • AmazonDataZoneBlueprint – Type of blueprint corresponding to this blueprint’s CloudFormation template (for example, Tooling)
  • AmazonDataZoneDomain – Amazon DataZone domain associated with this CloudFormation template
  • AmazonDataZoneEnvironment – Amazon DataZone environment ID associated with this CloudFormation template
  • AmazonDataZoneProject – Amazon DataZone project associated with this CloudFormation template

To track costs in SageMaker Unified Studio, you will perform the following steps:

  1. Create a SageMaker domain and project.
  2. Configure cost and billing settings by enabling cost allocation tags.
  3. (Optional) Generate costs for your project.
  4. Track costs using Cost Explorer and Data Exports.

Prerequisites

This post requires the following configurations in your AWS account:

  • AWS IAM Identity Center enabled in your organization management account (preferred) or in the member account where you will use SageMaker Unified Studio. For instructions on enabling IAM Identity Center, refer to Enable IAM Identity Center.
  • Cost Explorer enabled in your organization management account (preferred) or in the member account where you will use SageMaker Unified Studio. For configuration steps, refer to Enabling Cost Explorer.

Either legacy AWS Cost and Usage Reports (AWS CUR) with Amazon Athena integration or Data Exports configured and integrated with Athena for queries. For setup instructions, refer to creating Data Exports.

Create a SageMaker Unified Studio domain and project

Complete the following steps to set up your domain and project:

  1. Create a SageMaker Unified Studio domain using the Quick setup option (recommended for new users) or manual setup.

After domain creation, you will be redirected to the domain overview page.

  1. Choose Open Unified Studio.
  2. On the SageMaker Unified Studio console, choose Create project.
  3. For Project profile, choose SQL analytics, then choose Continue.

SageMaker Unified Studio create project wokflow (configuration page)

  1. Choose Continue to keep the default blueprint parameters.
  2. Review the configuration summary, then choose Create project.

SageMaker Unified Studio create project wokflow (confirmation page)

After the project is created, you will be redirected to the project overview page. Record the project ID and domain ID.

Project details page showing various details such as project id, project name and project IAM role ARN

Cost and billing configuration

As mentioned earlier, to track costs in SageMaker Unified Studio, you must configure cost allocation tags. Refer to Organizing and tracking costs using AWS cost allocation tags for more information about this feature.

Complete the following steps:

  1. On the AWS Billing and Cost Management console, under Cost organization in the navigation pane, choose Cost allocation tags.
  2. Select the following tags and choose Activate:
    1. AmazonDataZoneDomain
    2. AmazonDataZoneProject
    3. AmazonDataZoneEnvironment
    4. AmazonDataZoneBlueprint

The AmazonDataZoneProject and AmazonDataZoneDomain tags correspond to the project and domain ID values you recorded earlier.

AWS cost allocation tags interface showing the AWS tags that are currently configured as cost allocation tags

Cost allocation tags configuration doesn’t apply retroactively. If you want to monitor costs associated with these tags in the AWS Billing and Cost Management tools before the activation date, you must request a cost allocation tag backfill. The backfill operation can take several hours to complete.

Generate costs for the project

This section explains how to generate costs associated with the underlying data backend (Amazon Redshift in this case) to examine them using AWS billing tools. You can skip this section if you’re tracking costs on an active project.

To generate costs, we use the table structure used in the Redshift Immersion Labs. Refer to Create Tables for more details.

To run queries in SageMaker Unified Studio, follow these steps:

  1. In your project, choose New and then Query.

Image that shows the query button within the SageMaker Unified Studio project overview page allowing users to open the query editor tool

  1. Use the Amazon Redshift Serverless compute configured for the project to generate the costs:
    1. Choose the Redshift (Lakehouse) connection.
    2. Choose the dev database.
    3. Choose the project schema.
    4. Choose Choose.

Image that shows the conection selector available in SageMaker Unified Studio. In this case Redshift LakeHouse connection is selected with dev database and project schema selected underneath

  1. Copy and execute the SQL statements provided in the following GitHub repo into the SageMaker Unified Studio query editor to create, load, and validate data on the tables.

View of the Query editor within the SageMaker Unified Studio portal. Image contains two SQL queries (create tables and COPY data operation)

After running these steps, you will have generated some Amazon Redshift costs that will be present for further analysis in AWS Billing and Cost Management tools. However, these tools (Cost Explorer and Data Exports) are refreshed least one time every 24 hours, so you might need to wait up to 24 hours before proceeding to the next section.

Tracking costs in AWS Billing and Cost Management tools

With the cost allocation tags enabled, you can use AWS Billing and Cost Management tools to analyze and track costs, including Cost Explorer and Data Exports. For more information about using these tools, refer to the AWS Billing and Cost Management User Guide.

Check costs in Cost Explorer

You can check your SageMaker Unified Studio costs using Cost Explorer. With this tool, you can view and analyze your costs and usage through an interface with pre-built filters and aggregation capabilities for various metrics. For more information, refer to the Analyzing your costs and usage with AWS Cost Explorer.

To access Cost Explorer, complete the following steps:

  1. On the AWS Management Console, choose your account name in the top right corner and choose Billing Dashboard, or search for “Cost Explorer” in the console search bar.
  2. On the Billing Dashboard, choose Cost Explorer in the navigation pane.
  3. For first-time users, choose Launch Cost Explorer to enable the service.

AWS can take up to 24 hours to prepare your cost data.

  1. To view overall costs per project, configure the following report parameters:
    1. For Date Range, enter your range.
    2. For Granularity, choose Monthly.
    3. For Dimension, choose Tag.
    4. For Tag, enter your tag (AmazonDataZoneProject).

Image that shows how to group by a particular dimension (tag) in cost explorer

The following screenshot shows a sample report.

AWS cost explorer report showing costs by SageMaker Unified Studio project

  1. To view different service costs for a specific project, update the following parameters:
    1. For Dimension, choose Service.Image that shows how to group by a particular dimension (service) in cost explorer
    2. For Tag¸ choose AmazonDataZoneProject and choose the value of the project you want to inspect (in this case, 4z9d694nbsnyqx).

Image that illustrates how to filter by a specific dimension (tag) and value in cost explorer

The results should look similar to the following screenshot.

AWS cost explorer report showing service costs for a particular SageMaker Unified Studio project

Check costs using Data Exports

With Data Exports, you can query your cost and usage in AWS with the maximum flexibility degree compared to other tools such as Cost Explorer. It provides a comprehensive set of measures and dimensions that you can include in the export to create a personalized report. This report is then delivered to Amazon Simple Storage Service (Amazon S3) so you can configure it with Athena, so it can be queried using SQL or business intelligence (BI) tools such as Amazon QuickSight.

This post assumes you have already configured a data export and you have it integrated with Athena (refer to Processing data exports for more information). For instructions on setting up CUR and Athena integration, refer to Creating reports.

Check costs by project

Use the following query to check costs by project:

SELECT product_servicecode,
    product_product_family,
    resource_tags[ 'user_amazon_data_zone_project' ] as user_amazon_data_zone_project,
    round(sum(line_item_unblended_cost), 2) costs,
    line_item_line_item_description 
FROM "data_exports"."data_exportdata"
where resource_tags [ 'user_amazon_data_zone_project' ] != ''
group by product_product_family,
    product_servicecode,
    resource_tags[ 'user_amazon_data_zone_project' ],
    line_item_line_item_description
order by round(sum(line_item_unblended_cost), 2) DESC;

Results will look similar to the following screenshot on the Athena console.

Athena SQL query results when querying cost and usage data from data exports

The preceding query shows your costs grouped by:

  • Project (using tags)
  • Service
  • Product family, which corresponds to the subtype for a given product usage charge (for example, ML Instance for SageMaker, or Managed Storage for Amazon Redshift)

Check costs for individual projects

To check costs for a specific SageMaker Unified Studio project (for example, the sample project 4z9d694nbsnyqx created during this walkthrough), you can use the following query:

SELECT product_servicecode,
    product_product_family,
    resource_tags[ 'user_amazon_data_zone_project' ] as user_amazon_data_zone_project,
    round(sum(line_item_unblended_cost), 2) costs,
    line_item_line_item_description 
FROM "data_exports"."data_exportdata"
where resource_tags [ 'user_amazon_data_zone_project' ] != ''
and resource_tags [ 'user_amazon_data_zone_project' ] = <provide the project id here>
group by product_product_family,
    product_servicecode,
    resource_tags[ 'user_amazon_data_zone_project' ],
    line_item_line_item_description
order by round(sum(line_item_unblended_cost), 2) DESC;

Monitor costs with Data Exports and QuickSight

If you enabled Athena to work with Data Exports, you can also configure QuickSight to query this data source. With QuickSight, you can create interactive dashboards to track SageMaker costs in SageMaker Unified Studio at scale.

Configure access and permissions

To create CUR dashboards in QuickSight, first complete the following steps:

  1. Subscribe to QuickSight and have an author user account. For instructions on subscribing to QuickSight, refer to Signing up for an Amazon QuickSight subscription.
  2. Enable access to Athena and your CUR S3 bucket in the Security & permissions section of the QuickSight administration console. You need QuickSight administrator permissions to access this console.

Image shows QuickSight administration console where administrators can edit the AWS services (Athena in this case) that QuickSight is allowed to access

  1. If you’re using AWS Lake Formation, make sure your QuickSight user is authorized to query the CUR database and table. For more information about granting access in Lake Formation, refer to Granting permissions on Data Catalog resources.

Create a QuickSight dataset

The next step is to create a dataset in QuickSight using a SQL query. For instructions on creating a dataset with SQL, refer to Using SQL to customize data. Use the following SQL expression:

SELECT product_servicecode,
    product_product_family,
    resource_tags[ 'user_amazon_data_zone_environment' ] as user_amazon_data_zone_environment,
    resource_tags[ 'user_amazon_data_zone_project' ] as user_amazon_data_zone_project,
    resource_tags[ 'user_amazon_data_zone_domain' ] as user_amazon_data_zone_domain,
    line_item_unblended_cost,
    line_item_usage_start_date,
    line_item_line_item_description
FROM "data_exports"."data_exportdata"
where resource_tags [ 'user_amazon_data_zone_environment' ] != '' or resource_tags [ 'user_amazon_data_zone_project' ] != ''

Image of QuickSight dataset preparation page. Shows a SQL query that is used to extract data from the data exports previously configured.

The preceding query includes only cost and usage data that’s tagged with either user_amazon_data_zone_environment or user_amazon_data_zone_project to focus on SageMaker associated costs. To include other AWS costs, you must modify these filters.

Create QuickSight dashboards

Using the authoring capabilities of QuickSight, you can create interactive dashboards where business stakeholders can explore and track costs associated with SageMaker Unified Studio projects. You can use these dashboards to review relevant cost metrics at a glance that are derived from the Data Exports dimensions and metrics included in your dataset, as shown in the following screenshot. For more information about adding visuals to analyses, refer to Adding visuals to Amazon QuickSight analyses.

Example of a QuickSight dashboard consuming data exports cost and usage data. Dashboard contains multiple visuals that illustrate SageMaker Unified Studio costs by project and service

The preceding example shows a dashboard built using QuickSight connected to a Data Exports dataset. The dashboard contains the following visuals:

  • KPI visual showing the current monthly costs for SageMaker Unified Studio along with the month over month (MoM) variation and history
  • Autonarrative visual analyzing SageMaker Unified Studio costs (highest) by month
  • Vertical stacked bar chart showing SageMaker Unified Studio costs by month (grouped by project)
  • Donut chart showing SageMaker Unified Studio cost by service
  • Heat map visual correlating costs by project ID and service

Using this approach (QuickSight and Data Exports), you can create highly customizable dashboards to explore and monitor your SageMaker Unified Studio costs. Furthermore, you can create automated reports using the QuickSight reporting feature to send these by email to the relevant stakeholders.

Clean up

Delete the resources you created as part of this post when you’re done with them to avoid monthly charges. This includes SageMaker resources, created Data Export reports and the QuickSight subscription (in case it was created to visualize costs).

  1. Delete SageMaker resources
    1. Log in to the SageMaker domain using an admin role.
    2. Delete the project you created.
    3. Delete the SageMaker domain.
  2. Delete Data Exports reports
    1. On the AWS Billing console, in the navigation pane, choose Cost & Usage Reports.
    2. Select the report you want to delete.
    3. Choose Delete.
    4. Confirm the deletion by choosing Delete report.

For more information about managing Data Exports, refer to Deleting exports.

  1. Unsubscribe from QuickSight
    1. On the QuickSight console, choose your profile name in the top right corner.
    2. Choose Manage QuickSight.
    3. Choose Account settings.
    4. At the bottom of the page, choose Delete your QuickSight account.
    5. Review the information about data deletion.
    6. Enter delete to confirm.
    7. Choose Delete.

IMPORTANT NOTE: Before unsubscribing, make sure you backed up any dashboards or analyses you want to keep. After deletion, you can’t recover your QuickSight assets. For more information about managing your QuickSight subscription, refer to Deleting your Amazon QuickSight subscription and closing the account.

Conclusion

Managing costs on a unified platform like SageMaker can seem challenging because it aggregates many tools and services with different cost models. In this post, we showed how to use AWS Billing and Cost Management tools to aggregate and categorize costs across the various services used within SageMaker. With this approach, you can monitor and track respective service costs, either in aggregate or focusing on a particular project.

Start taking control of your analytics and ML costs today. With AWS Billing and Cost Management tools with SageMaker, you can:

  • Track and monitor your service costs
  • Break down expenses by project or service
  • Implement efficient back charging mechanisms to the different business units or organizations using SageMaker within your organization

For further reading, refer to Analyzing your costs and usage with AWS Cost Explorer and Processing Data Exports (using Athena).


About the authors

Enrique Salgado Hernández is a Senior Specialist Solutions Architect at AWS with more than 10 years of experience working in the cloud. He specializes in designing and implementing large-scale analytics architectures across various industry sectors. He is passionate about working with customers to solve their problems by supporting them during their cloud journey.

Angel Conde Manjon is a Senior EMEA Data & AI PSA, based in Madrid. He previously worked on research related to data analytics and AI in diverse European research projects. In his current role, Angel helps partners develop businesses centered on data and AI.

How Stifel built a modern data platform using AWS Glue and an event-driven domain architecture

Post Syndicated from Amit Maindola original https://aws.amazon.com/blogs/big-data/how-stifel-built-a-modern-data-platform-using-aws-glue-and-an-event-driven-domain-architecture/

Stifel Financial Corp. is an American multinational independent investment bank and financial services company, founded in 1890 and headquartered in downtown St. Louis, Missouri. Stifel offers securities-related financial services in the United States and Europe through several wholly owned subsidiaries. Stifel provides both equity and fixed income research and is the largest provider of US equity research.

In this post, we show you how Stifel implemented a modern data platform using AWS services and open data standards, building an event-driven architecture for domain data products while centralizing the metadata to facilitate discovery and sharing of data products.

Stifel’s modern data platform use case

Stifel envisioned a data platform that delivers accurate, timely, and properly governed data, providing consistency throughout the organization whenever users access the information. This approach showed limitations as the data complexity increased, data volumes grew, and demand for quick, business-driven insights rose. These challenges are encountered by financial institutions worldwide, leading to a reassessment of traditional data management practices. Under the federated governance model, Stifel developed a modern data strategy based on the following objectives:

  • Managing ingestion and metadata
  • Creating source-aligned data products complying with Stifel business streams
  • Integrating source-aligned data products from other domains (Stifel business units)
  • Producing consumer-aligned data products for specific business purposes
  • Publishing data products to a centralized data catalog

Some of the Stifel challenges highlighted in the preceding list required building a data platform that can:

  • Boost agility by democratizing data, thus reducing time to market and enhancing the customer experience
  • Improve data quality and trust in the data
  • Standardize tools and eliminate the shadow information technology (IT) culture to increase scalability, reduce risk, and minimize operational inefficiencies

Following the federated governance model, Stifel has organized its domain structure to provide autonomy to various functional teams while preserving the core values of data mesh. The following diagram depicts a high-level architecture of the data mesh implementation at Stifel.

Each data domain has the flexibility to create data products that can be published to the centralized catalog, while maintaining the autonomy for teams to develop data products that are exclusively accessible to teams within the domain. These products aren’t available to others until they are deemed ready for broader enterprise use. Domains have the freedom to decide which data they want to share. They can either:

  • Make their data products visible to everyone through the central catalog
  • Keep their data products visible only within their own domain

By implementing an event-driven domain architecture, organizations can achieve significant business advantages while positioning themselves for future growth and innovation. Stifel data products refreshes were dependent on data assets with variable cadence. Event-driven architecture enables real-time or near real-time updates by allowing data products to automatically respond to changes in underlying data assets as they occur, rather than relying on fixed batch schedules that might miss critical updates or waste resources on unnecessary refreshes. The key is to carefully plan the implementation and make sure of alignment with business objectives while considering both technical and organizational factors. This architecture style particularly suits organizations that:

  • Need real-time processing capabilities
  • Have complex domain interactions
  • Require high scalability
  • Want to improve business agility
  • Need better system integration
  • Are pursuing digital transformation

The following are some of the key AWS Services that helped Stifel to build their modern data platform.

  • AWS Glue is a serverless data integration service that’s used for data processing to build data assets and data products in the domains. Data is also cataloged in AWS Glue Catalog, making it straightforward to discover and query with supported engines.
  • Amazon EventBridge provides a scalable and flexible serverless event bus that facilitates seamless communication between different domains and services. By using EventBridge, Stifel was able to implement a publish-subscribe model where domain events can be emitted, filtered, and routed to appropriate consumers based on configurable rules. EventBridge supports custom event buses for domain-specific events, enabling clear separation of concerns and improved manageability.
  • AWS Lake Formation helped in providing centralized security, governance, and catalog capabilities while preserving domain autonomy in data product creation and management. With Lake Formation, data domains were able to maintain their independent data products within a federated structure while enforcing consistent access controls, data quality standards, and metadata management across the organization.
  • Apache Hudi on Amazon Simple Storage Service (Amazon S3) offers an optimized way to store data assets and products and promotes interoperability across other services.

Stifel’s solution architecture

The following diagram illustrates the data mesh architecture that Stifel uses to build a domain-driven architecture. In this system, various domains create data products and share them with other domains through a central governance account that uses Lake Formation.

Let’s look at some of the key design components that are being used to enable and implement data mesh and event driven design

Data ingestion framework

The data ingestion framework consists of several processor modules that are built using several AWS services and metadata driven architecture. The following diagram shows the architecture of the raw data ingestion framework.

The framework gets raw data files from both internal Stifel systems and third-party data sources. These files are processed and stored in a raw data ingestion account on Amazon S3 in open table format Apache Hudi. This stored data is then shared with different parts of the organization, called data domains. Each domain can use this shared data to create their own data products.

As a file (in CSV, XML, JSON and custom formats) lands into the landing bucket, an Amazon S3 event notification is created and placed in an Amazon Simple Queue Service (Amazon SQS)queue. The Amazon SQS queue triggers an AWS Lambda function and saves the metadata (such as the name of the file, date and time the file was received, and the file size) to a file audit data store (Amazon Aurora PostgreSQL-Compatible Edition).

An EventBridge time scheduler invokes an AWS Step Functions workflow at pre-determined intervals. The Step Functions workflow orchestrates the batch ingestion from raw to staging layer.

  1. The Step Functions workflow orchestrates a set of Lambda functions to get the list of unprocessed raw files from the audit data store and create batches of raw files to process them in parallel. The Step Functions workflow then triggers parallel AWS Glue jobs that process each batch of raw files.
  2. Each raw file is validated for any data quality checks and the data is saved to staging tables in Hudi format. Any errors encountered are logged into an audit table and a notification is generated for support team. For all successfully processed raw files, the file status is updated to PROCESSED and logged into an audit table.
  3. After the Hudi table is updated, a data refresh event is sent to EventBridge and then passed to the Central Mesh Account. The Central Mesh Account forwards these events to the data domains to notify them that the raw tables are refreshed, allowing the data domains to use this data for creating their own data products.

Event driven data product refresh

The Stifel data lake is based on a data mesh architecture where several data producers share data across data domains. A mechanism is needed to alert consumers who depend on other data producers’ data products when those source data products are refreshed, so that the consumers can update their own data products accordingly. The following diagram describes the technical architecture of event-based data processing. The central governance account acts as the central event bus, which receives all data refresh events from all data producers. The central event bus forwards the events to consumer accounts. The consumer accounts filter the events consumers are interested in from data producers for their data processing needs.

Orchestration design

Stifel designed and implemented an event-based data pipeline orchestration system that triggers data pipelines when specific events occur. This system processes data immediately after receiving all required dependency events, enabling efficient workflow management.

The following diagram describes the logical architecture of the domain data pipeline orchestration framework.

The orchestration framework includes the components described in the following list. The data dependencies and data pipeline state management metadata are hosted in an Aurora PostgreSQL database.

  1. Data refresh processor: Receives data refresh events from central mesh and local data domain and evaluates if the domain data products data dependencies are met
  2. Data product dependency processor: Retrieves metadata for the product, kicks off a corresponding data domain AWS Glue job, and updates metadata with the job information
  3. Data pipeline state change processor: Monitors the domain data jobs and takes actions based on the job’s final status (SUCCEED or FAILED) and then creates incident tickets for failed jobs

Conclusion

Stifel has improved its data management and reduced data silos by adopting a data product approach. This strategy has positioned Stifel to become a data-driven, customer-centric organization. The company combines federated platform practices with AWS and open standards. As a result, Stifel is achieving its decentralization objectives through a scalable data platform. This platform empowers domain teams to make informed decisions, drive innovation, and maintain a competitive edge. Here are the some of the advantages Stifel got from an event-driven domain architecture (EDDA):

  • Business agility: Rapid market response, new business capability integration, scalable domains, quicker feature deployment, and flexible process modification
  • Customer experience: Real-time processing, responsive interactions, personalized services, consistent omnichannel presence, and enhanced service availability
  • Operational efficiency: Reduced system coupling, optimal resource use, scalable systems, lower maintenance overhead, and efficient data processing
  • Cost benefits: Lower development costs, reduced infrastructure expenses, decreased maintenance costs, efficient resource usage, and a better ROI on technology investments

In this post, we demonstrated how Stifel is building a modern data platform by recognizing the critical importance of data in today’s financial landscape. This strategic approach not only enhances operational efficiency but also positions Stifel at the forefront of technological innovation in the financial services industry. To learn more and get started, see the following resources:


About the authors

Amit Maindola is a Senior Data Architect focused on data engineering, analytics, and AI/ML at Amazon Web Services. He helps customers in their digital transformation journey and enables them to build highly scalable, robust, and secure cloud-based analytical solutions on AWS to gain timely insights and make critical business decisions.

Srinivas Kandi is a Senior Architect at Stifel focusing on delivering the next generation of cloud data platform on AWS. Prior to joining Stifel, Srini was a delivery specialist in cloud data analytics at AWS helping several customers in their transformational journey into AWS cloud. In his free time, Srini likes to explore cooking, travel and learn new trends and innovations in AI and cloud computing.

Hossein Johari is a seasoned data and analytics leader with over 25 years of experience architecting enterprise-scale platforms. As Lead and Senior Architect at Stifel Financial Corp. in St. Louis, Missouri, he spearheads initiatives in Data Platforms and Strategic Solutions, driving the design and implementation of innovative frameworks that support enterprise-wide analytics, strategic decision-making, and digital transformation. Known for aligning technical vision with business objectives, he works closely with cross-functional teams to deliver scalable, forward-looking solutions that advance organizational agility and performance.

Ahmad Rawashdeh is a Senior Architect at Stifel Financial. He supports Stifel and its clients in designing, implementing, and building scalable and reliable data architectures on Amazon Web Services (AWS), with a strong focus on data lake strategies, database services, and efficient data ingestion and transformation pipelines.

Lei Meng is a data architect at Stifel. His focus is working in designing and implementing scalable and secure data solutions on the AWS and helping Stifel’s cloud migration from on-premises systems.

How Skroutz handles real-time schema evolution in Amazon Redshift with Debezium

Post Syndicated from Konstantina Mavrodimitraki original https://aws.amazon.com/blogs/big-data/how-skroutz-handles-real-time-schema-evolution-in-amazon-redshift-with-debezium/

This guest post was co-authored with Kostas Diamantis from Skroutz.

At Skroutz, we are passionate about our product, and it is always our top priority. We are constantly working to improve and evolve it, supported by a large and talented team of software engineers. Our product’s continuous innovation and evolution lead to frequent updates, often necessitating changes and additions to the schemas of our operational databases.

When we decided to build our own data platform to meet our data needs, such as supporting reporting, business intelligence (BI), and decision-making, the main challenge—and also a strict requirement—was to make sure it wouldn’t block or delay our product development.

We chose Amazon Redshift to promote data democratization, empowering teams across the organization with seamless access to data, enabling faster insights and more informed decision-making. This choice supports a culture of transparency and collaboration, as data becomes readily available for analysis and innovation across all departments.

However, keeping up with schema changes from our operational databases, while updating the data warehouse without constantly coordinating with development teams, delaying releases, or risking data loss, became a new challenge for us.

In this post, we share how we handled real-time schema evolution in Amazon Redshift with Debezium.

Solution overview

Most of our data resides in our operational databases, such as MariaDB and MongoDB. Our approach involves using the change data capture (CDC) technique, which automatically handles the schema evolution of the data stores being captured. For this, we used Debezium along with a Kafka cluster. This solution enables schema changes to be propagated without disrupting the Kafka consumers.

However, handling schema evolution in Amazon Redshift became a bottleneck, prompting us to develop a strategy to address this challenge. It’s important to note that, in our case, changes in our operational databases primarily involve adding new columns rather than breaking changes like altering data types. Therefore, we have implemented a semi-manual process to resolve this issue, along with a mandatory alerting mechanism to notify us of any schema changes. This two-step process consists of handling schema evolution in real time and handling data updates in an asynchronous manual step. The following architectural diagram illustrates a hybrid deployment model, integrating both on-premises and cloud-based components.

End-to-end data migration workflow from on-premises databases to AWS cloud using CDC, messaging, and data warehouse services

The data flow begins with data from MariaDB and MongoDB, captured using Debezium for CDC in near real-time mode. The captured data is streamed to a Kafka cluster, where Kafka consumers (built on the Ruby Karafka framework) read and write them to the staging area, either in Amazon Redshift or Amazon Simple Storage Service (Amazon S3). From the staging area, DataLoaders promote the data to production tables in Amazon Redshift. At this stage, we apply the slowly changing dimension (SCD) concept to these tables, using Type 7 for most of them.

In data warehousing, an SCD is a dimension that stores data, and though it’s generally stable, it might change over time. Various methodologies address the complexities of SCD management. SCD Type 7 places both the surrogate key and the natural key into the fact table. This allows the user to select the appropriate dimension records based on:

  • The primary effective date on the fact record
  • The most recent or current information
  • Other dates associated with the fact record

Afterwards, analytical jobs are run to create reporting tables, enabling BI and reporting processes. The following diagram provides an example of the data modeling process from a staging table to a production table.

Database schema evolution: staging.shops to production.shops with added temporal and versioning columns

The architecture depicted in the diagram shows only our CDC pipeline, which fetches data from our operational databases and doesn’t include other pipelines, such as those for fetching data through APIs, scheduled batch processes, and many more. Also note that our convention is that dw_* columns are used to catch SCD metadata information and other metadata in general. In the following sections, we discuss the key components of the solution in more detail.

Real-time workflow

For the schema evolution part, we focus on the column dw_md_missing_data, which captures schema evolution changes in near real time that occur in the source databases. When a new change is produced to the Kafka cluster, the Kafka consumer is responsible for writing this change to the staging table in Amazon Redshift. For example, a message produced by Debezium to the Kafka cluster will have the following structure when a new shop entity is created:

{
  "before": null,
  "after": {
    "id": 1,
    "name": "shop1",
    "state": "hidden"
  },
  "source": {
    ...
    "ts_ms": "1704114000000",
    ...
  },
  "op": "c",
  ...
}

The Kafka consumer is responsible for preparing and executing the SQL INSERT statement:

INSERT INTO staging.shops (
  id,
  "name",
  state,
  dw_md_changed_at,
  dw_md_operation,
  dw_md_missing_data
)
VALUES
  (
    1,
    'shop1',
    'hidden',
    '2024-01-01 13:00:00',
    'create',
    NULL
  )
;

After that, let’s say a new column is added to the source table called new_column, with the value new_value.
The new message produced to the Kafka cluster will have the following format:

{
  "before": { ... },
  "after": {
    "id": 1,
    "name": "shop1",
    "state": "hidden",
    "new_column": "new_value"
  },
  "source": {
    ...
    "ts_ms": "1704121200000"
    ...
  },
  "op": "u"
  ...
}

Now the SQL INSERT statement executed by the Kafka consumer will be as follows:

INSERT INTO staging.shops (
  id,
  "name",
  state,
  dw_md_changed_at,
  dw_md_operation,
  dw_md_missing_data
)
VALUES
  (
    1,
    'shop1',
    'hidden',
    '2024-01-01 15:00:00',
    'update',
    JSON_PARSE('{"new_column": "new_value"}') /* <-- check this */
  )
;

The consumer performs an INSERT as it would for the known schema, and anything new is added to the dw_md_missing_data column as key-value JSON. After the data is promoted from the staging table to the production table, it will have the following structure.

Production.shops table displaying temporal data versioning with creation, update history, and current state indicators

At this point, the data flow continues running without any data loss or the need for communication with teams responsible for maintaining the schema in the operational databases. However, this data might not be easily accessible for the data consumers, analysts, or other personas. It’s worth noting that dw_md_missing_data is defined as a column of the SUPER data type, which was introduced in Amazon Redshift to store semistructured data or documents as values.

Monitoring mechanism

To track new columns added to a table, we have a scheduled process that runs weekly. This process checks for tables in Amazon Redshift with values in the dw_md_missing_data column and generates a list of tables requiring manual action to make this data available through a structured schema. A notification is then sent to the team.

Manual remediation steps

In the aforementioned example, the manual steps to make this column available would be:

  1. Add the new columns to both staging and production tables:
ALTER TABLE staging.shops ADD COLUMN new_column varchar(255);
ALTER TABLE production.shops ADD COLUMN new_column varchar(255);
  1. Update the Kafka consumer’s known schema. In this step, we just need to add the new column name to a simple array list. For example:
class ShopsConsumer < ApplicationConsumer
  SOURCE_COLUMNS = [
    'id',
    'name',
    'state',
    'new_column' # this one is the new column
  ]
 
  def consume
    # Ruby code for:
    #   1. data cleaning
    #   2. data transformation
    #   3. preparation of the SQL INSERT statement
 
    RedshiftClient.conn.exec <<~SQL
      /*
        generated SQL INSERT statement
      */
    SQL
  end
end
  1. Update the DataLoader’s SQL logic for the new column. A DataLoader is responsible for promoting the data from the staging area to the production table.
class DataLoader::ShopsTable < DataLoader::Base
  class << self
    def load
      RedshiftClient.conn.exec <<~SQL
        CREATE TABLE staging.shops_new (LIKE staging.shops);
      SQL
 
      RedshiftClient.conn.exec <<~SQL
        /*
          We move the data to a new table because in staging.shops
          the Kafka consumer will continue add new rows
        */
        ALTER TABLE staging.shops_new APPEND FROM staging.shops;
      SQL
 
      RedshiftClient.conn.exec <<~SQL
        BEGIN;
          /*
            SQL to handle
              * data deduplications etc
              * more transformations
              * all the necessary operations in order to apply the data modeling we need for this table
          */
 
          INSERT INTO production.shops (
            id,
            name,
            state,
            new_column, /* --> this one is the new column <-- */
            dw_start_date,
            dw_end_date,
            dw_current,
            dw_md_changed_at,
            dw_md_operation,
            dw_md_missing_data
          )
          SELECT
            id,
            name,
            state,
            new_column, /* --> this one is the new column <-- */
            /*
              here is the logic to apply the data modeling (type 1,2,3,4...7)
            */
          FROM
            staging.shops_new
          ;
 
          DROP TABLE staging.shops_new;
        END TRANSACTION;
      SQL
    end
  end
end
  1. Transfer the data that has been loaded in the meantime from the dw_md_missing_data SUPER column to the newly added column and then clean up. In this step, we just need to run a data migration like the following:
BEGIN;
 
  /*
    Transfer the data from the `dw_md_missing_data` to the corresponding column
  */
  UPDATE production.shops
  SET new_column = dw_md_missing_data.new_column::varchar(255)
  WHERE dw_md_missing_data.new_column IS NOT NULL;
 
  /*
    Clean up dw_md_missing_data column
  */
  UPDATE production.shops
  SET dw_md_missing_data = NULL
  WHERE dw_md_missing_data IS NOT NULL;
 
END TRANSACTION;

To perform the preceding operations, we make sure that no one else performs changes to the production.shops table because we want no new data to be added to the dw_md_missing_data column.

Conclusion

The solution discussed in this post enabled Skroutz to manage schema evolution in operational databases while seamlessly updating the data warehouse. This alleviated the need for constant development team coordination and removed risks of data loss during releases, ultimately fostering innovation rather than stifling it.

As the migration of Skroutz to the AWS Cloud approaches, discussions are underway on how the current architecture can be adapted to align more closely with AWS-centered principles. To that end, one of the changes being considered is Amazon Redshift streaming ingestion from Amazon Managed Streaming for Apache Kafka (Amazon MSK) or open source Kafka, which will make it possible for Skroutz to process large volumes of streaming data from multiple sources with low latency and high throughput to derive insights in seconds.

If you face similar challenges, discuss with an AWS representative and work backward from your use case to provide the most suitable solution.


About the authors

Konstantina Mavrodimitraki is a Senior Solutions Architect at Amazon Web Services, where she assists customers in designing scalable, robust, and secure systems in global markets. With deep expertise in data strategy, data warehousing, and big data systems, she helps organizations transform their data landscapes. A passionate technologist and people person, Konstantina loves exploring emerging technologies and supports the local tech communities. Additionally, she enjoys reading books and playing with her dog.

Kostas Diamantis is the Head of the Data Warehouse at Skroutz company. With a background in software engineering, he transitioned into data engineering, using his technical expertise to build scalable data solutions. Passionate about data-driven decision-making, he focuses on optimizing data pipelines, enhancing analytics capabilities, and driving business insights.

Introducing AWS Lambda native support for Avro and Protobuf formatted Apache Kafka events

Post Syndicated from Julian Wood original https://aws.amazon.com/blogs/compute/introducing-aws-lambda-native-support-for-avro-and-protobuf-formatted-apache-kafka-events/

AWS Lambda now provides native support for Apache Avro and Protocol Buffers (Protobuf) formatted events with Apache Kafka event source mapping (ESM) when using Provisioned Mode. The support allows you to validate your schema with popular schema registries. This allows you to use and filter the more efficient binary event formats and share data using schema in a centralized and consistent way. This blog post shows how you can use Lambda to process Avro and Protobuf formatted events from Kafka topics using schema registry integration.

This new capability works with both Amazon Managed Streaming for Apache Kafka (Amazon MSK), Confluent Cloud and self-managed Kafka clusters. To get started, update your existing Kafka ESM to Provisioned Mode and add schema registry configuration, or create a new ESM in Provisioned Mode with schema registry integration enabled.

Avro and Protobuf

Many organizations use Avro and Protobuf formats with Apache Kafka because these binary serialization formats offer advantages over JSON. They provide 50-80% smaller message sizes, faster serialization and deserialization performance, robust schema evolution capabilities, and strong typing across multiple programming languages.Working with these formats in Lambda functions previously necessitated custom code. Developers needed to implement schema registry clients, handle authentication and caching, write format-specific deserialization logic, and manage schema evolution scenarios.

What’s new

Lambda’s Kafka Event Source Mapping (ESM) now provides built-in integration with AWS Glue Schema Registry, Confluent Cloud Schema Registry, and self-managed Confluent Schema Registry. When you configure schema registry settings for your Kafka ESM, the service automatically validates incoming JSON Schema, Avro, and Protobuf records against their registered schema. This moves complex schema registry integration logic from your application layer to the managed Lambda service.

You can build your function with Kafka’s open-source ConsumerRecords interface using Powertools for AWS Lambda to get your Avro or Protobuf generated business objects directly. Optionally you can specify to get your records in the JSON format, where your function receives clean, validated JSON data regardless of the original serialization format, removing the need for custom deserialization code in your Lambda functions. This also allows you to create Kafka consumers across multiple programming languages.

Powertools for AWS Lambda is a developer toolkit that provides specific support for Java, .NET, Python, and TypeScript, maintaining consistency with existing Kafka development patterns. You can directly access business objects without custom deserialization code.

You can also setup filtering rules to discard irrelevant, JSON, Avro or Protobuf formatted events before function invocations, which can improve processing performance and reduce costs.

How schema validation works

When you configure schema registry integration for your Kafka ESM, you specify the registry endpoint, authentication details, and which event fields (key, value, or both) to validate. The ESM polls your Kafka topics for records as usual but now performs additional processing before invoking your Lambda function.For each incoming event, the ESM extracts the schema ID embedded in the serialized data. It fetches the corresponding schema from your configured registry. This process happens transparently, with schema definitions cached for up to 24 hours to optimize performance. The ESM identifies the format of your events using schema metadata and validates the event structure. It keeps either the original binary data or deserializes it to JSON format based on your customer configuration and sends it to your function for processing.


Figure 1: Kafka processing flow diagram.

The ESM handles schema evolution automatically. When producers begin using new schema versions, the service detects the updated schema IDs and fetches the latest definitions from your registry. This makes sure that your functions always receive properly deserialized data without requiring code changes.

Event record format

As a part of the ESM schema registry configuration, you need to specify Event Record Format, which Lambda uses to deliver validated records to your function. The schema registry configuration supports SOURCE and JSON.

SOURCE preserves the original binary format of the data as a base64-encoded string with producer-appended schema-id removed. This allows direct conversion to Avro or Protobuf objects so that you can use Kafka’s ConsumerRecords interface for a Kafka-like experience. Use this format when working with strongly typed languages or when you need to maintain the full capabilities of Avro or Protobuf schemas. Then, you can use any Avro or Protobuf deserializer to convert raw bytes to your business object. Powertools provides native support for this deserialization.

With JSON, the ESM deserializes the data ready for direct use in languages with native JSON support. Use this when you don’t need to preserve the original binary format or work with generated classes. You can also use Powertools to convert the base64 to your business object. See the documentation for payload formats and deserialization behavior.

If you configure filtering rules, then they operate on the JSON-formatted events after deserialization. This upstream filtering prevents unnecessary Lambda invocations for events that don’t match your processing criteria, directly reducing your compute costs.

Configuration and setup

To use this feature, you must enable Provisioned Mode for your Kafka ESM, which provides the dedicated compute resources needed for schema registry integration.

You can configure the integration through the AWS Management Console, AWS Command Line Interface (AWS CLI), AWS Language SDKs, or infrastructure as code (IaC) tools such as the AWS Serverless Application Model (AWS SAM) or AWS Cloud Development Kit (AWS CDK).

Your schema registry configuration includes the registry endpoint URL, authentication method (AWS Identity and Access Management (IAM) for AWS Glue Schema Registry, or Basic Auth, SASL/SCRAM, or mTLS for Confluent registries), and validation settings. You specify which event attributes to validate and optionally define filtering rules using standard Lambda event filtering syntax.

For error handling, configure Lambda failure destinations where events that fail schema validation or deserialization are sent. This makes sure that problematic events don’t disappear silently but are routed to other services such as Amazon Simple Queue Service (Amazon SQS), Amazon Simple Notification Service (Amazon SNS), and Amazon S3 for debugging and analysis.

Seeing the new features in action

There are a number of Serverless Patterns that you can use to process Kafka streams using Lambda. This example uses the Java pattern.

Deploy a sample Amazon MSK cluster

To set up an Amazon MSK cluster, follow the instructions in the GitHub repo and create a new AWS CloudFormation stack using the MSKAndKafkaClientEC2.yaml template file. The stack creates the Amazon MSK cluster, along with a client Amazon EC2 instance, to manage the Kafka cluster. There are costs involved when running this infrastructure.

  1. Connect to the EC2 instance using EC2 Instance Connect.
  2. Check that the Kafka topic is created by checking the contents of the kafka_topic_creator_output.txt file.
    cat kafka_topic_creator_output.txt

  3. The file should contain the text: “Created topic MskIamJavaLambdaTopic.”

Deploy the Glue schema registry and consumer Lambda function

The EC2 instance contains the software needed to deploy the schema registry and Lambda function.

  1. Change directory to the pattern directory.
    cd serverless-patterns/msk-lambda-iam-java-sam
  2. Build the application using AWS SAM.
    sam build
  3. To deploy your application for the first time, run the following in the EC2 instance shell:
    sam deploy --capabilities CAPABILITY_IAM --no-confirm-changeset \
    	--no-disable-rollback --region $AWS_REGION --stack-name msk-lambda-schema-avro-java-sam --guided

  4. You can accept all the defaults by hitting Enter. You can browse to the AWS Glue schema registry console and view the ContactSchema definition:
    {
      "type": "record",
      "name": "Contact",
      "fields": [
        {"name": "firstname", "type": "string"},
        {"name": "lastname", "type": "string"},
        {"name": "company", "type": "string"},
        {"name": "street", "type": "string"},
        {"name": "city", "type": "string"},
        {"name": "county", "type": "string"},
        {"name": "state", "type": "string"},
        {"name": "zip", "type": "string"},
        {"name": "homePhone", "type": "string"},
        {"name": "cellPhone", "type": "string"},
        {"name": "email", "type": "string"},
        {"name": "website", "type": "string"}
      ]
    }
    

    The consumer Lambda function ESM is configured for Provisioned Mode.

  5. View the ESM configuration from the Lambda console for the Lambda function name prefixed with msk-lambda-schema-avro-ja-LambdaMSKConsumer.
  6. Choose the MSK Lambda trigger which opens the Triggers pane under Configuration.
    Figure 2: View Lambda ESM schema configuration
  7. The configuration specifies using the Event record format SOURCE so your function can use Kafka’s native open-source ConsumerRecords interface. Powertools then deserializes the payload.
  8. The schema validation attribute is VALUE.
  9. The ESM filter configuration only processes the records that match zip codes of 2000.
  10. In your function code, specify the open-source Kafka ConsumersRecords interface by including Powertools for Lambda as a dependency. ConsumerRecords provides metadata about Kafka records and allows you to get direct access to your Avro/Protobuf generated business objects without requiring any additional deserialization code.
package com.amazonaws.services.lambda.samples.events.msk;

import com.amazonaws.services.lambda.runtime.Context;
import com.amazonaws.services.lambda.runtime.RequestHandler;
import org.apache.kafka.clients.consumer.ConsumerRecord;
import org.apache.kafka.clients.consumer.ConsumerRecords;
import org.slf4j.Logger;
import org.slf4j.LoggerFactory;
import software.amazon.lambda.powertools.kafka.Deserialization;
import software.amazon.lambda.powertools.kafka.DeserializationType;
import software.amazon.lambda.powertools.logging.Logging;

public class AvroKafkaHandler implements RequestHandler<ConsumerRecords<String, Contact>, String> {
    private static final Logger LOGGER = LoggerFactory.getLogger(AvroKafkaHandler.class);

    @Override
    @Logging(logEvent = true)
    @Deserialization(type = DeserializationType.KAFKA_AVRO)
    public String handleRequest(ConsumerRecords<String, Contact> records, Context context) {
        LOGGER.info("=== AvroKafkaHandler called ===");
        LOGGER.info("Event object: {}", records);
        LOGGER.info("Number of records: {}", records.count());
        
        for (ConsumerRecord<String, Contact> record : records) {
            LOGGER.info("Processing record - Topic: {}, Partition: {}, Offset: {}", 
                       record.topic(), record.partition(), record.offset());
            LOGGER.info("Record key: {}", record.key());
            LOGGER.info("Record value: {}", record.value());
            
            if (record.value() != null) {
                Contact contact = record.value();
                LOGGER.info("Contact details - firstName: {}, zip: {}", 
                           contact.getFirstname(), contact.getZip());
            }
        }
        
        LOGGER.info("=== AvroKafkaHandler completed ===");
        return "OK";
    }
}
Produce and consumer records

To send messages to Kafka, there is a LambdaMSKProducerJava function.

  1. Invoke the function from the Lambda console or CLI within the EC2 instance.
    sam remote invoke LambdaMSKProducerJavaFunction --region $AWS_REGION \
    	--stack-name msk-lambda-schema-avro-java-sam

  2. You can view the Producer logs to see the 10 records produced.The consumer Lambda function processes the records.
  3. View the consumer Lambda function logs using the Amazon CloudWatch logs console or CLI within the EC2 instance.
    sam logs --name LambdaMSKConsumerJavaFunction \
    	--stack-name msk-lambda-schema-avro-java-sam --region $AWS_REGION

The Lambda function processes and logs only the records that match the filter FILTER. The Avro binary data is deserialized using Powertools for AWS Lambda. You should see the function logs showing each record processed with the decoded keys and values.


Figure 3: Lambda consumer logs showing Avro processing

Cleaning up

You can clean up the example Lambda function by running the sam delete command.

sam delete

If you created the Amazon MSK cluster and EC2 client instance, then navigate to the CloudFormation console, choose the stack, and choose Delete.

Performance and cost considerations

Schema validation and deserialization can add processing time before your function invocation. However, this overhead is typically minimal when compared to the benefits. ESM caching minimizes schema registry API calls. Using filtering allows you to reduce costs, depending on how effectively your filtering rules eliminate irrelevant events. This feature simplifies the operational overhead of managing schema registry integration code so teams can focus on business logic rather than infrastructure concerns.

Error handling and monitoring

If schema registries become temporarily unavailable, then cached schemas allow event processing to continue until the registry is available again. Authentication failures generate error messages with automatic retry logic. Schema evolution happens seamlessly as Lambda automatically detects and fetches new versions.

If events fail validation or deserialization, they are routed to your configured failure destinations. For Amazon SQS and Amazon SNS destinations, the service sends metadata about the failure. For Amazon S3 destinations, both metadata and the original serialized payload are included for detailed analysis.

You can use standard Lambda monitoring, with more CloudWatch metrics providing visibility into schema validation success rates, registry API usage, and filtering effectiveness.

Conclusion

AWS Lambda now supports Avro and Protobuf formats for Kafka event processing in Provisioned Mode for Kafka ESM. This enables schema validation, event filtering, and integration with both Amazon MSK, Confluent, and self-managed Kafka clusters. Whether you’re building new Kafka applications or migrating existing consumers to Lambda, this native schema registry integration streamlines processing pipelines.

For more information about the Lambda Kafka integration capabilities, go to the learning guide, Lambda ESM documentation. To learn about Lambda pricing, such as Provisioned Mode costs, visit the Lambda pricing page.

For more serverless learning resources, visit Serverless Land.

Running and optimizing small language models on-premises and at the edge

Post Syndicated from Chris McEvilly original https://aws.amazon.com/blogs/compute/running-and-optimizing-small-language-models-on-premises-and-at-the-edge/

As you move your generative AI implementations from prototype to production, you may discover the need to run foundation models (FMs) on-premises or at the edge to address data residency, information security (InfoSec) policy, or low latency requirements. For example, customers in regulated industries, such as financial services, healthcare, and telecom, may want to leverage chatbots that support customer queries, optimize internal workflows for complex reporting, and automatically approve requests—while keeping their data in-country. Similarly, some organizations choose to deploy their own small language models (SLMs) to align with stringent internal InfoSec requirements. As another example, manufacturers may want to deploy SLMs right inside their factories to analyze production data and provide real-time equipment diagnostics. To address users’ data residency, latency, and InfoSec needs, this post provides guidance on deploying generative AI FMs into AWS Local Zones and AWS Outposts. The goal is to present a framework for running a range of SLMs that address local data processing requirements-based customer engagements.

Generative AI deployment options

The growth in generative AI deployments and experimentation has accelerated with two business deployment options. The first is the use of a large language model (LLM) to support enterprise needs. LLMs are incredibly flexible: one model can perform completely different tasks, such as answering questions, coding, summarizing documents, translating languages, and generating content. LLMs have the potential to disrupt content creation and the way people use search engines and virtual assistants. The second deployment model is the use of SLMs, addressing a specific use case. SLMs are compact transformer models that primarily use decoder-only or encoder-decoder architectures, with typically less than 20 billion parameters, though this definition is evolving as larger models become available. SLMs can achieve comparable or even superior performance when fine-tuned for specific domains or tasks, making them an excellent alternative for specialized applications.

In addition, SLMs offer faster inference times, lower resource requirements, and are suitable for deployment on a wider range of devices, making them particularly valuable for specialized applications and edge computing where space and power supply are limited. While SLMs are limited in scope and accuracy compared to LLMs, you can enhance their performance for specific tasks through Retrieval Augmented Generation (RAG) and fine-tuning. This combination produces an SLM capable of responding to queries relating to a specific domain with a comparable level of accuracy to an LLM, while reducing hallucinations. SLMs offer effective solutions that balance user needs with cost efficiency.

Architecture overview

The solution discussed in this blog post uses Llama.cpp, an optimized framework written in C/C++ to efficiently run a range of SLMs. Llama.cpp can run efficiently in a wide range of computing environments, enabling generative AI models to operate in Local Zones or on Outposts without the large Graphics Processing Unit (GPU) clusters typically associated with LLMs in their native frameworks. This framework expands your model choice and increases model performance when deploying SLMs to Local Zones and Outposts.

The architecture provides a template for deploying a range of SLMs supporting chatbot or generation use cases. The solution consists of a front-end application receiving user queries, formatting the prompts for presentation to the model, and delivering the resulting responses. To support a scalable solution, the application servers and Amazon EC2 G4dn GPU-enabled instances are front-ended with an Application Load Balancer (ALB).

For a deployment where the incoming prompts exceed the ability of SLMs to service the requests, a message queue can be deployed to the front end of the SLMs. As an example, you could deploy a RabbitMQ cluster to serve as your queue manager.


Figure 1: Architecture overview

Solution deployment

The following instructions show how to launch an SLM using Llama.cpp in Local Zones or on Outposts. Although the preceding architecture overview shows a complete solution with multiple components, this post focuses specifically on the steps necessary to deploy the SLM in an EC2 instance using Llama.cpp.

Prerequisites

For this solution, you need the following prerequisites:

  1. An AWS account that is either allowlisted for Local Zones or has a logical Outpost installed, configured, and running
  2. Access to G4dn instances in your account at the chosen location (check availability in AWS Service Quotas)
  3. A VPC created to host the environment
  4. Public and private subnets to support the environment in the VPC
  5. A security group that is associated with your EC2 instance
  6. AWS Identity and Access Management (IAM) role with AWS Systems Manager Session Manager permissions

1. Launch a GPU instance for your SLM

Sign in to the AWS Management Console, open the Amazon EC2 console, and launch a g4dn.12xlarge EC2 instance in your Local Zone or Outposts environment. Configure it with:

  1. Red Hat Enterprise Linux 9 (HVM), SSD Volume Type
  2. A private subnet associated with your Local Zone or Outposts rack
  3. 30 GiB gp2 root volume and an additional 300 GiB gp2 EBS volume
  4. The IAM role configured with permissions required for Systems Manager
  5. SSM Agent to connect to the instance (follow the instructions in Install SSM Agent on RHEL 8.x and 9.x in the Systems Manager User Guide)

For detailed EC2 launch instructions, see Launch an EC2 instance using the launch instance wizard in the console or Launch an instance on your Outposts rack.


Figure 2: SLM instance launched

2. Install NVIDIA drivers

  1. Connect to the SLM instance using Systems Manager. You can follow the instructions in Connect to your Amazon EC2 instance using Session Manager in the Amazon EC2 User Guide.
  2. Install kernel packages and tools.
    sudo su –
    
    dnf update -y
    
    subscription-manager repos --enable codeready-builder-for-rhel-9-x86_64-rpms
    
    dnf install -y https://dl.fedoraproject.org/pub/epel/epel-release-latest-9.noarch.rpm
    
    dnf install -y ccache cmake gcc-c++ git git-lfs htop python3-pip unzip wget
    
    dnf install -y dkms elfutils-libelf-devel kernel-devel kernel-modules-extra \
    libglvnd-devel vulkan-devel xorg-x11-server-Xorg
    
    systemctl enable --now dkms
    
    reboot
    

  3. Install Miniconda3 in the /opt/miniconda3 folder or install a compatible package manager to manage Python dependencies.
  4. Install the NVIDIA drivers.
    dnf config-manager --add-repo \
    http://developer.download.nvidia.com/compute/cuda/repos/rhel9/x86_64/cuda-rhel9.repo
    
    dnf module install -y nvidia-driver:latest-dkms
    
    dnf install -y cuda-toolkit
    
    echo 'export PATH=/usr/local/cuda/bin:$PATH' >> ~/.bashrc
    
    echo 'export LD_LIBRARY_PATH=/usr/local/cuda/lib64:$LD_LIBRARY_PATH' >> ~/.bashrc
    
    source ~/.bashrc

3. Download and install Llama.cpp

  1. Create and mount the filesystem of the Amazon EBS volume you created earlier in the /opt/slm folder. The instructions are available in Make an Amazon EBS volume available for use in the Amazon EBS User Guide.
  2. Run the following commands to download and install Llama.cpp.
    cd /opt/slm
    
    git clone -b b4942 \
    https://github.com/ggerganov/llama.cpp.git
    
    cd llama.cpp
    
    cmake -B build -DGGML_CUDA=ON
    
    cmake --build build --config Release -j$(nproc)
    
    conda install python=3.12
    
    pip install -r requirements.txt
    
    pip install nvitop

4. Download and convert the SLM model

To run the SLM efficiently with Llama.cpp, you need to convert the model format to GGUF (GPT-Generated Unified Format). This conversion optimizes the model for better performance and memory usage on edge deployments with limited resources. GGUF is specifically designed to work with Llama.cpp’s inference engine.The following instructions show how to download SmolLM2 1.7B and convert it to the GGUF format:

mkdir /opt/slm/models
cd /opt/slm/models

git lfs install
git clone https://huggingface.co/HuggingFaceTB/SmolLM2-1.7B-Instruct

cd /opt/slm/llama.cpp

python3 convert_hf_to_gguf.py --outtype f16 \
--outfile /opt/slm/llama.cpp/models/SmolLM2-1.7B-Instruct-f16.gguf \
/opt/slm/models/SmolLM2-1.7B-Instruct/

echo 'export PATH=/opt/slm/llama.cpp/build/bin:$PATH' >> ~/.bashrc

echo 'export LD_LIBRARY_PATH=/opt/slm/llama.cpp/build/bin:$LD_LIBRARY_PATH' \
>> ~/.bashrc

source ~/.bashrc

You can also download other publicly available models from Hugging Face as needed, following the same conversion process.

SLM operation and optimization

The deployment of SLMs through Llama.cpp provides operational flexibility through a significant range of environment customization options, allowing you to tailor model behavior to your specific use cases. With Llama.cpp, you can select a range of parameters that can be used to optimize the use of system resources and model operation. This enables models to efficiently use the available resources without consuming unneeded resources or negatively impacting their operation. The following parameters are commonly supported when running Llama.cpp to provide control over how the model runs.

  • -ngl N, --n-gpu-layers N: When compiled with GPU support, this option allows you to offload some layers to the GPU for computation. This generally results in increased performance.
  • -t N, --threads N: Sets the number of threads to use during generation. For optimal performance, it is recommended to set this value to the number of physical CPU cores that your system has.
  • -n N, --n-predict N: Sets the number of tokens to predict when generating text. Adjusting this value can influence the length of the generated text.
  • -sm, --split-mode: Specifies how to split the model across multiple GPUs when running in a multi-GPU environment. Consider testing the ‘row’ splitting mode as it may provide better performance in some scenarios compared to the default layer-based splitting.
  • --temp N: Temperature is a parameter that provides control over an SLM’s randomness in terms of its outputs. Changing the value from the default of 0.8 changes the distribution of the model’s predictions. Lower values sharpen and deterministically enhance the model’s output, preferring high-probability phrases. On the other hand, a higher temperature fosters more inventiveness and unpredictability, allowing for a wider range of diverse responses. (default: 0.8).
  • -s SEED, --seed SEED: Provides a method to control the randomness of the SLM’s response. Setting a specific seed value produces consistent responses across multiple runs, while using the default value (-1) generates varied responses. (default: -1, -1 = random seed).
  • -c, --ctx-size N: Context size is defined as the number of tokens an FM can process as one prompt (in tokens) into the model. This value reserves memory in the host for the maximum size context length. Reducing the context size can reduce the amount of RAM needed to load and run a model. Models with larger context sizes (>50k) consume more RAM, and in some models, a larger context size can impact accuracy. For example, with Phi-3, it’s recommended to reduce the context size to 8k or 16k. The command to achieve this is –ctx-size XXXX, where XXXX is the context size.

This section demonstrates how to optimize SLM performance for specific use cases using Llama.cpp. We’ll cover two common scenarios: chatbot interactions and text summarization.

Chatbot Use Case Example

Token Size Requirements

For chatbot applications, typical token size requirements include input sizes ranging from 50-150 tokens, which support user questions up to a couple of sentences, and output sizes of approximately 100-300 tokens, allowing the model to provide detailed but concise responses.

Sample Command

./build/bin/llama-cli -m ./models/SmolLM2-1.7B-Instruct-f16.gguf \
-ngl 99 -n 512 --ctx-size 8192 -sm row --temp 0 --single-turn \
-sys "You are a helpful assistant" -p "Hello"

Figure 3: Chatbot example

Command Explanation

  • -m ./models/SmolLM2-1.7B-Instruct-f16.gguf: Specifies the model file to use
  • -ngl 99: Allocates GPU layers for optimal performance
  • -n 512: Sets maximum output tokens to 512, sufficient for the 100-300 tokens typically needed
  • --ctx-size 8192: Defines context window size, allowing for complex conversation history
  • -sm row: Splits the rows across GPUs
  • --temp 0: Sets the temperature to zero to be less creative
  • --single-turn: Optimizes for single-response interactions
  • -sys "You are a helpful assistant": Sets the system prompt to define assistant behavior
  • -p "Hello": Provides the user input prompt

Text summarization example

This command line shows SmolLM2-1.7B running to support a summarization activity.

PROMPT_TEXT="Summarize the following text: Amazon DynamoDB is a serverless, 
NoSQL database service that allows you to develop modern applications 
at any scale. As a serverless database, you only pay for what you use 
and DynamoDB scales to zero, has no cold starts, no version upgrades, 
no maintenance windows, no patching, and no downtime maintenance. 
DynamoDB offers a broad set of security controls and compliance 
standards. For globally distributed applications, DynamoDB global 
tables is a multi-Region, multi-active database with a 99.999% 
availability SLA and increased resilience. DynamoDB reliability is 
supported with managed backups, point-in-time recovery, and more. 
With DynamoDB streams, you can build serverless event-driven applications."

./build/bin/llama-cli -m ./models/SmolLM2-1.7B-Instruct-f16.gguf \
-ngl 99 -n 512 --ctx-size 8192 -sm row --single-turn \
-sys "You are a technical writer" \
--prompt "$PROMPT_TEXT"

Figure 4: Summarization example

Cleaning up

To avoid ongoing charges, take these steps to delete the resources you created by following this post, if they are no longer needed.

  • Terminate your EC2 instance to avoid unnecessary charges. Furthermore, verify that the 300 GiB EBS volume you attached is properly deleted by checking the Volumes section under Elastic Block Store and manually delete any remaining volumes by choosing them and choosing Actions > Delete volume.

Conclusion

This post took you through the steps of deploying SLMs into AWS on-premises or edge environments to address local data processing needs. The post first discussed business benefits of SLMs, including faster inference time, reduced operational costs, and improved model outcomes. SLMs launched using Llama.cpp and optimized for specific use cases can effectively deliver user services from the edge in a scalable manner. The optimization parameters described in this post provide multiple ways to configure these models for different deployment use cases. You can follow the deployment steps and techniques in this blog post to implement generative AI capabilities that align with your specific data residency, latency, or InfoSec compliance needs while operating efficiently within the resource constraints of edge environments. Visit the following pages to learn more about AWS Local Zones and AWS Outposts.

Networking of Amazon MQ for RabbitMQ event source mapping for AWS Lambda

Post Syndicated from Rafal Pawlaszek original https://aws.amazon.com/blogs/compute/networking-of-amazon-mq-for-rabbitmq-event-source-mapping-for-aws-lambda/

Event-driven architectures with message brokers need careful attention to security best practices. Amazon MQ for RabbitMQ combined with AWS Lambda enables serverless event processing. However, implementing defense in depth and least privilege principles necessitates a clear understanding of networking requirements. This is particularly important when working with different subnet types and their impact on service connectivity.

This post explores the networking aspects of Lambda event source mapping for Amazon MQ for RabbitMQ. Learn how deployment options influence your networking setup and security posture to make informed architectural decisions. These networking concepts are essential for building secure, scalable solutions, regardless of your experience level with message brokers.

For clarity in this post, when we refer to “RabbitMQ”, we mean Amazon MQ for RabbitMQ.

Prerequisites

The following prerequisites are necessary to complete this post:

  • An Amazon Web Services (AWS) account
  • Basic understanding of AWS networking concepts
  • Familiarity with Amazon MQ for RabbitMQ
  • Basic knowledge of Lambda

Furthermore, to enable setup of the discussed architectures, this post is accompanied by a GitHub repository that uses AWS Cloud Development Kit (AWS CDK).

Repository prerequisites

The following prerequisites are necessary for the repository:

Repository setup

Clone the https://github.com/aws-samples/sample-amazonmq-rabbitmq-lambda-esm repository. This repository contains all the necessary code and instructions to create relevant architectures using AWS CDK.

Install dependencies and build

Install the necessary NPM dependencies by running the following commands:

npm install
npm run build

Amazon MQ for RabbitMQ networking deployment options

Public accessibility is the primary networking differentiator when deploying a RabbitMQ broker in AWS. Although the broker operates in the Amazon MQ service account, the networking configuration varies based on this choice.

Public broker

When you deploy a publicly accessible broker, Amazon MQ provisions all networking components in the service account. The service provides a DNS name that resolves to an IP address of the Network Load Balancer (NLB) in that account. This configuration doesn’t support security groups. All security measures must be implemented through the RabbitMQ broker’s authentication and authorization mechanisms. The following diagram shows this communication flow.

Figure-1 DNS resolution of a public Amazon MQ for RabbitMQ broker.

Private broker

A private broker routes networking through a Amazon Virtual Private Cloud (Amazon VPC) in your account. Amazon MQ uses AWS PrivateLink to provision VPC Endpoints, which serve as entry points for broker communication.

The following diagram shows how client applications communicate with RabbitMQ:

  1. The client application connects to Amazon Route 53 Resolver
  2. Route 53 Resolver resolves the DNS name to the VPC Endpoint’s IP address
  3. The client communicates with the broker through PrivateLink
  4. Security groups protect the VPC Endpoint’s Elastic Network Interfaces (ENIs)

Figure-2 DNS resolution of a private Amazon MQ for RabbitMQ broker.

A private broker deployment offers two networking options:

  • Custom VPC configuration – Specify:
    • Subnets for VPC Endpoint creation
    • At least one security group to protect the VPC Endpoints
  • Default VPC configuration – Leave VPC options blank to use:
    • Default VPC
    • Default security group

Amazon MQ for RabbitMQ Lambda event source mapping building blocks

RabbitMQ solutions offer two approaches for message processing:

  • Create a custom client to read messages from broker queues
  • Use Lambda functions with event source mapping (ESM) for automated message retrieval

The ESM is a Lambda service resource that reads the messages from the broker and invokes the Lambda function synchronously. In the remainder of this post, we refer to this Lambda function as listener.

ESM connectivity depends on the following:

For public brokers, ESM uses public connectivity. For private brokers, ESM:

  • Assumes the listener’s IAM Role
  • Creates ENIs in the same subnets as the broker’s VPC Endpoints
  • Uses the same security groups that protect the VPC Endpoints

The listener’s IAM Role must include these Amazon Elastic Compute Cloud (Amazon EC2) permissions:

  • CreateNetworkInterface
  • DeleteNetworkInterface
  • DescribeNetworkInterfaces
  • DescribeSecurityGroups
  • DescribeSubnets
  • DescribeVpcs

To view ESM ENIs:

  1. Open the AWS Management Console
  2. Navigate to EC2 > Network Interfaces
  3. Look for ENIs with the following naming pattern:
    AWS Lambda VPC ENI-armq-<ACCOUNT_ID>-<ESM_ID>-<remainder>

    where:

    • ACCOUNT_ID – The AWS account number containing the ESM
    • ESM_ID – The unique identifier of the ESM

The following image shows example ESM ENIs.

Figure-3 An example list of interfaces that Amazon MQ for RabbitMQ creates for private brokers.

Disabling or deleting the ESM removes the ESM components.

An enabled ESM needs connectivity to the following:

Because the ESM queue polling process follows these steps:

  1. Assumes the listener’s IAM Role
  2. Retrieves RabbitMQ credentials from Secrets Manager
  3. Establishes broker communication
  4. Invokes the listener when messages are present

You have two options to enable private broker connectivity to support the queue polling process:

  1. Deploy VPC endpoints in ESM subnets for:
    • AWS Security Token Service (AWS STS)
    • Secrets Manager
    • Lambda
  2. Deploy NAT gateway in ESM subnets

ESM networking configuration options

The following sections detail ESM networking configurations for different deployment scenarios.

Option 1: Public broker

In this approach all network communication happens on the Amazon MQ service’s side. The ESM, when enabled, uses public connectivity.

To observe the architecture implemented in your account go to the cloned repository root location, make sure that you are signed in with AWS CLI and run the following:

cdk deploy PublicRabbitMqInstanceStack

Option 2: Private broker in a default VPC

Deploying a private RabbitMQ broker without specifying the VPC informs the Amazon MQ service to pick the default VPC for setting up the networking and then the public subnet(s) in that VPC. The default security group is used for securing the broker’s VPC Endpoints.

Creating the ESM provisions dedicated ENIs in the public subnets where the RabbitMQ broker’s VPC Endpoints reside with the default security group applied. The default security group allows itself for inbound traffic on all protocols and full port range, thus the ESM can route traffic through the VPC Endpoint.

Although the subnet is public with internet gateway access, the ESM ENIs operate in private address space, preventing direct communication with AWS services. To enable proper communication, create VPC Endpoints for AWS STS, Secrets Manager, and Lambda. These endpoints allow the ESM to communicate with AWS services through private IP addresses within your VPC. The following diagram shows the complete communication path from the ESM to the broker.

Figure-4 Networking configuration and request flow for a private broker provisioned in the default VPC.

To observe the architecture implemented in your account, go to the cloned repository root location, make sure that you are signed in with AWS CLI, and run the following

cdk deploy PrivateRabbitMqInstanceDefaultVpcStack

Option 3: Private broker in a Custom VPC with NAT

When deploying a private RabbitMQ broker in a custom VPC, specify either a single subnet for a standalone broker or multiple subnets for a cluster deployment. The deployment also needs a security group for the VPC Endpoint ENIs.

Configure the security group with a self-referencing inbound rule on the AMQP port. This configuration enables communication between the ESM and the RabbitMQ VPC Endpoints’ ENIs.

The following diagram shows how ESM resources communicate through networking components when deployed in a private subnet with NAT gateway. This architecture demonstrates the complete communication path from the ESM to the broker.

Figure-5 Networking configuration and request flow for a private broker provisioned in a private VPC subnet with NAT.

To observe the architecture implemented in your account, go to the cloned repository root location, make sure that you are signed in with AWS CLI, and run the following:

cdk deploy PrivateRabbitMqInstanceCustomVpcWithNatStack

Option 4: Private broker in a Custom VPC with isolated subnets

This configuration builds upon the previous architecture but introduces isolated subnets. These subnets restrict all internet connectivity, permitting only internal VPC network traffic. Although the broker networking components mirror Option 3, the isolation introduces more considerations.

The security group still needs an open AMQP port for queue operations, but the subnet isolation prevents the ESM from directly accessing AWS services. To address this limitation, deploy VPC Endpoints for AWS STS, Secrets Manager, and Lambda within the isolated subnets. These endpoints create a private communication path for the ESM to interact with essential AWS services without needing internet access.

The following diagram shows the communication architecture for ESM resources deployed in isolated subnets. It demonstrates how VPC Endpoints enable secure communication between the ESM and AWS services while maintaining network isolation. This architecture makes sure that the ESM can fulfill its message processing responsibilities without compromising security through internet exposure.

Figure-6 Networking configuration and request flow for a private broker provisioned in an isolated VPC subnet.

To observe the architecture implemented in your account, go to the cloned repository root location, make sure that you are signed in with AWS CLI, and run the following:

cdk deploy PrivateRabbitMqInstanceCustomVpcIsolatedSubnetStack

Option 5: Private broker in a Custom VPC with public subnets

The final configuration places the broker in public subnets while maintaining the core deployment requirements from the previous options. Despite the public subnet placement, the ESM’s networking behavior presents an important consideration: ESM ENIs operate in private address space, preventing direct internet communication even with an internet gateway present.

This architecture necessitates VPC Endpoints for AWS service communication, similar to Option 2. Any attempts to route ESM traffic through the internet gateway fail because the ENIs operate in private address space. Understanding this limitation is crucial for proper deployment planning.

The following diagram shows the ESM communication architecture in public subnets. Despite the different subnet type, this configuration mirrors the isolated subnet approach in its use of VPC Endpoints. These endpoints enable the ESM to communicate with AWS STS, Secrets Manager, and Lambda services through private, secure connections within the VPC.

Figure-7 Networking configuration and request flow for a private broker provisioned in a public VPC subnet.

To observe the architecture implemented in your account, go to the cloned repository root location, make sure that you are signed in with AWS CLI, and run the following:

cdk deploy PrivateRabbitMqInstanceCustomVpcPublicSubnetStack

Cleaning up

To prevent unexpected AWS charges, remove resources you’ve created. The following AWS CDK command helps you safely remove all deployed resources:

cdk destroy --all

Conclusion

This post explored the relationship between AWS Lambda event source mapping and RabbitMQ networking configurations. We examined various deployment scenarios, from public brokers to isolated subnets, each presenting unique considerations for secure and effective implementation.

Understanding these networking patterns enables you to make informed architectural decisions when deploying Amazon MQ for RabbitMQ with Lambda event source mapping. Whether choosing public accessibility or implementing private networking with VPC Endpoints, understanding the consequences of choosing specific networking configurations allows you to apply security best practices while meeting your application’s messaging needs. As you implement these patterns, consider your specific security requirements and operational needs to choose the most appropriate configuration for your use case.

Take the next step in optimizing your serverless messaging architecture. Dive in to the AWS documentation, experiment with the RabbitMQ and Lambda integration patterns discussed, and discover how these networking configurations can elevate the security and performance of your own applications. Start implementing these strategies today to build more robust, scalable solutions.

Empower AI agents with user context using Amazon Cognito

Post Syndicated from Abrom Douglas original https://aws.amazon.com/blogs/security/empower-ai-agents-with-user-context-using-amazon-cognito/

Amazon Cognito is a managed customer identity and access management (CIAM) service that enables seamless user sign-up and sign-in for web and mobile applications. Through user pools, Amazon Cognito provides a user directory with strong authentication features, including passkeys, federation to external identity providers (IdPs), and OAuth 2.0 flows for secure machine-to-machine (M2M) authorization.

Amazon Cognito issues standard JSON Web Tokens (JWTs) and supports the customization of identity and access tokens for user authentication by using the pre token generation Lambda trigger. Learn more about this in How to customize access tokens in Amazon Cognito user pools. Amazon Cognito has extended token customization capabilities to support access token customization for M2M and the ability to pass metadata from the client during M2M authorization. Application builders can use these two features to support multiple use cases, including customizing access tokens based on unique runtime policies, entitlements, environment, or passed metadata. This can simplify and enrich M2M authentication and authorization scenarios and opens up new possibilities for emerging use cases, such as identity and access management for AI agents.

This post demonstrates how Amazon Cognito enables AI agents to perform authorized actions on behalf of users through user-contextualized access tokens for OAuth 2.0-enabled resource servers. AI agents represent a class of autonomous services that require robust identity management and precise access control, especially when acting on behalf of users. By using the Amazon Cognito client credentials flow with access token customization, you can establish distinct identities for AI agents that carry critical information about their capabilities, scope of access, and intended use cases. This approach provides a foundation for more secure, auditable AI agent operations while maintaining clear boundaries around their authorized activities.

The identity of an AI agent can be represented within Amazon Cognito as an app client. The AI agent obtains an access token (JSON Web Token (JWT)) through an OAuth 2.0 client credentials grant. This JWT can be customized to contain claims that represent the authenticated human user whom the AI agent is acting on behalf of. This token can then be used to authorize access to other services that has established trust with the Amazon Cognito user pool by trusting the issuer and audience of the token. For example, this third-party service could be a claims processor, a travel agency service, or a scheduling service acting on behalf of a user. The focus of this post is on foundational building blocks using Amazon Cognito for AI agents and how to obtain a customized access token with user context.

Solution overview and reference architecture

Looking at an example architecture (Figure 1), a user signs in to a web or mobile application using an Amazon Cognito user pool, and tokens for the user are returned to the client. Here, the application could be a serverless digital assistant using an Amazon Bedrock agent that needs to gather and process data residing in a third-party cross-domain service. The AI agent obtains its own access token by performing an OAuth 2.0 client credentials grant while passing the user’s access token as context using the aws_client_metadata request parameter. The AI agent receives the user contextualized access token and calls an external, third-party, or cross-domain service that trusts the issuer and audience of the AI agent’s access token issued from an Amazon Cognito user pool. The cross-domain service can obtain the JSON Web Key Set (JWKS) to verify the token and extract claims presenting both the AI agent and most importantly, the underlying user. Authorization takes place within the cross-domain service using the claims of the customized access token and for fine-grain authorization, Amazon Verified Permissions is used. See Figure 1 for a detailed flow of this example.

Figure 1: AI agent identity reference architecture

Figure 1: AI agent identity reference architecture

  1. The user navigates to the application through the client.
  2. There is no existing session or token for the user, so the user authentication flow with the Amazon Cognito user pool begins.
  3. After a successful sign-in, Amazon Cognito returns access, ID, and refresh tokens to the client for the user.
  4. As the user interacts with AI agent through the application, the client sends the user’s access token to an Amazon API Gateway endpoint.
  5. The API gateway integrates with the AI agent, which is using an Amazon Bedrock agent. As an example, this can use several AWS Lambda functions interacting with an Amazon Bedrock Knowledge Base or a Retrieval-Augmented Generation (RAG) process.
  6. The AI agent obtains its own access token from an Amazon Cognito user pool using an OAuth 2.0 client credentials grant. The user’s access token, obtained in step 1, is sent with the token request in the aws_client_metadata request parameter.

Note: You can use different Amazon Cognito user pools for user authentication and for agent (machine) authentication. This promotes separation and provides the ability to apply different settings and controls on each user pool if needed to meet security requirements.

  1. Amazon Cognito validates the client ID and secret from the AI agent and invokes the pre token generation Lambda trigger to customize the access token for the AI agent.

Note: Within the pre token generation Lambda trigger, the user’s access token is verified before returning a customized access token to the AI agent using the aws-jwt-verify library.

  1. The customized access token is returned to the AI agent, including custom claims representing the user.
  2. The AI agent, using its own access token, calls the cross-domain service to perform the requested action on behalf of the user. For example, this can be a third-party reservation system or a photo sharing service.
  3. The resource server in the cross-domain service verifies that the access token from the AI agent is valid. The resource server must be pre-configured to trust the user pool that issued the agent access token.
  4. Coarse- and fine-grained authorization can happen either locally in the service code or using Verified Permissions.
  5. A response from the cross-domain service flows back to the AI agent, if necessary.
  6. A response from the AI agent to the user application or client is returned, if necessary.
  7. Actions that take place throughout the flow are logged in AWS CloudTrail, providing end-to-end logging and auditing.

Implementation details

Let’s take a deeper look into the three core components of this scenario:

  1. The AI agent obtaining its own OAuth 2.0 access token
  2. The Amazon Cognito pre token generation Lambda trigger used to enrich the AI agent’s access token with user context
  3. The cross-domain resource server performing fine-grained authorization

AI agent

Figure 2: AI agent obtaining a user access token from the frontend application through API Gateway

Figure 2: AI agent obtaining a user access token from the frontend application through API Gateway


Amazon Bedrock Agents is used in this solution with a
custom orchestration configured to use Lambda. When the application interacts with the Amazon Bedrock agent, the custom orchestrator initiation begins with the agent passing the user’s access token to a Lambda function as part of the custom orchestration (shown in Figure 2). The Lambda function validates the user’s token to verify that it’s not expired and hasn’t been tampered with. This custom orchestrator begins the process for the agent to obtain its own OAuth access token and to access downstream and cross-domain resources on behalf of the user. The human user’s access token is included in the call from the application through the client. To learn more about Amazon Bedrock Agents custom orchestrator, see
Getting started with Amazon Bedrock Agents custom orchestrator. The following is an example of what a human user’s decoded access token provided through an API Gateway REST API might look like.

{
  sub: "user-identity-4e4c-example-7cede8e609a2",
  cognito:groups: 
    [
    "exampleChatApplicationAccess"
    ]
  ,
  iss: https://cognito-idp.<region>.amazonaws.com/<region>_example,
  version: 2,
  client_id: "1example23456789",
  origin_jti: "",
  token_use: "access",
  scope: "openid profile email",
  auth_time: 499192140,
  exp: 1445444940,
  iat: 499192140,
  jti: "",
  username: "my-example-username"
}

The following is a Node.js code sample that an AI agent can use to obtain its own access token from Amazon Cognito. This can be the Lambda function part of the custom orchestration for the Amazon Bedrock agent. Notice the clientMetadata variable being set, which will be passed to the Cognito /token endpoint using the aws_client_metadata request parameter. This request parameter is where the user’s access token is provided. In the following code example, you will find an attribute called callerApp, which is set to ExampleChatApplication, which serves as a unique identifier for the application. The callerApp value is preconfigured in the backend of the solution. This unique application identifier is included in the customized access token for the agent and used for additional authorization checks later. It’s a security best practice to use AWS Secrets Manager to store the client ID and client secret and obtain these credentials at runtime. As a security best practice, the user’s access token should be verified prior to passing it to the AI agent backend.

async function getAccessToken() {
    const clientId = 'exampleAiAgentClientId'; // use Secrets Manager
    const clientSecret = 'exampleAiAgentClientSecret'; // use Secrets Manager
    const tokenEndpoint = 'https://mydomain.auth.<region>.amazoncognito.com/oauth2/token';
    const scope = 'crossDomainService/read userData/read';
    const clientMetadata = '{"onBehalfOfToken":"<HUMAN-USER-ACCESS-TOKEN>", "callerApp":"ExampleChatApplication"}';
  
    const basicAuth = Buffer.from(`${clientId}:${clientSecret}`).toString('base64');
  
    const body = new URLSearchParams({
      grant_type: 'client_credentials',
      scope,
      aws_client_metadata: clientMetadata
    });
  
    const res = await fetch(tokenEndpoint, {
      method: 'POST',
      headers: {
        'Authorization': `Basic ${basicAuth}`,
        'Content-Type': 'application/x-www-form-urlencoded'
      },
      body
    });
  
    if (!res.ok) {
      const error = await res.text();
      throw new Error(`Token request failed: ${res.status} ${error}`);
    }
  
    const { access_token } = await res.json();
    console.log('Access Token:', access_token);
  
    return access_token;
  }
  
  getAccessToken().catch(err => console.error('Error:', err.message));

The access token for the AI agent is returned only if the client ID and secret are correct and the provided user access token is valid. However, before it’s returned, the AI agent’s access token is customized by the Amazon Cognito pre token generation Lambda trigger.

Amazon Cognito pre token generation Lambda trigger

Figure 3: AI agent access token customization with Cognito pre token generation Lambda trigger

Figure 3: AI agent access token customization with Cognito pre token generation Lambda trigger

After the AI agent’s action calls the Amazon Cognito /token endpoint with a valid client ID and secret, Cognito invokes the pre token generation Lambda trigger. The following is an example Lambda function that takes the aws_client_metadata request parameter, which contains the access token of the user and the callerApp attribute that was defined while the user was authenticating. In the following Lambda function, the access token provided from the user is verified (shown in Figure 3). The aws-jwt-verify library is used to verify the token is not expired, the token has not been tampered with by verifying the signature, and it’s making sure that an access token was provided. The Lambda function is also pre-configured to accept user tokens from a specific issuer and audience, this protects against malicious context injection risks. This is also an opportunity to perform additional authorization. For example, check if the user is a member of certain groups.

After the token is verified, the Lambda function customizes the access token to be returned to the AI agent.

import { CognitoJwtVerifier } from "aws-jwt-verify";

// Initialize the JWT verifier to verify the user’s access token
// Provide the user pool ID, token use, and client ID 
const jwtVerifier = CognitoJwtVerifier.create({
  userPoolId: process.env.USER_POOL_ID,  // user pool for user authentication
  clientId: process.env.CLIENT_ID,
  // groups: "exampleChatApplicationAccess", // optional group membership authorization
  tokenUse: 'access'
});

export const handler = async function(event, context) {
  try {
    const onBehalfOfToken = event.request.clientMetadata?.onBehalfOfToken || '';
    // It’s recommended that the provided “callerApp” value from the application is authorized for use with the app client for the AI agent
    const callerApp = event.request.clientMetadata?.callerApp || '';

    // The below console log will display the authenticated user’s JWT
    // Keep this logging with caution in a production environment
    console.log('Original event:', event);

    // Verify the access token from the human user
    // You could optionally also perform some authorization checks here as well
    // Example: check for the membership of a group
    let decodedJWT;
    if (onBehalfOfToken) {
      try {
        decodedJWT = await jwtVerifier.verify(onBehalfOfToken);
        console.log('Decoded JWT:', decodedJWT);
      } catch (err) {
        console.error('Token verification failed:', err);
        throw new Error('Token verification failed');
      }
    }

    // Create the onBehalfOf claim structure
    const behalfOfClaim = decodedJWT ? {
      sub: decodedJWT.sub,
      username: decodedJWT.username,
      groups: decodedJWT['cognito:groups'] || []
    } : {};

    // Customized token returned to client
    event.response = {
      "claimsAndScopeOverrideDetails": {
        "accessTokenGeneration": {
          "claimsToAddOrOverride": {
            "onBehalfOf": behalfOfClaim,
            "callerApp": callerApp
          },
        }
      }
    };

    return event;

  } catch (error) {
    console.error('Error in Lambda execution:', error);
    throw error;
  }
};

Notice in the preceding Lambda function that two custom claims are being dynamically created within the event.response: onBehalfOf and callerApp. The onBehalfOf claim contains nested claims that were extracted from the human user’s access token. The callerApp is carried forward from the frontend application and provided alongside the user access token. It’s recommended for the callerApp value to also be verified against some custom logic to add additional layer of protection. The return AI agent’s access token would look like the following JWT.


{    
	"sub": "agent-identity-4e4c-example-7cede8e609a2",
	"onBehalfOf": {
		"sub": "user-identity-4e4c-example-7cede8e609a2",
		"username": "my-example-username",
		"groups": [
			"readaccess"        
				]    
		},    
		"iss": "https://cognito-idp..amazonaws.com/_example",
		"version": 2,
		"client_id": "1example23456789",
		"callerApp": "ExampleChatApplication",
		"token_use": "access",
		"scope": "crossDomainService123/read userData/read",
		"auth_time": 499192140,
		"exp": 1445444940,
		"iat": 499192140,
		"jti": "aaaaaaaa-bbbb-cccc-dddd-eeeeeeeeeeee"
}

Cross-domain resource server authorization check

At this point, shown in Figure 4, the human user has successfully authenticated to the web application, the human user’s access token was sent as context to the backend, an AI agent obtained its own customized access token containing the human user context, and now the agent is ready to call an external cross-domain service.

Figure 4: Cross-domain resource server performing fine-grained authorization with Amazon Verified Permissions

Figure 4: Cross-domain resource server performing fine-grained authorization with Amazon Verified Permissions

As shown in Figure 4, the cross-domain service is the resource server and therefore needs to perform an authorization check. For this example, we’ll keep things straightforward and make sure that three core things are verified:

  1. The AI agent’s OAuth access token is valid
  2. The AI agent is authorized to access this service
  3. The AI agent is authorized to interact with the user data

Depending on your use case and requirements, you might also need to verify that the user’s consent has been obtained prior to the AI agent acting on their behalf. Ultimately, you want to verify that the AI agent can access a user’s data on their behalf and only for the purpose for which consent has been provided by the user.

For the token verification, use the aws-jwt-verify library again. The following is a Node.js example to verify the AI agent’s access token.

import { CognitoJwtVerifier } from "aws-jwt-verify";

// add custom logic to verify that AI agent is authorized to perform this action on behalf of the user

// Verifier that expects valid access tokens:
const verifier = CognitoJwtVerifier.create({
  userPoolId: "<user_pool_id>", // user pool for AI agent authentication
  tokenUse: "access",
  clientId: "<client_id>",
});

try {
  const payload = await verifier.verify(
    "eyJraWQeyJhdF9oYXNoIjoidk..." //this will be the AI agent's access token
  );
  console.log("Token is valid. Payload:", payload);
} catch {
  console.log("Token not valid!");
}

Fine-grained authorization with Verified Permissions

As a security best practice, the zero trust principle of enforcing fine-grained identity-based authorization should take place using Verified Permissions. The preceding Node.js code sample is a basic validation of the AI agents access token that can happen within the application logic. Instead of keeping authorization logic within the resource server, you can use Verified Permissions to offload the authorization policies to a managed service. The following is an example Cedar policy for this use case.

permit(
    principal == Agent::"agent-identity-4e4c-example-7cede8e609a2",
    action == Action::"readOnly",
    resource == Resource::"crossDomainService123::userData"
)
when {
    resource.scope == Scope::"crossDomainService123/read" &&
    resource.owner == User::" user-identity-4e4c-example-7cede8e609a2" &&
    context.onBehalfOf.sub == " user-identity-4e4c-example-7cede8e609a2" &&
    context.callerApp == "ExampleChatApplication"
};

With the preceding Cedar policy example, you are permitting the AI agent to read userData from the crossDomainService123 resource. This is only permitted when the AI agent’s access token contains the crossDomainService/read scope and when the resource owner and the onBehalfOf user (from the access token) are the same—the human user in this case. There’s also an additional when clause in the policy to make sure that this interaction initiated from ExampleChatApplication.

The cross-domain resource server would use the AI agent’s access token and call the Verified Permissions IsAuthorizedWithToken API. To learn more, see Simplify fine-grained authorization with Amazon Verified Permissions and Amazon Cognito.

The following is a Node.js example using the IsAuthorizedWithToken API from Verified Permissions using the AWS SDK for JavaScript v3.

import { VerifiedPermissionsClient, IsAuthorizedWithTokenCommand } from "@aws-sdk/client-verifiedpermissions";

const client = new VerifiedPermissionsClient({ region: "<region>" });

// Dynamically provided token 
const jwtToken = "eyJraWQiOiJrMWtleSIsInR..."; //AI agent's access token

async function checkAccess() {
  const input = {
    policyStoreId: "ps-abc123example", // your AVP policy store ID
    accessToken: jwtToken,
    action: {
      actionType: "Action",
      actionId: "readOnly"
    },
    resource: {
      entityType: "crossDomainService123",
      entityId: "userData"
    }
  };

  const command = new IsAuthorizedWithTokenCommand(input);

  try {
    const response = await client.send(command);
    console.log("Authorization Decision:", response.decision);
  } catch (err) {
    console.error("Authorization error:", err);
  }
}

Based on the preceding examples of the AI agent’s access token (with user context), the Cedar policy, and the IsAuthorizedWithToken API call, the resource server would get an Allow decision for this action to take place. The following is an example of the authorization decision response.

{
    "decision": "Allow",
    "determiningPolicies": [{
        "determiningPolicyId": "ps-abc123example"
    }],
    "errors": []
}

Before this policy can be evaluated, you must define a schema that includes the relevant entity types (Agent, User, Resource, Scope, and so on), and create corresponding entities in your policy store that match the IDs used in the policy and request.

Bringing it all together, the requested data from the AI agent, on behalf of the user, is returned from the cross-domain service to the AI agent. This additional data can now be used within the context of the AI agent workload. The entire solution can be used for a chat application, such as the one described in Protect sensitive data in RAG applications with Amazon Bedrock.

Conclusion

Amazon Cognito M2M access token customization and support for passing client metadata provides you the extensibility to solve complex use cases and enables emerging ones like AI agent identity and access management. For example, passing contextual client metadata and customizing access tokens at runtime can help software as a service (SaaS) and multi-tenant service providers scale to an unlimited number of resource servers, because these can be dynamically determined at runtime. As organizations increasingly explore the use of AI agents, having a secure, scalable identity management solution becomes crucial for maintaining control and accountability. By using these new features, you can build more secure and scalable solutions with Amazon Cognito to prepare for the future of autonomous AI agent use cases.

Use the comments section to leave feedback about this post. If you have questions about this post, start a new thread on Amazon Cognito re:Post or contact AWS Support.

Abrom Douglas

Abrom Douglas III

Abrom is a Senior Solutions Architect within AWS Identity with nearly 20 years of software engineering and security experience, specializing in the identity and access management space. He loves speaking with customers about how identity and access management can provide secure outcomes that enable both business and technology initiatives. In his free time, he enjoys cheering for Arsenal FC, photography, travel, volunteering, and competing in duathlons.

Secure your Express application APIs in minutes with Amazon Verified Permissions

Post Syndicated from Trevor Schiavone original https://aws.amazon.com/blogs/security/secure-your-express-application-apis-in-minutes-with-amazon-verified-permissions/

Today, Amazon Verified Permissions announced the release of @verifiedpermissions/authorization-clients-js, an open source package that developers can use to implement external fine-grained authorization for Express.js web application APIs in minutes when using Verified Permissions.

Express is a minimal and flexible Node.js web application framework that provides a robust set of features for web and mobile applications. By using this standardized integration with Verified Permissions, developers can externalize authorization using up to 90 percent less code compared to writing their own custom integrations, saving them time and effort and improving application security posture by reducing the amount of custom integration code.

Why externalize authorization?

Traditionally, developers implemented authorization within their application by embedding authorization logic directly into application code. This embedded authorization logic is designed to support a few permissions, but as applications evolve, there is often a need to incrementally update the embedded authorization logic to support more complex use cases, resulting in code that is complex and difficult to maintain. As code complexity increases, further evolving the security model and performing audits of permissions becomes more challenging, resulting in an application that becomes more difficult to maintain over its lifecycle.

By externalizing authorization, you can decouple authorization logic from your application. This yields multiple benefits including freeing up development teams to focus on application logic and simplifying software audits.

One approach to externalize authorization from your application code is to use Cedar. Cedar is an open source language and software development kit (SDK) for writing and enforcing authorization policies for your applications. You specify fine-grained permissions as Cedar policies, and your application authorizes access requests by calling the Cedar SDK. For example, if you’re building a pet store application, you can use the following Cedar policy to control that only a user with a jobLevel of employee can access the POST /pets API.


permit (
	principal,
	action in [Action::"POST /pets"], 
	resource
) when {
	principal.jobLevel = "employee"
};

One option for using Cedar is to self-manage the implementation; you can find an example for this pattern in another post: Secure your application APIs in 5 minutes with Cedar.

Self-managed Cedar provides the benefits of externalizing authorization but requires ongoing operational management. Organizations are responsible for Cedar version upgrades, applying security patches, managing policies, and auditing authorizations. Another option for using Cedar is to use Verified Permissions. Verified Permissions removes these operational requirements by providing a managed service for Cedar. Verified Permissions manages scaling, simplifies policy governance by supporting centralized policy management, and logs policy changes and authorization requests to simplify auditing.

This post describes how web application developers can use the new Express package to simplify the integration of Express web applications with Verified Permissions. The step-by-step guide uses a sample Pet Store application to show how access to APIs can be restricted based on user groups. You can find the sample Pet Store application in the verifiedpermissions repository on GitHub.

Pet Store application API overview

The Pet Store application is used to manage a pet store. The pet store is built using Express with Node.js and exposes the APIs in the following table.

API Description
GET /api/pets Returns the list of available pets
GET /api/pets/{petId} Returns the specified pet found
POST /api/pets Adds a pet to the pet store
PUT /api/pets/{petId} Updates an existing pet
DELETE /api/pets/{petId} Removes a pet from the pet store

This application doesn’t allow all users to access all APIs. Instead, it enforces the following rules:

  • Administrators: Full access to pets and management functions
  • Employees: Can view, create, and update pets
  • Customers: Can view pets and create new pets

Implementing authorization for the Pet Store APIs

Let’s walk through how to secure your application APIs using Verified Permissions and the new package for Express. The initial application, with no authorization, can be found in the start folder; use this to follow along with the post. You can find a completed version of the application in the finish folder.

When completed, you’ll have implemented the application architecture shown in Figure 1. A React frontend application that uses Amazon Cognito for authentication. The application then includes the identity token returned from Cognito as an authorization header to the Express backend APIs. The Express backend, using the new Verified Permissions authorization middleware package, calls Verified Permissions to authorize the user request.

Figure 1: Architecture of the Pet Store application

Figure 1: Architecture of the Pet Store application

Prerequisites

Before you get started, make sure you have the following prerequisites in place.

Step 1: Set up the AWS CLI

Some of the commands require the AWS Command Line Interface (AWS CLI). See Installing or updating to the latest version of the AWS CLI and Configuring settings for the AWS CLI.

Step 2: Set up an OpenID Connect identity provider and a database

The Pet Store application uses an OpenID Connect (OIDC) identity provider to manage users. For this example, you use an Amazon Cognito user pool called PetStoreUserPool with three users, one Admin, one Employee, and one Customer.

The application also uses a Amazon DynamoDB database to store the pets.

You can set up Amazon Cognito and DynamoDB in your AWS account by running the following command in the /start directory.

./scripts/setup-infrastructure.sh

The setup script will prompt you to set passwords for the three users (passwords must be at least 8 characters and require at least one number, one uppercase letter, and one lowercase letter).

Note the outputs of running this script because you’ll use them in step 5 of Integrate Verified Permissions.

Note: In your own applications, you can set up Amazon Cognito by following the instructions in Create a new application in the Amazon Cognito console, or you can bring your own OIDC identity provider.

Step 3 (optional): Run the application

Now that the infrastructure is set up, you can run the application. In two separate terminals, run the following commands in the /start directory:

./scripts/run-backend-dev.sh
./scripts/run-frontend-dev.sh

Test the application by creating some pets.

Integrate Verified Permissions

With the prerequisites in place, the next step is to integrate Verified Permissions. Verified Permissions can be integrated into an Express application in six steps:

  1. Create a Verified Permissions policy store
  2. Add the Cedar and Verified Permissions authorization middleware packages
  3. Create and deploy a Cedar schema
  4. Create and deploy Cedar policies
  5. Connect the Verified Permissions policy store to your OIDC identity provider
  6. Update the application code to call Verified Permissions to authorize API access

The Verified Permissions integration happens with the Express web application backend. All commands in the section should be run in the /start/backend directory.

Step 1: Create a Verified Permissions policy store 

  1. Create a policy store in Verified Permissions using the AWS CLI by running the following command
    aws verifiedpermissions create-policy-store  --validation-settings "mode=STRICT"
    

    Example successful command output:

    {
        "policyStoreId": "AAAAbbbbCCCCdddd",
        "arn": "arn:aws:verifiedpermissions::111122223333:policy-store/AAAAbbbbCCCCdddd",
        "createdDate": "2025-06-05T19:30:37.896119+00:00",
        "lastUpdatedDate": "2025-06-05T19:30:37.896119+00:00"
    }
    

  2. Save the policyStoreId value from the command output to use in step 3.

Step 2: Add the Cedar and Verified Permissions authorization middleware packages

  • Run the following command to add two new dependencies on @verifiedpermissions/authorization-clients and @cedar-policy/authorization-for-expressjs
    npm i --save @verifiedpermissions/authorization-clients
    npm i --save @cedar-policy/authorization-for-expressjs
    

Step 3: Create and deploy the Cedar schema 

A Cedar schema defines the authorization model for an application, including the entity types in the application and the actions users are allowed to take. You attach your schema to your Verified Permissions policy stores, and when policies are added or modified, the service automatically validates the policies against the schema.

The @cedar-policy/authorization-for-expressjs package can analyze the OpenAPI specification of your application and generate a Cedar schema. Specifically, the paths object in the OpenAPI schema is required in your specification.

If you don’t have an OpenAPI spec, you can generate one using the tool of your choice. There are several open source libraries that you can use to do this for Express; you might need to add some code to your application, generate the OpenAPI spec, and then remove the code. Alternatively, some generative AI based tools such as the Amazon Q Developer CLI are effective at generating OpenAPI spec documents. Regardless of how you generate the spec, be sure to validate the correct output from the tool.

For the sample application an OpenAPI spec document has been included and is named openapi.json.

  1. Run the following command to generate the Cedar schema.
    npx @cedar-policy/authorization-for-expressjs generate-schema --api-spec schemas/openapi.json --namespace PetStoreApp --mapping-type SimpleRest
    

    Example successful command output:

    Cedar schema successfully generated. Your schema files are named: v2.cedarschema.json, v4.cedarschema.json.
    v2.cedarschema.json is compatible with Cedar 2.x and 3.x
    v4.cedarschema.json is compatible with Cedar 4.x and required by the nodejs Cedar plugins.
    

  2. Next, format the Cedar schema for use with the AWS CLI. The specific format required is described in the documentation Amazon Verified Permissions policy store schema. To format the Cedar schema run the following command.
    ../scripts/prepare-cedar-schema.sh v2.cedarschema.json v2.cedarschema.forAVP.json
    

    Example successful command output:

    Cedar schema prepared successfully: v2.cedarschema.forAVP.json
    You can now use it with AWS CLI:
    

  3. After the schema is formatted, run the following command to upload the schema to Verified Permissions. Note that you need to replace <policy store id> with the actual policy store ID, which is provided as an output from the command in step 1.
    aws verifiedpermissions put-schema --definition file://v2.cedarschema.forAVP.json --policy-store-id <policy store id>
    

    Example successful command output:

    {
        "policyStoreId": "AAAAbbbbCCCCdddd",
        "namespaces": [
            "PetStoreApp"
        ],
        "createdDate": "2025-06-03T20:19:33.480528+00:00",
        "lastUpdatedDate": "2025-06-05T19:42:45.198325+00:00"
    }
    

Step 4: Create and deploy Cedar policies

If no policies are configured, Cedar denies authorization requests. The next step is to create policies that will allow specific user groups access to specific resources. The Express framework integration helps bootstrap this process by generating example policies based on the previously generated schema. You can then then customize these policies based on your use cases.

  1. Run the following command to generate sample Cedar policies.
    npx @cedar-policy/authorization-for-expressjs generate-policies --schema v2.cedarschema.json
    

    Example successful command output:

    Cedar policy successfully generated in policies/policy_1.cedar
    Cedar policy successfully generated in policies/policy_2.cedar
    

    Two sample policies are generated in the /policies directory: policy_1.cedar and policy_2.cedar.

    policy_1.cedar provides permissions for users in the admin user group to perform any action on any resource.

    
    // policy_1.cedar
    // Allows admin usergroup access to everything
    permit (
    	principal in PetStoreApp::UserGroup::"admin",
    	action,
    	resource
    );
    

    policy_2.cedar provides more access to the individual actions defined in the Cedar schema with a place holder for a specific group.

    // policy_2.cedar
    // Allows more granular user group control, change actions as needed
    permit (
        principal in PetStoreApp::UserGroup::"ENTER_THE_USER_GROUP_HERE",
        action in
            [PetStoreApp::Action::"GET /pets",
             PetStoreApp::Action::"POST /pets",
             PetStoreApp::Action::"GET /pets/{petId}",
             PetStoreApp::Action::"PUT /pets/{petId}",
             PetStoreApp::Action::"DELETE /pets/{petId}"],
        resource
    );
    

    Note that if you specified an operationId in the OpenAPI specification, the action names defined in the Cedar Schema will use that operationId instead of the default <HTTP Method> /<PATH> format. In this case, make sure that the naming of your actions in your Cedar policies matches the naming of your actions in your Cedar schema.

    For example, if you want to call your action AddPet instead of POST /pets, you could set the operationId in your OpenAPI specification to AddPet. The resulting action in the Cedar policy would be PetStoreApp::Action::"AddPet"

    Create a third policy file called policy_3.cedar and then replace the contents of each file with the following policies. Replace <userpoolId> in each policy with the Cognito User Pool Id copied earlier.

    Note: In a real use case, consider renaming your Cedar policy files based on their contents, for example, allow_customer_group.cedar.

    // Defines permitted administrator user group actions
    permit (
        principal in PetStoreApp::UserGroup::"<userPoolId>|administrator",
        action,
        resource
    );
    

    // Defines permitted employee user group actions
    permit (
        principal in PetStoreApp::UserGroup::"<userPoolId>|employee",
        action in
            [PetStoreApp::Action::"GET /pets",
             PetStoreApp::Action::"POST /pets",
             PetStoreApp::Action::"GET /pets/{petId}",
             PetStoreApp::Action::"PUT /pets/{petId}"],
        resource
    );
    

    // Defines permitted customer user group actions
    permit (
        principal in PetStoreApp::UserGroup::"<userPoolId>|customer",
        action in
            [PetStoreApp::Action::"GET /pets",
             PetStoreApp::Action::"POST /pets",
             PetStoreApp::Action::"GET /pets/{petId}"],
        resource
    );
    

  2. The policies need to be formatted so that they work with the AWS CLI for Verified Permissions. The specific format is described in the AWS CLI Verified Permissions documentation. Run the following command to format the policies.
    ../scripts/convert_cedar_policies.sh
    

    Example successful command output:

    Converting policies/policy_1.cedar to policies/json/policy_1.json
    Created policies/json/policy_1.json
    Converting policies/policy_2.cedar to policies/json/policy_2.json
    Created policies/json/policy_2.json
    Converting policies/policy_3.cedar to policies/json/policy_3.json
    Created policies/json/policy_3.json
    Conversion complete. JSON policy files are in ../policies/json/
    

    The formatted policies will be output to the backend/policies/json/ directory.

  3. After formatting the policies, run the following three commands, one for each policy, to upload them to Verified Permissions. The policy store ID is returned after completing step 2. Replace <policy store id> with the actual policy store ID.
    aws verifiedpermissions create-policy  --definition file://policies/json/policy_1.json --policy-store-id <policy store id>
    aws verifiedpermissions create-policy  --definition file://policies/json/policy_2.json --policy-store-id <policy store id>
    aws verifiedpermissions create-policy  --definition file://policies/json/policy_3.json --policy-store-id <policy store id>
    

    Example successful command output:

    {
        "policyStoreId": "AAAAbbbbCCCCdddd",
        "policyId": "8AmzZYMw6Ux5DGBoX7w24m",
        "policyType": "STATIC",
        "principal": {
            "entityType": "PetStoreApp::UserGroup",
            "entityId": "<userPoolId>|administrator"
        },
        "createdDate": "2025-06-05T19:46:45.848602+00:00",
        "lastUpdatedDate": "2025-06-05T19:46:45.848602+00:00",
        "effect": "Permit"
    }
    

Alternatively, you can also copy and paste Cedar policies into Verified Permissions in the AWS Management Console.

Step 5: Connect the Verified Permissions policy store to your OIDC identity provider

By default, the Verified Permissions authorizer middleware reads a JSON Web Token (JWT) provided within the authorizationheader of the API request to get user information. Verified Permissions can validate the token in addition to performing authorization policy evaluation.

  1. To do this, create an identity source in Verified Permissions policy store. To simplify formatting in the AWS CLI command, we’ve defined the identity source configuration in identity-source-configuration.txtReplace the <userPoolArn> and <clientId> parameters in the following code block based on the outputs of running the setup-infrastructure.sh script in Step 2 of the prerequisites.
    // identity-source-configuration.txt
    {
        "cognitoUserPoolConfiguration": {
            "userPoolArn": "<userPoolArn>",
            "clientIds":["<clientId>"] ,
            "groupConfiguration": {
                  "groupEntityType": "PetStoreApp::UserGroup"
            }
        }
    }
    

  2. After you update the file, run the following command to update the Verified Permissions policy store. Replace <policy store id> with the actual policy store ID.
    aws verifiedpermissions create-identity-source --configuration file://identity-source-configuration.txt --policy-store-id <policy store id> --principal-entity-type PetStoreApp::User
    

Example successful command output:

{
    "createdDate": "2025-06-05T20:02:53.992782+00:00",
    "identitySourceId": "DTLvwdiKfdPmk2RWzSVfu2",
    "lastUpdatedDate": "2025-06-05T20:02:53.992782+00:00",
    "policyStoreId": "AAAAbbbbCCCCdddd"
}

Step 6: Update the application code to call Verified Permissions to authorize API access 

You now need to update the application to use the @verifiedpermissions/authorization-clients and @cedar-policy/authorization-for-expressjs dependencies. This will allow the application to call Verified Permissions to authorize the API requests.

  1. Add the dependencies and define the CedarAuthorizerMiddleware and AVPAuthorizer in the application by adding the following block of code to line 13 (directly after the import statements) of backend/app.ts. Replace <policystoreId> in the following code block with your actual Verified Permissions policy store ID.
    const { ExpressAuthorizationMiddleware } = require('@cedar-policy/authorization-for-expressjs');
    
    const { AVPAuthorizationEngine } = require('@verifiedpermissions/authorization-clients');
    
    const avpAuthorizationEngine = new AVPAuthorizationEngine({
        policyStoreId: <policyStoreId>,
        callType: 'identityToken'
    });
    
    const expressAuthorization = new ExpressAuthorizationMiddleware({
        schema: {
            type: 'jsonString',
            schema: fs.readFileSync(path.join(__dirname, '../v4.cedarschema.json'), 'utf8'),
        },
        authorizationEngine: avpAuthorizationEngine,
        principalConfiguration: { type: 'identityToken' },
        skippedEndpoints: [],
        logger: {
            debug: (s: any) => console.log(s),
            log: (s: any) => console.log(s),
        }
    });
    

  2. Configure the Express application to use the authorization middleware that you just defined. To do this, add the following line of code to the end of the block of app.use(..) statements that begin after the comment // Configure security and performance middleware (approximately line 48 depending on how you pasted the previous block of code).
    app.use(expressAuthorization.middleware);
    

You’ve now successfully set up authorization in your application by creating a Verified Permissions policy store, writing Cedar policies to define your authorization, and integrating your application with Verified Permissions.

Validating API security

You can use the frontend web application to verify that authorization has been applied to the APIs. In two separate terminals run the following commands in the /start directory

./scripts/run-backend-dev.sh
./scripts/run-frontend-dev.sh

In a browser navigate to http://localhost:3001 and sign in with one of the Amazon Cognito users you created earlier. Validate that the permissions policies are working as expected:

  • Administrators: Can view, create, update, and delete pets.
  • Employees: Can view, create, and update pets.
  • Customers: Can view pets and create new pets.

In the terminal for the Express application, you can see log output that provides additional details about the authorization decisions. For example, following an unauthorized action the terminal outputs the following:

Authorization result: {"type":"deny"}

Conclusion

The new @verifiedpermissions/authorization-clients-js package allows Express developers to integrate their application with Verified Permissions to decouple authorization logic from code. By decoupling your authorization logic and integrating your application with the Verified Permissions, you can improve developer productivity and simplify permissions and access audits.

To support analyzing and auditing permissions when writing cedar policies the open source Cedar project also recently open sourced the Cedar Analysis CLI to help developers perform policy analysis on their policies. You can learn more about this new tool in Introducing Cedar Analysis: Open Source Tools for Verifying Authorization Policies.

The framework packages are open source and available on GitHub under the Apache 2.0 license, with distribution through NPM. To learn more, see Amazon Verified Permissions and Cedar.

If you have feedback about this post, submit comments in the Comments section below.
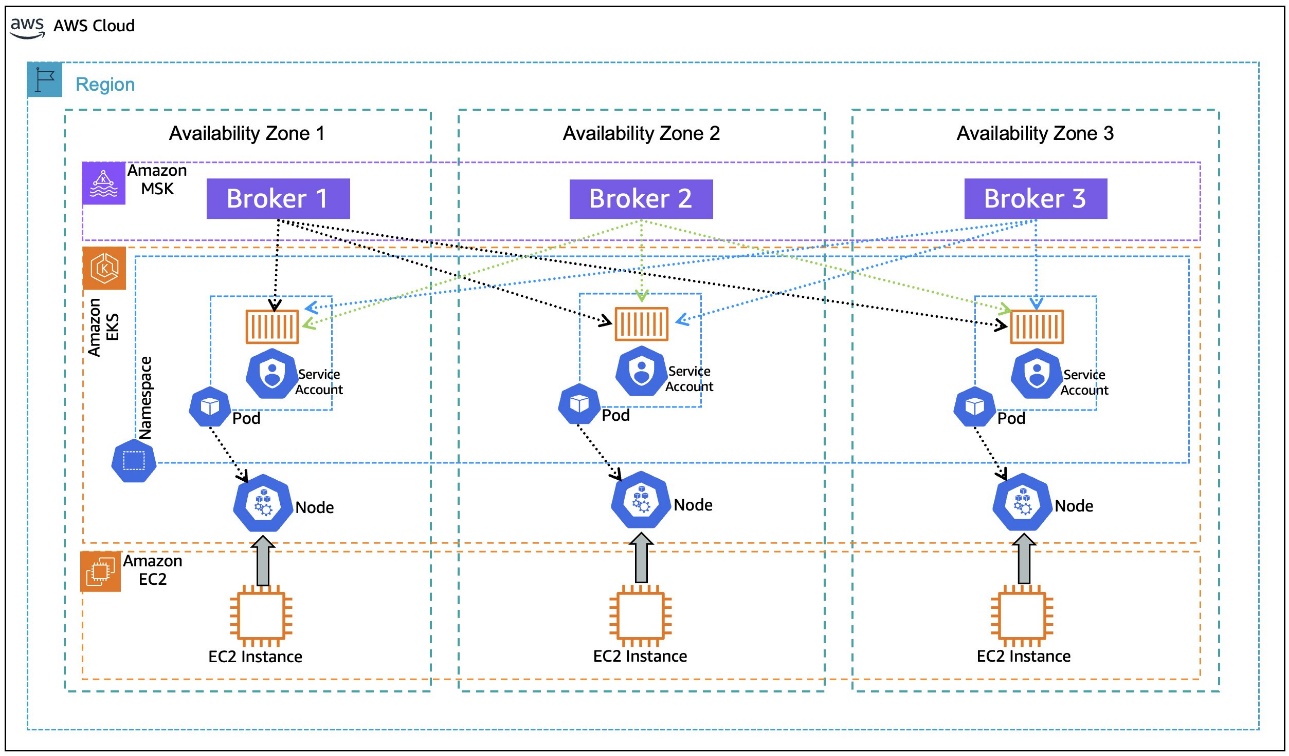
Trevor Schiavone

Trevor Schiavone

Trevor is a Senior Solutions Architect at AWS. He works with customers to build secure, scalable, and innovative architectures. When not at work he’s usually out running, cycling, or travelling to new countries.

Rickard Lofstrom

Rickard Löfström

Ricard guides enterprises in building secure cloud environments as a Specialist Solution Architect in the AWS EMEA Security & Compliance team. He advises customers on implementing AWS security services, focusing on identity management, data protection, and infrastructure security controls. Rickard translates complex security requirements into technical solutions that enable organizations to meet their security objectives while maintaining operational efficiency.