Tag Archives: announcements

New – Amazon Lookout for Equipment Analyzes Sensor Data to Help Detect Equipment Failure

Post Syndicated from Harunobu Kameda original https://aws.amazon.com/blogs/aws/new-amazon-lookout-for-equipment-analyzes-sensor-data-to-help-detect-equipment-failure/

Companies that operate industrial equipment are constantly working to improve operational efficiency and avoid unplanned downtime due to component failure. They invest heavily and repeatedly in physical sensors (tags), data connectivity, data storage, and building dashboards over the years to monitor the condition of their equipment and get real-time alerts. The primary data analysis methods are single-variable threshold and physics-based modeling approaches, and while these methods are effective in detecting specific failure types and operating conditions, they can often miss important information detected by deriving multivariate relationships for each piece of equipment.

With machine learning, more powerful technologies have become available that can provide data-driven models that learn from an equipment’s historical data. However, implementing such machine learning solutions is time-consuming and expensive owing to capital investment and training of engineers.

Today, we are happy to announce Amazon Lookout for Equipment, an API-based machine learning (ML) service that detects abnormal equipment behavior. With Lookout for Equipment, customers can bring in historical time series data and past maintenance events generated from industrial equipment that can have up to 300 data tags from components such as sensors and actuators per model. Lookout for Equipment automatically tests the possible combinations and builds an optimal machine learning model to learn the normal behavior of the equipment. Engineers don’t need machine learning expertise and can easily deploy models for real-time processing in the cloud.

Customers can then easily perform ML inference to detect abnormal behavior of the equipment. The results can be integrated into existing monitoring software or AWS IoT SiteWise Monitor to visualize the real-time output or to receive alerts if an asset tends toward anomalous conditions.

How Lookout for Equipment Works
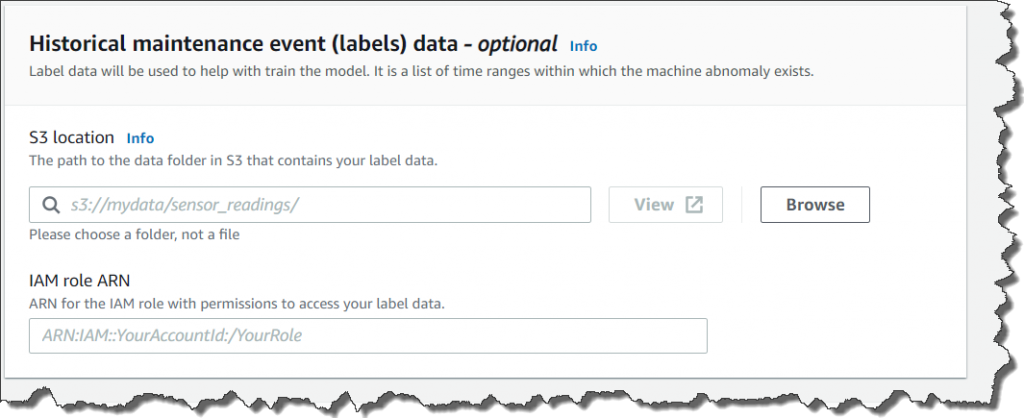
Lookout for Equipment reads directly from Amazon S3 buckets. Customers can publish their industrial data in S3 and leverage Lookout for Equipment for model development. A user determines the value or time period to be used for training and assigns an appropriate label. Given this information, Lookout for Equipment launches a task to learn and creates the best ML model for each customer.

Because Lookout for Equipment is an automated machine learning tool, it gets smarter over time as users use Lookout for Equipment to retrain their models with new data. This is useful for model re-creation when new invisible failures occur, or when the model drifts over time. Once the model is complete and can be inferred, Lookout for Equipment provides real-time analysis.

With the equipment data being published to S3, the user can scheduled inference that ranges from 5 minutes to one hour. When the user data arrives in S3, Lookout for Equipment fetches the new data on the desired schedule, performs data inference, and stores the results in another S3 bucket.

Set up Lookout for Equipment with these simply steps:

  1. Upload data to S3 buckets
  2. Create datasets
  3. Ingest data
  4. Create a model
  5. Schedule inference (if you need real-time analysis)

1. Upload data
You need to upload tag data from equipment to any S3 bucket.

2. Create Datasets

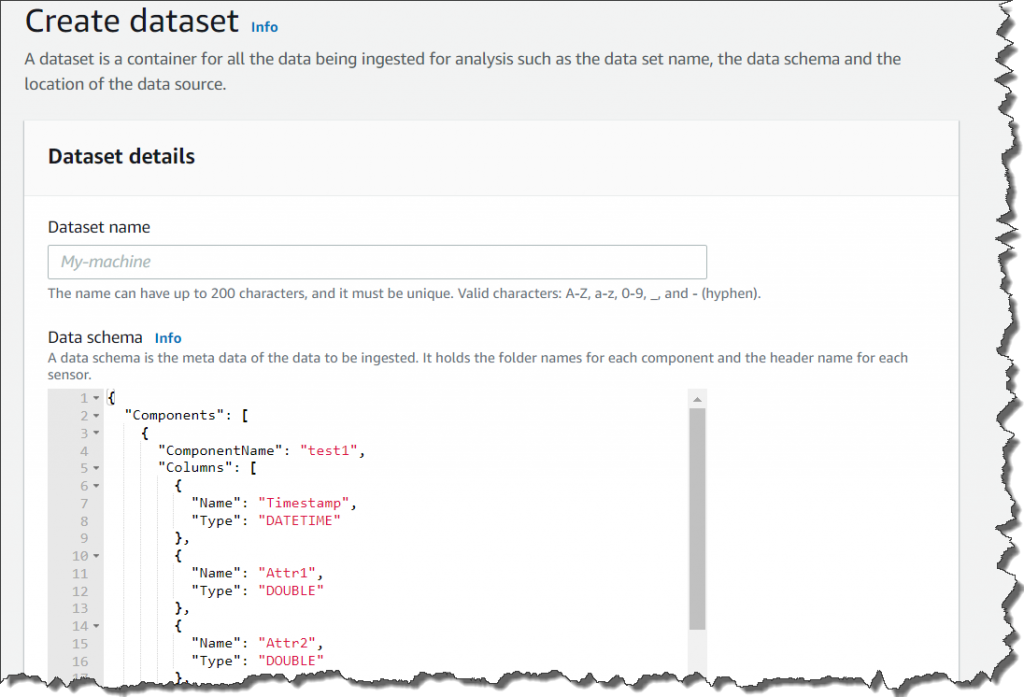
Select Create dataset, and set Dataset name, and set Data Schema. Data schema is like a data design document that defines the data to be fed in later. Then select Create.

creating datasets console

3. Ingest data
After a dataset is created, the next step is to ingest data. If you are familiar with Amazon Personalize or Amazon Forecast, doesn’t this screen feel familiar? Yes, Lookout for Equipment is as easy to use as those are.

Select Ingest data.

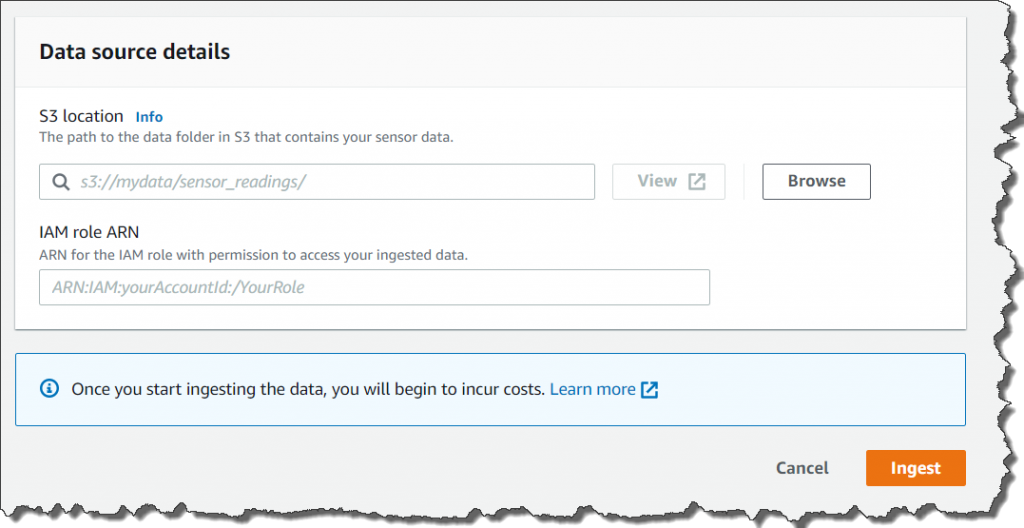
Ingesting data consoleSpecify the S3 bucket location where you uploaded your data, and an IAM role. The IAM role has to have a trust relationship to “lookoutequipment.amazonaws.com” You can use the following policy file for the test.

{
  "Version": "2012-10-17",
  "Statement": [
    {
      "Effect": "Allow",
      "Principal": {
        "Service": "lookoutequipment.amazonaws.com"
      },
      "Action": "sts:AssumeRole"
    }
  ]
}

The data format in the S3 bucket has to match the Data Schema you set up in step 2. Please check our technical documents for more detail. Ingesting data takes a few minutes to tens of minutes depending on your data volume.

4. Create a model
After data ingest is completed, you can train your own ML model now. Select Create new model. Fields show us a list of fields in the ingested data. By default, no field is selected. You can select fields you want Lookout for Equipment to learn. Lookout for Equipment automatically finds and trains correlations from multiple specified fields and creates a model.

Image illustrates setting up fields.

If you are sure that your data has some unusual data included, you can optionally set the windows to exclude that data.

setting up maintenance windowOptionally, you can divide ingested data for training and then for evaluation. The data specified during the evaluation period is checked compared to the trained model.

setting up evaluation window

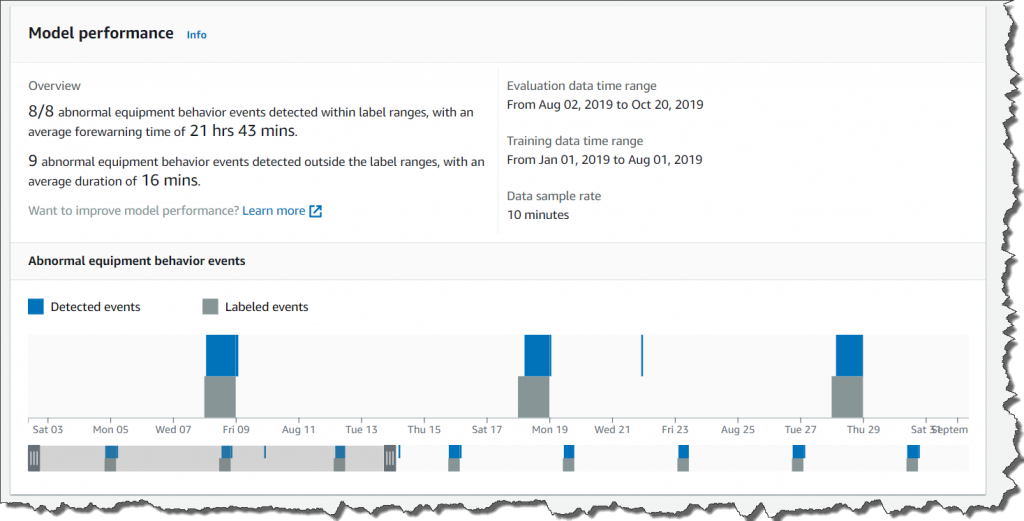
Once you select Create, Lookout for Equipment starts to train your model. This process takes minutes to hours depending on your data volume. After training is finished, you can evaluate your model with the evaluation period data.

model performance console

5. Schedule Inference
Now it is time to analyze your real time data. Select Schedule Inference, and set up your S3 buckets for input.

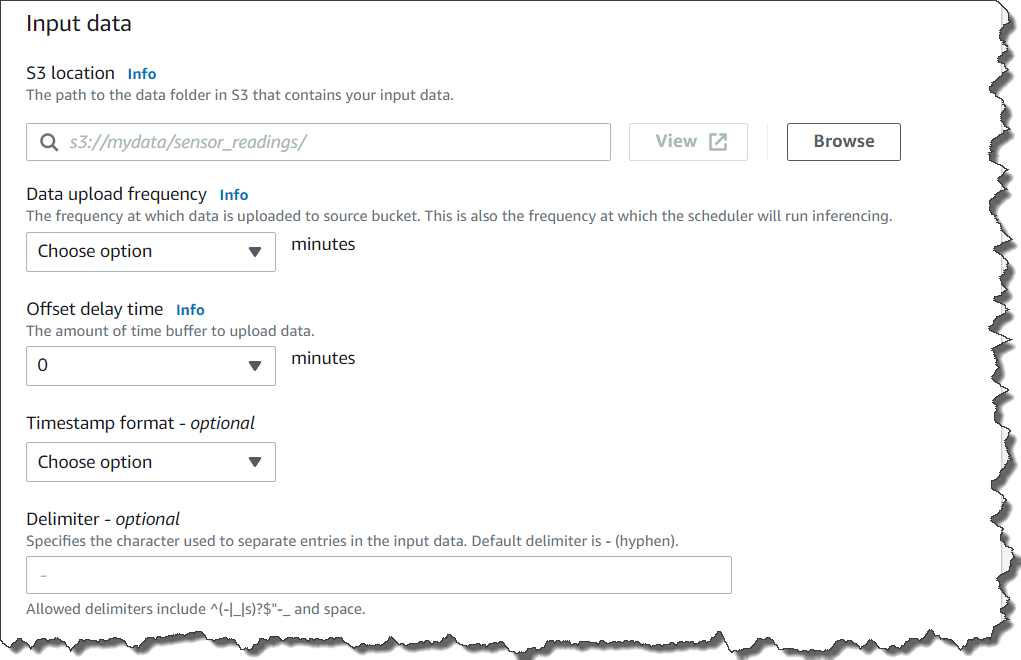
setting up input S3 bucket

You can also set Data upload frequency, which is actually the same as inferencing frequency, and Offset delay time. Then, you need to set up Output data as Lookout for Equipment outputs the result of inference.

setting up inferenced output S3 bucket

Amazon Lookout for Equipment is In Preview Today
Amazon Lookout for Equipment is in preview today at US East (N. Virginia), Asia Pacific (Seoul), and Europe (Ireland) and you can see the documentation here.

– Kame

Amazon Connect – Now Smarter and More Integrated With Third-Party Tools

Post Syndicated from Sébastien Stormacq original https://aws.amazon.com/blogs/aws/amazon-connect-smarter-and-more-integrated/

We launched Amazon Connect in 2017 and, since then, thousands of customers have created their own contact centers in the cloud. Amazon Connect makes it easy for non-technical customers to design interaction flows, manage agents, and track performance metrics.

For example, when I book a Best Western hotel room in Europe by phone, the call is managed by Amazon Connect. In the UK, the Post Office went from ideation to production rollout in just three weeks. In France, WebHelp, a global leader in Business Process Outsourcing, activated thousands of workstations and remote agents in just 72 hours.

Since I last blogged about Amazon Connect, the team has been continuously listening for your feedback and, today, I am happy to announce a new set of capabilities to make Amazon Connect smarter and more integrated with third-party tools.

We are using Machine Learning (ML) to make Amazon Connect smarter at analyzing conversations in real time, finding relevant information needed by contact center agents, and authenticating customers by the sound of their voice. The second set of capabilities makes Amazon Connect easier to integrate with third party tools or services to present unified customer profile information to contact center agents, and to make it easier to manage their tasks.

Let’s go into the details, one by one.

Contact Lens Real Time
Contact Lens for Amazon Connect is a set of machine learning (ML) capabilities allowing contact center supervisors to better understand the sentiment, trends, and compliance of customer conversations. It was first announced during re:Invent 2019 and available since July 2020. It allows to effectively train agents, replicate successful interactions, and to identify crucial company and product feedback.

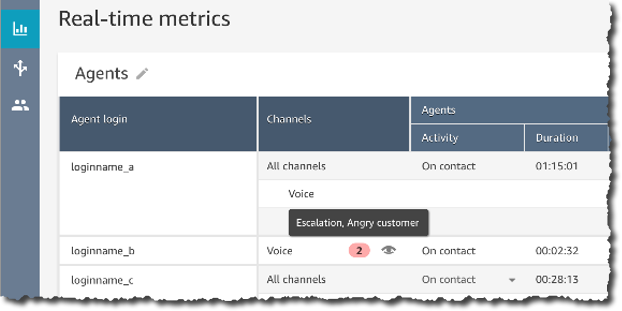
Starting today, you can get real-time insights into customer experience during the live calls, such as a customer expressing dissatisfaction. Customer experience analytics and alerts for live calls are delivered in Amazon Connect’s real-time metrics dashboard. It makes it easy for supervisors to identify when to listen-in on a critical call, and to provide guidance to the agent via chat, or have the agent transfer the call to them for assistance.

You, as the contact center manager, can define rules using specific terms such as “not happy,” “poor quality product,” and “cancel my subscription.” Contact Lens uses natural language processing (NLP) to perform intelligent matching to automatically detect variations of the spoken words even when the example phrases are limited.

Create Rules for real time analytics

Contact Lens analyzes in-progress calls in real time to detect when the rule criteria for a customer experience issue is met, and immediately creates an alert next to the live call in the Amazon Connect dashboard to notify supervisors of the situation.

Real Time alert based on rules

With this launch, we are adding 13 language variants to post-call analytics, in addition to the 5 already supported :English (United States), English (Great Britain), English (Australia), English (India), and Spanish (United States).

The new language variants for post-call analytics are: English (Ireland), English (Scotland), English (Wales), Spanish (Spain), French (Canada), French (France), Portuguese (Portugal), Portuguese (Brazil), German (Germany), German (Switzerland), Italian (Italy), Arabic (Gulf), and Hindi (India).

Contact Lens for Amazon Connect real-time is available in 4 language variants: English (United States), English (Great Britain), English (Australia), and Spanish (United States). More language variants will be added at later stage.

For more details visit this launch page.

Amazon Connect Wisdom (Preview)
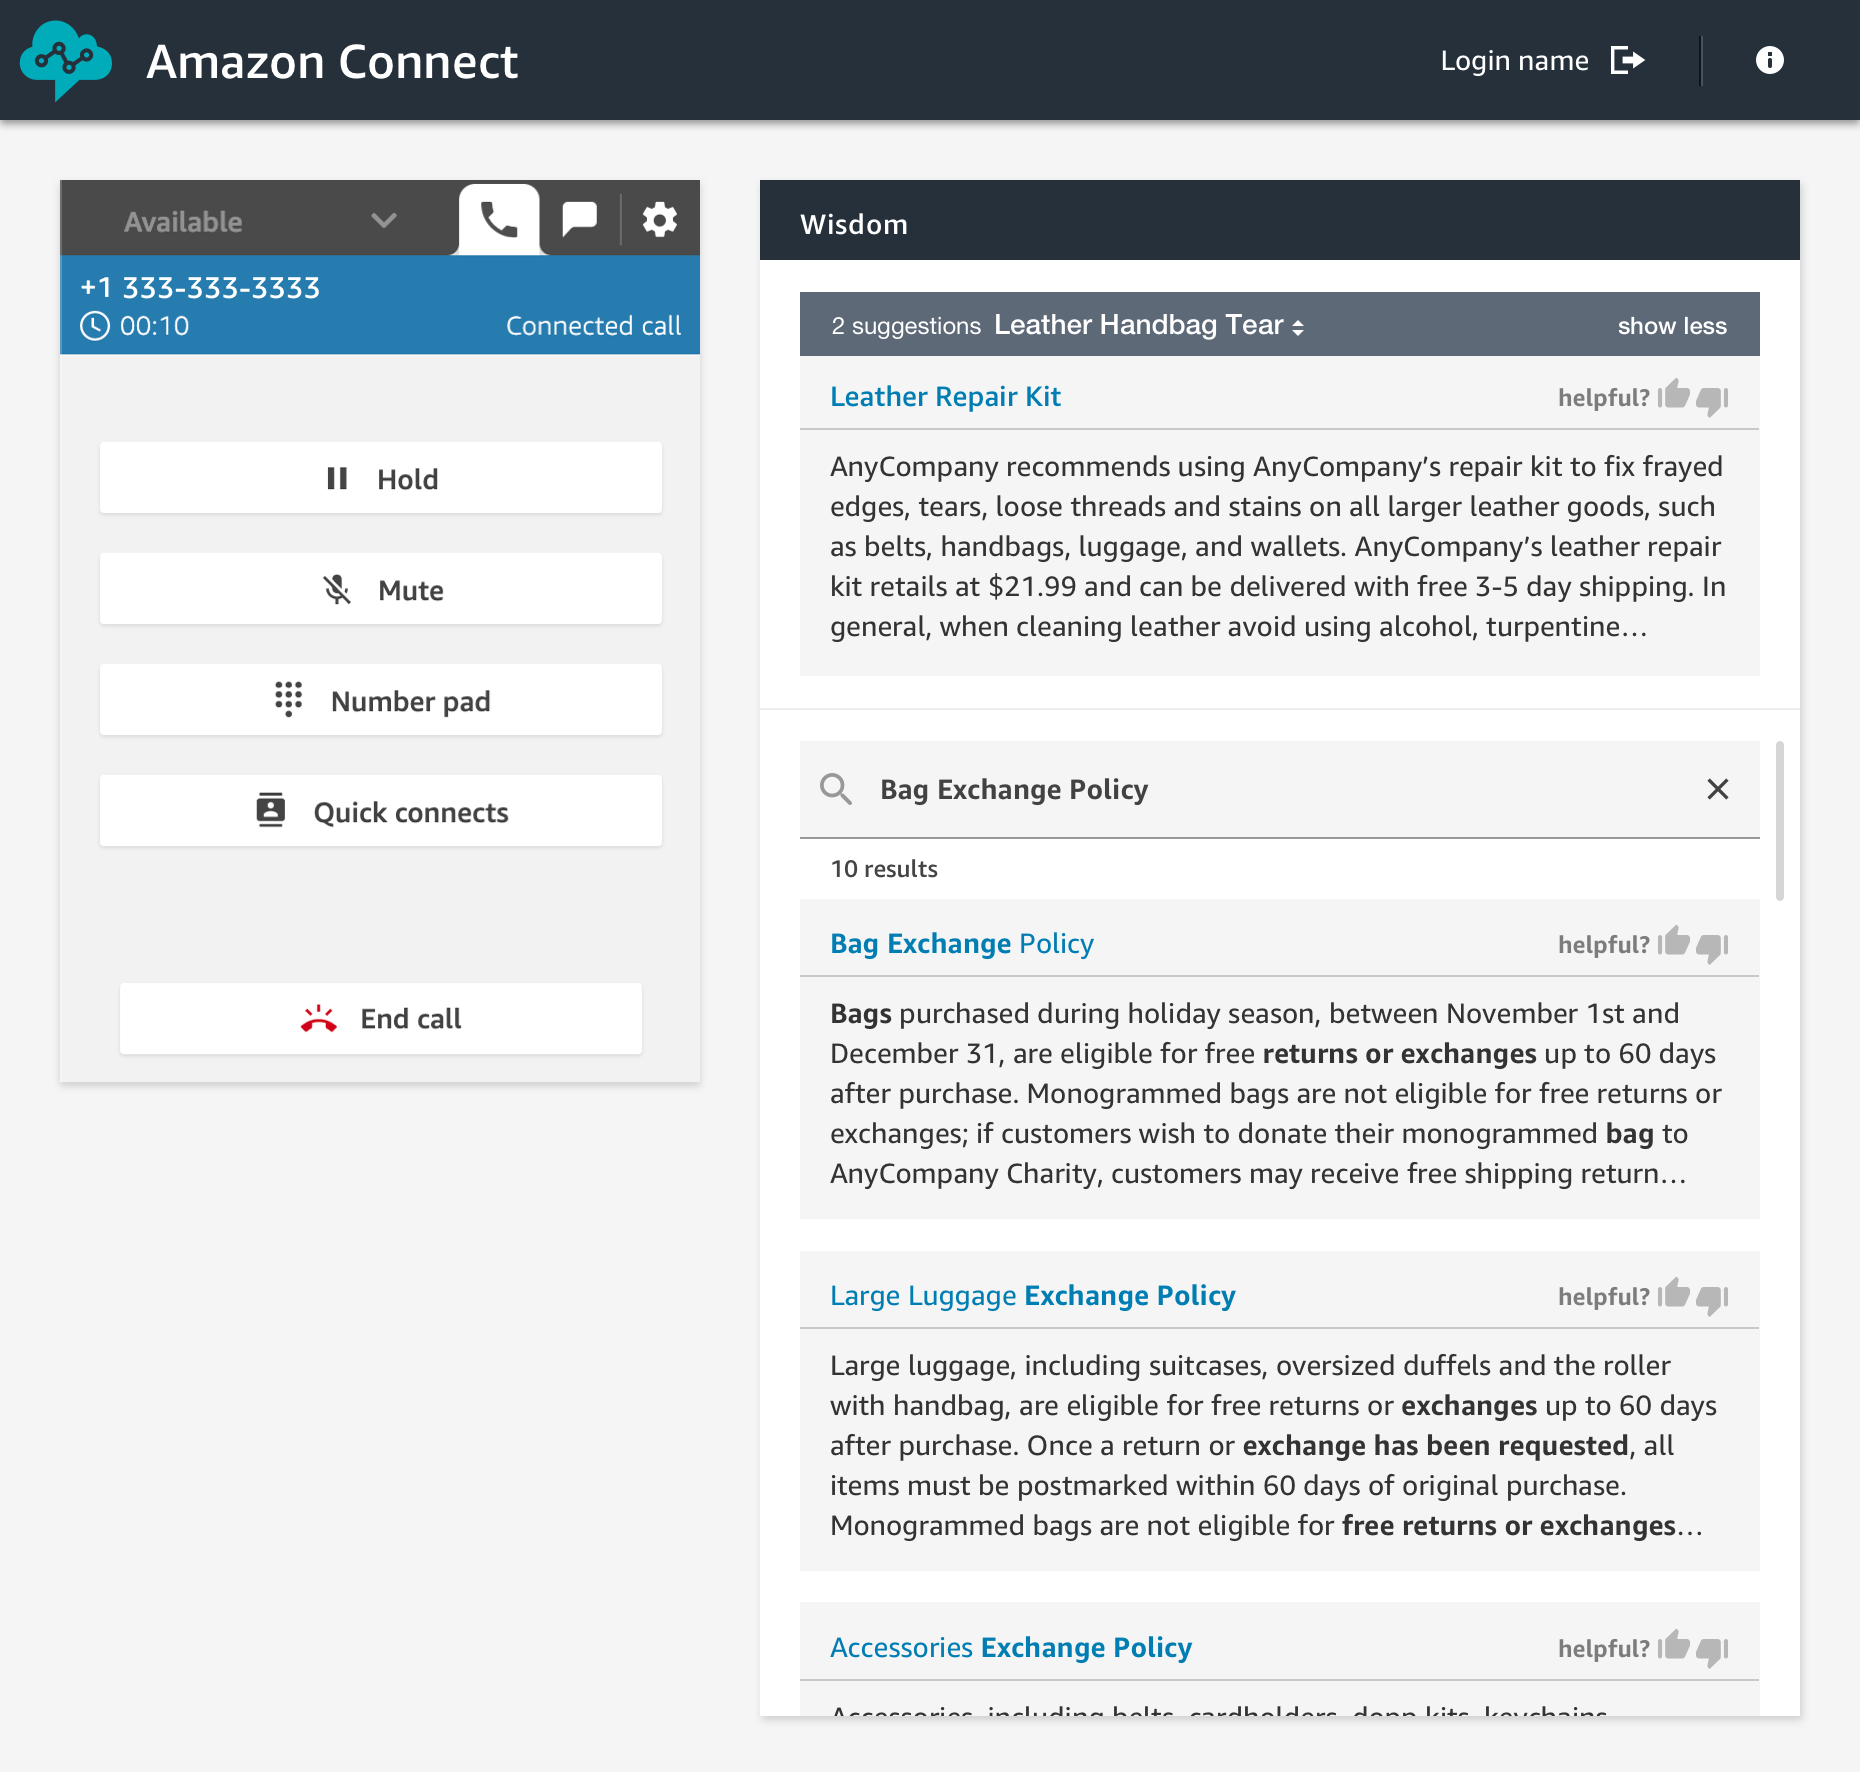
Wisdom provides built-in agent assistance capabilities in Amazon Connect, including machine learning (ML) powered search and real-time recommendations, to quickly enable agents with relevant information for resolving customer issues.

As an agent, I can type questions or phrases in the Wisdom search box, without guessing what keyword I should use. Wisdom understands what information I am searching for. It surfaces results in the agent’s preferred Amazon Connect application, the web-based one we do provide, or the ones you built.

Amazon Connect Wisdom search results

Wisdom comes with pre-built connectors to third-party knowledge repositories to provide most relevant results to agents. Wisdom includes connectors for Salesforce and ServiceNow during the preview, with more to come at launch.

Wisdom may use Contact Lens Real Time analytics to analyse the conversation in real-time. It detects the customer issue, finds related content in the connected repositories, and provides proactive recommendations to help the agent resolve it. For example, Wisdom can detect that a customer is talking about a problem with the handbag they bought last week, recommend an article that describes similar products defect, and provide instructions with a link to the order management application needed to initiate an exchange.

Wisdom is available in preview, you can signup today or visit the launch page.

Amazon Connect Voice ID (Preview)
Amazon Connect Voice ID provides real-time caller authentication which makes voice interactions in contact centers more secure and efficient.

To effectively recognise me as “Sébastien”, Voice ID must learn how I am talking. This is the enrolment phase. Then it compares the sound of my voice with the one enrolled earlier. This is the verification phase.

To meet with personal data protection laws, contact center agents capture my consent to use Voice ID.

During the enrolment phase, Voice ID listens to the call until it has captured 30 seconds of my voice. Then it creates my voiceprint, which uniquely authenticates me. A voiceprint is a mathematical representation that captures unique aspects of an individual’s voice such as speech rhythm, pitch, intonation, and loudness. I do not need to say or repeat any specific phrases to let Voice ID create my voiceprint. Voice ID provides an API that can be used to opt-out a customer.

When I call back in, Voice ID just needs 10 seconds of my voice to authenticate me. My voice can be captured as part of a typical interaction with the Interactive Voice Response (IVR) happening at the start of the call, or when I first start to talk with the agent. For example when I am answering questions, such as “what’s your first and last name?” and “what are you calling about?”, Voice ID uses this audio to generate my voiceprint again. It compares it with the one enrolled earlier. Voice ID then generates an authentication score depending on the confidence of the match. Contact center managers can use this score to create policies in Amazon Connect to let agents see a real-time result (“authenticated” or “not authenticated”) in their web-based application. Agents can then decide to proceed with the call or ask for additional authentication credentials.

Amazon Connect Voice ID is available in preview. You can signup today or visit this launch page.

Amazon Connect Customer Profiles
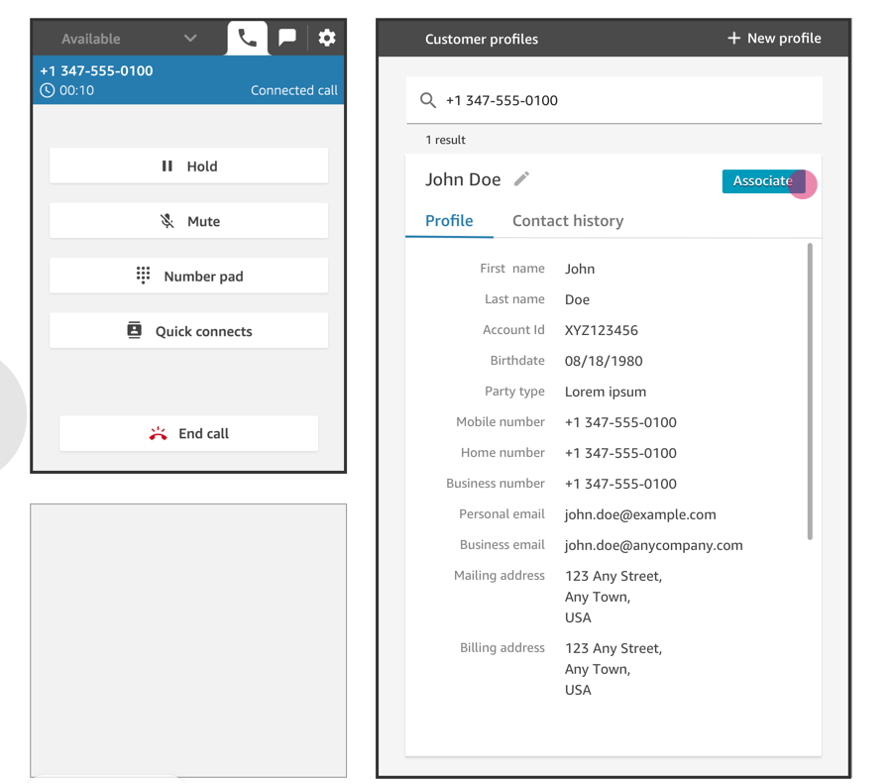
Customer Profiles is a unified profile for Amazon Connect that brings together customer information from disparate sources without having to build integrations or wrangle data.

Providing agents (or automatic IVR systems) with accurate and unified customer profile information at the right moment helps them to deliver better service to customers, and to resolve calls faster. Using Customer Profiles, agents must not navigate out of Amazon Connect, or switch between different applications to get the customer insights they need.

With just a few clicks, System Administrators can integrate customer profile data from applications like Salesforce, ServiceNow, Zendesk, and Marketo to build your own homegrown integration. Setting up connectors for Customer Profiles requires no programming or data integration expertise.

Once enabled, Customer Profiles automatically detects customer records from the applications. It matches and deduplicates them. This results in accurate and up-to-date profiles displayed to agents within their Connect web-based experience.

Amazon Connect Customer Profile

Learn more about Amazon Connect Customer Profile by visiting the launch page.

Amazon Connect Tasks
Amazon Connect Tasks makes it easy to automate, track, and manage contact center agent tasks. It provides a single place for contact center managers to prioritize, assign, and track customer service tasks across the disparate applications used by agents, so that they are focused on the highest priority work of any type.

Tasks can be sourced from third-party applications, such as a CRM solution, or to update a business-specific system. For example, you can programmatically create tasks for agents to follow-up on a customer case in a third party application like Salesforce, or complete an action item in a business-specific application, such as processing a claim in an insurance system. You can also automate tasks that dont require agent interaction, to ensure your agents spend more time focused on customers.

Using Amazon Connect tasks, agents no longer need to switch between applications to know what work should be completed, and with what priority. Agents can see all their assigned tasks right from the Amazon Connect contact control panel, the same web-based application they use to interact with customers over calls and chat. When a task is assigned, the agent receives a notification with the description of the task, and when required, links to any external applications needed to complete the action. Agents can also create tasks so that follow-up work is not forgotten, for example calling a customer back to provide a status update.

Amazon Connect Accept Tasks Amazon Connect View Task Create a task uisng Amazon Connect Tasks
Incoming Tasks Task Details Create a new Task

Amazon Connect Tasks provides pre-built connectors fo Salesforce and Zendesk. With just a few clicks, you can easily set up rules to automatically create tasks based on pre-defined conditions, as sown on the screenshot hereunder. It also provides an API to create tasks from any other application.

Amazon Connect Task Rules

Learn more about how to configure and to get started with Tasks by visiting the launch page.

Available Today
Three of these new capabilities are available today: Contact Lens Real Time, Customer Profiles, and Tasks. You must register to the preview program to test Wisdom and Voice ID.

Customer Profile and Tasks are available in all AWS Regions where Amazon Connect is available : US East (N. Virginia), US East (Ohio), US West (N. California), US West (Oregon), Asia Pacific (Sydney), Asia Pacific (Singapore), Asia Pacific (Tokyo), Europe (Frankfurt), and Europe (London). Contact Lens Real Time is available in US West (Oregon), US East (N. Virginia), and Asia Pacific (Sydney) at the moment. Wisdom is available in US East (N. Virginia) and US West (Oregon) during the preview, while Voice ID is available only in US West (Oregon) during the preview.

With Amazon Connect, you only pay for what you use. There are no required up-front payments, long-term commitments, or minimum monthly fees. The price metrics for these new capabilities are detailed on the Amazon Connect pricing page.

Should you need help adding Amazon Connect any of these capabilities to contact flows, please reach out to one of the dozens of Amazon Connect partners available worldwide.

— seb

New for AWS Lambda – Container Image Support

Post Syndicated from Danilo Poccia original https://aws.amazon.com/blogs/aws/new-for-aws-lambda-container-image-support/

With AWS Lambda, you upload your code and run it without thinking about servers. Many customers enjoy the way this works, but if you’ve invested in container tooling for your development workflows, it’s not easy to use the same approach to build applications using Lambda.

To help you with that, you can now package and deploy Lambda functions as container images of up to 10 GB in size. In this way, you can also easily build and deploy larger workloads that rely on sizable dependencies, such as machine learning or data intensive workloads. Just like functions packaged as ZIP archives, functions deployed as container images benefit from the same operational simplicity, automatic scaling, high availability, and native integrations with many services.

We are providing base images for all the supported Lambda runtimes (Python, Node.js, Java, .NET, Go, Ruby) so that you can easily add your code and dependencies. We also have base images for custom runtimes based on Amazon Linux that you can extend to include your own runtime implementing the Lambda Runtime API.

You can deploy your own arbitrary base images to Lambda, for example images based on Alpine or Debian Linux. To work with Lambda, these images must implement the Lambda Runtime API. To make it easier to build your own base images, we are releasing Lambda Runtime Interface Clients implementing the Runtime API for all supported runtimes. These implementations are available via native package managers, so that you can easily pick them up in your images, and are being shared with the community using an open source license.

We are also releasing as open source a Lambda Runtime Interface Emulator that enables you to perform local testing of the container image and check that it will run when deployed to Lambda. The Lambda Runtime Interface Emulator is included in all AWS-provided base images and can be used with arbitrary images as well.

Your container images can also use the Lambda Extensions API to integrate monitoring, security and other tools with the Lambda execution environment.

To deploy a container image, you select one from an Amazon Elastic Container Registry repository. Let’s see how this works in practice with a couple of examples, first using an AWS-provided image for Node.js, and then building a custom image for Python.

Using the AWS-Provided Base Image for Node.js
Here’s the code (app.js) for a simple Node.js Lambda function generating a PDF file using the PDFKit module. Each time it is invoked, it creates a new mail containing random data generated by the faker.js module. The output of the function is using the syntax of the Amazon API Gateway to return the PDF file.

const PDFDocument = require('pdfkit');
const faker = require('faker');
const getStream = require('get-stream');

exports.lambdaHandler = async (event) => {

    const doc = new PDFDocument();

    const randomName = faker.name.findName();

    doc.text(randomName, { align: 'right' });
    doc.text(faker.address.streetAddress(), { align: 'right' });
    doc.text(faker.address.secondaryAddress(), { align: 'right' });
    doc.text(faker.address.zipCode() + ' ' + faker.address.city(), { align: 'right' });
    doc.moveDown();
    doc.text('Dear ' + randomName + ',');
    doc.moveDown();
    for(let i = 0; i < 3; i++) {
        doc.text(faker.lorem.paragraph());
        doc.moveDown();
    }
    doc.text(faker.name.findName(), { align: 'right' });
    doc.end();

    pdfBuffer = await getStream.buffer(doc);
    pdfBase64 = pdfBuffer.toString('base64');

    const response = {
        statusCode: 200,
        headers: {
            'Content-Length': Buffer.byteLength(pdfBase64),
            'Content-Type': 'application/pdf',
            'Content-disposition': 'attachment;filename=test.pdf'
        },
        isBase64Encoded: true,
        body: pdfBase64
    };
    return response;
};

I use npm to initialize the package and add the three dependencies I need in the package.json file. In this way, I also create the package-lock.json file. I am going to add it to the container image to have a more predictable result.

$ npm init
$ npm install pdfkit
$ npm install faker
$ npm install get-stream

Now, I create a Dockerfile to create the container image for my Lambda function, starting from the AWS provided base image for the nodejs12.x runtime:

FROM amazon/aws-lambda-nodejs:12
COPY app.js package*.json ./
RUN npm install
CMD [ "app.lambdaHandler" ]

The Dockerfile is adding the source code (app.js) and the files describing the package and the dependencies (package.json and package-lock.json) to the base image. Then, I run npm to install the dependencies. I set the CMD to the function handler, but this could also be done later as a parameter override when configuring the Lambda function.

I use the Docker CLI to build the random-letter container image locally:

$ docker build -t random-letter .

To check if this is working, I start the container image locally using the Lambda Runtime Interface Emulator:

$ docker run -p 9000:8080 random-letter:latest

Now, I test a function invocation with cURL. Here, I am passing an empty JSON payload.

$ curl -XPOST "http://localhost:9000/2015-03-31/functions/function/invocations" -d '{}'

If there are errors, I can fix them locally. When it works, I move to the next step.

To upload the container image, I create a new ECR repository in my account and tag the local image to push it to ECR. To help me identify software vulnerabilities in my container images, I enable ECR image scanning.

$ aws ecr create-repository --repository-name random-letter --image-scanning-configuration scanOnPush=true
$ docker tag random-letter:latest 123412341234.dkr.ecr.sa-east-1.amazonaws.com/random-letter:latest
$ aws ecr get-login-password | docker login --username AWS --password-stdin 123412341234.dkr.ecr.sa-east-1.amazonaws.com
$ docker push 123412341234.dkr.ecr.sa-east-1.amazonaws.com/random-letter:latest

Here I am using the AWS Management Console to complete the creation of the function. You can also use the AWS Serverless Application Model, that has been updated to add support for container images.

In the Lambda console, I click on Create function. I select Container image, give the function a name, and then Browse images to look for the right image in my ECR repositories.

Screenshot of the console.

After I select the repository, I use the latest image I uploaded. When I select the image, the Lambda is translating that to the underlying image digest (on the right of the tag in the image below). You can see the digest of your images locally with the docker images --digests command. In this way, the function is using the same image even if the latest tag is passed to a newer one, and you are protected from unintentional deployments. You can update the image to use in the function code. Updating the function configuration has no impact on the image used, even if the tag was reassigned to another image in the meantime.

Screenshot of the console.

Optionally, I can override some of the container image values. I am not doing this now, but in this way I can create images that can be used for different functions, for example by overriding the function handler in the CMD value.

Screenshot of the console.

I leave all other options to their default and select Create function.

When creating or updating the code of a function, the Lambda platform optimizes new and updated container images to prepare them to receive invocations. This optimization takes a few seconds or minutes, depending on the size of the image. After that, the function is ready to be invoked. I test the function in the console.

Screenshot of the console.

It’s working! Now let’s add the API Gateway as trigger. I select Add Trigger and add the API Gateway using an HTTP API. For simplicity, I leave the authentication of the API open.

Screenshot of the console.

Now, I click on the API endpoint a few times and download a few random mails.

Screenshot of the console.

It works as expected! Here are a few of the PDF files that are generated with random data from the faker.js module.

Output of the sample application.


Building a Custom Image for Python
Sometimes you need to use your custom container images, for example to follow your company guidelines or to use a runtime version that we don’t support.

In this case, I want to build an image to use Python 3.9. The code (app.py) of my function is very simple, I just want to say hello and the version of Python that is being used.

import sys
def handler(event, context): 
    return 'Hello from AWS Lambda using Python' + sys.version + '!'

As I mentioned before, we are sharing with you open source implementations of the Lambda Runtime Interface Clients (which implement the Runtime API) for all the supported runtimes. In this case, I start with a Python image based on Alpine Linux. Then, I add the Lambda Runtime Interface Client for Python (link coming soon) to the image. Here’s the Dockerfile:

# Define global args
ARG FUNCTION_DIR="/home/app/"
ARG RUNTIME_VERSION="3.9"
ARG DISTRO_VERSION="3.12"

# Stage 1 - bundle base image + runtime
# Grab a fresh copy of the image and install GCC
FROM python:${RUNTIME_VERSION}-alpine${DISTRO_VERSION} AS python-alpine
# Install GCC (Alpine uses musl but we compile and link dependencies with GCC)
RUN apk add --no-cache \
    libstdc++

# Stage 2 - build function and dependencies
FROM python-alpine AS build-image
# Install aws-lambda-cpp build dependencies
RUN apk add --no-cache \
    build-base \
    libtool \
    autoconf \
    automake \
    libexecinfo-dev \
    make \
    cmake \
    libcurl
# Include global args in this stage of the build
ARG FUNCTION_DIR
ARG RUNTIME_VERSION
# Create function directory
RUN mkdir -p ${FUNCTION_DIR}
# Copy handler function
COPY app/* ${FUNCTION_DIR}
# Optional – Install the function's dependencies
# RUN python${RUNTIME_VERSION} -m pip install -r requirements.txt --target ${FUNCTION_DIR}
# Install Lambda Runtime Interface Client for Python
RUN python${RUNTIME_VERSION} -m pip install awslambdaric --target ${FUNCTION_DIR}

# Stage 3 - final runtime image
# Grab a fresh copy of the Python image
FROM python-alpine
# Include global arg in this stage of the build
ARG FUNCTION_DIR
# Set working directory to function root directory
WORKDIR ${FUNCTION_DIR}
# Copy in the built dependencies
COPY --from=build-image ${FUNCTION_DIR} ${FUNCTION_DIR}
# (Optional) Add Lambda Runtime Interface Emulator and use a script in the ENTRYPOINT for simpler local runs
COPY https://github.com/aws/aws-lambda-runtime-interface-emulator/releases/latest/download/aws-lambda-rie /usr/bin/aws-lambda-rie
RUN chmod 755 /usr/bin/aws-lambda-rie
COPY entry.sh /
ENTRYPOINT [ "/entry.sh" ]
CMD [ "app.handler" ]

The Dockerfile this time is more articulated, building the final image in three stages, following the Docker best practices of multi-stage builds. You can use this three-stage approach to build your own custom images:

  • Stage 1 is building the base image with the runtime, Python 3.9 in this case, plus GCC that we use to compile and link dependencies in stage 2.
  • Stage 2 is installing the Lambda Runtime Interface Client and building function and dependencies.
  • Stage 3 is creating the final image adding the output from stage 2 to the base image built in stage 1. Here I am also adding the Lambda Runtime Interface Emulator, but this is optional, see below.

I create the entry.sh script below to use it as ENTRYPOINT. It executes the Lambda Runtime Interface Client for Python. If the execution is local, the Runtime Interface Client is wrapped by the Lambda Runtime Interface Emulator.

#!/bin/sh
if [ -z "${AWS_LAMBDA_RUNTIME_API}" ]; then
    exec /usr/bin/aws-lambda-rie /usr/local/bin/python -m awslambdaric
else
    exec /usr/local/bin/python -m awslambdaric
fi

Now, I can use the Lambda Runtime Interface Emulator to check locally if the function and the container image are working correctly:

$ docker run -p 9000:8080 lambda/python:3.9-alpine3.12

Not Including the Lambda Runtime Interface Emulator in the Container Image
It’s optional to add the Lambda Runtime Interface Emulator to a custom container image. If I don’t include it, I can test locally by installing the Lambda Runtime Interface Emulator in my local machine following these steps:

  • In Stage 3 of the Dockerfile, I remove the commands copying the Lambda Runtime Interface Emulator (aws-lambda-rie) and the entry.sh script. I don’t need the entry.sh script in this case.
  • I use this ENTRYPOINT to start by default the Lambda Runtime Interface Client:
    ENTRYPOINT [ "/usr/local/bin/python", “-m”, “awslambdaric” ]
  • I run these commands to install the Lambda Runtime Interface Emulator in my local machine, for example under ~/.aws-lambda-rie:
mkdir -p ~/.aws-lambda-rie
curl -Lo ~/.aws-lambda-rie/aws-lambda-rie https://github.com/aws/aws-lambda-runtime-interface-emulator/releases/latest/download/aws-lambda-rie
chmod +x ~/.aws-lambda-rie/aws-lambda-rie

When the Lambda Runtime Interface Emulator is installed on my local machine, I can mount it when starting the container. The command to start the container locally now is (assuming the Lambda Runtime Interface Emulator is at ~/.aws-lambda-rie):

docker run -d -v ~/.aws-lambda-rie:/aws-lambda -p 9000:8080 \
       --entrypoint /aws-lambda/aws-lambda-rie lambda/python:3.9-alpine3.12
       /lambda-entrypoint.sh app.handler

Testing the Custom Image for Python
Either way, when the container is running locally, I can test a function invocation with cURL:

curl -XPOST "http://localhost:9000/2015-03-31/functions/function/invocations" -d '{}'

The output is what I am expecting!

"Hello from AWS Lambda using Python3.9.0 (default, Oct 22 2020, 05:03:39) \n[GCC 9.3.0]!"

I push the image to ECR and create the function as before. Here’s my test in the console:

Screenshot of the console.

My custom container image based on Alpine is running Python 3.9 on Lambda!

Available Now
You can use container images to deploy your Lambda functions today in US East (N. Virginia), US East (Ohio), US West (Oregon), Asia Pacific (Tokyo), Asia Pacific (Singapore), Europe (Ireland), Europe (Frankfurt), South America (São Paulo). We are working to add support in more Regions soon. The container image support is offered in addition to ZIP archives and we will continue to support the ZIP packaging format.

There are no additional costs to use this feature. You pay for the ECR repository and the usual Lambda pricing.

You can use container image support in AWS Lambda with the console, AWS Command Line Interface (CLI), AWS SDKs, AWS Serverless Application Model, and solutions from AWS Partners, including Aqua Security, Datadog, Epsagon, HashiCorp Terraform, Honeycomb, Lumigo, Pulumi, Stackery, Sumo Logic, and Thundra.

This new capability opens up new scenarios, simplifies the integration with your development pipeline, and makes it easier to use custom images and your favorite programming platforms to build serverless applications.

Learn more and start using container images with AWS Lambda.

Danilo

Preview: AWS Proton – Automated Management for Container and Serverless Deployments

Post Syndicated from Alex Casalboni original https://aws.amazon.com/blogs/aws/preview-aws-proton-automated-management-for-container-and-serverless-deployments/

Today, we are excited to announce the public preview of AWS Proton, a new service that helps you automate and manage infrastructure provisioning and code deployments for serverless and container-based applications.

Maintaining hundreds – or sometimes thousands – of microservices with constantly changing infrastructure resources and configurations is a challenging task for even the most capable teams.

AWS Proton enables infrastructure teams to define standard templates centrally and make them available for developers in their organization. This allows infrastructure teams to manage and update infrastructure without impacting developer productivity.

How AWS Proton Works
The process of defining a service template involves the definition of cloud resources, continuous integration and continuous delivery (CI/CD) pipelines, and observability tools. AWS Proton will integrate with commonly used CI/CD pipelines and observability tools such as CodePipeline and CloudWatch. It also provides curated templates that follow AWS best practices for common use cases such as web services running on AWS Fargate or stream processing apps built on AWS Lambda.

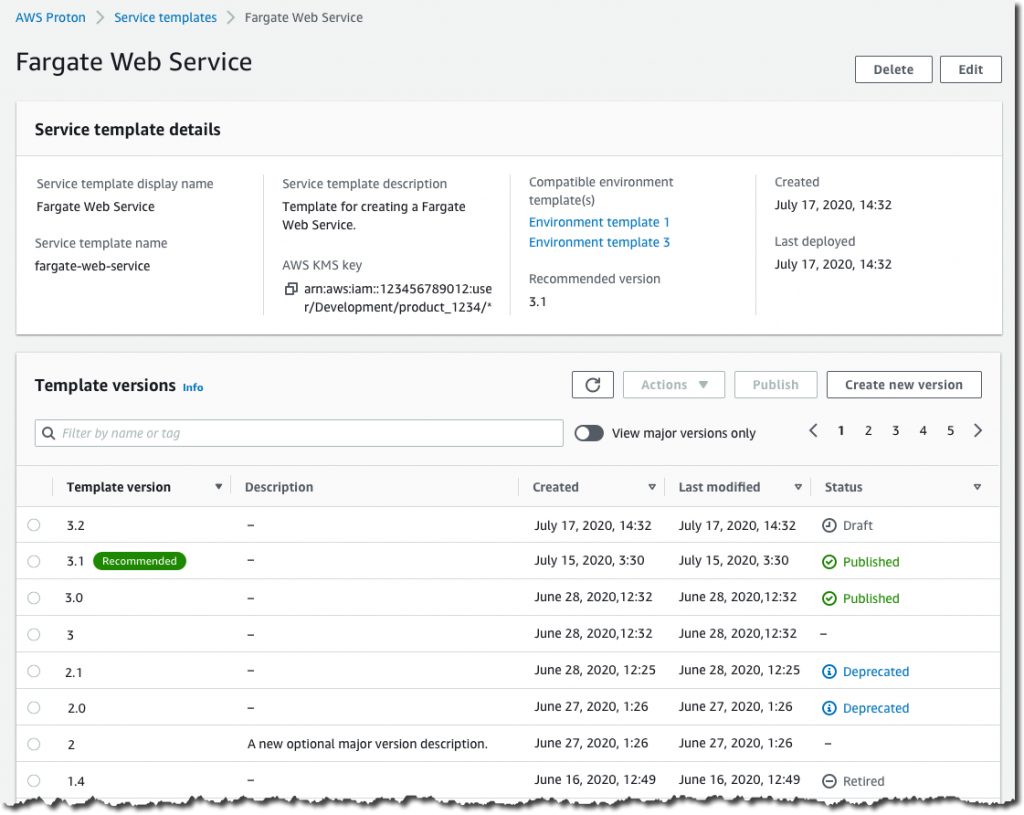
Infrastructure teams can visualize and manage the list of service templates in the AWS Management Console.

This is what the list of templates looks like.

AWS Proton also collects information about the deployment status of the application such as the last date it was successfully deployed. When a template changes, AWS Proton identifies all the existing applications using the old version and allows infrastructure teams to upgrade them to the most recent definition, while monitoring application health during the upgrade so it can be rolled-back in case of issues.

This is what a service template looks like, with its versions and running instances.

Once service templates have been defined, developers can select and deploy services in a self-service fashion. AWS Proton will take care of provisioning cloud resources, deploying the code, and health monitoring, while providing visibility into the status of all the deployed applications and their pipelines.

This way, developers can focus on building and shipping application code for serverless and container-based applications without having to learn, configure, and maintain the underlying resources.

This is what the list of deployed services looks like.

Available in Preview
AWS Proton is now available in preview in US East (N. Virginia), US East (Ohio), US West (Oregon), Asia Pacific (Tokyo), and Europe (Ireland); it’s free of charge, as you only pay for the underlying services and resources. Check out the technical documentation.

You can get started using the AWS Management Console here.

Alex

New for AWS Lambda – Functions with Up to 10 GB of Memory and 6 vCPUs

Post Syndicated from Danilo Poccia original https://aws.amazon.com/blogs/aws/new-for-aws-lambda-functions-with-up-to-10-gb-of-memory-and-6-vcpus/

AWS Lambda runs your code on an highly available and scalable compute infrastructure so that you can focus on what you want to build. Do you want to get the advantages of Lambda for workloads that are memory or computationally intensive? Wait no more!

Starting today, you can allocate up to 10 GB of memory to a Lambda function. This is more than a 3x increase compared to previous limits. Lambda allocates CPU and other resources linearly in proportion to the amount of memory configured. That means you can now have access to up to 6 vCPUs in each execution environment. In this way, your multithreaded and multiprocess applications run faster. Since Lambda charges are proportional to memory configured and function duration (GB-seconds), the additional costs for using more memory may be offset by lower duration. I have more on this in the example below.

With more memory and CPU power, and support for the AVX2 instruction set, new use cases — such as machine learning applications; batch and extract, transform, load (ETL) jobs; modelling; genomics; gaming; high-performance computing (HPC); and media processing — become easier to implement and scale with Lambda functions.

Let’s see how this works in practice!

Lambda Function Performance as Memory Increases
When I first wrote about the capability of mounting a shared Amazon Elastic File System (EFS) for Lambda functions, one of the examples I used was a function doing machine learning inference to classify images of birds. The function is using PyTorch to run the inference, applying a pre-trained machine learning model.

Now, I can execute the same function in the updated Lambda execution environment. Let’s see how increasing memory affects the duration of the function. Here are the results of using memory configurations between 1 and 10 GB. To get these numbers, I ran 20 invocations for each memory configuration. Then, I computed the average duration, discarding function initializations. To avoid possible outliers, I also excluded from the average the top and bottom 10% of reported durations. Based on the results, I estimated the charges I would have for 1 million invocations with each configuration.

Graph showing Function Duration and Charges for 1M Invocations as Memory Increases

As you can see, the function is able to use the additional CPU power that comes with more memory, decreasing the duration of the invocations. What is interesting is the impact of increasing memory on my costs.

Lambda charges are related to memory and duration, so if I increase memory and this is reducing duration by the same proportion, the overall charges are about the same. For example, looking at the graph above, when I configure 5 GB of memory, I have the same costs as when I have 1 GB of memory (about $61 for one million invocations), but the function is 5x faster. If I need lower latency, I can increase memory up to 10 GB, where the function is 7.6x faster and I pay a little more ($80 for one million invocations).

Depending on your code and business case, you can find out which memory configuration gives the optimal trade-off between cost and performance. To help you with that, my colleague and friend Alex Casalboni started the AWS Lambda Power Tuning project to help you optimize your Lambda functions in a data-driven way. This open source tool is really useful and has been improved by the support of many contributors. Give it a try!

In my tests, PyTorch is also using the optimizations of the Advanced Vector Extensions 2 (AVX2) instruction set, now available in the Lambda execution environment. With the AVX2 instruction set, the processor allows running a certain set of operations simultaneously. This is extremely beneficial for applications with operations that can run in parallel such as matrix multiplication. As a result, using AVX2 can improve performance by increasing CPU throughput per cycle. This typically helps compute intensive workloads such as machine learning inference, multimedia processing, scientific simulations, and financial modeling applications.

Available Now
AWS Lambda support for larger functions is available in Africa (Cape Town), Asia Pacific (Mumbai), Asia Pacific (Seoul), Asia Pacific (Singapore), Asia Pacific (Sydney), Asia Pacific (Tokyo), Canada (Central), EU (Frankfurt), EU (Ireland), EU (London), EU (Milano), EU (Paris), EU (Stockholm), South America (Sao Paulo), US East (N. Virginia), US East (Ohio), US West (N. California), US West (Oregon).

You can configure up to 10 GB of memory for new or existing Lambda functions using the AWS Management Console, AWS Command Line Interface (CLI), AWS SDKs, and Serverless Application Model.

Here’s a snapshot of the new console experience. We replaced the slider with a field, and you can now configure memory in 1 MB increments (it was 64MB increments before). In this way, the console works similarly to the Lambda API that always accepted memory configurations with 1MB granularity.

There is no change in Lambda pricing, you pay for requests and usage, with duration and Provisioned Concurrency charged at a rate proportional to the amount of memory configured.

Start using Lambda functions with up to 10 GB of memory and 6 vCPUs today.

Danilo

New for AWS Lambda – 1ms Billing Granularity Adds Cost Savings

Post Syndicated from Danilo Poccia original https://aws.amazon.com/blogs/aws/new-for-aws-lambda-1ms-billing-granularity-adds-cost-savings/

What I like about AWS Lambda is that it lets you run code without provisioning or managing servers, and you pay only for what you use. Since we launched Lambda in 2014, you have been charged for the number of times your code is triggered (requests) and for the time your code executes, rounded up to the nearest 100ms (duration).

Starting today, we are rounding up duration to the nearest millisecond with no minimum execution time.

With this new pricing, you are going to pay less most of the time, but it’s going to be more noticeable when you have functions whose execution time is much lower than 100ms, such as low latency APIs.

For example, let’s look at a simple web app that I have running. In the Amazon CloudWatch Logs, for each invocation there is a REPORT line. To improve readability, I am breaking the REPORT line into three lines here:

REPORT RequestId: 35a7e0cb-4902-490d-b8d3-eb315dded660
Duration: 27.40 ms  Billed Duration: 100 ms Memory Size: 1024 MB  Max Memory Used: 472 MB

With 1ms billing granularity that becomes:

REPORT RequestId: a24d03b5-429d-4ca3-a490-878a52a0182f
Duration: 27.55 ms  Billed Duration: 28 ms Memory Size: 1024 MB  Max Memory Used: 472 MB

My application doesn’t have a lot of traffic, so let’s do a simple production scenario. Let’s say I have 100,000 users for a web/mobile app. I expect each user to call this function via the web/mobile app about 20 times per day. The duration of those invocations is on average 28ms. Each month, I should expect:

  • 100,000 users * 20 invocations * 30 days = 60 million invocations.

Let’s estimate the costs in US East (N. Virginia). For simplicity, I am not considering the Lambda free tier.

The Lambda monthly request charges are unchanged:

  • 60 million invocations * $0.20 per 1M requests = $12

To that, I have to add compute charges based on duration.

The Lambda monthly compute charges with the old 100ms rounded up pricing would have been:

  • 60 million invocations* 100ms * 1G memory * $0.0000166667 for every GB-second = $100

With the new 1ms billing granularity, the duration costs are:

  • 60 million invocations * 28ms * 1G memory * $0.0000166667 for every GB-second = $28

For this scenario, overall costs including request and compute charges are much cheaper ($40) than before ($112).

With this pricing, there is now more of an incentive to optimize the duration of functions even if it is already well below 100ms. Your engineering efforts can reduce costs even more.

If you increase memory to get more CPU power and speed up your functions, you now get the benefit of a lower billed duration below 100ms as well. That means that increasing performance and reducing latency is going to be cheaper than before.

We are applying 1ms billing granularity for duration, including when you have Provisioned Concurrency enabled, in all AWS Regions with the exception of those based in China starting with the December 2020 billing period. Regions in China will get the change from January.

Enjoy the new pricing!

Danilo

Amazon Elastic Container Registry Public: A New Public Container Registry

Post Syndicated from Martin Beeby original https://aws.amazon.com/blogs/aws/amazon-ecr-public-a-new-public-container-registry/

In November, we announced that we intended to create a public container registry, and today at AWS re:Invent, we followed through on that promise and launched Amazon Elastic Container Registry Public (ECR Public).

ECR Public allows you to store, manage, share, and deploy container images for anyone to discover and download globally. You have long been able to host private container images on AWS with Amazon Elastic Container Registry, and now with the release of ECR Public, you can host public ones too, enabling anyone (with or without an AWS account) to browse and pull your published container artifacts.

As part of the announcement, a new website allows you to browse and search for public container images, view developer provided details, and discover the commands you need to pull containers.

If you check the website out now, you will see we have hosted some of our container images on the registry, including including the Amazon EKS Distro images. We also have hundreds of images from partners such as Bitnami, Canonical and HashiCorp.

Publishing A Container
Before I can upload a container, I need to create a repository. There is now a Public tab in the Repositories section of the Elastic Container Registry console. In this tab, I click the button Create repository.

I am taken to the Create repository screen, where I select that I would like the repository to be public.

I give my repository the name news-blog and upload a logo that will be used on the gallery details page. I provide a description and select Linux as the Content type, There is also an option to select the CPU architectures that the image supports, if you have a multi-architecture image you can select more than one architecture type. The content types are used for filtering on the gallery website, this will enable people using the gallery to filter their searches by architecture and operating system support.

I enter some markdown in the About section. The text I enter here will be displayed on the gallery page and would ordinarily explain what’s included in the repository, any licensing details, or other relevant information. There is also a Usage section where I enter some sample text to explain how to use my image and that I created the repository for a demo. Finally, I click Create repository.

Back at the repository page, I now have one public repository. There is also a button that says View push commands. I click on this so I can learn more about how to push containers to the repository.

I follow the four steps contained in this section. The first step helps me authenticate with ECR Public so that I can push containers to my repository. Steps two, three, and four show me how to build, tag, and push my container to ECR Public.

The application that I have containerized is a simple app that runs and outputs a terminal message. I use the docker CLI to push my container to my repository, it’s quite a small container, so it only takes a minute or two.

Once complete, I head over to the ECR Public gallery and can see that my image is now publicly available for anyone to pull.

Pulling A Container
You pull containers from ECR Public using the familiar docker pull command with the URL of the image.

You can easily find this URL on the ECR Public website, where the image URL is displayed along with other published information. Clicking on the URL copies the image URL to your clipboard for an easy copy-paste.

ECR Public image URLs are in the format public.ecr.aws/<namespace>/<image>:<tag>

For example, if I wanted to pull the image I uploaded earlier, I would open my terminal and run the following command (please note: you will need docker installed locally to run these commands).

docker pull public.ecr.aws/r6g9m2o3/news-blog:latest

I have now download the Docker Image onto my machine, and I can run the container using the following command:

docker run public.ecr.aws/r6g9m2o3/news-blog:latest

My application runs and writes a message from Jeff Barr. If you are wondering about the switches and parameters I have used on my docker run command, it’s to make sure that the log is written in color because we wouldn’t want to miss out on Jeff’s glorious purple hair.

Nice to Know
ECR Public automatically replicates container images across two AWS Regions to reduce download times and improve availability. Therefore, using public images directly from ECR Public may simplify your build process if you were previously creating and managing local copies. ECR Public caches image layers in Amazon CloudFront, to improve pull performance for a global audience, especially for popular images.

ECR Public also has some nice integrations that will make working with containers easier on AWS. For example, ECR Public will automatically notify services such as AWS CodeBuild to rebuild an application when a public container image changes.

Pricing
All AWS customers will get 50 GB of free storage each month, and if you exceed that limit, you will pay nominal charges. Check out the pricing page for details.

Anyone who pulls images anonymously will get 500 GB of free data bandwidth each month, after which they can sign up or sign in to an AWS account to get more. Simply authenticating with an AWS account increases free data bandwidth up to 5 TB each month when pulling images from the internet.

Finally, workloads running in AWS will get unlimited data bandwidth from any region when pulling publicly shared images from ECR Public.

Verification and Namespaces
You can create a custom namespace such as your organization or project name to be used in a ECR Public URL subdomain unless it’s a reserved namespace. Namespaces such as sagemaker and eks that identify AWS services are reserved. Namespaces that identify AWS Marketplace sellers are also reserved.

Available Today
ECR Public is available today and you can find out more over on the product page. Visit the gallery to explore and use available public container software and log into the ECR Console to share containers publicly.

Happy Containerizing!

— Martin

Coming Soon – Amazon EC2 G4ad Instances Featuring AMD GPUs for Graphics Workloads

Post Syndicated from Steve Roberts original https://aws.amazon.com/blogs/aws/new-amazon-ec2-g4ad-instances-featuring-amd-gpus-for-graphics-workloads/

Customers with high performance graphic workloads, such as game streaming, animation, and video rendering for example, are always looking for higher performance with less cost. Today, I’m happy to announce new Amazon Elastic Compute Cloud (EC2) instances in the G4 instance family are in the works and will be available soon, to improve performance and reduce cost for graphics-intensive workloads. The new G4ad instances feature AMD’s latest Radeon Pro V520 GPUs and 2nd generation EPYC processors, and are the first in EC2 to feature AMD GPUs.

G4dn instances, released in 2019 and featuring NVIDIA T4 GPUs, were previously the most cost-effective GPU-based instances in EC2. G4dn instances are ideal for deploying machine learning models in production and also graphics-intensive applications. However, when compared to G4dn the new G4ad instances enable up to 45% better price performance for graphics-intensive workloads, including the aforementioned game streaming, remote graphics workstations, and rendering scenarios. Compared to an equally-sized G4dn instance, G4ad instances offer up to 40% improvement in performance.

G4dn instances will continue to be the best option for small-scale machine learning (ML) training and GPU-based ML inference due to included hardware optimizations like Tensor Cores. Additionally, G4dn instances are still best suited for graphics applications that need access to NVIDIA libraries such as CUDA, CuDNN, and NVENC. However, when there is no dependency on NVIDIA’s libraries, we recommend customers try the G4ad instances to benefit from the improved price and performance.

AMD Radeon Pro V520 GPUs in G4ad instances support DirectX 11/12, Vulkan 1.1, and OpenGL 4.5 APIs. For operating systems, customers can choose from Windows Server 2016/2019, Amazon Linux 2, Ubuntu 18.04.3, and CentOS 7.7. Instances using G4ad can be purchased as On-Demand, Savings Plan, Reserved Instances, or Spot Instances. Three instance sizes are available, from G4ad.4xlarge, with 1 GPU, to G4ad.16xlarge with 4 GPUs, as shown below.

Instance Size GPUs GPU Memory (GB) vCPUs Memory (GB) Storage EBS Bandwidth (Gbps) Network Bandwidth (Gbps)
g4ad.4xlarge 1 8 16 64 600 Up to 3 Up to 10
g4ad.8xlarge 2 16 32 128 1200 3 15
g4ad.16xlarge 4 32 64 256 2400 6 25

The new G4ad instances will be available soon in US East (N. Virginia), US West (Oregon), and Europe (Ireland).

Learn more about G4ad instances.

— Steve

Coming Soon – EC2 C6gn Instances – 100 Gbps Networking with AWS Graviton2 Processors

Post Syndicated from Danilo Poccia original https://aws.amazon.com/blogs/aws/coming-soon-ec2-c6gn-instances-100-gbps-networking-with-aws-graviton2-processors/

Based on the amazing feedback from customers such as Snap, NextRoll, Intuit, SmugMug, and Honeycomb who are running their workloads on Amazon Elastic Compute Cloud (EC2) instances powered by AWS Graviton2, today we are announcing an addition to our broad Arm-based Graviton2 portfolio with C6gn instances that deliver up to 100 Gbps network bandwidth, up to 38 Gbps Amazon Elastic Block Store (EBS) bandwidth, up to 40% higher packet processing performance, and up to 40% better price/performance versus comparable current generation x86-based network optimized instances.

Compared to C6g instances, this new instance type provides 4x higher network bandwidth, 4x higher packet processing performance, and 2x higher EBS bandwidth. This means that customers with workloads that need high networking bandwidth such as high performance computing (HPC), network appliance, real-time video communications, and data analytics, will be able to bring their biggest and most challenging applications to Arm and take advantage of the performance and cost-optimization.

C6gn instances will be available in 8 sizes:

Name vCPUs Memory
(GiB)
Network Bandwidth
(Gbps)
EBS Throughput
(Gbps)
c6gn.medium 1 2 Up to 25 Up to 9.5
c6gn.large 2 4 Up to 25 Up to 9.5
c6gn.xlarge 4 8 Up to 25 Up to 9.5
c6gn.2xlarge 8 16 Up to 25 Up to 9.5
c6gn.4xlarge 16 32 25 9.5
c6gn.8xlarge 32 64 50 19
c6gn.12xlarge 48 96 75 28.5
c6gn.16xlarge 64 128 100 38

The new instances are built on the AWS Nitro System, a collection of AWS-designed hardware and software innovations that maximize resource efficiency. C6gn instances support Elastic Fabric Adapter (EFA) on the c6gn.16xlarge sizes for workloads that can take advantage of lower network latency (such as HPC and video processing) and use Message Passing Interface (MPI) for highly scalable clusters. These new instances also fully support network frameworks like Data Plane Development Kit (DPDK), making it easier to migrate network appliance workloads.

Coming Soon
EC2 C6gn instances will be available later this month and make it easier to optimize costs for HPC and workloads that require high network bandwidth and low latency. Let me know what you are going to build with them!

To get practice with the AWS Graviton2 architecture, you can try t4g.micro instances for free for up to 750 hours per month until March 31st, 2021.

Learn more about EC2 C6gn instances today.

Danilo

AWS On Air – re:Invent Weekly Streaming Schedule

Post Syndicated from Nicholas Walsh original https://aws.amazon.com/blogs/aws/reinvent-2020-streaming-schedule/

Last updated: 11:00 am (PST), November 30

Join AWS On Air throughout re:Invent (Dec 1 – Dec 17) for daily livestreams with news, announcements, demos, and interviews with experts across industry and technology. To get started, head over to register for re:Invent. Then, after Andy Jassy’s keynote (Tuesday, Dec 1 at 8-11 am PST) check back here for the latest livestreams and where to tune-in.

Time (PST) Tuesday 12/1 Wednesday 12/2 Thursday (12/3) 12/3
12:00 AM
1:00 AM
2:00 AM Daily Recap (Italian) Daily Recap (Italian)
3:00 AM Daily Recap (German) Daily Recap (German)
4:00 AM Daily Recap (French) Daily Recap (French)
5:00 AM
6:00 AM Daily Recap
(Portuguese)
7:00 AM Daily Recap (Spanish)
8:00 AM
9:00 AM
9:30 AM
10:00 AM AWS What’s Next AWS What’s Next
10:30 AM AWS What’s Next AWS What’s Next
11:00 AM Voice of the Customer AWS What’s Next
11:30 AM Keynoteworthy Voice of the Customer Keynoteworthy
12:00 PM
12:30 PM
1:00 PM Industry Live Session – Energy AWS What’s Next
1:30 PM
2:00 PM AWS What’s Next AWS What’s Next AWS What’s Next
2:30 PM AWS What’s Next AWS What’s Next AWS What’s Next
3:00 PM Howdy Partner Howdy Partner
3:30 PM This Is My
Architecture
All In The Field This Is My
Architecture
4:00 PM
4:30 PM AWS What’s Next
5:00 PM Daily Recap (English) Daily Recap (English) Daily Recap (English)
5:30 PM Certification Quiz
Show
Certification Quiz
Show
Certification Quiz
Show
6:00 PM Industry Live
Sessions
Industry Live
Sessions
6:30 PM
7:00 PM Daily Recap
(Japanese)
Daily Recap
(Japanese)
Daily Recap
(Japanese)
8:00 PM Daily Recap (Korean) Daily Recap (Korean) Daily Recap (Korean)
9:00 PM
10:00 PM Daily Recap
(Cantonese)
Daily Recap
(Cantonese)
Daily Recap
(Cantonese)
11:00 PM

Show synopses

AWS What’s Next. Dive deep on the latest launches from re:Invent with AWS Developer Advocates and members of the service teams. See demos and get your questions answered live during the show.

Keynoteworthy. Join hosts Robert Zhu and Nick Walsh after each re:Invent keynote as they chat in-depth on the launches and announcements.

AWS Community Voices. Join us each Thursday at 11:00AM (PST) during re:Invent to hear from AWS community leaders who will share their thoughts on re:Invent and answer your questions live!

Howdy Partner. Howdy Partner highlights AWS Partner Network (APN) Partners so you can build with new tools and meet the people behind the companies. Experts and newcomers alike can learn how AWS Partner solutions enable you to drive faster results and how to pick the right tool when you need it.

re:Invent Recaps. Tune in for daily and weekly recaps about all things re:Invent—the greatest launches, events, and more! Daily recaps are available Tuesday through Thursday in English and Wednesday through Friday in Japanese, Korean, Italian, Spanish, French, and Portuguese. Weekly recaps are available Thursday in English.

This Is My Architecture.Designed for a technical audience, this popular series highlights innovative architectural solutions from customers and AWS Partners. Our hosts, Adrian DeLuca, Aarthi Raju, and Boaz Ziniman, will showcase the most interesting and creative elements of each architecture. #thisismyarchitecture

All in the Field: AWS Agriculture Live. Our expert AgTech hosts Karen Hildebrand and Matt Wolff review innovative applications that bring food to your table using AWS technology. They are joined by industry guests who walk through solutions from under the soil to low-earth-orbit satellites. #allinthefield

IoT All the Things: Special Projects Edition. Join expert hosts Erin McGill and Tim Mattison as they showcase exploratory “side projects” and early stage use cases from guest solution architects. These episodes let developers and IT professionals at any level jump in and experiment with AWS services in a risk-free environment. #alltheexperiments

Certification Quiz Show. Test your AWS knowledge on our fun, interactive AWS Certification Quiz Show! Each episode covers a different area of AWS knowledge that is ideal for preparing for AWS Certification. We also deep-dive into how best to gain AWS skills and how to become AWS Certified.

AWS Industry Live. Join AWS Industry Live for a comprehensive look into 14 different industries. Attendees will get a chance to join industry experts for a year in review, a review of common use cases, and learning about customer success stories from 2020.

Voice of the Customer. Tune in for one-on-one interviews with AWS industry customers to learn about their AWS journey, the technology that powers their products, and the innovation they are bringing to their industry.

re:Invent 2020 Liveblog: Andy Jassy Keynote

Post Syndicated from Jeff Barr original https://aws.amazon.com/blogs/aws/reinvent-2020-liveblog-andy-jassy-keynote/

I’m always ready to try something new! This year, I am going to liveblog Andy Jassy‘s AWS re:Invent keynote address, which takes place from 8 a.m. to 11 a.m. on Tuesday, December 1 (PST). I’ll be updating this post every couple of minutes as I watch Andy’s address from the comfort of my home office. Stay tuned!

Jeff;


Introducing Amazon Managed Workflows for Apache Airflow (MWAA)

Post Syndicated from Danilo Poccia original https://aws.amazon.com/blogs/aws/introducing-amazon-managed-workflows-for-apache-airflow-mwaa/

As the volume and complexity of your data processing pipelines increase, you can simplify the overall process by decomposing it into a series of smaller tasks and coordinate the execution of these tasks as part of a workflow. To do so, many developers and data engineers use Apache Airflow, a platform created by the community to programmatically author, schedule, and monitor workflows. With Airflow you can manage workflows as scripts, monitor them via the user interface (UI), and extend their functionality through a set of powerful plugins. However, manually installing, maintaining, and scaling Airflow, and at the same time handling security, authentication, and authorization for its users takes much of the time you’d rather use to focus on solving actual business problems.

For these reasons, I am happy to announce the availability of Amazon Managed Workflows for Apache Airflow (MWAA), a fully managed service that makes it easy to run open-source versions of Apache Airflow on AWS, and to build workflows to execute your extract-transform-load (ETL) jobs and data pipelines.

Airflow workflows retrieve input from sources like Amazon Simple Storage Service (S3) using Amazon Athena queries, perform transformations on Amazon EMR clusters, and can use the resulting data to train machine learning models on Amazon SageMaker. Workflows in Airflow are authored as Directed Acyclic Graphs (DAGs) using the Python programming language.

A key benefit of Airflow is its open extensibility through plugins which allows you to create tasks that interact with AWS or on-premise resources required for your workflows including AWS Batch, Amazon CloudWatch, Amazon DynamoDB, AWS DataSync, Amazon ECS and AWS Fargate, Amazon Elastic Kubernetes Service (EKS), Amazon Kinesis Firehose, AWS Glue, AWS Lambda, Amazon Redshift, Amazon Simple Queue Service (SQS), and Amazon Simple Notification Service (SNS).

To improve observability, Airflow metrics can be published as CloudWatch Metrics, and logs can be sent to CloudWatch Logs. Amazon MWAA provides automatic minor version upgrades and patches by default, with an option to designate a maintenance window in which these upgrades are performed.

You can use Amazon MWAA with these three steps:

  1. Create an environment – Each environment contains your Airflow cluster, including your scheduler, workers, and web server.
  2. Upload your DAGs and plugins to S3 – Amazon MWAA loads the code into Airflow automatically.
  3. Run your DAGs in Airflow – Run your DAGs from the Airflow UI or command line interface (CLI) and monitor your environment with CloudWatch.

Let’s see how this works in practice!

How to Create an Airflow Environment Using Amazon MWAA
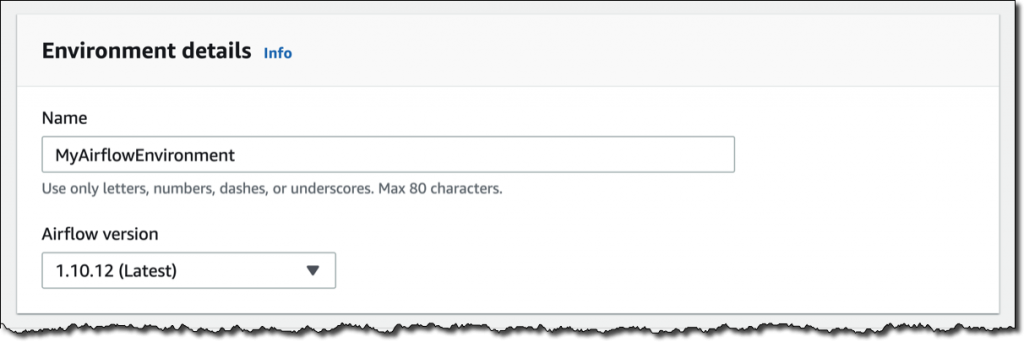
In the Amazon MWAA console, I click on Create environment. I give the environment a name and select the Airflow version to use.

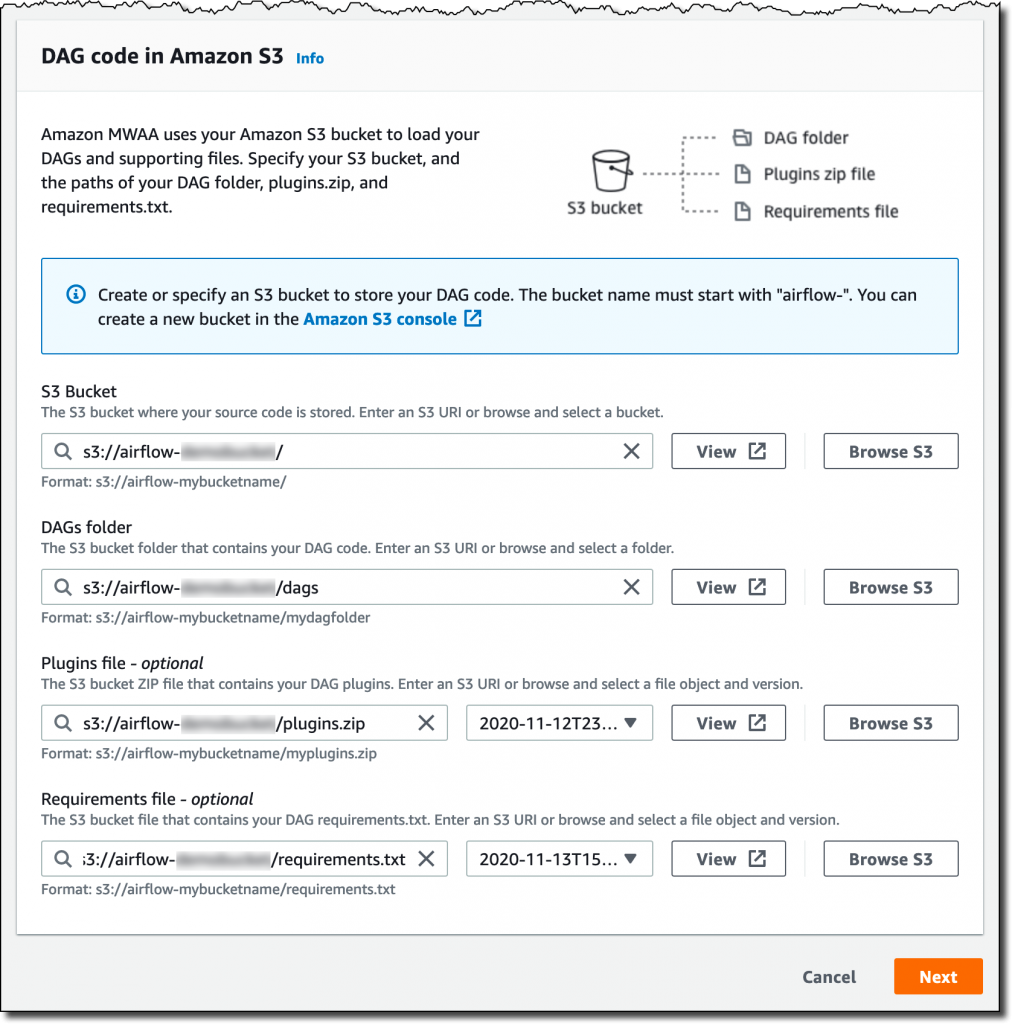
Then, I select the S3 bucket and the folder to load my DAG code. The bucket name must start with airflow-.

Optionally, I can specify a plugins file and a requirements file:

  • The plugins file is a ZIP file containing the plugins used by my DAGs.
  • The requirements file describes the Python dependencies to run my DAGs.

For plugins and requirements, I can select the S3 object version to use. In case the plugins or the requirements I use create a non-recoverable error in my environment, Amazon MWAA will automatically roll back to the previous working version.


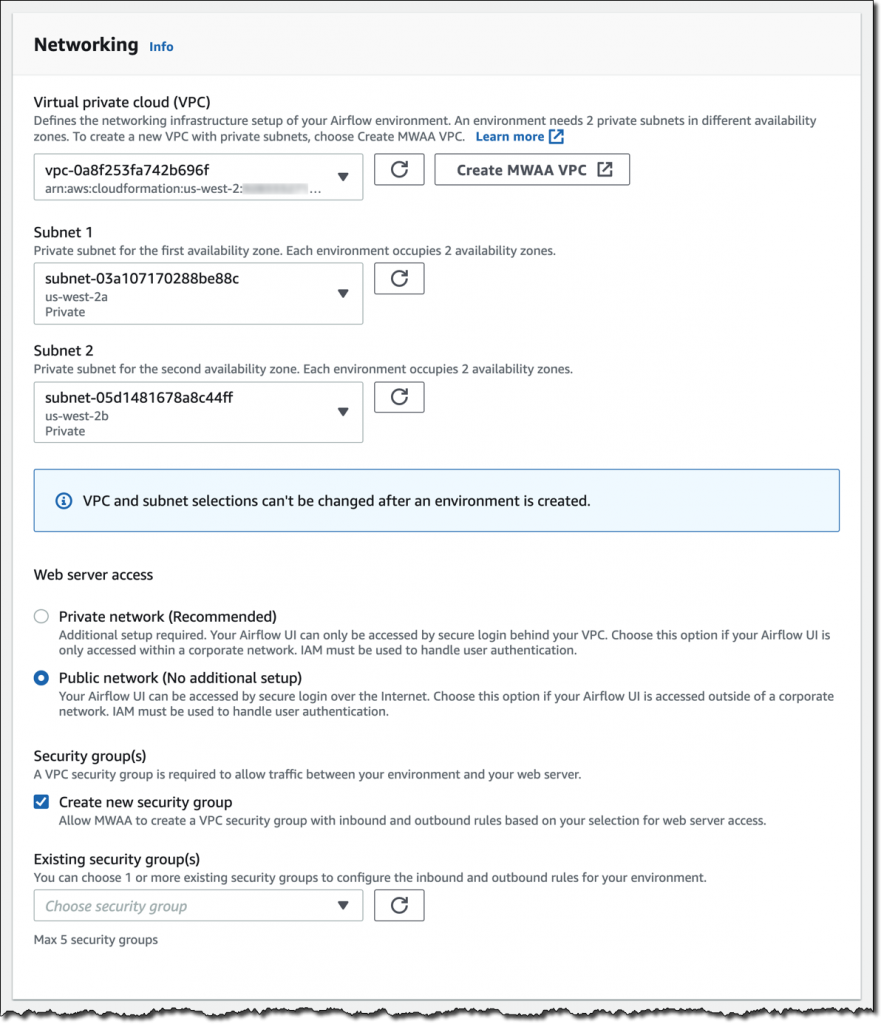
I click Next to configure the advanced settings, starting with networking. Each environment runs in a Amazon Virtual Private Cloud using private subnets in two availability zones. Web server access to the Airflow UI is always protected by a secure login using AWS Identity and Access Management (IAM). However, you can choose to have web server access on a public network so that you can login over the Internet, or on a private network in your VPC. For simplicity, I select a Public network. I let Amazon MWAA create a new security group with the correct inbound and outbound rules. Optionally, I can add one or more existing security groups to fine-tune control of inbound and outbound traffic for your environment.

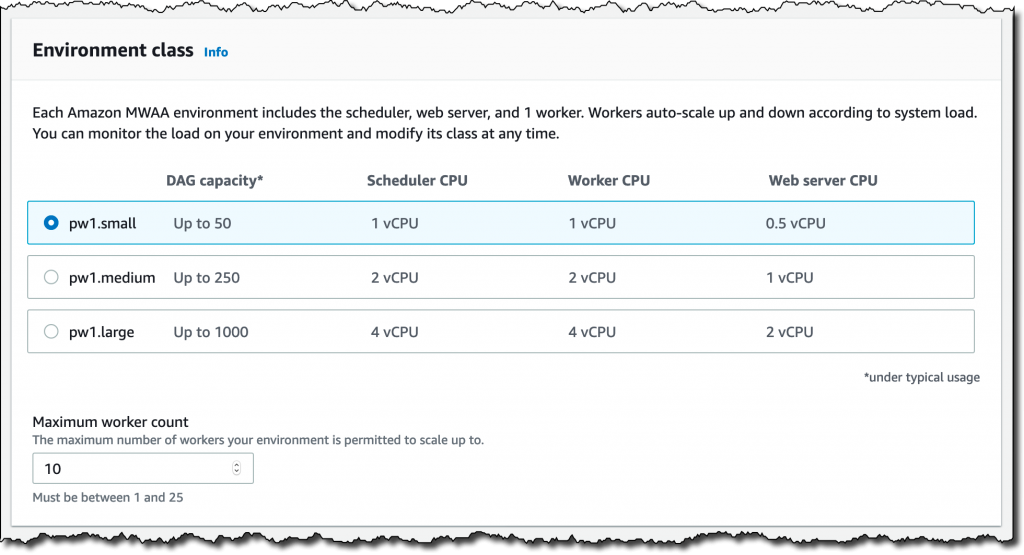
Now, I configure my environment class. Each environment includes a scheduler, a web server, and a worker. Workers automatically scale up and down according to my workload. We provide you a suggestion on which class to use based on the number of DAGs, but you can monitor the load on your environment and modify its class at any time.

Encryption is always enabled for data at rest, and while I can select a customized key managed by AWS Key Management Service (KMS) I will instead keep the default key that AWS owns and manages on my behalf.

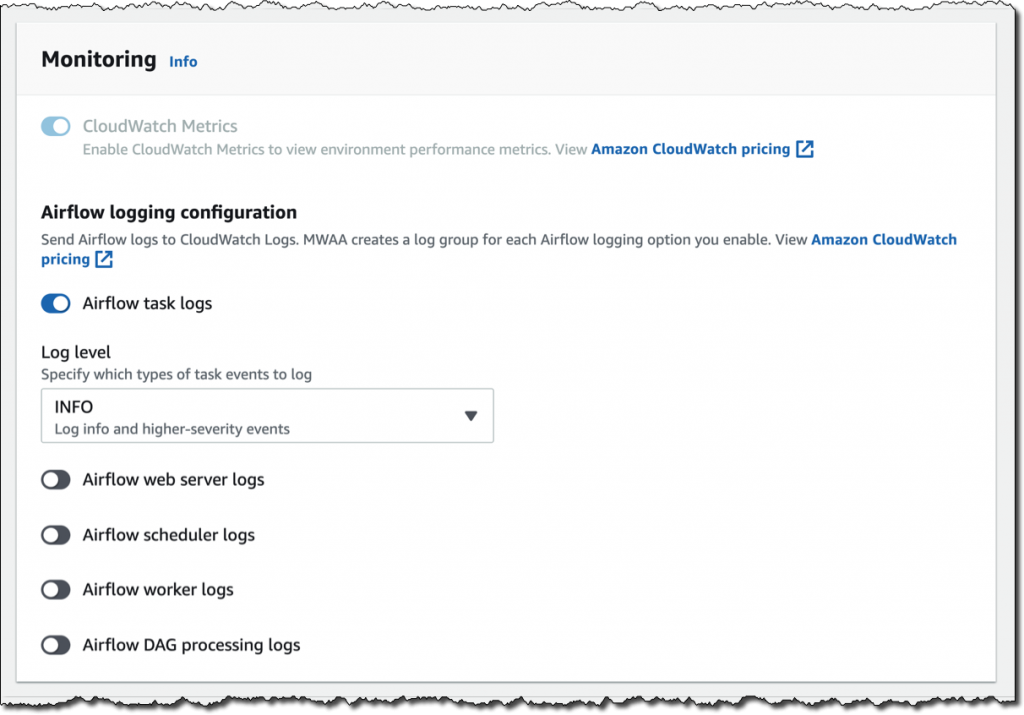
For monitoring, I publish environment performance to CloudWatch Metrics. This is enabled by default, but I can disable CloudWatch Metrics after launch. For the logs, I can specify the log level and which Airflow components should send their logs to CloudWatch Logs. I leave the default to send only the task logs and use log level INFO.

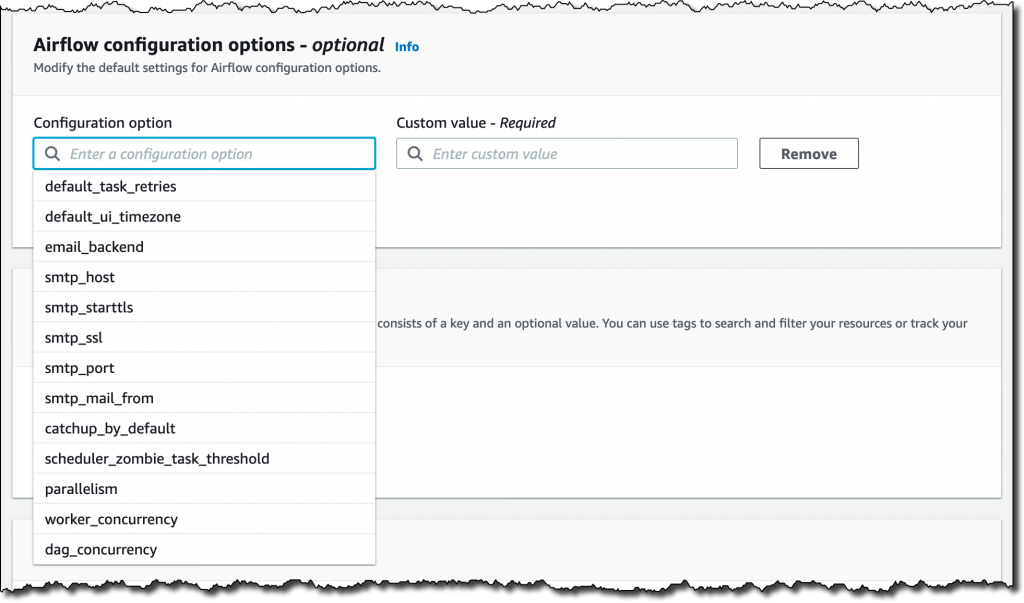
I can modify the default settings for Airflow configuration options, such as default_task_retries or worker_concurrency. For now, I am not changing these values.

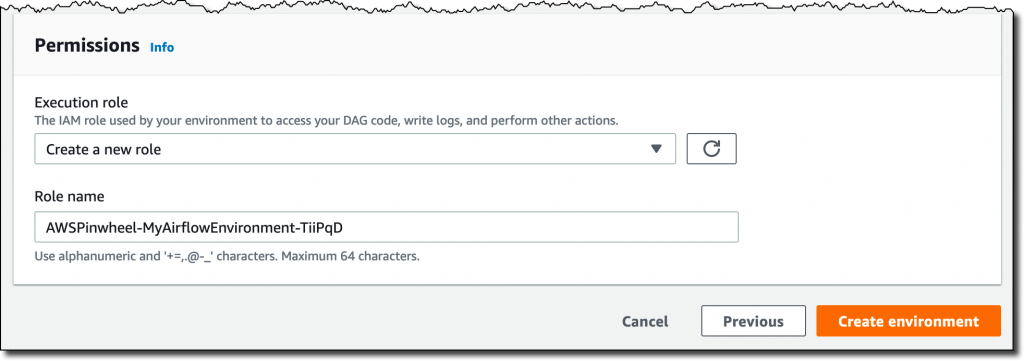
Finally, but most importantly, I configure the permissions that will be used by my environment to access my DAGs, write logs, and run DAGs accessing other AWS resources. I select Create a new role and click on Create environment. After a few minutes, the new Airflow environment is ready to be used.

Using the Airflow UI
In the Amazon MWAA console, I look for the new environment I just created and click on Open Airflow UI. A new browser window is created and I am authenticated with a secure login via AWS IAM.

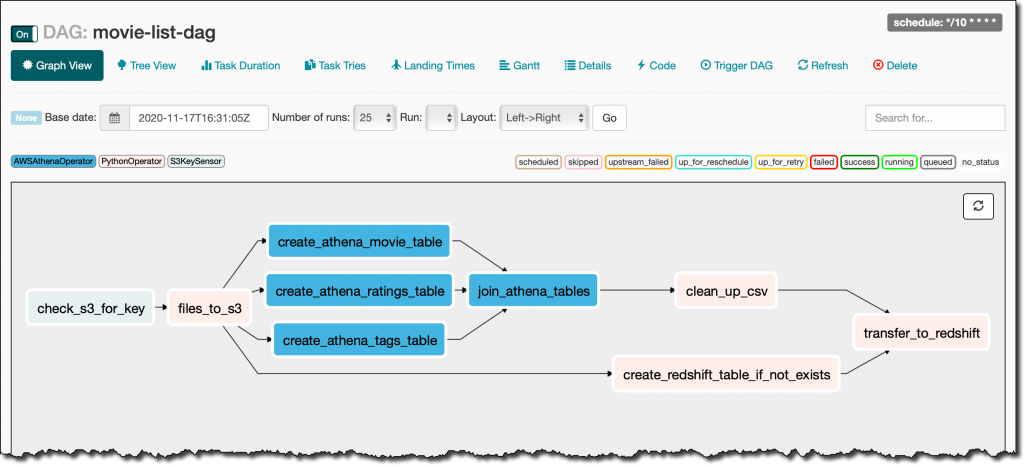
There, I look for a DAG that I put on S3 in the movie_list_dag.py file. The DAG is downloading the MovieLens dataset, processing the files on S3 using Amazon Athena, and loading the result to a Redshift cluster, creating the table if missing.

Here’s the full source code of the DAG:

from airflow import DAG
from airflow.operators.python_operator import PythonOperator
from airflow.operators import HttpSensor, S3KeySensor
from airflow.contrib.operators.aws_athena_operator import AWSAthenaOperator
from airflow.utils.dates import days_ago
from datetime import datetime, timedelta
from io import StringIO
from io import BytesIO
from time import sleep
import csv
import requests
import json
import boto3
import zipfile
import io
s3_bucket_name = 'my-bucket'
s3_key='files/'
redshift_cluster='redshift-cluster-1'
redshift_db='dev'
redshift_dbuser='awsuser'
redshift_table_name='movie_demo'
test_http='https://grouplens.org/datasets/movielens/latest/'
download_http='http://files.grouplens.org/datasets/movielens/ml-latest-small.zip'
athena_db='demo_athena_db'
athena_results='athena-results/'
create_athena_movie_table_query="""
CREATE EXTERNAL TABLE IF NOT EXISTS Demo_Athena_DB.ML_Latest_Small_Movies (
  `movieId` int,
  `title` string,
  `genres` string 
)
ROW FORMAT SERDE 'org.apache.hadoop.hive.serde2.lazy.LazySimpleSerDe'
WITH SERDEPROPERTIES (
  'serialization.format' = ',',
  'field.delim' = ','
) LOCATION 's3://pinwheeldemo1-pinwheeldagsbucketfeed0594-1bks69fq0utz/files/ml-latest-small/movies.csv/ml-latest-small/'
TBLPROPERTIES (
  'has_encrypted_data'='false',
  'skip.header.line.count'='1'
); 
"""
create_athena_ratings_table_query="""
CREATE EXTERNAL TABLE IF NOT EXISTS Demo_Athena_DB.ML_Latest_Small_Ratings (
  `userId` int,
  `movieId` int,
  `rating` int,
  `timestamp` bigint 
)
ROW FORMAT SERDE 'org.apache.hadoop.hive.serde2.lazy.LazySimpleSerDe'
WITH SERDEPROPERTIES (
  'serialization.format' = ',',
  'field.delim' = ','
) LOCATION 's3://pinwheeldemo1-pinwheeldagsbucketfeed0594-1bks69fq0utz/files/ml-latest-small/ratings.csv/ml-latest-small/'
TBLPROPERTIES (
  'has_encrypted_data'='false',
  'skip.header.line.count'='1'
); 
"""
create_athena_tags_table_query="""
CREATE EXTERNAL TABLE IF NOT EXISTS Demo_Athena_DB.ML_Latest_Small_Tags (
  `userId` int,
  `movieId` int,
  `tag` int,
  `timestamp` bigint 
)
ROW FORMAT SERDE 'org.apache.hadoop.hive.serde2.lazy.LazySimpleSerDe'
WITH SERDEPROPERTIES (
  'serialization.format' = ',',
  'field.delim' = ','
) LOCATION 's3://pinwheeldemo1-pinwheeldagsbucketfeed0594-1bks69fq0utz/files/ml-latest-small/tags.csv/ml-latest-small/'
TBLPROPERTIES (
  'has_encrypted_data'='false',
  'skip.header.line.count'='1'
); 
"""
join_tables_athena_query="""
SELECT REPLACE ( m.title , '"' , '' ) as title, r.rating
FROM demo_athena_db.ML_Latest_Small_Movies m
INNER JOIN (SELECT rating, movieId FROM demo_athena_db.ML_Latest_Small_Ratings WHERE rating > 4) r on m.movieId = r.movieId
"""
def download_zip():
    s3c = boto3.client('s3')
    indata = requests.get(download_http)
    n=0
    with zipfile.ZipFile(io.BytesIO(indata.content)) as z:       
        zList=z.namelist()
        print(zList)
        for i in zList: 
            print(i) 
            zfiledata = BytesIO(z.read(i))
            n += 1
            s3c.put_object(Bucket=s3_bucket_name, Key=s3_key+i+'/'+i, Body=zfiledata)
def clean_up_csv_fn(**kwargs):    
    ti = kwargs['task_instance']
    queryId = ti.xcom_pull(key='return_value', task_ids='join_athena_tables' )
    print(queryId)
    athenaKey=athena_results+"join_athena_tables/"+queryId+".csv"
    print(athenaKey)
    cleanKey=athena_results+"join_athena_tables/"+queryId+"_clean.csv"
    s3c = boto3.client('s3')
    obj = s3c.get_object(Bucket=s3_bucket_name, Key=athenaKey)
    infileStr=obj['Body'].read().decode('utf-8')
    outfileStr=infileStr.replace('"e"', '') 
    outfile = StringIO(outfileStr)
    s3c.put_object(Bucket=s3_bucket_name, Key=cleanKey, Body=outfile.getvalue())
def s3_to_redshift(**kwargs):    
    ti = kwargs['task_instance']
    queryId = ti.xcom_pull(key='return_value', task_ids='join_athena_tables' )
    print(queryId)
    athenaKey='s3://'+s3_bucket_name+"/"+athena_results+"join_athena_tables/"+queryId+"_clean.csv"
    print(athenaKey)
    sqlQuery="copy "+redshift_table_name+" from '"+athenaKey+"' iam_role 'arn:aws:iam::163919838948:role/myRedshiftRole' CSV IGNOREHEADER 1;"
    print(sqlQuery)
    rsd = boto3.client('redshift-data')
    resp = rsd.execute_statement(
        ClusterIdentifier=redshift_cluster,
        Database=redshift_db,
        DbUser=redshift_dbuser,
        Sql=sqlQuery
    )
    print(resp)
    return "OK"
def create_redshift_table():
    rsd = boto3.client('redshift-data')
    resp = rsd.execute_statement(
        ClusterIdentifier=redshift_cluster,
        Database=redshift_db,
        DbUser=redshift_dbuser,
        Sql="CREATE TABLE IF NOT EXISTS "+redshift_table_name+" (title	character varying, rating	int);"
    )
    print(resp)
    return "OK"
DEFAULT_ARGS = {
    'owner': 'airflow',
    'depends_on_past': False,
    'email': ['[email protected]'],
    'email_on_failure': False,
    'email_on_retry': False 
}
with DAG(
    dag_id='movie-list-dag',
    default_args=DEFAULT_ARGS,
    dagrun_timeout=timedelta(hours=2),
    start_date=days_ago(2),
    schedule_interval='*/10 * * * *',
    tags=['athena','redshift'],
) as dag:
    check_s3_for_key = S3KeySensor(
        task_id='check_s3_for_key',
        bucket_key=s3_key,
        wildcard_match=True,
        bucket_name=s3_bucket_name,
        s3_conn_id='aws_default',
        timeout=20,
        poke_interval=5,
        dag=dag
    )
    files_to_s3 = PythonOperator(
        task_id="files_to_s3",
        python_callable=download_zip
    )
    create_athena_movie_table = AWSAthenaOperator(task_id="create_athena_movie_table",query=create_athena_movie_table_query, database=athena_db, output_location='s3://'+s3_bucket_name+"/"+athena_results+'create_athena_movie_table')
    create_athena_ratings_table = AWSAthenaOperator(task_id="create_athena_ratings_table",query=create_athena_ratings_table_query, database=athena_db, output_location='s3://'+s3_bucket_name+"/"+athena_results+'create_athena_ratings_table')
    create_athena_tags_table = AWSAthenaOperator(task_id="create_athena_tags_table",query=create_athena_tags_table_query, database=athena_db, output_location='s3://'+s3_bucket_name+"/"+athena_results+'create_athena_tags_table')
    join_athena_tables = AWSAthenaOperator(task_id="join_athena_tables",query=join_tables_athena_query, database=athena_db, output_location='s3://'+s3_bucket_name+"/"+athena_results+'join_athena_tables')
    create_redshift_table_if_not_exists = PythonOperator(
        task_id="create_redshift_table_if_not_exists",
        python_callable=create_redshift_table
    )
    clean_up_csv = PythonOperator(
        task_id="clean_up_csv",
        python_callable=clean_up_csv_fn,
        provide_context=True     
    )
    transfer_to_redshift = PythonOperator(
        task_id="transfer_to_redshift",
        python_callable=s3_to_redshift,
        provide_context=True     
    )
    check_s3_for_key >> files_to_s3 >> create_athena_movie_table >> join_athena_tables >> clean_up_csv >> transfer_to_redshift
    files_to_s3 >> create_athena_ratings_table >> join_athena_tables
    files_to_s3 >> create_athena_tags_table >> join_athena_tables
    files_to_s3 >> create_redshift_table_if_not_exists >> transfer_to_redshift

In the code, different tasks are created using operators like PythonOperator, for generic Python code, or AWSAthenaOperator, to use the integration with Amazon Athena. To see how those tasks are connected in the workflow, you can see the latest few lines, that I repeat here (without indentation) for simplicity:

check_s3_for_key >> files_to_s3 >> create_athena_movie_table >> join_athena_tables >> clean_up_csv >> transfer_to_redshift
files_to_s3 >> create_athena_ratings_table >> join_athena_tables
files_to_s3 >> create_athena_tags_table >> join_athena_tables
files_to_s3 >> create_redshift_table_if_not_exists >> transfer_to_redshift

The Airflow code is overloading the right shift >> operator in Python to create a dependency, meaning that the task on the left should be executed first, and the output passed to the task on the right. Looking at the code, this is quite easy to read. Each of the four lines above is adding dependencies, and they are all evaluated together to execute the tasks in the right order.

In the Airflow console, I can see a graph view of the DAG to have a clear representation of how tasks are executed:

Available Now
Amazon Managed Workflows for Apache Airflow (MWAA) is available today in US East (Northern Virginia), US West (Oregon), US East (Ohio), Asia Pacific (Singapore), Asia Pacific (Toyko), Asia Pacific (Sydney), Europe (Ireland), Europe (Frankfurt), and Europe (Stockholm). You can launch a new Amazon MWAA environment from the console, AWS Command Line Interface (CLI), or AWS SDKs. Then, you can develop workflows in Python using Airflow’s ecosystem of integrations.

With Amazon MWAA, you pay based on the environment class and the workers you use. For more information, see the pricing page.

Upstream compatibility is a core tenet of Amazon MWAA. Our code changes to the AirFlow platform are released back to open source.

With Amazon MWAA you can spend more time building workflows for your engineering and data science tasks, and less time managing and scaling the infrastructure of your Airflow platform.

Learn more about Amazon MWAA and get started today!

Danilo

Vulkan update: we’re conformant!

Post Syndicated from original https://www.raspberrypi.org/blog/vulkan-update-were-conformant/

Today we have a guest post from Igalia’s Iago Toral, who has spent the past year working on the Mesa graphic driver stack for Raspberry Pi 4.

It’s been nearly a year since we first announced that we were developing a Vulkan driver for the latest generation of Raspberry Pi devices (Raspberry Pi 4, Raspberry Pi 400, and Compute Module 4).

Sascha Willems’ Vulkan radial blur demo

In June we released the source code for our prototype driver, and last month we announced that the driver had been successfully merged to Mesa upstream.

Today we have some very exciting news to share: as of 24 November the V3DV Vulkan Mesa driver for Raspberry Pi 4 has demonstrated Vulkan 1.0 conformance.

Khronos describes the conformance process as a way to ensure that its standards are consistently implemented by multiple vendors, so as to create a reliable platform for application developers. For each standard, Khronos provides a large conformance test suite (CTS) that implementations must pass successfully to be declared conformant; in the case of Vulkan 1.0, the CTS contains over 100,000 tests.

Vulkan 1.0 conformance is a major milestone in bringing Vulkan to Raspberry Pi, but it isn’t the end of the journey. Our team continues to work on all fronts to expand the Vulkan feature set, improve performance, and fix bugs. So stay tuned for future Vulkan updates!

The post Vulkan update: we’re conformant! appeared first on Raspberry Pi.

Multi-Region Replication Now Enabled for AWS Managed Microsoft Active Directory

Post Syndicated from Martin Beeby original https://aws.amazon.com/blogs/aws/multi-region-replication-now-enabled-for-aws-managed-microsoft-active-directory/

Our customers build applications that need to serve users that live in all corners of the world. When listening to our customers, they told us that whilst they were comfortable building Active Directory (AD) aware applications on AWS, making them work globally can be a real challenge.

Customers told us that AWS Directory Service for Microsoft Active Directory had saved them time and money and provided them with all the capabilities they need to run their AD-aware applications. However, if they wanted to go global, they needed to create independent AWS Managed Microsoft AD directories per Region. They would then need to create a solution to synchronize data across each Region. This level of management overhead is significant, complex, and costly. It also slowed customers as they sought to migrate their AD-aware workloads to the cloud.

Today, I want to tell you about a new feature that allows customers to deploy a single AWS Managed Microsoft AD across multiple AWS Regions. This new feature called multi-region replication automatically configures inter-region networking connectivity, deploys domain controllers, and replicates all the Active Directory data across multiple Regions, ensuring that Windows and Linux workloads residing in those Regions can connect to and use AWS Managed Microsoft AD with low latency and high performance. AWS Managed Microsoft AD makes it more cost-effective for customers to migrate AD-aware applications and workloads to AWS and easier to operate them globally. In addition, automated multi-region replication provides multi-region resiliency.

AWS can now synchronize all customer directory data, including users, groups, Group Policy Objects (GPOs), and schema across multiple Regions. AWS handles automated software updates, monitoring, recovery, and the security of the underlying AD infrastructure across all Regions, enabling customers to focus on building their applications. Integrating with Amazon CloudWatch Logs and Amazon Simple Notification Service (SNS), AWS Managed Microsoft AD makes it easy for customers to monitor the directory’s health, and security logs globally.

How It Works 
Let me show you how to create an Active Directory that spans multiple Regions using the AWS Managed Microsoft AD console. You do not have to create a new directory to use multi-region replication it will work on all your existing directories too.

First, I create a new Directory following the normal steps. I select Enterprise Edition since this is the only edition that supports multi-region replication.

I give my Directory a name and a description and then set an Admin password. I then click Next which takes me to the Networking setup.

I select a Amazon Virtual Private Cloud that I use for demos and then choose two subnets which are in separate Availability Zones. The AWS Managed Microsoft AD deploys two domain controllers per region and places them in separate subnets which are in different Availability Zones, this is done for resiliency reasons so that the directory can still operate even if one of the Availability Zones has issues.

Once I click next, I am presented with the review screen and I click Create Directory.

The directory takes between 20-45 minutes to be created. There is now a column on the Directories listing page that says Multi-Region, this directory has this value currently set to No indicating that it does not span multiple Regions

Once the directory has been created, I click on the Directory ID and drill into the details. I now have a new section called Multi-Region replication and there is a button called Add Region. If I click this button I can then configure an additional Region.

I select the Region that I want to add to my directory, in this example US West (Oregon) us-west-2, I then select a VPC in that Region and two subnets that must reside in separate Availability Zones. Finally, I click the Add button to add this new Region for my directory.

Now back on the directory details page I see there are two Regions listed one in US East (N. Virginia) and one in US West (Oregon), again the creation process can take upto 45 minutes, but once it has complete I will have my directory replicated across two Regions.

Costs
You pay by the hour for the domain controllers in each region, plus the cross-region data transfer. It’s important to understand that this feature will create two domain controllers in each Region that you Add, and so applications that reside in these Regions can now communicate with a local directory which lowers costs by minimizing the need for data transfer. To learn more, visit the pricing page.

Available Now
This new feature can be used today and is available for both new and existing directories that use the Enterprise Edition in any of the following Regions: US East (N. Virginia), US East (Ohio), US West (N. California), US West (Oregon), AWS GovCloud (US-East), US West (Oregon), Asia Pacific (Mumbai), Asia Pacific (Seoul), Asia Pacific (Singapore), Asia Pacific (Sydney), Asia Pacific (Tokyo), Canada (Central), Europe (Frankfurt), Europe (Ireland), Europe (London), Europe (Paris), Europe (Stockholm), and South America (São Paulo).

Head over to the product page to learn more, view pricing, and get started creating directories that span multiple AWS Regions.

Happy Administering

— Martin

Monitoring dashboard for AWS ParallelCluster

Post Syndicated from Ben Peven original https://aws.amazon.com/blogs/compute/monitoring-dashboard-for-aws-parallelcluster/

This post is contributed by Nicola Venuti, Sr. HPC Solutions Architect.

AWS ParallelCluster is an AWS-supported, open source cluster management tool that makes it easy to deploy and manage High Performance Computing (HPC) clusters on AWS. While AWS ParallelCluster includes many benefits for its users, it has not provided straightforward support for monitoring your workloads. In this post, I walk you through an add-on extension that you can use to help monitor your cloud resources with AWS ParallelCluster.

Product overview

AWS ParallelCluster offers many benefits that hide the complexity of the underlying platform and processes. Some of these benefits include:

  • Automatic resource scaling
  • A batch scheduler
  • Easy cluster management that allows you to build and rebuild your infrastructure without the need for manual actions
  • Seamless migration to the cloud supporting a wide variety of operating systems.

While all of these benefits streamline processes for you, one crucial task for HPC stakeholders that customers have found challenging with AWS ParallelCluster is monitoring.

Resources in an HPC cluster like schedulers, instances, storage, and networking are important assets to monitor, especially when you pay for what you use. Organizing and displaying all these metrics becomes challenging as the scale of the infrastructure increases or changes over time which is the typical scenario in the Cloud.

Given these challenges, AWS wants to provide AWS ParallelCluster users with two additional benefits: 1/ facilitate the optimization of price performance and 2/ visualize and monitor the components of cost for their workloads.

The HPC Solution Architects team has created an AWS ParallelCluster add-on that is easy to use and customize. In this blog post, I demonstrate how Grafana – a platform for monitoring and observability – can run on AWS ParallelCluster to enable infrastructure monitoring.

AWS ParallelCluster integrated dashboard and Grafana add-on dashboards

Many customers want a tool that consolidates information coming from different AWS services and makes it easy to monitor the computing infrastructure created and managed by AWS ParallelCluster. The AWS ParallelCluster team – just like every other service team at AWS – is open and keen to listen from our customers.

This feedback helps us inform our product roadmap and build new, customer-focused features.

We recently released AWS ParallelCluster 2.10.0 based on customer feedback. Here are some key features have been released with it:

  • Support for the CentOS 8 Operating System: Customers can now choose CentOS 8 as their base operating system of choice to run their clustersfor both x86 and Arm architectures.
  • Support for P4d instances along with NVIDIA GPUDirect Remote Direct Memory Access (RDMA).
  • FSx for Lustre enhancements (support for  FSx AutoImport and HDD-based support filesystem options)
  • And finally, a new CloudWatch Dashboards designed to help aggregating cluster information, metrics, and logging already available on CloudWatch.

The last of these features above, integrated CloudWatch Dashboards, are designed to help customers face the challenge of cluster monitoring mentioned above. In addition, the Grafana dashboards demonstrated later in this blog are a complementary add-on to this new, CloudWatch-based, dashboard. There are some key differences between the two, summarized in the table below.

The latter does not require any additional component or agent running on either the head or the compute nodes. It aggregates the metrics already pushed by AWS ParallelCluster on CloudWatch into a single dashboard. This translates into zero overhead for the cluster, but at the expense of less flexibility and expandability.

Instead, the Grafana-based dashboard offers additional flexibility and customizability and requires a few lightweight components installed on either the head or the compute nodes. Another key difference between the two monitoring dashboards is that the CloudWatch based one requires AWS credentials, IAM User and Roles configured and access to the AWS web-console, while the Grafana-based one has its-own built-in authentication and authorization system unrelated from the AWS account, end-users or HPC admins might not have permissions (or simply are not willing) to access the AWS Management Console in order to monitor their clusters.

CloudWatch based dashboard Grafana-based monitoring add-on
No additional component Grafana + Prometheus
No overhead Minimal overhead
Little to no expandability Support full customizability
Requires AWS credentials and IAM configured Custom credentials, no AWS access required
Custom user-interface

Grafana add-on dashboards on GitHub

There are many components of an HPC cluster to monitor. Moreover, the cluster is built on a system that is continuously evolving: AWS ParallelCluster and AWS services in general are updated and new features are released often. Because of this, we wanted to have a monitoring solution that is developed on flexible components, that can evolve rapidly. So, we released a Grafana add-on as an open-source project onto this GitHub repository.

Releasing it as an open-source project allows us to more easily and frequently release new updates and enhancements. It also enables users to customize and extend its functionalities by adding new dashboards, or extending the dashboards functionalities (like GPU monitoring or track EC2 Spot Instance interruptions).

At the moment, this new solution is composed of the following open-source components:

  • Grafana is an open-source platform for monitoring and observing. Grafana allows you to query, visualize, alert, and understand your metrics. It also helps you create, explore, and share dashboards fostering a data-driven culture.
  • Prometheus is an open source project for systems and service monitoring from the Cloud Native Computing Foundation. It collects metrics from configured targets at given intervals, evaluates rule expressions, displays the results, and can trigger alerts if some condition is observed to be true.
  • The Prometheus Pushgateway is an open source tool that allows ephemeral and batch jobs to expose their metrics to Prometheus.
  • NGINX is an HTTP and reverse proxy server, a mail proxy server, and a generic TCP/UDP proxy server.
  • Prometheus-Slurm-Exporter is a Prometheus collector and exporter for metrics extracted from the Slurm resource scheduling system.
  • Node_exporter is a Prometheus exporter for hardware and OS metrics exposed by *NIX kernels, written in Go with pluggable metric collectors.

Note: while almost all components are under the Apache2 license, only Prometheus-Slurm-Exporter is licensed under GPLv3. You should be aware of this license and accept its terms before proceeding and installing this component.

The dashboards

I demonstrate a few different Grafana dashboards in this post. These dashboards are available for you in the AWS Samples GitHub repository. In addition, two dashboards – still under development – are proposed in beta. The first shows the cluster logs coming from Amazon CloudWatch Logs. The second one shows the costs associated to each AWS service utilized.

All these dashboards can be used as they are or customized as you need:

  • AWS ParallelCluster Summary – This is the main dashboard that shows general monitoring info and metrics for the whole cluster. It includes: Slurm metrics, compute related metrics, storage performance metrics, and network usage.

ParallelCluster dashboard

  • Master Node Details – This dashboard shows detailed metrics for the head node, including CPU, memory, network, and storage utilization.

Master node details

  • Compute Node List – This dashboard shows the list of the available compute nodes. Each entry is a link to a more detailed dashboard: the compute node details (see the following image).

Compute node list

  • Compute Node Details – Similar to the head node details, this dashboard shows detailed metrics for the compute nodes.
  • Cluster Logs – This dashboard (still under development) shows all the logs of your HPC cluster. The logs are pushed by AWS ParallelCluster to Amazon CloudWatch Logs and are reported here.

Cluster logs

  • Cluster Costs (also under development) – This dashboard shows the cost associated to AWS Service utilized by your cluster. It includes: EC2, Amazon EBS, FSx, Amazon S3, Amazon EFS. as well as an aggregation of all the costs of every single component.

Cluster costs

How to deploy it

You can simply use the post-install script that you can find in this GitHub repo as it is, or customize it as you need. For instance, you might want to change your Grafana password to something more secure and meaningful for you, or you might want to customize some dashboards by adding additional components to monitor.

#Load AWS Parallelcluster environment variables
. /etc/parallelcluster/cfnconfig
#get GitHub repo to clone and the installation script
monitoring_url=$(echo ${cfn_postinstall_args}| cut -d ',' -f 1 )
monitoring_dir_name=$(echo ${cfn_postinstall_args}| cut -d ',' -f 2 )
monitoring_tarball="${monitoring_dir_name}.tar.gz"
setup_command=$(echo ${cfn_postinstall_args}| cut -d ',' -f 3 )
monitoring_home="/home/${cfn_cluster_user}/${monitoring_dir_name}"
case ${cfn_node_type} in
    MasterServer)
        wget ${monitoring_url} -O ${monitoring_tarball}
        mkdir -p ${monitoring_home}
        tar xvf ${monitoring_tarball} -C ${monitoring_home} --strip-components 1
    ;;
    ComputeFleet)
    ;;
esac
#Execute the monitoring installation script
bash -x "${monitoring_home}/parallelcluster-setup/${setup_command}" >/tmp/monitoring-setup.log 2>&1
exit $?

The proposed post-install script takes care of installing and configuring everything for you. Although a few additional parameters are needed in the AWS ParallelCluster configuration file: the post-install argument, additional IAM policies, custom security group, and a tag. You can find an AWS ParallelCluster template here.

Please note that, at the moment, the post install script has only been tested using Amazon Linux 2.

Add the following parameters to your AWS ParallelCluster configuration file, and then build up your cluster:

base_os = alinux2
post_install = s3://<my-bucket-name>/post-install.sh
post_install_args = https://github.com/aws-samples/aws-parallelcluster-monitoring/tarball/main,aws-parallelcluster-monitoring,install-monitoring.sh
additional_iam_policies = arn:aws:iam::aws:policy/CloudWatchFullAccess,arn:aws:iam::aws:policy/AWSPriceListServiceFullAccess,arn:aws:iam::aws:policy/AmazonSSMFullAccess,arn:aws:iam::aws:policy/AWSCloudFormationReadOnlyAccess
tags = {"Grafana" : "true"}

Make sure that port 80 and port 443 of your head node are accessible from the internet or from your network. You can achieve this by creating the appropriate security group via AWS Management Console or via Command Line Interface (AWS CLI), see the following example:

aws ec2 create-security-group --group-name my-grafana-sg --description "Open Grafana dashboard ports" —vpc-id vpc-1a2b3c4d
aws ec2 authorize-security-group-ingress --group-id sg-12345 --protocol tcp --port 443 —cidr 0.0.0.0/0
aws ec2 authorize-security-group-ingress --group-id sg-12345 --protocol tcp --port 80 —cidr 0.0.0.0/0

There is more information on how to create your security groups here.

Finally, set the additional_sg parameter in the [VPC] section of your AWS ParallelCluster configuration file.

After your cluster is created, you can open a web-browser and connect to https://your_public_ip. You should see a landing page with links to the Prometheus database service and the Grafana dashboards.

Size your compute and head nodes

We looked into resource utilization of the components required for building this monitoring solution. In particular, the Prometheus node exporter installed in the compute nodes uses a small (almost negligible) number of CPU cycles, memory, and network.

Depending on the size of your cluster the components installed on the head node (see the list in the chapter “Solution components” of this blog) it might require additional CPU, memory and network capabilities. In particular, if you expect to run a large-scale cluster (hundreds of instances) because of the higher volume of network traffic due to the compute nodes continuously pushing metrics into the head node, we recommend you use an instance type bigger than what you planned.

We cannot advise you exactly how to size your head node because there are many factors that can influence resource utilization. The best recommendation we could give you is to use the Grafana dashboard itself to monitor the CPU, memory, disk, and most importantly, network utilization, and then resize your head node (or other components) accordingly.

Conclusions

This monitoring solution for AWS ParallelCluster is an add-on for your HPC Cluster on AWS and a complement to new features recently released in AWS ParallelCluster 2.10. This blog aimed to provide you with instructions and basic tooling that can be customized based on your needs and that can be adapted quickly as the underlying AWS services evolve.

We are open to hear from you, receive feedback, issues, and pull requests to extend its functionalities.

AWS and the New Zealand notifiable privacy breach scheme

Post Syndicated from Adam Star original https://aws.amazon.com/blogs/security/aws-and-the-new-zealand-notifiable-privacy-breach-scheme/

The updated New Zealand Privacy Act 2020 (Privacy Act) will come into force on December 1, 2020. Importantly, it establishes a new notifiable privacy breach scheme (NZ scheme). The NZ scheme gives affected individuals the opportunity to take steps to protect their personal information following a privacy breach that has caused, or is likely to cause, serious harm. It also reinforces entities’ accountability for the personal information they hold.

We’re happy to announce that Amazon Web Services (AWS) now offers two types of New Zealand Notifiable Data Breach (NZNDB) addenda to customers who are subject to the Privacy Act and are using AWS to store and process personal information covered by the NZ scheme. The NZNDB addenda address customers’ need for notification if a security event affects their data.

We’ve made both types of NZNDB addenda available online as click-through agreements in AWS Artifact, which is our customer-facing audit and compliance portal that can be accessed from the AWS Management Console. In AWS Artifact, you can review and activate the relevant NZNDB addendum for those AWS accounts you use to store and process personal information covered by the NZ scheme.

The first type, the Account NZNDB Addendum, applies only to the specific individual account that accepts the Account NZNDB Addendum. The Account NZNDB Addendum must be separately accepted for each AWS account that you need to cover.

The second type, the AWS Organizations ANDB Addendum, once accepted by a management account in AWS Organizations, applies to the management account and all member accounts in that organization. If you don’t need or want to take advantage of the AWS Organizations ANDB Addendum, you can still accept the Account ANDB Addendum for individual accounts.

As with all AWS Artifact features, there is no additional cost to use AWS Artifact to review, accept, and manage either the individual Account NZNDB Addendum or AWS Organizations NZNDB Addendum. To learn more about AWS Artifact, including how to view, download, and accept the NZNDB addenda, visit the AWS Artifact FAQ page.

We welcome the arrival of the NZ scheme, and hope it helps New Zealand entities to improve their security capabilities.

If you have feedback about this post, submit comments in the Comments section below.

Want more AWS Security how-to content, news, and feature announcements? Follow us on Twitter.

Author

Adam Star

Adam joined Amazon in 2012 and is a Program Manager on the Security Obligations and Contracts team. He enjoys designing practical solutions to help customers meet a range of global compliance requirements including GDPR, HIPAA, and the European Banking Authority’s Guidelines on Outsourcing Arrangements. Adam lives in Seattle with his wife and daughter. Originally from New York, he’s constantly searching for “real” bagels and pizza. He’s an active member of the Washington State Bar Association and American Homebrewers Association, finding the latter much more successful when attempting to make friends in social situations.

120 AWS services achieve HITRUST certification

Post Syndicated from Hadis Ali original https://aws.amazon.com/blogs/security/120-aws-services-achieve-hitrust-certification/

We’re excited to announce that 120 Amazon Web Services (AWS) services are certified for the HITRUST Common Security Framework (CSF) for the 2020 cycle.

The full list of AWS services that were audited by a third-party assessor and certified under HITRUST CSF is available on our Services in Scope by Compliance Program page. You can view and download our HITRUST CSF certification from AWS Artifact.

AWS HITRUST CSF certification is available for customer inheritance

You don’t have to assess the inherited controls, because AWS already has! You can deploy environments onto AWS and inherit our HITRUST CSF certification provided that you use only in-scope services and apply the controls detailed on the HITRUST website that you are responsible for implementing.

The HITRUST certification allows you, as an AWS customer, to tailor your security control baselines to a variety of factors including, but not limited to, regulatory requirements and organization type. The HITRUST CSF is widely adopted by leading organizations in a variety of industries in their approach to security and privacy. Visit the HITRUST website for more information.

As always, we value your feedback and questions and are committed to helping you achieve and maintain the highest standard of security and compliance. Feel free to contact the team through AWS Compliance Contact Us. If you have feedback about this post, submit comments in the Comments section below.

Want more AWS Security how-to content, news, and feature announcements? Follow us on Twitter.

Author

Hadis Ali

Hadis is a Security and Privacy Manager at Amazon Web Services. He leads multiple security and privacy initiatives within AWS Security Assurance. Hadis holds Bachelor’s degrees in Accounting and Information Systems from the University of Washington.

Fall 2020 SOC 2 Type I Privacy report now available

Post Syndicated from Ninad Naik original https://aws.amazon.com/blogs/security/fall-2020-soc-2-type-i-privacy-report-now-available/

Your privacy considerations are at the core of our compliance work, and at AWS, we are focused on the protection of your content while using Amazon Web Services. Our Fall 2020 SOC 2 Type I Privacy report is now available, demonstrating the privacy compliance commitments we made to you.

The Fall 2020 SOC 2 Type I Privacy report provides you with a third-party attestation of our system and the suitability of the design of our privacy controls. The SOC 2 Privacy Trust Service Criteria (TSC), developed by the American Institute of CPAs (AICPA) establishes the criteria for evaluating controls relating to how personal information is collected, used, retained, disclosed and disposed of to meet AWS’s objectives. Customers can find additional information related to privacy commitments supporting our SOC2 Type 1 report in the Customer Agreement documentation.

The scope of the privacy report includes information about how we handle the content that you upload to AWS and how it is protected in all of the services and locations that are in scope for the latest AWS SOC reports. You can find our SOC 2 Type I Privacy report through Artifact in the AWS Management Console.

As always, we value your feedback and questions. Please feel free to reach out to the team through the Contact Us page. If you have feedback about this post, submit comments in the Comments section below.

Want more AWS Security how-to content, news, and feature announcements? Follow us on Twitter.

Author

Ninad Naik

Ninad is a Security Assurance Manager at Amazon Web Services, leading multiple security and privacy initiatives within AWS. He has a Master’s degree in Information Systems from Syracuse University, NY and a Bachelor’s of Engineering degree in Information Technology from Mumbai University, India. Ninad has 10 years of experience in security assurance and ITIL, CISA, CGEIT, and CISM certifications.

Fall 2020 SOC reports now available with 124 services in scope

Post Syndicated from Ninad Naik original https://aws.amazon.com/blogs/security/fall-2020-soc-reports-now-available-with-124-services-in-scope/

At AWS, we’re committed to providing our customers with continued assurance over the security, availability and confidentiality of the AWS control environment. We’re proud to deliver the System and Organizational (SOC) 1, 2 and 3 reports to enable our AWS customers to maintain confidence in AWS services.

For the Fall 2020 SOC reports, covering 04/01/2020 to 09/30/2020, we are excited to announce two new services in scope, for a total of 124 total services in scope. The associated infrastructure supporting our in-scope products and services is updated to reflect new regions and edge locations.

Here are the 2 new services in scope for Fall SOC 2020 reports:

The Fall 2020 SOC reports are now available through Artifact in the AWS Management Console. The SOC 3 report can also be downloaded here as PDF.

AWS strives to bring services into scope of its compliance programs to help you meet your architectural and regulatory needs. If there are additional AWS services which you would like to see added to the scope of our SOC reports (or other compliance programs), please reach out to your AWS Representatives.

If you have feedback about this post, submit comments in the Comments section below.

Want more AWS Security how-to content, news, and feature announcements? Follow us on Twitter.

Author

Ninad Naik

Ninad is a Security Assurance Manager at Amazon Web Services, leading multiple security and privacy initiatives within AWS. Ninad holds a Master’s degree in Information Systems from Syracuse University, NY and a Bachelor’s of Engineering degree in Information Technology from Mumbai University, India. Ninad has 10 years of experience in security assurance and ITIL, CISA, CGEIT, and CISM certifications.