Tag Archives: observability

Soar: Simulation for Observability, reliAbility, and secuRity

Post Syndicated from Yan Zhai original https://blog.cloudflare.com/soar-simulation-for-observability-reliability-and-security/

Soar: Simulation for Observability, reliAbility, and secuRity

Soar: Simulation for Observability, reliAbility, and secuRity

Serving more than approximately 25 million Internet properties is not an easy thing, and neither is serving 20 million requests per second on average. At Cloudflare, we achieve this by running a homogeneous edge environment: almost every Cloudflare server runs all Cloudflare products.

Soar: Simulation for Observability, reliAbility, and secuRity
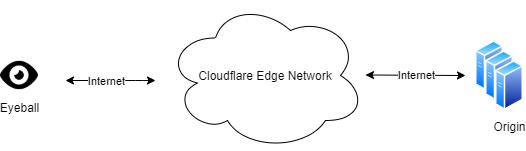
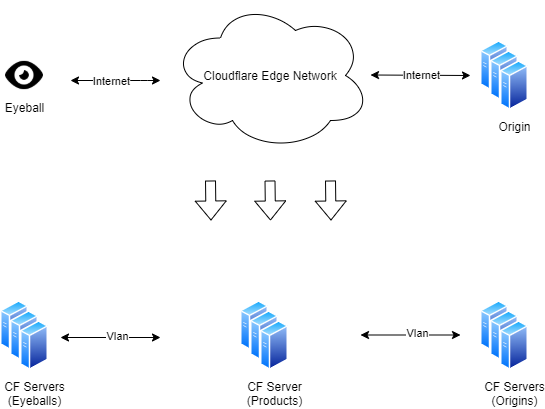
Figure 1. Typical Cloudflare service model: when an end-user (a browser/mobile/etc) visits an origin (a Cloudflare customer), traffic is routed via the Internet to the Cloudflare edge network, and Cloudflare communicates with the origin servers from that point.

As we offer more and more products and enjoy the benefit of horizontal scalability, our edge stack continues to grow in complexity. Originally, we only operated at the application layer with our CDN service and DoS protection. Then we launched transport layer products, such as Spectrum and Argo. Now we have further expanded our footprint into the IP layer and physical link with Magic Transit. They all run on every machine we have. The work of our engineers enables our products to evolve at a fast pace, and to serve our customers better.

However, such software complexity presents a sheer challenge to operation: the more changes you make, the more likely it is that something is going to break. And we don’t tolerate any of our mistakes slipping into the production environment and affecting our customers.

In this article, we will discuss one of the techniques we use to fight such software complexity: simulations. Simulations are basically system tests that run with synthesized customer traffic and applications. We would like to introduce our simulation system, SOAR, i.e. Simulation for Observability, reliAbility, and secuRity.

What is SOAR? Simply put, it’s a data center built specifically for simulations. It runs the same software stack as our production data centers, but without any production traffic. Within SOAR, there are end-user servers, product servers, and origin servers (Figure 2). The product servers behave exactly the same as servers in our production edge network, and they are the targets that we want to test. End-user servers and origin servers run applications that try to simulate customer behaviors. The simplest case is to run network benchmarks through product servers, in order to evaluate how effective the corresponding products are. Instead of sending test traffic over the Internet, everything happens in the LAN environment that Cloudflare tightly controls. This gives us great flexibility in testing network features such as bring-your-own-IP (BYOIP) products.

Soar: Simulation for Observability, reliAbility, and secuRity
Figure 2. SOAR architectural view: by simulating the end users and origin on Cloudflare servers in the same VLAN, we can focus on examining the problems occurring in our edge network.

To demonstrate how this works, let’s go through a running example using Magic Transit.

Magic Transit is a product that provides IP layer protection and acceleration. One of the main functions of Magic Transit is to shield customers from DDoS attacks.

Soar: Simulation for Observability, reliAbility, and secuRity
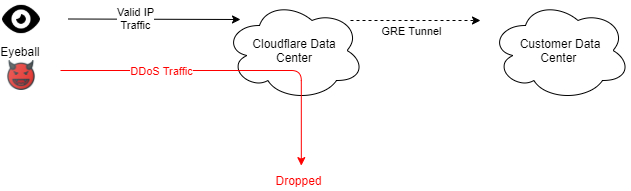
Figure 3. Magic Transit workflow in a nutshell

Customers bring their IP ranges to advertise from Cloudflare edge. When attackers initiate a DoS attack, Cloudflare absorbs all the customer’s traffic, drops the attack traffic, and encapsulates clean traffic to customers. For this product, operational concerns are multifold, and here are some examples:

  • Have we properly configured our data plane so that traffic can reach customers? Is BGP ready? Are ECMP routes programmed correctly? Are health probes working correctly?
  • Do we have any untested corner cases that only manifest with a large amount of traffic?
  • Is our DoS system dropping malicious traffic as intended? How effective
  • Will any other team’s changes break Magic Transit as our edge keeps growing?

To ease these concerns, we run simulated customers with SOAR. Yes, simulated, not real. For example, assume a customer Alice onboarded an IP range 192.0.2.0/24 to Magic Transit. To simulate this customer, in SOAR we can configure a test application (e.g. iperf server) on one origin server to represent Alice’s service. We also bring up a product server to run Magic Transit. This product server will filter traffic toward a.b.c.0/24, and GRE encapsulated cleansed traffic to Alice’s specified GRE endpoint. To make it work, we also add routing rules to forward packets destined to 192.0.2.0/24 to go through the product server above. Similarly, we add routing rules to deliver GRE packets from the product server to the origin servers. Lastly, we start running test clients as eyeballs to evaluate the functional correctness, performance metrics, and resource usage.

For the rest of this article, we will talk about the design and implementation of this simulation system, as well as several real cases in which it helped us catch problems early or avoid problems altogether.

System Design

From performance simulation to config simulation

Before we created SOAR, we had already built a “performance simulation” for our layer 7 services. It is based on SaltStack, our configuration management software. All the simulation cases are system test cases against Cloudflare-owned HTTP sites. These cases are statically configured and run non-stop. Each simulation case produces multiple Prometheus metrics such as requests per second and latency. We monitor these metrics daily on our Grafana dashboard.

While this simulation system is very useful, it becomes less efficient as we have more and more simulation cases and products to run and analyze.

Isolation and Coordination

As more types of simulations are onboarded, it is critical to ensure each simulation runs in a clean environment, and all tasks of a simulation run together. This challenge is specific to providers like Cloudflare, whose products are not virtualized because we want to maximize our edge performance. As a result, we have to isolate simulations and clean up by ourselves; otherwise, different simulations may cross-affect each other.

For example, for Magic Transit simulations, we need to create a GRE tunnel on an origin server and set up several routes on all three servers, to make sure simulated traffic can flow as real Magic Transit customers would. We cannot leave these routes after the simulation finishes, or there might be a conflict. We once ran into a situation where different simulations required different source IP addresses to the same destination. In our original performance simulation environment, we will have to modify simulation applications to avoid these conflicts. This approach is less desirable as different engineering teams have to pay attention to other teams’ code.

Moreover, the performance simulation addresses only the most basic system test cases: a client sends traffic to a server and measures the performance characteristics like request per second and latency quantile. But the situation we want to simulate and validate in our production environment can be far more complex.

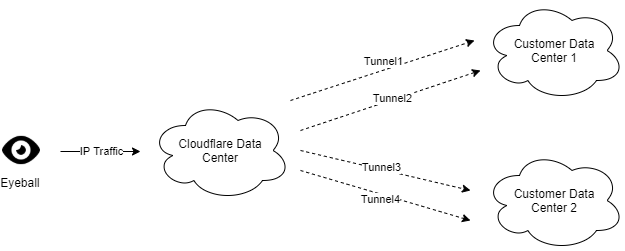
In our previous example of Magic Transit, customers can configure complicated network topology. Figure 4 is one simplified case. Let’s say Alice establishes four GRE tunnels with Cloudflare; two connect to her data center 1, and traffic will be ECMP hashed between these two tunnels. Similarly, she also establishes another two tunnels to her data center 2 with similar ECMP settings. She would like to see traffic hit data center 1 normally and fail over to data center 2 when tunnels 1 and 2 are both down.

Soar: Simulation for Observability, reliAbility, and secuRity
Figure 4. The customer configured Magic Transit to establish four tunnels to her two data centers. Traffic to data center 1 is hashed between tunnel 1 and 2 using ECMP, and traffic to data center 2 is hashed between tunnel 3 and 4. Data center 1 is the primary one, and traffic should failover to data center 2 if tunnels 1 and 2 are both down. Note the number “2” is purely symbolic, as real customers can have more than just 2 data centers, or 2 paths per ECMP route.

In order to examine the effectiveness of route failover, we would need to inject errors on the product servers only after the traffic on the eyeball server has started. But this type of coordination is not achievable with statically defined simulations.

Engineer friendliness and Interactiveness

Our performance simulation is not engineer-friendly. Not just because it is all statically configured in SaltStack (most engineering teams do not possess Salt expertise), but it is also not integrated with an engineer’s daily routine. Can engineers trigger a simulation on every branch build? Can simulation results get back in time to inform that a performance problem occurs? The answer is no, it is not possible with our static configuration. An engineer can submit a Salt PR to config a new simulation, but this simulation may have to wait for several hours because all other unfinished simulations need to complete first (recall it is just a static loop). Nor can an engineer add a test to the team’s repository to run on every build, as it needs to reside in the SRE-managed Salt repository, making it unmanageable as the number of simulations grows.

The Architecture

To address the above limitations, we designed SOAR.

Soar: Simulation for Observability, reliAbility, and secuRity
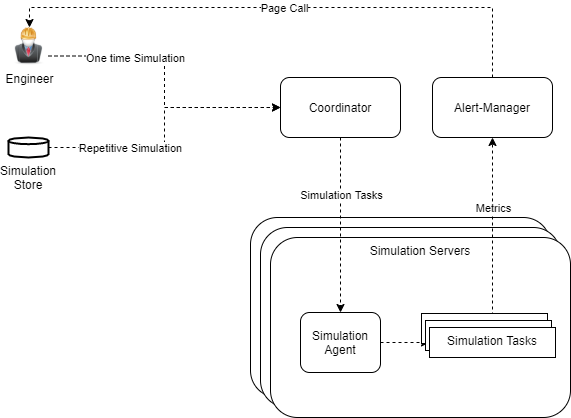
Figure 5. The Architecture of SOAR

The architecture is a performance simulation structure, extended. We created an internal coordinator service to:

  1. Interface with engineers, so they could now submit one-time simulations from their laptop or within the building pipeline, or view previous execution results.
  2. Dispatch and coordinate simulation tasks to each simulation server, where a simulation agent executes these tasks. The coordinator will isolate simulations properly so none of them contends on system resources. For example, the simplest policy we implemented is to never run two simulations on the same server at the same time.

The coordinator is secured by Cloudflare Access, so that only employees can visit this service. The coordinator will serve two types of simulations: one-time simulation to be run in an ad-hoc way and mainly on a per pull request manner, to ease development testing. It’s also callable from our CI system. Another type is repetitive simulations that are stored in the coordinator’s persistent storage. These simulations serve daily monitoring purposes and will be executed periodically.

Each simulation server runs a simulation agent. This agent will execute two types of tasks received from the coordinator: system tasks and user tasks. System tasks change the system-wide configurations and will be reverted after each simulation terminates. These will include but are not limited to route change, link change, address change, ipset change and iptables change.

User tasks, on the other hand, run benchmarks that we are interested in evaluating, and will be terminated if it exceeds an allocated execution budget. Each user task is isolated in a cgroup, and the agent will ensure all user tasks are executed with dedicated resources. The generic runtime metrics of user tasks is monitored by Cadvisor and sent to Prometheus and Alert Manager. A user task can export its own metrics to Prometheus as well.

For SOAR to run reliably, we provisioned a dedicated environment that enforces the same settings for the production environment and operates it as a production system: hardened security, standard alerts on watch, no engineer access except approved tools. This to a large extent allows us to run simulations as a stable source of anomaly detection.

Simulating with customer-specific configuration

An important ability of SOAR is to simulate for a specific customer. This will provide the customer with more guarantees that both their configurations and our services are battle-tested with traffic before they go live. It can also be used to bisect problems during a customer escalation, helping customer support to rule out unrelated factors more easily.

All of our edge servers know how to dispatch an incoming customer packet. This factor greatly reduces difficulties in simulating a specific customer. What we need to do in simulation is to mock routing and domain translation on simulated eyeballs and origins, so that they will correctly send traffic to designated product servers. And the problem is solved—magic!

The actual implementation is also straightforward: as simulations run in a LAN environment, we have tight control over how to route packets (servers are on the same broadcast domain). Any eyeball, origin, or product server can just use a direct routing rule and a static DNS entry in /etc/hosts to redirect packets to go to the correct destination.

Running a simulation this way allows us to separate customer configuration management from the simulation service: our products will manage it, so any time a customer configuration is changed, they will already reflect in simulations without special care.

Implementation and Integration

All SOAR components are built with Golang from scratch on Linux servers. It took three engineer-months to build the prototype and onboard the first engineering use case. While there are other mature platforms for job scheduling, task isolation, and monitoring, building our own allows us to better absorb new requirements from engineering teams, which is much easier and quicker than an external dependency.

In addition, we are currently integrating the simulation service into our release pipeline. Cloudflare built a release manager internally to schedule product version changes in controlled steps: a new product is first deployed into dogfooding data centers. After the product has been trialed by Cloudflare employees, it moves to several canary data centers with limited customer traffic. If nothing bad happens, in an hour or so, it starts to land in larger data centers spread across three tiers. Tier-3 will receive the changes an hour earlier than tier-2, and the same applies to tier-2 and tier-1. This ensures a product would be battle-tested enough before it can serve the majority of Cloudflare customers.

Now we move this further by adding a simulation step even before dogfooding. In this step, all changes are deployed into the simulation environment, and engineering teams will configure which simulations to run. Dogfooding starts only when there is no performance regression or functional breakage. Here performance regression is based on Prometheus metrics, where each engineering team can define their own Prometheus query to interpret the performance results. All configured simulations will run periodically to detect problems in releases that do not tie to a specific product, e.g. a Linux kernel upgrade. SREs receive notifications asynchronously if any issue is discovered.

Simulations at Cloudflare: Case Studies

Simulations are very useful inside Cloudflare. Let’s see some real experiences we had in the past.

Detecting an anomaly on data center specific releases

In our Magic Transit example, the engineering team was about to release physical network interconnect (PNI) support. With PNI, customer data centers physically peer with Cloudflare routers.

Soar: Simulation for Observability, reliAbility, and secuRity
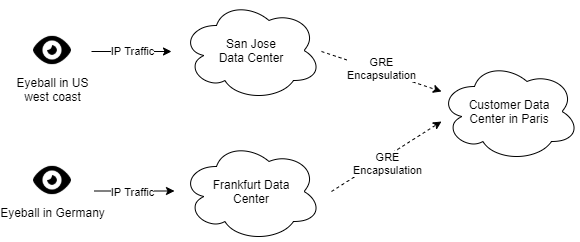
Figure 6. The Magic Transit service flow for a customer without PNI support. Any Cloudflare data center can receive eyeball traffic. After mitigating a DoS attack traffic, valid traffic is encapsulated to the customer data center from any of the handling Cloudflare data centers.
Soar: Simulation for Observability, reliAbility, and secuRity
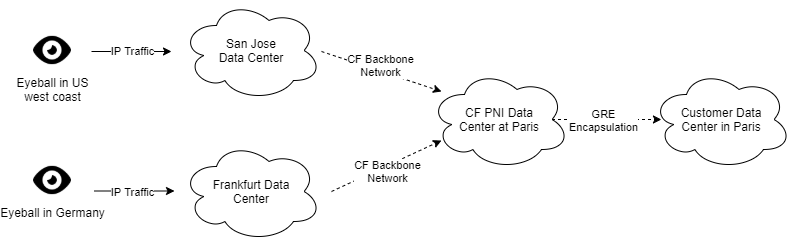
Figure 7. Magic Transit with PNI support. Traffic received from any data center will be moved to the PNI data center that the customer connects to. The PNI data center becomes a choke point.‌‌

However, this PNI functionality introduces a problem in our normal release process. However, PNI data centers are typically different from our dogfooding and canary data centers. If we still release with the normal process, then two critical phases are skipped. And what’s worse, the PNI data center could be a choke point in front of that customer’s traffic. If the PNI data center is taken down, no other data center can replace its role.

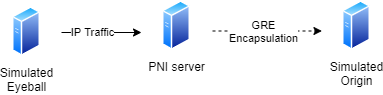
SOAR in this case is an important utility to help. The basic idea is to configure a server with PNI information. This server will act as if it runs in a PNI data center. Then we run simulated eyeball and origin to examine if there is any functional breakage:

Soar: Simulation for Observability, reliAbility, and secuRity
Figure 8. SOAR configures a server with PNI information and runs simulated eyeball and origin on this server. If a PNI related code release has a problem, then with proper simulation traffic it will be caught before rolling into production.

With such simulation capability, we were able to detect several problems early on and before releasing. For example, we caught a problem that impacts checksum offloading, which could encapsulate TCP packets with the wrong inner checksum and cause the packets to be dropped at the origin side. This problem does not exist in our virtualized testing environment and integration tests; it only happens when production hardware comes into play. We then use this simulation as a success indicator to test various fixes until we get the packet flow running normally again.

Continuously monitor performance on the edge stack

When a team configures a simulation, it runs on the same stack where all other teams run their products as well. This means when a simulation starts to show unhealthy results, it may or may not directly relate to the product associated with that simulation.

But with continuous simulations, we will have more chances to detect issues before things go south, or at least it will serve as a hint to quickly react to emerging problems. In an example early this year, we noticed one of our performance simulation dashboards showed that some HTTP request throughput was dropping by 20%. After digging into the case, we found our bot detection system had made a change that affected related requests. Luckily enough we moved fast thanks to the hint from the simulation (and some other useful tools like Opentracing).

Our recent enhancement from just HTTP performance simulation to SOAR makes it even more useful for customers. This is because we are now able to simulate with customer-specific configurations, so we might expose customer-specific problems. We are still dogfooding this, and hopefully, we can deploy it to our customers soon.

DoS Attacks as Simulations

When we started to develop Magic Transit, a question worth monitoring was how effective our mitigation pipeline is, and how to apply thresholds for different customers. For our new ACK flood mitigation system, flowtrackd, we onboarded its performance simulation cases together with tunable ACK flood. Combined with customer-specific configuration, this allows us to compare the throughput result under different volumes of attacks, and systematically tune our mitigation threshold.

Another important factor that we will be able to achieve with our “attack simulation” system is to mount attacks we have seen in the past, making sure the development of our mitigation pipelines won’t ever pass on these known attacks to our customers.

Conclusion

In this article, we introduced Cloudflare’s simulation system, SOAR. While simulation is not a new tool, we can use it to improve reliability, observability, and security. Our adoption of SOAR is still in its early stages, but we are pretty confident that, by fully leveraging simulations, we will push our quality of service to a new level.

How Netflix Scales its API with GraphQL Federation (Part 2)

Post Syndicated from Netflix Technology Blog original https://netflixtechblog.com/how-netflix-scales-its-api-with-graphql-federation-part-2-bbe71aaec44a

In our previous post and QConPlus talk, we discussed GraphQL Federation as a solution for distributing our GraphQL schema and implementation. In this post, we shift our attention to what is needed to run a federated GraphQL platform successfully — from our journey implementing it to lessons learned.

Netflix GraphQL Federation

Our Journey so Far

Over the past year, we’ve implemented the core infrastructure pieces necessary for a federated GraphQL architecture as described in our previous post:

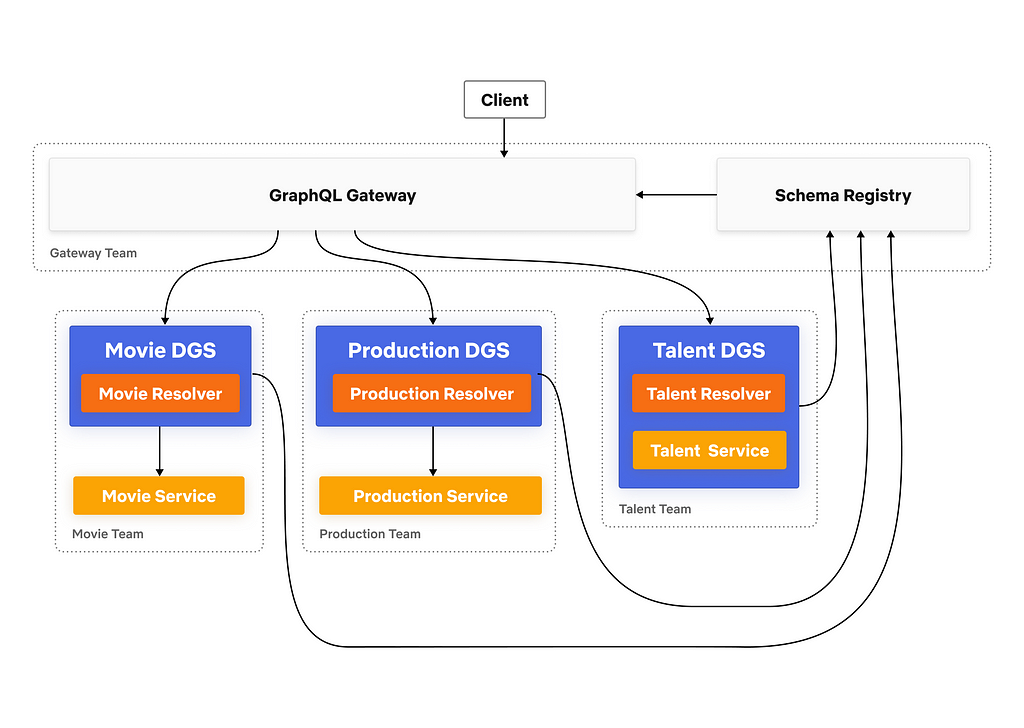
Studio Edge Architecture Diagram
Studio Edge Architecture

The first Domain Graph Service (DGS) on the platform was the former GraphQL monolith that we discussed in our first post (Studio API). Next, we worked with a few other application teams to make DGSs that would expose their APIs alongside the former monolith. We had our first Studio applications consuming the federated graph, without any performance degradation, by the end of the 2019. Once we knew that the architecture was feasible, we focused on readying it for broader usage. Our goal was to open up the Studio Edge platform for self-service in April 2020.

April 2020 was a turbulent time with the pandemic and overnight transition to working remotely. Nevertheless, teams started to jump into the graph in droves. Soon we had hundreds of engineers contributing directly to the API on a daily basis. And what about that Studio API monolith that used to be a bottleneck? We migrated the fields exposed by Studio API to individually owned DGSs without breaking the API for consumers. The original monolith is slated to be completely deprecated by the end of 2020.

This journey hasn’t been without its challenges. The biggest challenge was aligning on this strategy across the organization. Initially, there was a lot of skepticism and dissent; the concept was fairly new and would require high alignment across the organization to be successful. Our team spent a lot of time addressing dissenting points and making adjustments to the architecture based on feedback from developers. Through our prototype development and proactive partnership with some key critical voices, we were able to instill confidence and close crucial gaps.

Once we achieved broad alignment on the idea, we needed to ensure that adoption was seamless. This required building robust core infrastructure, ensuring a great developer experience, and solving for key cross-cutting concerns.

Core Infrastructure

Our GraphQL Gateway is based on Apollo’s reference implementation and is written in Kotlin. This gives us access to Netflix’s Java ecosystem, while also giving us the robust language features such as coroutines for efficient parallel fetches, and an expressive type system with null safety.

The schema registry is developed in-house, also in Kotlin. For storing schema changes, we use an internal library that implements the event sourcing pattern on top of the Cassandra database. Using event sourcing allows us to implement new developer experience features such as the Schema History view. The schema registry also integrates with our CI/CD systems like Spinnaker to automatically setup cloud networking for DGSs.

Developer Education & Experience

In the previous architecture, only the monolith Studio API team needed to learn GraphQL. In Studio Edge, every DGS team needs to build expertise in GraphQL. GraphQL has its own learning curve and can get especially tricky for complex cases like batching & lookahead. Also, as discussed in the previous post, understanding GraphQL Federation and implementing entity resolvers is not trivial either.

We partnered with Netflix’s Developer Experience (DevEx) team to build out documentation, training materials, and tutorials for developers. For general GraphQL questions, we lean on the open source community plus cultivate an internal GraphQL community to discuss hot topics like pagination, error handling, nullability, and naming conventions.

DGS Framework & Developer Tools

To make it easy for backend engineers to build a GraphQL DGS, the DevEx team built a “DGS Framework” on top of GraphQL Java and Spring Boot. The framework takes care of all the cross-cutting concerns of running a GraphQL service in production while also making it easier for developers to write GraphQL resolvers. In addition, DevEx built robust tooling for pushing schemas to the Schema Registry and a Self Service UI for browsing the various DGS’s schemas. Check out their conference talk and expect a future blog post from our colleagues. The DGS framework is planned to be open-sourced in early 2021.

Schema Governance

Netflix’s studio data is extremely rich and complex. Early on, we anticipated that active schema management would be crucial for schema evolution and overall health. We had a Studio Data Architect already in the org who was focused on data modeling and alignment across Studio. We engaged with them to determine graph schema best practices to best suit the needs of Studio Engineering.

Our goal was to design a GraphQL schema that was reflective of the domain itself, not the database model. UI developers should not have to build Backends For Frontends (BFF) to massage the data for their needs, rather, they should help shape the schema so that it satisfies their needs. Embracing a collaborative schema design approach was essential to achieving this goal.

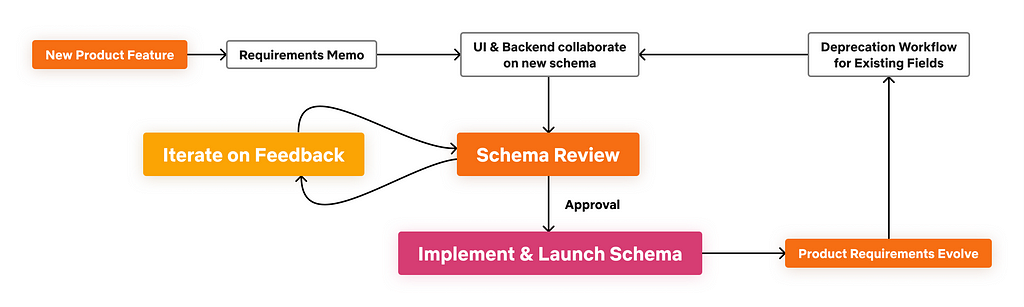
Schema Design Workflow Diagram
Schema Design Workflow

The collaborative design process involves feedback and reviews across team boundaries. To streamline schema design and review, we formed a schema working group and a managed technical program for on-boarding to the federated architecture. While reviews add overhead to the product development process, we believe that prioritizing the quality of the graph model will reduce the amount of future changes and reworking needed. The level of review varies based on the entities affected; for the core federated types, more rigor is required (though tooling helps streamline that flow).

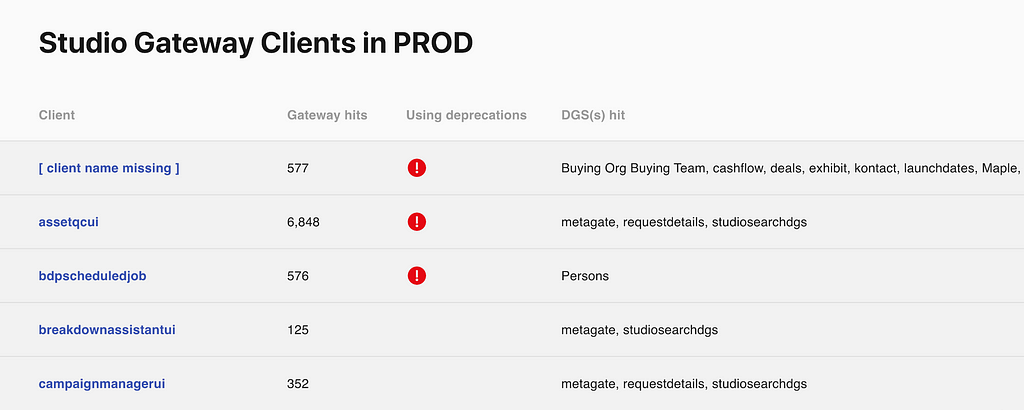
We have a deprecation workflow in place for evolving the schema. We’ve leveraged GraphQL’s deprecation feature and also track usage stats for every field in the schema. Once the stats show that a deprecated field is no longer used, we can make a backward incompatible change to remove the field from the schema.

Clients with Deprecated Field Usage
Clients with Deprecated Field Usage

We embraced a schema-first approach instead of generating our schema from existing models such as the Protobuf objects in our gRPC APIs. While Protobufs and gRPC are excellent solutions for building service APIs, we prefer decoupling our GraphQL schema from those layers to enable cleaner graph design and independent evolvability. In some scenarios, we implement generic mapping code from GraphQL resolvers to gRPC calls, but the extra boilerplate is worth the long-term flexibility of the GraphQL API.

Underlying our approach is a foundation of “context over control”, which is a key tenet of Netflix’s culture. Instead of trying to hold tight control of the entire graph, we give guidance and context to product teams so that they can apply their domain knowledge to make a flexible API for their domain. As this architecture matures, we will continue to monitor schema health and develop new tooling, processes, and best practices where needed.

Observability

In our previous architecture, observability was achieved through manual analysis and routing via the API team, which scaled poorly. For our federated architecture, we prioritized solving observability needs in a more scalable manner. We prioritized three areas:

  • Alerting — report when something goes awry
  • Discovery — easily determine what isn’t working
  • Diagnosis — debug why something isn’t working

Our guiding metrics in this space are mean time to resolution (MTTR) and service level objectives and indicators (SLO/SLI).

We teamed up with experts from Netflix’s Telemetry team. We integrated the Gateway and DGS architectural components with Zipkin, the internal distributed tracing tool Edgar, and application monitoring tool TellTale. In GraphQL, almost every response is a 200 with custom errors in the error block. We introspect these custom error codes from the response and emit them to our metrics server, Atlas. These integrations created a great foundation of rich visibility and insights for the consumers and developers of the GraphQL API.

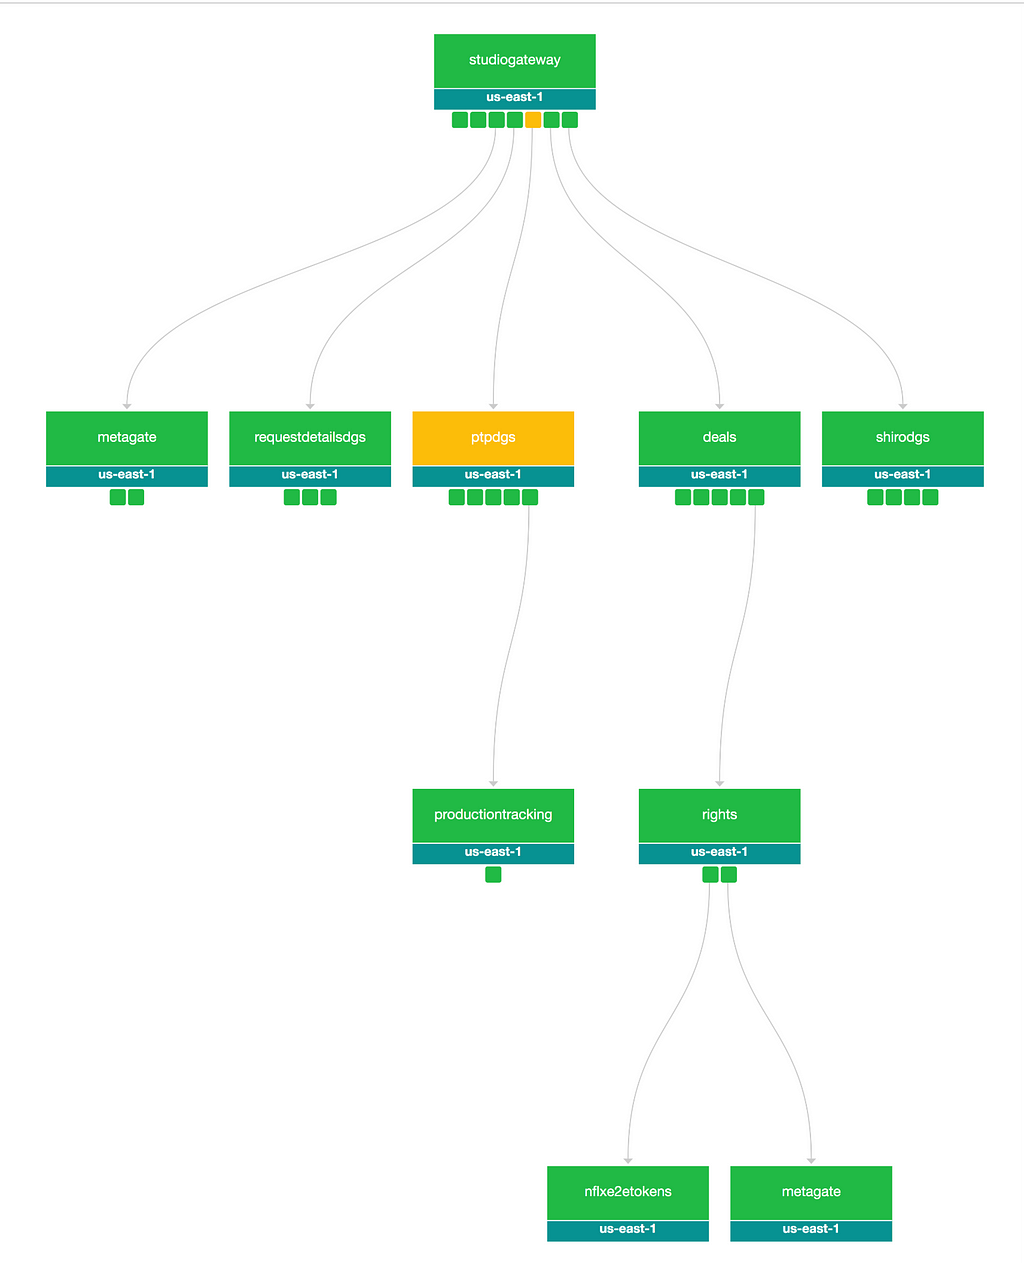
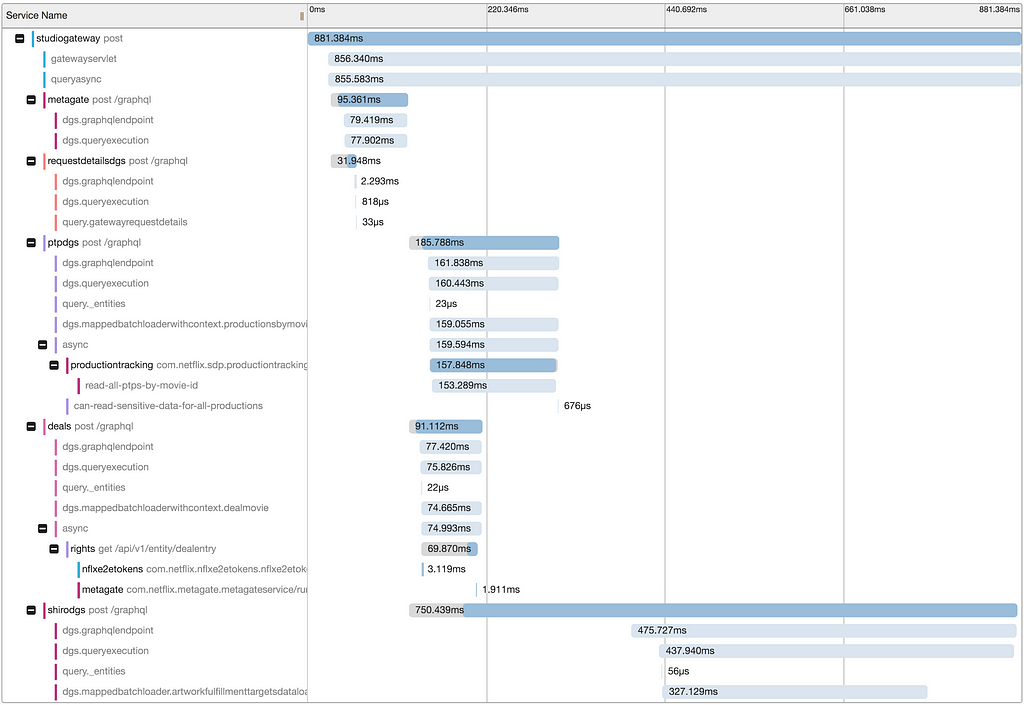
Trace for a Federated Request Lifecycle
Edgar Trace for a Federated Request Lifecycle
Timeline View for a Federated Request lifecycle
Timeline View for a Federated Request

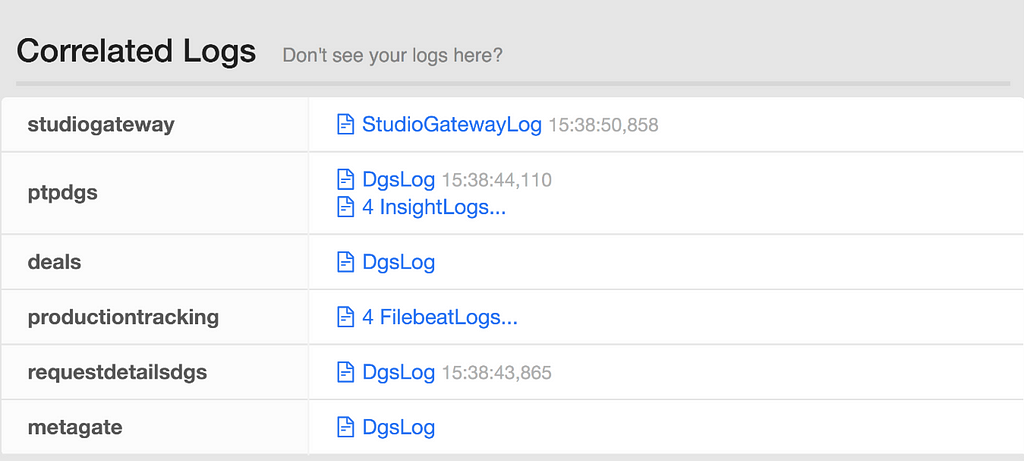
Distributed Log Correlation helps with debugging more complex server issues. By surfacing the application level logging details for all systems involved in processing a request, we gain deeper insights into what happened across the stack. Developers can easily see what was happening around the same time as a given request, to inspect surrounding factors that might have impacted an interaction.

Log correlation across multiple services for a request lifecycle
Logs across multiple services for a Federated Request

To solve the “who do I ask about…” routing problem, we integrated deep linking from GraphQL types and fields to their owning team’s support channels. Finding support is now as simple as clicking a link from a trace, which helps shorten MTTR and reduce the number of times the gateway team needs to get involved.

Securing the Federated Graph

Our goal is to enable robust and consistent security practices across the federated architecture. To achieve this, we partnered with the security experts at Netflix to build security into the graph. Let’s look at two essential parts of our security solution: AuthN and AuthZ.

Authentication

All of our product experiences in the Studio space require an authenticated account, so we restrict the GraphQL Gateway access to only trusted authenticated callers. Additionally, Graph Introspection is restricted to Netflix internal developers.

Authorization

Before Studio Edge, authorization logic was fragmented across teams. Some teams implemented authorization in their BFFs, some in microservices, and others did both for good measure. The result was often a different authorization story for a given piece of data depending on which UI a user was accessing it through. UI teams also found themselves needing to implement (and re-implement) authorization checks with each new frontend.

In Studio Edge, we delegated the authorization responsibility to DGS owners. This resulted in consistent authorization for the same user across different applications. Plus, Product Managers, Engineers and the Security team can easily get a bird’s eye view of who has access to each data type and how.

We have multiple authorization offerings within Netflix: from a simple system that grants access based on user identity to a more granular system that brings in the concept of roles and capabilities. DGS developers can choose a solution based on their needs. Then they simply annotate their resolvers with @Secured annotation and configure that to use one of the available systems. If needed, more complex authorization can be implemented in the resolver or in downstream systems.

Future of Authorization

We are currently prototyping a GraphQL-aware authorization solution. The Schema Registry automatically generates Access Control Groups (ACGs) for each field and its corresponding type when its schema is registered. Product managers & DGS Engineers decide membership and rules for these generated ACGs. Since the ACGs map to a field in GraphQL, the DGS framework then automatically applies the rules associated with the ACG during execution.

Architecting for Failure

The GraphQL Gateway is the single entry point for all requests; a failure on the gateway can cause significant disruptions. Following Netflix engineering best practices, we assume failures will happen and design ways to mitigate the impact of those failures. These are our design principles for ensuring the gateway layer is resilient:

  1. Single purpose
  2. Stateless service
  3. Demand controlled
  4. Multi-region
  5. Sharded by functionality

First, we focus the responsibilities of the gateway layer on a single purpose: parse client queries, then build and execute query plans. By reducing the scope, we limit the range of problems that can occur. We aim to perform any additional resource-intensive operations off-box with the exception of logging and metrics. Taking on additional unrelated logic in the gateway layer could increase surface area for failures in this critical tier.

Second, we run multiple stateless instances of the gateway service. Any gateway instance is able to generate and execute a query plan for any request. When we do code changes to the gateway layer, we rigorously test them before rolling out to production.

Third, we seek to balance the resources each request consumes through applying demand control. We rate-limit callers to avoid overloading the underlying databases that are the source of most of our domain elements. We also run a static query cost calculation on all incoming queries and reject expensive queries to avoid gridlock in gateway and DGS resources. Our partners understand these tradeoffs and work with us to meet these requirements, reworking expensive queries and reducing high volume callers.

Fourth, we deploy our gateway layer to multiple AWS regions around the world. This allows us to limit the blast radius for problems that inevitably arise. When problems happen, we can fail over to another region to ensure our clients are minimally impacted.

Last, we deploy multiple functional shards of our gateway layer. The code is the same in each shard and incoming requests are routed based on category. For example, GraphQL subscriptions generally result in long-lived connections while Queries & Mutations are short-lived. We use a separate fleet of instances for Subscriptions so “running out of connections” does not affect the availability of Queries and Mutations.

There is more we can do to improve resilience. We have plans to do canary deployments and analysis for gateway deployments and, eventually, schema changes. Today, our gateway dynamically updates its schema by polling the schema registry. We are in the process of decoupling these by storing the federation config in a versioned S3 bucket, making the gateway resilient to schema registry failures.

Closing Thoughts

GraphQL and Federation have been a productivity multiplier for Studio applications. Motivated by this, we’ve recently prototyped using GraphQL Federation for the Netflix consumer app search page on iOS & Android. To do this, we created three DGSs to provide the data for a minimal portion of the consumer graph. We are sending a small subset of users to this alternative stack and measuring high-level metrics. We are excited to see the results and explore further applicability in the Netflix consumer space.

Despite our positive experience, GraphQL Federation is early in its maturity lifecycle and may not be the best fit for every team or organization. Learning GraphQL and DGS development, running a federation layer, and doing a migration requires high commitment from partner teams and seamless cross-functional collaboration. If you’re considering going in this direction, we recommend checking out Apollo’s SaaS offering for Federation and the many online resources for learning GraphQL. For ecosystems like ours with a large swath of microservices that need to be aggregated together, the development velocity and improved operability has made the transition worth it.

In closing, we want to hear from you! If you have already implemented federation or tried to solve this problem with another approach, we would love to learn more. Sharing knowledge is one of the ways our industry learns and improves rapidly. Finally, if you’d like to be a part of solving complex and interesting problems like this at Netflix scale, check out our jobs page or reach out to us directly.

By Tejas Shikhare, Edited by Philip Fisher-Ogden

Additional Credits: Stephen Spalding, Jennifer Shin, Robert Reta, Antoine Boyer, Bruce Wang, David Simmer


How Netflix Scales its API with GraphQL Federation (Part 2) was originally published in Netflix TechBlog on Medium, where people are continuing the conversation by highlighting and responding to this story.

Building Netflix’s Distributed Tracing Infrastructure

Post Syndicated from Netflix Technology Blog original https://netflixtechblog.com/building-netflixs-distributed-tracing-infrastructure-bb856c319304

by Maulik Pandey

Our Team — Kevin Lew, Narayanan Arunachalam, Elizabeth Carretto, Dustin Haffner, Andrei Ushakov, Seth Katz, Greg Burrell, Ram Vaithilingam, Mike Smith and Maulik Pandey

@Netflixhelps Why doesn’t Tiger King play on my phone?” — a Netflix member via Twitter

This is an example of a question our on-call engineers need to answer to help resolve a member issue — which is difficult when troubleshooting distributed systems. Investigating a video streaming failure consists of inspecting all aspects of a member account. In our previous blog post we introduced Edgar, our troubleshooting tool for streaming sessions. Now let’s look at how we designed the tracing infrastructure that powers Edgar.

Distributed Tracing: the missing context in troubleshooting services at scale

Prior to Edgar, our engineers had to sift through a mountain of metadata and logs pulled from various Netflix microservices in order to understand a specific streaming failure experienced by any of our members. Reconstructing a streaming session was a tedious and time consuming process that involved tracing all interactions (requests) between the Netflix app, our Content Delivery Network (CDN), and backend microservices. The process started with manual pull of member account information that was part of the session. The next step was to put all puzzle pieces together and hope the resulting picture would help resolve the member issue. We needed to increase engineering productivity via distributed request tracing.

If we had an ID for each streaming session then distributed tracing could easily reconstruct session failure by providing service topology, retry and error tags, and latency measurements for all service calls. We could also get contextual information about the streaming session by joining relevant traces with account metadata and service logs. This insight led us to build Edgar: a distributed tracing infrastructure and user experience.

Figure 1. Troubleshooting a session in Edgar

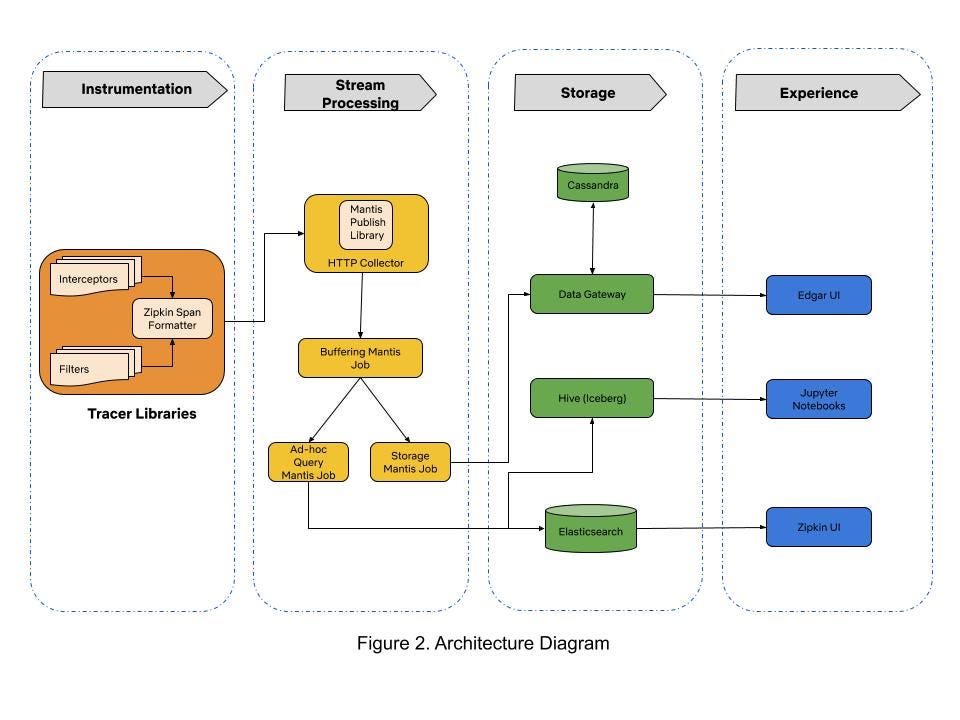
When we started building Edgar four years ago, there were very few open-source distributed tracing systems that satisfied our needs. Our tactical approach was to use Netflix-specific libraries for collecting traces from Java-based streaming services until open source tracer libraries matured. By 2017, open source projects like Open-Tracing and Open-Zipkin were mature enough for use in polyglot runtime environments at Netflix. We chose Open-Zipkin because it had better integrations with our Spring Boot based Java runtime environment. We use Mantis for processing the stream of collected traces, and we use Cassandra for storing traces. Our distributed tracing infrastructure is grouped into three sections: tracer library instrumentation, stream processing, and storage. Traces collected from various microservices are ingested in a stream processing manner into the data store. The following sections describe our journey in building these components.

Trace Instrumentation: how will it impact our service?

That is the first question our engineering teams asked us when integrating the tracer library. It is an important question because tracer libraries intercept all requests flowing through mission-critical streaming services. Safe integration and deployment of tracer libraries in our polyglot runtime environments was our top priority. We earned the trust of our engineers by developing empathy for their operational burden and by focusing on providing efficient tracer library integrations in runtime environments.

Distributed tracing relies on propagating context for local interprocess calls (IPC) and client calls to remote microservices for any arbitrary request. Passing the request context captures causal relationships between microservices during runtime. We adopted Open-Zipkin’s B3 HTTP header based context propagation mechanism. We ensure that context propagation headers are correctly passed between microservices across a variety of our “paved road” Java and Node runtime environments, which include both older environments with legacy codebases and newer environments such as Spring Boot. We execute the Freedom & Responsibility principle of our culture in supporting tracer libraries for environments like Python, NodeJS, and Ruby on Rails that are not part of the “paved road” developer experience. Our loosely coupled but highly aligned engineering teams have the freedom to choose an appropriate tracer library for their runtime environment and have the responsibility to ensure correct context propagation and integration of network call interceptors.

Our runtime environment integrations inject infrastructure tags like service name, auto-scaling group (ASG), and container instance identifiers. Edgar uses this infrastructure tagging schema to query and join traces with log data for troubleshooting streaming sessions. Additionally, it became easy to provide deep links to different monitoring and deployment systems in Edgar due to consistent tagging. With runtime environment integrations in place, we had to set an appropriate trace data sampling policy for building a troubleshooting experience.

Stream Processing: to sample or not to sample trace data?

This was the most important question we considered when building our infrastructure because data sampling policy dictates the amount of traces that are recorded, transported, and stored. A lenient trace data sampling policy generates a large number of traces in each service container and can lead to degraded performance of streaming services as more CPU, memory, and network resources are consumed by the tracer library. An additional implication of a lenient sampling policy is the need for scalable stream processing and storage infrastructure fleets to handle increased data volume.

We knew that a heavily sampled trace dataset is not reliable for troubleshooting because there is no guarantee that the request you want is in the gathered samples. We needed a thoughtful approach for collecting all traces in the streaming microservices while keeping low operational complexity of running our infrastructure.

Most distributed tracing systems enforce sampling policy at the request ingestion point in a microservice call graph. We took a hybrid head-based sampling approach that allows for recording 100% of traces for a specific and configurable set of requests, while continuing to randomly sample traffic per the policy set at ingestion point. This flexibility allows tracer libraries to record 100% traces in our mission-critical streaming microservices while collecting minimal traces from auxiliary systems like offline batch data processing. Our engineering teams tuned their services for performance after factoring in increased resource utilization due to tracing. The next challenge was to stream large amounts of traces via a scalable data processing platform.

Mantis is our go-to platform for processing operational data at Netflix. We chose Mantis as our backbone to transport and process large volumes of trace data because we needed a backpressure-aware, scalable stream processing system. Our trace data collection agent transports traces to Mantis job cluster via the Mantis Publish library. We buffer spans for a time period in order to collect all spans for a trace in the first job. A second job taps the data feed from the first job, does tail sampling of data and writes traces to the storage system. This setup of chained Mantis jobs allows us to scale each data processing component independently. An additional advantage of using Mantis is the ability to perform real-time ad-hoc data exploration in Raven using the Mantis Query Language (MQL). However, having a scalable stream processing platform doesn’t help much if you can’t store data in a cost efficient manner.

Storage: don’t break the bank!

We started with Elasticsearch as our data store due to its flexible data model and querying capabilities. As we onboarded more streaming services, the trace data volume started increasing exponentially. The increased operational burden of scaling ElasticSearch clusters due to high data write rate became painful for us. The data read queries took an increasingly longer time to finish because ElasticSearch clusters were using heavy compute resources for creating indexes on ingested traces. The high data ingestion rate eventually degraded both read and write operations. We solved this by migrating to Cassandra as our data store for handling high data ingestion rates. Using simple lookup indices in Cassandra gives us the ability to maintain acceptable read latencies while doing heavy writes.

In theory, scaling up horizontally would allow us to handle higher write rates and retain larger amounts of data in Cassandra clusters. This implies that the cost of storing traces grows linearly to the amount of data being stored. We needed to ensure storage cost growth was sub-linear to the amount of data being stored. In pursuit of this goal, we outlined following storage optimization strategies:

  1. Use cheaper Elastic Block Store (EBS) volumes instead of SSD instance stores in EC2.
  2. Employ better compression technique to reduce trace data size.
  3. Store only relevant and interesting traces by using simple rules-based filters.

We were adding new Cassandra nodes whenever the EC2 SSD instance stores of existing nodes reached maximum storage capacity. The use of a cheaper EBS Elastic volume instead of an SSD instance store was an attractive option because AWS allows dynamic increase in EBS volume size without re-provisioning the EC2 node. This allowed us to increase total storage capacity without adding a new Cassandra node to the existing cluster. In 2019 our stunning colleagues in the Cloud Database Engineering (CDE) team benchmarked EBS performance for our use case and migrated existing clusters to use EBS Elastic volumes. By optimizing the Time Window Compaction Strategy (TWCS) parameters, they reduced the disk write and merge operations of Cassandra SSTable files, thereby reducing the EBS I/O rate. This optimization helped us reduce the data replication network traffic amongst the cluster nodes because SSTable files were created less often than in our previous configuration. Additionally, by enabling Zstd block compression on Cassandra data files, the size of our trace data files was reduced by half. With these optimized Cassandra clusters in place, it now costs us 71% less to operate clusters and we could store 35x more data than our previous configuration.

We observed that Edgar users explored less than 1% of collected traces. This insight leads us to believe that we can reduce write pressure and retain more data in the storage system if we drop traces that users will not care about. We currently use a simple rule based filter in our Storage Mantis job that retains interesting traces for very rarely looked service call paths in Edgar. The filter qualifies a trace as an interesting data point by inspecting all buffered spans of a trace for warnings, errors, and retry tags. This tail-based sampling approach reduced the trace data volume by 20% without impacting user experience. There is an opportunity to use machine learning based classification techniques to further reduce trace data volume.

While we have made substantial progress, we are now at another inflection point in building our trace data storage system. Onboarding new user experiences on Edgar could require us to store 10x the amount of current data volume. As a result, we are currently experimenting with a tiered storage approach for a new data gateway. This data gateway provides a querying interface that abstracts the complexity of reading and writing data from tiered data stores. Additionally, the data gateway routes ingested data to the Cassandra cluster and transfers compacted data files from Cassandra cluster to S3. We plan to retain the last few hours worth of data in Cassandra clusters and keep the rest in S3 buckets for long term retention of traces.

Table 1. Timeline of Storage Optimizations

Secondary advantages

In addition to powering Edgar, trace data is used for the following use cases:

Application Health Monitoring

Trace data is a key signal used by Telltale in monitoring macro level application health at Netflix. Telltale uses the causal information from traces to infer microservice topology and correlate traces with time series data from Atlas. This approach paints a richer observability portrait of application health.

Resiliency Engineering

Our chaos engineering team uses traces to verify that failures are correctly injected while our engineers stress test their microservices via Failure Injection Testing (FIT) platform.

Regional Evacuation

The Demand Engineering team leverages tracing to improve the correctness of prescaling during regional evacuations. Traces provide visibility into the types of devices interacting with microservices such that changes in demand for these services can be better accounted for when an AWS region is evacuated.

Estimate infrastructure cost of running an A/B test

The Data Science and Product team factors in the costs of running A/B tests on microservices by analyzing traces that have relevant A/B test names as tags.

What’s next?

The scope and complexity of our software systems continue to increase as Netflix grows. We will focus on following areas for extending Edgar:

  • Provide a great developer experience for collecting traces across all runtime environments. With an easy way to to try out distributed tracing, we hope that more engineers instrument their services with traces and provide additional context for each request by tagging relevant metadata.
  • Enhance our analytics capability for querying trace data to enable power users at Netflix in building their own dashboards and systems for narrowly focused use cases.
  • Build abstractions that correlate data from metrics, logging, and tracing systems to provide additional contextual information for troubleshooting.

As we progress in building distributed tracing infrastructure, our engineers continue to rely on Edgar for troubleshooting streaming issues like “Why doesn’t Tiger King play on my phone?”. Our distributed tracing infrastructure helps in ensuring that Netflix members continue to enjoy a must-watch show like Tiger King!

We are looking for stunning colleagues to join us on this journey of building distributed tracing infrastructure. If you are passionate about Observability then come talk to us.


Building Netflix’s Distributed Tracing Infrastructure was originally published in Netflix TechBlog on Medium, where people are continuing the conversation by highlighting and responding to this story.

Why Deployment Requirements are Important When Making Architectural Choices

Post Syndicated from Yusuf Mayet original https://aws.amazon.com/blogs/architecture/why-deployment-requirements-are-important-when-making-architectural-choices/

Introduction

Too often, architects fall into the trap of thinking the architecture of an application is restricted to just the runtime part of the architecture. By doing this we focus on only a single customer (such as the application’s users and how they interact with the system) and we forget about other important customers like developers and DevOps teams. This means that requirements regarding deployment ease, deployment frequency, and observability are delegated to the back burner during design time and tacked on after the runtime architecture is built. This leads to increased costs and reduced ability to innovate.

In this post, I discuss the importance of key non-functional requirements, and how they can and should influence the target architecture at design time.

Architectural patterns

When building and designing new applications, we usually start by looking at the functional requirements, which will define the functionality and objective of the application. These are all the things that the users of the application expect, such as shopping online, searching for products, and ordering. We also consider aspects such as usability to ensure a great user experience (UX).

We then consider the non-functional requirements, the so-called “ilities,” which typically include requirements regarding scalability, availability, latency, etc. These are constraints around the functional requirements, like response times for placing orders or searching for products, which will define the expected latency of the system.

These requirements—both functional and non-functional together—dictate the architectural pattern we choose to build the application. These patterns include Multi-tierevent-driven architecturemicroservices, and others, and each one has benefits and limitations. For example, a microservices architecture allows for a system where services can be deployed and scaled independently, but this also introduces complexity around service discovery.

Aligning the architecture to technical users’ requirements

Amazon is a customer-obsessed organization, so it’s important for us to first identify who the main customers are at each point so that we can meet their needs. The customers of the functional requirements are the application users, so we need to ensure the application meets their needs. For the most part, we will ensure that the desired product features are supported by the architecture.

But who are the users of the architecture? Not the applications’ users—they don’t care if it’s monolithic or microservices based, as long as they can shop and search for products. The main customers of the architecture are the technical teams: the developers, architects, and operations teams that build and support the application. We need to work backwards from the customers’ needs (in this case the technical team), and make sure that the architecture meets their requirements. We have therefore identified three non-functional requirements that are important to consider when designing an architecture that can equally meet the needs of the technical users:

  1. Deployability: Flow and agility to consistently deploy new features
  2. Observability: feedback about the state of the application
  3. Disposability: throwing away resources and provision new ones quickly

Together these form part of the Developer Experience (DX), which is focused on providing developers with APIs, documentation, and other technologies to make it easy to understand and use. This will ensure that we design for Day 2 operations in mind.

Deployability: Flow

There are many reasons that organizations embark on digital transformation journeys, which usually involve moving to the cloud and adopting DevOps. According to Stephen Orban, GM of AWS Data Exchange, in his book Ahead in the Cloud, faster product development is often a key motivator, meaning the most important non-functional requirement is achieving flow, the speed at which you can consistently deploy new applications, respond to competitors, and test and roll out new features. As well, the architecture needs to be designed upfront to support deployability. If the architectural pattern is a monolithic application, this will hamper the developers’ ability to quickly roll out new features to production. So we need to choose and design the architecture to support easy and automated deployments. Results from years of research prove that leaders use DevOps to achieve high levels of throughput:

Graphic - Using DevOps to achieve high levels of throughput

Decisions on the pace and frequency of deployments will dictate whether to use rolling, blue/green, or canary deployment methodologies. This will then inform the architectural pattern chosen for the application.

Using AWS, in order to achieve flow of deployability, we will use services such as AWS CodePipelineAWS CodeBuildAWS CodeDeploy and AWS CodeStar.

Observability: feedback

Once you have achieved a rapid and repeatable flow of features into production, you need a constant feedback loop of logs and metrics in order to detect and avoid problems. Observability is a property of the architecture that will allow us to better understand the application across the delivery pipeline and into production. This requires that we design the architecture to ensure that health reports are generated to analyze and spot trends. This includes error rates and stats from each stage of the development process, how many commits were made, build duration, and frequency of deployments. This not only allows us to measure code characteristics such as test coverage, but also developer productivity.

On AWS, we can leverage Amazon CloudWatch to gather and search through logs and metrics, AWS X-Ray for tracing, and Amazon QuickSight as an analytics tool to measure CI/CD metrics.

Disposability: automation

In his book, Cloud Strategy: A Decision-based Approach to a Successful Cloud Journey, Gregor Hohpe, Enterprise Strategist at AWS, notes that cloud and automation add a new “-ility”: disposability, which is the ability to set up and dispose of new servers in an automated and pain-free manner. Having immutable, disposable infrastructure greatly enhances your ability to achieve high levels of deployability and flow, especially when used in a CI/CD pipeline, which can create new resources and kill off the old ones.

At AWS, we can achieve disposability with serverless using AWS Lambda, or with containers running on Amazon Elastic Container Service (ECS) or Amazon Elastic Kubernetes Service (EKS), or using AWS Auto Scaling with Amazon Elastic Compute Cloud (EC2).

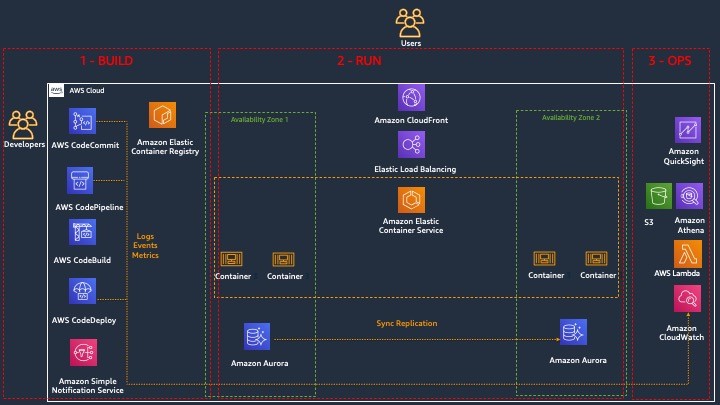
Three different views of the architecture

Once we have designed an architecture that caters for deployability, observability, and disposability, it exposes three lenses across which we can view the architecture:

3 views of the architecture

  1. Build lens: the focus of this part of the architecture is on achieving deployability, with the objective to give the developers an easy-to-use, automated platform that builds, tests, and pushes their code into the different environments, in a repeatable way. Developers can push code changes more reliably and frequently, and the operations team can see greater stability because environments have standard configurations and rollback procedures are automated
  2. Runtime lens: the focus is on the users of the application and on maximizing their experience by making the application responsive and highly available.
  3. Operate lens: the focus is on achieving observability for the DevOps teams, allowing them to have complete visibility into each part of the architecture.

Summary

When building and designing new applications, the functional requirements (such as UX) are usually the primary drivers for choosing and defining the architecture to support those requirements. In this post I have discussed how DX characteristics like deployability, observability, and disposability are not just operational concerns that get tacked on after the architecture is chosen. Rather, they should be as important as the functional requirements when choosing the architectural pattern. This ensures that the architecture can support the needs of both the developers and users, increasing quality and our ability to innovate.

Edgar: Solving Mysteries Faster with Observability

Post Syndicated from Netflix Technology Blog original https://netflixtechblog.com/edgar-solving-mysteries-faster-with-observability-e1a76302c71f

Edgar helps Netflix teams troubleshoot distributed systems efficiently with the help of a summarized presentation of request tracing, logs, analysis, and metadata.

by Elizabeth Carretto

Everyone loves Unsolved Mysteries. There’s always someone who seems like the surefire culprit. There’s a clear motive, the perfect opportunity, and an incriminating footprint left behind. Yet, this is Unsolved Mysteries! It’s never that simple. Whether it’s a cryptic note behind the TV or a mysterious phone call from an unknown number at a critical moment, the pieces rarely fit together perfectly. As mystery lovers, we want to answer the age-old question of whodunit; we want to understand what really happened.

For engineers, instead of whodunit, the question is often “what failed and why?” When a problem occurs, we put on our detective hats and start our mystery-solving process by gathering evidence. The more complex a system, the more places to look for clues. An engineer can find herself digging through logs, poring over traces, and staring at dozens of dashboards.

All of these sources make it challenging to know where to begin and add to the time spent figuring out what went wrong. While this abundance of dashboards and information is by no means unique to Netflix, it certainly holds true within our microservices architecture. Each microservice may be easy to understand and debug individually, but what about when combined into a request that hits tens or hundreds of microservices? Searching for key evidence becomes like digging for a needle in a group of haystacks.

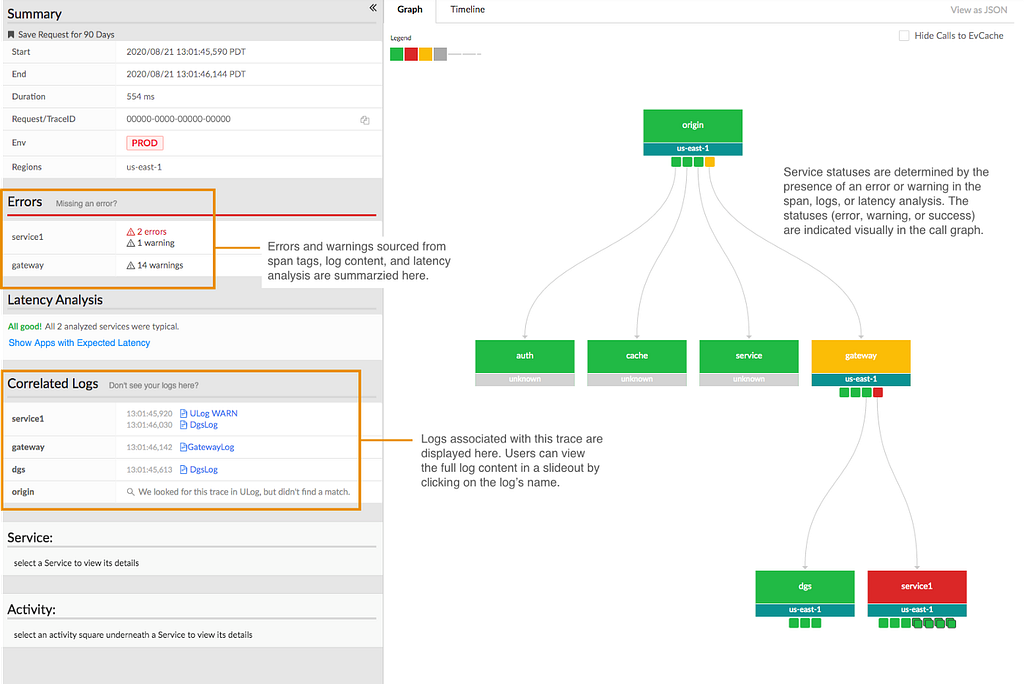
Example call graph in Edgar

In some cases, the question we’re answering is, “What’s happening right now??” and every second without resolution can carry a heavy cost. We want to resolve the problem as quickly as possible so our members can resume enjoying their favorite movies and shows. For teams building observability tools, the question is: how do we make understanding a system’s behavior fast and digestible? Quick to parse, and easy to pinpoint where something went wrong even if you aren’t deeply familiar with the inner workings and intricacies of that system? At Netflix, we’ve answered that question with a suite of observability tools. In an earlier blog post, we discussed Telltale, our health monitoring system. Telltale tells us when an application is unhealthy, but sometimes we need more fine-grained insight. We need to know why a specific request is failing and where. We built Edgar to ease this burden, by empowering our users to troubleshoot distributed systems efficiently with the help of a summarized presentation of request tracing, logs, analysis, and metadata.

What is Edgar?

Edgar is a self-service tool for troubleshooting distributed systems, built on a foundation of request tracing, with additional context layered on top. With request tracing and additional data from logs, events, metadata, and analysis, Edgar is able to show the flow of a request through our distributed system — what services were hit by a call, what information was passed from one service to the next, what happened inside that service, how long did it take, and what status was emitted — and highlight where an issue may have occurred. If you’re familiar with platforms like Zipkin or OpenTelemetry, this likely sounds familiar. But, there are a few substantial differences in how Edgar approaches its data and its users.

  • While Edgar is built on top of request tracing, it also uses the traces as the thread to tie additional context together. Deriving meaningful value from trace data alone can be challenging, as Cindy Sridharan articulated in this blog post. In addition to trace data, Edgar pulls in additional context from logs, events, and metadata, sifting through them to determine valuable and relevant information, so that Edgar can visually highlight where an error occurred and provide detailed context.
  • Edgar captures 100% of interesting traces, as opposed to sampling a small fixed percentage of traffic. This difference has substantial technological implications, from the classification of what’s interesting to transport to cost-effective storage (keep an eye out for later Netflix Tech Blog posts addressing these topics).
  • Edgar provides a powerful and consumable user experience to both engineers and non-engineers alike. If you embrace the cost and complexity of storing vast amounts of traces, you want to get the most value out of that cost. With Edgar, we’ve found that we can leverage that value by curating an experience for additional teams such as customer service operations, and we have embraced the challenge of building a product that makes trace data easy to access, easy to grok, and easy to gain insight by several user personas.

Tracing as a foundation

Logs, metrics, and traces are the three pillars of observability. Metrics communicate what’s happening on a macro scale, traces illustrate the ecosystem of an isolated request, and the logs provide a detail-rich snapshot into what happened within a service. These pillars have immense value and it is no surprise that the industry has invested heavily in building impressive dashboards and tooling around each. The downside is that we have so many dashboards. In one request hitting just ten services, there might be ten different analytics dashboards and ten different log stores. However, a request has its own unique trace identifier, which is a common thread tying all the pieces of this request together. The trace ID is typically generated at the first service that receives the request and then passed along from service to service as a header value. This makes the trace a great starting point to unify this data in a centralized location.

A trace is a set of segments representing each step of a single request throughout a system. Distributed tracing is the process of generating, transporting, storing, and retrieving traces in a distributed system. As a request flows between services, each distinct unit of work is documented as a span. A trace is made up of many spans, which are grouped together using a trace ID to form a single, end-to-end umbrella. A span:

  • Represents a unit of work, such as a network call from one service to another (a client/server relationship) or a purely internal action (e.g., starting and finishing a method).
  • Relates to other spans through a parent/child relationship.
  • Contains a set of key value pairs called tags, where service owners can attach helpful values such as urls, version numbers, regions, corresponding IDs, and errors. Tags can be associated with errors or warnings, which Edgar can display visually on a graph representation of the request.
  • Has a start time and an end time. Thanks to these timestamps, a user can quickly see how long the operation took.

The trace (along with its underlying spans) allows us to graphically represent the request chronologically.

Sample timeline view of a trace, based on Jaegar UI’s timeline view

Adding context to traces

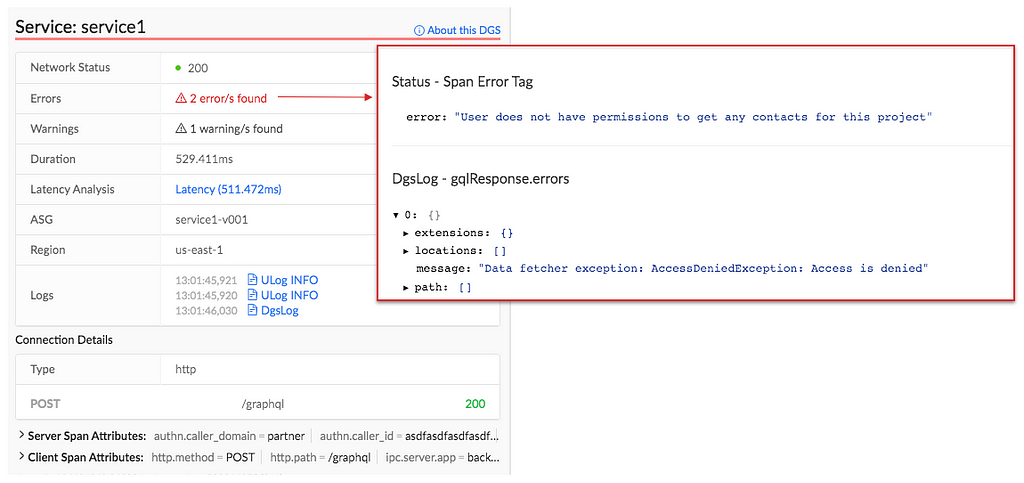
With distributed tracing alone, Edgar is able to draw the path of a request as it flows through various systems. This centralized view is extremely helpful to determine which services were hit and when, but it lacks nuance. A tag might indicate there was an error but doesn’t fully answer the question of what happened. Adding logs to the picture can help a great deal. With logs, a user can see what the service itself had to say about what went wrong. If a data fetcher fails, the log can tell you what query it was running and what exact IDs or fields led to the failure. That alone might give an engineer the knowledge she needs to reproduce the issue. In Edgar, we parse the logs looking for error or warning values. We add these errors and warnings to our UI, highlighting them in our call graph and clearly associating them with a given service, to make it easy for users to view any errors we uncovered.

Example view of errors associated with a service, including an error parsed from a log

With the trace and additional context from logs illustrating the issue, one of the next questions may be how does this individual trace fit into the overall health and behavior of each service. Is this an anomaly or are we dealing with a pattern? To help answer this question, Edgar pulls in anomaly detection from a partner application, Telltale. Telltale provides Edgar with latency benchmarks that indicate if the individual trace’s latency is abnormal for this given service. A trace alone could tell you that a service took 500ms to respond, but it takes in-depth knowledge of a particular service’s typical behavior to make a determination if this response time is an outlier. Telltale’s anomaly analysis looks at historic behavior and can evaluate whether the latency experienced by this trace is anomalous. With this knowledge, Edgar can then visually warn that something happened in a service that caused its latency to fall outside of normal bounds.

Sample latency analysis

Edgar should reduce burden, not add to it

Presenting all of this data in one interface reduces the footwork of an engineer to uncover each source. However, discovery is only part of the path to resolution. With all the evidence presented and summarized by Edgar, an engineer may know what went wrong and where it went wrong. This is a huge step towards resolution, but not yet cause for celebration. The root cause may have been identified, but who owns the service in question? Many times, finding the right point of contact would require a jump into Slack or a company directory, which costs more time. In Edgar, we have integrated with our services to provide that information in-app alongside the details of a trace. For any service configured with an owner and support channel, Edgar provides a link to a service’s contact email and their Slack channel, smoothing the hand-off from one party to the next. If an engineer does need to pass an issue along to another team or person, Edgar’s request detail page contains all the context — the trace, logs, analysis — and is easily shareable, eliminating the need to write a detailed description or provide a cascade of links to communicate the issue.

Edgar’s request detail page

A key aspect of Edgar’s mission is to minimize the burden on both users and service owners. With all of its data sources, the sheer quantity of data could become overwhelming. It is essential for Edgar to maintain a prioritized interface, built to highlight errors and abnormalities to the user and assist users in taking the next step towards resolution. As our UI grows, it’s important to be discerning and judicious in how we handle new data sources, weaving them into our existing errors and warnings models to minimize disruption and to facilitate speedy understanding. We lean heavily on focus groups and user feedback to ensure a tight feedback loop so that Edgar can continue to meet our users’ needs as their services and use cases evolve.

As services evolve, they might change their log format or use new tags to indicate errors. We built an admin page to give our service owners that configurability and to decouple our product from in-depth service knowledge. Service owners can configure the essential details of their log stores, such as where their logs are located and what fields they use for trace IDs and span IDs. Knowing their trace and span IDs is what enables Edgar to correlate the traces and logs. Beyond that though, what are the idiosyncrasies of their logs? Some fields may be irrelevant or deprecated, and teams would like to hide them by default. Alternatively, some fields contain the most important information, and by promoting them in the Edgar UI, they are able to view these fields more quickly. This self-service configuration helps reduce the burden on service owners.

Initial log configuration in Edgar

Leveraging Edgar

In order for users to turn to Edgar in a situation when time is of the essence, users need to be able to trust Edgar. In particular, they need to be able to count on Edgar having data about their issue. Many approaches to distributed tracing involve setting a sample rate, such as 5%, and then only tracing that percentage of request traffic. Instead of sampling a fixed percentage, Edgar’s mission is to capture 100% of interesting requests. As a result, when an error happens, Edgar’s users can be confident they will be able to find it. That’s key to positioning Edgar as a reliable source. Edgar’s approach makes a commitment to have data about a given issue.

In addition to storing trace data for all requests, Edgar implemented a feature to collect additional details on-demand at a user’s discretion for a given criteria. With this fine-grained level of tracing turned on, Edgar captures request and response payloads as well as headers for requests matching the user’s criteria. This adds clarity to exactly what data is being passed from service to service through a request’s path. While this level of granularity is unsustainable for all request traffic, it is a robust tool in targeted use cases, especially for errors that prove challenging to reproduce.

As you can imagine, this comes with very real storage costs. While the Edgar team has done its best to manage these costs effectively and to optimize our storage, the cost is not insignificant. One way to strengthen our return on investment is by being a key tool throughout the software development lifecycle. Edgar is a crucial tool for operating and maintaining a production service, where reducing the time to recovery has direct customer impact. Engineers also rely on our tool throughout development and testing, and they use the Edgar request page to communicate issues across teams.

By providing our tool to multiple sets of users, we are able to leverage our cost more efficiently. Edgar has become not just a tool for engineers, but rather a tool for anyone who needs to troubleshoot a service at Netflix. In Edgar’s early days, as we strove to build valuable abstractions on top of trace data, the Edgar team first targeted streaming video use cases. We built a curated experience for streaming video, grouping requests into playback sessions, marked by starting and stopping playback for a given asset. We found this experience was powerful for customer service operations as well as engineering teams. Our team listened to customer service operations to understand which common issues caused an undue amount of support pain so that we could summarize these issues in our UI. This empowers customer service operations, as well as engineers, to quickly understand member issues with minimal digging. By logically grouping traces and summarizing the behavior at a higher level, trace data becomes extremely useful in answering questions like why a member didn’t receive 4k video for a certain title or why a member couldn’t watch certain content.

An example error viewing a playback session in Edgar

Extending Edgar for Studio

As the studio side of Netflix grew, we realized that our movie and show production support would benefit from a similar aggregation of user activity. Our movie and show production support might need to answer why someone from the production crew can’t log in or access their materials for a particular project. As we worked to serve this new user group, we sought to understand what issues our production support needed to answer most frequently and then tied together various data sources to answer those questions in Edgar.

The Edgar team built out an experience to meet this need, building another abstraction with trace data; this time, the focus was on troubleshooting production-related use cases and applications, rather than a streaming video session. Edgar provides our production support the ability to search for a given contractor, vendor, or member of production staff by their name or email. After finding the individual, Edgar reaches into numerous log stores for their user ID, and then pulls together their login history, role access change log, and recent traces emitted from production-related applications. Edgar scans through this data for errors and warnings and then presents those errors right at the front. Perhaps a vendor tried to login with the wrong password too many times, or they were assigned an incorrect role on a production. In this new domain, Edgar is solving the same multi-dashboarded problem by tying together information and pointing its users to the next step of resolution.

An example error for a production-related user

What Edgar is and is not

Edgar’s goal is not to be the be-all, end-all of tools or to be the One Tool to Rule Them All. Rather, our goal is to act as a concierge of troubleshooting — Edgar should quickly be able to guide users to an understanding of an issue, as well usher them to the next location, where they can remedy the problem. Let’s say a production vendor is unable to access materials for their production due to an incorrect role/permissions assignment, and this production vendor reaches out to support for assistance troubleshooting. When a support user searches for this vendor, Edgar should be able to indicate that this vendor recently had a role change and summarize what this role change is. Instead of being assigned to Dead To Me Season 2, they were assigned to Season 1! In this case, Edgar’s goal is to help a support user come to this conclusion and direct them quickly to the role management tool where this can be rectified, not to own the full circle of resolution.
Usage at Netflix

While Edgar was created around Netflix’s core streaming video use-case, it has since evolved to cover a wide array of applications. While Netflix streaming video is used by millions of members, some applications using Edgar may measure their volume in requests per minute, rather than requests per second, and may only have tens or hundreds of users rather than millions. While we started with a curated approach to solve a pain point for engineers and support working on streaming video, we found that this pain point is scale agnostic. Getting to the bottom of a problem is costly for all engineers, whether they are building a budget forecasting application used heavily by 30 people or a SVOD application used by millions.

Today, many applications and services at Netflix, covering a wide array of type and scale, publish trace data that is accessible in Edgar, and teams ranging from service owners to customer service operations rely on Edgar’s insights. From streaming to studio, Edgar leverages its wealth of knowledge to speed up troubleshooting across applications with the same fundamental approach of summarizing request tracing, logs, analysis, and metadata.

As you settle into your couch to watch a new episode of Unsolved Mysteries, you may still find yourself with more questions than answers. Why did the victim leave his house so abruptly? How did the suspect disappear into thin air? Hang on, how many people saw that UFO?? Unfortunately, Edgar can’t help you there (trust me, we’re disappointed too). But, if your relaxing evening is interrupted by a production outage, Edgar will be behind the scenes, helping Netflix engineers solve the mystery at hand.

Keeping services up and running allows Netflix to share stories with our members around the globe. Underneath every outage and failure, there is a story to tell, and powerful observability tooling is needed to tell it. If you are passionate about observability then come talk to us.


Edgar: Solving Mysteries Faster with Observability was originally published in Netflix TechBlog on Medium, where people are continuing the conversation by highlighting and responding to this story.