Post Syndicated from Explosm.net original https://explosm.net/comics/32453
New Cyanide and Happiness Comic
Post Syndicated from Explosm.net original https://explosm.net/comics/32453
New Cyanide and Happiness Comic
Post Syndicated from jzb original https://lwn.net/Articles/995293/
Security updates have been issued by Debian (dmitry, libheif, and python-sql), Fedora (suricata and wireshark), SUSE (cargo-c, libeverest, protobuf, and qemu), and Ubuntu (golang-1.22, libheif, unbound, and webkit2gtk).
Post Syndicated from Nick Wood original https://blog.cloudflare.com/training-a-million-models-per-day-to-save-customers-of-all-sizes-from-ddos
Our always-on DDoS protection runs inside every server across our global network. It constantly analyzes incoming traffic, looking for signals associated with previously identified DDoS attacks. We dynamically create fingerprints to flag malicious traffic, which is dropped when detected in high enough volume — so it never reaches its destination — keeping customer websites online.
In many cases, flagging bad traffic can be straightforward. For example, if we see too many requests to a destination with the same protocol violation, we can be fairly sure this is an automated script, rather than a surge of requests from a legitimate web browser.
Our DDoS systems are great at detecting attacks, but there’s a minor catch. Much like the human immune system, they are great at spotting attacks similar to things they have seen before. But for new and novel threats, they need a little help knowing what to look for, which is an expensive and time-consuming human endeavor.
Cloudflare protects millions of Internet properties, and we serve over 60 million HTTP requests per second on average, so trying to find unmitigated attacks in such a huge volume of traffic is a daunting task. In order to protect the smallest of companies, we need a way to find unmitigated attacks that may only be a few thousand requests per second, as even these can be enough to take smaller sites offline.
To better protect our customers, we also have a system to automatically identify unmitigated, or partially mitigated DDoS attacks, so we can better shore up our defenses against emerging threats. In this post we will introduce this anomaly detection pipeline, we’ll provide an overview of how it builds statistical models which flag unusual traffic and keep our customers safe. Let’s jump in!
A DDoS attack, by definition, is characterized by a higher than normal volume of traffic destined for a particular destination. We can use this fact to loosely sketch out a potential approach. Let’s look at an example website, and look at the request volume over the course of a day, broken down into 1 minute intervals.

We can plot this same data as a histogram:

The data follows a bell-shaped curve, also known as a normal distribution. We can use this fact to flag observations which appear outside the usual range. By first calculating the mean and standard deviation of our dataset, we can then use these values to rate new observations by calculating how many standard deviations (or sigma) the data is from the mean.
This value is also called the z-score — a z-score of 3 is the same as 3-sigma, which corresponds to 3 standard deviations from the mean. A data point with a high enough z-score is sufficiently unusual that it might signal an attack. Since the mean and standard deviation are stationary, we can calculate a request volume threshold for each z-score value, and use traffic volumes above these thresholds to signal an ongoing attack.

Trigger thresholds for z-score of 3, 4 and 5
Unfortunately, it’s incredibly rare to see traffic that is this uniform in practice, as user load will naturally vary over a day. Here I’ve simulated some traffic for a website which runs a meal delivery service, and as you might expect it has big peaks around meal times, and low traffic overnight since it only operates in a single country.

Our volume data no longer follows a normal distribution and our 3-sigma threshold is now much further away, so smaller attacks could pass undetected.
Many websites elastically scale their underlying hardware based upon anticipated load to save on costs. In the example above the website operator would run far fewer servers overnight, when the anticipated load is low, to save on running costs. This makes the website more vulnerable to attacks during off-peak hours as there would be less hardware to absorb them. An attack as low as a few hundred requests per minute may be enough to overwhelm the site early in the morning, even though the peak-time infrastructure could easily absorb this volume.
This approach relies on traffic volume being stable over time, meaning it’s roughly flat throughout the day, but this is rarely true in practice. Even when it is true, benign increases in traffic are common, such as an e-commerce site running a Black Friday sale. In this situation, a website would expect a surge in traffic that our model wouldn’t anticipate, and we may incorrectly flag real shoppers as attackers.
It turns out this approach makes too many naive assumptions about what traffic should look like, so it’s impossible to choose an appropriate sigma threshold which works well for all customers.
Let’s continue with trying to determine a volumetric baseline for our meal delivery example. A reasonable assumption we could add is that yesterday’s traffic shape should approximate the expected shape of traffic today. This idea is called “seasonality”. Weekly seasonality is also pretty common, i.e. websites see more or less traffic on certain weekdays or on weekends.
There are many methods designed to analyze a dataset, unpick the varying horizons of seasonality within it, and then build an appropriate predictive model. We won’t go into them here but reading about Seasonal ARIMA (SARIMA) is a good place to start if you are looking for further information.
There are three main challenges that make SARIMA methods unsuitable for our purposes. First is that in order to get a good idea of seasonality, you need a lot of data. To predict weekly seasonality, you need at least a few weeks worth of data. We’d require a massive dataset to predict monthly, or even annual, patterns (such as Black Friday). This means new customers wouldn’t be protected until they’d been with us for multiple years, so this isn’t a particularly practical approach.
The second issue is the cost of training models. In order to maintain good accuracy, time series models need to be frequently retrained. The exact frequency varies between methods, but in the worst cases, a model is only good for 2–3 inferences, meaning we’d need to retrain all our models every 10–20 minutes. This is feasible, but it’s incredibly wasteful.
The third hurdle is the hardest to work around, and is the reason why a purely volumetric model doesn’t work. Most websites experience completely benign spikes in traffic that lie outside prior norms. Flash sales are one such example, or 1,000,000 visitors driven to a site from Reddit, or a Super Bowl commercial.
So if volumetric modeling won’t work, what can we do instead? Fortunately, volume isn’t the only axis we can use to measure traffic. Consider the end users’ browsers for example. It would be reasonable to assume that over a given time interval, the proportion of users across the top 5 browsers would remain reasonably stationary, or at least within a predictable range. More importantly, this proportion is unlikely to change too much during benign traffic surges.
Through careful analysis we were able to discover about a dozen such variables with the following features for a given zone:
They follow a normal distribution
They aren’t correlated, or are only loosely correlated with volume
They deviate from the underlying normal distribution during “under attack” events
Recall our initial volume model, where we used z-score to define a cutoff. We can expand this same idea to multiple dimensions. We have a dozen different time series (each feature is a single time series), which we can imagine as a cloud of points in 12 dimensions. Here is a sample showing 3 such features, with each point representing the traffic readings at a different point in time. Note that both graphs show the same cloud of points from two different angles.

To use our z-score analogy from before, we’d want our points to be spherical, since our multidimensional- z-score is then just the distance from the centre of the cloud. We could then use this distance to define a cutoff threshold for attacks.
For several reasons, a perfect sphere is unlikely in practice. Our various features measure different things, so they have very different scales of ‘normal’. One property might vary between 100-300 whereas another property might usually occupy the interval 0-1. A change of 3 in this latter property would be a significant anomaly, whereas in the first this would just be within the normal range.
More subtly, two or more axes may be correlated, so an increase in one is usually mirrored with a proportional increase/decrease in another dimension. This turns our sphere into an off-axis disc shape, as pictured above.
Fortunately, we have a couple of mathematical tricks up our sleeve. The first is scale normalization. In each of our n dimensions, we subtract the mean, and divide by the standard deviation. This makes all our dimensions the same size and centres them around zero. This gives a multidimensional analogue of z-score, but it won’t fix the disc shape.
What we can do is figure out the orientation and dimensions of the disc, and for this we use a tool called Principal Component Analysis (PCA). This lets us reorient our disc, and rescale the axes according to their size, to make them all the same.
Imagine grabbing the disc out of the air, then drawing new X and Y axes on the top surface, with the origin at the center of the disc. Our new Z-axis is the thickness of the disc. We can compare the thickness to the diameter of the disc, to give us a scaling factor for the Z direction. Imagine stretching the disc along the z-axis until it’s as tall as the length across the diameter.
In reality there’s nothing to say that X & Y have to be the same size either, but hopefully you get the general idea. PCA lets us draw new axes along these lines of correlation in an arbitrary number of dimensions, and convert our n-dimensional disc into a nicely behaved sphere of points (technically an n-dimensional sphere).
Having done all this work, we can uniquely define a coordinate transformation which takes any measurement from our raw features, and tells us where it should lie in the sphere, and since all our dimensions are the same size we can generate an anomaly score purely based on its distance from the centre of the cloud.
As a final trick, we can also use a final scaling operation to ensure the sphere for dataset A is the same size as the sphere generated from dataset B, meaning we can do this same process for any traffic data and define a cutoff distance λ which is the same across all our models. Rather than fine-tuning models for each individual customer zone, we can tune this to a value which applies globally.
Another name for this measurement is Mahalanobis distance. (Inclined readers can understand this equivalence by considering the role of the covariance matrix in PCA and Mahalanobis distance. Further discussion can be found on this StackExchange post.) We further tune the process to discard dimensions with little variance — if our disc is too thin we discard the thickness dimension. In practice, such dimensions were too sensitive to be useful.

We’re left with a multidimensional analogue of the z-score we started with, but this time our variables aren’t correlated with peacetime traffic volume. Above we show 2 output dimensions, with coloured circles which show Mahalanobis distances of 4, 5 and 6. Anything outside the green circle will be classified as an attack.
The approach we’ve outlined is incredibly parallelizable: a single model requires only the traffic data for that one website, and the datasets needed can be quite small. We use 4 weeks of training data chunked into 5 minute intervals which is only ~8k rows/website.
We run all our training and inference in an Apache Airflow deployment in Kubernetes. Due to the parallelizability, we can scale horizontally as needed. On average, we can train about 3 models/second/thread. We currently retrain models every day, but we’ve observed very little intraday model drift (i.e. yesterday’s model is the same as today’s), so training frequency may be reduced in the future.
We don’t consider it necessary to build models for all our customers, instead we train models for a large sample of representative customers, including a large number on the Free plan. The goal is to identify attacks for further study which we then use to tune our existing DDoS systems for all customers.
If you’ve read this far you may have questions, like “how do you filter attacks from your training data?” or you may have spotted a handful of other technical details which I’ve elided to keep this post accessible to a general audience. If so, you would fit in well here at Cloudflare. We’re helping to build a better Internet, and we’re hiring.
Post Syndicated from Omer Yoachimik original https://blog.cloudflare.com/ddos-threat-report-for-2024-q3
Welcome to the 19th edition of the Cloudflare DDoS Threat Report. Released quarterly, these reports provide an in-depth analysis of the DDoS threat landscape as observed across the Cloudflare network. This edition focuses on the third quarter of 2024.
With a 296 Terabit per second (Tbps) network located in over 330 cities worldwide, Cloudflare is used as a reverse proxy by nearly 20% of all websites. Cloudflare holds a unique vantage point to provide valuable insights and trends to the broader Internet community.
The number of DDoS attacks spiked in the third quarter of 2024. Cloudflare mitigated nearly 6 million DDoS attacks, representing a 49% increase QoQ and 55% increase YoY.
Out of those 6 million, Cloudflare’s autonomous DDoS defense systems detected and mitigated over 200 hyper-volumetric DDoS attacks exceeding rates of 3 terabits per second (Tbps) and 2 billion packets per second (Bpps). The largest attack peaked at 4.2 Tbps and lasted just a minute.
The Banking & Financial Services industry was subjected to the most DDoS attacks. China was the country most targeted by DDoS attacks, and Indonesia was the largest source of DDoS attacks.
To learn more about DDoS attacks and other types of cyber threats, visit our Learning Center, access previous DDoS threat reports on the Cloudflare blog, or visit our interactive hub, Cloudflare Radar. There’s also a free API for those interested in investigating these and other Internet trends. You can also learn more about the methodologies used in preparing these reports.
In the first half of 2024, Cloudflare’s autonomous DDoS defense systems automatically detected and mitigated 8.5 million DDoS attacks: 4.5 million in Q1 and 4 million in Q2. In Q3, our systems mitigated nearly 6 million DDoS attacks bringing it to a total of 14.5 million DDoS attacks year-to-date. That’s an average of around 2,200 DDoS attacks every hour.
Of those attacks, Cloudflare mitigated over 200 hyper-volumetric network-layer DDoS attacks that exceeded 1 Tbps or 1 Bpps. The largest attacks peaked at 3.8 Tbps and 2.2 Bpps. Read more about these attacks and how our DDoS defense systems mitigated them autonomously.

Distribution of hyper-volumetric DDoS attacks over time
As we were writing this blog post, our systems continued to detect and mitigate these massive attacks and a new record has just been broken again, only three weeks after our last disclosure. On October 21, 2024, Cloudflare’s systems autonomously detected and mitigated a 4.2 Tbps DDoS attack that lasted around a minute.

4.2 Tbps DDoS attack mitigated autonomously by Cloudflare
Of the 6 million DDoS attacks, half were HTTP (application layer) DDoS attacks and half were network layer DDoS attacks. Network layer DDoS attacks increased by 51% QoQ and 45% YoY, and HTTP DDoS attacks increased by 61% QoQ and 68% YoY.
90% of DDoS attacks, including the largest of attacks, were very short-lived. We did see, however, a slight increase (7%) in attacks lasting more than an hour. These longer attacks accounted for 3% of all attacks.
In Q3, we saw an even distribution in the number of network-layer DDoS attacks compared to HTTP DDoS attacks. Of the network-layer DDoS attacks, SYN flood was the top attack vector followed by DNS flood attacks, UDP floods, SSDP reflection attacks, and ICMP reflection attacks.
On the application layer, 72% of HTTP DDoS attacks were launched by known botnets and automatically mitigated by our proprietary heuristics. The fact that 72% of DDoS attacks were mitigated by our home-grown heuristics showcases the advantages of operating a large network. The volume of traffic and attacks that we see let us craft, test, and deploy robust defenses against botnets.
Another 13% of HTTP DDoS attacks were mitigated due to their suspicious or unusual HTTP attributes, and another 9% were HTTP DDoS attacks launched by fake browsers or browser impersonators. The remaining 6% of “Other” includes attacks that targeted login endpoints and cache busting attacks.
One thing to note is that these attack vectors, or attack groups, are not necessarily exclusive. For example, known botnets also impersonate browsers and have suspicious HTTP attributes, but this breakdown is our attempt to categorize the HTTP DDoS attacks in a meaningful way.

Distribution of DDoS attacks in 2024 Q3
In Q3, we observed a 4,000% increase in SSDP amplification attacks compared to the previous quarter. An SSDP (Simple Service Discovery Protocol) attack is a type of reflection and amplification DDoS attack that exploits the UPnP (Universal Plug and Play) protocol. Attackers send SSDP requests to vulnerable UPnP-enabled devices such as routers, printers, and IP-enabled cameras, and spoof the source IP address to be the victim’s IP address. These devices respond to the victim’s IP address with large amounts of traffic, overwhelming the victim’s infrastructure. The amplification effect allows attackers to generate massive traffic from small requests, causing the victim’s service to go offline. Disabling UPnP on unnecessary devices and using DDoS mitigation strategies can help defend against this attack.

Illustration of an SSDP amplification attack
When launching HTTP DDoS attacks, threat actors want to blend in to avoid detection. One tactic to achieve this is to spoof the user agent. This lets them appear as a legitimate browser or client if done successfully.
In Q3, 80% of HTTP DDoS attack traffic impersonated the Google Chrome browser, which was the most common user agent observed in attacks. More specifically, Chrome 118, 119, 120, and 121 were the most common versions.
In second place, no user agent was seen for 9% of HTTP DDoS attack traffic.
In third and fourth place, we observed attacks using the Go-http-client and fasthttp user agents. The former is the default HTTP client in Go’s standard library and the latter is a high-performance alternative. fasthttp is used to build fast web applications, but is often used for DDoS attacks and web scraping too.

Top user agents used in DDoS attacks
The user agent hackney came in fifth place. It’s an HTTP client library for Erlang. It’s used for making HTTP requests and is popular in Erlang/Elixir ecosystems.
An interesting user agent shows up in the sixth place: HITV_ST_PLATFORM. This user agent appears to be associated with smart TVs or set-top boxes. Threat actors typically avoid using uncommon user agents, as evidenced by the frequent use of Chrome user agents in cyberattacks. Therefore, the presence of HITV_ST_PLATFORM likely suggests that the devices in question are indeed compromised smart TVs or set-top boxes.
In seventh place, we saw the uTorrent user agent being used in attacks. This user agent is associated with a popular BitTorrent client that’s used for downloading files.
Lastly, okhttp was the least common user agent in DDoS attacks despite its popularity as an HTTP client for Java and Android applications.
While 89% of HTTP DDoS attack traffic used the GET method, it is also the most commonly used HTTP method. So when we normalize the attack traffic by dividing the number of attack requests by total request per HTTP method, we get a different picture.
Almost 12% of all requests that used the DELETE method were part of an HTTP DDoS attack. After DELETE, we see that HEAD, PATCH and GET are the methods most commonly used in DDoS attack requests.

While 80% of DDoS attack requests were over HTTP/2 and 19% were over HTTP/1.1, they represented a much smaller portion when normalized by the total traffic by version. When we normalize the attack requests by all requests by version, we see a different picture. Over half of traffic to the non-standard or mislabeled “HTTP/1.2” version was malicious and part of DDoS attacks. It’s important to note that “HTTP/1.2” is not an official version of the protocol.

The vast majority of HTTP DDoS attacks are actually encrypted — almost 94% — using HTTPS.

China was the most attacked location in the third quarter of 2024. The United Arab Emirates was ranked second, with Hong Kong in third place, followed closely by Singapore, Germany, and Brazil.

Canada was ranked seventh, followed by South Korea, the United States, and Taiwan as number ten.
In the third quarter of 2024, Banking & Financial Services was the most targeted by DDoS attacks. Information Technology & Services was ranked in second place, followed by the Telecommunications, Service Providers, and Carriers sector.

Cryptocurrency, Internet, Gambling & Casinos, and Gaming followed closely behind as the next most targeted industries. Consumer Electronics, Construction & Civil Engineering, and the Retail industries rounded out the top ten most attacked industries.
For a few years now, we’ve been surveying our customers that have been subjected to DDoS attacks. The survey covers various factors, such as the nature of the attack and the threat actors. In the case of threat actors, while 80% of survey respondents said that they don’t know who attacked them, 20% said they did. Of those, 32% said that the threat actors were extortionists. Another 25% said a competitor attacked them, and another 21% said that a disgruntled customer or user was behind the attack. 14% of respondents said that the attacks were carried out by a state or a state-sponsored group. Lastly, 7% said that they mistakenly attacked themselves. One example of when a self-DDoS attack occurs is a post-firmware update for IoT devices that causes all devices to phone home at the same time, resulting in a flood of traffic.

Distribution of the top threat actors
While extortionists were the most common threat actor, overall, reports of Ransom DDoS attacks decreased by 42% QoQ, but increased 17% YoY. A total of 7% of respondents reported being subjected to a Ransom DDoS attack or threatened by the attacker. In August, however, that figure increased to 10% — that’s one out of ten.

Reports of Ransom DDoS attacks by quarter
Indonesia was the largest source of DDoS attacks in the third quarter of 2024. The Netherlands was the second-largest source, followed by Germany, Argentina, and Colombia.

The next five largest sources included Singapore, Hong Kong, Russia, Finland, and Ukraine.
For service providers that operate their own networks and infrastructure, it can be difficult to identify who is using their infrastructure for malicious intent, such as generating DDoS attacks. For this reason, we provide a free threat intelligence feed to network operators. This feed provides service providers information on IP addresses from within their networks that we’ve seen participate in subsequent DDoS attacks.
On that note, Hetzner (AS24940), a German-based IT provider, was the largest source of HTTP DDoS attacks in the third quarter of 2024. Linode (AS63949), a cloud computing platform acquired by Akamai in 2022, was the second-largest source of HTTP DDoS attacks. Vultr (AS64515), a Florida-based service provider, came in third place.
Netcup (AS197540), another German-based IT provider, came in fourth place. Google Cloud Platform (AS15169) followed in fifth place. DigitalOcean (AS14061) came in sixth place, followed by French provider OVH (AS16276), Stark Industries (AS44477), Amazon Web Services (AS16509), and Microsoft (AS8075).

Networks that were that largest sources of HTTP DDoS attacks in 2024 Q3
This quarter, we observed an unprecedented surge in hyper-volumetric DDoS attacks, with peaks reaching 3.8 Tbps and 2.2 Bpps. This mirrors a similar trend from the same period last year, when application layer attacks in the HTTP/2 Rapid Reset campaign exceeded 200 million requests per second (Mrps). These massive attacks are capable of overwhelming Internet properties, particularly those relying on capacity-limited cloud services or on-premise solutions.
The increasing use of powerful botnets, fueled by geopolitical tensions and global events, is expanding the range of organizations at risk — many of which were not traditionally considered prime targets for DDoS attacks. Unfortunately, too many organizations reactively deploy DDoS protections after an attack has already caused significant damage.
Our observations confirm that businesses with well-prepared, comprehensive security strategies are far more resilient against these cyberthreats. At Cloudflare, we’re committed to safeguarding your Internet presence. Through significant investment in our automated defenses and a robust portfolio of security products, we ensure proactive protection against both current and emerging threats — so you don’t have to.
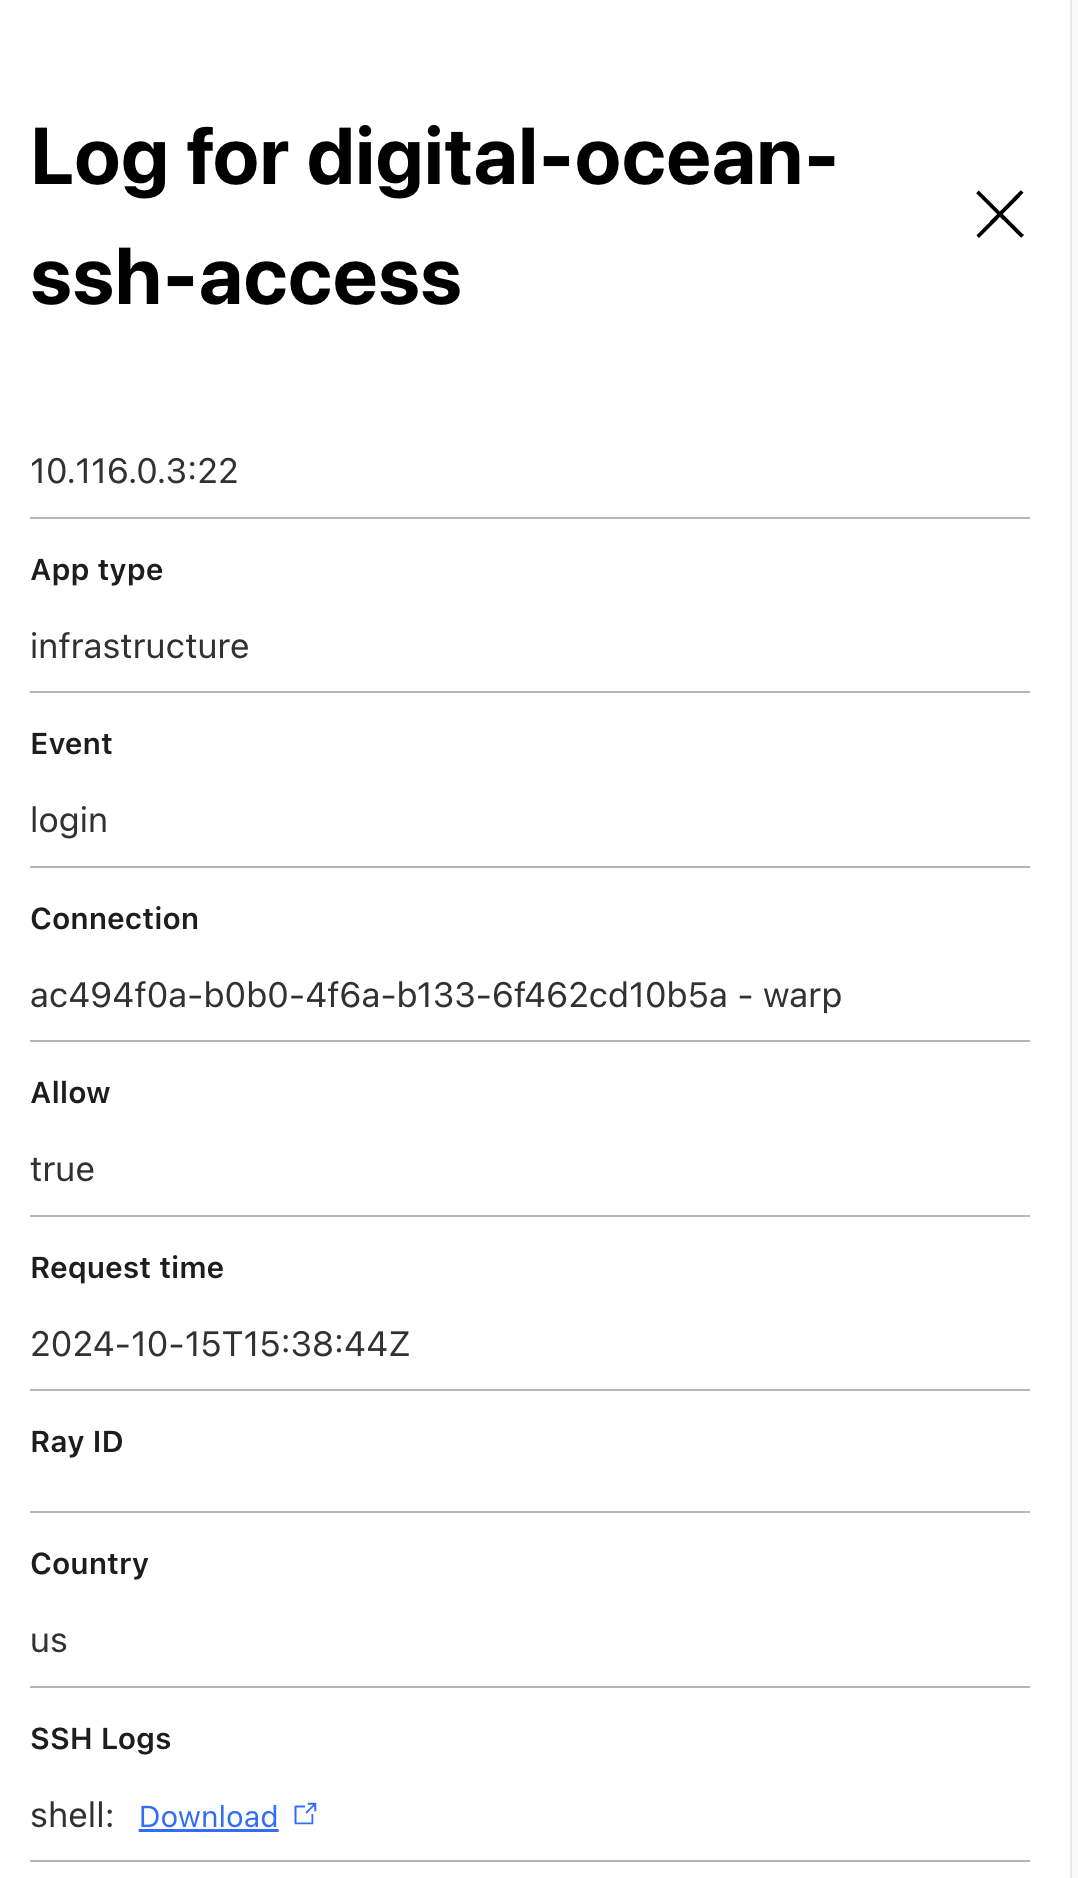
Post Syndicated from Sharon Goldberg original https://blog.cloudflare.com/intro-access-for-infrastructure-ssh
BastionZero joined Cloudflare in May 2024. We are thrilled to announce Access for Infrastructure as BastionZero’s native integration into our SASE platform, Cloudflare One. Access for Infrastructure will enable organizations to apply Zero Trust controls in front of their servers, databases, network devices, Kubernetes clusters, and more. Today, we’re announcing short-lived SSH access as the first available feature. Over the coming months we will announce support for other popular infrastructure access target types like Remote Desktop Protocol (RDP), Kubernetes, and databases.
Organizations have embraced Zero Trust initiatives that modernize secure access to web applications and networks, but often the strategies they use to manage privileged access to their infrastructure can be siloed, overcomplicated, or ineffective. When we speak to customers about their infrastructure access solution, we see common themes and pain points:
Too risky: Long-lived credentials and shared keys get passed around and inflate the risk of compromise, excessive permissions, and lateral movement
Too clunky: Manual credential rotations and poor visibility into infrastructure access slow down incident response and compliance efforts
Some organizations have dealt with the problem of privileged access to their infrastructure by purchasing a Privileged Access Management (PAM) solution or by building a homegrown key management tool. Traditional PAM solutions introduce audit logging and session recording features that capture user interactions with their servers and other infrastructure and/or centralized vaults that rotate keys and passwords for infrastructure every time a key is used. But this centralization can introduce performance bottlenecks, harm usability, and come with a significant price tag. Meanwhile, homegrown solutions are built from primitives provided by cloud providers or custom infrastructure-as-code solutions, and can be costly and tiresome to build out and maintain.
We believe that organizations should apply Zero Trust principles to their most sensitive corporate resources, which naturally includes their infrastructure. That’s why we’re augmenting Cloudflare’s Zero Trust Network Access (ZTNA) service with Access to Infrastructure to support privileged access to sensitive infrastructure, and offering features that will look somewhat similar to those found in a PAM solution:
Access: Connect remote users to infrastructure targets via Cloudflare’s global network.
Authentication: Eliminate the management of credentials for servers, containers, clusters, and databases and replace them with SSO, MFA, and device posture.
Authorization: Use policy-based access control to determine who can access what target, when, and under what role.
Auditing: Provide command logs and session recordings to allow administrators to audit and replay their developers’ interactions with the organization’s infrastructure.
At Cloudflare, we are big believers that unified experiences produce the best security outcomes, and because of that, we are natively rebuilding each BastionZero feature into Cloudflare’s ZTNA service. Today, we will cover the recently-released feature for short-lived SSH access.
SSH (Secure Shell) is a protocol that is commonly used by developers or system administrators to secure the connections used to remotely administer and manage (usually Linux/Unix) servers. SSH access to a server often comes with elevated privileges, including the ability to delete or exfiltrate data or to install or remove applications on the server.
Modern enterprises can have tens, hundreds, or even thousands of SSH targets. Servers accessible via SSH can be targeted in cryptojacking or proxyjacking attacks. Manually tracking, rotating, and validating SSH credentials that grant access is a chore that is often left undone, which creates risks that these long-lived credentials could be compromised. There’s nothing stopping users from copying SSH credentials and sharing them with other users or transferring them to unauthorized devices.
Although many organizations will gate access to their servers to users that are inside their corporate network, this is no longer enough to protect against modern attackers. Today, the principles of Zero Trust demand that an organization also tracks who exactly is accessing their servers with SSH, and what commands they are running on those servers once they have access. In fact, the elevated privileges that come along with SSH access mean that compliance frameworks like SOC2, ISO27001, FedRAMP and others have criteria that require monitoring who has access with SSH and what exactly they are doing with that access.
We’ve introduced SSH with Access for Infrastructure to provide customers with granular control over privileged access to servers via SSH. The feature provides improved visibility into who accessed what service and what they did during their SSH session, while also eliminating the risk and overhead associated with managing SSH credentials. Specifically, this feature enables organizations to:
Eliminate security risk and overhead of managing SSH keys and instead use short-lived SSH certificates issued by a Cloudflare-managed certificate authority (CA).
Author fine-grained policy to govern who can SSH to your servers and through which SSH user(s) they can log in as.
Monitor infrastructure access with Access and SSH command logs, supporting regulatory compliance and providing visibility in case of security breach.
Avoid changing end-user workflows. SSH with Access for Infrastructure supports whatever native SSH clients end users happen to be using.
SSH with Access for Infrastructure is supported through one of the most common deployment models of Cloudflare One customers. Users can connect using our device client (WARP), and targets are made accessible using Cloudflare Tunnel (cloudflared or the WARP connector). This architecture allows customers with existing Cloudflare One deployments to enable this feature with little to no effort. The only additional setup will be configuring your target server to accept a Cloudflare SSH certificate.

Cloudflare One already offers multiple ways to secure organizations’ SSH traffic through network controls. This new SSH with Access for Infrastructure aims to incorporate the strengths of those existing solutions together with additional controls to authorize ports, protocols, and specific users as well as a much improved deployment workflow and audit logging capabilities.
How does Access for Infrastructure eliminate your SSH credentials? This is done by replacing SSH password and SSH keys with an SSH Certificate Authority (CA) that is managed by Cloudflare. Generally speaking, a CA’s job is to issue certificates that bind an entity to an entity’s public key. Cloudflare’s SSH CA has a secret key that is used to sign certificates that authorize access to a target (server) via SSH, and a public key that is used by the target (server) to cryptographically validate these certificates. The public key for the SSH CA can be obtained by querying the Cloudflare API. And the secret key for the SSH CA is kept secure by Cloudflare and never exposed to anyone.
To use SSH with Access for Infrastructure to grant access via SSH to a set of targets (i.e. servers), you need to instruct those servers to trust the Cloudflare SSH CA. Those servers will then grant access via SSH whenever they are presented with an SSH certificate that is validly signed by the Cloudflare SSH CA.
The same Cloudflare SSH CA is used to support SSH access for all of your developers and engineers to all your target servers. This greatly simplifies key management. You no longer need to manage long-lived SSH keys and passwords for individual end users, because access to targets with SSH is granted via certificates that are dynamically issued by the Cloudflare SSH CA. And, because the Cloudflare SSH CA issued short-lived SSH certificates that expire after 3 minutes, you also don’t have to worry about creating or managing long-lived SSH credentials that could be stolen by attackers.
The 3-minute time window on the SSH certificate only applies to the time window during which the user has to authenticate to the target server; it does not apply to the length of the SSH session, which can be arbitrarily longer than 3 minutes. This 3-minute window was chosen because it was short enough to reduce the risk of security compromise and long enough to ensure that we don’t miss the time window of the user’s authentication to the server, especially if the user is on a slow connection.
One of the problems with traditional SSH is that once a user has an SSH key or password installed on a server, they will have access to that server forever — unless an administrator somehow remembers to remove their SSH key or password from the server in question. This leads to privilege creep, where too many people have standing access to too many servers, creating a security risk if an SSH key or password is ever stolen or leaked.
Instead, SSH with Access for Infrastructure allows you to centrally write policies in the Cloudflare dashboard specifying exactly what (set of) users has access to what (set of) servers. Users may be authenticated by SSO, MFA, device posture, location, and more, which provides better security than just authenticating them via long-lived SSH keys or passwords that could be stolen by attackers.
Moreover, the SSH certificates issued by the Cloudflare CA include a field called ValidPrinciples which indicates the specific Linux user (e.g. root, read-only, ubuntu, ec2-user) that can be assumed by the SSH connection. As such, you can write policies that specify the (set of) Linux users that a given (set of) end users may access on a given (set of) servers, as shown in the figure below. This allows you to centrally control the privileges that a given end user has when accessing a given target server. (The one caveat here is that the server must also be pre-configured to already know about the specific Linux user (e.g. root) that is specified in the policies and presented in the SSH certificate. Cloudflare is NOT managing the Linux users on your Linux servers.)
As shown below, you could write a policy that says users in Canada, the UK, and Australia that are authenticated with MFA and face recognition can access the root and ec2-user Linux users on a given set of servers in AWS.

Cloudflare captures SSH command logs because we built an SSH proxy that intercepts the SSH connections. The SSH proxy establishes one SSH connection between itself and the end user’s SSH client, and another SSH connection between itself and the target (server). The SSH proxy can therefore inspect the SSH commands and log them.
SSH commands are encrypted at rest using a public key that the customer uploads via the Cloudflare API. Cloudflare cannot read SSH command logs at rest, but they can be extracted (in encrypted form) from the Cloudflare API and decrypted by the customer (who holds the corresponding private key). Instructions for uploading the encryption public key are available in our developer documentation.
To understand how Cloudflare’s SSH proxy works, we first must review how a generic SSH connection is established.
First off, SSH runs over TCP, so to establish an SSH connection, we first need to complete a TCP handshake. Then, once the TCP handshake is complete, an SSH key exchange is needed to establish an ephemeral symmetric key between the client and the server that will be used to encrypt and authenticate their SSH traffic. The SSH key exchange is based on the server public key, also known as the hostkey. If you’ve ever used SSH, you’ve probably seen this message — that is the SSH server telling your SSH client to trust this hostkey for all future SSH interactions. (This is also known as TOFU or Trust On First Use.)

Finally, the client needs to authenticate itself to the server. This can be done using SSH passwords, SSH keys, or SSH certificates (as described above). SSH also has a mode called none, which means that the client does NOT need to authenticate itself to the server at all.

To understand this, we note that whenever you set up SSH with Access for Infrastructure in the Cloudflare dashboard, you first need to create the set of targets (i.e. servers) that you want to make accessible via SSH. Targets can be defined by IP address or hostname. You then create an Access for Infrastructure application that captures the TCP ports (e.g. port 22) that SSH runs over for those targets, and write policies for those SSH connections, as we already described above and in our developer documentation.
This setup allows Cloudflare to know the set of IP addresses and ports for which it must intercept SSH traffic. Thus, whenever Cloudflare sees a TCP handshake with an IP address and port that must be intercepted, it sends traffic for that TCP connection to the SSH proxy.
The SSH proxy leverages the client’s already authenticated identity from the WARP client, and enforces the configured Access for Infrastructure policies against it. If the policies do not allow the identity to connect to the target under the requested Linux user (e.g. root), the SSH proxy will reject the connection and log an Access denied event to the Access logs. Otherwise, if policies do allow the identity to connect, the the SSH proxy will establish the following two SSH connections:
SSH connection from SSH proxy to target
SSH connection from end user’s SSH client (via Cloudflare’s WARP client) to SSH proxy
Let’s take a look at each of these SSH connections, and the cryptographic material used to set them up.
To establish the SSH connection from SSH proxy to the target, the SSH proxy acts as a client in the SSH key exchange between itself and the target server. The handshake uses the target server’s hostkey to establish an ephemeral symmetric key between the client and the server that will encrypt and authenticate their SSH traffic. Next, the SSH proxy must authenticate itself to the target server. This is done by presenting the server with a short-lived SSH certificate, issued by the Cloudflare SSH CA, for the specified Linux user that is requested for this connection as we already described above. Because the target server has been configured to trust the Cloudflare SSH CA, the target server will be able to successfully validate the certificate and the SSH connection will be established.
To establish the SSH connection from the end-user’s SSH client to SSH proxy, the SSH proxy acts as a server in the SSH key exchange between itself and the end-user’s SSH client.
To do this, the SSH proxy needs to inform the end user’s SSH client about the hostkey that will be used to establish this connection. But what hostkey should be used? We cannot use the same hostkey used by the target server, because that hostkey is the public key that corresponds to a private key that is known only to the target server, and not known to the SSH proxy. So, Cloudflare’s SSH proxy needs to generate its own hostkey. We don’t want the end user to randomly see warnings like the one shown below, so the SSH proxy should provide the same hostkey each time the user wants to access a given target server. But, if something does change with the hostkey of the target server, we do want the warning below to be shown.

To achieve the desired behavior, the SSH proxy generates a hostkey and its corresponding private key by hashing together (a) a fixed secret value valid that associated with the customer account, along with (b) the hostkey that was provided by this target server (in the connection from SSH proxy to target server). This part of the design ensures that the end user only needs to see the TOFU notification the very first time it connects to the target server via WARP, because the same hostkey is used for all future connections to that target. And, if the hostkey of the target server does change as a result of a Monster-In-The-Middle attack, the warning above will be shown to the user.
Finally, during the SSH key exchange handshake from WARP client to SSH proxy, the SSH proxy informs that end user’s native SSH client that it is using none for client authentication. This means that the SSH client does NOT need to authenticate itself to the server at all. This part of the design ensures that the user need not enter any SSH passwords or store any SSH keys in its SSH configuration in order to connect to the target server via WARP. Also, this does not compromise security, because the SSH proxy has already authenticated the end user via Cloudflare’s WARP client and thus does not need to use the native SSH client authentication in the native SSH client.
Put this all together, and we have accomplished our goal of having end users authenticate to target servers without any SSH keys or passwords, using Cloudflare’s SSH CA instead. Moreover, we also preserve the desired behaviors of the TOFU notifications and warnings built into native SSH clients!
Before we wrap up, let’s review the cryptographic keys you need in order to deploy SSH with Access for Infrastructure. There are two keys:
Public key of the SSH CA. The private key of the SSH CA is only known to Cloudflare and not shared with anyone. The public key of the SSH CA is obtained from the Cloudflare API and must be installed on all your target servers. The same public key is used for all of your targets. This public key does not need to be kept secret.
Private key for SSH command log encryption. To obtain logs of SSH commands, you need to generate a public-private key pair, and upload the public key to Cloudflare. The public key will be used to encrypt your SSH commands logs at REST. You need to keep the private key secret, and you can use it to decrypt your SSH command logs.
That’s it! No other keys, passwords, or credentials to manage!
At Cloudflare, we are committed to providing the most comprehensive solution for ZTNA, which now also includes privileged access to sensitive infrastructure like servers accessed over SSH.
Organizations can now treat SSH like any other Access application and enforce strong MFA, device context, and policy-based access prior to granting user access. This allows organizations to consolidate their infrastructure access policies into their broader SSE or SASE architecture.
You can try out Access for Infrastructure today by following these instructions in our developer documentation. Access for Infrastructure is currently available free to teams of under 50 users, and at no extra cost to existing pay-as-you-go and Contract plan customers through an Access or Zero Trust subscription. Expect to hear about a lot more features from us as we continue to natively rebuild BastionZero’s technology into Cloudflare’s Access for Infrastructure service!
Post Syndicated from The History Guy: History Deserves to Be Remembered original https://www.youtube.com/watch?v=pbw7sMTe65Y
Post Syndicated from The Atlantic original https://www.youtube.com/watch?v=qlPT7alI0iI
Post Syndicated from BeardedTinker original https://www.youtube.com/watch?v=3t2xhza3U8k
Post Syndicated from Patrik Uytterhoeven original https://blog.zabbix.com/monitoring-failed-jobs-in-netbackup-with-zabbix/28539/
Monitoring backup solutions can be an arduous task – especially since many backup tools don’t provide APIs and simply are not easy to work with. One such solution – NetBackup – provides its own set of challenges, but fortunately we have Zabbix, with its low-level discovery (LLD) features and the possibility to leverage user parameters to extend Zabbix agent.
Table of Contents
For those not familiar with LLD, Zabbix is able to create items, triggers, graphs, and other entities based on LLD rules. JSON is used to detect those entities by Zabbix.
https://www.zabbix.com/documentation/current/en/manual/discovery/low_level_discovery/custom_rules
If we create a script that returns this information to Zabbix, then we can automatically create items based on the received low-level discovery macros and their values. In this example from the Zabbix website, Zabbix will map {#FSNAME} to one of the detected logical volumes.
[
{ "{#FSNAME}":"/",                           "{#FSTYPE}":"rootfs"   },
{ "{#FSNAME}":"/sys",                        "{#FSTYPE}":"sysfs"    },
{ "{#FSNAME}":"/proc",                       "{#FSTYPE}":"proc"     },
{ "{#FSNAME}":"/dev",                        "{#FSTYPE}":"devtmpfs" },
{ "{#FSNAME}":"/dev/pts",                    "{#FSTYPE}":"devpts"   },
{ "{#FSNAME}":"/lib/init/rw",                "{#FSTYPE}":"tmpfs"    },
{ "{#FSNAME}":"/dev/shm",                    "{#FSTYPE}":"tmpfs"    },
{ "{#FSNAME}":"/home",                       "{#FSTYPE}":"ext3"     },
{ "{#FSNAME}":"/tmp",                        "{#FSTYPE}":"ext3"     },
{ "{#FSNAME}":"/usr",                        "{#FSTYPE}":"ext3"     },
{ "{#FSNAME}":"/var",                        "{#FSTYPE}":"ext3"     },
{ "{#FSNAME}":"/sys/fs/fuse/connections",    "{#FSTYPE}":"fusectl"  }
]
Zabbix can automatically create items with this information. If we then create another script where we sent the values for each of the volumes, then we can return for example the free space for the “/” volume as a value and do this for all other volumes as well.
With this knowledge, we can create a solution to monitor our backups. We will further optimize this approach because we don’t want to rely on multiple scripts, such as a script that sends us a list of failed backups, another script that returns the status codes, etc. We will use the dependent item feature, which allows us to simply create one master item to collect all the values and then process them further in Zabbix.
To format our data in JSON, we need to extract it first from the API. For this, we can create a script with the user parameters in our Zabbix agent. The Python script we will use for this can be copied to “/etc/zabbix” or another place that is accessible by the Zabbix user on our system.
https://github.com/Trikke76/Zabbix/blob/master/Netbackup/netbackup-failed-jobs-zabbix.py
Don’t forget to adapt the script and update settings like user name, password, URL, and page limit!
# NetBackup API configuration
BASE_URL = "https://<netbackup-url>:1556/netbackup"
USERNAME = ""
PASSWORD = ""
PAGELIMIT = "100" # adapt to your needs

The page limit will limit the search to the last 100 lines

If you want you can also adapt how many days we have to look back in history standard is 7 days

# Set the time range for job retrieval (last 7 days)
end_time = datetime.utcnow()
start_time = end_time - timedelta(hours=168)
The script will collect errors in backups and the resulting output will display a list of failed backups over the last 100 jobs:
{
  "data": [
    {
      "{#JOBID}": 257086,
      "JOBTYPE": "DBBACKUP",
      "STATUSCODE": 11,
      "STATE": "DONE",
      "POLICYNAME": "NBU-Catalog",
      "CLIENTNAME": "NetBackup-server",
      "STARTTIME": "2024-07-29T12:46:34.000Z",
      "ENDTIME": "2024-07-29T12:47:53.000Z",
      "ELAPSEDTIME": "PT1M19S",
      "KILOBYTESTRANSFERRED": 0
    }
  ]
}
This data is perfect for our LLD rules in Zabbix. Once we have copied our script to the server, we have to define our Zabbix user parameter. You can download an example here:
https://github.com/Trikke76/Zabbix/blob/master/Netbackup/Userparameter-netbackup.conf
Copy this file to your Zabbix agent in the config folder, usually somewhere in:
“/etc/zabbix/zabbix_agent2.d/” or “/etc/zabbix/zabbix_agentd.d/” depending if you use Zabbix agent or Zabbix agent 2.
Don’t forgot to modify the file permissions so that only the agent can read it, and restart Zabbix agent. Also, make sure that the user parameter points are at the correct location of the Python script. The last thing we have to do now is create or import our Zabbix template:
https://github.com/Trikke76/Zabbix/blob/master/Netbackup/Templates_Netbackup.yaml
The first thing we have to do is create a master item that collects the data from our script.
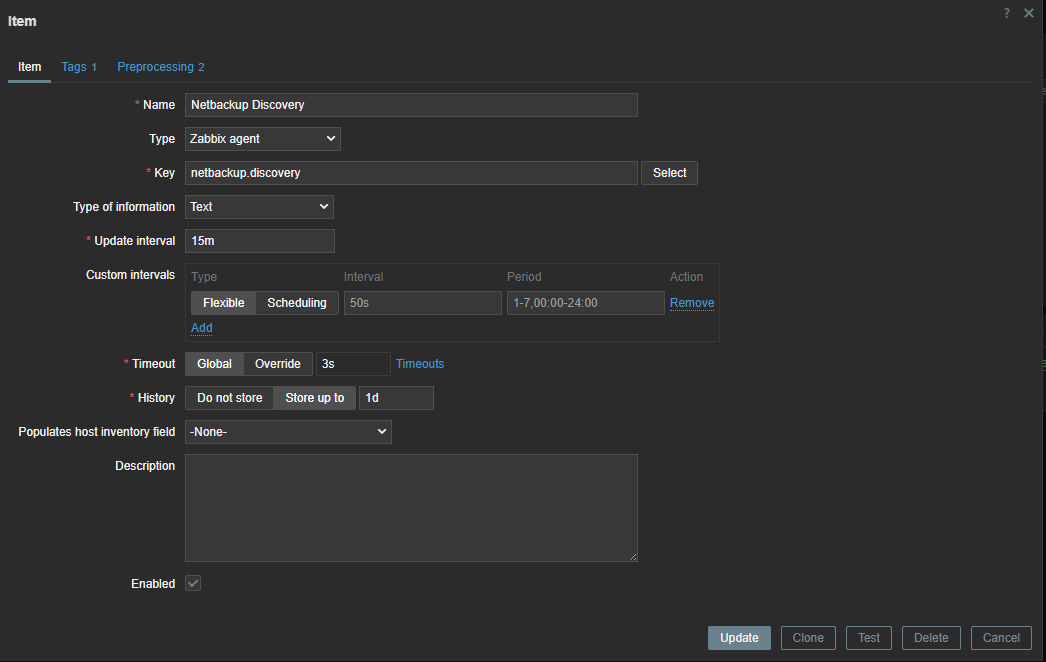
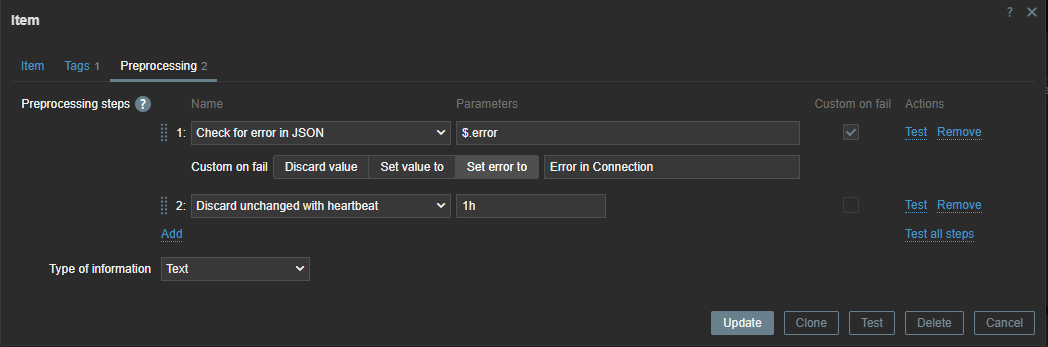
Since the error check is executed every 15 minutes, we can use throttling pre-processing to discard duplicate data, since most of the time there will be no errors in our backups.
Also, if our script fails to connect to the API, our data collection will fail. Therefore, we can use custom on fail pre-processing and set a custom, more human-readable error message.
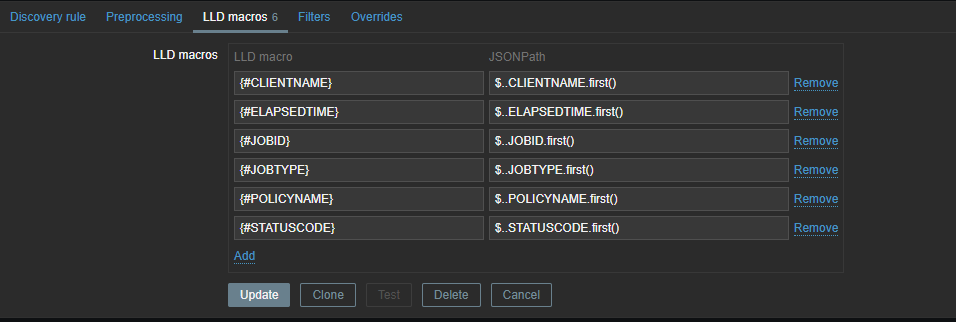
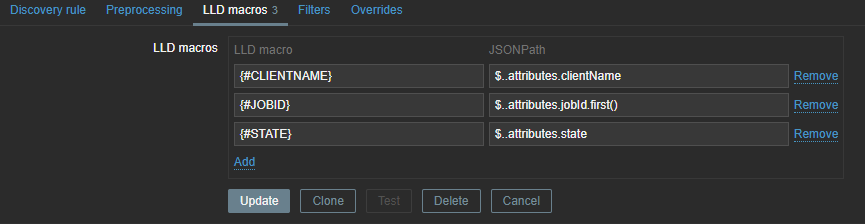
Now we have to create a discovery rule in Zabbix based on this data. In this discovery rule we will extract the required data and map it to custom LLD macros.
Those macros can be used later in our items. As you can see, we use .first() at the end of our JSONPATH expression – otherwise, we would get all our matching data between the [ ], as our data comes in a list. By making use of .first() we filter out all other data we don’t need.
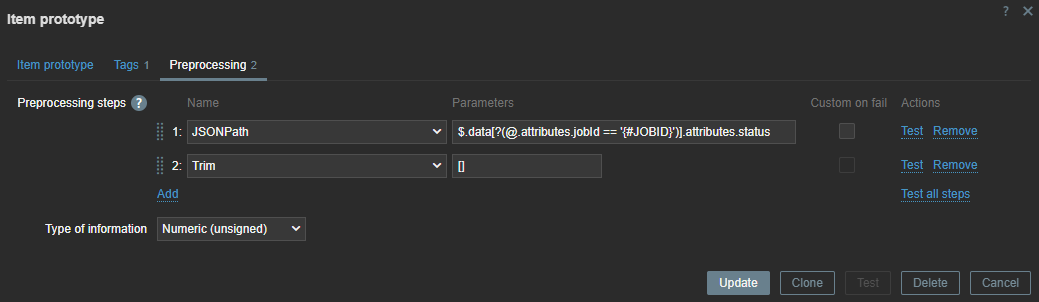
To create our LLD items, we need to create an item prototype so that items can be generated when they are detected. Our item will be a dependent item, so it will get its data from the master item.
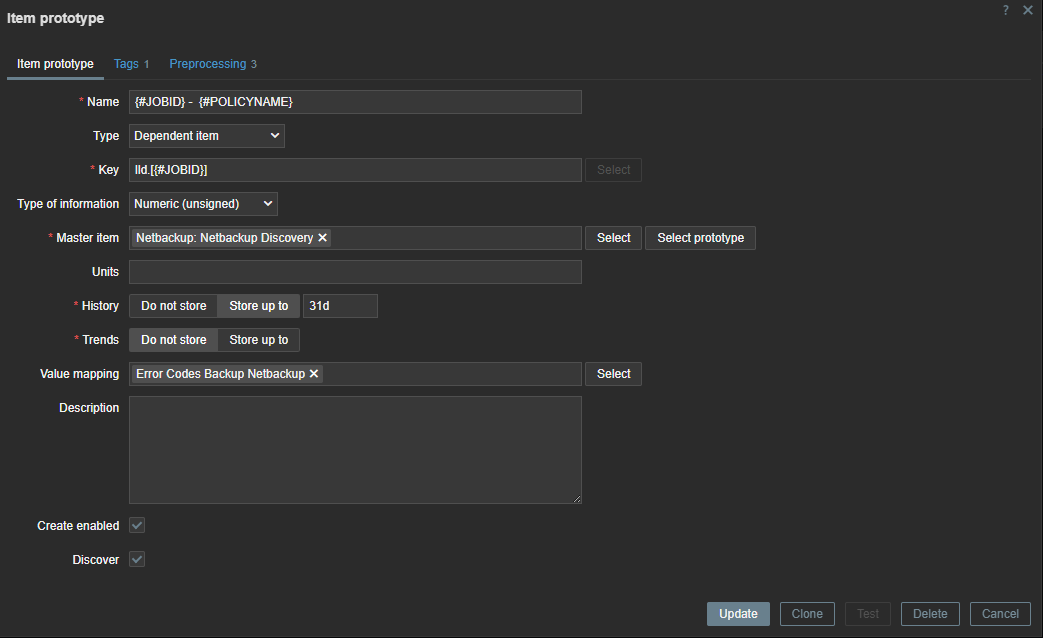
In our item prototype we can make use of the Zabbix LLD macros we created before. To extract the data we need, we have to add a preprocessing rule first to extract the data we want from our master item.
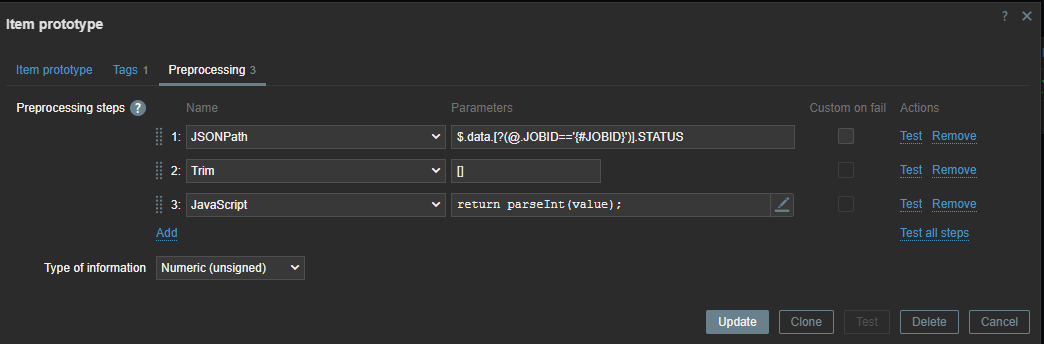
First line will look for the “JOBID” and will use the LLD macro we created before. Remember we used .last() ? If we had not done this our ID here would have been a list [ ] instead of just the ID number.
We also have to remove the [ ] – this we can do with trim. Since our data is returned as text we also add some JS to convert our data to an Integer. This allows us to create triggers based on the error code we have received.
There is another way to do the same thing in Zabbix without writing those complex python scripts. Since Zabbix 4.0 we have “HTTP agent” item type. This allows us to connect to the API and retrieve the required data from the API. Combined with LLD and dependent items this becomes a very powerful way to collect metrics.
First thing we have to do is create a master item to retrieve the data from the API. This item is of the type “HTTP agent” and we have to fill in the URL of the API endpoint. To authenticate we have to pass information like the authentication token in the headers. For this you need to create a token first in NetBackup. As you can see I used a macro {$BEARER.TOKEN} – this is so we can make it secret.
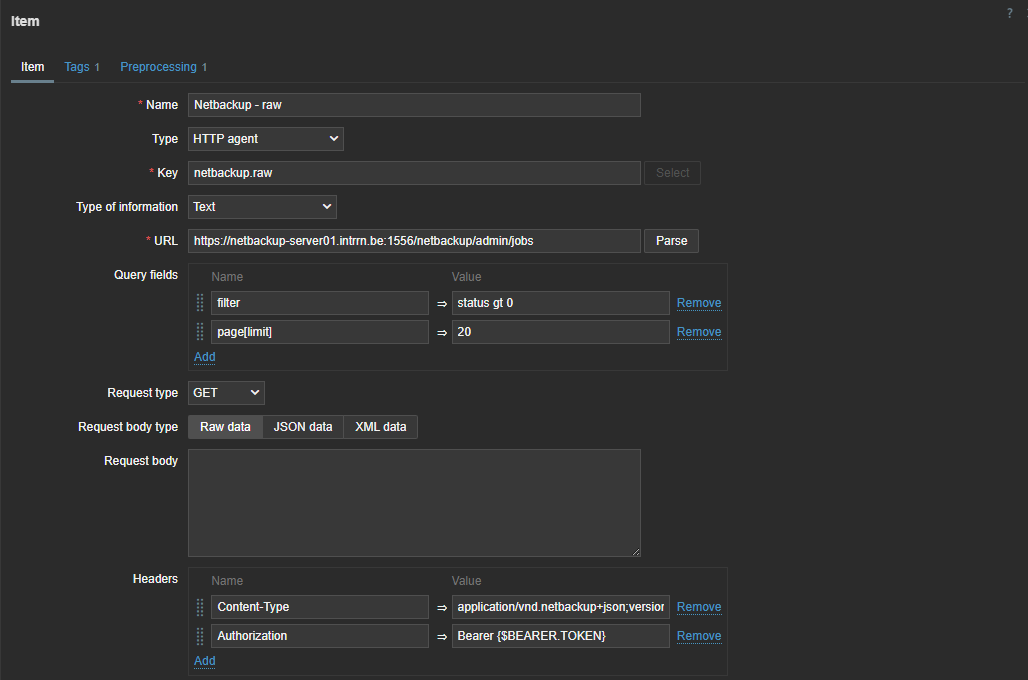
So next step is to add our secret token. Let’s create our macro in the template under the Macros section. Here we can choose to keep it hidden for everyone. An even more secure way to store sensitive information like authentication tokens would be using a secret vault.

The data we get back from our API is a bit different from what we have seen in the output of the Python script we defined previously, but not by much.
{
  "data": [
    {
      "type": "job",
      "id": "260136",
      "attributes": {
          "jobId": 260136,
          "parentJobId": 0,
          "jobType": "DBBACKUP",
          "policyType": "NBU_CATALOG",
          "policyName": "NBU-Catalog",
          "scheduleType": "DIFFERENTIAL_INCREMENTAL_BACKUP",
          "scheduleName": "-",
      …
With this knowledge and what we know from our first try with Python, we can now make a dependent discovery rule.
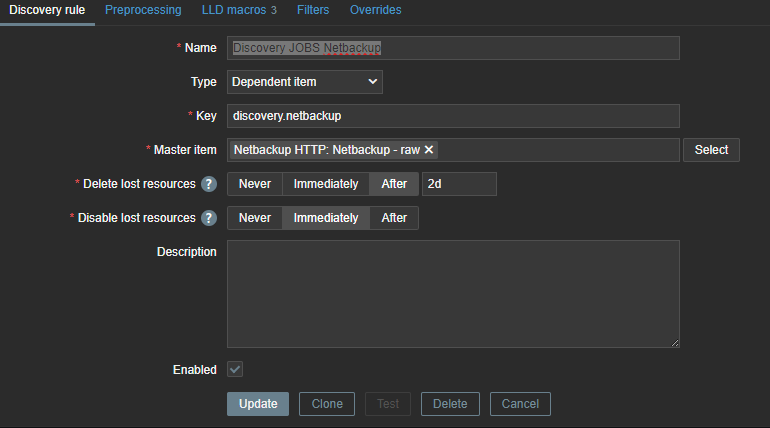
The same logic applies again – we need to map our data to LLD macros so that we can use them later in our LLD items and triggers.
These LLD macros can later be used in our item prototypes and triggers. We only need JOBID and STATE, but you can create some extra mappings in case you like to use the extra information later. With our JSON path we will once again extract the data from our master item.
The next step is to create the LLD item prototype. Here we can use the macros we extracted earlier.

The item is dependent on our master item, so without any pre-processing the data will be exactly the same as in our master item. Therefore, we can add some rules to get the data we need.
Here, we use the JSON path to extract the data. With our LLD macros we can extract the data dynamically for every item we have discovered. With Trim, we remove the [ ] that comes around our data.
If there are backup errors, the end result will look something like this:
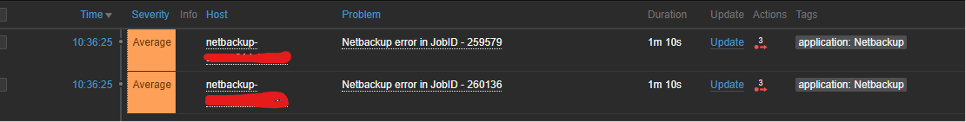
The steps can look a bit abstract, so the best thing to do is to try and perform everything step-by-step and use the Test button in Zabbix to test every step before you continue.
Websites like https://jsonpath.com/ and https://jsonformatter.org/ can also be helpful to beautify your data and do some testing with your JSONPath pre-processing.
If you want to test the template, feel free to download it from my github:
https://github.com/Trikke76/Zabbix/blob/master/Netbackup/Templates_Netbackup_HTTP.yaml
That’s it! If you’ve set up everything correctly, you should now get a list of failed jobs collected from NetBackup. Once the failed jobs are gone, Zabbix will disable the related entities and clean them up after some time.
If you need help optimizing your Zabbix environment, or you need a support contract, some consultancy, or training, feel free to contact [email protected] or visit us at https://www.open-future.be.
We are always available to help!
The post Monitoring Failed Jobs in NetBackup with Zabbix appeared first on Zabbix Blog.
Post Syndicated from Bozho original https://blog.bozho.net/blog/4424
Електронна идентификация. Или „как да ползваме е-услуги по начин, по който да докажем онлайн кои сме по удобен и сигурен начин“.
Историята на тази битка е дълга и за съжаление 8 години след като имаха готова техническа документация, МВР все още няма готов продукт. Проектът за мобилно приложение, който стартирах като министър, също беше спрян след края на мандата ми, не без помощта на МВР.
След множеството ми въпроси и срещи по темата, нямам очакване, че в края на годината МВР ще покаже добър продукт, вкл. защото 8 години по-късно той е поостарял.
Затова ще предложим въвеждане на национален цифров портфейл, в изпълнение на новия европейски регламент, но с допълнителни възможности.
Един позиивен елемент е, че приехме законова промяма, с която изрично казваме, че квалифициран електронен подпис не се изисква за подписване на заявленията, за да премахнем тази бариера и позването на е-услуги ще е възможно с мобилното приложение.
Освен, че ще можем да се идентифицираме за всички услуги, вкл. в други държави-членки, ще можем в същото приложение да виждаме цялата информация, която държавата има за нас, да получаваме глоби, писма от администрацията и да го ползваме като входна точка за всички е-услуги.
Това най-накрая ще направи електронното управление достъпно за много повече хора и неговите ползи ще започнат да се усещат не само от ентусиастите.

Материалът Национален цифров портфейл е публикуван за пръв път на БЛОГодаря.
Post Syndicated from original https://www.toest.bg/neslomimata-ukrayna-tova-e-voynata/

Минавам покрай голяма красива църква в старата част на Лвов. Вратата е дървена, масивна, толкова висока, че в подножието ѝ трябва да изкривя главата си, за да видя края ѝ. Вътре много хора, предимно военни, седят прави около няколко ковчега, поставени по средата. Светлината е приглушена. Идва единствено от тежките свещници в ъглите. Слушам в унес пеенето на свещениците, което от време на време се накъсва от женски плач.
На входа на църквата стои надпис: „Гарнiзонний храм свв. апп. Петра i Павла“. Храмът е построен през 1610–1630-та. Години наред е бил паметник на културата, докато на 6 декември 2011-та е осветен по случай 20-годишнината от създаването на Въоръжените сили на Украйна. Висок е сигурно трийсетина метра и заедно с огромната си врата гледа към улица „Театрална“, но това, което се случва вътре сега, не е театър.


© Николета Атанасова
Чакам Андрей на площад „Пазарни“, съвсем близо до църквата. Вече наближава седем следобед. Слънцето се отразява в красивите поддържани фасади на сградите около нас, боядисани в жълто, синьо, оранжево, бежово. Всички са украсени с орнаменти – дракони, богове, малки оръдия, мечове, които надничат над балконите от ковано желязо или са кацнали под островърхите покриви. Животът в Лвов кипи. Заведенията и пейките са пълни с хора. Всичко изглежда спокойно.
Само прозорците на приземните етажи са затъкнати с черни чували, пълни с пясък, а четирите огромни паметника на гръцки богове, „пазещи“ ъглите на площада, са обвити в предпазни пана, на които пише:
Оригинала ще може да видите след победата.
Така са опаковани почти всички паметници на културата в Лвов.


© Николета Атанасова
Виждам Андрей сред многото хора. Приближава се бързо към мен и дефектът, който знам, че има в крака, почти не личи. Усмихва ми се широко и избираме заведение, в което да седнем.
В старата част на Лвов има много скрити улички. „Скрити“, защото влизаш в тях през арката на някоя сграда, която прилича по-скоро на вход с тесен коридор, и в първия момент дори не разбираш, че тръгваш по улица, свързваща напречно две нейни перпендикулярни. В тия места има малки ресторантчета с по две-три маси върху паважа. На такова място сме с Андрей. Около нас предимно млади хора ходят на групи, смеят се, хапват сладолед, облечени са добре.
Андрей сякаш прочита въпроса ми за огромния контраст между войната на няколкостотин километра от този приказен град, който не спира да жужи под напора на тълпите по улиците и заведенията му.
Огледайте се. Тук наоколо няма война. Веднъж в месеца долита някоя ракета и това е всичко. Обществото се е разделило на такива, които са в контекста на войната, и такива, които са извън контекста ѝ. Тези, които пряко ги е засегнала войната, сега са на фронта или пък са загубили близки – те знаят и мислят за нея. Тези, чиито семейства не са засегнати от войната, си ходят по улиците и сякаш за тях тя не съществува. Може би защото войната продължава вече твърде дълго и за хората е невъзможно да мислят постоянно за нея. Затова някои наши градове живеят в ада, а други са като рай.
В Лвов е рай, но Харков е обстрелван всеки ден и там умират хора всеки ден. И въпреки това дори за Харков може да видите видео с място в града, където има басейн, чадъри, хората пият коктейли и само на може би километър вдясно от тях падат ракети, но хората до басейна не спират да пият коктейлите си. Това за мен е необяснимо. Не знам какво да кажа, освен че войната до такава степен стана реалност за нас, че всички се адаптираха към нея. Защото трябва да запазим разсъдъка си, за да продължим да живеем. Иначе може да се побъркаш, ако само мислиш за нашата реалност. Но съм сигурен, че много от тези млади хора са част от организации, които по някакъв начин помагат на фронта.

Преди войната от 2022 г. Андрей Петцяк е бил лекар физиотерапевт. След нахлуването на Русия в Украйна той се записва като доброволец в морската пехота на Украйна и две години е военен лекар на кораб в делтата на Днепър, в района на Херсон.
„Корабчетата бяха малки, защото воювахме в тази част на реката, където има много острови, между които се водеха боевете. Побираха седем моряка. Войната във водата е много по-различна, отколкото на земята, защото при офанзиви на земята можеш по-лесно да се защитиш. Във водата си просто на една лодка без никакви подкрепления и в същото време си видим за врага. Когато отидох там в края на октомври 2022 г., беше много студено, около 2–3 градуса, бяхме мокри, уморени и насред окупираната Херсонска област, обстрелвани от батареята на врага.
Имах една медицинска чанта, пълна с инструменти и лекарства, с които да спра критично кървене, да осигуря възможност на ранения да диша и да определя колко голяма е травмата или раната, която е получил, преди да го транспортирам към мястото за евакуация. Никой не прави хирургически операция на самото бойно поле. За мен най-важното беше да ги стабилизирам и да не допусна да умрат, да им помогна да оживеят, всичко друго са следващи етапи.
Когато след сражение имаме много ранени, първо правим триаж на самото бойно поле. За съжаление, безнадеждно ранените се отделят. Следват „червените“ ранени, на които трябва да помогнеш на място веднага. След това са „жълтите“ ранени, които не се нуждаят от спешна намеса. Войниците, които имат рани в корема, в белите дробове или черния дроб, са в категорията „товари и бягай“, т.е. не ги лекуваш на място, а трябва максимално бързо да бъдат придвижени от бойното поле до най-близката болница.
На първа линия на фронта място за паника няма. Там не трябва да разчиташ на емоциите си, а на своята подготовка. Учил съм във Великобритания, подготовката ми е изключително добра. Успявам да запазя хладнокръвие дори когато около мен е осеяно с разкъсани трупове, на които се виждат вътрешностите. Тичал съм двайсет километра по цялата зона на боя, за да търся оцелели сред труповете и да им помогна. Имаше обезглавени хора, хора без крайници, разкъсани хора… Но това е войната, а аз съм длъжен да запазя хладнокръвие, за да мога да спася останалите живи ранени, а и себе си.
През цялото време чуваш само викове, много викове, защото командирите издават командите, крещейки. Тези, които предават информация по радиостанцията, също крещят, ранените и загиващите също крещят. Въздухът около теб е изпълнен с гласове, които постоянно крещят, и взривове, които избухват. Спомням си, когато бяхме до Авдиевка и беше тихо. Това много ни изплаши, защото бяхме заобиколени от дървета, не виждахме врага и го очаквахме да се появи от всяко възможно място. Тишината тогава беше много страшна, защото знаехме, че врагът планира действия, с които целят да ни убият. Понесохме загуби там. В такива моменти, ако започнеш да мислиш какво се обърка, защо стана така, какво да направя сега, има опасност да загубиш своя живот, както и да не успееш да помогнеш на никого. Място за паника и емоции просто няма. Дори да видиш свой близък приятел убит или осакатен, или тежко ранен, запазваш хладния си разум и продължаваш. Не е най-доброто преживяване, но това е войната.“
Андрей говори спокойно, без патос, страх или тъга. Очите му продължават да са дружелюбни. Отпива от водата, която си поръча, и намества десния си крак. Питам го какво се е случило с него.
Провеждахме операция по прочистването на Днепър и стъпихме на левия бряг, където бяха руснаците. Стигнахме до Кринки. На шестия ден от операцията бях ранен при минометен обстрел в десния крак. Наложи се сам да си окажа първа помощ. Спрях сам кръвотечението от крака ми, тампонирах раните си, поставих си турникет на крака, след това и антибиотик и лежах така осем часа. Чаках да ме евакуират от първа бойна линия, но никой не идваше. Тогава аз, командирът ни и още двама ранени от нашата бригада намерихме плавателен съд, с който сами преплавахме реката, за да достигнем нашите позиции на другия бряг. Това се случи през нощта. Звучи като сценарий за филм, представете си ни, четири човека, ранени, на прага на силите си, преплавахме Днепър през нощта. Когато стигнахме до десния бряг, предадохме координатите си и дойде автомобил, който ни закара в болница. Не може да си представите всичко това. Няма и нужда. Но е ужасно, да.

Андрей не се колебае, когато го питам какво предстои за него оттук нататък. Ще се върне на фронта веднага щом е възможно. Въобще не разбира учудването ми.
Ние прекрасно разбираме, че воюваме с противник, който ни превъзхожда и като въоръжение, и като ресурси, и числено. Разбираме и че ще се съпротивляваме, докато ни стигнат силите и хората. Разбираме и че не можем да успеем сами, без чужда помощ, по отношение на оръжията, които са ни нужни. Това не означава, че ще допуснем компромис с територията, както направихме през 2014 г., когато загубихме три региона. Сега искат от нас да отстъпим и други области. Не можем да допуснем това, защото знаем, че Русия ще дойде отново с нови апетити при нас, за да окупира още и още от нашите територии. Не можем да покажем слабост. Готови сме да пожертваме всичко, което имаме като хора и ресурси. Победата е в ума на всеки украинец и имаме само един шанс – да се бием за това. Имаме нужда само от оръжие и от това да знаете, че ние сме там и воюваме всеки ден. А когато последният украински войник умре, Путин ще дойде за вас.
Андрей отново намества десния си крак под масата. Опитвам се да му направя място около кръглата масичка в тясната скрита уличка на Лвов. Той се усмихва и с поглед ми казва, че няма нужда. Но ми обяснява, че най-страшните травми са тези, които засягат ръцете и краката, защото често се налагат ампутации, които оставят войниците инвалиди. Според него инвалидите ветерани от тази война са твърде много. Пита ме била ли съм в болницата за рехабилитация в Лвов. Отговарям му, че не съм. Андрей ми дава телефона на свой приятел, който е професор там.

Вечерта идва неусетно. Андрей си е тръгнал преди повече от час. Лвов внезапно потъва в тъмнина. Започва режимът на тока, който правителството въведе след масираните руски обстрели срещу украински градове и инфраструктура отпреди два дни. Мислим си, че ей сега всичко ще утихне. Изненадата ни е голяма, когато до всеки магазин или ресторант се появяват генератори в различни размери и сградите светват. Шумът е оглушителен, не можеш да чуеш човека до себе си, но улиците продължават да са пълни с хора, ток от генераторите има, POS терминалите работят, за да пазаруваш спокойно, можеш и да заредиш телефона си някъде при нужда.
Звъня на Олег, професора в болницата за ветерани. Никак не се учудвам, когато операторът ми казва:
Моля, изчакайте! Абонатът говори за победата!
Пиша му съобщение. Утре ще се видим при ветераните.
Post Syndicated from Тоест original https://www.toest.bg/most/

Стоя на моста
Наведена към реката и гледам
Как заобикаля камъните
Как се пени над тях
Как влачи боклуци
Как се чисти
Къде отиваш река
Защо бързаш
Нали знаеш
Ще стигнеш долу
Ще стигнеш в ниското
Ще се успокоиш над наносите
И там ще се образува вирът
В който децата ще плуват през лятната ваканция
А ние ще гледаме от брега веселите им игри
Разплисканата вода
Като родители на детска площадка
Без да можем да предотвратим
Поредната битка
Очаквания плач раните
Нанесени от брат на брата
Кръвта от която
Водата е вече червена
Някой нагълтал вода
Някой се дави
А никой не реагира
Силвия Чолева
Силвия Чолева (р. 1959, София) е писателка, издателка и журналистка. Авторка е на шест стихосбирки, сред които „Детето на глухонемите“ (1993), „Картички“ и „Писма“ (2007) и „От небето до земята“ (2015); две книги с фрагменти – „Отиване Връщане“ (1997) и „Зими и лета“ (2001); романa „Зелено и златно“ (2010) и книгата с разкази „Гошко“ (2013). Има поставена една пиеса – „Ела, легни върху мен“, и три радиопиеси, излъчени по БНР. През 2012 г. заедно с Иглика Василева и Калоян Игнатовски основава Издателство за поезия ДА.
Според Екатерина Йосифова „четящият стихотворение сутрин… добре понася другите часове“ от деня. Убедени, че поезията държи умовете ни будни, а сърцата – отворени, в края на всеки месец ви предлагаме по едно стихотворение. Защото и в най-смутни времена доброто стихотворение е добра новина.
Post Syndicated from The History Guy: History Deserves to Be Remembered original https://www.youtube.com/watch?v=NgvQyd2Waok
Post Syndicated from Grab Tech original https://engineering.grab.com/llm-assisted-vector-similarity-search
As the complexity of data retrieval requirements continue to grow, traditional search methods often struggle to provide relevant and accurate results, especially for nuanced or conceptual queries. Vector similarity search has emerged as a powerful technique for finding semantically similar information. It refers to finding vectors in a large dataset that are most similar to a given query vector, typically using some distance or similarity measure. The concept originated in the 1960s with the work by Minsky and Papert on nearest neighbour search 1. Since then, the idea has evolved substantially with modern approaches often using approximate methods to enable fast search in high-dimensional spaces, such as locality-sensitive hashing 2 and graph-based indexing 3.
Recently, vector similarity search has become a crucial component in many machine learning and information retrieval applications. It is one of the key technologies that popularised the idea of Retrieval Augmented Generation (RAG) 4 which increased the applicability of Transformer 5 based Generative Large Language Models (LLMs) 6 in domain-specific tasks without requiring any further training or fine-tuning. However, the effectiveness of the vector search can be limited when dealing with intricate queries or contextual nuances. For example, from a typical vector similarity search perspective, “I like fishing” and “I do not like fishing” may be quite close to each other, while in reality, they are the exact opposite. In this blog post, we discuss an approach that we experimented with that combines vector similarity search with LLMs to enhance the relevance and accuracy of search results for such complex and nuanced queries. We leverage the strengths of both techniques: vector similarity search for efficient shortlisting of potential matches, and LLMs for their ability to understand natural language queries and rank the shortlisted results based on their contextual relevance.
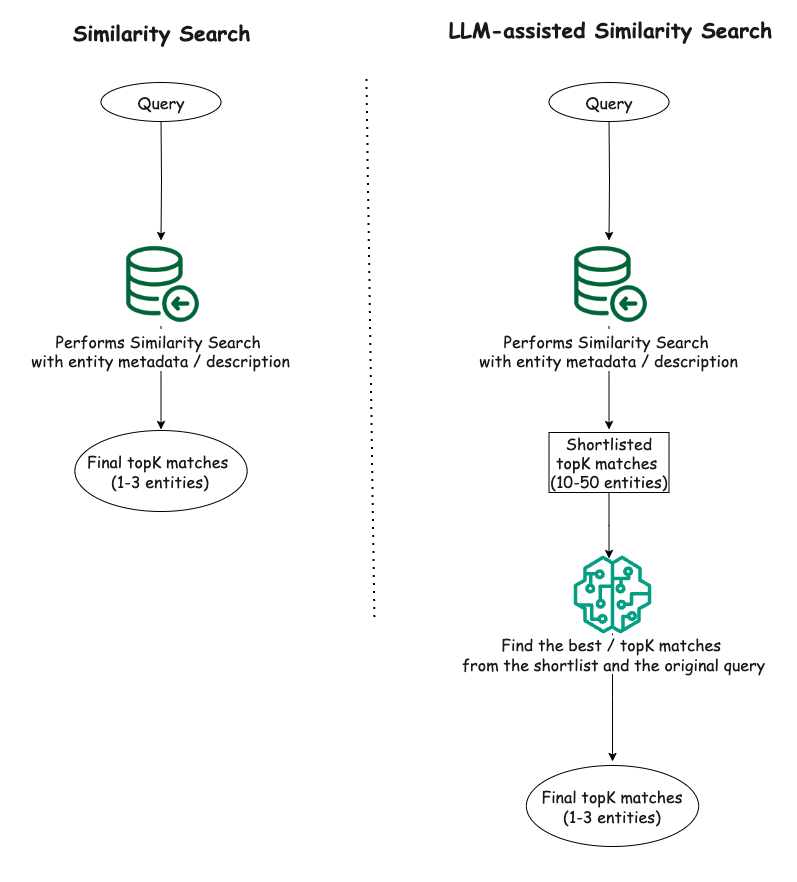
The proposed solution involves a two-step process:
Vector similarity search: We first perform a vector similarity search on the dataset to obtain a shortlist of potential matches (e.g., top 10-50 results) for the given query. This step leverages the efficiency of vector similarity search to quickly narrow down the search space.
LLM-assisted ranking: The shortlisted results from the vector similarity search are then fed into an LLM, which ranks the results based on their relevance to the original query. The LLM’s ability to understand natural language queries and contextual information helps in identifying the most relevant results from the shortlist.
By combining these two steps, we aim to achieve the best of both worlds: the efficiency of vector similarity search for initial shortlisting, and the contextual understanding and ranking capabilities of LLMs for refining the final results.
To evaluate the effectiveness of our proposed solution, we conducted experiments on two small synthetic datasets in CSV format that we curated using GPT-4o 7.
It is important to note that we primarily focus on performing similarity search on structured data such as description of various entities in a relational database.
Our experimental setup included a Python script for vector similarity search leveraging Facebook AI Similarity Search (FAISS) 8, a library developed by Facebook that offers efficient similarity search, and OpenAI’s embeddings (i.e., text-embedding-ada-002) 9 to generate the vector embeddings needed for facilitating the vector search. For our proposed solution, an LLM component (i.e., GPT-4o) was included in the setup in addition to the FAISS-based similarity search component.
To compare the performance of the proposed approach of LLM-assisted vector similarity search as outlined in the “Proposed solution” section with the raw vector similarity search, we conducted both techniques on our two synthetic datasets. With the raw vector search, we get the top three matches for a given query. For our proposed technique, we first get a shortlist of 15 entity matches from FAISS for the same query, and supply the shortlist and the original query to LLM with some descriptive instructions in the prompt to find the top three matches from the provided shortlist.
From the experiments, in simpler cases where the queries were straightforward and directly aligned with the textual content of the data, both the raw similarity search and the LLM-assisted similarity search demonstrated comparable performance. However, as the queries became more complex, involving additional constraints, negations, or conceptual requirements, the LLM-assisted search exhibited a clear advantage over the raw similarity search. The LLM’s ability to understand context and capture subtleties in the queries allowed it to filter out irrelevant results and rank the most appropriate ones higher, leading to improved accuracy.
Here are a few examples where the LLM-assisted similarity search performed better:
Query: “food with no fish or shrimp”
Raw similarity search result:
- title: Tempura, description: A Japanese dish of seafood or vegetables that have been battered and deep fried.
- title: Ceviche, description: A seafood dish popular in Latin America, made from fresh raw fish cured in citrus juices.
- title: Sushi, description: A Japanese dish consisting of vinegared rice accompanied by various ingredients such as seafood and vegetables.
LLM-assisted similarity search result:
- title: Chicken Piccata, description: Chicken breasts cooked in a sauce of lemon, butter, and capers.
- title: Chicken Alfredo, description: An Italian-American dish of pasta in a creamy sauce made from butter and Parmesan cheese.
- title: Chicken Satay, description: Grilled chicken skewers served with peanut sauce.
Observation: The LLM correctly filtered out dishes containing fish or shrimp, while the raw similarity search failed to do so, presumably due to the presence of negation in the query.
Query: “exposure to wildlife”
Raw similarity search result:
- name: Ocean Park, city: Hong Kong, country: Hong Kong, description: Marine mammal park and oceanarium.
- name: Merlion Park, city: Singapore, country: Singapore, description: Iconic statue with the head of a lion and body of a fish.
- name: Manila Bay, city: Manila, country: Philippines, description: A natural harbor known for its sunset views.
LLM-assisted similarity search result:
- name: Ocean Park, city: Hong Kong, country: Hong Kong, description: Marine mammal park and oceanarium.
- name: Chengdu Research Base, city: Chengdu, country: China, description: A research center for giant panda breeding.
- name: Mount Hua, city: Shaanxi, country: China, description: Mountain known for its dangerous hiking trails.
Observation: Two out of the top three matches by the LLM-assisted technique seem relevant to the query while only one result from the raw similarity search is relevant and the other two being somewhat irrelevant to the query. The LLM identified the relevance of a research base for giant panda breeding to the “exposure to wildlife”, which the raw similarity search ignored in its ranking.
These examples provide a glimpse into the utility of LLMs in finding more relevant matches in scenarios where the queries involved additional context, constraints, or conceptual requirements beyond simple keyword matching. On the other hand, when the queries were more straightforward and focused on specific keywords or phrases present in the data, both approaches demonstrated comparable performance. For instance, queries like “Japanese food” or “beautiful mountains” yielded similar results from both the raw similarity search and the proposed LLM-assisted approach.
Overall, the LLM-assisted vector search exhibited a clear advantage in handling complex queries, leveraging its ability to understand natural language and contextual information. However, for simpler queries, the raw similarity search remained a viable option, especially when computational efficiency is a concern.
The experiments demonstrated the potential of combining vector similarity search with LLMs to enhance the relevance and accuracy of search results, particularly for complex and nuanced queries. While vector similarity search alone can provide reasonable results for straightforward queries, the LLM-assisted approach shines when dealing with queries that require a deeper understanding of context, nuances, and conceptual relationships. By leveraging the natural language understanding capabilities of LLMs, this approach can better capture the intent behind complex queries and provide more relevant search results.
Our experiment was limited to using a small volume of structured data (100 data points in each dataset) with a limited number of queries. However, we have witnessed similar enhancement in search result relevance when we deployed this solution internally within Grab for larger datasets, for example, 4500+ rows of data stored in a relational database.
Nevertheless, it is important to note that the effectiveness of this approach may still depend on the quality and complexity of the data, as well as the specific use case and query patterns. We believe it is still worthwhile to evaluate the proposed approach for more diverse (e.g., beyond CSV) and larger datasets. An interesting future work can be varying the size of the shortlist from the similarity search and observing how it impacts the overall search relevance when using the proposed approach. In addition, for real world applications, the performance implications in terms of additional latency introduced by the additional LLM query must also be considered.
Grab is the leading superapp platform in Southeast Asia, providing everyday services that matter to consumers. More than just a ride-hailing and food delivery app, Grab offers a wide range of on-demand services in the region, including mobility, food, package and grocery delivery services, mobile payments, and financial services across 700 cities in eight countries.
Powered by technology and driven by heart, our mission is to drive Southeast Asia forward by creating economic empowerment for everyone. If this mission speaks to you, join our team today!
M. Minsky and S. Papert, Perceptrons: An Introduction to Computational Geometry. MIT Press, 1969. ↩
P. Indyk and R. Motwani, “Approximate nearest neighbors: Towards removing the curse of dimensionality,” in Proceedings of the Thirtieth Annual ACM Symposium on Theory of Computing, 1998. ↩
Y. Malkov and D. Yashunin, “Efficient and robust approximate nearest neighbor search using hierarchical navigable small world graphs,” IEEE Transactions on Pattern Analysis and Machine Intelligence, 2020. ↩
P. Lewis, E. Perez, A. Piktus, F. Petroni, V. Karpukhin, N. Goyal, and D. Kiela, “Retrieval-augmented generation for knowledge-intensive NLP tasks,” in Advances in Neural Information Processing Systems, 2020. ↩
A. Vaswani, “Attention is all you need,” in Advances in Neural Information Processing Systems, 2017. ↩
A. Radford, “Improving language understanding by generative pre-training,” 2018. ↩
“Hello GPT-4o,” OpenAI, May 2024. [Online]. Available: https://openai.com/index/hello-gpt-4o/. [Accessed: Oct. 6, 2024]. ↩
M. Douze, A. Guzhva, C. Deng, J. Johnson, G. Szilvasy, P. E. Mazaré, and H. Jégou, “The faiss library,” arXiv preprint arXiv:2401.08281, 2024. ↩
“Embeddings,” OpenAI API. [Online]. Available: https://platform.openai.com/docs/guides/embeddings. [Accessed: Oct. 6, 2024]. ↩
Post Syndicated from xkcd.com original https://xkcd.com/3002/

Post Syndicated from corbet original https://lwn.net/Articles/995186/
Perhaps one of the more surprising changes in the 6.12-rc4 development
kernel was the removal
of several entries from the kernel’s MAINTAINERS file. The patch
performing the removal was sent (by Greg Kroah-Hartman) only to the
[email protected] mailing list; the change was included in a char-misc drivers
pull request with no particular mention.
The explanation for the removal is simply “various compliance
“. Given that the developers involved all appear to be of
requirements
Russian origin, it is not too hard to imagine what sort of compliance is
involved here. There has, however, been no public posting of the policy
that required the removal of these entries.
Post Syndicated from Brian Beach original https://aws.amazon.com/blogs/devops/introducing-the-new-amazon-q-developer-experience-in-aws-lambda/
AWS Lambda recently announced a new code editor based on Code-OSS. Like the previous version, the new editor includes Amazon Q Developer. Amazon Q Developer is a generative AI-powered assistant for software development that can help you build and debug Lambda functions more quickly. In this post, I provide an overview of Amazon Q Developer’s integration into the new built-in code editor.
AWS Lambda first supported Amazon Q Developer in 2022 (previously known as Amazon CodeWhisperer). While Q Developer has added many features since 2022, the experience in the Lambda editor has remained mostly unchanged until recently. For example, the quality and length of recommendations has increased significantly over the past two years. The original blog post announcing support for Q Developer in the Lambda editor (then called CodeWhisperer) used a series of prompts such as “upload a file to an S3 bucket” or “send a notification using SNS” to incrementally build a Lambda function. While that was impressive at the time, Q Developer can now accept much longer and more complex prompts. For example, I asked Q Developer to create an image moderation function with the following comment. This comment will result in about seventy lines of Python code, including whitespace.
This function moderates images uploaded to S3. It is invoked by an S3 event notification when a new image is uploaded. First, it calls Rekognition image moderation. It also uses Rekognition to extract text from the image, and uses Comprehend to check for toxic content. Finally, it sends a message to the SQS queue identified in the env var QUEUE_URL if the image was moderated or if it contained toxic content. The env var MIN_SCORE allows configuration of the confidence score used as the threshold for both moderation and toxicity.
While I can use this comment in both the old and new editor, the experience in the new editor has significantly improved. Note that in the following image of the old editor, I can only see the first eight lines of the suggestion in a popup. I have to scroll to review the remaining 62 lines of code. The old editor experience did not anticipate that Q Developer would someday return 70 lines, or more, in a single response.

The experience in the new editor is much improved as shown in the following image. I can preview the entire suggestion in-line with my code, up to the size of my screen. This makes it much easier to evaluate the suggestion before deciding to accept or decline it.

Now that you have seen the new editor in action, let’s discuss how to configure and use it.
Q Developer can provide you with code recommendations in real time. As you write code, Q Developer automatically generates suggestions based on your existing code and comments. Before I can use Q Developer in the Lambda console, I must first configure it as described in Using Amazon Q Developer with AWS Lambda. With that done, I am ready to start with a simple example.
While I love Python, I often find myself working with a dictionary object without knowledge of its structure. As a result, I waste time reading the documentation searching for the names of various keys. In Lambda, the event object is passed as a dictionary. In addition, each event type has a different structure. Q Developer can save me countless hours of reading documentation to find the structure of each event.
As an example, imagine that I have created a function that can be triggered by Amazon API Gateway, Application Load Balancer, and AWS AppSync. I need to get the IP address of the client that invoked my function. While this is available in the X-Forwarded-For header, the location and format of the header in the dictionary is subtly different in each event type. Q Developer can save me a trip to the documentation.
In the example below, Q Developer is making the correct suggestion for API Gateway based on the contextual clues in my file. Specifically, the comments on lines one and three. When I hit enter at the end of line three, Q Developer uses the context to recommend the code on line four. Note that it correctly recommends X-Forwarded-For with capitals for an API Gateway event.

However, in the next example, the comment on line one now mentions an Application Load Balancer. Note that Q Developer correctly recommends x-forwarded-for in lower-case for an Application Load Balancer event.

That trivial example just saved me a trip to the documentation that would have taken three to five minutes. If I can do that a few times every hour, it has a huge impact on my productivity and focus due to less context switching.
While the in-line completion experience is greatly improved in the new editor, Q Developer supports other capabilities in the Lambda console that I do not want to overlook. Let’s take a moment to review chat and troubleshooting, which are unchanged with the release of the new editor.
Q Developer supports chat in the Lambda console. I can use this to ask questions rather than reading through the documentation. Returning to my original example, the image moderation function, remember that my function expects two environment variables, QUEUE_URL andMIN_SCORE.Imagine that I do not know how to configure an environment variable in the Lambda console. In the following example, I chat with Q Developer to ask for help.

Note that the response is aware of my position in the console. Q Developer says “It looks like you’re already in the function design.” Q Developer not only saves me a trip to the documentation, but it tailors the suggestion to my current position so I do not have to read unnecessary instructions. I will follow Q Developer’s instructions to configure the two required environment variables as shown below.

You can see how chat is able to help keep me on task and in a state of flow. Next, I will show you how Q Developer can help you troubleshoot issues in the console.
With the environment variables configured, I am ready to test my function. However, when I run a test, I get an error message as shown in the following image. Note the “Diagnose with Amazon Q” button. Q Developer noticed that I am having issues, and is offering to help.

If I select the “Diagnose with Amazon Q” button, Q Developer will analyze the error. In the example below, you can see that it has identified that “the Lambda function is unable to access an object in S3.” Of course! I never granted the Lambda function permission to access the Amazon Simple Storage Service (Amazon S3) bucket.

I could go back to the chat pane I used earlier and ask Q Developer how to add permissions. However, notice that it already provides set-by-step instructions to fix the issue. So, I don’t even need to use the chat. Once I fix the permissions, my function is working as expected. Q Developer has saved me time and made me much more productive.
If you have been following along and deployed a Lambda function, please remember to delete it.
The new AWS Lambda built-in editor experience greatly improves the Q Developer inline suggestion experience for Lamba. This new editor, combined with the existing chat and troubleshooting capabilities can significantly improve your productivity. To learn more read Getting started with Amazon Q Developer and Using Amazon Q Developer with AWS Lambda.
Post Syndicated from The History Guy: History Deserves to Be Remembered original https://www.youtube.com/watch?v=RTCegEn5GsQ
Post Syndicated from Nicholas Jaeger original https://aws.amazon.com/blogs/security/how-to-use-the-amazon-detective-api-to-investigate-guardduty-security-findings-and-enrich-data-in-security-hub/
Understanding risk and identifying the root cause of an issue in a timely manner is critical to businesses. Amazon Web Services (AWS) offers multiple security services that you can use together to perform more timely investigations and improve the mean time to remediate issues. In this blog post, you will learn how to integrate Amazon Detective with AWS Security Hub, giving you better visibility into threat indicators and investigative data directly from Security Hub, which provides you with a centralized view of your overall security posture across your AWS accounts.
Amazon GuardDuty is an intelligent threat detection service that continuously monitors your AWS accounts, workloads, runtime activity, and data for potential malicious activity. If suspicious activity, such as anomalous behavior or credential exfiltration, is detected, GuardDuty generates detailed security findings. When you enable GuardDuty and Security Hub in the same account within the same AWS Region, GuardDuty sends its generated findings to Security Hub.
AWS Security Hub is a cloud security posture management tool that automatically detects when your AWS accounts and resources deviate from security best practices, aggregates security alerts into a single place and format, and provides insight into your security posture across your AWS accounts.
Amazon Detective makes it easier for you to analyze, investigate, and quickly identify the root cause of potential security issues or suspicious activities. Detective supports the ability to automatically investigate AWS Identity and Access Management (IAM) users and roles for indicators of compromise (IoC). This capability helps security analysts determine whether IAM users and IAM roles have potentially been compromised or involved in any known tactics, techniques, and procedures (TTPs) from the MITRE ATT&CK framework. In this post, we show you an example of how to programmatically use the Detective Investigation API to help investigate potential security issues.
The example architecture we provide in this post performs enrichment automatically for CRITICAL, HIGH, and MEDIUM severity findings and gives you the flexibility to initiate additional investigations and enrichment on-demand. You then have the option to review those enriched findings directly in the Security Hub console, or you can enable an integration to review the enriched findings in the AWS service or AWS Partner Network (APN) solution of your choice. This post gives an overview of what you need to do to build the example architecture, but if you prefer step-by-step instructions, check out the workshop version of the instructions.
This integration and finding enrichment is made possible through the use of the Detective Investigation API. You must have GuardDuty, Detective, and Security Hub enabled for this to work. We recommend that you build this architecture in the account you are using as a delegated admin for GuardDuty, Detective, and Security Hub, and in the Region where Security Hub aggregates findings (if finding aggregation is configured).
Security Hub automatically ingests findings from GuardDuty. You can integrate Security Hub with Detective using EventBridge rules and a Lambda function. To make the solution more manageable and customizable, you can configure a Security Hub custom action and a Security Hub automation rule. The custom action is used to identify findings you want to manually select for investigation. The automation rule is configured to identify and flag findings you want to automatically initiate investigations for. EventBridge rules (two of them) are used to initiate the Lambda function for each finding you want to investigate and enrich. The Lambda function processes the finding it receives, makes API calls to Detective, and then makes an API call back to Security Hub to update and enrich the finding. The Lambda function is invoked one time for each finding. Figure 1 illustrates this solution.
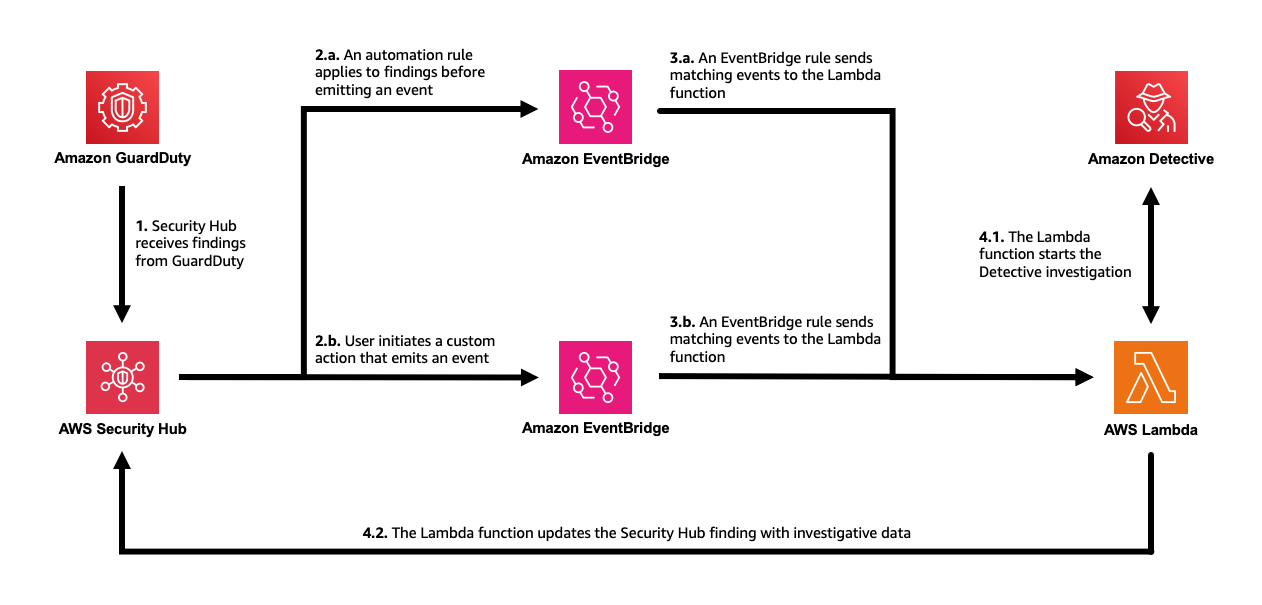
Figure 1: The solution architecture, including GuardDuty, Security Hub, EventBridge, Lambda, and Detective
The workflow is as follows:
In the following sections of this post, we provide more detail on the architecture components and setup. As a prerequisite, you must have GuardDuty, Detective, and Security Hub enabled.
You can start investigations in Detective and retrieve the results through the API. AWS Lambda supports several programming languages, but you will use JavaScript (Node.js 20.x) in this example. To start an investigation, supply the Amazon Resource Name (ARN) of an IAM role or user, the start time, the end time, and the ARN of the Detective behavior graph. The Detective API will fetch the results of the investigation, including IoCs, TTPs, and a categorical severity score. The severity score returned is computed using two dimensions, confidence and impact, where the confidence represents the likelihood that the events are anomalous and not normal user behavior, while the impact quantifies harm that could occur from the events as a measure of the TTPs’ effect.
You can use the example Lambda function in code sample 1 as the target of the EventBridge rule in the architecture previously described. The function takes the ARN from a GuardDuty security finding that was aggregated by Security Hub and calls the Investigation API. When the result is returned, the function formats the data into the AWS Security Finding Format (ASFF) used by Security Hub and calls the BatchUpdateFindings API to send the enriched, updated finding back to Security Hub. Make sure to read and review the function so you understand in detail how it works.
Code sample 1: Example JavaScript Lambda function using Node.js 20.x
For this function to work as desired, you need to change the permissions and the timeout of the Lambda function. The permissions must include the necessary actions you are taking with Detective and Security Hub in the function. Attach the policy shown in code example 2 to the role used by the function. Then set the timeout of the function to 15 minutes to allow Detective to complete the investigation. Note that you can change “Resource”:”*” to restrict permissions as needed.
Code example 2: Permissions required by the Lambda function
Now that you’ve set up the Lambda function, you’re ready to set up the two methods of initiating the investigations. The first approach involves automatically investigating and enriching CRITICAL, HIGH, and MEDIUM severity GuardDuty findings. This can accelerate investigations for the highest severity findings because you don’t need to go into Security Hub or Detective and manually select the findings for investigation.
In this approach, the investigation Lambda function you previously created is automatically invoked by using Security Hub automations and an EventBridge rule. Using Security Hub automations allows you to configure and update which findings get automatically investigated and enriched without ongoing code changes. (Automation rules use a UI with dropdown options for criteria.)
Set up an automation rule from the Automations page in Security Hub. Use these criteria for the rule:
In the future, if you want to modify which findings are automatically investigated, you can revisit the rule and select new criteria to specify which findings receive the user-defined field.
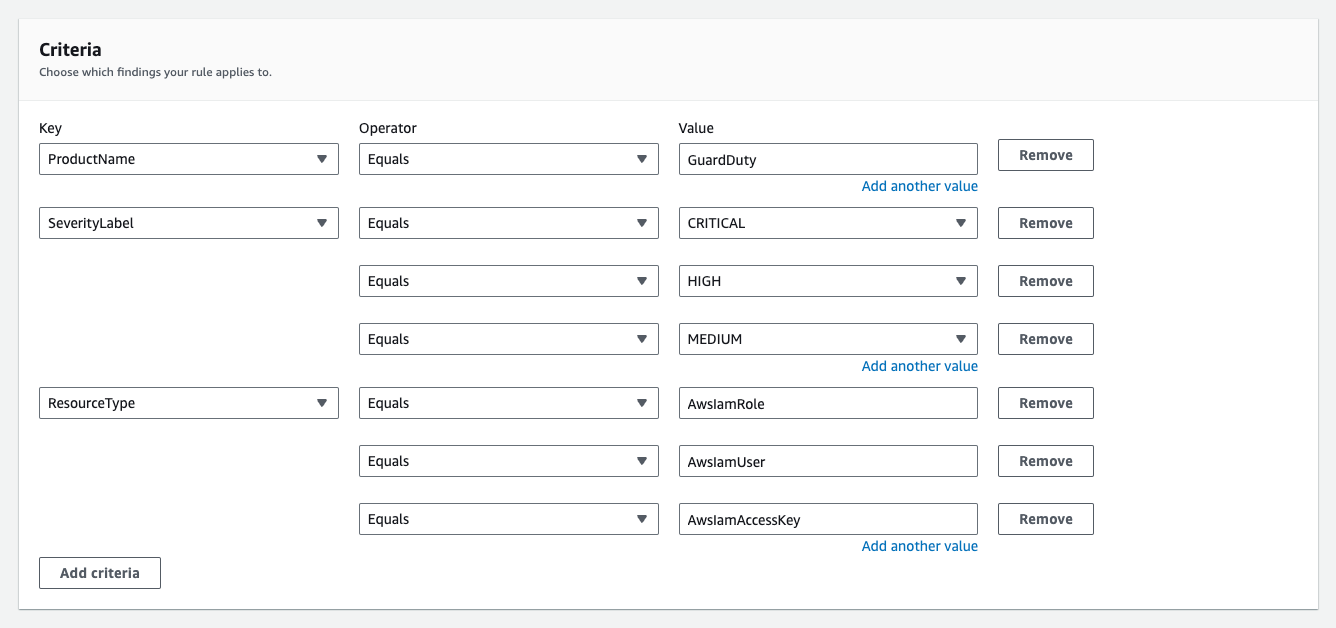
Figure 2: Example criteria for automation rule in Security Hub
For the automated actions for the rule, add a user-defined field as follows:

Figure 3: Define the user-defined field for the automation rule in Security Hub
Next, set an EventBridge rule to determine which Security Hub Findings – Imported events are investigated based on the user-defined field, investigate. Each Security Hub Findings – Imported event contains a single finding. Use the JSON pattern shown in Code example 3 to match findings in the rule. You need to set the target of this rule to the Lambda function you set up earlier.
Code example 3: The pattern used in your EventBridge rule
As new findings are aggregated in Security Hub, they are evaluated and updated by the automation rule. Findings that receive the user-defined field will initiate the Lambda function. After the Lambda function is initiated, it might take a couple of minutes for the execution to complete and appear in Security Hub. When it does, you will notice a new Notes field, as shown in Figure 4, and additional data in the finding JSON.
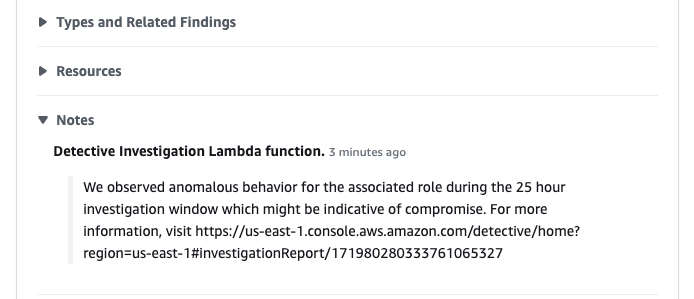
Figure 4: See that the enriched finding now includes a Notes section
You can also see what updates were made to the finding on the History tab of the finding, as shown in Figure 5.
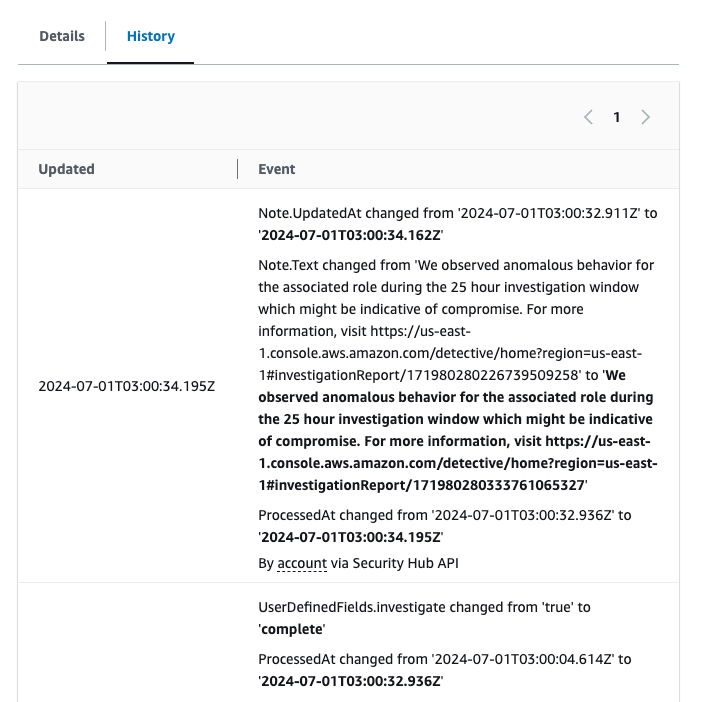
Figure 5: See the fields that were updated for the finding under the History tab
If you want to modify which findings start this flow, you can modify the automation rule in the Security Hub console. For example, you might also want to investigate findings from other services or with other severity labels. Keep in mind that Detective only supports IAM users and IAM roles.
You might want to add additional criteria to help prevent repeat investigations on the same findings. For example, you might not want to have the investigation flow initiated every time a finding receives an update. To help prevent this behavior, you can add criteria to the automation rule where the user-defined field, investigate, does not equal complete.
The second approach involves investigating and enriching findings on-demand. You might want to use both approaches in case there are findings that don’t meet the criteria of your earlier automation that you still want to investigate.
In this approach, initiate the Lambda function through the use of a feature in Security Hub called custom actions. To use a Security Hub custom action to send findings to EventBridge, you first create the custom action in Security Hub. Name it Investigate. Then, define a rule in EventBridge that applies to your custom action (using the ARN of the custom action) and that uses the same Lambda function as the target to orchestrate the automation. The pattern of your EventBridge rule will be similar to the one shown in Figure 6, but uses the ARN of the custom action you create in Security Hub.
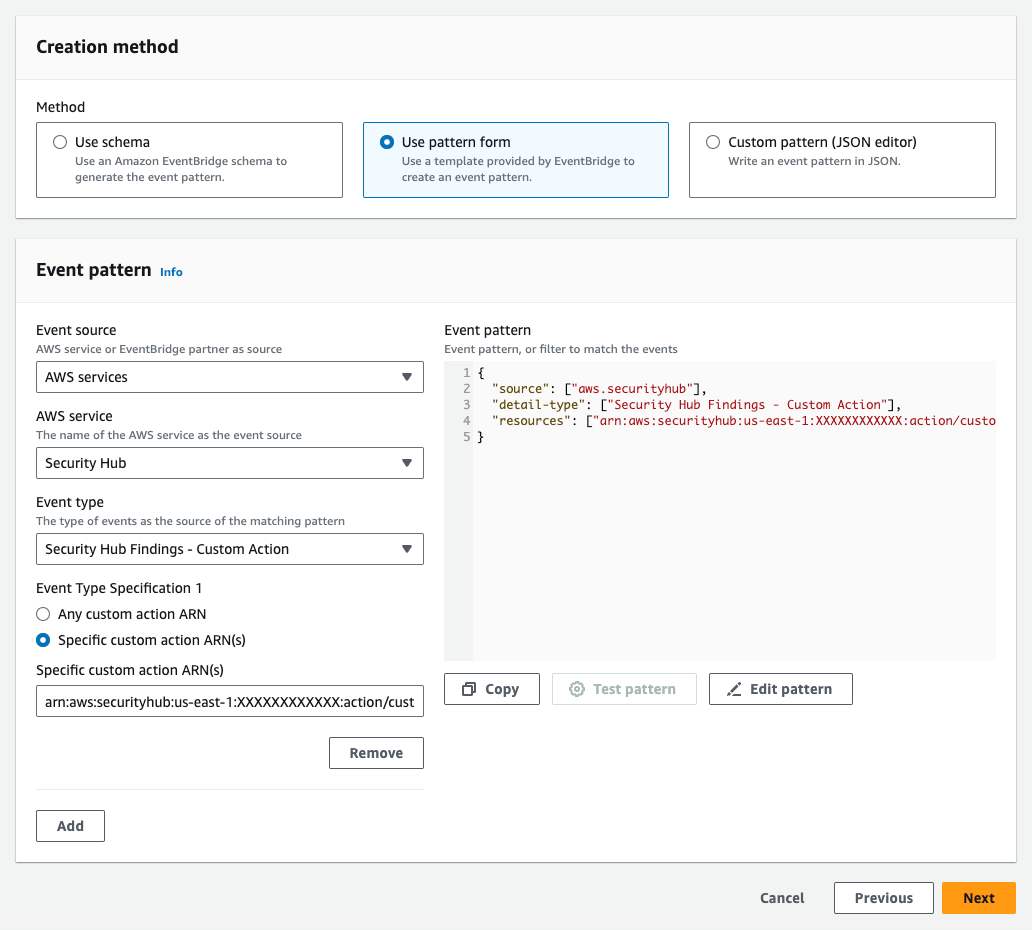
Figure 6: The EventBridge rule for the second approach
After you set up the custom action and the EventBridge rule, you can select a finding and choose Investigate from the Actions dropdown list to initiate the processing, as shown in Figure 7.

Figure 7: Initiate the on-demand finding enrichment
Because both approaches to initiating the investigation use the same Lambda function, the resulting enriched finding in Security Hub will be the same.
We encourage you to try, test, and customize the architecture and example code. To simplify the example, there are some limitations coded in the Lambda function. For example, the Lambda function processes only the first finding it receives (per execution) and proceeds only if the finding originates from GuardDuty. The function also only begins an investigation into the first IAM user or IAM role it identifies that is associated with the finding. If you have a use case requiring that the Lambda function handle multiple findings at a time, findings from other services, or other problems, you will need to make code or architectural changes to accommodate those requirements (such as incorporating the use of AWS Step Functions or Amazon Simple Queue Service (Amazon SQS)), and perform the relevant testing.
Use the example code provided here or the detailed workshop version of the instructions to try out the Detective API and enrich findings in Security Hub with investigative data. This can help you reduce mean time to respond by automatically investigating IAM entities, providing investigation details within the findings, and giving you a direct link into the details of the Detective investigation. Visit Getting started with AWS Security Hub, Getting started with Amazon Detective, and Getting started with Amazon GuardDuty to learn more.
If you have feedback about this post, submit comments in the Comments section below. If you have questions about this post, contact AWS Support.
Post Syndicated from The Atlantic original https://www.youtube.com/watch?v=mMPQKKUd8nk