Post Syndicated from LastWeekTonight original https://www.youtube.com/shorts/VPtAWwRBHUc
Celebrating 10 years of Amazon Aurora innovation
Post Syndicated from Sébastien Stormacq original https://aws.amazon.com/blogs/aws/celebrating-10-years-of-amazon-aurora-innovation/
Ten years ago, we announced the general availability of Amazon Aurora, a database that combined the speed and availability of high-end commercial databases with the simplicity and cost-effectiveness of open source databases.
As Jeff described it in its launch blog post: “With storage replicated both within and across three Availability Zones, along with an update model driven by quorum writes, Amazon Aurora is designed to deliver high performance and 99.99% availability while easily and efficiently scaling to up to 64 TiB of storage.”
When we started developing Aurora over a decade ago, we made a fundamental architectural decision that would change the database landscape forever: we decoupled storage from compute. This novel approach enabled Aurora to deliver the performance and availability of commercial databases at one-tenth the cost.
This is one of the reasons why hundreds of thousands of AWS customers choose Aurora as their relational database.
Today, I’m excited to invite you to join us for a livestream event on August 21, 2025, to celebrate a decade of Aurora database innovation.
A brief look back at the past
Throughout the evolution of Aurora, we’ve focused on four core innovation themes: security as our top priority, scalability to meet growing workloads, predictable pricing for better cost management, and multi-Region capabilities for global applications. Let me walk you through some key milestones in the Aurora journey.
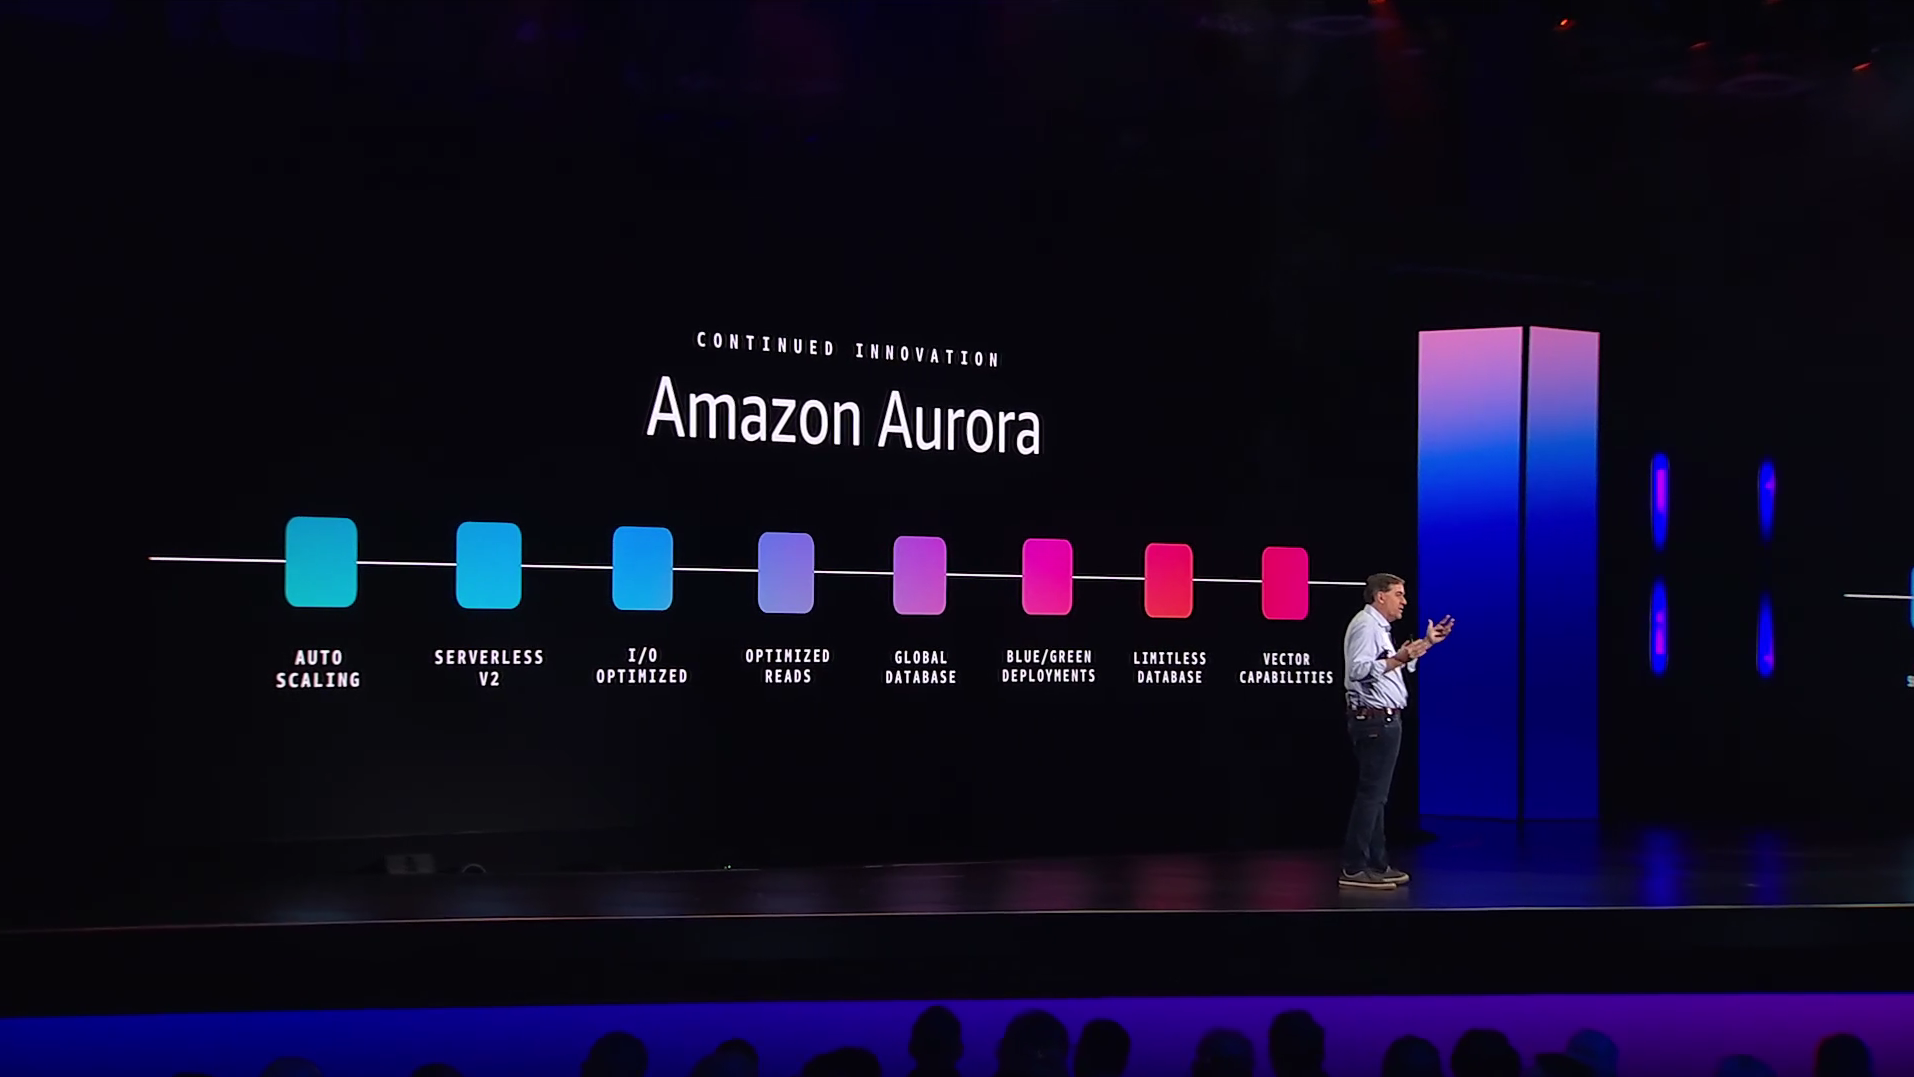
We previewed Aurora at re:Invent 2014, and made it generally available in July 2015. At launch, we presented Aurora as “a new cost-effective MySQL-compatible database engine.”
In June 2016, we introduced reader endpoints and cross-Region read replicas, followed by AWS Lambda integration and the ability to load tables directly from Amazon S3 in October. We added database cloning and export to Amazon S3 capabilities in June 2017 and full compatibility with PostgreSQL in October that year.
The journey continued with the serverless preview in November 2017, which became generally available in August 2018. Global Database launched in November 2018 for cross-Region disaster recovery. We introduced blue/green deployments to simplify database updates, and optimized read instances to improve query performance.
In 2023, we added vector capabilities with pgvector for similarity search for Aurora PostgreSQL, and Aurora I/O-Optimized to provide predictable pricing with up to 40 percent cost savings for I/O-intensive applications. We launched Aurora zero-ETL integration with Amazon Redshift which enables near real-time analytics and ML using Amazon Redshift on petabytes of transactional data from Aurora by removing the need for you to build and maintain complex data pipelines that perform extract, transform, and load (ETL) operations. This year we added Aurora MySQL zero-ETL integration with Amazon Sagemaker, enabling near real-time access of your data in the lakehouse architecture of SageMaker to run a broad range of analytics.
In 2024, we made it as effortless as just one click to select Aurora PostgreSQL as a vector store for Amazon Bedrock Knowledge Bases and launched Aurora PostgreSQL Limitless Database, a serverless horizontal scaling (sharding) capability.
To simplify scaling for customers, we also increased the maximum storage to 128 TiB in September 2020, allowing many applications to operate within a single instance. Last month, we’ve further simplified scaling by doubling the maximum storage to 256 TiB, with no upfront provisioning required and pay-as-you-go pricing based on actual storage used. This enables even more customers to run their growing workloads without the complexity of managing multiple instances while maintaining cost efficiency.
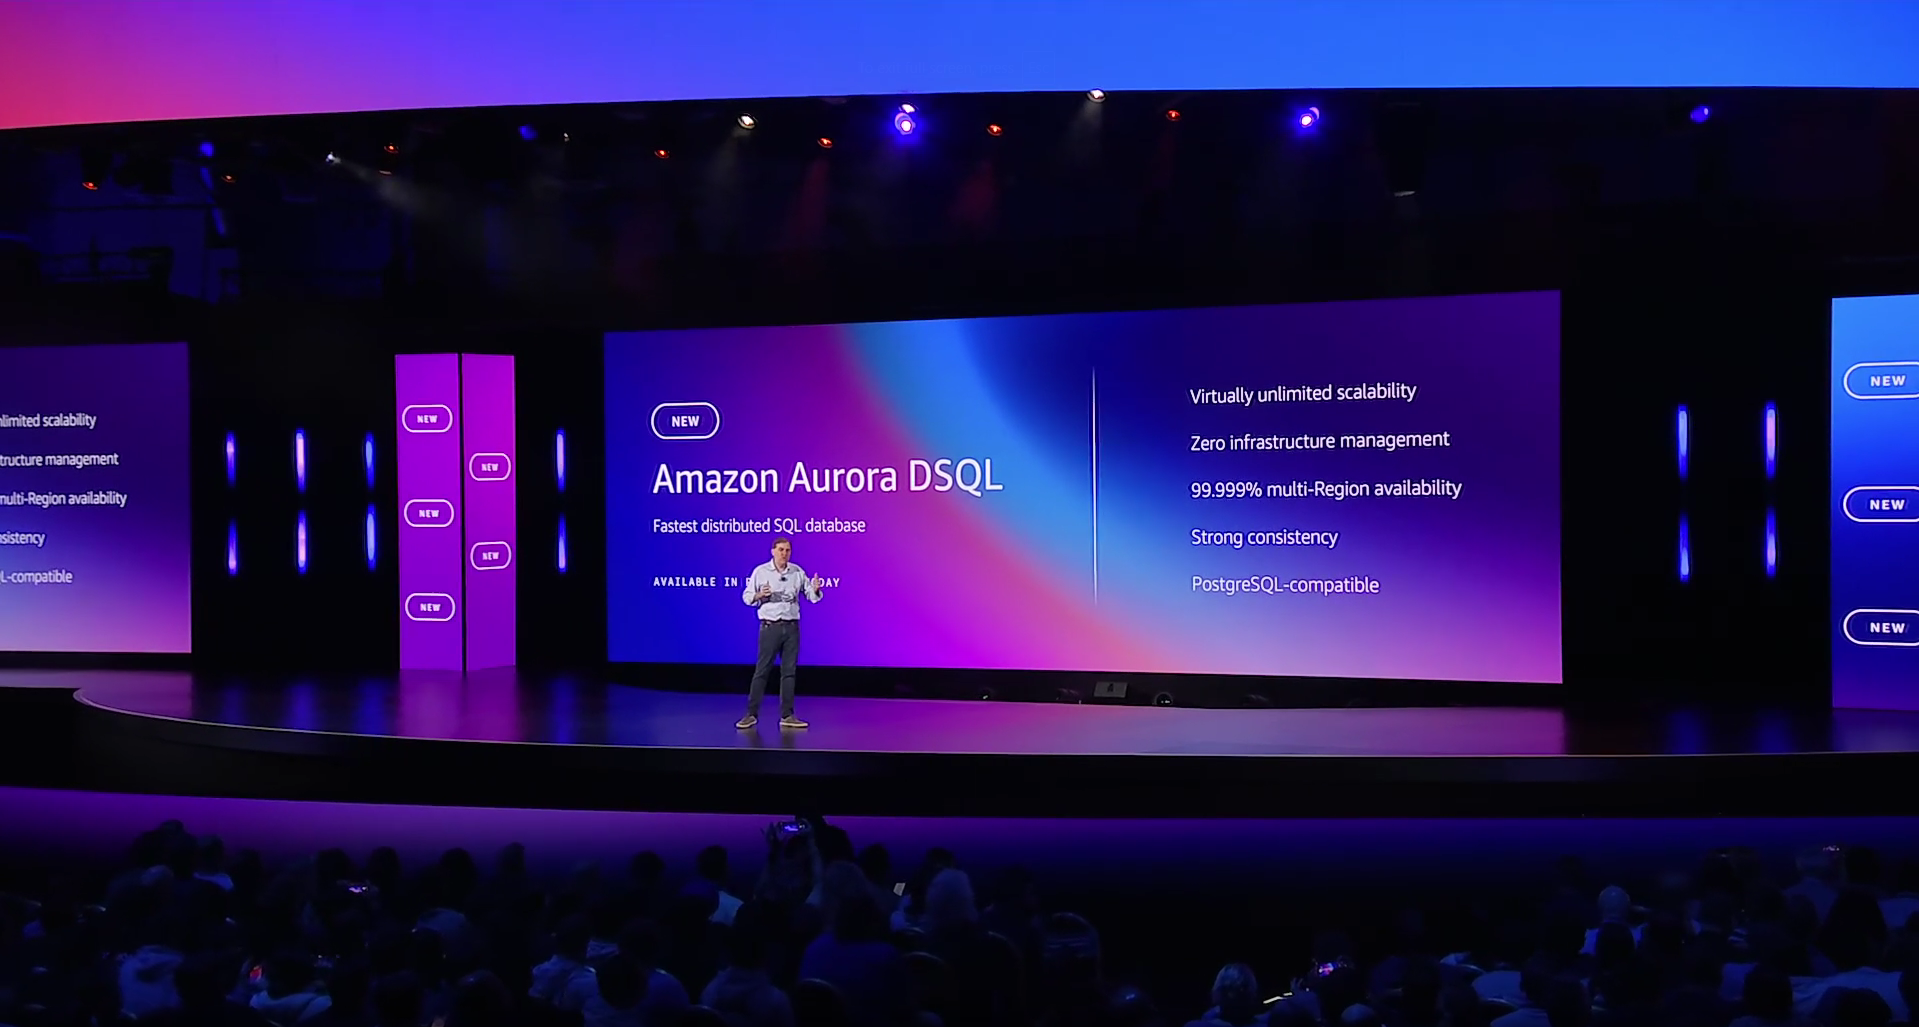
Most recently, at re:Invent 2024, we announced Amazon Aurora DSQL, which became generally available in May 2025. Aurora DSQL represents our latest innovation in distributed SQL databases, offering active-active high availability and multi-Region strong consistency. It’s the fastest serverless distributed SQL database for always available applications, effortlessly scaling to meet any workload demand with zero infrastructure management.
Aurora DSQL builds on our original architectural principles of separation of storage and compute, taking them further with independent scaling of reads, writes, compute, and storage. It provides 99.99% single-Region and 99.999% multi-Region availability, with strong consistency across all Regional endpoints.
And in June, we launched Model Context Protocol (MCP) servers for Aurora, so you can integrate your AI agents with your data sources and services.
Let’s celebrate 10 years of innovation
 By attending the August 21 livestream event, you’ll hear from Aurora technical leaders and founders, including Swami Sivasubramanian, Ganapathy (G2) Krishnamoorthy, Yan Leshinsky, Grant McAlister, and Raman Mittal. You’ll learn directly from the architects who pioneered the separation of compute and storage in cloud databases, with technical insights into Aurora architecture and scaling capabilities. You’ll also get a glimpse into the future of database technology as Aurora engineers share their vision and discuss the complex challenges they’re working to solve on behalf of customers.
The event also offers practical demonstrations that show you how to implement key features. You’ll see how to build AI-powered applications using pgvector, understand cost optimization with the new Aurora DSQL pricing model, and learn how to achieve multi-Region strong consistency for global applications.
The interactive format includes Q&A opportunities with Aurora experts, so you’ll be able to get your specific technical questions answered. You can also receive AWS credits to test new Aurora capabilities.
If you’re interested in agentic AI, you’ll particularly benefit from the sessions on MCP servers, Strands Agents, and how to integrate Strands Agents with Aurora DSQL, which demonstrate how to safely integrate AI capabilities with your Aurora databases while maintaining control over database access.
Whether you’re running mission-critical workloads or building new applications, these sessions will help you understand how to use the latest Aurora features.
Register today to secure your spot and be part of this celebration of database innovation.
To the next decade of Aurora innovation!
What makes a Portrait GREAT? Reviewing the Masters
Post Syndicated from Matt Granger original https://www.youtube.com/watch?v=T-0P7VBxSrM
Five Friday stable kernels
Export JMX metrics from Kafka connectors in Amazon Managed Streaming for Apache Kafka Connect with a custom plugin
Post Syndicated from Jaydev Nath original https://aws.amazon.com/blogs/big-data/export-jmx-metrics-from-kafka-connectors-in-amazon-managed-streaming-for-apache-kafka-connect-with-a-custom-plugin/
Organizations use streaming applications to process and analyze data in real time and adopt the Amazon MSK Connect feature of Amazon Managed Streaming for Apache Kafka (Amazon MSK) to run fully managed Kafka Connect workloads on AWS. Message brokers like Apache Kafka allow applications to handle large volumes and diverse types of data efficiently and enable timely decision-making and instant insights. It’s crucial to monitor the performance and health of each component to help ensure the seamless operation of data streaming pipelines.
Amazon MSK is a fully managed service that simplifies the deployment and operation of Apache Kafka clusters on AWS. It simplifies building and running applications that use Apache Kafka to process streaming data. Amazon MSK Connect simplifies the deployment, monitoring, and automatic scaling of connectors that transfer data between Apache Kafka clusters and external systems such as databases, file systems, and search indices. Amazon MSK Connect is fully compatible with Kafka Connect and supports Amazon MSK, Apache Kafka, and Apache Kafka compatible clusters. Amazon MSK Connect uses a custom plugin as the container for connector implementation logic.
Custom MSK connect plugins use Java Management Extensions (JMX) to expose runtime metrics. While Amazon MSK Connect sends a set of connect metrics to Amazon CloudWatch, it currently does not support exporting the JMX metrics emitted by the connector plugins natively. These metrics can be exported by modifying the custom connect plugin code directly, but it requires maintenance overhead because the plugin code needs to be modified every time it’s updated. In this post, we demonstrate an optimal approach by extending a custom connect plugin with additional modules to export JMX metrics and publish them to CloudWatch as custom metrics. These additional JMX metrics emitted by the custom connectors provide rich insights into their performance and health of the connectors. In this post, we demonstrate how you can export the JMX metrics for Debezium connector when used with MSK Connect.
Understanding JMX
Before we dive deep into exporting JMX metrics, let’s understand how JMX works. JMX is a technology that you can use to monitor and manage Java applications. Key components involved in JMX monitoring are:
- Managed beans (MBeans) are Java objects that represent the metrics of the Java application being monitored. They contain the actual data points of the resources being monitored.
- JMX server creates and registers the MBeans with the PlatformMBeanServer. The Java application that is being monitored acts as the JMX server and exposes the MBeans.
- MBeanServer or JMX registry is the central registry that keeps track of all the registered MBeans in the JMX server. It is the access point for all the MBeans within the Java virtual machine (JVM).
- JMXConnectorServer acts as a bridge between the JMX client and the JMX server and enables remote access to the exposed MBeans. JMXConnectorServerFactory creates and manages the JMXConnectorServer. It allows for the customization of the server’s properties and uses the JMXServiceURL to define the endpoint where the JMX client can connect to the JMX server.
- JMXServiceURL provides the necessary information such as the protocol, host, and port for the client to connect to the JMX server and access the desired MBeans.
- JMX client is an external application or tool that connect to the JMX server to access and monitor the exposed metrics.
JMX monitoring involves the steps shown in the following figure:
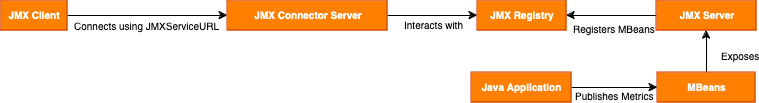
JMX monitoring steps include:
- The Java application acting as the JMX server creates and configures MBeans for the desired metrics.
- JMX server registers the MBeans with the JMX registry.
- JMXConnectorServerFactory creates the JMXConnectorServer that defines the JMXServiceURL that provides the entry point details for the JMX client.
- JMXClient connects to the JMX registry in the JMX server using the JMXServiceURL and the JMXConnectorServer.
- The JMX server handles client requests, interacting with the JMX registry to retrieve the MBean data.
Solution overview
This method of wrapping supported Kafka connectors with custom code that exposes connector-specific operational metrics enables teams to get better insights by correlating various connector metrics with cloud-centered metrics in monitoring systems such as Amazon CloudWatch. This approach enables consistent monitoring across different components of the change data capture (CDC) pipeline, ultimately feeding metrics into unified dashboards while respecting each connector’s architectural philosophy. The consolidated metrics can be delivered to CloudWatch or the monitoring tool of your choice including partner specific application performance management (APM) tools such as Datadog, New Relic, and so on.
We have the working implementation of this same approach with two popular connectors: Debezium source connector and MongoDB Sink Connector. You can find the Github sample and ready to use plugins built for each in the repository. Review the README file for this custom implementation for more details.
For example, our custom implementation for the MongoDB Sink Connector adds a metrics export layer that calculates critical performance indicators such as latest-kafka-time-difference-ms – which measures the latency between Kafka message timestamps and connector processing time by subtracting the connector’s current clock time from the last received record’s timestamp. This custom wrapper around the MongoDB Sink Connector enables exporting relevant JMX metrics and publishing them as custom metrics to CloudWatch. We’ve open sourced this solution on GitHub, along with a ready-to-use plugin and detailed configuration guidance in the README.
CDC is the process of identifying and capturing changes made in a database and delivering those changes in real time to a downstream system. Debezium is an open source distributed platform built on top of Apache Kafka that provides CDC functionality. It provides a set of connectors to track and stream changes from databases to Kafka.
In the next section, we dive deep into the implementation details of how to export JMX metrics from Debezium MySQL Connector deployed as a custom plugin in Amazon MSK Connect. The connector plugin takes care of creating and configuring the MBeans and registering them with the JMX registry.
The following diagram shows the workflow of using Debezium MySQL Connector as a custom plugin in Amazon MSK Connect for CDC from an Amazon Aurora MySQL-Compatible Edition data source.
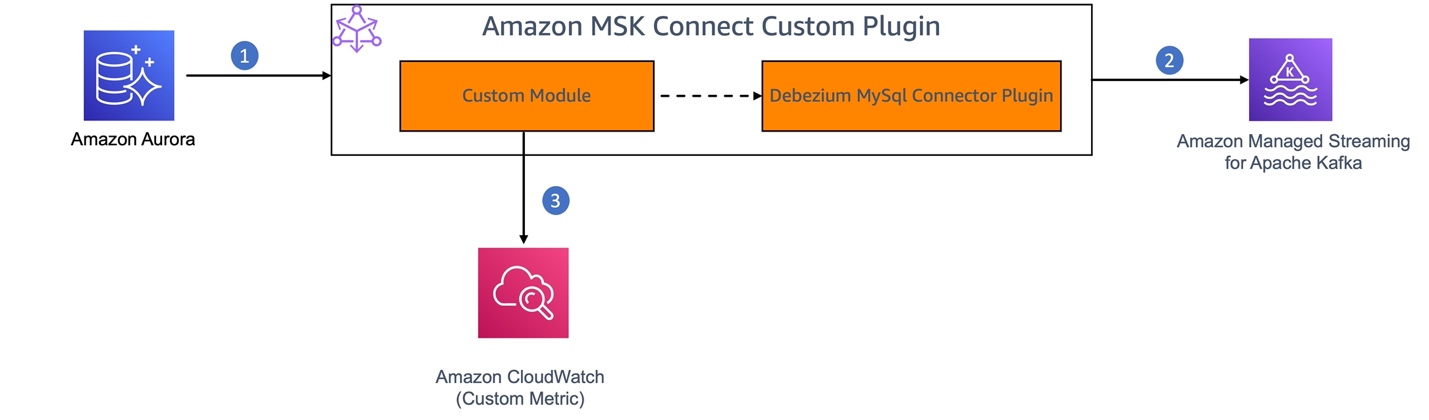
- MySQL binary log (binlog) is enabled in Amazon Aurora for MySQL to record all the operations in the order in which they are committed to the database.
- The Debezium connector plugin component of the MSK Connect custom plugin continuously monitors the MySQL database, captures the row-level changes by reading the MySQL bin logs, and streams them as change events to Kafka topics in Amazon MSK.
- We’ll build a custom module to enable JMX monitoring on the Debezium connector. This module will act as a JMX client to retrieve the JMX metrics from the connector and publish them as custom metrics to CloudWatch.
The Debezium connector provides three types of metrics in addition to the built-in support for default Kafka and Kafka Connect JMX metrics.
- Snapshot metrics provide information about connector operation while performing a snapshot.
- Streaming metrics provide information about connector operation when the connector is reading the binlog.
- Schema history metrics provide information about the status of the connector’s schema history.
In this solution, we export the MilliSecondsBehindSource streaming metrics emitted by the Debezium MySQL connector. This metric provides the number of milliseconds that the connector is lagging behind the change events in the database.
Prerequisites
Following are the prerequisites you need:
- Access to the AWS account where you want to set up this solution.
- You have set up the source database and MSK cluster by following this setup instructions in the MSK Connect workshop.
Create a custom plugin
Creating a custom plugin for Amazon MSK Connect for the solution involves the following steps:
- Create a custom module: Create a new Maven module or project that will contain your custom code to:
- Enable JMX monitoring in the connector application by starting the JMX server.
- Create a Remote Method Invocation (RMI) registry to enable the access to the JMX metrics to the clients.
- Create a JMX metrics exporter to query the JMX metrics by connecting to the JMX server and push the metrics to CloudWatch as custom metrics.
- Schedule to run the JMX metrics exporter at a configured interval.
- Package and deploy the custom module as an MSK Connect custom plugin.
- Create a connector using the custom plugin to capture CDC from the source, stream it and validate the metrics in Amazon CloudWatch.
This custom module extends the connector functionality to export the JMX metrics without requiring any changes in the underlying connector implementation. This helps ensure that upgrading the custom plugin requires only upgrading the plugin version in the pom.xml of the custom module.
Let’s deep dive and understand the implementation of each step mentioned above.
1. Create a custom module
Create a new Maven project with dependencies on Debezium MySQL Connector to enable JMX monitoring, Kafka Connect API for configuration, and CloudWatch AWS SDK to push the metrics to CloudWatch.
Set up a JMX connector server to enable JMX monitoring: To enable JMX monitoring, the JMX server needs to be started at the time of initializing the connector. This is usually done by setting the environment variables with JMX options as described in Monitoring Debezium. In the case of an Amazon MSK Connect custom plugin, JMX monitoring is enabled programmatically at the time of connector plugin initialization. To achieve this:
- Extend the
MySqlConnectorclass and override thestartwhich is the connector’s entry point to execute custom code.
- In the
startmethod of the custom connector class (DebeziumMySqlMetricsConnector) that we are creating, set the following parameters to allow customization of the JMX Server properties by retrieving connector configuration from a config file.
connect.jmx.port – The port number on which the RMI registry needs to be created. JMXConnectorServer would listen to the incoming connections on this port.
database.server.name – Name of the database that is the source for the CDC.
It also retrieves the CloudWatch configuration related properties that will be used while pushing the JMX metrics to CloudWatch.
cloudwatch.namespace.name – CloudWatch NameSpace to which the metrics need to be pushed as custom metrics
cloudwatch.region – CloudWatch Region where the custom namespace is created in your AWS account
- Create an RMI registry on the specified port (
connectJMXPort). This registry is used by the JMXConnectorServer to store the RMI objects corresponding to the MBeans in the JMX registry. This allows the JMX clients to look up and access the MBeans on the PlatformMBeanServer.
LocateRegistry.createRegistry(connectJMXPort);
- Retrieve the
PlatformMBeanServerand construct theJMXServiceURLwhich is in the formatservice:jmx:rmi://localhost/jndi/rmi://localhost:<<jmx.port>>/jmxrmi. Create a new JMXConnectorServer instance using the JMXConnectorServerFactory and the JMXServiceURL and start the JMXConnectorServer instance.
Implement JMX metrics exporter: Create a JMX client to connect to the JMX server, query the MilliSecondBehindSource metric from the JMX server, convert it into the required format, and export it to CloudWatch.
- Connect to the JMX Server using the
JMXConnectorFactoryandJMXServiceURL
- Query the MBean object that holds the corresponding metric, for example,
MilliSecondsBehindSource, and retrieve the metric value using sample code provided in msk-connect-custom-plugin-jmx. (you can choose one or more metrics). - Schedule the execution of your JMX metrics exporter at regular intervals.
getScheduler().schedule(new JMXMetricsExporter(), SCHEDULER_INITIAL_DELAY, SCHEDULER_PERIOD);
Export metrics to CloudWatch: Implement the logic to push relevant JMX metrics to CloudWatch. You can use the AWS SDK for Java to interact with the CloudWatch PutMetricData API or use the CloudWatch Logs subscription filter to ingest the metrics from a dedicated Kafka topic.
For more information, see the sample implementation for the custom module in aws-samples in GitHub. This sample also provides custom plugins packaged with two different versions of Debezium MySQL connector (debezium-connector-mysql-2.5.2.Final-plugin and debezium-connector-mysql-2.7.3.Final-plugin) and the following steps would explain the steps to build a custom plugin using your custom code.
2. Package the custom module and Debezium MySQL connector as a custom plugin
Build and package the Maven project with the custom code as a JAR file and include the JAR file in the debezium-connector-mysql-2.5.2.Final-plugin folder downloaded from maven repo. Package the updated debezium-connector-mysql-2.5.2.Final-plugin as a ZIP file (Amazon MSK Connect accepts custom plugins in ZIP or JAR format). Alternatively, you can use the prebuiltcustom-debezium-mysql-connector-plugin.zip available in GitHub.
Choose the Debezium connector version (2.5 or 2.7) that fits your requirement.
When you have to upgrade to a new version of the Debezium MySQL connector, you can update the version of the dependency and build the custom module and deploy it. By doing this, you can maintain the custom plugin without modifying the original connector code. The GitHub samples provide ready-to-use plugins for two Debezium connector versions. However, you can follow the same approach to upgrade to the latest connector version as well.
Create a custom plugin in Amazon MSK
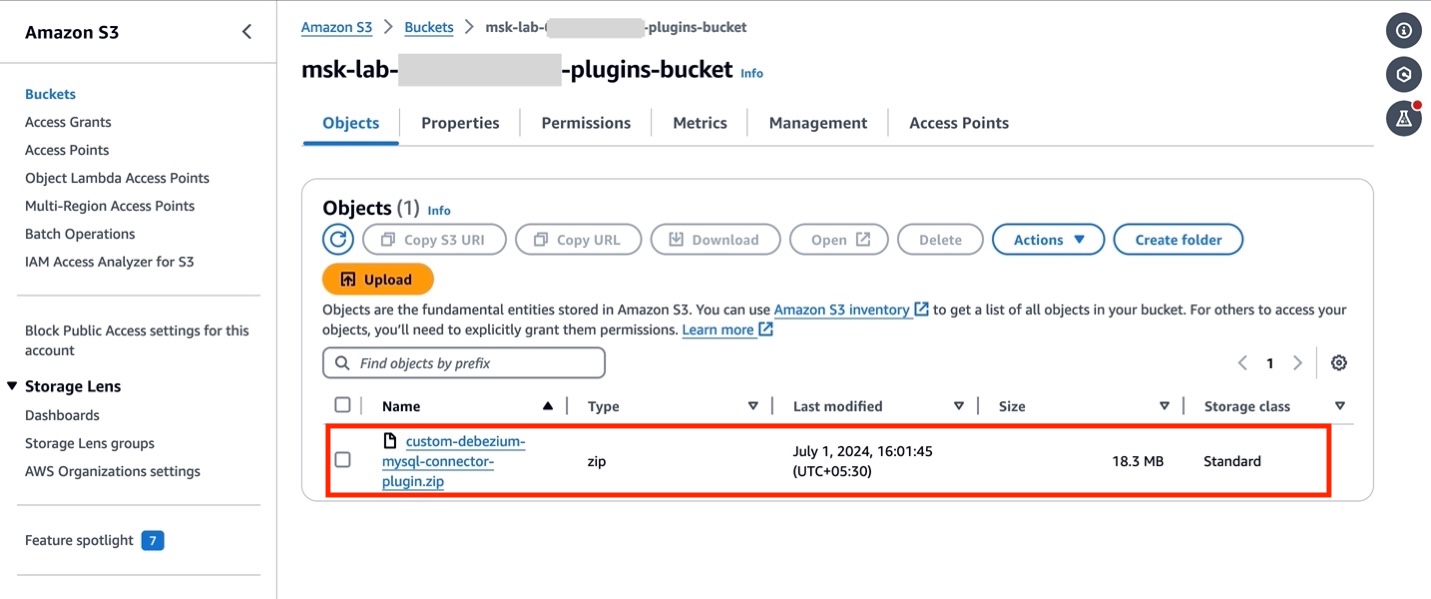
- If you have set up your AWS resources by following the Getting Started lab, open Amazon S3 console and locate the bucket
msk-lab-${ACCOUNT_ID}-plugins-bucket/debezium. - Upload the custom plugin created in the previous section
custom-debezium-mysql-connector-plugin.ziptomsk-lab-${ACCOUNT_ID}-plugins-bucket/debezium, as shown in the following figure.
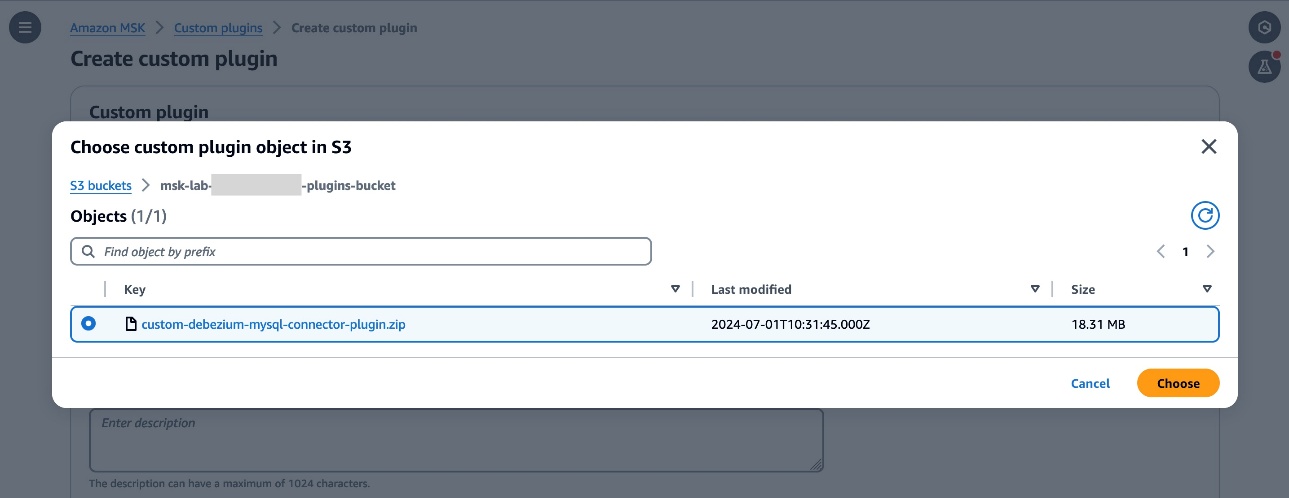
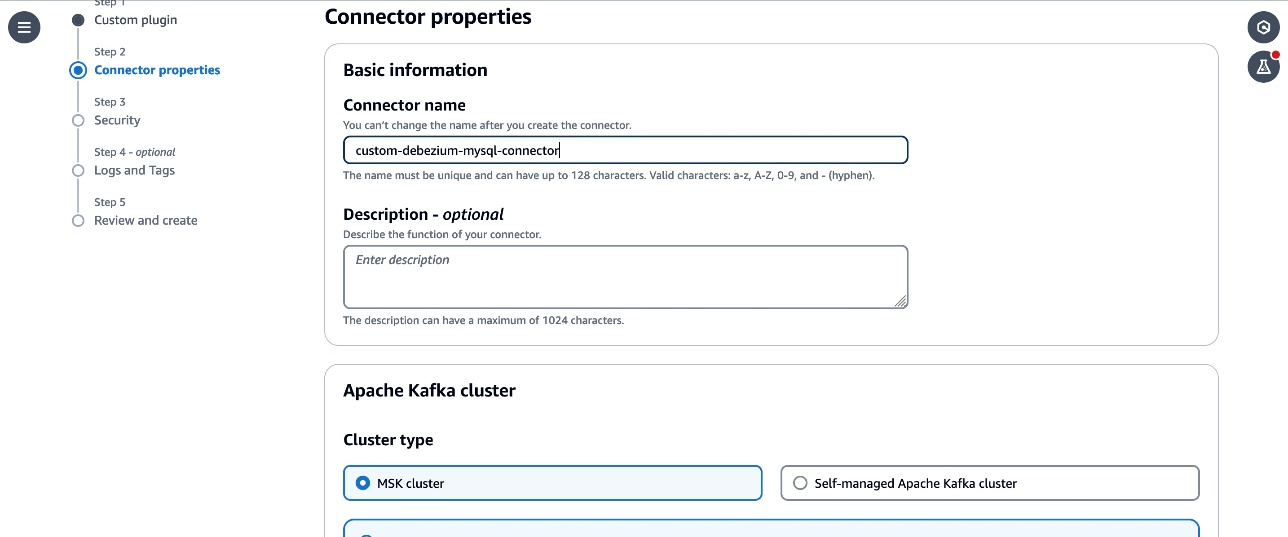
- Switch to the Amazon MSK console and choose Custom plugins in the navigation pane. Choose Create custom plugin and, browse the S3 bucket that you created above and select the custom plugin ZIP file you just uploaded.
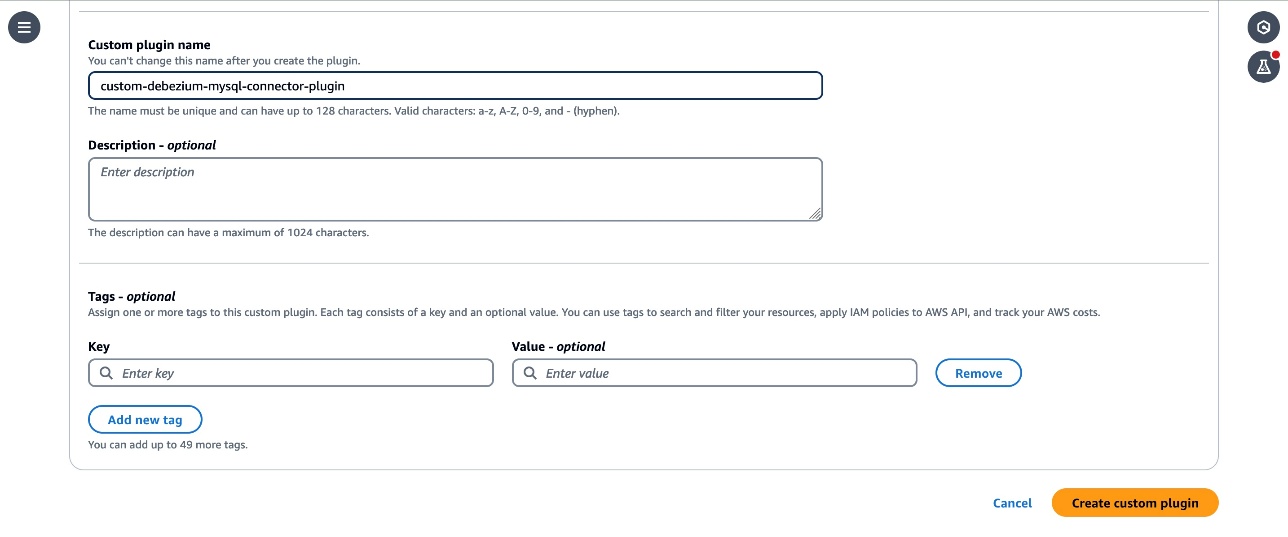
- Enter
custom-debezium-mysql-connector-pluginfor the plugin name. Optionally, enter a description and choose Create Custom Plugin.
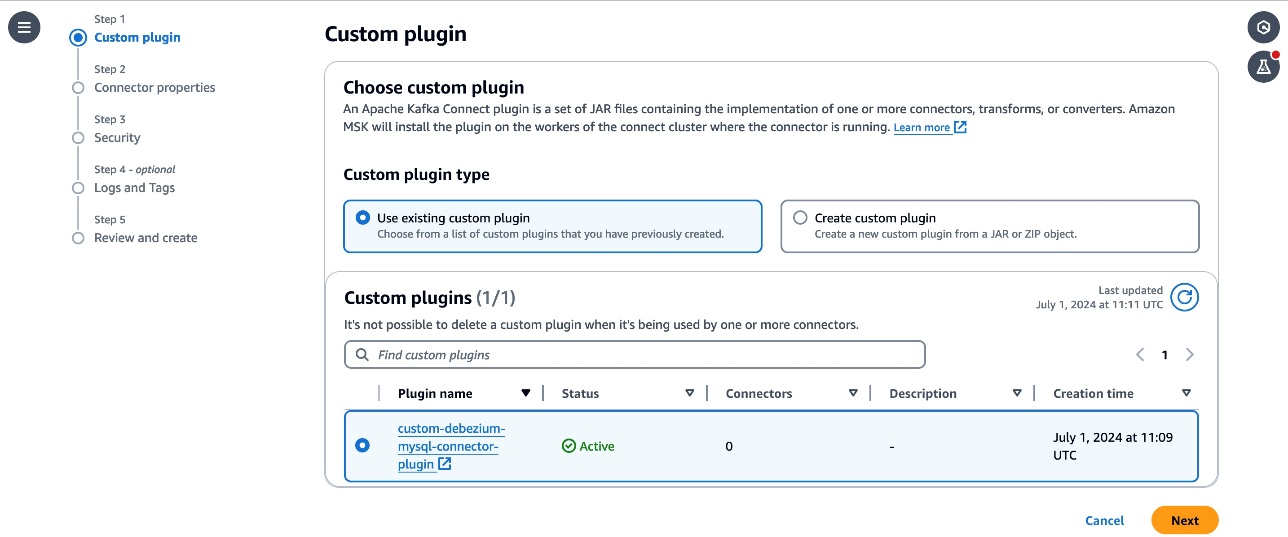
- After a few seconds you should see the plugin is created and the status is
Active. - Customize the worker configuration for the connector by following the instructions in the Customize worker configuration lab.
3. Create an Amazon MSK connector
The next step is to create an MSK connector.
- From the MSK section choose Connectors, then choose Create connector. Choose
custom-debezium-mysql-connector-pluginfrom the list of Custom plugins, then choose Next.
- Enter
custom-debezium-mysql-connectorin the Name textbox, and a description for the connector.
- Select the
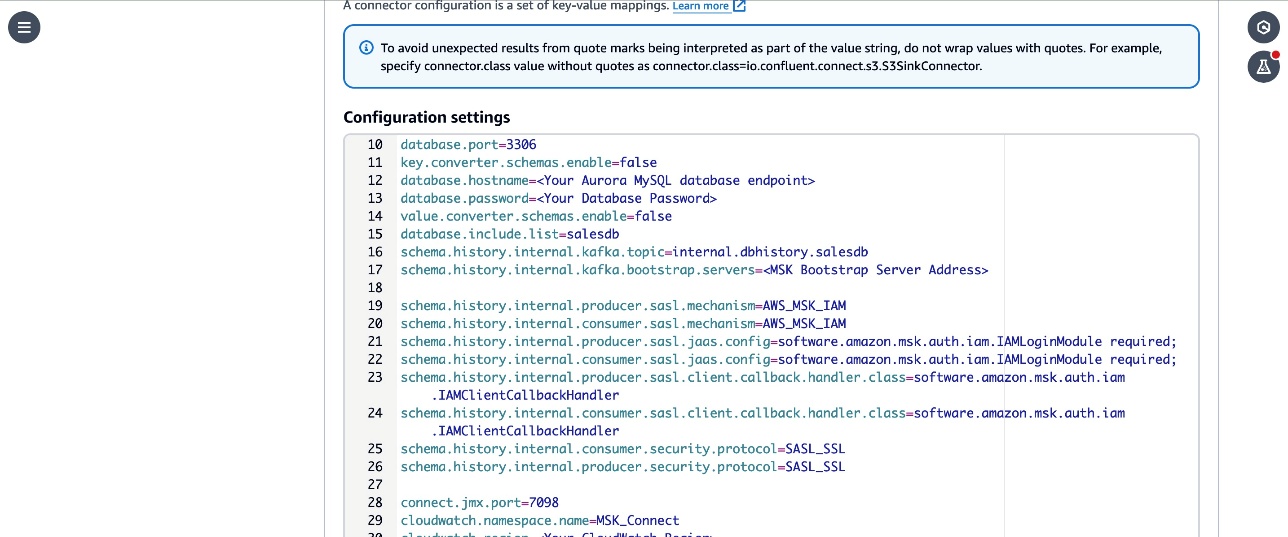
MSKCluster-msk-connect-labfrom the listed MSK clusters. From the Authentication dropdown, select IAM. - Copy the following configuration and paste it in the connector configuration textbox.
- Replace the
<Your Aurora MySQL database endpoint>,<Your Database Password>,<Your MSK Bootstrap Server Address>, and<Your CloudWatch Region>placeholders with the corresponding details for the resources in your account. - Review the
topic.prefix,database.user,topic.prefix,database.server.id,database.server.name,database.port,database.include.listparameters in the configuration. These parameters are configured with the values used in the workshop. Update them with the details corresponding to your configuration if you have customized it in your account. - Note that the
connector.classparameter is updated with the qualified name of the subclass of MySqlConnector class that you created in the custom module. - The
connect.jmx.portparameter specifies the default port to start the JMX server. You can configure this to any available port.
5. Follow the remaining instructions from the Create MSK Connector lab and create the connector. Verify that the connector status changes to Running.
Debezium MySQL custom connector version (2.7.3) provides additional flexibility to configure optional properties that can be added to your MSK connector configuration and selectively include and exclude metrics to emit to CloudWatch. The following are the example configuration properties that can be used with version 2.7.3 :
- cloudwatch.debezium.streaming.metrics.include – A comma-separated list of streaming metrics type that must be exported to CloudWatch as custom metrics.
- cloudwatch.debezium.streaming.metrics.exclude – Specify a comma-separated list of streaming metrics types to exclude from being sent to CloudWatch as custom metrics.
- Similarly include and exclude properties for snapshot metrics type are cloudwatch.debezium.snapshot.metrics.include and cloudwatch.debezium.snapshot.metrics.exclude
- Include and exclude properties for schema history metrics type are cloudwatch.debezium.schema.history.metrics.include and cloudwatch.debezium.schema.history.metrics.exclude
The following is a sample configuration excerpt.
Review the GitHub README file for more details on the use of these properties with MSK connector configurations.
Verify the replication in the Kafka cluster and CloudWatch metrics
Follow the instructions in the Verify the replication in the Kafka cluster lab to set up a client and make changes to the source DB and verify that the changes are captured and sent to Kafka topics by the connector.
To verify that the connector has published the JMX metrics to CloudWatch, go to the CloudWatch console and choose Metrics in the navigation pane, then choose All Metrics. Under Custom namespace, you can see MSK_Connect with database name as the dimension. Select the database name to view the metrics.
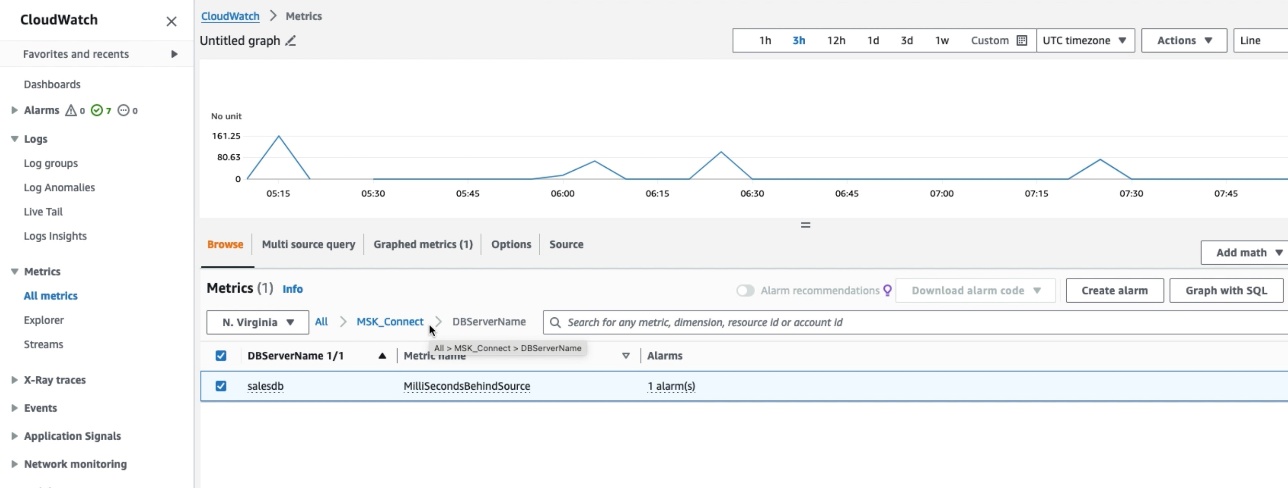
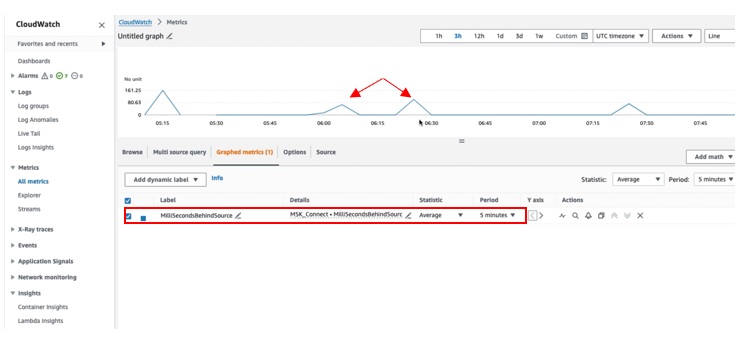
Select the MilliSecondBehindSource metric with statistic as Average in the Graphed Metric to plot the graph. You can verify that the MilliSecondBehindSource metric value is greater than zero whenever any operation is being performed on the source database and returns to zero during the idle time.
Clean up
Delete the resources that you created such as the Aurora DB, Amazon MSK Cluster and connectors by following the instructions at Cleanup in the Amazon MSK Connect lab if you have been following along to set up the solution on your account.
Conclusion
In this post, we showed you how to extend the Debezium MySQL connector plugin with an additional module to export the JMX metrics to CloudWatch as custom metrics. As a next step, you can create a CloudWatch alarm to monitor the metrics and take remediation actions when the alarm is triggered. In addition to exporting the JMX metrics to CloudWatch, you can export these metrics to third-party applications such as Prometheus or DataDog using CloudWatch Metric Streams. You can follow a similar approach to export the JMX metrics of other connectors from MSK Connect. You can learn more about creating your own connectors by visiting the Connector Developer Guide and how to deploy them as custom plugins in the MSK Connect documentation.
About the authors
 Jaydev Nath is a Solutions Architect at AWS, where he works with ISV customers to build secure, scalable, reliable, and cost-efficient cloud solutions. He brings strong expertise in building SaaS architecture on AWS with a focus on Generative AI and data analytics technologies to help deliver practical, valuable business outcomes for customers.
 David John Chakram is a Principal Solutions Architect at AWS. He specializes in building data platforms and architecting seamless data ecosystems. With a profound passion for databases, data analytics, and machine learning, he excels at transforming complex data challenges into innovative solutions and driving businesses forward with data-driven insights.
 Sharmila Shanmugam is a Solutions Architect at Amazon Web Services. She is passionate about solving the customers’ business challenges with technology and automation and reduce the operational overhead. In her current role, she helps customers across industries in their digital transformation journey and build secure, scalable, performant and optimized workloads on AWS.
[$] Finding a successor to the FHS
Post Syndicated from jzb original https://lwn.net/Articles/1032947/
The purpose of the Filesystem
Hierarchy Standard (FHS) is to provide a specification for
filesystem layout; it specifies the location for files and directories
on a Linux system to simplify application development for multiple
distributions. In its heyday it had some success at this, but the
standard has been frozen in time since 2015, and much has changed
since then. There is a slow-moving effort
to revive the FHS and create a FHS 4.0, but a recent discussion
among Fedora developers also raised the possibility of standardizing
on the suggestions in systemd’s file-hierarchy
documentation, which has now been added to the Linux Userspace API
(UAPI) Group’s specifications.
Security updates for Friday
Post Syndicated from daroc original https://lwn.net/Articles/1033901/
Security updates have been issued by AlmaLinux (kernel and webkit2gtk3), Debian (aide and postgresql-13), Fedora (libtiff, mupdf, and pandoc), SUSE (cairo, chromium, gstreamer-plugins-base, ImageMagick, iputils, kubernetes1.23, kubernetes1.26, matrix-synapse, Mesa, pgadmin4, python3, qemu, and rz-pm), and Ubuntu (aide).
The Dole Derby, 1927
Post Syndicated from The History Guy: History Deserves to Be Remembered original https://www.youtube.com/watch?v=vo6Cr0yT-mQ
Trojans Embedded in .svg Files
Post Syndicated from Bruce Schneier original https://www.schneier.com/blog/archives/2025/08/trojans-embedded-in-svg-files.html
Porn sites are hiding code in .svg files:
Unpacking the attack took work because much of the JavaScript in the .svg images was heavily obscured using a custom version of “JSFuck,” a technique that uses only a handful of character types to encode JavaScript into a camouflaged wall of text.
Once decoded, the script causes the browser to download a chain of additional obfuscated JavaScript. The final payload, a known malicious script called Trojan.JS.Likejack, induces the browser to like a specified Facebook post as long as a user has their account open.
“This Trojan, also written in Javascript, silently clicks a ‘Like’ button for a Facebook page without the user’s knowledge or consent, in this case the adult posts we found above,” Malwarebytes researcher Pieter Arntz wrote. “The user will have to be logged in on Facebook for this to work, but we know many people keep Facebook open for easy access.”
This isn’t a new trick. We’ve seen Trojaned .svg files before.
The CEO
Post Syndicated from The Atlantic original https://www.youtube.com/watch?v=1nMO9oPP_zo
Arguably the most far-flung inhabited island on Earth.
Post Syndicated from The History Guy: History Deserves to Be Remembered original https://www.youtube.com/shorts/y0hSdBvkDTM
Archaeology Research
Post Syndicated from xkcd.com original https://xkcd.com/3129/

Effectively building AI agents on AWS Serverless
Post Syndicated from Anton Aleksandrov original https://aws.amazon.com/blogs/compute/effectively-building-ai-agents-on-aws-serverless/
Imagine an AI assistant that doesn’t just respond to prompts – it reasons through goals, acts, and integrates with real-time systems. This is the promise of agentic AI.
According to Gartner, by 2028 over 33% of enterprise applications will embed agentic capabilities – up from less than 1% today. While early generative AI efforts focused on GPUs and model training, agentic systems shift the focus to CPUs, orchestration, and integration with live data – the places where organizations are starting to see real return on investment (ROI).
In this post, you’ll learn how to build and run serverless AI agents on AWS using services such as Amazon Bedrock AgentCore (preview as of this post publication), AWS Lambda, and Amazon Elastic Container Service (Amazon ECS), which provide scalable compute foundations for agentic workloads. You’ll also explore architectural patterns, state management, identity, observability, and tool usage to support production-ready deployments.
Overview
Early AI assistants were stateless and reactive – each prompt processed in isolation, with no memory of prior interactions or awareness of broader context. Gradually, AI assistants became more capable by injecting system prompts, preserving conversation history, and incorporating enterprise knowledge using Retrieval-Augmented Generation (RAG), as illustrated in the following diagram.
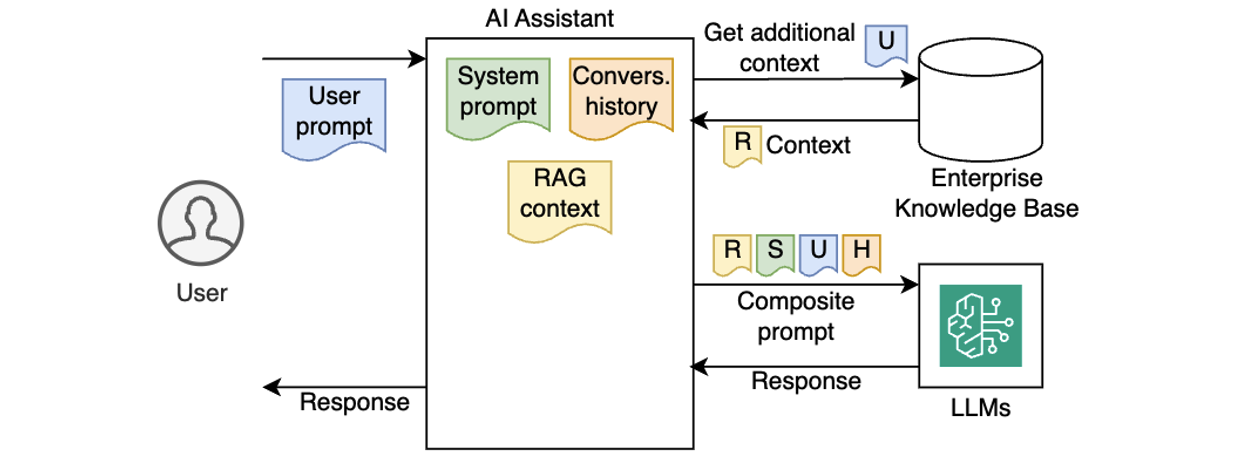
Despite these improvements, traditional AI assistants still lacked true autonomy. They couldn’t reason through multi-step goals, make decisions on their own, or adjust workflows dynamically based on outcomes. As a result, they worked well for simpler Q&A or predefined workflows, but struggled with dynamic, more complex, real-world tasks that require planning, using external tools, and making decisions along the way.
Agentic AI systems shift from passive content generation to autonomous, goal-driven behavior. Powered by Large Language Models (LLMs) and enhanced with memory, planning, and tool use, these systems can break down complex tasks into smaller steps, reason through each step, and take real-time actions, such as calling APIs, executing tools, or interacting with live data. By referencing the LLM within a control cycle that manages context, memory, and decision-making, these systems can choose the right tools, adapt workflows, and integrate deeply into enterprise environments, with use cases ranging from travel booking and financial analysis to DevOps automation and code debugging. This is referred to as an agentic loop. In this system, the agent relies on the LLM’s reasoning output to execute tools, capture tool results, and feed these results to the LLM as updated context (as shown in the following diagram). This happens in a loop until LLM instructs the agent to return the final output to the caller.
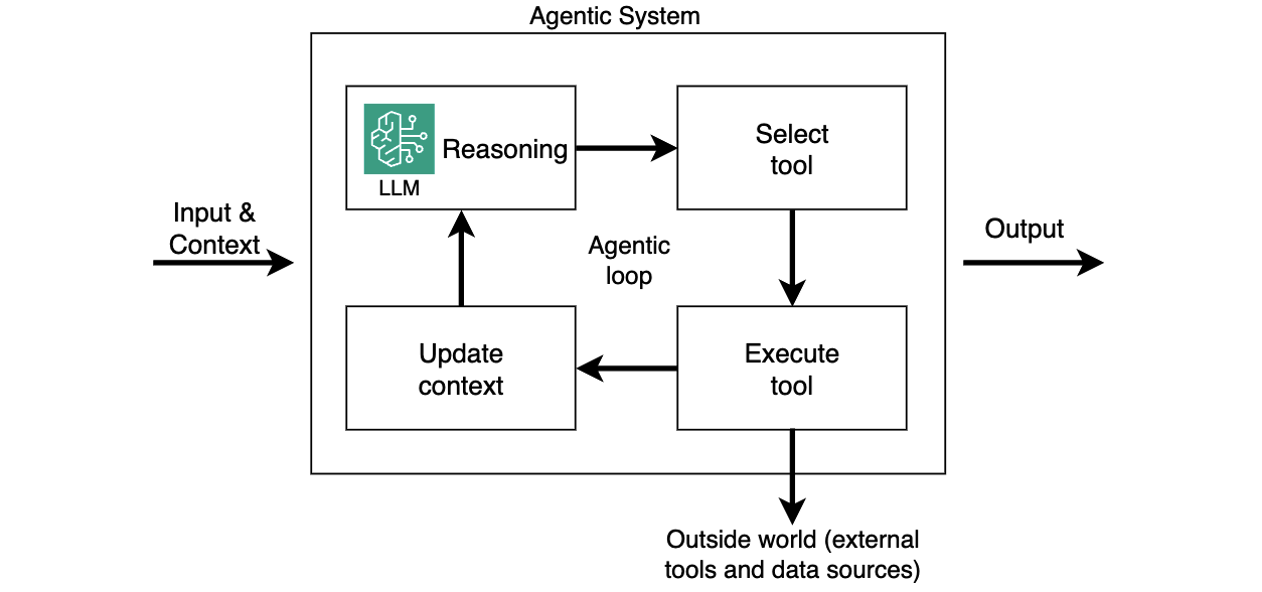
While agentic loop is a lightweight approach to structuring these systems, other control flow paradigms, such as graph, swarm, and workflows, are also available in open-source frameworks like LangGraph.
Introducing Strands Agents SDK
Strands Agents SDK is a code-first framework to build production-ready AI agents with minimal boilerplate. It utilizes the above-mentioned agentic loop system and abstracts common challenges like memory management, tool integration, and multi-step reasoning in a lightweight, modular Python framework. Strands SDK handles state, tool orchestration, and multi-step reasoning so agents can remember past conversations, call external APIs, enforce business rules, and adapt to changing inputs. This allows you to focus on the application’s business logic.
Because agents built with Strands SDK are essentially Python apps, they’re portable and can run across different compute options, such as Bedrock AgentCore Runtime, Lambda functions, ECS tasks, or even locally. This makes Strands Agents SDK a powerful foundation for building scalable and goal-driven AI systems. The following sections assume you’re running your AI agents built with Strands Agents SDK on Lambda functions.
Building your first serverless AI agent
Imagine you’re building an AI-powered corporate travel assistant on AWS, and you have the following technical requirements:
- Define the system prompts, memory, and model you want to use
- Integrate tools for API calls, business logic, and knowledge bases
- Ensure authentication and observability
Strands SDK handles heavy lifting, so you can focus on building smart, responsive agents with minimal overhead. The following code snippet creates a simple agent, according to your configuration.
from strands import Agent

agent = Agent(
    system_prompt=
      """You're a travel assistant that helps
         employees book business trips
         according to policy.""",
    model=my_model,
    tools=[get_policies, get_hotels, get_cars, book_travel]
)

response = agent("Book me a flight to NYC next Monday.")
That’s it. Your agent now has a personality, memory, and ability to use external tools. The Agent class in the Strands SDK abstracts agentic logic, such as maintaining conversation history, handling LLM interactions, orchestrating tools and external knowledge sources, and running the full agentic loop.
Session state management
Session state management is critical for agentic workflows. It allows agents to track goals across interactions – enabling coherent conversations, retaining context, and providing personalized experiences. Without state management, each prompt is handled in isolation, making it impossible for the agent to reference prior context or track ongoing tasks. In cloud environments, where applications need to be stateless and scalable, the solution is to externalize session state to persistent storage, such as Amazon Simple Storage Service (Amazon S3). This allows any agent instance to reconstruct the conversation history on demand, delivering a seamless, stateful user experience while keeping the agentic app itself stateless for scalability and resilience.

AI agents built with Strands store conversation history in the agent.messages property (see documentation). To support stateless compute environments, you can externalize the agent state, persisting it after each interaction and restoring it before the next. This preserves continuity across invocations while keeping your agent instances stateless. In user-aware agentic applications, you want to persist state for each user, typically associated with the user’s unique ID. The following example illustrates how you can do it with the built-in S3SessionManager class when running your agent in a stateless environment such as a Lambda function:
    session_manager = S3SessionManager(
        session_id=f"session_for_user_{user.id}",
        bucket=SESSION_STORE_BUCKET_NAME,
        prefix="agent_sessions"
    )

    agent = Agent(
        session_manager=session_manager
    )
When using Bedrock AgentCore, use the fully managed, serverless AgentCore Memory primitive to manage sessions and long-term memory. It provides relevant context to models while helping agents learn from past interactions. You can make Strands’ session manager work with AgentCore Memory similar to S3SessionManager.
Authentication and authorization
For enterprise AI agents to operate safely, they must know who the user is and what they are allowed to do. This goes beyond basic identity validation – AI agents often act on behalf of users, so they might need to enforce role-based access controls, support audit, and comply with corporate policies.
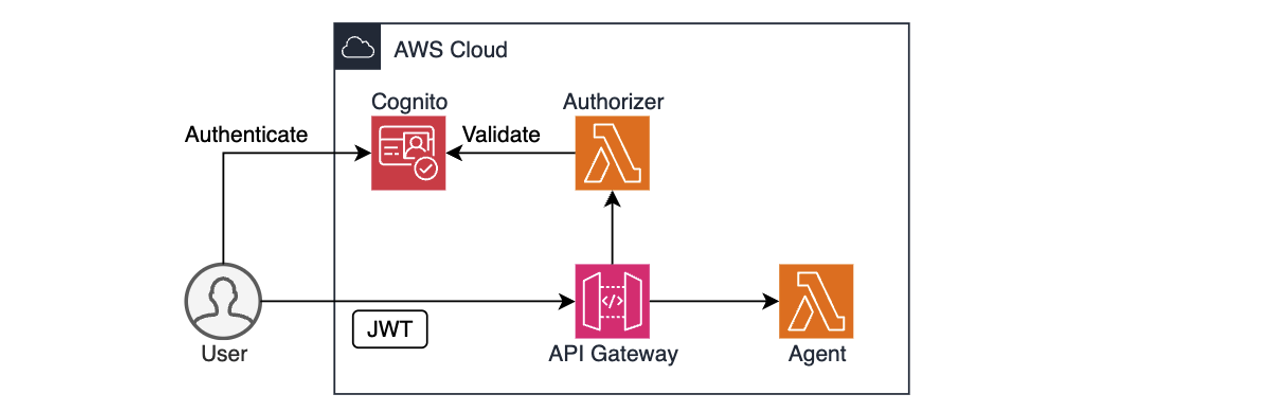
AWS services like Amazon Cognito, Amazon Identity and Access Management (IAM), and Amazon API Gateway provide a solid foundation for authentication and authorization. For example, you can use Cognito to authenticate users through user pools or federated identity providers, combined with API Gateway and Lambda authorizer to validate user access permissions before forwarding requests to the agent, as shown in the preceding diagram. IAM policies define what the agent is allowed to do. After the user is both authenticated and authorized, the agent can extract the identity context, for example, from a JSON Web Token (JWT), to personalize prompts, enforce rules, or dynamically restrict actions.
The following code snippet illustrates retrieving user’s identity from the Authorization header and passing it to an agent:
def handler(event: dict, ctx):
    user_id = extract_user_id(event["headers"]["Authorization"])
    user_prompt: dict = json.loads(event["body"])["prompt"]
    agent_response = agent.prompt(user_id, user_prompt)

    return {
        "statusCode": 200,
        "body": json.dumps({"text": agent_response.text})
    }
The identity context can become a part of the agent’s execution loop. An agent might check the user’s department before booking travel or restrict access to sensitive tools unless the user has the appropriate permissions. By integrating authentication early, you not only enhance security, but also unlock rich personalization and audit capabilities that make agents enterprise-ready from day one.
When using Bedrock AgentCore, the AgentCore Identity primitive allows your AI agents to securely access AWS services and third-party tools either on behalf of users or as themselves with pre-authorized user consent. It provides managed OAuth 2.0 supported providers for both inbound and outbound authentication. During the preview phase, AgentCore Identity supports identity providers like Amazon Cognito, Auth0 by Okta, Microsoft Entra ID, GitHub, Google, Salesforce, and Slack. Refer to the samples for implementation details.
Building portable Strands agents on AWS
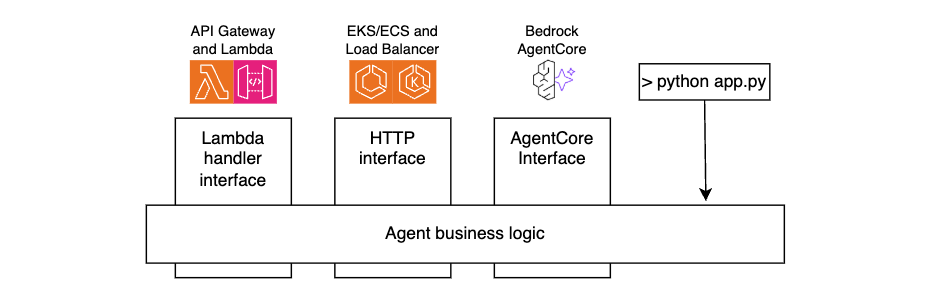
Strands Agents SDK is compute-agnostic. The agents you build are standard Python applications, which can run on any compute type.
For portability and maintainability, separate your agent’s business logic from the interface layer. By doing this, you can reuse the same core agent code across environments, whether invoked through API Gateway and Lambda functions, accessed through Application Load Balancer and Amazon ECS, running on AgentCore Runtime, or even executed locally during development, as shown in the following figure.
The following code snippets illustrate this technique.
Lambda handler code:
def handler(event: dict, ctx):
     user_id = extract_user_id(event)
     user_prompt = json.loads(event["body"])["prompt"]
     agent_response = call_agent(user_id, user_prompt)
     return {
          "statusCode":200,
          "body": json.dumps({
               "text": agent_response.mesage
          })
     }
AgentCore code:
@app.entrypoint
def invoke(payload):
     user_id = extract_user_id(payload)
     user_prompt = payload.get("prompt")
     agent_response = call_agent(user_id, user_prompt)
     return {"result": agent_response.message)
HTTP Handler code:
@app.post("/prompt")
async def prompt(request: Request, prompt_request: PromptRequest):
    user_id=extract_user_id(request)
    user_prompt = prompt_request.prompt
    agent_response = call_agent(user_id, user_prompt)
    return {"text": agent_response.message)
For local testing:
if __name__ == "__main__":
     user_id="local-testing-user"
     user_prompt="book me a trip to NYC"
     agent_response = call_agent(user_id, user_prompt)
     return agent_response.message
Agent code:
def call_agent(user_id, user_prompt):
     agent = Agent(
          system_prompt="You’re a travel agent…",
          model=my_model,
          session_manager = my_session_manager,
      )
     agent_response = agent(user_prompt)
     return agent_response
Extending agent functionality with tools
A key strength of agentic systems is their ability to invoke tools that perform actions or retrieve real-time data, enabling agents to interact with the outside world, not just generate text. The Strands Agents SDK includes built-in tools and allows you to define your own custom tools, as either in-process Python functions or external tools accessible over HTTP using the Model Context Protocol (MCP). These tools can fetch data, call APIs, or trigger workflows, and can be registered for the agent to reason over and use during execution.
The following snippet illustrates creating an in-process tool. See the documentation for more examples.
from strands import tool

@tool
def get_weather(city: str) -> str:
    weather = call_weather_api(city)
    return f"The current weather in {city} is {weather}"
Integrating with remote MCP servers
Model Context Protocol (MCP) is an open standard that decouples agents from tools using a client-server model. Instead of embedding tool logic directly into the agent, your agent becomes an MCP client that connects to one or more MCP servers – each exposing tools, resources, and reusable prompts.
Running remote MCP servers is especially valuable when tools span multiple business domains or are provided by third-party vendors, just like how microservices separate responsibilities across teams and systems. This separation allows each domain team to manage their own tools independently while exposing a consistent, standardized interface to agents. It also enables reuse, versioning, and centralized governance without tightly coupling logic into the agent itself. By decoupling tools from agents, MCP unlocks composability, scalability, and long-term ecosystem growth.
The following snippet illustrates configuring an MCP client to connect to a remote MCP Server, retrieving the list of tools, and integrating those tools with an agent.
mcp_client = MCPClient(lambda: streamablehttp_client(
    url=mcp_endpoint,
    headers={"Authorization": f"Bearer {token}"},
))

with mcp_client:
  tools = mcp_client.list_tools_sync()
  agent = Agent(tools=tools)
When using Bedrock AgentCore, you can operate MCP at scale through AgentCore Gateway. It provides an easy and secure way for developers to build, deploy, discover, and connect to remote tools like above at scale. With AgentCore Gateway, developers can convert APIs, Lambda functions, and existing services into Model Context Protocol (MCP)-compatible tools and make them available to agents through Gateway endpoints with just a few lines of code.
Monitoring and observability
Observability is essential when running AI agents. Beyond traditional metrics such as uptime and latency, agentic systems introduce new telemetry dimensions, such as LLM latency, token consumption, and tracing reasoning cycles. These new metrics are essential for understanding both the performance and cost of your agentic systems.
When deploying agents using AWS services such as Bedrock AgentCore, Lambda, or ECS, you inherit the built-in observability capabilities, such as seamless integration with Amazon CloudWatch for metrics, logs, and distributed tracing. This simplifies tracking invocation counts, errors, request duration, and concurrency, as shown in the following figure – essential for operating reliable and scalable agentic applications.
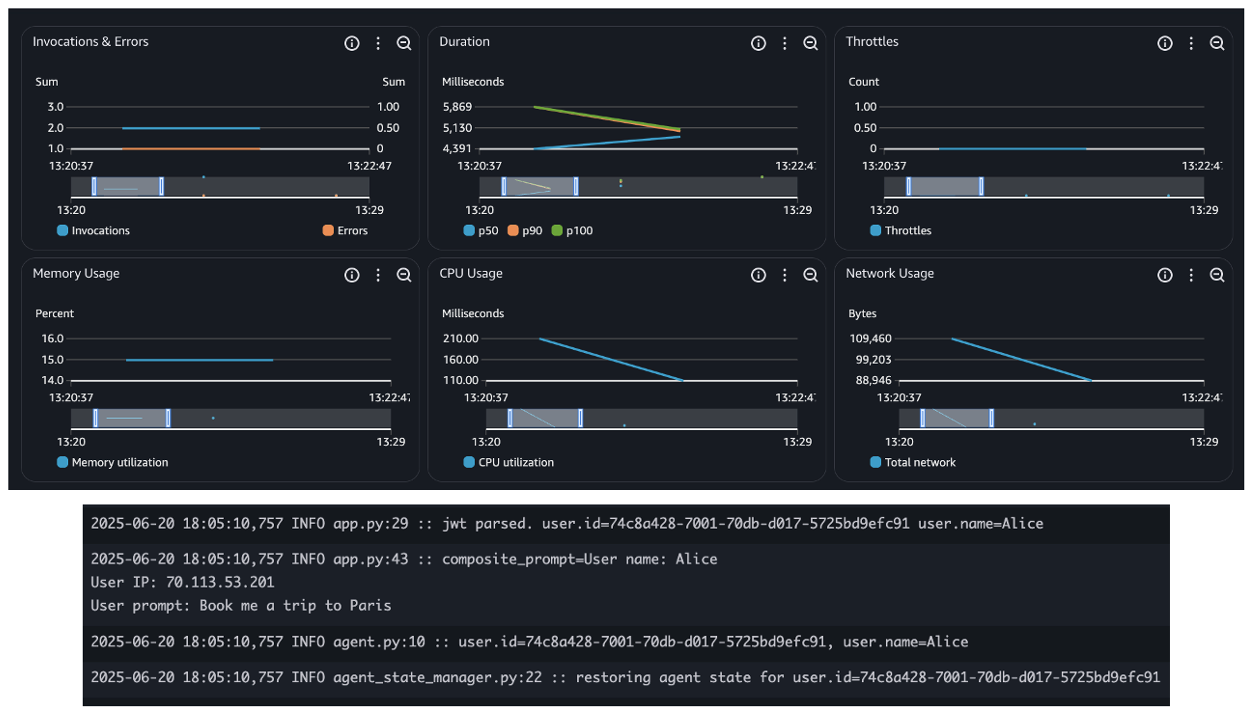
In addition, the Strands Agents SDK provides built-in agent observability features. It uses OpenTelemetry (OTEL) to automatically trace each agent interaction, including spans for LLM calls, tool usage, and context updates. It also exports detailed metrics such as token counts, tool execution times, and decision cycle durations. These metrics can be sent to any OTEL-compatible backend, giving you deep, real-time visibility into how your agents reason, act, and adapt. The following snippet shows built-in token usage metrics:
{
  "accumulated_usage": {
    "inputTokens": 1539,
    "outputTokens": 122,
    "totalTokens": 1661
  },
  "average_cycle_time": 0.881234884262085,
  "total_cycles": 2,
  "total_duration": 1.881234884262085,
  ... redacted ...
}
Learn more about observability and evaluation of Strands agents from this sample code.
When using Bedrock AgentCore, the AgentCore Observability primitive helps you to log and capture metrics and traceability from other AgentCore primitives like runtime, memory, and gateway, as described in this tutorial.
Security considerations
You should build secure communication and access controls layers deploying AI agents that integrate with remote MCP servers. All client-server interactions should be encrypted using TLS, ideally with mutual TLS for bidirectional authentication. Access to tools should be validated through authorization checks with fine-grained permissions to enforce least privilege access. Deploying MCP servers behind an API Gateway provides additional security layers like DDoS protection, WAF, and centralized authentication. Use API Gateway logging capabilities to capture caller identity and execution outcomes. Using trusted, versioned MCP repositories helps protect against supply chain attacks and ensures consistent tool governance across teams. Protocols such as MCP are evolving rapidly, you should always use the most recent versions to minimize potential security vulnerabilities risk.
In addition, you should leverage security best practices described in the AWS Well-Architected Framework Security Pillar, such as enforcing strict IAM role scoping, integrating with identity providers for user context, encrypting all data in transit and at rest, and using VPC endpoints and PrivateLink to limit network exposure. To protect against prompt injection attacks, sanitize inputs, and ensure you maintain comprehensive audit logs for compliance and governance.
Sample project
Follow instructions in this GitHub repo to deploy a sample project implementing the practices described in this post using the AWS Serverless compute. The repo includes a travel agent implemented with Strands Agents SDK and a remote MCP server, both running as Lambda functions.
Conclusion
Agentic AI moves beyond simple prompt-response interactions to enable dynamic, goal-driven workflows. In this post, you learned how to build scalable, production-ready agents on AWS using the Strands Agents SDK and serverless services such as Lambda and Amazon ECS.
By externalizing state, integrating authentication, and adding observability, agents can operate securely and at scale. With support for in-process and remote tools through the MCP, you can cleanly separate responsibilities and build composable, enterprise-ready systems. You can combine these patterns to deliver intelligent, adaptable AI agents that fit naturally into modern cloud and event-driven architectures.
Useful resources
- Strands Agents SDK Docs
- Amazon Bedrock AgentCore User guide
- MCP Protocol Specification
- Sample Serverless MCP Servers
To learn more about Serverless architectures see Serverless Land.
MadeYouReset: An HTTP/2 vulnerability thwarted by Rapid Reset mitigations
Post Syndicated from Alex Forster original https://blog.cloudflare.com/madeyoureset-an-http-2-vulnerability-thwarted-by-rapid-reset-mitigations/
On August 13, security researchers at Tel Aviv University disclosed a new HTTP/2 denial-of-service (DoS) vulnerability that they are calling MadeYouReset (CVE-2025-8671). This vulnerability exists in a limited number of unpatched HTTP/2 server implementations that do not sufficiently enforce restrictions on the number of times a client may send malformed frames. If you’re using Cloudflare for HTTP DDoS mitigation, you’re already protected from MadeYouReset.
Cloudflare was informed of this vulnerability in May through a coordinated disclosure process, and we were able to confirm that our systems were not susceptible, due in large part to the mitigations we put in place during Rapid Reset (CVE-2023-44487). MadeYouReset and Rapid Reset are two conceptually similar HTTP/2 protocol attacks that exploit a fundamental feature within the HTTP/2 specification: stream resets. In the HTTP/2 protocol, a “stream” represents an independent series of HTTP request/response pairs exchanged between the client and server within an HTTP/2 connection. The stream reset feature is intended to allow a client to initiate an HTTP request and subsequently cancel it before the server has delivered its response.
The vulnerability exploited by both MadeYouReset and Rapid Reset lies in the potential for malicious actors to abuse this stream reset mechanism. By repeatedly causing stream resets, attackers can overwhelm a server’s resources. While the server is attempting to process and respond to a multitude of requests, the rapid succession of resets forces it to expend computational effort on starting and then immediately discarding these operations. This can lead to resource exhaustion and impact the availability of the targeted server for legitimate users. The difference between MadeYouReset and Rapid Reset is that, instead of clients issuing stream resets directly, they instead trick servers into resetting streams by sending specially crafted malformed frames.
Fortunately, the MadeYouReset vulnerability only impacts a relatively small number of HTTP/2 implementations. In most major HTTP/2 implementations already in widespread use today, the proactive measures taken to counter Rapid Reset in 2023 have also provided substantial protection against MadeYouReset, limiting its potential impact and preventing a similarly disruptive event.
A note about Cloudflare’s Pingora and its users:
Our open-sourced Pingora framework uses the popular Rust-language h2 library for its HTTP/2 support. Versions of h2 prior to 0.4.11 were potentially susceptible to MadeYouReset. Users of Pingora can patch their applications by updating their h2 crate version using the cargo update command. Pingora does not itself terminate inbound HTTP connections to Cloudflare’s network, meaning this vulnerability could not be exploited against Cloudflare’s infrastructure.
We would like to credit researchers Gal Bar Nahum, Anat Bremler-Barr, and Yaniv Harel of Tel Aviv University for discovering this vulnerability and thank them for their leadership in the coordinated disclosure process. Cloudflare always encourages security researchers to submit vulnerabilities like this to our HackerOne Bug Bounty program.
Spring 2025 PCI 3DS compliance package available now
Post Syndicated from Will Black original https://aws.amazon.com/blogs/security/spring-2025-pci-3ds-compliance-package-available-now/
Amazon Web Services (AWS) is pleased to announce the successful completion of our annual audit to renew our Payment Card Industry Three Domain Secure (PCI 3DS) certification. As part of this renewal, we have expanded the scope to include three additional AWS services and three additional AWS Regions:
Newly added AWS services:
Newly added AWS Regions:
- Asia Pacific (Thailand)
- Asia Pacific (Malaysia)
- Mexico (Central)
This certification allows customers to use these services while maintaining PCI 3DS compliance, enabling innovation without compromising security. The full list of services can be found on the AWS Services in Scope by Compliance Program page.
The PCI 3DS compliance package includes two key components:
- Attestation of Compliance (AOC) – demonstrates that AWS was successfully validated against the PCI 3DS standard.
- AWS Responsibility Summary – provides guidance to help AWS customers understand their responsibility in developing and operating a highly secure environment on AWS for handling payment card data.
AWS was evaluated by Coalfire, a third-party Qualified Security Assessor (QSA).
This refreshed certification offers customers greater flexibility in deploying regulated workloads while reducing compliance overhead. Customers can access the PCI 3DS reports through AWS Artifact. This self-service portal provides on-demand access to AWS compliance reports, streamlining audit processes.
To learn more about our PCI programs and other compliance and security programs, see the AWS Compliance Programs page. As always, we value your feedback and questions; reach out to the AWS Compliance team through the Compliance Support page.
If you have feedback about this post, submit comments in the Comments section below. If you have questions about this post, contact AWS Support.
Exploring the NVIDIA HGX B200 Lambda AI Cluster at Cologix with Supermicro
Post Syndicated from Patrick Kennedy original https://www.servethehome.com/exploring-the-nvidia-hgx-b200-lambda-ai-cluster-at-cologix-with-supermicro/
We take you on a tour of the Lambda AI cluster at Cologix with the latest-generation Supermicro NVIDIA HGX B200 servers
The post Exploring the NVIDIA HGX B200 Lambda AI Cluster at Cologix with Supermicro appeared first on ServeTheHome.
Behind the Byline: Tom Nichols
Post Syndicated from The Atlantic original https://www.youtube.com/watch?v=Iq0-h07NgZQ
Pantry Inventory: Never Miss Expiring Beans Again! (Easy Guide)
Post Syndicated from BeardedTinker original https://www.youtube.com/shorts/MIAVj-dsj_E
Cluster manager communication simplified with Remote Publication
Post Syndicated from Himshikha Gupta original https://aws.amazon.com/blogs/big-data/cluster-manager-communication-simplified-with-remote-publication/
Amazon OpenSearch Service has taken a significant leap forward in scalability and performance with the introduction of support for 1,000-node OpenSearch Service domains capable of handling 500,000 shards with OpenSearch Service version 2.17. This breakthrough is made possible by multiple features, including Remote Publication, which introduces an innovative cluster state publication mechanism that enhances scalability, availability, and durability. It uses the remote cluster state feature as the base. This feature provides durability and makes sure metadata is not lost even when the majority of the cluster manager nodes fail permanently. By using a remote store for cluster state publication, OpenSearch Service can now support clusters with a higher number of nodes and shards.
The cluster state is an internal data structure that contains cluster information. The elected cluster manager node manages this state. It’s distributed to follower nodes through the transport layer and stored locally on each node. A follower node can be a data node, a coordinator node or a non-elected cluster manager node. However, as the cluster grows, publishing the cluster state over the transport layer becomes challenging. The increasing size of the cluster state consumes more network bandwidth and blocks transport threads during publication. This can impact scalability and availability. This post explains cluster state publication, Remote Publication, and their benefits in improving durability, scalability, and availability.
How did cluster state publication work before Remote Publication?
The elected cluster manager node is responsible for maintaining and distributing the latest OpenSearch cluster state to all the follower nodes. The cluster state updates when you create indexes and update mappings, or when internal actions like shard relocations occur. Distribution of the updates follows a two-phase process: publish and commit. In the publish phase, the cluster manager sends the updated state to the follower nodes and saves a copy locally. After a majority (more than half) of the eligible cluster manager nodes acknowledge this update, the commit phase begins, where the follower nodes are instructed to apply the new state.
To optimize performance, the elected cluster manager sends only the changes since the last update, referred to as the diff state, reducing data transfer. However, if a folllower node is out of sync or new to the cluster, it might reject the diff state. In such cases, the cluster manager sends the full cluster state to those follower nodes.
The following diagram depicts the cluster state publication flow.
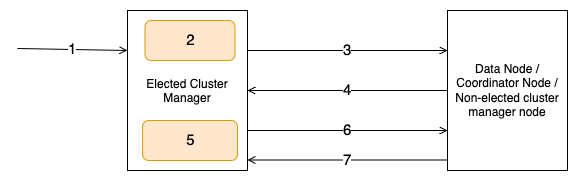
The workflow consists of the following steps:
- The user invokes an admin API such as create index.
- The elected cluster manager node computes the cluster state for the admin API request.
- The elected cluster manager node sends the cluster state publish request to follower nodes.
- The follower nodes respond with an acknowledgement to the publish request.
- The elected cluster manager node persists the cluster state to the disk.
- The elected cluster manager node sends the commit request to follower nodes.
- The follower nodes respond with an acknowledgement to the commit request.
We’ve observed stable cluster operations with this publication flow up to 200 nodes or 75,000 shards. However, as the cluster state grows in size with more indexes, shards, and nodes, it starts consuming high network bandwidth and blocking transport threads for a longer duration during publication. Additionally, it becomes CPU and memory intensive for the elected cluster manager to transmit to the follower nodes, often impacting publication latency. The increased latency can lead to a high pending task count on the elected cluster manager. This can cause request timeouts, or in severe cases, cluster manager failure, creating a cluster outage.
Using a remote store for cluster state publication improved availability and scalability
With Remote Publication, cluster state updates are transmitted through an Amazon Simple Storage Service (Amazon S3) bucket as the remote store, rather than transmitting the state over the transport layer. When the elected cluster manager updates the cluster state, it uploads the new state to Amazon S3 in addition to persisting on disk. The cluster manager uploads a manifest file, which keeps track of the entities and which entities changed from their previous state. Similarly, follower nodes download the manifest from Amazon S3 and can decide if it needs the full state or only changed entities. This has two benefits: reduced cluster manager resource usage and faster transport thread availability.
Creating new domains or upgrading from existing OpenSearch Service versions to 2.17 or above, or applying the service patch to an existing 2.17 or above domain, enables Remote Publication by default, This provides seamless migration with the remote state. This is enabled by default for SLA clusters, with or without remote-backed storage. Let’s dive into some details of this design and understand how it works internally.
How is the remote store modeled for scalability?
Having scalable and efficient Amazon S3 storage is essential for Remote Publication to work seamlessly. The cluster state has multiple entities, which get updated at different frequencies. For example, cluster node data only changes if a new node joins the cluster or an old node leaves the cluster, which usually happens during blue/green deployments or node replacements. However, shard allocation can change multiple times a day based on index creations, rollovers, or internal service triggered relocations. The storage schema needs to be able to handle these entities in a way that a change in one entity doesn’t impact another entity. A manifest file keeps track of the entities. Each cluster state entity has its own separate file, like one for templates, one for cluster settings, one for cluster nodes, and so on. For entities that scale with the number of indexes, like index metadata and index shard allocation, per-index files are created to make sure changes in an index can be uploaded and downloaded independently. The manifest file keeps track of paths to these individual entity files. The following code shows a sample manifest file. It contains the details of the granular cluster state entities’ files uploaded to Amazon S3 along with some basic metadata.
In addition to keeping track of cluster state components, the manifest file also keeps track of what entities changed compared to the last state, which is the diff manifest. In the preceding code, diff manifest has a section for metadata diff and routing table diff. This signifies that between these two versions of the cluster state, these entities have changed.
We also keep a separate shard diff file specifically for shard allocation. Because multiple shards for different indexes can be relocated in a single cluster state update, having this shard diff file further reduces the number of files to download.
This configuration provides the following benefits:
- Separate files help prevent bloating a single document
- Per-index files reduces the number of updates and effectively reduces the network bandwidth usage, because most updates affect only a few indexes
- Having a diff tracker makes downloads on nodes efficient because only limited data needs to be downloaded
To support the scale and high request rate to Amazon S3, we use Amazon S3 pre-partitioning, so we can scale proportionally with the number of clusters and indexes. For managing storage size, an asynchronous scheduler is added, which cleans up stale files and keeps only the last 10 recently updated documents. After a cluster is deleted, a domain sweeper job removes the files for that cluster after a few days.
Remote Publication overview
Now that you understand how cluster state is persisted in Amazon S3, let’s see how it is used during the publication workflow. When a cluster state update occurs, the elected cluster manager uploads changed entities to Amazon S3 in parallel, with the number of concurrent uploads determined by a fixed thread pool. It then updates and uploads a manifest file with diff details and file paths.
During the publish phase, the elected cluster manager sends the manifest path, term, and version to follower nodes using a new remote transport action. When the elected cluster manager changes, the newly elected cluster manager increments the term which signifies the number of times a new cluster manager election has occurred. The elected cluster manager increments the cluster state version when the cluster state is updated. You can use these two components to identify cluster state progression and make sure nodes operate with the same understanding of the cluster’s configuration. The follower nodes download the manifest, determine if they need a full state or just the diff, and then download the required files from Amazon S3 in parallel. After the new cluster state is computed, follower nodes acknowledge the elected cluster manager.
In the commit phase, the elected cluster manager updates the manifest, marking it as committed, and instructs follower nodes to commit the new cluster state. This process provides efficient distribution of cluster state updates, especially in large clusters, by minimizing direct data transfer between nodes and using Amazon S3 for storage and retrieval. The following diagram depicts the Remote Publication flow when an index creation triggers a cluster state update.
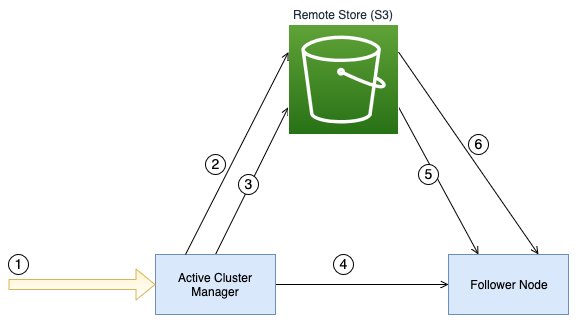
The workflow consists of the following steps:
- The user invokes an admin API such as create index.
- The elected cluster manager node uploads the index metadata and routing table files in parallel to the configured remote store.
- The elected cluster manager node uploads the manifest file containing the details of the metadata files to the remote store.
- The elected cluster manager sends the remote manifest file path to the follower nodes.
- The follower node downloads the manifest file from the remote store.
- The follower nodes download the index metadata and routing table files from the remote store in parallel.
Failure detection in publication
Remote Publication brings in a significant change to how publication works and how the cluster state is managed. Issues in file creation, publication, or downloading and creating cluster state on follower nodes can have a potential impact on the cluster. To make sure the new flow works as expected, a checksum validation is added to the publication flow. On the elected cluster manager, after creating a new cluster state, a checksum is created for individual entities and the overall cluster state and added to the manifest. On follower nodes, after the cluster state is created after download, a checksum is created again and matched against the checksum from the manifest. A mismatch in checksums means the cluster state on the follower node is different from that on the elected cluster manager. In the default mode, the service only logs which entity is failing the checksum match and lets the cluster state persist. For further debugging, checksum match supports different modes, where it can download the complete state and find the diff between two states in trace mode, or fail the publication request in failure mode.
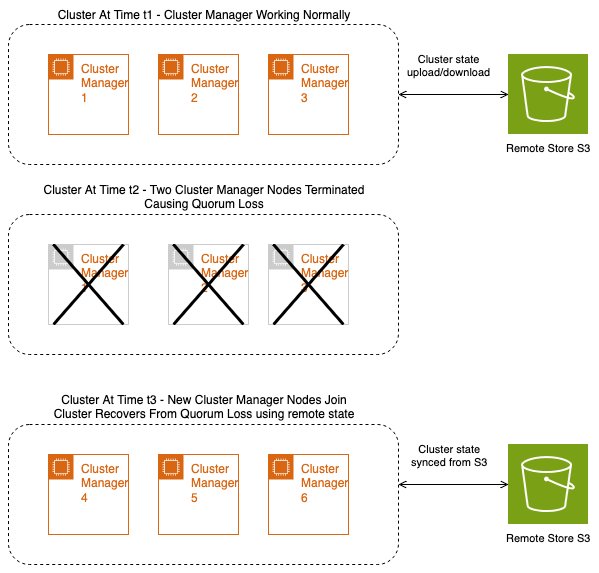
Recovery from failures
With remote state, quorum loss is recovered by using the cluster state from the remote store. Without remote state, the cluster manager might lose metadata, leading to data loss for your cluster. However, the cluster manager can now use the last persisted state to help prevent metadata loss in the cluster. The following diagram illustrates the states of a cluster before a quorum loss, during a quorum loss, and after the quorum loss recovery happens using a remote store.
Benefits
In this section, we discuss some of the solution benefits.
Scalability and availability
Remote Publication significantly reduces the CPU, memory, and network overhead for the elected cluster manager when transmitting the state to the follower nodes. Additionally, transport threads responsible for sending publish requests to follower nodes are made available more quickly, because the remote publish request size is smaller. The publication request size remains consistent irrespective of the cluster state size, giving consistent publication performance. This enhancement enables OpenSearch Service to support larger clusters of up to 1,000 nodes and a higher number of shards per node, without overwhelming the elected cluster manager. With reduced load on the cluster manager, its availability improves, so it can more efficiently serve admin API requests.
Durability
With the cluster state being persisted to Amazon S3, we get Amazon S3 durability. Clusters suffering quorum loss due to replacement of cluster manager nodes can hydrate with the remote cluster state and recover from quorum loss. Because Amazon S3 has the last committed cluster state, there is no data loss on recovery.
Cluster state publication performance
We tested the elected cluster manager performance in a 1,000-node domain containing 500,000 shards. We compared two versions: the new Remote Publication system vs. the older cluster state publication system. Both clusters were operated with the same workload for a few hours. The following are some key observations:
- Cluster state publication time reduced from an average of 13 seconds to 4 seconds, which is a three-fold improvement
- Network out reduced from an average of 4 GB to 3 GB
- Elected cluster manager resource utilization showed significant improvement, with JVM dropping from an average of 40% to 20% and CPU dropping from 50% to 40%
We tested on a 100-node cluster as well and saw performance improvements with the increase in the size of the cluster state. With 50,000 shards, the uncompressed cluster state size increased to 600 MB. The following observations were made during cluster state update when compared to a cluster without Remote Publication:
- Max network out traffic reduced from 11.3 GB to 5.7 GB (approximately 50%)
- Average elected cluster manager JVM usage reduced from 54% to 35%
- Average elected cluster manager CPU reduced from 33% to 20%
Contributing to open source
OpenSearch is an open source, community-driven software. You can find code for the Remote Publication feature in the project’s GitHub repository. Some of the notable GitHub pull requests have been added inline to the preceding text. You can find the RFCs for remote state and remote state publication in the project’s GitHub repository. A more comprehensive list of pull requests is attached in the meta issues for remote state, remote publication, and remote routing table.
Looking ahead
The new Remote Publication architecture enables teams to build additional features and optimizations using the remote store:
- Faster recovery after failures – With the new architecture, we have the last successful cluster state in Amazon S3, which can be downloaded on the new cluster manager. At the time of writing, only cluster metadata gets restored on recovery and then the elected cluster manager tries to build shard allocation by contacting the data nodes. This takes up a lot of CPU and memory for both the cluster manager and data nodes, in addition to the time taken to collate the data to build the allocation table. With the last successful shard allocation available in Amazon S3, the elected cluster manager can download the data, build the allocation table locally, and then update the cluster state to the follower nodes, making recovery faster and less resource-intensive.
- Lazy loading – The cluster state entities can be loaded as needed instead of all at once. This approach reduces the average memory usage on a follower node and is expected to speed up cluster state publication.
- Node-specific metadata – At present, every follower node downloads and loads the entire cluster state. However, we can optimize this by modifying the logic so that a data node only downloads the index metadata and routing table for the indexes it contains.
- Optimize cluster state downloads – There is an opportunity to optimize the downloading of cluster state entities. We are exploring compression and serialization techniques to minimize the amount of data transmitted.
- Restoring to an older state – The service keeps the cluster state for the last 10 updates. This can be used to restore the cluster to a previous state in case the state gets corrupted.
Conclusion
Remote Publication makes cluster state publication faster and more robust, significantly improving cluster scalability, reliability, and recovery capabilities, potentially reducing customer incidents and operational overhead. This change in architecture enables further improvements in elected cluster manager performance and making domains more durable, especially for larger domains where cluster manager operations become heavy as the number of indexes and nodes increase. We encourage you to upgrade to the latest version to take advantage of these improvements and share your experience with our community.
About the authors
 Himshikha Gupta is a Senior Engineer with Amazon OpenSearch Service. She is excited about scaling challenges with distributed systems. She is an active contributor to OpenSearch, focused on shard management and cluster scalability
 Sooraj Sinha is a software engineer at Amazon, specializing in Amazon OpenSearch Service since 2021. He has worked on multiple core components of OpenSearch, including indexing, cluster management, and cross-cluster replication. His contributions have focused on improving the availability, performance, and durability of OpenSearch.
Enhance Amazon EMR observability with automated incident mitigation using Amazon Bedrock and Amazon Managed Grafana
Post Syndicated from Yu-Ting Su original https://aws.amazon.com/blogs/big-data/enhance-amazon-emr-observability-with-automated-incident-mitigation-using-amazon-bedrock-and-amazon-managed-grafana/
Maintaining high availability and quick incident response for Amazon EMR clusters is important in data analytics environments. In this post, we show you how to build an automated observability system that combines Amazon Managed Grafana with Amazon Bedrock to detect and remediate EMR cluster issues. We demonstrate how to integrate real-time monitoring with AI-powered remediation suggestions, combining Amazon Managed Grafana for visualization, Amazon Bedrock for intelligent response recommendations, and AWS Systems Manager for automated remediation actions on Amazon Web Services (AWS).
Solution overview
This solution helps you improve EMR cluster observability through a comprehensive four-layer architecture—comprising monitoring, notification, remediation, and knowledge management—to provide the following features:
- Real-time monitoring of EMR clusters using Amazon Managed Service for Prometheus and Amazon Managed Grafana
- Automated first-aid remediation through Systems Manager
- AI-powered incident response suggestions using Amazon Bedrock
- Integration with the AWS Premium Support knowledge base
- Historical incident data archival and analysis
The implementation of this architecture delivers the following key benefit:
- Reduced Mean time to resolution (MTTR)
- Proactive incident prevention
- Automated first-response actions
- Knowledge base enrichment through machine learning
The following diagram illustrates the solution architecture.
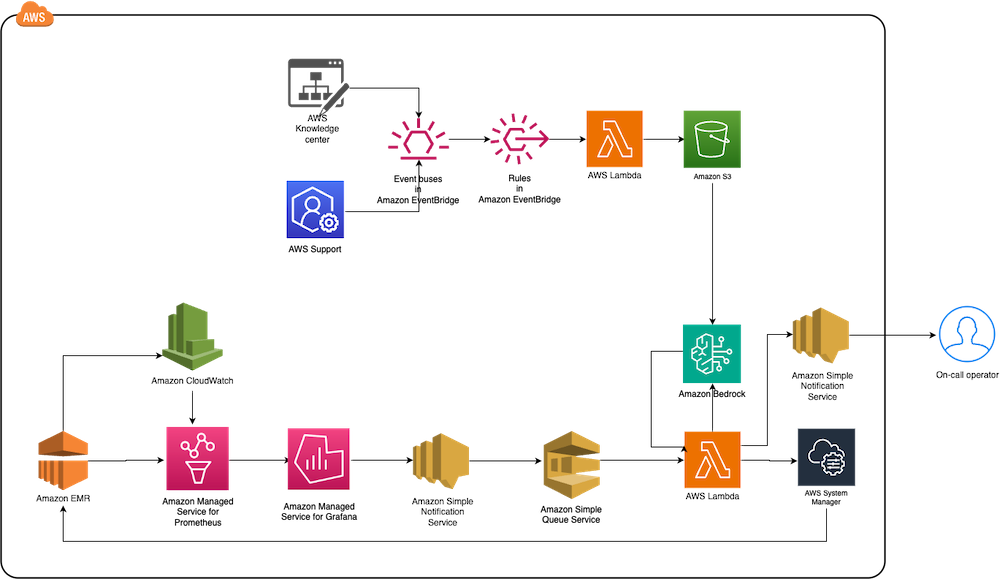
The architecture comprises the following core components:
- Monitoring layer – The monitoring layer uses Amazon Managed Service for Prometheus and Amazon CloudWatch to capture real-time metrics from EMR clusters. Amazon Managed Grafana serves as the visualization layer, offering comprehensive dashboards for Apache YARN, HDFS, Apache HBase, and Apache Hudi performance monitoring. Advanced alerting mechanisms trigger notifications based on predefined query results.
- Notification layer – To provide timely and reliable alert delivery, the notification layer uses Amazon Simple Notification Service (Amazon SNS) for distribution and Amazon Simple Queue Service (Amazon SQS) for message queuing. This architecture prevents message delays and provides a robust trigger mechanism for AWS Lambda functions.
- Remediation layer – The remediation layer enables automatic issue resolution through:
- Lambda functions for orchestration
- Systems Manager for script execution
- Amazon Bedrock (amazon.nova-lite-v1:0) for generating intelligent response recommendations
- Knowledge management layer – To maintain an up-to-date knowledge base, the solution:
- Archives technical articles in Amazon Simple Storage Service (Amazon S3)
- Implements periodic data synchronization using Amazon EventBridge
- Integrates with an Amazon Bedrock knowledge base for enhanced insights
We provide an AWS CloudFormation template to deploy the solution resources.
Prerequisites
Before starting this walkthrough, make sure you have access to the following AWS resources and configurations:
- An AWS account
- Access to the US East (N. Virginia) AWS Region
- Add access to Amazon Bedrock foundation models (amazon.nova-lite-v1:0)
- Add access to Amazon Bedrock foundation models (amazon.nova-lite-v1:0)
- Amazon EMR version 6.15.0 (used in this demo)
- Archived technical or troubleshooting articles
- AWS IAM Identity Center enabled with at least one role that can become a Grafana administrator
- (Optional) AWS Premium Support with a business support plan or higher for enhanced troubleshooting capabilities
Throughout this walkthrough, we provide detailed instructions to set up and configure these prerequisites if you haven’t already done so.
Configure resources using AWS CloudFormation
Complete the following steps to configure your resources:
- Launch the CloudFormation stack:
![]()
- Provide
emrobservabilityas the stack name. - Select a virtual private cloud (VPC) and assign a public subnet.
- For EMRClusterName, enter a name for your cluster (default:
emrObservability). - Enter an existing Amazon S3 location as the Apache HBase root directory location (for example,
s3://mybucket/my/hbase/rootdir/). - For MasterInstanceType and CoreInstanceType, enter your instance types (default: m5.xlarge for both).
- For CoreInstanceCount, enter your instance count (default: 2).
- For SSHIPRange, use CheckIp and enter your IP (for example, 10.1.10/32).
- Choose the release label (default: 6.15.0).
- For KeyName, enter a key name to SSH to Amazon Elastic Compute Cloud (Amazon EC2) instances.
- For LatestAmiId, enter your AMI (default:
/aws/service/ami-amazon-linux-latest/amzn2-ami-hvm-x86_64-gp2). - For KBS3Bucket, enter a name for your S3 bucket (for example,
mykbbucket). - For SubscriptionEndpoint, enter an email address to receive notifications and responses (for example,
[email protected]).
Accept subscription confirmation
Accept the subscription confirmation sent to the email address you specified in the CloudFormation stack parameters. The following screenshot shows an example of the email you receive.

Prepare the knowledge base
Complete the following steps to populate the S3 bucket with archived technical articles and cases:
- On the Lambda console, choose Functions in the navigation pane.
- Choose the function
CustomFunctionCopyKCArticlesToS3Bucket.
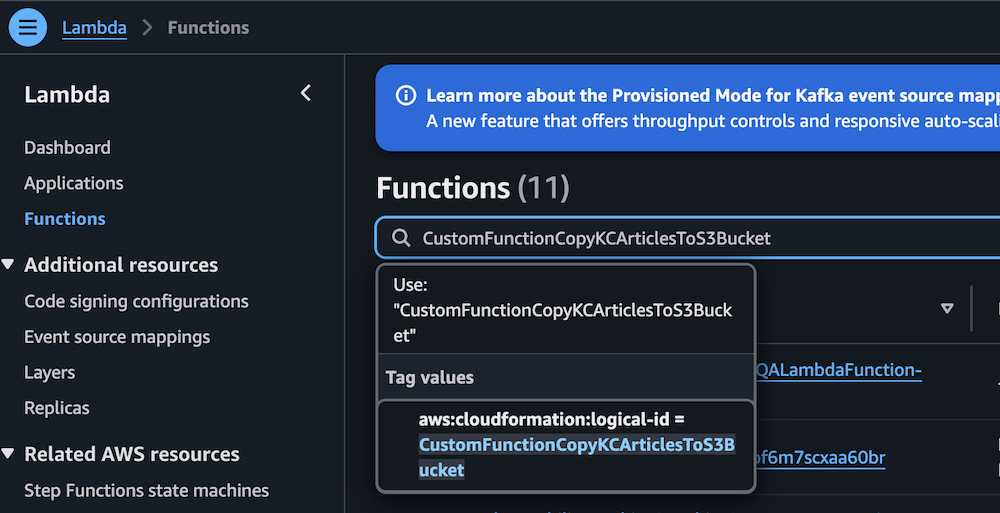
- Manually invoke the function by choosing Test on the Test tab.
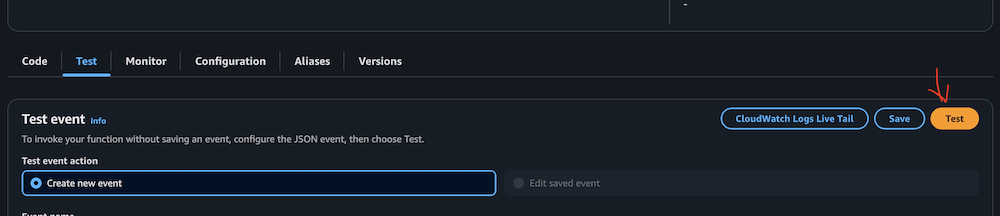
- Verify successful execution by checking the CloudWatch logs.
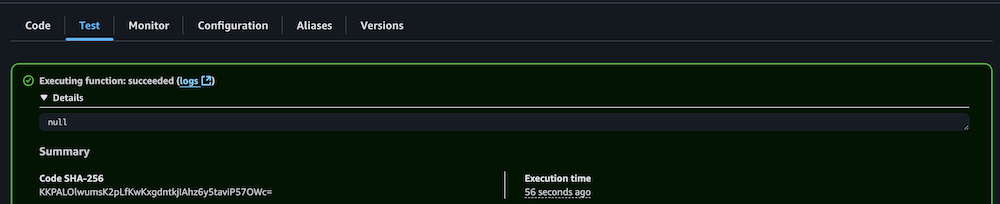
- Repeat the process for the Lambda function
CustomFunctionCopyCasesToS3Bucket.
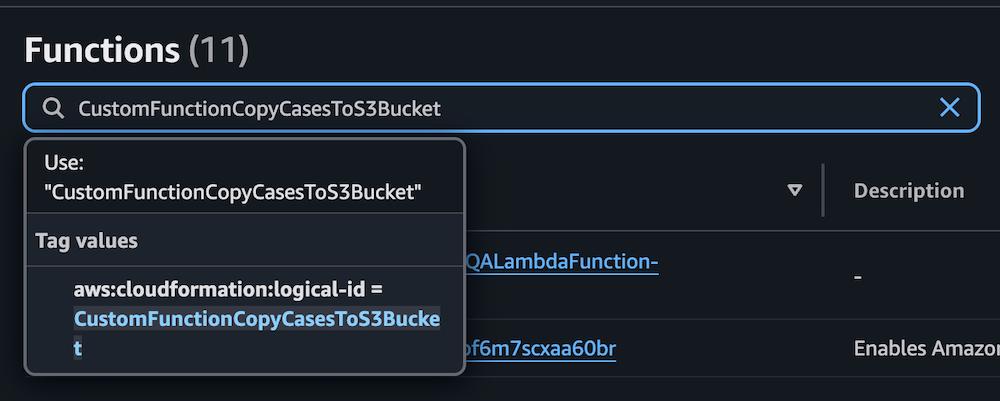
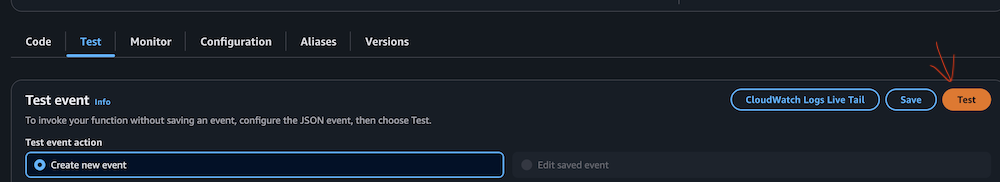
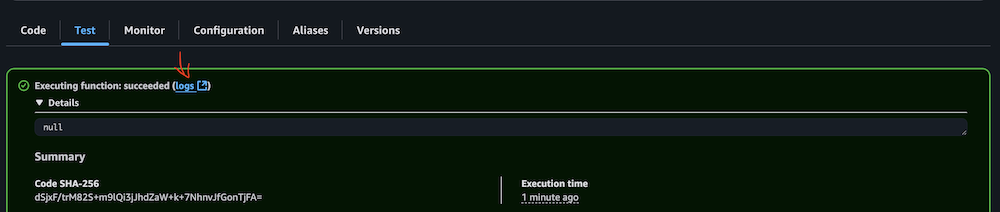
- Confirm the S3 bucket has been populated with archived technical articles and cases.
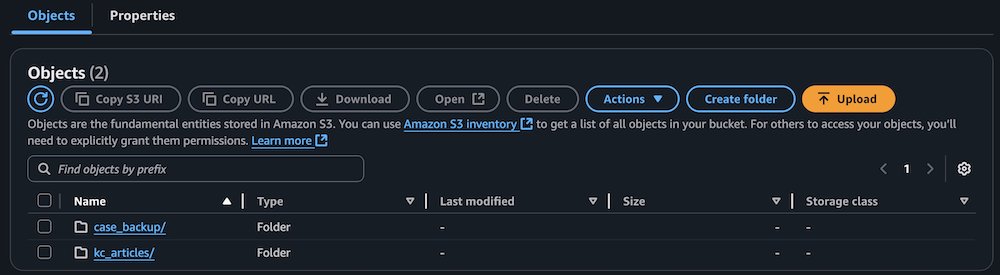
Sync data to the Amazon Bedrock knowledge base
Complete the following steps to sync the data to your knowledge base:
- On the Lambda console, choose Functions in the navigation pane.
- Choose the function
KBDataSourceSync.
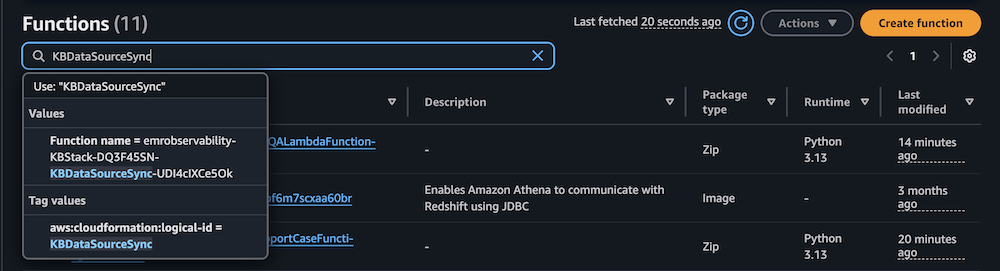
- Manually invoke the function by choosing Test on the Test tab.
This task might take 10–15 minutes to complete.

- Verify successful execution by checking the CloudWatch logs.

Configure your Amazon Managed Grafana workspace
Complete the following steps to configure your Amazon Managed Grafana workspace:
- On the Amazon Managed Grafana console, choose Workspaces in the navigation pane.
- Open your workspace.
- Choose Assign new user or group.
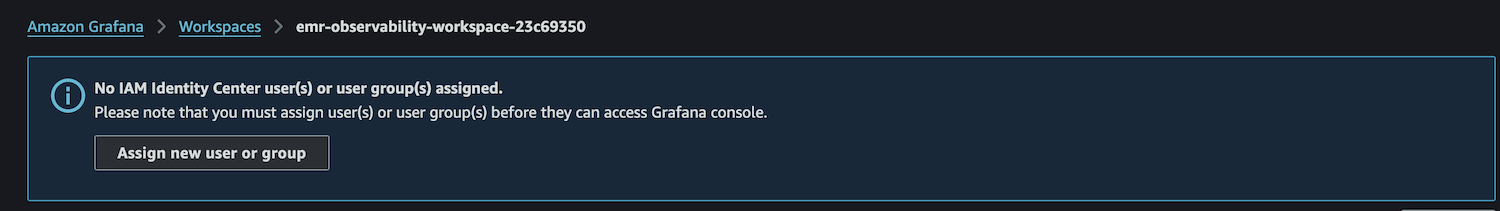
- Select your IAM Identity Center role and choose Assign users and groups.
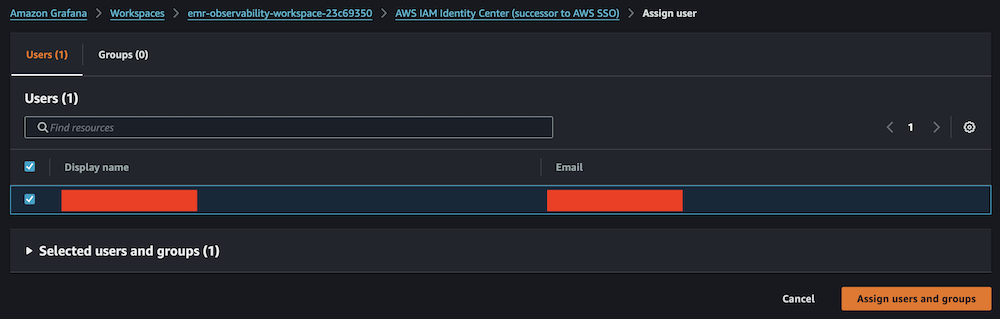
- On the Admin dropdown menu, choose Make admin.
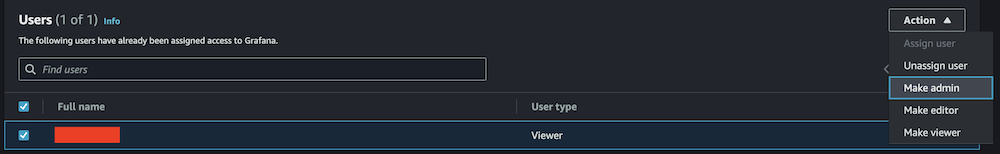
- Enable Grafana alerting, then choose Save changes.
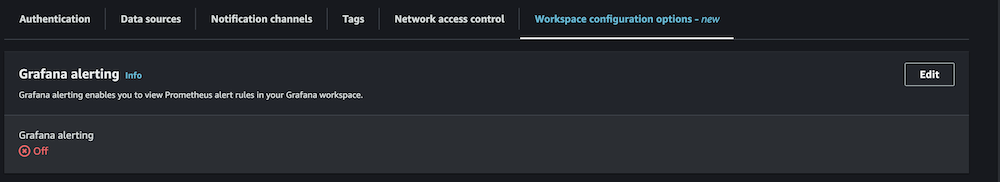
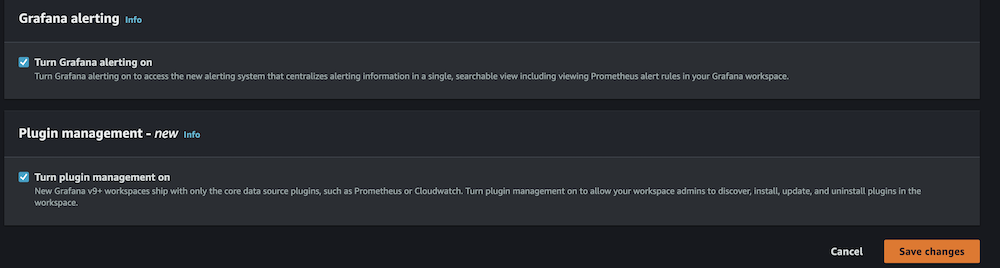
- Wait 10 minutes for the workspace to become active.
- When it’s active, sign in to the Grafana workspace. (For more information, refer to Connect to your workspace.)
Configure data sources
Add and configure the following data sources:
- For Service, choose CloudWatch, then select your Region and add CloudWatch as a data source.
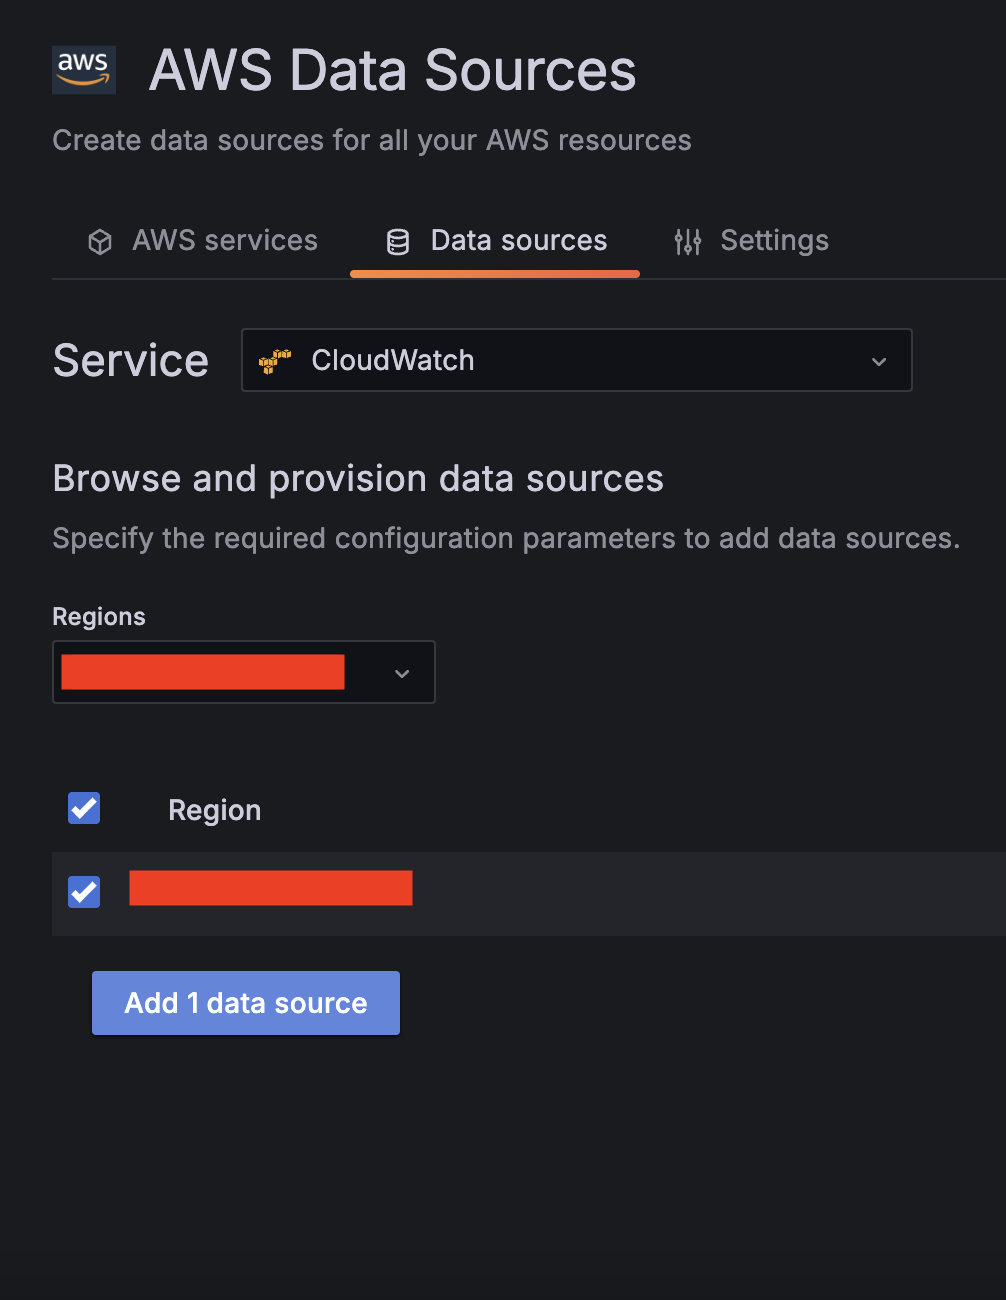
- Choose Amazon Managed Service for Prometheus as a second data source and select your Region.
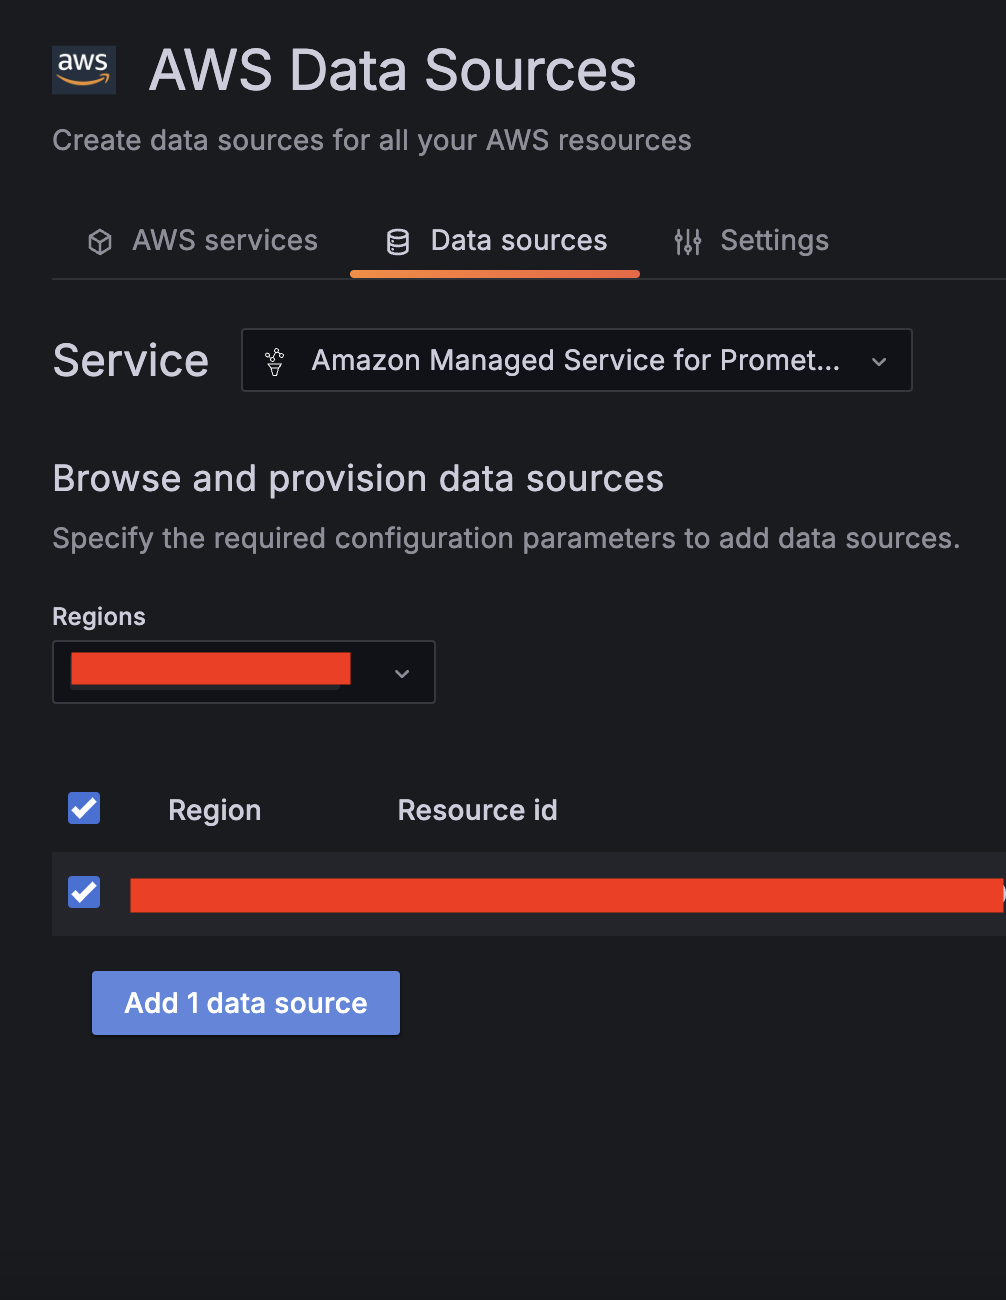
- Validate CloudWatch connectivity:
- Run test queries (for example, Namespace:
AWS/EC2, Metric name:CPUUtilization, Statistic:Maximum).

- Verify CloudWatch metric retrieval.
- Run test queries (for example, Namespace:
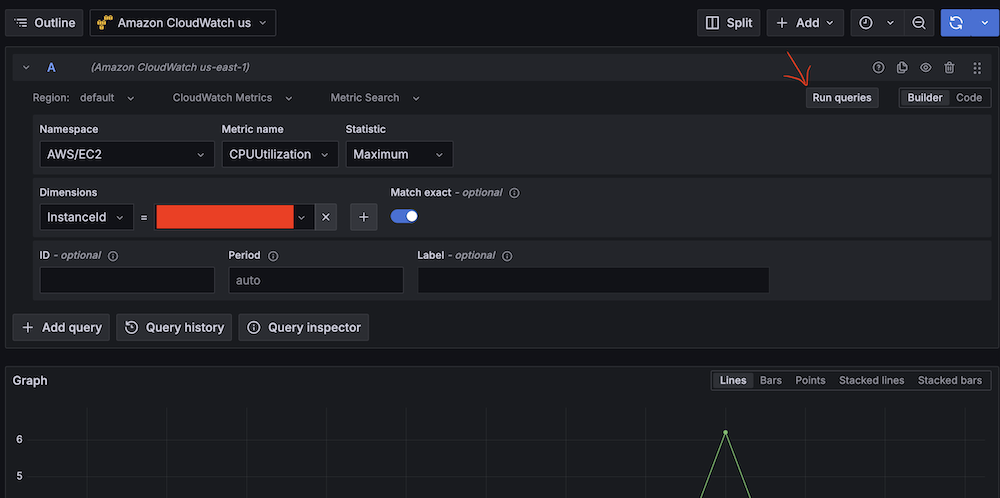
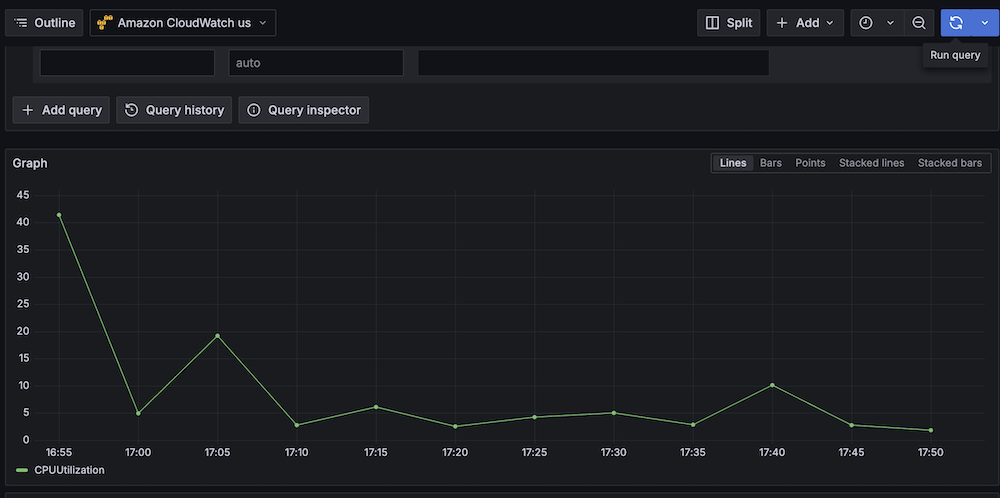
- Validate Amazon Managed Service for Prometheus connectivity:
- Run test queries (for example, Metric:
hadoop_hbase_numregionservers, Label filters:cluster_id = <Amazon EMR cluster ID>).

- Verify Prometheus metric retrieval.

- Run test queries (for example, Metric:
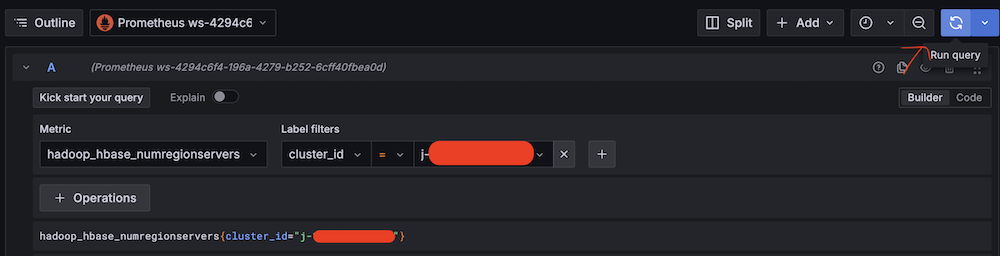
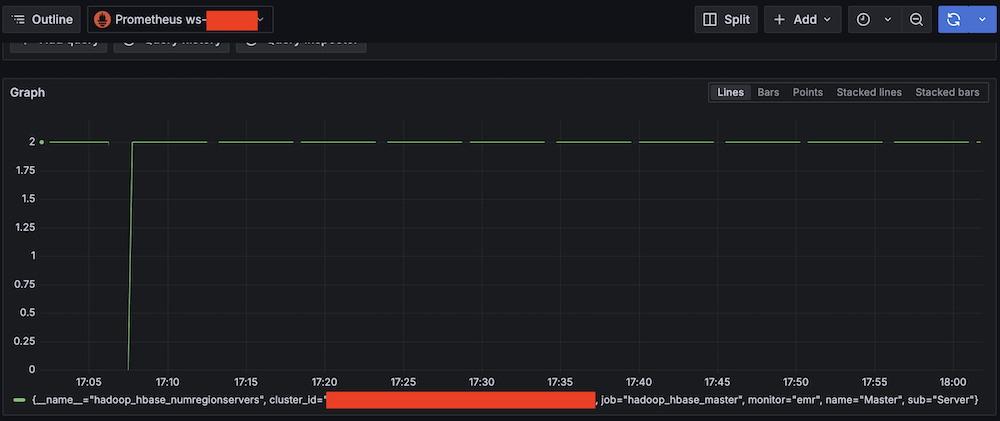
Confirm SNS notification channels
Complete the following steps to confirm your SNS notification is set up:
- On the Amazon SNS console, choose Topics in the navigation pane.
- Locate and note the ARNs for
-LambdaFunctionTopicand-QALambdaFunctionTopic.
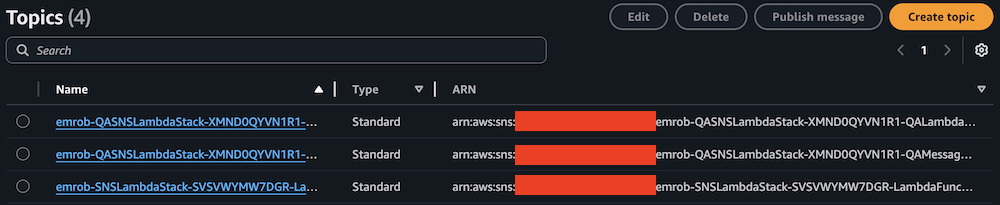
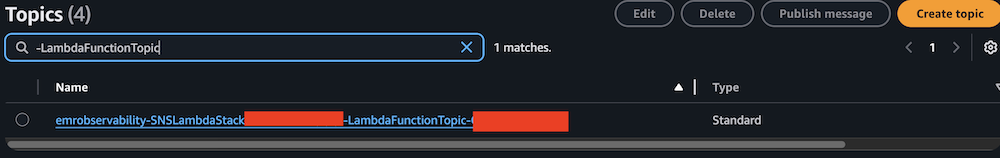
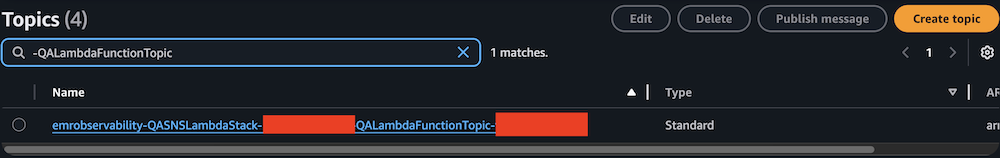
- Choose Contact points under Alerting.
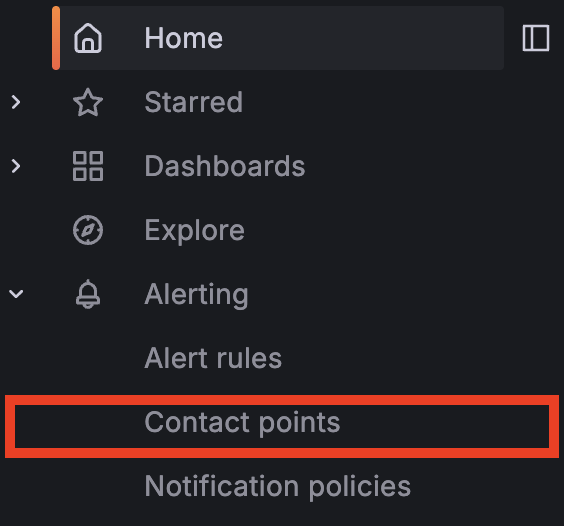
- Create the first contact point:
- For Name, enter SNS_SSM.
- For Integration, choose AWS SNS.
- For Topic, enter the ARN for LambdaFunctionTopic.
- For Auth Provider, choose Workspace IAM role.
- For Alert Message format, choose JSON.
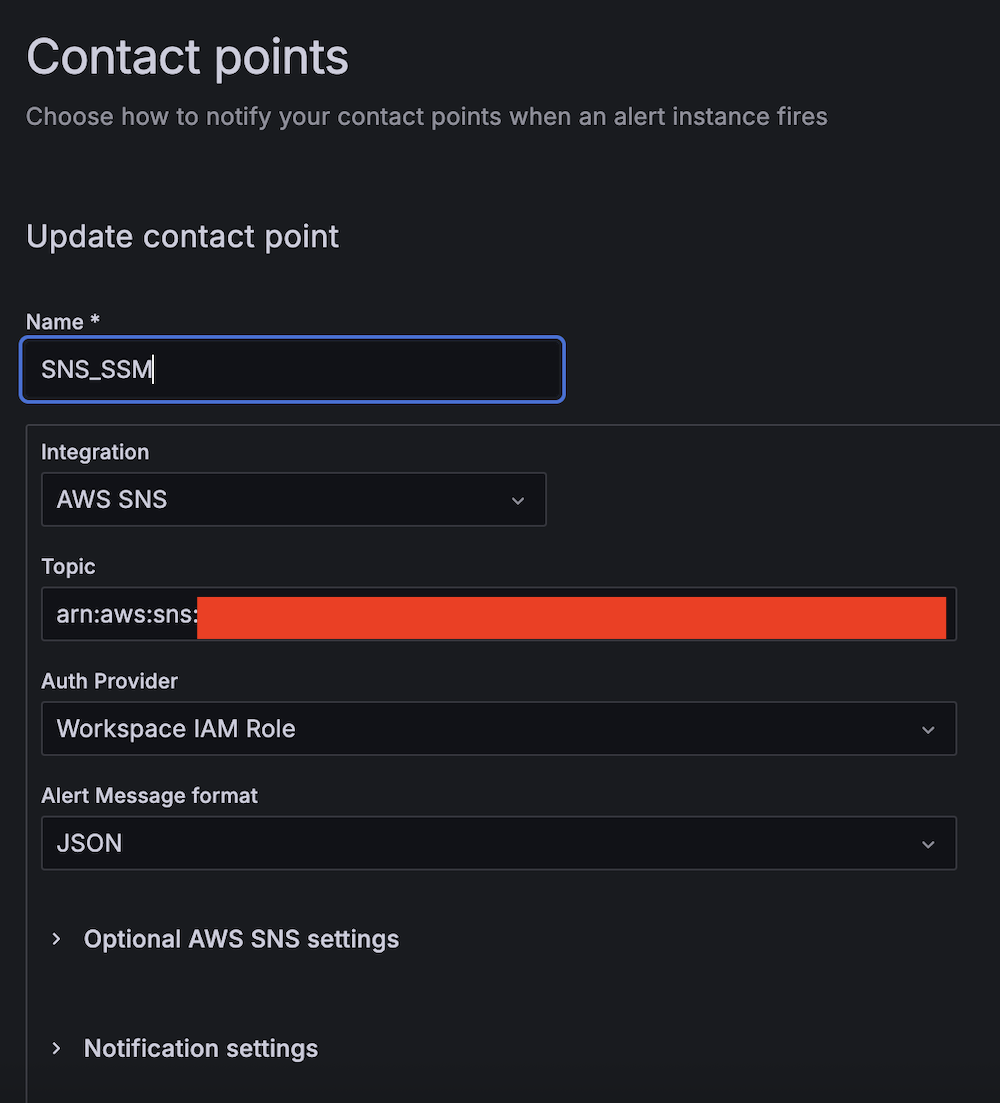
- Create the second contact point:
- For Name, enter SNS_QA.
- For Integration, choose AWS SNS.
- For Topic, enter the ARN for QALambdaFunctionTopic.
- For Auth Provider, choose Workspace IAM role.
- For Alert Message format, choose JSON.
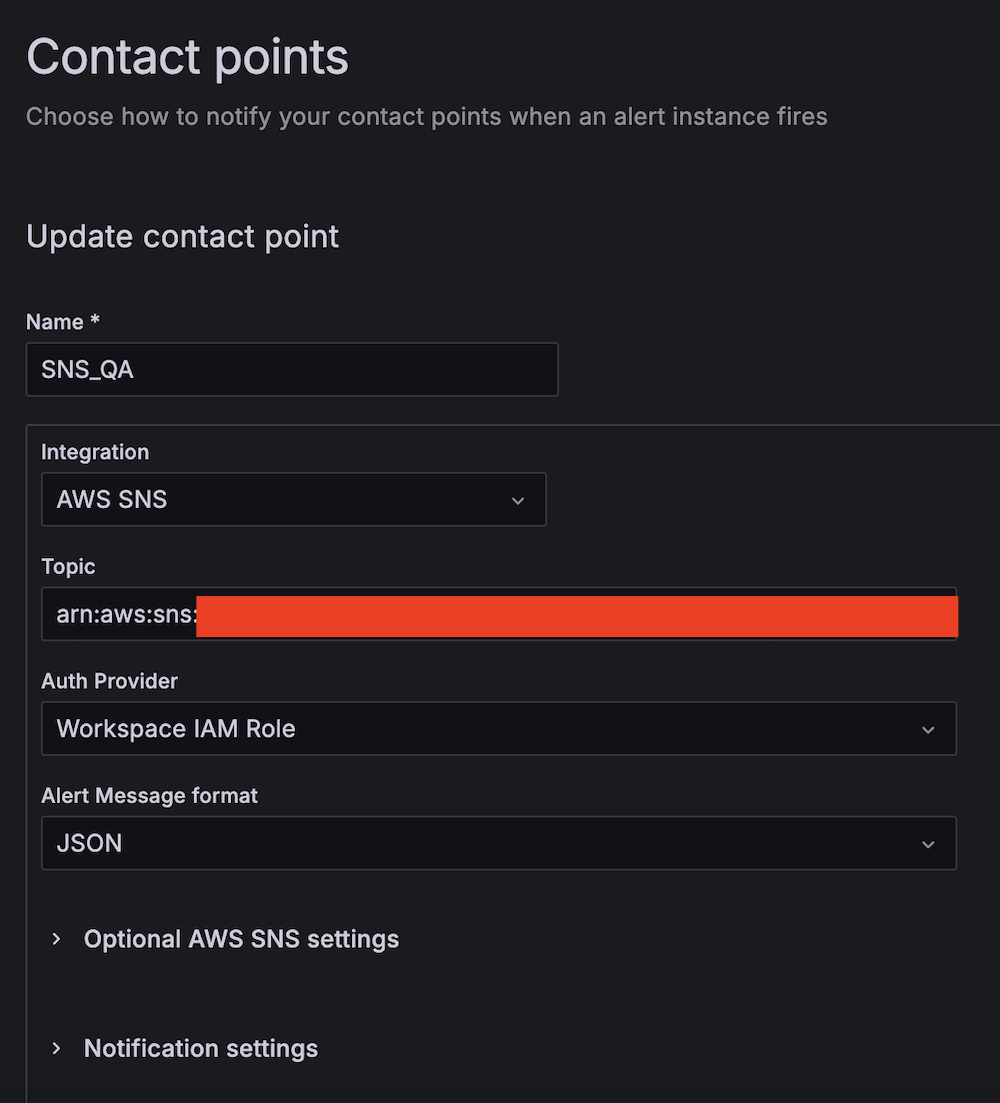
Create alert rules
Complete the following steps to set up two critical alert rules:
- Choose Alert rules under Alerting.
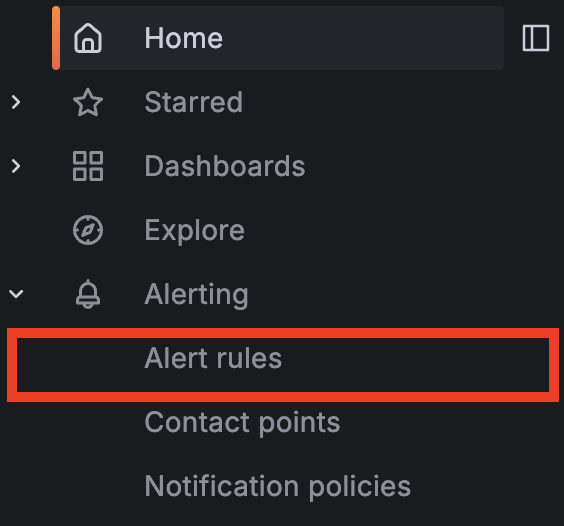
- Set up alerting if the Apache HBase region server status is abnormal:
- For Alert name, enter HBase region server down.
- For Data source, choose Amazon Managed Service for Prometheus.
- For Metric, choose
hadoop_hbase_numregionservers.

- For Threshold, configure to alert if the region server count is less than 2 for 3 minutes.

- For Evaluation interval, set to 1 minute.


- For Contact point, choose
SNS_SSM.

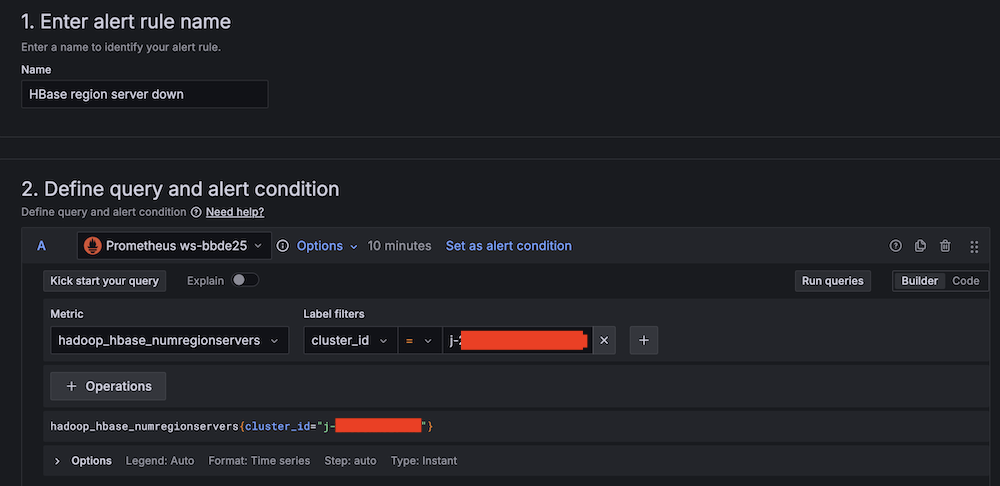
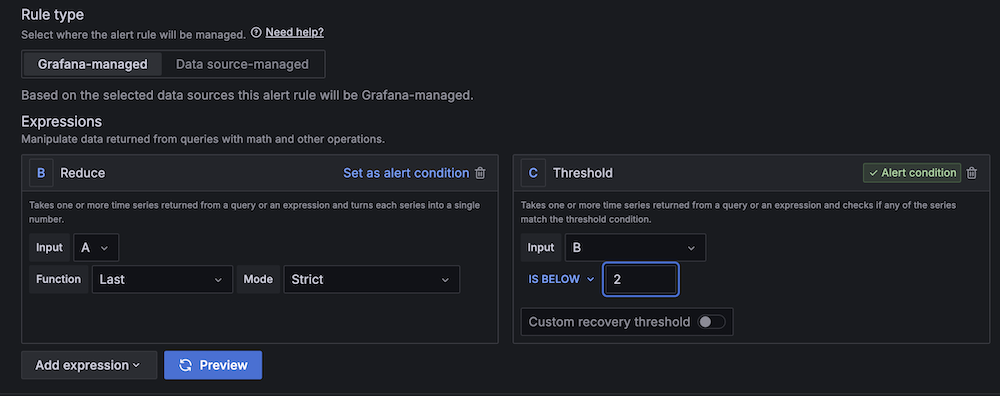

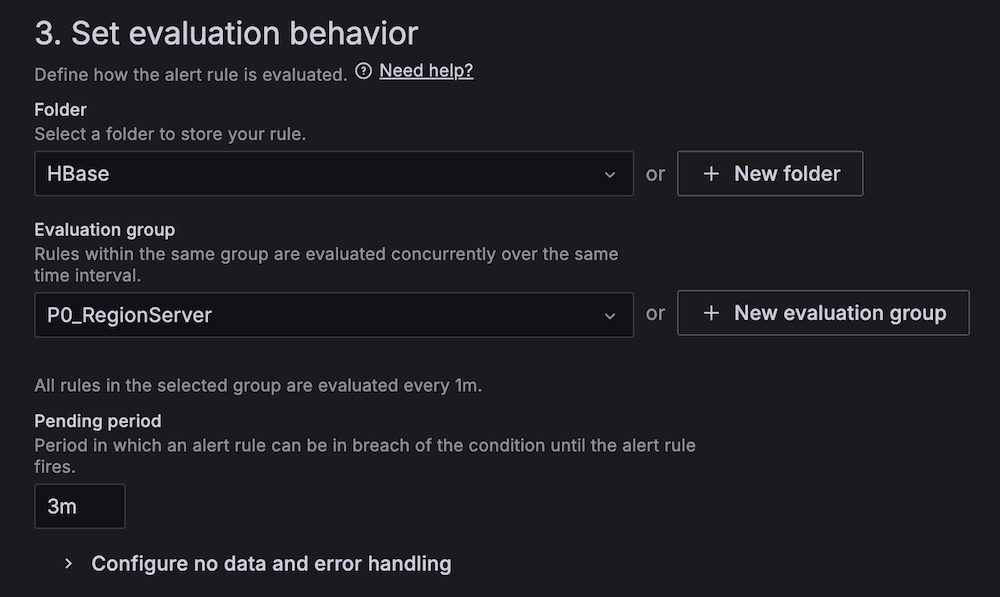
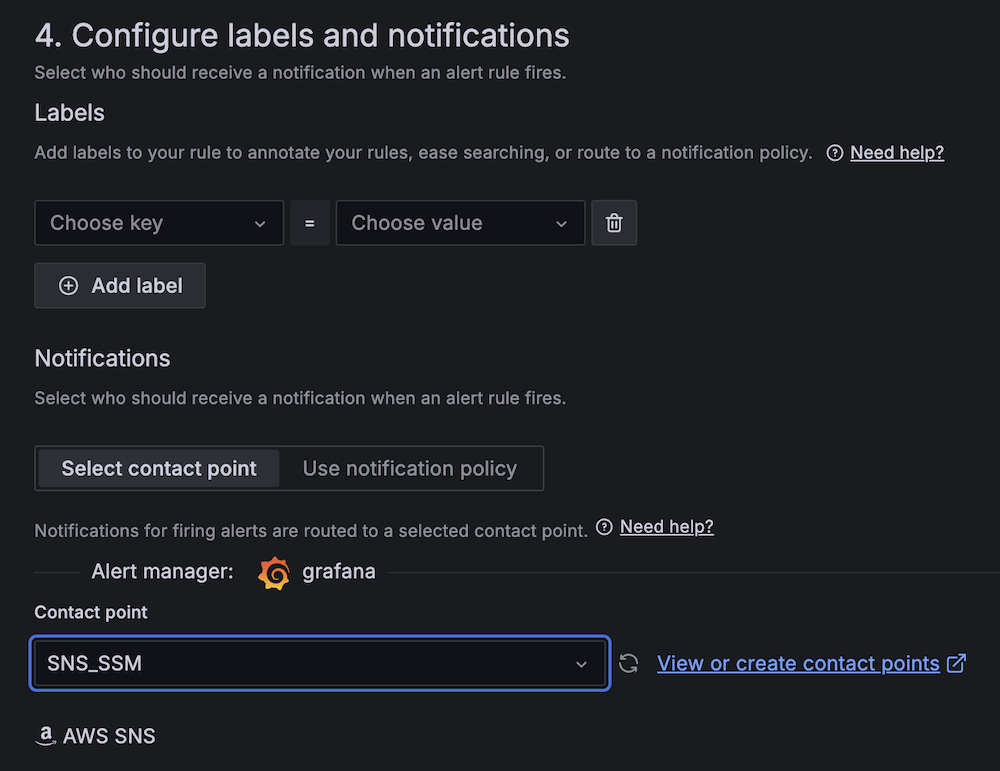
- Create a second alert for if Amazon EC2 CPU utilization is abnormal:
- For Alert name, enter EC2 CPU utilization too high.
- For Data source, choose Amazon CloudWatch.
- For Namespace, choose AWS/EC2.
- For Metric name, choose CPUUtilization
- For Statistic, choose Maximum.

- For Threshold, configure to alert if CPU utilization is more than 95% for 3 minutes.

- For Evaluation interval, configure to 1 minute.

- For Contact point, choose
SNS_QA.
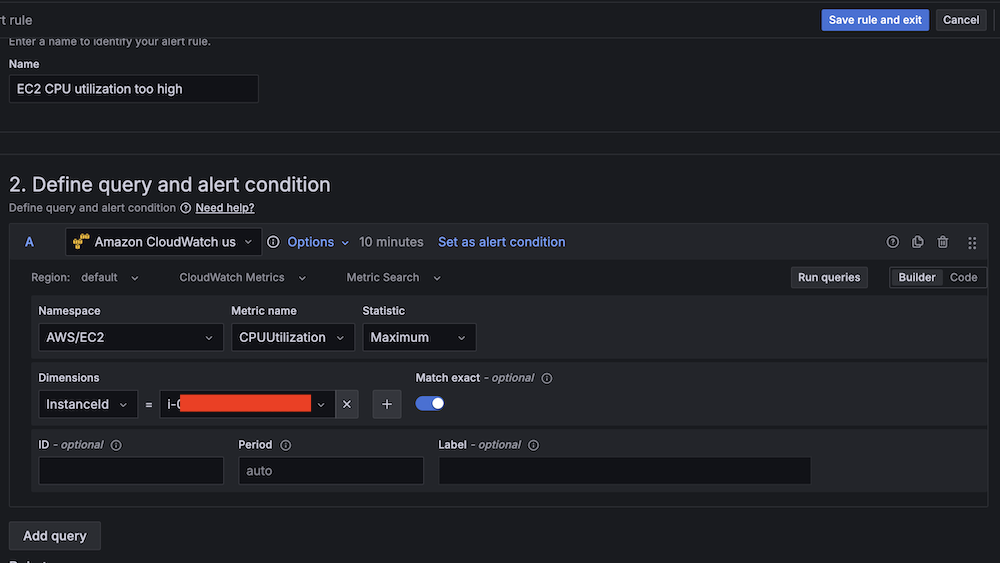
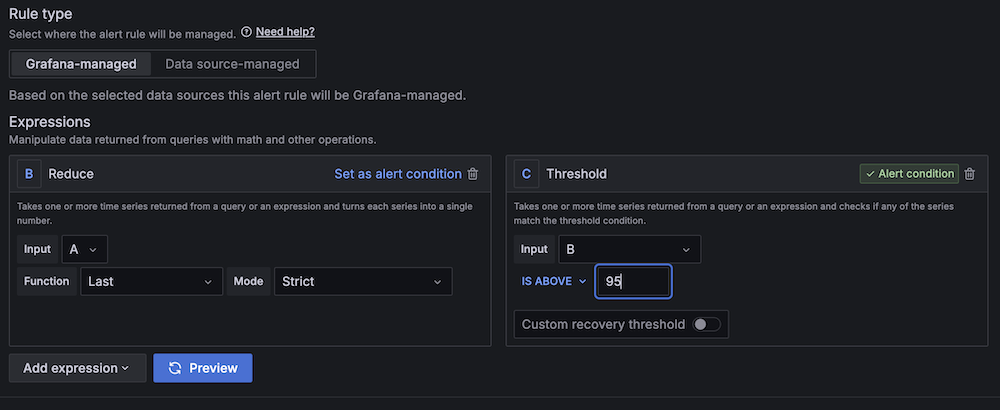
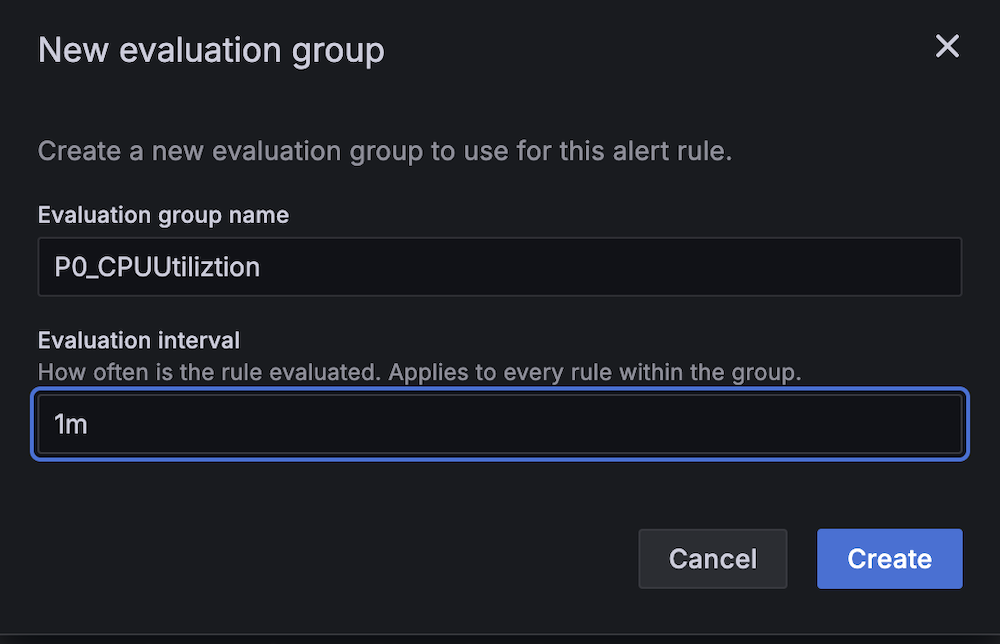
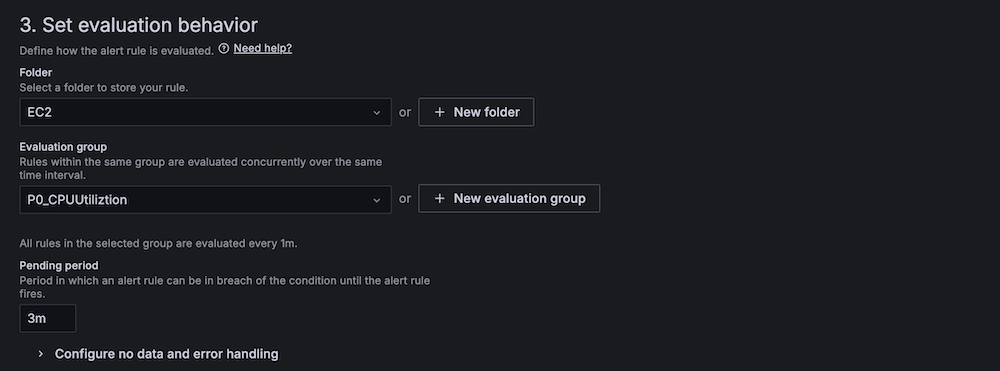
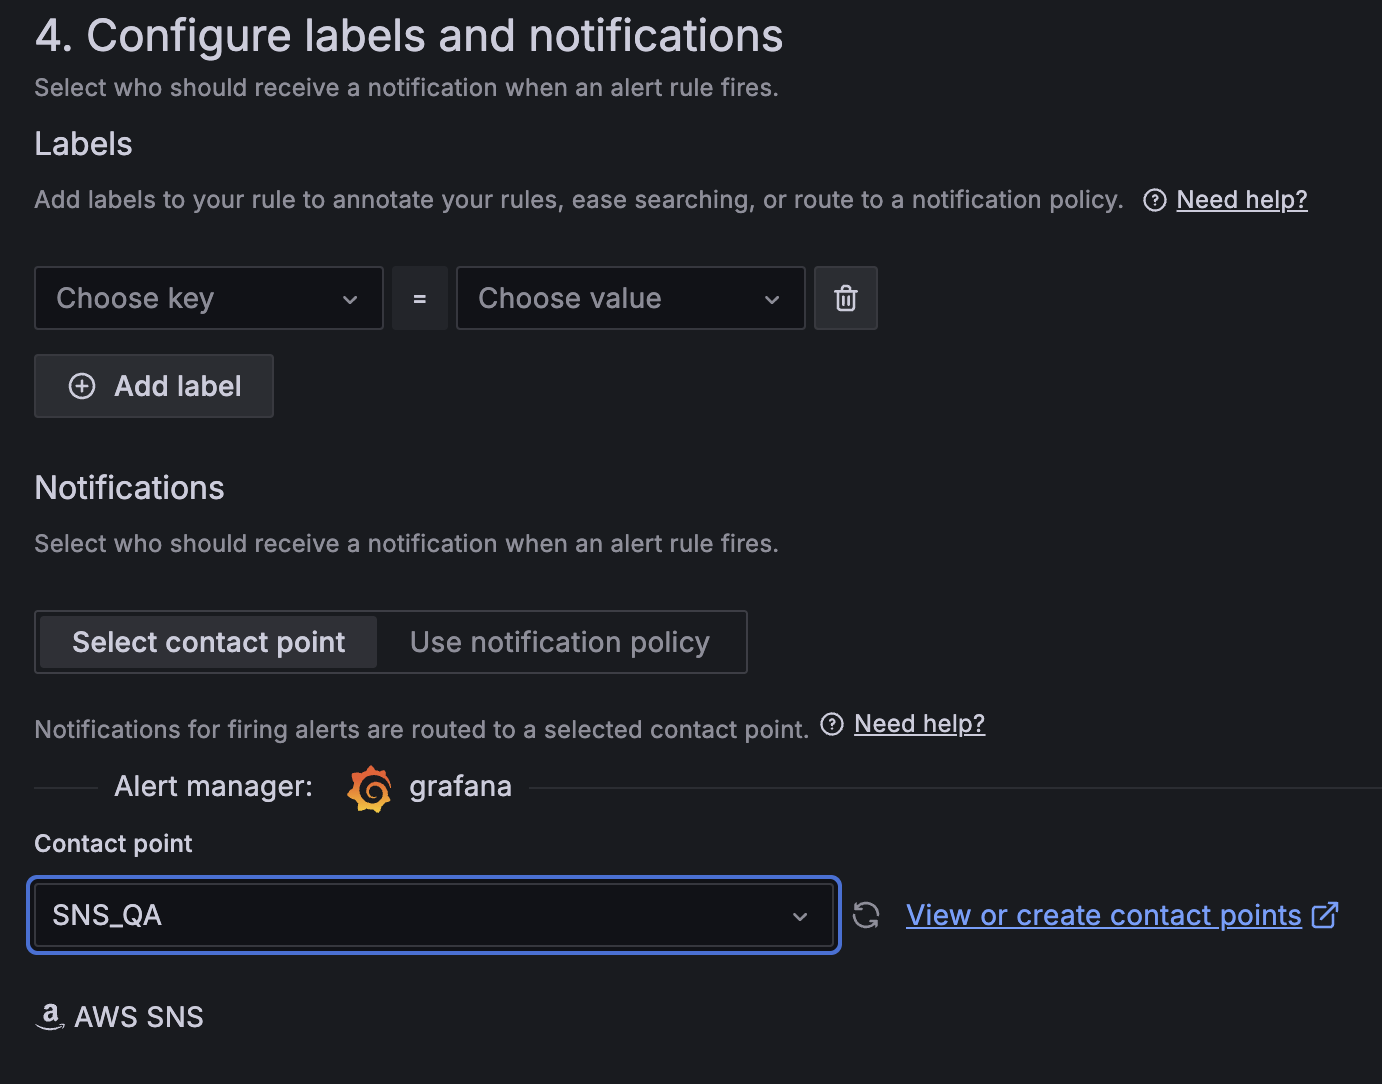
- On the alert rule creation page, scroll to 5. Add annotations and for Summary, add a clear description of the alert, for example, CPU utilization on EC2 instance is too high.
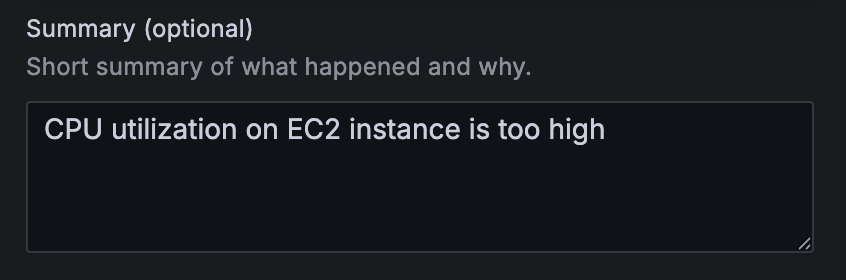
Apache HBase region server incident test
To confirm the system is working as expected, complete the following Apache HBase region server incident test:
- SSH into an EMR core instance.
- Stop the Apache HBase region server using systemctl:
- Verify the service status:
- Observe Amazon Managed Grafana alert progression:
- Monitor alert status changes.


- Verify SNS message generation.
- Confirm SQS message queuing.
- Track the Lambda function triggered for remediation.
- Monitor alert status changes.
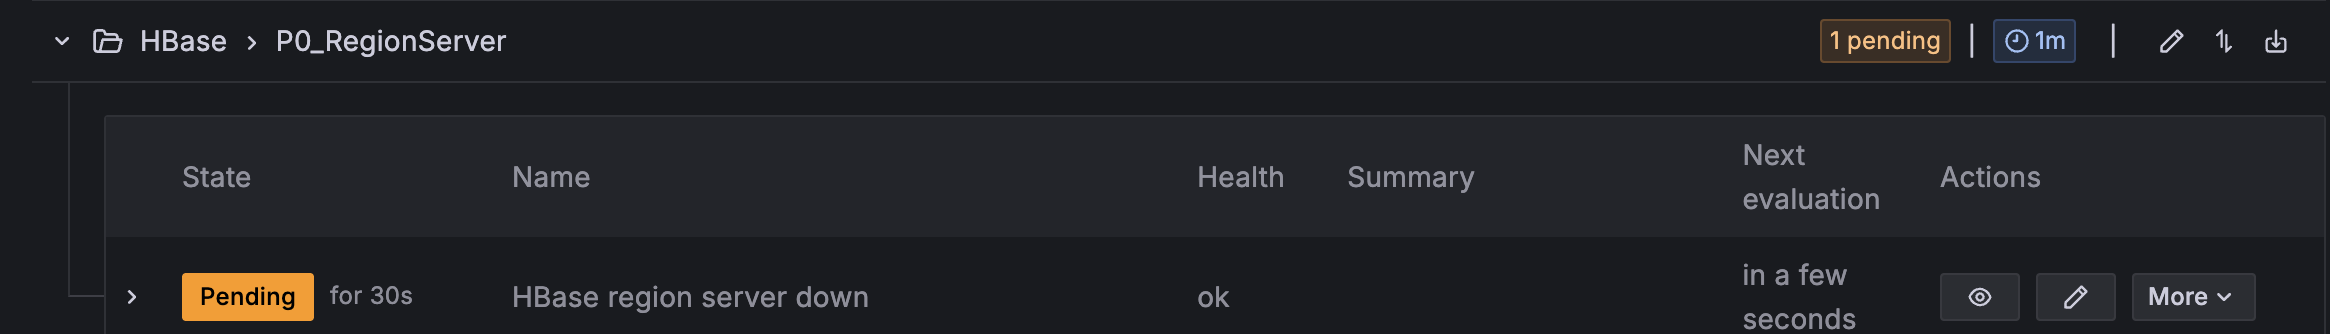
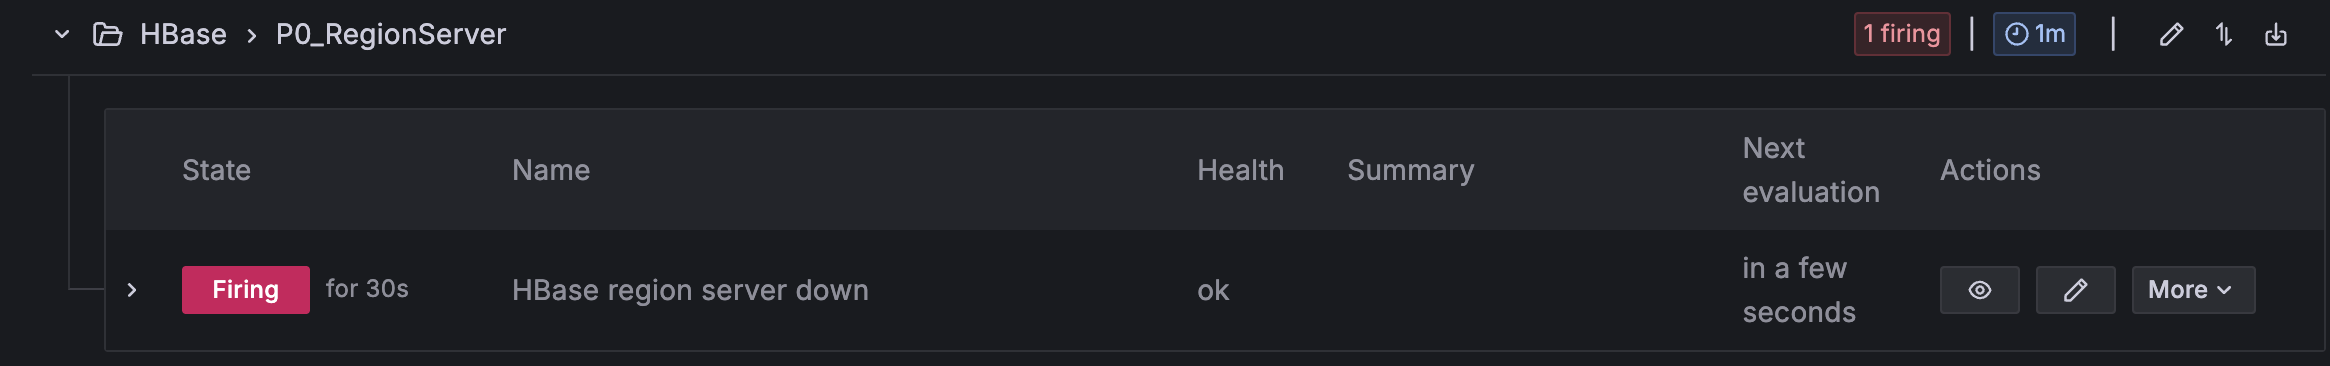
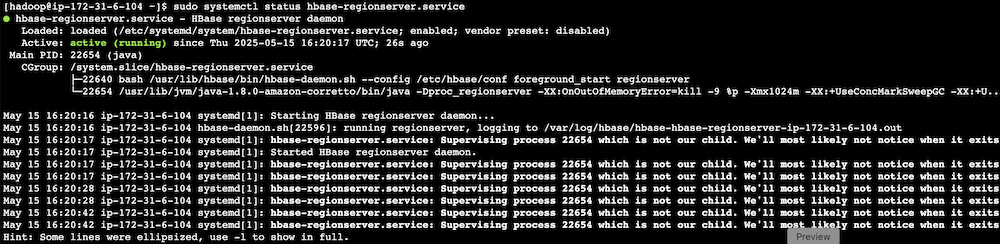
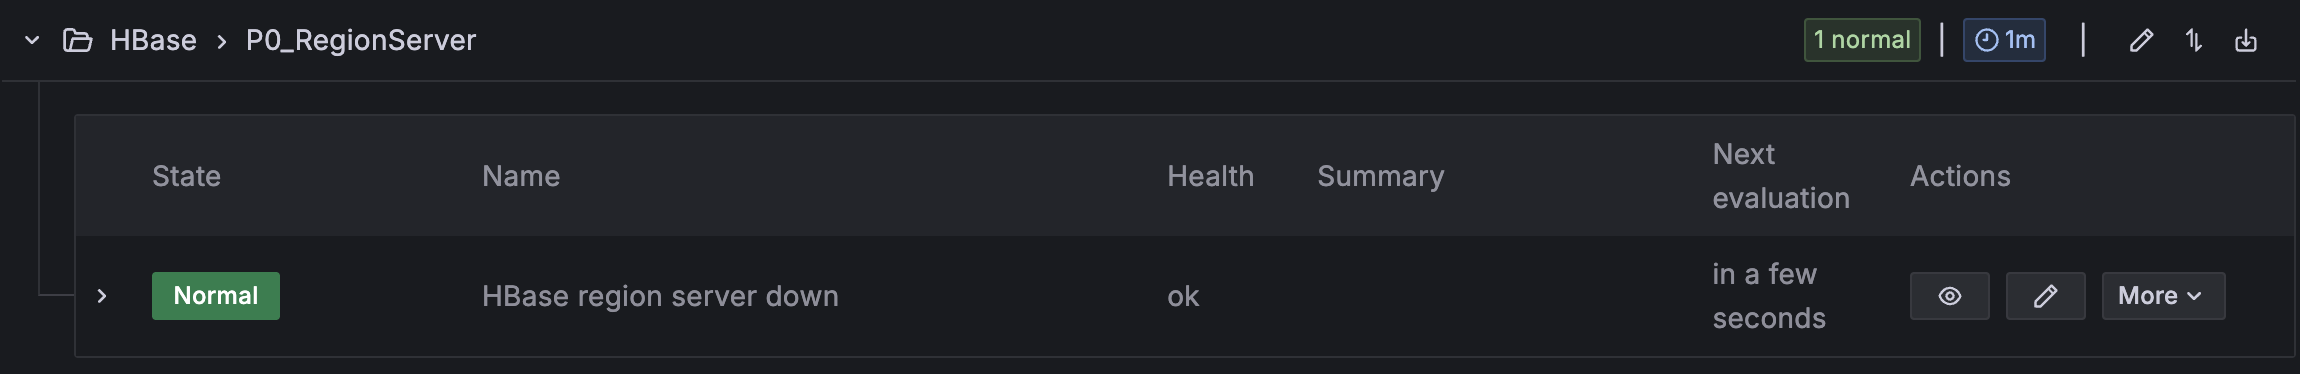
CPU utilization stress test
Complete the following CPU utilization stress test:
- SSH into the EMR primary instance.
- Install stress testing tools:
- Verify the installation:
- Generate high CPU load using the stress command and the following command structure:
For our Amazon EMR test, use the following command:
-c 4 in the command creates 4 CPU-bound processes (one for each vCPU).The following are instance type vCPUs for your reference:
- m5.xlarge: 4 vCPUs
- m5.2xlarge: 8 vCPUs
- m5.4xlarge: 16 vCPUs
- Monitor system response:
- Observe Amazon Managed Grafana alert status changes.

- Verify Amazon Bedrock recommendation generation.
- Check SNS email notification delivery.


- Observe Amazon Managed Grafana alert status changes.
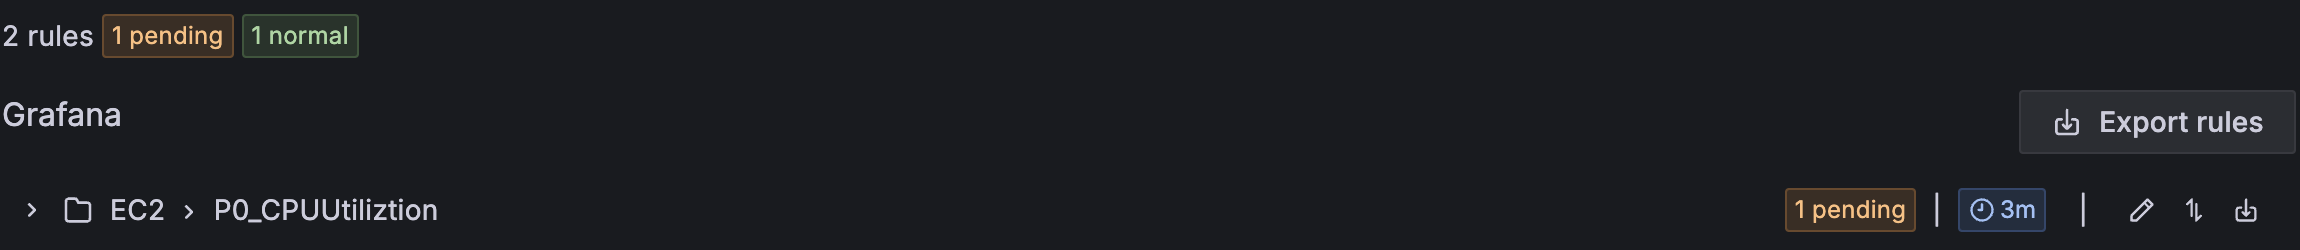
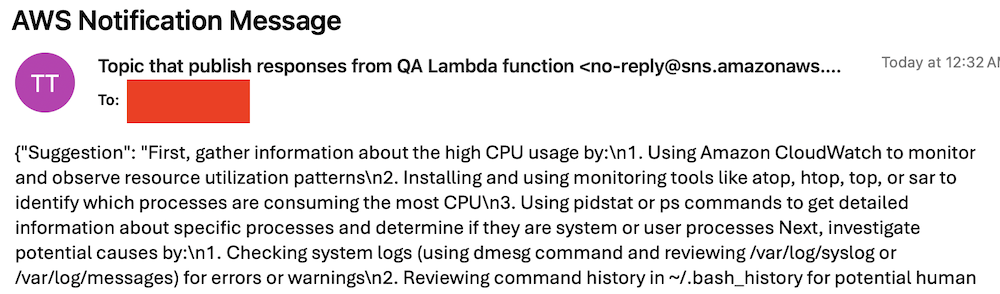
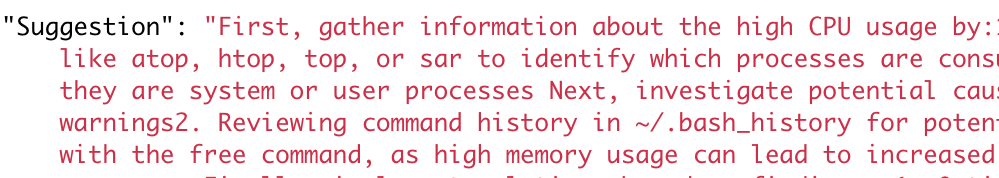
Best practices and considerations
Monitoring infrastructure requires precise alert prioritization and threshold configuration. Alert aggregation techniques prevent notification overload by consolidating event streams and reducing redundant alerts. Operational teams must maintain dashboards through consistent updates and metric integration, providing real-time visibility into system performance and health.
Security implementations focus on least-privilege AWS Identity and Access Management (IAM) roles, restricting access to critical resources and minimizing potential breach vectors. Data protection strategies involve encryption protocols for information at rest and in transit, using AES-256 standards. Automated security audit processes scan automation scripts, identifying potential vulnerabilities through code analysis and runtime inspection.
Performance optimization in serverless architectures uses Lambda extensions to cache knowledge base content, reducing latency and improving response times. Retry mechanisms for API calls implement exponential backoff strategies, mitigating transient network exceptions and enhancing system resilience. Execution time monitoring of Lambda functions enables detection of anomalies through statistical analysis, providing insights into potential system-wide incidents or performance degradations.
Clean up
To avoid incurring future charges, delete the resources by deleting the parent stack on the AWS CloudFormation console.
Conclusion
This solution provides a robust framework for automated EMR cluster monitoring and incident response. By combining real-time monitoring with AI-powered remediation suggestions and automated execution, organizations can significantly reduce MTTR for common Amazon EMR issues while building a knowledge base for future incident response.
Try out this solution for your own use case, and leave your feedback in the comments section.
About the authors
 Yu-ting Su, Sr. Hadoop System Engineer, AWS Support Engineering. Yu-Ting is a Sr. Hadoop Systems Engineer at Amazon Web Services (AWS). Her expertise is in Amazon EMR and Amazon OpenSearch Service. She’s passionate about distributing computation and helping people to bring their ideas to life.