Deploy modern data platforms in minutes with MDAA

Post Syndicated from Sudeshna Dash original https://aws.amazon.com/blogs/big-data/deploy-modern-data-platforms-in-minutes-with-mdaa/

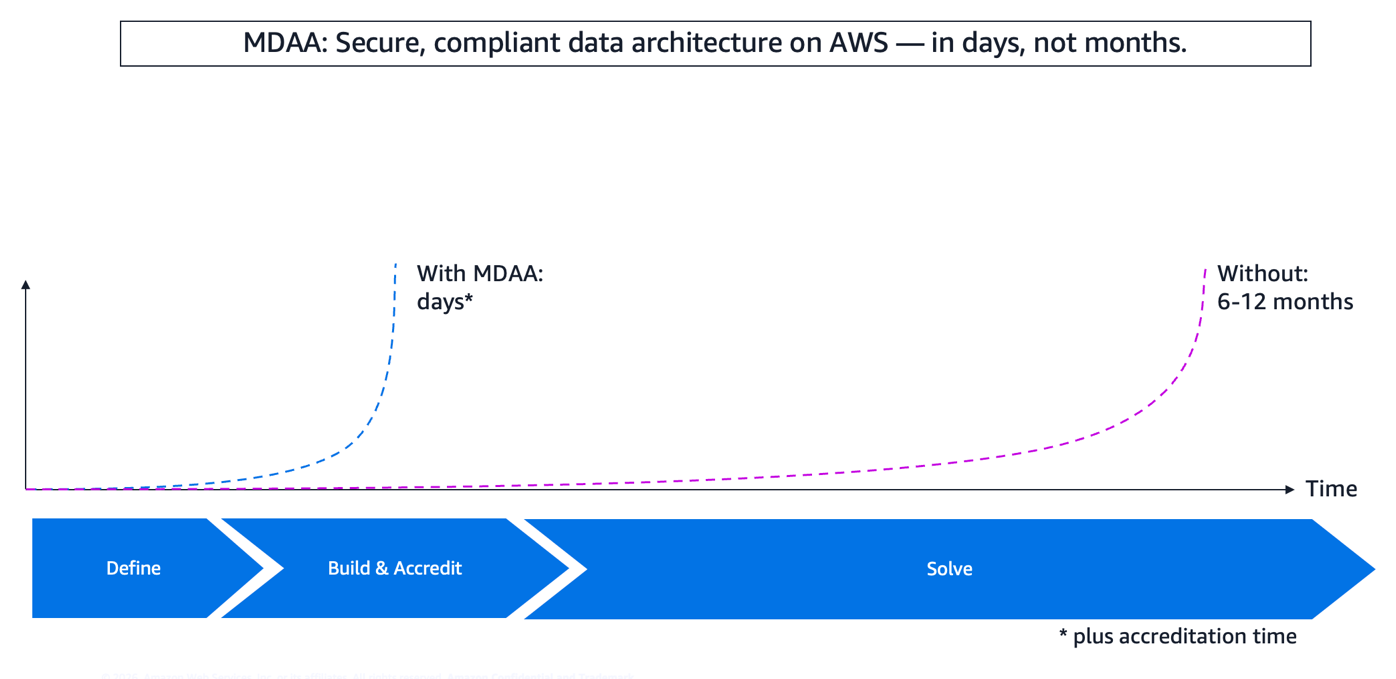
Modern Data Architecture Accelerator (MDAA) is an open source framework that replaces infrastructure code with concise YAML configuration, so your team can deploy a governed, production-ready data architecture, reducing deployment time from months to weeks (depending on complexity and team experience).

Organizations building modern data architecture on AWS face a critical challenge: deploying production-ready, governed infrastructure traditionally requires 6–12 months of custom development, thousands of lines of infrastructure code, and continuous remediation cycles to maintain security and compliance. Governance is often added incrementally, treated as an afterthought that creates compliance gaps and engineering rework.

MDAA addresses this by replacing infrastructure code with concise YAML configuration, achieving up to 97.6 percent code reduction (from approximately 1,800 lines of AWS CloudFormation to 45 lines of MDAA YAML) while embedding governance from the start. The complete Governed Lakehouse Starter Kit deploys 491 AWS resources across 12 stacks from approximately 450 lines of YAML configuration, representing a 66x verbosity ratio where each line automatically expands into production-ready infrastructure.

In this post, we explore how MDAA transforms data architecture development from months of manual coding to production-ready deployment through configuration-driven infrastructure and embedded governance, examine a real customer transformation, and provide a clear implementation pathway for your own data modernization journey.

Customer use case and challenge

A university system office needed to modernize its analytics architecture across 17 campuses while managing sensitive educational data. Their third-party dependency created bottlenecks that slowed feature implementation from weeks to months, and their IT team lacked the cloud skillsets to build modern infrastructure independently.

With MDAA, they achieved:

  • 95 percent reduction in time-to-value for dashboard and feature implementation (from weeks to hours).
  • 17 campuses integrated into a unified, secure architecture.
  • 7.2TB of data and over 8,000 dashboards migrated successfully.
  • Significant cost savings by removing third-party dependencies and reducing license costs.
  • Enhanced security posture for external stakeholders accessing sensitive educational data.
The team used MDAA to implement a modernization strategy with continuous integration and continuous delivery (CI/CD) for automated deployment. The architecture now supports rapid response to stakeholder requests while maintaining strict data governance through AWS Lake Formation.

Their transformation demonstrates what becomes possible when governance is embedded from launch rather than added incrementally, moving from months-long manual development to weeks of production-ready deployment through configuration-driven infrastructure.

Solution: MDAA and its value propositions

MDAA’s capabilities stem from its modular, composable architecture. The accelerator provides over 40 pre-built modules that encapsulate AWS best practices for security, governance, and operational excellence. Organizations describe the outcomes they want in MDAA-specific YAML configuration files (not CloudFormation or Terraform YAML) and the accelerator automatically translates these configurations into AWS Cloud Development Kit (AWS CDK) constructs, which then deploy via CloudFormation with embedded governance.
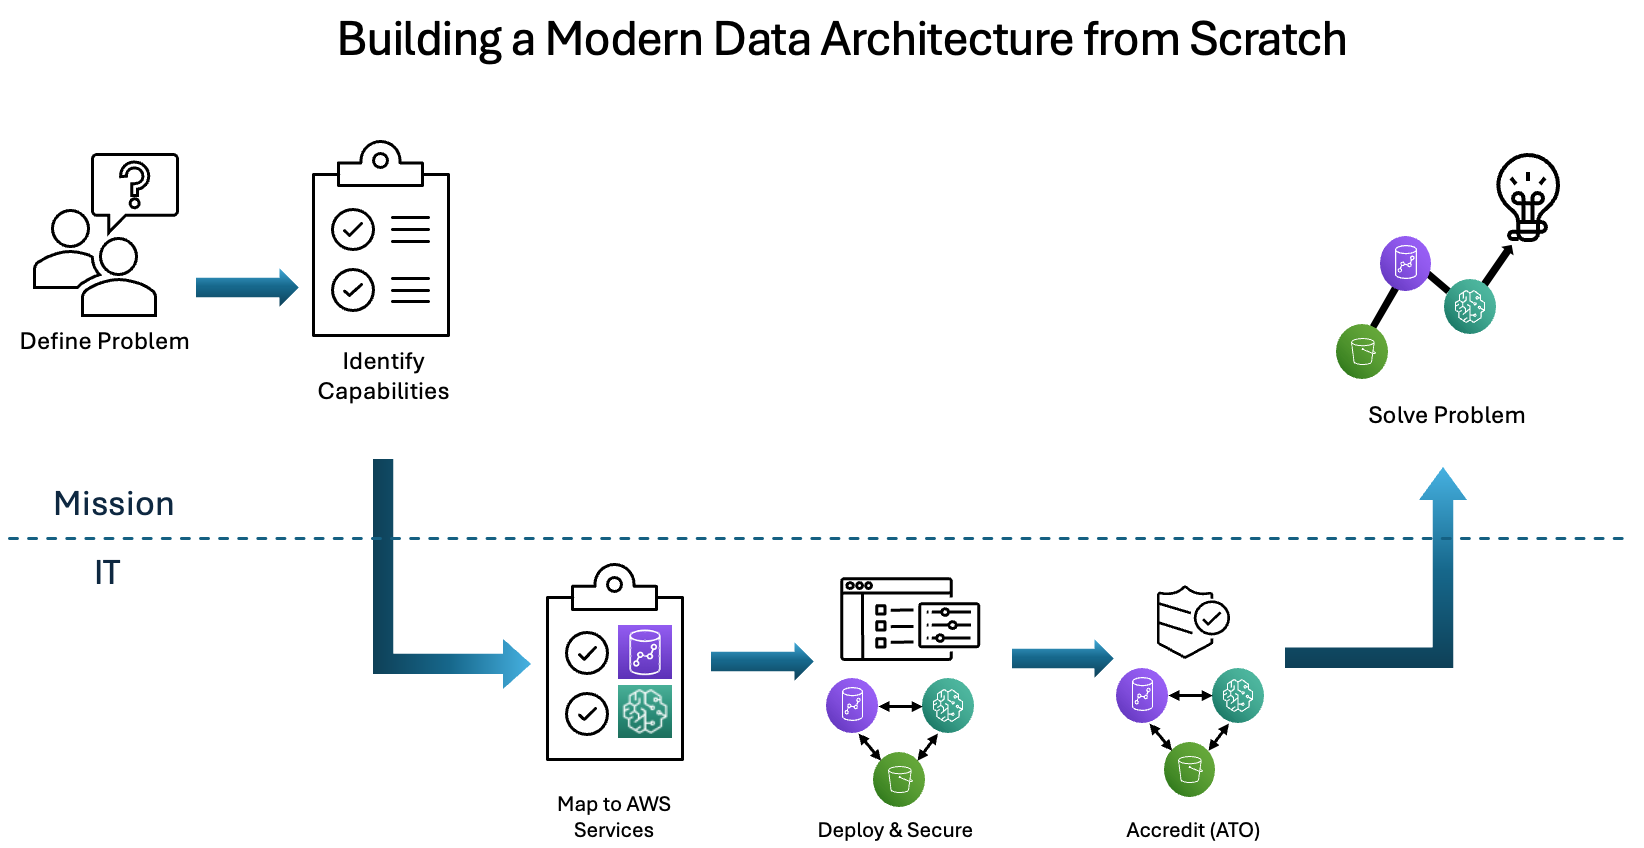
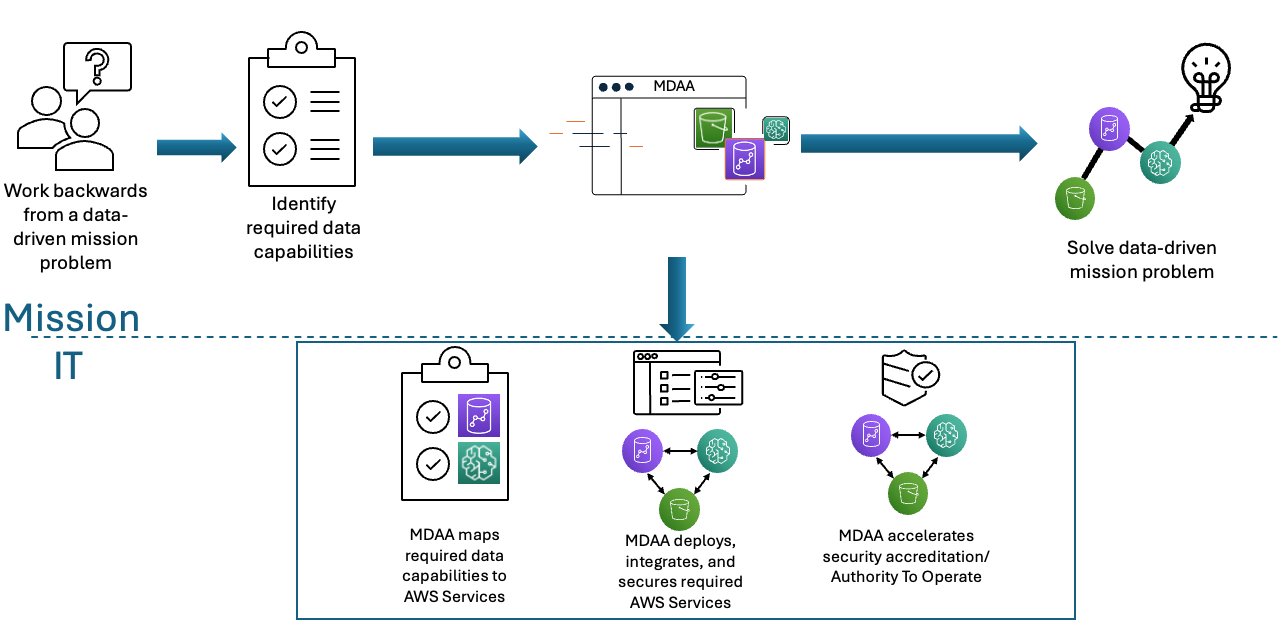
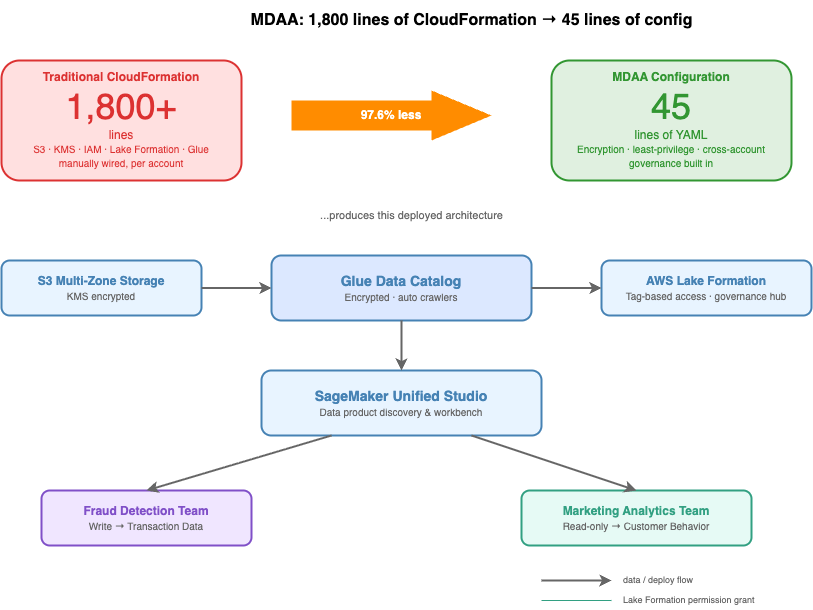
Configuration over code. The MDAA framework takes a fundamentally different approach: describe the outcomes you want in YAML, and the accelerator deploys production-ready infrastructure with embedded governance. Consider deploying a governed data lake where fraud detection teams need write access to transaction data, while marketing analytics teams require read-only access to customer behavior data. Traditional approaches require over 1,800 lines of CloudFormation across Amazon Simple Storage Service (Amazon S3) buckets, AWS Key Management Service (AWS KMS) keys, AWS Identity and Access Management (IAM) policies, and Lake Formation permissions. With MDAA, the same governed data lake is expressed in 45 lines of configuration, a 97.6 percent reduction, while helping you apply encryption, least-privilege access, and cross-account governance as built-in defaults.
The configuration deploys multi-zone S3 storage with KMS encryption, Lake Formation permissions with tag-based access control (TBAC) enabled, Amazon SageMaker Unified Studio for data product discovery, and encrypted AWS Glue Data Catalog with automated crawlers. All permissions flow through Lake Formation rather than individual IAM policies.

Embedded governance from day one. Governance is declared in YAML and deployed alongside infrastructure from the first run. Fine-grained access controls, encrypted data catalogs, data quality validation, audit trails, and sensitive data classification are all part of the same configuration. MDAA’s Governed Lakehouse starter kit defines an entire governed data architecture in roughly 450 lines of YAML, which produces approximately 29,700 lines of CloudFormation across 12 stacks (a 98.5 percent reduction in infrastructure code).

Modular, composable architecture. Each module is purpose-built to handle a specific capability within the data architecture. Modules communicate through AWS Systems Manager Parameter Store, passing resource identifiers (Amazon Resource Names (ARNs), IDs, and names) between stacks. This approach removes hardcoded dependencies. A KMS key created in one module can be referenced by another through parameter resolution, with all dependencies resolved automatically at deployment time.

The diagram illustrates the deployed architecture and team-level access flow that MDAA generates from the 45-line configuration.
Progressive architecture patterns. MDAA provides four reference architecture patterns that align to progressive stages of data infrastructure maturity:

  • Basic Data Lake deploys a governed data lake with built-in security controls, data quality checks, centralized metadata management using AWS Lake Formation and AWS Glue.
  • Data Science Platform extends the data lake with Amazon SageMaker notebooks, feature stores, and machine learning (ML) pipelines so data science teams can experiment and train models on governed data.
  • SageMaker Unified Studio adds a single interface for analytics and ML collaboration, connecting data engineers, analysts, and data scientists in one workspace.
  • Generative AI Platform layers Amazon Bedrock and Retrieval Augmented Generation (RAG) capabilities on top of your existing data foundation, so teams can build generative AI applications grounded in enterprise data.

Each pattern builds the one before it. You can start with the Basic Data Lake and adopt additional patterns as your team’s needs grow. MDAA’s modular design means you add capabilities without rearchitecting what you already deployed.

The infrastructure is versioned through GitHub, repeatable across environments, and auditable through comprehensive AWS CloudTrail logging. Data engineers focus on data pipelines and business logic while MDAA manages infrastructure complexity and governance integration. This represents the fundamental shift: from writing infrastructure code to describing the outcomes you want through configuration, with governance embedded from the start.

Use case of MDAA: Governed data architecture

DataOps teams spend significant time on governance tasks, including permissions management, compliance validation, and access control, rather than building pipelines and analytics. These aren’t data problems, they’re governance problems that consume engineering capacity meant for higher-value work. MDAA addresses this at the architectural level. Governance is declared in YAML and deployed alongside infrastructure from the first run.

The following sections walk through how each governance module works in practice.

Publish, discover, subscribe, and consume data products between business units: SageMaker Unified Studio

Amazon SageMaker Unified Studio provides a governed data catalog where data producers publish data products, and consumers discover and subscribe to them. Your deployment with MDAA includes a pre-configured domain, blueprints (managed and custom), projects, and environment profiles, all defined in a single configuration file:

# sagemaker.yaml --- 16 lines that deploy 114 CloudFormation resources
domains:
  domain1:
    dataAdminRole:
      id: ssm:/{{org}}/govern1/generated-role/data-admin/id
    description: SMUS Domain 1
    userAssignment: MANUAL

    tooling:
      vpcId: '{{context:vpc_id}}'
      subnetIds:
        - '{{context:private_subnet_id1}}'
        - '{{context:private_subnet_id2}}'

    groups:
      team1:
        ssoId: '{{context:team1-group-sso-id}}'
      team2:
        ssoId: '{{context:team2-group-sso-id}}'

Behind this configuration, MDAA deploys an Amazon SageMaker Unified Studio domain with dedicated KMS keys, execution and provisioning roles, and single sign-on group profiles for team access. Data producers tag and publish assets with metadata, ownership, and classification. Consumers browse a searchable catalog, see only authorized assets, and request access through a governed workflow. Cross-account and cross-business-unit data sharing flows through a subscription model, ensuring every access grant is tracked, auditable, and revocable.

Use case of MDAA: Restricting access to cardholder data using Lake Formation

AWS Lake Formation provides fine-grained access control at database and table levels, removing manual IAM policy management. MDAA deploys AWS Lake Formation with pre-configured settings that disable IAMAllowedPrincipals, the critical governance setting that ensures all permissions flow through centralized governance:

# lakeformation-settings.yaml --- 6 lines that deploy 25 CloudFormation resources
lakeFormationAdminRoles:
  - id: generated-role-id:data-admin
createCdkLFAdmin: true
createDataZoneAdminRole: true
iamAllowedPrincipalsDefault: false

That last flag is the single most important governance setting in the platform. Without it, an IAM principal with glue:GetTable can read tables in the catalog, bypassing the entire access control model. Most manual setups miss this or defer it.

With the data lake configuration, you declare roles and access policies in YAML where admins get full control, engineers get read access to curated data, extract, transform, and load (ETL) roles get scoped write access, and MDAA compiles them into the correct S3 bucket policies and Lake Formation registrations.

Use case of MDAA: Ensuring data integrity with AWS Glue Data Quality

AWS Glue Data Quality runs automated validation rulesets continuously as part of the pipeline, not as periodic batch checks. MDAA’s data quality module supports over 15 built-in rule types, from completeness and uniqueness checks to statistical thresholds and data freshness validation:

# data-quality.yaml
projectName: example-project

rulesets:
  customer-data-quality:
    description: Validate customer data completeness and uniqueness
    targetTable:
      databaseName: project:databaseName/customer-data
      tableName: customers
    ruleset:
      - ruleType: IsComplete
        column: customer_id
      - ruleType: Uniqueness
        column: email
        comparisonOperator: ">"
        threshold: 0.95
      - ruleType: RowCount
        comparisonOperator: ">"
        value: 100

Quality metrics flow into Amazon CloudWatch for real-time alerting. If anomalies are detected, automated workflows quarantine affected records and alert data engineering teams before issues reach downstream consumers.

Protecting metadata at rest: AWS Glue Data Catalog encryption

Table schemas, column names, and partition structures can reveal sensitive information about an organization’s data architecture, even without access to the underlying data. AWS Glue Catalog Encryption secures metadata at rest using AWS KMS-managed keys. MDAA configures catalog encryption by default, so schema definitions and connection passwords are encrypted from initial deployment without requiring manual key management setup. Access to catalog metadata follows the same Lake Formation governance controls applied to the data itself, so teams see only the schemas that they’re authorized to query.

Auditing every data access event: CloudTrail integration

Every data access event must be logged and attributable to a specific identity. Without a complete audit trail, demonstrating compliance during a regulatory review becomes a manual, error-prone process. AWS CloudTrail captures API-level activity across the data infrastructure, recording who accesses what data, when, and from which service. MDAA configures CloudTrail integration by default, so audit logging is active from initial deployment rather than added retroactively. Log data flows into a centralized, tamper-resistant store, giving compliance teams a single location to query access history across all business units and accounts.

Identifying sensitive data automatically: Macie integration

In large environments, sensitive information spreads across dozens of S3 buckets through pipelines, transforms, and ad hoc data drops, and self-reporting data owners consistently produce gaps. Amazon Macie uses machine learning to automatically discover and classify sensitive data in S3, surfacing findings at the object level without manual tagging. MDAA configures Macie across your S3 buckets during deployment, routing findings to Amazon EventBridge where automated workflows can alert owners or trigger remediation.

Together, these controls form a layered defense: Lake Formation governs access to cataloged data, Glue Data Quality validates integrity on arrival, and Macie identifies sensitive data that lands outside governed pipelines to reduce compliance risk.

Multi-account data mesh

MDAA provides extensive support for multi-account data mesh setups, with decentralized data ownership across business units and centralized governance. The data mesh starter kit supports cross-account data product publishing and consumption, allowing organizations to scale data sharing while maintaining consistent security and compliance controls.

Technical implementation

Ready to deploy your modern data architecture? Here are the resources to get started:

MDAA Implementation Guide provides detailed instructions for deploying all starter packages, including architecture patterns, configuration examples, security best practices, and troubleshooting guidance.

MDAA Hands-on Workshop offers step-by-step guided implementation with AWS experts. The workshop covers configuration management best practices, implementation patterns, hands-on labs with real-world scenarios, and cleanup instructions.

GitHub Repository and Documentation provide source code, module reference, and comprehensive documentation.

Organizations approach MDAA from different starting points. Some modernize existing data architectures, migrating from on-premises infrastructure or legacy cloud architectures. Others build new architectures for artificial intelligence and machine learning (AI/ML) initiatives or generative AI applications. Financial services organizations require PCI-DSS compliance from day one. Healthcare organizations need controls that can help support HIPAA. Each journey benefits from MDAA’s configuration-driven approach and embedded governance.

Conclusion

MDAA transforms data architecture development from months of manual coding to production-ready deployment. Configuration-driven infrastructure reduces development time by 40–60 percent while embedding governance from the start. The university system’s 95 percent reduction in time-to-value demonstrates the outcome: organizations deploy secure, compliant, governed data architectures in weeks rather than months.

Financial services organizations can deploy architectures to help them align with PCI-DSS compliance requirements using Lake Formation access controls, Glue Data Quality validation, SageMaker Unified Studio data discovery, comprehensive CloudTrail audit trails, and automated Macie data classification, all inherited from configuration rather than built manually.

Data architecture journeys need not follow six-month timelines with governance added incrementally. MDAA provides an alternative: describe the outcomes you want through YAML configuration, inherit pre-validated security controls, and deploy production-ready infrastructure with comprehensive governance from initial deployment.

Security and compliance is a shared responsibility between AWS and the customer. For more information, see the AWS Shared Responsibility Model.

Need help or have questions? Contact AWS ProServe for personalized guidance on selecting the right package and deployment strategy for your organization.


About the author

Sudeshna Dash

Sudeshna Dash

Sudeshna is a Data Scientist at AWS Professional Services based in Berlin, Germany. She specializes in data architecture, generative AI, and agentic AI systems on AWS. Sudeshna is a contributor to the Modern Data Architecture Accelerator (MDAA) open-source project and helps customers design and deploy governed, production-ready data and AI/ML architectures on AWS.

John Reynolds

John Reynolds is a Principal Engineer with AWS Professional Services based in Seattle, Washington. He leads the architecture and development of Modern Data Architecture Accelerator (MDAA), focusing on turning proven delivery patterns into reusable, production-ready foundations that customers can adopt and extend at scale.

Amazon Redshift RG: Faster and lower cost, Graviton-powered

Post Syndicated from Stefan Gromoll original https://aws.amazon.com/blogs/big-data/amazon-redshift-rg-faster-and-lower-cost-graviton-powered/

Amazon Redshift recently announced the general availability of a new Graviton-powered instance called RG. Built on Amazon’s own Graviton processors, RG delivers:

  • Up to 2.2x faster performance for data warehouse workloads compared to RA3.
  • Up to 2.4x faster for Iceberg queries and 1.5x faster for Parquet queries through an integrated vectorized data lake engine.
  • No per-TB scan charges for data lake queries, eliminating the Amazon Redshift Spectrum cost applied on RA3 clusters.
  • 30 percent lower cost per vCPU compared to RA3.

RG is both faster and cheaper. While cloud vendors typically charge more for faster performance or newer generation hardware, Amazon Redshift delivers better performance at lower cost.

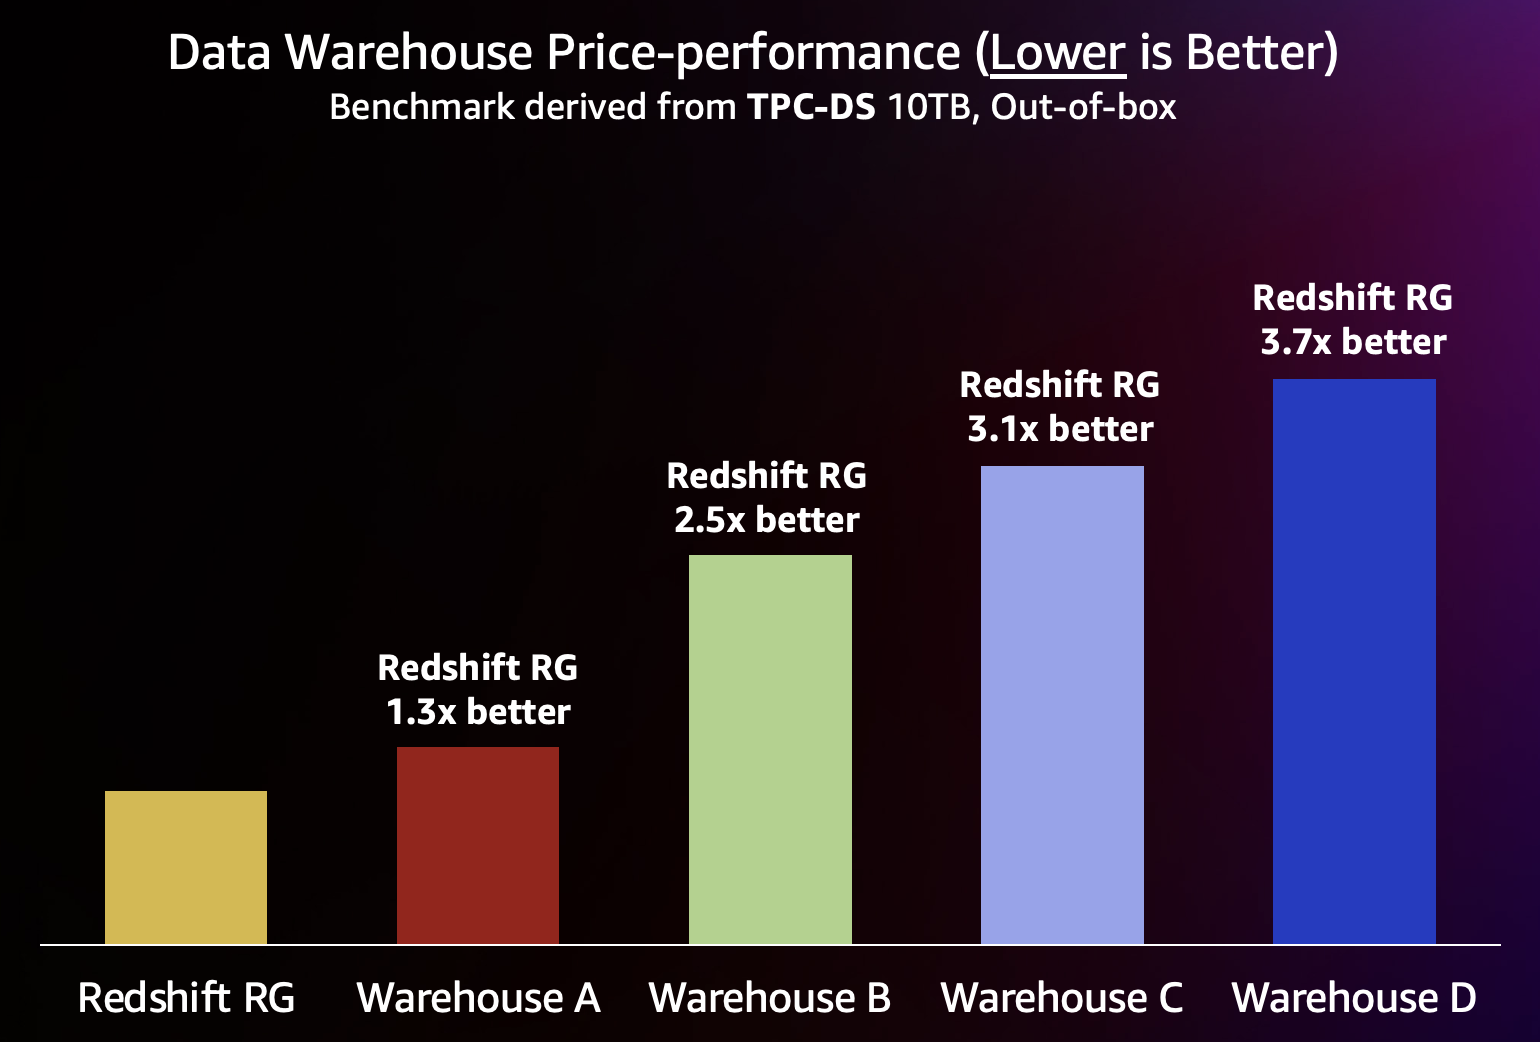
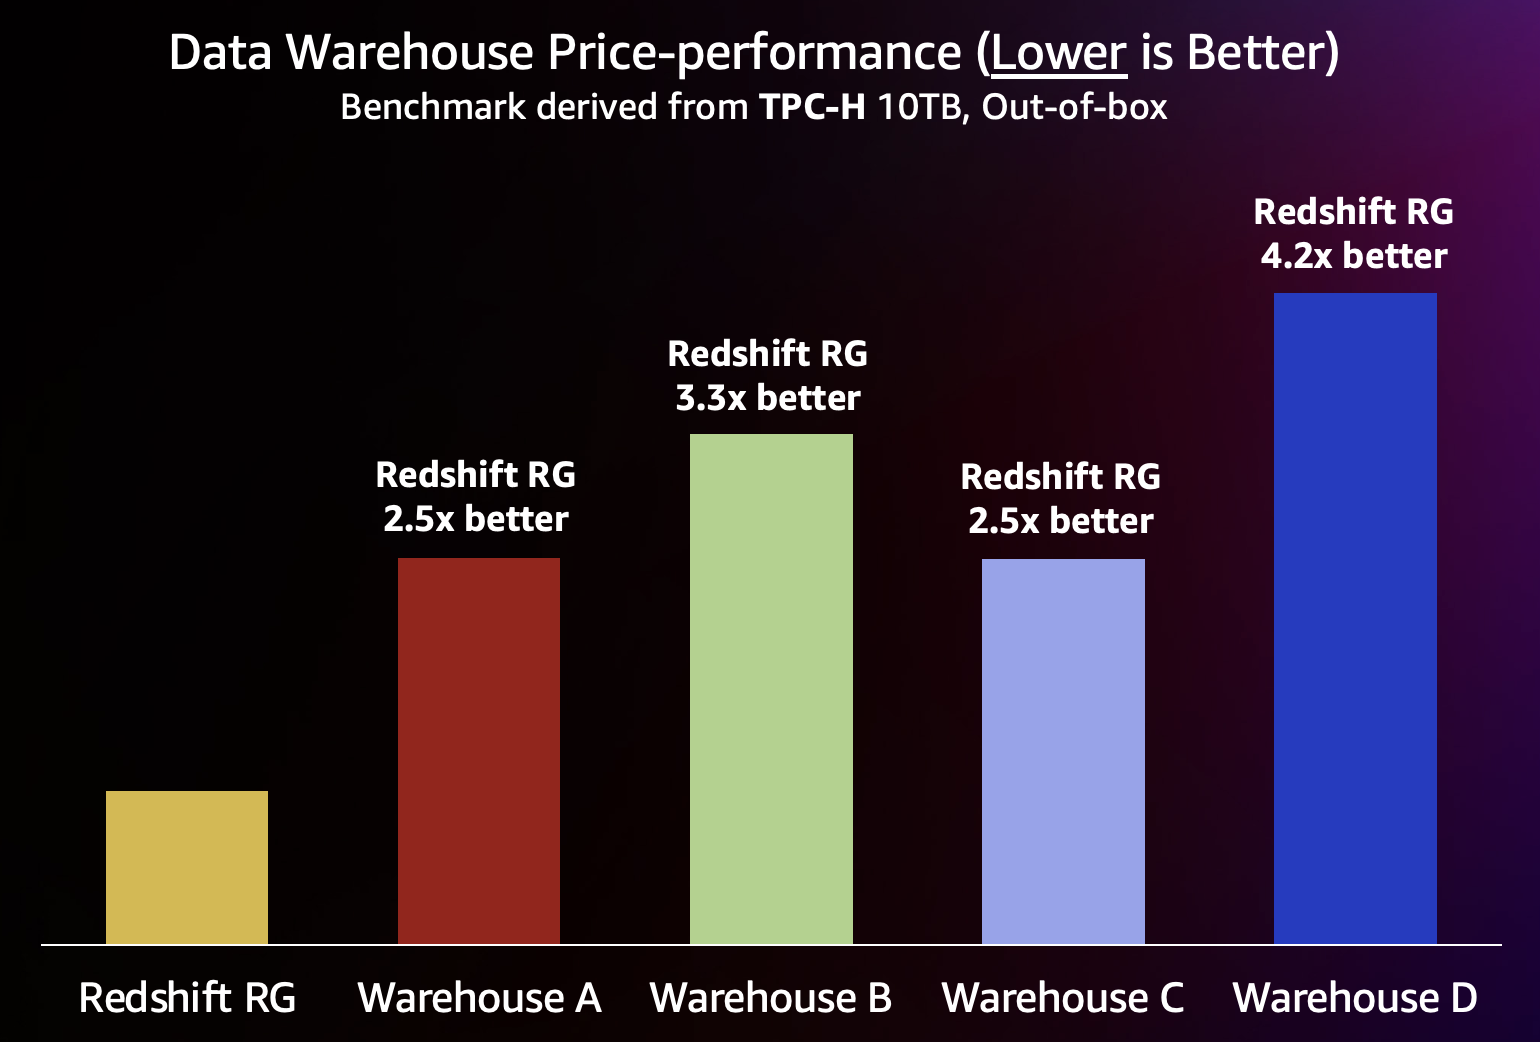
In this post, we describe the innovations that make RG instances so much faster. We also share benchmark results showing that RG delivers up to 4.2x better price-performance than other leading data warehouses.

What makes RG so fast

The new RG instances are built from the ground up to take advantage of Graviton processors. The vectorized engine of Amazon Redshift is optimized with Graviton-based single instruction, multiple data (SIMD) kernels to deliver accelerated, parallelized execution for analytics workloads. Operations like predicate evaluations over Parquet encodings use Graviton vector comparison, table lookup, and vector manipulation intrinsics. To support these increased processing speeds, RG instances use custom-built Nitro SSDs. This lets RG use faster local storage as a caching layer for Amazon Redshift Managed Storage (RMS), data lake scans, and intermediate result sets for computations that can’t fit in memory. RG’s JIT (Just-In-Time) Analyze feature also collects statistics from data lake files automatically as queries run, so the optimizer can produce significantly better query plans. Together, these represent innovation across the entire stack: hardware acceleration with Graviton, vectorized execution with SIMD kernels, high-speed storage with Nitro SSDs, and intelligent query planning with JIT Analyze.

These optimizations, coupled with RG’s purpose-built high-performance vectorized data lake engine, combine to make Amazon Redshift’s new RG instances up to 2.2x faster than RA3 for analytics workloads at 30 percent lower cost.

Purpose-built high-performance vectorized data lake engine

With RA3, data lake queries offloaded scans to a separate compute fleet known as Amazon Redshift Spectrum. Because data lake queries ran on this separate compute, additional overhead was introduced to transfer query metadata and results between RA3 clusters and the Spectrum fleet. Amazon Redshift RG instances include a completely new built-in scan layer designed from the ground up for data lakes. This new scan layer includes a purpose-built I/O subsystem that incorporates smart prefetch capabilities to reduce data latency. The new scan layer is also optimized to process Apache Parquet files, the most commonly used file format for Iceberg, through fast vectorized scans that use SIMD kernels optimized for Graviton. The scan layer includes sophisticated data pruning mechanisms that operate at both partition and file levels, which significantly reduces the volume of data that needs to be scanned. This pruning capability works with the smart prefetch system to create a coordinated approach that maximizes efficiency throughout the entire data retrieval process.

The new purpose-built vectorized data lake engine is up to 2.4x faster than RA3 for Iceberg queries and 1.5x faster than RA3 for Parquet queries.

Because this new vectorized data lake engine integrates directly with the core execution engine of Amazon Redshift, new performance optimizations are possible compared to RA3. With this architecture, data lake queries on RG now benefit from fast local data caching, improved bloom filters, vectorized Parquet scans, and advanced filtering and pruning.

RG also solves a common problem customers face when querying data in the lake: open-format files like Iceberg in Amazon Simple Storage Service (Amazon S3) often lack useful metadata and statistics, which makes it difficult to run a SQL query optimally.

Statistics are metadata about your data, such as distinct value counts, min/max values, distribution patterns, and row counts. The query optimizer uses this information to choose the most efficient way to run a query. For example, when joining two tables, the optimizer needs to know how many unique values each side produces to pick the right join strategy. Without statistics, it has to guess, which often leads to slower joins and unnecessary data movement across nodes. This is where Amazon Redshift’s new feature called JIT (Just-In-Time) Analyze comes in. RG instances automatically fetch and store statistics of your Iceberg files as queries run, so Amazon Redshift can choose query execution strategies that are far more optimized than it could without these statistics.

These improvements make scans of Iceberg and Parquet data much faster than RA3. Removing Amazon Redshift Spectrum compute also means RG instances remove the $5/TB cost for data lake queries, which makes data lake queries cheaper and costs predictable. This is a triple win for data lake price-performance: faster performance, lower compute cost, and no per-TB scan cost.

Faster insights from faster data loads

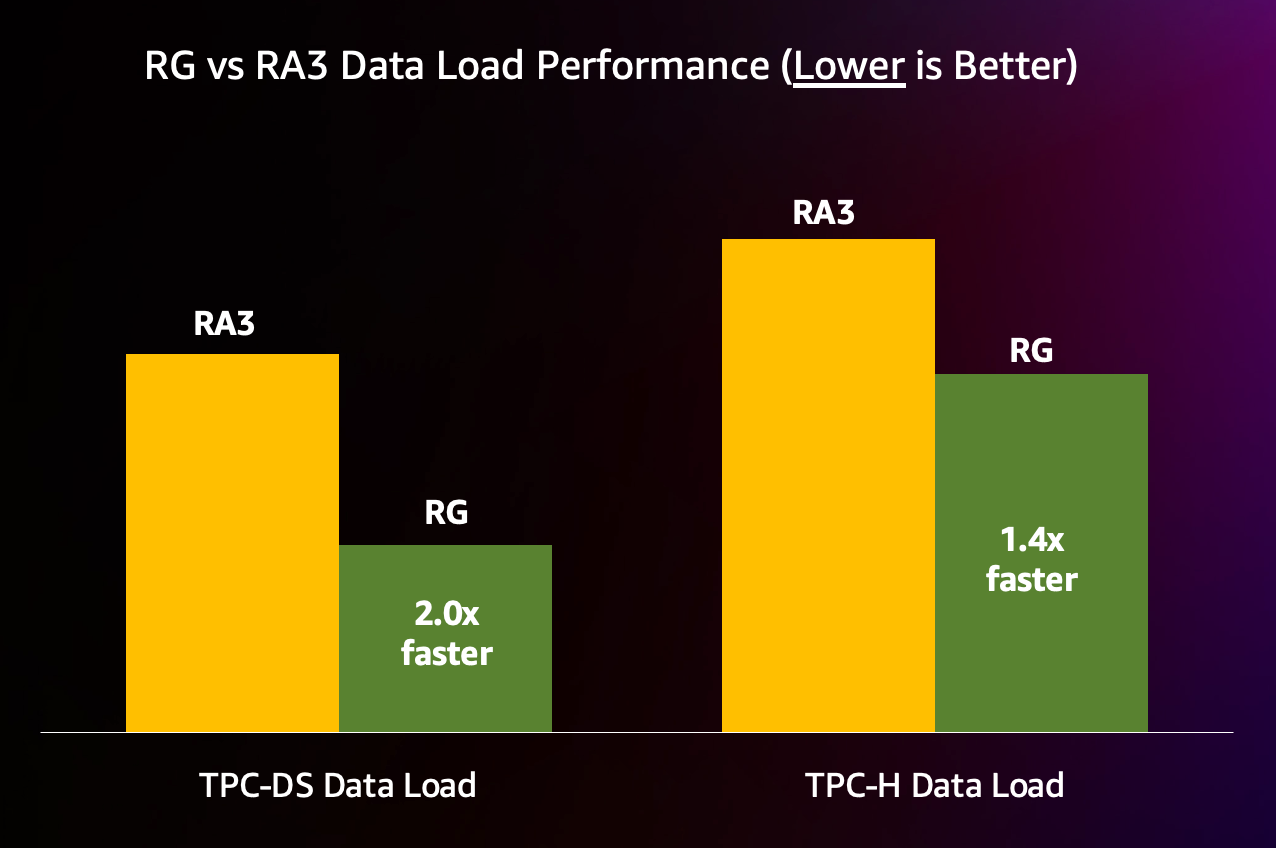
Amazon Redshift RG’s fast I/O and Graviton-optimized engine result in faster data loads compared to RA3. To measure this improved performance, we ran the data ingestion step of 10TB TPC-DS and TPC-H on equivalently sized RA3 and RG clusters. RG ingested the TPC-DS dataset 2x faster and the TPC-H dataset 1.4x faster, as shown in the following figure.

Bar chart comparing data ingestion time on RA3 and RG, showing RG loads TPC-DS 2x faster and TPC-H 1.4x faster

The new Graviton-based RG instances are up to 2.0x faster for data loads compared to RA3 instances. This means workloads can see the latest data sooner, and users and agents can get up-to-date insights faster. This faster ingestion on RG comes at 30 percent lower cost compared to RA3, resulting in up to 2.9x better price-performance for data loads compared to RA3 instances.

What customers are saying

Amazon Redshift customers are already seeing performance and cost benefits of switching to RG. Southwest Airlines and tombola tested their business-critical workloads, and found they could get better performance and save on cost:

Southwest Airlines

“Amazon Redshift RG instances have the potential to deliver meaningful business impact for Southwest Airlines. Based on initial testing in our development environment, our data warehouse workloads run 50–60% faster, and data lake analytics are 45% faster—enabling teams to get insights sooner, respond to operational conditions faster, and make data‑driven decisions with less latency. These early results are encouraging, and we are excited to validate and scale these improvements in production. All of this comes without per‑terabyte Spectrum scanning charges, delivering 30% lower cost than RA3 at a time when fuel prices continue to pressure industry margins!!”

— Sean Lynch, Vice President, Data and Architecture, Southwest Airlines

tombola

“The new Graviton-based Amazon Redshift RG instances delivered 1.8x–2x faster write throughput and up to 2.2x faster read speeds compared to RA3 across a diverse set of batch and analytical jobs — enabling us to process 40% more within the same window. Compressed ETL cycles, accelerated time-to-insight, and decision-making no longer bottlenecked by the pipeline — together, these translated directly into fresher data reaching our analysts and business teams sooner. What made this even more compelling was a concurrent 30% reduction in compute spend alongside the gains — delivering more for less is a rare outcome, and one worth highlighting. In a volume-heavy gaming industry at tombola, where query latency and cost compound at scale, this has been one of the more impactful platform decisions we’ve made this year.”

— Akshay Srinivasan, Data Engineer, tombola

Qoala

“After migrating our Amazon Redshift cluster from RA3 to the new Graviton-based RG instances, we saw 60–70% faster query processing times across our BI and analytics workloads. As a growing insurtech platform handling millions of policy transactions, faster time-to-insight means our data team can deliver dashboards and reports to the business sooner. We moved to a larger node configuration to accommodate future growth, and the performance gains far exceeded the incremental investment – making this one of the most impactful infrastructure decisions we’ve made this year.”

— Umar Abdul Aziz, VP of Data, Qoala

Performance results

To see how RG stacks up, we ran benchmarks derived from the industry-standard TPC-DS and TPC-H benchmarks at 10TB scale on the new Amazon Redshift RG instances and on leading alternative data warehouses. These benchmarks are designed to run queries of various operational requirements and complexities, such as ad hoc, reporting, iterative online analytical processing (OLAP), and data mining. We sized each data warehouse at approximately the same on-demand cost ($32/hr) and ran three power runs of each benchmark out of the box, with no special tuning or manual customization. The results are shown in the following charts.
Bar chart of TPC-DS 10TB price-performance showing Amazon Redshift RG leading alternative data warehouses

Bar chart of TPC-H 10TB price-performance showing Amazon Redshift RG leading alternative data warehouses

The new RG instance leads, and by a large margin. Better price-performance means better performance and lower cost.

Conclusion

Amazon Redshift RG instances are the next generation of analytics engine, delivering high performance for data warehouse and data lake workloads. Because RG supports all the same workloads and features as RA3, getting started is straightforward. See our migration guide for how to upgrade and start getting better performance at lower cost.

Find the best price-performance for your workloads

The benchmarks used in this post are derived from the industry-standard TPC-DS and TPC-H benchmarks, and have the following characteristics:

  • We use the schema and data unmodified from TPC-DS and TPC-H.
  • The queries are generated using the official TPC-DS and TPC-H kits with query parameters generated using the default random seed of the kits. TPC-approved query variants are used for a warehouse if the warehouse doesn’t support the SQL dialect of the default queries.
  • The test includes the 99 TPC-DS SELECT queries and 22 TPC-H SELECT queries. It doesn’t include maintenance and throughput steps.
  • Three power runs were run, and the best run is taken for each data warehouse.
  • Price-performance is calculated as the cost per hour (USD) divided by 3,600 seconds/hour times the benchmark geomean in seconds, which is equivalent to the geomean cost per query. The latest published on-demand pricing is used for all data warehouses.

We call this the Cloud Data Warehouse benchmark, and you can reproduce the preceding benchmark results using the scripts, queries, and data available in our GitHub repository. It’s derived from the TPC-DS benchmarks as described in this post, and as such isn’t comparable to published TPC-DS results, because the results of our tests don’t comply with the official specification.

About the authors

Stefan Gromoll

Stefan Gromoll

Stefan is a Principal Engineer with the Amazon Redshift team where he is responsible for Redshift performance. In his spare time, he enjoys cooking, playing with his four boys, and chopping firewood.

Ankit Sahu

Ankit Sahu

Ankit brings over 18 years of expertise in building innovative data products and services. His diverse experience spans product strategy, go-to-market execution, and digital transformation initiatives. Currently, as Sr. Product Manager at Amazon Web Services (AWS), Ankit is driving the vision and strategy for Amazon Redshift.

Mohammed Alkateb

Mohammed Alkateb

Mohammed is an Engineering Manager at Amazon Redshift, leading Software Engineers, Applied Scientists, and Amazon Scholars across query optimization, data lake access, performance engineering, and new instance qualification. Prior to Amazon, he spent over 12 years with the Teradata Optimizer team. Mohammed holds a PhD from The University of Vermont and has many US patents and publications in premier database conferences.

Yousuf Hussain

Yousuf Hussain

Yousuf is a Senior Software Engineer at Amazon Redshift with 11 years of experience in building and operating large-scale cloud data warehouse systems. He is passionate about analytics and focuses on instance strategy, availability, and reliability to deliver a performant experience for Amazon Redshift customers.

Nita Shah

Nita Shah

Nita is a Sr. Analytics Specialist Solutions Architect at AWS based out of New York. She has been building enterprise data platforms, data warehousing, and analytics solutions for over 20 years and specializes in Amazon Redshift. She is focused on helping customers design and build enterprise-scale well-architected analytics and decision support platforms.

Sanket Hase

Sanket Hase

Sanket is an Engineering Manager with the Amazon Redshift team, where he leads query execution teams focusing on data lake analytics, hardware-software co-design, and vectorized query execution. Sanket holds a Master’s in CS from Carnegie Mellon University and has several U.S. patents in the field of database systems

Jingbo Zhang

Jingbo Zhang

Jingbo is a Data Engineer at Amazon Redshift focused on new instance qualification and performance validation. She has contributed to the qualification and launch of multiple Graviton-based Redshift instance families, including RG, r8gd, and r7gd, with a focus on benchmarking, performance analysis, and automation. Jingbo holds a master’s degree in data Analytics from Carnegie Mellon University.

Spoofed email from LWN

Post Syndicated from jzb original https://lwn.net/Articles/1081012/

We were made aware today of an email sent to a reader that was
spoofed to appear to be from LWN. The message claimed, among other
things, that we were providing personal information about the reader
to another site user. As is explained in our privacy policy we do not,
and would not, provide such information.

If any other readers have received an odd message from LWN, it is
an attempt at a hoax; if in doubt, please check the DKIM header of the
email. Any email that does come from LWN will have a proper DKIM
signature in its headers.

If you receive such a message, please feel free to send it to us,
with its headers intact. But to reiterate, we are not providing any
user information upon request, nor banning any accounts. We hope this
will not be a recurring problem.

Fedora Council proposes pausing Community Initiatives

Post Syndicated from jzb original https://lwn.net/Articles/1081013/

Aoife Moloney has, on behalf of the Fedora Council, posted an
announcement
that the Fedora Council is “proposing we pause the
Community Initiatives process as an official project process
”
because it has decided the current process is ineffective. It is also
closing discussion regarding the AI developer desktop
initiative
covered by LWN in May.

The Fedora Objectives/Initiatives framework was never intended as a
mandatory prerequisite to do the work in Fedora. It supposed to help
by focusing the community on a certain work when needed, not to decide
what is allowed. The AI developer desktop initiative proposal
highlighted that the Community Initiatives process has failed to serve
as a good framework in Fedora where new ideas can surface, receive
respectful feedback, and gain Council support for work that fits the
project’s present and/or future. This is something that the Council
must address.

As a first step, we would like to halt the community initiative
process immediately. Existing initiatives in flight (Fedora Forge,
Atomic, and Fedora Docs 2026) will continue with full Council
backing. Their underlying work will be completed as planned in their
current timeboxed state, though the administrative framework around
them may evolve.
As a second step, we would like to work out a new mechanism to allow
Council to set strategic direction in an open, transparent way that
more intentionally includes the community voice. We recognise that we
have to be better at being more open in our discussions and decision
making.

The council is considering the “sandbox” proposal as an
alternative or supplement to a process that replaces the Community
Initiatives.

Защо германските домове нямат климатици?

Post Syndicated from Светла Енчева original https://www.toest.bg/zashto-germanskite-domove-nyamat-klimatitsi/

Защо германските домове нямат климатици?

Северозападна Германия в края на юни, 22:30 ч. И без това слабата вентилация в пицарията секва. От клиентите започва да се лее пот и те бързо схващат, че с изключването на прохладата от заведението деликатно им намекват, че е време да си ходят. Навън вече почти се е стъмнило, но е все така горещо, а от минувачите също се лее пот. Когато се прибирам, минава 23 ч. Датчикът за измерване на температурата на балкона показва близо 34 градуса, а вътре е 31,5. Толкова горещо остава в стаята до сутринта. Изритвам завивката си и пак не мога да заспя. След няколко часа се унасям, гушнала два охладителя за хладилна чанта, пъхнати в хавлиени чорапи.

„Сложете си климатик“, биха казали повечето хора в България.

В Германия обаче са климатизирани магазини (но не всички), търговски центрове, някои офиси и все повече средства на обществения транспорт (отново – не всички). Но за десетте години, през които редовно съм посещавала различни райони на тази страна, не съм виждала външно тяло на климатик на прозорец. Според публикация на Deutche Welle около 6% от домакинствата в Германия разполагат с централни охладителни системи (което е различно от познатите ни климатици във всяка стая и е интегрирано в конструкцията на цялата сграда). А според ZDF едва 4,3% от новите жилищни сгради имат охладителни системи.

Климатиците не са забранени, но…

На теория е възможно в Германия да си купите климатик и да извикате сертифицирана фирма, която да ви го монтира. Ако опитате обаче, ентусиазмът ви бързо ще бъде попарен. Независимо дали живеете под наем, или в собствено жилище.

Голяма част от хората в Германия живеят в многофамилни сгради под наем.

Какво трябва да направите, ако сте един от тях и искате климатик? Разбира се, трябва да получите разрешение от наемодателя си. В противен случай нарушавате Гражданския кодекс, според който нямате право да извършвате подобни реконструкции на своя глава. Жилището ви може да се притежава както от частно лице, което е купило конкретния апартамент, така и от фирма (или пък много богата личност), притежаваща цялата сграда или дори повече сгради в района.

Да кажем, че собственикът на квартирата ви притежава само едно жилище в сградата (вашето). Първо трябва да го убедите да направи сериозна и трайна инвестиция в имота си, а това не е лесна задача. Дори да допуснем, че успеете, идва следващото препятствие:

монтирането на климатик засяга фасадата на сградата.

И тук вече идва отговорността на самия собственик, която пък се регулира от Закона за собствеността върху жилищата. От него става ясно, че ако притежавате жилище, ваша е само вътрешността му. Фасадата, покривът и носещите стени са обща собственост. Ако искате да правите промени по тях, трябва и останалите собственици на сградата да са съгласни. А е много вероятно те да решат, че им е шумно и/или грозно, въпреки че и на тях им е горещо.

Архитектура и градски политики. Три урока от Америка

Проблемни градски центрове, нужда от повече качествени жилища, нечувствителност към климатичните промени – това са трите предизвикателства, пред които са изправени американските градове според Анета Василева. Вървим ли и ние по същия път?

Ако цялата сграда, в която живеете, се притежава от една фирма или едно лице, също не е много вероятно собственикът ѝ да се съгласи да предприеме такава инвестиция, дори това да означава после да качи наемите (което нормално се случва след ремонти и саниране на сгради). От икономическа гледна точка засега екстремно горещите дни в Германия все още не са толкова много, че да оправдават подобни сериозни интервенции в сградата. Хората могат да се облекчават в жегите с по-неинвазивни, макар и не толкова ефективни средства – вентилатори, мобилни климатици или просто пиене на повече течности.

Още по-сложно става, ако сградата, в която живеете, е старо строителство.

В този случай не би помогнало дори съгласието на собствениците да се монтират климатици на фасадата ѝ, която е към улицата. Такива сгради често са паметници на културата, а климатиците биха нарушили историческия характер на градската среда. Собствениците им дори нямат право да сменят старите им дървени дограми с по-модерни, енергийно ефективни и шумоизолиращи.

На подобно място в берлинския квартал „Фриденау“ – много красива червена къща на 5–6 етажа с високи тавани – прекарах близо месец преди осем години. Откъм вътрешния двор дограмите бяха сменени, но откъм улицата, където беше и моята стая, прозорците бяха като в несъществуващата вече къща на баба ми във Видин. В берлинската стая температурата не надвишаваше 20 градуса (навън денем беше около 25), а аз непрекъснато зъзнех и се разболях. („Да ти дадем още едно одеяло, но вече си имаш три“, ми каза стопанката на дома, до чийто ум така и не стигна, че всъщност я моля за печка.)

Тогава разбрах по трудния начин, че културното наследство си има цена; и че част от нея може да е личният комфорт.

Фасадите като елемент от общественото пространство

Постепенно стигнахме до темата за градската среда. Не само в Германия, а и в повечето западноевропейски страни на фасадата на една сграда се гледа не само като на частна собственост, а и като на елемент от средата. Затова интервенциите в нея подлежат на различни регулации.

При посещението си в България моя позната италианка непрекъснато изпадаше в културен шок при вида на жилищните сгради – саниранията и остъкляванията на парче, климатиците, монтирани на най-разнообразни места… В Италия, рече тя, това не може да се случи, защото фасадата е част от градската среда.

Архитектура и климатични промени: От Венеция, през Атланта, до Ню Йорк

Незапомнени жеги, последвани от бури, порои, урагани и тайфуни с повече или по-малко нежни имена. Светът, какъвто го познаваме, се търкаля с нарастващо ускорение към екологична катастрофа. Каква е реакцията на съвременната архитектура?

Не само климатици не можете да видите по германските фасади.

Малко вероятно е да попаднете и на различен модел или цвят дограма (санирането „на парче“ изобщо не го коментирам). За елемент от фасадата се смятат и външните щори. И в Германия е обичайно, ако на една сграда са монтирани външни щори, всички те да изглеждат еднакво. Понякога това важи за няколко сгради в близост (което не е учудващо, ако имат общ собственик).

В България всеки може да си сложи климатик, ако има пари за това, но липсата на регулация е израз не на последно място на тукашното отношение към частната собственост – „моето си е мое и ще си правя с него каквото си искам“.

Тази житейска нагласа обаче е типична повече за Дивия запад,

отколкото за европейска държава, в която съществува баланс между индивидуалната свобода и общественото благо. Заради безотговорното отношение към частната собственост, толерирано и от държавата, не само фасадите в България изглеждат по специфичния си начин. Застрояват се крайбрежия и паркове, а публичната инфраструктура (обществен транспорт, вкл. железопътна мрежа, пешеходни зони, велосипедни алеи и пр.) е зле. Всичко в името на собствениците – на земя, на имоти, на автомобили и т.н.

Климатиците и климатът

„Климатиче, нещо?“ – реагира позната, емигрантка в САЩ, на оплакванията ми от северногерманската жега. „Климатик за онези горещи три дни в годината просто не си струва“, отговори ѝ друга позната, живееща в Берлин. „А в живота на печеното пиле това [печенето – б.а.] продължава около половин час“, репликира приятел, пребиваващ през по-голямата част от годината в Гърция. „Направо се почувствах късметлийка, че в България си имаме климатици навсякъде“, възкликна пловдивчанка.

Тези реплики всъщност доста добре изразяват преобладаващите нагласи на жителите на съответните държави.

И все пак в Германия промените в климата са все по-често тема не само в новините, а и във всекидневните разговори между хората.

Жегите, които до неотдавна може да са били „три дни в годината“, вече траят със седмици. А в Северозападна Германия, където климатът е близък до нидерландския (с меки зими и хладни лета) и местните почти не са виждали сняг, все по-често снеговалеж блокира влаковете, а през последните зими се образуваха и поледици.

Gen Z и промените в климата. Защо младите хора са все по-ангажирани със зелените политики

Как ще се почувства едно дете, ако в училище му кажат, че питейната вода на планетата ще свърши, преди да навърши 50 години? Теодора Станимирова познава усещането от личен опит. Днес тя разговаря с младежи от своето поколение, ангажирани със зелени политики, и ни разказва какво е научила.

Като цяло обаче температурите се покачват. Ако преди около век средните годишни температури във федералната провинция Северен Рейн-Вестфалия са били 8–9 градуса, в последните години стигат 11, научих от изложба в Zeche Zollverein в Есен (бивша мина, днес музей и част от културното наследство на ЮНЕСКО). А от края на XIX век до днес са се повишили с над 4 градуса.

Затова темата за климатиците все по-често излиза на дневен ред. Вече става ясно, че ако на този етап справянето с жегите може да е с подръчни средства в домовете и с „жегави ваканции“ (Hitzefrei) в училищата, в обозримо бъдеще ще трябва да се търсят трайни решения. Особено на фона на смъртните случаи заради високите температури в съседна Франция, които за около една седмица надвишават 1000. Вметката, че пилето се опича за половин час, вече не звучи смешно. И за по-малко от половин час може да се спомине човек от жегата, особено ако е възрастен и/или с крехко здраве, или ако потърси разхлаждане във водоем, без да може да плува добре.

Но понеже става дума за Германия, решението трябва да е и устойчиво.

Що се отнася до градската среда, това означава намиране на общи решения за инсталирането на климатици и климатични/охладителни системи, които не дразнят окото на минувачите. Ако може изобщо да не се виждат, би било най-добре.

По-сериозният проблем обаче е свързан с екологичната устойчивост. Защото климатиците, които инсталираме, за да се справяме с последствията от глобалното затопляне, на свой ред допринасят за увеличаването му.

Затова в Германия се предпочитат по-екологични алтернативи. Например проектиране на т.нар. пасивни сгради – които се терморегулират сами, без външни енергийни източници, термопомпи, затревяване на покривите и т.н. Тези мерки обаче са възможни само при нови сгради. А какво да се прави с вече построените?

На този етап експертите препоръчват отново предимно пасивни мерки и настояват, че климатиците трябва да са последното възможно решение. Например добра изолация, проветряване, зеленина отвън. Обсъждат се и начини за ограничаване на вредното въздействие на климатиците – например ако са свързани със слънчеви колектори, за да се харчи по-малко конвенционална електроенергия. Или ако отделят по-малко вещества, които усилват парниковия ефект. В краен случай – климатиците (доколкото изобщо ги има) поне да не се настройват на температура, по-ниска от 26 градуса.

Междувременно хората в Германия оцеляват от жегите с подръчни средства.

Тези средства може и да не загрозяват градската среда, но енергийната ефективност на някои от тях е по-ниска, отколкото на един качествен конвенционален климатик. В магазините за техника например все повече се търсят мобилни климатици, които работят на отворен прозорец (или врата към балкон), откъдето да излиза тръбата. Така се губи енергия, а помещението се охлажда едва с два-три градуса. Други продължават да разчитат на любимото на германците проветряване (което в жегите, казвам от опит, не помага особено). Не след дълго вече ще е наложително да се намери приемливо решение. И то едва ли ще е идеалното.

П.П. Прогнозата за днес беше, че следобед ще има буря. Исках в края на тази статия да напиша „заваля и разхлади“. Но уви – вече е вечер, а капка не е капнала. И вън, и вътре температурата е малко над 31 градуса. Но поне има някое и друго облаче и се усеща деликатен намек за прохлада.

Между лекарствата и играчките – да избягаме от медицинския модел

Post Syndicated from Надежда Цекулова original https://www.toest.bg/mezhdu-lekarstvata-i-igrachkite-da-izbyagame-ot-meditsinskiya-model/

Между лекарствата и играчките – да избягаме от медицинския модел

В България под „палиативни грижи“ все още се разбира „да облекчим болката на умиращия“. А те са това, но и много повече. Липсата на достатъчно разбиране какво представляват съвременните палиативни грижи, ни пречи да ги осигурим в добро качество за всички, които се нуждаят от тях, включително за децата. 

Въпреки това на отделни места в България отделни специалисти и организации се опитват да прилагат практики, които в развитите системи се приемат за същност на палиативните грижи – облекчаване на ефектите на симптомите и подкрепа за повече радост за тези, чийто живот се очаква да продължи кратко.

Едно такова място открихме в Русе.


Ида* е на пет години и живее в Центъра за настаняване от семеен тип за деца и младежи с увреждания с потребност от постоянна медицинска грижа в Русе. 

Успяхте ли да прочетете цялото име на мястото?

Запомнете го, защото ще ни трябва по-късно в този текст. Но сега да се върнем към Ида. Запознах се с нея, когато една неделя през май пристигнах в Центъра, част от Обединени детски услуги „Слънчо“. 

Ида е с тежка диагноза и множествени увреждания. Почти неподвижна е, няма когнитивни способности, храни се със сонда и екипът споделя, че тя е „най-тежкото им дете“, макар да изглежда мъничка и крехка като капка. 

Докато ми показват стаите и ми разказват за децата, директорката Милена Неделчева намества момиченцето в леглото му и го пита: „Защо си тъжна днес?“ Телцето на Ида не функционира правилно и лекарите не могат да ѝ помогнат. Тя не може да отговори и дори не е сигурно доколко има съзнание за тъгата си. Но тъгата е там. Една от задачите на екипа е да се опитва да лекува поне нея. 

Просто добави радост. Какво са съвременните палиативни грижи за деца

Разполагаме със здравна система, която все още не успява да се пречупи така, че да осигури детство там, където заболяването е отнело почти всичко друго. Как изглеждат детските палиативни грижи в България? Първи текст от новата поредица на Надежда Цекулова за детските палиативни грижи.

Ида е едно от децата и младежите в Центъра, които получават палиативни грижи, макар на хартия да не са наречени така. 

Децата в България, които биха получили услуги от спектъра на палиативните грижи, ако те бяха регламентирани, вероятно са около 5000. Числото е екстраполирано от данните на други държави в първия анализ и картиране на нуждите от палиативни грижи за деца у нас, изготвени през 2018 г. от екипа на „Ида – фондация за палиативни грижи за деца“. 

Посетих Центъра в Русе, управляван от Сдружение „Еквилибриум“, в търсене на отговор на въпроса какво наистина става у нас в момента с децата с множествени увреждания и очаквана съкратена продължителност на живота. Това, което видях, не е представителна извадка за системата, а моментна снимка на един конкретен екип и неговите усилия в грижите за конкретни деца през май 2026 г. Просто защото „система“ по отношение на детските палиативните грижи липсва.

В Центъра са настанени осем деца (колкото е капацитетът му), от които две са вече пораснали младеж и девойка. От създаването на услугата през 2016 г. до момента през нея са преминали около 45 деца, като повече от половината или са върнати в семействата им след работа с родителите, или са настанени в приемна грижа. Екипът се радва особено много на няколкото успешни осиновявания въпреки здравословното състояние на децата. 

След като през 2010 г. с Националната стратегия „Визия за деинституционализацията на децата в Република България“ е планирана реформата, целяща да се закрият всички институции за деца, посоката е да се създаде широка палитра от услуги, които трябва да помогнат на семействата в риск да останат с децата си. 

При децата с най-тежки увреждания обаче това все още е труден процес: от една страна – заради липса на достатъчно подкрепа за семействата, от друга – заради страх и отдръпване на самите биологични родители. 

Едно от местата, където тези деца могат да попаднат, е именно Центърът в Русе. Елена Петкова, програмен директор на „Еквилибриум“, използва във всекидневния си речник фразата „пемегето“. Изразът идва от абревиатурата на „постоянна медицинска грижа“ – ПМГ, устойчиво словосъчетание, съдържащо се в наименованието на този тип малки резидентни услуги за деца. У нас в момента функционират „осем плюс шест“ такива центъра. 

Големият отсъстващ. Детските палиативни грижи в публичните политики и в публичния дебат

Детските палиативни грижи в България остават почти невидими – и в законите, и в обществения разговор. Политиките свеждат темата до болници и терминални състояния, а медиите рядко говорят за качество на живот, достойнство, радост и игра. Цената я плащат децата и семействата им. От Надежда Цекулова.

„Тези, които аз наричам „старите осем“, са пилотните осем центъра“, казва Елена. Те се отварят в сградите на закритите в първите години на реформата домове за медико-социални грижи за деца в Русе, Търговище, Габрово, Монтана, София, Перник и в два в Пловдив. Попадат под шапката на Министерството на труда и социалната политика и се финансират по реда на Закона за социалните услуги. 

По-късно се появяват и „новите шест“ центъра за деца от същата група. Те са в Кърджали, Хасково, два в Стара Загора и два в Казанлък, но вече са под шапката на Министерството на здравеопазването (МЗ) и са разкрити по реда на Закона за лечебните заведения. 

Така, обяснява Елена Петкова, една и съща целева група деца попада в сходни услуги, но регламентирани и финансирани по различен ред. Формалното наименование на социалната услуга е Център за настаняване от семеен тип за деца и младежи с увреждания с потребност от постоянна медицинска грижа – ЦНСТДМУПМГ. А Центърът за комплексно обслужване на деца с увреждания и хронични заболявания – ЦКОДУХЗ, е с различен тип структура: лечебно заведение към МЗ, което може да предоставя медицинска помощ, рехабилитация, обучение на родители, мобилна подкрепа и специализирани палиативни грижи. 

Проблемът според Елена е, че реформата създава на хартия „интегрирани“ услуги, но невинаги реално интегрира здравната и психосоциалната грижа. По думите ѝ, вече е необходимо не просто закриване на последните домове за деца с увреждания, а въвеждане на общ стандарт и кръстосано финансиране, така че децата с тежки увреждания да получават еднакво качество на грижа, сигурен достъп до медицинско обслужване и психосоциална подкрепа, независимо дали услугата е към социалната, или към здравната система.

„Може да имаме, може и да нямаме“

Екипът на „Еквилибриум“ непрекъснато фондонабира, защото заплащането, което получава от държавата за дейността си, не би стигнало за грижа според най-добрите практики. 

Често децата имат нужда от специфични лекарства или от помощни средства. Менютата са индивидуални, а е имало и период, в който в Центъра са се грижили едновременно за две деца с нужда от скъпи медицински храни, които към онзи момент не са се заплащали от държавата. Дарители помагат и за играчките, за освежаването на обстановката, за разнообразието от помощни средства, за да може всяко дете да бъде максимално активно според възможностите си. 

Две от децата посещават масова детска градина въпреки проблемите си, а останалите се срещат с други деца по време на заниманията в дневния център, поддържан от същата организация. Част от екипа са и подкрепящите специалисти – логопед, психолог, рехабилитатор, – които работят както с деца, отглеждани в семействата им, така и с дълготрайно настанените.

Въпреки че не е лечебно заведение, в Центъра винаги има медицинска сестра на смяна и договор с педиатър. Един от най-важните хора в мрежата от специалисти е педиатърката д-р Веска Христова. Елена Петкова уточнява, че „по методика може да имаме, може и да нямаме“ такъв лекар и повечето подобни центрове всъщност нямат собствен педиатър на разположение. Д-р Христова не е в услугата от 8 до 5 ч., но е „на телефон и на разположение нонстоп“, идва по график, проследява децата, обучава персонала и реагира при тежки ситуации. „Имали сме много критични моменти с деца“, разказва директорката Милена Неделчева.

Как да говорим за деца с тежки заболявания. Право, етика и човечност

Публичният разговор за тежко болните деца често се движи между две крайности – патетична жалост и почти пълно мълчание. Там някъде са и самите деца и семействата им. Как да се говори за страдание, без то да се превръща в сюжет? От Надежда Цекулова.

Другият постоянен партньор е УМБАЛ „Канев“ в Русе. По думите на Елена, методиката предвижда специалист от областната болница да има преки ангажименти с децата в услугата – да участва в оценките за настаняване, да проследява състоянието им и да съдейства при нужда от болнична помощ. В Русе това е началникът на детското отделение. „Когато ги потърсим и когато се налага, не са ни отказвали никога“, казва Елена за екипа на УМБАЛ „Канев“. Тя подчертава, че при спешни състояния децата от Центъра са с приоритет за спешна помощ и хоспитализация.

Особено важна част от ангажиментите на персонала е децата да не остават сами, когато постъпят в болница. „Ние им осигуряваме придружител 24 часа“, казва Елена. Обикновено това е детегледачка – човек, който познава детето отблизо и може да долови промяна, която не личи веднага дори от изследванията, каквито случаи са имали. 

Водещото е семейството

За екипа на „Еквилибриум“ семейната среда не е абстрактен принцип, а част от самата грижа. Елена Петкова разказва, че много настояват родителите да придружават децата, да идват, да пребивават при тях през деня, да се обучават, да се грижат за тях. Целта е семейството постепенно да започне да разбира състоянието на детето и да се учи как да отговаря на нуждите му. 

Екипът работи с децата, но и с родителите, понякога още в неонатологията. Елена дава пример с бебе с цепка на небцето и устната, за което първоначално се е смятало, че трябва да бъде настанено при тях и хранено със сонда. Заедно с д-р Христова се срещат с родителите, подкрепят ги да опитат хранене със специален биберон, а началникът на неонатологията се съгласява детето да остане по-дълго в отделението, „докато родителите се обучат да го хранят“. Така детето изобщо не стига до резидентната услуга, а от неонатологията се прибира у дома.

Но този щастлив сценарий невинаги е гарантиран. Тогава екипът търси друг път към семейна среда – приемна грижа или осиновяване. От 2016 г. насам четири деца от Центъра са осиновени, основно чрез международно осиновяване. За Елена това е доказателство, че усилието си струва: 

Много се гордея с качеството на грижата, която предоставяме, но не можем да заменим семейството. Просто децата кардинално се променят, когато се върнат в семействата си или излязат в приемна грижа, или бъдат осиновени. 

Любима за екипа е историята на вече почти 7-годишния Мани. Днес той изглежда напълно здрав. Ходи на училище, има грижовни родители и кака, която го учи на английски, защото е осиновен в чужбина. 

Историята на Мани започва в родилното отделение в Русе в един горещ августовски ден. Мани има бързо прогресираща хидроцефалия – състояние, при което в мозъка се натрупва прекалено много гръбначномозъчна течност. При бебетата това води до необичайно увеличаване на обиколката на главата, както се случва и с Мани. Първите лекари, с които животът го среща, очакват хидроцефалията да доведе до бърз край на наскоро започналия му път. Майка му не намира сили да бъде до него в това предизвикателство и така момченцето попада в Центъра. 

„Ние обаче отказахме да се примирим. Направихме образно изследване, свързахме се с проф. Цеков в болница „Токуда“ и му го изпратихме“, разказва Милена Неделчева. Професорът се съгласява да го оперира и това преобръща целия живот на момченцето. До навършването на втората си година той прохожда, започва да говори, а след като е настанен в приемно семейство, напълно компенсира изоставането в развитието си. 

Историята на Мани. Автор: Ася Пенчева, БНР – Русе

По-късно е осиновен в чужбина и изглежда, го очаква вълнуващо и пълно с любов бъдеще. Според Елена момченцето е ярък пример как децата разцъфват в семейството. Милена Неделчева обаче отбелязва, че в тези истории се вижда и нещо болезнено – въпреки усилията на екипа в Центъра и на лекарите тук, за доста от децата „са останали немалко неща, които не са направени“, за да получат най-доброто лечение и допълнителните грижи, нужни, за да развият потенциала си. 

За да подкрепят семействата, при които се връщат или настаняват деца, екипът е на разположение да реагира 24/7. „Нямаме регламентирана мобилна услуга“, обяснява Елена и разказва как на Бъдни вечер една от медицинските сестри от екипа им посетила по спешност семейство, за да обслужи сондата за хранене на детето. 

Просто правим каквото трябва, за да могат децата да останат със семействата си.

Да избягаме от медицинския модел

В края на разговора ни питам Елена може ли да се каже, че това, което правят в Центъра, са палиативни грижи.

 Да, така биха се наричали в някои други държави – ходили сме и сме виждали. 

И вероятно се наричат така в центровете под шапката на МЗ. Колко точно е интегрирана грижата, която се оказва там обаче, за Елена не е напълно ясно. „За нас е от ключово значение всички да работим по общ стандарт, да имаме стандарт за медицинската част на услугата, но и за психосоциалната, и да знаем, че той се спазва навсякъде, където попадат нуждаещи се деца“. Според нея един от големите рискове пред системата е, че фокусът продължава да пада върху „медицинския модел“, от който „трябва да избягаме“. 

Между лекарствата и играчките

В началото на този текст ви помолих да запомните дългото име на мястото, където живее Ида. То е на административен език, способен да натъпче почти всичко в букви – с изключение на самата грижа. Защото нито едно дете не живее в абревиатура. То живее между лекарствата и играчките, между медицинската сестра и логопеда, между болничната стая и човека, който няма да го остави само̀ през нощта.

Екипът в Русе прави точно това, воден от убеждението, че така изглежда добрата грижа. Друга тема е колко още тя ще съществува само там, където някой е решил да направи повече от изискваното.

* Името е измислено.


Между лекарствата и играчките – да избягаме от медицинския модел

Настоящата публикация е създадена по проект „Да говорим с грижа: Палиативните грижи за деца през погледа на медиите“. Проектът се осъществява благодарение на най-голямата социално отговорна инициатива на Лидл България „Ти и Lidl“, в партньорство с Фондация „Работилница за граждански инициативи“, Български дарителски форум и Асоциация на европейските журналисти. Отговорността за съдържанието е на журналистката Надежда Цекулова и по никакъв начин не отразява официалните позиции на финансиращите организации.

Между лекарствата и играчките – да избягаме от медицинския модел

[$] Two LLM-assisted memory-management patch sets

Post Syndicated from corbet original https://lwn.net/Articles/1080162/

The kernel community (like many other free-software projects) has recently
seen a large influx of patches developed with the assistance of large
language models (LLMs). Those patches tend to come from developers who
were previously unknown to the community. At the moment, though, the
memory-management developers are evaluating two large patch sets, developed
with LLM assistance, that were submitted by established and well-respected
developers. The rather different reception accorded to that work may give
insights into how LLM-generated contributions will be handled going
forward.

Formalizing Red Teaming Offensive Methodology as a Multi-Agent AI Architecture

Post Syndicated from Brian Bartholomew original https://www.rapid7.com/blog/post/so-red-teaming-offensive-methodology-multi-agent-ai-architecture

Threat actors are integrating AI into their exploit chains, accelerating reconnaissance, automating vulnerability discovery, and scaling social engineering in ways that compress the timeline between initial access and impact. The barrier to sophisticated offensive operations is dropping fast.

Rapid7’s Red Team is doing the same. Over the past year we formalized our approach into a structured multi-agent system that follows our penetration testing methodology end-to-end from scoping an engagement to validating findings to generating reports. We built it as a production system, not a proof of concept, and the process of designing and operating it taught us as much about defending against AI-enhanced attacks as it did about conducting them.

The system also proved its value as part of Anthropic’s Project Glasswing initiative. Glasswing is a program that gives leading security companies early access to frontier cyber models before they reach wider availability, enabling security research that stays ahead of malicious adoption. We infused our red team architecture with Claude Mythos, applying it across penetration testing, vulnerability research, and red team operations. The combination of our formalized multi-agent architecture with a frontier-class model produced exceptional results in vulnerability analysis and exploit chain development. This validated both the architecture’s design and the importance of getting these capabilities into defenders’ hands first.

This post covers the architecture, the key design decisions, and what we learned along the way.

Why Rapid7’s Red Team built a multi-agent system

Penetration testing is labor-intensive by nature as a significant portion of any engagement is spent on structured, repeatable work like enumerating attack surfaces, tracing data flows through source code, checking security headers, documenting findings in a consistent format. The actual judgement — deciding what to test next, assessing exploitability, understanding business impact — remains deeply human.

The opportunity was straightforward: offload the mechanical work to AI agents while maintaining human insight at decision points where it matters most. Those decision points are where engagements succeed or fail: scoping what’s in and out of bounds, choosing which attack paths to pursue based on business context, assessing whether a vulnerability is genuinely exploitable in a given environment, deciding when a finding is significant enough to escalate, and interpreting results in ways that translate to actionable risks. None of that is mechanical, it requires experience, judgement, and context that models routinely get wrong. And as an internal security team, we don’t just report vulnerabilities, we’re accountable for coverage. If something ships with an exploitable flaw we missed, that’s on us. The bar for confidence is high, and that’s why humans stay in the loop at every point that matters.

We also had a secondary motivation. Building a system that follows a structured offensive methodology gives us direct architectural insight into how AI agents behave in adversarial contexts including the capabilities, the limitations, and the failure modes. That understanding now informs how we assess and secure Rapid7’s own AI-powered products.

The architecture: Orchestration, not autonomy

The system isn’t a single monolithic agent but a team of specialist agents coordinated by an orchestrator that mirrors how human red teams operate. The orchestrator doesn’t test anything. It assesses the current state of the engagement, determines what needs to happen next, routes work to the appropriate specialist, and processes the results. Specialist agents handle enumeration, code review, dynamic testing, and reporting.Each with defined inputs, outputs, and constraints.

The architectural choice to use supervisor-style orchestration rather than a monolithic agent separates routing decisions from execution. This makes the system more predictable, auditable, and controllable,properties that matter when the agent is operating in sensitive environments.

The key design decision that made this work was methodological, not technical. We reverse-engineered the agent’s architecture directly from our team’s daily task lists. The to-do items our testers tracked during real engagements became the specification: which tasks repeat, in what sequence, where decisions branch, and what triggers a return to an earlier phase. The methodology we’d built over years of engagements became the orchestration logic.

Scope decomposition: Giving every target full attention

One of the earliest lessons we learned was that throwing an entire engagement scope at an AI agent produces shallow, scattered results. LLMs have finite context windows and finite attention. A complex application with dozens of endpoints, multiple authentication flows, and layered business logic overwhelms a single-pass analysis and important details get lost in the noise.

The solution was deliberate scope decomposition. Before the agent begins any technical work, the engagement scope is broken into discrete, manageable chunks.  The scope includes individual components, feature areas, or functional boundaries. Each chunk flows through the full architecture independently: enumeration, code review, dynamic testing, and reporting. The orchestrator tracks which chunks are complete, which are in progress, and which are queued.

This achieves two things. First, it ensures depth over breadth as each component receives the agent’s full analytical attention rather than competing for context space with everything else. Second, it creates natural parallelization opportunities and clear progress tracking. A tester can see exactly which areas have been thoroughly assessed and which remain.

The principal maps directly to how experienced pentesters already work by breaking the target into logical units, going deep on each one, then synthesizing across them. Making the principal explicit and enforceable in the orchestration logic was the design contribution.

Feedback loops: Why linear pipelines fail

Real penetration tests don’t follow a straight line. Code review reveals new endpoints that need enumeration. Dynamic testing uncovers an attack surface that wasn’t visible from source alone. Validated findings sometimes expose entirely new subsystems.

The agent handles this natively. The orchestrator maintains a routing table with progression gates — criteria that must be met before advancing — and feedback triggers that route the engagement backward when new actionable data emerges. This creates a directed graph with re-entry points, not a waterfall.

Guardrails: Maintaining safety in a malicious context

Building an AI agent that can hack is relatively straightforward but building one that operates safely within defined boundaries is a challenge. So it was an area where we invested significant design effort.

The system uses a tiered safety model:

  • Scope enforcement — every action is validated against the engagement’s authorized scope before execution. Out-of-scope discoveries are reported but never probed.

  • Action classification — before execution, every proposed dynamic test is categorized as non-destructive, destructive, or ambiguous. Destructive and ambiguous actions require human approval.

  • Human-in-the-loop by default — in our current deployment, a tester reviews and approves every dynamic test. The agent proposes; the human decides.

The system is designed with a path toward semi-automated operation where low-risk, read-only actions execute autonomously while state-modifying operations still require human approval. The decision about where to sit on that spectrum is context-dependent. Internal labs can tolerate more autonomy while client engagements demand more oversight.

Token efficiency: Making AI practical

AI agents are expensive to run at scale. Every enumeration step, every code block analyzed, every HTTP request reasoned about will consume tokens. It is a practical concern that shaped several design decisions. 

The approach was to identify mechanical tasks that don’t require LLM reasoning and replace them with deterministic scripts and MCP servers. DNS lookups, header checks, input field probing, and certificate enumeration produce structured data that the agent consumes, but the data collection itself doesn’t need intelligence. This reduced token consumption dramatically for enumeration-heavy phases while letting the AI focus its reasoning budget on analysis, correlation, and judgement.

Not every step in an AI workflow needs AI. Knowing where to draw that line was the difference between a demo and a production system for us.

Securing AI from the inside out

There’s a dimension to this work that goes beyond offensive operations. Rapid7 builds AI-powered products. As the internal security team, we’re responsible for securing those systems and building a complex multi-agent architecture gave us direct insight into where the weak points live.

Designing the orchestrated system taught us exactly how prompt injection can propagate between agents, where trust boundaries blur when one agent’s output becomes another’s input, how guardrails can be bypassed through indirect manipulation, and what happens when scope enforcement relies on instruction-following rather than programmatic controls.

We now test Rapid7’s AI features with the same architectural intuition we developed building this system. We know where to look because we’ve built the same patterns and felt where they flex. When we assess an AI system’s safety, we’re thinking like the orchestrator — looking for the routing decision that can be subverted, the progression gate that can be skipped, the feedback loop that can be poisoned.

Building offensive AI made us materially better at defending the AI we ship to customers.

What we learned operating the multi-agent system

A few observations from our team:

Methodology is the differentiator

The LLMs are commodities. The orchestration patterns are emerging in open literature. What makes an AI agent effective at penetration testing is the methodology it follows and that’s built from years of institutional knowledge. Formalizing our methodology into explicit, machine-executable logic was the most valuable part of the project.

Building AI builds intuition for securing AI

The architectural understanding we developed — trust boundaries, prompt propagation, scope enforcement failures — translates directly into more effective security assessments of production AI systems. This was an unexpected but significant return on the investment.

The automation spectrum is context dependent

Full autonomy isn’t a goal; it’s one end of a spectrum. The right level of automation depends on the context.Internal labs, client engagements, and product integrations each have different risk profiles. Designing for the spectrum rather than a fixed endpoint kept the system flexible.

What’s next for Rapid7 Red Teaming in the age of AI

We’re continuing to develop the system, refining the methodology mapping, expanding specialist capabilities, and exploring where purpose-built models could replace general-purpose LLM calls for specific tasks (such as severity classification, report writing, payload selection). We’re also using what we learn from operating this system to inform how Rapid7 detects and responds to AI-enhanced offensive activity in the wild.

You can learn more about Vector Command, Rapid7’s continuous red-teaming solution, here.

Security updates for Thursday

Post Syndicated from jzb original https://lwn.net/Articles/1080956/

Security updates have been issued by AlmaLinux (giflib, kernel, mariadb:10.11, mod_http2, php, rrdtool, ruby, ruby:3.3, and ruby:4.0), Debian (jq and node-lodash), Fedora (caddy, hut, ipp-usb, kernel, opkssh, rclone, thunderbird, and transmission), SUSE (389-ds, 7zip, alsa, amazon-ecs-init, avahi, cadvisor, cosign, cups, dnsdist, docker, dracut, firefox, firewalld, giflib, glib-networking, glycin-loaders, google-cloud-sap-agent, google-guest-agent, gsasl, hauler, helm, ImageMagick, kernel, keylime, krb5, libaom, libexif, libgcrypt, libnfs, libssh2_org, loupe, lrzip, mutt, ncurses, nodejs22, openCryptoki, openssh, openssl-3, pacemaker, perl-Config-IniFiles, perl-CSS-Minifier-XS, perl-DBI, perl-JavaScript-Minifier-XS, perl-libwww-perl, postfix, python-click, python-idna, python-Markdown, python-joblib, python-handy-archives, python-apache-libcloud, python-WebOb, python-PyGithub, python-soupsieve, python-pip, python-pytest-html, python-python-dotenv, python-python-multipart, python-starlette, python-tornado6, python-zeroconf, python311, python311-jupyter-server, rpcbind, sed, sg3_utils, tar, tiff, and util-linux), and Ubuntu (kernel, linux, linux-aws, linux-aws-5.15, linux-aws-fips, linux-azure, linux-azure-5.15, linux-azure-fde-5.15, linux-fips, linux-gcp, linux-gcp-fips, linux-gke, linux-gkeop, linux-hwe-5.15, linux-ibm, linux-ibm-5.15, linux-intel-iot-realtime, linux-intel-iotg, linux-kvm, linux-lowlatency, linux-lowlatency-hwe-5.15, linux-nvidia, linux-nvidia-tegra, linux-nvidia-tegra-5.15, linux-nvidia-tegra-igx, linux-oracle, linux-realtime, linux, linux-aws, linux-aws-fips, linux-gcp, linux-gcp-fips, linux-ibm, linux-nvidia, linux-nvidia-6.8, linux-oracle, linux-realtime, linux-realtime-6.8, linux-oem-6.17, and linux-oem-7.0).

Cybersecurity Mission Creep in the US

Post Syndicated from Bruce Schneier original https://www.schneier.com/blog/archives/2026/07/cybersecurity-mission-creep-in-the-us.html

Interesting paper: “Cybersecurity Mission Creep.”

Abstract: Cybersecurity is experiencing mission creep. Policymakers are casting more and more problems as issues of cybersecurity. So reframed, wildly different policy issues, from misinformation, to child social media safety laws, to antitrust regulations, to alleged journalist misconduct, to anti-sex trafficking statutes become what this Article calls “cybersecuritized.” Before this reframing, these issues present as important but not existential. But once cybersecuritization positions the issues as threats intensified by their technological nature, they gain access to the politics and law of urgency and exceptionalism and invite troubling governance responses.

Positioned as security threats, cybersecuritized issues become endowed with the apparent normative power to override countervailing considerations, oversimplifying the problem. Cybersecuritization’s oversimplification similarly risks unidimensional solutions and invites use of argumentative trump cards, like First Amendment challenges. Cybersecuritization also invites deference to purported specialists and their proposed solutions. Together, the reductive tendencies of cybersecuritization and the deference it prompts to specialists renders ultimate governance choices more opaque. And this opacity can erode public trust and political legitimacy.

This Article surfaces the phenomenon of cybersecuritization and offers a novel framework for analyzing and critiquing it. Mining cases from across criminal and civil domains, the account also demonstrates the insidiousness of cybersecuritization and the likelihood that it will continue to expand. Confronting cybersecuritization is crucial. If we continue to ignore it, we risk abdicating further responsibility for difficult choices to the trump card of cybersecurity. This Article’s analysis and critique aim to help reclaim the hard work of governance for our hands.

[$] LWN.net Weekly Edition for July 2, 2026

Post Syndicated from jzb original https://lwn.net/Articles/1079457/

Inside this week’s LWN.net Weekly Edition:

  • Front: Xsnow protestware; Git 2.55; Rhombus; kernel hardening; More LSFMM+BPF coverage; 7.2 merge window; Secure Boot certificate expiration; Ceph and Garage; OSPM 2026.
  • Briefs: Akrites; Mageia 10; Git 2.55.0; Podman 6.0; systemd v261; Creative Commons chat; Quotes; …
  • Announcements: Newsletters, conferences, security updates, patches, and more.

Run log analytics for a fraction of the cost with the new engine for Amazon OpenSearch Service

Post Syndicated from Jagadish Kumar original https://aws.amazon.com/blogs/big-data/run-log-analytics-for-a-fraction-of-the-cost-with-the-new-engine-for-amazon-opensearch-service/

Amazon OpenSearch Service is a real-time retrieval engine for AI, search, and analytics at any scale. As log volumes grow 30–40 percent year over year, organizations face rising infrastructure costs and slower analytical queries across their observability data. Teams are forced to choose between retaining the data they need and staying within budget.

We’re introducing a purpose-built log analytics engine for Amazon OpenSearch Service. This new engine delivers up to 4x price performance, 2x faster data ingestion, up to 2x faster analytical queries, and up to 70 percent lower storage costs. You get all of this without sacrificing search capabilities on the same data.

In this post, you learn how to take advantage of these benefits, see how to get started, and review benchmark results at billion-document scale.

How the optimized engine works

The optimized engine is a new engine mode within the same Amazon OpenSearch Service domain. You use the same console, APIs, security model, and networking configuration that you already use with the general-purpose engine.

OpenSearch Service stores all data in Apache Parquet format. For fields configured as searchable, OpenSearch Service also writes the data to the inverted index. Apache Calcite parses and optimizes each query, then routes operations to the engine best suited to execute them: Apache DataFusion for analytical operations on columnar data, or Lucene for search predicates. The two hand off mid-query, so a single query can search log content and aggregate the results without additional roundtrips.

You ingest data through the same REST APIs and client libraries you use today and you don’t need to change your agents or pipelines. The optimized engine supports two query languages: Piped Processing Language (PPL) and SQL. Both execute natively through the vectorized engine. The Domain Specific Language (DSL) query API is not supported on the optimized engine at launch.

Getting started

At launch, the optimized engine is a domain-level setting selected at creation time. You can’t add the optimized engine to an existing domain or enable it on individual indices or fields within a general-purpose domain. To adopt the optimized engine, create a new domain and migrate your ingestion pipelines to it.

Create a new domain in the Amazon OpenSearch Service console and select Observability as your use case. The optimized engine is enabled by default. The console provides a side-by-side comparison of capabilities to help you choose.

Amazon OpenSearch Service console showing the Observability use case selected with a side-by-side comparison of engine capabilities

After your domain is ready, ingest JSON documents through the same Bulk API and client libraries you use today. No changes to your ingestion pipelines or application code are required.

Benefits of the optimized engine for log analytics

The optimized engine for log analytics introduces the following performance and cost improvements:

  • Up to 4x better price-performance compared to the existing general-purpose engine on internal benchmarks, while retaining full-text search for incident investigation.
  • Up to 2x faster analytical queries. The engine uses a vectorized query execution path that processes data in columnar batches for fast results across large datasets.
  • Up to 2x higher ingestion throughput. The append-only columnar write path increases sustained ingestion rates.
  • Up to 70 percent lower storage with columnar storage for aggregation workloads. You can retain up to 3x more data at the same cost.

To demonstrate these improvements, we benchmarked observability workloads at billion-document scale. In the following sections, we explore the benchmark methodology, test environment, and results. We recommend testing the optimized engine with your own workload to validate the gains for your use case.

Benchmark methodology

We used the Telemetry Generator for OpenTelemetry to generate synthetic traces and logs at scale, producing three observability datasets: OTEL traces, OTEL logs, and web server access logs. We stored the generated data as bulk-format NDJSON in Amazon Simple Storage Service (Amazon S3). We then ingested it through a pipeline on Amazon Elastic Container Service (Amazon ECS) with AWS Fargate. The pipeline reads chunks from Amazon S3, transforms timestamps, and writes to the OpenSearch Bulk API, simulating a production observability flow.

We benchmarked on two OpenSearch Service domains running OpenSearch 3.5, each with 9 data nodes in a 3-Availability Zone configuration:

Configuration Optimized Engine Standard Lucene
Instance type 9x or2.4xlarge.search 9x r8g.4xlarge.search
Leader nodes 3x m7g.large.search 3x m7g.large.search
EBS 2,500 GB gp3, 7,500 IOPS, 500 MB/s per node 2,500 GB gp3, 7,500 IOPS, 500 MB/s per node
Engine mode OPTIMIZED General Purpose (best_compression)

We ingested three data sets totaling 24.4 billion documents and 9.5 TB of raw JSON. All indices used 9 primary shards, 1 replica, and Index State Management (ISM)-managed rollover at 50 GB per primary shard. The Lucene baseline used best_compression (zstd) codec with _source enabled, representing the default customer configuration.

The ingestion pipeline ran on 90 Fargate tasks (16 vCPU, 120 GB RAM each, 48 writer threads per task, bulk size of 3,000 documents) in the same virtual private cloud (VPC) as the OpenSearch Service domains.

Results

Ingestion throughput

The optimized engine’s append-only columnar storage writes segments in bulk-optimized batches without per-document stored field overhead.

Metric Optimized Engine Lucene Baseline
Peak throughput 1.78M docs/sec ~647K docs/sec
Cluster CPU at peak 62% 72%
Write rejections 0 0
Total documents ingested 24.4 billion 15.7 billion

The optimized engine sustained 1.78 million documents per second at matched concurrency, approximately 2x the throughput of the Lucene baseline, while consuming less CPU. Both domains ran with zero write rejections. For teams ingesting terabytes per day, the throughput advantage translates to fewer nodes for the same volume, or longer retention on the same infrastructure.

Storage compression

The columnar Parquet format compresses observability data through dictionary encoding of repeated fields, tight packing of numeric columns, and elimination of per-document JSON overhead.

Measured across 24.4 billion documents:

Dataset Documents Source Optimized Engine Lucene (default)

Compression

vs.

source

Savings vs. Lucene
Web logs 8.76B 2,360 GB 254 GB 614 GB 89% 59%
OTEL logs 8.20B 3,720 GB 815 GB 1,549 GB 78% 47%
OTEL traces 7.43B 4,131 GB 841 GB 1,790 GB 80% 53%
Total 24.4B 9,539 GB 1,910 GB 3,953 GB 80% 52%

The optimized engine stores the same data at 5x compression versus raw JSON (80 percent savings). Against the default Lucene configuration (_source enabled, what most domains run), the optimized engine uses roughly half the storage. The optimized engine derives _source from Parquet columns on read, eliminating the need to store the raw JSON blob while still allowing document retrieval.

Analytical query performance

We measured query latency on a typical observability dashboard pattern: analytical aggregations scoped to a 15-minute time window over billions of log events. The optimized engine uses row-group pruning on the @timestamp column to skip data outside the query window, reading only the relevant subset.

Query pattern Dataset Optimized Engine Lucene baseline Speedup
Error count by service OTEL logs 717 ms 2.8 s 3.9x
Log volume by host OTEL logs 252 ms 17.6 s 70x
5xx errors by service and method OTEL logs 171 ms 885 ms 5.2x
Top services by error OTEL traces 635 ms 569 ms ~1x
Point lookup (single traceId) OTEL traces 394 ms 783 ms 2x

All queries scoped to a 15-minute window. Index sizes: 8.2 billion OTEL log events, 7.4 billion OTEL trace spans.

The optimized engine completes time-filtered analytical queries in 171 ms to 717 ms over billions of documents. The advantage is most pronounced on unfiltered aggregations (log volume by host: 70x) where the columnar engine reads only the columns needed. On queries where the Lucene inverted index provides strong predicate selectivity (top services by error on traces), performance is comparable between the two engines.

Search and point lookups

The optimized engine retains the Lucene inverted index alongside columnar storage. When the query planner recognizes a selective lookup (such as retrieving a single trace by ID), the planner routes the query to the inverted index rather than scanning columnar data. In our benchmark, a single traceId lookup across 7.4 billion spans returned in 165 ms.

This means a real investigation can use both engines in sequence: broad aggregations to localize the problem, then a point lookup to pull the offending trace, all from the same domain.

Now available

The optimized engine for Amazon OpenSearch Service is generally available today in all commercial AWS Regions (Regions other than the AWS GovCloud (US) Regions and the China Regions) where OpenSearch Optimized Instances are available.

Pricing follows standard Amazon OpenSearch Service rates for instances and storage, with no additional premium for the optimized engine. For more information, see Amazon OpenSearch Service Pricing.

To learn more about configuring and using the optimized engine, see Optimized for Log Analytics in the Amazon OpenSearch Service documentation. For an overview of the service, visit Amazon OpenSearch Service Log Analytics.

Give it a try and send feedback to AWS re:Post for Amazon OpenSearch Service or through your usual AWS Support contacts.


About the authors

Jagadish Kumar

Jagadish Kumar

Jagadish is a Senior Solutions Architect at Amazon Web Services, focused on OpenSearch and analytics workloads.

Rohin Bhargava

Rohin Bhargava

Rohin is a Senior Product Manager for Amazon OpenSearch Service.

Michael Supangkat

Michael Supangkat

Michael is a Solutions Architect at Amazon Web Services specializing in search and observability.

Маргарита Доровска: Средата не е даденост, ние ѝ влияем

Post Syndicated from Ина Иванова original https://www.toest.bg/margarita-dorovska-sredata-ne-e-dadenost-nie-i-vliyaem/

Маргарита Доровска: Средата не е даденост, ние ѝ влияем

Точно от едно десетилетие Маргарита Доровска работи в Габрово. Другият начин да се опише професионалният ѝ път е: между Габрово, София и още няколко големи европейски града, защото споделянето и преживяването на изкуството, средата и общността са важни за емоционалното и менталното оцеляване, убедена е тя.

В продължение на седем години Маргарита е директор на Музея на хумора и сатирата в Габрово, а след това оглавява Центъра за съвременно изкуство „Кристо и Жан-Клод“. Идеята за подобен център в родния град на Кристо Явашев датира от 90-те години, Общинският съвет одобрява инициативата през 2008-ма, а от 2016-та с проекта е ангажирана и Маргарита Доровска.

Тя е завършила културология в Софийския университет и магистратура по куриране на съвременно изкуство в Кралския колеж по изкуства в Лондон (Royal College of Art) – престижно учебно заведение, отгледало арт директори и куратори на водещи световни музеи и галерии. Да работиш за публични институции не е комерсиално ориентирана работа – фокусът е върху културните политики. Това, което Маргарита категорично си взема оттам, е

нагласата. Отношението към това кое е публичното и какво дължим на обществото. Тоест съзнанието, че институциите работят за публиката и че нейният интерес, който е много трудно да бъде дефиниран, трябва да бъде представен. Важно е как комуникираш една идея, как я приближаваш, как отговаряш на времето – ти всъщност правиш изложби, които реагират на съвремието.

Центърът „Кристо и Жан-Клод“ е разположен в сградата на бившата Професионална текстилна гимназия (закрита през 2009 г.). Просторните работилници с високи тавани ще бъдат трансформирани в изложбени зали и пространства за създаване на изкуство и сътрудничество. С програмата си от временни и постоянни изложби, ателиета, резидентски програми, прожекции и беседи Центърът ще акцентира върху образованието и обучението на млади хора и изобщо върху развитието на общността.

В по-малките градове имаш много по-плътен контакт с публиката. И много по-лесно получаваш обратна връзка – разбира се, ако я търсиш и тя те интересува. Така че не става въпрос да угаждаш на посетителите, аз съм категорична, че трябва да намираме добрия начин да комуникираме, но да правим това, което ние смятаме за важно. Ако за теб е истински интересно, ще стане такова и за други хора. Нещо като детския блясък в очите: виж какво намерих, чакай сега да ти го покажа.

В по-малките населени места подкрепата е много по-голяма, а сътрудничеството– по-лесно, убедена е Маргарита Доровска и разказва как при технически проблем за откриването на Центъра е получила помощ от частна строителна фирма и от пожарната, които със съвместни усилия са решили инфарктна ситуация със старо съоръжение, застинало във въздуха. Помощта е точно на един телефон разстояние, ако общността те е припознала.

Разбира се, аз имах огромния късмет да попадна в знакова за идентичността на града институция, каквато е Музеят на хумора и сатирата. Това е място, което габровци може да не са посещавали от 15 години, обаче то е важно за тях, скъпо им е, свързано е с идентичността им и те са готови да го бранят. Всъщност това е истинска възможност за развитие на публики, защото хората започват да се интересуват от онова, което правиш.

В момента е обявен двуетапен конкурс от Община Габрово, за да бъде намерено най-доброто архитектурно решение за реконструкция на сградата на Центъра „Кристо и Жан-Клод“. Първата фаза е открит анонимен конкурс за изготвяне на идейна концепция с предвиден награден фонд за класираните първи пет проекта.

Тук е моментът да кажем, че конкурсите, макар да са отворена и демократична среда или инструмент за проектиране, всъщност са много изискващи – ти предпоставяш, че немалък брой екипи ще седнат и ще работят с дни. Има много архитектурни студиа, които не участват в конкурси, защото шансът да спечелиш е малък. И той наистина е малък статистически, а подобен проект е разход на човешка енергия. Затова направихме конкурса на етапи.

Сградата е разположена край Янтра и е свързана с основния предмет на бившето училище – текстила, който е неизменна част и от изкуството на Кристо. Впрочем семейната история на Явашеви също е свързана с тъканите – баща му е бил текстилен инженер.

Идеята за свързаността на концепции и пространства сякаш е част от професионалната биография на Маргарита Доровска.

Аз дълбоко вярвам, че архитектурата и дизайнът, интериорът и екстериорът, градските връзки, които се създават, влияят на нашето поведение. За да имаш добре работеща институция, трябва да създадеш добра среда, в която да се случват изложбите и процесите, заложени от теб.

Желанието и амбицията един проект да бъде изпълнен възможно най-добре на всички нива са обичайният modus operandi за Маргарита Доровска. Тя разказва за показателна ситуация от следването си в Лондон, при която екипът от бъдещи магистри подготвя предстояща реална изложба. Британската система на администриране изисква всяка стъпка да бъде одобрена и подписана на по-високо ниво. Така се оказва, че буквално в последния момент прессъобщението е връщано неколкократно с различни предложения за редактиране, и групата, отговорна за текста, редактира отново и отново, докато не получи одобрение – до последната точка и запетая. Защото така се прави.

Този перфекционизъм, мисълта, че трябва да извървиш всичко до последната крачка, някак се оказа доста полезен за мен,

казва Маргарита.

А изкуството има свойството исторически да напипва пулса и да предсказва времето. Има го, разбира се, и момента, в който това може да бъде фрустриращо, защото понякога подхващаш проекти, които са изпреварили времето си, а ти вярваш силно в тях. Фрустрацията идва от невъзможността – ти си убеден в нещо, виждаш го, обаче обществото не го разпознава и ти не успяваш да го комуникираш, както си се надявал.

Маргарита Доровска вярва, че за да настъпи промяна в нагласите на публиката, трябва да се натрупа критична маса от събития и никой не е единствен пророк. Съвременното изкуство все още среща предразсъдъци. За своя цел тя припознава възможността хората да се чувстват добре дошли. По особен начин тази идея влиза в диалог с каузата на Кристо и Жан-Клод, които замислят, подготвят, координират и деинсталират амбициозните си проекти, включвайки различни групи хора. Всички помним милионната аудитория на последните им работи, усещането за лично свързване и приобщаване, вълнението.

Маргарита Доровска насочва вниманието ни и към един филм, създаден в края на 70-те години – „Бягащата ограда“ (Running Fence). Филмът проследява усилията да бъде „построена“ близо 40-километрова ограда от бяло платно над хълмовете на Калифорния. Преди реализирането на проекта Кристо и Жан-Клод срещат съпротива от щатските власти въпреки съгласието, дадено от фермерите, през чиито земи ще мине оградата. Четири години по-късно идеята е осъществена.

Реализирането на проекта е документирано от братя Мейзълс. Там виждаш начина, по който Кристо и Жан-Клод работят и как приобщават общността, заживяват с общността, за да стане тя на свой ред част от изкуството им. Хората да го искат и да се борят за това изкуство.

Днес истински важно е културните организации да бъдат способни да се променят, твърди Маргарита. Всички сме наясно доколко автоматизирането на алгоритмите започва да замества хората в рутинната работа. Но промяната не се прави през ежедневния мениджмънт, тя се прави през проекти.

Заедно с организационни психолози сме правили тиймбилдинги, на които разказваме за Кристо и Жан-Клод. След това оставяме хората да си минат през своите упражнения – вече завладени и спечелени, вдъхновени. Можем само да си мечтаем организации и бизнеси да работят така, както се случват проектите на Кристо и Жан-Клод – толкова предвидливо към детайлите.

Изкуството на Кристо и Жан-Клод е много интересно за разказване. Работим интензивно и с деца, имаме работилници, в които се опитваме да ги научим, че не трябва да приемат средата за даденост, да не са пасивни участници, а да знаят, че могат да ѝ повлияят.

Изкуството е там, където можем да учим, играейки.

Правим ателие, на което им даваме познати локации и казваме: ето сега, както Кристо е правил подготвителни рисунки на проектите си, ти какво искаш да сложиш в този пейзаж? Можеш да лепиш, да режеш, да рисуваш. Можеш всичко. Имаме и друго ателие, което подготвихме с боядисани консервни кутии, приличащи на малки варели. След това започва едно редене на мастаба, както е в проекта на Кристо. А ако някой някъде нещо обърка, може точно преди финала цялата мастаба да се срути. Всичко е много физическо, но и дава възможност да говорим за философията на съвременното изкуство.

В края на септември в Центъра „Кристо и Жан-Клод“ предстои мащабен проект, свързан със скейт културата. Събитието ще включва изложба, филмови прожекции, демонстрации и история на скейтбординга. В България първите самоделни дъски се появяват през 70-те, а в края на 80-те години тази субкултура получава подкрепата (и контрола) на Комсомола, тъй като духът вече е излязъл от бутилката, а и част от децата на партийните първенци са били извън страната и искат да живеят друг живот, казва Маргарита Доровска.

Всъщност е много интересно да намериш начин да разкажеш една субкултура, без да я нарушиш. Скейтърите са свързани и с градското изкуство, с дизайна, модата, фотографията, музиката. Едновременно с това около тях има доста предразсъдъци, те не са долюбвани, мисли се, че са вандали, че тяхното каране вреди на градската среда – но тя се чупи, когато не е добре изпълнена.

Да събужда любопитството и да провокира сетивата и ума – това е мисията на съвременния куратор. Да напомня, че в изкуството няма „верен отговор“. Още повече когато предубежденията и инерцията са твърде силни. Това успява да прави екипът на Маргарита Доровска в Габрово. И макар тя да е наясно, че събитийният интензитет в столицата е по-силен, вижда, че работата им предизвиква внимание. Или, казано на езика на вълнението, което изкуството разпалва:

Да събудим любопитството и да дадем увереността на хората, че са добре дошли.


Хората, които тихо и кротко променят средата, формират общности и задават посоки, в които има смисъл да тръгнем заедно. Тук ви срещаме с тях. Това са „Тези хора“.

Secure Amazon container workloads using container attribute-based rules in AWS Network Firewall

Post Syndicated from Amit Gaur original https://aws.amazon.com/blogs/security/secure-amazon-container-workloads-using-container-attribute-based-rules-in-aws-network-firewall/

Today, you can use AWS Network Firewall to protect traffic flowing to and from containerized applications on Amazon Elastic Kubernetes Service (Amazon EKS) and Amazon Elastic Container Service (Amazon ECS) clusters. If you run AI and machine learning (ML) workloads on Amazon EKS—such as model inference, RAG pipelines, or JupyterHub—your containerized workloads require the same firewall protections you enforce for traditional applications. However, traditional firewall rules rely on IP addresses, and pod IPs in Kubernetes change frequently as containers scale or restart. Writing and maintaining static firewall rules based on these ephemeral IPs, CIDRs, and subnets is difficult and error-prone, which can leave gaps in your security posture.

Kubernetes Network Policies offer basic traffic control at the namespace level, operating at layers 3 and 4. Depending on your security requirements, you might need additional capabilities beyond what network policies provide: Layer 7 inspection, FQDN-based filtering, and protection from threats detected by managed IDS/IPS rules. Visibility into which pod or service generates blocked traffic is equally important, so you can troubleshoot faster and meet audit requirements.

You can use container attribute-based rules for Network Firewall to define firewall rules for your containerized workloads on both Amazon EKS and Amazon ECS using native container attributes, rather than relying on ephemeral IP addresses. For Amazon EKS, these attributes include namespaces, pod names, cluster names, and labels. This reduces the need to maintain IP-based rules in dynamic container environments. While this capability supports both Amazon EKS and Amazon ECS, this post focuses on Amazon EKS. Your containerized workloads get the same Network Firewall capabilities you use today.

There is no additional charge for the feature itself, because it’s included in the base tier of Network Firewall.

How it works

When you create a container association and link it to your EKS cluster, Network Firewall automatically discovers and tracks the pods that match your defined attributes (namespace, labels, cluster name) and resolves them to their current IP addresses. As pods scale up or restart, the firewall dynamically updates the IP-to-attribute mapping in near real-time and no manual rule updates are required. This approach keeps your firewall rules accurate in dynamic environments while minimizing performance impact on the EKS cluster. In multi-cluster environments, this feature enables centralized cross-cluster traffic inspection for any traffic that passes through the firewall.

Container attribute-based rules also enrich firewall alert logs with container context. Alert logs now include a new metadata field with the container association name associated with the matched rule. This gives security teams the ability to trace blocked, allowed, or alerted traffic directly back to the originating workload. Network Firewall exports these enriched logs to Amazon CloudWatch Logs and Amazon Simple Storage Service (Amazon S3), from where you can forward them to the SIEM of your choice. To bind these attribute groups to running workloads, Network Firewall continuously watches your EKS cluster for pod lifecycle events (create and delete) across the namespaces covered by your container association definition. This definition is stored in a container association, keyed by attribute name and value.

When published, you reference these @ aliases in stateful Suricata rules. The following are some common patterns:

  • Pod group rules: Allow only payment-service pods to reach the external payment gateway over TLS:
    pass tls @ecommerce_pods any -> any 443 (msg:"allow ecommerce to payment gateway"; tls.sni; content:“checkip.amazonaws.com”; flow:to_server,established; sid:1; rev:1;)

  • Layer 7 application rules : Enforce block from all pods from reaching malicious destinations:
    drop tls @all-pods any -> $EXTERNAL_NET any (msg:"Block malicious sites"; aws_domain_category:malicious-sites; sid:10; rev:1;)

At packet evaluation time, Network Firewall expands each @ reference against the current catalog. When pods scale, restart, or move between nodes, the controller refreshes group membership, and the firewall picks up the new IPs, hence no rule edits or operator intervention is required. Each match—whether alert, pass, or drop—streams to the logging destination of your choice with container context. This gives your team a real-time, auditable view of policy effectiveness and a feedback loop for tuning rules and pod-group definitions over time.

Getting started

The Network Firewall container attribute-based rules for Amazon container workloads can be configured using the AWS Management Console for Amazon Virtual Private Cloud (Amazon VPC), AWS Command Line Interface (AWS CLI), or AWS SDK by creating a container association. This container association then can be used to create attribute-based Network Firewall rules.

Prerequisites

This walkthrough requires an existing Network Firewall configured to filter traffic through your Amazon VPC. If you haven’t set one up yet, see Getting started with AWS Network Firewall.

Step 1 – Create a container association:

  1. In the AWS VPC console, navigate to Network Firewall, select Container associations. Choose Create container association.
  2. Enter a Name and optional Description for this container association.
  3. Under Cluster configuration, select the Cluster type and select your EKS cluster from the Cluster drop down.
  4. For Attribute filters, configure the EKS attribute to identify which pods to associate:
    • Attribute key: Enter the attribute key defined in your EKS cluster (for example, namespace, pod, cluster, or custom label key).
    • Attribute value: Enter an attribute key value defined in your EKS cluster.
Figure 1: Create container association

Figure 1: Create container association

Step 2 – Create an attribute-based firewall rule:

  1. In the AWS VPC console, navigate to Network Firewall, then select Network Firewall rule groups.
  2. Select Create rule group.
  3. For Rule group type, select Stateful rule group.
  4. For Rule group format, select Suricata compatible rule string.
    Figure 2: Rule group selection

    Figure 2: Rule group selection

  5. For Rule evaluation order, select Strict order. Choose Next.
  6. Under Describe rule group, enter a Name, Description, and Capacity for the rule group. Choose Next.
    Figure 3: Describe rule group

    Figure 3: Describe rule group

  7. Under IP set references, enter a variable name and from the resource ID drop-down, select the container association created in step 1.
  8. Under Suricata compatible rule string, enter your Suricata rule string. The following is a sample string used for this post:
    pass tls @ecommerce_pods any -> any any (msg:"allow ecommerce to payment gateway"; flow:to_server; tls.sni; dotprefix; content:".checkip.amazonaws.com"; endswith; nocase; alert; sid:101; rev:1;)
    
    reject tls @ecommerce_pods any -> any 443 (msg:"block ecommerce pods to external ecommerce website"; flow:to_server; tls.sni; dotprefix; content:".amazon.com"; endswith; nocase; alert; sid:104; rev:1;)

    Figure 4: Configure rules

    Figure 4: Configure rules

  9. Choose Next.
  10. Enter the details if required on the next options. For this post, we’re using the default values.
  11. On the review and create page, choose Create rule group.

Tests and results

To verify these rules are working as expected, test using the curl command on a pod in the ecommerce namespace. A curl request to www.amazon.comshould fail, because action=rejectis defined in the Suricata rule string. Similarly, a request to the payment gateway URL should succeed, because action=passis defined in the Suricata rule string.

Test 1 – Allowed traffic:

kubectl exec -n ecommerce deployment/payment-service -- curl -sk --max-time 5 -w "\nHTTP_CODE:%{http_code}\n" https://checkip.amazonaws.com/

HTTP_CODE:200

Test 2 – Blocked traffic:

kubectl exec -n ecommerce deployment/payment-service -- curl -sk --max-time 5 https://www.amazon.com 2>&1

curl: (35) Recv failure: Connection reset by peer
command terminated with exit code 35

Container association can also be used in a Standard stateful rules format.

Considerations

There are several important considerations when adopting this feature.

  1. Source NAT (SNAT) must be disabled so that the Network Firewall can see pod IP addresses. If SNAT remains enabled, only the node IP will be visible, preventing granular pod-level egress controls.
  2. This feature can’t enforce security on pod-to-pod traffic within the same node, because that traffic doesn’t traverse the Network Firewall endpoint. A separate solution is needed for this use case.
  3. Performance impact can vary based on rule complexity and traffic volume.

Conclusion

In this post, you learned how container attribute-based rules for AWS Network Firewall solve the challenge of securing dynamic containerized workloads. You explored how the feature maps Kubernetes attributes such as namespaces, pod names, cluster names, and labels to firewall rules, eliminating the need to track ephemeral IP addresses. You walked through how to create a container association to link your EKS cluster attributes to Network Firewall, and then how to reference that association using IP set references in Suricata compatible rule strings. This gives you granular traffic control of your Amazon EKS workloads with the same Network Firewall capabilities as traditional applications including layer 7 inspection, FQDN filtering, TLS decryption, and managed IDS/IPS rules along with enriched logging that traces traffic back to the originating workload.

If you have feedback about this post, submit comments in the Comments section below.


Amit Gaur

Amit Gaur

Amit, a Cloud Infrastructure Architect at AWS, brings his passion for technology and knowledge-sharing to the networking community. Specializing in network architecture design, he helps customers build highly scalable and resilient environments on AWS. Through technical guidance and architectural expertise, Amit enables customers to accelerate their cloud adoption journey while making sure their systems are built for scale and reliability.

Preetkumar Shah

Preetkumar Shah

Preetkumar is a Technical Account Manager at AWS, based in Atlanta, GA. He specializes in helping customers design and operate secure, scalable network architectures in the cloud. At AWS, he works with SMB customers and collaborates closely with service teams to proactively resolve complex challenges and ensure customers get the most from their AWS environment. Outside of work, his interests include spending time with family and going on trails.

Akash Kuman Sinha

Akash Kumar Sinha

Akash is a DevOps Consultant and GenAI Ambassador at AWS, where he helps customers transform their cloud operations through containerization and modern delivery practices. He specializes in container orchestration and DevOps automation, and is a regular speaker at AWS events across Europe. Outside of work, Akash is passionate about knowledge-sharing and exploring the intersection of generative AI and cloud-native innovation.

Amish Shah

Amish is a seasoned product leader with over 15 years of experience in developing innovative and scalable solutions for networking, security, and cloud use cases. He currently leads the AWS Network Firewall service, where he helps to develop security solutions that protect AWS workloads. Outside of work, Amish enjoys playing cricket and soccer, loves to travel, and has recently started collecting niche fragrances.

AI-powered performance recommendations for Amazon Redshift

Post Syndicated from Steve Phillips original https://aws.amazon.com/blogs/big-data/ai-powered-performance-recommendations-for-amazon-redshift/

Data platform teams running Amazon Redshift collect performance telemetry across system views like SYS_QUERY_HISTORY, SVV_TABLE_INFO, and SVV_ALTER_TABLE_RECOMMENDATIONS, plus Amazon CloudWatch metrics for capacity, query execution, and storage. The challenge is interpretation. Correlating a spike in QueryRuntimeBreakdown commit time with hundreds of small INSERT statements, or connecting high disk spill with undersized compute, takes deep expertise and hours of manual analysis.

In this post, you learn how to build an AI-powered solution that collects the telemetry, pre-computes performance signals, correlates them with CloudWatch, and uses Amazon Bedrock to generate prioritized recommendations. The source code is in the accompanying GitHub repository: sample-ai-performance-advisor-for-amazon-redshift.

The signal-based design is what makes this solution produce precise recommendations rather than generic advice. Instead of dumping raw system view output into the large language model (LLM) prompt, the collector pre-computes boolean and threshold-based findings, pairs them with CloudWatch correlations, and hands the model a structured context. The model then cross-references specific query IDs, table names, and metric values in its output.

Solution overview

Two AWS Lambda functions run on a 24-hour Amazon EventBridge schedule:

  • The collector Lambda runs 13 diagnostic SQL queries against Amazon Redshift Serverless and reads the workgroup’s Workload Management (WLM) configuration. It also collects CloudWatch metrics across capacity, query execution, WLM, connections, and storage. From these inputs, it computes the performance signals. Finally, it writes a telemetry JSON file to Amazon Simple Storage Service (Amazon S3).
  • The analyzer Lambda reads the telemetry from Amazon S3, builds a structured prompt with inline CloudWatch-to-signal correlations. Using the correlations, the analyzer calls Amazon Bedrock (Anthropic Claude Sonnet 4.6), and writes the resulting recommendations JSON back to Amazon S3.
  • An Amazon Simple Notification Service (Amazon SNS) topic sends an email summary of the top recommendations to subscribers.
AWS architecture diagram showing an automated Redshift analysis pipeline within the AWS Cloud. Amazon EventBridge triggers a “Collector” AWS Lambda function, which interacts bidirectionally with AWS Secrets Manager, Amazon Redshift, and Amazon CloudWatch to gather data. The Collector passes results to an “Analyzer” AWS Lambda function, which exchanges data with Amazon Bedrock and reads/writes to Amazon S3. The Analyzer then publishes to Amazon Simple Notification Service (SNS), which delivers an email notification.

Figure 1 – Architecture diagram

Prerequisites

Before deploying the solution, make sure the following are in place.

  • An Amazon Redshift Serverless workgroup with a database and query history.
  • An Amazon Redshift database administrator user (superuser). The collector reads views that only a superuser can query (SVV_TABLE_INFO, SVV_ALTER_TABLE_RECOMMENDATIONS, SVV_MV_INFO, SYS_SERVERLESS_USAGE, SYS_AUTO_TABLE_OPTIMIZATION).
    Store the admin credentials in AWS Secrets Manager and pass the secret ARN to the collector.
    Alternatively, have an existing superuser run ALTER USER "IAMR:redshift-performance-recommendations-role" CREATEUSER;
    once to grant the Lambda role superuser privileges.
  • Amazon Bedrock model access for the model of choice. For this solution, a us.anthropic.claude-* model is recommended for multi-region inference. The solution doesn’t depend on a single model.
  • The AWS Command Line Interface (AWS CLI) installed and configured, and a clone of the GitHub repository.

Create the supporting resources

You need an Amazon S3 bucket, an Amazon SNS topic, an AWS Secrets Manager secret, and an AWS Identity and Access Management (IAM) role before the Lambda functions can run.

Create the Amazon S3 bucket

The Amazon S3 bucket will host the output report.

  • Open the Amazon S3 console and choose Create bucket.
  • Enter a globally unique name (for example, amzn-s3-demo-bucket), keep the default settings, and choose Create bucket.

The collector writes telemetry JSON under the telemetry/ prefix and the analyzer writes recommendations under the recommendations/ prefix.

Create the Amazon SNS topic and subscription

Use Amazon SNS to generate notifications once reports are created.

  • Open the Amazon SNS console and choose Topics, Create topic.
  • Select Standard, and enter the name redshift-performance-recommendations.
  • Choose Create topic.
  • On the topic detail page, choose Create subscription.
  • Select Email as the protocol, enter your email address, and choose Create subscription.
  • Open the confirmation email from AWS Notifications and choose Confirm subscription.
Amazon SNS “Create topic” console page. The Type is set to Standard (selected over FIFO), and the Name field contains “redshift-performance-recommendations.” Annotation arrows highlight the Topics nav item, the Standard topic type, the entered name, and the “Create topic” button in the lower right. Optional sections for Encryption, Access policy, Delivery policy, Message delivery status logging, Tags, and Active tracing are collapsed below.

Figure 2 – Create SNS Topic

Store the admin credentials in AWS Secrets Manager

To avoid using hard-coded credentials, create an AWS Secrets Manager secret to connect to Amazon Redshift.

  • Open the AWS Secrets Manager console and choose Store a new secret.
  • Select Other type of secret, choose the Plaintext tab, and paste the following, replacing <ADMIN_PASSWORD> with the workgroup’s admin password:
    {"username":"admin","password":"<ADMIN_PASSWORD>"}

  • Choose Next, enter redshift-performance-admin as the secret name, then choose Next, Next, and Store.
  • Copy the secret Amazon Resource Name (ARN) from the secret detail page. You pass it to the collector in a later step.
AWS Secrets Manager “Store a new secret” page, Step 1: Choose secret type. “Other type of secret” is selected, and the Plaintext tab shows the key-value pair {“username”:“admin”,“password”:“”}. The encryption key is set to aws/secretsmanager. Annotation arrows highlight the secret type selection, the plaintext credentials, and the “Next” button in the lower right.

Figure 3 – Create secret

Create the IAM role and attach the policy

The repository includes a trust policy in iam/trust-policy.json (allowing lambda.amazonaws.com to assume the role) and the least-privilege permission policy in iam/lambda-role-policy.json. Replace the <ACCOUNT_ID>, <REGION>, <YOUR_BUCKET>, and SNS topic ARN placeholders in the permission policy with your values, then create the role in the AWS Management Console or with this AWS CLI command:

aws iam create-role --role-name redshift-performance-recommendations-role \
    --assume-role-policy-document file://iam/trust-policy.json

aws iam put-role-policy --role-name redshift-performance-recommendations-role \
    --policy-name redshift-performance-policy \
    --policy-document file://iam/lambda-role-policy.json

The permission policy grants the Amazon Redshift Data API, Amazon S3, Amazon SNS, Amazon Bedrock, AWS Lambda invoke, AWS Secrets Manager, and Amazon CloudWatch Logs permissions that both Lambda functions require.

Deploy the Lambda functions

The collector source is in lambda/collector.py and it loads the SQL files in sql/ at runtime. The deployment package must contain both.

Package the collector

Open a terminal or shell window and execute a command to copy the collector code, supporting SQL into a folder and archive.

mkdir -p build/collector/sql
cp lambda/collector.py build/collector/
cp sql/*.sql build/collector/sql/
(cd build/collector && zip -qr ../collector.zip .)

Create the collector function

Using the AWS Management Console, navigate to AWS Lambda.

  • Choose Create function.

    AWS Lambda “Create function” console page with the “Configure custom execution role” panel open on the right. “Author from scratch” is selected, the function name is “redshift-performance-collector,” and the runtime is Python 3.14. Under Additional settings, the “Custom execution role” toggle is enabled, and the execution role list is set to “redshift-performance-recommendations-role.” Annotation highlights mark the Author from scratch option, function name, runtime, custom execution role toggle, the selected role, the Save button, and the “Create function” button.

    Figure 4 – Create AWS Lambda function

  • Select Author from scratch, enter redshift-performance-collector as the name, and select Python 3.14.
  • Expand Custom settings, toggle Custom execution role, choose an existing role, select redshift-performance-recommendations-role, and choose Save.
  • On the function page, choose Upload from, .zip file, and upload build/collector.zip.
  • In Runtime settings, select Edit, and set the Handler to collector.lambda_handler.

    Lambda console for the “redshift-performance-collector” function, Code tab. The code editor shows collector.py — a Python file that runs diagnostic SQL queries against Amazon Redshift Serverless, collects CloudWatch metrics, writes telemetry to Amazon S3, and invokes the analyzer Lambda. The Runtime settings section below shows the Handler highlighted as “lambda_function.lambda_handler,” with an arrow pointing to the Edit button and the “Upload from .zip file” option highlighted.

    Figure 5 – Set AWS Lambda handler

  • Choose Configuration, Edit, set timeout to 5 minutes, and memory to 256 MB.

    Lambda console for “redshift-performance-collector,” Configuration tab with “General configuration” selected. The panel shows Memory 128 MB, Ephemeral storage 512 MB, and Timeout 0 min 3 sec, with SnapStart set to None. Annotation arrows point to the General configuration menu item and the Edit button.

    Figure 6 – Set AWS Lambda timeout and memory

  • Under Configuration, select Environment variables, and add the following keys:
    • WORKGROUP: your Amazon Redshift Serverless workgroup name.
    • NAMESPACE_NAME: the namespace the workgroup belongs to.
    • DATABASE: dev (or your target database).
    • BUCKET: the Amazon S3 bucket name you created earlier.
    • SECRET_ARN: the AWS Secrets Manager secret ARN you copied earlier.
    • ANALYZER_FN: redshift-performance-analyzer.

Package and create the analyzer

Repeat the same steps for the analyzer, using lambda/analyzer.py with a 15-minute timeout:

(cd lambda && zip -q ../build/analyzer.zip analyzer.py)

Use the Lambda console to create redshift-performance-analyzer with handler analyzer.lambda_handler, timeout 15 minutes, memory 256 MB, the same execution role, and these environment variables:

  • BUCKET: the same Amazon S3 bucket.
  • SNS_TOPIC: the SNS topic ARN.
  • MODEL_ID: us.anthropic.claude-sonnet-4-6.

The analyzer creates the Amazon Bedrock client with read_timeout=600 and max_tokens=16384 to handle large prompts and long responses. Anthropic Claude inference on a full telemetry payload typically takes 2–4 minutes.

How the signals and the prompt work

You don’t write any custom code for signal computation or prompt construction. Both computation and construction live in the repository.

The compute_signals() function in lambda/collector.py scans the telemetry for Boolean and threshold-based anti-patterns. At the table level, it looks for row skew, ghost rows, stale statistics, unsorted data, sub-optimal sort or distribution keys, and oversized VARCHAR columns. It also flags runtime and workload issues such as disk spill, small-insert bursts, high Data Definition Language (DDL) executions, and unoptimized COPY file size. Beyond that, it catches Amazon Redshift Spectrum queries that fail to prune partitions and data sharing materialized views doing full refresh. It also flags WLM configurations that lack Query Monitoring Rules (QMR), such as limits on blocks spilled to disk and query execution time. The full set of signals and thresholds is defined inline in the function. To tune a threshold or add a custom signal, edit this function and redeploy.

The build_prompt() function in lambda/analyzer.py constructs the Amazon Bedrock prompt in four sections. The first section lists the triggered signals. The second adds CloudWatch metrics, annotated with >> CORRELATION lines that pair each signal with its supporting metric. The third includes the filtered supporting data, limited to the table and query rows that triggered a signal. The fourth gives explicit instructions to return a pipe delimited text where every recommendation references specific table names, query IDs, and metric values. This structure is why the model produces targeted output rather than generic best-practice advice.

Schedule daily runs

Use the Amazon EventBridge console to trigger the collector every 24 hours.

  • Open the EventBridge console and choose Schedules under Scheduler, Create schedule.
  • Enter the name redshift-performance-daily for Schedule name, toggle Recurring schedule and Rate-based schedule.
  • Under Rate expression, enter 24 and select hours.
  • For Flexible time window, choose Off, and select Next.
    Amazon EventBridge Scheduler “Create schedule” page, Step 1: Specify schedule detail. The schedule name is “redshift-performance-daily.” Under Schedule pattern, “Recurring schedule” and “Rate-based schedule” are selected, with a rate expression of 24 hours, and the time zone set to (UTC-06:00) America/Denver. Annotation highlights mark the Schedules nav item, the recurring/rate-based selections, the rate expression, and the Next button.

    Figure 7 – Create Amazon EventBridge schedule


  • On the Select target page, choose AWS Lambda, select the redshift-performance-collector function, and choose Next.

    EventBridge Scheduler “Create schedule” page, Step 2: Select target. “Templated targets” is selected and the AWS Lambda “Invoke” target is chosen from the grid of target options. In the Invoke section, the Lambda function list is set to “redshift-performance-collector” with an empty JSON payload. Annotation highlights mark the Templated targets toggle, the AWS Lambda Invoke target, the selected function, and the Next button.

    Figure 8 – Select Amazon EventBridge schedule target

  • Accept the defaults for Settings and select Next. EventBridge automatically adds a resource-based permission on the Lambda function so the rule can invoke it.
  • Choose Create schedule.

Run it once and review the output

Invoke the collector manually to confirm the pipeline works end-to-end.

  • In the Lambda console, open the redshift-performance-collector function and choose Test. Create a test event named manual with the body {} and choose Test.

    Lambda console for “redshift-performance-collector,” Test tab. A new test event named “manual” is being configured with Invocation type set to Synchronous, event sharing set to Private, the “Hello World” template selected, and an empty {} Event JSON body. Annotation arrows point to the function in the left nav, the Synchronous option, the event name, the Event JSON field, and the Test button.

    Figure 9 – Test end-to-end workflow

  • The function completes in under a minute. Check the Monitor tab for the invocation log via the CloudWatch live logs link.
  • In the Amazon S3 console, open your bucket. Confirm that the telemetry/ prefix contains a JSON file with the current timestamp.
  • Within 2–4 minutes, the analyzer publishes a message to the SNS topic. Check the email address you subscribed for the summary with the top 10 recommendations. Confirm that the recommendations/ prefix in Amazon S3 contains the full JSON.

Each recommendation has a priority (critical, high, medium, low) and a category (query_optimization, table_design, capacity, wlm, maintenance, or ingestion). It also includes a signal_source that names the signals and CloudWatch metrics that triggered it, a plain-language explanation, a specific SQL or configuration action, and an expected impact estimate.

Email notification from AWS Notifications with the subject “Redshift performance: 3 critical, 5 high, 4 medium, 2 low (8 signals)” highlighted. The body is a plain-text “Amazon Redshift Performance Recommendations” report listing workgroup, namespace, database, analysis time, and 14 recommendations. Two critical items are shown for the game_events table: fixing extreme row-skew via DISTSTYLE ALL, and eliminating non-encoded columns with column compression, each with a category, source, explanation, SQL action, and expected impact.

Figure 10 – Sample analyzer emailed output

Best practices

  • Tune thresholds to your workload. The default thresholds in compute_signals() come from the Amazon Redshift operational review playbook. For high-velocity ingestion or small-cluster environments, consider lowering the small-insert threshold, widening the stale-statistics window, or adding custom signals for your own tables.
  • Keep the signal-to-metric correlations current. When you add a signal, also add a matching correlation in build_correlations(). The inline >> CORRELATION lines are what make the model connect an infrastructure metric to an application-level symptom.
  • Review recommendations before you act. The analyzer produces prioritized suggestions, but VACUUM, ANALYZE, and ALTER TABLE actions change table state. Read the explanation and action on each recommendation, validate the SQL against your schema, and run it during a maintenance window.

Cleaning up

To avoid ongoing charges, delete the resources you created for this solution:

  • The two AWS Lambda functions: redshift-performance-collector and redshift-performance-analyzer.
  • The Amazon EventBridge rule: redshift-performance-daily.
  • The Amazon SNS topic and its email subscription: redshift-performance-recommendations.
  • The Amazon S3 bucket, including the telemetry/ and recommendations/ objects.
  • The AWS Secrets Manager secret: redshift-performance-admin.
  • The IAM role and its inline policy: redshift-performance-recommendations-role.

Conclusion

You now have a daily performance review for Amazon Redshift Serverless that runs entirely on AWS Lambda, stores every run in Amazon S3, and delivers prioritized recommendations by email. The signal-based prompt pattern keeps the Amazon Bedrock cost low and the recommendations specific to your workload.

To learn more, see the following resources:


About the authors

Steve Phillips

Steve Phillips

Steve is a Principal Technical Account Manager and Analytics specialist at AWS in the North America region. Steve currently focuses on data warehouse architectural design, AI/ML data foundations, data lakes, data ingestion pipelines, and cloud distributed architectures.

Richard Raseley

Richard Raseley

Richard is a Senior Technical Account Manager in North America who works with Games customers. He is passionate about applying his background in automation, cloud computing, networking, and storage to help customers build AI solutions.

The collective thoughts of the interwebz