Industrial Control System (ICS) networking stacks are often the go-to bogeyman for infosec and cybersecurity professionals, and doubly so for offensive, red-team style security folks. How often have you been new on site, all ready to run a bog-standard nmap scan across the internal address space, only to be stopped by a frantic senior manager, “No, you can’t scan 192.168.69.0/24, that’s where the factory floor operates!”
“Why not?” you might ask—after all, isn’t it important to scan your IP-connected assets regularly to make sure they’re all accounted for and patched? Isn’t that kind of the one thing we tell literally anyone who asks, right after making sure your passwords are nice and long and random?
“Oh no,” this manager might plead, “if you scan them, they fall over, and it kills production. Minutes of downtime costs millions!”
Well, I’m happy to report that today, Rapid7’s Andreas Galauner has produced a technical deep dive whitepaper into the mysterious and opaque world of PLC protocols, and specifically, how you, intrepid IT explorer, can safely and securely scan around your CODESYS-based ICS footprint.
CODESYS is a protocol suite that runs a whole lot of industrial equipment. Sometimes it’s labeled clearly as such, and sometimes it’s not mentioned at all in the docs. While it is IP-based, it also uses some funky features of UDP multicast, which is one reason why scanning (or worse, fuzzing) these things blindly can cause a lot of trouble in the equipment that depends on it.
No spoilers, but if you’re the sort who always wondered why, exactly, flinging packets at the ICS network can lead to heartache and lost productivity, this is the paper for you. This goes double if you’re already a bit of a networking nerd.
If you’re not sure, here’s an easy test. Go and read this Errata Security blog about the infamous Hacker Jeopardy telnet question real quick. If you have any emotional response at all (hilarity, enlightenment, outrage, or a mix of all three), you’re definitely in the audience for this paper.
Best of all, this paper comes with some tooling; Andy has graciously open sourced a Wireshark plugin for CODESYS analysis, and an Nmap NSE script for safer scanning. You can grab those, right now, at our GitHub repo. Cower in the dark about ICS networks no more!
Security updates have been issued by Debian (imagemagick), Fedora (xml-security-c), Red Hat (grub2), SUSE (chromium, freerdp, libbpf, and python-setuptools), and Ubuntu (fig2dev and python-django).
What will it take for policy makers to take cybersecurity seriously? Not minimal-change seriously. Not here-and-there seriously. But really seriously. What will it take for policy makers to take cybersecurity seriously enough to enact substantive legislative changes that would address the problems? It’s not enough for the average person to be afraid of cyberattacks. They need to know that there are engineering fixes—and that’s something we can provide.
For decades, I have been waiting for the “big enough” incident that would finally do it. In 2015, Chinese military hackers hacked the Office of Personal Management and made off with the highly personal information of about 22 million Americans who had security clearances. In 2016, the Mirai botnet leveraged millions of Internet-of-Things devices with default admin passwords to launch a denial-of-service attack that disabled major Internet platforms and services in both North America and Europe. In 2017, hackers—years later we learned that it was the Chinese military—hacked the credit bureau Equifax and stole the personal information of 147 million Americans. In recent years, ransomware attacks have knocked hospitals offline, and many articles have been written about Russia inside the U.S. power grid. And last year, the Russian SVR hacked thousands of sensitive networks inside civilian critical infrastructure worldwide in what we’re now calling Sunburst (and used to call SolarWinds).
Those are all major incidents to security people, but think about them from the perspective of the average person. Even the most spectacular failures don’t affect 99.9% of the country. Why should anyone care if the Chinese have his or her credit records? Or if the Russians are stealing data from some government network? Few of us have been directly affected by ransomware, and a temporary Internet outage is just temporary.
Cybersecurity has never been a campaign issue. It isn’t a topic that shows up in political debates. (There was one question in a 2016 Clinton–Trump debate, but the response was predictably unsubstantive.) This just isn’t an issue that most people prioritize, or even have an opinion on.
So, what will it take? Many of my colleagues believe that it will have to be something with extreme emotional intensity—sensational, vivid, salient—that results in large-scale loss of life or property damage. A successful attack that actually poisons a water supply, as someone tried to do in January by raising the levels of lye at a Florida water-treatment plant. (That one was caught early.) Or an attack that disables Internet-connected cars at speed, something that was demonstrated by researchers in 2014. Or an attack on the power grid, similar to what Russia did to the Ukraine in 2015 and 2016. Will it take gas tanks exploding and planes falling out of the sky for the average person to read about the casualties and think “that could have been me”?
Here’s the real problem. For the average nonexpert—and in this category I include every lawmaker—to push for change, they not only need to believe that the present situation is intolerable, they also need to believe that an alternative is possible. Real legislative change requires a belief that the never-ending stream of hacks and attacks is not inevitable, that we can do better. And that will require creating working examples of secure, dependable, resilient systems.
Providing alternatives is how engineers help facilitate social change. We could never have eliminated sales of tungsten-filament household light bulbs if fluorescent and LED replacements hadn’t become available. Reducing the use of fossil fuel for electricity generation requires working wind turbines and cost-effective solar cells.
We need to demonstrate that it’s possible to build systems that can defend themselves against hackers, criminals, and national intelligence agencies; secure Internet-of-Things systems; and systems that can reestablish security after a breach. We need to prove that hacks aren’t inevitable, and that our vulnerability is a choice. Only then can someone decide to choose differently. When people die in a cyberattack and everyone asks “What can be done?” we need to have something to tell them.
We don’t yet have the technology to build a truly safe, secure, and resilient Internet and the computers that connect to it. Yes, we have lots of security technologies. We have older secure systems—anyone still remember Apollo’s DomainOS and MULTICS?—that lost out in a market that didn’t reward security. We have newer research ideas and products that aren’t successful because the market still doesn’t reward security. We have even newer research ideas that won’t be deployed, again, because the market still prefers convenience over security.
What I am proposing is something more holistic, an engineering research task on a par with the Internet itself. The Internet was designed and built to answer this question: Can we build a reliable network out of unreliable parts in an unreliable world? It turned out the answer was yes, and the Internet was the result. I am asking a similar research question: Can we build a secure network out of insecure parts in an insecure world? The answer isn’t obviously yes, but it isn’t obviously no, either.
While any successful demonstration will include many of the security technologies we know and wish would see wider use, it’s much more than that. Creating a secure Internet ecosystem goes beyond old-school engineering to encompass the social sciences. It will include significant economic, institutional, and psychological considerations that just weren’t present in the first few decades of Internet research.
Cybersecurity isn’t going to get better until the economic incentives change, and that’s not going to change until the political incentives change. The political incentives won’t change until there is political liability that comes from voter demands. Those demands aren’t going to be solely the results of insecurity. They will also be the result of believing that there’s a better alternative. It is our task to research, design, build, test, and field that better alternative—even though the market couldn’t care less right now.
This essay originally appeared in the May/June 2021 issue of IEEE Security & Privacy. I forgot to publish it here.
Computing combines a very broad mixture of concepts and skills. We work to support any school to teach students about the whole of computing and how to create with digital technologies. A key part of this support is The Computing Curriculum.
We help schools around the world teach their learners computing.
The Computing Curriculum: Free and comprehensive
The Computing Curriculum is our complete bank of free lesson plans and other resources that offer you everything you need to teach computing lessons to all school-aged learners. It helps you cover the full breadth of computing, including computing systems, programming, creating media, data and information, and societal impacts of digital technology.
The 500 hours of free, downloadable resources within The Computing Curriculum include all the materials you need in your classroom: from lesson plans and slide decks to activity sheets, homework, and assessments. To our knowledge, this is the most comprehensive set of free teaching and learning materials for computing and digital skills in the world.
We continuously update The Computing Curriculum to reflect the latest research about this young subject.
Our Curriculum’s resources are based on clear progression and content frameworks we’ve designed, and we continuously update them based on the latest research and feedback from practising teachers. Doing this is particularly important for computing education resources, because computing is a young subject where thoughts and understanding about the best teaching approaches are still evolving.
Computing lesson plans that save time and engage your learners
With The Computing Curriculum, we support educators of all levels of experience. Whether you specialise in computing, or you are a newcomer to the subject, the Curriculum will save you time and help you deliver engaging lessons.
In our 2022 survey of teachers who have used The Computing Curriculum resources:
91% said the Curriculum was effective or very effective at saving teachers time
89% said it was effective or very effective at developing teachers’ subject knowledge
81% said it was effective or very effective at engaging students
The resources are organised as themed units, and they support your computing lesson planning, preparation, and delivery because they are comprehensive as well as adaptable. You are free to use the resources as they are, or adjust them to your context, access to hardware, and learners’ needs and experience level.
The Computing Curriculum will help you plan and deliver engaging lessons.
One aspect of The Computing Curriculum that will facilitate your teaching is the progression framework on which the resources are based. In creating the resources, we have considered the learning objectives throughout each unit and year group, and throughout the entire schooling period. This progression is detailed in curriculum maps and learning graphs, and you’ll be able to use these documents to plan your lessons and to check your learners’ understanding.
Start teaching with The Computing Curriculum
You can download and use the resources for the year groups you teach computing right now. And please tell us of your experiences using The Computing Curriculum in your classroom, so that we can make the resources even better for educators around the world.
We’ve come a long way since the launch of the m1.small instance in 2006, adding instances with additional memory, compute power, and your choice of Intel, AMD, or Graviton processors. The original general-purpose “one size fits all” instance has evolved into six families, each one optimized for specific uses cases, with over 600 generally available instances in all.
New M7g and R7g Today I am happy to tell you about the newest Amazon EC2 instance types, the M7g and the R7g. Both types are powered by the latest generation AWS Graviton3 processors, and are designed to deliver up to 25% better performance than the equivalent sixth-generation (M6g and R6g) instances, making them the best performers in EC2.
The M7g instances are for general purpose workloads such as application servers, microservices, gaming servers, mid-sized data stores, and caching fleets. The R7g instances are a great fit for memory-intensive workloads such as open-source databases, in-memory caches, and real-time big data analytics.
Here are the specs for the M7g instances:
Instance Name
vCPUs
Memory
Network Bandwidth
EBS Bandwidth
m7g.medium
1
4 GiB
up to 12.5 Gbps
up to 10 Gbps
m7g.large
2
8 GiB
up to 12.5 Gbps
up to 10 Gbps
m7g.xlarge
4
16 GiB
up to 12.5 Gbps
up to 10 Gbps
m7g.2xlarge
8
32 GiB
up to 15 Gbps
up to 10 Gbps
m7g.4xlarge
16
64 GiB
up to 15 Gbps
up to 10 Gbps
m7g.8xlarge
32
128 GiB
15 Gbps
10 Gbps
m7g.12xlarge
48
192 GiB
22.5 Gbps
15 Gbps
m7g.16xlarge
64
256 GiB
30 Gbps
20 Gbps
m7g.metal
64
256 GiB
30 Gbps
20 Gbps
And here are the specs for the R7g instances:
Instance Name
vCPUs
Memory
Network Bandwidth
EBS Bandwidth
r7g.medium
1
8 GiB
up to 12.5 Gbps
up to 10 Gbps
r7g.large
2
16 GiB
up to 12.5 Gbps
up to 10 Gbps
r7g.xlarge
4
32 GiB
up to 12.5 Gbps
up to 10 Gbps
r7g.2xlarge
8
64 GiB
up to 15 Gbps
up to 10 Gbps
r7g.4xlarge
16
128 GiB
up to 15 Gbps
up to 10 Gbps
r7g.8xlarge
32
256 GiB
15 Gbps
10 Gbps
r7g.12xlarge
48
384 GiB
22.5 Gbps
15 Gbps
r7g.16xlarge
64
512 GiB
30 Gbps
20 Gbps
r7g.metal
64
512 GiB
30 Gbps
20 Gbps
Both types of instances are equipped with DDR5 memory, which provides up to 50% higher memory bandwidth than the DDR4 memory used in previous generations. Here’s an infographic that I created to highlight the principal performance and capacity improvements that we have made available with the new instances:
If you are not yet running your application on Graviton instances, be sure to take advantage of the AWS Graviton Ready Program. The partners in this program provide services and solutions that will help you to migrate your application and to take full advantage of all that the Graviton instances have to offer. Other helpful resources include the Porting Advisor for Graviton and the Graviton Fast Start program.
The instances are built on the AWS Nitro System, and benefit from multiple features that enhance security: always-on memory encryption, a dedicated cache for each vCPU, and support for pointer authentication. They also support encrypted EBS volumes, which protect data at rest on the volume, data moving between the instance and the volume, snapshots created from the volume, and volumes created from those snapshots. To learn more about these and other Nitro-powered security features, be sure to read The Security Design of the AWS Nitro System.
Pricing and Regions M7g and R7g instances are available today in the US East (N. Virginia), US East (Ohio), US West (Oregon), and Europe (Ireland) AWS Regions in On-Demand, Spot, Reserved Instance, and Savings Plan form.
The Super Bowl has been happening since the end of the 1966 season, the same year that the ARPANET project, which gave birth to the Internet, was initiated. Around 20 years ago, 50% of the US population were Internet users, and that number is now around 92%. So, it’s no surprise that interest in an event like Super Bowl LVII resulted in a noticeable dip in Internet traffic in the United States at the time of the game’s kickoff, dropping to around 5% lower than the previous Sunday. During the game, Rihanna’s halftime show also caused a significant drop in Internet traffic across most states, with Pennsylvania and New York feeling the biggest impact, but messaging and video platforms saw a surge of traffic right after her show ended.
In this blog post, we will dive into who the biggest winners were among Super Bowl advertisers, as well as examine how traffic to food delivery services, social media and sports and betting websites changed during the game. In addition, we look at traffic trends seen at city and state levels during the game, as well as email threat volume across related categories in the weeks ahead of the game.
Cloudflare Radar uses a variety of sources to provide aggregate information about Internet traffic and attack trends. In this blog post, as we did last year and the year before, we use DNS name resolution data from our 1.1.1.1 resolver to estimate traffic to websites. We can’t see who visited the websites mentioned, or what anyone did on the websites, but DNS can give us an estimate of the interest generated by the ads or across a set of sites in the categories listed above.
Ads: are URLs no longer cool?
In contrast to Super Bowl commercials of the past 25 years, many of this year’s advertisements didn’t include a URL, possibly suggesting strong confidence by brands in their search engine results placement, or an assumption that the viewer would engage with the brand through an app on their phone, rather than a website. To that end, several ads did include an app store-related call to action, encouraging the viewer to download the associated mobile app. And possibly in an effort to capitalize on the success of Coinbase’s QR code commercial during Super Bowl LVI, a number of brands, including Toyota, Michelob Ultra, and Mr. Peanut included QR codes as a way for viewers to get additional information or see more.
As we did last year, we again tracked DNS request traffic to our 1.1.1.1 resolver in United States data centers for domains associated with the advertised products or brands. Traffic growth is plotted against a baseline calculated as the mean request volume for the associated domains between 1200-1500 EST on Sunday, February 12 (Super Bowl Sunday.) Although over 50 brands advertised during the game, the brands highlighted below were chosen because their advertisements drove some of the largest percentage traffic spikes, as well as one interesting tale.
BlueMoon
Although the commercial initially seemed to be for sibling beer brands Coors Light and Miller Lite, there was a twist at the end, This twist was only fitting, as the ad was actually for Blue Moon, which is often served with a twist of orange on the rim of the glass. Although beer ads don’t usually drive significant traffic spikes, this one did, reaching 76,400% above baseline for Blue Moon’s site. Coors Light saw a 275% bump in DNS traffic coincident with the ad, while Miller Lite grew 120%. However, traffic for Coors and Miller was fairly volatile at other times during the game.
LimitBreak
Although last year’s advertisements included a number of cryptocurrency-related brands, they were all but absent from this year’s slate of ads. The closest we got during this year’s game was a commercial from LimitBreak, which describes itself as “bringing the free-to-play gaming experience to Web3 and beyond”, in which it promoted a giveaway of thousands of its Dragon series NFTs. This ad featured a QR code and a URL, and given the nearly 54,000% increase in DNS traffic observed, both were effective means of driving traffic to the LimitBreak website.
Temu
Upstart mobile shopping app Temu purchased multiple Super Bowl ad slots to promote its “shop like a billionaire” campaign, urging viewers to download its mobile app. As seen in the graph below, these advertisements drove spikes in traffic, and continued engagement, each time they ran. The first airing at 19:16 EST drove a 222% spike over baseline in DNS traffic. However, the second airing at 21:12 EST apparently resulted in significantly more interest, driving a 475% traffic increase. A third airing at 22:20 EST reached 169% over baseline, with another one just after that reaching over 200%.
Dunkin’
In early January, Boston-area media blew up with the news that local celebrity Ben Affleck was spotted working the drive-through window at one of the coffee chain’s Medford locations, raising some speculation that he was filming a Super Bowl commercial. That speculation turned out to be true, as the commercial aired at 18:53 EST. But the commercial had a side effect: DNS traffic for dunkin.com, associated with DunkinWorks (a small personal coaching and training business), spiked 8,000% when the commercial aired, as shown in the graph below. (It isn’t clear what drove the later three spikes for dunkin.com, as the advertisement didn’t air again nationally during the remainder of the game.) We can only hope that the dunkin.com system administrators were fueled with plenty of coffee and donuts as they dealt with the rapid growth in traffic.
Site categories: touchdowns bring attention
As we saw last year, there are two factors that bring a surge of traffic to the websites of Super Bowl participants: touchdowns and winning. However, nothing is more impactful than the sweet taste of victory. Both the Kansas City Chiefs’ and Philadelphia Eagles’ websites experienced a surge in DNS traffic just before the game started, as compared to a baseline calculated as the mean request volume for the associated domains between 12:00-15:00 EST on Sunday, February 12 (Super Bowl Sunday.). The Eagles website had its peak just around the time of the kickoff, with 828% growth over baseline, and continued to grow more rapidly than traffic to the Chiefs’ website until 20:55 EST, when traffic to chiefs.com began to pull ahead.
What happened at that time? That was the moment of the Chiefs’ third touchdown of the game, when DNS traffic to the team’s website had its first peak of the evening, at 514% above baseline. There was a clear spike during another Chiefs touchdown at 21:42 EST, at 454% above baseline, but that was nothing compared to the end of the game, when the Kansas City Chiefs were once again, after their 2019 victory, the winners. At 22:15 EST, when the game ended, DNS traffic to the Chiefs’ website was 871% higher, and peaked 10 minutes later at 890%, as compared to the baseline. At this same time, DNS traffic for the Eagles’ website dropped significantly. As we saw last year as well, winning the Super Bowl clearly drives increased traffic to the victor’s website.
Sports websites trends also followed the in-game events. There was a clear spike to approximately 90% above baseline when the game started at 18:30 EST, with further growth to 120% over baseline at 19:00 EST during the Kansas City Chiefs’ first touchdown. There were also clear spikes at 21:30 and 21:40 EST coinciding with the two more Chiefs touchdowns. The Super Bowl peak for these websites was reached during the final break at 22:00 EST, reaching 145% above baseline, just before the Chiefs’ game-winning field goal. After a brief drop as the game ended, there was an additional spike to 134%.
Rihanna’s impact on messaging and social media sites
What happened following Rihanna’s performance during the Super Bowl halftime show? As the game resumed, we saw a clear increase in traffic for messaging websites, with a first peak right after the end of the show at around 20:45 EST, 22% over baseline. The biggest peak, however, was when the game ended. At 22:15 EST, DNS traffic for messaging sites was 30% higher than the earlier baseline.
Rihanna’s announcement of her second pregnancy, which made news after her performance, also impacted traffic to social media platforms. After a small increase when halftime started, there was a clear drop during Rihanna’s show, followed by a jump from 6% below baseline back to 0% right after the show. An additional 3% of traffic growth was reached during the final break at 22:00 EST, just before the Kansas City Chiefs’ winning field goal. After a brief drop, traffic reached 2% above baseline as the game ended.
Is halftime also a time for rewatching ads?
The arrival of halftime at 20:21 EST also brought a surge in DNS traffic for video platforms. The first peak was reached at 18:00 EST, before the game started, at 12% above baseline. The peak during halftime was reached at 20:25 EST with 13% growth above baseline, suggesting that viewers may have been looking at that time to Super Bowl related videos or just using the time to browse those platforms.
Food delivery websites saw flat to lower DNS traffic just before the game as compared to the earlier baseline, suggesting that food orders were placed/scheduled earlier in the afternoon, hours before the game. At kickoff, traffic was 19% below baseline, but there was a clear spike at the time of the first break and right after the first Kansas City touchdown at 18:55 EST. After falling again during the game, there was a small increase in traffic observed just after the game ended.
What about betting sites? They expected a big day during the Super Bowl, given that more states have recently legalized gambling on sports. The peak was reached at 19:00 EST, as DNS traffic reached 295% over baseline, when the Chiefs had their first touchdown, The first Eagles touchdown, minutes before, resulted in a 233% spike. The lowest traffic for betting sites during the Super Bowl was during the halftime show. In the second half of the game, two other clear spikes in traffic are visible. The first was at 20:55 EST at 167% above baseline when the Chiefs pulled ahead with a touchdown, and then a jump to 278% over baseline when the game ended.
Rihanna runs this town city
While the so-called NFL cities across the country are loyal to their local teams, looking at traffic trends across cities from both conferences makes it clear that fans everywhere find joy, not division, in the unknown pleasures of a good halftime show. The drop visible in both graphs below between 20:30-20:50 EST coincides with Rihanna’s return to live performance, as she last performed live in January 2018. Based on the observed drop in traffic, viewers apparently turned away from their computers and devices, giving their attention to Rihanna, or at least stopped their general Internet surfing during the halftime show. As the graphs show, traffic recovered as soon as halftime was over.
Zooming in to individual cities, we examined the traffic patterns observed in both Philadelphia and Kansas City. While both teams have fans across the country, we can use their home cities as a proxy. In this case, we compared normalized Internet traffic levels between 17:00-22:30 EST on Super Bowl Sunday (February 12) with the same time frame on the prior Sunday (February 5).
In Kansas City last Sunday, traffic volumes remained fairly consistent across the surveyed time period. However, on Super Bowl Sunday, traffic levels were initially similar, but by the start of the game were 84% lower than the same time the previous week. Slight drops in traffic are visible coincident with Chiefs touchdowns, but don’t stand out from the overall noisiness of the graph. The graph reached its nadir at 22:13 EST when the Chiefs broke the tie and kicked the game-winning field goal, with the significant drop in traffic likely due to an increased shift in focus towards the outcome of the game, even by those that hadn’t previously been paying close attention.
As the graph below shows, last Sunday saw Internet traffic in Philadelphia gradually decline as the evening wore on. On Super Bowl Sunday, traffic started out slightly lower than the week prior, and also diverged as game time approached, reaching nearly 50% lower at kickoff. As the Eagles took an early lead, their first touchdown resulted in a noticeable drop in traffic from Philadelphia, seen at 18:52 EST, less than 10 minutes after the start of the game. Visible drops in traffic are also coincident with the Eagles’ other three touchdowns, although they don’t stand out against the volatility of the graph. Traffic began to drop towards the end of the game, as the tie score added tension, and reached its lowest point when it became clear that the Eagles were not going to emerge victorious in Super Bowl LVII.
State-level traffic trends: the winning impact
In addition to looking at traffic impacts at a city level, we can also zoom out to examine Internet traffic trends in the Super Bowl states. Arizona, which hosted the big game at State Farm Stadium in Glendale, saw a drop in state-level traffic starting around 13:00 EST. At the time of the kickoff, traffic was 25% lower than the previous Sunday, but the biggest impact was during the wildly popular halftime show by Rihanna. At 20:30 EST, traffic was 29% lower than the same time on the previous Sunday. After the game ended, traffic levels returned to normal around 23:30 EST.
In Pennsylvania, home of the Philadelphia Eagles, traffic began to dip after 15:00 EST and reached its first low point around kickoff, when it was 28% lower than the previous Sunday. Just like in Arizona, the biggest difference was during Rihanna’s halftime show, when it was a whopping 33% lower than usual. However, just a few minutes after the game ended at 22:30 EST, traffic returned to normal.
What about the winning team’s state of Missouri? There, traffic started to decrease only after 17:00 EST and was actually higher than the previous Sunday before that point. With the kickoff came a clear drop, resulting in 28% less traffic than the previous Sunday at the same time. Traffic increased a bit heading towards halftime, but dropped again during Rihanna’s show, when it was 30% lower than usual. The biggest drop in traffic, not surprisingly, was during the exciting moment of the Kansas City Chiefs’ winning field goal. At 22:15 EST, traffic was 33% lower than the previous Sunday. However, after 22:50 EST, Internet traffic in Missouri was back on the fast track, with traffic increasing to levels higher than the previous Sunday.
Rihanna’s halftime performance had a clear impact on Internet traffic at a state level, which dropped across all states with NFL teams at the time of her show. Below we take a closer look at the most populous states, among which Pennsylvania, New York and Arizona were winners, with the largest traffic declines. The impacts in Pennsylvania and Arizona are shown above, and the graph below shows the traffic trends seen in New York.
California, Texas, Florida, and New York all had their fair share of Internet traffic dropping before and throughout the game, but it was during the halftime show when things really got interesting. At the time of Rihanna’s performance, Internet traffic in California was 24% lower than the previous Sunday, while in Texas it was 21% below a week earlier, and Florida also saw a 21% drop. Meanwhile, New York had a clear 30% decrease in traffic during the show and, as shown above, Pennsylvania took the cake with a 33% drop. Illinois, Ohio, Georgia, North Carolina, and Michigan were close behind with 23%, 27%, 22%, 25%, and 22% drops respectively.
This seems to be a clear indication that the Super Bowl in general, but also the much-anticipated halftime shows, and the winning celebrations, all have a massive impact on the Internet, causing a noticeable dip in Internet traffic, especially in the state of the winning team.
Do email spammers and scammers take advantage of “The Big Game”?
Spammers and scammers will frequently try to take advantage of the popularity of major events when running their campaigns, hoping the tie-in will entice the user to open the message and click on a malicious link, or visit a malicious website where they give up a password or credit card number. Cloudflare Area 1 Email Security analyzed the subject lines of email messages processed by the service in the weeks leading up to the Super Bowl to identify malicious, suspicious, and spam messages across four topic areas: Super Bowl/football, sports gambling, sports media/websites, and food delivery.
As the “regular” season NFL games wrapped up, Super Bowl and football themed email threat volume remained relatively low. However, campaigns clearly picked up between January 23-29 as the message count grew sevenfold. However, campaigns kicked into high gear once the Chiefs and Eagles were headed to the Super Bowl, as the number of identified messages between January 30 and February 5 was nearly six times higher than the previous week. These campaigns quickly ended in the week before the big game, though, as Super Bowl and football themed suspicious, malicious, and spam email volume dropped by nearly 90%.
Overall, the number of sports gambling themed subject lines remained fairly low over the survey period. This is somewhat surprising, given that an increasing number of US states have recently legalized betting on sporting events. Interestingly, the trend was highest at the beginning of the year, although that first week was too late to capture potential interest in college football “bowl” games. However, the weeks ahead of the NFL conference championship games (January 23-29) and the Super Bowl (February 6-12) saw message volume increase to levels nearly 2.5x higher than previous weeks.
Sports media and website themed suspicious, malicious, and spam email messages apparently don’t draw the clicks, because the volume of such messages seen by Cloudflare Area 1 has remained extremely low since the start of the year, but peaked during the week of January 23-29. And although lower in volume, the observed trends were similar to those seen for sports gambling, with peaks during the same weeks.
For many people, the Super Bowl is less about the football game than it is about the commercials and the food, and the growth of food delivery services over the last few years have made it easier to ensure that the snacks and libations never run out during the game. Scammers and spammers have apparently learned to take advantage of this hunger, as food delivery themed email messages saw the highest counts across the four categories reviewed here. Peak message counts were seen the weeks of January 2-8 and January 30-February 5. Message volume the weeks following these peaks fell by over 50% in both cases.
Conclusion
As we have seen time and again, advertising during the Super Bowl can drive significant traffic spikes, and apparently this holds true even if a URL isn’t included as a call to action within the commercial. In addition, the trends observed during the game remain a clear reminder that human behavior drives Internet traffic, especially when the halftime show features a popular singer that last performed live five years ago.
Visit Cloudflare Radar for up to date Internet traffic and attack trends, and follow the Cloudflare Radar Twitter and Mastodon accounts for regular insights on Internet events.
In this blog post, we show you how to create an Amazon QuickSight dashboard to visualize the policy validation findings from AWS Identity and Access Management (IAM) Access Analyzer. You can use this dashboard to better understand your policies and how to achieve least privilege by periodically validating your IAM roles against IAM best practices. This blog post walks you through the deployment for a multi-account environment using AWS Organizations.
Policy validation is a feature of IAM Access Analyzer that guides you to author and validate secure and functional policies with more than 100 policy checks. You can use these checks when creating new policies or to validate existing policies. To learn how to use IAM Access Analyzer policy validation APIs when creating new policies, see Validate IAM policies in CloudFormation templates using IAM Access Analyzer. In this post, we focus on how to validate existing IAM policies.
Approach to visualize IAM Access Analyzer findings
As shown in Figure 1, there are four high-level steps to build the visualization.
Figure 1: Steps to visualize IAM Access Analyzer findings
Collect IAM policies
To validate your IAM policies with IAM Access Analyzer in your organization, start by periodically sending the content of your IAM policies (inline and customer-managed) to a central account, such as your Security Tooling account.
Validate IAM policies
After you collect the IAM policies in a central account, run an IAM Access Analyzer ValidatePolicy API call on each policy. The API calls return a list of findings. The findings can help you identify issues, provide actionable recommendations to resolve the issues, and enable you to author functional policies that can meet security best practices. The findings are stored in an Amazon Simple Storage Service (Amazon S3) bucket. To learn about different findings, see Access Analyzer policy check reference.
Visualize findings
IAM Access Analyzer policy validation findings are stored centrally in an S3 bucket. The S3 bucket is owned by the central (hub) account of your choosing. You can use Amazon Athena to query the findings from the S3 bucket, and then create a QuickSight analysis to visualize the findings.
Publish dashboards
Finally, you can publish a shareable QuickSight dashboard. Figure 2 shows an example of the dashboard.
Figure 2: Dashboard overview
Design overview
This implementation is a serverless job initiated by Amazon EventBridge rules. It collects IAM policies into a hub account (such as your Security Tooling account), validates the policies, stores the validation results in an S3 bucket, and uses Athena to query the findings and QuickSight to visualize them. Figure 3 gives a design overview of our implementation.
Figure 3: Design overview of the implementation
As shown in Figure 3, the implementation includes the following steps:
A time-based rule is set to run daily. The rule triggers an AWS Lambda function that lists the IAM policies of the AWS account it is running in.
When new messages are received, the Amazon SQS queue initiates the second Lambda function. For each message, the Lambda function extracts the policy document and validates it by using the IAM Access Analyzer ValidatePolicy API call.
The Lambda function stores validation results in an S3 bucket.
An AWS Glue table contains the schema for the IAM Access Analyzer findings. Athena natively uses the AWS Glue Data Catalog.
Athena queries the findings stored in the S3 bucket.
QuickSight uses Athena as a data source to visualize IAM Access Analyzer findings.
Benefits of the implementation
By implementing this solution, you can achieve the following benefits:
Store your IAM Access Analyzer policy validation results in a scalable and cost-effective manner with Amazon S3.
Add scalability and fault tolerance to your validation workflow with Amazon SQS.
Partition your evaluation results in Athena and restrict the amount of data scanned by each query, helping to improve performance and reduce cost.
Gain insights from IAM Access Analyzer policy validation findings with QuickSight dashboards. You can use the dashboard to identify IAM policies that don’t comply with AWS best practices and then take action to correct them.
Prerequisites
Before you implement the solution, make sure you’ve completed the following steps:
If you plan to deploy the implementation in a multi-account environment using Organizations, enable all features and enable trusted access with Organizations to operate a service-managed stack set.
Note: This implementation works in accounts that don’t have AWS Lake Formation enabled. If Lake Formation is enabled in your account, you might need to grant Lake Formation permissions in addition to the implementation IAM permissions. For details, see Lake Formation access control overview.
Walkthrough
In this section, we will show you how to deploy an AWS CloudFormation template to your central account (such as your Security Tooling account), which is the hub for IAM Access Analyzer findings. The central account collects, validates, and visualizes your findings.
To deploy the implementation to your multi-account environment
Deploy the CloudFormation stack to your central account.
In your central account, run the following commands in a terminal. These commands clone the GitHub repository and deploy the CloudFormation stack to your central account.
# A) Clone the repository
git clone https://github.com/aws-samples/visualize-iam-access-analyzer-policy-validation-findings.git # B) Switch to the repository's directory
cd visualize-iam-access-analyzer-policy-validation-findings # C) Deploy the CloudFormation stack to your central security account (hub). For<AWSRegion>enter your AWS Region without quotes.
make deploy-hub aws-region=<AWSRegion>
If you want to send IAM policies from other member accounts to your central account, you will need to make note of the CloudFormation stack outputs for SQSQueueUrl and KMSKeyArn when the deployment is complete.
make describe-hub-outputs aws-region=<AWSRegion>
Switch to your organization’s management account and deploy the stack sets to the member accounts. For <SQSQueueUrl> and <KMSKeyArn>, use the values from the previous step.
# Create a CloudFormation stack set to deploy the resources to the member accounts.

make deploy-members SQSQueueUrl=<SQSQueueUrl> KMSKeyArn=<KMSKeyArn< aws-region=<AWSRegion>
To deploy the QuickSight dashboard to your central account
Make sure that QuickSight is using the IAM role aws-quicksight-service-role.
In QuickSight, in the navigation bar at the top right, choose your account (indicated by a person icon) and then choose Manage QuickSight.
On the Manage QuickSight page, in the menu at the left, choose Security & Permissions.
On the Security & Permissions page, under QuickSight access to AWS services, choose Manage.
For IAM role, choose Use an existing role, and then do one of the following:
If you see a list of existing IAM roles, choose the role
# <aws-region> your Quicksight main Region, for example eu-west-1
# <account-id> The ID of your account, for example 123456789012
# <namespace-name> Quicksight namespace, for example default.
# You can list the namespaces by using aws quicksight list-namespaces --aws-account-id<account-id>
aws quicksight list-users --region <aws-region> --aws-account-id <account-id> --namespace <namespace-name>
Make a note of the user’s ARN that you want to grant permissions to list, describe, or update the QuickSight dashboard. This information is found in the arn element. For example, arn:aws:quicksight:us-east-1:111122223333:user/default/User1
To launch the deployment stack for the QuickSight dashboard, run the following command. Replace <quicksight-user-arn> with the user’s ARN from the previous step.
make deploy-dashboard-hub aws-region=<AWSRegion> quicksight-user-arn=<quicksight-user-arn>
Publish and share the QuickSight dashboard with the policy validation findings
You can publish your QuickSight dashboard and then share it with other QuickSight users for reporting purposes. The dashboard preserves the configuration of the analysis at the time that it’s published and reflects the current data in the datasets used by the analysis.
To publish the QuickSight dashboard
In the QuickSight console, choose Analyses and then choose access-analyzer-validation-findings.
In your analysis, in the application bar at the upper right, choose Share, and then choose Publish dashboard.
On the Publish dashboard page, choose Publish new dashboard as and enter IAM Access Analyzer Policy Validation.
Choose Publish dashboard. The dashboard is now published.
On the QuickSight start page, choose Dashboards.
Select the IAM Access Analyzer Policy Validation dashboard. IAM Access Analyzer policy validation findings will appear within the next 24 hours.
Note: If you don’t want to wait until the Lambda function is initiated automatically, you can invoke the function that lists customer-managed policies and inline policies by using the aws lambda invoke AWS CLI command on the hub account and wait one to two minutes to see the policy validation findings:
In the QuickSight console, choose Dashboards and then choose IAM Access Analyzer Policy Validation.
In your dashboard, in the application bar at the upper right, choose Share, and then choose Share dashboard.
On the Share dashboard page that opens, do the following:
For Invite users and groups to dashboard on the left pane, enter a user email or group name in the search box. Users or groups that match your query appear in a list below the search box. Only active users and groups appear in the list.
For the user or group that you want to grant access to the dashboard, choose Add. Then choose the level of permissions that you want them to have.
After you grant users access to a dashboard, you can copy a link to it and send it to them.
Your teams can use this dashboard to better understand their IAM policies and how to move toward least-privilege permissions, as outlined in the section Validate your IAM roles of the blog post Top 10 security items to improve in your AWS account.
Clean up
To avoid incurring additional charges in your accounts, remove the resources that you created in this walkthrough.
Before deleting the CloudFormation stacks and stack sets in your accounts, make sure that the S3 buckets that you created are empty. To delete everything (including old versioned objects) in a versioned bucket, we recommend emptying the bucket through the console. Before deleting the CloudFormation stack from the central account, delete the Athena workgroup.
To delete remaining resources from your AWS accounts
Delete the CloudFormation stack from your central account by running the following command. Make sure to replace <AWSRegion> with your own Region.
make delete-stackset-instances aws-region=<AWSRegion>

# Wait for the operation to finish. You can check its progress on the CloudFormation console.

make delete-stackset aws-region=<AWSRegion>
Delete the QuickSight dashboard by running the following command using the central account credentials. Make sure to replace <AWSRegion> with your own Region.
In this post, you learned how to validate your existing IAM policies by using the IAM Access Analyzer ValidatePolicy API and visualizing the results with AWS analytics tools. By using the implementation, you can better understand your IAM policies and work to reach least privilege in a scalable, fault-tolerant, and cost-effective way. This will help you identify opportunities to tighten your permissions and to grant the right fine-grained permissions to help enhance your overall security posture.
If you have feedback about this post, submit comments in the Comments section below. If you have questions about this post, start a new thread on the AWS Security, Identity, & Compliance re:Post.
Want more AWS Security news? Follow us on Twitter.
“Pig butchering” is the colorful name given to online cons that trick the victim into giving money to the scammer, thinking it is an investment opportunity. It’s a rapidly growing area of fraud, and getting more sophisticated.
AWS announced 32 capabilities since we published the last Week in Review blog post a week ago. I also read a couple of other news and blog posts.
Here is my summary.
The VPC section of the AWS Management Console now allows you to visualize your VPC resources, such as the relationships between a VPC and its subnets, routing tables, and gateways. This visualization was available at VPC creation time only, and now you can go back to it using the Resource Map tab in the console. You can read the details in Channy’s blog post.
CloudTrail Lake now gives you the ability to ingest activity events from non-AWS sources. This lets you immutably store and then process activity events without regard to their origin–AWS, on-premises servers, and so forth. All of this power is available to you with a single API call: PutAuditEvents. We launched AWS CloudTrail Lake about a year ago. It is a managed organization-scale data lake that aggregates, immutably stores, and allows querying of events recorded by CloudTrail. You can use it for auditing, security investigation, and troubleshooting. Again, my colleague Channy wrote a post with the details.
There are three new Amazon CloudWatch metrics for asynchronous AWS Lambda function invocations: AsyncEventsReceived, AsyncEventAge, and AsyncEventsDropped. These metrics provide visibility for asynchronous Lambda function invocations. They help you to identify the root cause of processing issues such as throttling, concurrency limit, function errors, processing latency because of retries, or missing events. You can learn more and have access to a sample application in this blog post.
Amazon EC2 Mac instances now support replacing root volumes for quick instance restoration. Stopping and starting EC2 Mac instances trigger a scrubbing workflow that can take up to one hour to complete. Now you can swap the root volume of the instance with an EBS snapshot or an AMI. It helps to reset your instance to a previous known state in 10–15 minutes only. This significantly speeds up your CI and CD pipelines.
Amazon Polly launches two new Japanese NTTS voices. Neural Text To Speech (NTTS) produces the most natural and human-like text-to-speech voices possible. You can try these voices in the Polly section of the AWS Management Console. With this addition, according to my count, you can now choose among 52 NTTS voices in 28 languages or language variants (French from France or from Quebec, for example).
X in Y Jeff started this section a while ago to list the expansion of new services and capabilities to additional Regions. I noticed 10 Regional expansions this week:
Upcoming AWS Events Check your calendars and sign up for these AWS events:
AWS re:Invent recaps in your area. During the re:Invent week, we had lots of new announcements, and in the next weeks, you can find in your area a recap of all these launches. All the events are posted on this site, so check it regularly to find an event nearby.
AWS re:Invent keynotes, leadership sessions, and breakout sessions are available on demand. I recommend that you check the playlists and find the talks about your favorite topics in one collection.
AWS Summits season will restart in Q2 2023. The dates and locations will be announced here. Paris and Sidney are kicking off the season on April 4th. You can register today to attend these in-person, free events (Paris, Sidney).
Stay Informed That was my selection for this week! To better keep up with all of this news, do not forget to check out the following resources:
The Official AWS Podcast – Listen each week for updates on the latest AWS news and deep dives into exciting use cases. There are also official AWS podcasts in your local languages. Check out the ones in French, German, Italian, and Spanish.
Amazon EMR provides a managed Apache Hadoop framework that makes it straightforward, fast, and cost-effective to run Apache HBase. Apache HBase is a massively scalable, distributed big data store in the Apache Hadoop ecosystem. It is an open-source, non-relational, versioned database that runs on top of the Apache Hadoop Distributed File System (HDFS). It’s built for random, strictly consistent, real-time access for tables with billions of rows and millions of columns. Monitoring HBase clusters is critical in order to identify stability and performance bottlenecks and proactively preempt them. In this post, we discuss how you can use Amazon Managed Service for Prometheus and Amazon Managed Grafana to monitor, alert, and visualize HBase metrics.
HBase has built-in support for exporting metrics via the Hadoop metrics subsystem to files or Ganglia or via JMX. You can either use AWS Distro for OpenTelemetry or Prometheus JMX exporters to collect metrics exposed by HBase. In this post, we show how to use Prometheus exporters. These exporters behave like small webservers that convert internal application metrics to Prometheus format and serve it at /metrics path. A Prometheus server running on an Amazon Elastic Compute Cloud (Amazon EC2) instance collects these metrics and remote writes to an Amazon Managed Service for Prometheus workspace. We then use Amazon Managed Grafana to create dashboards and view these metrics using an Amazon Managed Service for Prometheus workspace as its data source.
This solution can be extended to other big data platforms such as Apache Spark and Apache Presto that also use JMX to expose their metrics.
Solution overview
The following diagram illustrates our solution architecture.
Install an open-source Prometheus server on an EC2 instance.
Create appropriate AWS Identity and Access Management (IAM) roles and security group for the EC2 instance running the Prometheus server.
Create an EMR cluster with an HBase on Amazon S3 configuration.
Install JMX exporters on all EMR nodes.
Create additional security groups for the EMR master and worker nodes to connect with the Prometheus server running on the EC2 instance.
Create a workspace in Amazon Managed Service for Prometheus.
Prerequisites
To implement this solution, make sure you have the following prerequisites:
An AWS account that provides access to AWS services.
AWS IAM Identity Center (successor to AWS Single Sign-On) enabled in your account and an IAM Identity Center user to use with Amazon Managed Grafana. For instructions, refer to Enable IAM Identity Center.
EMRKeyName – Choose a key pair for the EMR cluster
EMRRleaseLabel – Use emr-6.9.0
InstanceType – Use the EC2 instance type for installing the Prometheus server
Enable remote writes on the Prometheus server
The Prometheus server is running on an EC2 instance. You can find the instance hostname in the CloudFormation stack’s Outputs tab for key PrometheusServerPublicDNSName.
SSH into the EC2 instance using the key pair:
ssh -i <sshKey.pem> ec2-user@<Public IPv4 DNS of EC2 instance running Prometheus server>
Copy the value for Endpoint – remote write URL from the Amazon Managed Service for Prometheus workspace console.
Edit remote_write url in /etc/prometheus/conf/prometheus.yml:
sudo vi /etc/prometheus/conf/prometheus.yml
It should look like the following code:
Now we need to restart the Prometheus server to pick up the changes:
sudo systemctl restart prometheus
Enable Amazon Managed Grafana to read from an Amazon Managed Service for Prometheus workspace
We need to add the Amazon Managed Prometheus workspace as a data source in Amazon Managed Grafana. You can skip directly to step 3 if you already have an existing Amazon Managed Grafana workspace and want to use it for HBase metrics.
First, let’s create a workspace on Amazon Managed Grafana. You can follow the appendix to create a workspace using the Amazon Managed Grafana console or run the following API from your terminal (provide your role ARN):
On the Amazon Managed Grafana console, choose Configure users and select a user you want to allow to log in to Grafana dashboards.
Make sure your IAM Identity Center user type is admin. We need this to create dashboards. You can assign the viewer role to all the other users.
Log in to the Amazon Managed Grafana workspace URL using your admin credentials.
Choose AWS Data Sources in the navigation pane.
For Service, choose Amazon Managed Service for Prometheus.
For Regions, choose US East (N. Virginia).
Create an HBase dashboard
Grafana labs has an open-source dashboard that you can use. For example, you can follow the guidance from the following HBase dashboard. Start creating your dashboard and chose the import option. Provide the URL of the dashboard or enter 12722 and choose Load. Make sure your Prometheus workspace is selected on the next page. You should see HBase metrics showing up on the dashboard.
Key HBase metrics to monitor
HBase has a wide range of metrics for HMaster and RegionServer. The following are a few important metrics to keep in mind.
HMASTER
Metric Name
Metric Description
.
hadoop_HBase_numregionservers
Number of live region servers
.
hadoop_HBase_numdeadregionservers
Number of dead region servers
.
hadoop_HBase_ritcount
Number of regions in transition
.
hadoop_HBase_ritcountoverthreshold
Number of regions that have been in transition longer than a threshold time (default: 60 seconds)
.
hadoop_HBase_ritduration_99th_percentile
Maximum time taken by 99% of the regions to remain in transition state
REGIONSERVER
Metric Name
Metric Description
.
hadoop_HBase_regioncount
Number of regions hosted by the region server
.
hadoop_HBase_storefilecount
Number of store files currently managed by the region server
.
hadoop_HBase_storefilesize
Aggregate size of the store files
.
hadoop_HBase_hlogfilecount
Number of write-ahead logs not yet archived
.
hadoop_HBase_hlogfilesize
Size of all write-ahead log files
.
hadoop_HBase_totalrequestcount
Total number of requests received
.
hadoop_HBase_readrequestcount
Number of read requests received
.
hadoop_HBase_writerequestcount
Number of write requests received
.
hadoop_HBase_numopenconnections
Number of open connections at the RPC layer
.
hadoop_HBase_numactivehandler
Number of RPC handlers actively servicing requests
Memstore
.
.
.
hadoop_HBase_memstoresize
Total memstore memory size of the region server
.
hadoop_HBase_flushqueuelength
Current depth of the memstore flush queue (if increasing, we are falling behind with clearing memstores out to Amazon S3)
.
hadoop_HBase_flushtime_99th_percentile
99th percentile latency for flush operation
.
hadoop_HBase_updatesblockedtime
Number of milliseconds updates have been blocked so the memstore can be flushed
Block Cache
.
.
.
hadoop_HBase_blockcachesize
Block cache size
.
hadoop_HBase_blockcachefreesize
Block cache free size
.
hadoop_HBase_blockcachehitcount
Number of block cache hits
.
hadoop_HBase_blockcachemisscount
Number of block cache misses
.
hadoop_HBase_blockcacheexpresshitpercent
Percentage of the time that requests with the cache turned on hit the cache
.
hadoop_HBase_blockcachecounthitpercent
Percentage of block cache hits
.
hadoop_HBase_blockcacheevictioncount
Number of block cache evictions in the region server
.
hadoop_HBase_l2cachehitratio
Local disk-based bucket cache hit ratio
.
hadoop_HBase_l2cachemissratio
Bucket cache miss ratio
Compaction
.
.
.
hadoop_HBase_majorcompactiontime_99th_percentile
Time in milliseconds taken for major compaction
.
hadoop_HBase_compactiontime_99th_percentile
Time in milliseconds taken for minor compaction
.
hadoop_HBase_compactionqueuelength
Current depth of the compaction request queue (if increasing, we are falling behind with storefile compaction)
.
flush queue length
Number of flush operations waiting to be processed in the region server (a higher number indicates flush operations are slow)
IPC Queues
.
.
.
hadoop_HBase_queuesize
Total data size of all RPC calls in the RPC queues in the region server
.
hadoop_HBase_numcallsingeneralqueue
Number of RPC calls in the general processing queue in the region server
.
hadoop_HBase_processcalltime_99th_percentile
99th percentile latency for RPC calls to be processed in the region server
.
hadoop_HBase_queuecalltime_99th_percentile
99th percentile latency for RPC calls to stay in the RPC queue in the region server
JVM and GC
.
.
.
hadoop_HBase_memheapusedm
Heap used
.
hadoop_HBase_memheapmaxm
Total heap
.
hadoop_HBase_pausetimewithgc_99th_percentile
Pause time in milliseconds
.
hadoop_HBase_gccount
Garbage collection count
.
hadoop_HBase_gctimemillis
Time spent in garbage collection, in milliseconds
Latencies
.
.
.
HBase.regionserver.<op>_<measure>
Operation latencies, where <op> is Append, Delete, Mutate, Get, Replay, or Increment, and <measure> is min, max, mean, median, 75th_percentile, 95th_percentile, or 99th_percentile
.
HBase.regionserver.slow<op>Count
Number of operations we thought were slow, where <op> is one of the preceding list
These scripts are for guidance purposes only and aren’t ready for production deployments. Make sure to perform thorough testing.
Clean up
To avoid ongoing charges, delete the CloudFormation stack and workspaces created in Amazon Managed Grafana and Amazon Managed Service for Prometheus.
Conclusion
In this post, you learned how to monitor EMR HBase clusters and set up dashboards to visualize key metrics. This solution can serve as a unified monitoring platform for multiple EMR clusters and other applications. For more information on EMR HBase, see Release Guide and HBase Migration whitepaper.
Appendix
Complete the following steps to create a workspace on Amazon Managed Grafana:
Log in to the Amazon Managed Grafana console and choose Create workspace.
For Authentication access, select AWS IAM Identity Center.
Optionally, to view Prometheus alerts in your Grafana workspace, select Turn Grafana alerting on.
On the next page, select Amazon Managed Service for Prometheus as the data source.
After the workspace is created, assign users to access Amazon Managed Grafana.
For a first-time setup, assign admin privileges to the user.
You can add other users with only viewer access.
Make sure you are able to log in to the Grafana workspace URL using your IAM Identity Center user credentials.
About the Author
Anubhav Awasthi is a Sr. Big Data Specialist Solutions Architect at AWS. He works with customers to provide architectural guidance for running analytics solutions on Amazon EMR, Amazon Athena, AWS Glue, and AWS Lake Formation.
This was a weekend of record-breaking DDoS attacks. Over the weekend, Cloudflare detected and mitigated dozens of hyper-volumetric DDoS attacks. The majority of attacks peaked in the ballpark of 50-70 million requests per second (rps) with the largest exceeding 71 million rps. This is the largest reported HTTP DDoS attack on record, more than 35% higher than the previous reported record of 46M rps in June 2022.
The attacks were HTTP/2-based and targeted websites protected by Cloudflare. They originated from over 30,000 IP addresses. Some of the attacked websites included a popular gaming provider, cryptocurrency companies, hosting providers, and cloud computing platforms. The attacks originated from numerous cloud providers, and we have been working with them to crack down on the botnet.
Record breaking attack: DDoS attack exceeding 71 million requests per second
Over the past year, we’ve seen more attacks originate from cloud computing providers. For this reason, we will be providing service providers that own their own autonomous system a free Botnet threat feed. The feed will provide service providers threat intelligence about their own IP space; attacks originating from within their autonomous system. Service providers that operate their own IP space can now sign up to the early access waiting list.
Is this related to the Super Bowl or Killnet?
No. This campaign of attacks arrives less than two weeks after the Killnet DDoS campaign that targeted healthcare websites. Based on the methods and targets, we do not believe that these recent attacks are related to the healthcare campaign. Furthermore, yesterday was the US Super Bowl, and we also do not believe that this attack campaign is related to the game event.
What are DDoS attacks?
Distributed Denial of Service attacks are cyber attacks that aim to take down Internet properties and make them unavailable for users. These types of cyberattacks can be very efficient against unprotected websites and they can be very inexpensive for the attackers to execute.
An HTTP DDoS attack usually involves a flood of HTTP requests towards the target website. The attacker’s objective is to bombard the website with more requests than it can handle. Given a sufficiently high amount of requests, the website’s server will not be able to process all of the attack requests along with the legitimate user requests. Users will experience this as website-load delays, timeouts, and eventually not being able to connect to their desired websites at all.
Illustration of a DDoS attack
To make attacks larger and more complicated, attackers usually leverage a network of bots — a botnet. The attacker will orchestrate the botnet to bombard the victim’s websites with HTTP requests. A sufficiently large and powerful botnet can generate very large attacks as we’ve seen in this case.
However, building and operating botnets requires a lot of investment and expertise. What is the average Joe to do? Well, an average Joe that wants to launch a DDoS attack against a website doesn’t need to start from scratch. They can hire one of numerous DDoS-as-a-Service platforms for as little as $30 per month. The more you pay, the larger and longer of an attack you’re going to get.
Why DDoS attacks?
Over the years, it has become easier, cheaper, and more accessible for attackers and attackers-for-hire to launch DDoS attacks. But as easy as it has become for the attackers, we want to make sure that it is even easier – and free – for defenders of organizations of all sizes to protect themselves against DDoS attacks of all types.
Unlike Ransomware attacks, Ransom DDoS attacks don’t require an actual system intrusion or a foothold within the targeted network. Usually Ransomware attacks start once an employee naively clicks an email link that installs and propagates the malware. There’s no need for that with DDoS attacks. They are more like a hit-and-run attack. All a DDoS attacker needs to know is the website’s address and/or IP address.
Is there an increase in DDoS attacks?
Yes. The size, sophistication, and frequency of attacks has been increasing over the past months. In our latest DDoS threat report, we saw that the amount of HTTP DDoS attacks increased by 79% year-over-year. Furthermore, the amount of volumetric attacks exceeding 100 Gbps grew by 67% quarter-over-quarter (QoQ), and the number of attacks lasting more than three hours increased by 87% QoQ.
But it doesn’t end there. The audacity of attackers has been increasing as well. In our latest DDoS threat report, we saw that Ransom DDoS attacks steadily increased throughout the year. They peaked in November 2022 where one out of every four surveyed customers reported being subject to Ransom DDoS attacks or threats.
Distribution of Ransom DDoS attacks by month
Should I be worried about DDoS attacks?
Yes. If your website, server, or networks are not protected against volumetric DDoS attacks using a cloud service that provides automatic detection and mitigation, we really recommend that you consider it.
Cloudflare customers shouldn’t be worried, but should be aware and prepared. Below is a list of recommended steps to ensure your security posture is optimized.
What steps should I take to defend against DDoS attacks?
Cloudflare’s systems have been automatically detecting and mitigating these DDoS attacks.
Cloudflare offers many features and capabilities that you may already have access to but may not be using. So as extra precaution, we recommend taking advantage of these capabilities to improve and optimize your security posture:
Ensure all DDoS Managed Rules are set to default settings (High sensitivity level and mitigation actions) for optimal DDoS activation.
Cloudflare Enterprise customers that are subscribed to the Advanced DDoS Protection service should consider enabling Adaptive DDoS Protection, which mitigates attacks more intelligently based on your unique traffic patterns.
Deploy firewall rules and rate limiting rules to enforce a combined positive and negative security model. Reduce the traffic allowed to your website based on your known usage.
Ensure your origin is not exposed to the public Internet (i.e., only enable access to Cloudflare IP addresses). As an extra security precaution, we recommend contacting your hosting provider and requesting new origin server IPs if they have been targeted directly in the past.
Customers with access to Managed IP Lists should consider leveraging those lists in firewall rules. Customers with Bot Management should consider leveraging the threat scores within the firewall rules.
Enable caching as much as possible to reduce the strain on your origin servers, and when using Workers, avoid overwhelming your origin server with more subrequests than necessary.
Defending against DDoS attacks is critical for organizations of all sizes. While attacks may be initiated by humans, they are executed by bots — and to play to win, you must fight bots with bots. Detection and mitigation must be automated as much as possible, because relying solely on humans to mitigate in real time puts defenders at a disadvantage. Cloudflare’s automated systems constantly detect and mitigate DDoS attacks for our customers, so they don’t have to. This automated approach, combined with our wide breadth of security capabilities, lets customers tailor the protection to their needs.
We’ve been providing unmetered and unlimited DDoS protection for free to all of our customers since 2017, when we pioneered the concept. Cloudflare’s mission is to help build a better Internet. A better Internet is one that is more secure, faster, and reliable for everyone – even in the face of DDoS attacks.
This is a guest post by Suresh Dakshina and Damodharan Sampathkumar from Chargeback Gurus.
Chargeback Gurus, a global financial technology company helps businesses fight, prevent, and win chargebacks. To date, we have helped businesses worldwide recover over $2 billion in lost revenue. As trusted advisors to card networks and Fortune 500 companies, we are known for our expertise in the areas of transaction risk management, chargeback mitigation, fraud prevention, and dispute intelligence. Our Veda and Ari product lines are an industry breakthrough helping merchants identify the risk in online transactions and take insightful actions to protect revenue.
Chargebacks are costing merchants up to 40% of their overall revenue if left unchecked. In addition, as per a Javelin study, fraud and chargeback management are consuming 13-20% of a merchant’s operational budget. As a result, it is of utmost importance for merchants to gain access to transaction intelligence that can help them minimize these costs. The vast majority of these chargebacks are preventable, which is why our advanced dispute intelligence platform – Veda, along with our ability to predict chargebacks accurately using Ari have helped us go a long way in effectively preventing and recovering chargebacks for the merchants.
When seeking the right balance of flexibility, confidentiality, big data, cost, and customization capabilities, Amazon QuickSight stood out as the clear winner. In this post, we go over what we needed in a business intelligence (BI) tool, and why QuickSight was the right choice for us.
Helping customers solve problems with data
Our customers face numerous challenges on a daily basis, including the need to adapt to changing payment methods and products, navigate complex payments ecosystems, and address resource shortages. They also frequently encounter difficulties in identifying the root causes of their chargebacks and fraud. As a result, they are constantly confronted with challenges to protect their revenue. It is our mission to utilize data intelligence to address their biggest pain point and make a significant impact on their bottom line.
Our industry-first Advanced Dispute Intelligence platform, Veda, provides merchants with a wealth of data analytics, which would help them minimize revenue leakages. Empowered with this data, our merchants can spot inefficiencies in their operations and proactively fix issues to prevent chargebacks and fraud. Veda’s dashboard can be customized to display the information that’s most relevant to each merchant, allowing them to get to the root causes of their underlying challenges with a high level of accuracy.
The following sample screenshot highlights Veda’s ability to accurately forecast chargeback performance and trends using AWS QuickSight.
To power Veda, we were looking for a balance of flexibility and customization. We needed a BI tool that would meet our data analytics needs, and also provide us with the agility to make periodic changes to align with business requirements. The main reasons we chose QuickSight were:
Fast setup – Speed and agility can make all the difference when it comes to gathering insights that can impact revenue lost from chargebacks.
Comprehensive out-of-the-box functionality – Having a tool that has all the business intelligence and embedded analytics capabilities that we needed from the start was very important.
SPICE engine – SPICE (Super-fast, Parallel, In-memory Calculation Engine) is the robust in-memory engine that QuickSight uses. As it’s engineered to rapidly perform advanced calculations and serve data, it was a big selling point for us.
QuickSight’s out-of-the-box features and functionality were the perfect fit, enabling us to get started with providing insights to our customers right away.
User-friendliness is a key differentiator
Our Gurus provide deep analytics and data-driven recommendations to help businesses identify the problems and inefficiencies that are leading to chargebacks. With this guidance, companies can permanently improve their business processes and increase customer retention. Though we have the expertise and acumen to assist with all aspects of chargeback mitigation, management, and forecasting, we needed that same level of expertise and acumen when it came to translating ideas to products in the BI space.
QuickSight has met all our needs to provide dashboards and reports, with insightful visualizations that help our customers run their businesses more efficiently. Better still, it has done so through an intuitive, user-friendly interface that enables people from all technical backgrounds to use it with very little time spent on training. Having a minimal training timeframe is a key factor when it comes to onboarding new clients.
Partners in customer obsession
One of the things that has been a delightful surprise in our experience with QuickSight is how invested the development team is in collecting our feedback and using it to help inform plans for future releases. We have agreed to be beta testers, and so we receive proactive updates on progress from the project team, providing us with informative visibility on upcoming changes. Being understanding of evolving customer and data needs, and being receptive to feedback has made this a fantastic partnership. We look forward to continuing to work with QuickSight to expand our BI capabilities, empowering our customers with the data they need to be efficient and successful.
To learn more about how QuickSight can help your business with dashboards, reports, and more, visit Amazon QuickSight.
Suresh Dakshina is the Co-founder & President at Chargeback Gurus. A pioneer in data analytics and industry-specific risk management, he is a certified e-commerce fraud prevention specialist and Certified Payments Professional. He understands first-hand the challenges that business owners face, especially when it comes to chargebacks and fraud. He is a veteran speaker, and works closely with Card Networks like Visa and American Express on chargeback process optimization and compelling evidence policies. He loves spending time with his family and his Labradoodle, Joy, when not working.
Damodharan Sampathkumar is the Chief Product Officer & GM-India at Chargeback Gurus. He is responsible for product strategy, platform development, and leading innovation for the next generation in payments technology with a specific focus on Chargebacks and Risk mitigation at Chargeback Gurus. He specializes in cloud-native, mission-critical, real-time payment systems, group-up technology platform setup, and operations. He has successfully championed multiple new-age digital payment platforms across North America, Europe, India, and the Middle East for Central Banks, Acquirer processors, and Fintech innovators. He is an avid cyclist and regular endurance rider who loves to ride during his time off to bring the right balance between work and life.
The collective thoughts of the interwebz
Manage Consent
To provide the best experiences, we use technologies like cookies to store and/or access device information. Consenting to these technologies will allow us to process data such as browsing behavior or unique IDs on this site. Not consenting or withdrawing consent, may adversely affect certain features and functions.
Functional
Always active
The technical storage or access is strictly necessary for the legitimate purpose of enabling the use of a specific service explicitly requested by the subscriber or user, or for the sole purpose of carrying out the transmission of a communication over an electronic communications network.
Preferences
The technical storage or access is necessary for the legitimate purpose of storing preferences that are not requested by the subscriber or user.
Statistics
The technical storage or access that is used exclusively for statistical purposes.The technical storage or access that is used exclusively for anonymous statistical purposes. Without a subpoena, voluntary compliance on the part of your Internet Service Provider, or additional records from a third party, information stored or retrieved for this purpose alone cannot usually be used to identify you.
Marketing
The technical storage or access is required to create user profiles to send advertising, or to track the user on a website or across several websites for similar marketing purposes.










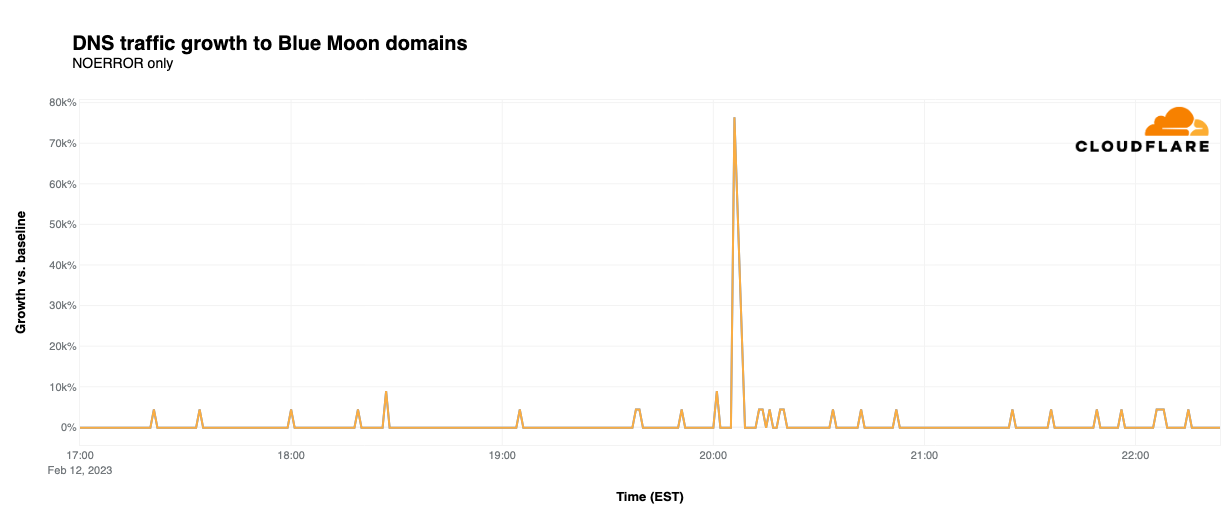
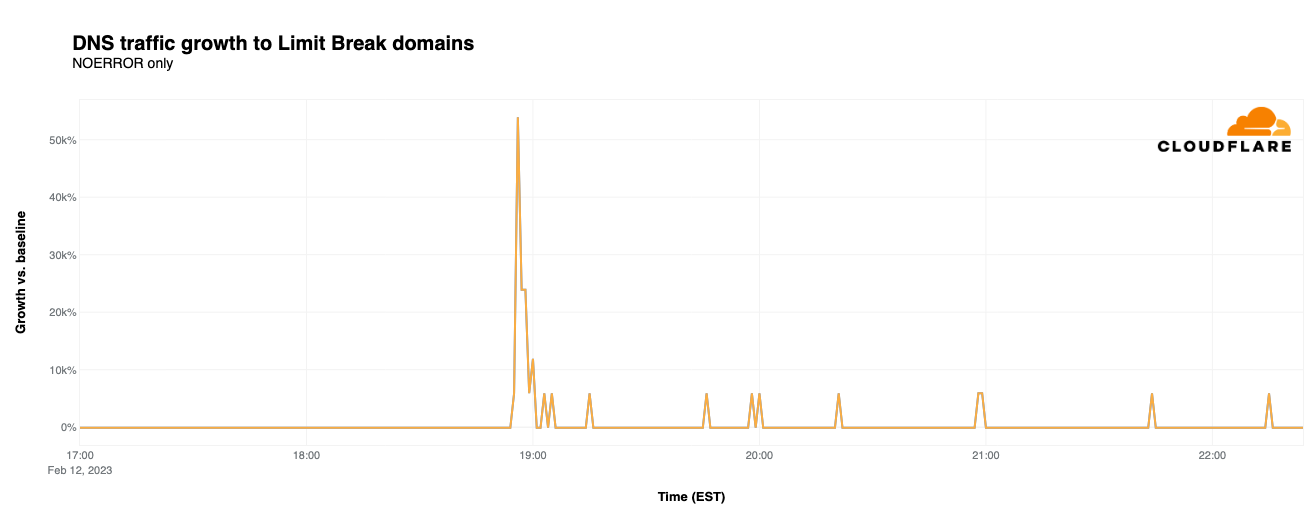
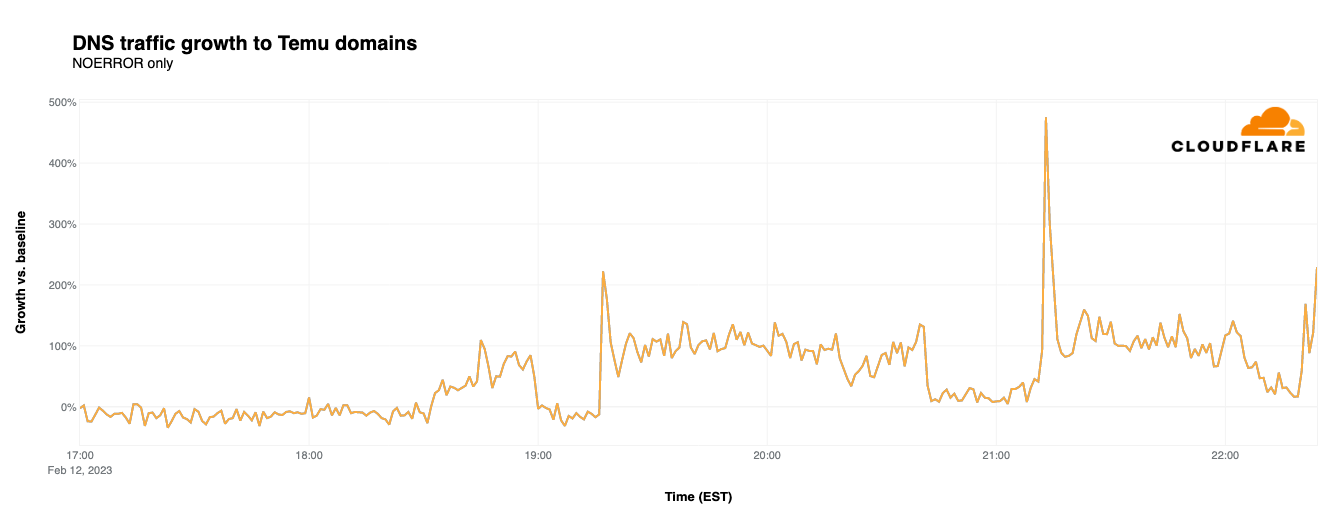
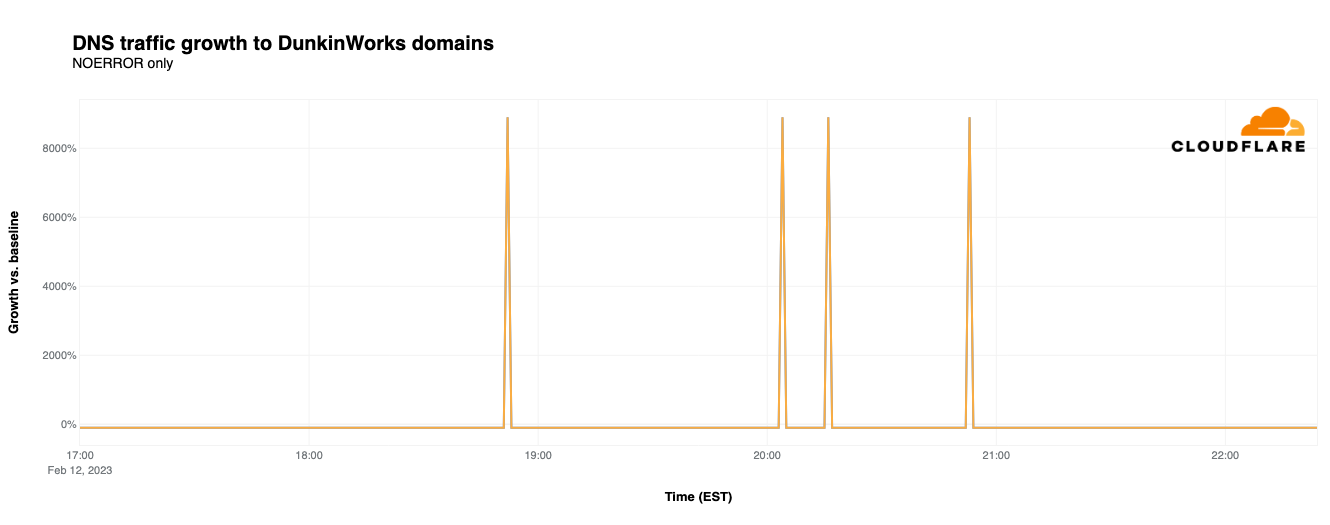
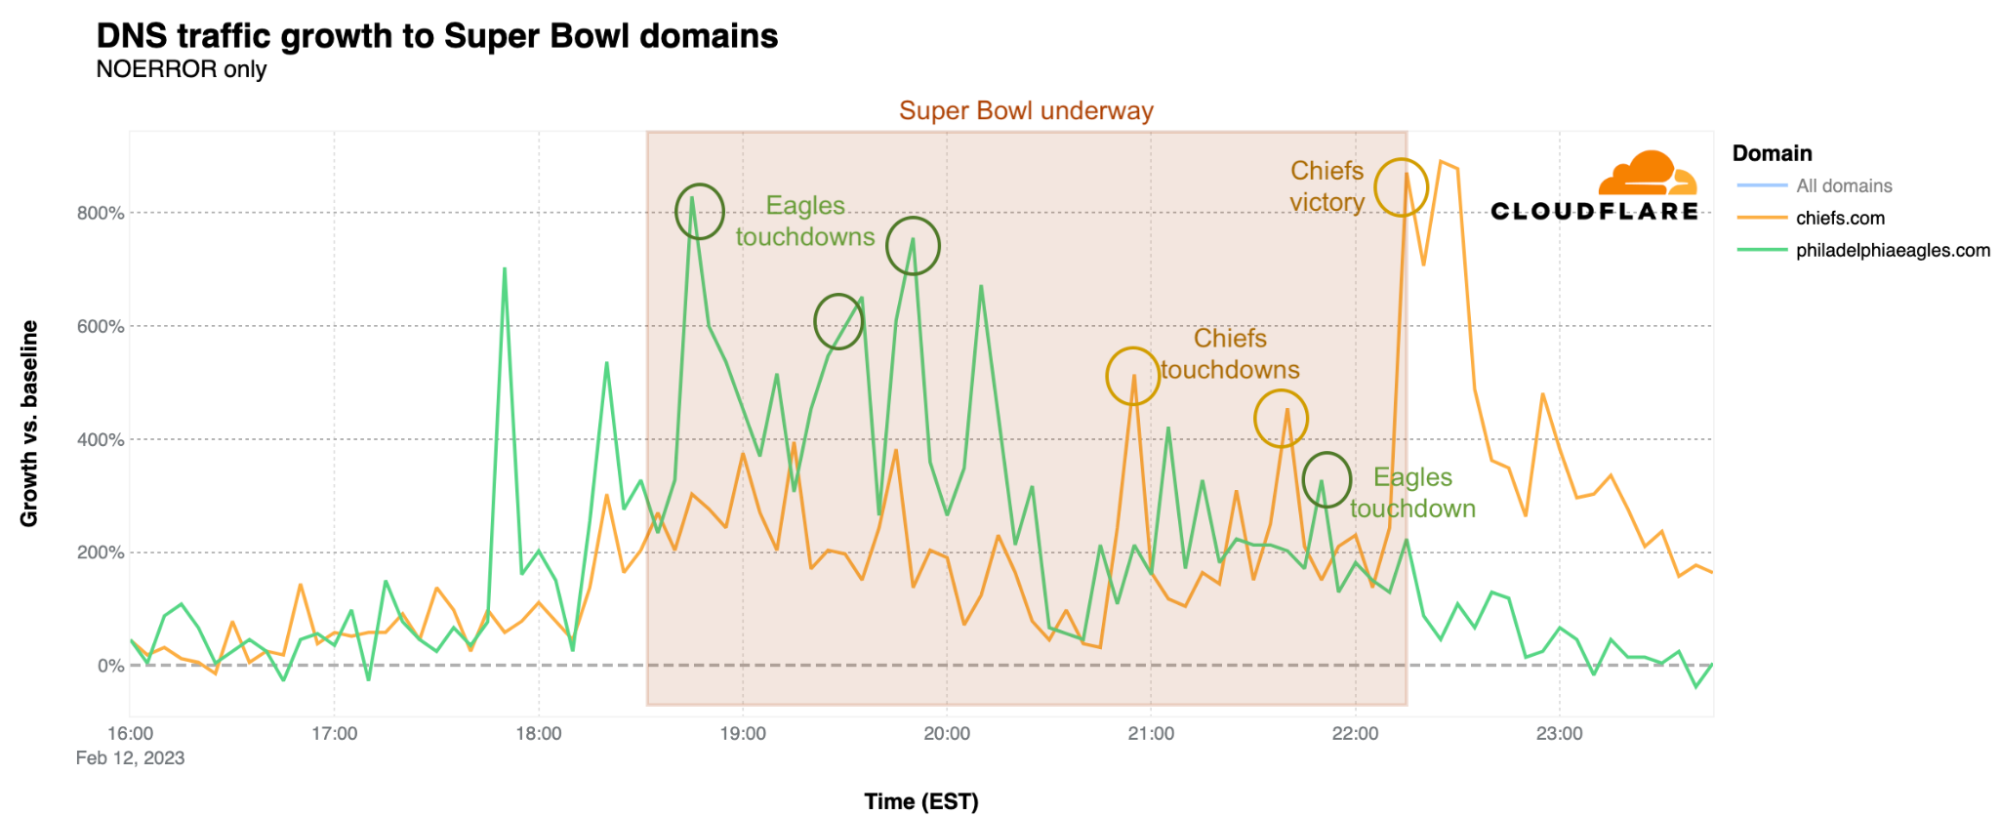
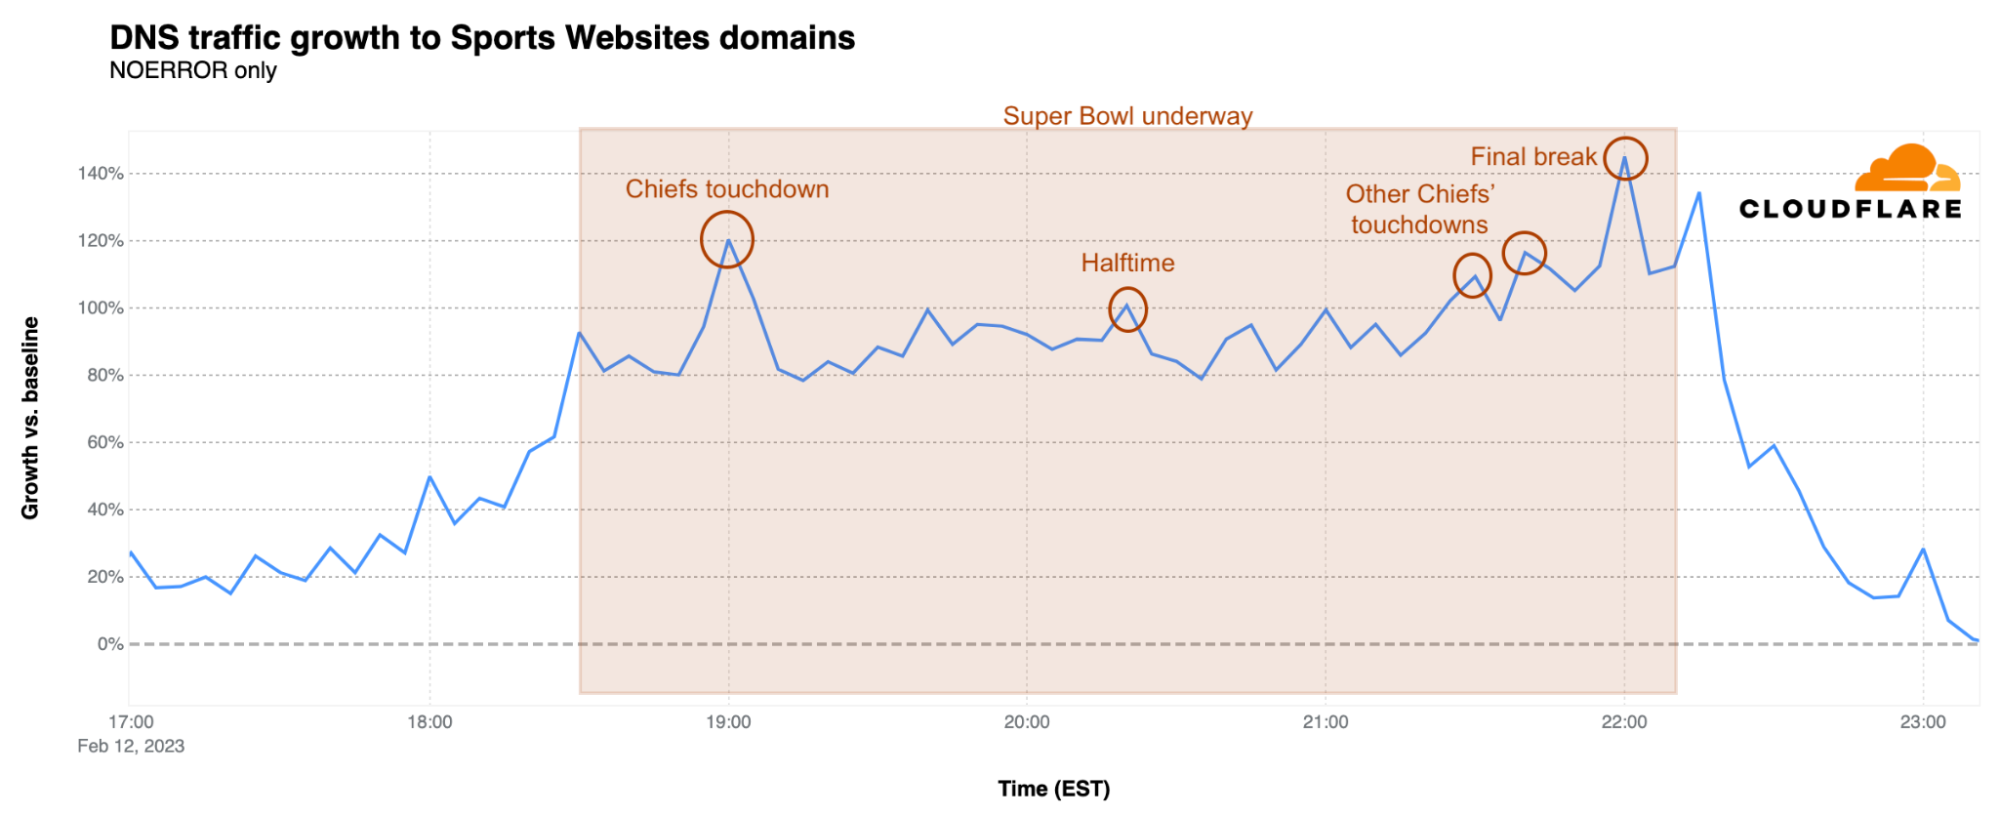
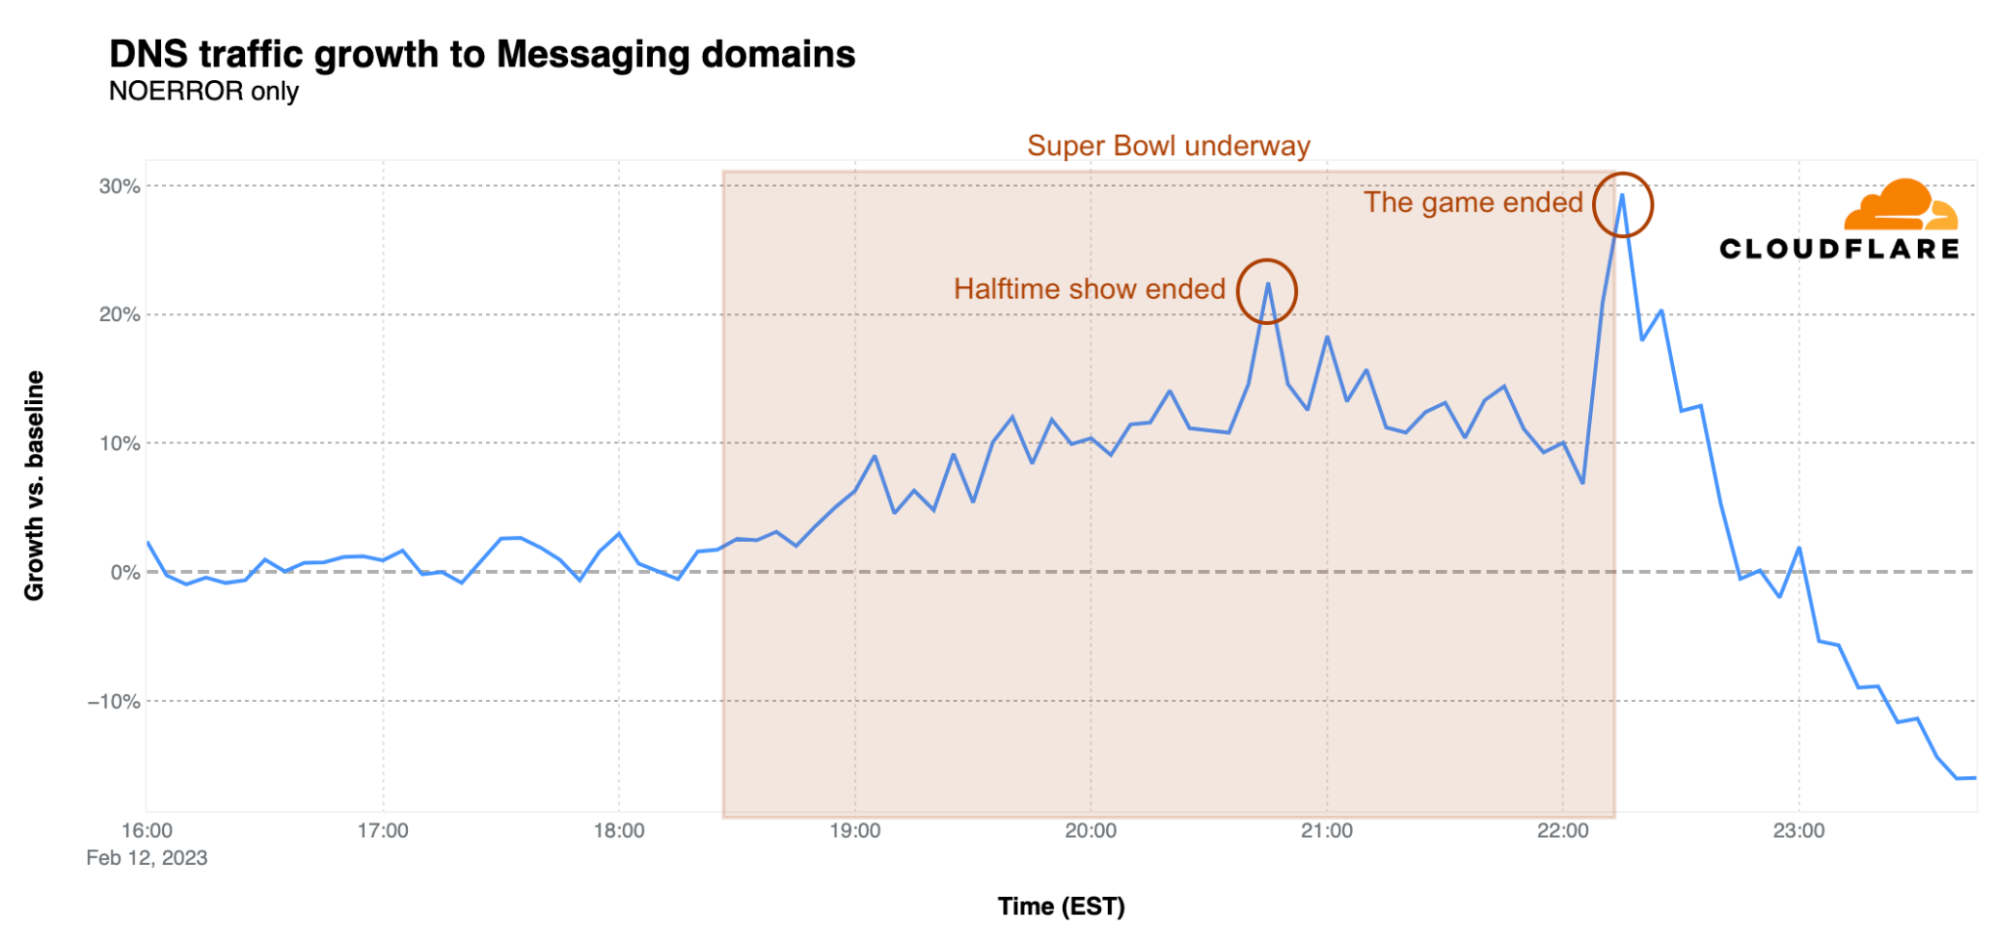
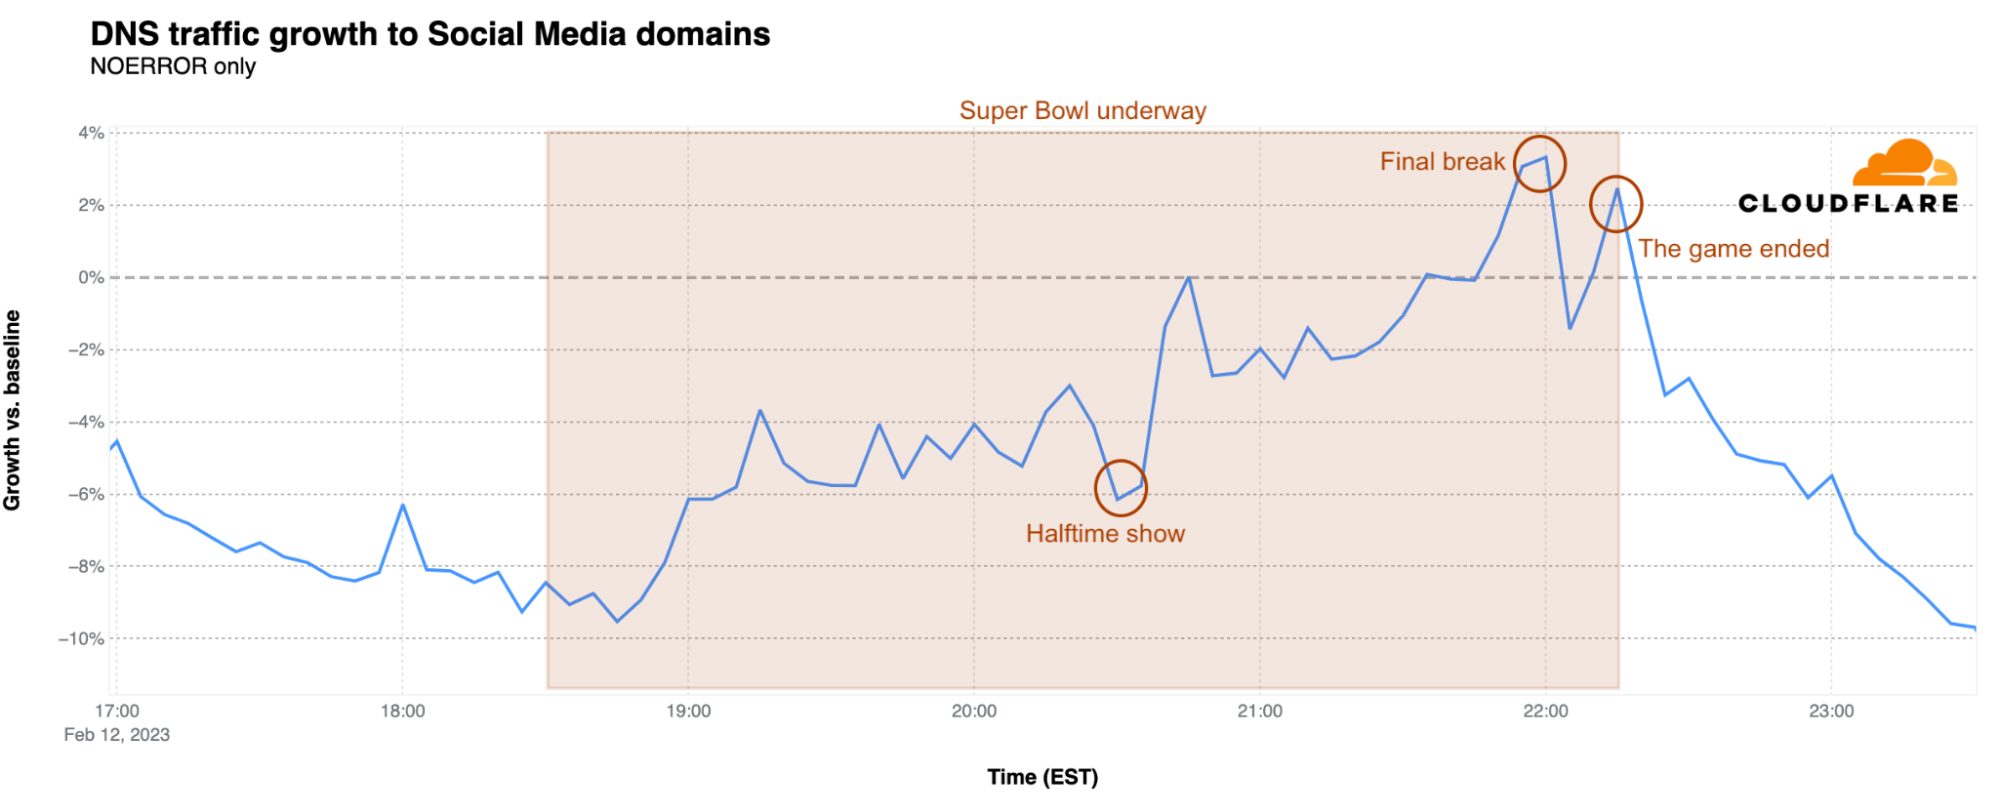
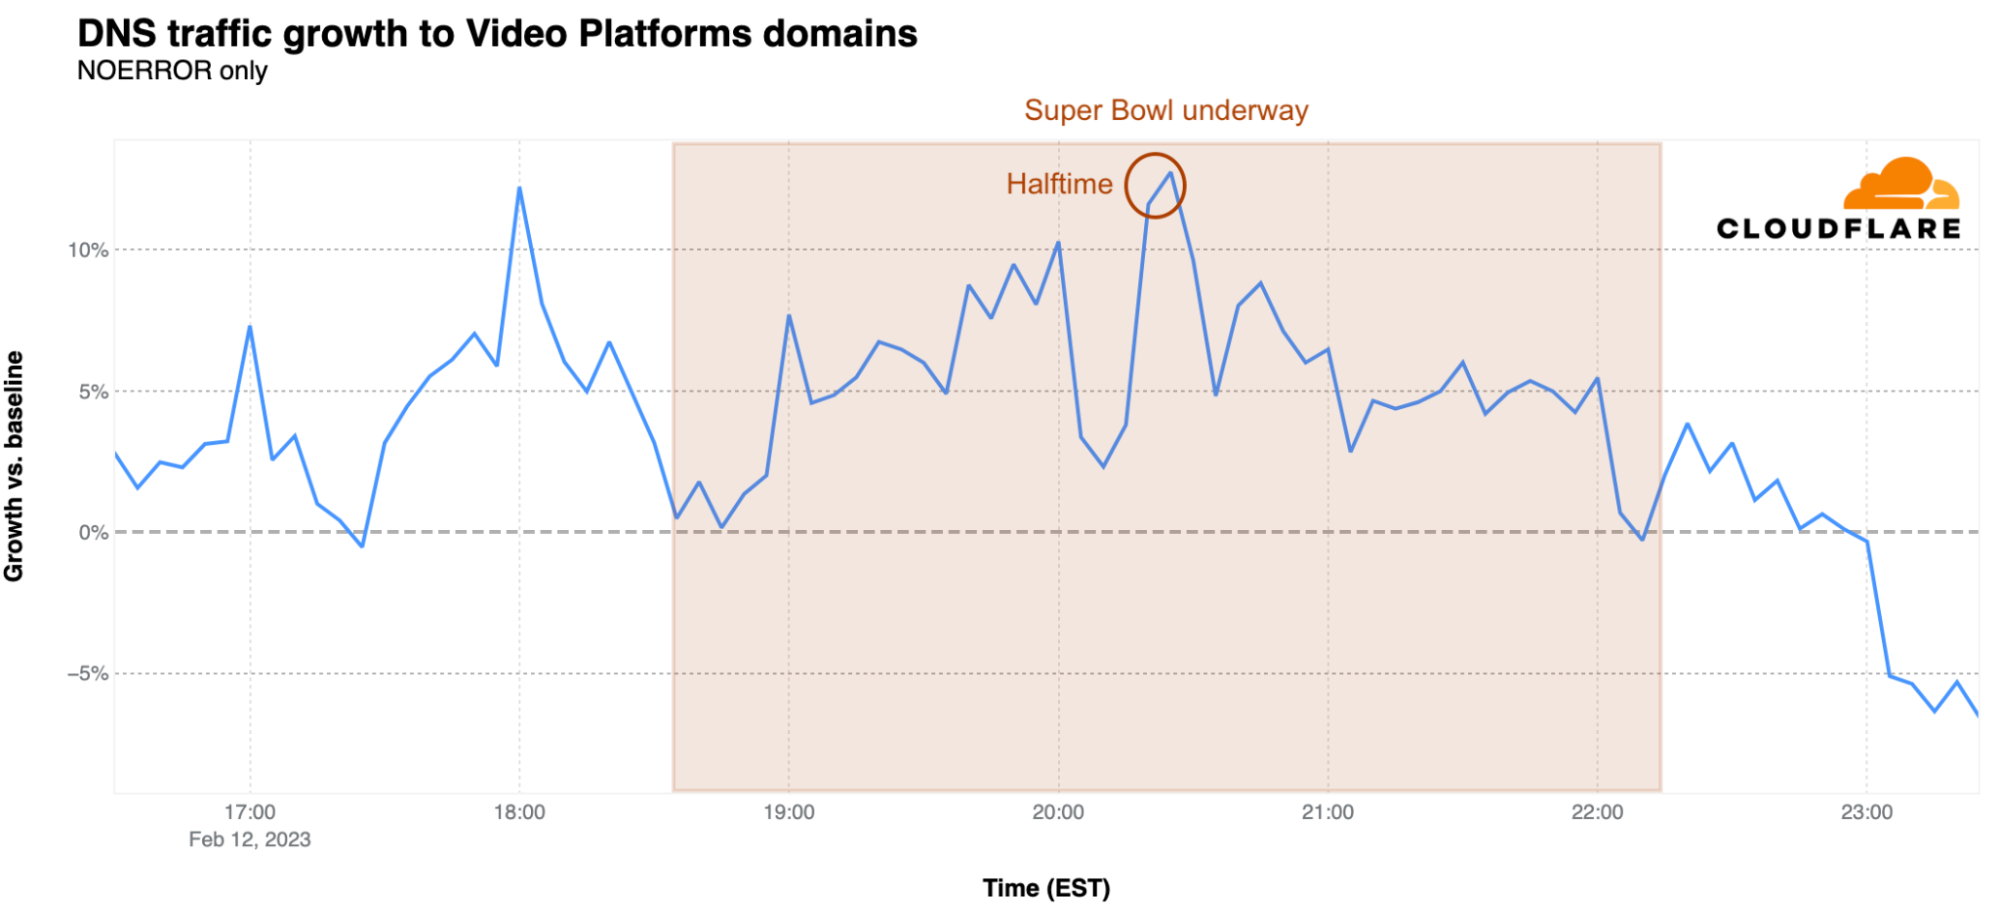
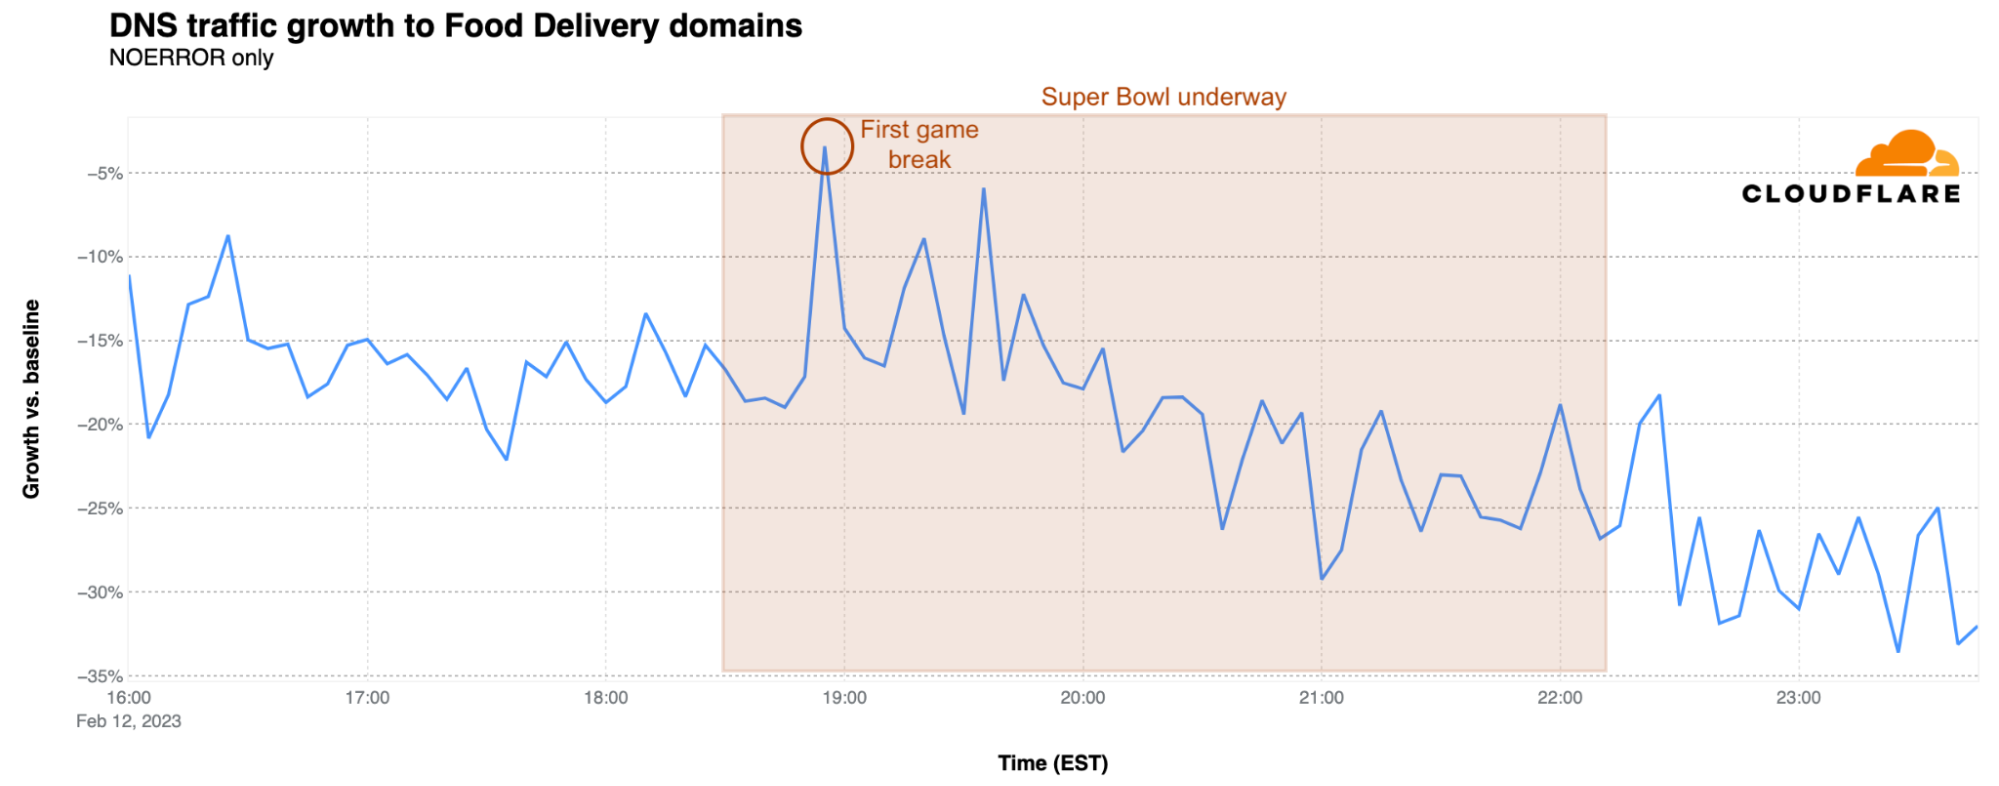
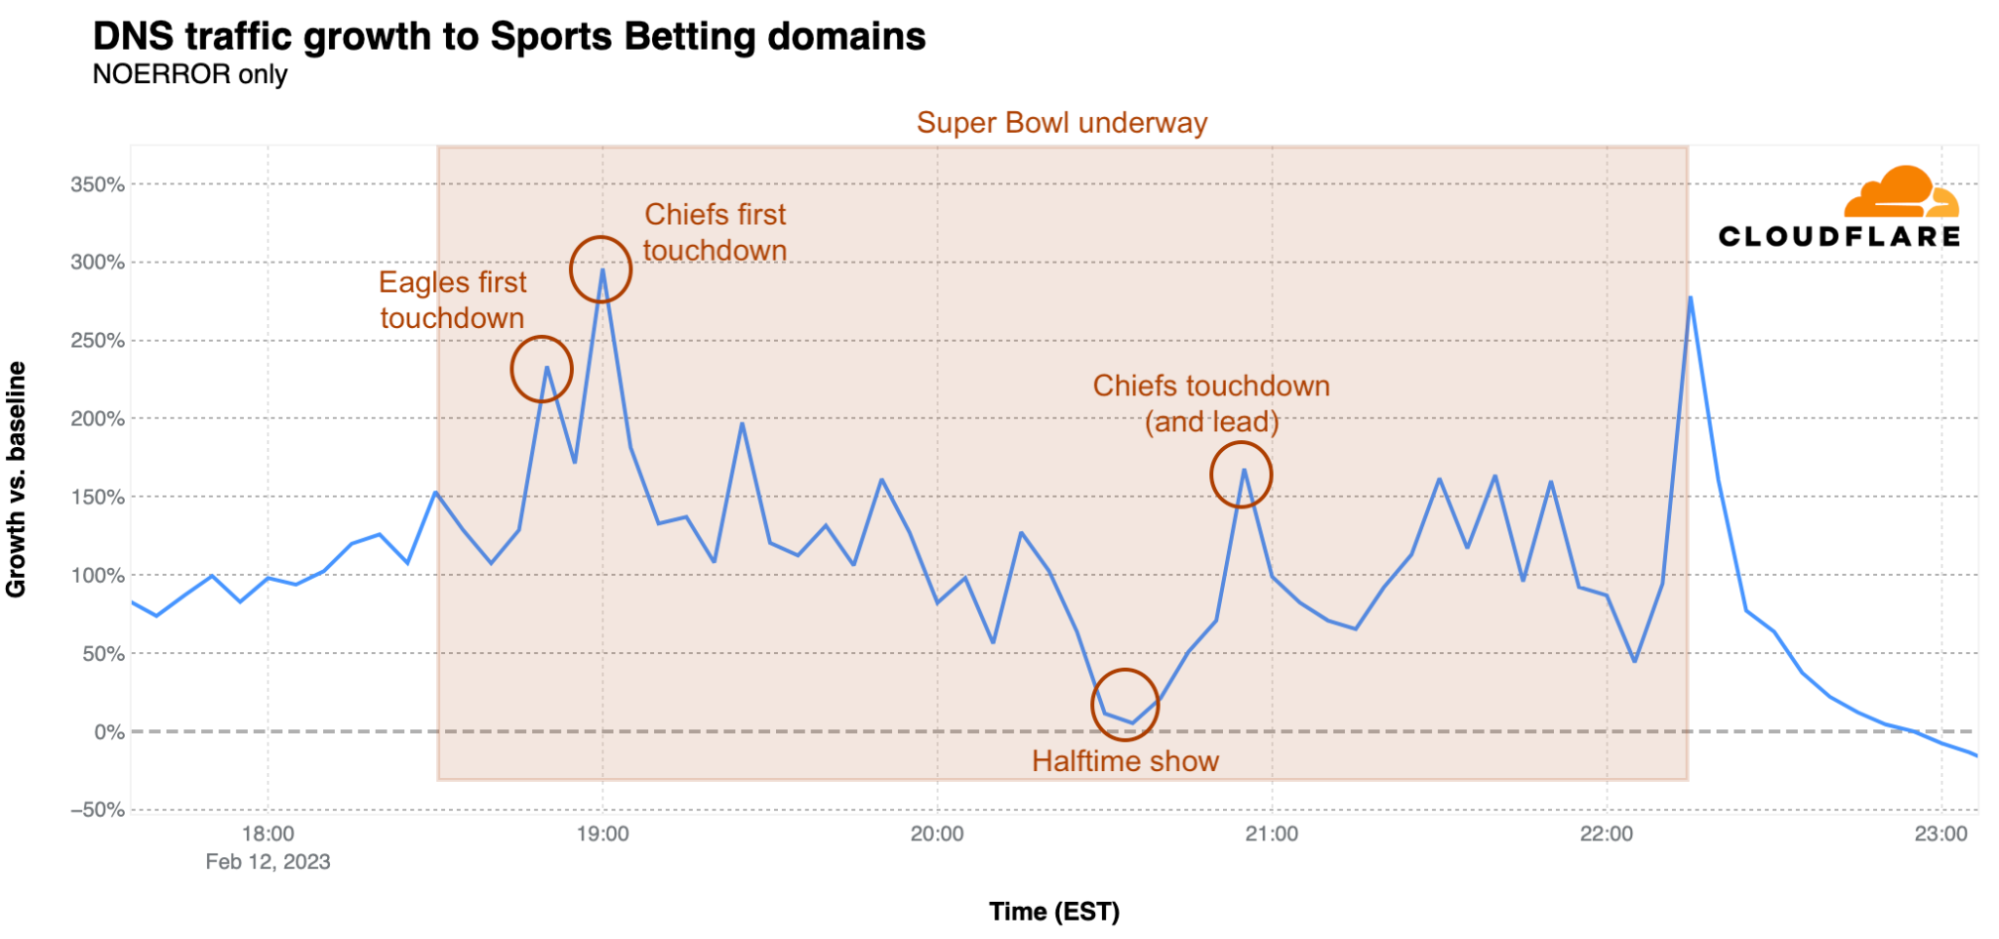
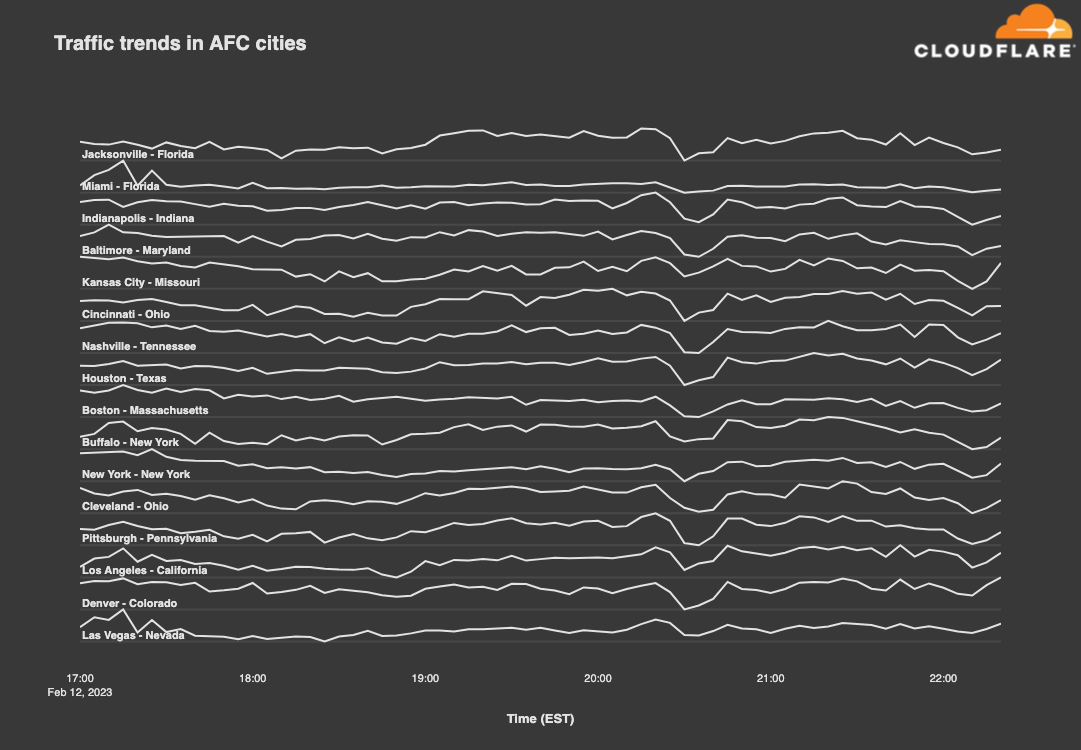
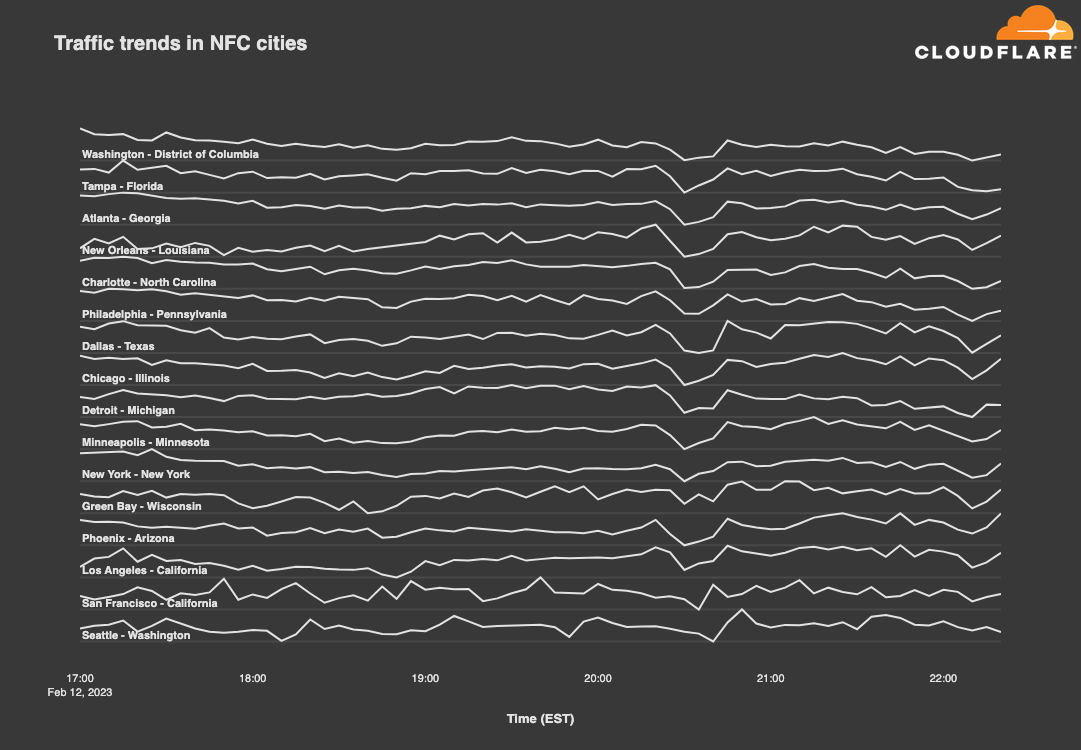
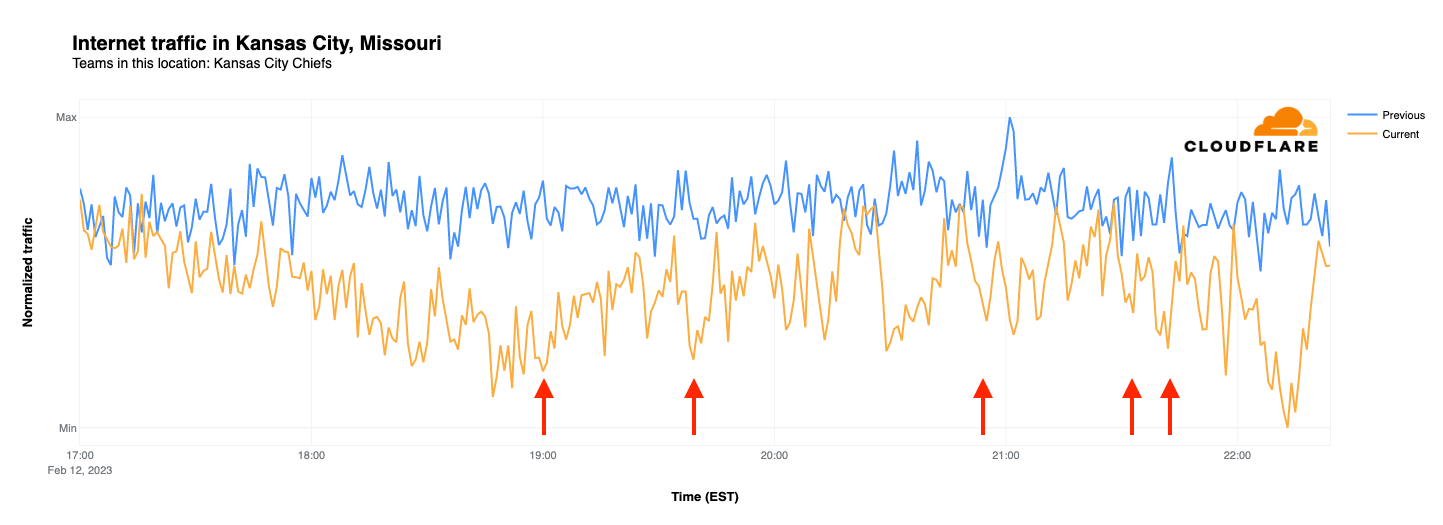
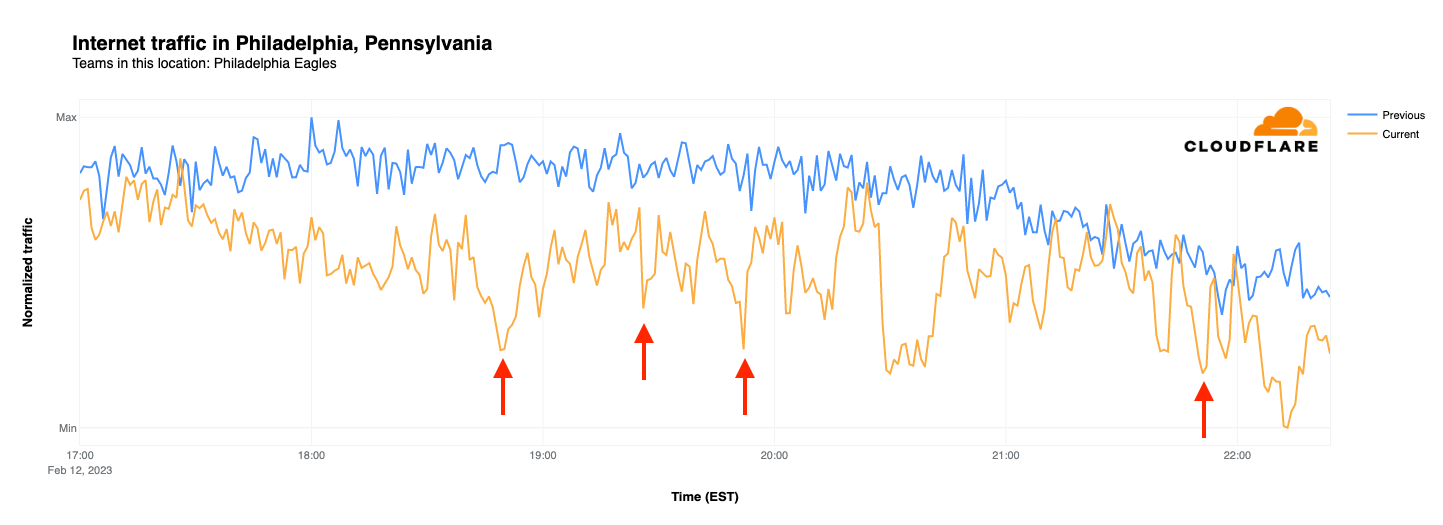
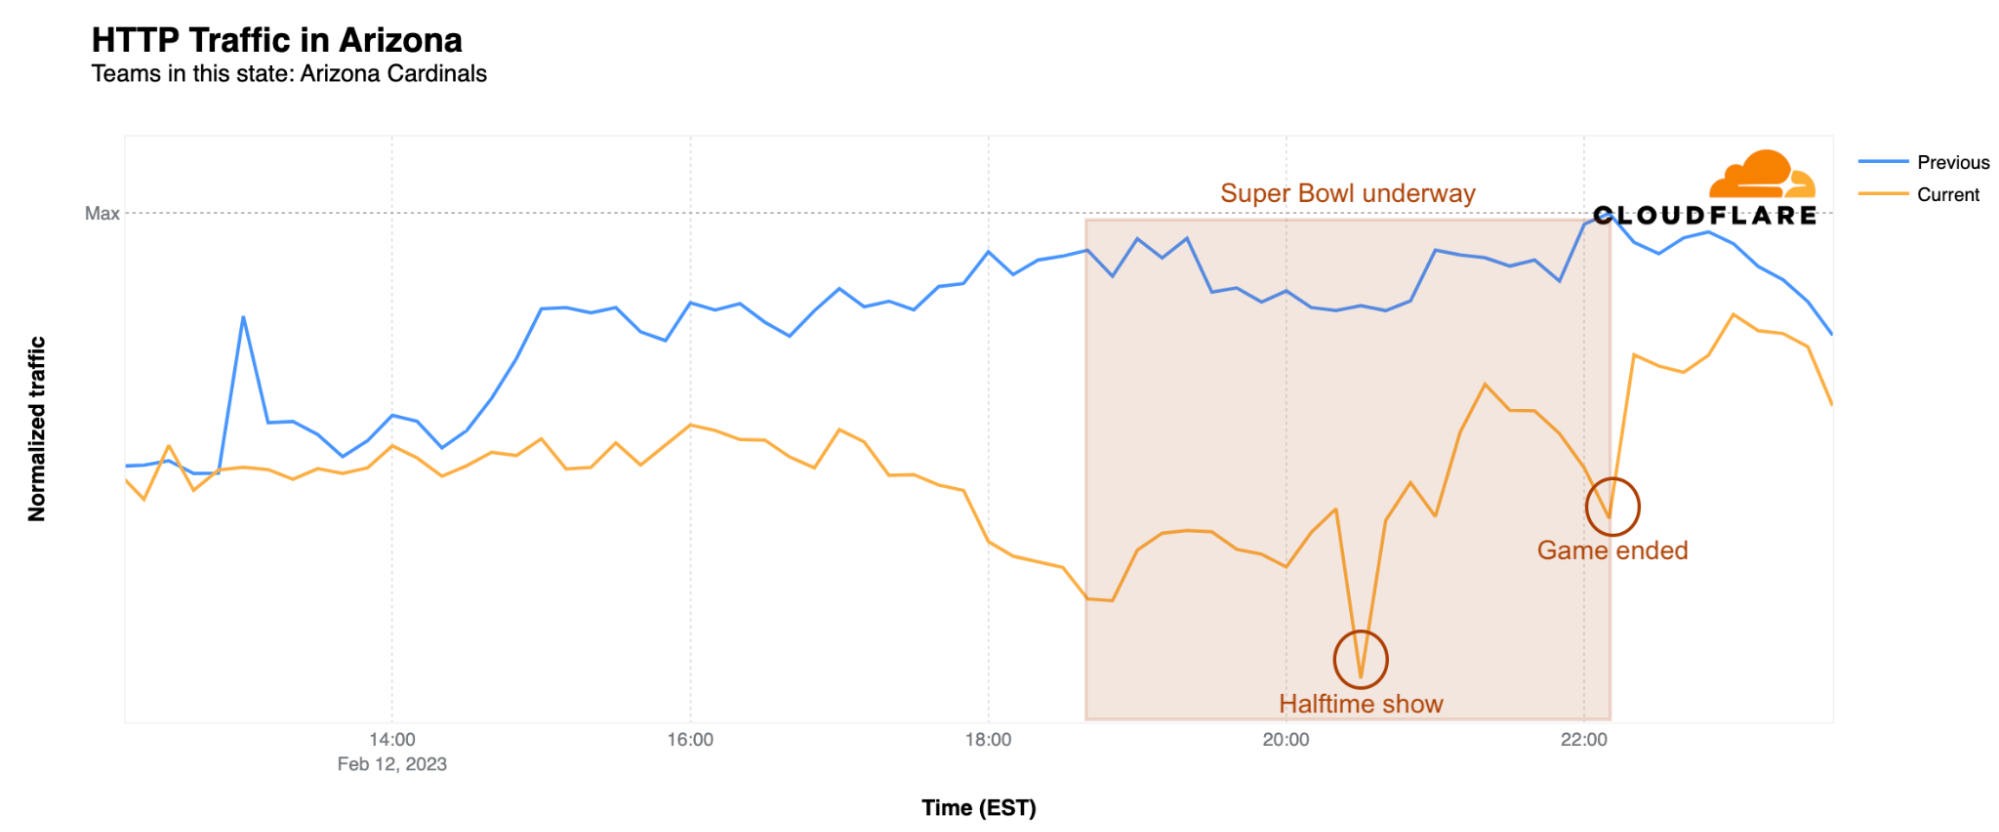
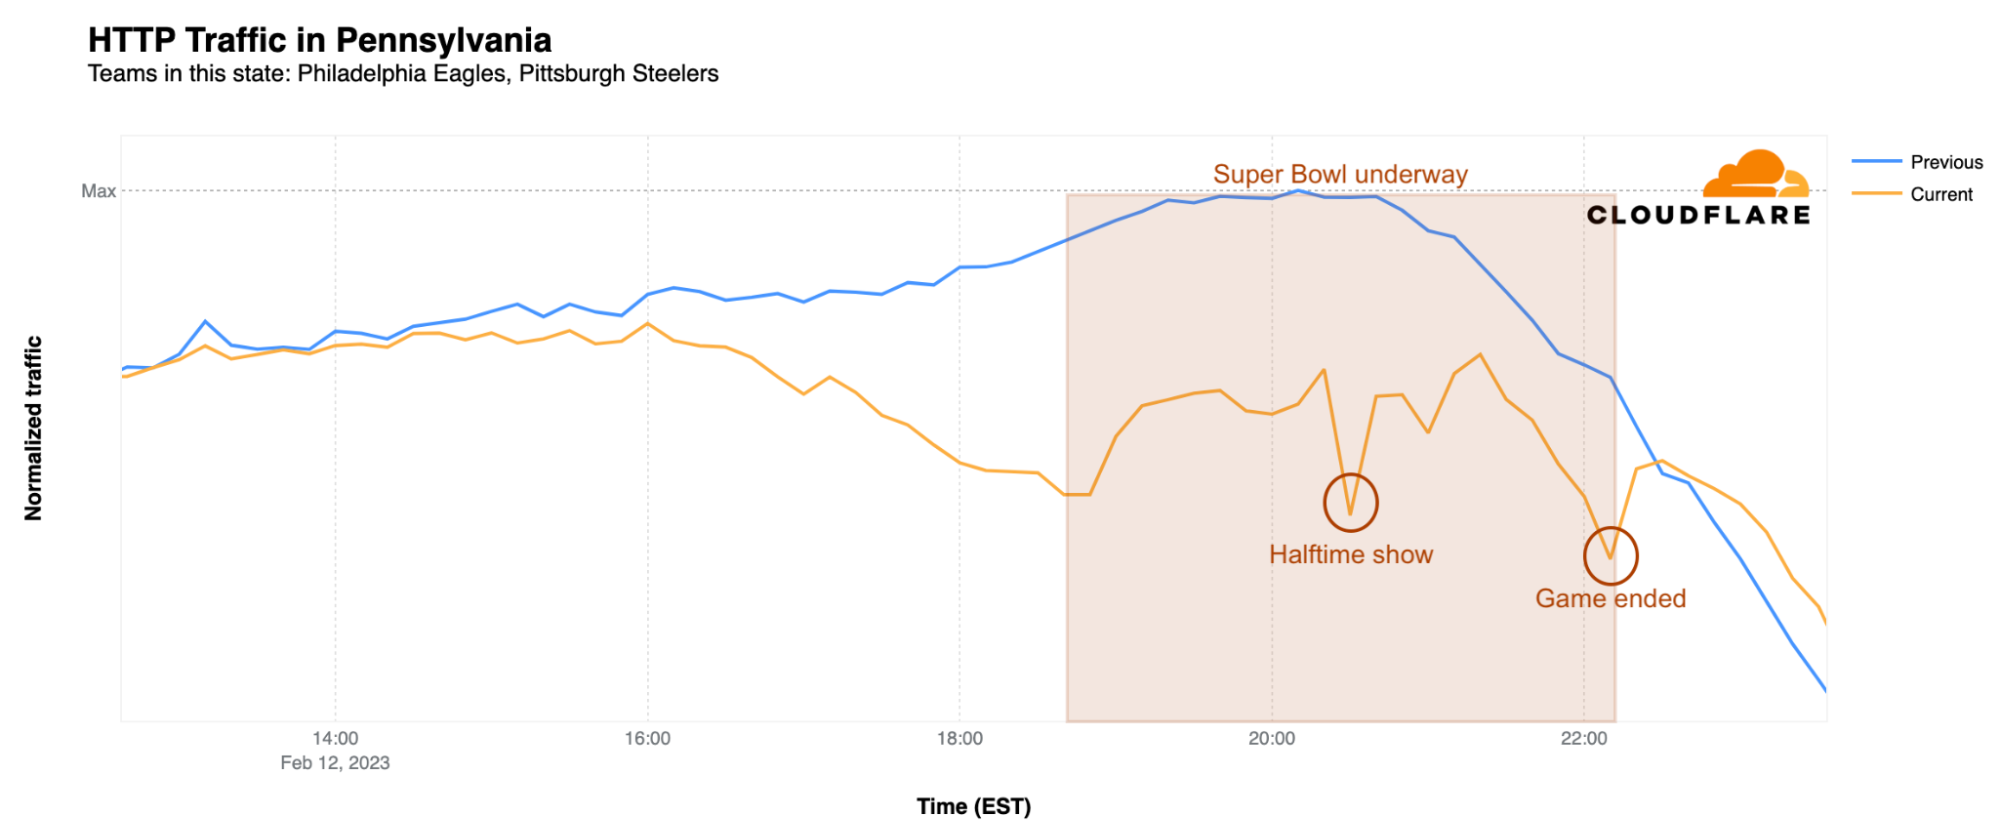
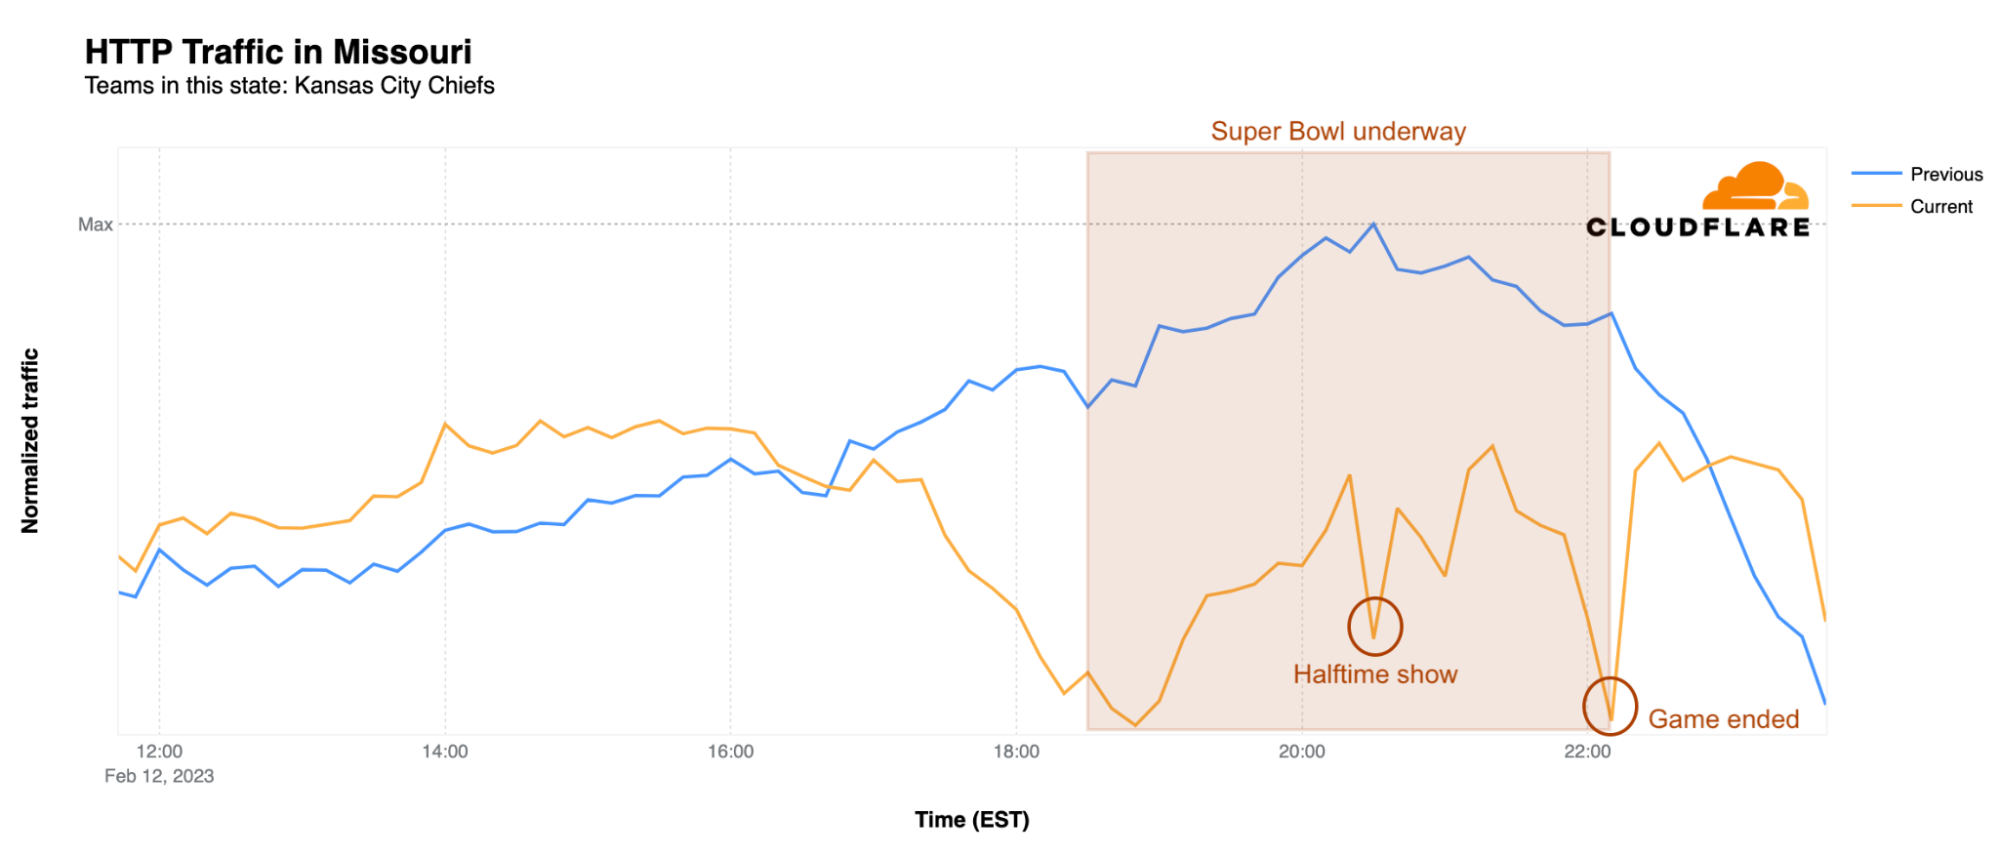
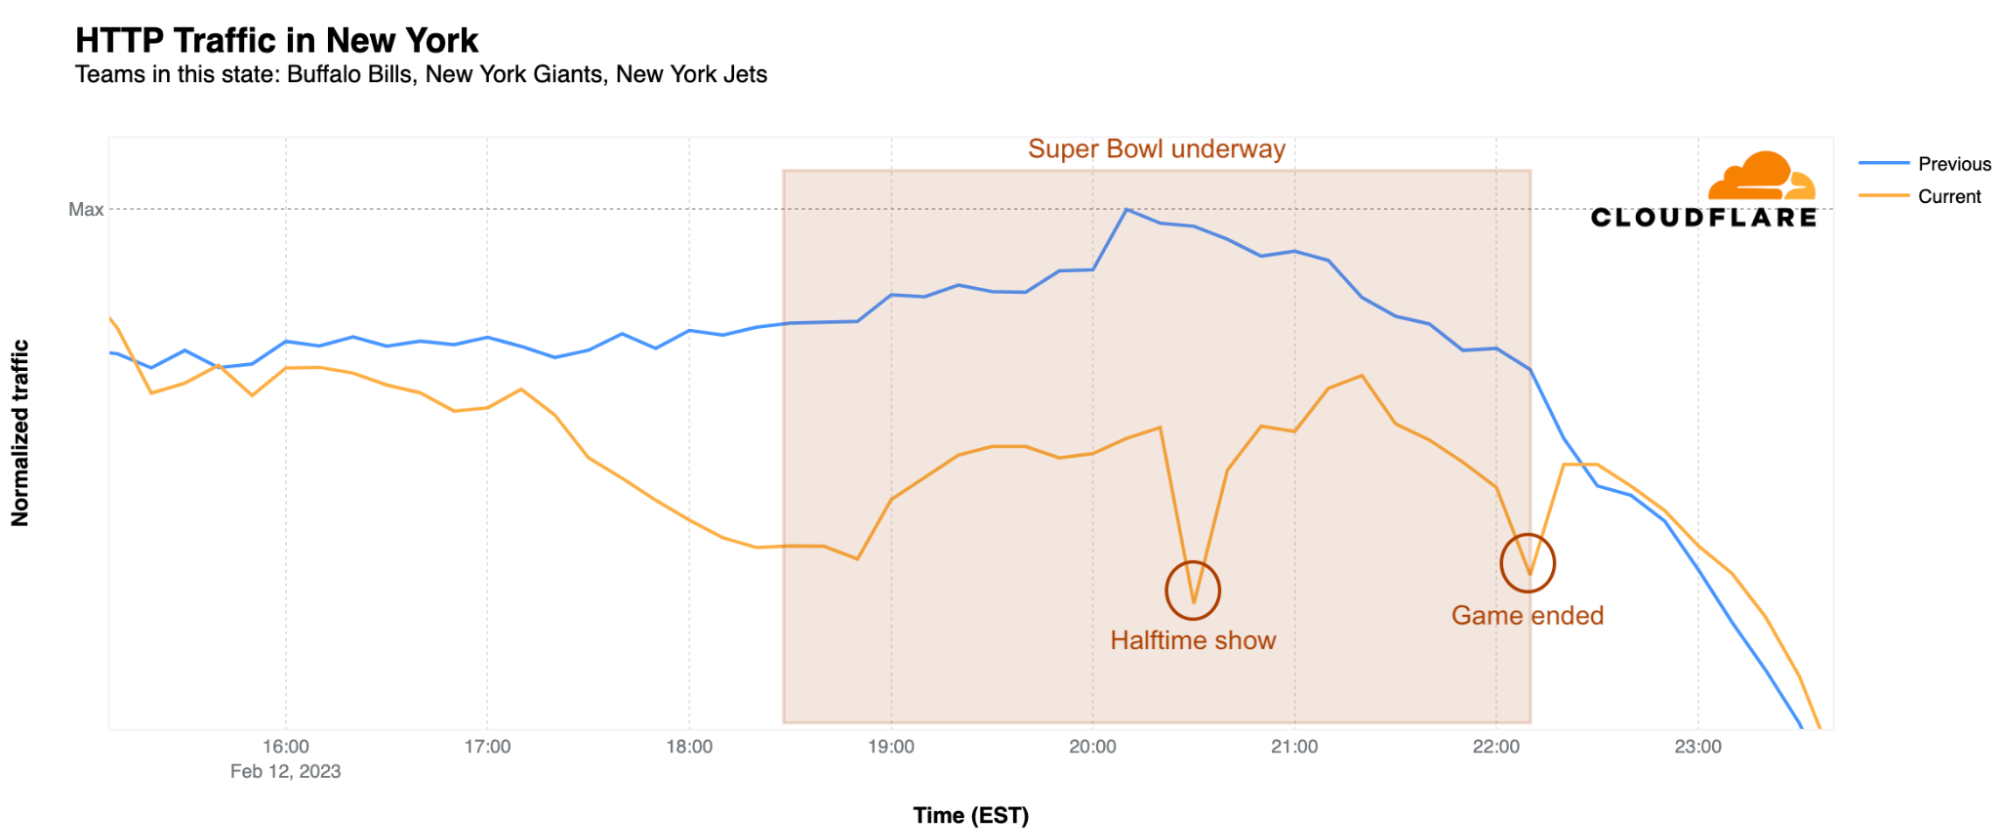
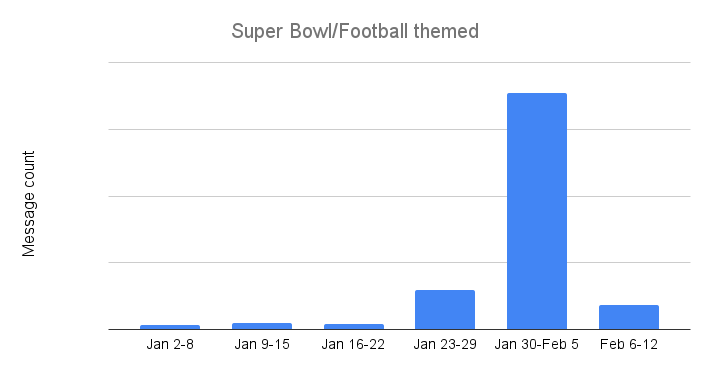
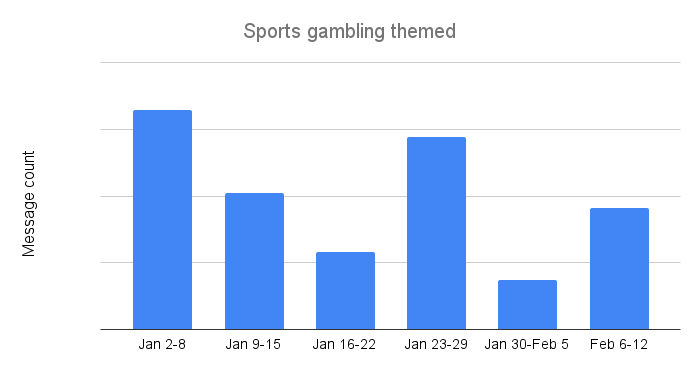
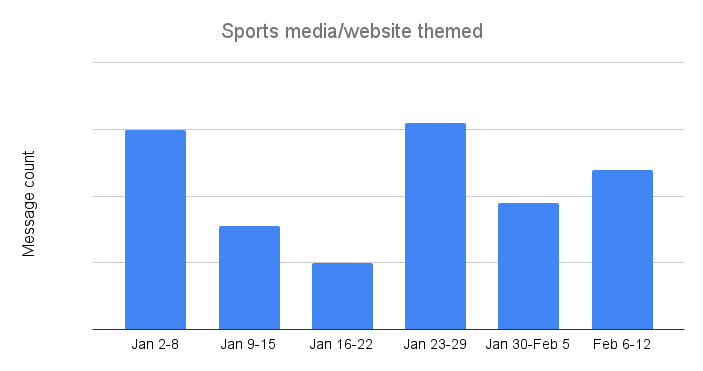
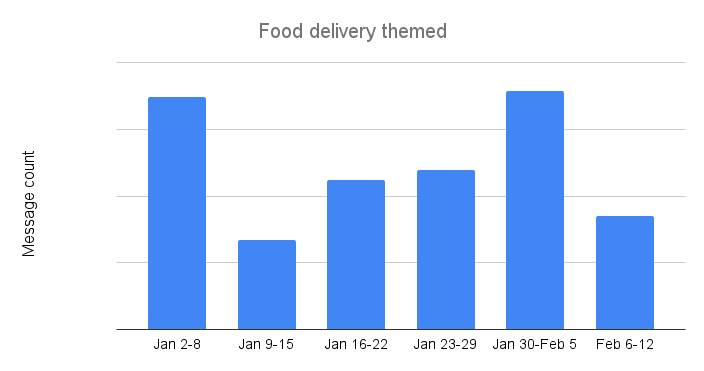


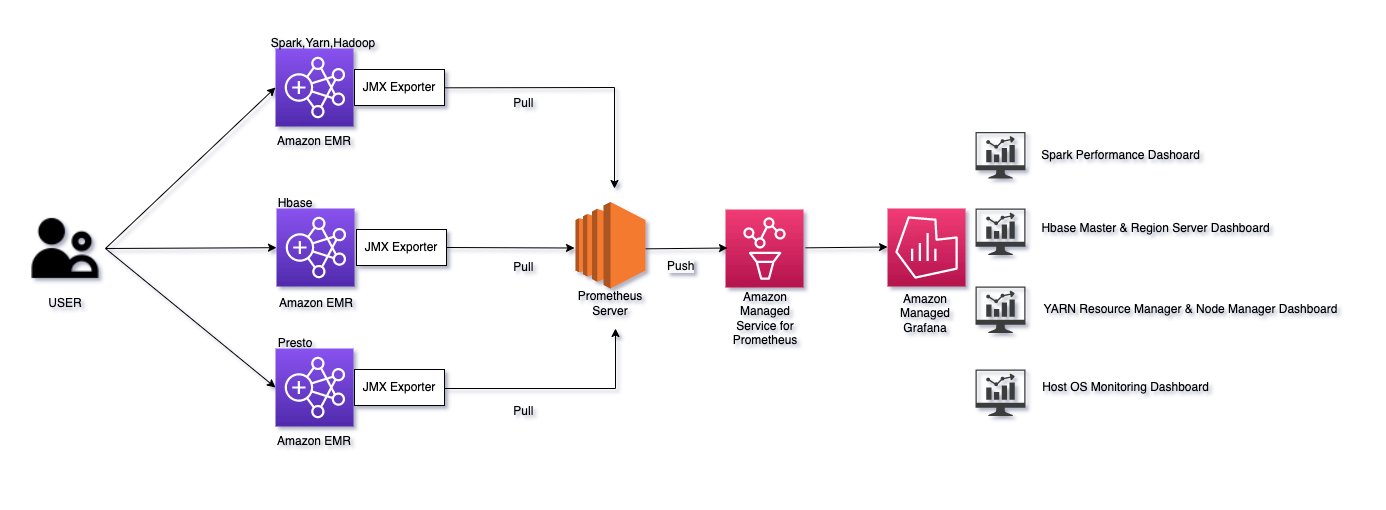


 Anubhav Awasthi is a Sr. Big Data Specialist Solutions Architect at AWS. He works with customers to provide architectural guidance for running analytics solutions on Amazon EMR, Amazon Athena, AWS Glue, and AWS Lake Formation.


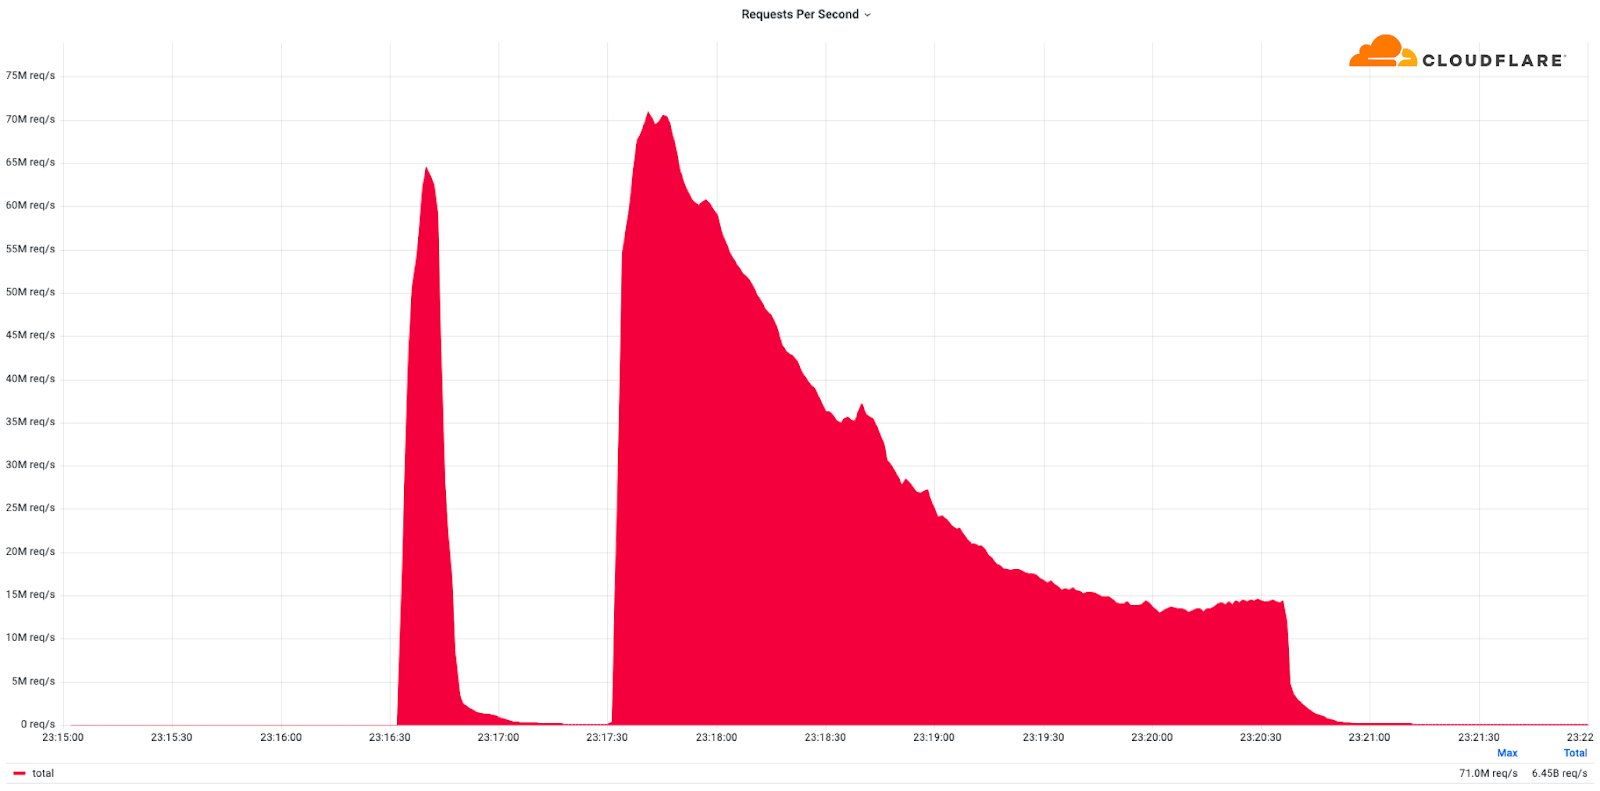
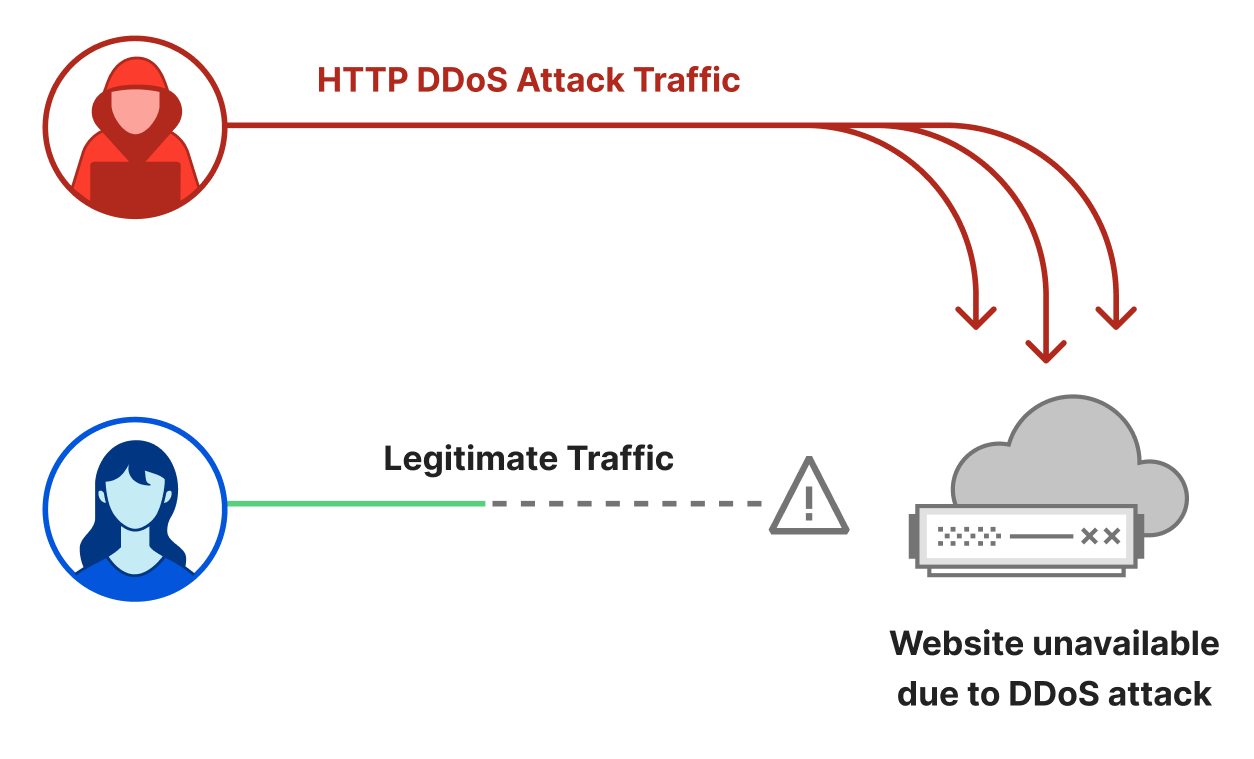
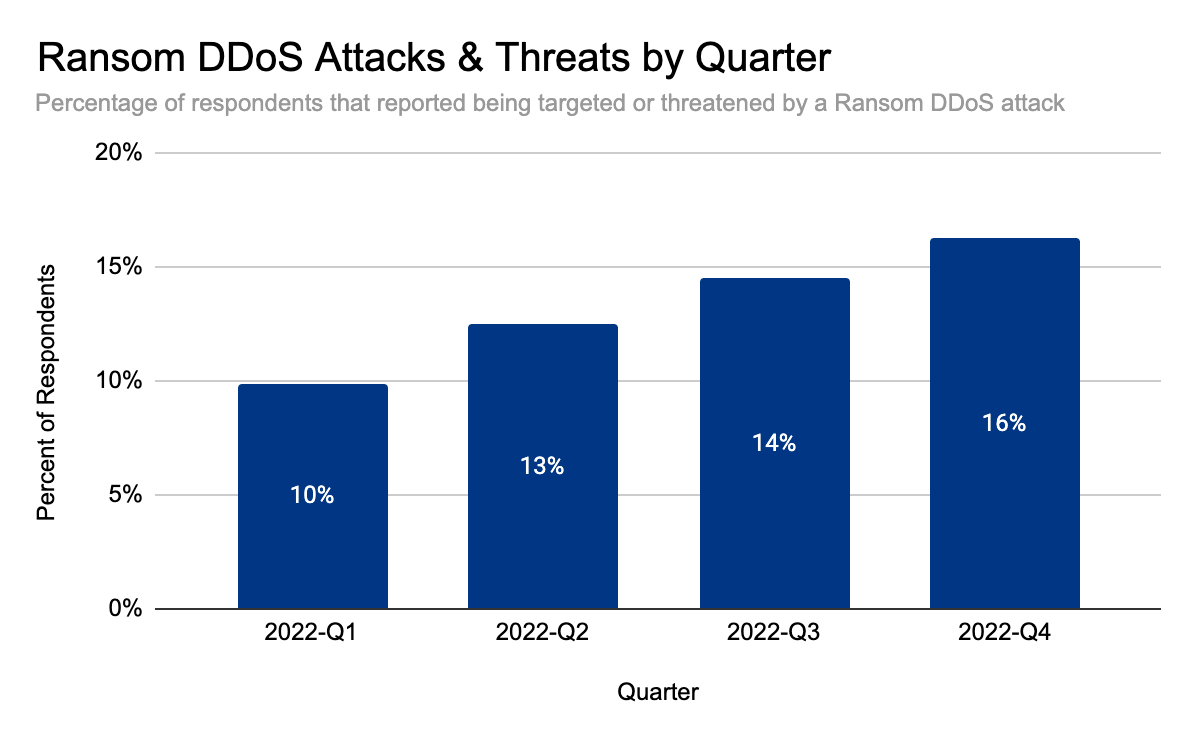
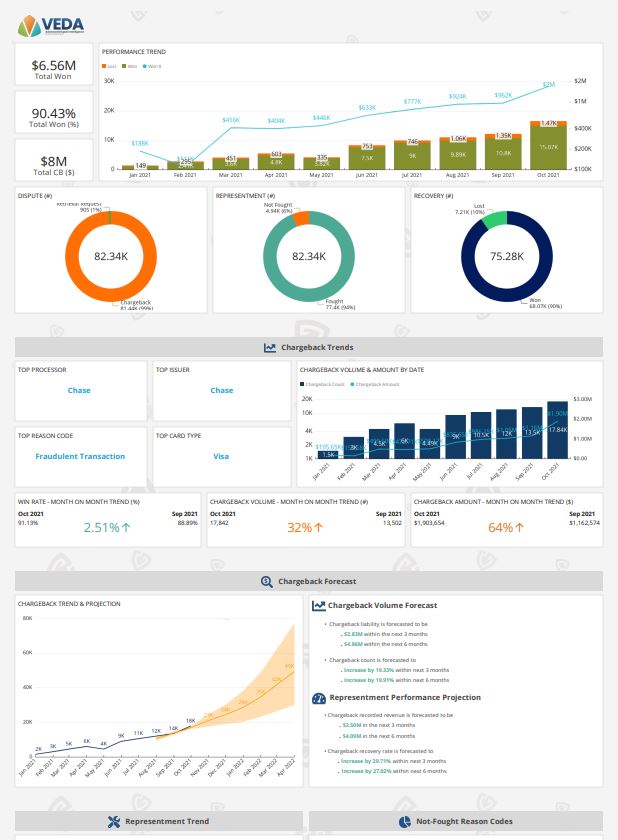
 Suresh Dakshina is the Co-founder & President at Chargeback Gurus. A pioneer in data analytics and industry-specific risk management, he is a certified e-commerce fraud prevention specialist and Certified Payments Professional. He understands first-hand the challenges that business owners face, especially when it comes to chargebacks and fraud. He is a veteran speaker, and works closely with Card Networks like Visa and American Express on chargeback process optimization and compelling evidence policies. He loves spending time with his family and his Labradoodle, Joy, when not working.
 Damodharan Sampathkumar is the Chief Product Officer & GM-India at Chargeback Gurus. He is responsible for product strategy, platform development, and leading innovation for the next generation in payments technology with a specific focus on Chargebacks and Risk mitigation at Chargeback Gurus. He specializes in cloud-native, mission-critical, real-time payment systems, group-up technology platform setup, and operations. He has successfully championed multiple new-age digital payment platforms across North America, Europe, India, and the Middle East for Central Banks, Acquirer processors, and Fintech innovators. He is an avid cyclist and regular endurance rider who loves to ride during his time off to bring the right balance between work and life.