Generating DevOps Guru Proactive Insights for Amazon ECS

Post Syndicated from Trishanka Saikia original https://aws.amazon.com/blogs/devops/generate-devops-guru-proactive-insights-in-ecs-using-container-insights/

Monitoring is fundamental to operating an application in production, since we can only operate what we can measure and alert on. As an application evolves, or the environment grows more complex, it becomes increasingly challenging to maintain monitoring thresholds for each component, and to validate that they’re still set to an effective value. We not only want monitoring alarms to trigger when needed, but also want to minimize false positives.

Amazon DevOps Guru is an AWS service that helps you effectively monitor your application by ingesting vended metrics from Amazon CloudWatch. It learns your application’s behavior over time and then detects anomalies. Based on these anomalies, it generates insights by first combining the detected anomalies with suspected related events from AWS CloudTrail, and then providing the information to you in a simple, ready-to-use dashboard when you start investigating potential issues. Amazon DevOpsGuru makes use of the CloudWatch Containers Insights to detect issues around resource exhaustion for Amazon ECS or Amazon EKS applications. This helps in proactively detecting issues like memory leaks in your applications before they impact your users, and also provides guidance as to what the probable root-causes and resolutions might be.

This post will demonstrate how to simulate a memory leak in a container running in Amazon ECS, and have it generate a proactive insight in Amazon DevOps Guru.

Solution Overview

The following diagram shows the environment we’ll use for our scenario. The container “brickwall-maker” is preconfigured as to how quickly to allocate memory, and we have built this container image and published it to our public Amazon ECR repository. Optionally, you can build and host the docker image in your own private repository as described in step 2 & 3.

After creating the container image, we’ll utilize an AWS CloudFormation template to create an ECS Cluster and an ECS Service called “Test” with a desired count of two. This will create two tasks using our “brickwall-maker” container image. The stack will also enable Container Insights for the ECS Cluster. Then, we will enable resource coverage for this CloudFormation stack in Amazon DevOpsGuru in order to start our resource analysis.

Architecture Diagram showing the service “Test” using the container “brickwall-maker” with a desired count of two. The two ECS Task’s vended metrics are then processed by CloudWatch Container Insights. Both, CloudWatch Container Insights and CloudTrail, are ingested by Amazon DevOps Guru which then makes detected insights available to the user. [Image: DevOpsGuruBlog1.png]V1: DevOpsGuruBlog1.drawio (https://api.quip-amazon.com/2/blob/fbe9AAT37Ge/LdkTqbmlZ8uNj7A44pZbnw?name=DevOpsGuruBlog1.drawio&s=cVbmAWsXnynz) V2: DevOpsGuruBlog1.drawio (https://api.quip-amazon.com/2/blob/fbe9AAT37Ge/SvsNTJLEJOHHBls_kV7EwA?name=DevOpsGuruBlog1.drawio&s=cVbmAWsXnynz) V3: DevOpsGuruBlog1.drawio (https://api.quip-amazon.com/2/blob/fbe9AAT37Ge/DqKTxtQvmOLrzM3KcF_oTg?name=DevOpsGuruBlog1.drawio&s=cVbmAWsXnynz)

Source provided on GitHub:

  • DevOpsGuru.yaml
  • EnableDevOpsGuruForCfnStack.yaml
  • Docker container source

Steps:

1. Create your IDE environment

In the AWS Cloud9 console, click Create environment, give your environment a Name, and click Next step. On the Environment settings page, change the instance type to t3.small, and click Next step. On the Review page, make sure that the Name and Instance type are set as intended, and click Create environment. The environment creation will take a few minutes. After that, the AWS Cloud9 IDE will open, and you can continue working in the terminal tab displayed in the bottom pane of the IDE.

Install the following prerequisite packages, and ensure that you have docker installed:

sudo yum install -y docker
sudo service docker start 
docker --version
Clone the git repository in order to download the required CloudFormation templates and code:

git clone https://github.com/aws-samples/amazon-devopsguru-brickwall-maker

Change to the directory that contains the cloned repository

cd amazon-devopsguru-brickwall-maker

2. Optional : Create ECR private repository

If you want to build your own container image and host it in your own private ECR repository, create a new repository with the following command and then follow the steps to prepare your own image:

aws ecr create-repository —repository-name brickwall-maker

3. Optional: Prepare Docker Image

Authenticate to Amazon Elastic Container Registry (ECR) in the target region

aws ecr get-login-password --region ap-northeast-1 | \
    docker login --username AWS --password-stdin \
    123456789012.dkr.ecr.ap-northeast-1.amazonaws.com

In the above command, as well as in the following shown below, make sure that you replace 123456789012 with your own account ID.

Build brickwall-maker Docker container:

docker build -t brickwall-maker .

Tag the Docker container to prepare it to be pushed to ECR:

docker tag brickwall-maker:latest 123456789012.dkr.ecr.ap-northeast-1.amazonaws.com/brickwall-maker:latest

Push the built Docker container to ECR

docker push 123456789012.dkr.ecr.ap-northeast-1.amazonaws.com/brickwall-maker:latest

4. Launch the CloudFormation template to deploy your ECS infrastructure

To deploy your ECS infrastructure, run the following command (replace your own private ECR URL or use our public URL) in the ParameterValue) to launch the CloudFormation template :

aws cloudformation create-stack --stack-name myECS-Stack \
--template-body file://DevOpsGuru.yaml \
--capabilities CAPABILITY_IAM CAPABILITY_NAMED_IAM \
--parameters ParameterKey=ImageUrl,ParameterValue=public.ecr.aws/p8v8e7e5/myartifacts:brickwallv1

5. Enable DevOps Guru to monitor the ECS Application

Run the following command to enable DevOps Guru for monitoring your ECS application:

aws cloudformation create-stack \
--stack-name EnableDevOpsGuruForCfnStack \
--template-body file://EnableDevOpsGuruForCfnStack.yaml \
--parameters ParameterKey=CfnStackNames,ParameterValue=myECS-Stack

6. Wait for base-lining of resources

This step lets DevOps Guru complete the baselining of the resources and benchmark the normal behavior. For this particular scenario, we recommend waiting two days before any insights are triggered.

Unlike other monitoring tools, the DevOps Guru dashboard would not present any counters or graphs. In the meantime, you can utilize CloudWatch Container Insights to monitor the cluster-level, task-level, and service-level metrics in ECS.

7. View Container Insights metrics

  • Open the CloudWatch console.
  • In the navigation pane, choose Container Insights.
  • Use the drop-down boxes near the top to select ECS Services as the resource type to view, then select DevOps Guru as the resource to monitor.
  • The performance monitoring view will show you graphs for several metrics, including “Memory Utilization”, which you can watch increasing from here. In addition, it will show the list of tasks in the lower “Task performance” pane showing the “Avg CPU” and “Avg memory” metrics for the individual tasks.

8. Review DevOps Guru insights

When DevOps Guru detects an anomaly, it generates a proactive insight with the relevant information needed to investigate the anomaly, and it will list it in the DevOps Guru Dashboard.

You can view the insights by clicking on the number of insights displayed in the dashboard. In our case, we expect insights to be shown in the “proactive insights” category on the dashboard.

Once you have opened the insight, you will see that the insight view is divided into the following sections:

  • Insight Overview with a basic description of the anomaly. In this case, stating that Memory Utilization is approaching limit with details of the stack that is being affected by the anomaly.
  • Anomalous metrics consisting of related graphs and a timeline of the predicted impact time in the future.
  • Relevant events with contextual information, such as changes or updates made to the CloudFormation stack’s resources in the region.
  • Recommendations to mitigate the issue. As seen in the following screenshot, it recommends troubleshooting High CPU or Memory Utilization in ECS along with a link to the necessary documentation.

The following screenshot illustrates an example insight detail page from DevOps Guru

 An example of an ECS Service’s Memory Utilization approaching a limit of 100%. The metric graph shows the anomaly starting two days ago at about 22:00 with memory utilization increasing steadily until the anomaly was reported today at 18:08. The graph also shows a forecast of the memory utilization with a predicted impact of reaching 100% the next day at about 22:00.

Potentially related events on a timeline and below them a list of recommendations. Two deployment events are shown without further details on a timeline. The recommendations table links to one document on how to troubleshoot high CPU or memory utilization in Amazon ECS.

Conclusion

This post describes how DevOps Guru continuously monitors resources in a particular region in your AWS account, as well as proactively helps identify problems around resource exhaustion such as running out of memory, in advance. This helps IT operators take preventative actions even before a problem presents itself, thereby preventing downtime.

Cleaning up

After walking through this post, you should clean up and un-provision the resources in order to avoid incurring any further charges.

  1. To un-provision the CloudFormation stacks, on the AWS CloudFormation console, choose Stacks. Select the stack name, and choose Delete.
  2. Delete the AWS Cloud9 environment.
  3. Delete the ECR repository.

About the authors

Trishanka Saikia

Trishanka Saikia is a Technical Account Manager for AWS. She is also a DevOps enthusiast and works with AWS customers to design, deploy, and manage their AWS workloads/architectures.

Gerhard Poul

Gerhard Poul is a Senior Solutions Architect at Amazon Web Services based in Vienna, Austria. Gerhard works with customers in Austria to enable them with best practices in their cloud journey. He is passionate about infrastructure as code and how cloud technologies can improve IT operations.

Exploring Data Transfer Costs for AWS Managed Databases

Post Syndicated from Dennis Schmidt original https://aws.amazon.com/blogs/architecture/exploring-data-transfer-costs-for-aws-managed-databases/

When selecting managed database services in AWS, it’s important to understand how data transfer charges are calculated – whether it’s relational, key-value, document, in-memory, graph, time series, wide column, or ledger.

This blog will outline the data transfer charges for several AWS managed database offerings to help you choose the most cost-effective setup for your workload.

This blog illustrates pricing at the time of publication and assumes no volume discounts or applicable taxes and duties. For demonstration purposes, we list the primary AWS Region as US East (Northern Virginia) and the secondary Region is US West (Oregon). Always refer to the individual service pricing pages for the most up-to-date pricing.

Data transfer between AWS and internet

There is no charge for inbound data transfer across all services in all Regions. When you transfer data from AWS resources to the internet, you’re charged per service, with rates specific to the originating Region. Figure 1 illustrates data transfer charges that accrue from AWS services discussed in this blog out to the public internet in the US East (Northern Virginia) Region.

Data transfer to the internet

Figure 1. Data transfer to the internet

The remainder of this blog will focus on data transfer within AWS.

Data transfer with Amazon RDS

Amazon Relational Database Service (Amazon RDS) makes it straightforward to set up, operate, and scale a relational database in the cloud. Amazon RDS provides six database engines to choose from: Amazon Aurora, MySQL, MariaDB, Oracle, SQL Server, and PostgreSQL.

Let’s consider an application running on Amazon Elastic Compute Cloud (Amazon EC2) that uses Amazon RDS as a data store.

Figure 2 illustrates where data transfer charges apply. For clarity, we have left out connection points to the replica servers – this is addressed in Figure 3.

Amazon RDS data transfer

Figure 2. Amazon RDS data transfer

In this setup, you will not incur charges for:

  • Data transfer to or from Amazon EC2 in the same Region, Availability Zone, and virtual private cloud (VPC)

You will accrue charges for data transfer between:

  • Amazon EC2 and Amazon RDS across Availability Zones within the same VPC, charged at Amazon EC2 and Amazon RDS ($0.01/GB in and $0.01/GB out)
  • Amazon EC2 and Amazon RDS across Availability Zones and across VPCs, charged at Amazon EC2 only ($0.01/GB in and $0.01/GB out). For Aurora, this is charged at Amazon EC2 and Aurora ($0.01/GB in and $0.01/GB out)
  • Amazon EC2 and Amazon RDS across Regions, charged on both sides of the transfer ($0.02/GB out)

Figure 3 illustrates several features that are available within Amazon RDS to show where data transfer charges apply. These include multi-Availability Zone deployment, read replicas, and cross-Region automated backups. Not all database engines support all features, consult the product documentation to learn more.

Amazon RDS features

Figure 3. Amazon RDS features

In this setup, you will not incur data transfer charges for:

In addition to the charges you will incur when you transfer data to the internet, you will accrue data transfer charges for:

  • Data replication to read replicas deployed across Regions ($0.02/GB out)
  • Regional transfers for Amazon RDS snapshot copies or automated cross-Region backups ($0.02/GB out)

Refer to the following pricing pages for more detail:

Data transfer with Amazon DynamoDB

Amazon DynamoDB is a key-value and document database that delivers single-digit millisecond performance at any scale. Figures 4 and 5 illustrate an application hosted on Amazon EC2 that uses DynamoDB as a data store and includes DynamoDB global tables and DynamoDB Accelerator (DAX).

DynamoDB with global tables

Figure 4. DynamoDB with global tables

DynamoDB without global tables

Figure 5. DynamoDB without global tables

You will not incur data transfer charges for:

  • Inbound data transfer to DynamoDB
  • Data transfer between DynamoDB and Amazon EC2 in the same Region
  • Data transfer between Amazon EC2 and DAX in the same Availability Zone

In addition to the charges you will incur when you transfer data to the internet, you will accrue charges for data transfer between:

  • Amazon EC2 and DAX across Availability Zones, charged at the EC2 instance ($0.01/GB in and $0.01/GB out)
  • Global tables for cross-Region replication or adding replicas to tables that contain data in DynamoDB, charged at the source Region, as shown in Figure 4 ($0.02/GB out)
  • Amazon EC2 and DynamoDB across Regions, charged on both sides of the transfer, as shown in Figure 5 ($0.02/GB out)

Refer to the DynamoDB pricing page for more detail.

Data transfer with Amazon Redshift

Amazon Redshift is a cloud data warehouse that makes it fast and cost-effective to analyze your data using standard SQL and your existing business intelligence tools. There are many integrations and services available to query and visualize data within Amazon Redshift. To illustrate data transfer costs, Figure 6 shows an EC2 instance running a consumer application connecting to Amazon Redshift over JDBC/ODBC.

Amazon Redshift data transfer

Figure 6. Amazon Redshift data transfer

You will not incur data transfer charges for:

  • Data transfer within the same Availability Zone
  • Data transfer to Amazon S3 for backup, restore, load, and unload operations in the same Region

In addition to the charges you will incur when you transfer data to the internet, you will accrue charges for the following:

  • Across Availability Zones, charged on both sides of the transfer ($0.01/GB in and $0.01/GB out)
  • Across Regions, charged on both sides of the transfer ($0.02/GB out)

Refer to the Amazon Redshift pricing page for more detail.

Data transfer with Amazon DocumentDB

Amazon DocumentDB (with MongoDB compatibility) is a database service that is purpose-built for JSON data management at scale. Figure 7 illustrates an application hosted on Amazon EC2 that uses Amazon DocumentDB as a data store, with read replicas in multiple Availability Zones and cross-Region replication for Amazon DocumentDB Global Clusters.

Amazon DocumentDB data transfer

Figure 7. Amazon DocumentDB data transfer

You will not incur data transfer charges for:

  • Data transfer between Amazon DocumentDB and EC2 instances in the same Availability Zone
  • Data transferred for replicating multi-Availability Zone deployments of Amazon DocumentDB between Availability Zones in the same Region

In addition to the charges you will incur when you transfer data to the internet, you will accrue charges for the following:

  • Between Amazon EC2 and Amazon DocumentDB in different Availability Zones within a Region, charged at Amazon EC2 and Amazon DocumentDB ($0.01/GB in and $0.01/GB out)
  • Across Regions between Amazon DocumentDB instances, charged at the source Region ($0.02/GB out)

Refer to the Amazon DocumentDB pricing page for more details.

Tips to save on data transfer costs to your databases

  • Review potential data transfer charges on both sides of your communication channel. Remember that “Data Transfer In” to a destination is also “Data Transfer Out” from a source.
  • Use Regional and global readers or replicas where available. This can reduce the amount of cross-Availability Zone or cross-Region traffic.
  • Consider data transfer tiered pricing when estimating workload pricing. Rate tiers aggregate usage for data transferred out to the Internet across Amazon EC2, Amazon RDS, Amazon Redshift, DynamoDB, Amazon S3, and several other services. See the Amazon EC2 On-Demand pricing page for more details.
  • Understand backup or snapshots requirements and how data transfer charges apply.
  • AWS offers various purpose-built, managed database offerings. Selecting the right one for your workload can optimize performance and cost.
  • Review your application and query design. Look for ways to reduce the amount of data transferred between your application and data store. Consider designing your application or queries to use read replicas.

Conclusion/next steps

AWS offers purpose-built databases to support your applications and data models, including relational, key-value, document, in-memory, graph, time series, wide column, and ledger databases. Each database has different deployment options, and understanding different data transfer charges can help you design a cost-efficient architecture.

This blog post is intended to help you make informed decisions for designing your workload using managed databases in AWS. Note that service charges and charges related to network topology, such as AWS Transit Gateway, VPC Peering, and AWS Direct Connect, are out of scope for this blog but should be carefully considered when designing any architecture.

Looking for more cost saving tips and information? Check out the Overview of Data Transfer Costs for Common Architectures blog post.

Security updates for Tuesday

Post Syndicated from original https://lwn.net/Articles/874818/rss

Security updates have been issued by Debian (asterisk, bind9, glusterfs, and openjdk-11), Fedora (ansible and CuraEngine), openSUSE (mailman and opera), Oracle (binutils and flatpak), Red Hat (curl, flatpak, java-1.8.0-ibm, kernel, kernel-rt, libsolv, python3, samba, and webkit2gtk3), Scientific Linux (binutils and flatpak), SUSE (binutils and transfig), and Ubuntu (ceph and mailman).

Backblaze Drive Stats for Q3 2021

Post Syndicated from original https://www.backblaze.com/blog/backblaze-drive-stats-for-q3-2021/

As of September 30, 2021, Backblaze had 194,749 drives spread across four data centers on two continents. Of that number, there were 3,537 boot drives and 191,212 data drives. The boot drives consisted of 1,557 hard drives and 1,980 SSDs. This report will review the quarterly and lifetime failure rates for our data drives, as well as compare failure rates for our SSD and HDD boot drives. Along the way, we’ll share our observations and insights of the data presented and, as always, we look forward to your comments below.

Q3 2021 Hard Drive Failure Rates

At the end of September 2021, Backblaze was monitoring 191,212 hard drives used to store data. For our evaluation, we removed from consideration 386 drives which were used for either testing purposes or were drive models for which we did not have at least 60 drives. This leaves us with 190,826 hard drives for the Q3 2021 quarterly report, as shown below.

Notes and Observations on the Q3 2021 Stats

The data for all of the drives in our data centers, including the 386 drives not included in the list above, is available for download on the Hard Drive Test Data webpage.

Zero Failures

The only drive model that recorded zero failures during Q2 was the HGST 12TB drive (model: HUH721212ALE600) which is used in our Dell storage servers in our Amsterdam data center.

Honorable Mentions

Five drive models recorded one drive failure during the quarter:

  • HGST 12TB drive (model: HUH728080ALE600).
  • Seagate 6TB drive (model: ST6000DX000).
  • Toshiba 4TB drive (model: MD04ABA400V).
  • Toshiba 14TB drive (model: MG07ACA14TEY).
  • WDC 16TB drive (model: WUH721816ALE6L0).

While one failure is good, the number of drive days for each of these drives is 100,256 or less for the quarter. This leads to a wide confidence interval for the annualized failure rate (AFR) for these drives. Still, kudos to the Seagate 6TB drives (average age 77.8 months) and Toshiba 4TB drives (average age 75.6 months) as they have been good for a long time.

What’s New

We added a new Toshiba 16TB drive this quarter (model: MG08ACA16TE). There were a couple of early drive failures, but they’ve only been installed a little over a month. This drive is similar to model MG08ACA16TEY, with the difference purportedly being the latter having the Sanitize Instant Erase (SIE) feature, which shouldn’t be in play in our environment. It will be interesting to see how they compare over time.

Outliers

There are two drives in the quarterly results which require additional information beyond the raw numbers presented. Let’s start with the Seagate 12TB drive (model: ST12000NM0007). Back in January of 2020, we noted that these drives were not working optimally in our environment and higher failure rates were predicted. Together with Seagate, we decided to remove these drives from service over the coming months. Covid-19 delayed the project some and the results are the predicted higher failure rates. We expect all of the remaining drives to be removed during Q4.

The second outlier is the Seagate 14TB drive (model: ST14000NM0138). As noted in the Q2 Drive Stats report, these drives, while manufactured by Seagate, were provisioned in Dell storage servers. As noted, both Seagate and Dell were looking into the possible causes for the unexpected failure rate. The limited number of failures, 26 this quarter, have made failure analysis challenging. As we learn more, we will let you know.

HDDs versus SSDs

As a reminder, we use both SSDs and HDDs as boot drives in our storage servers. The workload for a boot drive includes regular reading, writing, and deleting of files (log files typically) along with booting the server when needed. In short, the workload for each type of drive is similar.

In our recent post, “Are SSDs Really More Reliable Than Hard Drives?” we compared the failure rates of our HDD and SSD boot drives using data through Q2 2021. In that post, we found that if we controlled for the average age and drive days for each cohort, we were able to compare failure rates over time.

We’ll continue that comparison, and we have updated the chart below through Q3 2021 to reflect the latest data.

The first four points of each drive type create lines that are very similar, albeit the SSD failures rates are slightly lower. The HDD failure rates began to spike in year five (2018) as the HDD drive fleet started to age. Given what we know about drive failure over time, it is reasonable to assume that the failure rates of the SSDs will rise as they get older. The question to answer is: Will it be higher, lower, or the same? Stay tuned.

Data Storage Changes

Over the last year, we’ve added 40,129 new hard drives. Actually, we installed 67,990 new drives and removed 27,861 old drives. The removed drives included failed drives (1,674) and migrations (26,187). That works out to installing about 187 drives a day, which over the course of the last year, totaled just over 600PB of new data storage.

The following chart breaks down the efforts of our intrepid data center teams.

Lifetime Hard Drive Stats

The chart below shows the lifetime AFRs of all the hard drive models in production as of September 30, 2021.

Notes and Observations on the Lifetime Stats

The lifetime AFR for all of the drives in our farm continues to decrease. The 1.43% AFR is the lowest recorded value since we started back in 2013. The drive population spans drive models from 4TB to 16TB and varies in average age from one month (Toshiba 16TB) to over six years (Seagate 6TB).

Our best performing drive models in our environment by drive size are listed in the table below.

Notes:

  1. The WDC 16TB drive (model: WUH721816ALE6L0) does not appear to be available in the U.S. through retail channels. It is available in Europe for 549,00 EUR.
  2. Status is based on what is stated on the website. Further investigation may be required to ensure you are purchasing a new drive versus a refurbished drive marked as new.
  3. The source and price columns were as of 10/23/2021.
Interested in learning more? Join our webinar on November 4th at 10 a.m. PT with Drive Stats author, Andy Klein, to gain unique and valuable insights into why drives fail, how often they fail, and which models work best in our environment of 190,000+ drives. Register today.

The Hard Drive Stats Data

The complete data set used to create the information used in this review is available on our Hard Drive Test Data page. You can download and use this data for free for your own purpose. All we ask are three things: 1) you cite Backblaze as the source if you use the data, 2) you accept that you are solely responsible for how you use the data, and 3) you do not sell this data to anyone; it is free.

If you just want the summarized data used to create the tables and charts in this blog post, you can download the ZIP file containing the Excel XLXS files for each chart.

Good luck and let us know if you find anything interesting.

The post Backblaze Drive Stats for Q3 2021 appeared first on Backblaze Blog | Cloud Storage & Cloud Backup.

Fedora 35 released

Post Syndicated from original https://lwn.net/Articles/874767/rss

The Fedora 35
release
has been announced.

No matter what variant of Fedora you use, you’re getting the latest
the open source world has to offer. Following our “First”
foundation, we’ve updated key programming language and system
library packages, including Python 3.10, Perl 5.34, and PHP
8.0. Fedora Linux 35 also includes the 1.0 release of firewalld,
the modern firewall service.

Choosing between storage mechanisms for ML inferencing with AWS Lambda

Post Syndicated from James Beswick original https://aws.amazon.com/blogs/compute/choosing-between-storage-mechanisms-for-ml-inferencing-with-aws-lambda/

This post is written by Veda Raman, SA Serverless, Casey Gerena, Sr Lab Engineer, Dan Fox, Principal Serverless SA.

For real-time machine learning inferencing, customers often have several machine learning models trained for specific use-cases. For each inference request, the model must be chosen dynamically based on the input parameters.

This blog post walks through the architecture of hosting multiple machine learning models using AWS Lambda as the compute platform. There is a CDK application that allows you to try these different architectures in your own account. Finally, it then discusses the different storage options for hosting the models and the benefits of each.

Overview

The serverless architecture for inferencing uses AWS Lambda and API Gateway. The machine learning models are stored either in Amazon S3 or Amazon EFS. Alternatively, they are part of the Lambda function deployed as a container image and stored in Amazon ECR.

All three approaches package and deploy the machine learning inference code as Lambda function along with the dependencies as a container image. More information on how to deploy Lambda functions as container images can be found here.

Solution architecture

  1. A user sends a request to Amazon API Gateway requesting a machine learning inference.
  2. API Gateway receives the request and triggers Lambda function with the necessary data.
  3. Lambda loads the container image from Amazon ECR. This container image contains the inference code and business logic to run the machine learning model. However, it does not store the machine learning model (unless using the container hosted option, see step 6).
  4. Model storage option: For S3, when the Lambda function is triggered, it downloads the model files from S3 dynamically and performs the inference.
  5. Model storage option: For EFS, when the Lambda function is triggered, it accesses the models via the local mount path set in the Lambda file system configuration and performs the inference.
  6. Model storage option: If using the container hosted option, you must package the model in Amazon ECR with the application code defined for the Lambda function in step 3. The model runs in the same container as the application code. In this case, choosing the model happens at build-time as opposed to runtime.
  7. Lambda returns the inference prediction to API Gateway and then to the user.

The storage option you choose, either Amazon S3, Amazon EFS, or Amazon ECR via Lambda OCI deployment, to host the models influences the inference latency, cost of the infrastructure and DevOps deployment strategies.

Comparing single and multi-model inference architectures

There are two types of ML inferencing architectures, single model and multi-model. In single model architecture, you have a single ML inference model that performs the inference for all incoming requests. The model is stored either in S3, ECR (via OCI deployment with Lambda), or EFS and is then used by a compute service such as Lambda.

The key characteristic of a single model is that each has its own compute. This means that for every Lambda function there is a single model associated with it. It is a one-to-one relationship.

Multi-model inferencing architecture is where there are multiple models to be deployed and the model to perform the inference should be selected dynamically based on the type of request. So you may have four different models for a single application and you want a Lambda function to choose the appropriate model at invocation time. It is a many-to-one relationship.

Regardless of whether you use single or multi-model, the models must be stored in S3, EFS, or ECR via Lambda OCI deployments.

Should I load a model outside the Lambda handler or inside?

It is a general best practice in Lambda to load models and anything else that may take a longer time to process outside of the Lambda handler. For example, loading a third-party package dependency. This is due to cold start invocation times – for more information on performance, read this blog.

However, if you are running a multi-model inference, you may want to load inside the handler so you can load a model dynamically. This means you could potentially store 100 models in EFS and determine which model to load at the time of invocation of the Lambda function.

In these instances, it makes sense to load the model in the Lambda handler. This can increase the processing time of your function, since you are loading the model at the time of request.

Deploying the solution

The example application is open-sourced. It performs NLP question/answer inferencing using the HuggingFace BERT model using the PyTorch framework (expanding upon previous work found here). The inference code and the PyTorch framework are packaged as a container image and then uploaded to ECR and the Lambda service.

The solution has three stacks to deploy:

  • MlEfsStack – Stores the inference models inside of EFS and loads two models inside the Lambda handler, the model is chosen at invocation time.
  • MlS3Stack – Stores the inference model inside of S3 and loads a single model outside of the Lambda handler.
  • MlOciStack – Stores the inference models inside of the OCI container loads two models outside of the Lambda handler, the model is chosen at invocation time.

To deploy the solution, follow along the README file on GitHub.

Testing the solution

To test the solution, you can either send an inference request through API Gateway or invoke the Lambda function through the CLI. To send a request to the API, run the following command in a terminal (be sure to replace with your API endpoint and Region):

curl --location --request POST 'https://asdf.execute-api.us-east-1.amazonaws.com/develop/' --header 'Content-Type: application/json' --data-raw '{"model_type": "nlp1","question": "When was the car invented?","context": "Cars came into global use during the 20th century, and developed economies depend on them. The year 1886 is regarded as the birth year of the modern car when German inventor Karl Benz patented his Benz Patent-Motorwagen. Cars became widely available in the early 20th century. One of the first cars accessible to the masses was the 1908 Model T, an American car manufactured by the Ford Motor Company. Cars were rapidly adopted in the US, where they replaced animal-drawn carriages and carts, but took much longer to be accepted in Western Europe and other parts of the world."}'

General recommendations for model storage

For single model architectures, you should always load the ML model outside of the Lambda handler for increased performance on subsequent invocations after the initial cold start, this is true regardless of the model storage architecture that is chosen.

For multi-model architectures, if possible, load your model outside of the Lambda handler; however, if you have too many models to load in advance then load them inside of the Lambda handler. This means that a model will be loaded at every invocation of Lambda, increasing the duration of the Lambda function.

Recommendations for model hosting on S3

S3 is a good option if you need a simpler, low-cost storage option to store models. S3 is recommended when you cannot predict your application traffic volume for inference.

Additionally, if you must retrain the model, you can upload the retrained model to the S3 bucket without redeploying the Lambda function.

Recommendations for model hosting on EFS

EFS is a good option if you have a latency-sensitive workload for inference or you are already using EFS in your environment for other machine learning related activities (for example, training or data preparation).

With EFS, you must VPC-enable the Lambda function to mount the EFS filesystem, which requires an additional configuration.

For EFS, it’s recommended that you perform throughput testing with both EFS burst mode and provisioned throughput modes. Depending on inference request traffic volume, if the burst mode is not able to provide the desired performance, you must provision throughput for EFS. See the EFS burst throughput documentation for more information.

Recommendations for container hosted models

This is the simplest approach since all the models are available in the container image uploaded to Lambda. This also has the lowest latency since you are not downloading models from external storage.

However, it requires that all the models are packaged into the container image. If you have too many models that cannot fit into the 10 GB of storage space in the container image, then this is not a viable option.

One drawback of this approach is that anytime a model changes, you must re-package the models with the inference Lambda function code.

This approach is recommended if your models can fit in the 10 GB limit for container images and you are not re-training models frequently.

Cleaning up

To clean up resources created by the CDK templates, run “cdk destroy <StackName>”

Conclusion

Using a serverless architecture for real-time inference can scale your application for any volume of traffic while removing the operational burden of managing your own infrastructure.

In this post, we looked at the serverless architecture that can be used to perform real-time machine learning inference. We then discussed single and multi-model architectures and how to load the models in the Lambda function. We then looked at the different storage mechanisms available to host the machine learning models. We compared S3, EFS, and container hosting for storing models and provided our recommendations of when to use each.

For more learning resources on serverless, visit Serverless Land.

A Matter of Perspective: Agent-Based and Agentless Approaches to Cloud Security, Part 2

Post Syndicated from Amit Bawer original https://blog.rapid7.com/2021/11/02/a-matter-of-perspective-agent-based-and-agentless-approaches-to-cloud-security-part-2-2/

A Matter of Perspective: Agent-Based and Agentless Approaches to Cloud Security, Part 2

In our previous blog on this topic, we discussed some of the considerations when choosing between agent-based and agentless cloud security approaches. The following table provides a summary of these considerations.

Aspect Agent-based Agentless
Deployment – Deployed on every asset independently

– Can add potential friction; may require some special access permissions per asset

– Deployment has to scale up with additional assets

– Can be resource-intensive for the monitored asset

– Deployed externally to assets being monitored, usually at the cluster level

– Relies on the provider’s inherent access role schemes and APIs

– Processing and data collection are independent of assets

– Can be resource-consuming at the provider’s billing level

Monitoring – Tailored for asset specifications (must be aware of and compatible with OS, kernel, and architecture of the layer in which it operates)

– Can be used over a variety of different cloud providers

– Has access to unexposed asset information, but requires elevated permissions, which may turn into a security consideration of its own

– Has a specific view per monitored asset; higher-level correlation has to be done externally

– Missing or malfunctioning deployment may result in blind spots

– May require different inspection methods for different types of assets

– Agnostic to asset specifications

– Relies on cloud provider’s API and its data collection facilities

– No access to unexposed provider information

– Has a cluster-level view of asset activities, usually from a single collection point; easy to make correlations between different cluster asset activities

– Malfunctioning deployment may result in cluster-level blindness

– Unified access to all asset information via a common API and data collection facility

Enforcement – Needs an in-band access to medium for taking an action

– May interfere with uncorrelated provider operations

– Integrates to and correlates with provider’s automations and enforcement tools

– Cannot go beyond provider’s limitations

Hybrid approach

Neither the agent-based nor agentless approach is strictly considered better than the other. In some cases, it could be beneficial to join forces and have both flavors of security scooped into the same cone, so each can cover for the shortcomings of its counterpart. For example, agentless solutions are usually shortsighted when it comes to a workload’s confined information, such as the activity of processes executed within the workload space. Therefore, you might choose to augment your agentless solution with an agent-based deployment for this purpose.

As a counter-example, agent-based solutions could be disruptive or resource-consuming for network monitoring tasks. You could instead carry out these tasks over the already existing provider facilities by adding an agentless solution, which could then catch all cluster network activity information within a single collection point.

So, what’s the right answer?

In this post, we have covered some of the key aspects that differentiate agentless and agent-based approaches to cloud security. We can conclude that neither is necessarily preferable over the other, but each can cover the shortcomings of its counterpart, depending on your organization’s needs. Agent-based solutions can potentially provide a more in-depth perspective of a protected asset’s internal activities. Provider-integrated agentless solutions are usually agnostic to the containerized internal activities, but they can excel at a broader scale when making correlations between different sources of information, while still minimizing the friction per asset.

Essentially, there’s no right or wrong answer for cloud security. To keep your assets secure, just pick the approach — or mix of approaches — that makes sense for you and your organization.

NEVER MISS A BLOG

Get the latest stories, expertise, and news about security today.

Field Notes: Extending the Baseline in AWS Control Tower to Accelerate the Transition from AWS Landing Zone

Post Syndicated from MinWoo Lee original https://aws.amazon.com/blogs/architecture/field-notes-extending-the-baseline-in-aws-control-tower-to-accelerate-the-transition-from-aws-landing-zone/

Customers who adopt and operate the AWS Landing Zone solution as a scalable multi-account environment are starting to migrate to the AWS Control Tower service. They are doing so to enjoy the added benefits of managed services such as stability, feature enhancement, and operational efficiency. Customers who fully use the baseline for governance control provided by AWS Landing Zone for their member accounts may want to apply the baseline of the same feature without omission even when transitioning to AWS Control Tower. To baseline an account is to set up common blueprints and guardrails required for an organization to enable governance at the start of the account.

As shown in Table 1, AWS Control Tower provides most of the features that are mapped with the baseline of the AWS Landing Zone solution through the baseline stacks, guardrails, and account factory, but some features are unique to AWS Landing Zone.

Table 1. AWS Landing Zone and
AWS Control Tower Baseline mapping
AWS Landing Zone baseline stack AWS Control Tower baseline stack
AWS-Landing-Zone-Baseline-EnableCloudTrail AWSControlTowerBP-BASELINE-CLOUDTRAIL
AWS-Landing-Zone-Baseline-SecurityRoles AWSControlTowerBP-BASELINE-ROLES
AWS-Landing-Zone-Baseline-EnableConfig AWSControlTowerBP-BASELINE-CLOUDWATCH
AWSControlTowerBP-BASELINE-CONFIG
AWSControlTowerBP-BASELINE-SERVICE-ROLES
AWS-Landing-Zone-Baseline-ConfigRole AWSControlTowerBP-BASELINE-SERVICE-ROLES
AWS-Landing-Zone-Baseline-EnableConfigRule Guardrails – Enable guardrail on OU
(AWSControlTowerGuardrailAWS-GR-xxxxx)
AWS-Landing-Zone-Baseline-EnableConfigRulesGlobal Guardrails – Enable guardrail on OU
(AWSControlTowerGuardrailAWS-GR-xxxxx)
AWS-Landing-Zone-Baseline-PrimaryVPC Account Factory – Network Configuration
AWS-Landing-Zone-Baseline-IamPasswordPolicy
AWS-Landing-Zone-Baseline-EnableNotifications

The baselines uniquely provided by AWS Landing Zone are as follows:

  • AWS-Landing-Zone-Baseline-IamPasswordPolicy
    • AWS Lambda to configure AWS Identity and Access Management (IAM) custom password policy (such as minimum password length, password expires period, password complexity, and password history in member accounts).
  • AWS-Landing-Zone-Baseline-EnableNotifications
    • Amazon CloudWatch alarms deliver CloudTrail application programming interface (API) activity such as Security Group changes, Network ACL changes, and Amazon Elastic Compute Cloud (Amazon EC2) instance type changes to the security administrator.

AWS provides the AWS Control Tower lifecycle events and Customizations for AWS Control Tower as a way to add features that are not included by default in AWS Control Tower. Customizations for AWS Control Tower is an AWS solution that allows you to easily add customizations using AWS CloudFormation templates and service control polices.

This blog post explains how to modify and deploy the code to apply AWS Landing Zone specific baselines such as IamPasswordPolicy and EnableNotifications into AWS Control Tower using Customizations for the AWS Control Tower.

Overview of solution

Adhering to the package folder structure of Customizations for AWS Control Tower, modify the AWS Landing Zone IamPasswordPolicy, EnableNotifications template, parameter file, and manifest file to match the AWS Control Tower deployment environment.

When the modified package is uploaded to the source repository, contents of the package are validated and built by launching AWS CodePipeline. The AWS Landing Zone specific baseline is deployed in member accounts through AWS CloudFormation StackSets in the AWS Control Tower management account.

When a new or existing account is enrolled in AWS Control Tower, the same AWS Landing Zone specific baseline is automatically applied to that account by the lifecycle event (CreateManagedAccount status is SUCCEEDED).

Figure 1 shows how the default baseline of AWS Control Tower and the specific baseline of AWS Landing Zone are applied to member accounts.

Figure 1. Default and custom baseline deployment in AWS Control Tower

Figure 1. Default and custom baseline deployment in AWS Control Tower

Walkthrough

This solution follows these steps:

  1. Download and extract the latest version of the AWS Landing Zone Configuration source package. The package contains several functional components including baseline of IamPasswordPolicy, EnableNotifications for applying to accounts in AWS Landing Zone environment. If you are transitioning from AWS Landing Zone to AWS Control Tower, you may use the AWS Landing Zone configuration source package that exists in your management account.
  2. Download and extract the configuration source package of your Customizations for AWS Control Tower.
  3. Create templates and parameters folder structure for customizing configuration package source of Customizations for AWS Control Tower.
  4.  Copy the template and parameter files of the IamPasswordPolicy baseline from the AWS Landing Zone configuration source to the Customizations for AWS Control Tower configuration source.
    1. Open the parameter file (JSON), and modify the parameter value to match your organization’s password policy.
  1. Copy the template and parameter files of the EnableNotifications baseline from the AWS Landing Zone configuration source to the Customizations for AWS Control Tower configuration source.
    1. Open the parameter file (JSON), and change the LogGroupName parameter value to the CloudWatch log group name of your AWS Control Tower environment. Select whether or not to use each alarm in the parameter value.
    2. Open the template file (YAML), and modify the AlarmActions properties of all CloudWatch alarms to refer to the security topic of the Amazon Simple Notification Service (Amazon SNS) that exists in your AWS Control Tower environment.
  1. Open the manifest (YAML) file in the configuration source of Customizations for AWS Control Tower, and update with the modified IamPasswordPolicy and EnableNotifications parameter, template file path, and organizational unit to be applied.
    1. If you have customizations which have already been deployed and operated through Customizations for AWS Control Tower, do not remove existing contents, and consecutively add customized resource in resources section.
  1. Compress the completed source package, and upload it to the source repository of Customizations for AWS Control Tower.
  2. Check the results for applying this solution in AWS Control Tower.
    1. In the management account, wait for all AWS CodePipeline steps in Customizations for AWS Control Tower to be completed.
    2. In the management account, check that the CloudFormation IamPasswordPolicy and EnableNotifications StackSet is deployed.
    3. In a member account, check that the custom password policy is configured in Account Settings of IAM.
    4. In a member account, check that alarms are created in All Alarms of CloudWatch.

Prerequisites

For this walkthrough, you should have the following prerequisites:

  • AWS Control Tower deployment.
  • An AWS Control Tower member account.
  • Customizations for AWS Control Tower solution deployment.
  • IAM user and roles, and permission to allow use of ‘CustomControlTowerKMSKey’ in AWS Key Management Service Key Policy to access Amazon Simple Storage Service (Amazon S3) as the configuration source.
    • This is not required in case of using CodeCommit as source repository, but it assumes that Amazon S3 is used for this solution.
  • If the IamPasswordPolicy and EnableNotifications baseline for the AWS Landing Zone service has been deployed in the AWS Control Tower environment, it is necessary to delete stack instances and StackSet associated with the following CloudFormation StackSets:
    • AWS-Landing-Zone-Baseline-IamPasswordPolicy
    • AWS-Landing-Zone-Baseline-EnableNotifications
  • An IAM or AWS Single Sign-On (AWS SSO) account with the following settings:
    • Permission with AdministratorAccess
    • Access type with Programmatic access and AWS Management Console access
  • AWS Command Line Interface (AWS CLI) and Linux Zip package installation in work environment.
  • An IAM or AWS SSO user for member account (optional).

Prepare the work environment

Download the AWS Landing Zone configuration package and Customizations for AWS Control Tower configuration package, and create a folder structure.

  1. Open your terminal AWS Command Line Interface (AWS CLI).

Note: Confirm that AWS Config and credentials for the AWS Command Line Interface (AWS CLI) are properly set as access method (IAM or AWS SSO user) you are using in management account.

  1. Change to home directory and download the aws-landing-zone-configuration.zip file.
cd ~
wget https://s3.amazonaws.com/solutions-reference/aws-landing-zone/latest/aws-landing-zone-configuration.zip
  1.  Extract AWS Landing Zone configuration file to new directory (Named alz).
unzip aws-landing-zone-configuration.zip -d ~/alz
  1. Download _custom-control-tower-configuration.zip file in Customizations for AWS Control Tower configuration’s S3 bucket. Use your AWS Account Id and home Region in S3 bucket name.

Note: If you have already used the Customizations for AWS Control Tower configuration package, or have the Auto Build parameter set to true, use custom-control-tower-configuration.zip instead of _custom-control-tower-configuration.zip.

aws s3 cp s3://custom-control-tower-configuration-<AWS Account Id >-<AWS Region>/_custom-control-tower-configuration.zip ~/

Figure 2. Downloading source package of Customizations for AWS Control Tower

  1. Extract Customizations for AWS Control Tower configuration file to new directory (Named cfct).
unzip _custom-control-tower-configuration.zip -d ~/cfct
  1. Create templates and parameters directory under Customizations for AWS Control Tower configuration directory.
cd ~/cfct
mkdir templates parameters

Now you will see directories and files under Customizations for AWS Control Tower configuration directory.

Note: example-configuration is just an example, and will not be used in this blog post.

 Figure 3. Directory structure of Customizations for AWS Control Tower

Figure 3. Directory structure of Customizations for AWS Control Tower

Customize to include AWS Landing Zone specific baseline

Start customization work by integrating the AWS Landing Zone IamPasswordPolicy and EnableNotifications baseline related files into the structure of Customizations for AWS Control Tower configuration package.

  1. Copy the IamPasswordPolicy baseline template and parameter file into the Customizations for AWS Control Tower configuration directory.
cp ~/alz/templates/aws_baseline/aws-landing-zone-iam-password-policy.template ~/cfct/templates/
cp ~/alz/parameters/aws_baseline/aws-landing-zone-iam-password-policy.json ~/cfct/parameters/
  1. Open the copied aws-landing-zone-iam-password-policy.json, then adjust it to be compliant with your optional password policy requirement.
  2. Copy the EnableNotifications baseline template and parameter file into the Customizations for AWS Control Tower configuration directory.
cp ~/alz/templates/aws_baseline/aws-landing-zone-notifications.template ~/cfct/templates/
cp ~/alz/parameters/aws_baseline/aws-landing-zone-notifications.json ~/cfct/parameters/
  1. Open the copied aws-landing-zone-notifications.template.

Remove the following four lines from the SNSNotificationTopic parameter:

SNSNotificationTopic:
    Type: AWS::SSM::Parameter::Value<String>
    Default: /org/member/local_sns_arn
    Description: "Local Admin SNS Topic for Landing Zone"

Modify AlarmActions under Properties for each of 11 CloudWatch alarms as follows:

AlarmActions:
      - !Sub 'arn:aws:sns:${AWS::Region}:${AWS::AccountId}:aws-controltower-SecurityNotifications'
  1. Open aws-landing-zone-notifications.json.

Remove the following five lines from the SNSNotificationTopic parameter key, and parameter value at the bottom of file. Make sure to remove the including comma preceding the JSON syntax.

  ,
  {
    "ParameterKey": "SNSNotificationTopic",
    "ParameterValue": "/org/member/local_sns_arn"
  }

     Modify the parameter value of LogGroupName parameter key as follows:

{
"ParameterKey": "LogGroupName",
"ParameterValue": "aws-controltower/CloudTrailLogs"
},

6. Open the manifest.yaml under root of the Customizations for AWS Control Tower configuration directory, then modify it to include IamPasswordPolicy and EnableNotifications baseline. If there are customizations that  have been previously used in the manifest file of Customizations for AWS Control Tower, add them at the end.

7. Properly adjust region, resource_file, parameter_file, and organizational_units for your AWS Control Tower environment.

Note: Choose the proper organizational units because Customizations for AWS Control Tower will try to deploy customization resources to all AWS accounts within operational units defined in organizational_units property. If you want to select specific accounts, consider using accounts property instead of organizational_units property.

Review the following sample manifest file:

---
#Default region for deploying Custom Control Tower: Code Pipeline, Step functions, Lambda, SSM parameters, and StackSets
region: ap-northeast-2
version: 2021-03-15

# Control Tower Custom Resources (Service Control Policies or CloudFormation)
resources:
  - name: IamPasswordPolicy
    resource_file: templates/aws-landing-zone-iam-password-policy.template
    parameter_file: parameters/aws-landing-zone-iam-password-policy.json
    deploy_method: stack_set
    deployment_targets:
      organizational_units:
        - Security
        - Infrastructure
        - app-services
        - app-reports

  - name: EnableNotifications
    resource_file: templates/aws-landing-zone-notifications.template
    parameter_file: parameters/aws-landing-zone-notifications.json
    deploy_method: stack_set
    deployment_targets:
      organizational_units:
        - Security
        - Infrastructure
        - app-services
        - app-reports
  1. Compress all files within the root of the Customizations for AWS Control Tower configuration directory into the custom-control-tower-configuration.zip file.
cd ~/cfct/
zip -r custom-control-tower-configuration.zip ./
  1. Upload the custom-control-tower-configuration.zip file into the Customizations for AWS Control Tower configuration S3 bucket. Use your AWS Account Id and Home Region in the S3 bucket name.
aws s3 cp ~/cfct/custom-control-tower-configuration.zip s3://custom-control-tower-configuration-<AWS Account Id>-<AWS Region>/

Figure 4. Uploading source package of Customizations for AWS Control Tower

Verify solution

Now, you can verify the results for applying this solution.

  1. Log in to your AWS Control Tower management account.
  2.  Navigate to AWS CodePipeline service, then select Custom-Control-Tower-CodePipeline.
  3. Wait for all pipeline stages to complete.
  4. Go to AWS CloudFormation, then choose StackSets.
  5.  Search with the keyword custom. This will result in two custom StackSets.

Figure 5. Custom StackSet of Customizations for AWS Control Tower

  1. Log in to your AWS Control Tower member account.

Note: You need an IAM or AWS SSO user, or simply switch the role to AWSControlTowerExecution in the member account.

  1. Go to IAM, then choose Account settings. You will see a configured custom password policy.
Figure 6. IAM custom password policy of member account

Figure 6. IAM custom password policy of member account

  1. Go to Amazon CloudWatch, then choose All alarms. You will see 11 configured alarms.

Figure 7. Amazon CloudWatch alarms of member account

Cleaning up

Resources deployed to member accounts by this solution can be removed through the CloudFormation Stack function in the management account.

Run Delete stack from StackSet, followed by Delete StackSet, for the following two StackSets.

  • CustomControlTower-IamPasswordPolicy
  • CustomControlTower-EnableNotifications

Conclusion

In this blog post, you learned how to extend the baseline in AWS Control Tower to include the baseline specific to AWS Landing Zone. The principal idea is to use Customizations for AWS Control Tower, and additionally add guardrails, such as AWS Config rule and service control policy, which are not included by default in AWS Control Tower. This helps the transition of AWS Landing Zone to the AWS Control Tower, and enhances the governance control capability of the enterprise.

Related reading: Seamless Transition from an AWS Landing Zone to AWS Control Tower

Field Notes provides hands-on technical guidance from AWS Solutions Architects, consultants, and technical account managers, based on their experiences in the field solving real-world business problems for customers.

How we build software at Cloudflare

Post Syndicated from Nick Wood original https://blog.cloudflare.com/building-software-at-cloudflare/

How we build software at Cloudflare

How we build software at Cloudflare

Cloudflare provides a broad range of products — ranging from security, to performance and serverless compute — which are used by millions of Internet properties worldwide. Often, these products are built by multiple teams in close collaboration and delivering them can be a complex task. So ever wondered how we do so consistently and safely at scale?

Software delivery consists of all the activities to get working software into the hands of customers. It’s usual to talk about software delivery with reference to a model, or framework. These provide the scaffolding for most modern software delivery models, although in order to minimise operational friction it’s usual for a company to tailor their approach to suit their business context and culture.

For example, a company that designs the autopilot systems for passenger aircraft will require very strict tolerances, as a failure could cost hundreds of lives. They would want a different process to a cutting edge tech startup, who may value time to market over system uptime or stability.

Before outlining the approach we use at Cloudflare it’s worth quickly running through a couple of commonly used delivery models.

The Waterfall Approach

Waterfall has its foundations (pun intended) in construction and manufacturing. It breaks a project up into phases and presumes that each phase is completed before the next begins. Each phase “cascades” into the next bit like a waterfall, hence the name.

How we build software at Cloudflare

The main criticism of waterfall approaches arises when flaws are discovered downstream, which may necessitate a return to earlier phases — though this can be managed through governance processes that allows for adjusting scope, budgets or timelines.

More recently there are a number of modified waterfall models which have been developed as a response to its perceived inflexibility. Some notable examples are the Rational Unified Process (RUP), which encourages iteration within phases, and Sashimi which provides partial overlap between phases.

Despite falling out of favour in recent years, waterfall still has a place in modern technology companies. It tends to be reserved for projects where the scope and requirements can be defined upfront and are unlikely to change. At Cloudflare, we use it for infrastructure rollouts, for example. It also has a place in very large projects with complex dependencies to manage.

Agile Approaches

Agile isn’t a single well-defined process, rather a family of approaches which share similar philosophies — those of the agile manifesto. Implementations vary, but most agile flavours tend to share a number of common traits:

  • Short release cycles, such that regular feedback (ideally from real users) can be incorporated.
  • Teams maintain a prioritized to-do list of upcoming work (often called a ‘backlog’), with the most valuable items are at the top.
  • Teams should be self-organizing, and work at a sustainable pace.
  • A philosophy of Continuous Improvement, where teams seek to improve their ways of working over time.

Continuous improvement is very much the heart of agile, meaning these approaches are less about nailing down “the correct process” and focus more on regular reflection and change. This means variances between any two teams is expected, and encouraged.

Agile approaches can be divided into two main branches — iterative and flow-based. Scrum is probably the most prevalent of the iterative agile methods. In Scrum a team aims to build shippable increments of code at regular intervals called sprints (or “iterations”). Flow-based approaches on the other hand (such as Kanban) instead pick up new items from their backlog on an ad hoc basis. They use a number of techniques to try and minimise work in progress across the team.

The main differences between the two branches can be typified by looking at two example teams:

  • The “Green” Team has a set of products they support and wants to update them regularly, production issues for them are rare and there is very little ad-hoc work. An iterative approach allows them to make long term plans whilst also being able to incorporate feedback from users with some regularity.
  • The “Blue” Team meanwhile is an operational team, where a big part of their role is to monitor production systems and investigate issues as they arise. For them, a flow based approach is much more appropriate, so they can update their plans on the fly as new items arise.

Which approach does Cloudflare follow?

Cloudflare comprises dozens of globally distributed engineering teams each with their own unique challenges and contexts. A team usually has an Engineering Manager, a Product Manager and less than 10 engineers, who all focus on a singular product or mission. The DDoS team for example is one such team.

A team that supports a newly released product will likely want to rapidly incorporate feedback from customers, whereas a team that manages shared internal platforms will prize platform stability over speed of innovation. There is a spectrum of different contexts within Cloudflare which makes it impossible to define a single software delivery method for all teams to follow.

Instead, we take a more nuanced approach where we allow teams to decide which methodology they wish to follow within the team, whilst also defining a number of high-level concepts and language that are common to all teams. In other words, we are more concerned with macro-management than micro-management.

“SHIP”s and “Epic”s

At the highest level, our unit of work is called a “SHIP”  — this is a change to a service or product which we intend to ship to customers, hence the name. All live SHIPs are published on our internal roadmap, called our “SHIP-board”. Transparency and collaboration are part of our DNA at Cloudflare, so for us, it’s important that anyone in Cloudflare can view the SHIP-board.

Individual SHIPs are sized such that they can be comfortably delivered within a month or two, though we have a strong preference towards shorter timescales. We’d much rather deliver three small feature sets monthly than one big launch every quarter.

A single SHIP might need work from multiple teams in order for customers to use it. We manage this by ensuring there is an EPIC within the SHIP for each team contributing. To prevent circular dependencies, a SHIP can’t contain another SHIP. SHIPs are owned by their Product Manager, and EPICs are usually owned by an Engineering Manager. We also allow for EPICs to be created that don’t deliver against SHIPs — this is where technical improvement initiatives are typically managed.

Below the level of EPICs we don’t enforce any strict delivery model on teams, though teams will usually link their contributory work to the EPIC for ease of tracking. Teams are free to use whichever delivery framework they wish.

Within the Product Engineering organisation, all Product Managers and Engineering managers meet weekly to discuss progress and blockers of their live SHIPs/EPICs. Due to the number of people involved, this is a very rapid fire meeting facilitated by our automated “SHIP-board”. This has a built-in linter to highlight potential issues, to be updated prior to the meeting. We run through each team one by one, starting with the team with the most outstanding lints.

There’s also a few icons which let us visualise the status of a SHIP or EPIC at a glance. For example, a monkey means the target date for an item moved in the last week. Bananas count the total number of times the date has “slipped”, i.e. changed. A typical fragment of the SHIP-board is shown below.

How we build software at Cloudflare

Planning

Planning takes place every quarter. This lets us deliver aggressively, without having to change plans too frequently. It also forces us to make conscious choices about what to include and exclude from a SHIP so that extraneous work is minimised.

About a month before quarter-end, product managers will begin to compile the SHIPs that would deliver the most value to customers. They’ll work with their engineering teams to understand how the work might be done, and what work is required of other teams (e.g. the UI team might need to build a frontend whilst another team builds the API).

The team will likely estimate the work at this stage (though the exact mechanism is left up to them). Where work is required of other teams we’ll also begin to reach out to them, so they can factor it into their work for the quarter, and estimate their effort too. It’s also important at this stage to understand what kind of dependency this is — do we need one piece to fully complete before the other, or can they be done in parallel and integrated towards the end? Usually the latter.

The final aspect of planned work are unlinked EPICs — these are things that don’t necessarily contribute meaningfully to a SHIP, but the team would still like to get them completed. Examples of this are performance improvements, or changes/fixes to backend tooling.

We deliver continuously through the quarter to avoid a scramble of deployment at once, and our target dates will reflect that. We also allow anything delivered in the first two weeks of the following quarter to still count as being on-time — stability of the network is more important than hitting arbitrary dates.

We also take a fairly pragmatic approach towards target dates. A natural part of software delivery is that as we begin to explore the solution space we may uncover additional complexity. As long as we can justify a change of date it’s perfectly acceptable to amend the dates of SHIPs/EPICs to reflect the latest information. The exception to this is where we’ve made an external commitment to deliver something, so changing the delivery dates is subject to greater scrutiny.

Keeping us safe

You might think that letting teams set their own process might lead to chaos, but in my experience the opposite is true. By allowing teams to define their own methods we are empowering them to make better decisions and understand their own context within Cloudflare. We explicitly define the interfaces we use between teams, and that allows teams the flexibility to do what works best for them.

We don’t go as far as to say “there are no rules”. Last quarter Cloudflare blocked an average of 87 billion cyber threats each day, and in July 2021 we blocked the largest DDoS attack ever recorded. If we have an outage, our customers feel it, and we feel it too. To manage this we have strict, though simple, rules governing how code reaches our data centers. For example, we mandate a minimum number of reviews for each piece of code, and our deployments are phased so that changes are tested on a subset of live traffic, so any issues can be localised.

The main takeaway is to find the right balance between freedom and rules, and appreciate that this may vary for different teams within the organisation. Enforcing an unnecessarily strict process can cause a lot of friction in teams, and that’s a shortcut to losing great people. Our ideal process is one that minimises red tape, such that our team can focus on the hard job of protecting our customers.

P.S. — we’re hiring!

Do you want to come and work on advanced technologies where every code push impacts millions of Internet properties? Join our team!

България ще бъде различна

Post Syndicated from Bozho original https://blog.bozho.net/blog/3855

В последната година и половина в България се промениха много неща. Те не са очевидни в ежедневнието, но са значителни и са важно начало. Ще опитам да дам моя „вътрешен“ поглед на ситуацията и по-важното – какво предстои. Смятам, че има четири етапа не тези промени.

До средата на 2020 г. всичко изглеждаше монотонно и предрешено – ГЕРБ щеше да спечели още един мандат, социологията от май месец даваше сравнително високо доверие за Борисов и кабинета, а на хоризонта нямаше алтернатива. Тогава се случи събитие, което „разбърка“ нещата. Росенец.

На Росенец Христо Иванов и съмишленици осветиха преплитането на власт, икономически и лични интереси; осветиха влиянието и безнаказаността на ДПС и демаскираха зависимостите на ГЕРБ. Тогава написах, че Росенец е начало. И макар в момента много хората да опитват да омаловажат това събитие, мисля, че историците след много години ще го анализират и ще му отдадат необходимата важност.

След Росенец последва неизбежния отговор на президента заради подопечната му НСО, в който той атакува ДПС, Доган и Борисов. Последва и контраатака на зависимата от ДПС прокуратура, която влезе в президентството. Двете събития доведоха до протести, които промениха коренно картината и макар да не свалиха Борисов, предвещаха края на управлението му.

Росенец даде началото на първия етап. Вторият етап започна с парламентарните избори през април. До тях много хора все още не вярваха, че ГЕРБ няма да управлява и че няма да бъде отпусната тяхната хватка над властови и икономически влияния. Но изборният резултат и последващата твърдост на „партиите на протеста“ размагьоса избирателите – вече беше ясно, че ерата „Борисов“ свършва. ГЕРБ се сви до едно ядро избиратели, което е много различно от това, което ги държа на власт толкова време. Изборите дадоха начало на отпускането на властовите инструменти от ГЕРБ и ДПС, доведоха до служебно правителство, което разрови доста схеми, за които медии и опозиция говореха отдавна, но те си продължаваха и се разрастваха.

„Партиите на протеста“ станаха „партии на промяната“, но кабинет така и не беше сформиран. Причините са много, но могат да се обобщят с това, че се беше случила важна промяна в политическия пейзаж – вече нямаше един голям, който да определя условията. Това ще бъде трайната политическа ситуация, с която партиите трябва да свикват – ще има 5-6 средни по големина партии, които трябва да се научат на коалиционна култура, за да може да има управление.

Третият етап започва на 14 ноември. След изборите има шанс партиите на промяната да направят коалиционно управление, което да управлява с експертност и приличие; с прозрачност и отговорност; управление, което да реши затлачвани с години проблеми в правосъдие, образование, здравеопазване, инфраструктура, а и на практика всяка сфера. Такова управление не е гарантирано, а заявките, които ГЕРБ, ДПС и БСП дадоха в края на предния парламент за съвместни действия, продължени от действията на техните представители в ЦИК в тази предизборна кампания, са плашеща алтернатива – „още от същото, но дори по-грозно“.

Ако това не се случи и все пак партиите на промяната постигнат достатъчно висок резултат, в средносрочен план предстои четвъртата стъпка – промяна на мисленето. Мисленето, че сме аутсайдери, че нищо не зависи от нас, че е окей да сме последни, че е нормално всичко да е корумпирано. Да спрем да се дърпаме надолу в казана. Да водим, а не да догонваме.

Смятам, че последните година и половина и следващите две-три години са от историческа важност за България. И затова влагам усилията си в политическа кауза, каквато е Да, България и Демократична България. При всички рискове и негативи от това. България ще излезе различна от този период и зависи от всеки едни от нас да е към по-добро.

Материалът България ще бъде различна е публикуван за пръв път на БЛОГодаря.

Cat Lamin on building a global educator family | Hello World #17

Post Syndicated from Gemma Coleman original https://www.raspberrypi.org/blog/global-staffroom-mental-health-hello-world-17/

Cat Lamin.

In Hello World issue 17, Raspberry Pi Certified Educator Cat Lamin talks about how building connections and sharing the burden can help make us better educators, even in times of great stress:

“I felt like I needed to play my part”

In March 2020, the world suddenly changed. For educators, we jumped from face-to-face teaching to a stark new landscape, with no idea of how the future would look. As generous teachers pushed out free resources, I felt like I needed to play my part. Suddenly, an idea struck me. In September 2017, I had decided to be brave and submit a talk to PyConUK to discuss my mental health. Afterwards, several people in the audience shared their own stories with me or let me know that it helped them just to hear that someone else struggled too. I realised that in times of pressure, we need a chance to talk and we had lost these outlets. In school, we would pop to the staffroom or a friend’s classroom for a quick vent, but that wasn’t an option anymore. People were feeling isolated, scared, stressed and didn’t have anyone to turn to.

I realised that in times of pressure, we need a chance to talk, and we had lost these outlets.

Cat Lamin

Thus, the first Global Google Educator Group Staffroom: Mental Health Matters was launched on 14 March 2020, which coincided with the US government announcing school closures and UK teachers still waiting anxiously to hear when doors would close. The aim of Staffroom was to give teachers a safe space to talk about how they’re feeling under the overwhelming weight of school closures. To say it was a success would be an understatement, with teachers joining the calls from Australia, Malaysia, the USA, Colombia, Mexico, Brazil, Europe and more!

Pily Perfil.

Staffroom for me is a place and time to connect with other teachers from around the world. I remember seeing the calendar invites by mail and I kept thinking I should join but was afraid to do it. The first time I did it, I listened first and it made me realize that my struggles during pandemic online teaching were the same struggles as everywhere else.” – Pily Hernandez, Monterrey, Mexico

Which William are you today?

In those early days, we just gave teachers a chance to talk. The format of our meetings was simple: what’s your name, where are you from, and then an ice breaker question like ‘What colour do you feel like?’ or ‘What song represents your current mood?’ It wasn’t long before we hit upon a winning formula by making our own ‘Which image are you today?’ picture scale (see the ‘Which William’ image below!). Using the picture scales allowed people to really express how they felt. Often someone who had been happily chatting would explain that they were actually struggling to keep their head above water because a silly image allowed them to be honest.

A grid of photos of the same toddler expressing different emotions.
Which William are you today?

One of the most important messages from Staffroom was that many people involved with technology in schools were feeling alone. After years of suggesting teachers use technology, suddenly they were blamed for schools not being properly prepared. They were struggling with not necessarily knowing what to suggest to teachers with technology difficulties, as they were grappling with their own personal lockdown situations. Hearing that other people, all around the world, were experiencing something similar was hugely eye-opening and took a great amount of weight off their shoulders.

Abid Patel.

“As someone who thrived from having in person connections and networking opportunities, lockdown hit me hard. Staffroom really helped to keep those connections going and has developed into such a lovely safe space to talk and connect with others.” – Abid Patel, London, UK

We varied the tone of the sessions depending on the needs of the attendees. In the first few months, we shared our lockdown situations and our different experiences across the world. We could share advice and tips, as well as best practice for delivering content and things that had gone terribly wrong since switching to remote teaching. Or we’d discuss food in different countries around the world (did you know that in Australia, fish and chips is made from shark?) or joke about whether Vegemite was actually an edible product (it’s ok, I tried it live on camera during one Staffroom). Other days, we would discuss how difficult we were finding teaching, isolation or life in general during a pandemic.

An honest environment

One of the things that people continuously mentioned was that Staffroom was a safe place where they felt they could share, be listened to, and be understood. We made it clear that no one had to speak unless they wanted to. I made a point of always being completely honest about my own mental health. As a person who had suffered from depression and anxiety in the past, it was no surprise to me when I was diagnosed with both near the end of 2020, and I was fortunate enough to get virtual therapy. I shared my story with the group, which allowed attendees to feel more comfortable being open and talking about their own struggles, in some cases leading to their own diagnosis and getting much-needed support.

Frederick Ballew.

Staffroom has been the best ‘out of my comfort zone’ leap that I have ever taken. I have met educators from all over the world and learned that there are more things that unite us than divide us in this world of education.” – Frederick Ballew, Minnesota, USA

People would join Staffroom to share new jobs, engagements, even cross-country moves, but equally they would join after losing a loved one or hearing of a pupil sick in hospital. Staffroom became a safe haven for teachers, coaches, IT directors, and pretty much anyone involved in technology within education. It is a place where we could bond over shared experience, share a joke, ask questions, get ideas, and even plan our futures.

Do not underestimate the power of connections, and of sharing your story.

Cat Lamin

Alongside Staffroom, I also built a website to allow teachers to share their mental health stories and to feel a little less alone (mentalhealthineducation.com). I continue to host regular Staffrooms, although less frequently. 18 months ago, we needed a chance to talk three times a week, but now we meet two or three times a month instead. You can find current Staffroom dates at www.globalgeg.org/events. If you take one thing away from this article, however, it is this: do not underestimate the power of connections, and of sharing your story.

Cat Lamin is a Raspberry Pi Certified Educator, CAS Master Teacher, and Google Certified Innovator who works as a freelance trainer and coach, supporting schools with digital strategy and enabling educators to use technology more effectively. For running this regular mental health staffroom, she was awarded a Mental Health Champion Award from Edufuturist.

Share your thoughts about Hello World with me!

Your insights are invaluable to help us make Hello World as useful as it can be for computing educators around the globe. Hello World is a magazine for educators from educators — so if you are interested in having a 20-minute chat with me about what you like about the magazine, and what you would like to change, then please sign up here. I look forward to speaking with you.

Download Hello World for free

The brand-new issue of our free Hello World magazine for computing educators focuses on all things health and well-being.

Cover of issue 17 of Hello World.

It is full of inspiring stories and practical ideas for teaching your learners about computing in this context, and supporting them to use digital technologies in beneficial ways.

Download the new issue of Hello World for free today:

To never miss a new issue, you can subscribe to Hello World for free. Also check out the first-ever special edition of Hello World, The Big Book of Pedagogy. It focuses on approaches to teaching computing in the classroom, and you can download the special edition for free.

Wherever you are in the world, you can listen to our Hello World podcast too! Each episode, we explore a new topic with some of the computing educators who’ve written for the magazine.

The post Cat Lamin on building a global educator family | Hello World #17 appeared first on Raspberry Pi.

Deep Dive on Amazon EC2 VT1 Instances

Post Syndicated from Rick Armstrong original https://aws.amazon.com/blogs/compute/deep-dive-on-amazon-ec2-vt1-instances/

This post is written by:  Amr Ragab, Senior Solutions Architect; Bryan Samis, Principal Elemental SSA; Leif Reinert, Senior Product Manager

Introduction

We at AWS are excited to announce that new Amazon Elastic Compute Cloud (Amazon EC2) VT1 instances are now generally available in the US-East (N. Virginia), US-West (Oregon), Europe (Ireland), and Asia Pacific (Tokyo) Regions. This instance family provides dedicated video transcoding hardware in Amazon EC2 and offers up to 30% lower cost per stream as compared to G4dn GPU based instances or 60% lower cost per stream as compared to C5 CPU based instances. These instances are powered by Xilinx Alveo U30 media accelerators with up to eight U30 media accelerators per instance in the vt1.24xlarge. Each U30 accelerator comes with two XCU30 Zynq UltraScale+ SoCs, totaling 16 addressable devices in the vt1.24xlarge instance with H.264/H.265 Video Codec Units (VCU) cores.

Each U30 accelerator card comes with two XCU30 Zynq UltraScale+ SoCs

Currently, the VT1 family consists of three sizes, as summarized in the following:

Instance Type vCPUs RAM U30 accelerator cards Addressable XCU30 SoCs 
vt1.3xlarge 12 24 1 2
vt1.6xlarge 24 48 2 8
vt1.24xlarge 96 182 8 16

Each addressable XCU30 SoC device supports:

  • Codec: MPEG4 Part 10 H.264, MPEG-H Part 2 HEVC H.265
  • Resolutions: 128×128 to 3840×2160
  • Flexible rate control: Constant Bitrate (CBR), Variable Bitrate(VBR), and Constant Quantization Parameter(QP)
  • Frame Scan Types: Progressive H.264/H.265
  • Input Color Space: YCbCr 4:2:0, 8-bit per color channel.

The following table outlines the number of transcoding streams per addressable device and instance type:

Transcoding Each XCU30 SoC vt1.3xlarge vt1.6xlarge vt1.24xlarge
3840x2160p60 1 2 4 16
3840x2160p30 2 4 8 32
1920x1080p60 4 8 16 64
1920x1080p30 8 16 32 128
1280x720p30 16 32 64 256
960x540p30 24 48 92 384

Each XCU30 SoC can support the following stream densities: 1x 4kp60, 2x 4kp30, 4x 1080p60, 8x 1080p30, 16x 720p30

Customers with applications such as live broadcast, video conferencing and just-in-time transcoding can now benefit from a dedicated instance family devoted to video encoding and decoding with rescaling optimizations at the lowest cost per stream. This dedicated instance family lets customers run batch, real-time, and faster than real-time transcoding workloads.

Deployment and Quick Start

To get started, you launch a VT1 instance with prebuilt VT1 Amazon Machine Images (AMIs), available on the AWS Marketplace. However, if you have AMI hardening requirements or other requirements that require you to install the Xilinx software stack, you can reference the Xilinx Video SDK documentation for VT1.

The software stack utilizes a driver suite that is a combination of the driver stack as well as management and client tools. The following terminology will be used in this instance family:

  • XRT – Xilinx Runtime Library
  • XRM – Xilinx Runtime Management Library
  • XCDR – Xilinx Video Transcoding SDK
  • XMA – Xilinx Media Accelerator API and Samples
  • XOCL – Xilinx driver (xocl)

To run workloads directly on Amazon EC2 instances, you must load both the XRT and XRM stack. These are conveniently provided by loading the XCDR environment. To load the devices, run the following:

source /opt/xilinx/xcdr/setup.sh

With the output:

-----Source Xilinx U30 setup files-----
XILINX_XRT        : /opt/xilinx/xrt
PATH              : /opt/xilinx/xrt/bin:/usr/local/sbin:/sbin:/bin:/usr/sbin:/usr/bin:/root/bin
LD_LIBRARY_PATH   : /opt/xilinx/xrt/lib:
PYTHONPATH        : /opt/xilinx/xrt/python:
XILINX_XRM      : /opt/xilinx/xrm
PATH            : /opt/xilinx/xrm/bin:/opt/xilinx/xrt/bin:/usr/local/sbin:/sbin:/bin:/usr/sbin:/usr/bin:/root/bin
LD_LIBRARY_PATH : /opt/xilinx/xrm/lib:/opt/xilinx/xrt/lib:
Number of U30 devices found : 16  

Running Containerized Workloads on Amazon ECS and Amazon EKS

To help build AMIs for Amazon Linux2, Ubuntu 18/20, Amazon ECS and Amazon Elastic Kubernetes Service (Amazon EKS), we have provided a Github project in order to simplify the build process utilizing Packer:

https://github.com/aws-samples/aws-vt-baseami-pipeline

At the time of writing, Xilinx does not have an officially supported container runtime. However, it is possible to pass the specific devices in the docker run ... stanza, and in order to set this environment download this specific script. The following example is the output for vt1.24xlarge:

[ec2-user@ip-10-0-254-236 ~]$ source xilinx_aws_docker_setup.sh
XILINX_XRT : /opt/xilinx/xrt
PATH : /opt/xilinx/xrt/bin:/usr/local/bin:/usr/bin:/usr/local/sbin:/usr/sbin:/home/ec2-user/.local/bin:/home/ec2-user/bin
LD_LIBRARY_PATH  : /opt/xilinx/xrt/lib:
PYTHONPATH : /opt/xilinx/xrt/python:
XILINX_AWS_DOCKER_DEVICES : --device=/dev/dri/renderD128:/dev/dri/renderD128
--device=/dev/dri/renderD129:/dev/dri/renderD129
--device=/dev/dri/renderD130:/dev/dri/renderD130
--device=/dev/dri/renderD131:/dev/dri/renderD131
--device=/dev/dri/renderD132:/dev/dri/renderD132
--device=/dev/dri/renderD133:/dev/dri/renderD133
--device=/dev/dri/renderD134:/dev/dri/renderD134
--device=/dev/dri/renderD135:/dev/dri/renderD135
--device=/dev/dri/renderD136:/dev/dri/renderD136
--device=/dev/dri/renderD137:/dev/dri/renderD137
--device=/dev/dri/renderD138:/dev/dri/renderD138
--device=/dev/dri/renderD139:/dev/dri/renderD139
--device=/dev/dri/renderD140:/dev/dri/renderD140
--device=/dev/dri/renderD141:/dev/dri/renderD141
--device=/dev/dri/renderD142:/dev/dri/renderD142
--device=/dev/dri/renderD143:/dev/dri/renderD143
--mount type=bind,source=/sys/bus/pci/devices/0000:00:1d.0,target=/sys/bus/pci/devices/0000:00:1d.0 --mount type=bind,source=/sys/bus/pci/devices/0000:00:1e.0,target=/sys/bus/pci/devices/0000:00:1e.0

Once the devices have been enumerated, start the workload by running:

docker run -it $XILINX_AWS_DOCKER_DEVICES <image:tag>

Amazon EKS Setup

To launch an EKS cluster with VT1 instances, create the AMI from the scripts provided in the repo earlier.

https://github.com/aws-samples/aws-vt-baseami-pipeline

Once the AMI is created, launch an EKS cluster:

eksctl create cluster --region us-east-1 --without-nodegroup --version 1.19 \
       --zones us-east-1c,us-east-1d

Once the cluster is created, substitute the values for the cluster name, subnets, and AMI IDs in the following template.

apiVersion: eksctl.io/v1alpha5
kind: ClusterConfig

metadata:
  name: <cluster-name>
  region: us-east-1

vpc:
  id: vpc-285eb355
  subnets:
    public:
      endpoint-one:
        id: subnet-5163b237
      endpoint-two:
        id: subnet-baff22e5

managedNodeGroups:
  - name: vt1-ng-1d
    instanceType: vt1.3xlarge
    volumeSize: 200
    instancePrefix: vt1-ng-1d-worker
    ami: <ami-id>
    iam:
      withAddonPolicies:
        imageBuilder: true
        autoScaler: true
        ebs: true
        fsx: true
        cloudWatch: true
    ssh:
      allow: true
      publicKeyName: amrragab-aws
    subnets:
    - endpoint-one
    minSize: 1
    desiredCapacity: 1
    maxSize: 4
    overrideBootstrapCommand: |
      #!/bin/bash
      /etc/eks/bootstrap.sh <cluster-name>

Save this file, and then deploy the nodegroup.

eksctl create nodegroup -f vt1-managed-ng.yaml

Once deployed, apply the FPGA U30 device plugin. The daemonset container is available on the Amazon Elastic Container Registry (ECR) public gallery. You can also access the daemonset deployment file.

kubectl apply -f xilinx-device-plugin.yml

Confirm that the Xilinx U30 device(s) are seen by K8s API server and can be allocatable in your job.

Capacity:
  attachable-volumes-aws-ebs:                  39
  cpu:                                         12
  ephemeral-storage:                           209702892Ki
  hugepages-1Gi:                               0
  hugepages-2Mi:                               0
  memory:                                      23079768Ki
  pods:                                        15
  xilinx.com/fpga-xilinx_u30_gen3x4_base_1-0:  1
Allocatable:
  attachable-volumes-aws-ebs:                  39
  cpu:                                         11900m
  ephemeral-storage:                           192188443124
  hugepages-1Gi:                               0
  hugepages-2Mi:                               0
  memory:                                      22547288Ki
  pods:                                        15
  xilinx.com/fpga-xilinx_u30_gen3x4_base_1-0:  1

Video Quality Analysis

The video quality produced by the U30 is roughly equivalent to the “faster” profile in the x264 and x265 codecs, or the “p4” preset using the nvenc codec on G4dn. For example, in the following test we encoded the same UHD (4K) video at multiple bitrates into H264, and then compared Video Multimethod Assessment Fusion (VMAF) scores:

Plotting VMAF and bitrate we see comparable quality across x264 faster, h264_nvenc p4 and u30

Stream Density and Encoding Performance

To illustrate the VT1 instance family stream density and encoding performance, let’s look at the smallest instance, the vt1.3xlarge, which can encode up to eight simultaneous 1080p60 streams into H.264. We chose a set of similar instances at a close price point, and then compared how many 1080p60 H264 streams they could encode simultaneously to an equivalent quality:

Column 1 Column 2 Column 3 Column 4 Column 5
Instance Codec us-east-1 Hourly Price* 1080p60 Streams / Instance Hourly Cost / Stream
c5.4xlarge x264 $0.680 2 $0.340
c6g.4xlarge x264 $0.544 2 $0.272
c5a.4xlarge x264 $0.616 3 $0.205
g4dn.xlarge nvenc $0.526 4 $0.132
vt1.3xlarge xma $0.650 8 $0.081

* Prices accurate as of the publishing date of this article.

As you can see, the vt1.3xlarge instance can encode four times as many streams as the c5.4xlarge, and at a lower hourly cost. It can also encode two times the number of streams as a g4dn.xlarge instance. Thus, yielding in this example a cost per stream reduction of up to 76% over c5.4xlarge, and up to 39% compared to g4dn.xlarge.

Faster than Real-time Transcoding

In addition to encoding multiple live streams in parallel, VT1 instances can also be utilized to encode file-based content at faster-than-real-time performance. This can be done by over-provisioning resources on a single XCU30 device so that more resources are dedicated to transcoding than are necessary to maintain real-time.

For example, running the following command (specifying -cores 4) will utilize all resources on a single XCU30 device, and yield an encode speed of approximately 177 FPS, or 2.95 times faster than real-time for a 60 FPS source:

$ ffmpeg -c:v mpsoc_vcu_h264 -i input_1920x1080p60_H264_8Mbps_AAC_Stereo.mp4 -f mp4 -b:v 5M -c:v mpsoc_vcu_h264 -cores 4 -slices 4 -y /tmp/out.mp4
frame=43092 fps=177 q=-0.0 Lsize= 402721kB time=00:11:58.92 bitrate=4588.9kbits/s speed=2.95x

To maximize FPS further, utilize the “split and stitch” operation to break the input file into segments, and then transcode those in parallel across multiple XCU30 chips or even multiple U30 cards in an instance. Then, recombine the file at the output. For more information, see the Xilinx Video SDK documentation on Faster than Real-time transcoding.

Using the provided example script on the same 12-minute source file as the preceding example on a vt1.3xlarge, we can utilize both addressable devices on the U30 card at once in order to yield an effective encode speed of 512 fps, or 8.5 times faster than real-time.

$ python3 13_ffmpeg_transcode_only_split_stitch.py -s input_1920x1080p60_H264_8Mbps_AAC_Stereo.mp4 -d /tmp/out.mp4 -i h264 -o h264 -b 5.0

There are 1 cards, 2 chips in the system
...
Time from start to completion : 84 seconds (1 minute and 24 seconds)
This clip was processed 8.5 times faster than realtime

This clip was effectively processed at 512.34 FPS

Conclusion

We are excited to launch VT1, our first EC2 instance with dedicated hardware acceleration for video transcoding, which provides up to 30% lower cost per stream as compared to G4dn or 60% lower cost per stream as compared to G5. With up to eight Xilinx Alveo U30 media accelerators, you can parallelize up to 16 4K UHD streams, for batch, real-time, and faster than real-time transcoding. If you have any questions, reach out to your account team. Now, go power up your video transcoding workloads with Amazon EC2 VT1 instances.

Folios merged for 5.16

Post Syndicated from original https://lwn.net/Articles/874684/rss

The long-running and sometimes acrimonious discussion on the memory folio patch set has come to an end:
the folio patches were the first thing pulled into the mainline repository
for the 5.16 development cycle. Now the developers involved just have to
do all of the other work identified as necessary to clean up the
memory-management subsystem and isolate it from other parts of the kernel.

Building ARM64 applications on AWS Graviton2 using the AWS CDK and Self-Hosted Runners for GitHub Actions

Post Syndicated from Rick Armstrong original https://aws.amazon.com/blogs/compute/building-arm64-applications-on-aws-graviton2-using-the-aws-cdk-and-self-hosted-runners-for-github-actions/

This post is written by Frank Dallezotte, Sr. Technical Account Manager, and Maxwell Moon, Sr. Solutions Architect

AWS Graviton2 processors are custom built by AWS using the 64-bit Arm Neoverse cores to deliver great price performance for workloads running in Amazon Elastic Compute Cloud (Amazon EC2). These instances are powered by 64 physical core AWS Graviton2 processors utilizing 64-bit Arm Neoverse N1 cores and custom silicon designed by AWS, built using advanced 7-nanometer manufacturing technology.

Customers are migrating their applications to AWS Graviton2 based instance families in order to take advantage of up to 40% better price performance over comparable current generation x86-based instances for a broad spectrum of workloads. This migration includes updating continuous integration and continuous deployment (CI/CD) pipelines in order to build applications for ARM64.

One option for running CI/CD workflows is GitHub Actions, a GitHub product that lets you automate tasks within your software development lifecycle. Customers utilizing GitHub Actions today can host their own runners and customize the environment used to run jobs in GitHub Actions workflows, allowing you to build ARM64 applications. GitHub recommends that you only use self-hosted runners with private repositories.

This post will teach you to set up an AWS Graviton2 instance as a self-hosted runner for GitHub Actions. We will verify the runner is added to the default runner group for a GitHub Organization, which can only be used by private repositories by default. Then, we’ll walk through setting up a continuous integration workflow in GitHub Actions that runs on the self-hosted Graviton2 runner and hosted x86 runners.

Overview

This post will cover the following:

  • Network configurations for deploying a self-hosted runner on EC2.
  • Generating a GitHub token for a GitHub organization, and then storing the token and organization URL in AWS Systems Manager Parameter Store.
  • Configuring a self-hosted GitHub runner on EC2.
  • Deploying the network and EC2 resources by using the AWS Cloud Development Kit (AWS CDK).
  • Adding Graviton2 self-hosted runners to a workflow for GitHub Actions to an example Python application.
  • Running the workflow.

Prerequisites

  1. An AWS account with permissions to create the necessary resources.
  2. A GitHub account: This post assumes that you have the required permissions as a GitHub organization admin to configure your GitHub organization, as well as create workflows.
  3. Familiarity with the AWS Command Line Interface (AWS CLI).
  4. Access to AWS CloudShell.
  5. Access to an AWS account with administrator or PowerUser (or equivalent) AWS Identity and Access Management (IAM) role policies attached.
  6. Account capacity for two Elastic IPs for the NAT gateways.
  7. An IPv4 CIDR block for a new Virtual Private Cloud (VPC) that is created as part of the AWS CDK stack.

Security

We’ll be adding the self-hosted runner at the GitHub organization level. This makes the runner available for use by the private repositories belonging to the GitHub organization. When new runners are created for an organization, they are automatically assigned to the default self-hosted runner group, which, by default, cannot be utilized by public repositories.

You can verify that your self-hosted runner group is only available to private repositories by navigating to the Actions section of your GitHub Organization’s settings. Select the “Runner Groups” submenu then the Default runner group and confirm that “Allow public repositories” is not checked.

GitHub recommends only utilizing self-hosted runners with private repositories. Allowing self-hosted runners on public repositories and allowing workflows on public forks introduces a significant security risk. More information about the risks can be found in self-hosted runner security with public repositories.

In this post, we verified that for the default runner group, allowing public repositories is not enabled.

AWS CDK

To model and deploy our architecture, we use the AWS CDK. The AWS CDK lets us design components for a self-hosted runner that are customizable and shareable in several popular programming languages.

Our AWS CDK application is defined by two stacks (VPC and EC2) that we’ll use to create the networking resources and our self-hosted runner on EC2.

Network Configuration

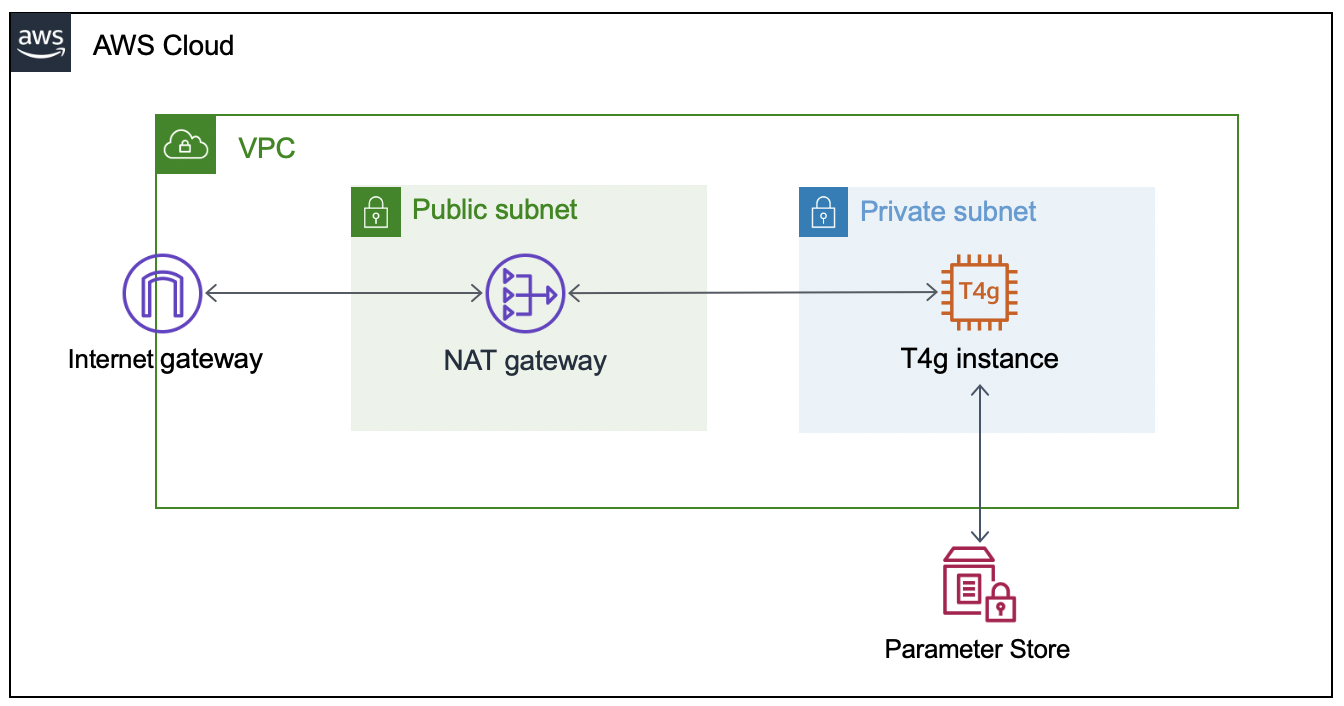
This section will walk through the networking resources that the CDK stack will create in order to support this architecture. We are deploying our self-hosted runner in a private subnet. A NAT gateway in a public subnet lets the runner make requests to GitHub, but not direct access to the instance from the internet.

  • Virtual Private Cloud – Defines a VPC across two Availability Zones with an IPv4 CIDR block that you set.
  • Public Subnet – A NAT Gateway will be created in each public subnet for outbound traffic through the VPC’s internet gateway.
  • Private Subnet – Contains the EC2 instance for the self-hosted runner that routes internet bound traffic through a NAT gateway in the public subnet.

AWS architecture diagram for self-hosted runner.

Configuring the GitHub Runner on EC2

To successfully provision the instance, we must  supply the GitHub organization URL and token. To accomplish this, we’ll create two AWS Systems Manager Parameter Store values (gh-url and gh-token), which will be accessed via the EC2 instance user data script when the CDK application deploys the EC2 stack. The EC2 instance will only be accessible through AWS Systems Manager Session Manager.

Get a Token From GitHub

The following steps are based on these instructions for adding self-hosted runners – GitHub Docs.

  1. Navigate to the private GitHub organization where you’d like to configure a custom GitHub Action Runner.
  2. Under your repository name, organization, or enterprise, click Settings.
  3. In the left sidebar, click Actions, then click Runners.
  4. Under “Runners”, click Add runner.
  5. Copy the token value under the “Configure” section.

NOTE: this is an automatically generated time-limited token for authenticating the request.

Create the AWS Systems Manager Parameter Store Values

Next, launch an AWS CloudShell environment, and then create the following AWS Systems Manager Parameter Store values in the AWS account where you’ll be deploying the AWS CDK stack.

The names gh-url and gh-token, and types String and SecureString, respectively, are required for this integration:

#!/bin/bash
aws ssm put-parameter --name gh-token --type SecureString --value ABCDEFGHIJKLMNOPQRSTUVWXYZABC
aws ssm put-parameter --name gh-url --type String --value https://github.com/your-url

Self-Hosted Runner Configuration

The EC2 instance user data script will install all required packages, and it will register the GitHub Runner application using the gh-url and gh-token parameters from the AWS Systems Manager Parameter Store. These parameters are stored as variables (TOKEN and REPO) in order to configure the runner.

This script runs automatically when the EC2 instance is launched, and it is included in the GitHub repository. We’ll utilize Amazon Linux 2 for the operating system on the runner instance.

#!/bin/bash
yum update -y
# Download and build a recent version of International Components for Unicode.
# https://github.com/actions/runner/issues/629
# https://github.com/dotnet/core/blob/main/Documentation/linux-prereqs.md
# Install jq for parsing parameter store
yum install -y libicu60 jq
# Get the latest runner version
VERSION_FULL=$(curl -s https://api.github.com/repos/actions/runner/releases/latest | jq -r .tag_name)
RUNNER_VERSION="${VERSION_FULL:1}"


# Create a folder
mkdir /home/ec2-user/actions-runner && cd /home/ec2-user/actions-runner || exit
# Download the latest runner package
curl -o actions-runner-linux-arm64-${RUNNER_VERSION}.tar.gz -L https://GitHub.com/actions/runner/releases/download/v${RUNNER_VERSION}/actions-runner-linux-arm64-${RUNNER_VERSION}.tar.gz
# Extract the installer
tar xzf ./actions-runner-linux-arm64-${RUNNER_VERSION}.tar.gz
chown -R ec2-user /home/ec2-user/actions-runner
REGION=$(curl -s http://169.254.169.254/latest/meta-data/placement/region)
INSTANCE_ID=$(curl -s http://169.254.169.254/latest/meta-data/instance-id)
TOKEN=$(aws ssm get-parameter --region "${REGION}" --name gh-token --with-decryption | jq -r '.Parameter.Value')
REPO=$(aws ssm get-parameter --region "${REGION}" --name gh-url | jq -r '.Parameter.Value')
sudo -i -u ec2-user bash << EOF
/home/ec2-user/actions-runner/config.sh --url "${REPO}" --token "${TOKEN}" --name gh-g2-runner-"${INSTANCE_ID}" --work /home/ec2-user/actions-runner --unattended
EOF
./svc.sh install
./svc.sh start

Deploying the Network Resources and Self-Hosted Runner

In this section, we’ll deploy the network resources and EC2 instance for the self-hosted GitHub runner using the AWS CDK.

From the same CloudShell environment, run the following commands in order to deploy the AWS CDK application:

#!/bin/bash
sudo npm install aws-cdk -g
git clone https://github.com/aws-samples/cdk-graviton2-gh-sh-runner.git
cd cdk-graviton2-gh-sh-runner
python3 -m venv .venv
source .venv/bin/activate
python -m pip install -r requirements.txt
export VPC_CIDR="192.168.0.0/24" # Set your CIDR here.
export AWS_ACCOUNT=`aws sts get-caller-identity | jq -r '.Account'`
cdk bootstrap aws://$AWS_ACCOUNT/$AWS_REGION
cdk deploy --all
# Note: Before the EC2 stack deploys you will be prompted for approval
# The message states 'This deployment will make potentially sensitive changes according to your current security approval level (--require-approval broadening).' and prompts for y/n

These steps will deploy an EC2 instance self-hosted runner that is added to your GitHub organization (as previously specified by the gh-url parameter). Confirm the self-hosted runner has been successfully added to your organization by navigating to the Settings tab for your GitHub organization, selecting the Actions options from the left-hand panel, and then selecting Runners.

Default runner group including an ARM64 self-hosted runner.

Extending a Workflow to use the self-hosted Runner

This section will walk through setting up a GitHub Actions workflow to extend a test pipeline for an example application. We’ll define a workflow that runs a series of static code checks and unit tests on both x86 and ARM.

Our example application is an online bookstore where users can find books, add them to their cart, and create orders. The application is written in Python using the Flask framework, and it uses Amazon DynamoDB for data storage.

Actions expect the workflow to be defined in the folder .github/workflows and the extension of either .yaml or .yml. We’ll create the directory, as well as an empty file inside the directory called main.yml.

#!/bin/bash
mkdir -p .github/workflows
touch .github/workflows/main.yml

First, we must define when our workflow will run. We’ll define the workflow to run when pull requests are created, synchronized (new commits are pushed), or re-opened, and then on push to the main branch.

# main.yml
on:
  pull_request:
    types: [opened, synchronize, reopened]
  push:
    branches:
      - main

Next, define the workflow by adding jobs. Each job can have one or more steps to run. A step defines a command, set up task, or action that will be run. You can also create custom Actions with user-defined steps and repeatable modules.

Next, we’ll define a single job test to include every step of our workflow, as well as a strategy for the job to run the workflow on both x86 and the Graviton2 self-hosted runner. We’ll specify both ubuntu-latest, a hosted runner, and self-hosted for our Graviton2 runner. This lets our workflow run in parallel on two different CPUs, and it is not disruptive of existing processes.

# main.yml
jobs:
  test:
    runs-on: ${{ matrix.os }}
    strategy:
      fail-fast: false
      matrix:
        os: [ubuntu-latest, self-hosted]

Now we can add steps that each runner will run. We’ll be using custom Actions that we create for each step, as well as the pre-built action checkout for pulling down the latest changes to each runner.

GitHub Actions expects all custom actions to be defined in .github/actions/<name of action>/action.yml. We’ll define four custom Actions – check_system_deps, check_and_install_app_deps, run_static_checks, and run_unit_tests.

#!/bin/bash
for action in check_system_deps check_and_install_app_deps run_static_checks run_unit_tests; do \
    mkdir -p .github/actions/${action} && \
    touch .github/actions/${action}/action.yml; \
    done

We define an Action with a series of steps to ensure that the runner is prepared to run our tests and checks:

  1. Check that Python3 is installed
  2. Check that pipenv is installed

Our using statement specifies “composite” to run all steps as a single action.

# .github/actions/check_system_deps/action.yml
name: "Check System Deps"
description: "Check for Python 3.x, list version, Install pipenv if it is not installed"
runs:
  using: "composite"
  steps:
    - name: Check For Python3.x
      run: |
        which python3
        VERSION=$(python3 --version | cut -d ' ' -f 2)
        VERSION_PATCH=$(echo ${VERSION} | cut -d '.' -f 2)
        [ $VERSION_PATCH -ge 8 ]
      shell: bash
    - name: Install Pipenv
      run: python3 -m pip install pipenv --user
      shell: bash

Now that we have the correct version of Python and a package manager installed, we’ll create an action to install our application dependencies:

# .github/actions/check_and_install_app_deps/action.yml
name: "Install deps"
description: "Install application dependencies"
runs:
  using: "composite"
  steps:
    - name: Install deps
      run: python3 -m pipenv install --dev
      shell: bash

Next, we’ll create an action to run all of our static checks. For our example application, we want to perform the following checks:

  1. Check for security vulnerabilities using Bandit
  2. Check the cyclomatic complexity using McCabe
  3. Check for code that has no references using Vulture
  4. Perform a static type check using MyPy
  5. Check for open CVEs in dependencies using Safety
# .github/actions/run_static_checks/action.yml
name: "Run Static Checks"
description: "Run static checks for the python app"
runs:
  using: "composite"
  steps:
    - name: Check common sense security issues
      run: python3 -m pipenv run bandit -r graviton2_gh_runner_flask_app/
      shell: bash
    - name: Check Cyclomatic Complexity
      run: python3 -m pipenv run flake8 --max-complexity 10 graviton2_gh_runner_flask_app
      shell: bash
    - name: Check for dead code
      run: python3 -m pipenv run vulture graviton2_gh_runner_flask_app --min-confidence 100
      shell: bash
    - name: Check static types
      run: python3 -m pipenv run mypy graviton2_gh_runner_flask_app
      shell: bash
    - name: Check for CVEs
      run: python3 -m pipenv check
      shell: bash

We’ll create an action to run the unit tests using PyTest.

# .github/actions/run_unit_tests/action.yml
name: "Run Unit Tests"
description: "Run unit tests for python app"
runs:
  using: "composite"
  steps:
    - name: Run PyTest
      run: python3 -m pipenv run pytest -sv tests
      shell: bash

Finally, we’ll bring all of these actions into our steps in main.yml in order to define every step that will be run on each runner any time that our workflow is run.

# main.yml
steps:
   - name: Checkout Code
     uses: actions/checkout@v2
   - name: Check System Deps
     uses: ./.github/actions/check_system_deps
   - name: Install deps
     uses: ./.github/actions/check_and_install_app_deps
   - name: Run Static Checks
     uses: ./.github/actions/run_static_checks
   - name: Run PyTest
     uses: ./.github/actions/run_unit_tests

Save the file.

Running the Workflow

The workflow will run on the runners when you commit and push your changes. To demonstrate, we’ll create a PR to update the README of our example app in order to kick off the workflow.

After the change is pushed, see the status of your workflow by navigating to your repository in the browser. Select the Actions tab. Select your workflow run from the list of All Workflows. This opens the Summary page for the workflow run.

Successful run of jobs on hosted Ubuntu and self-hosted ARM64 runners.

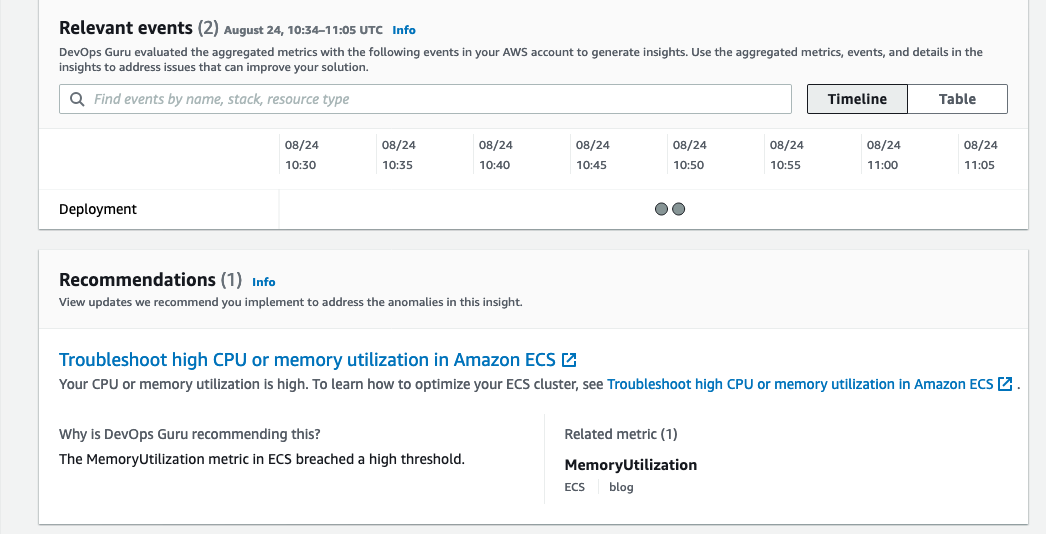
As each step defined in the workflow job runs, view their details by clicking the job name on the left-hand panel or on the graph representation. The following images are screenshots of the jobs, and example outputs of each step. First, we have check_system_deps.

Successful run of a custom action checking for required system dependencies.

We’ve excluded a screenshot of check_and_install_app_deps that shows the output of pipenv install. Next, we can see that our change passes for our run_static_checks Action (first), and unit tests for our run_unit_tests Action (second).

Successful run of a custom action checking for required system dependencies.

Successful run of a custom action running unit tests with PyTest.

Finally, our workflow completes successfully!

Successful run of jobs on hosted and self-hosted runners.

Clean up

To delete the AWS CDK stacks, launch CloudShell and enter the following commands:

#!/bin/bash
cd cdk-graviton2-gh-sh-runner
source .venv/bin/activate
# Re-set the environment variables again if required
# export VPC_CIDR="192.168.0.0/24" # Set your CIDR here.
cdk destroy --all

Conclusion

This post covered the configuring of a self-hosted GitHub Runner on an EC2 instance with a Graviton2 processor, the required network resources, and a workflow that will run on the Runner on each repository push or pull request for the example application. The Runner is configured at the Organization level, which by default only allows access by private repositories. Lastly, we showed an example run of the workflow after creating a pull request for our example app.

Self-hosted runners on Graviton2 for GitHub Actions lets you add ARM64 to your CICD workflows, accelerating migrations to take advantage of the price and performance of Graviton2. In this blog we’ve utilized a strategy to create a build matrix to run jobs on hosted and self-hosted runners.

We could further extend this workflow by automating deployment with AWS CodeDeploy or sending a build status notification to Slack. To reduce the cost of idle resources during periods without builds, you can set up an Amazon CloudWatch Event to schedule a stop and start of the instance during business hours.

Github Actions also supports ephemeral self-hosted runners, which automatically unregister runners from the service. Ephemeral runners are a good choice for self-managed environments where you need each job to run on a clean image.

For more examples of how to create development environments using AWS Graviton2 and AWS CDK, reference Building an ARM64 Rust development environment using AWS Graviton2 and AWS CDK.

The collective thoughts of the interwebz