Post Syndicated from The Atlantic original https://www.youtube.com/watch?v=fPImNiuePos
Choosing the right certificate revocation method in ACM Private CA
Post Syndicated from Arthur Mnev original https://aws.amazon.com/blogs/security/choosing-the-right-certificate-revocation-method-in-acm-private-ca/
AWS Certificate Manager Private Certificate Authority (ACM PCA) is a highly available, fully managed private certificate authority (CA) service that allows you to create CA hierarchies and issue X.509 certificates from the CAs you create in ACM PCA. You can then use these certificates for scenarios such as encrypting TLS communication channels, cryptographically signing code, authenticating users, and more. But what happens if you decide to change your TLS endpoint or update your code signing entity? How do you revoke a certificate so that others no longer accept it?
In this blog post, we will cover two fully managed certificate revocation status checking mechanisms provided by ACM PCA: the Online Certificate Status Protocol (OCSP) and certificate revocation lists (CRLs). OCSP and CRLs both enable you to manage how you can notify services and clients about ACM PCA–issued certificates that you revoke. We’ll explain how these standard mechanisms work, we’ll highlight appropriate deployment use cases, and we’ll identify the advantages and downsides of each. We won’t cover configuration topics directly, but will provide you with links to that information as we go.
Certificate revocation
An X.509 certificate is a static, cryptographically signed document that represents a user, an endpoint, an IoT device, or a similar end entity. Because certificates provide a mechanism to authenticate these end entities, they are valid for a fixed period of time that you specify in the expiration date attribute when you generate a certificate. The expiration attribute is important, because it validates and regulates an end entity’s identity, and provides a means to schedule the termination of a certificate’s validity. However, there are situations where a certificate might need to be revoked before its scheduled expiration. These scenarios can include a compromised private key, the end of agreement between signed and signing organizations, user or configuration error when issuing certificates, and more. Although you can use certificates in many ways, we will refer to the predominant use case of TLS-based client-server implementations for the remainder of this blog post.
Certificate revocation can be used to identify certificates that are no longer trusted, and CRLs and OCSP are the standard mechanisms used to publish the revocation information. In addition, the special use case of OCSP stapling provides a more efficient mechanism that is supported in TLS 1.2 and later versions.
ACM PCA gives you the flexibility to use either of these mechanisms, or both. More importantly, as an ACM PCA administrator, the mechanism you choose to use is reflected in the certificate, and you must know how you want to manage revocation before you create the certificate. Therefore, you need to understand how the mechanisms work, select your strategy based on its appropriateness to your needs, and then create and deploy your certificates. Let’s look at how each mechanism works, the use cases for each, and issues to be aware of when you select a revocation strategy.
Certificate revocation using CRLs
As the name suggests, a CRL contains a list of revoked certificates. A CRL is cryptographically signed and issued by a CA, and made available for download by clients (for example, web browsers for TLS) through a CRL distribution point (CDP) such as a web server or a Lightweight Directory Access Point (LDAP) endpoint.
A CRL contains the revocation date and the serial number of revoked certificates. It also includes extensions, which specify whether the CA administrator temporarily suspended or irreversibly revoked the certificate. The CRL is signed and timestamped by the CA and can be verified by using the public key of the CA and the cryptographic algorithm included in the certificate. Clients download the CRL by using the address provided in the CDP extension and trust a certificate by verifying the signature, expiration date, and revocation status in the CRL.
CRLs provide an easy way to verify certificate validity. They can be cached and reused, which makes them resilient to network disruptions, and are an excellent choice for a server that is getting requests from many clients for the same CA. All major web browsers, OpenSSL, and other major TLS implementations support the CRL method of validating certificates.
However, the size of CRLs can lead to inefficiency for clients that are validating server identities. An example is the scenario of browsing multiple websites and downloading a CRL for each site that is visited. CRLs can also grow large over time as you revoke more certificates. Consider the World Wide Web and the number of invalidations that take place daily, which makes CRLs an inefficient choice for small-memory devices (for example, mobile, IoT, and similar devices). In addition, CRLs are not suited for real-time use cases. CRLs are downloaded periodically, a value that can be hours, days, or weeks, and cached for memory management. Many default TLS implementations, such as Mozilla, Chrome, Windows OS, and similar, cache CRLs for 24 hours, leaving a window of up to a day where an endpoint might incorrectly trust a revoked certificate. Cached CRLs also open opportunities for non-trusted sites to establish secure connections until the server refreshes the list, leading to security risks such as data breaches and identity theft.
Implementing CRLs by using ACM PCA
ACM PCA supports CRLs and stores them in an Amazon Simple Storage Service (Amazon S3) bucket for high availability and durability. You can refer to this blog post for an overview of how to securely create and store your CRLs for ACM PCA. Figure 1 shows how CRLs are implemented by using ACM PCA.

Figure 1: Certificate validation with a CRL
The workflow in Figure 1 is as follows:
- On certificate revocation, ACM PCA updates the Amazon S3 CRL bucket with a new CRL.
Note: An update to the CRL may take up to 30 minutes after a certificate is revoked.
- The client requests a TLS connection and receives the server’s certificate.
- The client retrieves the current CRL file from the Amazon S3 bucket and validates it.
The refresh interval is the period between when an administrator revokes a certificate and when all parties consider that certificate revoked. The length of the refresh interval can depend on how quickly new information is published and how long clients cache revocation information to improve performance.
When you revoke a certificate, ACM PCA publishes a new CRL. ACM PCA waits 5 minutes after a RevokeCertificate API call before publishing a new CRL. This process exists to accommodate multiple revocation requests in a short time frame. An update to the CRL can take up to 30 minutes to propagate. If the CRL update fails, ACM PCA makes further attempts every 15 minutes.
CRLs also have a validity period, which you define as part of the CRL configuration by using ExpirationInDays. ACM PCA uses the value in the ExpirationInDays parameter to calculate the nextUpdate field in the CRL (the day and time when ACM PCA will publish the next CRL). If there are no changes to the CRL, the CRL is refreshed at half the interval of the next update. Clients may cache CRLs while they are still valid, so not all clients will have the updated CRL with the newly revoked certificates until the previous published CRL has expired.
Certificate revocation using OCSP
OCSP removes the burden of downloading the CRL from the client. With OCSP, clients provide the serial number and obtain the certificate status for a single certificate from an OCSP Responder. The OCSP Responder can be the CA or an endpoint managed by the CA. The certificate that is returned to the client contains an authorityInfoAccess extension, which provides an accessMethod (for example, OCSP), and identifies the OCSP Responder by a URL (for example, http://example-responder:<port>) in the accessLocation. You can also specify the OCSP Responder location manually in the CA profile. The certificate status response that is returned by the OCSP Responder can be good, revoked, or unknown, and is signed by using a process similar to the CRL for protection against forgery.
OCSP status checks are conducted in real time and are a good choice for time-sensitive devices, as well as mobile and IoT devices with limited memory.
However, the certificate status needs to be checked against the OCSP Responder for every connection, therefore requiring an extra hop. This can overwhelm the responder endpoint that needs to be designed for high availability, low latency, and protection against network and system failures. We will cover how ACM PCA addresses these availability and latency concerns in the next section.
Another thing to be mindful of is that the OCSP protocol implements OCSP status checks over unencrypted HTTP that poses privacy risks. When a client requests a certificate status, the CA receives information regarding the endpoint that is being connected to (for example, domain, IP address, and related information), which can easily be intercepted by a middle party. We will address how OCSP stapling can be used to address these privacy concerns in the OCSP stapling section.
Implementing OCSP by using ACM PCA
ACM PCA provides a highly available, fully managed OCSP solution to notify endpoints that certificates have been revoked. The OCSP implementation uses AWS managed OCSP responders and a globally available Amazon CloudFront distribution that caches OCSP responses closer to you, so you don’t need to set up and operate any infrastructure by yourself. You can enable OCSP on new or existing CAs using the ACM PCA console, the API, the AWS Command Line Interface (AWS CLI), or through AWS CloudFormation. Figure 2 shows how OCSP is implemented on ACM PCA.
Note: OCSP Responders, and the CloudFront distribution that caches the OCSP response for client requests, are managed by AWS.

Figure 2: Certificate validation with OCSP
The workflow in Figure 2 is as follows:
- On certificate revocation, the ACM PCA updates the OCSP Responder, which generates the OCSP response.
- The client requests a TLS connection and receives the server’s certificate.
- The client sends a query to the OCSP endpoint on CloudFront.
Note: If the response is still valid in the CloudFront cache, it will be served to the client from the cache.
- If the response is invalid or missing in the CloudFront cache, the request is forwarded to the OCSP Responder.
- The OCSP Responder sends the OCSP response to the CloudFront cache.
- CloudFront caches the OCSP response and returns it to the client.
The ACM PCA OCSP Responder generates an OCSP response that gets cached by CloudFront for 60 minutes. When a certificate is revoked, ACM PCA updates the OCSP Responder to generate a new OCSP response. During the caching interval, clients continue to receive responses from the CloudFront cache. As with CRLs, clients may also cache OCSP responses, which means that not all clients will have the updated OCSP response for the newly revoked certificate until the previously published (client-cached) OCSP response has expired. Another thing to be mindful of is that while the response is cached, a compromised certificate can be used to spoof a client.
Certificate revocation using OCSP stapling
With both CRLs and OCSP, the client is responsible for validating the certificate status. OCSP stapling addresses the client validation overhead and privacy concerns that we mentioned earlier by having the server obtain status checks for certificates that the server holds, directly from the CA. These status checks are periodic (based on a user-defined value), and the responses are stored on the web server. During TLS connection establishment, the server staples the certificate status in the response that is sent to the client. This improves connection establishment speed by combining requests and reduces the number of requests that are sent to the OCSP endpoint. Because clients are no longer directly connecting to OCSP Responders or the CAs, the privacy risks that we mentioned earlier are also mitigated.
Implementing OCSP stapling by using ACM PCA
OCSP stapling is supported by ACM PCA. You simply use the OCSP Certificate Status Response passthrough to add the stapling extension in the TLS response that is sent from the server to the client. Figure 3 shows how OCSP stapling works with ACM PCA.

Figure 3: Certificate validation with OCSP stapling
The workflow in Figure 3 is as follows:
- On certificate revocation, the ACM PCA updates the OCSP Responder, which generates the OCSP response.
- The client requests a TLS connection and receives the server’s certificate.
- In the case of server’s cache miss, the server will query the OCSP endpoint on CloudFront.
Note: If the response is still valid in the CloudFront cache, it will be returned to the server from the cache.
- If the response is invalid or missing in the CloudFront cache, the request is forwarded to the OCSP Responder.
- The OCSP Responder sends the OCSP response to the CloudFront cache.
- CloudFront caches the OCSP response and returns it to the server, which also caches the response.
- The server staples the certificate status in its TLS connection response (for TLS 1.2 and later versions).
OCSP stapling is supported with TLS 1.2 and later versions.
Selecting the correct path with OCSP and CRLs
All certificate revocation offerings from AWS run on a highly available, distributed, and performance-optimized infrastructure. We strongly recommend that you enable a certificate validation and revocation strategy in your environment that best reflects your use case. You can opt to use CRLs, OCSP, or both. Without a revocation and validation process in place, you risk unauthorized access. We recommend that you review your business requirements and evaluate the risk profile of access with an invalid certificate versus the availability requirements for your application.
In the following sections, we’ll provide some recommendations on when to select which certificate validation and revocation strategy. We’ll cover client-server TLS communication, and also provide recommendations for mutual TLS (mTLS) authentication scenarios.
Recommended scenarios for OCSP stapling and OCSP Must-Staple
If your organization requires support for TLS 1.2 and later versions, you should use OCSP stapling. If you want to reduce the application availability risk for a client that is configured to fail the TLS connection establishment when it is unable to validate the certificate, you should consider using the OCSP Must-Staple extension.
OCSP stapling
If your organization requires support for TLS 1.2 and later versions, you should use OCSP stapling. With OCSP stapling, you reduce your client’s load and connectivity requirements, which helps if your network connectivity is unpredictable. For example, if your application client is a mobile device, you should anticipate network failures, low bandwidth, limited processing capacity, and impatient users. In this scenario, you will likely benefit the most from a system that relies on OCSP stapling.
Although the majority of web browsers support OCSP stapling, not all servers support it. OCSP stapling is, therefore, typically implemented together with CRLs that provide an alternate validation mechanism or as a passthrough for when the OCSP response fails or is invalid.
OCSP Must-Staple
If you want to rely on OCSP alone and avoid implementing CRLs, you can use the OCSP Must-Staple certificate extension, which tells the connecting client to expect a stapled response. You can then use OCSP Must-Staple as a flag for your client to fail the connection if the client does not receive a valid OCSP response during connection establishment.
Recommended scenarios for CRLs, OCSP (without stapling), and combinational strategies
If your application needs to support legacy, now deprecated protocols such as TLS 1.0 or 1.1, or if your server doesn’t support OCSP stapling, you could use a CRL, OCSP, or both together. To determine which option is best, you should consider your sensitivity to CA availability, recently revoked certificates, the processing capacity of your application client, and network latency.
CRLs
If your application needs to be available independent of your CA connectivity, you should consider using a CRL. CRLs are much larger files that, from a practical standpoint, require much longer cache times to be of use, but they will be present and available for verification on your system regardless of the status of your network connection. In addition, the lookup time of a certificate within a CRL is local and therefore shorter than a network round trip to an OCSP Responder, because there are no network connection or DNS lookup times.
OCSP (without stapling)
If you are sensitive to the processing capacity of your application client, you should use OCSP. The size of an OCSP message is much smaller compared to a CRL, which allows you to configure shorter caching times that are better suited for your risk profile. To optimize your OCSP and OCSP stapling process, you should review your DNS configuration because it plays a significant role in the amount of time your application will take to receive a response.
For example, if you’re building an application that will be hosted on infrastructure that doesn’t support OCSP stapling, you will benefit from clients making an OCSP request and caching it for a short period. In this scenario, your application client will make a single OCSP request during its connection setup, cache the response, and reuse the certificate state for the duration of its application session.
Combining CRLs and OCSP
You can also choose to implement both CRLs and OCSP for your certificate revocation and validation needs. For example, if your application needs to support legacy TLS protocols while providing resiliency to network failures, you can implement both CRLs and OCSP. When you use CRLs and OCSP together, you verify certificates primarily by using OCSP; however, in case your client is unable to reach the OCSP endpoint, you can fail over to an alternative validation method (for example, CRL). This approach of combining CRLs and OCSP gives you all the benefits of OCSP mentioned earlier, while providing a backup mechanism for failure scenarios such as an unreachable OCSP Responder, invalid response from the OCSP Responder, and similar. However, while this approach adds resilience to your application, it will add management overhead because you will need to set up CRL-based and OCSP-based revocation separately. Also, remember that clients with reduced computing power or poor network connectivity might struggle as they attempt to download and process the CRL.
Recommendations for mTLS authentication scenarios
You should consider network latency and revocation propagation delays when optimizing your server infrastructure for mTLS authentication. In a typical scenario, server certificate changes are infrequent, so caching an OCSP response or CRL on your client and an OCSP-stapled response on a server will improve performance. For mTLS, you can revoke a client certificate at any time; therefore, cached responses could introduce the risk of invalid access. You should consider designing your system such that a copy of a CRL for client certificates is maintained on the server and refreshed based on your business needs. For example, you can use S3 ETags to determine whether an object has changed, and flush the server’s cache in response.
Conclusion
This blog post covered two certificate revocation methods, OCSP and CRLs, that are available on ACM PCA. Remember, when you deploy CA hierarchies for public key infrastructure (PKI), it’s important to define how to handle certificate revocation. The certificate revocation information must be included in the certificate when it is issued, so the choice to enable either CRL or OCSP, or both, has to happen before the certificate is issued. It’s also important to have highly available CRL and OCSP endpoints for certificate lifecycle management. ACM PCA provides a highly available, fully managed CA service that you can use to meet your certificate revocation and validation requirements. Get started using ACM PCA.
If you have feedback about this post, submit comments in the Comments section below. If you have questions about this post, contact AWS Support.
Want more AWS Security news? Follow us on Twitter.
AWS Week in Review – May 16, 2022
Post Syndicated from Marcia Villalba original https://aws.amazon.com/blogs/aws/aws-week-in-review-may-16-2022/
I had been on the road for the last five weeks and attended many of the AWS Summits in Europe. It was great to talk to so many of you in person. The Serverless Developer Advocates are going around many of the AWS Summits with the Serverlesspresso booth. If you attend an event that has the booth, say “Hi  ” to my colleagues, and have a coffee while asking all your serverless questions. You can find all the upcoming AWS Summits in the events section at the end of this post.
Last week’s launches
Here are some launches that got my attention during the previous week.
AWS Step Functions announced a new console experience to debug your state machine executions – Now you can opt-in to the new console experience of Step Functions, which makes it easier to analyze, debug, and optimize Standard Workflows. The new page allows you to inspect executions using three different views: graph, table, and event view, and add many new features to enhance the navigation and analysis of the executions. To learn about all the features and how to use them, read Ben’s blog post.

Example on how the Graph View looks
AWS Lambda now supports Node.js 16.x runtime – Now you can start using the Node.js 16 runtime when you create a new function or update your existing functions to use it. You can also use the new container image base that supports this runtime. To learn more about this launch, check Dan’s blog post.
AWS Amplify announces its Android library designed for Kotlin – The Amplify Android library has been rewritten for Kotlin, and now it is available in preview. This new library provides better debugging capacities and visibility into underlying state management. And it is also using the new AWS SDK for Kotlin that was released last year in preview. Read the What’s New post for more information.
Three new APIs for batch data retrieval in AWS IoT SiteWise – With this new launch AWS IoT SiteWise now supports batch data retrieval from multiple asset properties. The new APIs allow you to retrieve current values, historical values, and aggregated values. Read the What’s New post to learn how you can start using the new APIs.
AWS Secrets Manager now publishes secret usage metrics to Amazon CloudWatch – This launch is very useful to see the number of secrets in your account and set alarms for any unexpected increase or decrease in the number of secrets. Read the documentation on Monitoring Secrets Manager with Amazon CloudWatch for more information.
For a full list of AWS announcements, be sure to keep an eye on the What’s New at AWS page.
Other AWS News
Some other launches and news that you may have missed:
IBM signed a deal with AWS to offer its software portfolio as a service on AWS. This allows customers using AWS to access IBM software for automation, data and artificial intelligence, and security that is built on Red Hat OpenShift Service on AWS.
Podcast Charlas Técnicas de AWS – If you understand Spanish, this podcast is for you. Podcast Charlas Técnicas is one of the official AWS podcasts in Spanish. This week’s episode introduces you to Amazon DynamoDB and shares stories on how different customers use this database service. You can listen to all the episodes directly from your favorite podcast app or the podcast web page.
AWS Open Source News and Updates – Ricardo Sueiras, my colleague from the AWS Developer Relation team, runs this newsletter. It brings you all the latest open-source projects, posts, and more. Read edition #112 here.
Upcoming AWS Events
It’s AWS Summits season and here are some virtual and in-person events that might be close to you:
- May 18, AWS Summit Tel Aviv (in-person)
- May 18, AWS Summit ASEAN (online)
- May 18–19, AWS Summit Australia and New Zealand (online)
- May 18–19, AWS Summit Atlanta (in-person)
- May 23–25, AWS Summit Washington, DC (in-person)
You can register for re:MARS to get fresh ideas on topics such as machine learning, automation, robotics, and space. The conference will be in person in Las Vegas, June 21–24.
That’s all for this week. Check back next Monday for another Week in Review!
— Marcia
[$] Dynamically allocated pseudo-filesystems
Post Syndicated from original https://lwn.net/Articles/895111/
It is perhaps unusual to have a kernel tracing developer leading a
filesystem session, Steven Rostedt said, at the beginning of such a session at the
2022 Linux Storage,
Filesystem, Memory-management and BPF Summit (LSFMM). But he was doing
so to
try to find a good way to dynamically allocate kernel data structures
for some of the pseudo-filesystems, such as sysfs, debugfs, and tracefs,
in the kernel.
Avoiding static allocations would save memory, especially on systems
that are not actually using any of the files in those filesystems.
How we’re using projects to build projects
Post Syndicated from Jed Verity original https://github.blog/2022-05-16-how-were-using-projects-to-build-projects/
At GitHub, we use GitHub to build our own products, whether that be moving our entire Engineering team over to Codespaces for the majority of GitHub.com development, or utilizing GitHub Actions to coordinate our GitHub Mobile releases. And while GitHub Issues has been a part of the GitHub experience since the early days and is an integral part of how we work together as Hubbers internally, the addition of powerful project planning has given us more opportunities to test out some of our most exciting products.
In this post, I’m going to share how we’ve been utilizing the new projects experience across our team (from an engineer like myself all the way to our VPs and team leads). We love working so closely with developers to ship requested features and updates (all of which roll up into the Changelogs you see), and using the new projects helps us stay consistent in our shipping cadence.
How we think about shipping
Our core team consists of members of the product, engineering, design, and user research teams. We recognize that good ideas can come from anywhere. Our process is designed to inspire, surface, and implement those ideas, whether they come from users, individual contributors, managers, directors, or VPs. To get the proper alignment for this group, we’ve agreed on a few guiding principles that drive what our roadmap will look like:
 The pitch: When it comes to what we’re going to work on (outside of the big pieces of work on our roadmap) people within our team can pitch ideas in our team’s repository for upcoming cycles (which we define as 6-8 weeks of work, inclusive of planning, engineering work, and an unstructured passion project week); these can be features, fixes, or even maintenance work. Every pitch must clearly state the problem it’s solving and why it’s important for us to prioritize. Some features that have come from this process include live updates, burn up charts for insights, and more. Note: these are all the changes you see as a developer, but we also have a lot of pitches come in from my fellow engineers focused around the developer experience. For example, a couple successful pitches have included reducing our CI time to 10 minutes, and streamlining our release process by switching to a ring deployment model and adding ChatOps.
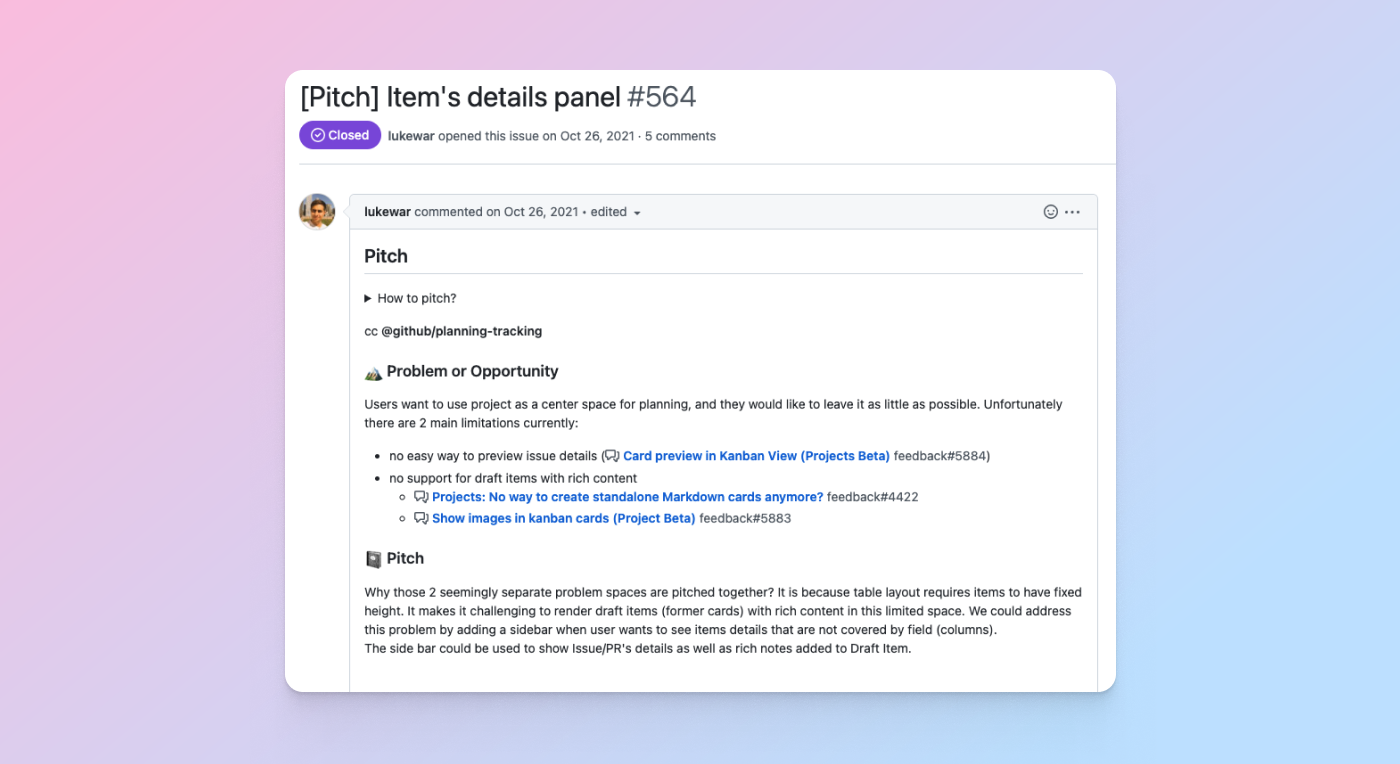
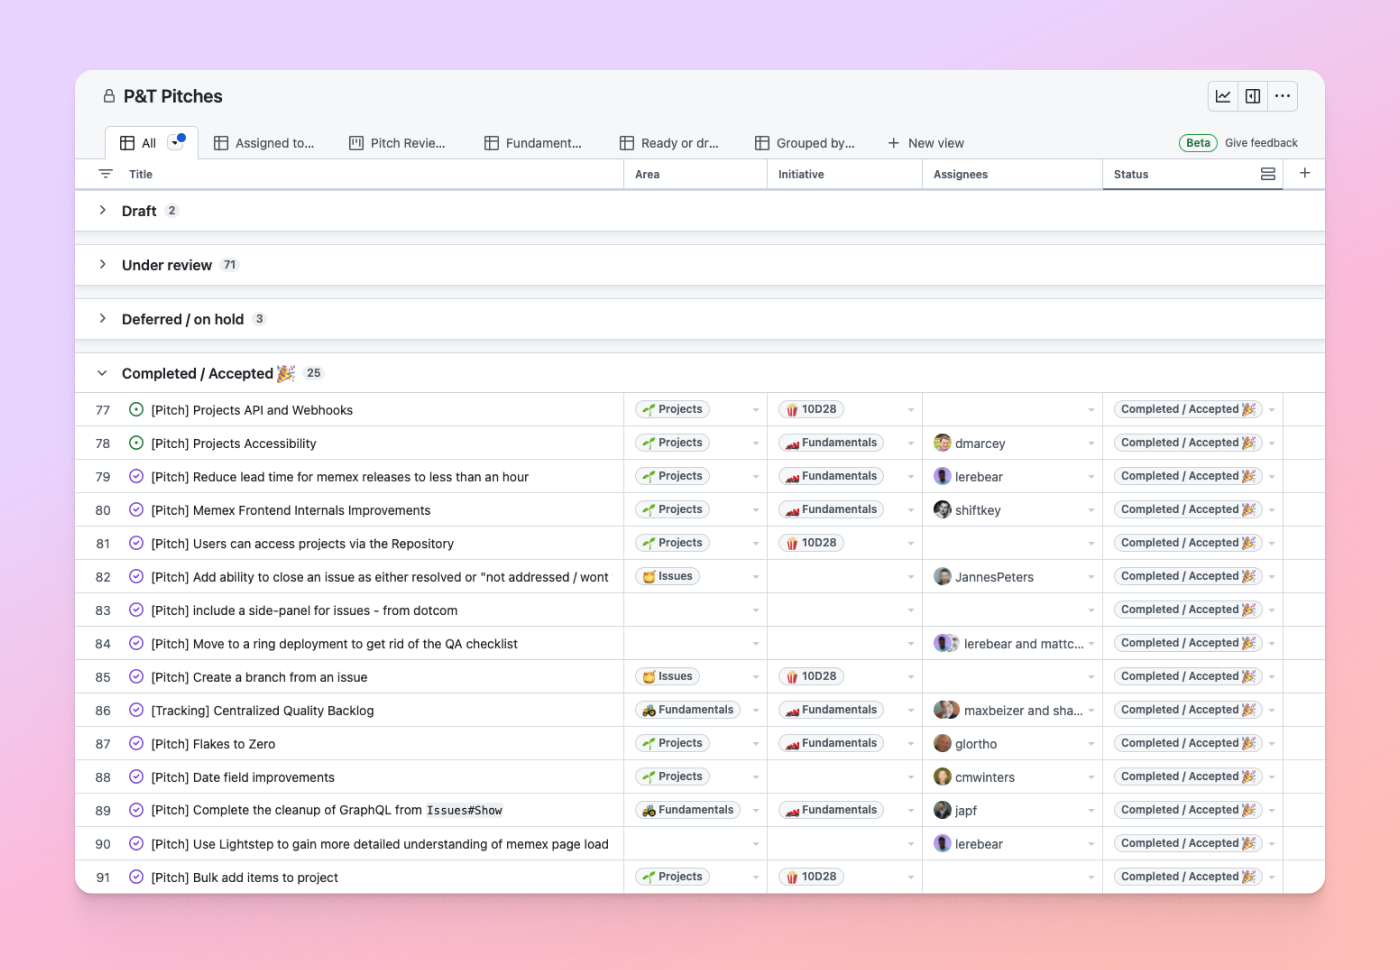
 In addition to using issues to propose and converse on pitches from the team, we use the new projects experience to track and manage all the pitches from the team so we can see them in an all-up table or board view.
 Keep it small: We knew for ourselves, and for developers, that we didn’t want to lock them into a specific planning methodology and over-complicate a team’s planning and tracking process. For us, we wanted to plan shorter cycles for our team to increase our tempo and focus, so we opted for six-week cycles to break up and build features. Check out how we recommend getting started with this approach in a recent blog post.
 Ship to learn: Similar to how we ship a lot of our products, we knew developers and customers were going to be heavily intertwined with each and every ship, giving us immediate feedback in both the private and public beta. Their feedback both influenced what we built and then how we iterated and continued to better the experience once something did ship. While there are so many people to thank, we’re extremely grateful for all our customers along the way for being our partners in building GitHub Issues into the place for developers to project plan.
How we used projects to do it
We love that the product we’re building doesn’t tool a specific project management methodology, but equips users with powerful primitives that they can compose into their preferred experiences and workflows. This allows for many people (not just us engineers) involved in building and developing products at GitHub (team leads, marketing, design, sales, etc.) the ability to use the product in a way that makes sense for them.
With the above principles in mind, once a pitch has been agreed upon to move forward on building, that pitch issue becomes a tracking issue in a project table or board that we convert into pieces of work that fit into an upcoming cycle. A great example of this was when we updated the GitHub Issues icons to lessen confusion among developers. This came in as a pitch from a designer on the team, and was soon accepted and moved into epic planning in which the team responsible began to track the individual pieces of work needed to make this happen.

IC approach
Let’s start with how my fellow engineers, individual contributors and I use projects for day-to-day development within cycles. From our perspective on any given day, we’re hyper-focused on tackling what issues and pull requests are assigned to us (fun fact: we recently added the assignee:me filter to make this even easier) in a given cycle, so we work from more individually scoped project tables or boards that stem from the larger epic and iteration tracking. Because of this, we can easily zoom out from our individual tasks to see how our work fits into a given cycle, and then even zoom out more into how it fits into larger initiatives.
In addition to scoping more specifically a given table or board, engineers across our organization utilize a personal project table or board to track all the things specific to themselves like what issues are assigned to them—even work not connected to a given cycle, like open source work.

EM approach
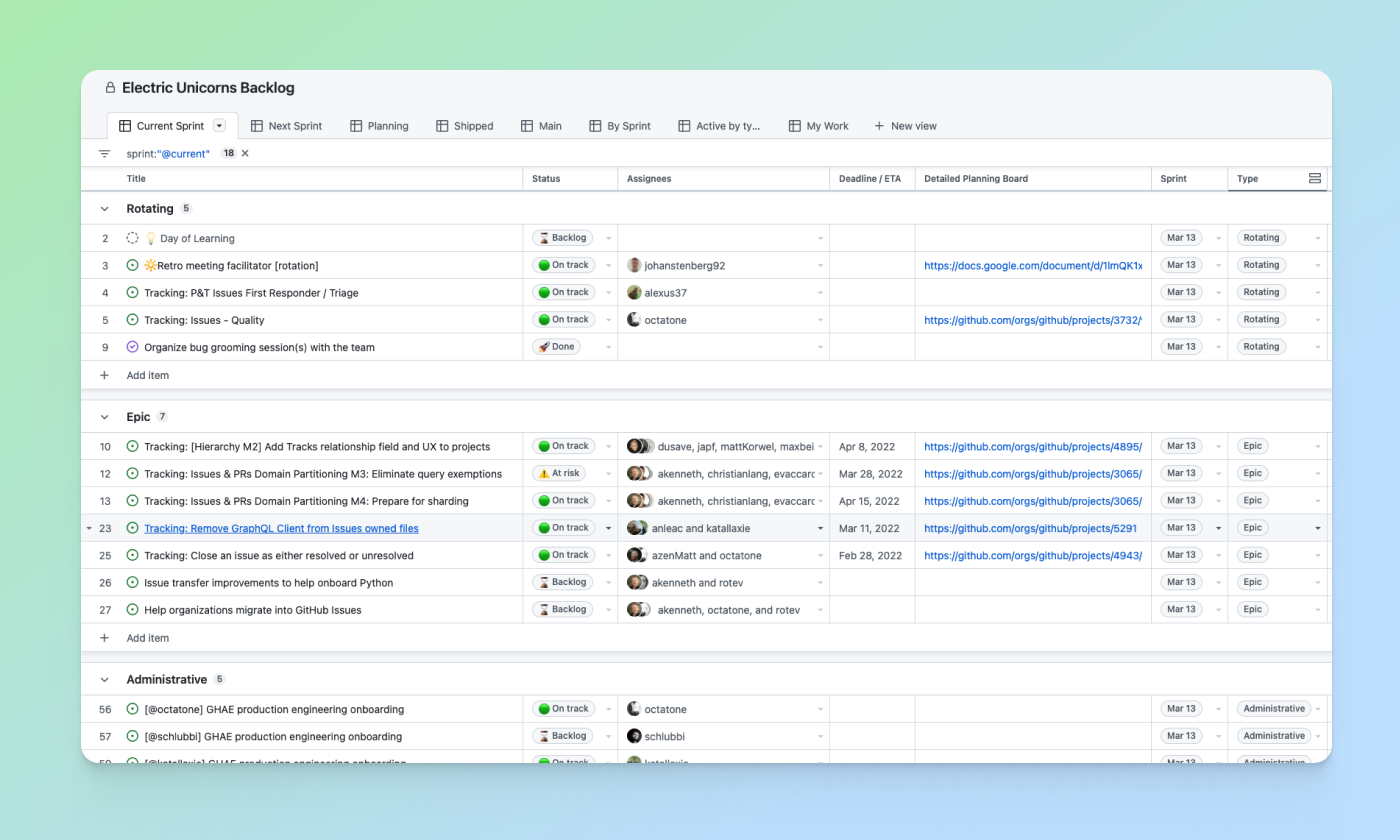
If we pull back to engineering managers overseeing those smaller cycles, they’re focused on kicking off an accepted pitch’s work, breaking it first into cycles and then into smaller iterations in which they can assign out work. A given cycle’s table or board view allows the managers to have a whole look at all members of their team and look specifically at things that are important to them, like all the pull requests that are open and quickly seeing which engineers are assigned, what pull requests have been merged, deployed, etc.
Check out what this looks like in our team board.
Team lead approach
Now, if we put ourselves in the shoes of our team leads and Directors/VPs, we see that they’re using the new projects experience to primarily get the full picture of where product and feature development currently sit. They told me the main team roadmap and backlog is where they can get questions answered like:
- Which projects do we have in flight in which product area right now?
- Who’s the key decision maker for this project?
- Which engineers are working on which projects?
- Which projects are at risk and need help (progress/status)?
What’s great about this is that they can quickly glance at what’s in motion and then click into any cycles or status to get more context on open issues, pull requests, and how everything is connected.
Outside of being able to check in on what’s being worked on and where the organization’s current focus is, our leads have found additional use cases that may not be applicable for an engineer like me. They use private projects for more sensitive tasks, like managing our team’s hiring, tracking upcoming start dates, making sure they’re staying on top of career development, organizational change management, and more.
Wrap-up
This is how we as the planning and tracking team at GitHub are using the very product we’re building for you to build the new projects experience. There are many other teams across GitHub that utilize the new project tables and boards, but we hope this gives you a little bit of inspiration about how to think about project planning on GitHub and how to optimize for all the stakeholders involved in building and shipping products.
What’s great about project planning on GitHub is that our focus on powerful primitives approach to project management means that there is an unlimited amount of flexibility for you and your team to play around with, and likely many, many ways we haven’t even thought about how to use the product. So, please let us know how you’re using it and how we can improve the experience!
Sione Havili | Why Second Chances Matter | Talks at Google
Post Syndicated from Talks at Google original https://www.youtube.com/watch?v=oC0BdyAiIlo
SFC v. Vizio remanded back to California state courts
Post Syndicated from original https://lwn.net/Articles/895405/
Software Freedom Conservancy (SFC)
has announced
that it succeeded with its motion in US Federal Court to send the case back
to California, where it was originally filed. The suit was filed
in October 2021 by SFC, as an owner of Vizio televisions, to get
the company to comply with the GPL on some of the code in the TVs. Back in November, Vizio had
asked to move the
case to Federal Court, because the GPL is only a copyright license
(which is a dispute handled at the Federal level) and not a contract (that
could be adjudicated in state court). Friday’s ruling disagreed with that premise:
The May 13 ruling by the Honorable Josephine L. Staton stated that the
claim from Software Freedom Conservancy succeeded in the “extra element
test” and was not preempted by copyright claims, and the court finds “that
the enforcement of ‘an additional contractual promise separate and distinct
from any rights provided by the copyright laws’ amounts to an ‘extra
element,’ and therefore, SFC’s claims are not preempted.”“The ruling is a watershed moment in the history of copyleft
licensing. This ruling shows that the GPL agreements function both as
copyright licenses and as contractual agreements,” says Karen M. Sandler,
executive director of Software Freedom Conservancy. Sandler noted that many
in the Free and Open Source Software (FOSS) legal community argue
incorrectly that the GPL and other copyleft licenses only function as
copyright licenses.
[$] The netfslib helper library
Post Syndicated from original https://lwn.net/Articles/894589/
A new helper library for network filesystems, called netfslib, was the subject
of a filesystem session at the
2022 Linux Storage,
Filesystem, Memory-management and BPF Summit (LSFMM). David Howells
developed
netfslib, which was merged for 5.13 a year ago, and led the session.
Some filesystems, like AFS and Ceph, are already using some of the services
that netfslib provides, while others are starting to look into it.
Use direct service integrations to optimize your architecture
Post Syndicated from Jerome Van Der Linden original https://aws.amazon.com/blogs/architecture/use-direct-service-integrations-to-optimize-your-architecture/
When designing an application, you must integrate and combine several AWS services in the most optimized way for an effective and efficient architecture:
- Optimize for performance by reducing the latency between services
- Optimize for costs operability and sustainability, by avoiding unnecessary components and reducing workload footprint
- Optimize for resiliency by removing potential point of failures
- Optimize for security by minimizing the attack surface
As stated in the Serverless Application Lens of the Well-Architected Framework, “If your AWS Lambda function is not performing custom logic while integrating with other AWS services, chances are that it may be unnecessary.” In addition, Amazon API Gateway, AWS AppSync, AWS Step Functions, Amazon EventBridge, and Lambda Destinations can directly integrate with a number of services. These optimizations can offer you more value and less operational overhead.
This blog post will show how to optimize an architecture with direct integration.
Workflow example and initial architecture
Figure 1 shows a typical workflow for the creation of an online bank account. The customer fills out a registration form with personal information and adds a picture of their ID card. The application then validates ID and address, and scans if there is already an existing user by that name. If everything checks out, a backend application will be notified to create the account. Finally, the user is notified of successful completion.

Figure 1. Bank account application workflow
The workflow architecture is shown in Figure 2 (click on the picture to get full resolution).
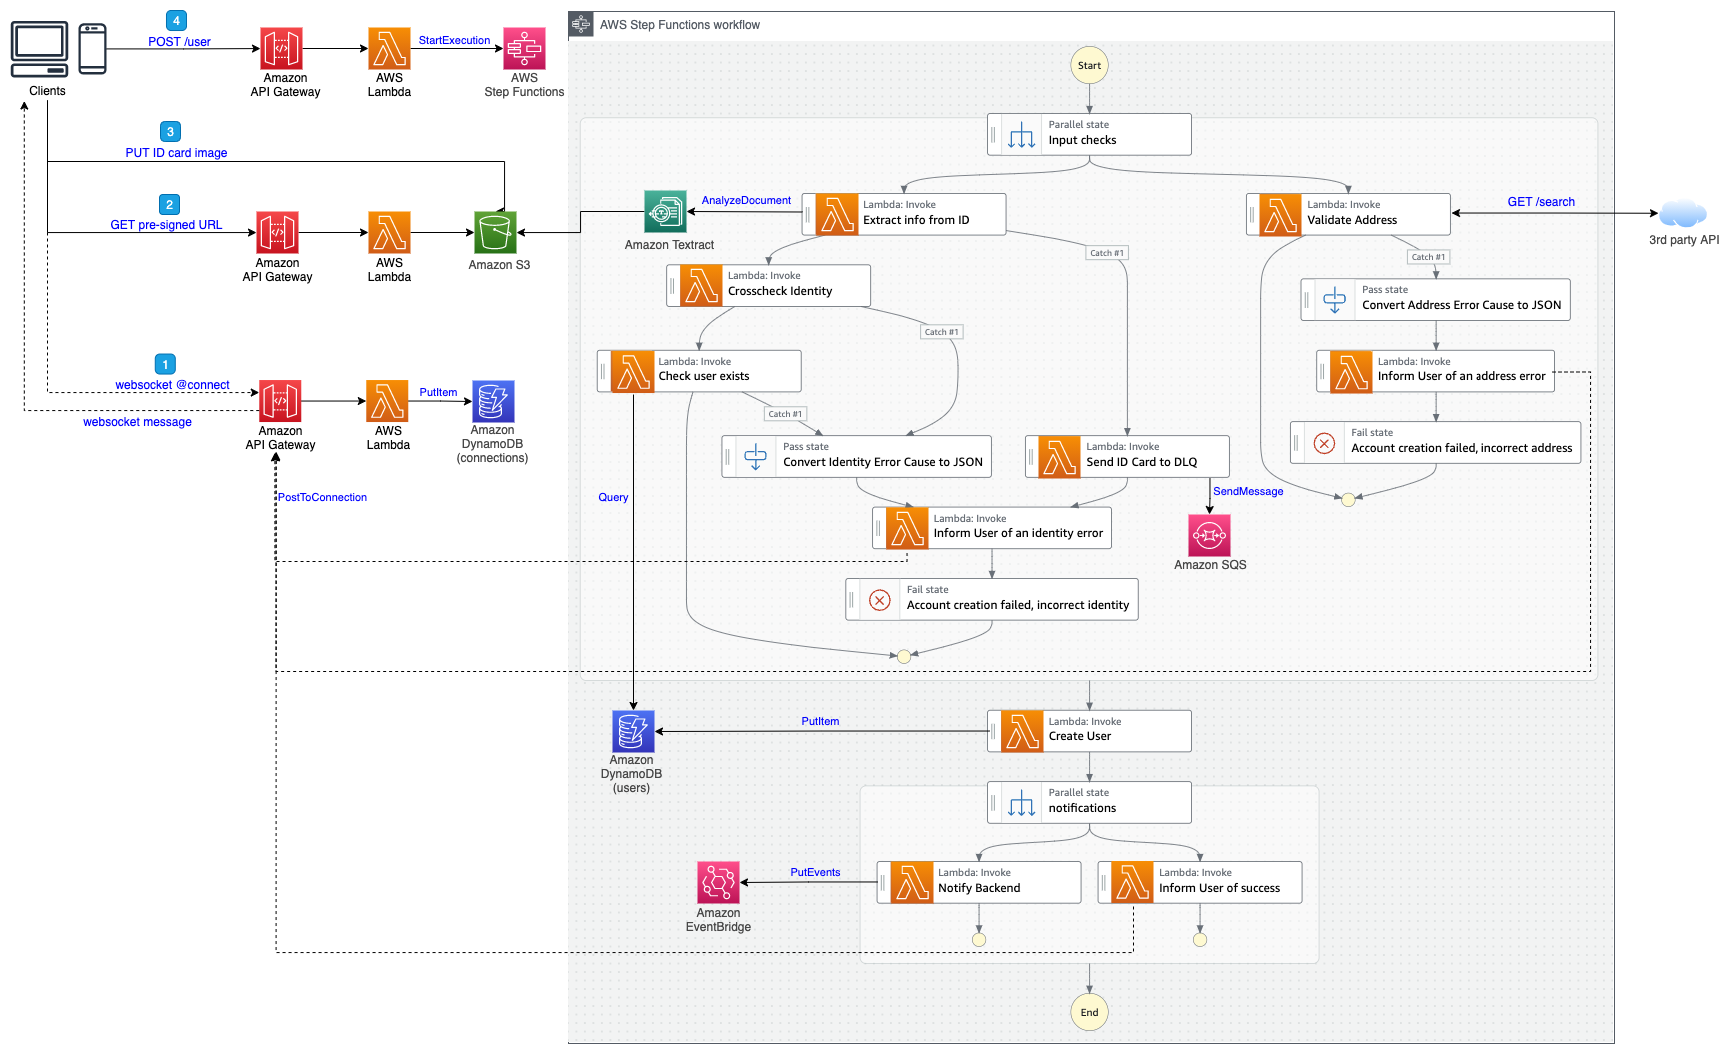
Figure 2. Initial account creation architecture
This architecture contains 13 Lambda functions. If you look at the code on GitHub, you can see that:
Five of these Lambda functions are basic and perform simple operations:
- One function to execute the Step Functions state machine
- Two functions to perform create, read, update, and delete (CRUD) operations on Amazon DynamoDB
- Two functions to send messages on Amazon Simple Queue Service (Amazon SQS) or EventBridge
Additional Lambda functions perform other tasks, such as verification and validation:
- One function generates a presigned URL to upload ID card pictures to Amazon Simple Storage Service (Amazon S3)
- One function uses the Amazon Textract API to extract information from the ID card
- One function verifies the identity of the user against the information extracted from the ID card
- One function performs simple HTTP request to a third-party API to validate the address
Finally, four functions concern the websocket (connect, message, and disconnect) and notifications to the user.
Opportunities for improvement
If you further analyze the code of the five basic functions (see startWorkflow on GitHub, for example), you will notice that there are actually three lines of fundamental code that start the workflow. The others 38 lines involve imports, input validation, error handling, logging, and tracing. Remember that all this code must be tested and maintained.
import os
import json
import boto3
from aws_lambda_powertools import Tracer
from aws_lambda_powertools import Logger
import re

logger = Logger()
tracer = Tracer()

sfn = boto3.client('stepfunctions')

PATTERN = re.compile(r"^arn:(aws[a-zA-Z-]*)?:states:[a-z]{2}((-gov)|(-iso(b?)))?-[a-z]+-\d{1}:\d{12}:stateMachine:[a-zA-Z0-9-_]+$")

if ('STATE_MACHINE_ARN' not in os.environ
    or os.environ['STATE_MACHINE_ARN'] is None
    or not PATTERN.match(os.environ['STATE_MACHINE_ARN'])):
    raise RuntimeError('STATE_MACHINE_ARN env var is not set or incorrect')

STATE_MACHINE_ARN = os.environ['STATE_MACHINE_ARN']

@logger.inject_lambda_context
@tracer.capture_lambda_handler
def handler(event, context):
    try:
        event['requestId'] = context.aws_request_id

        sfn.start_execution(
            stateMachineArn=STATE_MACHINE_ARN,
            input=json.dumps(event)
        )

        return {
            'requestId': event['requestId']
        }
    except Exception as error:
        logger.exception(error)
        raise RuntimeError('Internal Error - cannot start the creation workflow') from error
After running this workflow several times and reviewing the AWS X-Ray traces (Figure 3), we can see that it takes about 2–3 seconds when functions are warmed:

Figure 3. X-Ray traces when Lambda functions are warmed
But the process takes around 10 seconds with cold starts, as shown in Figure 4:

Figure 4. X-Ray traces when Lambda functions are cold
We use an asynchronous architecture to avoid waiting time for the user, as this can be a long process. We also use WebSockets to notify the user when it’s finished. This adds some complexity, new components, and additional costs to the architecture. Now let’s look at how we can optimize this architecture.
Improving the initial architecture
Direct integration with Step Functions
Step Functions can directly integrate with some AWS services, including DynamoDB, Amazon SQS, and EventBridge, and more than 10,000 APIs from 200+ AWS services. With these integrations, you can replace Lambda functions when they do not provide value. We recommend using Lambda functions to transform data, not to transport data from one service to another.
In our bank account creation use case, there are four Lambda functions we can replace with direct service integrations (see large arrows in Figure 5):
- Query a DynamoDB table to search for a user
- Send a message to an SQS queue when the extraction fails
- Create the user in DynamoDB
- Send an event on EventBridge to notify the backend

Figure 5. Lambda functions that can be replaced
It is not as clear that we need to replace the other Lambda functions. Here are some considerations:
- To extract information from the ID card, we use Amazon Textract. It is available through the SDK integration in Step Functions. However, the API’s response provides too much information. We recommend using a library such as amazon-textract-response-parser to parse the result. For this, you’ll need a Lambda function.
- The identity cross-check performs a simple comparison between the data provided in the web form and the one extracted in the ID card. We can perform this comparison in Step Functions using a
Choicestate and several conditions. If the business logic becomes more complex, consider using a Lambda function. - To validate the address, we query a third-party API. Step Functions cannot directly call a third-party HTTP endpoint, but because it’s integrated with API Gateway, we can create a proxy for this endpoint.
If you only need to retrieve data from an API or make a simple API call, use the direct integration. If you need to implement some logic, use a Lambda function.
Direct integration with API Gateway
API Gateway also provides service integrations. In particular, we can start the workflow without using a Lambda function. In the console, select the integration type “AWS Service”, the AWS service “Step Functions”, the action “StartExecution”, and “POST” method, as shown in Figure 6.

Figure 6. API Gateway direct integration with Step Functions
After that, use a mapping template in the integration request to define the parameters as shown here:
{
"stateMachineArn":"arn:aws:states:eu-central-1:123456789012:stateMachine: accountCreationWorkflow",
"input":"$util.escapeJavaScript($input.json('$'))"
}
We can go further and remove the websockets and associated Lambda functions connect, message, and disconnect. By using Synchronous Express Workflows and the StartSyncExecution API, we can start the workflow and wait for the result in a synchronous fashion. API Gateway will then directly return the result of the workflow to the client.
Final optimized architecture
After applying these optimizations, we have the updated architecture shown in Figure 7. It uses only two Lambda functions out of the initial 13. The rest have been replaced by direct service integrations or implemented in Step Functions.

Figure 7. Final optimized architecture
We were able to remove 11 Lambda functions and their associated fees. In this architecture, the cost is mainly driven by Step Functions, and the main price difference will be your use of Express Workflows instead of Standard Workflows. If you need to keep some Lambda functions, use AWS Lambda Power Tuning to configure your function correctly and benefit from the best price/performance ratio.
One of the main benefits of this architecture is performance. With the final workflow architecture, it now takes about 1.5 seconds when the Lambda function is warmed and 3 seconds on cold starts (versus up to 10 seconds previously), see Figure 8:

Figure 8. X-Ray traces for the final architecture
The process can now be synchronous. It reduces the complexity of the architecture and vastly improves the user experience.
An added benefit is that by reducing the overall complexity and removing the unnecessary Lambda functions, we have also reduced the risk of failures. These can be errors in the code, memory or timeout issues due to bad configuration, lack of permissions, network issues between components, and more. This increases the resiliency of the application and eases its maintenance.
Testing
Testability is an important consideration when building your workflow. Unit testing a Lambda function is straightforward, and you can use your preferred testing framework and validate methods. Adopting a hexagonal architecture also helps remove dependencies to the cloud.
When removing functions and using an approach with direct service integrations, you are by definition directly connected to the cloud. You still must verify that the overall process is working as expected, and validate these integrations.
You can achieve this kind of tests locally using Step Functions Local, and the recently announced Mocked Service Integrations. By mocking service integrations, for example, retrieving an item in DynamoDB, you can validate the different paths of your state machine.
You also have to perform integration tests, but this is true whether you use direct integrations or Lambda functions.
Conclusion
This post describes how to simplify your architecture and optimize for performance, resiliency, and cost by using direct integrations in Step Functions and API Gateway. Although many Lambda functions were reduced, some remain useful for handling more complex business logic and data transformation. Try this out now by visiting the GitHub repository.
For further reading:
Maximize Your VM Investment: Fix Vulnerabilities Faster With Automox + Rapid7
Post Syndicated from Nicholas Colyer original https://blog.rapid7.com/2022/05/16/maximize-your-vm-investment-fix-vulnerabilities-faster-with-automox-rapid7/

The Rapid7 InsightConnect Extension library is getting bigger! We’ve teamed up with IT operations platform, Automox, to release a new plugin and technology alliance that closes the aperture of attack for vulnerability findings and automates remediation. Using the Automox Plugin for Rapid7 InsightConnect in conjunction with InsightVM, customers are able to:
- Automate discovery-to-remediation of vulnerability findings
- Query Automox device details via Slack or Microsoft Teams
Getting started with Automox within InsightConnect
Automox is an IT Operations platform that fully automates the process of endpoint management across Windows, macOS, Linux, and third-party software — including Adobe, Java, Firefox, Chrome, and Windows.
The Automox InsightConnect Plugin allows mutual customers of Rapid7 and Automox to expand their capabilities between products, ultimately streamlining cyber security outcomes and operational effectiveness. Seamlessly transition CVE-based vulnerability findings through discovery to remediation, and perform device queries without needing to leave Slack or Microsoft Teams!
Example workflows you can start leveraging now with the Automox Plugin
- Generate Rapid7 InsightVM Report and Upload to Automox Vulnerability Sync: An example workflow that leverages threat context for assets and prioritizes them for remediation. An InsightVM report is automatically generated and uploaded using Automox’s Vulnerability Sync for easy remediation, saving internal teams precious time and effort in managing critically emerging threats – from start to finish.
- Automox Device Lookup from Microsoft Teams: An example workflow that lets a user query a device in Automox directly from Microsoft Teams.
- Automox Device Lookup from Slack: An example workflow that lets a user query a device in Automox directly from Slack.
For more information or to start using this plugin, access and install the Automox Plugin for Rapid7 InsightConnect through the Rapid7 Extension Library.
Additional reading:
How Ramadan shows up in Internet trends
Post Syndicated from João Tomé original https://blog.cloudflare.com/how-ramadan-shows-up-in-internet-trends/


What happens to the Internet traffic in countries where many observe Ramadan? Depending on the country, there are clear shifts and changing patterns in Internet use, particularly before dawn and after sunset.
This year, Ramadan started on April 2, and it continued until May 1, 2022, (dates vary and are dependent on the appearance of the crescent moon). For Muslims, it is a period of introspection, communal prayer and also of fasting every day from dawn to sunset. That means that people only eat at night (Iftar is the first meal after sunset that breaks the fast and often also a family or community event), and also before sunrise (Suhur).
In some countries, the impact is so big that we can see in our Internet traffic charts when the sun sets. Sunrise is more difficult to check in the charts, but in the countries more impacted, people wake up much earlier than usual and were using the Internet in the early morning because of that.
Cloudflare Radar data shows that Internet traffic was impacted in several countries by Ramadan, with a clear increase in traffic before sunrise, and a bigger than usual decrease after sunset. All times in this blog post are local. The data in the charts is bucketed into hours. So, for example, when we show an increase in traffic at 0400 we are showing that an increase occurred between 0400 and 0459 local time.
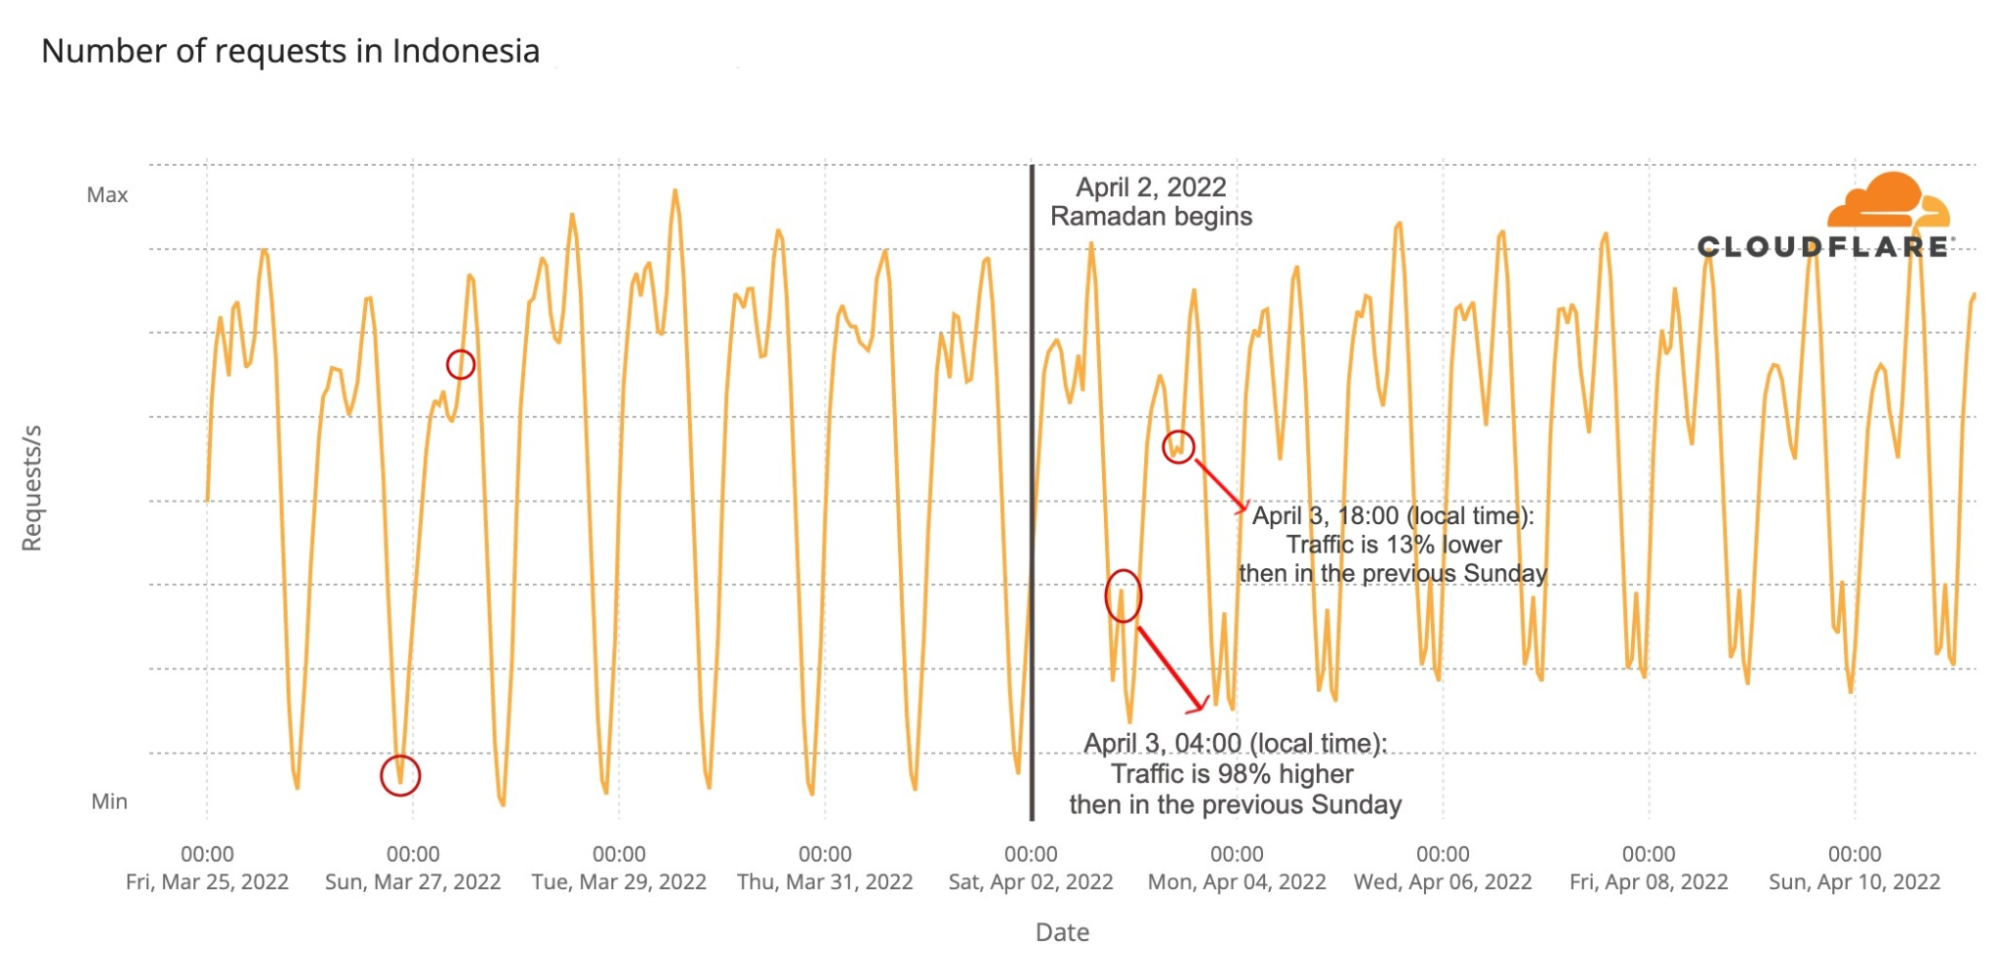
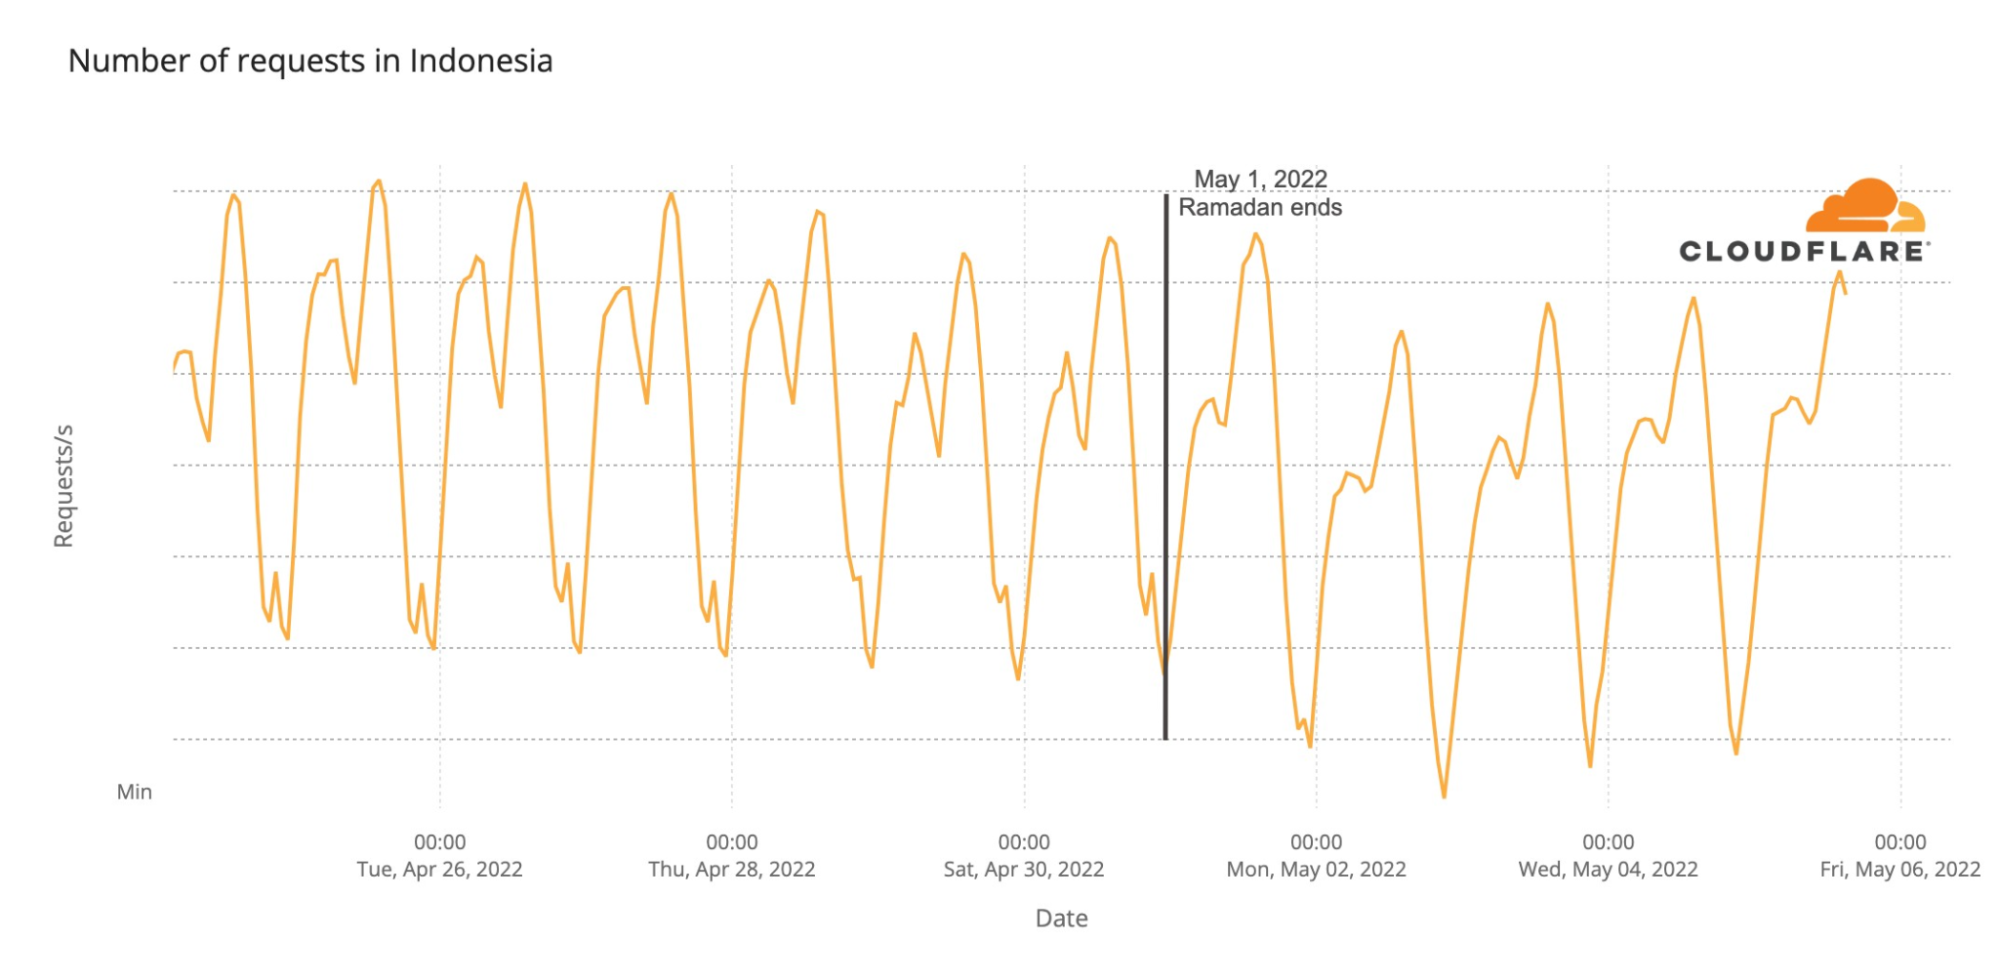
Indonesia is a clear example of that, showing trends that continued until the end of Ramadan:
In the next table, we show a country ranking by order of impact. Here, we include traffic changes before dawn and after sunset. In the last column, you can also see the change in traffic after Ramadan ended, right after sunset. In this case, we’re looking at Wednesday, May 4, right after the Eid al-fitr — the May 2-3, 2022 holiday of breaking the fast, in a comparison with the previous Wednesday at the same time (when Ramadan was ongoing):
| Internet traffic: Ramadan’s impact | Before sunrise | After sunset | Post-Ramadan, May 4 (after sunset) |
|---|---|---|---|
| Afghanistan | +203% | -28% | +20% |
| Pakistan | +119% | -39% | +13% |
| Indonesia | +98% | -13% | – |
| Morocco | +90% | -36% | +44% |
| Libya | +81% | -27% | +48% |
| Turkey | +78% | -19% | +22% |
| Bangladesh | +62% | -40% | +12% |
| Saudi Arabia | +55% | -45% | -5% |
| United Arab Emirates | +52% | -13% | +4% |
| Bahrain | +44% | -31% | +21% |
| Malaysia | +41% | -8% | -9% |
| Qatar | +35% | -23% | +5% |
| Egypt | +31% | -32% | +56% |
| Tunisia | +25% | -43% | +101% |
| Iran | +24% | +10% | -12% |
| Singapore | +8% | -5% | +4% |
| India | – | -15% | – |
Afghanistan, Pakistan, Indonesia, Morocco, Libya and Turkey had the biggest impact in an increase in traffic before sunrise. After sunset, it was (by order of impact) Saudi Arabia, Tunisia, Bangladesh, Pakistan that showed a more clear decrease in traffic after sunset.
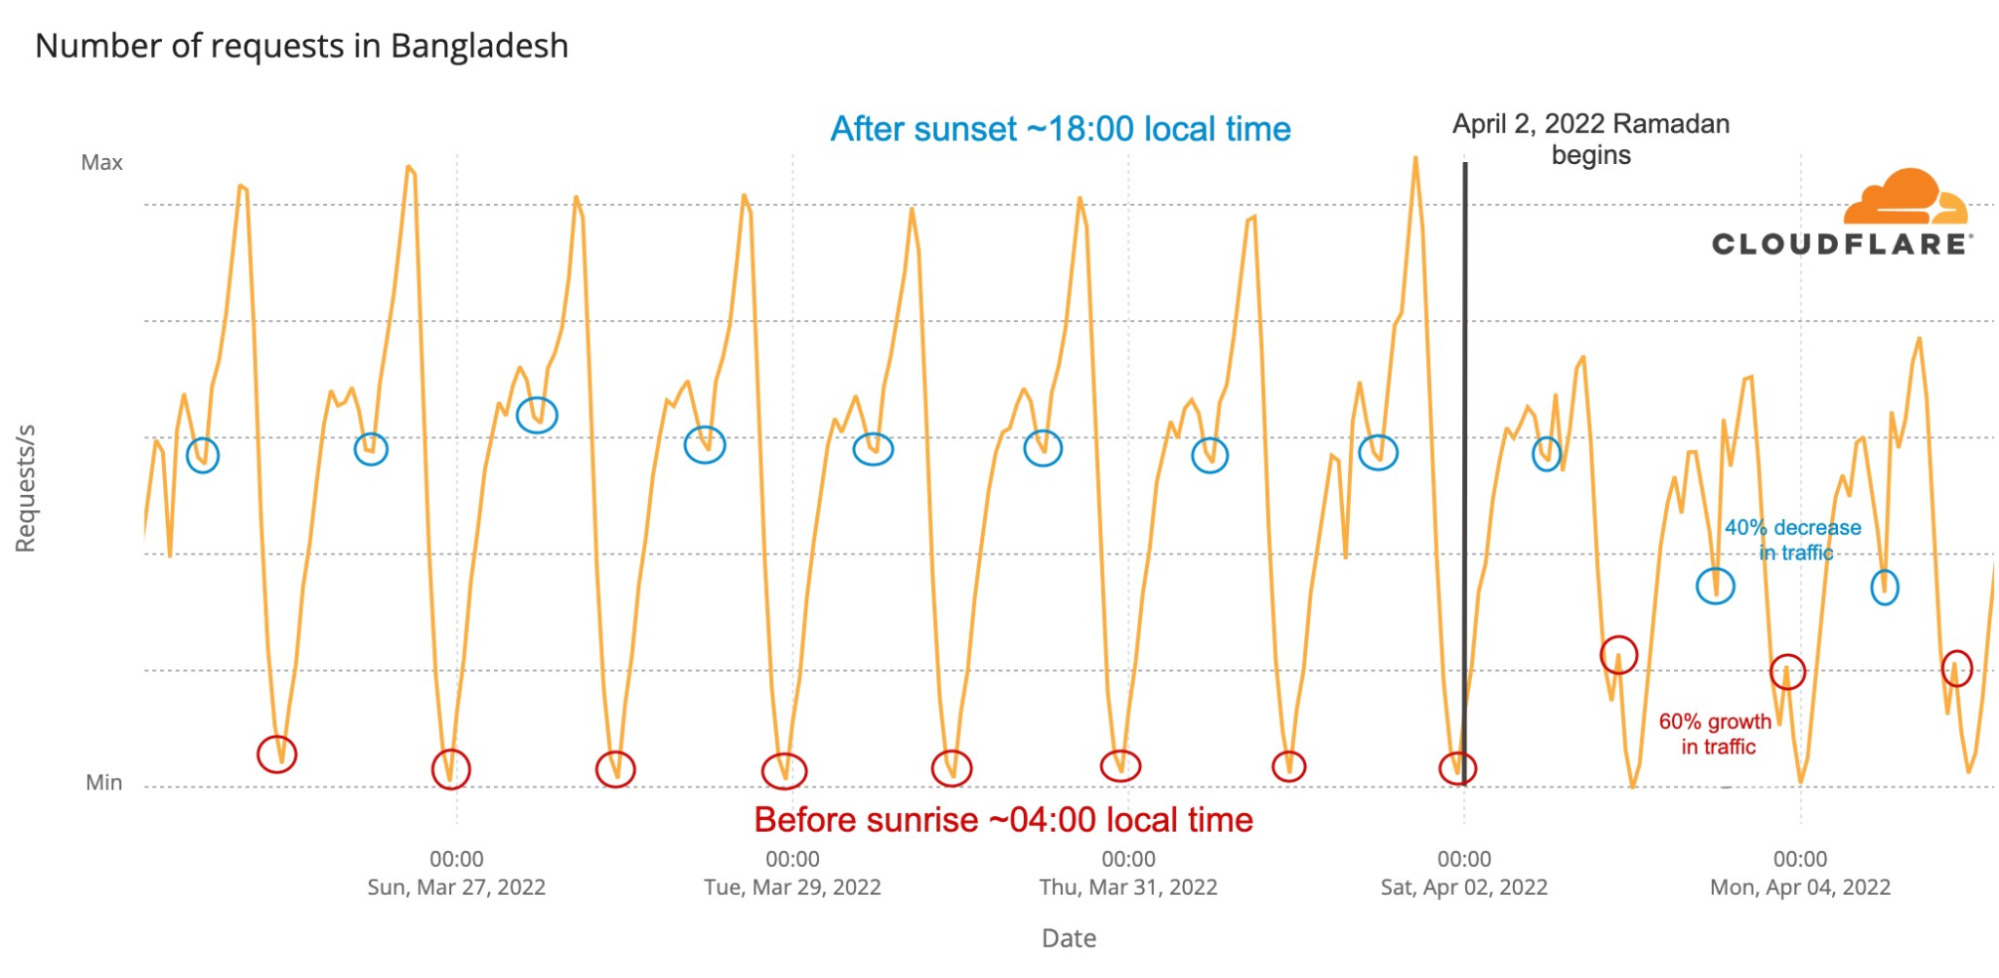
Here’s the impact of the start of Ramadan on Bangladesh, with more highlights inside the next chart:
Waking up earlier
There’s a clear pattern in most of the countries, Internet traffic was much higher than usual between 04:00 to 04:59 local time (where usually it’s the time with the lowest traffic).
The same early spike is seen in Turkey and the United Arab Emirates. In the case of the United Arab Emirates, the time before sunrise for the Suhur meal had more mobile usage than usual (so people were using their mobile devices to access the Internet more than usual at that time).
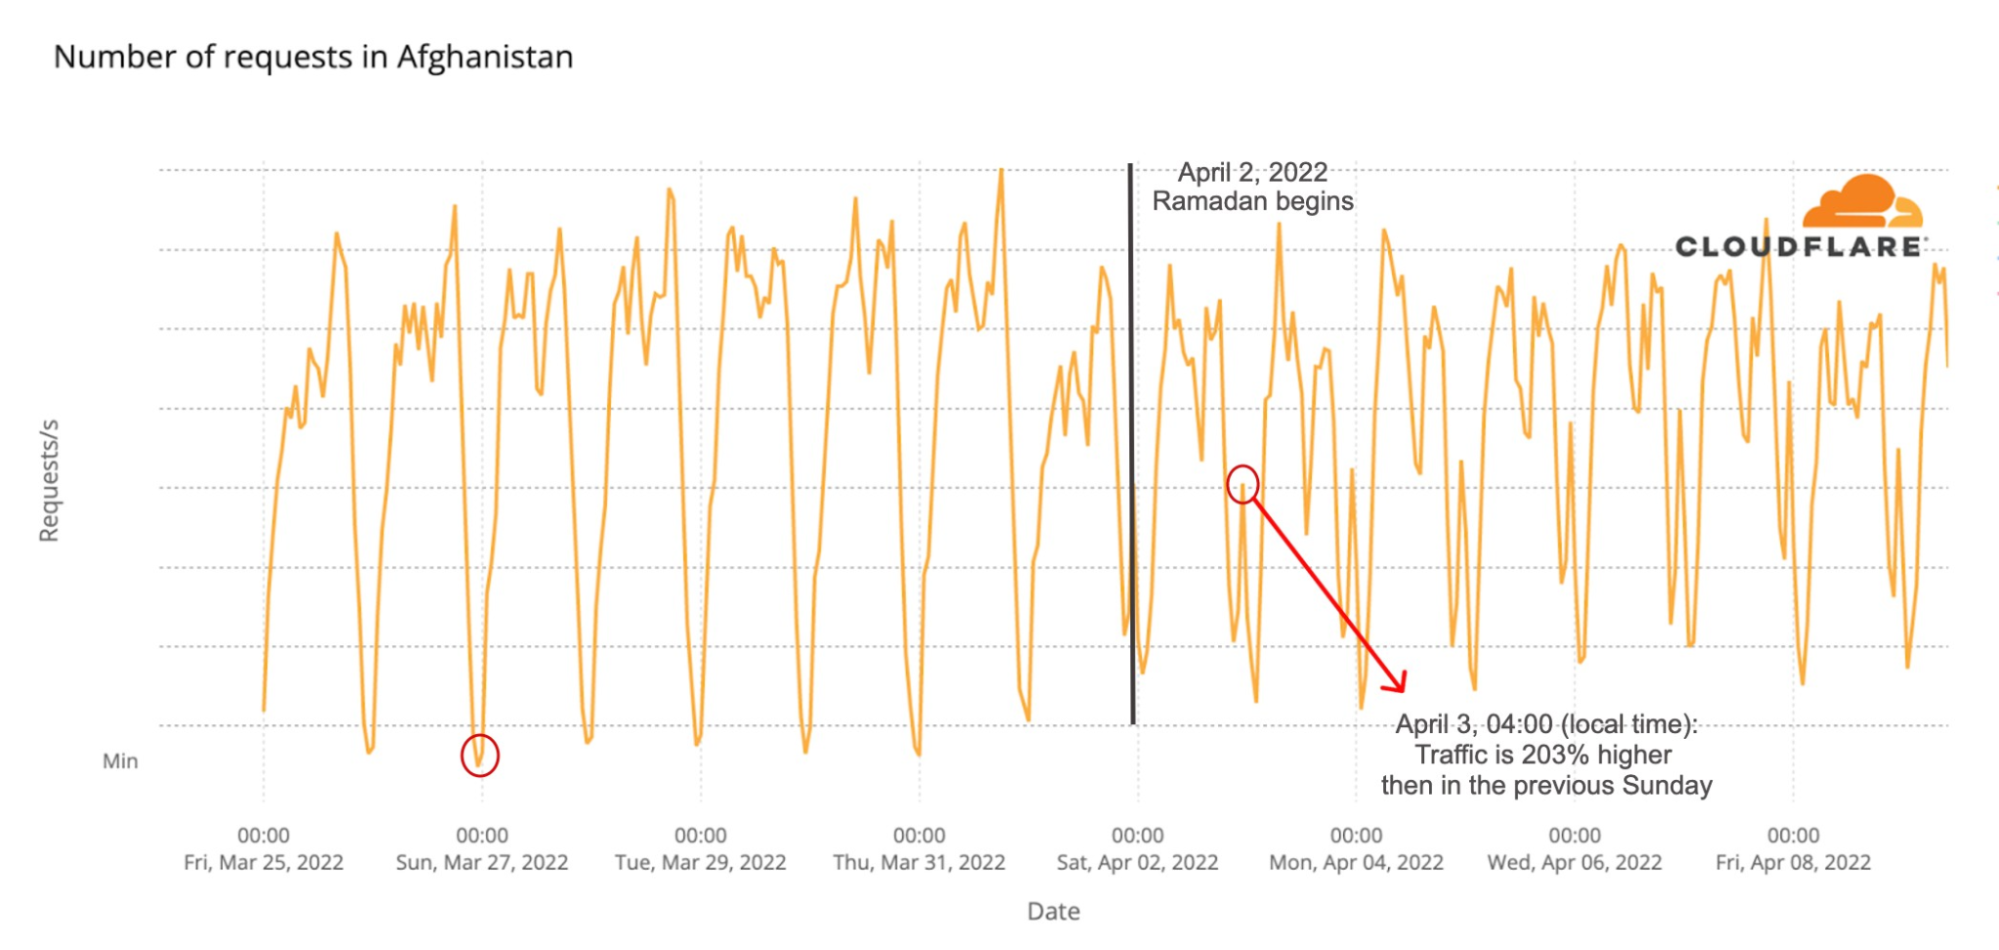
That’s also the case for Pakistan, where traffic is 119% higher on the 04:00 to 04:59 hour on April 3, than on the previous Sunday, but also in Qatar (sunrise at 05:25 and a spike of 35%) or Afghanistan. In the latter, the spike is 203% higher:
We also saw the same trend in Indonesia, sunrise was at 05:55 local time at the beginning of April, and there’s a clear spike in traffic in the 04:00 to 04:59 hour with a 98% growth in requests.
Northern African countries like Egypt, Tunisia, Morocco or Libya (sunrise at 06:54), show the same 04:00 to 04:59 hour spike. In Libya, traffic was 81% higher on Sunday, April 3, than it was the previous Sunday at the same time. Usually, the 04:00 to 04:59 hour is the lowest point in traffic in the country, but on April 3 and the following days it was at 08:00.
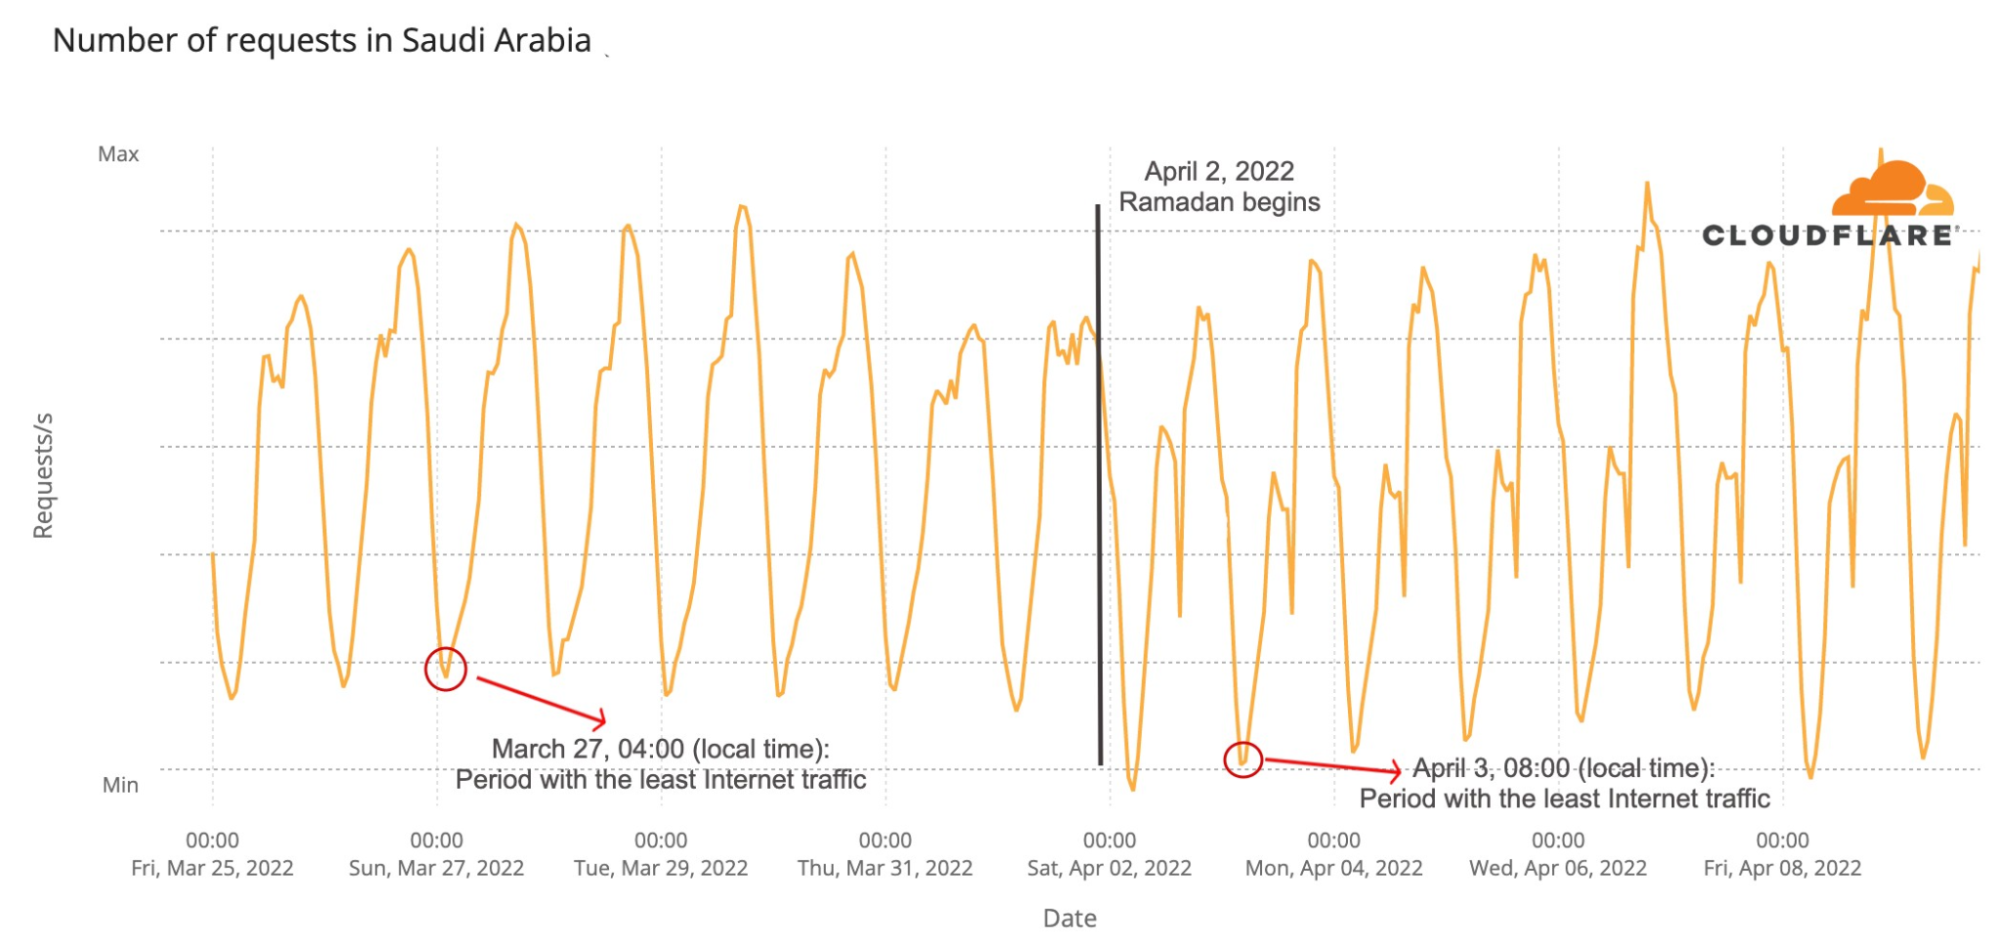
Saudi Arabia shows a similar pattern in terms of Internet traffic on Sunday, April 3, 2022, sunrise was at 05:44, and there was 55% more Internet use than at the same time on the previous Sunday, before Ramadan.
Does daily total Internet traffic go up or down?
The short answer is: depends on the country, given that there are examples of a general increase and decrease in traffic in the most impacted countries. We see similar trends for the sunset and sunrise times of day, but it’s a different story throughout the 30 days of Ramadan.
Iran, in general, shows an increase in traffic after Ramadan started on April 2, and a decrease after it ended on May 3 (of around 15%).
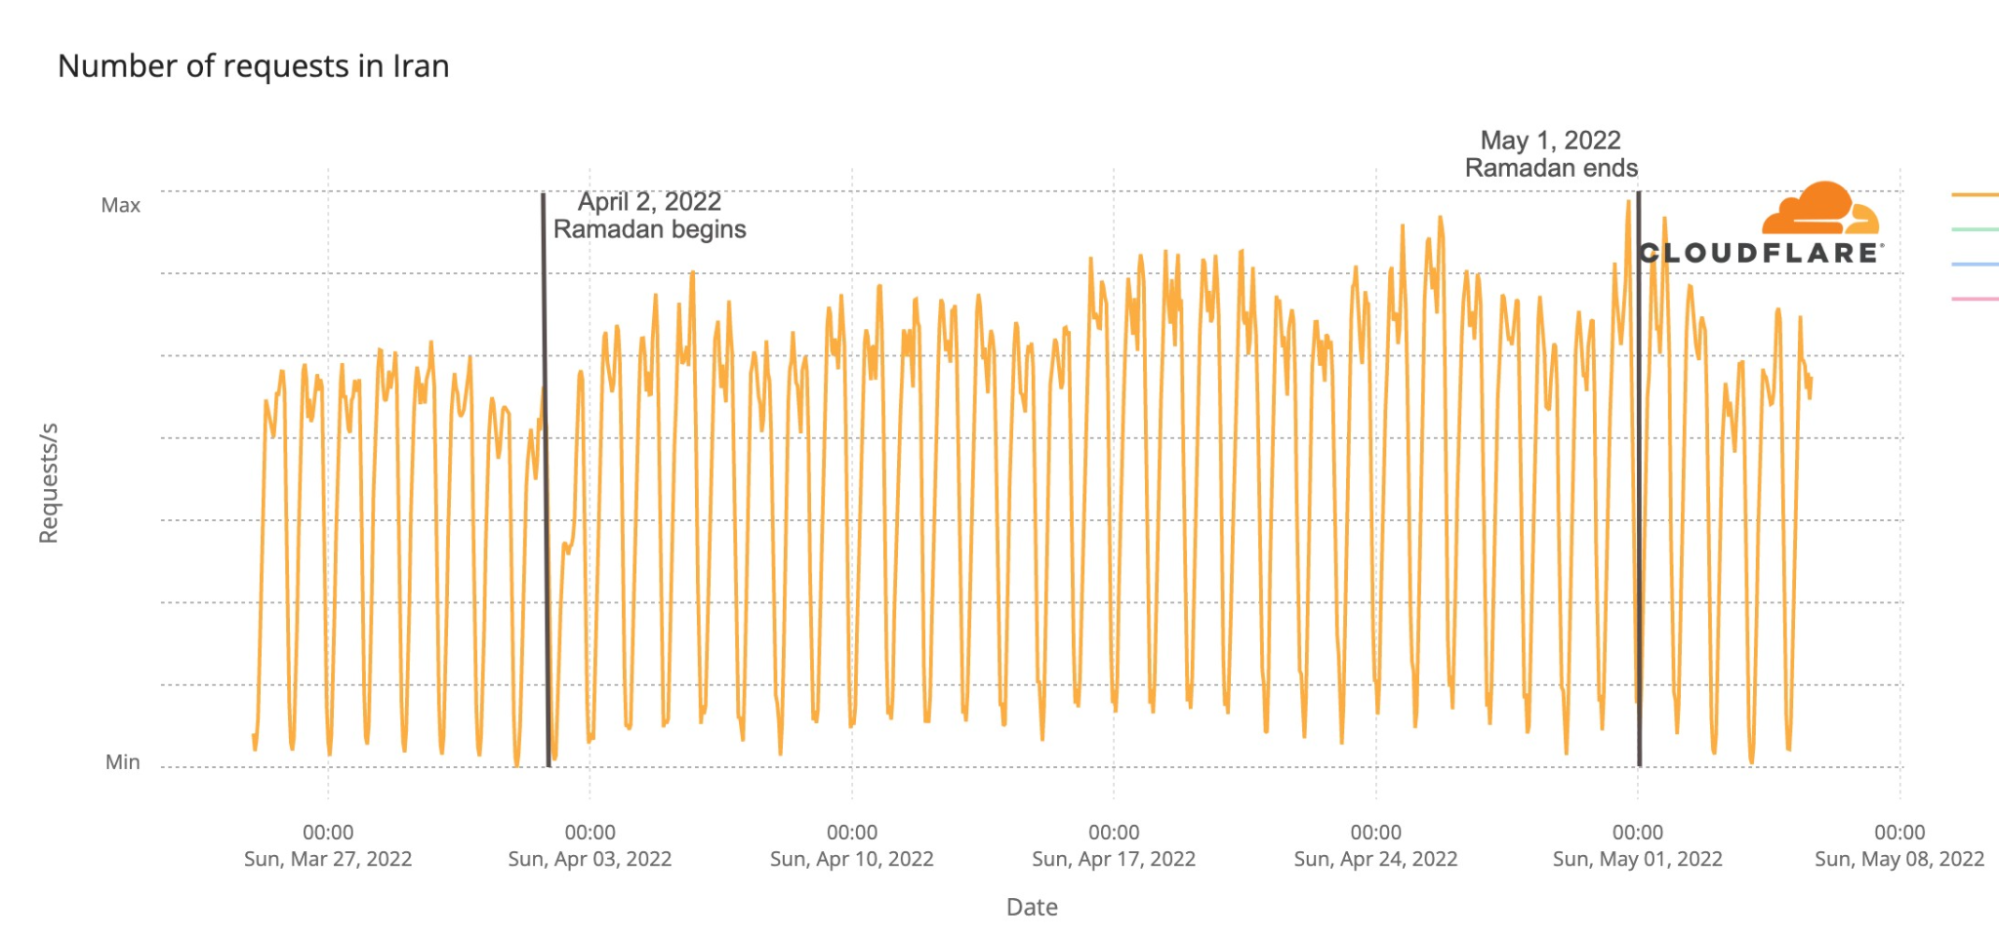
Something similar is seen in Pakistan, that had a general decrease in traffic the week after Ramadan ended, but during the 18:00 to 18:59 hour, May 4, had 13% more traffic than at the same time on the previous Wednesday, when Ramadan was being observed and the iftar meal would have happened during the 18:00 to 18:59 hour.
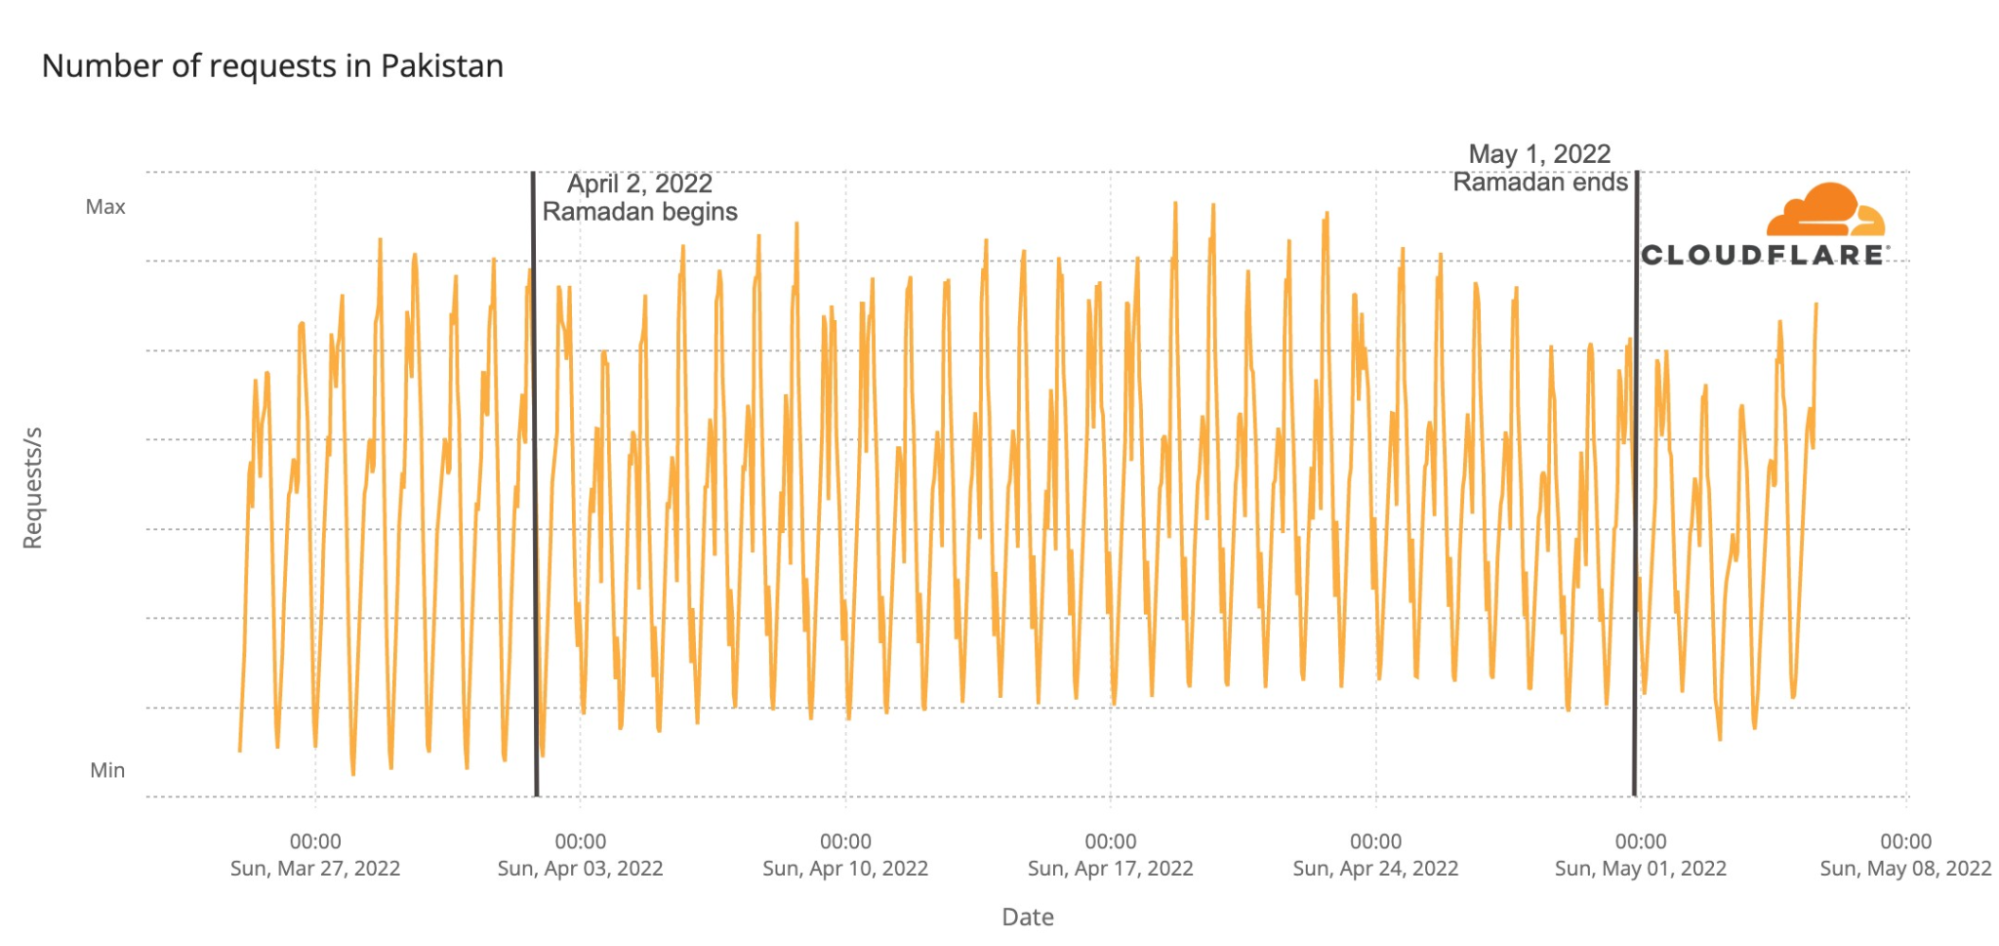
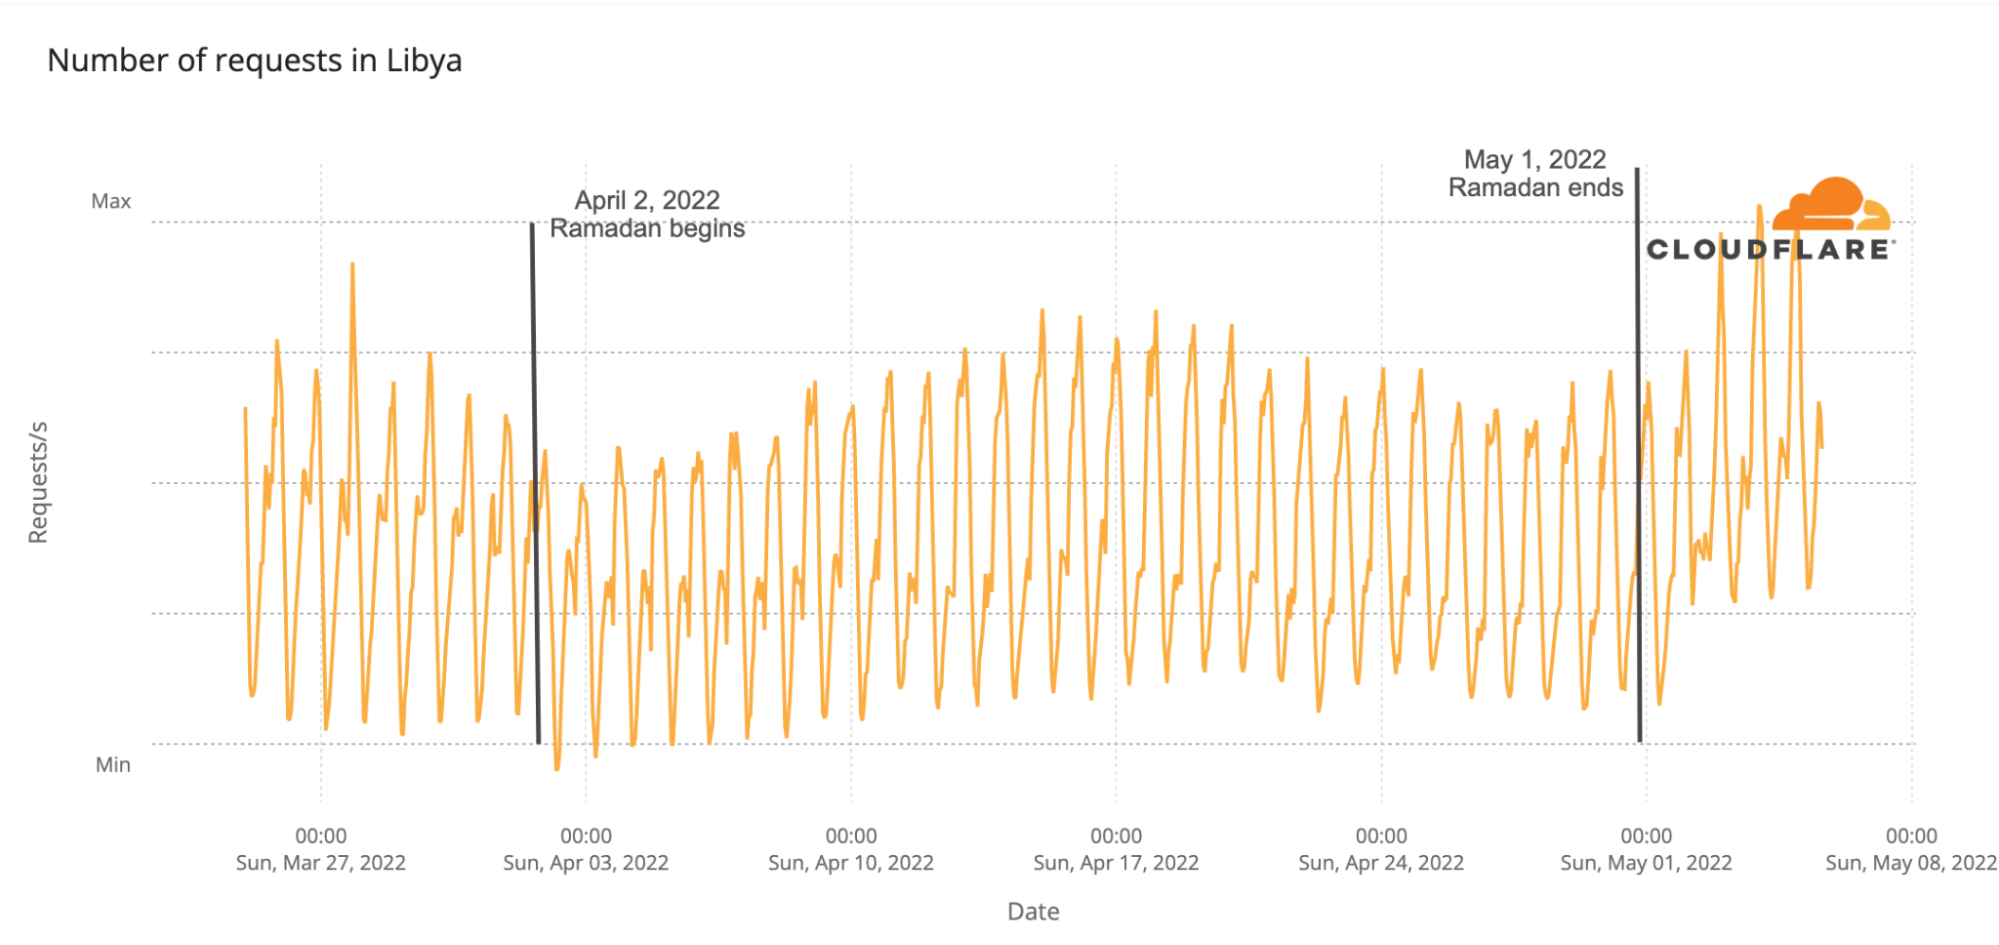
The opposite happens in Libya, where traffic, generally speaking, declined during Ramadan and picked up after — comparing Wednesday, May 4, 2022, with the previous one during the 19:00 to 19:59 hour, traffic grew around 48%. The same trend is seen in another North African country: Morocco (growth of 44% after Ramadan ended).
After Ramadan, sunsets ‘bring’ more Internet traffic
Another pattern, unsurprisingly, that our chart at the beginning of this blog post shows is how the sunset period changes when Ramadan (and the holiday that follows) ends, in most cases clearly increasing traffic at around 18:00 or 19:00.
Of the 16 countries with a bigger Ramadan impact, only four had a decrease in traffic after sunset on May 4: Iran, Indonesia, Saudi Arabia and Malaysia. All of these countries had an increase (or sustained traffic) in daily traffic during Ramadan and lost daily Internet usage after it ended (in May).
Here’s the example of Indonesia through the Ramadan period that includes April and May:
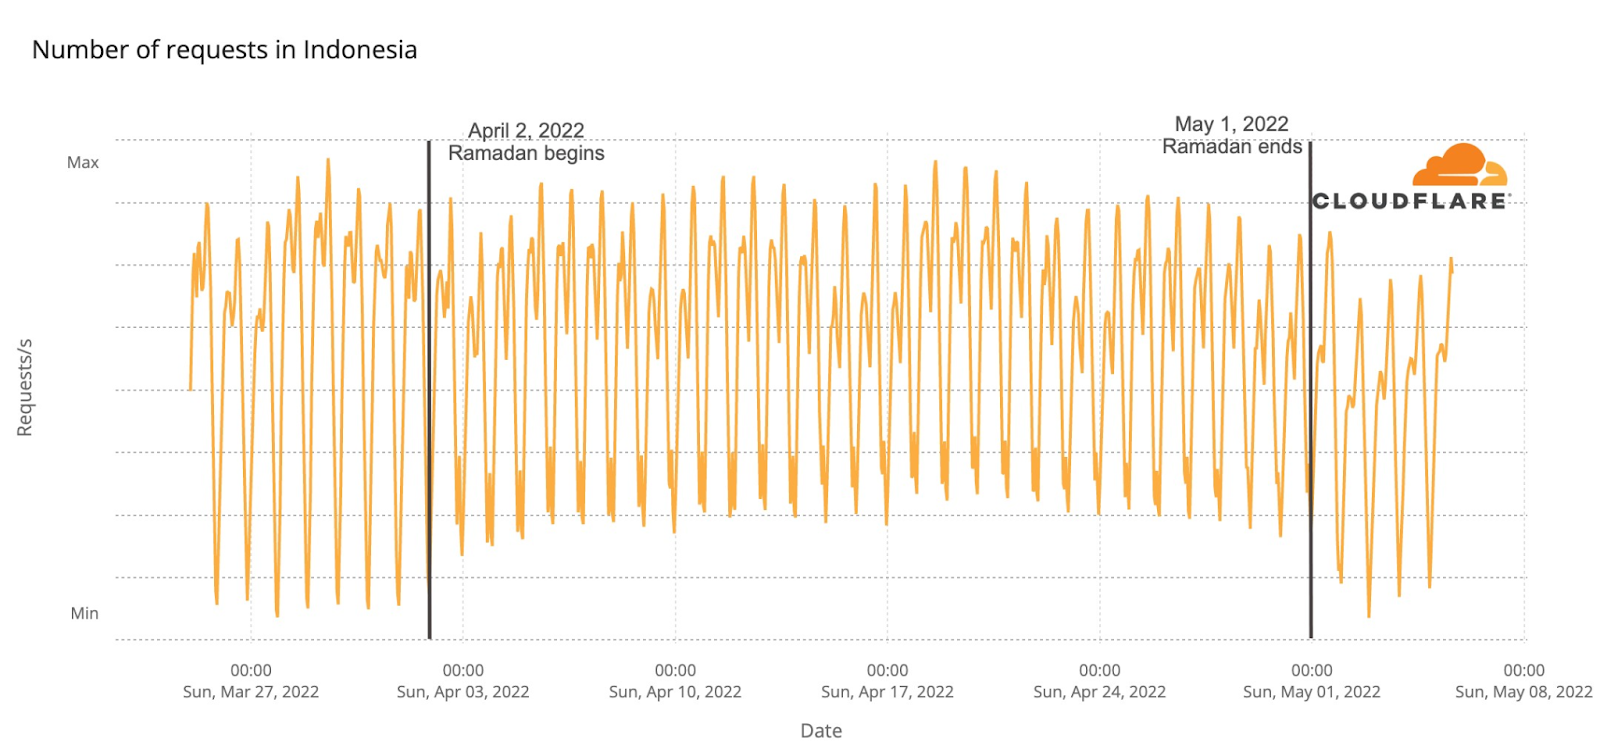
And a zoomed-in Indonesia chart after Ramadan ended (May 1, but bear in mind that May 2-3 is the holiday Eid al-fitr) that shows not only the general decrease in traffic, but also how the sunset period doesn’t have a clear drop in requests as seen in the Ramadan period:
Conclusion: a human impact
Ramadan has a clear impact on Internet traffic patterns as humans change their habits.
The Internet may be the network of networks, where there are many bots (friendly and less friendly), but it continues to be a human-powered network, made by humans for humans.
Follow our Internet trends (including details about ASNs) on Cloudflare Radar, and also on Radar’s Twitter account.
Security updates for Monday
Post Syndicated from original https://lwn.net/Articles/895392/
Security updates have been issued by CentOS (gzip, java-1.8.0-openjdk, java-11-openjdk, and zlib), Debian (adminer, htmldoc, imagemagick, libgoogle-gson-java, lrzip, openjdk-8, openssl, and ruby-nokogiri), Fedora (ecdsautils, et, libxml2, podman, and supertux), Mageia (cairo, clamav, curl, fish, freetype2, golang-github-prometheus-client, python-django-registration, python-nbxmpp, python-waitress, and xmlrpc-c), Red Hat (pcs), SUSE (curl, kernel, pidgin, and webkit2gtk3), and Ubuntu (tiff).
Network performance update: Platform Week
Post Syndicated from David Tuber original https://blog.cloudflare.com/network-performance-update-platform-week/


In September 2021, we shared extensive benchmarking results of 1,000 networks all around the world. The results showed that on a range of tests (TCP connection time, time to first byte, time to last byte), and on different measures (p95, mean), Cloudflare was the fastest provider in 49% of networks around the world. Since then, we’ve worked to continuously improve performance, with the ultimate goal of being the fastest everywhere and an intermediate goal to grow the number of networks where we’re the fastest by at least 10% every Innovation Week. We met that goal during Security Week (March 2022), and we’re carrying the work over to Platform Week (May 2022).
We’re excited to update you on the latest results, but before we do: after running with this benchmark for nine months, we’ve also been looking for ways to improve the benchmark itself — to make it even more representative of speeds in the real world. To that end, we’re expanding our measured networks from 1,000 to 3,000, to give an even more accurate sense of real world performance across the globe.
In terms of results: using the old benchmark of 1,000 networks, we’re the fastest in 69% of them. In this new expanded view of 3,000 networks, we’re the fastest in 42% of them. We’ve demonstrated a consistent ability to improve our performance against what we measure, and we’re excited to optimize our performance and lift our ranking in these smaller networks all around the world.
In addition to sharing a general update on where our network performance stands, we’re also sharing updated performance metrics on our Workers platform (given that it’s Platform Week!). We’ve done an extensive benchmark of Cloudflare Workers vs Fastly’s Compute@Edge.
We’ve got the results below, but before we get to that, we want to spend a bit of time on our revamped measurements.
Revamped measurements
A few months ago, we discussed the performance of Cloudflare Workers, as compared to other similar offerings out there. We compared our performance to Fastly’s Compute@Edge, showing that Workers was significantly faster.
After we published our results, there were questions and suggestions on how to improve our testing methodology (including sharing more detail about where and how we ran the tests). As we re-ran tests for this iteration, we made some small changes, and also worked to address the suggestions from the community. Let’s talk about what’s changed and why.
Measuring what matters
To quantify global network performance, we have to get enough data from around the world, across all manner of different networks, comparing ourselves with other providers. We used Real User Measurements (RUM) to fetch a 100kB file from different providers. Users around the world report the performance of different providers. The more users who report the data, the higher fidelity the signal is. The goal is to provide an accurate picture of where different providers are faster, and more importantly, where Cloudflare can improve. You can read more about the methodology in the original Speed Week blog post here.
In the process of quantifying network performance, it became clear where we needed to expand our scope in measuring performance. After Security Week, we were fastest in 71% of networks, and we decided that we wanted to expand the pool of networks from the top 1,000 most reported networks to the top 3,000 most reported networks.
We’ve shown the graph detailing the number of networks where Cloudflare is #1 in network performance, but from here on out, we will only be showing this graph in percentages of networks where we are number one out of 100%, since the denominator will be changing going forward as we set ourselves harder and harder challenges.
Benchmarking for everyone
At the time we published our earlier set of benchmarks, we had an unnecessary “no benchmarking” clause in our Terms of Service. It has since been removed. It’s been a while since we’ve worried about such things, and the clause lived past its intended life in our ToS.
We’ve done the work to show where we are the fastest provider, and it’s important that everyone else be able to validate that independently. We’re also confident that well run benchmarks will only help further improve performance for Workers, other Cloudflare products, and the Internet as a whole. Game on.
Measuring Workers performance from real users
To run our tests, we used Catchpoint, an industry standard “synthetic” testing tool, and measurements collected from real users distributed around the world. Catchpoint is a monitoring platform that has around 2,000 total endpoints distributed around the world that can be configured to fetch specific resources and time each test. Catchpoint is useful for network providers like us as it provides a consistent, repeatable way to measure end-to-end performance of a workload, and delivers a best-effort approximation for what a user sees.
Catchpoint has a series of backbone nodes that are embedded in ISPs around the world. That means that these nodes are plugged into ISP routers just like you are, and the traffic goes through the ISP network to each endpoint they are monitoring. These can approximate a real user, but they will never truly approximate a real user. For example, the bandwidth for these nodes is 100% dedicated for platform monitoring, as opposed to your home Internet connection, where your Internet experience will be a mixed bag of different use cases, some of which won’t talk to Workers applications at all.
For this new test, we chose 300 backbone nodes that are embedded in last mile ISPs around the world. We filtered out nodes in cloud providers, or in metro areas with multiple transit options, trying to remove duplicate paths as much as possible.
We cross-checked these tests with our own data set, which is collected from users connecting to free websites when they are served 1xxx error pages, similar to how we collect data for global network performance. When a user sees this error page, that page will contain a call that will execute these tests and upload performance metrics on these calls to Cloudflare. Users would run these calls independently of the error page, ensuring that Cloudflare did not get a head start in these tests.
We also changed our test methodology to use paid accounts for both Fastly and Cloudflare.
Changing the numbers we look at
For this new test, we decided to look at Wait time in addition to Time to First Byte. Time to First Byte is the time it takes for a web server to establish a connection, fetch the content, and deliver the first byte of a response to a user, and Wait time is the time the client spends waiting for the server to send back that first byte after the connection is established. We are using this particular measurement to look at the actual time it takes for the server to compute the request on the machine. Wait time is a subcomponent of TTFB, and contains the machine processing time, the time it takes the server to give the response to the socket to be sent back to the user, and the time it takes the response to reach the user. There could be latency in passing the request to the socket on the machine, but we measured the actual time it took the server to send the request for all tests and found it to be zero:
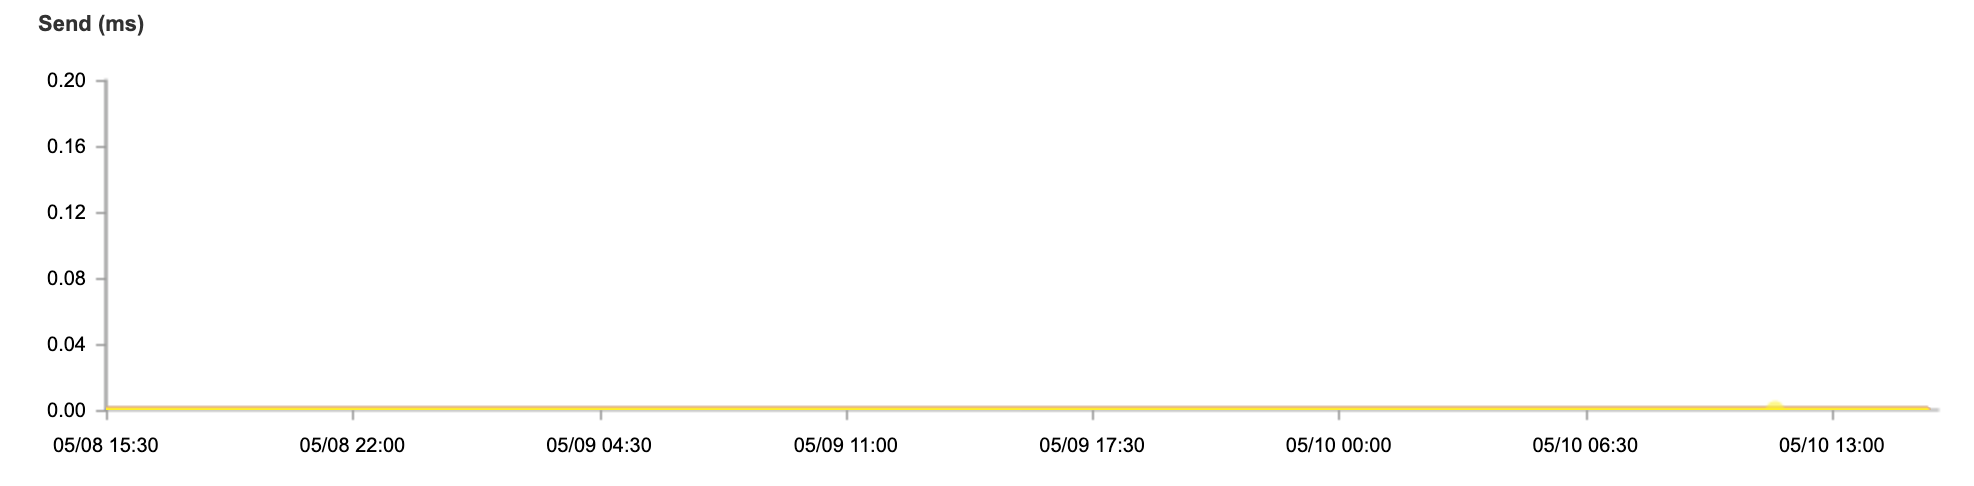
So we would calculate the wait time as the amount of time spent on the box plus the time it took the server to send the packet over the wire to the client.
However, others have noted that using Time to First Byte to measure performance of serverless computing solutions could potentially be misleading because user performance measurements can be influenced by more than just the time spent computing functions on the machine. For example, things like the time to connect to the server, DNS resolution, and cache times can impact Time to First Byte. Time to connect to the server (connect) can be impacted by how well peered a network is (or how poorly). DNS resolution can be impacted by client behavior, local DNS behavior, or by the performance of the provider’s DNS. Cache times can be driven by the performance of the cache on the server itself.
We agree that it is difficult to tease out computing time from Time to First Byte. To look at that particular aspect of serverless computing, we look at Wait, which is a value that contains the least amount of variables: we aren’t caching anything during our tests, DNS isn’t part of the wait time, and the only thing impacting Wait aside from the time spent on the machine is the Connect time.
However, since we’re trying to measure the end user experience and not just the amount of time spent on a server, we want to use both the Wait and TTFB so that we can show the time spent both on the server and how that impacts end-to-end performance.
What’s in the test?
For our test this time around, we decided to measure three things: a simple JavaScript function like last time, a complex JavaScript function, and a complex Rust function. Here are the functions for each of them:
async function getErrorResponse(event, message, status) {
  return new Response(message, {status: status, headers: {'Content-Type': 'text/plain'}});
}
function testHardBusyLoop() {
  let value = 0;
  let offset = Date.now();

  for (let n = 0; n < 15000; n++) {
    value += Math.floor(Math.abs(Math.sin(offset + n)) * 10);
  }

  return value;
}
fn test_hard_busy_loop() -> i32 {
  let mut value = 0;
  let offset = Date::now().as_millis();

  for n in 0..15000 {
    value += (((offset + n) as f64).sin().abs() * 10.0) as i32;
  }

  value
}
The goals of each of these tests is simple: test the ability of Workers and Compute@Edge to perform compute actions.
Latest update on network performance
We have two updates on data: a general network performance update, and then data on how Workers compares with Compute@Edge.
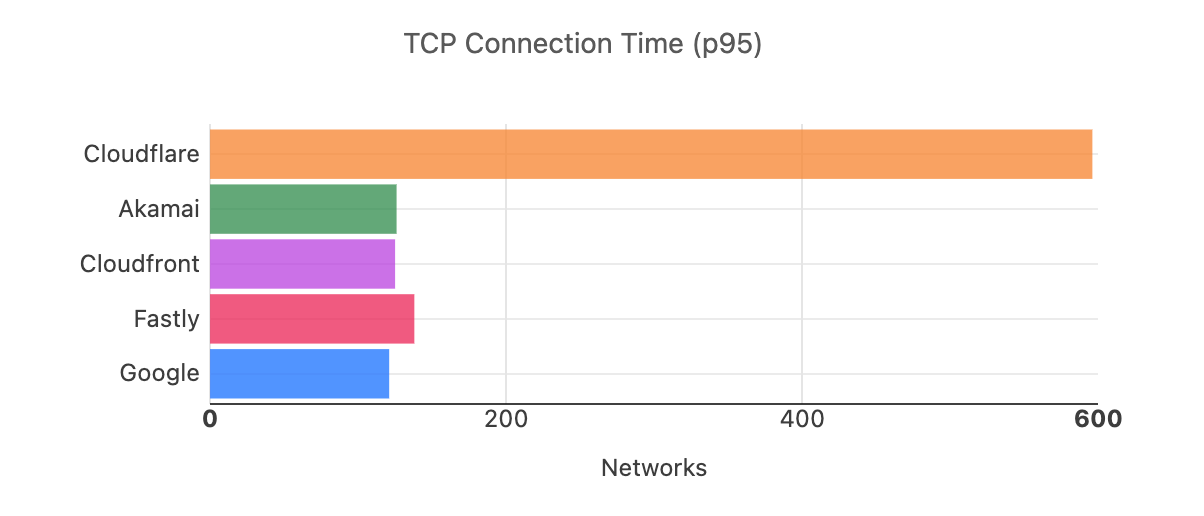
At Security Week (March 2022), we shared that we were faster in more of the most reported networks than our competitors. Out of the top 1,000 networks in the world (by number of IPv4 addresses advertised), here’s a breakdown of how many providers are number one in p95 TCP Connection Time, which represents the time it takes for a user to connect to the provider. This data is from Security Week (March 2022):
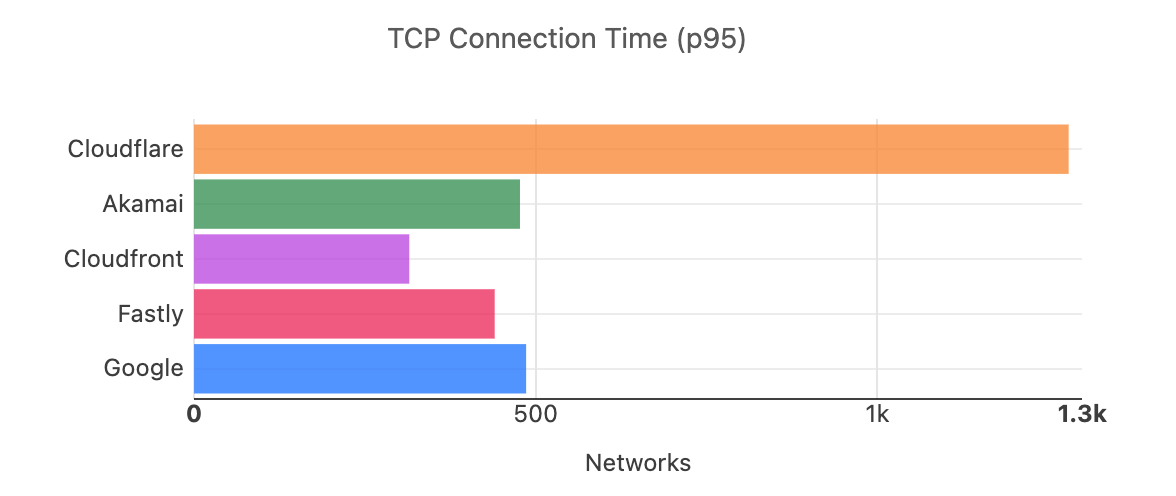
Recognizing that we are now looking at different numbers of networks, here is what the distribution looks like for the top 3,000 networks for Platform Week (May 2022):
In addition to being the fastest across popular networks, Cloudflare is also committed to being the fastest provider in every country.
Using data on the top 1,000 networks from Full Stack Week (March 2022), here’s what the world map looks like:
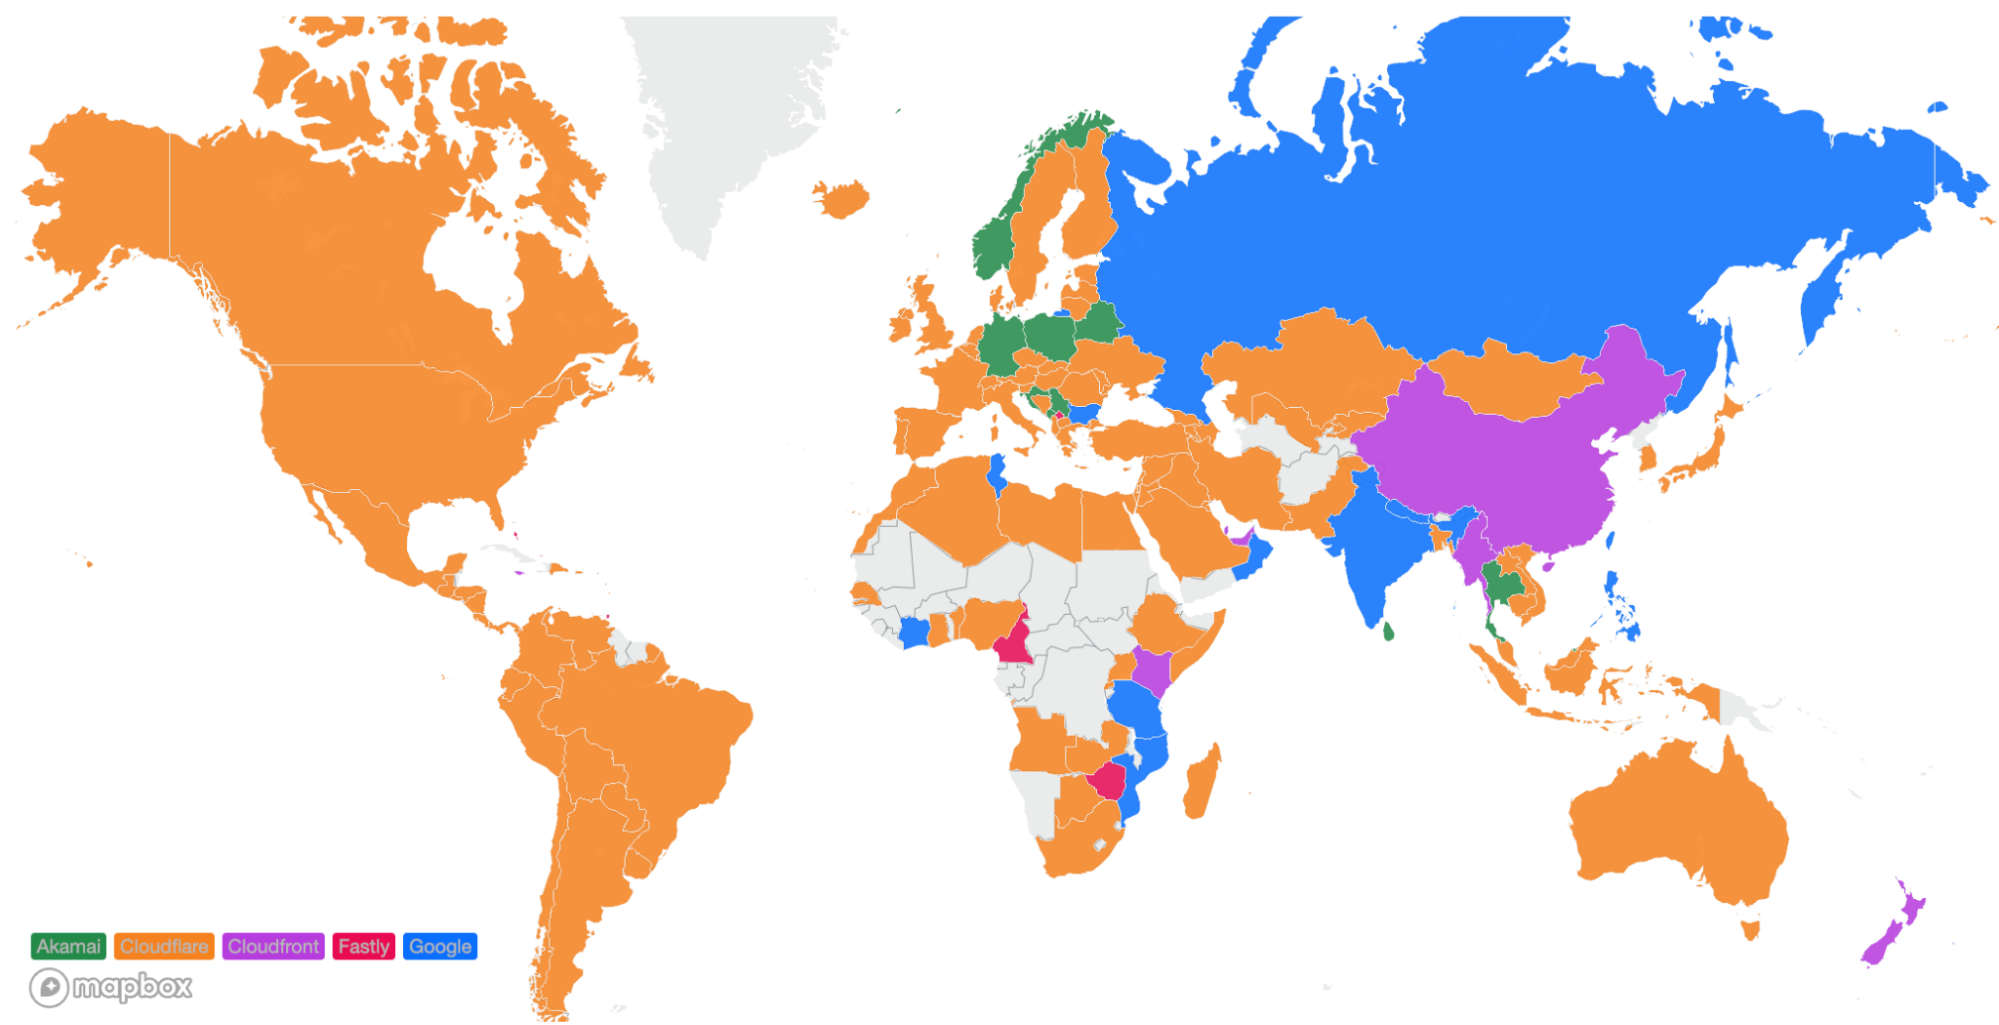
And here’s what the world looks like while looking at the top 3,000 networks:
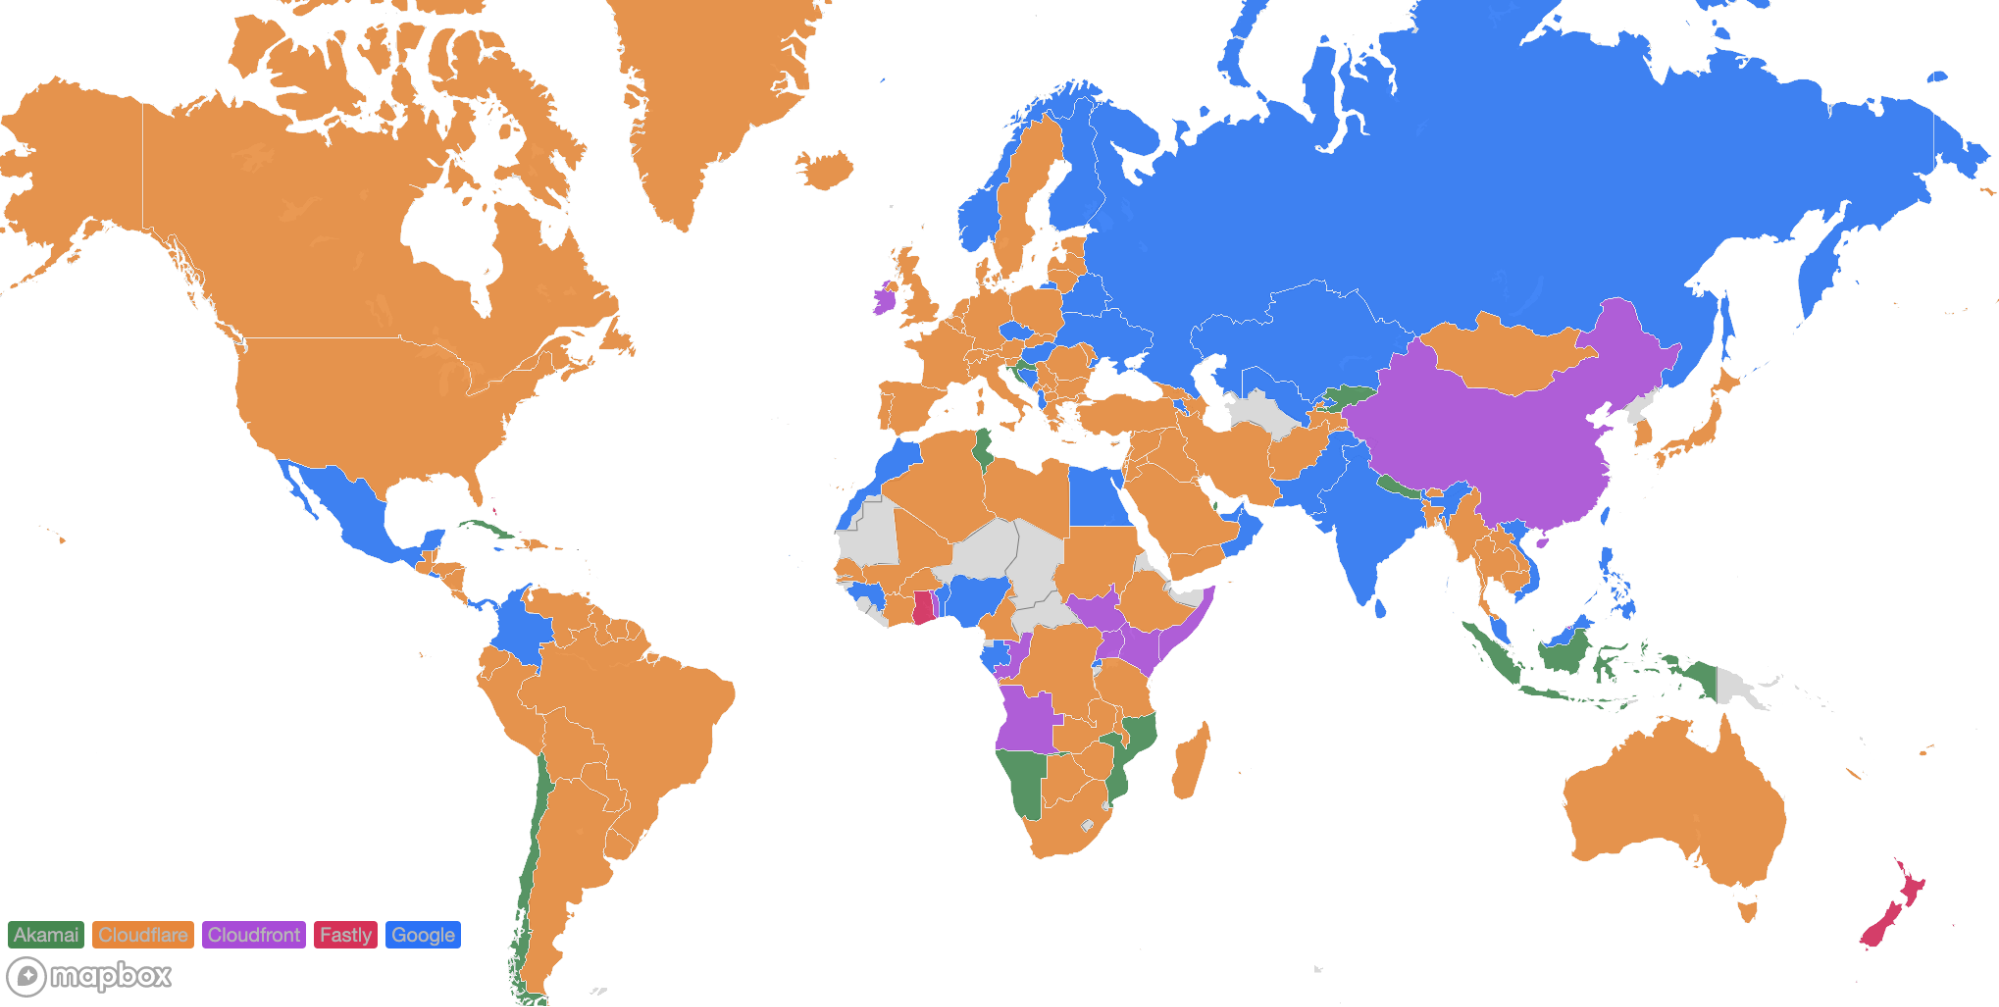
Cloudflare became #1 in more countries in Africa and Europe, some of which previously did not have enough samples to officially be counted to one provider or another.
Workers vs Compute@Edge
Moving on from general network results, what does performance look like when comparing serverless compute products across providers — in this case, Cloudflare Workers performance to Compute@Edge? Looking at the Catchpoint data, the first thing we noticed was Cloudflare is faster than Fastly in all tests at the 95th percentile for Time to First Byte:
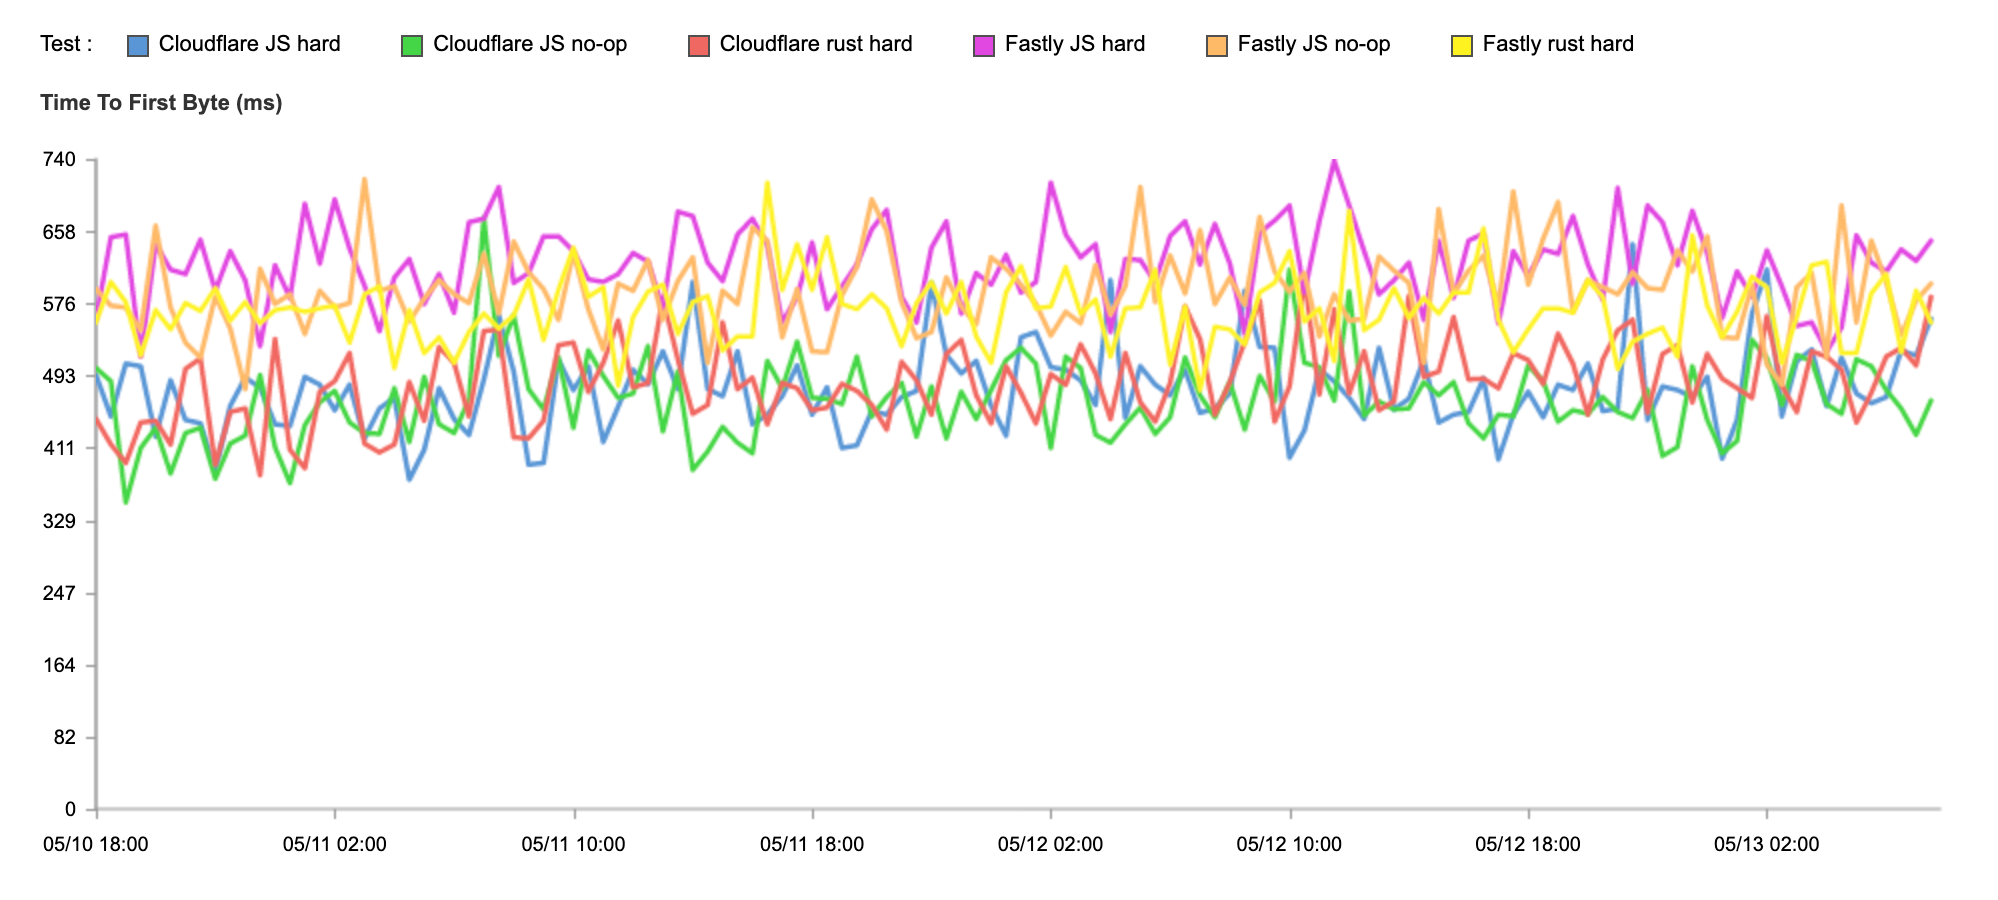
| Test | 95th percentile TTFB (ms) |
|---|---|
| Cloudflare JS no-op | 469 |
| Fastly JS no-op | 596 |
| Cloudflare JS hard | 481 |
| Fastly JS hard | 631 |
| Cloudflare Rust hard | 493 |
| Fastly Rust hard | 577 |
Cloudflare is significantly faster at all tests compared to Fastly. But let’s dig into why that is. Looking at p95 Wait, we can see that Cloudflare does have an edge in most tests related to compute on-box:
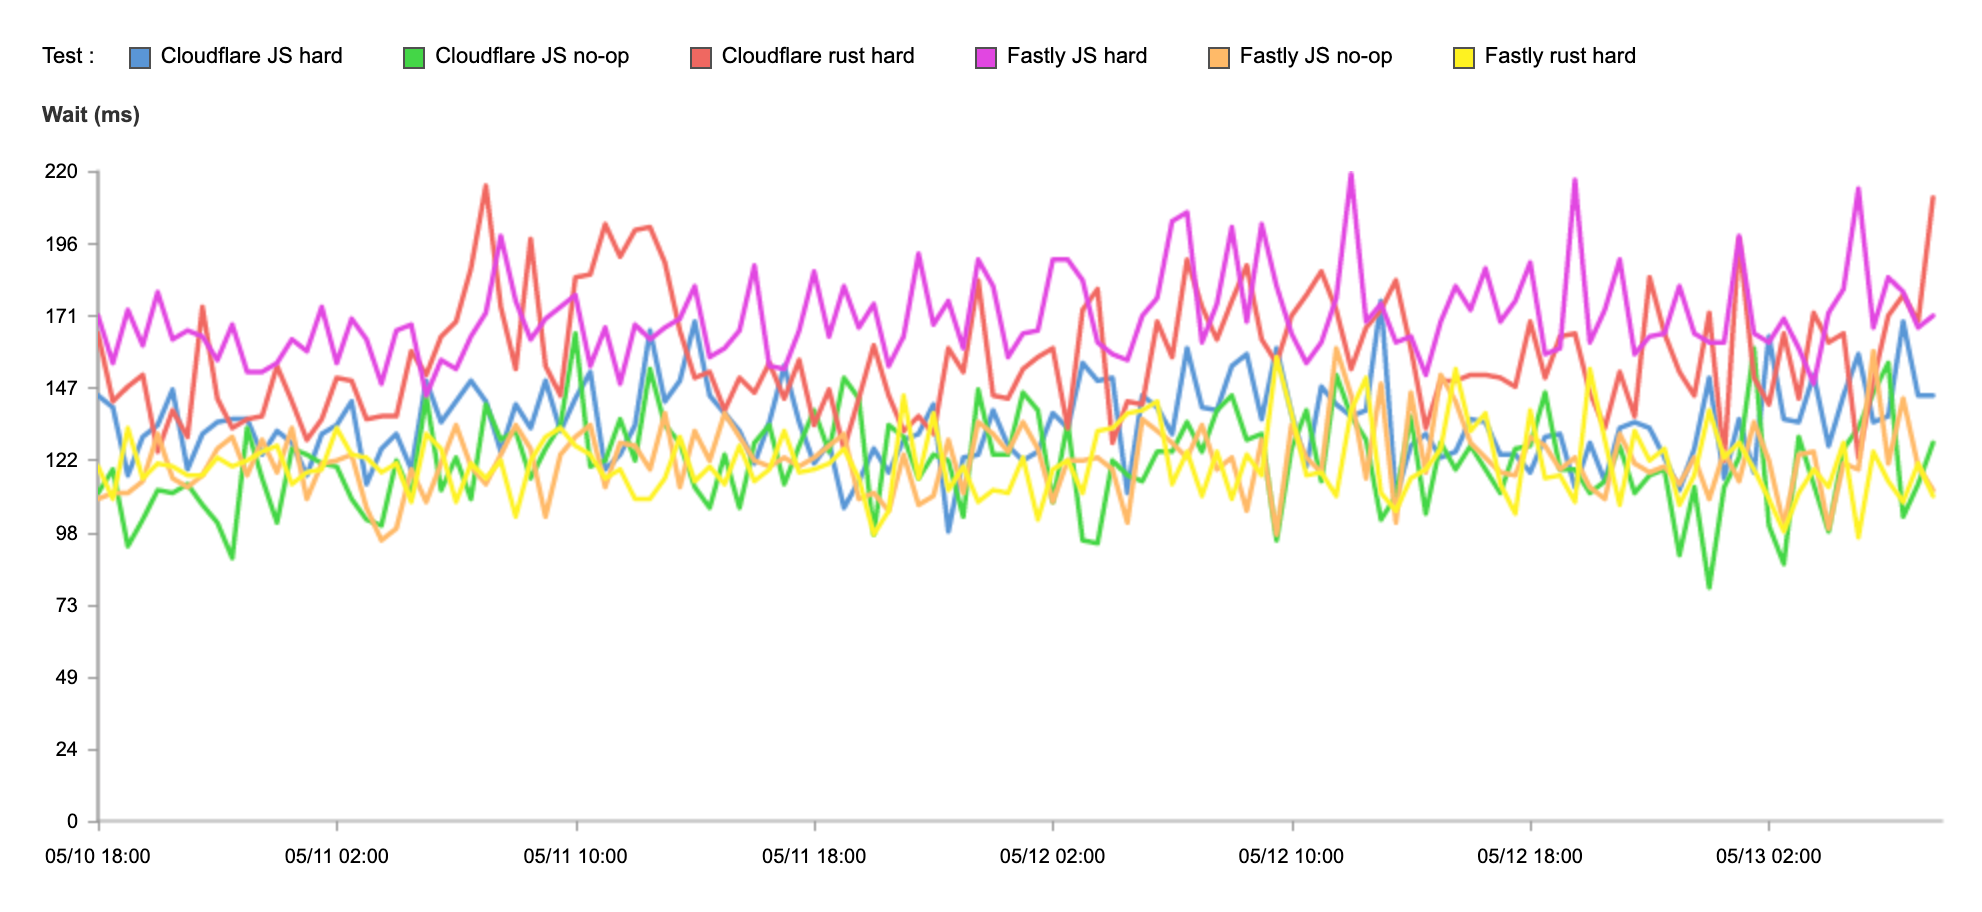
| Test | 95th Percentile Wait (ms) |
|---|---|
| Cloudflare JS no-op | 123 |
| Fastly JS no-op | 123 |
| Cloudflare JS hard | 136 |
| Fastly JS hard | 170 |
| Cloudflare Rust hard | 160 |
| Fastly Rust hard | 121 |
Looking at the Wait times, you can see that Cloudflare does have a significant edge in on-box performance, except in Rust, where Fastly claims their workloads are the most optimized. This data backs up that claim. But why is Fastly so much slower on Time to First Byte? The answer lies in the rest of the request. While latency spent in compute matters, it only matters in conjunction with the rest of the network performance. And Cloudflare has an advantage over Fastly in Connect times and SSL establishment times:
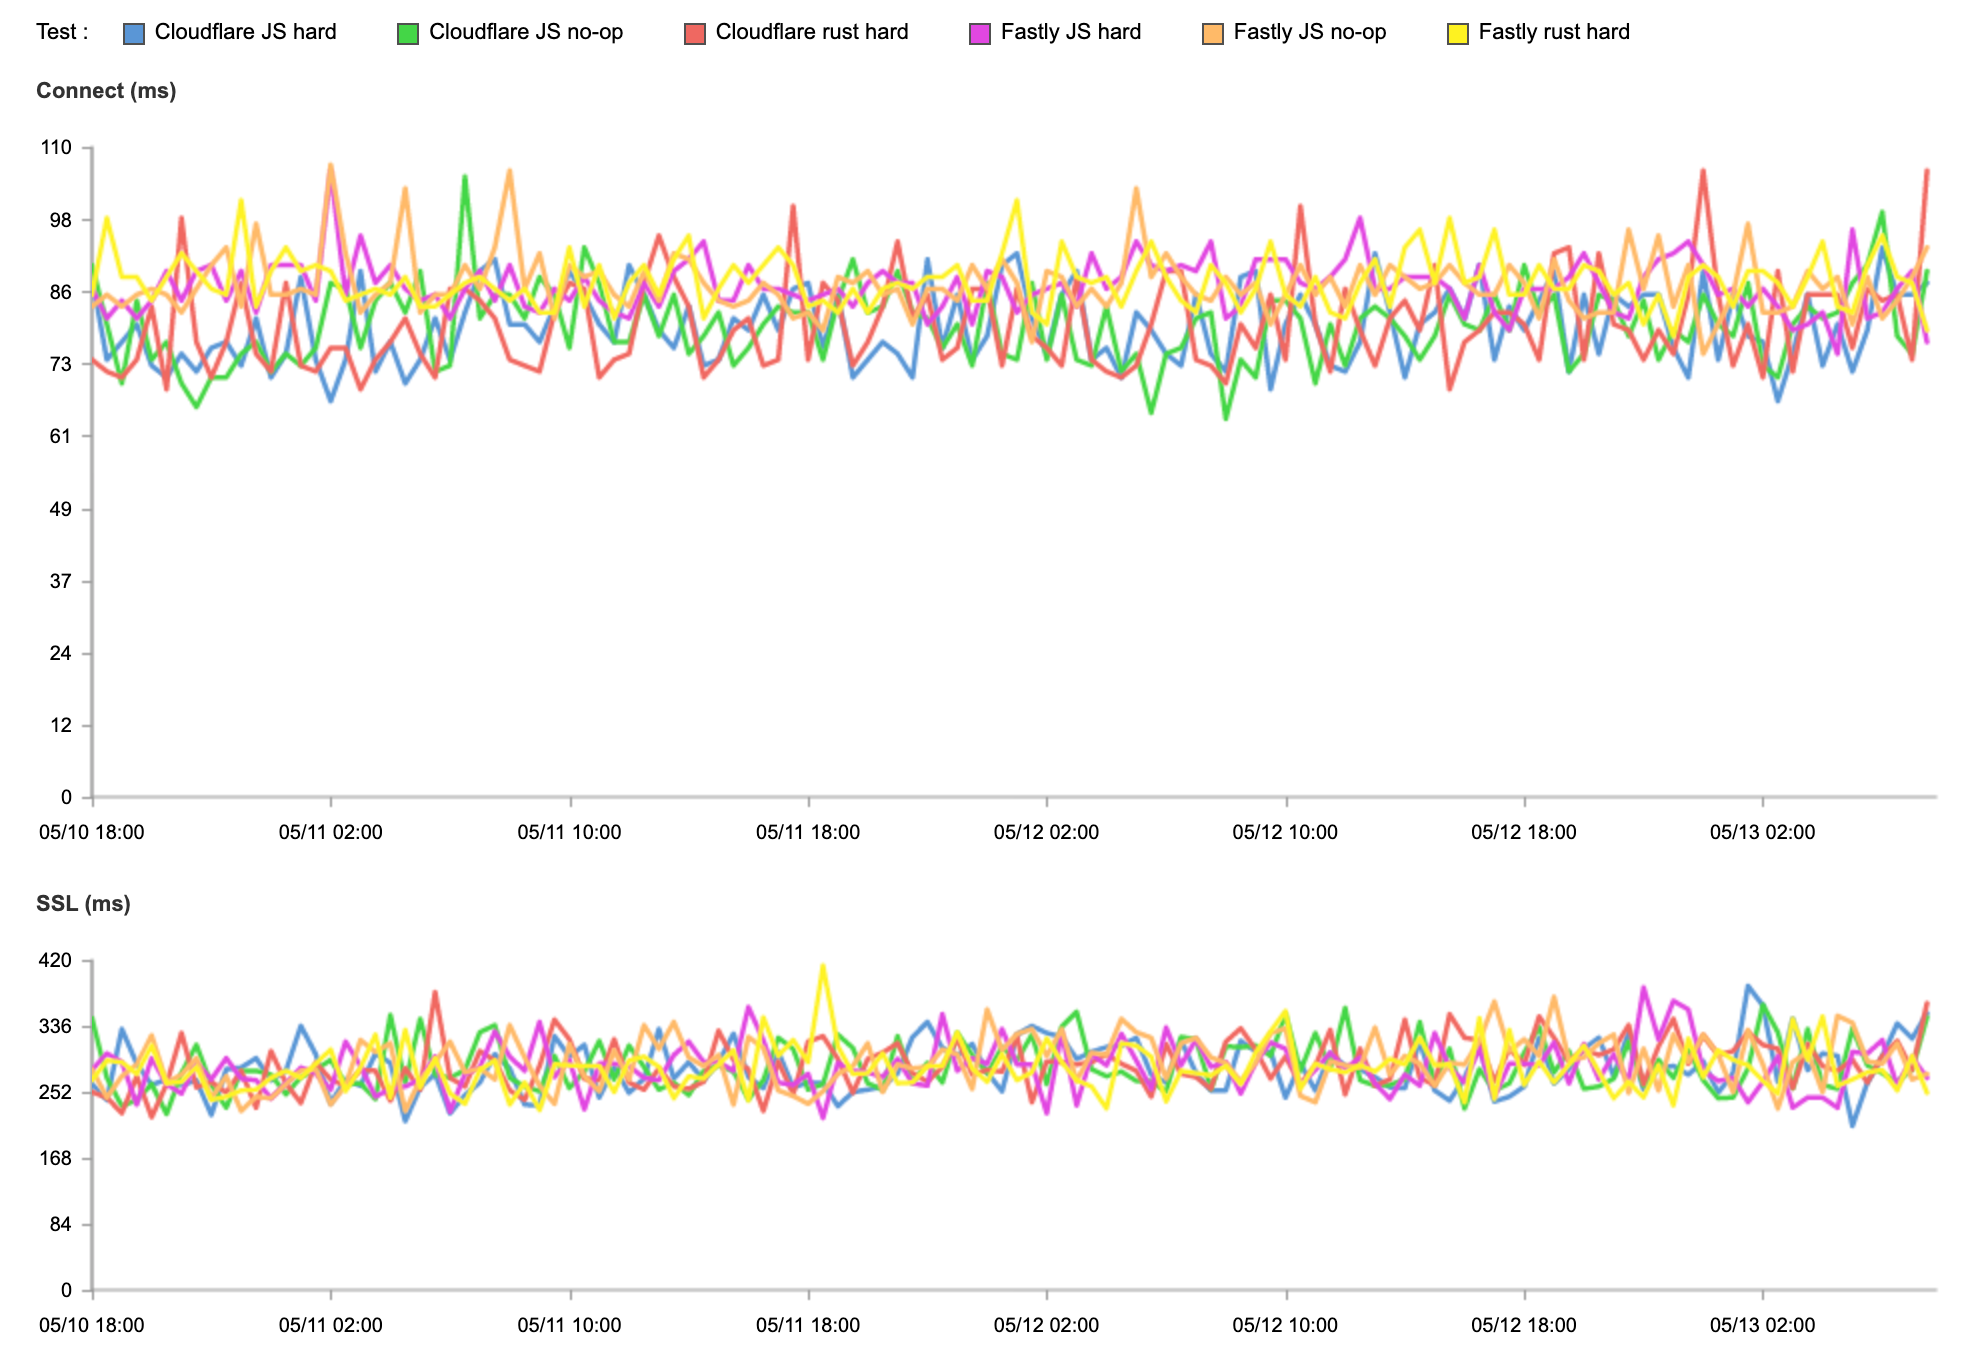
| Test | 95th Percentile Connect (ms) | 95th Percentile SSL (ms) |
|---|---|---|
| Cloudflare JS no-op | 81 | 289 |
| Fastly JS no-op | 88 | 293 |
| Cloudflare JS hard | 81 | 286 |
| Fastly JS hard | 88 | 291 |
| Cloudflare Rust hard | 81 | 288 |
| Fastly Rust hard | 88 | 295 |
Cloudflare’s hyper-optimized web stack allows us to process all requests faster, meaning that Workers code gets started faster. Having that extra head start in Connect and SSL allows us to further increase the distance between us and Compute@Edge.
To verify these results, we compared the Catchpoint results to our own data set. Here is the p95 TTFB for the JavaScript and Rust hard loops for both Fastly and Cloudflare from our data:
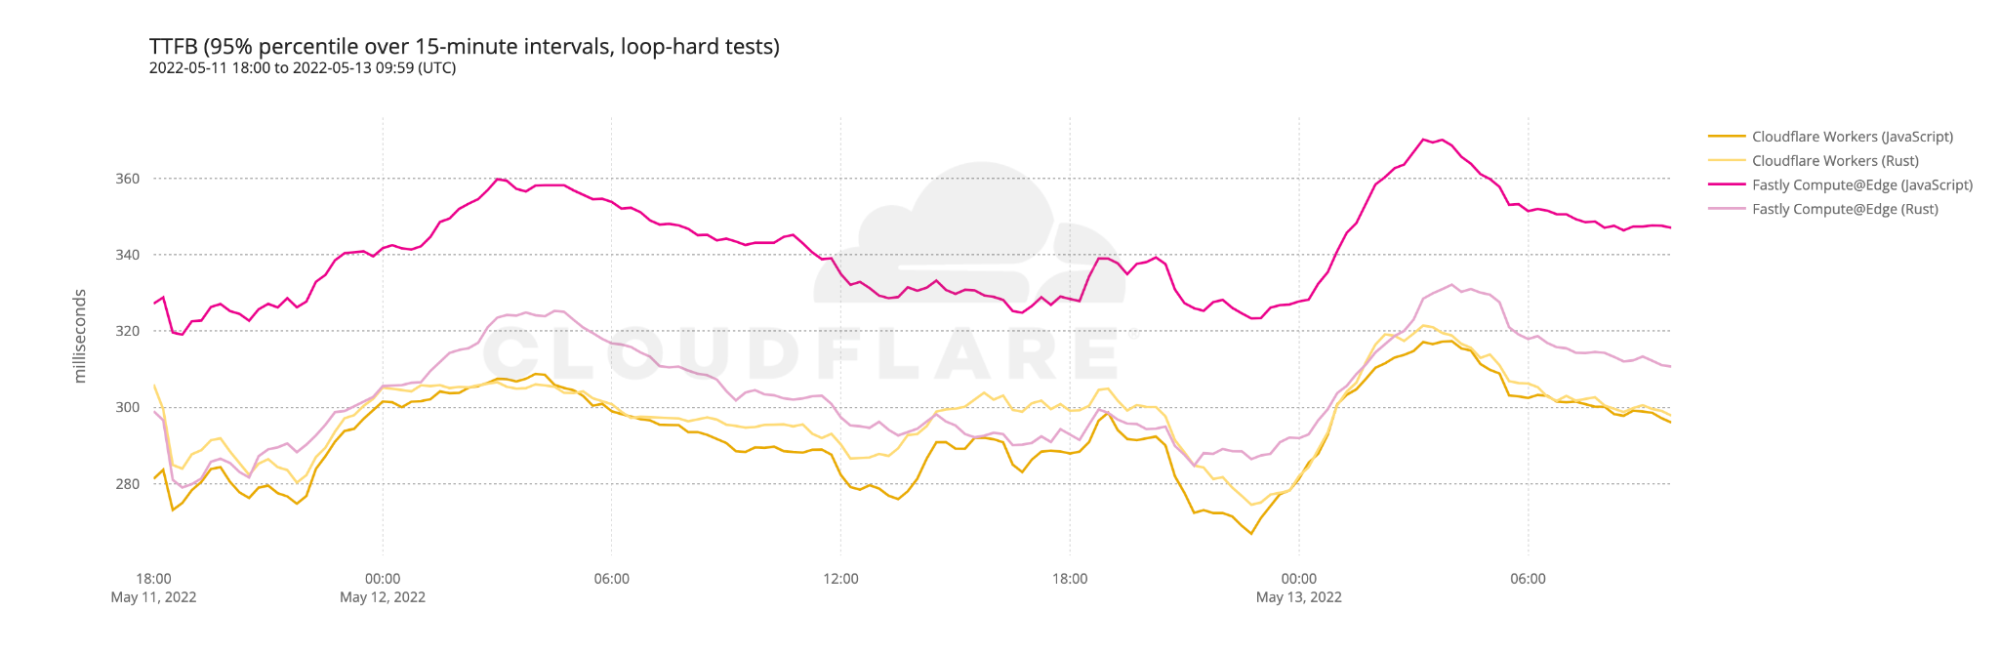
As you can see, Cloudflare is faster on JavaScript and Rust calls. And when you look at wait time, you will see that outside of Catchpoint results, Cloudflare even beats Fastly in the Rust hard tests:
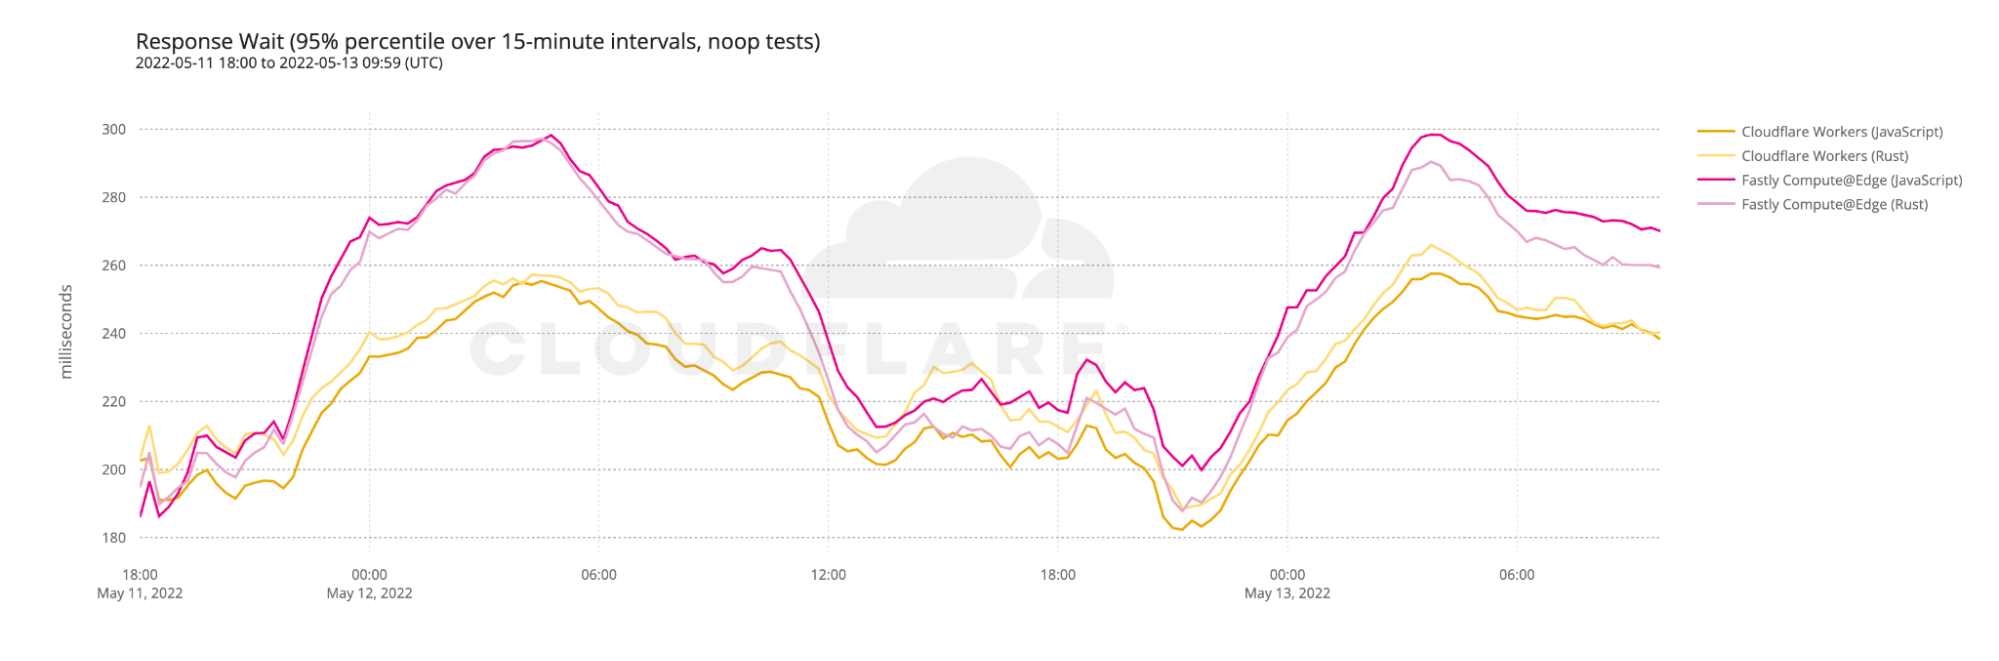
The big takeaway from this is that in addition to Cloudflare being faster for the time spent processing requests, Cloudflare’s network and performance optimizations as a whole set us apart and make our Workers platform even faster.
A fast network makes for a faster developer platform
Cloudflare’s commitment to building the fastest network allows us to deliver unparalleled performance for all applications, including our developer tools. Whether it’s by accelerating Cloudflare Pages performance by hosting on every single Cloudflare server, or by deploying Workers in 275 cities without developers needing to configure a thing, Cloudflare’s developer tools are all built on top of Cloudflare’s global network. We’re committed to making our network faster so that our developer products are as performant as they could possibly be.
And it’s not just the developer platform. Cloudflare runs an integrated and optimized stack that includes DDoS protection, WAF, rate limiting, bot management, caching, SSL, smart routing, and more. By having a single software stack we are able to offer the widest range of features while ensuring that performance (no matter which of our products you use) remains excellent. We don’t want you to have to compromise performance to get security or vice versa.
Proof of Stake and our next experiments in web3
Post Syndicated from Wesley Evans original https://blog.cloudflare.com/next-gen-web3-network/


A little under four years ago we announced Cloudflare’s first experiments in web3 with our gateway to the InterPlanetary File System (IPFS). Three years ago we announced our experimental Ethereum Gateway. At Cloudflare, we often take experimental bets on the future of the Internet to help new technologies gain maturity and stability and for us to gain deep understanding of them.
Four years after our initial experiments in web3, it’s time to launch our next series of experiments to help advance the state of the art. These experiments are focused on finding new ways to help solve the scale and environmental challenges that face blockchain technologies today. Over the last two years there has been a rapid increase in the use of the underlying technologies that power web3. This growth has been a catalyst for a generation of startups; and yet it has also had negative externalities.
At Cloudflare, we are committed to helping to build a better Internet. That commitment balances technology and impact. The impact of certain older blockchain technologies on the environment has been challenging. The Proof of Work (PoW) consensus systems that secure many blockchains were instrumental in the bootstrapping of the web3 ecosystem. However, these systems do not scale well with the usage rates we see today. Proof of Work networks rely on complex cryptographic functions to create consensus and prevent attacks. Every node on the network is in a race to find a solution to this cryptographic problem. This cryptographic function is called a hash function. A hash function takes a number in x, and gives a number out y. If you know x, it’s easy to compute y. However, given y, it’s prohibitively costly to find a matching x. Miners have to find an x that would output a y with certain properties, such as 10 leading zero. Even with advanced chips, this is costly and heavily based on chance.
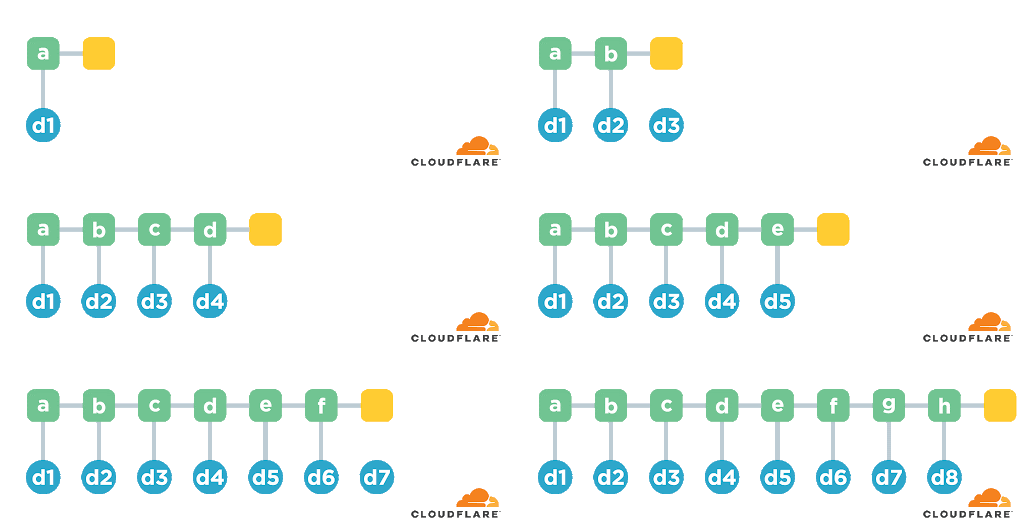
While that process is incredibly secure because of the vast amount of hashing that occurs, Proof of Work networks are wasteful. This waste is driven by the fact that Proof of Work consensus mechanisms are electricity-intensive. In a PoW ecosystem, energy consumption scales directly with usage. So, for example, when web3 took off in 2020, the Bitcoin network started to consume the same amount of electricity as Switzerland (according to Cambridge Bitcoin Electricity Consumption Index).
This inefficiency in resource use is by design to make it difficult for any single actor to threaten the security of the blockchain, and for the majority of the last decade, while use was low, this inefficiency was an acceptable trade off. The other major trade off accepted with the security of Proof of Work has been the number of transactions the network can handle per second. For instance, the Ethereum network can currently process about 30 transactions per second. This ultra-low transaction rate was acceptable when the technology was in development, but does not scale to meet the current demand.
As recently as two years ago, web3 was an up-and-coming ecosystem with minimal traffic compared to the majority of the traffic on the Internet. The last two years changed the web3 use landscape. Traffic to the Bitcoin and the Ethereum networks has exploded. Technologies like Smart Contracts that power DeFi, NFTs, and DAOs have started to become commonplace in the developer community (and in the Twitter lexicon). The next generation of blockchains like Flow, Avalanche, Solana, as well as Polygon are being developed and adopted by major companies like Meta.
In order to balance our commitment to the environment and to help build a better Internet, it is clear to us that we should launch new experiments to help find a path forward. A path that balances the clear need to drastically reduce the energy consumption of web3 technologies and the capability to scale the web3 networks by orders of magnitude if the need arises to support increased user adoption over the next five years. How do we do that? We believe that the next generation of consensus protocols is likely to be based on Proof of Stake and Proof of Spacetime consensus mechanisms.
Today, we are excited to announce the start of our experiments for the next generation of web3 networks that are embracing Proof of Stake; beginning with Ethereum. Over the next few months, Cloudflare will launch, and fully stake, Ethereum validator nodes on the Cloudflare global network as the community approaches its transition from Proof of Work to Proof of Stake with “The Merge.” These nodes will serve as a testing ground for research on energy efficiency, consistency management, and network speed.
There is a lot in that paragraph so let’s break it down! The short version though is that Cloudflare is going to participate in the research and development of the core infrastructure that helps keep Ethereum secure, fast, as well as energy efficient for everyone.
Proof of Stake is a next-generation consensus protocol to secure blockchains. Unlike Proof of Work that relies on miners racing each other with increasingly complex cryptography to mine a block, Proof of Stake secures new transactions to the network through self-interest. Validator’s nodes (people who verify new blocks for the chain) are required to put a significant asset up as collateral in a smart contract to prove that they will act in good faith. For instance, for Ethereum that is 32 ETH. Validator nodes that follow the network’s rules earn rewards; validators that violate the rules will have portions of their stake taken away. Anyone can operate a validator node as long as they meet the stake requirement. This is key. Proof of Stake networks require lots and lots of validators nodes to validate and attest to new transactions. The more participants there are in the network, the harder it is for bad actors to launch a 51% attack to compromise the security of the blockchain.
To add new blocks to the Ethereum chain, once it shifts to Proof of Stake, validators are chosen at random to create new blocks (validate). Once they have a new block ready it is submitted to a committee of 128 other validators who act as attestors. They verify that the transactions included in the block are legitimate and that the block is not malicious. If the block is found to be valid, it is this attestation that is added to the blockchain. Critically, the validation and attestation process is not computationally complex. This reduction in complexity leads to significant energy efficiency improvements.
The energy required to operate a Proof of Stake validator node is magnitudes less than a Proof of Work miner. Early estimates from the Ethereum Foundation estimate that the entire Ethereum network could use as little as 2.6 megawatts of power. Put another way, Ethereum will use 99.5% less energy post merge than today.
We are going to support the development and deployment of Ethereum by running Proof of Stake validator nodes on our network. For the Ethereum ecosystem, running validator nodes on our network allows us to offer even more geographic decentralization in places like EMEA, LATAM, and APJC while also adding infrastructure decentralization to the network. This helps keep the network secure, outage resistant, and closer to the goal of global decentralization for everyone. For us, It’s a commitment to helping research and experiment with scaling the next generation of blockchain networks that could be a key part of the story of the Internet. Running blockchain technology at scale is incredibly difficult, and Proof of Stake systems have their own unique requirements that will take time to understand and improve. Part of this experimentation though is a commitment. As part of our experiments Cloudflare has not and will not run our own Proof of Work infrastructure on our network.
Finally, what is “The Merge”? The Merge is the planned combination of the Ethereum Mainnet (the chain you interact with today when you make an Eth transaction) and the Ethereum Beacon Chain. The Beacon chain is the Proof of Stake blockchain running in parallel with the Ethereum Mainnet. The Merge is much more significant than a consensus update.
Consensus updates have happened multiple times already on Ethereum. This could be because of a vulnerability, or the need to introduce new features. The Merge is different in a way that it cannot be made by a normal upgrade. Previous forks have been enabled at a specific block number. This means that if you mine enough blocks, the new consensus rules apply automatically. With the Merge, there should only be one state root for the fork to happen. The merge state root would be the start of the Ethereum Mainnet PoS journey. It is chosen and set at a certain difficulty, instead of block height, to avoid merging a high block with low difficulty.
Once The Merge occurs later this year in 2022, Ethereum will be a full Proof of Stake ecosystem that no longer relies on Proof of Work.
This is just the start of our commitment to help build the next generation of web3 networks. We are excited to work with our partners across the cryptography, web3, and infrastructure communities to help create the next generation of blockchain ecosystems that are environmentally sustainable, secure, and blazing fast.
Public access for our Ethereum and IPFS gateways now available
Post Syndicated from Wesley Evans original https://blog.cloudflare.com/ea-web3-gateways/


Today we are excited to announce that our Ethereum and IPFS gateways are publicly available to all Cloudflare customers for the first time. Since our announcement of our private beta last September the interest in our Eth and IPFS gateways has been overwhelming. We are humbled by the demand for these tools, and we are excited to get them into as many developers’ hands as possible. Starting today, any Cloudflare customer can log into the dashboard and configure a zone for Ethereum, IPFS, or both!
Over the last eight months of the private beta, we’ve been busy working to fully operationalize the gateways to ensure they meet the needs of our customers!
First, we have created a new API with end-to-end managed hostname deployment. This ensures the creation and management of gateways as you continue to scale remains extremely quick and easy! It is paramount to give time and focus back to developers to focus on your core product and services and leave the infrastructural components to us!
Second, we’ve added a brand new UI bringing web3 to Cloudflare’s zone-level dashboard. Now, regardless of the workflow you are used to, we have parity between our UI and API to ensure we fit into your existing processes and no time is wasted internally to have to figure out ‘how we integrate’, but rather, a quick setup and start to serve content or connect your services!
Third, we are pleased to say that you will soon have testnet support to ensure your new development can be easily tested, hardened, and deployed to your mainnet without incurring additional risk to your brand trust, product availability, or concern that something may fail silently and begin a cascade of problems throughout your network. We want to ensure that anyone leveraging our web3 gateways is able to achieve more confidence and trust that whatever changes are pushed forward do not impact end user experience. At the end of the day, the Internet is for end users and their experience and perception must always be kept within our purview at all times.
Lastly, Cloudflare loves to build on top of Cloudflare. This helps us stay resilient and also shows our commitment and belief in all the products we create! We have always used our SSL for SaaS and Workers products in the background. Building on our own services gives our customers the ability to define and control their own HTTP features on top of traffic destined for web3 gateways, including: rate limits, WAF rules, custom security filters, serving video, customer defined Workers logic, custom redirects and more!
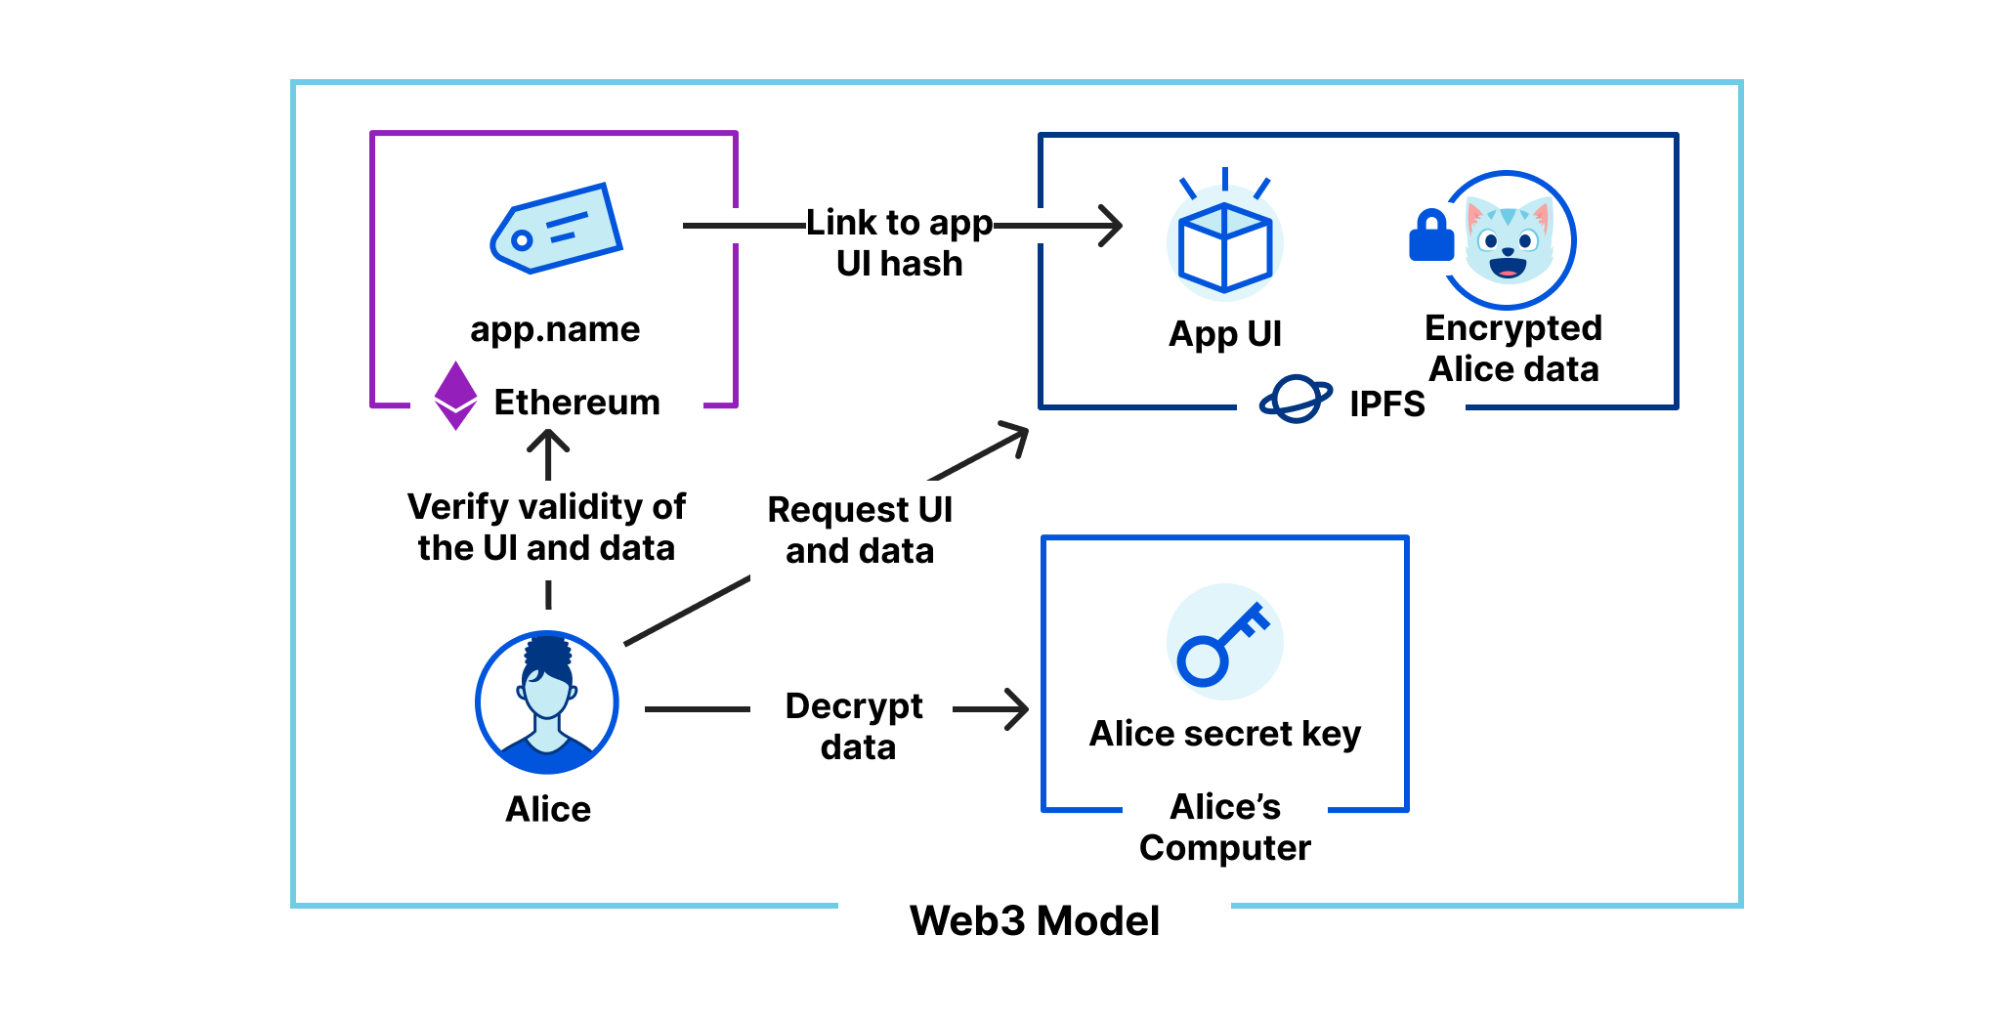
Today thousands of different individuals, companies, and DAO’s are building new products leveraging our web3 gateways — the most reliable web3 infrastructure with the largest network
Here are just a few snippets of how people are already using our web3 Gateways, and we can’t wait to see what you build on them:
- DeFi DAO’s use the Cloudflare IPFS gateway to serve their front end web applications globally without latency or cache penalties.
- NFT designers use the Ethereum Gateway to effortlessly drop new offerings, and the IPFS gateway to store them in a fully decentralized system.
- Large Dapp developers trust us to handle huge traffic spikes quickly and efficiently, without rate limits or overage caps. They combine all our offerings into a single pane of glass so that they don’t have to juggle multiple systems.
As part of this announcement, we will begin migrating our existing users away from the legacy gateway endpoints and onto our new API, which is easier, highly managed, and more robust. To ensure a smooth transition, you will first need to make sure you have signed up for a Cloudflare account if you did not already have one. On top of that, we have made sure to keep our free users in mind and thus our free users will continue to use the gateways at no cost with our free tier option! This includes no cap in the amount of traffic that can be pushed through our gateways along with offering the most transparent and forecastable pricing models in the market today. We are very excited about the future and look forward to sharing the next iterations of web3 at Cloudflare!
Also, if you can’t wait to start building on our gateways, check out our product documentation for more guidance.
Serving Cloudflare Pages sites to the IPFS network
Post Syndicated from Thibault Meunier original https://blog.cloudflare.com/cloudflare-pages-on-ipfs/


Four years ago, Cloudflare went Interplanetary by offering a gateway to the IPFS network. This meant that if you hosted content on IPFS, we offered to make it available to every user of the Internet through HTTPS and with Cloudflare protection. IPFS allows you to choose a storage provider you are comfortable with, while providing a standard interface for Cloudflare to serve this data.
Since then, businesses have new tools to streamline web development. Cloudflare Workers, Pages, and R2 are enabling developers to bring services online in a matter of minutes, with built-in scaling, security, and analytics.
Today, we’re announcing we’re bridging the two. We will make it possible for our customers to serve their sites on the IPFS network.
In this post, we’ll learn how you will be able to build your website with Cloudflare Pages, and leverage the IPFS integration to make your content accessible and available across multiple providers.
A primer on IPFS
The InterPlanetary FileSystem (IPFS) is a peer-to-peer network for storing content on a distributed file system. It is composed of a set of computers called nodes that store and relay content using a common addressing system. In short, a set of participants agree to maintain a shared index of content the network can provide, and where to find it.
Let’s take two random participants in the network: Alice, a cat person, and Bob, a dog person.
As a participant in the network, Alice keeps connections with a subset of participants, referred to as her peers. When Alice is making her content 🐱 available on IPFS, it means she announces to her peers she has content 🐱, and these peers stored in their routing table 🐱 is provided by Alice’s node.
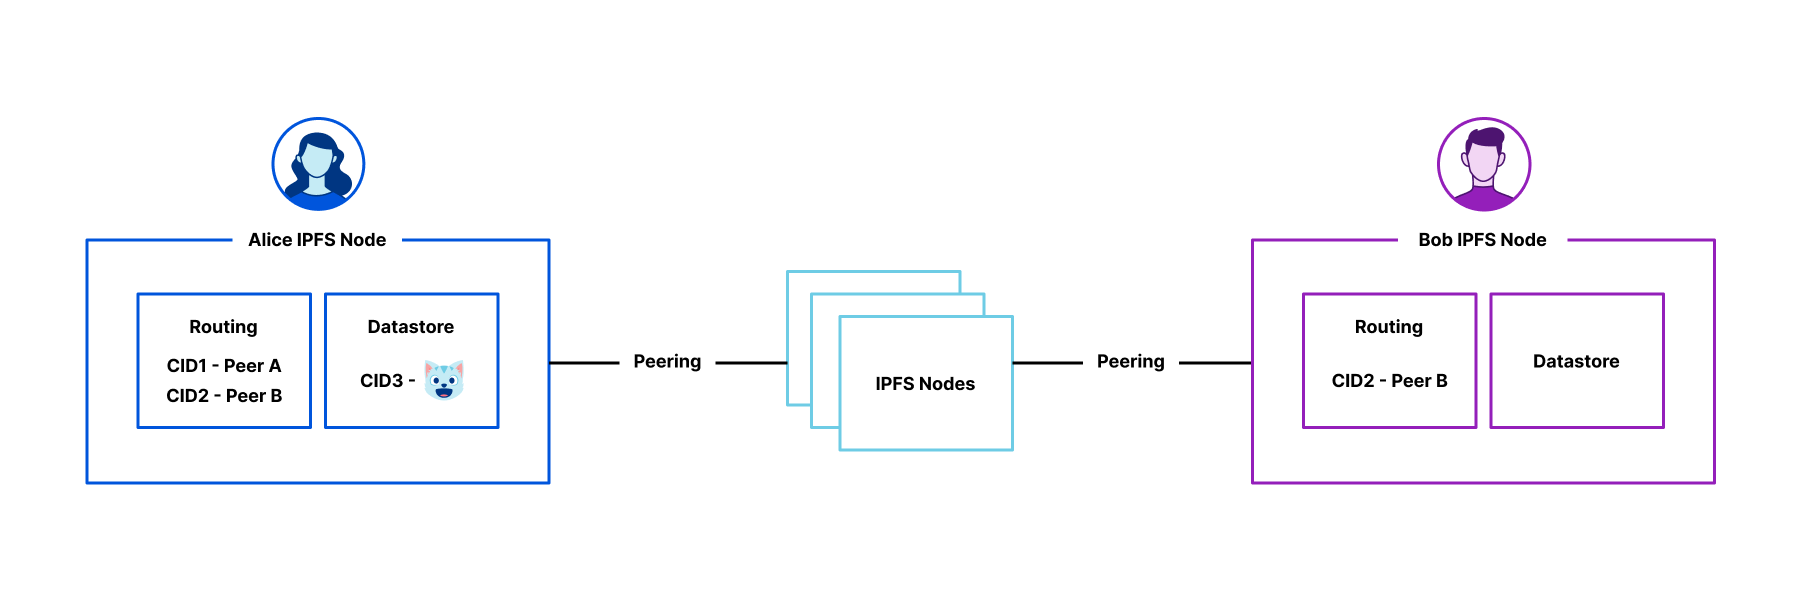
Each node has a routing table, and a datastore. The routing table retains a mapping of content to peers, and the datastore retains the content a given node stores. In the above case, only Alice has content, a 🐱.
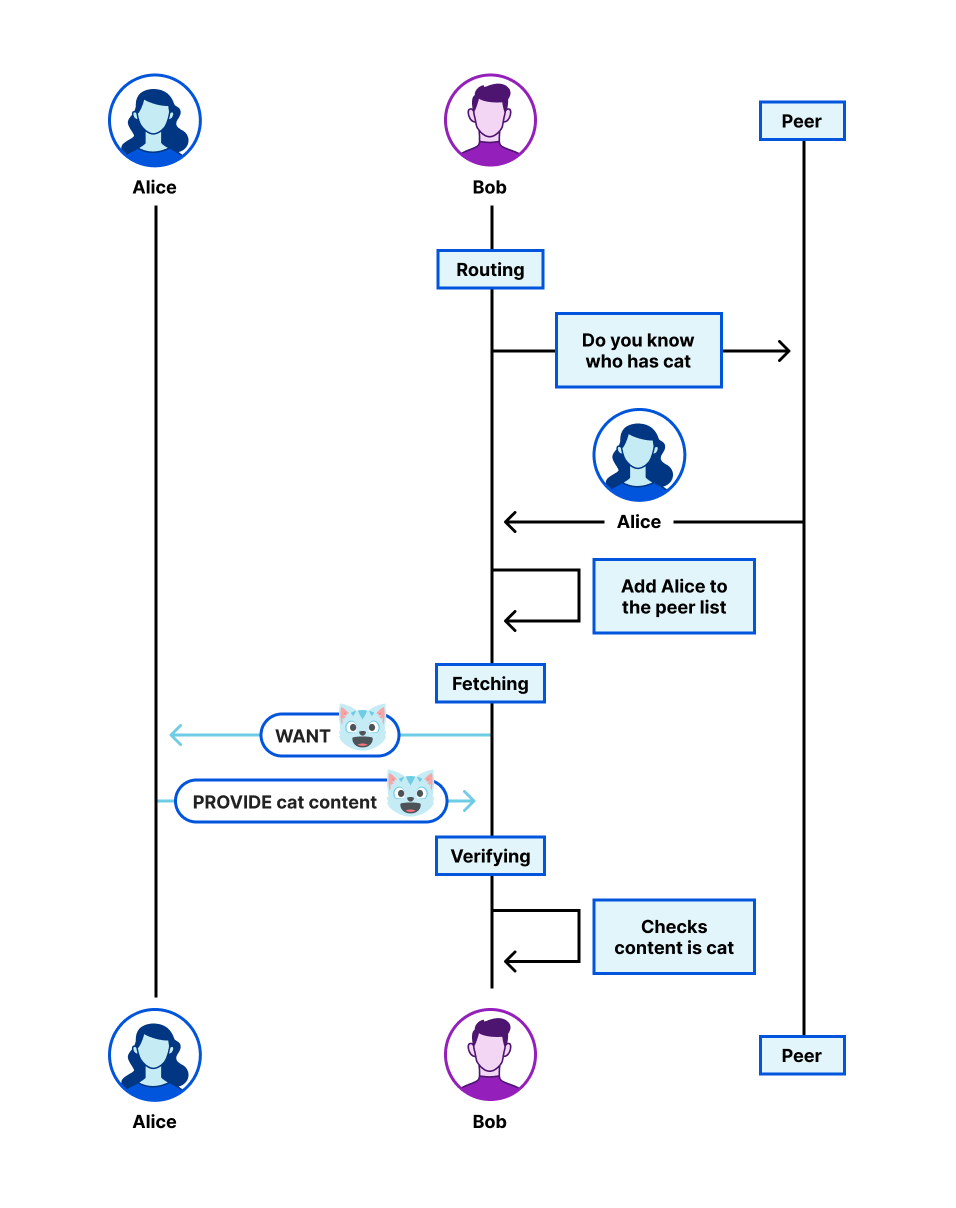
When Bob wants to retrieve 🐱, he tells his peers they want 🐱. These peers point him to Alice. Alice then provides 🐱 to Bob. Bob can verify 🐱 is the content they were looking for, because the content identifier he requested is derived from the 🐱 content itself, using a secure, cryptographic hash function.
Even better, if Bob becomes a cat person, they can announce to their peers they are also providing a cat. Bob’s love for cats could be genuine, or because they have interest in providing the content, such as a contract with Alice. IPFS provides a common ground to share content, without being opinionated on how this content has to be stored and its guarantees.
How Pages websites are made available on IPFS
Content is made available as follows.
The components are:
- Pages storage: Storage solution for Cloudflare Pages.
- IPFS Index Proxy: Service maintaining a map between IPFS CID and location of the data. This is operated on Cloudflare Workers and using Workers KV to store the mapping.
- IPFS node: Cloudflare-hosted IPFS node serving Pages content. It has an in-house datastore module, able to communicate with the IPFS Index Proxy.
- IPFS network: The rest of the IPFS network.
When you opt in serving your Cloudflare Page on IPFS, a call is made to the IPFS index proxy. This call first fetches your Pages content, transforms it into a CID, then both populates IndexDB to associate the CID with the content and reaches out to Cloudflare IPFS node to tell them they are able to provide the CID.
For example, imagine your website structure is as follows:
- /
- index.html
- static/
- cats.txt
- beautiful_cats.txt
To provide this website on IPFS, Cloudflare has to compute a CID for /. CIDs are built recursively. To compute the CID for a given folder /, one needs to have the CID of index.html and static/. index.html CID is derived from its binary representation, and static/ from cats.txt and beautiful_cats.txt.
This works similarly to a Merkle tree, except nodes can reference each other as long as they still form a Directed Acyclic Graph (DAG). This structure is therefore referred to as a MerkleDAG.
In our example, it’s not unlikely for cats.txt and beautiful_cats.txt to have data in common. In this case, Cloudflare can be smart in the way it builds the MerkleDAG.
This reduces the storage and bandwidth requirement when accessing the website on IPFS.
If you want to learn more about how you can model a file system on IPFS, you can check the UnixFS specification.
Cloudflare stores every CID and the content it references in IndexDB. This allows Cloudflare IPFS nodes to serve Cloudflare Pages assets when requested.
Let’s put this together
Let’s take an example: pages-on-ipfs.com is hosted on IPFS. It is built using Hugo, a static site generator, and Cloudflare Pages with the public documentation template. Its source is available on GitHub. If you have an IPFS compatible client, you can access it at ipns://pages-on-ipfs.com as well.
1. Read Cloudflare Pages deployment documentation
For the purpose of this blog, I want to create a simple Cloudflare page website. I have experience with Hugo, so I choose it as my framework for the project.
I type “cloudflare pages” in the search bar of my web browser, then head to the Read the docs > Framework Guide > Deploy a Hugo site.
2. Create a site
This is where I use Hugo, and your configuration might differ. In short, I use hugo new site pages-on-ipfs, create an index and two static resources, et voilà. The result is available on the source GitHub for this project.
3. Deploy using Cloudflare Pages
On the Cloudflare Dashboard, I go to Account Home > Pages > Create a project. I select the GitHub repository I created, and configure the build tool to build Hugo website. Basically, I follow what’s written on Cloudflare Pages documentation.
Upon clicking Save and Deploy, my website is deployed on pages-on-ipfs.pages.dev. I also configure it to be available at pages-on-ipfs.com
4. Serve my content on IPFS
First, I opt in my zone on Cloudflare Pages integration with IPFS. This feature is not available yet for everyone to try out.
This allows Cloudflare to index the content of my website. Once indexed, I get the CID for my deployment baf…1. I can check that my content is available at this hash on IPFS using an IPFS gateway https://baf…1.ipfs.cf-ipfs.com/.
5. Make my IPFS website available at pages-on-ipfs.com
Having one domain name to access both Cloudflare Pages and IPFS version, depending on if the client supports IPFS or not is ideal. Fortunately, the IPFS ecosystem supports such a feature via DNSLink. DNSLink is a way to specify the IPFS content a domain is associated with.
For pages-on-ipfs.com, I create a TXT record on _dnslink.pages-on-ipfs.com with value dnslink=/ipfs/baf…1. Et voilà. I can now access ipns://pages-on-ipfs.com via an IPFS client.
6. (Optional) Replicate my website
The content of my website can now easily be replicated and pinned by other IPFS nodes. This can either be done at home via an IPFS client or using a pinning service such as Pinata.
What’s next
We’ll make this service available later this year as it is being refined. We are committed to make information move freely and help build a better Internet. Cloudflare Pages work of solving developer problems continues, as developers are now able to make their site accessible to more users.
Over the years, IPFS has been used by more and more people. While Cloudflare started by making IPFS content available to web users through an HTTP interface, we now think it’s time to give back. Allowing Cloudflare assets to be served over a public distributed network extends developers and users capability on an open web.
Common questions
- I am already hosting my website on IPFS. Can I pin it using Cloudflare?
- No. This project aims at serving Cloudflare hosted content via IPFS. We are still investigating how to best replicate and re-provide already-existing IPFS content via Cloudflare infrastructure.
- Does this make IPFS more centralized?
- No. Cloudflare does not have the authority to decide who can be a node operator nor what content they provide.
- Are there guarantees the content is going to be available?
- Yes. As long as you choose Cloudflare to host your website on IPFS, it will be available on IPFS. Should you move to another provider, it would be your responsibility to make sure the content remains available. IPFS allows for this transition to be smooth using a pinning service.
- Is IPFS private?
- It depends. Generally, no. IPFS is a p2p protocol. The nodes you peer with and request content from would know the content you are looking for. The privacy depends on the trust you have in your peers to not snoop on the data you request.
- Can users verify the integrity of my website?
- Yes. They need to access your website through an IPFS compatible client. Ideally, IPFS content integrity is turned into a web standard, similar to subresource integrity.
Gaining visibility in IPFS systems
Post Syndicated from Pop Chunhapanya original https://blog.cloudflare.com/ipfs-measurements/


We have been operating an IPFS gateway for the last four years. It started as a research experiment in 2018, providing end-to-end integrity with IPFS. A year later, we made IPFS content faster to fetch. Last year, we announced we were committed to making IPFS gateway part of our product offering. Through this process, we needed to inform our design decisions to know how our setup performed.
To this end, we’ve developed the IPFS Gateway monitor, an observability tool that runs various IPFS scenarios on a given gateway endpoint. In this post, you’ll learn how we use this tool and go over discoveries we made along the way.
Refresher on IPFS
IPFS is a distributed system for storing and accessing files, websites, applications, and data. It’s different from a traditional centralized file system in that IPFS is completely distributed. Any participant can join and leave at any time without the loss of overall performance.
However, in order to access any file in IPFS, users cannot just use web browsers. They need to run an IPFS node to access the file from IPFS using its own protocol. IPFS Gateways play the role of enabling users to do this using only web browsers.
Cloudflare provides an IPFS gateway at https://cloudflare-ipfs.com, so anyone can just access IPFS files by using the gateway URL in their browsers.
As IPFS and the Cloudflare IPFS Gateway have become more and more popular, we need a way to know how performant it is: how much time it takes to retrieve IPFS-hosted content and how reliable it is. However, IPFS gateways are not like normal websites which only receive HTTP requests and return HTTP responses. The gateways need to run IPFS nodes internally and sometimes do content routing and peer routing to find the nodes which provide IPFS contents. They sometimes also need to resolve IPNS names to discover the contents. So, in order to measure the performance, we need to do measurements many times for many scenarios.
Enter the IPFS Gateway monitor
IPFS Gateway monitor is this tool. It allows anyone to check the performance of their gateway and export it to the Prometheus monitoring system.
This monitor is composed of three independent binaries:
- ipfs-gw-measure is the tool that calls the gateway URL and does the measurement scenarios.
- ipfs-gw-monitor is a way to call the measurement tool multiple times.
- Prometheus Exporter exposes prometheus-readable metrics.
To interact with the IPFS network, the codebase also provides a way to start an IPFS node.
A scenario is a set of instructions a user performs given the state of our IPFS system. For instance, we want to know how fast newly uploaded content can be found by the gateway, or if popular content has a low query time. We’ll discuss more of this in the next section.
Putting this together, the system is the following.
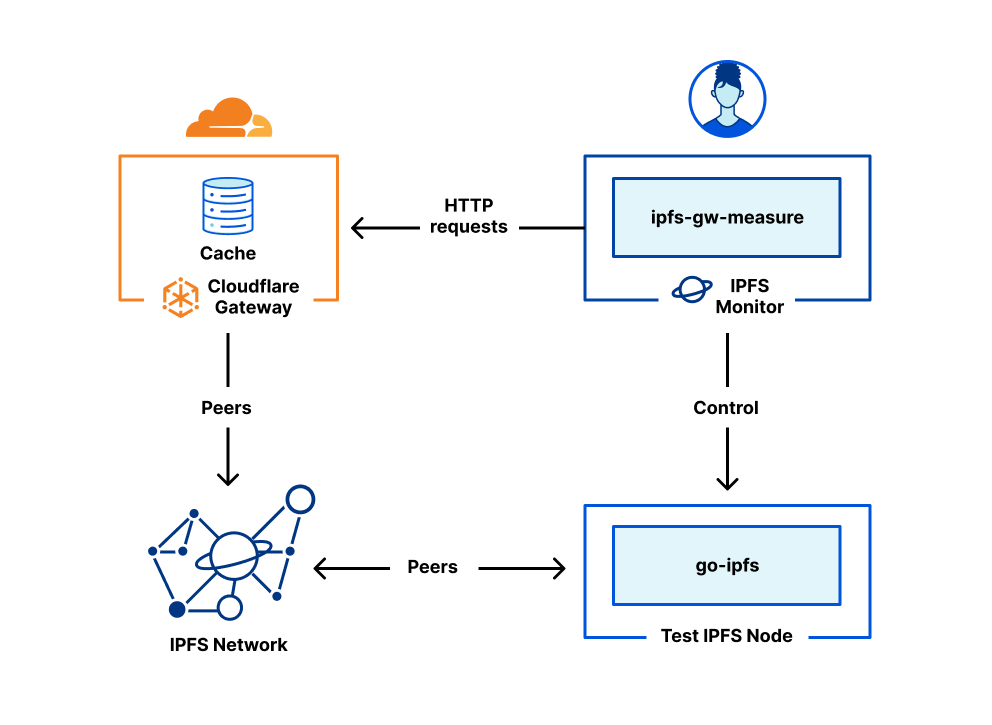
During this experience, we have operated both the IPFS Monitor, and a test IPFS node. The IPFS node allows the monitor to provide content to the IPFS network. This allows us to be sure that the content provided is fresh, and actually hosted. Peers have not been fixed, and leverage the IPFS default peer discovery mechanism.
Cloudflare IPFS Gateway is treated as an opaque system. The monitor performs end-to-end tests by contacting the gateway via its public API, either https://cloudflare-ipfs.com or via a custom domain registered with the gateway.
The following scenarios have been run on consumer hardware in March. They are not representative of all IPFS users. All values provided below have been sourced against Cloudflare’s IPFS gateway endpoint.
First scenarios: Gateway to serve immutable IPFS contents
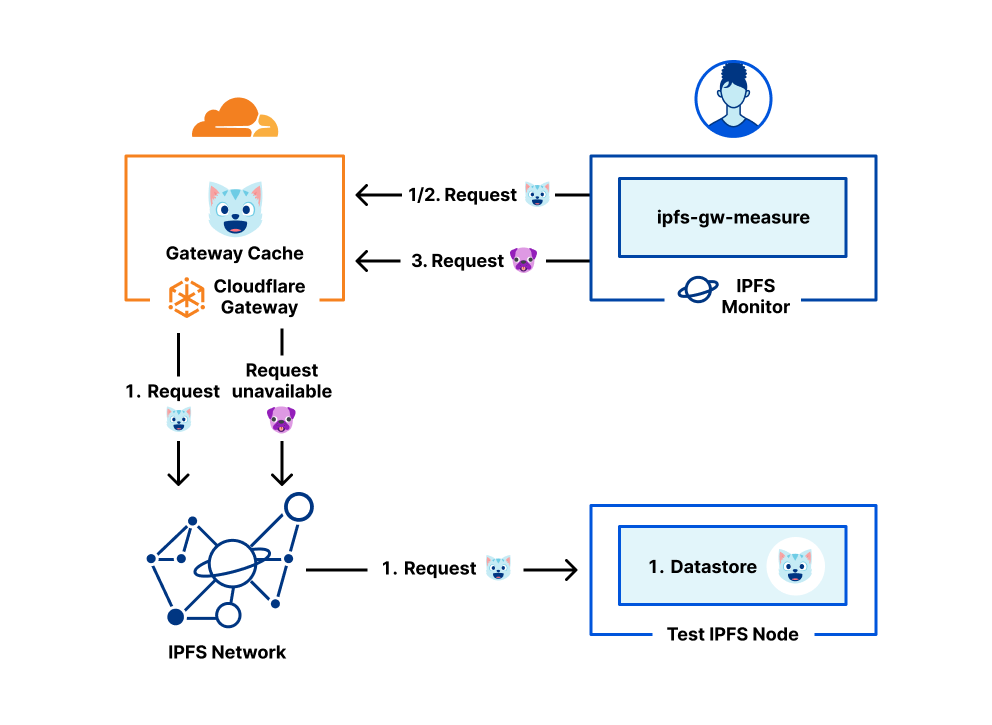
IPFS contents are the most primitive contents being served by the IPFS network and IPFS gateways. By their nature, they are immutable and addressable only by the hash of the content. Users can access the IPFS contents by putting the Content IDentifier (CID) in the URL path of the gateway. For example, ipfs://bafybeig7hluox6xefqdgmwcntvsguxcziw2oeogg2fbvygex2aj6qcfo64. We measure three common scenarios that users will often encounter.
The first one is when users fetch popular content which has a high probability of being found in our cache already. During our experiment, we measured a response time for such content is around 116ms.
The second one is the case where the users create and upload the content to the IPFS network, such as via the integration between Cloudflare Pages and IPFS (LINK TO BLOG). This scenario is a lot slower than the first because the content is not in our cache yet, and it takes some time to discover the content. The content that we upload during this measurement is a random piece of 32-byte content.
The last measurement is when users try to download content that does not exist. This one is the slowest. Because of the nature of content routing of IPFS, there is no indication that tells us that content doesn’t exist. So, setting the timeout is the only way to tell if the content exists or not. Currently, the Cloudflare IPFS gateway has a timeout of around five minutes.
| Scenarios | Min (s) | Max (s) | Avg (s) | |
|---|---|---|---|---|
| 1 | ipfs/newly-created-content | 0.276 | 343 | 44.4 |
| 2 | ipfs/in-cache-content | 0.0825 | 0.539 | 0.116 |
| 3 | ipfs/unavailable-cid | 90 | 341 | 279 |
Second scenarios: Gateway to serve mutable IPNS named contents
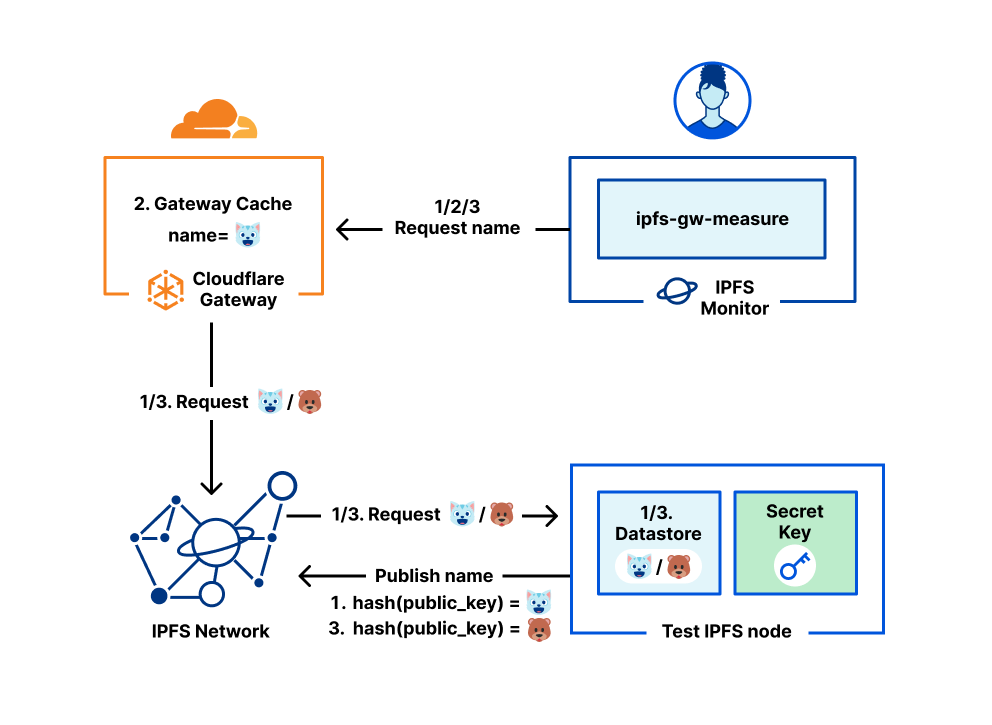
Since IPFS contents are immutable, when users want to change the content, the only way to do so is to create new content and distribute the new CID to other users. Sometimes distributing the new CID is hard, and is out of scope of IPFS. The InterPlanetary Naming System (IPNS) tries to solve this. IPNS is a naming system that — instead of locating the content using the CID — allows users to locate the content using the IPNS name instead. This name is a hash of a user’s public key. Internally, IPNS maintains a section of the IPFS DHT which maps from a name to a CID. Therefore, when the users want to download the contents using names through the gateway, the gateway has to first resolve the name to get the CID, then use the CID to query the IPFS content as usual.
The example for fetching the IPNS named content is at ipns://k51qzi5uqu5diu2krtwp4jbt9u824cid3a4gbdybhgoekmcz4zhd5ivntan5ey
We measured many scenarios for IPNS as shown in the table below. Three scenarios are similar to the ones involving IPFS contents. There are two more scenarios added: the first one is measuring the response time when users query the gateway using an existing IPNS name, and the second one is measuring the response time when users query the gateway immediately after new content is published under the name.
| Scenarios | Min (s) | Max (s) | Avg (s) | |
|---|---|---|---|---|
| 1 | ipns/newly-created-name | 5.50 | 110 | 33.7 |
| 2 | ipns/existing-name | 7.19 | 113 | 28.0 |
| 3 | ipns/republished-name | 5.62 | 80.4 | 43.8 |
| 4 | ipns/in-cache-content | 0.0353 | 0.0886 | 0.0503 |
| 5 | ipns/unavailable-name | 60.0 | 146 | 81.0 |
Third scenarios: Gateway to serve DNSLink websites
Even though users can use IPNS to provide others a stable address to fetch the content, the address can still be hard to remember. This is what DNSLink is for. Users can address their content using DNSLink, which is just a normal domain name in the Domain Name System (DNS). As a domain owner, you only have to create a TXT record with the value dnslink=/ipfs/baf…1, and your domain can be fetched from a gateway.
There are two ways to access the DNSLink websites using the gateway. The first way is to access the website using the domain name as a URL hostname, for example, https://ipfs.example.com. The second way is to put the domain name as a URL path, for example, https://cloudflare-ipfs.com/ipns/ipfs.example.com.
| Scenarios | Min (s) | Max (s) | Avg (s) | |
|---|---|---|---|---|
| 1 | dnslink/ipfs-domain-as-url-hostname | 0.251 | 18.6 | 0.831 |
| 2 | dnslink/ipfs-domain-as-url-path | 0.148 | 1.70 | 0.346 |
| 3 | dnslink/ipns-domain-as-url-hostname | 7.87 | 44.2 | 21.0 |
| 4 | dnslink/ipns-domain-as-url-path | 6.87 | 72.6 | 19.0 |
What does this mean for regular IPFS users?
These measurements highlight that IPFS content is fetched best when cached. This is an order of magnitude faster than fetching new content. This result is expected as content publication on IPFS can take time for nodes to retrieve, as highlighted in previous studies. Then, when it comes to naming IPFS resources, leveraging DNSLink appears to be the faster strategy. This is likely due to the poor connection of the IPFS node used in this setup, preventing IPNS name from propagating rapidly. Overall, IPNS names would benefit from using a resolver to speed up resolution without losing the trust they provide.
As we mentioned in September, IPFS use has seen important growth. So has our tooling. The IPFS Gateway monitor can be found on GitHub, and we will keep looking at improving this first set of metrics.
At the time of writing, using IPFS via a gateway seems to provide lower retrieval times, while allowing for finer grain control over security settings in the browser context. This configuration preserves the content validity properties offered by IPFS, but reduces the number of nodes a user is peering with to one: the gateway. Ideally, we would like users to peer with Cloudflare because we’re offering the best service, while still having the possibility to retrieve content from external sources if they want to. We’ll be conducting more measurements to better understand how to best leverage Cloudflare presence in 270 cities to better serve the IPFS network.
Salisbury Steak: The First Fad Diet
Post Syndicated from The History Guy: History Deserves to Be Remembered original https://www.youtube.com/watch?v=ZQCntDXqNMg
The NSA Says that There are No Known Flaws in NIST’s Quantum-Resistant Algorithms
Post Syndicated from Bruce Schneier original https://www.schneier.com/blog/archives/2022/05/the-nsa-says-that-there-are-no-known-flaws-in-nists-quantum-resistant-algorithms.html
Rob Joyce, the director of cybersecurity at the NSA, said so in an interview:
The NSA already has classified quantum-resistant algorithms of its own that it developed over many years, said Joyce. But it didn’t enter any of its own in the contest. The agency’s mathematicians, however, worked with NIST to support the process, trying to crack the algorithms in order to test their merit.
“Those candidate algorithms that NIST is running the competitions on all appear strong, secure, and what we need for quantum resistance,” Joyce said. “We’ve worked against all of them to make sure they are solid.”
The purpose of the open, public international scrutiny of the separate NIST algorithms is “to build trust and confidence,” he said.
I believe him. This is what the NSA did with NIST’s candidate algorithms for AES and then for SHA-3. NIST’s Post-Quantum Cryptography Standardization Process looks good.
I still worry about the long-term security of the submissions, though. In 2018, in an essay titled “Cryptography After the Aliens Land,” I wrote:
…there is always the possibility that those algorithms will fall to aliens with better quantum techniques. I am less worried about symmetric cryptography, where Grover’s algorithm is basically an upper limit on quantum improvements, than I am about public-key algorithms based on number theory, which feel more fragile. It’s possible that quantum computers will someday break all of them, even those that today are quantum resistant.
It took us a couple of decades to fully understand von Neumann computer architecture. I’m sure it will take years of working with a functional quantum computer to fully understand the limits of that architecture. And some things that we think of as computationally hard today will turn out not to be.
Celebrate Scratch Week with us
Post Syndicated from Joanne Vincent original https://www.raspberrypi.org/blog/scratch-week/
Scratch Week is a global celebration of Scratch that takes place from 15 to 21 May this year. Below, we’ve put together some free resources to help get kids coding with this easy-to-use, block-based programming language. If you’re not sure what Scratch is, check out our introduction video for parents.

Visit Scratch Island on Code Club World
Code Club World is a great place to start coding for children who have never done any coding or programming before. The Code Club World online platform lets them begin their coding journey with fun activities, starting by creating their own personal avatar.
Then on Scratch Island, kids can code a game to find a hidden bug, design a fun ‘silly eyes’ app, or animate a story. No experience necessary! We’ve just added a parents’ guide to explain how Code Club World works.
Explore Scratch projects
For kids who feel ready to move beyond the basics of Scratch this Scratch Week, our Projects site offers a catalogue of projects that further enhance kids’ coding skills as they earn badges and explore, design, and invent.

With the More Scratch path, they will create six projects to make apps, games, and simulations using message broadcasting, if..then and if..then..else decisions, and variables. Then with the Further Scratch path, they can explore the advanced features of Scratch in another six projects to use boolean logic, functions, and clones while creating apps, games, computer-generated art, and simulations.
Discover young people’s Scratch creations
Be inspired by the amazing things young tech creators worldwide code in Scratch by visiting the Coolest Projects Global 2022 showcase. Young people are showing off Scratch games, stories, art, and more. In our Coolest Projects online gallery, these creations are displayed amongst hundreds of others from around the world — it’s the ideal place to get inspired.

Learn something new with our Introduction to Scratch course
Are you curious about coding too? If you would like to start learning so you can better help young people with their creative projects, our online course Introduction to Programming with Scratch is perfect for you. It’s available on-demand, so you can join at any time and receive four weeks’ free access (select the ‘limited access’ option when you register). This course is a fun, inspiring, and colourful starting point if you have never tried coding before.
If you’re a parent looking for more coding activities to share with your kids, you can sign up to our parent-focused newsletter.
We hope you enjoy exploring these resources during Scratch Week.
The post Celebrate Scratch Week with us appeared first on Raspberry Pi.