FortiGate CVE-2025-59718 Exploitation: Incident Response Findings

Post Syndicated from Eric Carey original https://www.rapid7.com/blog/post/ve-fortigate-cve-2025-59718-exploitation-incident-response-ir-findings

Rapid7’s Incident Response (IR) team was engaged to investigate an incident involving exploitation of CVE-2025-59718 against a vulnerable FortiGate appliance. In December 2025, Fortinet disclosed this improper verification of cryptographic signature vulnerability that facilitates an SSO login bypass on affected appliances. After the initial exploitation, the attackers maintained a low-profile posture, systematically compromising additional firewalls before moving to internal network hosts. Ultimately, this grace period allowed responders to contain the threat before further impact could occur within the environment. This blog details exploitation insights, attack progression, and practical detection opportunities for defenders handling their own environments.

Investigative methodology: Tracing the initial access vector in FortiGate appliances

Identifying the Initial Access Vector (IAV) is a cornerstone of any incident response engagement. However, when the source of compromise is not immediately obvious, particularly when edge device exploitation is involved, responders often need to take a broader investigative approach. Rather than starting with a clear point of entry, investigators must analyze the available telemetry, reconstruct attacker activity, and work backwards to determine how access was first obtained.

This process often involves multiple investigative workstreams running in parallel, each designed to answer different questions about the intrusion. As many IR responders and enthusiasts know, the first suspicious event observed during an investigation is rarely the first action taken by the attacker. Instead, it typically represents a point somewhere in the middle of a larger attack chain.

A key step in incident response investigations is reconstructing the attacker timeline. Responders often take an “inside out” approach where they move outward from the initial alert to the full scope of the malicious activity (IAV), correlating multiple data sources to map the unfolding of the event. This process involves examining authentication logs, endpoint telemetry, firewall events, and records of system changes, rather than depending on just one log source. It also typically requires frequent pivoting between artifacts as investigations rarely ever unfold in a linear fashion. By aligning these findings and events chronologically, investigators often identify activity that predates the initial alert.

CVE-2025-59718: Technical analysis and observed attacker behavior

The first activity that drew attention was enumeration and credential discovery within the internal environment. This basic enumeration included gathering information about users, systems, and accessible resources within common user directories. This activity eventually expanded to SMB-based file scraping and network share access, allowing attackers to review files stored across the environment. While this behavior resembled routine administration, the chronological sequence of file scraping and network share access painted a clear picture of an attacker’s initial discovery phase.

Digging deeper into the credential discovery activity, the popular tool Mimikatz was utilized to harvest credentials from various sources within the impacted environment. The attacker’s objective was to obtain valid credentials to an elevated admin account with the goal to blend in.

With credentials in hand and mimicking admin activity to disguise their actions, the attacker was then enabled to move laterally throughout the environment using common administrative tools and access methods. PsExec and Microsoft Remote Desktop (RDP) were two tools utilized for lateral movement while standard web browsers facilitated application access.

Attackers appeared particularly interested in systems that could provide broader access to the environment, including virtualization platforms, domain controllers, and servers supporting backup infrastructure. These systems often represent high-value targets for attackers seeking to escalate privileges, access sensitive data, or disrupt recovery capabilities.

Responders were working simultaneously to contain the attacker while building the narrative to cut them off at the source. With the current understanding of the narrative, the IAV puzzle began to unravel as more information came to light. Strangely, the first authentication into the Windows environment originated from an internal IP address that did not align with the known internal IP address ranges. It turns out, this internal IP address fell within the DHCP lease range of the FortiGate device. At first glance, this could be written off as legitimate VPN activity. However, to create even more questions, it was revealed that the FortiGate SSL VPN was never turned on within this environment. This revelation made the FortiGate device a prime suspect for IAV.

Taking a closer look at the FortiGate device, specifically system logs and configuration data, revealed early indications that the device had been modified to support continued access. The SSL VPN component had been enabled, and multiple configuration changes were identified, including edits to VPN settings, the creation of new firewall policies, and adjustments to configuration parameters. These changes appeared in FortiGate system logs as configuration updates similar to the following:

logid="0100044546" type="event" subtype="system" level="information"
vd="root" logdesc="Attribute configured" user="admins"
ui="GUI(45.32.216[.]250)" action="Edit" cfgpath="vpn.ssl.settings"
msg="Edit vpn.ssl.settings"

⠀

logid="0100044547" type="event" subtype="system" level="information" 
vd="root" logdesc="Object attribute configured" user="admins" 
ui="GUI(45.32.216[.]250)" action="Add" cfgpath="firewall.policy" 
cfgobj="XX" msg="Add firewall.policy <redacted>"

⠀

While these types of changes may seem routine in isolation, it is the combination and timing of these actions that raises concerns from a responder’s perspective. The investigation’s next key clue was identified when the source of these changes was traced back to a newly created account.

Following this thread further, investigators identified that multiple accounts had been created on the device, including SSO administrator, system administrator, and local accounts. Several of these accounts were associated with email domains attributed to Namecheap-hosted infrastructure, including domains such as openmail[.]pro. Notably, some of the newly created SSO administrator accounts were linked to forticloud.com domains as reflected in log entries such as:

Object attribute configured(Add system.sso-forticloud-admin <attacker account>@forticloud.com-1)

⠀

For responders, the creation of multiple new administrative accounts is often a strong indicator of persistence being established. Continuing to work backwards through the timeline, investigators identified that prior to these account creation events, the device’s configuration file was downloaded through the FortiGate UI. From an investigative perspective, configuration exports are highly valuable to attackers because they effectively serve as a blueprint of the environment, exposing network architecture, authentication mechanisms/settings, device relationships, and occasionally, sensitive credentials.

logid="0100032095" type="event" subtype="system" level="warning" 
vd="root" logdesc="Admin performed an action from GUI" user="admin" 
ui="GUI(104.28.227[.]105)" action="download" status="success" 
msg="System config file has been downloaded by user admin via GUI(104.28.227[.]105)"

⠀

The session associated with the configuration download was established from an external IP address flagged as “malicious” by security vendors with a local account already present on the device. All of these new findings from the attacker’s actions can now be utilized as IOCs to scope available FortiGate logs to determine any other leads.

By correlating activity with the known malicious IP addresses, investigators identified the true entry point: administrative SSO logins to the FortiGate appliance with valid accounts. Another important detail was that there was no evidence of brute-forcing activity for these local accounts. The initial access was established approximately two weeks before any subsequent malicious activity, indicating the attacker used this time to secure consistent access to the environment via the FortiGate device.

Actions such as changing configurations, creating accounts, and downloading configurations might seem harmless individually. However, when viewed together, these activities established a clear pattern consistent with the exploitation of CVE-2025-59718 that facilitated authentication bypass.

Once this groundwork was established through persistence mechanisms and discovery, attackers began authenticating into the environment with their newly created accounts via the SSL VPN connections that led us to investigate the FortiGate device in the first place. These sessions effectively transformed the firewall into an ingress point into the internal network, allowing attackers to move beyond the edge device.

This investigation highlights a common reality in incident response where the first indicator of suspicious activity is rarely the beginning of the story. Instead, responders are often working from a point somewhere in the middle, tasked with reconstructing attacker behavior and peeling back layers of activity to uncover how access was first obtained. 

By following the digital breadcrumbs left behind within available evidence sources, investigators were able to trace the intrusion back to its origin. This process emphasizes the importance of working backward through artifacts and telemetry, recognizing that each piece of data may lead to an earlier stage of attacker activity.

Network edge devices such as firewalls and VPN appliances are often the main vectors of initial access. Despite being critical infrastructure in modern environments, full visibility is rarely achieved in comparison to monitored endpoints. These edge devices can provide valuable evidence during investigations and reveal how initial access went unnoticed.

Conclusion: Key takeaways for defenders

The human element of investigation is crucial. Effective investigations demand a mindset of curiosity; on one side the willingness to dig deeper, and on the other, the ability to look at the big picture. At face value these can seem contradictory, but each facilitates a specific role within an incident response investigation.

Curiosity is what drives responders to grapple with the initial evidence, question assumptions, and identify which threads are worth pulling. It allows responders to move beyond surface-level observations and begin forming hypotheses about what may have occurred. The willingness to dive deeper is what turns those hypotheses into answers. Rather than stopping at the first suspicious event, responders must continue pivoting across logs, correlating activity, and tracing actions further back in time. At the same time, maintaining a big-picture perspective is critical. Individual artifacts or events may appear benign in isolation but when viewed chronologically the attacker behavior emerges.

Looking past any specific incident response methodology, visibility into the environment is essential. Even the strongest investigative approach is limited without access to the right telemetry, thus preventing responders from fully reconstructing an intrusion. In particular, as seen within this investigation, visibility into edge device activity can play a crucial role in unraveling IAV. The network edge is a hostile environment yet is frequently less monitored.

As is often the case with externally facing services and devices, the network edge is constantly targeted. Due to the sheer volume of persistent targeting, this environment can prove difficult to monitor for successful malicious intrusions. Implementing centralized syslog monitoring across these edge devices can close these visibility gaps. It can provide a real-time audit trail of connection attempts, configuration changes, and potential exploit signatures that occur before a threat reaches the internal network.

By effectively pulling on each investigative thread and ensuring visibility across both internal systems and edge devices, defenders can uncover compromises that might otherwise remain hidden. Often, the path to the beginning of the intrusion is already present; it simply requires knowing where, and how, to look.

Detection coverage for Rapid7 customers

Rapid7 actively monitors for emerging threats and leverages evidence from incident response engagements to develop new detection capabilities. Detections have been created and implemented by Rapid7 to pinpoint both exploitation attempts and post-exploitation activities related to FortiGate CVE-2025-59718. For InsightIDR and MDR customers, these detections alert on attacker activity consistent with the techniques described in this blog, enabling earlier identification and response before an intrusion can escalate further.

Detections:

  • Potential Exploitation – FortiGate Admin SSO Login and Config Download via External IP

  • Exfiltration – FortiGate Config Downloaded Using GUI via External IP

  • Suspicious Authentication – FortiGate SSO Login via External IP

Mitigation guidance

Please refer to our initial blog from December, 2025.

MITRE ATT&CK Techniques

Tactic

Technique

Details

Initial Access

Exploit Public-Facing Application (T1190)

Exploitation of vulnerability CVE-2025-59718 on FortiGate firewalls.

Persistence

Create Account (T1136)

Creation of local accounts on FortiGate firewalls.

Persistence and Initial Access

Valid Accounts (T1078)

Use of created accounts and compromised accounts for SSL VPN and RDP authentication.

Defense Evasion

Impair Defenses (T1562)

Firewall rules added to allow for attacker access.

Credential Access

OS Credential Dumping (T1003)

Execution of Mimikatz targeting the local system and Windows Registry hives containing credentials.

Discovery

System Network Configuration Discovery (T1016)

Download of FortiGate firewall configuration files containing sensitive networking information.

Discovery

Network Service Scanning (T1046)

Execution of network scanning tools such as Advanced_Port_Scanner to scan internal IP addresses over SMB protocol.

Lateral Movement

Remote Services (T1021)

Use of Remote Desktop Protocol (RDP).

Execution

Service Execution (T1569.002)

Remote execution of the sysinternals tool PsExec to test credentials against an impacted system.

Indicators of compromise (IOCs)

IOC

Description

Advanced_IP_Scanner_2.5.4594.1.exe

Advanced IP Scanner tool utilized by the attacker.

advanced_ip_scanner.exe 

Advanced IP Scanner tool utilized by the attacker.

mimikatz.exe

An open-source post-exploitation tool utilized by the attacker to extract sensitive authentication credentials.

Advanced_port_scanner_2.5.3869.exe

An open-source network utility utilized by the attacker to quickly map active devices and identify open ports.

23.163.8[.]21

Attacker IP address that targeted FortiGate device.

45.32.216[.]250

IP address used by the attacker during FortiGate configuration changes.

45.84.107[.]17

IP address identified in malicious interaction with SSLVPN.

45.80.186[.]84

IP address identified in malicious interaction with SSLVPN.

185.219.157[.]127

IP address identified in malicious interaction with SSLVPN.

185.175.59[.]238

IP address identified in malicious interaction with SSLVPN.

198.98.54[.]209

Attacker IP address that targeted FortiGate device and SSO login.

45.80.184[.]229

Attacker IP address that targeted FortiGate device and SSLVPN.

45.80.184[.]241

Attacker IP address that targeted FortiGate device and SSLVPN.

42.200.230[.]178

Attacker IP address that targeted FortiGate device and SSLVPN.

103.20.235[.]155

IP address identified in malicious authentications to SSO login.

104.28.227[.]105

IP address identified in attacker download of FortiGate configuration file.

Security updates for Wednesday

Post Syndicated from jzb original https://lwn.net/Articles/1066809/

Security updates have been issued by Debian (openssl), Fedora (corosync, goose, kea, pspp, and rauc), Mageia (python-pygments, roundcubemail, and tigervnc), SUSE (bind, gimp, google-cloud-sap-agent, govulncheck-vulndb, ignition, ImageMagick, python, python-PyJWT, and python-pyOpenSSL), and Ubuntu (adsys, juju-core, lxd, python-django, and salt).

From bytecode to bytes: automated magic packet generation

Post Syndicated from Axel Boesenach original https://blog.cloudflare.com/from-bpf-to-packet/

Linux malware often hides in Berkeley Packet Filter (BPF) socket programs, which are small bits of executable logic that can be embedded in the Linux kernel to customize how it processes network traffic. Some of the most persistent threats on the Internet use these filters to remain dormant until they receive a specific “magic” packet. Because these filters can be hundreds of instructions long and involve complex logical jumps, reverse-engineering them by hand is a slow process that creates a bottleneck for security researchers.

To find a better way, we looked at symbolic execution: a method of treating code as a series of constraints, rather than just instructions. By using the Z3 theorem prover, we can work backward from a malicious filter to automatically generate the packet required to trigger it. In this post, we explain how we built a tool to automate this, turning hours of manual assembly analysis into a task that takes just a few seconds.

The complexity ceiling

Before we look at how to deconstruct malicious filters, we need to understand the engine running them. The Berkeley Packet Filter (BPF) is a highly efficient technology that allows the kernel to pull specific packets from the network stack based on a set of bytecode instructions.

While many modern developers are familiar with eBPF (Extended BPF), the powerful evolution used for observability and security, this post focuses on “classic” BPF. Originally designed for tools like tcpdump, classic BPF uses a simple virtual machine with just two registers to evaluate network traffic at high speeds. Because it runs deep within the kernel and can “hide” traffic from user-space tools, it has become a favorite tool for malware authors looking to build stealthy backdoors.

Creating a contextual representation of BPF instructions using LLMs is already reducing the manual overhead for analysts, crafting the network packets that correspond to the validating condition can still be a lot of work, even with the added context provided by LLM’s.

Most of the time this is not a problem if your BPF program has only ~20 instructions, but this can get exponentially more complex and time-consuming when a BPF program consists of over 100 instructions as we’ve observed in some of the samples.

If we deconstruct the problem we can see that it boils down to reading a buffer and checking a constraint, depending on the outcome we either continue our execution path or stop and check the end result.

This kind of problem that has a deterministic outcome can be solved by Z3, a theorem prover that has the means to solve problems with a set of given constraints.

Exhibit A: BPFDoor

BPFDoor is a sophisticated, passive Linux backdoor, primarily used for cyberespionage by China-based threat actors, including Red Menshen (also known as Earth Bluecrow). Active since at least 2021, the malware is designed to maintain a stealthy foothold in compromised networks, targeting telecommunications, education, and government sectors, with a strong emphasis on operations in Asia and the Middle East.

BPFDoor uses BPF to monitor all incoming traffic without requiring a specific network port to be open. 

BPFDoor example instructions

Let’s focus on the sample of which was shared for the research done by Fortinet (82ed617816453eba2d755642e3efebfcbd19705ac626f6bc8ed238f4fc111bb0). If we dissect the BPF instructions and add some annotations, we can write the following:

(000) ldh [0xc]                   ; Read halfword at offset 12 (EtherType)
(001) jeq #0x86dd, jt 2, jf 6     ; 0x86DD (IPv6) -> ins 002 else ins 006
(002) ldb [0x14]                  ; Read byte at offset 20 (Protocol)
(003) jeq #0x11, jt 4, jf 15      ; 0x11 (UDP) -> ins 004 else DROP
(004) ldh [0x38]                  ; Read halfword at offset 56 (Dst Port)
(005) jeq #0x35, jt 14, jf 15     ; 0x35 (DNS) -> ACCEPT else DROP
(006) jeq #0x800, jt 7, jf 15     ; 0x800 (IPv4) -> ins 007 else DROP
(007) ldb [23]                    ; Read byte at offset 23 (Protocol)
(008) jeq #0x11, jt 9, jf 15      ; 0x11 (UDP) -> ins 009 else DROP
(009) ldh [20]                    ; Read halfword at offset 20 (fragment)
(010) jset #0x1fff, jt 15, jf 11  ; fragmented -> DROP else ins 011
(011) ldxb 4*([14]&0xf)           ; Load index (x) register ihl & 0xf
(012) ldh [x + 16]                ; Read halfword at offset x+16 (Dst Port)
(013) jeq #0x35, jt 14, jf 15     ; 0x35 (DNS) -> ACCEPT else DROP
(014) ret #0x40000 (ACCEPT)
(015) ret #0 (DROP)

In the above example we can establish there are two paths that lead to an ACCEPT outcome (step 5 and step 13). We can also clearly observe certain bytes being checked, including their offsets and values. 

Taking these validations, and keeping track of anything that would match the ACCEPT path, we should be able to automatically craft the packets for us.

Calculating the shortest path

To find the shortest path to a packet that validates the conditions presented in the BPF instructions, we need to keep track of paths that are not ending in the unfavorable condition.

We start off by creating a small queue. This queue holds several important data points:

  • The pointer to the next instruction.

  • Our current path of executed instructions + the next instruction.

Whenever we encounter an instruction that is checking a condition, we keep track of the outcome using a boolean and store this in our queue, so we can compare paths on the amount of conditions before the ACCEPT condition is reached and calculate our shortest path. In pseudocode we can express this best as:

paths = []
queue = dequeue([(0, [0])])

while queue:
	pc, path = queue.popleft()

	if pc >= len(instructions):
            continue

instruction = instructions[pc]
	
	if instruction.class == return_instruction:
		if instruction_constant != 0:  # accept
			paths.append(path)
		continue  # drop or accept, stop parsing this instruction

if instruction.class == jump_instruction:
	if instruction.operation == unconditional_jump:
		next_pc = pc + 1 + instruction_constant
		queue.append((next_pc, path + [next_pc]))
		continue

	# Conditional jump, explore both
	pc_true = pc + 1 + instruction.jump_true
	pc_false = pc + 1 + instruction.jump_false
	
	if instruction.jump_true <= instruction.jump_false:
		queue.append((pc_true, path + [pc_true]))
		queue.append((pc_false, path + [pc_false]))
	# else: same as above but reverse order of appending
# else: sequential instruction, append to the queue

If we execute this logic against our earlier BPFDoor example, we will be presented with the shortest path to an accepted packet:

(000) code=0x28 jt=0 jf=0  k=0xc     ; Read halfword at offset 12 (EtherType)
(001) code=0x15 jt=0 jf=4  k=0x86dd  ; IPv6 packet
(002) code=0x30 jt=0 jf=0  k=0x14    ; Read byte at offset 20 (Protocol)
(003) code=0x15 jt=0 jf=11 k=0x11    ; Protocol number 17 (UDP)
(004) code=0x28 jt=0 jf=0  k=0x38    ; Read word at offset 56 (Destination Port)
(005) code=0x15 jt=8 jf=9  k=0x35    ; Destination port 53
(014) code=0x06 jt=0 jf=0  k=0x40000 ; Accept

This is already a helpful automation in automatically solving our BPF constraints when it comes to analyzing BPF instructions and figuring out how the accepted packet for the backdoor would look. But what if we can take it a step further?

What if we could create a small tool that will give us the expected packet back in an automated manner?

Employing Z3 and scapy

One such tool that is perfect to solve problems given a set of constraints is Z3. Developed by Microsoft the tool is labeled as a theorem prover and exposes easy to use functions performing very complex mathematical operations under the hood.

The other tool we will use for crafting our valid magic packets is scapy, a popular Python library for interactive packet manipulation.

Given that we already have a way to figure out the path to an accepted packet, we are left with solving the problem by itself, and then translating this solution to the bytes at their respective offsets in a network packet.

Symbolic execution

A common technique for exploring paths taken in a given program is called symbolic execution. For this technique we are giving input that can be used as variables, including the constraints. By knowing the outcome of a successful path we can orchestrate our tool to find all of these successful paths and display the end result to us in a contextualized format.

For this to work we will need to implement a small machine capable of keeping track of the state of things like constants, registers, and different boolean operators as an outcome of a condition that is being checked.

class BPFPacketCrafter:
    MIN_PKT_SIZE = 64           # Minimum packet size (Ethernet + IP + UDP headers)
    LINK_ETHERNET = "ethernet"  # DLT_EN10MB - starts with Ethernet header
    LINK_RAW = "raw"            # DLT_RAW - starts with IP header directly
    MEM_SLOTS = 16              # Number of scratch memory slots (M[0] to M[15])

    def __init__(self, ins: list[BPFInsn], pkt_size: int = 128, ltype: str = "ethernet"):
        self.instructions = ins
        self.pkt_size = max(self.MIN_PKT_SIZE, pkt_size)
        self.ltype = ltype

        # Symbolic packet bytes
        self.packet = [BitVec(f"pkt_{i}", 8) for i in range(self.pkt_size)]

        # Symbolic registers (32-bit)
        self.A = BitVecVal(0, 32)  # Accumulator
        self.X = BitVecVal(0, 32)  # Index register

        # Scratch memory M[0-15] (32-bit words)
        self.M = [BitVecVal(0, 32) for _ in range(self.MEM_SLOTS)]

With the above code we’ve covered most of the machine for keeping a state during the symbolic execution. There are of course more conditions we need to keep track of, but these are handled during the solving process. To handle an ADD instruction, the machine maps the BPF operation to a Z3 addition:

def _execute_ins(self, insn: BPFInsn):
    cls = insn.cls
    if cls == BPFClass.ALU:
        op = insn.op
        src_val = BitVecVal(insn.k, 32) if insn.src == BPFSrc.K else self.X
        if op == BPFOp.ADD:
            self.A = self.A + src_val

Luckily the BPF instruction set is only a small set of instructions that’s relatively easy to implement — only having two registers to keep track of is definitely a welcome constraint!

The overall working of this symbolic execution can be laid out in the following abstracted overview:

  • Initialize the “x” (index) and “a” (accumulator) registers to their base state.

  • Loop over the instructions from the path that was identified as a successful path;

    • Execute non-jump instructions as-is, keeping track of register states.

    • Determine if a jump instruction is encountered, and check if the branch should be taken.

  • Use the Z3 check() function to check if our condition has been satisfied with the given constraint (ACCEPT).

  • Convert the Z3 bitvector arrays into bytes.

  • Use scapy to construct packets of the converted bytes.

If we look at the constraints build by the Z3 solver we can trace the execution steps taken by Z3 to build the packet bytes:

[If(Concat(pkt_12, pkt_13) == 0x800,
    pkt_14 & 0xF0 == 0x40,
    True),
 If(Concat(pkt_12, pkt_13) == 0x800, pkt_14 & 0x0F >= 5, True),
 If(Concat(pkt_12, pkt_13) == 0x800, pkt_14 & 0x0F == 5, True),
 If(Concat(pkt_12, pkt_13) == 0x86DD,
    pkt_14 & 0xF0 == 0x60,
    True),
 0x86DD == ZeroExt(16, Concat(pkt_12, pkt_13)),
 0x11 == ZeroExt(24, pkt_20),
 0x35 == ZeroExt(16, Concat(pkt_56, pkt_57))]

The first part of the Z3 displayed constraints are the constraints added to ensure we’re building up a valid ethernet IP when dealing with link-layer BPF instructions. The “If” statements apply specific constraints based on which protocol is detected:

  • IPv4 Logic (0x0800):

    • pkt_14 & 240 == 64: Byte 14 is the start of the IP header. The 0xF0 mask isolates the high nibble (the Version field) to check if the version is 4 (0x40).

    • pkt_14 & 15 == 5: 15 (0x0F), isolating the low nibble (IHL – Internet Header Length). This mandates a header length of 5 (20 bytes), which is the standard size without options.

  • IPv6 Logic (0x86dd):

    • pkt_14 & 240 == 0x60: Check if the version field is version 6 (0x60)

We can observe the network packet values when we look at the second part where different values are being checked:

  • 0x86DD: Packet condition for IPv6 header.

  • 0x11: UDP protocol number.

  • 0x35: The destination port (53).

Next to the expected values we can see the byte offset of where it should exist in a given packet (e.g. pkt_12, pkt_13).

Crafting packets

Now that we’ve established which bytes should exist at specific offsets we can convert it into an actual network packet using scapy. If we generate a new packet from the bytes of our previous Z3 constraints we can clearly see what our packet would look like, and store this for further processing:

###[ Ethernet ]###
  dst       = 00:00:00:00:00:00
  src       = 00:00:00:00:00:00
  type      = IPv6                 <-- IPv6 Packet
###[ IPv6 ]###
     version   = 6
     tc        = 0
     fl        = 0
     plen      = 0
     nh        = UDP               <-- UDP Protocol
     hlim      = 0
     src       = ::
     dst       = ::
###[ UDP ]###
        sport     = 0
        dport     = domain         <-- Port 53
        len       = 0
        chksum    = 0x0

These newly crafted packets can in turn be used for further research or identifying the presence of these implants by scanning for these over the network. 

Try it yourself

Understanding what a specific BPF set of instructions is doing can be cumbersome and time-consuming work. The example used is only a total of sixteen instructions, but we’ve encountered samples that were over 200 instructions that would’ve taken at least a day to understand. By using the Z3 solver, we can now reduce this time to just seconds, and not only display the path to an accepted packet, but also the packet skeleton for this as well.

We have open-sourced the filterforge tool to help the community automate the deconstruction of BPF-based implants. You can find the source code, along with usage examples, on our GitHub repository.

By publishing this research and sharing our tool for reducing analysts’ time spent figuring out the BPF instructions, we hope to spark further research by others to expand on this form of automation.

Python Supply-Chain Compromise

Post Syndicated from Bruce Schneier original https://www.schneier.com/blog/archives/2026/04/python-supply-chain-compromise.html

This is news:

A malicious supply chain compromise has been identified in the Python Package Index package litellm version 1.82.8. The published wheel contains a malicious .pth file (litellm_init.pth, 34,628 bytes) which is automatically executed by the Python interpreter on every startup, without requiring any explicit import of the litellm module.

There are a lot of really boring things we need to do to help secure all of these critical libraries: SBOMs, SLSA, SigStore. But we have to do them.

Как да разбираме воскръсналите (по Великден) словеса

Post Syndicated from original https://www.toest.bg/kak-da-razbirame-voskrusnalite-po-velikden-slovesa/

Как да разбираме воскръсналите (по Великден) словеса

Почти две хилядолетия ни делят от възкръсването на Божия Син. Това събитие е най-големият празник за православния свят (за католиците и протестантите е Рождество Христово) и дори хората, които не са толкова ревностни следовници на вярата, почитат традицията и ритуалите – най-малкото като боядисват яйца и правят (по-често купуват) козунаци.

Празниците, особено религиозните, идват със своя езиков антураж – думи и изрази с онази специфична характеристика, която лингвистите определят като архаичност, но тя е нещо повече. За кратко в съзнанието възкръсват формули, изгубили отчасти или напълно връзка със съвременната реч, с размито значение, граматически странности, особен привкус… Може би точно заради това са някак магични, а какво е празникът без малко магия?

Воистину воскресе!

Емблематични за Възкресение Христово са поздравът Христос воскресе! и отговорът Воистину воскресе! Вече в доста сайтове може да се намери информация за правилните варианти, макар че понякога в обясненията има известна доза съчинителство.

Правилността тук е условна, защото се определя спрямо правописа и граматиката на църковнославянския език, от който са наследени тези застинали във времето фрази. Като знаем, че в основата на църковнославянския е старобългарският¹, можем да научим малко повече и за далечното минало на нашия език. Преди хилядолетие правописът е следвал доста точно звученето на думите и днешните представки въз- и из- например са се пишели така, както са се изговаряли: въздрьжаниѥ, но въскрьсениѥ, изливати, но искоушати. Това е валидно и за църковнославянския език, но в представката въз-/въс- настъпва една фонетична промяна: гласната ъ преминава в о. Вариантите възкресе и возкресе представляват опити да се осъвремени и всъщност да се осмисли старинното воскресе – опити, които според мен трябва да срещат повече разбиране, отколкото критика.

Много спорове се вихрят около наречието воистину.

Според речниците на църковнославянския език думата е тази, а не воистина. Тя стъпва на старобългарското словосъчетание въ истинѫ, в което думата истина е във винителен падеж. В църковнославянския голямата носова гласна преминава в у и закономерно наречието придобива облика воистину², а воистина отново е опит за осъвременяване, както по-горе, но също и резултат от уподобяване с наистина.

По-интересно тук е значението на думата, която от някои се тълкува като ‘в името на истината, заради истината’. Такава семантика не откривам нито в старобългарските, нито в църковнославянските речници, макар че в тях са регистрирани разнообразни значения, например³: ‘справедливо, с право’ (Зная, Господи, че Твоите съдби са праведни, и по справедливост Ти ме наказа [Пс 118:17]); ‘истински, от сърце, от цялата душа’ (Няма да изостави Господ онези, които го обичат истински⁴; ‘право, вярно’ (Книжникът Му рече: добре, Учителю! Ти право каза, че Бог е един, и няма друг, освен Него [Марк 12:32]).

Едно от значенията на въ истинѫ/воистину е ‘наистина, действително, несъмнено’ и е засвидетелствано с доста употреби дори само в рамките на евангелските текстове. Ето един пример: А стотникът, като видя станалото, прослави Бога и рече: наистина, Тоя Човек е бил праведник [Лук 23:47]. Надявам се, вече е несъмнено, че в ответния поздрав Воистину воскресе! наречието следва да се разбира точно така.

Великден, Велика неделя, Разпети петък

Вместо да наричаме празника с църковното Възкресение Христово, употребяваме по-краткото название Великден. Оказва се, че то също е стародавно – още в Супрасълския сборник (Х век) е засвидетелствано с тази конкретна употреба. По същия начин наричат празника беларусите – Вяликьдзень, и украинците – Великдень, както и (неизненадващо) македонците – Велигден. В западнославянските езици пък велик е не денят, а нощта на възкресението.

Седмицата преди това е известна като Страстна, а също и като Велика неделя. Многократно е обяснявано и сигурно се знае от повечето образовани хора, че тук става въпрос не за горещи чувства и пламенни желания, а за страданията Христови по пътя му към кръстната смърт. Действително

старобългарската дума страсть много по-често се употребява с това значение – ‘мъка, страдание’, също и ‘мъченически подвиг’.

От нея има доста производни с оглед на ограничения брой старобългарски лексеми, за които знаем със сигурност (около 10 000), включително две сложни думи: страстоносьць и страстотрьпьць. И без да давам линк, ще се досетите, че те означават ‘мъченик, страдалец, човек, който понася страдания (в името на християнската вяра)’.

Думата страсть се е употребявала също в съвременния смисъл, само че е имала негативна конотация – така са се наричали най-вече плътските влечения, греховните телесни желания, които са изгаряли отвътре човека и е трябвало да бъдат обуздавани и побеждавани със силата на вярата.

Словосъчетанието Велика неделя като че ли се среща по-рядко от Страстната седмица, но е любопитно, защото в него личи остарялото вече значение на думата неделя. Още една лексема, която в миналото е била натоварена с различни значения – ‘седмица’ и ‘неделя, последният ден от седмицата’. Според Е. Френкел пренасянето на семантиката от названието на ден от седмицата върху цялата седмица е станало по модела на гръцкото τὰ σάββατα, тъй като съботният ден е бил символ на седмицата⁵.

Всеки ден от Страстната седмица съдържа определението велик: Велики понеделник, Велики вторник и т.н. Последният ден обикновено не се нарича Велика неделя, тъй като съвпада с Възкресение Христово. Петъкът обаче със сигурност прави изключение. Той често се определя като най-тъжния за християните ден, защото тогава Исус Христос изкупва с живота си греховете на човечеството. Разпети петък буквално означава „разпънатият петък“, а малко по-описателно – „петъкът, в който Христос е бил разпънат“. Първата дума в словосъчетанието представлява някогашното минало страдателно причастие распѧтыи, образувано от глагола распѧти ‘разпъна’. По-наблюдателните вече са забелязали, че за разлика от воскресе, тук не се съобразяваме с обеззвучаването на з в представката на думата и следваме съвременния правопис – разпети.

Още една интересна особеност има в това причастие. То е съхранило някогашната сложна (дълга) форма на прилагателните имена – распѧтыи. За сравнение, простата (кратката) е била распѧтъ (разпет). Тъй като вече има обяснение за разликата между двете форми, ще добавя само, че сложната се пази в членуваните прилагателни, причастия и числителни редни имена за мъжки род, единствено число. Пред определителния член има гласна и, която сигнализира именно за тези дълги форми: новият, вървящият, донесеният, третият. Ако бяха се запазили само кратките форми, сега вероятно щяхме да казваме и пишем новът, вървящът, донесенът, третът.

Разгледахме само няколко фрази и словосъчетания, характерни за Великден, а разяснихме около една четвърт от особеностите на старобългарския (и по-малко на църковнославянския) език. При това дори не засегнахме образуването на минало свършено време (воскресе) и на миналото страдателно причастие. Хиперболизирам, разбира се, но е факт, че в толкова ограничен брой думи се съдържа езикова история, която малко познаваме и чието познаване изобщо намираме за ценно.

По време на празниците – особено тези с вековни традиции – влизаме в по-различен речеви режим. Активизират се архаични езикови пластове, и то не само лексикални. До голяма степен фразите и думите, които употребяваме, са се превърнали във формули, използвани като езиков код. С него даваме сигнал, че временно сме в други, не-делнични измерения. Добре е обаче да имаме и ключ за този код, защото на човека поначало е свойствено да разгадава тайнствата, пък били те и празнични.

1 „Църковнославянският език е резултат от развитието на руската редакция на старобългарския език в периода XI–XVI в., в което намират отражение белези както на българския, така и на руския книжовен език през Средновековието.“ Кирило-Методиевска енциклопедия. Т. 4. Гл. ред. Л. Грашева. София: Академично издателство „М. Дринов“, 2003, с. 492.

2 В речниците на църковнославянския език наречието е с двойно н и в края има една особена буква, с която се бележи звукът у: воистиннꙋ. Ако се придържаме строго към църковнославянския правопис, би трябвало да пишем воистинну.

3 Примерите са взети от Старобългарски речник. Отг. ред. Д. Иванова-Мирчева. Т. 1. София: Васил Траянов, 1999, който е достъпен онлайн, и А. Бончев. Речник на църковнославянски език. Т. 1. София, 2002, с. 97. Представени са на съвременен български език според Синодалния превод на Библията. Съответствието на въ истинѫ/воистину е в получерен шрифт.

4 Примерът е от Супрасълския сборник, а преводът е мой.

5 Цит. по Български етимологичен речник. Т. 4. Ред. В. Георгиев, И. Дуриданов. София: Академично издателство „М. Дринов“, 2002, с. 598

Езикът може да е вкусен и извън блюдото – онзи, българският език, на който говорим от малки и на който около 24 май се кълнем в обич. А той в същността си е средство за общуване и за да ни служи добре, непрекъснато се променя. Да го погледнем в неговата динамика и да се опитаме да разберем какво става и защо, кои са движещите механизми и как те са свързани с обществените процеси. И тъй като задачата не е лека, ще го правим постепенно – на порции.

Staying Secure: An Inside Look at Zabbix Security Advisories

Post Syndicated from Michael Kammer original https://blog.zabbix.com/staying-secure-an-inside-look-at-zabbix-security-advisories/32831/

Security has always been a core priority for us at Zabbix. As part of our ongoing commitment to delivering a reliable and secure monitoring platform, we regularly publish security advisories that reflect both newly discovered vulnerabilities and the improvements we’ve made to address them.

These advisories are not just a list of issues – they are a direct result of continuous internal efforts to analyze, test, and strengthen every aspect of our product.

More than just fixes

Every vulnerability we disclose represents a deeper process behind the scenes. It involves:

  • Careful investigation and validation
  • Improvements to internal tooling and detection methods
  • Reevaluation of development and testing processes
  • Retesting to ensure robustness and prevent regressions

For us, security is not a one-time fix – it’s an ongoing cycle of improvement.

Decoding severity scores

We understand that some of the published severity scores may appear alarming at first glance. It’s important to note that these scores are based on worst-case scenario evaluations. In real-world deployments, the actual risk often depends on system configuration, network exposure, access controls, usage patterns, and more.

For many typical Zabbix installations, the effective risk level may be significantly lower than the maximum theoretical score suggests.

Stay updated – it matters

Keeping your Zabbix installation up to date is one of the most effective ways to maintain a secure environment.
Each update includes not only bug fixes, but also: security enhancements, hardening improvements, and stability and performance updates. By applying updates regularly, you make sure that your systems benefit from the latest protections. In short, staying up to date is a shared responsibility and the best defense.

Open communication

We are aware that security advisories can sometimes lead to external reports that frame vulnerabilities without full context. We want to be clear that:

  • Publishing advisories is a sign of maturity and transparency, not weakness
  • Proactively identifying and fixing issues is a core strength
  • Our goal is not to avoid disclosure, but to handle it responsibly and openly

Security is not about the absence of vulnerabilities. It’s about how quickly and effectively they are identified, addressed, and communicated.

Going forward

We believe that transparency builds trust. If you have any questions about Zabbix security advisories or best practices, we encourage you to reach out to us. Our team is always ready to clarify, assist, and provide guidance. We remain fully committed to improving Zabbix security at every level – from code to processes to communication.

Your trust is important to us, and we will continue to invest in making Zabbix a secure and dependable platform for your infrastructure.

The post Staying Secure: An Inside Look at Zabbix Security Advisories appeared first on Zabbix Blog.

Introducing the UX Research Working Group

Post Syndicated from Amy Super original https://prometheus.io/blog/2026/04/08/introducing-ux-research-working-group/

Prometheus has always prioritized solving complex technical challenges to deliver a reliable, performant open-source monitoring system. Over time, however, users have expressed a variety of experience-related pain points. Those pain points range from onboarding and configuration to documentation, mental models, and interoperability across the ecosystem.

At PromCon 2025, a user research study was presented that highlighted several of these issues. Although the central area of investigation involved Prometheus and OpenTelemetry workflows, the broader takeaway was clear: Prometheus would benefit from a dedicated, ongoing effort to understand user needs and improve the overall user experience.

Recognizing this, the Prometheus team established a Working Group focused on improving user experience through design and user research. This group is meant to support all areas of Prometheus by bringing structured research, user insights, and usability perspectives into the community’s development and decision-making processes.

How we can help Prometheus maintainers

Building something where the user needs are unclear? Maybe you’re looking at two competing solutions and you’d like to understand the user tradeoffs alongside the technical ones.

That’s where we can be of help.

The UX Working Group will partner with you to conduct user research or provide feedback on your plans for user outreach. That could include:

  • User research reports and summaries
  • User journeys, personas, wireframes, prototypes, and other UX artifacts
  • Recommendations for improving usability, onboarding, interoperability, and documentation
  • Prioritized lists of user pain points
  • Suggestions for community discussions or decision-making topics

To get started, tell us what you’re trying to do, and we’ll work with you to determine what type and scope of research is most appropriate.

How we can help Prometheus end users

We want to hear from you! Let us know if you’re interested in participating in a research study and we’ll contact you when we’re working on one that’s a good fit. Having an issue with the Prometheus user experience? We can help you open an issue and direct it to the appropriate community members.

Interested in helping?

New contributors to the working group are always welcome! Get in touch and let us know what you’d like to work on.

Where to find us

Drop us a message in Slack, join a meeting, or raise an issue in GitHub.

Cloudflare targets 2029 for full post-quantum security

Post Syndicated from Bas Westerbaan original https://blog.cloudflare.com/post-quantum-roadmap/

Cloudflare is accelerating its post-quantum roadmap. We now target 2029 to be fully post-quantum (PQ) secure including, crucially, post-quantum authentication.

At Cloudflare, we believe in making the Internet private and secure by default. We started by offering free universal SSL certificates in 2014, began preparing our post-quantum migration in 2019, and enabled post-quantum encryption for all websites and APIs in 2022, mitigating harvest-now/decrypt-later attacks. While we’re excited by the fact that over 65% of human traffic to Cloudflare is post-quantum encrypted, our work is not done until authentication is also upgraded. Credible new research and rapid industry developments suggest that the deadline to migrate is much sooner than expected. This is a challenge that any organization must treat with urgency, which is why we’re expediting our own internal Q-Day readiness timeline.

What happened? Last week, Google announced they had drastically improved upon the quantum algorithm to break elliptic curve cryptography, which is widely used to secure the Internet. They did not reveal the algorithm, but instead provided a zero-knowledge proof that they have one.

This is not even the biggest breakthrough. That same day, Oratomic published a resource estimate for breaking RSA-2048 and P-256 on a neutral atom computer. For P-256, it only requires a shockingly low 10,000 qubits. Google’s motivation behind their recent announcement to also pursue neutral atoms alongside superconducting quantum computers becomes clear now. Although Oratomic explains their basic approach, they still leave out crucial details on purpose.

These independent advances prompted Google to accelerate their post-quantum migration timeline to 2029. What’s more, in their announcement and other talks, Google has placed a priority on quantum-secure authentication over mitigating harvest-now/decrypt-later attacks. As we discuss next, this priority indicates that Google is concerned about Q-Day coming as soon as 2030. Following the announcements, IBM Quantum Safe’s CTO is more pessimistic and can’t rule out quantum “moonshot attacks” on high value targets as early as 2029.

The quantum threat is well known: Q-Day is the day that sufficiently capable quantum computers can break essential cryptography used to protect data and access across systems today. Cryptographically relevant quantum computers (CRQCs) don’t exist yet, but many labs across the world are pursuing different approaches to building one. Until recently, progress on CRQCs has been mostly public, but there is no reason to expect that will continue. Indeed, there is ample reason to expect that progress will leave the public eye. As quantum computer scientist Scott Aaronson warned at the end of 2025:

[A]t some point, the people doing detailed estimates of how many physical qubits and gates it’ll take to break actually deployed cryptosystems using Shor’s algorithm are going to stop publishing those estimates, if for no other reason than the risk of giving too much information to adversaries. Indeed, for all we know, that point may have been passed already.

That point has now passed indeed.

Why now: independent progress on three fronts

We’d like to spend some words on why it’s difficult to predict progress on quantum computing. Sudden “quantum” leaps in understanding, like the one we witnessed last week, can occur even if everything happens in the public eye. Simply put, breaking cryptography with a quantum computer requires engineering on three independent fronts: quantum hardware, error correction, and quantum software. Progress on each front compounds progress on the others.

Hardware. There are many different competing approaches. We mentioned neutral atoms and superconducting qubits, but there are also ion-trap, photonics, and moonshots like topological qubits. Complementary approaches can even be combined. Most of these approaches are pursued by several labs around the world. They all have their distinct engineering challenges and problems to solve before they can scale up. A few years ago, all of them had a long list of open challenges, and it was unclear if any of them would scale. Today most of them have made good progress. None have been demonstrated to scale yet: if they had, we wouldn’t have a couple of years left. But these approaches are much closer now, especially neutral atoms. To ignore this progress, you’d have to believe that every single approach will hit a wall.

Error correction. All quantum computers are noisy and require error-correcting codes to perform meaningful computation. This adds quite a bit of overhead, though how much depends on the architecture. More noise requires more error correction, but more interestingly, improved qubit connectivity allows for much more efficient codes. For a sense of scale: typically around a thousand physical qubits are required for one logical qubit for the superconducting quantum computers that are noisy and only have neighbor qubit connectivity. We knew “reconfigurable qubits” such as those of neutral-atom machines allow for an order of magnitude better error-correcting codes. Surprisingly, Oratomic showed the advantage is even larger: only about 3-4 physical neutral atom qubits are required per logical qubit.

Software. Lastly, the quantum algorithms to crack cryptography can be improved. This is Google’s breakthrough: they massively sped up the algorithm to crack P-256. On top of that, Oratomic showed further architecture specific optimizations for reconfigurable qubits.

The picture comes together: in 2025 neutral atoms turned out to be more scalable than expected, and now Oratomic figured out how to do much better error-correcting codes with such highly connected qubits. On top of that, breaking P-256 requires much less work. The result is that Q-Day has been pulled forward significantly from typical 2035+ timelines, with neutral atoms in the lead, and other approaches not far behind.

In previous blog posts we’ve discussed how different quantum computers compare on physical qubit count and fidelity, compared to the conservative goalpost of cracking RSA-2048 on a superconducting qubit architecture. This analysis gives us a rough idea of how much time we have, and it’s certainly better than tracking quantum factoring records, but it misses architecture-specific optimization and software improvements. What to watch for now is when the final missing capabilities for each architecture are achieved.

It’s time to focus on authentication

Historically, the industry’s focus on post-quantum cryptography (PQC) has been based largely on PQ encryption, which stops harvest-now/decrypt-later (HNDL) attacks. In an HNDL attack, an adversary harvests sensitive encrypted network traffic today and stores it until a future date when it can use a powerful quantum computer to decrypt the data. HNDL attacks are the primary threat when Q-Day is far away. That’s why our focus, thus far, has been on mitigating this risk, by adopting post-quantum encryption by default in our products since 2022. Today, as we mentioned above, most Cloudflare products are secure against HNDL attacks, and we’re working to upgrade the rest as we speak. 

The other category of attacks is against authentication: adversaries armed with functioning quantum computers impersonate servers or forge access credentials. If Q-Day is far off, authentication is not urgent: deploying PQ certificates and signatures does not add any value, only effort.

An imminent Q-Day flips the script: data leaks are severe, but broken authentication is catastrophic. Any overlooked quantum-vulnerable remote-login key is an access point for an attacker to do as they wish, whether that’s to extort, take down, or snoop on your system. Any automatic software-update mechanism becomes a remote code execution vector. An active quantum attacker has it easy — they only need to find one trusted quantum-vulnerable key to get in.

When experts in the field of building quantum computers start patching authentication systems, we should all listen. The question is no longer “when will our encrypted data be at risk?” but “how long before an attacker walks in the front door with a quantum-forged key?”

Prioritizing the most vulnerable systems

If quantum computers arrive in the next few years, they will be scarce and expensive. Attackers will prioritize high-value targets, like long-lived keys that unlock substantial assets or persistent access such as root certificates, API auth keys and code-signing certs. If an attacker is able to compromise one such key, they retain indefinite access until they are discovered or that key is revoked.

This suggests long-lived keys should be prioritized. That is certainly true if the quantum attack of a single key is expensive and slow, which is to be expected for the first generation of neutral atom quantum computers. That’s not the case for scalable superconducting quantum computers and later generations of neutral atom quantum computers, which could well crack keys much faster. Such fast CRQCs flip the script again, and an adversary with one might focus purely on HNDL attacks so that their attacks remain undetected. Google’s Sophie Schmieg compares this scenario to Enigma’s cryptanalysis that changed the direction of World War II.

Adding support for PQ cryptography is not enough. Systems must disable support for quantum-vulnerable cryptography to be secure against downgrade attacks. In larger, especially federated systems such as the web, this is not feasible because not every client (browser) will support post-quantum certificates, and servers need to keep supporting these legacy clients. However, downgrade protection for HTTPS is still achievable using “PQ HSTS” and/or certificate transparency.

Disabling quantum-vulnerable cryptography is not the last step: once done, all secrets such as passwords and access tokens previously exposed in the quantum-vulnerable system need to be rotated. Unlike post-quantum encryption, which takes one big push, migrating to post-quantum authentication has a long dependency chain — not to mention third-party validation and fraud monitoring. This will take years, not months.

It’s natural for organizations reading this to rush out and think about which internal systems they need to upgrade. But that’s not the end of the story. Q-day threatens all systems. As such, it’s important to understand the impact of a potential Q-day on third-party dependencies, both direct and indirect. Not just the third-parties you speak cryptography to, but also any third parties that are critical business dependencies like financial services and utilities.

With Q-day approaching on a shorter timeline, post-quantum authentication is top priority. Long-term keys should be upgraded first. Deep dependency chains and the fact that everyone has third-party vendors means this effort will take on the order of years, not months. Upgrading to post-quantum cryptography is not enough: to prevent downgrades, quantum-vulnerable cryptography must also be turned off.

Cloudflare’s roadmap to full post-quantum security

Today, Cloudflare provides post-quantum encryption for the majority of our products mitigating harvest-now/decrypt-later. This is the product of work we started over a decade ago to protect our customers and the Internet at large.

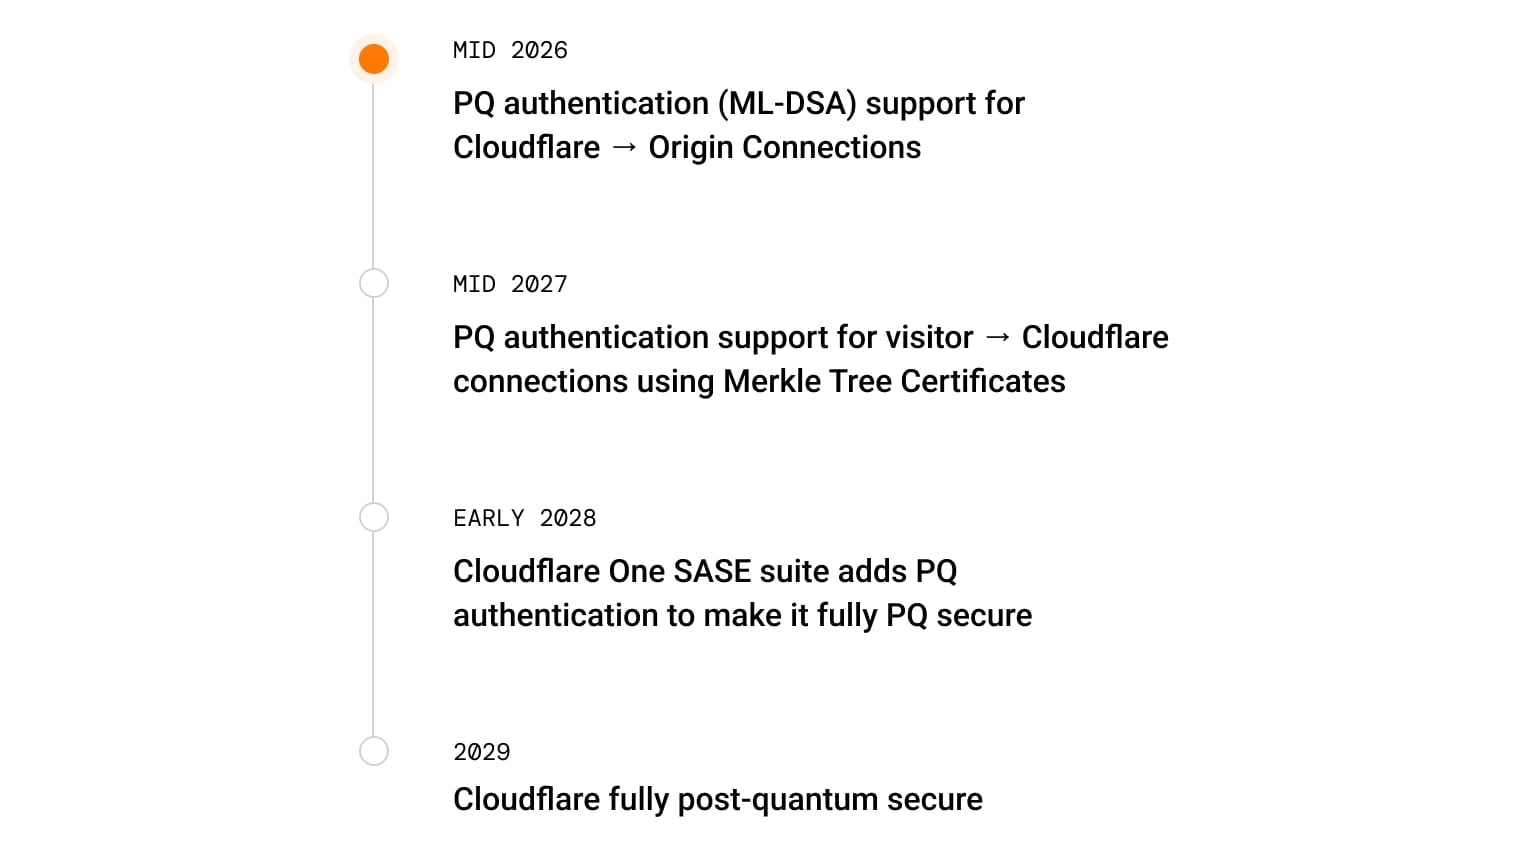
We are targeting full post-quantum security including authentication for our entire product suite by 2029. Here we’re sharing some intermediate milestones we’ve set, subject to change as our understanding of the risk and deployment challenges evolve.


What we recommend

For businesses, we recommend making post-quantum support a requirement for any procurement. Common best practices, like keeping software updated and automating certificate issuance, are meaningful and will get you pretty far. We recommend assessing critical vendors early for what their failure to take action would mean for your business.

For regulatory agencies and governments: leading by setting early timelines has been crucial for industry-wide progress so far. We are now in a pivotal position where fragmentation in standards and effort between and within jurisdictions could put progress at risk. We recommend that governments assign and empower a lead agency to coordinate the migration on a clear timeline, stay security-focused, and promote the use of existing international standards. Governments need not panic, but can lead migration with confidence.

For Cloudflare customers, with respect to our services, you do not need to take any mitigating action. We are following the latest advancements in quantum computing closely and taking proactive steps to protect your data. As we have done in the past, we will turn on post-quantum security by default, with no switches to flip. What we don’t control is the other side: browsers, applications, and origins need to upgrade. Corporate network traffic on Cloudflare need not worry: Cloudflare One offers end-to-end protection when tunnelling traffic through our post-quantum encrypted infrastructure.

Privacy and security are table stakes for the Internet. That’s why every post-quantum upgrade we build will continue to be available to all customers, on every plan, at no additional cost. Making post-quantum security the default is the only way to protect the Internet at scale.

Free TLS helped encrypt the web. Free post-quantum cryptography will help secure it for what comes next.

Launching S3 Files, making S3 buckets accessible as file systems

Post Syndicated from Sébastien Stormacq original https://aws.amazon.com/blogs/aws/launching-s3-files-making-s3-buckets-accessible-as-file-systems/

I’m excited to announce Amazon S3 Files, a new file system that seamlessly connects any AWS compute resource with Amazon Simple Storage Service (Amazon S3).

More than a decade ago, as an AWS trainer, I spent countless hours explaining the fundamental differences between object storage and file systems. My favorite analogy was comparing S3 objects to books in a library (you can’t edit a page, you need to replace the whole book) versus files on your computer that you can modify page by page. I drew diagrams, created metaphors, and helped customers understand why they needed different storage types for different workloads. Well, today that distinction becomes a bit more flexible.

With S3 Files, Amazon S3 is the first and only cloud object store that offers fully-featured, high-performance file system access to your data. It makes your buckets accessible as file systems. This means changes to data on the file system are automatically reflected in the S3 bucket and you have fine-grained control over synchronization. S3 Files can be attached to multiple compute resources enabling data sharing across clusters without duplication.

Until now, you had to choose between Amazon S3 cost, durability, and the services that can natively consume data from it or a file system’s interactive capabilities. S3 Files eliminates that tradeoff. S3 becomes the central hub for all your organization’s data. It’s accessible directly from any AWS compute instance, container, or function, whether you’re running production applications, training ML models, or building agentic AI systems.

You can access any general purpose bucket as a native file system on your Amazon Elastic Compute Cloud (Amazon EC2) instances, containers running on Amazon Elastic Container Service (Amazon ECS) or Amazon Elastic Kubernetes Service (Amazon EKS), or AWS Lambda functions. The file system presents S3 objects as files and directories, supporting all Network File System (NFS) v4.1+ operations like creating, reading, updating, and deleting files.

As you work with specific files and directories through the file system, associated file metadata and contents are placed onto the file system’s high-performance storage. By default, files that benefit from low-latency access are stored and served from the high performance storage. For files not stored on high performance storage such as those needing large sequential reads, S3 Files automatically serves those files directly from Amazon S3 to maximize throughput. For byte-range reads, only the requested bytes are transferred, minimizing data movement and costs.

The system also supports intelligent pre-fetching to anticipate your data access needs. You also have fine-grained control over what gets stored on the file system’s high performance storage. You can decide whether to load full file data or metadata only, which means you can optimize for your specific access patterns.

Under the hood, S3 Files uses Amazon Elastic File System (Amazon EFS) and delivers ~1ms latencies for active data. The file system supports concurrent access from multiple compute resources with NFS close-to-open consistency, making it ideal for interactive, shared workloads that mutate data, from agentic AI agents collaborating through file-based tools to ML training pipelines processing datasets.

Let me show you how to get started.
Creating my first Amazon S3 file system, mounting, and using it from an EC2 instance is straightforward.

I have an EC2 instance and a general purpose bucket. In this demo, I configure an S3 file system and access the bucket from an EC2 instance, using regular file system commands.

For this demo, I use the AWS Management Console. You can also use the AWS Command Line Interface (AWS CLI) or infrastructure as code (IaC).

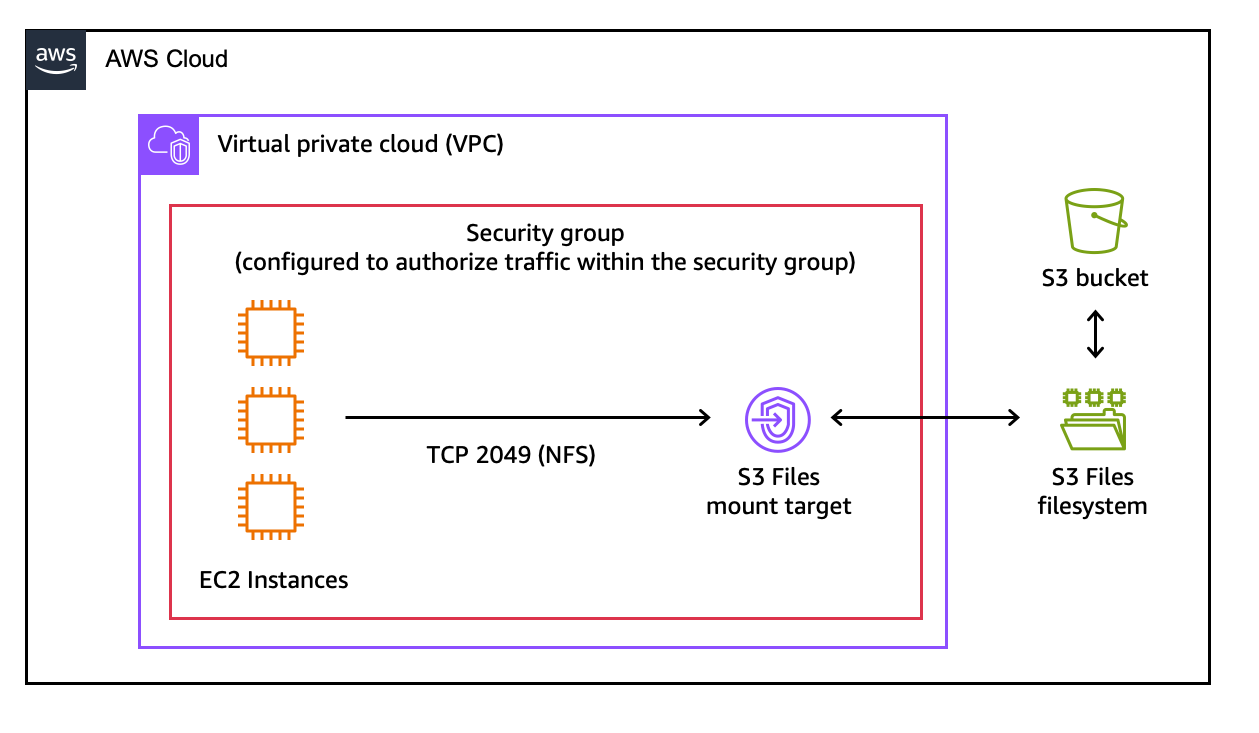
Here is the architecture diagram for this demo.

S3 Files demo architectureStep 1: Create an S3 file system.

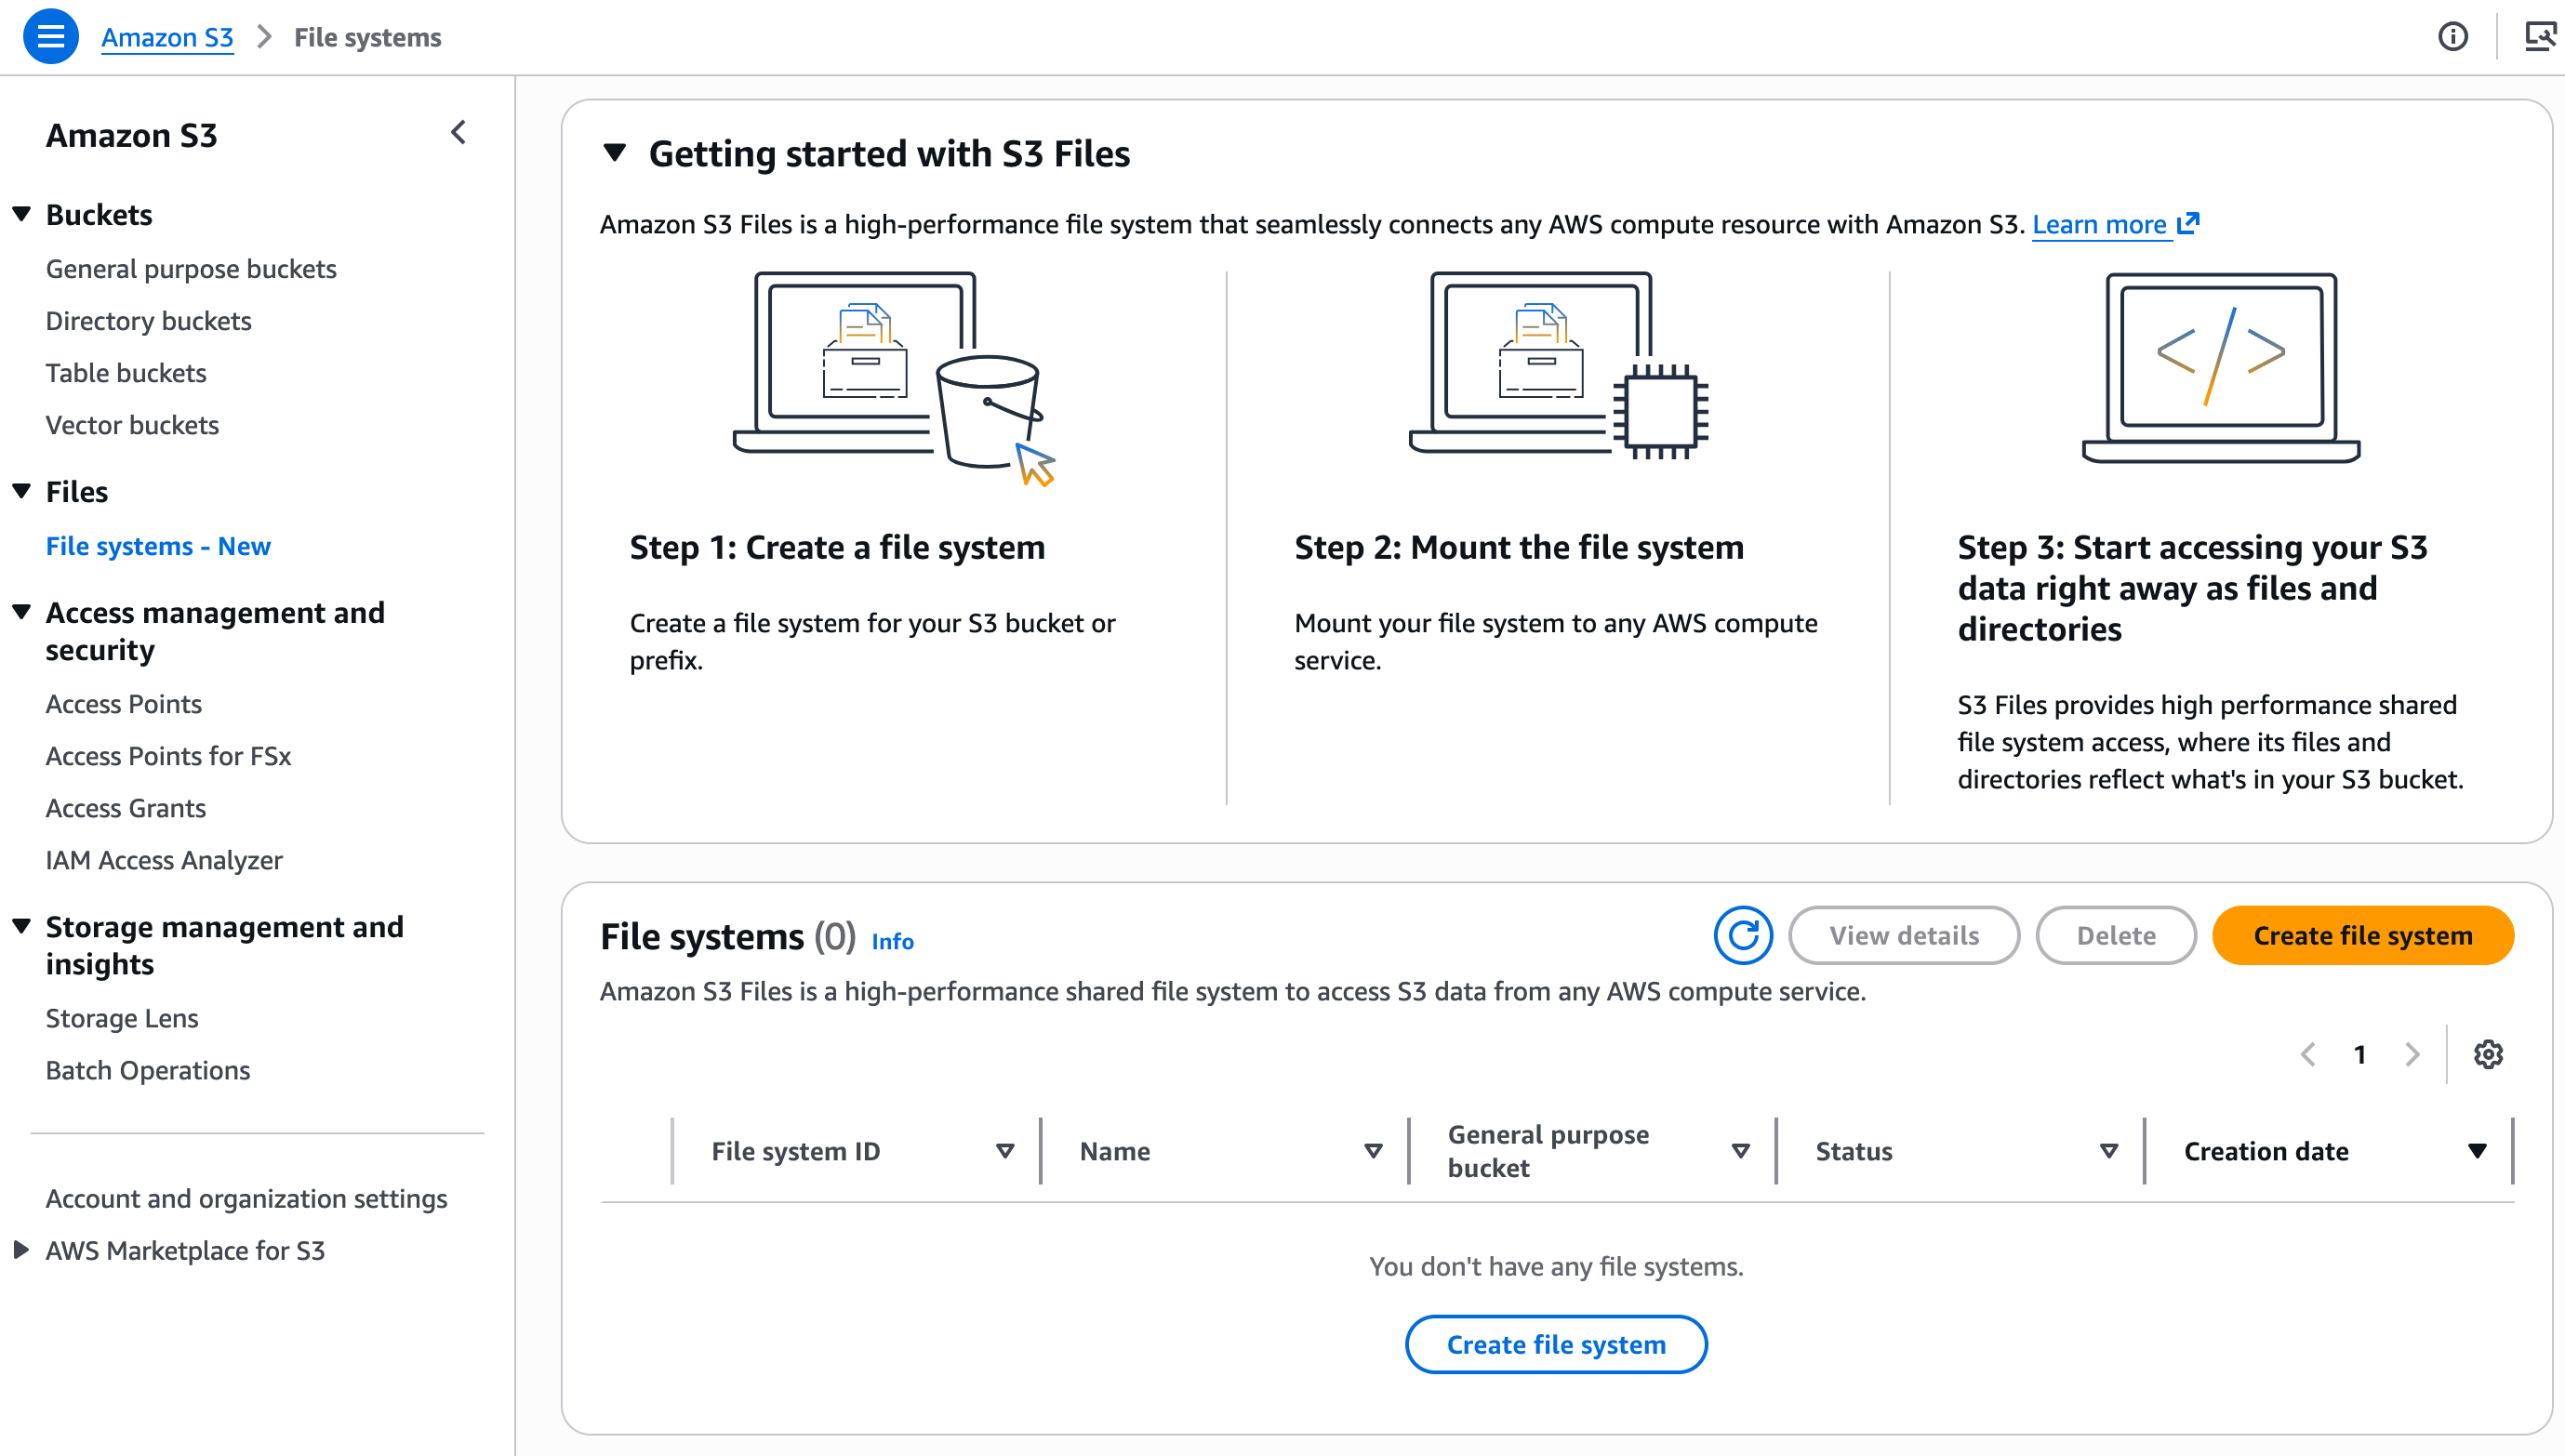
On the Amazon S3 section of the console, I choose File systems and then Create file system.

S3 Files create file system

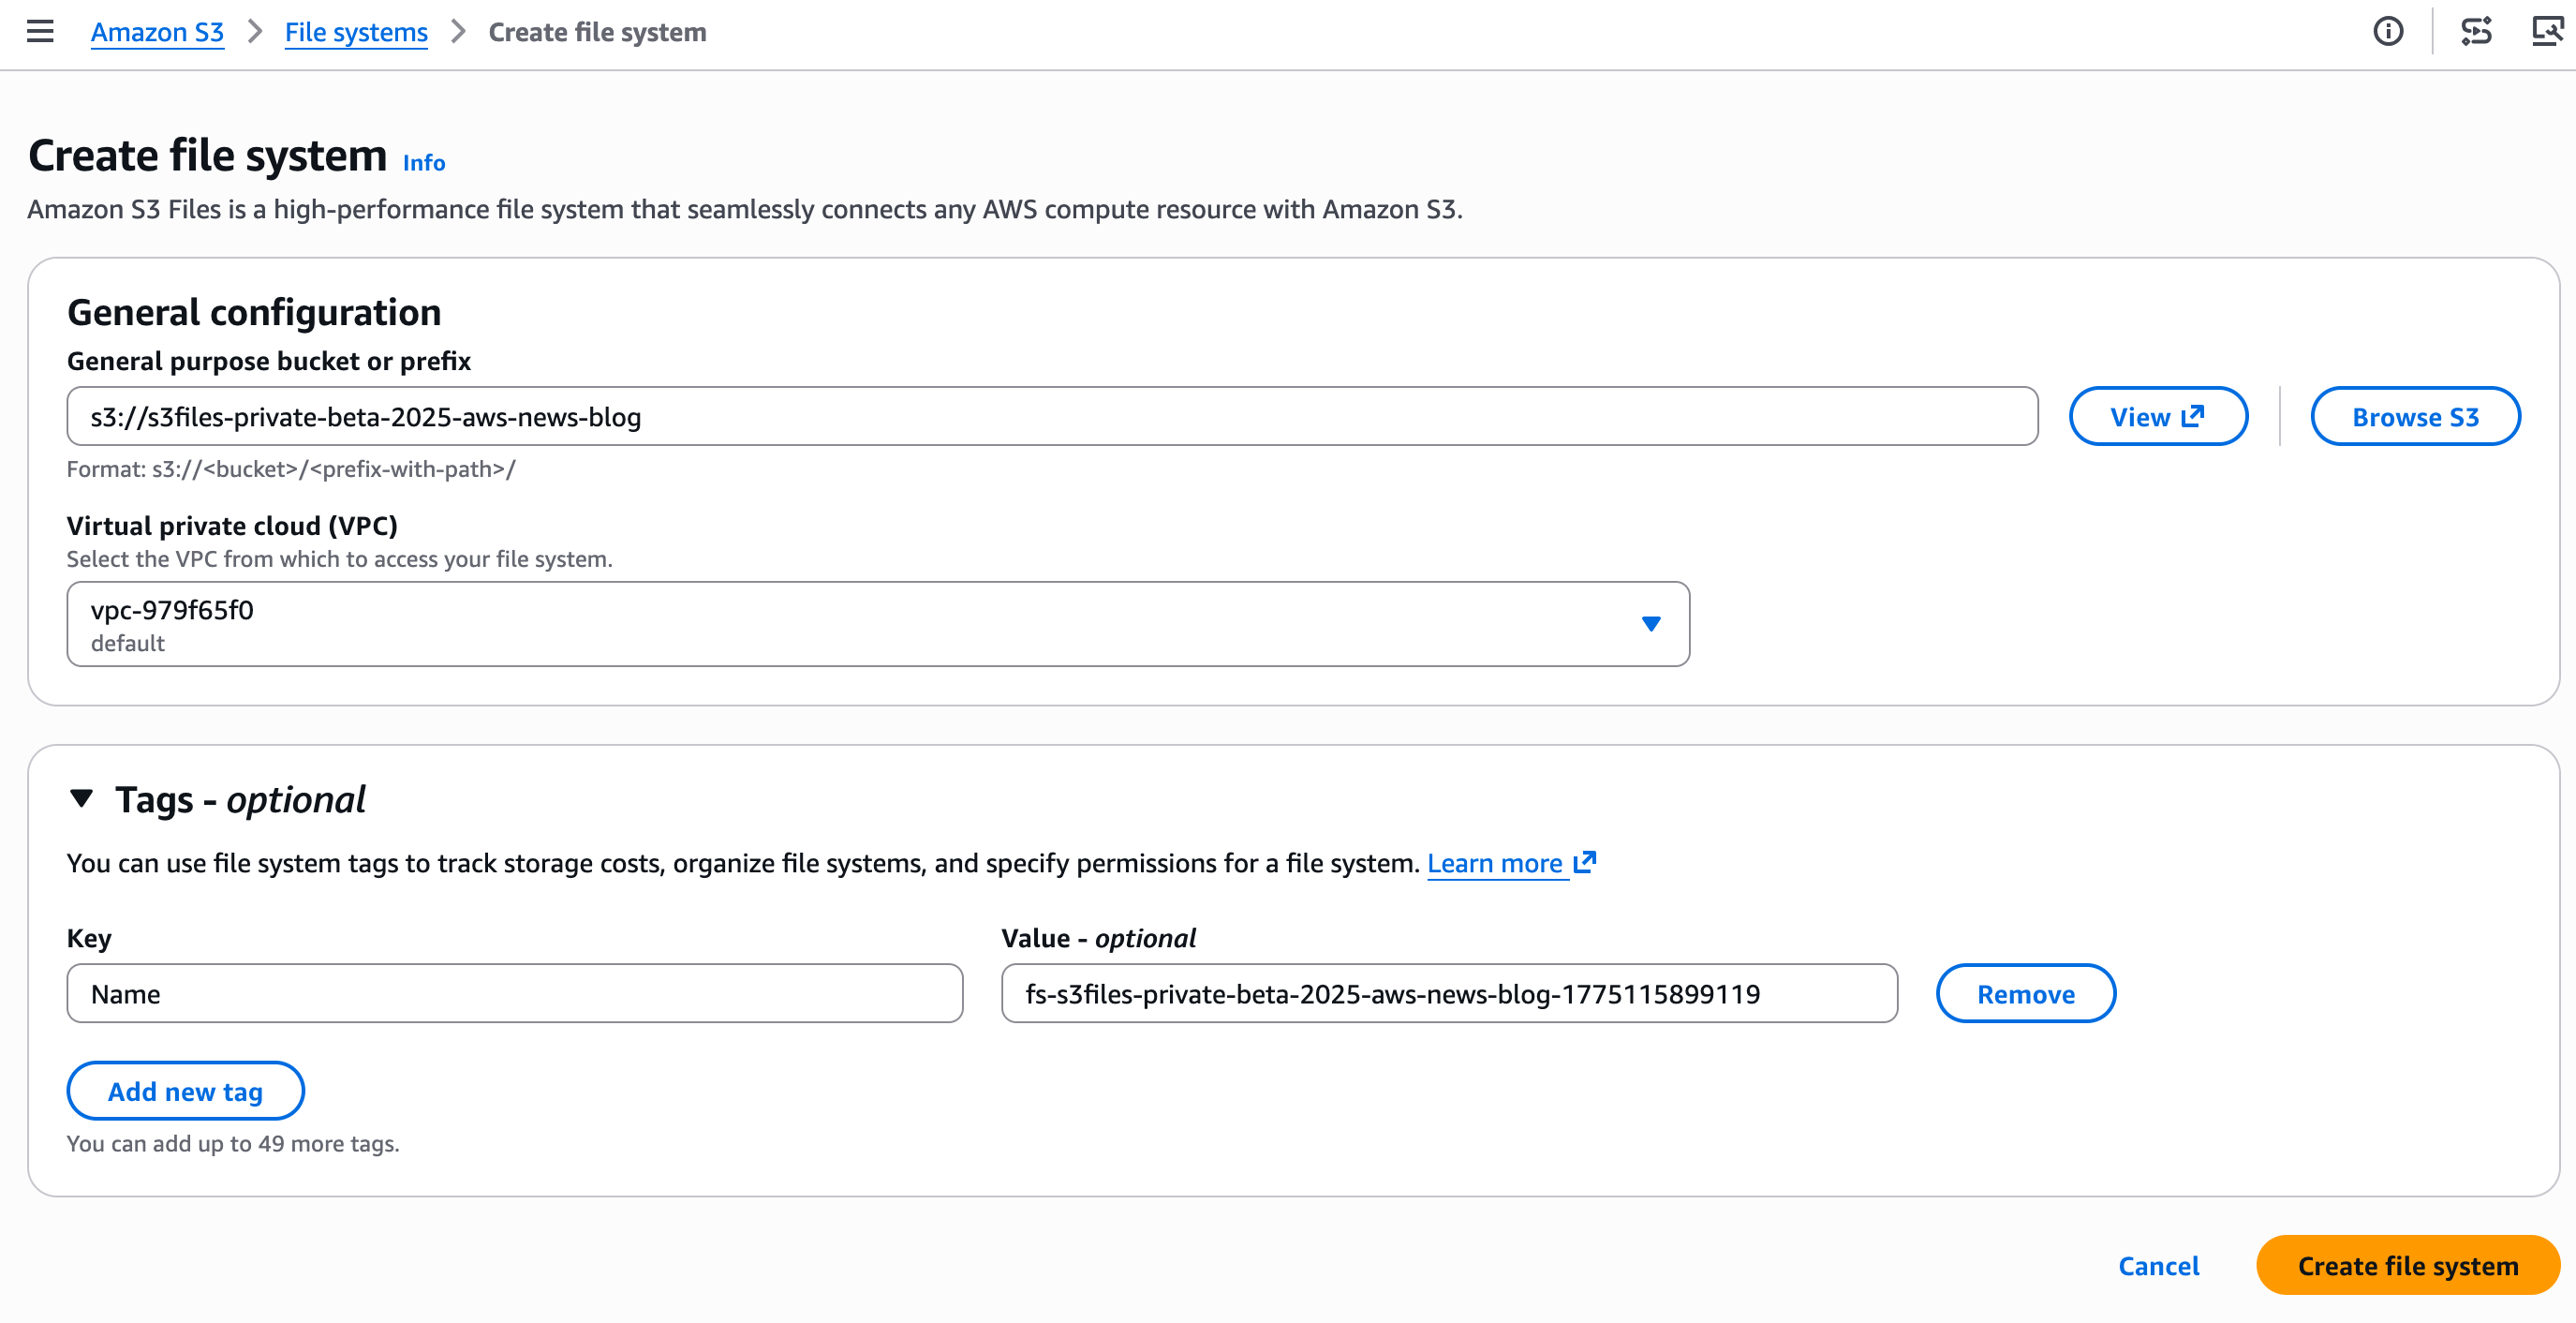
I enter the name of the bucket I want to expose as a file system and choose Create file system.

S3 Files create file system, part 2

Step 2: Discover the mount target.

A mount target is a network endpoint that will live in my virtual private cloud (VPC). It allows my EC2 instance to access the S3 file system.

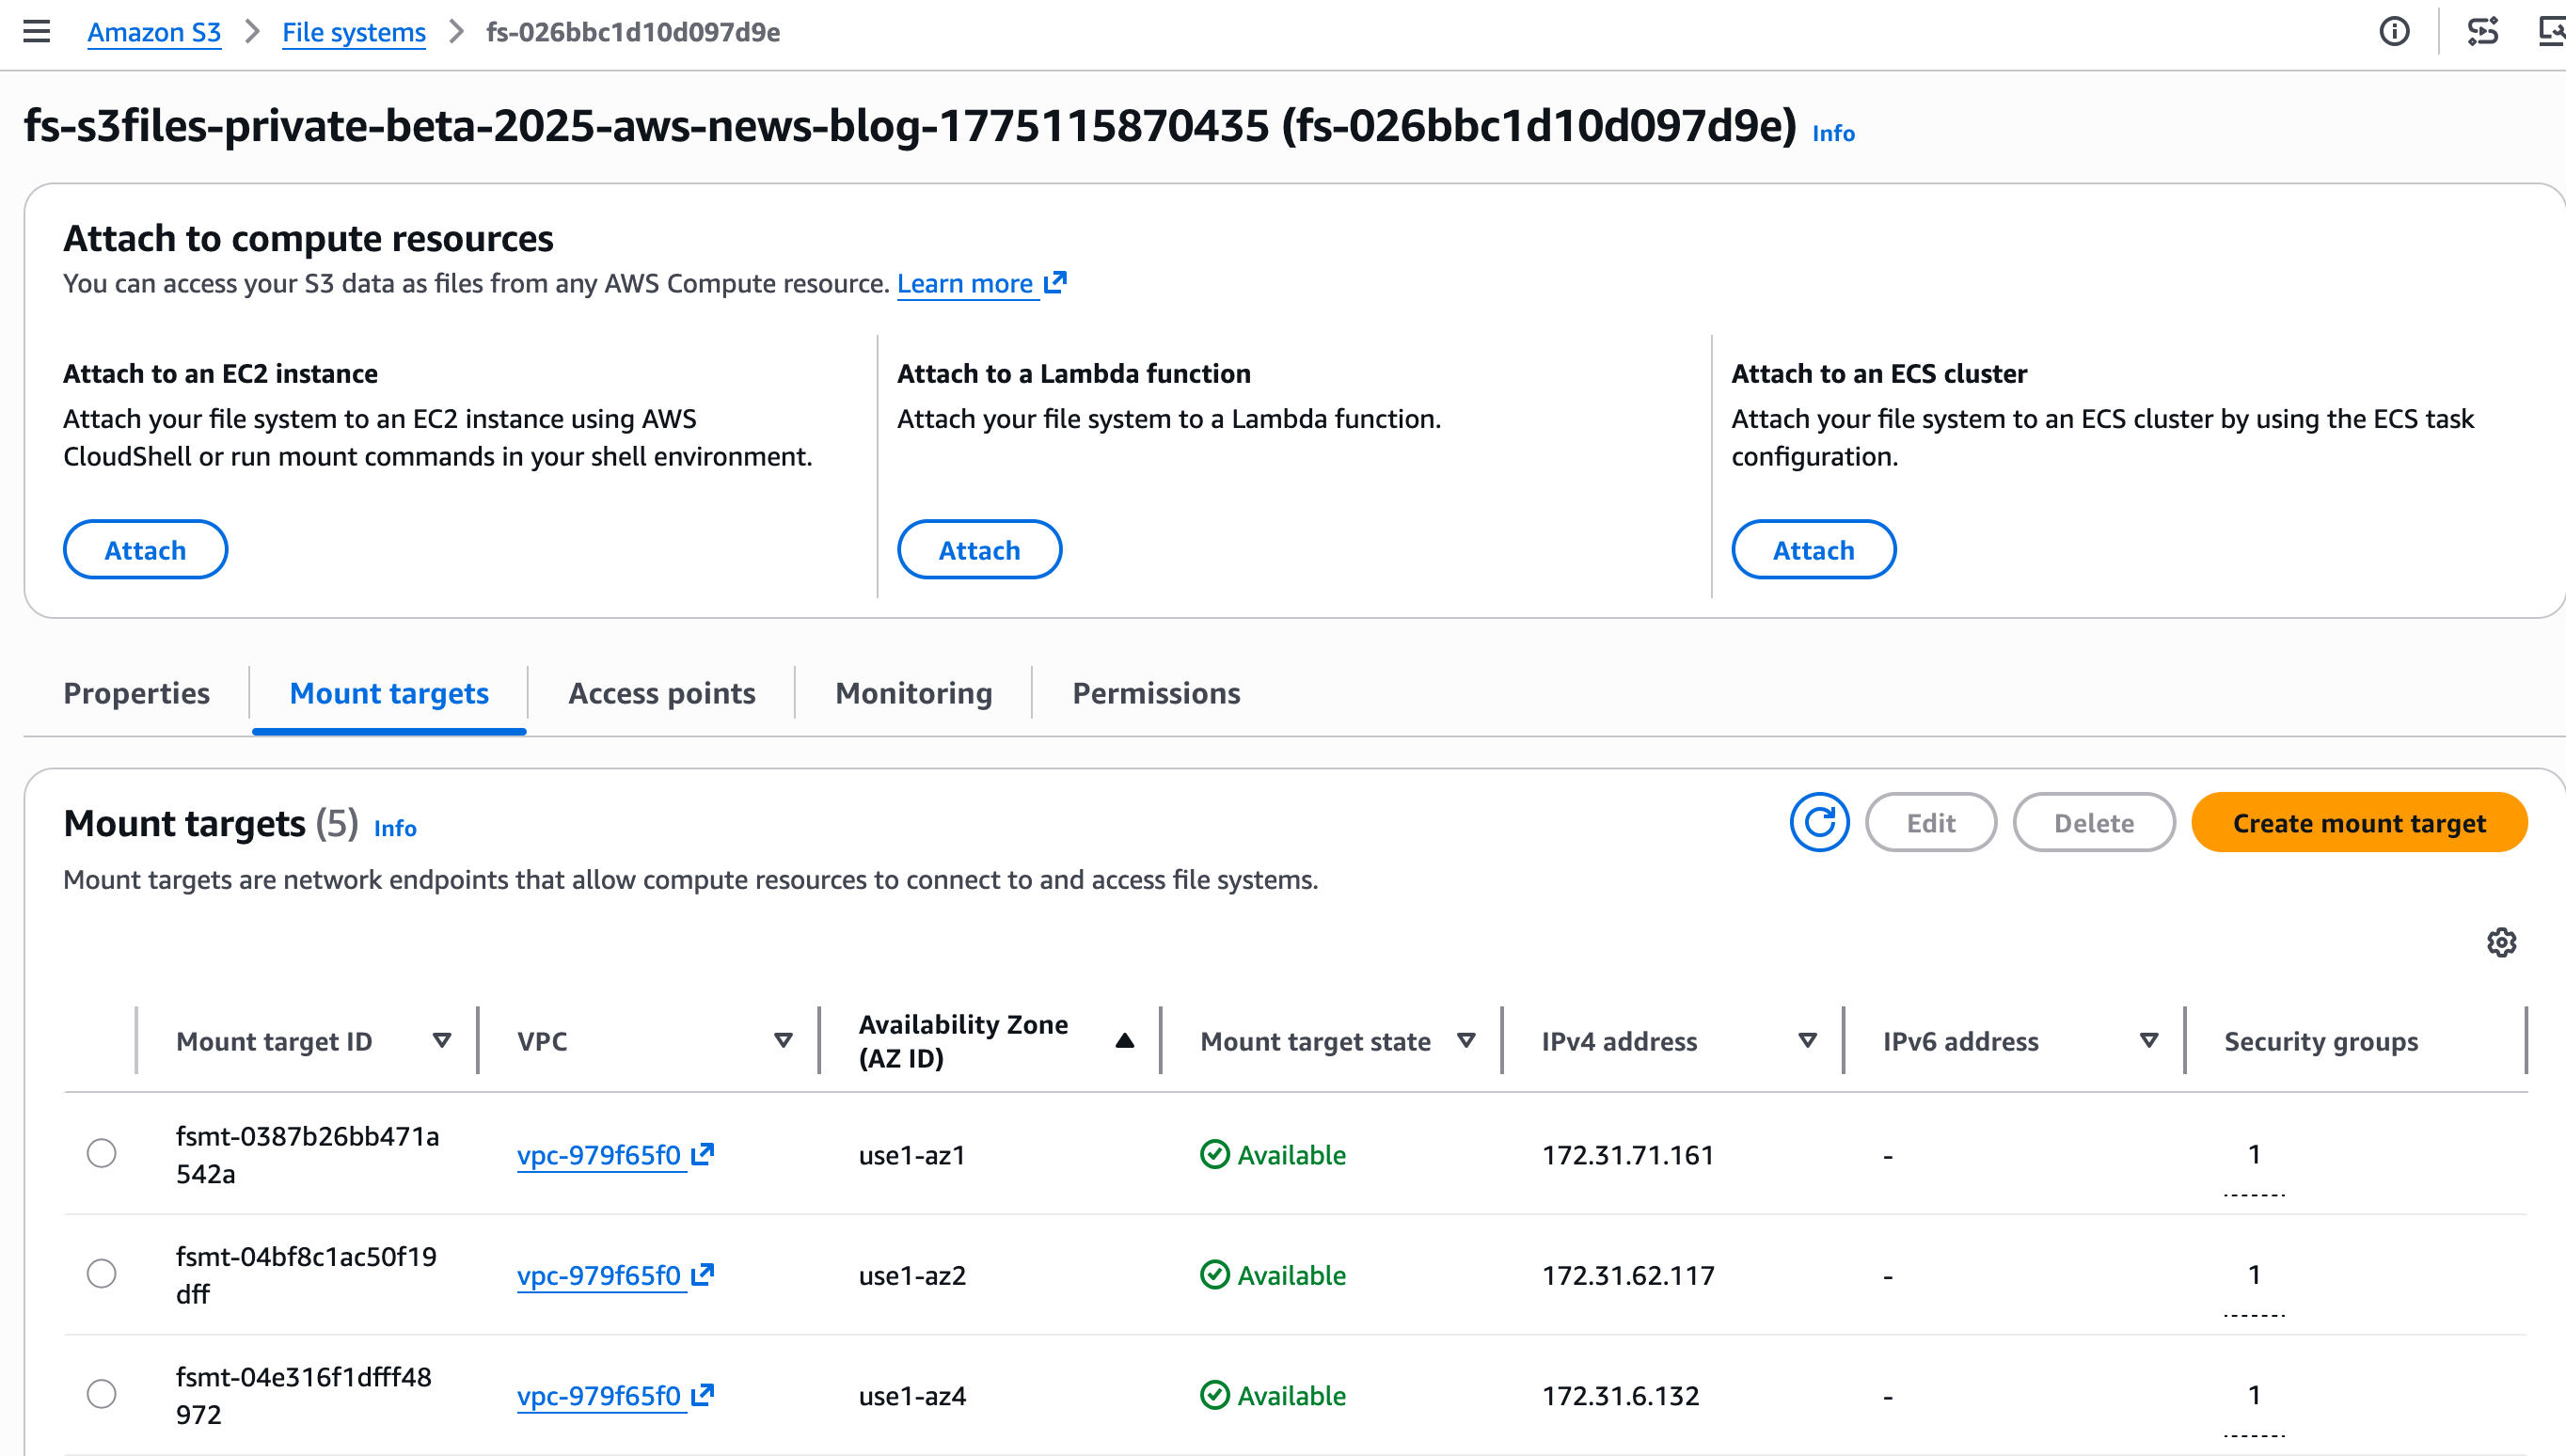
The console creates the mount targets automatically. I take notes of the Mount target IDs on the Mount targets tab.

When using the CLI, two separate commands are necessary to create the file system and its mount targets. First, I create the S3 file system with create-file-system. Then, I create the mount target with create-mount target.

Step 3: Mount the file system on my EC2 instance.

After it’s connected to an EC2 instance, I type:

sudo mkdir /home/ec2-user/s3files sudo mount -t s3files fs-0aa860d05df9afdfe:/ /home/ec2-user/s3files

I can now work with my S3 data directly through the mounted file system in ~/s3files, using standard file operations.

When I make updates to my files in the file system, S3 automatically manages and exports all updates as a new object or a new version on an existing object back in my S3 bucket within minutes.

Changes made to objects on the S3 bucket are visible in the file system within a few seconds but can sometimes take a minute or longer.

# Create a file on the EC2 file system 
echo "Hello S3 Files" > s3files/hello.txt 

# and verify it's here 
ls -al s3files/hello.txt
 -rw-r--r--. 1 ec2-user ec2-user 15 Oct 22 13:03 s3files/hello.txt 

# See? the file is also on S3 
aws s3 ls s3://s3files-aws-news-blog/hello.txt 
2025-10-22 13:04:04 15 hello.txt 

# And the content is identical! 
aws s3 cp s3://s3files-aws-news-blog/hello.txt . && cat hello.txt
Hello S3 Files

Things to know
Let me share some important technical details that I think you’ll find useful.

Another question I frequently hear in customer conversations is about choosing the right file service for your workloads. Yes, I know what you’re thinking: AWS and its seemingly overlapping services, keeping cloud architects entertained during their architecture review meetings. Let me help demystify this one.

S3 Files works best when you need interactive, shared access to data that lives in Amazon S3 through a high performance file system interface. It’s ideal for workloads where multiple compute resources—whether production applications, agentic AI agents using Python libraries and CLI tools, or machine learning (ML) training pipelines—need to read, write, and mutate data collaboratively. You get shared access across compute clusters without data duplication, sub-millisecond latency, and automatic synchronization with your S3 bucket.

For workloads migrating from on-premises NAS environments, Amazon FSx provides the familiar features and compatibility you need. Amazon FSx is also ideal for high-performance computing (HPC) and GPU cluster storage with Amazon FSx for Lustre. It’s particularly valuable when your applications require specific file system capabilities from Amazon FSx for NetApp ONTAP, Amazon FSx for OpenZFS, or Amazon FSx for Windows File Server.

Pricing and availability
S3 Files is available today in all commercial AWS Regions.

You pay for the portion of data stored in your S3 file system, for small file read and all write operations to the file system, and for S3 requests during data synchronization between the file system and the S3 bucket. The Amazon S3 pricing page has all the details.

From discussions with customers, I believe S3 Files helps simplify cloud architectures by eliminating data silos, synchronization complexity, and manual data movement between objects and files. Whether you’re running production tools that already work with file systems, building agentic AI systems that rely on file-based Python libraries and shell scripts, or preparing datasets for ML training, S3 Files lets these interactive, shared, hierarchical workloads access S3 data directly without choosing between the durability of Amazon S3 and cost benefits and a file system’s interactive capabilities. You can now use Amazon S3 as the place for all your organizations’ data, knowing the data is accessible directly from any AWS compute instance, container, and function.

To learn more and get started, visit the S3 Files documentation.

I’d love to hear how you use this new capability. Feel free to share your feedback in the comments below.

— seb

Building AI defenses at scale: Before the threats emerge

Post Syndicated from Amy Herzog original https://aws.amazon.com/blogs/security/building-ai-defenses-at-scale-before-the-threats-emerge/

At AWS, we’ve spent decades developing processes and tools that enable us to defend millions of customers simultaneously, wherever they operate around the world. Every day, our security and threat intelligence teams are doing work with AI and automation that most people never see. Our AI-powered log analysis system has reduced the time SecOps engineers spend analyzing security logs from an average of six hours to just seven minutes, a 50x productivity increase that lets us detect and respond to threats faster than ever. Across AWS, we analyze over 400 trillion network flows per day to detect patterns that signal emerging threats. In 2025 alone, we blocked over 300 million attempts to maliciously encrypt customer files hosted on Amazon S3.

What we learn protecting one customer helps protect all customers. At this scale, every threat we see makes our defenses stronger for everyone, and AI is already central to how we do it.

A new class of AI for cybersecurity

Today, Anthropic announced Project Glasswing, a cybersecurity initiative designed to secure the world’s most critical software and advance the cybersecurity practices the industry will need as AI grows more capable. Organizations that build or maintain critical digital infrastructure are getting early access to Claude Mythos Preview, a new class of AI model, to find and patch vulnerabilities in the systems the world depends on. Given our role in securing some of the world’s most essential infrastructure, AWS is playing an integral part in advancing this work.

Powering the project is Claude Mythos Preview, Anthropic’s most advanced AI model to date and a step-change in reasoning and AI capabilities for cybersecurity. Claude Mythos Preview represents a fundamentally new model class: more intelligent and capable than Anthropic’s previous frontier models, with higher performance on cybersecurity, software coding, and complex reasoning tasks.

As part of Project Glasswing, we’ve already applied Claude Mythos Preview to critical AWS codebases that undergo continuous AI-powered security reviews, and even in those well-tested environments, it’s helped us identify additional opportunities to strengthen our code. In our internal testing, Claude Mythos Preview has proven more productive than previous models at surfacing security findings, requiring less manual guidance from our engineers to deliver actionable results. We’ve also given early access to a select group of AWS customers, who are deploying Claude Mythos Preview in their own security workflows and helping shape how the model evolves. For us, Claude Mythos Preview is a natural extension of the AI tools we already use, and as the technology grows more powerful, so must our defenses.

This is exactly the kind of innovation that drives our work, and we’ve been working closely with Anthropic to help ensure Claude Mythos Preview is ready for enterprise use. AWS is Anthropic’s primary cloud provider for mission-critical workloads, safety research, and foundation model development. More broadly, AWS provides the foundational infrastructure that the world’s leading AI companies rely on to build, train, and deploy their most advanced models. We’re bringing decades of security experience to this partnership, helping to ensure Claude Mythos Preview is ready for even more organizations to build upon and operate securely at scale.

Claude Mythos Preview signals an upcoming wave of models that can find vulnerabilities and build working exploits at a scale and speed we haven’t seen before. Anthropic and AWS are taking a deliberately cautious approach to release. Access begins with a small number of organizations, prioritizing internet-critical companies and open-source maintainers whose software and digital services impact hundreds of millions of users. The goal: find and fix vulnerabilities in the world’s most critical software. Claude Mythos Preview is available in gated research preview through Amazon Bedrock with enterprise-grade security controls, including customer-managed encryption, VPC isolation, and detailed logging, so your team can explore Claude Mythos Preview’s capabilities without exposing production assets to unnecessary risk.

AWS architects services with security at the core

Our work with Project Glasswing is grounded in a philosophy we’ve developed over two decades of securing mission-critical workloads: you can’t wait for threats to materialize before building your defenses. You have to look around corners, adopt new technologies, build protections first, deploy them in your own operations at scale, and refine them based on what you learn.

That’s exactly what we’ve done at AWS with AI and security. Our approach spans the full spectrum: proactive defense through threat hunting and vulnerability research, dynamic response to active campaigns, and third-party certifications that verify our security practices meet the highest industry standards. This operational experience has taught us where AI accelerates security work and where human judgment remains essential. And it’s reinforced that security innovation must be pragmatic: proven in production before we ask you to rely on it.

That’s also why we help define what secure AI looks like. We became the first major cloud provider to achieve ISO 42001 certification for AI services. We’re active participants in OWASP, the Coalition for Secure AI, and the Frontier Model Safety Framework. And we co-founded the Open Cybersecurity Schema Framework (OCSF) to enable better threat intelligence sharing across the ecosystem. The AWS Nitro System provides mathematical isolation for workloads. Our zero-operator access architecture means AWS personnel can’t access your data. These aren’t aspirational goals. They’re how we operate today, at scale, every day.

Amazon Bedrock is where these principles come to life for AI. It provides policy-enforced access controls, built-in evaluation tools to measure how effectively models identify and validate vulnerabilities, and the ability to run workloads inside your own virtual private cloud. AWS is also the first cloud provider to achieve FedRAMP High and Department of Defense Security Requirements Guide Impact Level 4 and 5 authorizations for generally available Claude foundation models, reinforcing that Amazon Bedrock is where the most security-sensitive organizations already trust Anthropic’s technology.

How to get started today

The same principles that guide our work at AWS scale apply regardless of which AI tools you’re using: comprehensive observability, defense in depth, automation where it adds value, and human judgment where it’s essential. Here’s how to put them into practice.

Prepare for the next generation of AI security. Claude Mythos Preview signals an upcoming wave of AI models that will transform cybersecurity. Start strengthening your security posture now so your organization is ready as these capabilities become more broadly available. Claude Mythos Preview is available in gated preview through Amazon Bedrock, and access is limited to an initial allow-list of organizations. If your organization has been allow-listed, your AWS account team will reach out directly.

Run on-demand penetration testing with AWS Security Agent. Now generally available, AWS Security Agent delivers autonomous penetration testing that operates 24/7 at a fraction of the cost of manual penetration tests. It transforms penetration testing from a periodic bottleneck into an on-demand capability that scales with your development velocity across AWS, Azure, GCP, other cloud providers, and on-premises. AWS Security Agent represents a new class of frontier agents: autonomous systems that work independently to achieve goals, scale to tackle concurrent tasks, and run persistently without constant human oversight. It deploys specialized AI agents to discover, validate, and report security vulnerabilities through sophisticated multi-step attack scenarios. Unlike traditional scanners that generate findings without validation, AWS Security Agent identifies potential vulnerabilities, then attempts to exploit them with targeted payloads and attack chains to confirm they are legitimate security risks. Each finding includes CVSS risk scores, application-specific severity ratings, detailed reproduction steps, and remediation suggestions. The result: penetration testing that once took weeks now completes in hours, and security coverage that scales across your entire application portfolio, not just your most critical systems. New customers can explore AWS Security Agent with a 2-month free trial.

Build AI applications you can trust with Amazon Bedrock. For teams building with generative AI, the challenge isn’t just making AI work, it’s making AI work safely. Amazon Bedrock provides the security and safety controls you need to deploy AI responsibly. Its Automated Reasoning capability is the first and only AI safeguard to use formal logic to help prevent factual errors from hallucinations, providing verifiable explanations with 99% accuracy, a capability we’ve refined over more than a decade of applying formal methods across AWS storage, identity, and networking. Amazon Bedrock also provides customizable guardrails that block harmful content and enforce your content policies, along with comprehensive observability to track AI behavior and detect anomalies across your workloads.

The threat landscape isn’t waiting

The threat landscape isn’t waiting for us to catch up. Nation-state actors, ransomware operators, and supply chain attackers are already using AI to scale their operations. Our job is to stay ahead by building defenses first, deploying them at scale, and sharing what we learn so the entire community benefits.

That’s what we do every day at AWS. We prove technology works in our own operations before we ask customers to rely on it. We set standards rather than follow them. And we look around corners to address tomorrow’s challenges today.

As AI capabilities continue to evolve, this approach won’t change. We’ll keep building defenses first, refining them at scale, and working with partners like Anthropic to ensure the next generation of AI security tools meets the real-world needs of enterprises defending at this scale.

Learn More

If you have feedback about this post, submit comments in the Comments section below.

Amy Herzog

Amy Herzog is Vice President and Chief Information Security Officer (CISO) at Amazon Web Services (AWS) where she leads a global organization of cloud security professionals in a company in which security is the top priority. Prior to joining AWS, Amy served as CISO for Amazon’s Devices and Services, Media and Entertainment, and Advertising businesses, overseeing the security of consumer technology offerings such as Alexa+ and Ring, and playing a key role in the secure development of Project Kuiper, Amazon’s initiative to provide fast, reliable broadband to customers and communities around the world through low earth orbit satellites.

Cybersecurity in the Age of Instant Software

Post Syndicated from Bruce Schneier original https://www.schneier.com/blog/archives/2026/04/cybersecurity-in-the-age-of-instant-software.html

AI is rapidly changing how software is written, deployed, and used. Trends point to a future where AIs can write custom software quickly and easily: “instant software.” Taken to an extreme, it might become easier for a user to have an AI write an application on demand—a spreadsheet, for example—and delete it when you’re done using it than to buy one commercially. Future systems could include a mix: both traditional long-term software and ephemeral instant software that is constantly being written, deployed, modified, and deleted.

AI is changing cybersecurity as well. In particular, AI systems are getting better at finding and patching vulnerabilities in code. This has implications for both attackers and defenders, depending on the ways this and related technologies improve.

In this essay, I want to take an optimistic view of AI’s progress, and to speculate what AI-dominated cybersecurity in an age of instant software might look like. There are a number of unknowns that will factor into how the arms race between attacker and defender might play out.

How flaw discovery might work

On the attacker side, the ability of AIs to automatically find and exploit vulnerabilities has increased dramatically over the past few months. We are already seeing both government and criminal hackers using AI to attack systems. The exploitation part is critical here, because it gives an unsophisticated attacker capabilities far beyond their understanding. As AIs get better, expect more attackers to automate their attacks using AI. And as individuals and organizations can increasingly run powerful AI models locally, AI companies monitoring and disrupting malicious AI use will become increasingly irrelevant.

Expect open-source software, including open-source libraries incorporated in proprietary software, to be the most targeted, because vulnerabilities are easier to find in source code. Unknown No. 1 is how well AI vulnerability discovery tools will work against closed-source commercial software packages. I believe they will soon be good enough to find vulnerabilities just by analyzing a copy of a shipped product, without access to the source code. If that’s true, commercial software will be vulnerable as well.

Particularly vulnerable will be software in IoT devices: things like internet-connected cars, refrigerators, and security cameras. Also industrial IoT software in our internet-connected power grid, oil refineries and pipelines, chemical plants, and so on. IoT software tends to be of much lower quality, and industrial IoT software tends to be legacy.

Instant software is differently vulnerable. It’s not mass market. It’s created for a particular person, organization, or network. The attacker generally won’t have access to any code to analyze, which makes it less likely to be exploited by external attackers. If it’s ephemeral, any vulnerabilities will have a short lifetime. But lots of instant software will live on networks for a long time. And if it gets uploaded to shared tool libraries, attackers will be able to download and analyze that code.

All of this points to a future where AIs will become powerful tools of cyberattack, able to automatically find and exploit vulnerabilities in systems worldwide.

Automating patch creation

But that’s just half of the arms race. Defenders get to use AI, too. These same AI vulnerability-finding technologies are even more valuable for defense. When the defensive side finds an exploitable vulnerability, it can patch the code and deny it to attackers forever.

How this works in practice depends on another related capability: the ability of AIs to patch vulnerable software, which is closely related to their ability to write secure code in the first place.

AIs are not very good at this today; the instant software that AIs create is generally filled with vulnerabilities, both because AIs write insecure code and because the people vibe coding don’t understand security. OpenClaw is a good example of this.

Unknown No. 2 is how much better AIs will get at writing secure code. The fact that they’re trained on massive corpuses of poorly written and insecure code is a handicap, but they are getting better. If they can reliably write vulnerability-free code, it would be an enormous advantage for the defender. And AI-based vulnerability-finding makes it easier for an AI to train on writing secure code.

We can envision a future where AI tools that find and patch vulnerabilities are part of the typical software development process. We can’t say that the code would be vulnerability-free—that’s an impossible goal—but it could be without any easily findable vulnerabilities. If the technology got really good, the code could become essentially vulnerability-free.

Patching lags and legacy software

For new software—both commercial and instant—this future favors the defender. For commercial and conventional open-source software, it’s not that simple. Right now, the world is filled with legacy software. Much of it—like IoT device software—has no dedicated security team to update it. Sometimes it is incapable of being patched. Just as it’s harder for AIs to find vulnerabilities when they don’t have access to the source code, it’s harder for AIs to patch software when they are not embedded in the development process.

I’m not as confident that AI systems will be able to patch vulnerabilities as easily as they can find them, because patching often requires more holistic testing and understanding. That’s Unknown No. 3: how quickly AIs will be able to create reliable software updates for the vulnerabilities they find, and how quickly customers can update their systems.

Today, there is a time lag between when a vendor issues a patch and customers install that update. That time lag is even longer for large organizational software; the risk of an update breaking the underlying software system is just too great for organizations to roll out updates without testing them first. But if AI can help speed up that process, by writing patches faster and more reliably, and by testing them in some AI-generated twin environment, the advantage goes to the defender. If not, the attacker will still have a window to attack systems until a vulnerability is patched.

Toward self-healing

In a truly optimistic future, we can imagine a self-healing network. AI agents continuously scan the ever-evolving corpus of commercial and custom AI-generated software for vulnerabilities, and automatically patch them on discovery.

For that to work, software license agreements will need to change. Right now, software vendors control the cadence of security patches. Giving software purchasers this ability has implications about compatibility, the right to repair, and liability. Any solutions here are the realm of policy, not tech.

If the defense can find, but can’t reliably patch, flaws in legacy software, that’s where attackers will focus their efforts. If that’s the case, we can imagine a continuously evolving AI-powered intrusion detection, continuously scanning inputs and blocking malicious attacks before they get to vulnerable software. Not as transformative as automatically patching vulnerabilities in running code, but nevertheless valuable.

The power of these defensive AI systems increases if they are able to coordinate with each other, and share vulnerabilities and updates. A discovery by one AI can quickly spread to everyone using the affected software. Again: Advantage defender.

There are other variables to consider. The relative success of attackers and defenders also depends on how plentiful vulnerabilities are, how easy they are to find, whether AIs will be able to find the more subtle and obscure vulnerabilities, and how much coordination there is among different attackers. All this comprises Unknown No. 4.

Vulnerability economics

Presumably, AIs will clean up the obvious stuff first, which means that any remaining vulnerabilities will be subtle. Finding them will take AI computing resources. In the optimistic scenario, defenders pool resources through information sharing, effectively amortizing the cost of defense. If information sharing doesn’t work for some reason, defense becomes much more expensive, as individual defenders will need to do their own research. But instant software means much more diversity in code: an advantage to the defender.

This needs to be balanced with the relative cost of attackers finding vulnerabilities. Attackers already have an inherent way to amortize the costs of finding a new vulnerability and create a new exploit. They can vulnerability hunt cross-platform, cross-vendor, and cross-system, and can use what they find to attack multiple targets simultaneously. Fixing a common vulnerability often requires cooperation among all the relevant platforms, vendors, and systems. Again, instant software is an advantage to the defender.

But those hard-to-find vulnerabilities become more valuable. Attackers will attempt to do what the major intelligence agencies do today: find “nobody but us” zero-day exploits. They will either use them slowly and sparingly to minimize detection or quickly and broadly to maximize profit before they’re patched. Meanwhile, defenders will be both vulnerability hunting and intrusion detecting, with the goal of patching vulnerabilities before the attackers find them.

We can even imagine a market for vulnerability sharing, where the defender who finds a vulnerability and creates a patch is compensated by everyone else in the information-sharing/repair network. This might be a stretch, but maybe.

Up the stack

Even in the most optimistic future, attackers aren’t going to just give up. They will attack the non-software parts of the system, such as the users. Or they’re going to look for loopholes in the system: things that the system technically allows but were unintended and unanticipated by the designers—whether human or AI—and can be used by attackers to their advantage.

What’s left in this world are attacks that don’t depend on finding and exploiting software vulnerabilities, like social engineering and credential stealing attacks. And we have already seen how AI-generated deepfakes make social engineering easier. But here, too, we can imagine defensive AI agents that monitor users’ behaviors, watching for signs of attack. This is another AI use case, and one that I’m not even sure how to think about in terms of the attacker/defender arms race. But at least we’re pushing attacks up the stack.

Also, attackers will attempt to infiltrate and influence defensive AIs and the networks they use to communicate, poisoning their output and degrading their capabilities. AI systems are vulnerable to all sorts of manipulations, such as prompt injection, and it’s unclear whether we will ever be able to solve that. This is Unknown No. 5, and it’s a biggie. There might always be a “trusting trust problem.”

No future is guaranteed. We truly don’t know whether these technologies will continue to improve and when they will plateau. But given the pace at which AI software development has improved in just the past few months, we need to start thinking about how cybersecurity works in this instant software world.

This essay originally appeared in CSO.

EDITED TO ADD: Two essays published after I wrote this. Both are good illustrations of where we are re AI vulnerability discovery. Things are changing very fast.

Introducing workload simulation workbench for Amazon MSK Express broker

Post Syndicated from Manu Mishra original https://aws.amazon.com/blogs/big-data/introducing-workload-simulation-workbench-for-amazon-msk-express-broker/

Validating Kafka configurations before production deployment can be challenging. In this post, we introduce the workload simulation workbench for Amazon Managed Streaming for Apache Kafka (Amazon MSK) Express Broker. The simulation workbench is a tool that you can use to safely validate your streaming configurations through realistic testing scenarios.

Solution overview

Varying message sizes, partition strategies, throughput requirements, and scaling patterns make it challenging for you to predict how your Apache Kafka configurations will perform in production. The traditional approaches to test these variables create significant barriers: ad-hoc testing lacks consistency, manual set up of temporary clusters is time-consuming and error-prone, production-like environments require dedicated infrastructure teams, and team training often happens in isolation without realistic scenarios. You need a structured way to test and validate these configurations safely before deployment. The workload simulation workbench for MSK Express Broker addresses these challenges by providing a configurable, infrastructure as code (IaC) solution using AWS Cloud Development Kit (AWS CDK) deployments for realistic Apache Kafka testing. The workbench supports configurable workload scenarios, and real-time performance insights.

Express brokers for MSK Provisioned make managing Apache Kafka more streamlined, more cost-effective to run at scale, and more elastic with the low latency that you expect. Each broker node can provide up to 3x more throughput per broker, scale up to 20x faster, and recover 90% quicker compared to standard Apache Kafka brokers. The workload simulation workbench for Amazon MSK Express broker facilitates systematic experimentation with consistent, repeatable results. You can use the workbench for multiple use cases like production capacity planning, progressive training to prepare developers for Apache Kafka operations with increasing complexity, and architecture validation to prove streaming designs and compare different approaches before making production commitments.

Architecture overview

The workbench creates an isolated Apache Kafka testing environment in your AWS account. It deploys a private subnet where consumer and producer applications run as containers, connects to a private MSK Express broker and monitors for performance metrics and visibility. This architecture mirrors the production deployment pattern for experimentation. The following image describes this architecture using AWS services.

MSK Workload SImulator WorkBench Architecture Diagram

This architecture is deployed using the following AWS services:

Amazon Elastic Container Service (Amazon ECS) generate configurable workloads with Java-based producers and consumers, simulating various real-world scenarios through different message sizes and throughput patterns.

Amazon MSK Express Cluster runs Apache Kafka 3.9.0 on Graviton-based instances with hands-free storage management and enhanced performance characteristics.

Dynamic Amazon CloudWatch Dashboards automatically adapt to your configuration, displaying real-time throughput, latency, and resource utilization across different test scenarios.

Secure Amazon Virtual Private Cloud (Amazon VPC) Infrastructure provides private subnets across three Availability Zones with VPC endpoints for secure service communication.

Configuration-driven testing

The workbench provides different configuration options for your Apache Kafka testing environment, so you can customize instance types, broker count, topic distribution, message characteristics, and ingress rate. You can adjust the number of topics, partitions per topic, sender and receiver service instances, and message sizes to match your testing needs. These flexible configurations support two distinct testing approaches to validate different aspects of your Kafka deployment:

Approach 1: Workload validation (single deployment)

Test different workload patterns against the same MSK Express cluster configuration. This is useful for comparing partition strategies, message sizes, and load patterns.

// Fixed MSK Express Cluster Configuration
export const mskBrokerConfig: MskBrokerConfig = {
numberOfBrokers: 1, // 1 broker per AZ = 3 total brokers
instanceType: 'express.m7g.large', // MSK Express instance type
};

// Multiple Concurrent Workload Tests
export const deploymentConfig: DeploymentConfig = { services: [
{ topics: 2, partitionsPerTopic: 6, instances: 3, messageSizeBytes: 1024 }, // High-throughput scenario
{ topics: 1, partitionsPerTopic: 3, instances: 1, messageSizeBytes: 512 }, // Latency-optimized scenario
{ topics: 3, partitionsPerTopic: 4, instances: 2, messageSizeBytes: 4096 }, // Multi-topic scenario
]};

Approach 2: Infrastructure rightsizing (redeploy and compare)

Test different MSK Express cluster configurations by redeploying the workbench with different broker settings while keeping the same workload. This is recommended for rightsizing experiments and understanding the impact of vertical compared to horizontal scaling.

// Baseline: Deploy and test
export const mskBrokerConfig: MskBrokerConfig = { numberOfBrokers: 1, instanceType: 'express.m7g.large',};

// Vertical scaling: Redeploy with larger instances
export const mskBrokerConfig: MskBrokerConfig = { numberOfBrokers: 1,
instanceType: 'express.m7g.xlarge', // Larger instances
};

// Horizontal scaling: Redeploy with more brokers
export const mskBrokerConfig: MskBrokerConfig = {
numberOfBrokers: 2, // More brokers
instanceType: 'express.m7g.large',};

Each redeployment uses the same workload configuration, so you can isolate the impact of infrastructure changes on performance.

Workload testing scenarios (single deployment)

These scenarios test different workload patterns against the same MSK Express cluster:

Partition strategy impact testing

Scenario: You are debating the usage of fewer topics with many partitions compared to many topics with fewer partitions for your microservices architecture. You want to understand how partition count affects throughput and consumer group coordination before making this architectural decision.

const deploymentConfig = { services: [
{ topics: 1, partitionsPerTopic: 1, instances: 2, messageSizeBytes: 1024 }, // Baseline: minimal partitions
{ topics: 1, partitionsPerTopic: 10, instances: 2, messageSizeBytes: 1024 }, // Medium partitions
{ topics: 1, partitionsPerTopic: 20, instances: 2, messageSizeBytes: 1024 }, // High partitions
]};

Message size performance analysis

Scenario: Your application handles different types of events – small IoT sensor readings (256 bytes), medium user activity events (1 KB), and large document processing events (8KB). You must understand how message size impacts your overall system performance and if you should separate these into different topics or handle them together.

const deploymentConfig = { services: [
{ topics: 2, partitionsPerTopic: 6, instances: 3, messageSizeBytes: 256 }, // IoT sensor data
{ topics: 2, partitionsPerTopic: 6, instances: 3, messageSizeBytes: 1024 }, // User events
{ topics: 2, partitionsPerTopic: 6, instances: 3, messageSizeBytes: 8192 }, // Document events
]};

Load testing and scaling validation

Scenario: You expect traffic to vary significantly throughout the day, with peak loads requiring 10× more processing capacity than off-peak hours. You want to validate how your Apache Kafka topics and partitions handle different load levels and understand the performance characteristics before production deployment.

const deploymentConfig = { services: [
{ topics: 2, partitionsPerTopic: 6, instances: 1, messageSizeBytes: 1024 }, // Off-peak load simulation
{ topics: 2, partitionsPerTopic: 6, instances: 5, messageSizeBytes: 1024 }, // Medium load simulation
{ topics: 2, partitionsPerTopic: 6, instances: 10, messageSizeBytes: 1024 }, // Peak load simulation
]};

Infrastructure rightsizing experiments (redeploy and compare)

These scenarios help you understand the impact of different MSK Express cluster configurations by redeploying the workbench with different broker settings:

MSK broker rightsizing analysis

Scenario: You deploy a cluster with basic configuration and put load on it to establish baseline performance. Then you want to experiment with different broker configurations to see the effect of vertical scaling (larger instances) and horizontal scaling (more brokers) to find the right cost-performance balance for your production deployment.

Step 1: Deploy with baseline configuration

// Initial deployment: Basic configuration
export const mskBrokerConfig: MskBrokerConfig = {
numberOfBrokers: 1, // 3 total brokers (1 per AZ)
instanceType: 'express.m7g.large',};export const deploymentConfig: DeploymentConfig = { services: [ { topics: 2, partitionsPerTopic: 6, instances: 3, messageSizeBytes: 1024 }, ]};

Step 2: Redeploy with vertical scaling

// Redeploy: Test vertical scaling impact
export const mskBrokerConfig: MskBrokerConfig = {
numberOfBrokers: 1, // Same broker count
instanceType: 'express.m7g.xlarge', // Larger instances
};

// Keep same workload configuration to compare results

Step 3: Redeploy with horizontal scaling

// Redeploy: Test horizontal scaling impact
export const mskBrokerConfig: MskBrokerConfig = {
numberOfBrokers: 2, // 6 total brokers (2 per AZ)
instanceType: 'express.m7g.large', // Back to original size
};

// Keep same workload configuration to compare results

This rightsizing approach helps you understand how broker configuration changes affect the same workload, so you can improve both performance and cost for your specific requirements.

Performance insights

The workbench provides detailed insights into your Apache Kafka configurations through monitoring and analytics, creating a CloudWatch dashboard that adapts to your configuration. The dashboard starts with a configuration summary showing your MSK Express cluster details and workbench service configurations, helping you to understand what you’re testing. The following image shows the dashboard configuration summary:

The second section of dashboard shows real-time MSK Express cluster metrics including:

  • Broker performance: CPU utilization and memory usage across brokers in your cluster
  • Network activity: Monitor bytes in/out and packet counts per broker to understand network utilization patterns
  • Connection monitoring: Displays active connections and connection patterns to help identify potential bottlenecks
  • Resource utilization: Broker-level resource tracking provides insights into overall cluster health

The following image shows the MSK cluster monitoring dashboard:

The third section of the dashboard shows the Intelligent Rebalancing and Cluster Capacity insights showing:

  • Intelligent rebalancing: in progress: Shows whether a rebalancing operation is currently in progress or has occurred in the past. A value of 1 indicates that rebalancing is actively running, while 0 means that the cluster is in a steady state.
  • Cluster under-provisioned: Indicates whether the cluster has insufficient broker capacity to perform partition rebalancing. A value of 1 means that the cluster is under-provisioned and Intelligent Rebalancing can’t redistribute partitions until more brokers are added or the instance type is upgraded.
  • Global partition count: Displays the total number of unique partitions across all topics in the cluster, excluding replicas. Use this to track partition growth over time and validate your deployment configuration.
  • Leader count per broker: Shows the number of leader partitions assigned to each broker. An uneven distribution indicates partition leadership skew, which can lead to hotspots where certain brokers handle disproportionate read/write traffic.
  • Partition count per broker: Shows the total number of partition replicas hosted on each broker. This metric includes both leader and follower replicas and is key to identifying replica distribution imbalances across the cluster.

The following image shows the Intelligent Rebalancing and Cluster Capacity section of the dashboard:

The fourth section of the dashboard shows the application-level insights showing:

  • System throughput: Displays the total number of messages per second across services, giving you a complete view of system performance
  • Service comparisons: Performs side-by-side performance analysis of different configurations to understand which approaches fit
  • Individual service performance: Each configured service has dedicated throughput tracking widgets for detailed analysis
  • Latency analysis: The end-to-end message delivery times and latency comparisons across different service configurations
  • Message size impact: Performance analysis across different payload sizes helps you understand how message size affects overall system behavior

The following image shows the application performance metrics section of the dashboard:

Getting started

This section walks you through setting up and deploying the workbench in your AWS environment. You will configure the necessary prerequisites, deploy the infrastructure using AWS CDK, and customize your first test.

Prerequisites

You can deploy the solution from the GitHub Repo. You can clone it and run it on your AWS environment. To deploy the artifacts, you will require:

  • AWS account with administrative credentials configured for creating AWS resources.
  • AWS Command Line Interface (AWS CLI) must be configured with appropriate permissions for AWS resource management.
  • AWS Cloud Development Kit (AWS CDK) should be installed globally using npm install -g aws-cdk for infrastructure deployment.
  • Node.js version 20.9 or higher is required, with version 22+ recommended.
  • Docker engine must be installed and running locally as the CDK builds container images during deployment. Docker daemon should be running and accessible to CDK for building the workbench application containers.

Deployment

# Clone the workbench repository
git clone https://github.com/aws-samples/sample-simulation-workbench-for-msk-express-brokers.git

# Install dependencies and build
npm install 
npm run build

# Bootstrap CDK (first time only per account/region)
cd cdk 
npx cdk bootstrap

# Synthesize CloudFormation template (optional verification step)
npx cdk synth

# Deploy to AWS (creates infrastructure and builds containers)
npx cdk deploy

After deployment is completed, you will receive a CloudWatch dashboard URL to monitor the workbench performance in real-time.You can also deploy multiple isolated instances of the workbench in the same AWS account for different teams, environments, or testing scenarios. Each instance operates independently with its own MSK cluster, ECS services, and CloudWatch dashboards.To deploy additional instances, modify the Environment Configuration in cdk/lib/config.ts:

// Instance 1: Development team
export const AppPrefix = 'mske';export const EnvPrefix = 'dev';

// Instance 2: Staging environment (separate deployment)
export const AppPrefix = 'mske';export const EnvPrefix = 'staging';

// Instance 3: Team-specific testing (separate deployment)
export const AppPrefix = 'team-alpha';export const EnvPrefix = 'test';

Each combination of AppPrefix and EnvPrefix creates completely isolated AWS resources so that multiple teams or environments can use the workbench simultaneously without conflicts.

Customizing your first test

You can edit the configuration file located at folder “cdk/lib/config-types.ts” to define your testing scenarios and run the deployment. It is preconfigured with the following configuration:

export const deploymentConfig: DeploymentConfig = { services: [
// Start with a simple baseline test
{ topics: 1, partitionsPerTopic: 3, instances: 1, messageSizeBytes: 1024 },

// Add a comparison scenario
{ topics: 1, partitionsPerTopic: 6, instances: 1, messageSizeBytes: 1024 }, ]};

Best practices

Following a structured approach to benchmarking ensures that your results are reliable and actionable. These best practices will help you isolate performance variables and build a clear understanding of how each configuration change affects your system’s behavior. Begin with single-service configurations to establish baseline performance:

const deploymentConfig = { services: [ { topics: 1, partitionsPerTopic: 3, instances: 1, messageSizeBytes: 1024 } ]};

After you understand the baseline, add comparison scenarios.

Change one variable at a time

For clear insights, modify only one parameter between services:

const deploymentConfig = { services: [
{ topics: 1, partitionsPerTopic: 3, instances: 1, messageSizeBytes: 1024 }, // Baseline
{ topics: 1, partitionsPerTopic: 6, instances: 1, messageSizeBytes: 1024 }, // More partitions
{ topics: 1, partitionsPerTopic: 12, instances: 1, messageSizeBytes: 1024 }, // Even more partitions
]};

This approach helps you understand the impact of specific configuration changes.

Important considerations and limitations

Before relying on workbench results for production decisions, it is important to understand the tool’s intended scope and boundaries. The following considerations will help you set appropriate expectations and make the most effective use of the workbench in your planning process.

Performance testing disclaimer

The workbench is designed as an educational and sizing estimation tool to help teams prepare for MSK Express production deployments. While it provides valuable insights into performance characteristics:

  • Results can vary based on your specific use cases, network conditions, and configurations
  • Use workbench results as guidance for initial sizing and planning
  • Conduct comprehensive performance validation with your actual workloads in production-like environments before final deployment

Recommended usage approach

Production readiness training – Use the workbench to prepare teams for MSK Express capabilities and operations.

Architecture validation – Test streaming architectures and performance expectations using MSK Express enhanced performance characteristics.

Capacity planning – Use MSK Express streamlined sizing approach (throughput-based rather than storage-based) for initial estimates.

Team preparation – Build confidence and expertise with production Apache Kafka implementations using MSK Express.

Conclusion

In this post, we showed how the workload simulation workbench for Amazon MSK Express Broker supports learning and preparation for production deployments through configurable, hands-on testing and experiments. You can use the workbench to validate configurations, build expertise, and improve performance before production deployment. If you’re preparing for your first Apache Kafka deployment, training a team, or improving existing architectures, the workbench provides practical experience and insights needed for success. Refer to Amazon MSK documentation – Complete MSK Express documentation, best practices, and sizing guidance for more information.


About the authors

Manu MishraManu Mishra is a Senior Solutions Architect at AWS with over 18 years of experience in the software industry, specializing in artificial intelligence, data and analytics, and security. His expertise spans strategic oversight and hands-on technical leadership, where he reviews and guides the work of both internal and external customers. Manu collaborates with AWS customers to shape technical strategies that drive impactful business outcomes, providing alignment between technology and organizational goals.

Manu Mishra Ramesh Chidirala is a Senior Solutions Architect at Amazon Web Services with over two decades of technology leadership experience in architecture and digital transformation, helping customers align business strategy and technical execution. He specializes in designing innovative, AI-powered, cost-efficient serverless event-driven architectures and has extensive experience architecting secure, scalable, and resilient cloud solutions for enterprise customers.

Proactive monitoring for Amazon Redshift Serverless using AWS Lambda and Slack alerts

Post Syndicated from Cristian Restrepo Lopez original https://aws.amazon.com/blogs/big-data/proactive-monitoring-for-amazon-redshift-serverless-using-aws-lambda-and-slack-alerts/

Performance issues in analytics environments often remain invisible until they disrupt dashboards, delay ETL jobs, or impact business decisions. For teams running Amazon Redshift Serverless, unmonitored query queues, long-running queries, or unexpected spikes in compute capacity can degrade performance and increase costs if left undetected.

Amazon Redshift Serverless streamlines running analytics at scale by removing the need to provision or manage infrastructure. However, even in a serverless environment, maintaining visibility into performance and usage is essential for efficient operation and predictable costs. While Amazon Redshift Serverless provides advanced built-in dashboards for monitoring performance metrics, delivering notifications directly to platforms like Slack, brings another level of agility. Real-time alerts in the team’s workflow enable faster response times and more informed decision-making without requiring constant dashboard monitoring.

In this post, we show you how to build a serverless, low-cost monitoring solution for Amazon Redshift Serverless that proactively detects performance anomalies and sends actionable alerts directly to your selected Slack channels. This approach helps your analytics team identify and address issues early, often before your users notice a problem.

Solution overview

The solution presented in this post uses AWS services to collect key performance metrics from Amazon Redshift Serverless, evaluate them against thresholds that you can flexibly configure, and notify you when anomalies are detected.

scope of solution

The workflow operates as follows:

  1. Scheduled execution – An Amazon EventBridge rule triggers an AWS Lambda function on a configurable schedule (by default, every 15 minutes during business hours).
  2. Metric collection – The AWS Lambda function gathers metrics including queued queries, running queries, compute capacity (RPUs), data storage usage, table count, database connections, and slow-running queries using Amazon CloudWatch and the Amazon Redshift Data API.
  3. Threshold evaluation – Collected metrics are compared against your predefined thresholds that reflect acceptable performance and usage limits.
  4. Alerting – When a threshold is exceeded, the Lambda function publishes a notification to an Amazon SNS topic.
  5. Slack notification – Amazon Q Developer in Chat applications (formerly AWS Chatbot) delivers the alert to your designated Slack channel.
  6. Observability – Lambda execution logs are stored in Amazon CloudWatch Logs for troubleshooting and auditing.

This architecture is fully serverless and requires no changes to your existing Amazon Redshift Serverless workloads. To simplify deployment, we provide an AWS CloudFormation template that provisions all required resources.

Prerequisites

Before deploying this solution, you must collect information about your existing Amazon Redshift Serverless workgroup and namespace that you want to monitor. To identify your Amazon Redshift Serverless resources:

  1. Open the Amazon Redshift console.
  2. In the navigation pane, choose Serverless dashboard.
  3. Note down your workgroup and namespace names. You will use these values when launching this blog’s AWS CloudFormation template.

Deploy the solution

You can launch the CloudFormation stack and deploy the solution via the provided link.

GitHub Repo

When launching the CloudFormation stack, complete the following steps in the AWS CloudFormation Console:

  1. For Stack name, enter a descriptive name such as redshift-serverless-monitoring.
  2. Review and modify the parameters as needed for your environment.
  3. Acknowledge that AWS CloudFormation may create IAM resources with custom names.
  4. Choose Submit.

CloudFormation parameters

Amazon Redshift Serverless Workgroup configuration

Provide details for your existing Amazon Redshift Serverless environment. These values connect the monitoring solution to your Redshift environment. Some parameters come with the default values that you can replace with your actual configuration.

Parameter Default value Description
Amazon Redshift Workgroup Name Your Amazon Redshift Serverless workgroup name.
Amazon Redshift Namespace Name Your Amazon Redshift Serverless namespace name.
Amazon Redshift Workgroup ID Workgroup ID (UUID) of the Amazon Redshift Serverless workgroup to monitor. Must follow the UUID format: xxxxxxxx-xxxx-xxxx-xxxx-xxxxxxxxxxxx (lowercase hexadecimal with hyphens).
Namespace ID (UUID) of the Amazon Redshift Serverless namespace. Must follow the UUID format: xxxxxxxx-xxxx-xxxx-xxxx-xxxxxxxxxxxx (lowercase hexadecimal with hyphens).
Database Name dev Target Amazon Redshift database for SQL-based diagnostic and monitoring queries.

Monitoring schedule

The default schedule runs diagnostic SQL queries every 15 minutes during business hours, balancing responsiveness and cost efficiency. Running more frequently might increase costs, while less frequent monitoring could delay detection of performance issues. You can adjust this schedule to your actual need.

Parameter Default value Description
Schedule Expression cron(0/15 8-17 ? * MON-FRI *) EventBridge schedule expression for Lambda function execution. Default runs every 15 minutes, Monday through Friday, 8 AM to 5 PM UTC.

Threshold configuration

Thresholds should be tuned based on your workload characteristics.

Parameter Default value Description
Queries Queued Threshold 20 Alerts threshold for queued queries.
Queries Running Threshold 20 Alerts threshold for running queries.
Compute Capacity Threshold (RPUs) 64 Alert threshold for compute capacity (RPUs).
Data Storage Threshold (MB) 5242880 Threshold for data storage in MB (default 5 TB).
Table Count Threshold (MB) 1000 Alerts threshold for total table count.
Database Connections Threshold 50 Alert threshold for database connections.
Slow Query Threshold (seconds) 10 Thresholds in seconds for slow query detection.
Query Timeout (Seconds) 30 Timeout for SQL diagnostics queries.

Tip: Start with conservative thresholds and refine them after observing baseline behavior for one to two weeks.

Lambda configuration

Configure the AWS Lambda function settings. The selected default values are appropriate for most monitoring scenarios. You may want to change them only in case of troubleshooting.

Parameter Default value Description
Lambda Memory Size (MB) 256 Lambda function memory size in MB.
Lambda Time Out (Seconds) 240 Lambda function timeout in seconds.

Security Configuration – Amazon Virtual Private Cloud (VPC)

If your organization has network isolation requirements, you can optionally enable VPC deployment for the Lambda function. When enabled, the Lambda function runs within your specified VPC subnets, providing network isolation and allowing access to VPC-only resources.

Parameter Default value Description
VPC ID VPC ID for Lambda deployment (required if EnableVPC is true). The Lambda function will be deployed in this VPC. Ensure that the VPC has appropriate routing (NAT Gateway or VPC Endpoints) to allow Lambda to access AWS services like CloudWatch, Amazon Redshift, and Amazon SNS.
VPC Subnet IDs Comma-separated list of subnet IDs for Lambda deployment (required if EnableVPC is true).
Security Group IDs Comma-separated list of security group IDs for Lambda (optional). If not provided and EnableVPC is true, a default security group will be created with outbound HTTPS access. Custom security groups must allow outbound HTTPS (port 443) to AWS service endpoints.

Note that VPC deployment might increase cold start times and requires an NAT Gateway or VPC endpoints for AWS service access. We recommend provisioning interface VPC endpoints (through AWS PrivateLink) for the five services the Lambda function calls which keeps all traffic private without the recurring cost of a NAT Gateway.

Security configuration – Encryption

If your organization requires encryption of data at rest, you can optionally enable AWS Key Management Service (AWS KMS) encryption for the Lambda function’s environment variables, CloudWatch Logs, and SNS topic. When enabled, the template encrypts each resource using the AWS KMS keys that you provide, either a single shared key for all three services, or individual keys for granular key management and audit separation.

Parameter Default value Description
Shared KMS Key ARN AWS KMS key ARN to use for all encryption (Lambda, Logs, and SNS) unless service-specific keys are provided. This streamlines key management by using a single key for all services. The key policy must grant encrypt/decrypt permissions to Lambda, CloudWatch Logs, and SNS.
Lambda KMS Key ARN AWS KMS key ARN for Lambda environment variable encryption (optional, overrides SharedKMSKeyArn). Use this for separate key management per service. The key policy must grant decrypt permissions to the Lambda execution role. If not provided, SharedKMSKeyArn will be used when EnableKMSEncryption is true.
CloudWatch Logs KMS Key ARN AWS KMS key ARN for CloudWatch Logs encryption (optional, overrides SharedKMSKeyArn). Use this for separate key management per service. The key policy must grant encrypt/decrypt permissions to the CloudWatch Logs service. If not provided, SharedKMSKeyArn will be used when EnableKMSEncryption is true.
SNS Topic KMS Key ARN AWS KMS key ARN for SNS topic encryption (optional, overrides SharedKMSKeyArn). Use this for separate key management per service. The key policy must grant encrypt/decrypt permissions to SNS service and the Lambda execution role. If not provided, SharedKMSKeyArn will be used when EnableKMSEncryption is true.
Enable Dead Letter Queue False Optionally enable Dead Letter Queue (DLQ) for failed Lambda invocations to improve reliability and security monitoring. When enabled, events that fail after all retry attempts will be sent to an SQS queue for investigation and potential replay. This helps prevent data loss, provides visibility into failures, and enables security audit trails for monitoring anomalies. The DLQ retains messages for 14 days.

Note that AWS KMS encryption requires the key policy to grant appropriate permissions to each consuming service (Lambda, CloudWatch Logs, and SNS).

  1. On the review page, select I acknowledge that AWS CloudFormation might create IAM resources with custom names.
  2. Choose Submit.

Resources created

The CloudFormation stack creates the following resources:

  • EventBridge rule for scheduled execution
  • AWS Lambda function (Python 3.12 runtime)
  • Amazon SNS topic for alerts
  • IAM role with permissions for CloudWatch, Amazon Redshift Data API, and SNS
  • CloudWatch Log Group for Lambda logs

Note: CloudFormation deployment typically takes 10–15 minutes to complete. You can monitor progress in real time under the Events tab of your CloudFormation stack.

Post-deployment configuration

After the CloudFormation stack has been successfully created, complete the following steps.

Step 1: Record CloudFormation outputs

  1. Navigate to the AWS CloudFormation console.
  2. Select your stack and choose the Outputs tab.
  3. Note the values for LambdaRoleArn and SNSTopicArn. You will need these in subsequent steps.

Step 2: Grant Amazon Redshift permissions

Grant permissions to the Lambda function to query Amazon Redshift system tables for monitoring data. Complete the following steps to grant the necessary access:

  1. Navigate to the Amazon Redshift console.
  2. In the left navigation pane, choose Query Editor V2.
  3. Connect to your Amazon Redshift Serverless workgroup.
  4. Execute the following SQL commands, replacing <IAM Role ARN> with the LambdaRoleArn value from your CloudFormation outputs:
CREATE USER "IAMR:<IAM Lambda Role>" WITH PASSWORD DISABLE;

GRANT ROLE "sys:monitor" TO "IAMR:<IAM Role>";

RedshiftSQL-DBD-5612

These commands create an AmazonRedshift user associated with the Lambda IAM role and grant it the sys:monitor Amazon Redshift role. This role provides read-only access to catalog and system tables without granting permissions to user data tables.

Step 3: Configure Slack notifications

Amazon Q Developer in chat applications provides native AWS integration and managed authentication, removing custom webhook code and reducing setup complexity. To receive alerts in Slack, configure Amazon Q Developer in Chat Applications to connect your SNS topic to your preferred Slack channel:

  1. Navigate to Amazon Q Developer in chat applications (formerly AWS Chatbot) in the AWS console.
  2. Follow the instructions in the Slack integration documentation to authorize AWS access to your Slack workspace.
  3. When configuring the Slack channel, ensure that you select the correct AWS Region where you deployed the CloudFormation stack.
  4. In the Notifications section, select the SNS topic created by your CloudFormation stack (refer to the SNSTopicArn output value).
  5. Keep the default IAM read-only permissions for the channel configuration.

SNS topic

After configured, alerts automatically appear in Slack whenever thresholds are exceeded.

result-upon-success

Cost considerations

With the default configuration, this solution incurs minimal ongoing costs. The Lambda function executes approximately 693 times per month (every 15 minutes during an 8-hour business day, Monday through Friday), resulting in a monthly cost of approximately $0.33 USD. This includes Lambda compute costs ($0.26) and CloudWatch GetMetricData API calls ($0.07). All other services (EventBridge, SNS, CloudWatch Logs, and Amazon Redshift Data API). The Amazon Redshift Data API has no additional charges beyond the minimal Amazon Redshift Serverless RPU consumption for the Amazon Redshift Serverless system table query execution. You can reduce costs by decreasing the monitoring frequency (such as, every 30 minutes) or increase responsiveness by running more frequently (such as, every 5 minutes) with a proportional cost increase.

All costs are estimates and may vary based on your environment. Variations often occur because queries scanning system tables may take longer or require additional resources depending on the system complexity

Security best practices

This solution implements the following security controls:

  • IAM policies scoped to specific resource ARNs for the Amazon Redshift workgroup, namespace, SNS topic, and log group.
  • Data API statement access restricted to the Lambda function’s own IAM user ID.
  • Read-only sys:monitor database role for operational metadata access. Limit to the role created by the CloudFormation template.
  • Reserved concurrent executions capped at five.

To further strengthen your security posture, consider the following enhancements:

  • Enable EnableKMSEncryption to encrypt environment variables, logs, and SNS messages at rest.
  • Enable EnableVPC to deploy the function within a VPC for network isolation.
  • Audit access through AWS CloudTrail.

Important: This is sample code for non-production usage. Work with your security and legal teams to meet your organizational security, regulatory, and compliance requirements before deployment. This solution demonstrates monitoring capabilities but requires additional security hardening for production environments, including encryption configuration, IAM policy scoping, VPC deployment, and comprehensive testing.

Clean up

To remove all resources and avoid ongoing charges if you don’t want to use the solution anymore:

  1. Delete the CloudFormation stack.
  2. Remove the Slack integration from Amazon Q Developer in chat applications.

Troubleshooting

  • If no metrics or incomplete SQL diagnostics are returned, verify that the Amazon Redshift Serverless workgroup is active with recent query activity, and ensure the database user has the sys:monitor role (GRANT ROLE sys:monitor TO <user>) in the query editor. Without this role, queries execute successfully but only return data visible to that user’s permissions rather than the full cluster activity.
  • For VPC-deployed functions that fail to reach AWS services, confirm that VPC endpoints or a NAT Gateway are configured for CloudWatch, Amazon Redshift Data API, Amazon Redshift Serverless, SNS, and CloudWatch Logs.
  • If the Lambda function times out, increase the LambdaTimeout and QueryTimeoutSeconds parameters. The default timeout of 240 seconds accommodates most workloads, but clusters with many active queries may require additional time for SQL diagnostics to complete.

Conclusion

In this post, we showed how you can build a proactive monitoring solution for Amazon Redshift Serverless using AWS Lambda, Amazon CloudWatch, and Amazon SNS with Slack integration. By automatically collecting metrics, evaluating thresholds, and delivering alerts in near real time to Slack or your preferred collaborative platform, this solution helps detect performance and cost issues early. Because the solution itself is serverless, it aligns with the operational simplicity goals of Amazon Redshift Serverless—scaling automatically, requiring minimal maintenance, and delivering high value at low cost. You can extend this foundation with additional metrics, diagnostic logic, or alternative notification channels to meet your organization’s needs.

To learn more, see the Amazon Redshift documentation on monitoring and performance optimization.


About the authors

Headhost author 1

Cristian Restrepo Lopez

Cristian is a Solutions Architect at AWS, helping customers build modern data applications with a focus on analytics. Outside of work, he enjoys exploring emerging technologies and connecting with the data community.

Satesh Sonti

Satesh is a Principal Analytics Specialist Solutions Architect based out of Atlanta, specializing in building enterprise data platforms, data warehousing, and analytics solutions. He has over 19 years of experience in building data assets and leading complex data platform programs for banking and insurance clients across the globe.

Distributed by Design: Building a Truly Remote Backblaze

Post Syndicated from Elisa Ramos Miller original https://www.backblaze.com/blog/distributed-by-design-building-a-truly-remote-backblaze/

A decorative image showing different, interconnected icons of servers, buildings, and data.

In 2007, Backblaze started in a one-bedroom Palo Alto apartment. Since those days of hand-assembling Storage Pods, we’ve grown to manage over 5 exabytes of data for 500,000 customers across 175 countries. As our mission to make customers unstoppable grew, our team naturally grew with it, moving far beyond the walls of any single office.

The pandemic gave us the final piece of data we needed to evolve. When the world reopened, our San Mateo headquarters never quite looked the same. The office became a bit of a paradox: a large, quiet space where a handful of people moved through a space designed for hundreds. Meanwhile, the true heart and soul of the company was already thriving elsewhere, solving the world’s toughest storage challenges from data centers in Phoenix, spare bedrooms in Austin, and kitchen tables in Cheltenham.

We didn’t rush this. We experimented, explored, and really listened to our team. When we looked at the data, we found only around 5% of our teams worked out of the San Mateo office regularly. By testing new ways of collaborating, we confirmed what we already suspected: our culture isn’t tied to a physical floor plan, it’s tied to our shared commitment to our customers and each other. As of February 1, 2026, we made it official: Backblaze has moved beyond the hybrid model to become a fully remote, distributed company.

Listening, learning, and being practical

This transition isn’t about a grand corporate strategy, but about meeting our employees where they’re at—everywhere. While we appreciate the flexibility, we noticed that hybrid models can unintentionally create two different cultures, one for those who can make it into the office and another for everyone else. Whether an employee is in San Jose or the Philippines, we want them to have the same access to leadership, and each other. We’re now a team that finally matches the diversity and reach of the 175 countries we serve.

Beyond the culture, this is also about being good stewards of our financial resources. Holding onto an expensive, mostly empty office in one of the world’s costliest real estate markets was not a good investment.  By letting go of the San Mateo office, we can more responsibly direct those investments toward our people—funding intentional collaboration tools, resources, and smaller local gatherings that strengthen connection and culture. 

Let’s talk about the bedrock : Our data centers

While the “cloud” often feels like a metaphor, our Data Center Technicians know it’s built on hardware, precision, and physical presence. When it comes to data centers, there is no shifting the in-person work. Someone needs to be there to swap out a drive, and when it comes to making sure we’re always-on, that is a 24/7/365 commitment. 

They are the heartbeat of Backblaze. Every day, they show up in person to the facilities where data actually lives, keeping the drives spinning to ensure that your data is always available and accessible.

Remote flexibility is a privilege afforded to the rest of the company by the physical excellence of our Data Center teams. They are the essential anchor that allows the rest of us to be weightless. We celebrate their work not as an exception to our model, but as the very foundation that makes our distributed future possible.

We’re still figuring it out

We are still finding new ways to connect. This isn’t a static policy, but a continuous effort to make sure people can be successful wherever they work. We’re replacing accidental hallway chats with deliberate rituals, from cross-functional coffee chats and regional off-sites with local talent and execs, to providing on-demand access to professional workspaces for solo work or we want to assemble together. 

Closing the San Mateo office isn’t a retreat from our history; it’s an embrace of the company we’ve already become. As we grow across new markets and time zones, we’re committed to raising the bar on what distributed work can look like so our teams can collaborate in ways that drive real impact around the world. We are building a smarter, more intentional Backblaze, one that is as distributed as the data we protect and as resilient as the customers we serve.

The post Distributed by Design: Building a Truly Remote Backblaze appeared first on Backblaze Blog | Cloud Storage & Cloud Backup

The collective thoughts of the interwebz