Първите три години. Защо младите учители не се задържат в системата?

Post Syndicated from original https://www.toest.bg/purvite-tri-godini-zashcho-mladite-uchiteli-ne-se-zadurzhat-v-sistemata/

Първите три години. Защо младите учители не се задържат в системата?

Проучване на Сметната палата за качеството на образованието в България за периода 2019–2023 г. сочи, че 34% от новоназначените учители напускат в рамките на първите три години, а близо половината от завършилите педагогически специалности не се реализират в професията си. Въпреки това интересът към тези специалности е висок, а учителските заплати са нараснали с 60% в изследвания период.

За истински мотивираните учители обаче само заплатата не е достатъчна, за да останат на работа. Преподавателите в училищата днес имат нужда от качествени политики за подкрепа и професионално израстване, но преди това е важно да бъдат подготвени за срещата си с образователната система. Такъв е основният извод, до който стигнах, опитвайки се да разбера парадокса на масовото напускане – въпреки интереса и повишаващите се възнаграждения.

Университетът vs. реалната работна среда

Станимира Паскова и Цветомира Антонова започват учителската си кариера преди 20 години в две различни училища, но срещат един и същ проблем – университетът не ги е подготвил достатъчно добре за реалната училищна среда.

Станимира се среща с професията за първи път през 2002 г. в отдалечено селско училище, в което е единствената с майчин български език сред колегите и учениците си. Езиковата бариера обаче се оказва непреодолима: 

Аз бях много разочарована, че толкова се бях старала да се представя по възможно най-добрия начин, така както ме бяха подготвили в университета, но се оказа, че това тотално не върши работа за моите деца. И всъщност те са ме слушали учтиво, без да ме разбират, защото аз съм говорила на някакъв чужд език за тях. 

След тази първа година Станимира започва да посещава различни обучения за учители, докато през 2013 г. открива програмата „Нов път в преподаването“, разработена от „Заедно в час“.

Цветомира започва учителския си път през 2004 г. в София с голям ентусиазъм. Чувства се много добре подготвена академично, но днес е категорична, че методическата подготовка в университета не е била модерна и адекватна за времето си. Тя обаче се сблъсква и с друг характерен за учителите проблем –

„бърнаут“.

На петата година вече се чувствах много смазана и от системата. Имах усещането, че трудът ми отива на вятъра и че усилията, които влагам, са много по-големи от резултатите, които виждам, 

разказва Цветомира и допълва, че все още не се обръща достатъчно внимание на емоционалното прегаряне, което е причина много млади учители да напуснат професията. Самата тя прекъсва преподавателската си дейност за няколко години, докато през 2013 г. любопитството ѝ не я среща с програмата „Нов път в преподаването“.

Ръководителката на програмата Жаклин Мисирян-Дойчева определи в разговор с „Тоест“ бърнаута като синдром. За някои учители проблемът се корени в невъзможността за ефективно управление на времето. За други е в трудностите да се справят с клас от 26 деца, част от които не посещават часовете или не говорят български език.

Жаклин също е на мнение, че университетите не подготвят бъдещите учители за реалните предизвикателства в професията, сред които са

агресията и ниската мотивация,

които присъстват във всяка класна стая. За преодоляване на тези проблеми е важно ученикът да бъде поставен в центъра и да се вземат предвид неговите нужди и емоции.

Според Станимира решението за справяне с агресията е и в дома, затова е важно да се работи и с родителите. Тя смята, че като учителка на „Заедно в час“ в с. Караджово (Пловдив) е успяла да изгради доверие у учениците си и техните родители чрез посещения в домовете им и на местата, които са важни за конкретната общност, за да им покаже уважение, грижа и заинтересованост: 

Всяко едно детенце е индивидуално, така че колкото по-добре го познаваш, колкото по-добре изградиш връзки с него, толкова по-добре се чувства и то. То вече идва със съвсем друга нагласа в твоята класна стая.


Важно за мотивацията в клас е и оценяването. Ако учителят успява да забележи, уважи и оцени различните личности в класа, те ще работят по-добре и концентрацията ще се подобри. За поставянето на оценка обаче е нужно да имаш ясни критерии, категорична е Цветомира, за която обученията на „Заедно в час“ по отношение на оценяването, планирането и развиването на емоционалната интелигентност са били от изключителна полза.

Политиките на МОН за задържане на учителите

През 2016 г. педагогиката е включена в списъка на Министерството на образованието и науката (МОН) с приоритетни направления. Това означава, че студентите, приети по държавна поръчка в специалностите от това направление, не плащат такси за обучението си. От МОН уточниха за „Тоест“, че нарастването на учителските заплати е „ключов фактор за нарастване престижа на учителската професия и за привличане и задържане на новоназначените учители“. Към момента педагогиката все още е приоритетно направление с голям интерес от страна на студентите, макар част от специалностите в това направление да бяха извадени от списъка с приоритетните.

На теория в резултат на тези стимули би следвало днес в България да има достатъчен брой учители за нуждите на системата. Според Люба Йорданова, старши специалист в отдел „Стратегически партньорства“ на „Заедно в час“ обаче, една от предпоставките това да не става е в липсващите критерии за подбор. Тя обобщи ситуацията така: много от студентите в педагогически специалности следват висше образование заради дипломата, а не за да станат учители. Но дори голяма част от тези, които започват работа по специалността, напускат в първите три години заради недостатъчна подготовка в университета, липса на ефективно наставничество и други фактори. И това води до недостиг на качествени учители.

Критериите за подбор на квалифицирани учители са важни, категорична е и Жаклин, тъй като „ние не сме в позицията на хора, които трябва да губим времето на децата“.

Как се измерва качеството на образованието?

Освен липсващите критерии на подбор, демотивиращо за преподавателите може да се окаже и отсъствието на правна рамка, свързана с качеството на образованието. Оценките от външно оценяване и държавните зрелостни изпити все още са индикатор за състоянието на образованието, въпреки че според международното изследване PISA, което се провежда с 15-годишни ученици, голяма част от тях не притежават базови умения. Резултатите от държавните изпити не могат да измерят качеството на образованието в училищата, тъй като много деца посещават частни уроци, което пък поставя учениците от семейства с по-ниски финансови възможности в по-неблагоприятна ситуация спрямо връстниците им. Не се вижда и кои от училищата, където се работи с деца от уязвими групи, с ученици с майчин език, различен от българския, със специални потребности и т.н., са отбелязали напредък.

Заедно с приемането на Закона за предучилищно и училищно образование през 2016 г. влиза в сила и Наредба №16 от 8 декември същата година – за управлението на качеството в институциите, която утвърждава държавния образователен стандарт. Тя е отменена в края на 2017 г., когато образователен министър е Красимир Вълчев, и едва през септември 2025 г. започва обществено обсъждане на нов документ на мястото на стария. След приключване на обсъждането той не е гласуван. 

На въпрос на „Тоест“ какви са мотивите за отмяна на наредбата, бившият министър на образованието Красимир Вълчев отговори, че тя не е била оценена като „достатъчно ефективна“. Според него наредбата е произвеждала само „формализъм, а не реална отговорност в управлението на качеството“, тоест писане на стратегически документи, които да се показват по време на проверки, без да има реално съществуваща система. 

Макар Вълчев да оценява новата проектонаредба като много по-добра, той каза, че е предпочел да разполага с повече време за работа по нея. Категоричен е обаче, че трябва да има такава наредба и да се създаде култура на управление на качеството.

Как да задържим учителите?

През 2021 г. Световната банка представя резултатите от проучване по поръчка на МОН за нуждите на образователната система. Сред препоръките, изработени на основата на анализа, е създаването на пилотна програма за въвеждане в учителската професия на начинаещи учители чрез наставничество и подкрепа за професионално израстване. Изследването установява текучество на кадри,

като в периода 2015–2018 г. напусналите след третата година учители са близо 75%.

Настоящата практика за наставничество и подкрепа на новоназначените учители не се документира добре, а „системата се нуждае от изграждане на капацитет и постепенно въвеждане на рамкова програма за въвеждане в професията“, пише в доклада върху проучването.

На въпрос на „Тоест“ във връзка с установената от Световната банка потребност от подкрепа за новоназначените учители от МОН отговориха, че 

се провежда задължителната въвеждаща квалификация, която се изразява в обучения на новоназначени учители в предучилищното образование и чрез ментори, които са професионалисти с богата експертиза както в преподаването, така и в управлението и обучението на педагогически специалисти. 

От пресцентъра на Министерството допълват, че през 2025 г. са проведени 76 майсторски класа в рамките на Националната програма „Квалификация на педагогическите специалисти“. Те са били в три направления: подходи за формиращо оценяване и преподаване в контекста на националното външно оценяване и държавните зрелостни изпити, повишаване на четивната грамотност на учениците и обучения за местни модели за повишаване на резултатите и качеството на подготовка на учениците.

Обученията на практика

Цветомира потвърди, че е посещавала обучения, организирани от МОН, 

които уж адресират някакви проблеми, примерно свързани с агресия, с насилие […] но всъщност как протичат обученията – в 4-звезден хотел, със спа, с „Бяла роза“ и това е основният акцент – учителките да си починат за три дни.

В споменатия доклад на Световната банка се повдига и въпросът за липсата на добра подготовка още в университета. В него се прави следният извод:

… университетите не приоритизират достатъчно практическото обучение в училищна среда, организирано в тясно партньорство с базови училища.

Базовите училища в България не са „представителна извадка на всички типове училища в страната“, категорична е Люба Йорданова, и добавя: 

Учебните заведения нямат достатъчно стимули да приемат студенти по педагогика. Те трябва да отделят поне един старши или главен учител за наставник на стажантите, бюрокрацията по време на стажовете също не е малка. Хоспитирането (практическите наблюдения на студентите) трябва да започне още в първи или втори курс, а не както е в момента – в трети и четвърти. Важно е също студентите да имат възможността да практикуват както в училища в големи населени места и с високи резултати, така и в такива в малки населени места и изправени пред различни предизвикателства.

В частната езикова школа в Пловдив, в която преподава Станимира, стажуват и млади учители, но от разказите им за университета не е останала с впечатлението, че нещо драстично се е променило от времето, когато тя е била студентка.

„Нов път в преподаването“

Програмата, разработена от „Заедно в час“, се възобновява след прекъсване през 2022 г. Насочена е към педагози с до 5 години опит в професията и предлага подкрепа и наставничество в рамките на две години. Подборът е внимателен, „за да сме сигурни, че в програмата влизат високомотивирани кандидати“, казва Жаклин. Фокусът е върху подкрепата за учители, работещи с деца от уязвими групи или в по-малки населени места, където учениците нямат същите образователни възможности като връстниците си от по-големите градове. Тази година са обхванати град София и областта заедно с Враца, Пазарджик, Пловдив, Стара Загора и Бургас, като целта е да се достигне до малките населени места.

За Станимира програмата е била ценна с оказаната подкрепа от координатор, който посещава учителите регулярно, дискутира с тях казуси от ежедневието им, наблюдава учебните им часове и предоставя конструктивна обратна връзка. Според нея програмата предоставя пълна методическа подкрепа, достъп до ресурси от най-високо качество и непрекъснати надграждащи обучения. 

Всъщност никога не си бях представяла как изглеждам отстрани, какво се случва, дали децата ме харесват, дали не ме харесват, дали се справям добре, къде са ми били силните страни в часа, къде мога да направя нещата по друг начин – това е безценна информация за един учител и се отразява на работата ти веднага, още в следващия час […] Посещенията на координатора нямат нищо общо с посещенията на директора, защото по-старото поколение учители свързва посещението преди всичко с налагането на някакви санкции. Влизат, гледат те, осъждат те по някакъв начин,

разказва тя.

Програмата е успяла да уцели „в десетката“ на потребностите на Цветомира да бъде добър учител. Въпреки подкрепата на нейните по-опитни колеги в началото на кариерата ѝ, „Нов път в преподаването“ успява да ѝ помогне да развие преподавателската си методология, да бъде полезна на учениците си и удовлетворена от работата си. 

Станимира и Цветомира говориха с много любов за професията си. И двете обаче продължават да са учителки заради вътрешната си мотивация, любопитство и желание за развитие, а не защото държавата е успяла да ги мотивира. В тази връзка политиката на МОН за повишаване на възнагражденията не е изиграла особена роля за кариерното развитие на двете учителки. Истинската подкрепа за педагозите и адекватните отговори на техните нужди все още идват от неправителствения сектор. Грижата за учителите обаче е важна и за качеството на образованието, а то би трябвало да е национална политика. 
Team Mirai and Democracy

Post Syndicated from Bruce Schneier original https://www.schneier.com/blog/archives/2026/03/team-mirai-and-democracy.html

Japan’s election last month and the rise of the country’s newest and most innovative political party, Team Mirai, illustrates the viability of a different way to do politics.

In this model, technology is used to make democratic processes stronger, instead of undermining them. It is harnessed to root out corruption, instead of serving as a cash cow for campaign donations.

Imagine an election where every voter has the opportunity to opine directly to politicians on precisely the issues they care about. They’re not expected to spend hours becoming policy experts. Instead, an AI Interviewer walks them through the subject, answering their questions, interrogating their experience, even challenging their thinking.

Voters get immediate feedback on how their individual point of view matches—or doesn’t—a party’s platform, and they can see whether and how the party adopts their feedback. This isn’t like an opinion poll that politicians use for calculating short-term electoral tactics. It’s a deliberative reasoning process that scales, engaging voters in defining policy and helping candidates to listen deeply to their constituents.

This is happening today in Japan. Constituents have spent about eight thousand hours engaging with Mirai’s AI Interviewer since 2025. The party’s gamified volunteer mobilization app, Action Board, captured about 100,000 organizer actions per day in the runup to last week’s election.

It’s how Team Mirai, which translates to ‘The Future Party,’ does politics. Its founder, Takahiro Anno, first ran for local office in 2024 as a 33 year old software engineer standing for Governor of Tokyo. He came in fifth out of 56 candidates, winning more than 150,000 votes as an unaffiliated political outsider. He won attention by taking a distinctive stance on the role of technology in democracy and using AI aggressively in voter engagement.

Last year, Anno ran again, this time for the Upper Chamber of the national legislature—the Diet—and won. Now the head of a new national party, Anno found himself with a platform for making his vision of a new way of doing politics a reality.

In this recent House of Representatives election, Team Mirai shot up to win nearly four million votes. In the lower chamber’s proportional representation system, that was good enough for eleven total seats—the party’s first ever representation in the Japanese House—and nearly three times what it achieved in last year’s Upper Chamber election.

Anno’s party stood for election without aligning itself on the traditional axes of left and right. Instead, Team Mirai, heavily associated with young, urban voters, sought to unite across the ideological spectrum by taking a radical position on a different axis: the status quo and the future. Anno told us that Team Mirai believes it can triple its representation in the Diet after the next elections in each chamber, an ostentatious goal that seems achievable given their rapid rise over the past year.

In the American context, the idea of a small party unifying voters across left and right sounds like a pipe dream. But there is evidence it worked in Japan. Team Mirai won an impressive 11% of proportional representation votes from unaffiliated voters, nearly twice the share of the larger electorate. The centerpiece of the party’s policy platform is not about the traditional hot button issues, it’s about democracy itself, and how it can be enhanced by embracing a futuristic vision of digital democracy.

Anno told us how his party arrived at its manifesto for this month’s elections, and why it looked different from other parties’ in important ways. Team Mirai collected more than 38,000 online questions and more than 6,000 discrete policy suggestions from voters using its AI Policy app, which is advertised as a ‘manifesto that speaks for itself.’

After factoring in all this feedback, Team Mirai maintained a contrarian position on the biggest issue of the election: the sales tax and affordability. Rather than running on a reduction of the national sales tax like the major parties, Team Mirai reviewed dozens of suggestions from the public and ultimately proposed to keep that tax level while providing support to families through a child tax credit and lowering the required contribution for social insurance. Anno described this as another future-facing strategy: less price relief in the short term, but sustained funding for essential programs.

Anno has always intended to build a different kind of party. After receiving roughly $1 million in public funding apportioned to Team Mirai based on its single seat in the Upper Chamber last year, Anno began hiring engineers to enhance his software tools for digital democracy.

Anno described Team Mirai to us as a ‘utility party;’ basic infrastructure for Japanese democracy that serves the broader polity rather than one faction. Their Gikai (‘assembly’) app illustrates the point. It provides a portal for constituents to research bills, using AI to generate summaries, to describe their impacts, to surfacing media reporting on the issue, and to answer users’ questions. Like all their software, it’s open source and free for anyone, in any party, to use.

After last week’s victory, Team Mirai now has about $5 million in public funding and ambitions to grow the influence of their digital democracy platform. Anno told us Team Mirai has secured an agreement with the LDP, Japan’s dominant ruling party, to begin using Team Mirai’s Gikai and corruption-fighting Mirumae financial transparency tool.

AI is the issue driving the most societal and economic change we will encounter in our lifetime, yet US political parties are largely silent. But AI and Big Tech companies and their owners are ramping up their political spending to influence the parties. To the extent that AI has shown up in our politics, it seems to be limited to the question of where to site the next generation of data centers and how to channel populist backlash to big tech.

Those are causes worthy of political organizing, but very few US politicians are leveraging the technology for public listening or other pro-democratic purposes. With the midterms still nine months away and with innovators like Team Mirai making products in the open for anyone to use, there is still plenty of time for an American politician to demonstrate what a new politics could look like.

This essay was written with Nathan E. Sanders, and originally appeared in Tech Policy Press.

How Generali Malaysia optimizes operations with Amazon EKS

Post Syndicated from Antoine Boucherie original https://aws.amazon.com/blogs/architecture/how-generali-malaysia-optimizes-operations-with-amazon-eks/

This post is co-authored with Ivan Amemoutou, DevOps and Cloud Lead at Generali Malaysia (“Generali”).

The insurance industry’s shift to cloud computing has accelerated the development and expansion of digital services. To support this transformation, insurers are modernizing their technology stack with solutions that enhance scalability, portability, and operational efficiency. This digital evolution is driven by growing customer expectations for seamless insurance services across all touchpoints. Generali faced this industry-wide challenge head-on, needing both to migrate their legacy applications to the cloud and meet increasing demands for new digital services. To address these needs, they embraced a modern approach by implementing containerized microservices architecture, significantly improving their operational capabilities and service delivery.

Generali started its migration to AWS in 2019. They selected Amazon Elastic Kubernetes Service (Amazon EKS) as the target container service for their modernized applications for its capabilities as an enterprise-grade container management solution and its seamless integration with other AWS services. Previous experience of the Generali DevOps and Cloud team was also a strong factor in selecting Amazon EKS. Although the selection of the target platform was straightforward, the main challenge Generali was facing was to enable the scale of adoption while maintaining a lean operational base.

Today, digital applications and several core insurance solutions are hosted on their EKS clusters, making it an important piece of infrastructure for the company. In this post, we look at how Generali is using Amazon EKS Auto Mode and its integration with other AWS services to enhance performance while reducing operational overhead, optimizing costs, and enhancing security.

Solution overview

Generali strives to implement Amazon EKS best practices and actively align their implementation with the AWS Well-Architected Framework. To that end, they follow the six pillars of Operational Excellence, Security, Reliability, Performance Efficiency, Cost Optimization, and Sustainability to build a robust and scalable platform. By applying Well-Architected principles to their EKS environment, Generali benefits from improved system resilience through automated operations and monitoring, enhanced security through AWS Identity and Access Management (IAM) integration and network policies, optimized costs through right-sizing and automatic scaling, and sustainable practices that minimize their environmental impact while maintaining high performance and reliability.

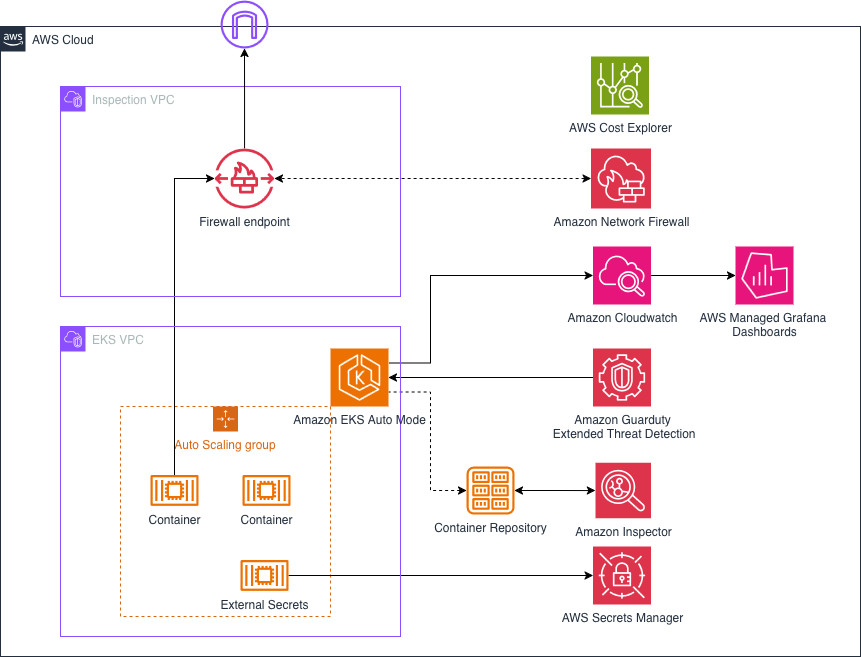
The following diagram illustrates the architecture of their EKS cluster and some of its integration points with different AWS services.AWS security and monitoring architecture diagram showing integration between Inspection VPC and EKS VPC with multiple AWS services for container workload protection and observability.

This solution offers the following benefits:

  • Simplified management of multiple containerized applications
  • Automated node provisioning and scaling
  • Enhanced security integration
  • Optimized resource utilization and simplified cost management
  • Granular multi-tenant observability

In the following sections, we discuss the integration with AWS services in more detail and how these components align with the AWS Well-Architected Framework.

Operational Excellence, Reliability, and Performance Efficiency with Amazon EKS Auto Mode

Generali faced challenges managing their expanding portfolio of containerized applications. The growth of their containerized services introduced operational inefficiencies and complexities: multiple applications from multiple tenants created operational overhead from manual orchestration and scaling to infrastructure maintenance, making it difficult to optimize costs while enforcing security and compliance across diverse application stacks. These challenges led to over-provisioning of resources and inconsistent security postures across different containerized environments.

To address these pain points, Generali has been adopting Amazon EKS Auto Mode, which automates their cluster infrastructure management, provides production-ready environments with minimal operational overhead, dynamically scales resources based on application demands, and implements consistent security practices with automated upgrades, so their teams can focus on application development rather than infrastructure complexity.

EKS Auto Mode manages the underlying nodes, load balancers, and storage configuration automatically. EKS Auto Mode takes care of scaling the cluster depending on the need of the workloads, while optimizing cost across a set of Amazon Elastic Compute Cloud (Amazon EC2) instances types selected by Generali in the node pools configuration.

With EKS Auto Mode’s expanded Shared Responsibility Model, compared to non-Auto Mode clusters, it also takes care of the patching of the underlying operating system (Bottlerocket), the different Amazon EKS add-ons installed by default, and the upgrade of the cluster, so Generali DevOps and Cloud team can focus on supporting their application teams.

While starting up EKS Auto Mode, the Generali DevOps and Cloud team had to adjust their operations to allow for those new features. For example, EKS Auto Mode releases a new version of its AMI, which automatically upgrades nodes on a regular basis, usually every week. To do so, nodes are terminated to be replaced with upgraded ones. The team had to create disruption control configurations to prevent those disruptions from impacting workloads. For example, they specified a maintenance window during off-peak hours for those upgrades. They also specified Pod Disruption Budgets and Node Disruptions Budgets to make sure critical applications would not see all the pods of a micro-service being terminated at the same time. The team can then focus on monitoring the current services and making sure they stay compliant with upcoming Amazon EKS upgrades, an activity that usually takes a fair amount of time every quarter, which is now automated with EKS Auto Mode.

Finally, the Generali DevOps and Cloud team also follow several principles to maintain reliability of their applications: they only allow stateless micro-services, they treat the underlying pods as immutable, they use Helm chart as a standardize deployment mechanism, and they use Horizontal Pod Autoscaler (HPA) to scale services based on traffic.

Security using Amazon GuardDuty, Amazon Inspector, Amazon Network Firewall, and AWS Secrets Manager

Generali implemented Amazon GuardDuty Extended Threat Detection for their EKS clusters to automatically correlate security signals across Amazon EKS audit logs, runtime behaviors, malware execution, and AWS API activity to identify sophisticated multistage attacks that traditional monitoring approaches often miss. By enabling both Amazon GuardDuty Amazon EKS protection and runtime monitoring, Generali gained comprehensive visibility into complex attack patterns such as container exploitation, privilege escalation, and unauthorized movement within their Kubernetes environment, with detailed timelines mapped to MITRE ATT&CK tactics and techniques. The benefits Generali realizes include reduced investigation time through consolidated security insights, rapid assessment of which containerized infrastructure components require immediate attention, and the ability to prioritize remediation efforts on the most critical affected resources while minimizing the potential blast radius of Amazon EKS targeted attacks.

Generali also uses the new Amazon Inspector capability to map Amazon ECR images to running containers, helping their security teams prioritize vulnerabilities based on containers currently running in their environment rather than just identifying vulnerabilities in repository images. The enhanced service provides Generali with visibility into which container images are actively running across their EKS environments, including cluster Amazon Resource Names (ARNs), the number of EKS pods where images are deployed, and last in-use dates for each vulnerability finding. The key benefits Generali realizes include the ability to prioritize remediation efforts based on actual container usage patterns rather than repository events alone, and comprehensive vulnerability management across container images.

Generali set up AWS Network Firewall to filter outbound HTTPS traffic from applications hosted on their EKS cluster by restricting outbound connections to only a set of hostnames provided by Server Name Indication (SNI) in the allow list, deploying their EKS cluster in private subnets with Network Firewall endpoints in public subnets and NAT gateways in protected subnets. The benefits Generali realizes include enhanced security through egress filtering that monitors and restricts outbound network traffic based on certificate hostnames rather than changing IP addresses, the ability to collect and analyze hostnames accessed by applications through Amazon CloudWatch alert logs for traffic pattern analysis, and improved compliance with security requirements by making sure applications can only access approved external services.

Getting secrets into pods can be done either through environment variables or as mounted volumes. Hard-coding them directly into the deployment template is not recommended, and it is better to store them in AWS Secret Manager and retrieve them dynamically. As a best practice and to reduce operational complexity, Generali choses to only host stateless containers in their cluster, alleviating the need for storage volume. To that end, the best option is to retrieve secrets dynamically and add them as environment variables to the pod. To do so, they implemented the External Secrets Operator on their EKS cluster to use Secrets Manager for centralized secret management, which reads the necessary secrets and automatically stores them as Kubernetes secrets without requiring application code changes or daemonsets. The benefits Generali realizes include improved security, management, and auditability of secret usage through centralized secret management outside their Kubernetes clusters and automatic secret synchronization on a recurring basis to capture credential rotations.

Cost Optimization using tags and Savings Plans

Although EKS Auto Mode already offers some cost optimization features, it’s important for Generali to keep track of resource consumption per business project. To that end, Generali uses AWS Billing split cost allocation data for Amazon EKS to analyze and allocate costs using the AWS Billing Console, gaining insights into Kubernetes costs alongside other AWS spend. The feature allows for split along cost allocation tags for some Kubernetes attributes. These tags include aws:eks:cluster-name, aws:eks:deployment, aws:eks:namespace, and aws:eks:node, so the company can map Amazon EKS consumption against lines of business and applications.

Generali also takes advantage of the following:

Operational Excellence and observability using custom dashboards in Amazon Managed Grafana

Hosting multiple projects from multiple business unit means that different application owners need their own custom analytics dashboards. To provide per-project granularity, Generali uses the integration between CloudWatch and Amazon Managed Grafana to create observability dashboards per EKS namespace. By connecting CloudWatch as a data source in Amazon Managed Grafana, they can visualize Amazon EKS metrics, logs, and traces through Grafana’s powerful visualization capabilities without managing the underlying Grafana infrastructure. Through this integration, Generali can create unified views of cluster health, node performance, pod resource utilization, and application performance indicators, while using Grafana’s advanced alerting and templating features for dynamic dashboard creation.

Lessons learned

Generali’s adoption of EKS Auto Mode, combined with integrated AWS security services and comprehensive observability tools, has transformed their container operations from a complex, manually managed environment to an automated, secure, and efficient platform. The integration with services like GuardDuty, Amazon CloudWatch Container Insights, and Amazon Managed Grafana has created a cohesive ecosystem that maximizes operational efficiency while minimizing management overhead. This transformation has helped the Generali DevOps and Cloud team shift its focus from infrastructure maintenance to strategic application support, resulting in improved security posture, cost optimization, and overall platform reliability.Generali realized the following key benefits:

  • Significant reduction in operational overhead with EKS Auto Mode
  • Enhanced security with automated threat detection and response
  • Reduction in infrastructure costs through optimization
  • Improved mean-time-to-resolution
  • Accelerated application deployment cycles

Conclusion

Amazon EKS Auto Mode has proven to be a transformative service for Generali, helping them build a modern, secure, and efficient container environment that aligns with AWS Well-Architected best practices. With EKS Auto Mode and its integration with AWS services like GuardDuty, Amazon Inspector, and CloudWatch, Generali created a robust foundation that not only enhances their security posture and operational efficiency but also optimizes costs. The Generali DevOps and Cloud team is now able to focus on applications teams’ support with expansion plans to host AI models and upcoming agentic applications.As organizations continue their cloud-based journey, Generali’s experience demonstrates how AWS’s comprehensive container services can help enterprises focus on innovation and business value while maintaining operational excellence, security, and cost-efficiency at scale.

If you’re interested in learning more about Amazon EKS, refer to Amazon EKS Best Practices Guide.

About Generali Malaysia

Generali Malaysia is one of the largest general insurers and an emerging life insurer in the country, dedicated to delivering best in class general and life insurance protection solutions for individuals, families, and businesses. As part of the Generali Group, a global insurance leader with over 190 years of heritage, Generali Malaysia carries forward a deep legacy of protection, service excellence, and innovation.

Today, the company is supported by more than 1,600 employees, over 9,000 agents and partners, and an extensive network of branches nationwide. Guided by its ambition to be a trusted Lifetime Partner, Generali Malaysia is committed to its purpose of empowering lives and dreams. The company continues to drive excellence by leveraging AI, data, and customer centric solutions, while embedding sustainability at the heart of its business.


About the authors

Best practices for Lambda durable functions using a fraud detection example

Post Syndicated from Debasis Rath original https://aws.amazon.com/blogs/compute/best-practices-for-lambda-durable-functions-using-a-fraud-detection-example/

AWS Lambda durable functions extend the Lambda programming model to build fault-tolerant multi-step applications and AI workflows using familiar programming languages. They preserve progress despite interruptions and execution can suspend for up to one year, for human approvals, scheduled delays, or other external events, without incurring compute charges for on-demand functions.

This post walks through a fraud detection system built with durable functions. It also highlights the best practices that you can apply to your own production workflows, from approval processes to data pipelines to AI agent orchestration. You will learn how to handle concurrent notifications, wait for customer responses, and recover from failures without losing progress. If you are new to durable functions, check out the Introduction to Durable Functions blog post first.

Fraud detection with human-in-the-loop

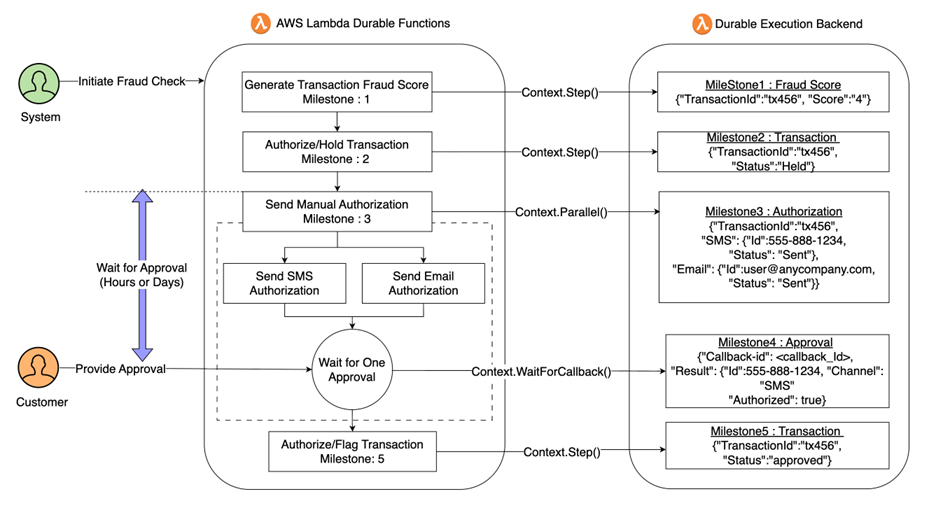
Consider a credit card fraud detection system, which uses an AI agent to analyze incoming transactions and assign risk scores. For ambiguous cases (medium-risk scores), the system needs human approval before authorizing a transaction. The workflow branches based on risk:

  • Low risk (score < 3): Authorize immediately
  • High risk (score ≥ 5): Send to the fraud department immediately
  • Medium risk (score 3–4): Suspend transaction, send SMS and email to cardholder, wait up to 24 hours for confirmation (wait time is customizable)
Figure 1. Agentic Fraud Detection with durable Lambda functions

Figure 1. Agentic Fraud Detection with durable Lambda functions

With human-in-the-loop workflows, response times can vary from minutes to hours. These delays introduce the need to durably preserve the state without consuming compute resources while waiting. With financial systems, we must also implement idempotency to guard against duplicate messages (invocations) and recover from failures without reprocessing completed work. To address these requirements, developers implement polling patterns with external state stores like Amazon DynamoDB or Amazon Simple Storage Service (Amazon S3) to manage idempotency, pay for idle compute while waiting for callbacks, introduce external orchestration components, or build asynchronous message-driven systems to handle long-processing tasks.

Lambda durable functions provide a new alternative to address these challenges through durable execution, a pattern that uses checkpoints (saved state snapshots) to preserve progress and replays from saved state to recover from failures or resume after waiting. With checkpointing capabilities, you no longer need to pay Lambda compute charges while waiting, whether for callbacks, scheduled delays, or external events. Learn how to implement durable functions using the complete fraud detection implementation at this GitHub repository. You can deploy it to your AWS account and experiment with the code as you read. The repository includes deployment instructions, sample data, and helper functions for testing.

As we walk through the code, we’ll focus on best practices for designing workflows with durable execution and how to apply these patterns correctly in production workflows.

Design steps to be idempotent

Durable execution is designed to preserve progress through checkpoints and replay, but that reliability model means step logic can execute more than once. When steps retry, how do you prevent duplicate actions like charges to the credit card or repeated customer SMS or email notifications?

Durable functions use at-least-once execution by default, executing each step at least one time, potentially more if failures occur. When a step fails, it retries. There are two strategies to design idempotent steps that prevent duplicate side effects: using external API idempotency keys and using the at-most-once step semantics built into durable functions.

Strategy A: External API Idempotency Keys

// Strategy A: Use external API idempotency keys
await context.step(`authorize-${tx.id}`, async () => {
  return payment.charges.create({
    amount: tx.amount,
    currency: 'usd',
    idempotency_key: `tx-${tx.id}`, // Prevents duplicate charges
    description: `Transaction ${tx.id}`
  });
});

Notice the configuration:

  • idempotency_key in API call: If the step retries, the payment processor recognizes it’s a duplicate request and returns the original result
  • Defense in depth: Two layers of protection: Lambda checkpointing and external API idempotency

Each layer provides independent protection. If Lambda’s checkpoint fails, the external API prevents duplicate charges. For legacy systems without idempotency support, where it’s critical that an operation is not executed more than once, use at-most-once semantics:

Strategy B: Use At-Most-Once Semantics

For legacy systems without idempotency support, use at-most-once execution, a delivery feature that executes each step zero or one time, never more:

// Strategy B: At-most-once step semantics
await context.step("charge-legacy-system", async () => {
  return await legacyPaymentSystem.charge(tx.amount);
}, {
  semantics: StepSemantics.AtMostOncePerRetry,
  retryStrategy: createRetryStrategy({ maxAttempts: 0 })
});

This checkpoints before step execution, preventing the step from re-execution on retries. The tradeoff? If the step fails, you must decide whether to retry (risking duplicates) or fail the entire workflow.

Use idempotency for critical side effects like payment processing, database writes, external API calls, state transitions, and resource provisioning. Read more about idempotency here.

Prevent duplicate executions with DurableExecutionName

Idempotent steps prevent duplicate side effects within a single execution, but what about duplicate workflow executions running concurrently? For example, duplicate messages in the queue, users clicking “Submit” multiple times in the UI, or the same event arriving via multiple channels like webhook and API. Without protection, each invocation creates a separate durable execution, potentially running the fraud check multiple times, sending duplicate notifications, and creating confusion about which execution is authoritative. Durable functions provide DurableExecutionName to help ensure only one concurrent execution per unique name.

// Invoke fraud detection function with execution name
await lambda.invoke({
  FunctionName: 'fraud-detection',
  InvocationType: 'Event',
  DurableExecutionName: `tx-${transactionId}`,
  Payload: JSON.stringify({
    id: transactionId,
    amount: 6500,
    location: 'New York, NY',
    vendor: 'Amazon.com'
  })
});

Notice the configuration:

  • DurableExecutionName: tx-${transactionId}: Uses the transaction ID as a unique execution identifier
  • InvocationType: ‘Event’: Asynchronous invocation supports long-running workflows beyond 15 minutes
  • One execution per transaction: If three invocations arrive with the same transaction ID, only the first creates an execution. Subsequent requests with the same execution name and payload receive an idempotent response returning the existing execution’s ARN, rather than creating a new execution.

Lambda durable functions work with Lambda event sources, including event source mappings (ESM) such as Amazon Simple Queue Service (Amazon SQS), Amazon Kinesis, and DynamoDB Streams. ESMs invoke durable functions synchronously and inherit Lambda’s 15-minute invocation limit. Therefore, like direct Request/Response invocations, durable functions executions using event source mappings cannot exceed 15 minutes.

For workflows exceeding 15 minutes, use an intermediary Lambda function between the event source mapping and durable function:

// Intermediary function for SQS -> Durable function
export const handler = async (event) => {
  for (const record of event.Records) {
    const transaction = JSON.parse(record.body);
    await lambda.invoke({
      FunctionName: process.env.FRAUD_DETECTION_FUNCTION,
      InvocationType: 'Event',
      DurableExecutionName: `tx-${transaction.id}`,
      Payload: JSON.stringify(transaction)
    });
  }
};

This removes the 15-minute limit, allows executions up to one year, and enables custom execution name parameters for idempotency. Use Powertools for AWS Lambda to prevent duplicate invocations of the durable function when the event source mapping retries the intermediary function. Additionally, configure failure handling for your event source to capture failed invocations for future redrive or replay. For example, dead letter queues for SQS, or on-failure destinations for other event sources.

Match timeouts to invocation type

One important configuration detail ties these patterns together: matching your timeout settings to your invocation type. Lambda synchronous invocations (RequestResponse) have a hard 15-minute timeout limit. If you configure a durable execution to run for 24 hours but invoke it synchronously, the synchronous invocation fails immediately with an exception. Durable functions support workflows up to one year when invoked asynchronously.

// Lambda function configuration
{
  FunctionName: 'fraud-detection',
  Timeout: 300,
  MemorySize: 512,
  DurableConfig: {
    ExecutionTimeout: 90000
  }
}

And invoke asynchronously:

// Async invocation for long-running workflow
await lambda.invoke({
  FunctionName: 'fraud-detection',
  InvocationType: 'Event',
  DurableExecutionName: `tx-${transactionId}`,
  Payload: JSON.stringify(transaction)
});

Notice the configuration:

  • Timeout: 300: Lambda function timeout (5 minutes in this example, up to a maximum of 15 minutes). This defines the maximum duration for each active execution phase, including the initial invocation and any subsequent replays. Set this to cover the longest expected active processing time in your workflow.
  • ExecutionTimeout: { hours: 25 }: Durable execution timeout covers the workflow’s expected total duration including suspension periods. Set this slightly above the longest wait timeout to avoid edge cases.
  • InvocationType: ‘Event’: Asynchronous invocation removes the 15-minute limit and enables executions up to one year.

The Lambda function timeout applies to active execution phases (AI calls, notification sending). During suspension (waiting for callbacks), the function isn’t running, so this timeout doesn’t apply. Setting the durable execution timeout to a meaningful boundary prevents workflows from running longer than expected. Without an explicit timeout, executions can run up to the maximum lifetime of one year.

Synchronous (RequestResponse) Asynchronous (Event)
Total duration Under 15 minutes Up to 1 year
Caller needs result Yes No
Idempotency support Yes Yes
Waits with suspension Yes Yes

Execute Concurrent Operations with context.parallel()

In the fraud detection workflow, the system notifies the cardholder through multiple channels such as SMS and email. Preserving business logic when executing parallel workflows introduces code complexities such as managing execution state across branches, handling synchronization, and coordinating branch completion. Durable functions simplify parallel workflow implementation using context.parallel(), which executes branches concurrently while maintaining durable checkpoints for each branch and provides configurable options to handle partial completions. By checkpointing and managing the state internally, durable functions help make sure that the state is preserved even if there are retries or failures. Note that context.parallel() manages the internal execution state for each branch. If your branches interact with a shared external state (such as a database), you’re responsible for managing concurrent access to that external state.

// Human-in-the-loop: verify via email AND SMS (first response wins)
let verified = await context.parallel("human-verification", [
  (ctx) => ctx.waitForCallback("SendVerificationEmail",
    async (callbackId) => sendCustomerNotification(callbackId, 'email', tx)
  ),
  (ctx) => ctx.waitForCallback("SendVerificationSMS",
    async (callbackId) => sendCustomerNotification(callbackId, 'sms', tx)
  )
], {
  maxConcurrency: 2,
  completionConfig: {
    minSuccessful: 1 // Continue after 1 success
  }
});

Notice the configuration:

  • maxConcurrency: 2: Both notifications sent at the same time
  • minSuccessful: 1: We only need one channel to succeed, whichever responds first wins

Each parallel branch waits for its callback independently, and the durable execution checkpoints each branch as part of the execution state. Using the minSuccessful parameter, you control the minimum number of successful branch executions required for the parallel operation to complete. In this example, only one of the two branches needs to succeed. Verifications through SMS or email are both valid, and the workflow resumes as soon as either channel completes successfully. We call this the first-response-wins pattern. This pattern works well when you only need a single successful result from any parallel branch and want the remaining branches to stop blocking progress.

But what happens if neither channel responds? Without timeouts, this workflow could remain suspended for up to the configured execution lifetime.

Always configure callback timeouts

Let’s add timeout protection to the parallel verification from the previous section. context.waitForCallback() accepts a timeout option that bounds how long each branch waits before throwing an exception. By wrapping the parallel call in a try/catch, you can implement fallback logic when users don’t respond in time.

// Enhanced: parallel verification with timeout and error handling
let verified;
try {
  verified = await context.parallel("human-verification", [
    (ctx) => ctx.waitForCallback("SendVerificationEmail",
      async (callbackId) => sendCustomerNotification(callbackId, 'email', tx),
      { timeout: { days: 1 } }  // Wait up to 1 day for email response
    ),
    (ctx) => ctx.waitForCallback("SendVerificationSMS",
      async (callbackId) => sendCustomerNotification(callbackId, 'sms', tx),
      { timeout: { days: 1 } }  // Wait up to 1 day for SMS response
    )
  ], {
    maxConcurrency: 2,
    completionConfig: {
      minSuccessful: 1
    }
  });
} catch (error) {
  const isTimeout = error.message?.includes("timeout");
  if (isTimeout) {
    context.logger.warn("Customer verification timeout", { error, txId: tx.id });
    // Fallback: escalate to fraud department
    return await context.step("sendToFraudDepartment", async () =>
      sendToFraudDepartment(tx, true)
    );
  }
  throw error; // Re-throw non-timeout errors
}

Notice what changed from the previous section:

  • timeout: { days: 1 }: Each callback branch now has a maximum wait time of 1 day. If neither the email nor SMS callback arrives within that window, a timeout exception is thrown.
  • try/catch with timeout detection: The catch block distinguishes between timeout errors and other exceptions. When a timeout occurs, the workflow implements fallback logic by escalating the transaction to the fraud department, while non-timeout errors are re-thrown to be handled by the durable execution retry mechanism.

Without this error handling, the entire execution fails unhandled. The timeout also works with the minSuccessful configuration: if one branch times out but the other succeeds, the parallel operation still completes successfully since only one successful result is required.

For advanced use cases where the callback handler performs long-running work, you can also configure a heartbeatTimeout to detect stalled callbacks before the main timeout expires. See the Lambda Developer Guide for details.

Use callback timeouts for human approvals, external API callbacks, asynchronous processing, and third-party integrations.

Putting it all together: complete fraud detection implementation

Now let’s see how all the best practices work together in the complete fraud detection workflow:

import { withDurableExecution } from "@aws/durable-execution-sdk-js";
import { BedrockAgentCoreClient, InvokeAgentRuntimeCommand } from "@aws-sdk/client-bedrock-agentcore";

const agentRuntimeArn = process.env.AGENT_RUNTIME_ARN;
const agentRegion = process.env.AGENT_REGION || 'us-east-1';
const client = new BedrockAgentCoreClient({ region: agentRegion });

export const handler = withDurableExecution(async (event, context) => {
  const tx = {
    id: event.id,
    amount: event.amount,
    location: event.location,
    vendor: event.vendor
  };

  // AI fraud assessment with error handling
  tx.score = await context.step("fraudCheck", async () => {
    try {
      const payloadJson = JSON.stringify({ input: { amount: tx.amount } });
      const command = new InvokeAgentRuntimeCommand({
        agentRuntimeArn: agentRuntimeArn,
        qualifier: 'DEFAULT',
        payload: Buffer.from(payloadJson, 'utf-8'),
        contentType: 'application/json',
        accept: 'application/json'
      });
      const response = await client.send(command);
      const responseText = await response.response.transformToString();
      const result = JSON.parse(responseText);
      return result?.output?.risk_score ?? 5;  // Default to high-risk if score unavailable
    } catch (error) {
      context.logger.error("Fraud check failed", { error, txId: tx.id });
      return 5;
    }
  });

  // Route based on AI decision
  if (tx.score < 3) {
    // Best Practice: Idempotent authorization
    return await context.step(`authorize-${tx.id}`, async () =>
    authorizeTransaction(tx, { idempotency_key: `tx-${tx.id}` })
    );
  }

  if (tx.score >= 5) {
    return await context.step(`sendToFraudDepartment-${tx.id}`, async () =>
      sendToFraudDepartment(tx)
    );
  }

  // Medium risk: need human verification
  await context.step(`suspend-${tx.id}`, async () => suspendTransaction(tx));

  // Best Practice: Concurrent operations with timeout configuration
  let verified;
  try {
    verified = await context.parallel("human-verification", [
      (ctx) => ctx.waitForCallback("SendVerificationEmail",
        async (callbackId) => sendCustomerNotification(callbackId, 'email', tx),
        { timeout: { days: 1 } }
      ),
      (ctx) => ctx.waitForCallback("SendVerificationSMS",
        async (callbackId) => sendCustomerNotification(callbackId, 'sms', tx),
        { timeout: { days: 1 } }
      )
    ], {
      maxConcurrency: 2,
      completionConfig: {
        minSuccessful: 1
      }
    });
  } catch (error) {
    const isTimeout = error.message?.includes("timeout");
    context.logger.warn(
      isTimeout ? "Customer verification timeout" : "Customer verification failed",
      { error, txId: tx.id }
    );
    return await context.step(`timeout-escalate-${tx.id}`, async () =>
      sendToFraudDepartment(tx, true)
    );
  }

  // Idempotent final step with idempotency key
  return await context.step(`finalize-${tx.id}`, async () => {
    const action = !verified.hasFailure && verified.successCount > 0
      ? "authorize"
      : "escalate";
    if (action === "authorize") {
      return authorizeTransaction(tx, true, { idempotency_key: `finalize-${tx.id}` });
    }
    return sendToFraudDepartment(tx, true);
  });
});

Notice how the best practices work together: context.parallel() sends SMS and email concurrently, resuming when either channel responds. Both callbacks configure 1-day timeouts with try/catch handling that escalates on timeout. The DurableExecutionName: tx-${transactionId} parameter (specified at invocation time, shown in the following CLI example) provides execution-level deduplication, while idempotency keys in the authorization steps prevent duplicate charges at the application layer. Asynchronous invocation (InvocationType: 'Event') enables the 24-hour wait period.

Once deployed, invoke the function asynchronously with a sample transaction to see it in action:

transactionId="123456789"
aws lambda invoke \
  --function-name "fraud-detection:$LATEST" \
  --invocation-type Event \
  --durable-execution-name "tx-${transactionId}" \
  --cli-binary-format raw-in-base64-out \
  --payload "{\"id\": \"${transactionId} \", \"amount\": 6500, \"location\": \"New York, NY\", \"vendor\": \"Amazon.com\"}" \
  --region us-east-2 \
  response.json

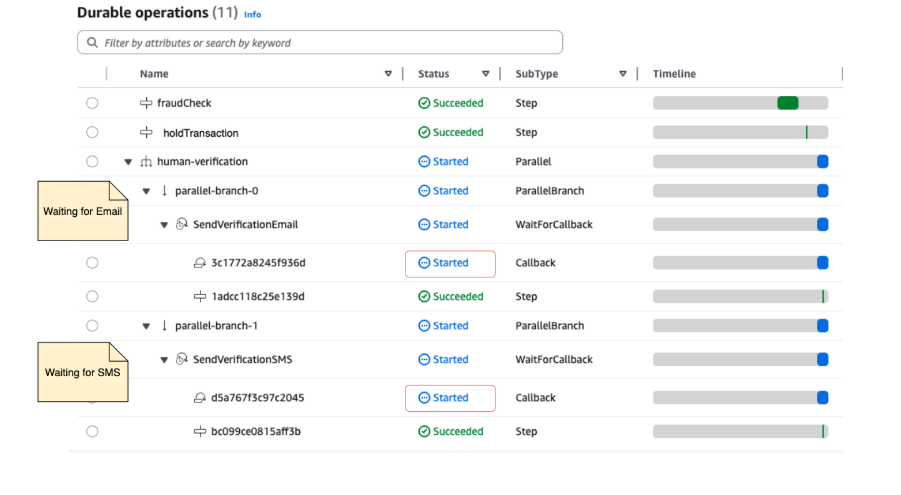
Upon successful invocation, you can view the execution state in the Lambda console’s durable operations view. The execution shows a suspended state, waiting for customer response:

Figure 2: Suspended execution state

Figure 2: Suspended execution state

Notice the fraudCheck and suspendTransaction steps show as succeeded with checkpointed results. The human-verification parallel operation shows that both SMS and email branches started. The timeline shows the function in a suspended state. Simulate a customer response by sending a callback success through the console, AWS Command Line Interface (AWS CLI) or Lambda API:

aws durable-lambda send-durable-execution-callback-success \
  --callback-id <CALLBACK_ID_FROM_EMAIL_OR_SMS> \
  --result '{"status":"approved","channel":"email"}' \
  --cli-binary-format raw-in-base64-out
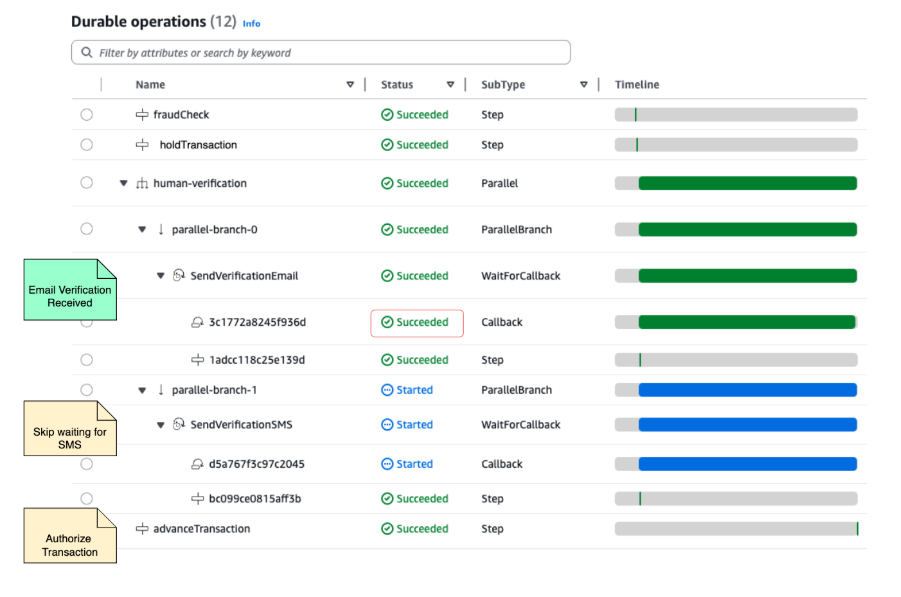
Figure 3: Completed execution with customer approval

Figure 3: Completed execution with customer approval

After receiving the customer’s approval, the durable execution resumes from its checkpoint, authorizes the transaction, and completes. The execution spanned hours but consumed only seconds of compute time.

Conclusion

With durable functions, Lambda extends beyond single-event processing to power core business processes and long-running workflows, while retaining the operational simplicity, reliability, and scale that define Lambda. You can build applications that run for days or months, survive failures, and resume where they left off, all within the familiar event-driven programming model.

Deploy the fraud detection workflow from our GitHub repository and experiment with human-in-the-loop patterns in your own account. For core concepts, see Introduction to AWS Lambda Durable Functions. For comprehensive documentation, see the Lambda Developer Guide. Browse Serverless Land for reference architectures and discover where durable execution fits in your designs.

Share your feedback, questions, and use cases in the SDK repositories or on re:Post.

CVE-2026-3055: Citrix NetScaler ADC and NetScaler Gateway Out-of-Bounds Read

Post Syndicated from Rapid7 original https://www.rapid7.com/blog/post/etr-cve-2026-3055-citrix-netscaler-adc-and-netscaler-gateway-out-of-bounds-read

Overview

On March 23, 2026, Citrix published a security advisory for a critical vulnerability affecting their NetScaler ADC (formerly Citrix ADC) and NetScaler Gateway (formerly Citrix Gateway) products. This vulnerability, CVE-2026-3055, which is classified as an out-of-bounds read and holds a CVSS score of 9.3, allows unauthenticated remote attackers to leak potentially sensitive information from the appliance’s memory.

The Citrix advisory states that systems configured as a SAML Identity Provider (SAML IDP) are vulnerable, whereas default configurations are unaffected. This SAML IDP configuration is likely a very common configuration for organizations utilizing single sign-on. Per the advisory, organizations can determine if they have an appliance configured as a SAML IDP Profile by inspecting their NetScaler Configuration for the specified string: add authentication samlIdPProfile .*

CVE-2026-3055 affects NetScaler ADC and NetScaler Gateway versions 14.1 before 14.1-66.59 and 13.1 before 13.1-62.23, as well as NetScaler ADC 13.1-FIPS and 13.1-NDcPP before 13.1-37.262. The advisory notes that only customer-managed instances are affected, not cloud instances managed by Citrix.

As of the advisory’s publication, there is no known in-the-wild exploitation and no public proof-of-concept (PoC) available. According to Citrix, the vulnerability was identified internally via security review. However, exploitation of CVE-2026-3055 is likely to occur once exploit code becomes public. Therefore, it is crucial that customers running affected Citrix systems remediate this vulnerability as soon as possible; Citrix software has previously seen memory leak vulnerabilities broadly exploited in the wild, including the infamous “CitrixBleed” vulnerability, CVE-2023-4966, in 2023.

Mitigation guidance

Organizations running affected on-premise instances of NetScaler ADC and NetScaler Gateway should prioritize upgrading to fixed versions on an emergency basis to remediate CVE-2026-3055.

  • Affected components:

    • NetScaler ADC and NetScaler Gateway versions 14.1, fixed in 14.1-66.59.

    • NetScaler ADC and NetScaler Gateway versions 13.1, fixed in 13.1-62.23.

    • NetScaler ADC 13.1-FIPS and 13.1-NDcPP, fixed in 13.1-37.262 (also referred to as 13.1.37.262 in the vendor advisory).

Please read the vendor advisory (CTX696300) for the latest guidance.

Rapid7 customers

Exposure Command, InsightVM, and Nexpose

Exposure Command, InsightVM, and Nexpose customers can assess exposure to CVE-2026-3055 on Citrix NetScaler ADC with an authenticated vulnerability check expected to be available in the March 24 content release.

Updates

  • March 23, 2026: Initial publication.

Extract data from Amazon Aurora MySQL to Amazon S3 Tables in Apache Iceberg format

Post Syndicated from Kunal Ghosh original https://aws.amazon.com/blogs/big-data/extract-data-from-amazon-aurora-mysql-to-amazon-s3-tables-in-apache-iceberg-format/

If you manage data in Amazon Aurora MySQL-Compatible Edition and want to make it available for analytics, machine learning (ML), or cross-service querying in a modern lakehouse format, you’re not alone.

Organizations often need to run analytics, build ML models, or join data across multiple sources. These are examples of workloads that can be resource-intensive and impractical to run directly against a transactional database. By extracting your Aurora MySQL data into Amazon S3 Tables in Apache Iceberg format, you can offload analytical queries from your production database without impacting its performance, while storing data in a fully managed Iceberg table store optimized for analytics. Built on the open Apache Iceberg standard, Amazon Simple Storage Service (Amazon S3) Table data is queryable from engines like Amazon Athena, Amazon Redshift Spectrum, and Apache Spark without additional data copies. You can also combine relational data with other datasets already in your data lake, enabling richer cross-domain insights.

Apache Iceberg and Amazon S3 Tables

Apache Iceberg is a widely adopted open table format that offers Atomicity, Consistency, Isolation, Durability (ACID) transactions, schema evolution, and time travel capabilities. It enables multiple engines to work concurrently on the same dataset, making it a popular choice for building open lakehouse architectures.

Amazon S3 Tables is a purpose-built, fully managed Apache Iceberg table store designed for analytics workloads. It delivers up to 3x faster query performance and up to 10x more transactions per second compared to self-managed Iceberg tables. It also automatically compacts data and removes unreferenced files to optimize storage and performance.

In this post, you learn how to set up an automated, end-to-end solution that extracts tables from Amazon Aurora MySQL Serverless v2 and writes them to Amazon S3 Tables in Apache Iceberg format using AWS Glue. The entire infrastructure is deployed using a single AWS CloudFormation stack.

Requirements

AWS offers zero-ETL integrations from Amazon Aurora to Amazon Redshift and Amazon SageMaker AI, enabling seamless data flow for analytics and machine learning workloads.

However, there isn’t yet a native zero-ETL integration between Amazon Aurora and Amazon S3 Tables. This means that organizations looking to use Amazon S3 Tables for their Lakehouse architecture currently face several requirements:

  • Setting up ETL pipelines to extract data from Amazon Aurora and transform it into Apache Iceberg format
  • Configuring networking and security for AWS Glue jobs to access Amazon Aurora databases in private subnets
  • Coordinating the provisioning of source databases, ETL pipelines, and target table stores
  • Managing the end-to-end workflow without native automation

Solution overview

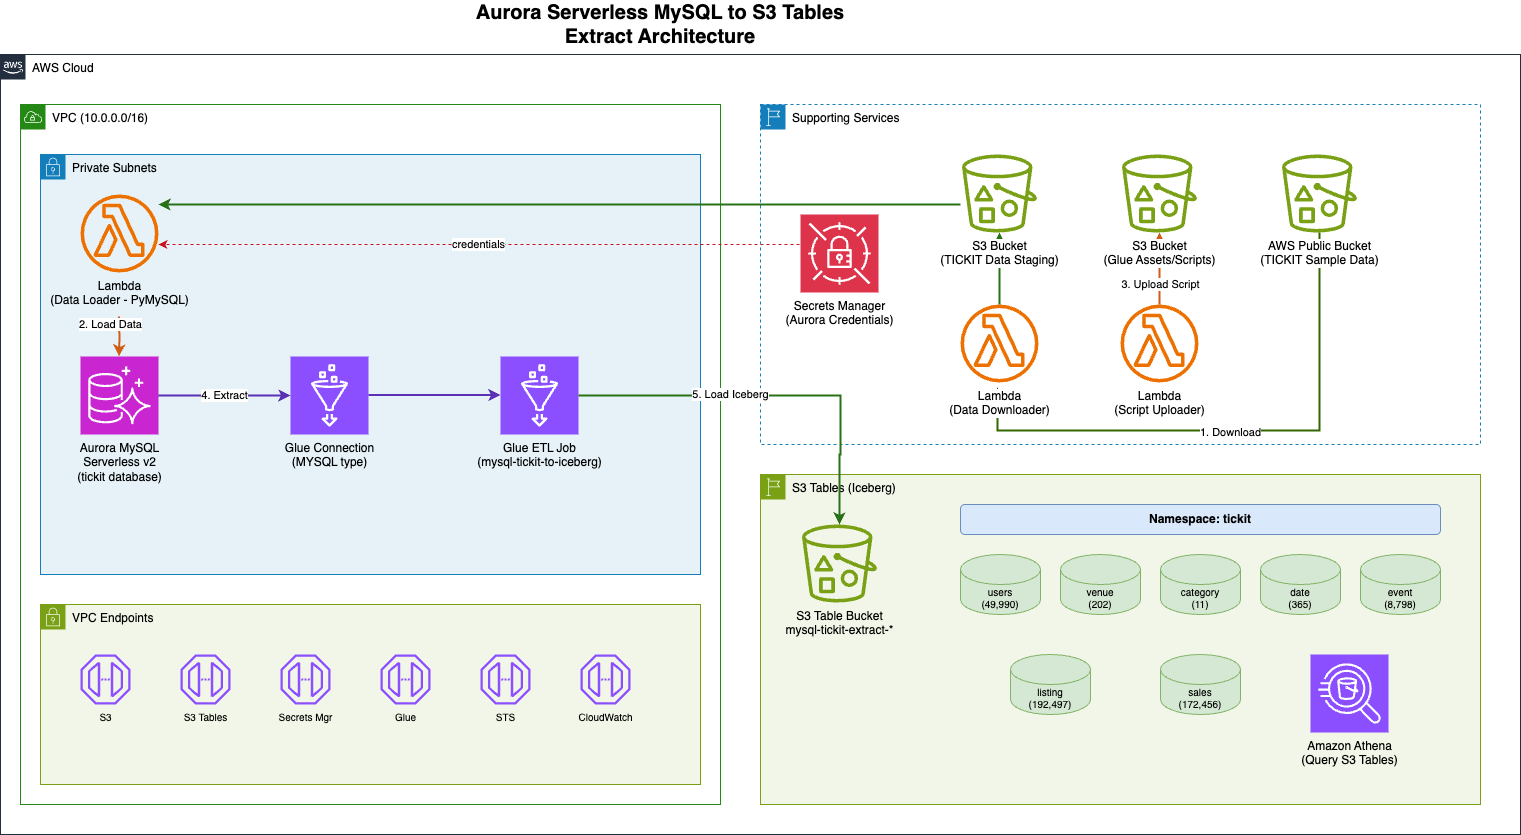
In this solution, you automate the extraction of relational database tables from Amazon Aurora MySQL Serverless v2 to Amazon S3 Tables in Apache Iceberg format using AWS Glue 5.0. To help you get started and test this solution, a CloudFormation template is provided. This template provisions the required infrastructure, loads sample data, and configures the Extract, Transform, Load (ETL) pipeline. You can adapt this template for your own scenario.

Solution overview

Sample data

This solution uses the TICKIT sample database, a well-known dataset used in Amazon Redshift documentation. The TICKIT data models a fictional ticket sales system with seven interrelated tables: users, venue, category, date, event, listing, and sales. The dataset is publicly available as mentioned in the Amazon Redshift Getting Started Guide.

Solution flow

The solution flow as shown in the previous architecture diagram:

  1. An AWS Lambda function downloads the TICKIT sample dataset (a fictional ticket sales system used in Amazon Redshift documentation) from a public Amazon S3 bucket to a staging S3 bucket.
  2. A second Lambda function, using PyMySQL (a Python MySQL client library), loads the staged data files into the Aurora MySQL Serverless v2 database using LOAD DATA LOCAL INFILE.
  3. The AWS Glue job reads seven TICKIT tables from Aurora MySQL through a native MySQL connection and writes them to Amazon S3 Tables in Apache Iceberg format using the S3 Tables REST catalog endpoint with SigV4 authentication.
  4. You can query the migrated data in S3 Tables using Amazon Athena.

The solution consists of the following key components:

  1. Amazon Aurora MySQL Serverless v2 as the source relational database containing the TICKIT sample dataset (users, venue, category, date, event, listing, and sales tables)
  2. AWS Secrets Manager to store the Aurora MySQL database credentials securely
  3. Amazon S3 staging bucket for the TICKIT sample data files downloaded from the public redshift-downloads S3 bucket
  4. AWS Lambda functions using PyMySQL to load data into Aurora MySQL
  5. AWS Glue 5.0 job (PySpark) to read tables from Aurora MySQL and write them to S3 Tables in Apache Iceberg format
  6. Amazon S3 Tables as the target storage for the migrated Iceberg tables
  7. Amazon VPC with private subnets and VPC endpoints for Amazon S3, S3 Tables, AWS Glue, Secrets Manager, AWS Security Token Service (AWS STS), CloudWatch Logs, and CloudFormation

Here are some advantages of this architecture:

  • Fully automated setup: A single CloudFormation stack provisions the required infrastructure, loads sample data, and configures the ETL pipeline.
  • Serverless and cost-efficient: Aurora MySQL Serverless v2 and AWS Glue both scale based on demand, minimizing idle costs.
  • Apache Iceberg table format: Data is stored in Apache Iceberg format, enabling ACID transactions, schema evolution, and time travel queries.
  • Network isolation and credential management: The resources run within private subnets with Virtual Private Cloud (VPC) endpoints, and database credentials are managed through AWS Secrets Manager.
  • Extensible pattern: The same approach can be adapted for other relational databases (PostgreSQL, SQL Server) and other target formats supported by AWS Glue.

Prerequisites

To follow along, you need an AWS account. If you don’t yet have an AWS account, you must create one. The CloudFormation stack deployment takes approximately 30-45 minutes to complete and requires familiarity with Amazon S3 Tables, AWS CloudFormation, Apache Iceberg, AWS Glue, Amazon Aurora. This solution will incur AWS costs. The main cost drivers are AWS Glue ETL job runs (billed per DPU-hour, proportional to data volume) and Amazon S3 Tables storage and request charges. Remember to clean up resources when you are done to avoid unnecessary charges.

CloudFormation parameters

You can configure the following parameters before deploying the CloudFormation stack:

Parameter Description Default Required
S3TableBucketName Name of the S3 Tables bucket to create (or use existing) Yes
DatabaseName Name of the initial Aurora MySQL database tickit No
MasterUsername Master username for Aurora MySQL admin No
VpcCidr CIDR block for the VPC 10.1.0.0/16 No
S3TableNamespace Namespace for S3 Tables tickit No

Implementation walkthrough

The following steps walk you through the implementation. These steps are to deploy and test an end-to-end solution from scratch. If you are already running some of these components, you may skip to the relevant step. You can also refer to the aws-samples repository, sample-to-write-aurora-mysql-to-s3tables-using-glue for the entire solution.

Step 1: Deploy the CloudFormation stack

Deploy the CloudFormation template scripts/aurora-mysql-to-s3tables-stack.yaml using the AWS Console or the AWS Command Line Interface (AWS CLI). Provide a name for the S3 Tables bucket; the stack will create it automatically (or use an existing one if it already exists).

To deploy using the AWS Console (recommended), navigate to the AWS CloudFormation Console and use the CloudFormation template. Alternatively, to deploy using the AWS CLI first upload the template to an S3 bucket (the template exceeds the 51,200 byte limit for inline –template-body), then create the stack.

# Upload the template to S3
aws s3 cp scripts/aurora-mysql-to-s3tables-stack.yaml \
  s3://<your-s3-bucket>/aurora-mysql-to-s3tables-stack.yaml \
  --region <your-region>
# Create the stack using the S3 template URL
aws cloudformation create-stack \
  --stack-name aurora-mysql-tickit-stack \
  --template-url https://<your-s3-bucket>.s3.<your-region>.amazonaws.com/aurora-mysql-to-s3tables-stack.yaml \
  --parameters \
    ParameterKey=S3TableBucketName,ParameterValue=<your-s3-table-bucket-name> \
  --capabilities CAPABILITY_NAMED_IAM \
  --region <your-region>

The stack will automatically:

  • Create the S3 Tables bucket (or use existing if it already exists)
  • Create a VPC with private subnets and VPC endpoints
  • Provision an Aurora MySQL Serverless v2 cluster
  • Download TICKIT sample data from the public Amazon S3 bucket
  • Load the sample data into Aurora MySQL via a Lambda function using PyMySQL
  • Create a Glue job configured to migrate data to S3 Tables in Iceberg format

Note: The S3 Tables bucket is retained when the stack is deleted to preserve your data.

Step 2: Verify the Aurora MySQL data

Retrieve the AuroraClusterEndpoint, DatabaseName, and SecretArn values from the CloudFormation stack, make a note of the AuroraClusterEndpoint, DatabaseName, and SecretArn. You can navigate to the Amazon Aurora Console, choose the Query Editor, and enter the values from the CloudFormation stack to connect. You can also choose your preferred method of connecting to an Amazon Aurora DB cluster.

Use the AWS CLI to retrieve the stack outputs: –

aws cloudformation describe-stacks --stack-name aurora-mysql-tickit-stack --region <your-region> --query "Stacks[0].Outputs"

Then run the following SQL commands to verify the data load:

-- Verify if the tables are created
SELECT * FROM information_schema.tables WHERE table_schema = 'tickit';

-- Verify if the data is loaded
SELECT 'users' AS table_name, COUNT(*) AS record_count FROM tickit.users
UNION ALL SELECT 'venue', COUNT(*) FROM tickit.venue
UNION ALL SELECT 'category', COUNT(*) FROM tickit.category
UNION ALL SELECT 'date', COUNT(*) FROM tickit.date
UNION ALL SELECT 'event', COUNT(*) FROM tickit.event
UNION ALL SELECT 'listing', COUNT(*) FROM tickit.listing
UNION ALL SELECT 'sales', COUNT(*) FROM tickit.sales;

Step 3: Run the Glue job

Navigate to the AWS Glue Console, choose ETL jobs under Data Integration and ETL from the left panel. Select the AWS Glue job mysql-tickit-to-iceberg-job and choose Run job to start execution. You can also start the ETL job using the AWS CLI:

aws glue start-job-run --job-name mysql-tickit-to-iceberg-job --region <your-region>

The AWS Glue job performs the following operations for each of the seven TICKIT tables:

  • Reads the table from Aurora MySQL through the native MYSQL Glue connection
  • Converts the data to a Spark DataFrame
  • Creates the Iceberg table in the S3 Tables namespace using CREATE TABLE IF NOT EXISTS with the USING ICEBERG clause
  • Inserts the data using INSERT INTO (or INSERT OVERWRITE if the table already exists)
  • Verifies the record count and displays sample data

Step 4: Verify the results

After the AWS Glue job completes, verify that the tables have been created in your S3 Table bucket by navigating to the Amazon S3 Console. Choose Table buckets under Buckets and select your S3 Table bucket. You can also verify using the AWS CLI:

aws s3tables list-tables \
  --table-bucket-arn arn:aws:s3tables:<your-region>:<your-account-id>:bucket/<your-s3-table-bucket-name> \
  --namespace tickit \
  --region <your-region>

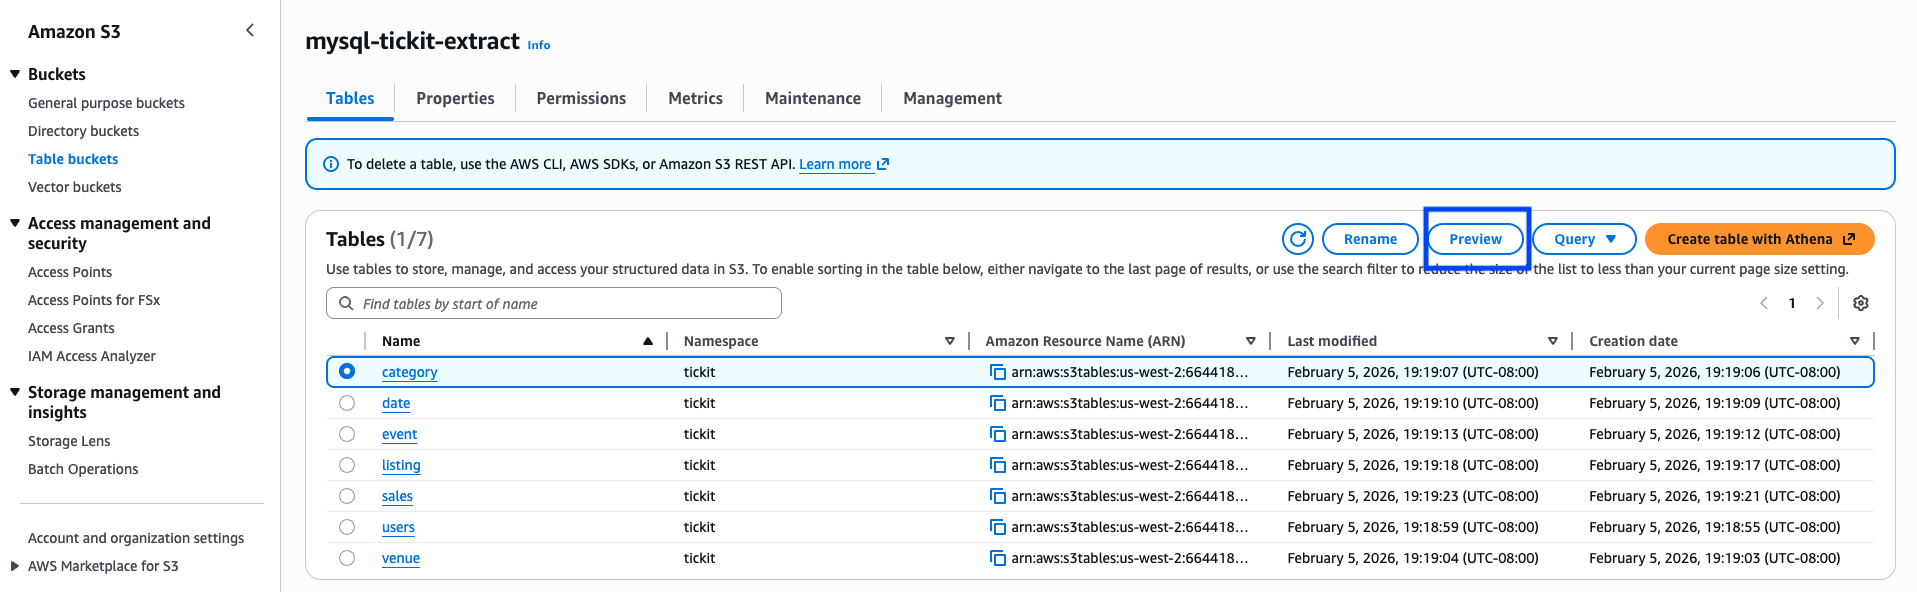
Select a table from the tickit namespace and choose Preview to inspect the data.

Preview S3 data

You can also query the migrated tables using Amazon Athena to validate the data.

Clean up resources

Remember to clean up resources when you no longer need them to avoid unnecessary charges.

Navigate to the CloudFormation console, search for your stack and choose Delete. Alternatively, use the AWS CLI:

aws cloudformation delete-stack --stack-name aurora-mysql-tickit-stack --region <your-region>

The S3 Tables bucket is retained by default. To delete it, use the Amazon S3 console or the AWS CLI to remove the table bucket separately. The staging S3 bucket will be automatically emptied and deleted as part of the stack deletion.

aws s3tables delete-table-bucket --table-bucket-arn arn:aws:s3tables:<your-region>:<your-account-id>:bucket/<your-s3-table-bucket-name> --region <your-region>

Summary

In this post, we showed you how to extract data from Amazon Aurora MySQL Serverless v2 and write it to Amazon S3 Tables in Apache Iceberg format using AWS Glue 5.0. By using the native Iceberg support of AWS Glue and the S3 Tables REST catalog endpoint, you can bridge the gap between relational databases and modern lakehouse storage formats. By automating the entire pipeline through CloudFormation, you can quickly set up and replicate this pattern across multiple environments.

As AWS Glue and Amazon S3 Tables continue to evolve, you can take advantage of future enhancements while maintaining this automated migration pattern.

If you have questions or suggestions, leave us a comment.


About the authors

Kunal Ghosh

Kunal Ghosh

Kunal is a Sr. Solutions Architect at AWS. He is passionate about building efficient and effective solutions on AWS, especially involving generative AI, analytics, data science, and machine learning. Besides family time, he likes reading, swimming, biking, and watching movies.

Arghya Banerjee

Arghya Banerjee

Arghya is a Sr. Solutions Architect at AWS in the San Francisco Bay Area, focused on helping customers adopt and use the AWS Cloud. He is focused on big data, data lakes, streaming and batch analytics services, and generative AI technologies.

Indranil Banerjee

Indranil Banerjee

Indranil is a Sr. Solutions Architect at AWS in the San Francisco Bay Area, focused on helping customers in the hi-tech and semi-conductor sectors solve complex business problems using the AWS Cloud. His special interests are in the areas of legacy modernization and migration, building analytics platforms and helping customers adopt cutting edge technologies such as generative AI.

Vipan Kumar

Vipan Kumar

Vipan is a Sr. Solutions Architect at AWS, where he works with strategic customers. He has extensive experience in machine learning and generative AI. With a background in application development, he is passionate about designing and building enterprise applications for the cloud.

Simplifying Kafka operations with Amazon MSK Express brokers

Post Syndicated from Mazrim Mehrtens original https://aws.amazon.com/blogs/big-data/simplifying-kafka-operations-with-amazon-msk-express-brokers/

In this post, we show you how Amazon Managed Streaming for Apache Kafka (Amazon MSK) Express brokers brokers streamline the end-to-end activities for Kafka administration. Apache Kafka has become the de facto standard for real-time data streaming, powering mission-critical applications across industries worldwide. Its popularity stems from its ability to handle high-throughput, fault-tolerant data pipelines at scale. Given its central role in modern data architectures, managing Apache Kafka with high resilience and reliability is essential for business success.

To maintain this level of resilience, administrators need to handle several important operational tasks. Apache Kafka is a distributed stateful system, whose state management requires constant communication and data movement in dynamic cloud environments. Administrators need to carefully size clusters by calculating complex compute, storage, and network requirements. They must provision storage volumes upfront and monitor utilization constantly to avoid disruptions. When workloads grow, scaling the cluster requires hours or days of effort using multiple tools to provision capacity and rebalance load.

With these operational requirements in mind, many administrators ask: is there an easier way to manage Apache Kafka at scale while maintaining the high resilience their applications demand?

Amazon MSK Express addresses these challenges directly. In this post, we show you how MSK Express brokers streamline the end-to-end activities for Kafka administration, including:

  • Sizing Kafka clusters for optimal performance and cost
  • Scaling cluster storage up and down with workload changes
  • Scaling cluster compute in and out over time
  • Monitoring cluster health
  • Managing cluster security
  • Ensuring high availability with fast and automatic broker recovery

What are Amazon MSK Express brokers?

Amazon MSK Express brokers are a transformative breakthrough for customers needing high-throughput Kafka clusters that scale faster and cost less. Express brokers reimagine Kafka’s compute and storage, decoupling to unlock performance and elasticity benefits. Express brokers deliver performance improvements that directly impact your operations:

  • Up to 3x more throughput per broker, allowing you to handle more data with fewer resources and lower costs
  • Rebalance partitions across brokers 180x faster, reducing scaling from hours to minutes
  • Scale up to 20x faster, enabling you to respond to demand spikes without lengthy planning cycles
  • Recover 90% quicker compared to standard Apache Kafka brokers, minimizing workload disruption and maintaining business continuity

To learn more about the technical details, see Express brokers for Amazon MSK: Turbo-charged Kafka scaling with up to 20 times faster performance. For a comprehensive overview of Express broker capabilities, see the MSK Express brokers documentation.

Let’s explore how MSK Express brokers simplify Apache Kafka management.

Sizing an Express cluster

Sizing a traditional Apache Kafka cluster is complex. Working backwards from your ingress and egress load, you need to consider every dimension of your cluster compute, storage, and network limitations. Each node must be carefully sized to handle:

  • Ingress and egress traffic from your clients
  • Internal Kafka operations like replication and rebalancing (the process of redistributing partitions across brokers to maintain balance)
  • High availability with node and Availability Zone failures
  • Client operations like backfill procedures when reading historical data

These activities impact your cluster storage I/O limits, network ingress/egress limits, and CPU and memory constraints. Beyond this, you need to consider the number of partitions required and determine whether your cluster can scale to handle partition management for your use case.

MSK Express brokers simplify this calculus. Rather than considering these complex variables, you can focus on what matters:

  • Your ingress throughput
  • Your egress throughput
  • Your partition needs

MSK documents the Express broker throughput throttle and partition limits by broker size. MSK pre-calculates these to consider all cluster limits. They include multi-Availability Zone high availability to handle rare events like node failures or AZ impairment.

Notice we did not discuss storage in sizing an Express cluster. That is because storage in Express scales nearly infinitely. You pay for storage as you go rather than sizing storage up front.

Scaling Express cluster storage

With sizing simplified by focusing on throughput and partitions, storage management becomes the next operational consideration.

Normally, Apache Kafka clusters need storage volumes pre-provisioned to handle all retained data. You must allocate all storage up-front and pay for that storage no matter what your actual data retention is.

Example: If you store 7 days of data at 1 MB/sec ingress, that’s 600+ GB of storage. This does not include data replication across nodes and buffers for growth and workload variability. This workload requires over 3 TB of storage, allocated up-front, to handle replicas and storage buffers.

As your workload evolves, careful monitoring of storage utilization becomes essential. Adding storage capacity prevents workload disruptions. Often, you cannot reclaim this storage. Once you increase the volume size, you continue paying for additional storage even if your workload scales down and no longer requires additional capacity.

With Express brokers, there is no need for sizing and provisioning storage volumes. You pay for what you use with no provisioning: the data ingested to the cluster and data stored in the cluster per-GB-per-hour. All data stored in the cluster is replicated across 3 Availability Zones for high availability. This pay-as-you-go model eliminates wasted capacity costs and reduces your total infrastructure spend.

  • As workloads scale up, the cluster uses more storage with no changes needed from you
  • When workloads scale down, the cluster uses less storage, reducing storage charges automatically
  • Storage management for Apache Kafka becomes simpler with Express. You focus on ensuring that your per-topic retention is right-sized for each use case. That is the only consideration. Once you set up topic retention, MSK Express automatically manages and cost-optimizes storage on your behalf.

Storage management in MSK Express brokers is far simpler than in a traditional Apache Kafka cluster. So is scaling the compute capacity for an Express-based cluster.

Scaling Express cluster compute

Just as storage scales automatically with your workload, compute capacity can also adapt to changing demands.

As your workload grows and changes, you may find that you exceed your initial sizing estimates. For a traditional Apache Kafka cluster, scaling the cluster capacity is a significant event. Scaling takes effort to provision capacity and rebalance load, it requires using multiple tools to manage the scaling process (compute, storage, DNS, rebalancing, client configs, and more). The scaling process can take hours or days to complete, which can exacerbate application impact. This means you need to plan well ahead to ensure your Kafka cluster is prepared for any load changes.

With MSK Express clusters, this process becomes much simpler and requires little to no upfront planning. It has near zero disruption to your existing workload, allowing your team to focus on building features rather than managing infrastructure.

To scale up an MSK Express cluster, you simply add brokers to the cluster. Once new brokers come online, Express Intelligent Rebalancing automatically rebalances topic partitions to the new nodes. Thanks to the Express storage architecture, the new nodes automatically have almost all the data they need. There is no significant inter-broker communication for rebalancing. This causes no disruption to existing brokers.

The cluster then elects new broker leaders for each partition, enabling producers to direct traffic to the new nodes. The same applies to consumer groups.

Express broker DNS design keeps this in mind. Express broker connection strings abstract away from the nodes themselves. Clients connect to the active broker nodes with one connection string. No changes to DNS, load balancing, or client configurations are needed.

Deciding when to scale in an Express cluster is also simpler than in a traditional Apache Kafka cluster. The simplified Express architecture means less to monitor and manage for long-term cluster operations.

Monitoring Express clusters

With simplified scaling decisions comes simplified monitoring. Express brokers reduce the number of metrics you need to track for cluster health. The below image demonstrates a dashboard which highlights the key metrics for monitoring MSK Express broker health.

Dashboard with key Amazon MSK Express brokers metrics

In a traditional Apache Kafka cluster, you need to consider dozens of metrics to understand overall cluster health. Express brokers simplify this operational process. They highlight ingress and egress throughput as two critical metrics for workload sizing and scaling. This streamlined monitoring approach reduces the expertise required to operate Kafka clusters and allows smaller teams to manage larger deployments effectively.

Other factors, like poorly designed clients, can incur additional overhead on a cluster. This can cause symptoms such as high CPU utilization without high ingress throughput. It is still important to monitor a variety of metrics with MSK Express brokers.

For Express brokers, the following table shows the critical metrics you must monitor and alert on for cluster health:

Metric Name Description Recommended Alarm
BytesInPerSec Ingress throughput to the cluster When > broker limit for > 5 minutes
BytesOutPerSec Egress throughput to the cluster When > broker limit for > 5 minutes
CpuUser + CpuSystem CPU utilization percentage When greater than 60% for 15 minutes
NetworkProcessorAvgIdlePercent Network processor thread idle time When less than 0.5 for > 5 minutes
RequestHandlerAvgIdlePercent Request processor thread idle time When less than 0.4 for > 15 minutes
FetchThrottleByteRate Consumer fetch throttling rate When < 0 for > 15 minutes
ProduceThrottleByteRate Producer ingress throttling rate When < 0 for > 15 minutes

For more information on monitoring Amazon MSK, see Monitoring Amazon MSK with Amazon CloudWatch.

Managing Express cluster access

Beyond monitoring, cluster management is another area where MSK Express brokers reduce operational complexity.

Express brokers simplify the internal management of Kafka clusters. In a traditional Kafka environment, you use schemes like SASL/SCRAM (username and password-based authentication) or mutual TLS (certificate-based authentication) for client authentication. Once authenticated, you configure complex Kafka ACLs (Access Control Lists—permissions that define who can access which topics) inside the Kafka cluster to authorize client access to topics and data.

These paradigms require you to manage all topics, authentication, and authorization inside Apache Kafka. This includes credential management, rotation, and other operational activities surrounding cluster access.

MSK simplifies this process by integrating with AWS Identity and Access Management (IAM) for access control. Clients can use IAM Roles that clearly specify cluster access boundaries. They also provide topic-level authorization to read and write data to a cluster with Kafka APIs.

Finally, clients can use MSK APIs to directly manage Kafka cluster configurations and Kafka topics, including creating new topics, updating topic configurations and partition counts, and deleting topics. Configurations and topics can be managed with the AWS Console, AWS CLI, and AWS SDK. For more information, refer to Amazon MSK simplifies Kafka topic management with new APIs and console integration.

You can focus only on your existing enterprise standards for IAM access controls, and your existing AWS CloudFormation and AWS CDK automation to manage your cluster with Infrastructure as Code (IaC). This integration reduces the operational overhead of cluster management and accelerates your time to production by leveraging existing security infrastructure.

MSK also supports using SASL/SCRAM and mutual TLS authentication modes alongside IAM access control. This gives you the flexibility to authorize applications outside of AWS. You can also provide access to legacy applications without the need for code changes.

For more information, see IAM access control for Amazon MSK and Security in Amazon MSK.

Building highly available Express brokers

With security simplified through IAM integration, high availability is the final piece of the operational puzzle.

Many of the same considerations we discussed in scaling Express cluster compute align with high availability considerations for MSK Express brokers.

Based on internal testing, MSK Express broker storage improvements enable faster recovery when broker nodes fail—90% faster than standard brokers. The new node can simply start up with almost no disruption to the rest of the cluster without needing to perform significant rebalancing. This contrasts with standard Kafka clusters, where the cluster needs to rebalance partitions to new nodes after recovery.

In addition to these improvements, MSK Express brokers are highly available by default. The service manages critical cluster and topic configurations for high availability and performance on your behalf. This eliminates the need for managing most cluster configurations.

Express fully manages configurations like min.insync.replicas, num.io.threads, and others described in Express brokers’ read-only configurations. This gives you a highly available and performant cluster out of the box.

You no longer need to worry about most cluster-level configurations of an Apache Kafka cluster. You can simply:

  • Start an MSK Express cluster
  • Configure topics and retention
  • Proceed without the fine tuning normally needed to ensure a highly available cluster

Conclusion

In this post, we showed how MSK Express brokers simplify cluster operations for Apache Kafka clusters. They lower the Total Cost of Ownership (TCO) of running an Apache Kafka cluster by simplifying sizing, storage management, compute management, high availability, and access control, while providing high performance, reliability, and cost-efficiency. These simplifications reduce the specialized expertise needed for cluster administration and accelerate your deployment timeline.

With this in mind, we recommend MSK Express brokers for almost all MSK workloads. If you are starting out with a new Kafka cluster or optimizing an existing one, MSK Express brokers provide a strong combination of simplicity, performance, and cost-efficiency.

Ready to simplify your Kafka operations? Get started using Amazon MSK to create your first Express cluster today. You can provision a fully managed, highly available Kafka cluster in minutes and start experiencing the operational benefits immediately. For pricing details, see Amazon MSK pricing.

For comprehensive information about Amazon MSK capabilities and features, visit the Amazon MSK product page and the Amazon MSK Developer Guide.


About the authors

Mazrim Mehrtens

Mazrim Mehrtens

Mazrim is a Sr. Specialist Solutions Architect for messaging and streaming workloads. Mazrim works with customers to build and support systems that process and analyze terabytes of streaming data in real time, run enterprise Machine Learning pipelines, and create systems to share data across teams seamlessly with varying data toolsets and software stacks.

Sai Maddali

Sai Maddali

Sai is a Senior Manager Product Management at AWS who leads the product team for Amazon MSK. He is passionate about understanding customer needs, and using technology to deliver services that empowers customers to build innovative applications. Besides work, he enjoys traveling, cooking, and running.

AWS Weekly Roundup: NVIDIA Nemotron 3 Super on Amazon Bedrock, Nova Forge SDK, Amazon Corretto 26, and more (March 23, 2026)

Post Syndicated from Daniel Abib original https://aws.amazon.com/blogs/aws/aws-weekly-roundup-nvidia-nemotron-3-super-on-amazon-bedrock-nova-forge-sdk-amazon-corretto-26-and-more-march-23-2026/

Hello! I’m Daniel Abib, and this is my first AWS Weekly Roundup. I’m a Senior Specialist Solutions Architect at AWS, focused on the generative AI and Amazon Bedrock. With over 28 years of experience in solution architecture, software development, and cloud architecture, I help Startups & Enterprises harness the power of generative AI with Amazon Bedrock. I’ve been at AWS for more than six and a half years, working closely with customers across Latin America, and I’m also passionate about Serverless technologies.

Outside of work and endurance sports, I’m a dedicated father to Cecília (7) and Rafael (4), who keep me busier—and happier— than any distributed system ever could. I’m based in São Paulo, you can find me on LinkedIn and X (@DCABib), where I share insights about generative AI, Amazon Bedrock, AWS serverless services, and the occasional Ironman throwback.

Now, let’s get into this week’s AWS news…

Last week’s launches
Here are some launches and updates from this past week that caught my attention:

  • Amazon Redshift increases performance for new queries in dashboards and ETL workloads by up to 7x — Amazon Redshift now delivers up to 7x faster performance for new queries in dashboards and ETL workloads. Queries you run for the first time — without cached results — now execute significantly faster, reducing wait times for interactive dashboards and accelerating your ETL pipelines. This is particularly impactful for workloads with high query variability where cache hits are less frequent.
  • NVIDIA Nemotron 3 Super now available on Amazon Bedrock — NVIDIA Nemotron 3 Super is now available in Amazon Bedrock, expanding the lineup of foundation models you can access through the unified Bedrock API. Nemotron 3 Super is a high-performance language model optimized for tasks such as text generation, complex reasoning, summarization, and code generation. You can now invoke Nemotron 3 Super alongside other foundation models in your existing Bedrock workflows, without managing any infrastructure.
  • Introducing Nova Forge SDK, a seamless way to customize Nova models for enterprise AI — Nova Forge SDK provides a streamlined way to fine-tune and customize Amazon Nova models for enterprise use cases. You can adapt Nova models to your domain-specific data and deploy them directly within Amazon Bedrock, reducing the complexity of building tailored AI solutions. The SDK handles the heavy lifting of model customization, letting you focus on your business logic rather than the underlying infrastructure.
  • Amazon Corretto 26 is now generally available — Amazon Corretto 26, the latest long-term support (LTS) release of the no-cost, production-ready distribution of OpenJDK, is now generally available. Corretto 26 includes the latest Java language features, performance improvements, and security patches, all backed by long-term support from AWS. You can use it across development and production environments on Amazon Linux, Windows, macOS, and Docker images.
  • AWS Lambda now supports Availability Zone metadata — AWS Lambda now provides Availability Zone metadata for your function invocations. You can now identify which Availability Zone your Lambda function is running in, enabling better observability, more informed architectural decisions, and simplified troubleshooting for latency-sensitive and multi-AZ workloads. This is particularly useful when correlating Lambda execution with other AZ-aware services in your architecture.
  • Amazon CloudWatch Logs now supports log ingestion using HTTP-based protocol — Amazon CloudWatch Logs now supports ingesting logs using an HTTP-based protocol, making it simpler to send logs from applications and services that use standard HTTP endpoints. You can now route logs to CloudWatch Logs without requiring custom agents or additional SDK integrations, lowering the barrier to centralized log management across your workloads.
  • Amazon EKS announces 99.99% Service Level Agreement and new 8XL scaling tier for Provisioned Control Plane clusters — Amazon EKS now offers a 99.99% Service Level Agreement (SLA) for clusters running on Provisioned Control Plane, up from the 99.95% SLA offered on standard control plane. EKS is also introducing the 8XL scaling tier, the largest available Provisioned Control Plane tier, which doubles the Kubernetes API server request processing capacity of the next lower 4XL tier — ideal for large-scale workloads like AI/ML training, high-performance computing (HPC), and large-scale data processing.

Other AWS news
Here are some additional posts and resources that you might find interesting:

  • Kiro for students — Kiro is now available for students, giving the next generation of builders access to AI-powered development tools at no cost. As Swami Sivasubramanian shared on LinkedIn, “Students are the future decision-makers shaping technology” — and Kiro gives them hands-on experience building with AI from day one. If you’re a student or know someone who is, this is a great opportunity to start building with AI-assisted development.
  • Strands Steering Hooks achieved 100% agent accuracy — The Strands Agents team published results showing that Steering Hooks can achieve 100% agent accuracy, outperforming both prompt engineering and rigid workflow approaches for controlling agent behavior. As Swami highlighted on LinkedIn, building reliable AI agents often means rethinking how we guide model behavior — and Steering Hooks offer a compelling new path to agent reliability.
  • Introducing Badges on AWS Builder Center — AWS Builder Center now features badges that recognize your contributions and achievements within the builder community. You can earn badges by sharing solutions, participating in challenges, and engaging with fellow builders. It’s a great way to showcase your expertise and track your growth.
  • Keep Building Together: The Power of Community — A thoughtful read on the power of community-driven learning and collaboration in the AWS ecosystem. Whether you’re just getting started with AWS or you’ve been building for years, the builder community is a place to connect, share knowledge, and grow together. I highly recommend checking it out.

Upcoming AWS events
Check your calendar and sign up for upcoming AWS events:

  • AWS Summits — Join AWS Summits in 2026, free in-person events where you can explore emerging cloud and AI technologies, learn best practices, and network with industry peers and experts. Upcoming Summits include Paris (April 1), London (April 22), Bengaluru (April 23–24), Singapore (May 6), Tel Aviv (May 6), and Stockholm (May 7).
  • AWS Community Days — Community-led conferences where content is planned, sourced, and delivered by community leaders, featuring technical discussions, workshops, and hands-on labs. Upcoming events include San Francisco (April 10) and Romania (April 23–24).
  • AWSome Women Summit LATAM — Taking place on March 28 in Mexico City, this event celebrates and empowers women in cloud technology across Latin America. A fantastic initiative for the LATAM tech community.

Join the AWS Builder Center to connect with builders, share solutions, and access content that supports your development. Browse the AWS Events and Webinars for upcoming AWS-led in-person and virtual events and developer-focused events.

That’s all for this week. Check back next Monday for another Weekly Roundup!

This post is part of our Weekly Roundup series. Check back each week for a quick roundup of interesting news and announcements from AWS!

„Какво е да остарееш в България“ – прожекции и срещи с публиката

Post Syndicated from Тоест original https://www.toest.bg/kakvo-e-da-ostareesh-v-bulgaria-prozhektsii-i-sreshti-s-publikata/

„Какво е да остарееш в България“ – прожекции и срещи с публиката

Част от работата на независимата онлайн медия „Тоест“ е да слага началото на разговор по теми, които често остават встрани, но по невидим начин изграждат обществото ни. С този филм пренасяме диалога отвъд дигиталното пространство и ви каним на прожекциите на новия документален филм „Какво е да остарееш в България“ на Лина Кривошиева.

Прожекции

София: 5 април, 15:00 ч., Дом на киното
Стара Загора: 8 април, 18:30 ч., РБ „Захарий Княжески“
Велико Търново: 30 май, 20:00 ч., ТАМ
Трявна: 31 май
Пловдив: предстои обявяване
Шумен: предстои обявяване
Межден: предстои обявяване

Входът за всички прожекции е свободен.

След поредицата от срещи с публиката в различните градове филмът ще бъде публикуван и в „Тоест“.

Продължителност: 40 минути
Продукция: Фондация „Тоест“
Режисьор, сценарист и оператор: Лина Кривошиева
Монтаж: Творческо студио TWO DOGS TWO CATS
Език: български, с английски субтитри

Какво означава да остарееш в България днес?

Нарастващото безпокойство от това как изглежда старостта в България, е причината Лина Кривошиева да започне личен разговор с майка си. Между този интимен въпрос и тревожните данни за демографската криза в страната Лина се среща с хора, които разкриват различните лица на старостта днес.

Яна Рупева от „Проект Северозапад“ показва как храната може да бъде не само форма на грижа и подкрепа, а и лек срещу самотата. Домът за възрастни хора в село Межден, създаден от Надя Димова, е добър пример как в България все още съществуват места, където думите „грижа“ и „човечност“ се изпълват със смисъл. Доцентката по етнология Ивелина Ефтимова говори за промяната в статуса на възрастните хора след прехода от традиционно към модерно общество и води Лина в един пенсионерски клуб, където възрастни хора се срещат, разговарят и доказват, че общността е източник на енергия и радост. Лина посещава и 93-годишната бивша учителка по математика Къна Георгиева от Трявна, която продължава да преподава и да живее с вдъхновяващо достойнство.

Филмът завършва там, откъдето е започнал – с разговора между дъщеря и майка за това какво означава да остареем достойно и как да посрещнем времето, което ни предстои.

За автора

Лина Кривошиева е видеограф, документалист и визуален разказвач. Съосновател е на независимата медия „Тоест“ и на творческото студио TWO DOGS TWO CATS. Чрез филми, фотография и редакционни формати тя търси разговор и взаимно разбиране в свят на нарастващи разделения.


Документалният филм „Какво е да остарееш в България“ и прожекциите му в страната са подкрепени от Институт „Отворено общество – София“ и съфинансирани от Европейския съюз в рамките на проекта Media Resilience. Изразените възгледи и мнения са само и изцяло на техните автори и не отразяват непременно възгледите и мненията на Европейския съюз, на Европейската изпълнителна агенция за образование и култура (EACEA) или на Институт „Отворено общество – София“ (ИООС). Нито Европейският съюз, нито EACEA, нито ИООС могат да бъдат държани отговорни за тях.

„Какво е да остарееш в България“ – прожекции и срещи с публиката

Beelink ME Pro Review A Small and Focused NAS That We Set Up with OpenClaw

Post Syndicated from Ryan Smith original https://www.servethehome.com/beelink-me-pro-review-intel-seagate-small-and-focused-nas/

In our Beelink ME Pro review, we see how this is a small and low power NAS. We also let OpenClaw set it up as a Proxmox VE homelab node

The post Beelink ME Pro Review A Small and Focused NAS That We Set Up with OpenClaw appeared first on ServeTheHome.

[$] Tracking when BPF programs may sleep

Post Syndicated from daroc original https://lwn.net/Articles/1062868/

BPF programs can run in both sleepable and non-sleepable (atomic) contexts.
Currently, sleepable BPF programs are not allowed to enter an atomic context.
Puranjay Mohan has a

new patch set
that changes that. The patch set would let BPF programs called
in sleepable contexts temporarily acquire locks that cause the programs to
transition to an atomic context. BPF maintainer Alexei
Starovoitov objected to parts of the implementation, however, so acceptance of
the patch depends on whether Mohan is willing and able to straighten it out.

Hello World #29 out now: Safety & security

Post Syndicated from Meg Wang original https://www.raspberrypi.org/blog/hello-world-29-out-now-safety-security/

Digital safety is a pressing concern in an increasingly connected world. In classrooms everywhere, educators face the challenge of supporting young people to learn about cybersecurity and to navigate online risks and the impact of AI tools and social media.

Graphic displaying covers of Hello World issue 29, 'Safety and Security'.

In issue 29 of Hello World, out today for free, educators all over the world share what digital safety and security mean in their classrooms. We hope this new issue will help you to actively empower your learners by equipping them with the understanding and skills to safely navigate our complex digital landscape.

The issue covers questions such as:

  • How can educators connect learners to real cybersecurity experiences?
  • What does youth online safety look like in the Global South?
  • How is Australia’s youth ban on social media impacting young coders?

Other highlights from Hello World issue 29

Beyond the focus on safety and security, here are three highlights from issue 29:

  • Shuchi Grover explores what ‘thinking’ means in the current age of large language models (LLMs)
  • Sethi DeClerq provides a checklist of important questions to ask yourself before spending your precious budget on new education technology
  • Rachel Fenichel argues that block-based programming isn’t just for kids, highlighting how Blockly can be a helpful abstraction when talking about algorithms at any age or stage

New podcast series coming soon

We also have new podcast episodes coming out over the next few weeks to continue the conversations started in the magazine.

Photo of the cast of the Hello World podcast episode – 'What’s next for computer science education in 2026?'.
A photo from the last series of the Hello World podcast: ‘What’s next for computer science education in 2026?’

The first episode is another edition of our teacher tips series, where computer science educators and experts from around the globe share practical, actionable tips that you can use in your classroom. In the upcoming episode, teachers will be sharing what works for them to engage students in cybersecurity, protect schools from cybersecurity breaches, and safely introduce generative AI to the classroom.

In the second episode, we’ll talk to Dr. Karla Badillo-Urquiola about her research in online safety in the Global South.

To listen to these podcasts, make sure you follow us in your preferred app, or head to helloworld.cc/podcast.

Share your thoughts and subscribe to Hello World

Visit helloworld.cc/29 to read our newest issue for free today, and let us know what you think by leaving a comment here or on our social media.

helloworld.cc is also where you go to subscribe and find older issues of Hello World magazine.

If you have a moment, do leave us a podcast review or share the magazine with a fellow educator. It really helps more people to discover Hello World.

The post Hello World #29 out now: Safety & security appeared first on Raspberry Pi Foundation.

Security updates for Monday

Post Syndicated from jzb original https://lwn.net/Articles/1064298/

Security updates have been issued by AlmaLinux (gimp:2.8, grub2, kernel, libarchive, libvpx, nginx, opencryptoki, python3.12, vim, yggdrasil, and yggdrasil-worker-package-manager), Debian (chromium, freeciv, libvirt, libyaml-syck-perl, mapserver, ruby-rack, spip, and webkit2gtk), Fedora (chromium, cpp-httplib, glib2, libsoup3, localsearch, openssh, python-scitokens, python-ujson, python3.6, scitokens-cpp, uxplay, wordpress, and xen), Mageia (expat), Red Hat (osbuild-composer), SUSE (Announcement ID: SUSE-SU-2026:0940-1 Release Date: 2026-03-20T13:41:23Z Rating: important References:, Announcement ID: SUSE-SU-2026:0941-1 Release Date: 2026-03-20T13:41:30Z Rating: important References:, Announcement ID: SUSE-SU-2026:0943-1 Release Date: 2026-03-20T13:41:33Z Rating: important References:, Announcement ID: SUSE-SU-2026:0944-1 Release Date: 2026-03-20T13:41:37Z Rating: important References:, Announcement ID: SUSE-SU-2026:0945-1 Release Date: 2026-03-20T13:41:40Z Rating: important References:, chromium, docker, go1.25-openssl, GraphicsMagick, helm, mumble, python311, python311-pyasn1, python313, runc, sqlite3, and tempo-cli), and Ubuntu (debian-goodies and libnet-cidr-perl).

Inside Gen 13: how we built our most powerful server yet

Post Syndicated from Syona Sarma original https://blog.cloudflare.com/gen13-config/

A few months ago, Cloudflare announced the transition to FL2, our Rust-based rewrite of Cloudflare’s core request handling layer. This transition accelerates our ability to help build a better Internet for everyone. With the migration in the software stack, Cloudflare has refreshed our server hardware design with improved hardware capabilities and better efficiency to serve the evolving demands of our network and software stack. Gen 13 is designed with 192-core AMD EPYC™ Turin 9965 processor, 768 GB of DDR5-6400 memory, 24 TB of PCIe 5.0 NVMe storage, and dual 100 GbE port network interface card.

Gen 13 delivers:

  • Up to 2x throughput compared to Gen 12 while staying within latency SLA

  • Up to 50% improvement in performance / watt efficiency, reducing data center expansion costs

  • Up to 60% higher throughput per rack keeping rack power budget constant

  • 2x memory capacity, 1.5x storage capacity, 4x network bandwidth

  • Introduced PCIe encryption hardware support in addition to memory encryption

  • Improved support for thermally demanding powerful drop-in PCIe accelerators

This blog post covers the engineering rationale behind each major component selection: what we evaluated, what we chose, and why.

Generation

Gen 13 Compute

Previous Gen 12 Compute

Form Factor

2U1N, Single socket

2U1N, Single socket

Processor

AMD EPYC™ 9965
Turin 192-Core Processor

AMD EPYC™ 9684X
Genoa-X 96-Core Processor

Memory

768GB of DDR5-6400 x12 memory channel

384GB of DDR5-4800 x12 memory channel

Storage

x3 E1.S NVMe

 Samsung PM9D3a 7.68TB /
Micron 7600 Pro 7.68TB

x2 E1.S NVMe 

Samsung PM9A3 7.68TB /
Micron 7450 Pro 7.68TB

Network

Dual 100 GbE OCP 3.0 

Intel Ethernet Network Adapter E830-CDA2 /
NVIDIA Mellanox ConnectX-6 Dx

Dual 25 GbE OCP 3.0

Intel Ethernet Network Adapter E810-XXVDA2 /
NVIDIA Mellanox ConnectX-6 Lx

System Management

DC-SCM 2.0 ASPEED AST2600 (BMC) + AST1060 (HRoT)

DC-SCM 2.0 ASPEED AST2600 (BMC) + AST1060 (HRoT)

Power Supply

1300W, Titanium Grade

800W, Titanium Grade


Figure: Gen 13 server

CPU

Gen 12

AMD EPYC™ 9684X Genoa-X 96-Core (400W TDP, 1152 MB L3 Cache)

Gen 13

AMD EPYC™ 9965 Turin Dense 192-Core (500W TDP, 384 MB L3 Cache)

During the design phase, we evaluated several 5th generation AMD EPYC™ Processors, code-named Turin, in Cloudflare’s hardware lab: AMD Turin 9755, AMD Turin 9845, and AMD Turin 9965. The table below summarizes the differences in specifications of the candidates for Gen 13 servers against the AMD Genoa-X 9684X used in our Gen 12 servers. Notably, all three candidates offer increases in core count but with smaller L3 cache per core. However, with the migration to FL2, the new workloads are less dependent on L3 cache and scale up well with the increased core count to achieve up to 100% increase in throughput.

The three CPU candidates are designed to target different use cases: AMD Turin 9755 offers superior per-core performance, AMD Turin 9965 trades per-core performance for efficiency, and AMD Turin 9845 trades core count for lower socket power. We evaluated three CPUs in the production environment.

CPU Model

AMD Genoa-X 9684X

AMD Turin 9755

AMD Turin 9845

AMD Turin 9965

For server platform

Gen 12

Gen 13 candidate

Gen 13 candidate

Gen 13 candidate

# of CPU Cores

96

128

160

192

# of Threads

192

256

320

384

Base Clock

2.4 GHz

2.7 GHz

2.1 GHz

2.25 GHz

Max Boost Clock

3.7 GHz

4.1 GHz

3.7 GHz

3.7 GHz

All Core Boost Clock

3.42 GHz

4.1 GHz

3.25 GHz

3.35 GHz

Total L3 Cache

1152 MB

512 MB

320 MB

384 MB

L3 cache per core

12 MB / core

4 MB / core

2 MB / core

2 MB / core

Maximum configurable TDP

400W

500W

390W

500W

Why AMD Turin 9965?

First, FL2 ended the L3 cache crunch.

L3 cache is the large, last-level cache shared among all CPU cores on the same compute die to store frequently used data. It bridges the gap between slow main memory external to the CPU, and the fast but smaller L1 and L2 cache on the CPU, reducing the latency for the CPU to access data.

Some may notice that the 9965 has only 2 MB of L3 cache per core, an 83.3% reduction from the 12 MB per core on Gen 12’s Genoa-X 9684X. Why trade away the very cache advantage that gave Gen 12 its edge? The answer lies in how our workloads have evolved.

Cloudflare has migrated from FL1 to FL2, a complete rewrite of our request handling layer in Rust. With the new software stack, Cloudflare’s request processing pipeline has become significantly less dependent on large L3 cache. FL2 workloads scale nearly linearly with core count, and the 9965’s 192 cores provide a 2x increase in hardware threads over Gen 12.

Second, performance per total cost of ownership (TCO). During production evaluation, the 9965’s 192 cores delivered the highest aggregate requests per second of the three candidates, and its performance-per-watt scaled favorably at 500W TDP, yielding superior rack-level TCO.

Gen 12 

Gen 13 

Processor

AMD EPYC™ 4th Gen Genoa-X 9684X

AMD EPYC™ 5th Gen Turin 9965

Core count

96C/192T

192C/384T

FL throughput

Baseline

Up to +100%

Performance per watt

Baseline

Up to +50%

Third, operational simplicity. Our operational teams have a strong preference for fewer, higher-density servers. Managing a fleet of 192-core machines means fewer nodes to provision, patch, and monitor per unit of compute delivered. This directly reduces operational overhead across our global network.

Finally, they are forward compatible. The AMD processor architecture supports DDR5-6400, PCIe Gen 5.0, CXL 2.0 Type 3 memory across all SKUs. AMD Turin 9965 has the highest number of high-performing cores per socket in the industry, maximizing the compute density per socket, maintaining competitiveness and relevance of the platform for years to come. By moving to AMD Turin 9965 from AMD Genoa-X 9684X, we get longer security support from AMD, extending the useful life of the Gen 13 server before they become obsolete and need to be refreshed.

Memory

Gen 12

12x 32GB DDR5-4800 2Rx8 (384 GB total, 4 GB/core)

Gen 13

12x 64GB DDR5-6400 2Rx4 (768 GB total, 4 GB/core)

Because the AMD Turin processor has twice the core count of the previous generation, it demands more memory resources, both in capacity and in bandwidth, to deliver throughput gains.

Maximizing bandwidth with 12 channels

The chosen AMD EPYC™ 9965 CPU supports twelve memory channels, and for Gen 13, we are populating every single one of them. We’ve selected 64 GB DDR5-6400 ECC RDIMMs in a “one DIMM per channel” (1DPC) configuration.

This setup provides 614 GB/s of peak memory bandwidth per socket, a 33.3% increase compared to our Gen 12 server platform. By utilizing all 12 channels, we ensure that the CPU is never “starved” for data, even during the most memory-intensive parallel workloads.

Populating all twelve channels in a balanced configuration — equal capacity per channel, with no mixed configurations — is common best practice. This matters operationally: AMD Turin processors interleave across all memory channels with the same DIMM type, same memory capacity and same rank configuration. Interleaving increases memory bandwidth by spreading contiguous memory access across all memory channels in the interleave set instead of sending all memory access to a single or a small subset of memory channels. 

The 4 GB per core “sweet spot”

Our Gen 12 servers are configured with 4GB per core. We revisited that decision as we designed Gen 13.

Cloudflare launches a lot of new products and services every month, and each new product or service demands an incremental amount of memory capacity. These accumulate over time and could become an issue of memory pressure, if memory capacity is not sized appropriately.

Initial requirement considered a memory-to-core ratio between 4 GB and 6 GB per core. With 192 cores on the AMD Turin 9965, that translates to a range of 768 GB to 1152 GB. Note that at higher capacities,  DIMM module capacity granularity are typically 16GB increments. With 12 channels in a 1DPC configuration, our options are 12x 48GB (576 GB), 12x 64GB (768 GB), or 12x 96GB (1152 GB).

  • 12x 48GB = 576 GB, or 1.5 GB/thread. The memory capacity of this configuration is too low; this would starve memory-hungry workloads and violate the lower bound.

  • 12x 96GB = 1152 GB, or 3.0 GB/thread. This would be a 50% capacity increase per core and would also result in higher power consumption and a substantial increase in cost, especially in the current market conditions where memory prices are 10x of what they were a year ago.

  • 12x 64GB = 768 GB, or 2.0 GB/thread (4 GB/core). This configuration is consistent with our Gen 12 memory to core ratio, and represents a 2x increase in memory capacity per server. Keeping the memory capacity configuration at 4 GB per core provides sufficient capacity for workloads that scale with core count, like our primary workload, FL, and provide sufficient memory capacity headroom for future growth without overprovisioning.

FL2 uses memory more efficiently than FL1 did: our internal measures show FL2 uses less than half the CPU of FL1, and far less than half the memory. The capacity freed up by the software stack migration provides ample headroom to support Cloudflare growth for the next few years.

The decision: 12x 64GB for 768 GB total. This maintains the proven 4 GB/core ratio, provides a 2x total capacity increase over Gen 12, and stays within the DIMM cost curve sweet spot.

Efficiency through dual rank

In Gen 12, we demonstrated that dual-rank DIMMs provide measurably higher memory throughput than single-rank modules, with advantages of up to 17.8% at a 1:1 read-write ratio. Dual-rank DIMMs are faster because they allow the memory controller to access one rank while another is refreshing. That same principle carries forward here.

Our requirement also calls for approximately 1 GB/s of memory bandwidth per hardware thread. With 614 GB/s of peak bandwidth across 384 threads, we deliver 1.6 GB/s per thread, comfortably exceeding the minimum. Production analysis has shown that Cloudflare workloads are not memory-bandwidth-bound, so we bank the headroom as margin for future workload growth.

By opting for 2Rx4 DDR5 RDIMMs at maximum supported 6400MT/s, we ensure we get the lowest latency and best performance from our Gen 13 platform memory configuration.

Storage

Gen 12

x2 E1.S NVMe PCIe 4.0, 16 TB total

Samsung PM9A3 7.68TB

Micron 7450 Pro 7.68TB

Gen 13

x3 E1.S NVMe PCIe 5.0, 24 TB total

Samsung PM9D3a 7.68TB

Micron 7600 Pro 7.68TB

+10x U.2 NVMe PCIe 5.0 option

Our storage architecture underwent a transformation in Gen 12 when we pivoted from M.2 to EDSFF E1.S. For Gen 13, we are increasing the storage capacity and the bandwidth to align with the latest technology. We have also added a front drive bay for flexibility to add up to 10x U.2 drives to keep pace with Cloudflare storage product growth. 

The move to PCIe 5.0

Gen 13 is configured with PCIe Gen 5.0 NVMe drives. While Gen 4.0 served us well, the move to Gen 5.0 ensures that our storage subsystem can serve data at improved latency, and keep up with increased storage bandwidth demand from the new processor. 

16 TB to 24 TB

Beyond the speed increase, we are physically expanding the array from two to three NVMe drives. Our Gen 12 server platform was designed with four E1.S storage drive slots, but only two slots were populated with 8TB drives. The Gen 13 server platform uses the same design with four E1.S storage drive slots available, but with three slots populated with 8TB drives. Why add a third drive? This increases our storage capacity per server from 16TB to 24TB, ensuring we are expanding our global storage capacity to maintain and improve CDN cache performance. This supports growth projections for Durable Objects, Containers, and Quicksilver services, too.

Front drive bay to support additional drives

For Gen 13, the chassis is designed with a front drive bay that can support up to ten U.2 PCIe Gen 5.0 NVMe drives. The front drive bay provides the option for Cloudflare to use the same chassis across compute and storage platforms, as well as the flexibility to convert a compute SKU to a storage SKU when needed. 

Endurance and reliability

We designed our servers to have a 5-year operational life and require storage drives endurance to sustain 1 DWPD (Drive Writes Per Day) over the full server lifespan.

Both the Samsung PM9D3a and Micron 7600 Pro meet the 1 DWPD specification with a hardware over-provisioning (OP) of approximately 7%. If future workload profiles demand higher endurance, we have the option to hold back additional user capacity to increase effective OP.

NVMe 2.0 and OCP NVMe 2.0 compliance

Both the Samsung PM9D3a and Micron 7600 adopt the NVMe 2.0 specification (up from NVMe 1.4) and the OCP NVMe Cloud SSD Specification 2.0. Key improvements include Zoned Namespaces (ZNS) for better write amplification management, Simple Copy Command for intra-device data movement without crossing the PCIe bus, and enhanced Command and Feature Lockdown for tighter security controls. The OCP 2.0 spec also adds deeper telemetry and debug capabilities purpose-built for datacenter operations, which aligns with our emphasis on fleet-wide manageability.

Thermal efficiency

The storage drives will continue to be in the E1.S 15mm form factor. Its high-surface-area design is essential for cooling these new Gen 5.0 controllers, which can pull upwards of 25W under sustained heavy I/O. The 2U chassis provides ample airflow over the E1.S drives as well as U.2 drive bays, a design advantage we validated in Gen 12 when we made the decision to move from 1U to 2U.

Network

Gen 12

Dual 25 GbE port OCP 3.0 NIC 

Intel E810-XXVDA2

NVIDIA Mellanox ConnectX-6 Lx

Gen 13

Dual 100 GbE port OCP 3.0 NIC

Intel E830-CDA2

NVIDIA Mellanox ConnectX-6 Dx

For more than eight years, dual 25 GbE was the backbone of our fleet. Since 2018 it has served us well, but as the CPU has improved to serve more requests and our products scale, we’ve officially hit the wall. For Gen 13, we are quadrupling our per-port bandwidth.

Why 100 GbE and why now?

Network Interface Card (NIC) bandwidth must keep pace with compute performance growth. With 192 modern cores, our 25 GbE links will become a measurable bottleneck. Production data from our co-locations worldwide over a week showed that, on our Gen 12, P95 bandwidth per port is consistently >50% of available bandwidth. Since throughput is doubling per server on Gen 13, we are at risk of saturating the NIC bandwidth.


Figure: on Gen 12, P95 bandwidth per port is consistently >50% of available bandwidth

The decision to go to 100 GbE rather than 50 GbE was driven by industry economics: 50 GbE transceiver volumes remain low in the industry, making them a poor supply chain bet. Dual 100 GbE ports also give us 200 Gb/s of aggregate bandwidth per server, future-proofing against the next several years of traffic growth.

Hardware choices and compatibility

We are maintaining our dual-vendor strategy to ensure supply chain resilience, a lesson hard-learned during the pandemic when single-sourcing the Gen 11 NIC left us scrambling.

Both NICs are compliant with OCP 3.0 SFF/TSFF form factor with the integrated pull tab, maintaining chassis commonality with Gen 12 and ensuring field technicians need no new tools or training for swaps.

PCIe Allocation

The OCP 3.0 NIC slot is allocated PCIe 4.0 x16 lanes on the motherboard, providing 256 Gb/s of bidirectional bandwidth, more than enough for dual 100 GbE (200 Gb/s aggregate) with room to spare.

Management

Gen 12

Project Argus Data Center Secure Control Module 2.0

Gen 13

Project Argus Data Center Secure Control Module 2.0

PCIe encryption

We are maintaining the architectural shift, introduced in Gen 12, of separating management and security-related components from the motherboard onto the Project Argus Data Center Secure Control Module 2.0.


Figure: Project Argus DC-SCM 2.0

Continuity with DC-SCM 2.0

We are carrying forward the Data Center Secure Control Module 2.0 (DC-SCM 2.0) standard. By decoupling management and security functions from the motherboard, we ensure that the “brains” of the server’s security stay modular and protected.

The DC-SCM module houses our most critical components:

  • Basic Input/Output System (BIOS)

  • Baseboard Management Controller (BMC)

  • Hardware Root of Trust (HRoT) and TPM (Infineon SLB 9672)

  • Dual BMC/BIOS flash chips for redundancy

Why we are staying the course with DC-SCM 2.0

The decision to keep this architecture for Gen 13 is driven by the proven security gains we saw in the previous generation. By offloading these functions to a dedicated module, we maintain:

  • Rapid recovery: Dual image redundancy allows for near-instant restoration of BIOS/UEFI and BMC firmware if an accidental corruption or a malicious update is detected.

  • Physical resilience: The Gen 13 chassis also moves the intrusion detection mechanism further from the flat edge of the chassis, making physical intercept harder.

  • PCIe encryption: In addition to TSME (Transparent Secure Memory Encryption) for CPU-to-memory encryption that was already enabled since our Gen 10 platforms, AMD Turin 9965 processor for Gen 13 extends encryption to PCIe traffic, this ensures data is protected in transit across every bus in the system.

  • Operational consistency: Sticking with the Gen 12 management stack means our security audits, deployment, provisioning, and operational standard procedure remain fully compatible. 

Power

Gen 12

800W 80 PLUS Titanium CRPS

Gen 13

1300W 80 PLUS Titanium CRPS

As we upgrade the compute and networking capability of the server, the power envelope of our servers has naturally expanded. Gen 13 are equipped with bigger power supplies to deliver the power needed.

The jump to 1300W

While our Gen 12 nodes operated comfortably with 800W 80 PLUS Titanium CRPS (Common Redundant Power Supply), the Gen 13 specification requires a larger power supply. We have selected a 1300W 80 PLUS Titanium CRPS.

Power consumption of Gen 13 during typical operation has risen to 850W, a 250W increase over the 600W seen in Gen 12. The primary contributors are the 500W TDP CPU (up from 400W), doubling of the memory capacity and the additional NVMe drive.

Why 1300W instead of 1000W? The current PSU ecosystem lacks viable, high-efficiency options at 1000W. To ensure supply chain reliability, we moved to the next industry-standard tier of 1300W. 

EU Lot 9 is a regulation that requires servers deploying in the European Union to have power supplies with efficiency at 10%, 20%, 50% and 100% load to be at or above the percentage threshold specified in the regulation. The threshold matches 80 PLUS Power Supply certification program titanium grade PSU requirement. We chose a titanium grade PSU for Gen 13 to maintain full compliance with EU Lot 9, ensuring that the servers can be deployed in our European data centers and beyond. 

Thermal design: 2U pays dividends again

The 2U1N form factor we adopted in Gen 12 continues to pay dividends. Gen 13 uses 5x 80mm fans (up from 4x in Gen 12) to handle the increased thermal load from the 500W CPU. The larger fan volume, combined with the 2U chassis airflow characteristics, means fans operate well below maximum duty cycle at typical ambient temperatures, keeping fan power in the < 50W range per fan.

Drop-in accelerator support

Gen 12

x2 single width FHFL or x1 double width FHFL

Gen 13

x2 double width FHFL

Maintaining the modularity of our fleet is a core requirement for our server design. This requirement enabled Cloudflare to quickly retrofit and deploy GPUs globally to more than 100 cities in 2024. In Gen 13, we are continuing the support of high-performance PCIe add-in cards.

On Gen 13, the 2U chassis layout is updated and configured to support more demanding power and thermal requirements. While Gen 12 was limited to a single double-width GPU, the Gen 13 architecture now supports two double-width PCIe cards.

A launchpad to scale Cloudflare to greater heights

Every generation of Cloudflare servers is an exercise in balancing competing constraints: performance versus power, capacity versus cost, flexibility versus simplicity. Gen 13 comes with 2x core count, 2x memory capacity, 4x network bandwidth, 1.5x storage capacity, and future-proofing for accelerator deployments — all while improving total cost of ownership and maintaining a robust management feature set and security posture that our global fleet demands.

Gen 13 servers are fully qualified and will be deployed to serve millions of requests across Cloudflare’s global network in more than 330 cities. As always, Cloudflare’s journey to serve the Internet as efficiently as possible does not end here. As the deployment of Gen 13 begins, we are planning the architecture for Gen 14.

If you are excited about helping build a better Internet, come join us. We are hiring.

Launching Cloudflare’s Gen 13 servers: trading cache for cores for 2x edge compute performance

Post Syndicated from Syona Sarma original https://blog.cloudflare.com/gen13-launch/

Two years ago, Cloudflare deployed our 12th Generation server fleet, based on AMD EPYC™ Genoa-X processors with their massive 3D V-Cache. That cache-heavy architecture was a perfect match for our request handling layer, FL1 at the time. But as we evaluated next-generation hardware, we faced a dilemma — the CPUs offering the biggest throughput gains came with a significant cache reduction. Our legacy software stack wasn’t optimized for this, and the potential throughput benefits were being capped by increasing latency.

This blog describes how the FL2 transition, our Rust-based rewrite of Cloudflare’s core request handling layer, allowed us to prove Gen 13’s full potential and unlock performance gains that would have been impossible on our previous stack. FL2 removes the dependency on the larger cache, allowing for performance to scale with cores while maintaining our SLAs. Today, we are proud to announce the launch of Cloudflare’s Gen 13 based on AMD EPYC™ 5th Gen Turin-based servers running FL2, effectively capturing and scaling performance at the edge. 

What AMD EPYCTurin brings to the table

AMD’s EPYC™ 5th Generation Turin-based processors deliver more than just a core count increase. The architecture delivers improvements across multiple dimensions of what Cloudflare servers require.

  • 2x core count: up to 192 cores versus Gen 12’s 96 cores, with SMT providing 384 threads

  • Improved IPC: Zen 5’s architectural improvements deliver better instructions-per-cycle compared to Zen 4

  • Better power efficiency: Despite the higher core count, Turin consumes up to 32% fewer watts per core compared to Genoa-X

  • DDR5-6400 support: Higher memory bandwidth to feed all those cores

However, Turin’s high density OPNs make a deliberate tradeoff: prioritizing throughput over per core cache. Our analysis across the Turin stack highlighted this shift. For example, comparing the highest density Turin OPN to our Gen 12 Genoa-X processors reveals that Turin’s 192 cores share 384MB of L3 cache. This leaves each core with access to just 2MB, one-sixth of Gen 12’s allocation. For any workload that relies heavily on cache locality, which ours did, this reduction posed a serious challenge.

Generation

Processor

Cores/Threads

L3 Cache/Core

Gen 12

AMD Genoa-X 9684X

96C/192T

12MB (3D V-Cache)

Gen 13 Option 1

AMD Turin 9755

128C/256T

4MB

Gen 13 Option 2

AMD Turin 9845

160C/320T

2MB

Gen 13 Option 3

AMD Turin 9965

192C/384T

2MB

Diagnosing the problem with performance counters

For our FL1 request handling layer, NGINX- and LuaJIT-based code, this cache reduction presented a significant challenge. But we didn’t just assume it would be a problem; we measured it.

During the CPU evaluation phase for Gen 13, we collected CPU performance counters and profiling data to identify exactly what was happening under the hood using AMD uProf tool. The data showed:

  • L3 cache miss rates increased dramatically compared to Gen 12’s server equipped with 3D V-cache processors

  • Memory fetch latency dominated request processing time as data that previously stayed in L3 now required trips to DRAM

  • The latency penalty scaled with utilization as we pushed CPU usage higher, and cache contention worsened

L3 cache hits complete in roughly 50 cycles; L3 cache misses requiring DRAM access take 350+ cycles, an order of magnitude difference. With 6x less cache per core, FL1 on Gen 13 was hitting memory far more often, incurring latency penalties.

The tradeoff: latency vs. throughput 

Our initial tests running FL1 on Gen 13 confirmed what the performance counters had already suggested. While the Turin processor could achieve higher throughput, it came at a steep latency cost.

Metric

Gen 12 (FL1)

Gen 13 – AMD Turin 9755 (FL1)

Gen 13 – AMD Turin 9845 (FL1)

Gen 13 – AMD Turin 9965 (FL1)

Delta

Core count

baseline

+33%

+67%

+100%

FL throughput

baseline

+10%

+31%

+62%

Improvement

Latency at low to moderate CPU utilization

baseline

+10%

+30%

+30%

Regression

Latency at high CPU utilization

baseline

> 20% 

> 50% 

> 50% 

Unacceptable

The Gen 13 evaluation server with AMD Turin 9965 that generated 60% throughput gain was compelling, and the performance uplift provided the most improvement to Cloudflare’s total cost of ownership (TCO). 

But a more than 50% latency penalty is not acceptable. The increase in request processing latency would directly impact customer experience. We faced a familiar infrastructure question: do we accept a solution with no TCO benefit, accept the increased latency tradeoff, or find a way to boost efficiency without adding latency?

Incremental gains with performance tuning

To find a path to an optimal outcome, we collaborated with AMD to analyze the Turin 9965 data and run targeted optimization experiments. We systematically tested multiple configurations:

  • Hardware Tuning: Adjusting hardware prefetchers and Data Fabric (DF) Probe Filters, which showed only marginal gains

  • Scaling Workers: Launching more FL1 workers, which improved throughput but cannibalized resources from other production services

  • CPU Pinning & Isolation: Adjusting workload isolation configurations to find optimal mix, with limited success 

The configuration that ultimately provided the most value was AMD’s Platform Quality of Service (PQOS). PQOS extensions enable fine-grained regulation of shared resources like cache and memory bandwidth. Since Turin processors consist of one I/O Die and up to 12 Core Complex Dies (CCDs), each sharing an L3 cache across up to 16 cores, we put this to the test. Here is how the different experimental configurations performed. 

First, we used PQOS to allocate a dedicated L3 cache share within a single CCD for FL1, the gains were minimal. However, when we scaled the concept to the socket level, dedicating an entire CCD strictly to FL1, we saw meaningful throughput gains while keeping latency acceptable.

Configuration

Description

Illustration

Performance gain

NUMA-aware core affinity 
(equivalent to PQOS at socket level)

6 out of 12 CCD (aligned with NUMA domain) run FL.


32MB L3 cache in each CCD shared among all cores. 

>15% incremental 

throughput gain

PQOS config 1

1 of 2 vCPU on each physical core in each CCD runs FL. 


FL gets 75% of the 32MB L3 cache of each CCD.

< 5% incremental throughput gain


Other services show minor signs of degradation

PQOS config 2

1 of 2 vCPU in each physical core in each CCD runs FL.


FL gets 50% of the 32MB L3 cache of each CCD.

< 5% incremental throughput gain

PQOS config 3

2 vCPU on 50% of the physical core in each CCD runs FL. 


FL gets 50% of  the 32MB L3 cache of each CCD.

< 5% incremental throughput gain

The opportunity: FL2 was already in progress

Hardware tuning and resource configuration provided modest gains, but to truly unlock the performance potential of the Gen 13 architecture, we knew we would have to rewrite our software stack to fundamentally change how it utilized system resources.

Fortunately, we weren’t starting from scratch. As we announced during Birthday Week 2025, we had already been rebuilding FL1 from the ground up. FL2 is a complete rewrite of our request handling layer in Rust, built on our Pingora and Oxy frameworks, replacing 15 years of NGINX and LuaJIT code.

The FL2 project wasn’t initiated to solve the Gen 13 cache problem — it was driven by the need for better security (Rust’s memory safety), faster development velocity (strict module system), and improved performance across the board (less CPU, less memory, modular execution).

FL2’s cleaner architecture, with better memory access patterns and less dynamic allocation, might not depend on massive L3 caches the way FL1 did. This gave us an opportunity to use the FL2 transition to prove whether Gen 13’s throughput gains could be realized without the latency penalty.

Proving it out: FL2 on Gen 13

As the FL2 rollout progressed, production metrics from our Gen 13 servers validated what we had hypothesized.

Metric

Gen 13 AMD Turin 9965 (FL1)

Gen 13 AMD Turin 9965 (FL2)

FL requests per CPU%

baseline

50% higher

Latency vs Gen 12

baseline

70% lower

Throughput vs Gen 12

62% higher

100% higher

The out-of-the-box efficiency gains on our new FL2 stack were substantial, even before any system optimizations. FL2 slashed the latency penalty by 70%, allowing us to push Gen 13 to higher CPU utilization while strictly meeting our latency SLAs. Under FL1, this would have been impossible.

By effectively eliminating the cache bottleneck, FL2 enables our throughput to scale linearly with core count. The impact is undeniable on the high-density AMD Turin 9965: we achieved a 2x performance gain, unlocking the true potential of the hardware. With further system tuning, we expect to squeeze even more power out of our Gen 13 fleet.


Generational improvement with Gen 13

With FL2 unlocking the immense throughput of the high-core-count AMD Turin 9965, we have officially selected these processors for our Gen 13 deployment. Hardware qualification is complete, and Gen 13 servers are now shipping at scale to support our global rollout.

Performance improvements

Gen 12 

Gen 13 

Processor

AMD EPYC™ 4th Gen Genoa-X 9684X

AMD EPYC™ 5th Gen Turin 9965

Core count

96C/192T

192C/384T

FL throughput

baseline

Up to +100%

Performance per watt

baseline

Up to +50%

Gen 13 business impact

Up to 2x throughput vs Gen 12 for uncompromising customer experience: By doubling our throughput capacity while staying within our latency SLAs, we guarantee our applications remain fast and responsive, and able to absorb massive traffic spikes.

50% better performance/watt vs Gen 12 for sustainable scaling: This gain in power efficiency not only reduces data center expansion costs, but allows us to process growing traffic with a vastly lower carbon footprint per request.

60% higher rack throughput vs Gen 12 for global edge upgrades: Because we achieved this throughput density while keeping the rack power budget constant, we can seamlessly deploy this next generation compute anywhere in the world across our global edge network, delivering top tier performance exactly where our customers want it.

Gen 13 + FL2: ready for the edge 

Our legacy request serving layer FL1 hit a cache contention wall on Gen 13, forcing an unacceptable tradeoff between throughput and latency. Instead of compromising, we built FL2. 

Designed with a vastly leaner memory access pattern, FL2 removes our dependency on massive L3 caches and allows linear scaling with core count. Running on the Gen 13 AMD Turin platform, FL2 unlocks 2x the throughput and a 50% boost in power efficiency all while keeping latency within our SLAs. This leap forward is a great reminder of the importance of hardware-software co-design. Unconstrained by cache limits, Gen 13 servers are now ready to be deployed to serve millions of requests across Cloudflare’s global network.

If you’re excited about working on infrastructure at global scale, we’re hiring.

The collective thoughts of the interwebz