Amazon S3 Metadata now provides complete visibility into all your existing objects in your Amazon Simple Storage Service (Amazon S3) buckets, expanding beyond new objects and changes. With this expanded coverage, you can analyze and query metadata for your entire S3 storage footprint.
Today, many customers rely on Amazon S3 to store unstructured data at scale. To understand what’s in a bucket, you often need to build and maintain custom systems that scan for objects, track changes, and manage metadata over time. These systems are expensive to maintain and hard to keep up to date as data grows.
Since the launch of S3 Metadata at re:Invent 2024, you’ve been able to query new and updated object metadata using metadata tables instead of relying on Amazon S3 Inventory or object-level APIs such as ListObjects, HeadObject, and GetObject—which can introduce latency and impact downstream workflows.
To make it easier for you to work with this expanded metadata, S3 Metadata introduces live inventory tables that work with familiar SQL-based tools. After your existing objects are backfilled into the system, any updates like uploads or deletions typically appear within an hour in your live inventory tables.
With S3 Metadata live inventory tables, you get a fully managed Apache Iceberg table that provides a complete and current snapshot of the objects and their metadata in your bucket, including existing objects, thanks to backfill support. These tables are refreshed automatically within an hour of changes such as uploads or deletions, so you stay up to date. You can use them to identify objects with specific properties—like unencrypted data, missing tags, or particular storage classes—and to support analytics, cost optimization, auditing, and governance.
S3 Metadata journal tables, previously known as S3 Metadata tables, are automatically enabled when you configure live inventory tables, provide a near real-time view of object-level changes in your bucket—including uploads, deletions, and metadata updates. These tables are ideal for auditing activity, tracking the lifecycle of objects, and generating event-driven insights. For example, you can use them to find out which objects were deleted in the past 24 hours, identify the requester making the most PUT operations, or monitor updates to object metadata over time.
S3 Metadata tables are created in a namespace name that is similar to your bucket name for easier discovery. The tables are stored in AWS system table buckets, grouped by account and Region. After you enable S3 Metadata for a general purpose S3 bucket, the system creates and maintains these tables for you. You don’t need to manage compaction or garbage collection processes—S3 Tables takes care of table maintenance tasks in the background.
These new tables help avoid waiting for metadata discovery before processing can begin, making them ideal for large-scale analytics and machine learning (ML) workloads. By querying metadata ahead of time, you can schedule GPU jobs more efficiently and reduce idle time in compute-intensive environments.
Let’s see how it works To see how this works in practice, I configure S3 Metadata for a general purpose bucket using the AWS Management Console.
After choosing a general purpose bucket, I choose the Metadata tab, then I choose Create metadata configuration.
For Journal table, I can choose the Server-side encryption option and the Record expiration period. For Live Inventory table, I choose Enabled and I can select the Server-side encryption options.
I configure Record expiration on the journal table. Journal table records expire after the specified number of days, 365 days (one year) in my example.
Then, I choose Create metadata configuration.
S3 Metadata creates the live inventory table and journal table. In the Live Inventory table section, I can observe the Table status: the system immediately starts to backfill the table with existing object metadata. It can take between minutes to hours. The exact time depends on the quantity of objects you have in your S3 bucket.
While waiting, I also upload and delete objects to generate data in the journal table.
Then, I navigate to Amazon Athena to start querying the new tables.
I choose Query table with Athena to start querying the table. I can choose between a couple of default queries on the console.
In Athena, I observe the structure of the tables in the AWSDataCatalogData source and I start with a short query to check how many records are available in the journal table. I already have 6,488 entries:
SELECT count(*) FROM "b_aws_news_blog_metadata_inventory_ns"."journal";

# _col0
1 6488
Here are a couple of example queries I tried on the journal table:
# Query deleted objects in last 24 hours
# Use is_delete_marker=true for versioned buckets and record_type='DELETE' otherwise
SELECT bucket, key, version_id, last_modified_date
FROM "s3tablescatalog/aws-managed-s3"."b_aws_news_blog_metadata_inventory_ns"."journal"
WHERE last_modified_date >= (current_date - interval '1' day) AND is_delete_marker = true;

# bucket key version_id last_modified_date is_delete_marker
1 aws-news-blog-metadata-inventory .build/index-build/arm64-apple-macosx/debug/index/store/v5/records/G0/NSURLSession.h-JET61D329FG0
2 aws-news-blog-metadata-inventory .build/index-build/arm64-apple-macosx/debug/index/store/v5/records/G5/cdefs.h-PJ21EUWKMWG5
3 aws-news-blog-metadata-inventory .build/index-build/arm64-apple-macosx/debug/index/store/v5/records/FX/buf.h-25EDY57V6ZXFX
4 aws-news-blog-metadata-inventory .build/index-build/arm64-apple-macosx/debug/index/store/v5/records/G6/NSMeasurementFormatter.h-3FN8J9CLVMYG6
5 aws-news-blog-metadata-inventory .build/index-build/arm64-apple-macosx/debug/index/store/v5/records/G8/NSXMLDocument.h-1UO2NUJK0OAG8

# Query recent PUT requests IP addresses
SELECT source_ip_address, count(source_ip_address)
FROM "s3tablescatalog/aws-managed-s3"."b_aws_news_blog_metadata_inventory_ns"."journal"
GROUP BY source_ip_address;

#	source_ip_address	_col1
1	my_laptop_IP_address	12488

# Query S3 Lifecycle expired objects in last 7 days
SELECT bucket, key, version_id, last_modified_date, record_timestamp
FROM "s3tablescatalog/aws-managed-s3"."b_aws_news_blog_metadata_inventory_ns"."journal"
WHERE requester = 's3.amazonaws.com' AND record_type = 'DELETE' AND record_timestamp > (current_date - interval '7' day);

(not applicable to my demo bucket)
The results helped me track the specific objects that were removed, including their timestamps.
Now, I look at the live inventory table:
# Distribution of object tags
SELECT object_tags, count(object_tags)
FROM "s3tablescatalog/aws-managed-s3"."b_aws_news_blog_metadata_inventory_ns"."inventory"
GROUP BY object_tags;

# object_tags    _col1
1 {Source=Swift} 1
2 {Source=swift} 1
3 {}             12486

# Query storage class and size for specific tags
SELECT storage_class, count(*) as count, sum(size) / 1024 / 1024 as usage
FROM "s3tablescatalog/aws-managed-s3"."b_aws_news_blog_metadata_inventory_ns"."inventory"
GROUP BY object_tags['pii=true'], storage_class;

# storage_class count   usage
1 STANDARD      124884  165

# Find objects with specific user defined metadata
SELECT key, last_modified_date, user_metadata
FROM "s3tablescatalog/aws-managed-s3"."b_aws_news_blog_metadata_inventory_ns"."inventory"
WHERE cardinality(user_metadata) > 0 ORDER BY last_modified_date DESC;

(not applicable to my demo bucket)
Pricing and availability S3 Metadata live inventory and journal tables are available today in US East (Ohio, N. Virginia) and US West (N. California).
The journal tables are charged $0.30 per million updates. This is a 33 percent drop from our previous price.
For inventory tables, there’s a one-time backfill cost of $0.30 for a million objects to set up the table and generate metadata for existing objects. There are no additional costs if your bucket has less than one billion objects. For buckets with more than a billion objects, there is a monthly fee of $0.10 per million objects per month.
With S3 Metadata live inventory and journal tables, you can reduce the time and effort required to explore and manage large datasets. You get an up-to-date view of your storage and a record of changes, and both are available as Iceberg tables you can query on demand. You can discover data faster, power compliance workflows, and optimize your ML pipelines.
You can get started by enabling metadata inventory on your S3 bucket through the AWS console, AWS Command Line Interface (AWS CLI), or AWS SDKs. When they’re enabled, the journal and live inventory tables are automatically created and updated. To learn more, visit the S3 Metadata Documentation page.
Earlier this year, we preannounced that TwelveLabs video understanding models were coming to Amazon Bedrock. Today, we’re announcing the models are now available for searching through videos, classifying scenes, summarizing, and extracting insights with precision and reliability.
TwelveLabs has introduced Marengo, a video embedding model proficient at performing tasks such as search and classification, and Pegasus, a video language model that can generate text based on video data. These models are trained on Amazon SageMaker HyperPod to deliver groundbreaking video analysis that provides text summaries, metadata generation, and creative optimization.
With the TwelveLabs models in Amazon Bedrock, you can find specific moments using natural language video search capabilities like “show me the first touchdown of the game” or “find the scene where the main characters first meet” and instantly jump to those exact moments. You can also build applications to understand video content by generating descriptive text such as titles, topics, hashtags, summaries, chapters, or highlights for discovering insights and connections without requiring predefined labels or categories.
For example, you can find recurring themes in customer feedback or spot product usage patterns that weren’t obvious before. Whether you have hundreds or thousands of hours of video content, you can now transform that entire library into a searchable knowledge resource while maintaining enterprise-grade security and performance.
Let’s take a look at the Marengo and Pegasus videos that TwelveLabs has published.
You can transform video workflows with these models across industries. Media producers and editors can instantly locate specific scenes or dialogue, which means you can focus on storytelling rather than sifting through hours of footage. Marketing teams are streamlining their advertising workflows by quickly personalizing content to resonate with various audiences, while security teams are using the technology to proactively identify potential risks by spotting patterns across multiple video feeds.
Getting started with TwelveLabs models in Amazon Bedrock Before getting started, if you’re new to using TwelveLabs models, go to the Amazon Bedrock console and choose Model access in the bottom left navigation pane. To access the latest TwelveLabs models, request access for Marengo Embed 2.7 and Pegasus 1.2 in TwelveLabs.
To use TwelveLabs models in Amazon Bedrock, choose Chat/Text Playground under Test in the left navigation pane. Choose Select model, select TwelveLabs as the category and Pegasus as the model, and then choose Apply.
For searching or generating text from your video, you should upload your video to an Amazon Simple Storage Service (Amazon S3) bucket or input Base64-formatted video string.
I will use a sample video generated with Amazon Nova Reel with a prompt: “A cute raccoon playing guitar underwater.”
Enter the S3 URI of your uploaded video and the S3 Bucket Owner, and then run your prompt: “Tell me about the video by timeline”.
You can get following model response:
The video opens with an underwater scene featuring a sandy seabed and swaying seaweed, creating a serene atmosphere. At around 5 seconds, a raccoon appears, swimming towards the camera with a curious expression. By 10 seconds, the raccoon is seen swimming near the seabed. The focus then shifts to a group of koi fish swimming gracefully near the seabed from 11 to 13 seconds.
At 14 seconds, the scene transitions to an ukulele resting on the seabed, with the camera zooming in to highlight its details. The raccoon reappears at 20 seconds, swimming among the koi fish, and by 23 seconds, it begins to play the ukulele. The raccoon continues to play the ukulele from 29 to 41 seconds, with the koi fish swimming around it, adding a lively and colorful touch to the underwater setting.
From 42 to 49 seconds, the raccoon is shown playing the ukulele with the koi fish swimming around it. The video concludes with a screen displaying "Video generated with Amazon Novo Reel 1.1" and "Available in Amazon Bedrock" from 50 to 54 seconds, followed by the AWS logo from 55 to 57 seconds.
The TwelveLabs models can be easily integrated into your applications using the Amazon Bedrock Converse API, which provides a unified interface for conversational AI interactions.
import boto3
import json
import os

AWS_REGION = "us-east-1"
MODEL_ID = "twelvelabs.pegasus-1-2-v1:0"
VIDEO_PATH = "sample.mp4"

def read_file(file_path: str) -> bytes:
    """Read a file in binary mode."""
    try:
        with open(file_path, 'rb') as file:
            return file.read()
    except Exception as e:
        raise Exception(f"Error reading file {file_path}: {str(e)}")

bedrock_runtime = boto3.client(
    service_name="bedrock-runtime",
    region_name=AWS_REGION
)

request_body = {
    "messages": [
        {
            "role": "user",
            "content": [
                {
                    "inputPrompt": "tell me about the video",
                    "mediaSource: {
                        "base64String": read_file(VIDEO_PATH)
                    }
                },
            ],
        }
    ]
}

response = bedrock_runtime.converse(
    modelId=MODEL_ID,
    messages=request_body["messages"]
)

print(response["output"]["message"]["content"][-1]["text"])
The TwelveLabs Marengo Embed 2.7 model generates vector embeddings from video, text, audio, or image inputs. These embeddings can be used for similarity search, clustering, and other machine learning (ML) tasks. The model supports asynchronous inference through the Bedrock AsyncInvokeModel API.
For video source, you can request JSON format for the TwelveLabs Marengo Embed 2.7 model using the AsyncInvokeModel API.
Now available TwelveLabs models are generally available today in Amazon Bedrock: the Marengo model in the US East (N. Virginia), Europe (Ireland), and Asia Pacific (Seoul) Region, and the Pegasus model in US West (Oregon), and Europe (Ireland) Region accessible with cross-Region inference from US and Europe Regions. Check the full Region list for future updates. To learn more, visit the TwelveLabs in Amazon Bedrock product page and the Amazon Bedrock pricing page.
Processing large volumes of data efficiently is critical for businesses, and so data engineers, data scientists, and business analysts need reliable and scalable ways to run data processing workloads. The next generation of Amazon SageMaker is the center for all your data, analytics, and AI. Amazon SageMaker Unified Studio is a single data and AI development environment where you can find and access all of the data in your organization and act on it using the best tools across any use case.
We’re excited to announce a new data processing job experience for Amazon SageMaker. Jobs are a common concept widely used in existing AWS services such as Amazon EMR and AWS Glue. With this launch, you can now build jobs in SageMaker to process large volumes of data. Jobs can be built using your preferred tool. For example, you can create jobs from extract, transform, and load (ETL) scripts coded in the Unified Studio code editor, code interactively in a Unified Studio Notebooks, or create jobs visually using the Unified Studio Visual ETL editor. After being created, data processing jobs can be set to run on demand, scheduled using the built in scheduler, or orchestrated with SageMaker workflows. You can monitor the status of your data processing jobs and view run history showing status, logs, and performance metrics. When jobs encounter failures, you can use generative AI troubleshooting to automatically analyze errors and receive detailed recommendations to resolve issues quickly. Together, you can use these capabilities to author, manage, operate, and monitor data processing workloads across your organization. The new experience provides an experience that’s consistent with other AWS analytics services such as AWS Glue.
This post demonstrates how the new jobs experience works in SageMaker Unified Studio.
Prerequisites
To get started, you must have the following prerequisites in place:
A SageMaker Unified Studio project with an Data analytics and AI-ML model development project profile
Example use case
A global apparel ecommerce retailer processes thousands of customer reviews daily across multiple marketplaces. They need to transform their raw review data into actionable insights to improve their product offerings and customer experience. Using SageMaker Unified Studio visual ETL editor, we’ll demonstrate how to transform raw review data into structured analytical datasets that enable market-specific performance analysis and product quality monitoring.
Create and run a visual job
In this section, you’ll create a Visual ETL Job that processes the review data from a Parquet file in Amazon Simple Storage Service Amazon S3. The job transforms the data using SQL queries and saves the results back to S3 buckets. Complete the following steps to create a Visual ETL Job:
On the SageMaker Unified Studio console, on the top menu, choose Build.
Under DATA ANALYSIS & INTEGRATION, choose Data processing jobs.
Choose Create Visual ETLJob.
You’ll be directed to the Visual ETL editor, where you can create ETL jobs. You can use this editor to design data transformation pipelines by connecting source nodes, transformation nodes, and target nodes.
On the top left, choose the plus (+) icon in the circle. Under Data sources, select Amazon S3.
Select the Amazon S3 source node and enter the following values:
Choose the plus (+) icon in the circle to the right of the Amazon S3 source node. Under Transforms, select SQL query.
Enter the following query statement and select Update node.
SELECT
    marketplace,
    star_rating,
    DATE_FORMAT(review_date, 'yyyy-MM-dd') as review_date,
    COUNT(*) as review_count,
    AVG(CAST(helpful_votes as DOUBLE) / NULLIF(total_votes, 0)) as helpfulness_ratio,
    COUNT(CASE WHEN insight = 'Y' THEN 1 END) as insight_count
FROM {myDataSource}
GROUP BY
    marketplace,
    star_rating,
    DATE_FORMAT(review_date, 'yyyy-MM-dd')
Choose the plus (+) icon to the right of the SQL Query node. Under Data target, select Amazon S3.
Select the Amazon S3 target node and enter the following values:
S3 URI: Choose the Amazon S3 location from the project overview page and add the suffix “/output/rating_analysis/”. For example, s3://<bucket-name>/<domainId>/<projectId>/output/rating_analysis/
Format: Parquet
Compression: Snappy
Partition keys: review_date
Mode: Append
Select Update node.
Next, add another SQL query node connected to the same Amazon S3 data source. This node performs a SQL query transformations and outputs the results to a separate S3 location.
On the top left, choose the plus (+) icon in the circle. Under Transforms, select SQL query, and connect the Amazon S3 source node.
Enter the following query statement and select Update node.
SELECT
    marketplace,
    product_id,
    product_title,
    COUNT(*) as review_count,
    AVG(star_rating) as avg_rating,
    SUM(helpful_votes) as total_helpful_votes,
    COUNT(DISTINCT customer_id) as unique_reviewers,
    COUNT(CASE WHEN insight = 'Y' THEN 1 END) as insight_count
FROM {myDataSource}
GROUP BY
    marketplace,
    product_id,
    product_title
Choose the plus (+) icon to the right of the SQL Query node. Under Data target, select Amazon S3.
Select the Amazon S3 target node and enter the following values:
S3 URI: Choose the Amazon S3 location from the project overview page and add suffix “/output/product_analysis/”. For example, s3://<bucket-name>/<domainId>/<projectId>/output/product_analysis/
Format: Parquet
Compression: Snappy
Partition keys: marketplace
Mode: Append
Select Update node.
At this point, your end-to-end visual job should look like the following image. The next step is to save this job to the project and run the job.
On the top right, choose Save to project to save the draft job. You can optionally change the name and add a description.
Choose Save.
On the top right, choose Run.
This will start running your Visual ETL job. You can monitor the list of job runs by selecting View runs in the top middle of the screen.
Create and run a code based job
In addition to creating jobs through the Visual ETL Editor, you can create jobs using a code-based approach by specifying Python script or Notebook files. When you specify a Notebook file, it automatically converts to a Python script to create the job. Here, you’ll create a notebook in JupyterLab within SageMaker Unified Studio, save it to the project repository, and then create a code-based job from that notebook. First, create a Notebook.
On the SageMaker Unified Studio console, on the top menu, choose Build.
Under IDE & APPLICATIONS, select JupyterLab.
Select Python 3 under Notebook.
For the first cell, select Local Python, python, enter following code:
For the second cell, select PySpark, project.spark.compatibility, enter following code. This performs the same processing as the Visual ETL job you created above. Replace the S3 bucket and folder names for output_path.
import sys
from pyspark.context import SparkContext
from pyspark.sql import SparkSession

sc = SparkContext.getOrCreate()
spark = SparkSession.builder.getOrCreate()

# Create Spark session
sc = SparkContext.getOrCreate()
spark = SparkSession.builder.getOrCreate()

# Configure paths
input_path = "s3://aws-bigdata-blog/generated_synthetic_reviews/data/product_category=Apparel/"
output_path = "s3://<bucket-name>/<domainId>/<projectId>/code-job-output/results"


# Read data from S3
df = spark.read.format("parquet").load(input_path)
df.createOrReplaceTempView("reviews")

# Transform 1: Rating Analysis
rating_analysis = spark.sql("""
    SELECT
        marketplace,
        star_rating,
        DATE_FORMAT(review_date, 'yyyy-MM-dd') as review_date,
        COUNT(*) as review_count,
        AVG(CAST(helpful_votes as DOUBLE) / NULLIF(total_votes, 0)) as helpfulness_ratio,
        COUNT(CASE WHEN insight = 'Y' THEN 1 END) as insight_count
    FROM reviews
    GROUP BY
        marketplace,
        star_rating,
        DATE_FORMAT(review_date, 'yyyy-MM-dd')
""")

# Transform 2: Product Analysis
product_analysis = spark.sql("""
    SELECT
        marketplace,
        product_id,
        product_title,
        COUNT(*) as review_count,
        AVG(star_rating) as avg_rating,
        SUM(helpful_votes) as total_helpful_votes,
        COUNT(DISTINCT customer_id) as unique_reviewers,
        COUNT(CASE WHEN insight = 'Y' THEN 1 END) as insight_count
    FROM reviews
    GROUP BY
        marketplace,
        product_id,
        product_title
    HAVING
        COUNT(*) >= 5
""")

# Write results to S3
rating_analysis.write.format("parquet") \
    .option("compression", "snappy") \
    .partitionBy("review_date") \
    .mode("append") \
    .save(f"{output_path}/rating_analysis")

product_analysis.write.format("parquet") \
    .option("compression", "snappy") \
    .partitionBy("marketplace") \
    .mode("append") \
    .save(f"{output_path}/product_analysis")
Choose the File icon to save the notebook file. Enter the name of your notebook.
Save the notebook to the project’s repository.
Choose the Git icon in the left navigation. This opens a panel where you can view the commit history and perform Git operations.
Choose the plus (+) icon next to the files you want to commit.
Enter a brief summary of the commit in the Summary text entry field. Optionally, enter a longer description of the commit in the Description text entry field.
Choose Commit.
Choose the Push committed changes icon to do a git push.
Create the Code-based Job from the Notebook file in the project repository.
On the SageMaker Unified Studio console, on the top menu, choose Build.
Under DATA ANALYSIS & INTEGRATION, choose Data processing jobs.
Choose Create job from files.
Choose Choose project files and choose Browse files.
Select the Notebook file you created and choose Select.
Here, the Python script automatically converted from your notebook file will be displayed. Review the content.
Choose Next.
For Job name, enter the name of your job.
Choose Submit to create your job.
Choose the job you created.
Choose Run job.
Convert existing Visual ETL flows to jobs
You can convert an existing visual ETL flow to a job by saving your existing Visual ETL flow to the project repository. Use the following steps to create a job from your existing visual ETL flow:
On the SageMaker Unified Studio console, on the top menu, choose Build.
Under DATA ANALYSIS & INTEGRATION, select Visual ETL editor.
Select the existing Visual ETL flow.
On the top right, choose Save to project to save the draft flow. You can optionally change the name and add a description.
Choose Save.
View jobs
You can view the list of jobs in your project on the Data processing jobs page. Jobs can be filtered by mode (Visual ETL or Code).
Monitor job runs
On each job’s detail page, you can view a list of job runs in the Job runs tab. You can filter activities by job run ID, status, start time, and end time. The Job runs list shows basic attributes such as duration, resources consumed, and instance type, along with log group names and various job parameters. You can list, compare, and explore job runs history based on various attributes.
On the individual job run details page, you can view job properties and output logs from the run. When a job fails because of an error, you can see the error message at the top of the page and examine detailed error information in the output logs.
Intelligent troubleshooting with generative AI: When jobs fail, you can take advantage of generative AI troubleshooting to resolve issues quickly. SageMaker Unified Studio’s AI-powered troubleshooting automatically analyzes job metadata, Spark event logs, error stack traces, and runtime metrics to identify root causes and provide actionable solutions. It handles both simple scenarios like missing S3 buckets, and complex performance issues such as out-of-memory exceptions. The analysis explains not just what failed, but why it failed and how to fix it, reducing troubleshooting time from hours or days to minutes.
To start the analysis, choosing Troubleshoot with AI at the top right. The troubleshooting analysis provides Root Cause Analysis identifying the specific issue, Analysis Insights explaining the error context and failure patterns, and Recommendations with step-by-step remediation actions. This expert-level analysis makes complex Spark debugging accessible to all team members, regardless of their Spark expertise.
Clean up
To avoid incurring future charges, delete the resources you created during this walkthrough:
Delete Visual ETL flows in Visual ETL editor.
Delete Data processing jobs, including Visual ETL and Code-based jobs.
Delete Output files in the S3 bucket.
Conclusion
In this post, we explored the new job experience in Amazon SageMaker Unified Studio, which brings a familiar and consistent experience for data processing and data integration tasks. This new capability streamlines your workflows by providing enhanced visibility, cost management, and seamless migration paths from AWS Glue.With the ability to create both visual and code-based jobs, monitor job runs, and set up scheduling, the new jobs experience helps you build and manage data processing and data integration tasks efficiently. Whether you’re a data engineer working on ETL processes or a data scientist preparing datasets for machine learning, the job experience in SageMaker Unified Studio provides the tools you need in a unified environment.Start exploring the new job experience today to simplify your data processing workflows and make the most of your data in Amazon SageMaker Unified Studio.
About the authors
Chiho Sugimoto is a Cloud Support Engineer on the AWS Big Data Support team. She is passionate about helping customers build data lakes using ETL workloads. She loves planetary science and enjoys studying the asteroid Ryugu on weekends.
Noritaka Sekiyama is a Principal Big Data Architect at the AWS Analytics product team. He’s responsible for designing new features in AWS products, building software artifacts, and providing architecture guidance to customers. In his spare time, he enjoys cycling on his road bike.
Matt Su is a Senior Product Manager on the AWS Glue team. He enjoys helping customers uncover insights and make better decisions using their data with AWS Analytics services. In his spare time, he enjoys skiing and gardening.
Automation of data processing and data integration tasks and queries is essential for data engineers and analysts to maintain up-to-date data pipelines and reports. Amazon SageMaker Unified Studio is a single data and AI development environment where you can find and access the data in your organization and act on it using the ideal tools for your use case. SageMaker Unified Studio offers multiple ways to integrate with data through the Visual ETL, Query Editor, and JupyterLab builders. SageMaker is natively integrated with Apache Airflow and Amazon Managed Workflows for Apache Airflow (Amazon MWAA), and is used to automate the workflow orchestration for jobs, querybooks, and notebooks with a Python-based DAG definition.
Today, we are excited to launch a new visual workflows builder in SageMaker Unified Studio. With the new visual workflow experience, you don’t need to code the Python DAGs manually. Instead, you can visually define the orchestration workflow in SageMaker Unified Studio, and the visual definition is automatically converted to a Python DAG definition that is supported in Airflow. This post demonstrates the new visual workflow experience in SageMaker Unified Studio.
Example use case
In this post, a fictional ecommerce company sells many different products, like books, toys, and jewelry. Customers can leave reviews and star ratings for each product so other customers can make informed decisions about what they should buy. We use a sample synthetic review dataset for demonstration purposes, which includes different products and customer reviews.In this example, we demonstrate the new visual workflow experience with a data processing job, SQL querybook, and notebook. We also identify the top 10 customers who have contributed the most helpful votes per category.The following diagram illustrates the solution architecture.
In the following sections, we show how to configure a series of components using data processing jobs, querybooks, and notebooks with SageMaker Unified Studio visual workflows. You can use sample data to extract information from the specific category, update partition metadata, and display query results in the notebook using Python code.
Prerequisites
To get started, you must have the following prerequisites:
The first step is to create a data processing job to run visual transformations to identify top contributing customers per category. Complete the following steps to create a data processing job:
On the top menu, under Build, choose Visual ETL flow.
Choose the plus sign, and under Data sources, choose Amazon S3.
Choose the Amazon S3 source node and enter the following values:
Choose the plus sign, and under Transform, choose Filter.
Choose the Filter node and enter the following values:
Filter Type: Global AND
Key: product_category
Operation: ==
Value: Books
Choose Update node.
Choose the plus sign, and under Data targets, choose Amazon S3.
Choose the S3 node and enter the following values:
S3 URI: Use the Amazon S3 location from the project overview page and add the suffix /data/books_synthetic_reviews/ (for example, /dzd_al0ii4pi2sqv68/awi0lzjswu0yhc/dev/data/books_synthetic_reviews/)
Format: Parquet
Compression: Snappy
Partition keys: marketplace
Mode: Overwrite
Update Catalog: True
Database: Choose your database
Table: books_synthetic_review
Include header: False
Choose Update node.
At this point, you should have an end-to-end visual flow. Now you can publish it.
Choose Save to project to save the draft flow.
Change Job name to filter-books-synthetic-review, then choose Update.
The data processing job has been successfully created.
Create a querybook
Complete the following steps to create a querybook to run a SQL query against the source table to recognize partitions:
Choose the plus sign next to the querybook tab to open new querybook.
Enter the following query and choose Save to project. The query MSCK REPAIR TABLE is prepared for recognizing partitions in the table. We don’t run this querybook yet because the querybook is designed to be triggered by a workflow.
MSCK REPAIR TABLE `books_synthetic_review`;
For Querybook title, enter QueryBook-synthetic-review-<timestamp>, then choose Save changes.
The querybook to recognize new partitions has been successfully created.
Create a notebook
Next, we create notebook to generate output and visualize the results. Complete following steps:
On the top menu, under Build, choose JupyterLab.
Choose File, New, and Notebook to create a new notebook.
Enter the following code snippets into notebook cells and save them (provide your AWS account ID, AWS Region, and S3 bucket):
import sys
!{sys.executable} -m pip install PyAthena
from sagemaker_studio import Project
from pyathena import connect
import pandas as pd

project = Project()
s3_path = f'{project.s3.root}/sys/athena/'
region = project.connection().physical_endpoints[0].aws_region
database = project.connection().catalog().databases[0].name

conn = connect(s3_staging_dir=s3_path, region_name=region)

print("Top 10 most helpful commented customer, Books category")
df = pd.read_sql(f"""
select customer_id, sum(helpful_votes) helpful_votes_sum from {database}.books_synthetic_review group by customer_id order by sum(helpful_votes) desc limit 10;
""", conn)
df
Choose File, Save Notebook.
Rename the file name, and choose Rename and Save.
Choose the Git sidebar and choose the plus sign next to the file name.
Enter the commit message and choose COMMIT.
Choose Push to Remote.
Create a workflow
Complete the following steps to create a workflow:
On the top menu, under Build, choose Workflows.
Choose Create new workflow.
Choose the plus sign, then choose Data processing job.
Choose the Data processing job node, then choose Browse jobs.
Select filter-books-synthetic-review and choose Select.
Choose the plus sign, then choose Querybook.
Choose the Querybook node, then choose Browse files.
Select QueryBook-synthetic-review-<timestamp>.sqlnb and choose Select.
Choose the plus sign, then choose Notebook.
Choose the Notebook node, then choose Browse files.
Select synthetics-review-result.ipynb and choose Select.
At this point, you should have an end-to-end visual workflow. Now you can publish it.
Choose Save to project to save the draft flow.
Change Workflow name to synthetic-review-workflow and choose Save to project.
Run the workflow
To run your workflow, complete following steps:
Choose Run on the workflow details page.
Choose View runs to see the running workflow.
When the run is complete, you can check the notebook task result by choosing the run ID (manual__<timestamp>), then choose the notebook task ID (notebook-task-xxxx).
You can find the IDs of the top 10 customers who have contributed the most helpful votes in the notebook output.
Clean up
To avoid incurring future charges, clean up the resources you created during this walkthrough:
On the workflows page, select your workflow, and under Actions, choose Deleteworkflow.
On the Visual ETL flows page, select filter-books-synthetics-review, and under Actions, choose Delete flow.
In Query Editor, enter and run the following SQL to drop table:
DROP TABLE `books_synthetic_review`;
In JupyterLab, in the File Browser sidebar, choose (right-click) each notebook (synthetics-review-result.ipynb and QueryBook-synthetic-review-<timestamp>.sqlnb) and choose Delete.
Commit with git and then push to the remote repository.
Conclusion
The new visual workflow editor in SageMaker Unified Studio can help you orchestrate your data integration tasks visually without requiring deep expertise in Airflow. Through the visual interface, data engineers and analysts can focus on their core tasks instead of spending time on manual workflow Python DAG code implementation.Visual workflows offer several advantages, including an intuitive visual interface for workflow design and automatic conversion of visual workflows to Python DAG definitions. The integration with Airflow and Amazon MWAA further enhances the utility, and improved monitoring capabilities provide greater visibility into workflow runs. These features contribute to reduced development time in workflow creation. Visual workflows make workflow automation easy for a variety of use cases, such as data engineers orchestrating complex ETL pipelines or analysts maintaining regular reports.We encourage you to explore visual workflows in SageMaker Unified Studio, and discover how they can streamline your data processing and analytics workflows. For more information about SageMaker Unified Studio and its features, see AWS documentation.
About the authors
Naohisa Takahashi is a Senior Cloud Support Engineer on the AWS Support Engineering team. He supports customers resolve technical issues and launch systems. In his spare time, he plays board games with his friends.
Noritaka Sekiyama is a Principal Big Data Architect with AWS Analytics services. He’s responsible for building software artifacts to help customers. In his spare time, he enjoys cycling on his road bike.
Iris Tian is a UX designer on the Amazon SageMaker Unified Studio team. She designs intuitive, end-to-end experiences that simplify and streamline workflows across data processing and orchestration. In her spare time, she enjoys snowboarding and visiting museums.
Regan Baum is a Senior Software Development Engineer on the Amazon SageMaker Unified Studio team. She designs, implements, and maintains features that enable customers to manage their workflows in SageMaker Unified Studio. Outside of work, she enjoys hiking and running.
Yuhang Huang is a Software Development Manager on the Amazon SageMaker Unified Studio team. He leads the engineering team to design, build, and operate scheduling and orchestration capabilities in SageMaker Unified Studio. In his free time, he enjoys playing tennis.
Gal Heyne is a Senior Technical Product Manager for AWS Analytics services with a strong focus on AI/ML and data engineering. She is passionate about developing a deep understanding of customers’ business needs and collaborating with engineers to design simple-to-use data products.
The arcade is no longer ours, under attack from its own AI. Screens flicker with sentient static. The arcade’s laser power supply is failing; the power supply diagnostics are showing errors in everything from surge control to cooling functions. But, not all hope is lost: The laser power supply service and terminal both use PowerShell for operations.
Time to flex my command-line kung fu. Follow the breadcrumbs, get all parts of the puzzle together, hash-out files, and perform forensics to backtrack the changes. Win the race to terminate all evil processes, reverse all changes in the right order, and finally, succeed at powering up our arcade.
I leaned back from my keyboard. This wasn’t a Five Nights at Freddie’s-style dystopia—this was Sans Core NetWars, a prestigious, invite-only cybersecurity tournament—and my team won the 2024 Tournament of Champions last year. This year’s theme, defeating a rogue AI in an arcade, has me feeling inspired.
Call it a recursive function, but we had AI generate an image of the evil AI.
Held annually at the SANS Cyber Defense Initiative in Washington, D.C., NetWars challenges participants with a series of escalating scenarios that test a wide range of skills, from digital forensics to malware analysis.
My name is Manuel, and I’m a Cloud Security Architect at Backblaze. Not every part of my job is all fun and games, but tournaments like NetWars have long been an important part of the cybersecurity industry. Let’s talk about why, and how, they help solve what is arguably the biggest persistent vulnerability in the cybersecurity industry—attracting, identifying, developing, and maintaining top talent.
What are cybersecurity tournaments?
The concept of cybersecurity competitions dates back to 1996 with the introduction of the capture the flag (CTF) event at DEFCON, one of the world’s largest hacker conventions. This event set the stage for numerous other competitions, and these days, cybersecurity tournaments and competitions have cultivated a vibrant community where top experts not only showcase their technical prowess, but also stay up-to-date with evolving trends in the industry.
Manuel in front of the leaderboard after winning the SANS Core Netwars Tournament of Champions 2024. Source.
What are the challenges to finding talent in the cybersecurity industry?
Finding top cybersecurity talent is one of the most persistent challenges in the tech industry. The field moves faster than job descriptions with attack techniques, tools, and frameworks evolving constantly.
Not only that, but “cybersecurity” isn’t one skill—it’s a collection of disciplines: network security, cloud infrastructure, threat hunting, incident response, forensics, red teaming, compliance, and more. Finding someone with both broad knowledge and deep expertise in one or two areas is rare. Top candidates tend to specialize, and hiring managers often need a “Swiss Army knife.”
How do tournaments help to solve that?
Cybersecurity tournaments like the SANS NetWars Tournament of Champions play a crucial role in advancing the field. They not only provide a platform for professionals to hone their skills but also contribute to building a resilient and collaborative cybersecurity community.
It may seem like “just a game”, but it’s more than just a fun activity taking place over a few days—tournaments contribute to things like:
Skill enhancement: Participants apply theoretical knowledge to practical challenges, enhancing their technical proficiency in areas like network security, cryptography, and incident response.
Continuous learning: The dynamic nature of these competitions encourages ongoing education, keeping professionals abreast of emerging threats and technologies.
Community building: Tournaments foster camaraderie among participants, creating networks that facilitate knowledge sharing and collaboration.
Talent identification: Organizations often scout these events to identify and recruit top talent, recognizing the practical skills demonstrated by competitors.
Inside the arena: Winning NetWars
For those unfamiliar, the Tournament of Champions isn’t your average capture the flag event. It’s an invitation-only tournament where only the top 3% of NetWars performers from the past two years are allowed to compete. Out of hundreds of global professionals—those who placed at the top of previous SANS events—only 300 get the invite. Around 250 of us showed up in D.C. to test our skills against the best in the industry.
Some see a conference room. Others, a battlefield. Source.
The structure of the tournament is deceptively simple: five escalating levels of difficulty over two days, each packed with real-world cybersecurity challenges across disciplines like digital forensics, malware analysis, network penetration testing, cryptography, cloud security, and even hardware, and mobile hacking.
You’re given two three-hour sessions to rack up as many points as you can, as quickly as possible. The faster you solve, the higher you climb. The problems are designed to simulate the kinds of complex tasks we face every day—reverse engineering binaries, analyzing breach data, and so on.
Beyond the technical challenge, what makes this event stand out is the people. The cybersecurity community is incredibly sharp, humble, and generous with knowledge. You’ll see everyone from Fortune 500 defenders to government red teamers, cloud security architects, and digital forensics and incident response (DFIR) experts—all there to sharpen their skills and learn from each other.
If you ever get the invitation to compete, take it. There’s nothing quite like battling alongside (and against) some of the sharpest minds in infosec, in a city that reminds you just how high the stakes can be.
See you at the next one?
Winning that tournament was an incredible honor—but more importantly, it gives me a good opportunity to showcase how such competitions can elevate industry standards and inspire the next generation of cybersecurity professionals.
So, if you’re interested in the cybersecurity industry, come on out. Start small: join a CTF. Set up a home lab. Learn Python. Read about the latest breaches and figure out how they happened. You don’t need to be a hacker to get started—you just need to be curious.
The threats we face are growing, but so is our community. And who knows? Maybe I’ll see you at the next competition.
Many great ideas at Netflix begin with a question, and three years ago, we asked one of our boldest yet: if we were to entertain the world through Live — a format almost as old as television itself — how would we do it?
In our series Behind the Streams — where we take you through the technical journey of our biggest bets — we will do a multiple part deep-dive into the architecture of Live and what we learned while building it. Part one begins with the foundation we set for Live, and the critical decisions we made that influenced our approach.
| But First: What Makes Live Streaming Different?
While Live as a television format is not new, the streaming experience we intended to build required capabilities we did not have at the time. Despite 15 years of on-demand streaming under our belt, Live introduced new considerations influencing architecture and technology choices:
This means that we had a lot to build in order to make Live work well on Netflix. That starts with making the right choices regarding the fundamentals of our Live Architecture.
| Key Pillars of Netflix Live Architecture
Our Live Technology needed to extend the same promise to members that we’ve made with on-demand streaming: great quality on as many devices as possible without interruptions. Live is one of many entertainment formats on Netflix, so we also needed to seamlessly blend Live events into the user experience, all while scaling to over 300 million global subscribers.
When we started, we had nine months until the first launch. While we needed to execute quickly, we also wanted to architect for future growth in both magnitude and multitude of events. As a key principle, we leveraged our unique position of building support for a single product — Netflix — and having control over the full Live lifecycle, from Production to Screen.
Dedicated Broadcast Facilities to Ingest Live Content from Production
Live events can happen anywhere in the world, but not every location has Live facilities or great connectivity. To ensure secure and reliable live signal transport, we leverage distributed and highly connected broadcast operations centers, with specialized equipment for signal ingest and inspection, closed-captioning, graphics and advertisement management. We prioritized repeatability, conditioning engineering to launch live events consistently, reliably, and cost-effectively, leaning into automation wherever possible. As a result, we have been able to reduce the event-specific setup to the transmission between production and the Broadcast Operations Center, reusing the rest across events.
Cloud-based Redundant Transcoding and Packaging Pipelines
The feed received at the Broadcast Center contains a fully produced program, but still needs to be encoded and packaged for streaming on devices. We chose a Cloud-based approach to allow for dynamic scaling, flexibility in configuration, and ease of integration with our Digital Rights Management (DRM), content management, and content delivery services already deployed in the cloud. We leverage AWS MediaConnect and AWS MediaLive to acquire feeds in the cloud and transcode them into various video quality levels with bitrates tailored per show. We built a custom packager to better integrate with our delivery and playback systems. We also built a custom Live Origin to ensure strict read and write SLAs for Live segments.
Scaling Live Content Delivery to millions of viewers with Open Connect CDN
In order for the produced media assets to be streamed, they need to be transferred from a few AWS locations, where Live Origin is deployed, to hundreds of millions of devices worldwide. We leverage Netflix’s CDN, Open Connect, to scale Live asset delivery. Open Connect servers are placed close to the viewers at over 6K locations and connected to AWS locations via a dedicated Open Connect Backbone network.
18K+ servers in 6K+ locations, in Internet Exchanges, or embedded into ISP networksOpen Connect Backbone connects servers in Internet Exchange locations to 5 AWS regions
By enabling Live delivery on Open Connect, we build on top of $1B+ in Netflix investments over the last 12 years focused on scaling the network and optimizing the performance of delivery servers. By sharing capacity across on-demand and Live viewership we improve utilization, and by caching past Live content on the same servers used for on-demand streaming, we can easily enable catch-up viewing.
Optimizing Live Playback for Device Compatibility, Scale, Quality, and Stability
To make Live accessible to the majority of our customers without upgrading their streaming devices, we settled on using HTTPS-based Live Streaming. While UDP-based protocols can provide additional features like ultra-low latency, HTTPS has ubiquitous support among devices and compatibility with delivery and encoding systems. Furthermore, we use AVC and HEVC video codecs, transcode with multiple quality levels up from SD to 4K, and use a 2-second segment duration to balance compression efficiency, infrastructure load, and latency. While prioritizing streaming quality and playback stability, we have also achieved industry standard latency from camera to device, and continue to improve it.
To configure playback, the device player receives a playback manifest at the play start. The manifest contains items like the encoding bitrates and CDN servers players should use. We deliver the manifest from the cloud instead of the CDN, as it allows us to personalize the configuration for each device. To reference segments of the stream, the manifest includes a segment template that is used by devices to map a wall-clock time to URLs on the CDN. Using a segment template vs periodic polling for manifest updates minimizes network dependencies, CDN server load, and overhead on resource-constrained devices, like smart TVs, thus improving both scalability and stability of our system. While streaming, the player monitors network performance and dynamically chooses the bitrate and CDN server, maximizing streaming quality while minimizing rebuffering.
Run Discovery and Playback Control Services in the Cloud
So far, we have covered the streaming path from Camera to Device. To make the stream fully work, we also need to orchestrate across all systems, and ensure viewers can find and start the Live event. This functionality is performed by dozens of Cloud services, with functions like playback configuration, personalization, or metrics collection. These services tend to receive disproportionately higher loads around Live event start time, and Cloud deployment provides flexibility in dynamically scaling compute resources. Moreover, as Live demand tends to be localized, we are able to balance load across multiple AWS regions, better utilizing our global footprint. Deployment in the cloud also allows us to build a user experience where we embed Live content into a broader selection of entertainment options in the UI, like on-demand titles or Games.
Centralize Real-time Metrics in the Cloud with Specialized Tools and Facilities
With control over ingest, encoding pipelines, the Open Connect CDN, and device players, we have nearly end-to-end observability into the Live workflow. During Live, we collect system and user metrics in real-time (e.g., where members see the title on Netflix and their quality of experience), alerting us to poor user experiences or degraded system performance. Our real-time monitoring is built using a mix of internally developed tools, such as Atlas, Mantis, and Lumen, and open-source technologies, such as Kafka and Druid, processing up to 38 million events per second during some of our largest live events while providing critical metrics and operational insights in a matter of seconds. Furthermore, we set up dedicated “Control Center” facilities, which bring key metrics together to the operational team that monitors the event in real-time.
| Our key learnings so far
Building new functionality always brings fresh challenges and opportunities to learn, especially with a system as complex as Live. Even after three years, we’re still learning every day how to deliver Live events more effectively. Here are a few key highlights:
Extensive testing: Prior to Live we heavily relied on the predictable flow of on-demand traffic for pre-release canaries or A/B tests to validate deployments. But Live traffic was not always available, especially not at the scale representative of a big launch. As a result, we spent considerable effort to:
Generate internal “test streams,” which engineers use to run integration, regression, or smoke tests as part of the development lifecycle.
Build synthetic load testing capabilities to stress test cloud and CDN systems. We use 2 approaches, allowing us to generate up to 100K starts-per-second: — Capture, modify, and replay past Live production traffic, representing a diversity of user devices and request patterns. — Virtualize Netflix devices and generate traffic against CDN or Cloud endpoints to test the impact of the latest changes across all systems.
Run automated failure injection, forcing missing or corrupted segments from the encoding pipeline, loss of a cloud region, network drop, or server timeouts.
Regular practice: Despite rigorous pre-release testing, nothing beats a production environment, especially when operating at scale. We learned that having a regular schedule with diverse Live content is essential to making improvements while balancing the risks of member impact. We run A/B tests, perform chaos testing, operational exercises, and train operational teams for upcoming launches.
Viewership predictions: We use prediction-based techniques to pre-provision Cloud and CDN capacity, and share forecasts with our ISP and Cloud partners ahead of time so they can plan network and compute resources. Then we complement them with reactive scaling of cloud systems powering sign-up, log-in, title discovery, and playback services to account for viewership exceeding our predictions. We have found success with forward-looking real-time viewership predictions during a live event, allowing us to take steps to mitigate risks earlier, before more members are impacted.
Graceful degradation: Despite our best efforts, we can (and did!) find ourselves in a situation where viewership exceeded our predictions and provisioned capacity. In this case, we developed a number of levers to continue streaming, even if it means gradually removing some nice-to-have features. For example, we use service-level prioritized load shedding to prioritize live traffic over non-critical traffic (like pre-fetch). Beyond that, we can lighten the experience, like dialing down personalization, disabling bookmarks, or lowering the maximum streaming quality. Our load tests include scenarios where we under-scale systems to validate desired behavior.
Retry storms: When systems reach capacity, our key focus is to avoid cascading issues or further overloading systems with retries.Beyond system retries, users may retry manually — we’ve seen a 10x increase in traffic load due to stream restarts after viewing interruptions of as little as 30 seconds. We spent considerable time understanding device retry behavior in the presence of issues like network timeouts or missing segments. As a result, we implemented strategies like server-guided backoff for device retries, absorbing spikes via prioritized traffic shedding at Cloud Edge Gateway, and re-balancing traffic between cloud regions.
Contingency planning: “Everyone has a plan until they get punched in the mouth” is very relevant for Live. When something breaks, there is practically no time for troubleshooting. For large events, we set up in-person launch rooms with engineering owners of critical systems. For quick detection and response, we developed a small set of metrics as early indicators of issues, and have extensive runbooks for common operational issues. We don’t learn on launch day; instead, launch teams practice failure response via Game Day exercises ahead of time. Finally, our runbooks extend beyond engineering, covering escalation to executive leadership and coordination across functions like Customer Service, Production, Communications, or Social.
Our commitment to enhancing the member experience doesn’t end at the “Thanks for Watching!” screen. Shortly after each live stream, we dive into metrics to identify areas for improvement. Our Data & Insights team conducts comprehensive analyses, A/B tests, and consumer research to ensure the next event is even more delightful for our members. We leverage insights on member behavior, preferences, and expectations to refine the Netflix product experience and optimize our Live technology — like reducing latency by ~10 seconds through A/B tests, without affecting quality or stability.
| What’s next on our Live journey?
Despite three years of effort, we are far from done! In fact, we are just getting started, actively building on the learnings shared above to deliver more joy to our members with Live events. To support the growing number of Live titles and new formats, like FIFA WWC in 2027, we keep building our broadcast and delivery infrastructure and are actively working to further improve the Live experience.
In this post, we’ve provided a broad overview and have barely scratched the surface. In the upcoming posts, we will dive deeper into key pillars of our Live systems, covering our encoding, delivery, playback, and user experience investments in more detail.
Getting this far would not have been possible without the hard work of dozens of teams across Netflix, who collaborate closely to design, build, and operate Live systems: Operations and Reliability, Encoding Technologies, Content Delivery, Device Playback, Streaming Algorithms, UI Engineering, Search and Discovery, Messaging, Content Promotion and Distribution, Data Platform, Cloud Infrastructure, Tooling and Productivity, Program Management, Data Science & Engineering, Product Management, Globalization, Consumer Insights, Ads, Security, Payments, Live Production, Experience and Design, Product Marketing and Customer Service, amongst many others.
On 14 July 2025, Cloudflare’s 1.1.1.1 Resolver service became unavailable to the Internet starting at 21:52 UTC and ending at 22:54 UTC. The majority of 1.1.1.1 users globally were affected. For many users, not being able to resolve names using the 1.1.1.1 Resolver meant that basically all Internet services were unavailable. This outage can be observed on Cloudflare Radar.
The outage occurred because of a misconfiguration of legacy systems used to maintain the infrastructure that advertises Cloudflare’s IP addresses to the Internet.
This was a global outage. During the outage, Cloudflare’s 1.1.1.1 Resolver was unavailable worldwide.
We’re very sorry for this outage. The root cause was an internal configuration error and not the result of an attack or a BGP hijack. In this blog, we’re going to talk about what the failure was, why it occurred, and what we’re doing to make sure this doesn’t happen again.
Background
Cloudflare introduced the 1.1.1.1 public DNS Resolver service in 2018. Since the announcement, 1.1.1.1 has become one of the most popular DNS Resolver IP addresses and it is free for anyone to use.
Almost all of Cloudflare’s services are made available to the Internet using a routing method known as anycast, a well-known technique intended to allow traffic for popular services to be served in many different locations across the Internet, increasing capacity and performance. This is the best way to ensure we can globally manage our traffic, but also means that problems with the advertisement of this address space can result in a global outage.
Cloudflare announces these anycast routes to the Internet in order for traffic to those addresses to be delivered to a Cloudflare data center, providing services from many different places. Most Cloudflare services are provided globally, like the 1.1.1.1 public DNS Resolver, but a subset of services are specifically constrained to particular regions.
These services are part of our Data Localization Suite (DLS), which allows customers to configure Cloudflare in a variety of ways to meet their compliance needs across different countries and regions. One of the ways in which Cloudflare manages these different requirements is to make sure the right service’s IP addresses are Internet-reachable only where they need to be, so your traffic is handled correctly worldwide. A particular service has a matching “service topology” – that is, traffic for a service should be routed only to a particular set of locations.
On June 6, during a release to prepare a service topology for a future DLS service, a configuration error was introduced: the prefixes associated with the 1.1.1.1 Resolver service were inadvertently included alongside the prefixes that were intended for the new DLS service. This configuration error sat dormant in the production network as the new DLS service was not yet in use, but it set the stage for the outage on July 14. Since there was no immediate change to the production network there was no end-user impact, and because there was no impact, no alerts were fired.
Incident Timeline
Time (UTC)
Event
2025-06-06 17:38
ISSUE INTRODUCED – NO IMPACT
A configuration change was made for a DLS service that was not yet in production. This configuration change accidentally included a reference to the 1.1.1.1 Resolver service and, by extension, the prefixes associated with the 1.1.1.1 Resolver service.
This change did not result in a change of network configuration, and so routing for the 1.1.1.1 Resolver was not affected.
Since there was no change in traffic, no alerts fired, but the misconfiguration lay dormant for a future release.
2025-07-14 21:48
IMPACT START
A configuration change was made for the same DLS service. The change attached a test location to the non-production service; this location itself was not live, but the change triggered a refresh of network configuration globally.
Due to the earlier configuration error linking the 1.1.1.1 Resolver’s IP addresses to our non-production service, those 1.1.1.1 IPs were inadvertently included when we changed how the non-production service was set up.
The 1.1.1.1 Resolver prefixes started to be withdrawn from production Cloudflare data centers globally.
2025-07-14 21:52
DNS traffic to 1.1.1.1 Resolver service begins to drop globally
2025-07-14 21:54
Related, non-causal event: BGP origin hijack of 1.1.1.0/24 exposed by withdrawal of routes from Cloudflare. This was not a cause of the service failure, but an unrelated issue that was suddenly visible as that prefix was withdrawn by Cloudflare.
2025-07-14 22:01
IMPACT DETECTED
Internal service health alerts begin to fire for the 1.1.1.1 Resolver
2025-07-14 22:01
INCIDENT DECLARED
2025-07-14 22:20
FIX DEPLOYED
Revert was initiated to restore the previous configuration. To accelerate full restoration of service, a manually triggered action is validated in testing locations before being executed.
2025-07-14 22:54
IMPACT ENDS
Resolver alerts cleared and DNS traffic on Resolver prefixes return to normal levels
2025-07-14 22:55
INCIDENT RESOLVED
Impact
Any traffic coming to Cloudflare via 1.1.1.1 Resolver services on these IPs was impacted. Traffic to each of these addresses were also impacted on the corresponding routes.
When the impact started we observed an immediate and significant drop in queries over UDP, TCP and DNS over TLS (DoT). Most users have 1.1.1.1, 1.0.0.1, 2606:4700:4700::1111, or 2606:4700:4700::1001 configured as their DNS server. Below you can see the query rate for each of the individual protocols and how they were impacted during the incident:
It’s worth noting that DoH (DNS-over-HTTPS) traffic remained relatively stable as most DoH users use the domain cloudflare-dns.com, configured manually or through their browser, to access the public DNS resolver, rather than by IP address. DoH remained available and traffic was mostly unaffected as cloudflare-dns.com uses a different set of IP addresses. Some DNS traffic over UDP that also used different IP addresses remained mostly unaffected as well.
As the corresponding prefixes were withdrawn, no traffic sent to those addresses could reach Cloudflare. We can see this in the timeline for the BGP announcements for 1.1.1.0/24:
Pictured above is the timeline for BGP withdrawal and re-announcement of 1.1.1.0/24 globally
When looking at the query rate of the withdrawn IPs it can be observed that almost no traffic arrives during the impact window. When the initial fix was applied at 22:20 UTC, a large spike in traffic can be seen before it drops off again. This spike is due to clients retrying their queries. When we started announcing the withdrawn prefixes again, queries were able to reach Cloudflare once more. It took until 22:54 UTC before routing was restored in all locations and traffic returned to mostly normal levels.
Technical description of the error and how it happened
Failure of 1.1.1.1 Resolver Service
As described above, a configuration change on June 6 introduced an error in the service topology for a pre-production, DLS service. On July 14, a second change to that service was made: an offline data center location was added to the service topology for the pre-production DNS service in order to allow for some internal testing. This change triggered a refresh of the global configuration of the associated routes, and it was at this point that the impact from the earlier configuration error was felt. The service topology for the 1.1.1.1 Resolver’s prefixes was reduced from all locations down to a single, offline location. The effect was to trigger the global and immediate withdrawal of all 1.1.1.1 prefixes.
As routes to 1.1.1.1 were withdrawn, the 1.1.1.1 service itself became unavailable. Alerts fired and an incident was declared.
Technical Investigation and Analysis
The way that Cloudflare manages service topologies has been refined over time and currently consist of a combination of a legacy and a strategic system that are synced. Cloudflare’s IP ranges are currently bound and configured across these systems that dictate where an IP range should be announced (in terms of datacenter location) on the edge network. The legacy approach of hard-coding explicit lists of data center locations and attaching them to particular prefixes has proved error-prone, since (for example) bringing a new data center online requires many different lists to be updated and synced consistently. This model also has a significant flaw in that updates to the configuration do not follow a progressive deployment methodology: Even though this release was peer-reviewed by multiple engineers, the change didn’t go through a series of canary deployments before reaching every Cloudflare data center. Our newer approach is to describe service topologies without needing to hard-code IP addresses, which better accommodate expansions to new locations and customer scenarios while also allowing for a staged deployment model, so changes can propagate slowly with health monitoring. During the migration between these approaches, we need to maintain both systems and synchronize data between them, which looks like this:
Initial alerts were triggered for the DNS Resolver at 22:01, indicating query, proxy, and data center failures. While investigating the alerts, we noted traffic toward the Resolver prefixes had drastically dropped and was no longer being received at our edge data centers. Internally, we use BGP to control route advertisements, and we found the Resolver routes from servers were completely missing.
Once our configuration error had been exposed and Cloudflare systems had withdrawn the routes from our routing table, all of the 1.1.1.1 routes should have disappeared entirely from the global Internet routing table. However, this isn’t what happened with the prefix 1.1.1.0/24. Instead, we got reports from Cloudflare Radar that Tata Communications India (AS4755) had started advertising 1.1.1.0/24: from the perspective of the routing system, this looked exactly like a prefix hijack. This was unexpected to see while we were troubleshooting the routing problem, but to be perfectly clear: this BGP hijack was not the cause of the outage. We are following up with Tata Communications.
Restoring the 1.1.1.1 Service
We reverted to the previous configuration at 22:20 UTC. Near instantly, we began readvertising the BGP prefixes which were previously withdrawn from the routers, including 1.1.1.0/24. This restored 1.1.1.1 traffic levels to roughly 77% of what they were prior to the incident. However, during the period since withdrawal, approximately 23% of the fleet of edge servers had been automatically reconfigured to remove required IP bindings as a result of the topology change. To add the configurations back, these servers needed to be reconfigured with our change management system which is not an instantaneous process by default for safety.
The process by which the IP bindings can be restored normally takes some time, as the network in individual locations is designed to be updated over a course of multiple hours. We implement a progressive rollout, rather than on all nodes at once to ensure we don’t introduce additional impact. However, given the severity of the incident, we accelerated the rollout of the fix after verifying the changes in testing locations to restore service as quickly and safely as possible. Normal traffic levels were observed at 22:54 UTC.
Remediation and follow-up steps
We take incidents like this seriously, and we recognise the impact that this incident had. Though this specific issue has been resolved, we have identified several steps we can take to mitigate the risk of a similar problem occurring in the future. We are implementing the following plan as a result of this incident:
Staging Addressing Deployments: Legacy components do not leverage a gradual, staged deployment methodology. Cloudflare will deprecate these systems which enables modern progressive and health mediated deployment processes to provide earlier indication in a staged manner and rollback accordingly.
Deprecating Legacy Systems: We are currently in an intermediate state in which current and legacy components need to be updated concurrently, so we will be migrating addressing systems away from risky deployment methodologies like this one. We will accelerate our deprecation of the legacy systems in order to provide higher standards for documentation and test coverage.
Conclusion
Cloudflare’s 1.1.1.1 DNS Resolver service fell victim to an internal configuration error.
We are sorry for the disruption this incident caused for our customers. We are actively making these improvements to ensure improved stability moving forward and to prevent this problem from happening again.
We are thrilled to announce that Cloudflare has been named a Visionary in the 2025 Gartner® Magic Quadrant™ for Secure Access Service Edge (SASE) Platforms1 report. We view this evaluation as a significant recognition of our strategy to help connect and secure workspace security and coffee shop networking through our unique connectivity cloud approach. You can read more about our position in the report here.
Today, we operate the world’s most expansive SASE network in order to deliver connectivity and security close to where users and applications are, anywhere in the world. We’ve developed our services from the ground up to be fully integrated and run on every server across our network, delivering a unified experience to our customers. And we enable these services with a unified control plane, enabling end-to-end visibility and control anywhere in the world. Tens of thousands of customers trust Cloudflare with their network and security infrastructure.
We’re thrilled with our inclusion in this report and are even more excited that we’re only just getting started. Building on this foundation, we’re investing to move even faster to solve problems for our customers.
What is SASE?
SASE (pronounced “sassy”) is an architectural model that delivers network connectivity and security functions, and delivers them through a single cloud platform and/or centralized policy control.
Given the extent of what organizations need for networking and security, not all SASE capabilities may be available from a single vendor. For example, the security-as-a-service model is sometimes consumed as a part of Security Service Edge (SSE).
The evolution of this architecture, where a vendor delivers key functionality across networking and security service in a single offering, is SASE. What’s important to note, however, is that convergence can mean many, many different things. For example, some vendors started with SSE capabilities and are building out infrastructure to support it. Some vendors are using public cloud for their infrastructure. Some are aggressively pursuing M&A to acquire functionality. These decisions have led to many problematic questions such as: how many interfaces do organizations need to manage their network and security needs? Why is security enforcement sometimes in the cloud and sometimes at the branch edge?
We believe that the market deserves more than a buffet of features. Convergence should be greater than the sum of the parts. The infrastructure/control plane/data plane for networking services should not be an independent entity from the security services. We believe that we are delivering SASE capabilities in a fundamentally different manner than the majority of vendors in the market: by building out the platform first, and layering services upon it.
We also believe that our efforts to focus on the underlying network delivers better solutions for simplifying your infrastructure, establishing control, and maintaining visibility to support branch connectivity, hybrid work, Zero Trust, and secure cloud access.
What is required for SASE and how is Cloudflare different?
The Cloudflare Global network is one of the largest, most well-connected networks in the world, spanning more than 330 cities in over 125 countries. We are not a new vendor entering a new market, but rather one that has been delivering services upon a mature platform that’s been tested under the most extreme circumstances over the past 15+ years.
Our unified platform, Cloudflare’s connectivity cloud, is built upon a set of principles across our infrastructure, our control plane, and our data plane, that guides everything we do:
Infrastructure: The infrastructure that we build must be everywhere our customers do business. Users, applications, and data are everywhere, and therefore we build ahead of our customer’s needs to ensure that they can connect anything to anywhere, quickly and reliably.
Control Plane: To stay on top of operations, organizations want a single user interface for monitoring activity and enforcing policies, with changes pushed out globally in seconds. In addition, our customers want APIs to extend management into automation and infrastructure-as-code tools. We help organizations cut down on the tool sprawl, doing away with the drudgery and complexity that affects even the most basic administrative tasks with conventional tech stacks. And we restore observability across activity (again by virtue of facilitating any-to-any connectivity) to help with operations with troubleshooting, forensics, and insights across the application landscape.
Data Plane: The data plane is where services are delivered, and we constantly deliver innovations in how users connect, consistently enforce inspection and policy, and deliver traffic to the intended location securely. These services are composable, meaning that new functionality can be enabled from the Control Plane, without the headaches of network downtime normally associated with appliance insertion.
How customers benefit from Cloudflare’s design principles
These principles are crucial for delivering a superior, end-to-end user experience. Your SASE environment is (or will be) processing packets from users across the globe. Latency damages the user experience, in ways that are similar to how a smoothly running engine becomes unreliable and inefficient as internal components become dirty. Our design principles establish the north star to ensure that everything we do and everything we build does not add grit to the engine. This is important because we are seeing a lot of confusion (and some obfuscation) about how to deliver performant SASE services.
To understand how our principles apply towards the delivery of SASE services:
Connecting users to a data center (last mile latency): With traditional on-prem networking, one of the major sources of latency is getting the traffic to the security stack. Both hub & spoke and VPN focus on taking traffic (from sometimes distant locations) to one of the organization’s security enforcement points such as a perimeter firewall. With SASE, the objective is to deliver the security closer to the user, using one of the SASE provider’s data centers. Cloudflare’s global coverage delivers service to within 50ms of 95% of the world’s population. This is something unique to Cloudflare, in that other vendors seldom discuss how much data center coverage is needed to deliver sufficient last mile performance, or sometimes use confusing metrics about the latency within their data centers (see next section) to infer what organizations might expect with end-to-end latency.
Delivering key networking and security services (processing latency): SASE data centers must deliver networking and security, but not all cloud data centers are designed the same. Some implementations in the market separate the SASE edge (the point of presence) from the actual compute (the data center itself). Some have disguised their single-pass processing with a series of daisy-chained proxies, which requires inefficiently decoding packets multiple times (From L3 to L7 and back to L3) to perform different security functions. As a result, there’s often a delta between the performance of a configuration that offers low latency and the configuration with the security features that customers want enabled. Cloudflare delivers full compute in every data center. There is no “next-hop” to compute; instead, there are fungible compute resources to ensure the fastest interface-to-interface possible with all the security features (including TLS decryption) enabled.
Connecting from the SASE to applications (Internet exchanges, private backbone, optimized routing and peering): Many vendors optimize their data centers to focus on egress to the Internet/cloud, typically by participating in Internet exchanges along with a handful of peering relationships. In other words, their networks were not designed for traffic between data centers, which is a suboptimal design for branch-to-branch or branch-to-data-center traffic.
Cloudflare’s network operates a private backbone for traffic destined to another Cloudflare data center, and we are one of the largest participants in Internet exchanges in the world for traffic destined to the Internet/cloud. We are connected to over 13,000 public and private networks, plus our open peering policy provides extensive access for networks of different sizes to participate as well. But user experience isn’t determinable solely by the number of interconnections. Not all Internet exchanges are the same, and in many cases there are variables that affect the quality and reliability of any given connection. That’s why Cloudflare further optimizes the connection to the user’s ultimate destination, whether destined to a public or private network, to make path selection more intelligent than simply counting hops over routing protocols.
How customers adopt Cloudflare One
We’ve discussed how we do what we do. Now let’s discuss the services we deliver. While customers have a number of different requirements that are specific to their organization, we do see centers of gravity that drive their use cases:
Network modernization initiatives: Enterprise networks are in ways more complicated than they need to be. To make the enterprise network suitable for today’s hybrid workspace, many organizations are looking for ways to converge the on-prem and remote user experience. The adoption of the coffee shop networking architecture is driving many projects towards single-vendor SASE. By using Cloudflare Access, users can access applications securely with identity and device-based contextual controls. Organizations use Magic WAN for network connectivity across branch offices, headquarters, regional campuses and the data center.
Security modernization initiatives: Security teams with concerns about enforcing more granular security controls to access critical resources are making efforts to adopt Zero Trust. These initiatives drive security-focused SASE use cases, which can both reduce the attack surface and centralize enforcement of adaptive access policies. Security teams need to both enable access to private applications while also securing access to the Internet. Use Cloudflare Access to implement Zero Trust Network Access, which accelerates the deployment of protections by layering granular, user-specific access controls on top of the existing network topology. Use Cloudflare Gateway to enforce content filtering policies to protect access to the Internet. Use Cloudflare Email Security to stop phishing attacks and disrupt the business email compromise attack lifecycle.
Transformation initiatives: Most organizations have legacy investments in both networking and security infrastructure, and are embarking upon a transformation across their business to support their future needs. Organizations that are transforming need to tackle both networking and security modernization. Cloudflare One addresses comprehensive transformation by delivering networking services through Cloudflare Magic WAN, Cloudflare Access to implement ZTNA, Cloudflare Gateway to protect users from Internet threats, Cloudflare CASB to secure SaaS, and more.
Building beyond SASE
We’re building new capabilities that extend beyond the traditional definition of SASE, all while leveraging our core Cloudflare network foundation. This includes addressing a broader spectrum of security concerns that organizations face, such as phishing and DDoS attacks.
We are expanding our networking capabilities to help organizations simplify and automate multi-cloud connectivity. As the boundaries between public and private networking blur, particularly with the widespread adoption of AI across various applications, customers are looking for a single set of controls for all their applications. This requires market-leading Web Application and API Protection (WAAP) services that natively support both positive and negative security models as part of SASE.
Furthermore, we arerapidly deploying Graphics Processing Units (GPUs) in our data centers topower AI protections and support customer applications. As the only SASE platform that also serves as a leading Edge Distribution Platform with AI primitives, we are uniquely positioned to help customers to understand the latest AI capabilities and secure their users, networks, applications, and data with a security-first approach across the entire application lifecycle. We provide holistic support for the age of AI, and many leading Generative AI platforms rely on our network as critical infrastructure to operate. With their traffic and often code on our network, we enable the safeguard of customers’ AI usage.
We believe that these efforts will help the market evolve and address a broader range of customer concerns. We’re doing this incrementally, building integrated solutions on top of our foundation and accelerating our pace. We can’t wait to show you what we’ve got planned for the year ahead in SASE.
Are you interested in Cloudflare One? Contact us to learn more about how we can help.
***
1Gartner, Magic Quadrant for SASE Platforms, Analyst(s): Jonathan Forest, Neil MacDonald, Dale Koeppen, July 9, 2025
GARTNER is a registered trademark and service mark of Gartner, Inc. and/or its affiliates in the U.S. and internationally, and MAGIC QUADRANT is a registered trademark of Gartner, Inc. and/or its affiliates and are used herein with permission. All rights reserved.
Gartner does not endorse any vendor, product or service depicted in its research publications, and does not advise technology users to select only those vendors with the highest ratings or other designation. Gartner research publications consist of the opinions of Gartner’s research organization and should not be construed as statements of fact. Gartner disclaims all warranties, expressed or implied, with respect to this research, including any warranties of merchantability or fitness for a particular purpose.
Software in the Public Interest has released
its annual report for 2024. It includes reports from the long list of
projects housed under the SPI umbrella, but the financial statements are
not included at this time.
Loadable kernel modules require access to kernel data structures and
functions to get their job done; the kernel provides this access by way of
exported symbols. Almost since this mechanism was created, there have been
debates over which symbols should be exported, and how. The 6.16 kernel
gained a new export mechanism that limits access to symbols to specific
kernel modules. That code is likely to change soon, but the addition
of an enforcement mechanism has since been backed out.
Security updates have been issued by Debian (ffmpeg), Fedora (gnutls, linux-firmware, mingw-djvulibre, mingw-python-requests, and salt), Mageia (qtimageformats6), Oracle (gnome-remote-desktop, golang, kernel, libxml2, and perl-File-Find-Rule), SUSE (gstreamer-plugins-base, gstreamer-plugins-good, kernel, and protobuf), and Ubuntu (apport, glibc, gnutls28, and roundcube).
Голяма част от анализите за региона на Близкия изток приемат за отправна точка на хипотезите си съществуващата дилема за сигурност между Държавата Израел и Ислямска република Иран заедно със съвременните тенденции във външната политика на САЩ. Въпреки предимствата си този подход крие един голям риск – ролята на Иран в региона далеч не се свежда до познатото ни уравнение в учебниците – когато една страна напада, другата се отбранява. Това е доста наивна представа за политическите реалности в Близкия изток, която не ни позволява правилно да оценим какви рискове крият иранските ядрени амбиции и защо ядрената програма на страната има глобални измерения. В този анализ ще се постараем да хвърлим светлина върху скритите аспекти на ядрената дилема на Иран и да отговорим на въпроса дали мечтаната ядрена сделка е постижима геополитическа реалност.
Стратегическата култура на Иран и ядрените ѝ амбиции
Първото уточнение, което е необходимо да направим, е, че политическата формула на властта в днешен Иран няма нищо общо с хилядолетната му култура, която е дори по-древна от китайската. Неин първи стълб са зороастрийските вярвания, които пресъздават религиозната представа за дуализъм между добро и зло, чиято вечна битка е белязана от есхатологичната визия за края на света.
Вторият стълб е шиитският ислям, който се превръща в доминираща формула на властта по време на Сефевидската династия, след близо десет века ислямизация на региона. По този начин зороастрийската и шиитската традиция успяват да влязат във взаимодействие, което прави исляма в Иран много по-различен дори от исляма при шиитите, тъй като той инкорпорира в себе си някои древни вярвания на персите, включително редица молитви, преведени по времето на Сефевидите от шиитското духовенство. Тази стратегическа амалгама от синкретични религиозни доктрини процъфтява по време на династията Пахлави, която въпреки модернизаторския си дух успешно балансира между запазването на традиционната иранска култура и отварянето си към Запада.
Второто важно уточнение е свързано с научно необоснованото твърдение, че днешен Иран е легитимен наследник на династията Пахлави и Персия.
Това е силно идеологизирана презумпция, която не отговаря на историческата истина. От културно-историческа и политическа гледна точка Ислямска република Иран не може да се счита дори за правоприемник на шиитските империи от времето на Сефевидите по една основна причина: след Ислямската революция от 1979 г. шиитската традицията в страната се пречупва през визията на Рухола Хомейни – вилаят-е факих, която значително модифицира шиитската доктрина, отстоявана от иранските монархии в продължения на столетия. Хомейни „революционизира“ шиитската традиция, връчвайки политическата власт еднолично на духовенството – аятоласите, като отхвърля напълно принципа на секуларизма в политиката.
Трябва да направим уточнението, че класическите интерпретации на исляма не отхвърлят секуларизма или в някои случаи просто предписват правила за поведението на мюсюлманите, живеещи в секуларни и плуралистични общества, с уговорката, че трябва да извършват т.нар. „хиджра“ – религиозна миграция, с която да разпространяват ислямския начин на живот и култура. Понятието датира от времето на Мохамед, който е принуден да избяга (мигрира) от Мека в Медина, след като заговорници се опитват да го убият.
Наред с това, като оставим настрана и доктриналната сунитска несъвместимост с шиитския клон на исляма, идеите на Хомейни се сблъскват със сериозни критики от влиятелни шиитски учени, като Ал ал-Шишани и Садик ал-Ширази, които дефинират вилаят-е факих като тоталитарна религиозно-политическа доктрина. Тя циментира управлението на един лидер – аятолаха, лишавайки мюсюлманите от справедливото право да го свалят в случай на недоволство.
В този смисъл стремежът на Иран да придобие оръжия за масово унищожение е последната крачка в наследството на Хомейни, което цели да превърне страната в регионален хегемон и в глобална сила. Ако Техеран успее да завърши ядрената си програма, това ще повдигне два сериозни въпроса, които до този момент нямат отговор нито в политическия, нито в научния дебат.
Първият е какво би се случило, ако тоталитарен режим като иранския придобие ядрен потенциал.
Възможните отговори са много, но най-прагматичният е един: той би бил много по-склонен да го използва, тъй като, за разлика от студения прагматизъм на Пхенян и Москва, политическата формула на властта в Техеран съдържа силен теократичен елемент, което я прави по-малко рационална и от Северна Корея, и от Русия. Да не говорим, че Иран няма да членува в нито един формат за ядрено сдържане, което ще го направи неуправляем дори за Русия.
Вторият е какво би се случило, ако иранските проксита в лицето на „Хизбула“ и на това, което е останало от „Хамас“, се сдобият с ядрен потенциал.
Тази опция не бива да се изключва, тъй като иранските управляващи на няколко пъти казаха каква е истинската им цел – унищожаването на Държавата Израел. Ако тези групировки се сдобият макар и с ограничен ядрен арсенал, тогава всички, които са убедени, че държавите са рационални актьори и няма да използват оръжия за масово унищожение, ще трябва да проверят дали валидността на теорията им може да бъде съотнесена и към трансграничните терористични мрежи.
Кои са сдържащите сили пред Иран в Близкия изток?
На този етап се очертават няколко актьора, които ефективно биха могли да сдържат Техеран. Първият е Израел. Причината е новата отбранителна доктрина на страната, която беше модифицирана в месеците след атаките на „Хамас“ от 7 октомври 2023 г. В своя оригинален вариант израелската отбранителна доктрина „Дахия“ съдържа постановката, че Израел си запазва правото да действа диспропорционално, в случай че бъде нападнат, но с презумпцията, че приоритетно трябва да бъдат поразени властовите и ресурсните центрове на агресора. Тази доктрина доминираше в израелското стратегически мислене в годините след 11 септември 2001 г. и многократно беше критикувана от европейските правителства под предлог, че взема много цивилни жертви.
Подобна логика обаче е погрешна, тъй като по обхват доктрината е избирателна (може да се приложи или не в зависимост от решението на командването), а ако Европа има НАТО, Израел е сам срещу много противници в Близкия изток. Ето защо през 2024 г. Военното командване на Израел реши да реформира доктрината си, включвайки в нея концепцията за pre-emptive strike (изпреварващ удар):правото на един държавен актьор да нанесе предварителен военен удар върху друг, ако са налице доказателства, че действията на отсрещната страна са заплаха за националната сигурност на нападащата, един вид, „нападам, за да не бъда нападнат“. Тук е мястото да кажем, че това понятие няма общо с друго понятие – preventive war (превантивна война), при което държавите прилагат сила само въз основа на предположения, а не на реални доказателства за неизбежно нападение.
Първото понятие попада под юрисдикцията на международните отношения като част от правото на всяка суверенна държава да се защитава, а второто е акт на военна агресия. В този смисъл руската военна интервенция срещу Украйна е израз на превантивна война (агресия) с предлога, че действията на Киев са заплаха за националната сигурност на Москва. Израелските удари върху иранската ядрена програма, от друга страна, са предварителен военен удар с цел ликвидирането на реално съществуваща заплаха за националната сигурност на страната. Взети заедно, доктрината „Дахия“ и концепцията за предварителния военен удар на този етап се явяват единствената регионална сдържаща сила пред ядрените амбиции на Иран.
Вторият играч са САЩ, тъй като те разполагат със стратегическите ресурси да унищожат напълно иранската ядрена програма или поне да я забавят с десетилетия.
Както историята често си прави шеги, изборът за това се падна на президент, който дълго време обещаваше на американците, че ще се грижи преди всичко за Америка, а след това за нейните съюзници. Доналд Тръмп се озова в същата роля като Удроу Уилсън и Франклин Рузвелт, чиято съпротива срещу влизането на САЩ в двете световни войни в крайна сметка беше победена от нуждата някой да балансира разрушителните амбиции на агресорите. Вашингтон попадна в тази позиция за пореден път, тъй като обективният баланс на силите в системата на международните отношения го позиционира като единствения държавен актьор, който разполага с военностратегическите, икономическите и културните ресурси да реагира във всяка точка на света. В допълнение, лобито на изолационистите в американската външна политика е изключително малко и влиянието му върху Тръмп е по-скоро периферно.
Намесата на САЩ в Близкия изток доказа и още нещо – че американският ядрен чадър над съюзниците функционира и че на Вашингтон може да се разчита, ако държавите изпълняват простото условие на бизнесмена Тръмп – да развиват отбранителните си способности солидарно със САЩ и да продължат да купуват американски оръжия.
Последната сдържаща сила пред Иран са останалите арабски държави, и по-точно Кралство Саудитска Арабия.
Арабските държави всъщност са най-големият победител от войната между Израел и Иран, тъй като въпреки критиките към Израел тайната мечта на всеки сунит в региона е да види как шиитската империя се сгромолясва. Затова и нито една сунитска държава не изпрати помощ на Иран. В Рияд ясно си дават сметка, че ако нещо се случи с Израел, те са следващите, тъй като ядреното оръжие ще даде на аятоласите пълна хегемония в Близкия изток. Това е дори по-силна мотивация от разрешаването на палестинския въпрос, защото въпреки отношението си към Израел Саудитска Арабия до този момент не е дала правен статус на палестинските бежанци на своя територия от съображения за националната си сигурност.
Република Турция, от друга страна, като част от НАТО и бидейки под американския ядрен чадър, си позволява лукса да флиртува с Иран. Това ѝ дава възможност да балансира между САЩ и Иран в позицията си и донякъде е мотив за Вашингтон да пуска покрай ушите си турските критики към Израел. Дали обаче Анкара ще продължи в същия дух при една повторна намеса на САЩ в Близкия изток или ако в близко бъдеще иранските шиитски проксита опитат терористичен атентат на турска територия – предстои да видим.
Какво ни чака оттук нататък?
Най-лесният начин да предвидим какво ни чака оттук нататък, е не чрез напразни идеологически догадки и политически мотивирани лозунги, а на базата на ясни емпирични изчисления. Теорията за войната на Фиърън е ценен източник на модел за бъдещето на региона и мястото на Иран в него. В същността си тази теория е много подходяща за конкретния конфликт, тъй като посочва като причини за всяка война липсата на информация (дезинформацията) и невъзможността да се установи диалог. Това са и двете причини, поради които днес Близкият изток е пред дилемата на затворника, както се нарича на езика на международните отношения. От нея не може да избяга нито един актьор, колкото и силен да е той.
Първият формат, в който може да се реализира политиката на Иран в региона, е конфронтационният.
Това е най-лошият възможен сценарий, тъй като при него дезинформацията, разпространявана от Техеран посредством „Хизбула“ и „Хамас“, ще продължава да се засилва, което ще доведе до липса на всякакъв диалог с Америка и съюзниците ѝ. Резултатите от такъв курс на събитията са ясни: нова война, в която Вашингтон ще се включи активно, за да защити Израел, а европейските държави вероятно ще участват избирателно.
Позицията на Франция ще е решаваща за Европа в този случай, тъй като само американската и френската армия разполагат със сили, които могат да бъдат разгърнати зад граница в най-кратък период. Такава война вероятно ще доведе до края на режима в Техеран и до окончателното унищожение на иранската ядрена програма. И нека не си правим илюзии, че в един такъв конфликт най-сетне ще видим кои държави ще застанат в лагера на демокрациите начело със САЩ и кои с мълчаливото си съгласие ще споделят симпатиите си към Иран и Русия. Във втория лагер по всяка вероятност ще попаднат традиционните партньори на Москва и Техеран, които са обединени от идеята да детронират глобалното лидерство на Вашингтон, а в първия – онези съюзници и партньори на САЩ, които прозират, че въпреки грешките си демокрациите остават най-добрият източник на сигурност и свобода.
Вторият сценарий не би бил толкова разрушителен за региона, но ще е най-мъчителен за Израел.
При него САЩ и Иран могат да успеят да постигнат формален диалог, който ще доведе до някаква договорка, но Техеран ще продължи с дезинформационната си кампания срещу Израел, която включва финансиране на иранските проксита в региона. Това означава Израел да продължи да бъде подлаган на постоянни нападения от терористичните мрежи в региона, а Иран да отрича, че подкрепя това, с мотива, че спазва договореностите с Вашингтон по ядрената сделка.
Ако Доналд Тръмп се съгласи с такова статукво в Близкия изток, за да си осигури подкрепата на консервативните републиканци изолационисти, той ще се върне към т.нар. политика на офшорно балансиране. САЩ ще продължат да снабдяват Израел с оръжия и ресурси, намесвайки се директно само ако иранските атаки застрашават пряко американските интереси. Ще станем свидетели на дирижирани битки и добре обмислени „сблъсъци“, което ще уеднакви политиката на Тръмп в региона с тази на Байдън.
Третият сценарий е промяна на режима в Техеран, при който Иран окончателно ще скъса с тоталитарното си минало, ще възобнови диалога със Запада и ще постави ново начало в отношенията си с Израел.
Това развитие на събитията започва да набира популярност, макар че много анализатори спорят дали падането на режима би довело до връщане към прозападно монархическо управление, или до тиранично управление, каквото последва след американските интервенции в Ирак и Афганистан.
Прозападното управление е вариант, ако иранците сами детронират аятоласите. Но ако режимът бъде свален насила от Вашингтон, по всяка вероятност ще се стигне до тиранично управление. Това е и основната причина, поради която Доналд Тръмп не желае насилствена промяна на режима в Иран и наложи вето върху планираното ликвидиране на аятолах Хаменей, а израелският президент Исак Херцог ясно заяви, че целта на предварителния военен удар срещу Техеран е бил унищожаването на иранската ядрена програма, а не свалянето на иранския режим. На този етап обаче иранците не показват такива признаци на желание за промяна, а доказателството за репресивната политика на Иран е, че режимът започна масови арести и екзекуции, след като стана ясно, че няма да бъде свален.
И накрая – нека си представим, че Иран просто спира с дезинформацията, без да води диалог, затваря се в себе си и не пречи на никого.
Регионът изглежда фалшиво спокоен, терористичните атаки срещу Израел спират, а Техеран решава да ограничи антиамериканската реторика. Това е сценарият, който си представят много от критиците на САЩ и Израел, а някои от тях призовават Конгреса да гласува импийчмънт на Тръмп заради бомбардировките над иранските ядрени обекти. Доста от тези критици, които преди време критикуваха реализма и Кенет Уолц, задето представя системата на международните отношения като бездушен пъзел, днес запалено цитират статията на Уолц, в която се обяснява защо Иран трябва да има ядрено оръжие. Материалът на този гениален автор, разбира се, отразява съвсем друга геополитическа действителност, а казусът, който бащата на структурния реализъм операционализира, е насочен към тестване на теорията дали разпространението на ядреното оръжие може да направи света по-стабилен в условията на съвсем друг двуполюсен модел, където едно телефонно обаждане от Москва или Вашингтон е достатъчно, за да спре която и да е ядрена програма.
Днес обаче времената са други. Но да се върнем към розовия сценарий. Той е най-опасният, тъй като един ден Близкият изток ще се събуди на прага на втора Кубинска ракетна криза. В случай че това стане, Иран вече ще разполага с ракети, които могат да достигнат територията на европейските съюзници от НАТО, както и на Русия, Индия, Пакистан, Китай, а в дългосрочен план – и Източното крайбрежие на САЩ. Парадоксално е, че Америка осъзна тази реалност и без да е заплашена в краткосрочен план, се намеси, докато Европа, която е пряко застрашена, не го стори.
Ако трябва да обобщим, съдбата на иранския ядрен въпрос не е просто политическа прищявка на Израел или пък популистки опит на Доналд Тръмп да докаже военностратегическото превъзходство на САЩ. То е геополитическа реалност, която засяга целия свят и за която изобщо не сме подготвени. А Европа закъснява отново. Фатално.
Welcome to the 22nd edition of the Cloudflare DDoS Threat Report. Published quarterly, this report offers a comprehensive analysis of the evolving threat landscape of Distributed Denial of Service (DDoS) attacks based on data from the Cloudflare network. In this edition, we focus on the second quarter of 2025. To view previous reports, visit www.ddosreport.com.
June was the busiest month for DDoS attacks in 2025 Q2, accounting for nearly 38% of all observed activity. One notable target was an independent Eastern European news outlet protected by Cloudflare, which reported being attacked following its coverage of a local Pride parade during LGBTQ Pride Month.
Key DDoS insights
DDoS attacks continue to break records. During 2025 Q2, Cloudflare automatically blocked the largest ever reported DDoS attacks, peaking at 7.3 terabits per second (Tbps) and 4.8 billion packets per second (Bpps).
Overall, in 2025 Q2, hyper-volumetric DDoS attacks skyrocketed. Cloudflare blocked over 6,500 hyper-volumetric DDoS attacks, an average of 71 per day.
Although the overall number of DDoS attacks dropped compared to the previous quarter — which saw an unprecedented surge driven by a large-scale campaign targeting Cloudflare’s network and critical Internet infrastructure protected by Cloudflare — the number of attacks in 2025 Q2 were still 44% higher than in 2024 Q2. Critical infrastructure continues to face sustained pressure, with the Telecommunications, Service Providers, and Carriers sector jumping again to the top as the most targeted industry.
All the attacks in this report were automatically detected and blocked by our autonomous defenses.
To learn more about DDoS attacks and other types of cyber threats, refer to our Learning Center. Visit Cloudflare Radar to view an interactive version of this report where you can drill down further. Radar also offers a free API for those interested in investigating Internet trends. You can also learn more about the methodologies used in preparing these reports.
DDoS attacks in numbers
In 2025 Q2, Cloudflare mitigated 7.3 million DDoS attacks — down sharply from 20.5 million in Q1, when an 18-day campaign against Cloudflare’s own and other critical infrastructure protected by Cloudflare, drove 13.5 million of those attacks.
DDoS attacks by quarter
We’ve just crossed halfway through 2025, and so far Cloudflare has already blocked 27.8 million DDoS attacks, equivalent to 130% of all the DDoS attacks we blocked in the full calendar year 2024.
DDoS attacks by year
Breaking it down further, Layer 3/Layer 4 (L3/4) DDoS attacks plunged 81% quarter-over-quarter to 3.2 million, while HTTP DDoS attacks rose 9% to 4.1 million. Year-over-year changes remain elevated. Overall attacks were 44% higher than 2024 Q2, with HTTP DDoS attacks seeing the largest increase of 129% YoY.
DDoS attacks by month
Hyper-volumetric DDoS attacks
In 2025 Q2, Cloudflare blocked over 6,500 hyper-volumetric DDoS attacks, averaging 71 hyper-volumetric attacks per day. Hyper-volumetric attacks include L3/4 DDoS attacks exceeding 1 Bpps or 1 Tbps, and HTTP DDoS attacks exceeding 1 million requests per second (Mrps).
The number of hyper-volumetric DDoS attacks exceeding 100 million packets per second (pps) surged by 592% compared to the previous quarter, and the number exceeding 1 billion pps and 1 terabits per second (Tbps) doubled compared to the previous quarter. The number of HTTP DDoS attacks exceeding 1 million rps (rps) remained the same at around 20 million in total, an average of almost 220,000 attacks every day.
Hyper-volumetric DDoS attacks in 2025 Q2
Threat actors
When asked who was behind the DDoS attacks they experienced in 2025 Q2, the majority (71%) of respondents said they didn’t know who attacked them. Of the remaining 29% of respondents that claimed to have identified the threat actor, 63% pointed to competitors, a pattern especially common in the Gaming, Gambling and Crypto industries. Another 21% attributed the attack to state-level or state-sponsored actors, while 5% each said they’d inadvertently attacked themselves (self-DDoS), were targeted by extortionists, or suffered an assault from disgruntled customers/users.
Top threat actors reported in 2025 Q2
Ransom DDoS attacks
The percentage of attacked Cloudflare customers that reported being targeted by a Ransom DDoS attack or that were threatened increased by 68% compared to the previous quarter, and by 6% compared to the same quarter in 2024.
Ransom DDoS attacks by quarter 2025 Q2
Diving deeper, Ransom DDoS attacks soared in June 2025. Around a third of respondents reported being threatened or subjected to Ransom DDoS attacks.
Ransom DDoS attacks by month 2025 Q2
Top attacked locations
The ranking of the top 10 most attacked locations in 2025 Q2 shifted significantly. China climbed two spots to reclaim first place, Brazil jumped four spots to second place, Germany slipped two spaces to third place, India edged up one to fourth, and South Korea rose four to fifth. Turkey fell four places to sixth, Hong Kong dropped three to seventh, and Vietnam vaulted an astonishing fifteen spots into eighth. Meanwhile, Russia rocketed forty places to ninth, and Azerbaijan surged thirty-one to round out the top ten.
The locations most targeted by DDoS attacks for 2025 Q2
It’s important to note that these attacked locations are determined by the billing country of the Cloudflare customer whose services were targeted — not that those nations themselves are under attack. In other words, a high rank simply means more of our registered customers in that billing jurisdiction were targeted by DDoS traffic, rather than implying direct geopolitical targeting.
Top attacked industries
The ranking of the top 10 most attacked industries in 2025 Q2 also saw notable movement. Telecommunications, Service Providers and Carriers climbed one spot to claim first place, while the Internet sector jumped two spots to second place. Information Technology & Services held its placement as third most attacked, and Gaming rose one spot to fourth place. Gambling & Casinos slipped four spots to fifth place, and the Banking & Financial Services industry remained in sixth place. Retail inched up one spot to seventh place, and Agriculture made a dramatic 38-place leap into eighth. Computer Software climbed two spots to ninth place, and Government hopped two places to round out the top ten most attacked industries.
The top attacked industries of DDoS attacks for 2025 Q2
Top sources of DDoS attacks
The ranking of the top 10 largest sources of DDoS attacks in 2025 Q2 also saw several shifts compared to the previous quarter. Indonesia climbed one spot to claim the first place, Singapore jumped two places to second place, Hong Kong dropped two places to third, Argentina slipped one space as fourth and Ukraine held on as the fifth-largest source of DDoS attacks. Russia surged six spots as the sixth-largest source, followed by Ecuador who jumped seven places. Vietnam inched up one place as the eighth-largest source. The Netherlands moved up four places as the ninth-largest source, and Thailand fell three places as the tenth-largest source of DDoS attacks.
The top sources of DDoS attacks for 2025 Q2
It’s important to note that these “source” rankings reflect where botnet nodes, proxy or VPN endpoints reside — not the actual location of threat actors. For L3/4 DDoS attacks, where IP spoofing is rampant, we geolocate each packet to the Cloudflare data center that first ingested and blocked it, drawing on our presence in over 330 cities for truly granular accuracy.
Top source networks of DDoS attacks
An ASN (Autonomous System Number) is a unique identifier assigned to a network or group of IP networks that operate under a single routing policy on the Internet. It’s used to exchange routing information between systems using protocols like BGP (Border Gateway Protocol).
For the first time in about a year, the German-based Hetzner (AS24940) network dropped from the first place as the largest source of HTTP DDoS attack to the third place. In its place, Austrian-based Drei (AS200373) jumped 6 places as the number one largest source of HTTP DDoS attacks. The US-based DigitalOcean (AS14061) hopped one spot to the second place.
The top 10 ASN sources of HTTP DDoS attacks
As can be seen in the chart above, 8 out of 10 ASNs listed offer virtual machines (VMs), hosting, or cloud services which indicate the common use of VM-based botnets. These botnets are estimated to be 5,000x stronger than IoT-based botnets. Only Drei (AS200373) and ChinaNet Backbone (AS4134) are primarily ISPs or telecom carriers without significant public VM/cloud offerings.
IoT-based botnets versus VM-based botnets
To help hosting providers, cloud computing providers and any Internet service providers identify and take down the abusive accounts that launch these attacks, we leverage Cloudflare’s unique vantage point to provide a free DDoS Botnet Threat Feed for Service Providers. Over 600 organizations worldwide have already signed up for this feed, and we’ve already seen great collaboration across the community to take down botnet nodes. This is possible thanks to the threat feed which provides these service providers a list of offending IP addresses from within their ASN that we see launching HTTP DDoS attacks. It’s completely free and all it takes is opening a free Cloudflare account, authenticating the ASN via PeeringDB, and then fetching the threat intelligence via API.
With a simple API call, service providers can get a list of offending IPs from within their network. An example response is provided below.
Example response from the free ISP DDoS Botnet Threat Feed API
Attack vectors
Defending against DDoS Botnets
In Q2 2025, the majority (71%) of HTTP DDoS attacks were launched by known botnets. Rapid detection and blocking of these attacks was possible as a result of operating a massive network and seeing many different types of attacks and botnets. By leveraging real-time threat intelligence, our systems are able to incriminate DDoS botnets very fast, contributing to a more effective mitigation. Even if a DDoS botnet has been incriminated while targeting only one website or IP address, our entire network and customer base is immediately protected against it. This real-time threat intelligence system adapts with botnets as they morph and change nodes.
The top HTTP DDoS attack vectors for 2025 Q2
L3/4 attack vectors
In Q2 2025, DNS flood attacks were the top L3/4 attack vector accounting for almost a third of all L3/4 DDoS attacks. SYN floods was the second most common attack vector, dipping from 31% in Q1 to 27% in Q2.
In third place, UDP floods also grew meaningfully, rising from 9% in Q1 to 13% in Q2. RST floods, another form of TCP-based DDoS attacks, accounting for 5% of all L3/4 attacks, was the fourth most common vector. Rounding out the top five, SSDP floods edged into fifth place at 3% despite a decline from 4.3% last quarter, but enough to push the previously prevalent Mirai attacks (which fell from 18% in Q1 to just 2% in Q2) out of the top five altogether.
The top L3/4 DDoS attack vectors for 2025 Q2
Breakdown of the top 3 L3/4 DDoS attack vectors
Below are details about the top 3 most common L3/4 DDoS attacks. We provide recommendations on how organizations can avoid becoming a reflection and amplification element, and also recommendations on how to defend against these attacks whilst avoiding impact to legitimate traffic. Cloudflare’s customers are protected against these attacks.
DNS Flood Attack
Type: Flood
How it works: A DNS flood aims to overwhelm a DNS server with a high volume of DNS queries—either valid, random, or malformed—to exhaust CPU, memory, or bandwidth. Unlike amplification attacks, this is a direct flood aimed at degrading performance or causing outages, often over UDP port 53, but sometimes over TCP as well (especially for DNS-over-TCP or DNSSEC-enabled zones).
How to defend against the attack: Use Cloudflare DNS as primary or secondary, Cloudflare DNS Firewall and/or Cloudflare Magic Transit to absorb and mitigate query floods before they reach your origin. Cloudflare’s global network handles tens of millions of DNS queries per second with built-in DDoS filtering and query caching, blocking malformed or excessive traffic while answering legitimate requests.
How to avoid unintended impact: Avoid blocking all DNS traffic or disabling UDP port 53, which would break normal resolution. Rely on Cloudflare’s DNS-specific protection such as the Advanced DNS Protection system, and deploy DNSSEC-aware protection to handle TCP-based query floods safely.
SYN Flood Attack
Type: Flood
How it works: In a SYN flood, threat actors send a large volume of TCP SYN packets—often with spoofed IP addresses—to initiate connections that are never completed. This leaves the target system with half-open connections, consuming memory and connection tracking resources, potentially exhausting server limits and preventing real clients from connecting.
How to defend against the attack: Use Cloudflare Magic Transit to intercept and mitigate TCP SYN floods at the edge. Cloudflare leverages SYN cookies, connection tracking, and behavioral analysis to distinguish real clients from spoofed or malicious sources, ensuring legitimate TCP connections are completed successfully. Using Cloudflare’s CDN/WAF services or Cloudflare Spectrum which are both reverse-proxy services for HTTP or TCP, respectively. Using a reverse-proxy basically eliminates the possible impact of TCP-based DDoS attacks.
How to avoid unintended impact: Blocking all SYN traffic or applying aggressive timeouts can block real users. Instead, rely on Cloudflare’s Advanced TCP protection system, which uses SYN rate shaping, anomaly detection, and spoofed-packet filtering to mitigate attacks without affecting genuine client connections.
UDP DDoS attack
Type: Flood
How it works: A high volume of UDP packets is sent to random or specific ports on the target IP address(es). It may attempt to saturate the Internet link or overwhelm its in-line appliances with more packets than it can handle in order to create disruption or an outage.
How to defend against the attack: Deploy cloud-based volumetric DDoS protection that can fingerprint attack traffic in real-time such as Cloudflare Magic Transit or Cloudflare Spectrum, apply smart rate-limiting on UDP traffic, and drop unwanted UDP traffic altogether with the Magic Firewall.
How to avoid unintended impact: Aggressive filtering may disrupt legitimate UDP services such as VoIP, video conferencing, or online games. Apply thresholds carefully.
Emerging threats
Among emerging L3/4 DDoS threats in 2025 Q2, Teeworlds flood saw the biggest spike. These attacks jumped 385% QoQ, followed by the RIPv1 flood, which surged 296%. RDP floods climbed by 173%, and Demon Bot floods increased by 149%. Even the venerable VxWorks flood made a comeback, rising 71% quarter-over-quarter. These dramatic upticks highlight threat actors’ ongoing experimentation with lesser-known and legacy protocols to evade standard defenses.
The top emerging threats for 2025 Q2
Breakdown of the top emerging threats
Below are details about the emerging threats for 2025 Q2, mostly recycling of very old attack vectors. We provide recommendations on how organizations can avoid becoming a reflection and amplification element, and also recommendations on how to defend against these attacks whilst avoiding impact to legitimate traffic. Cloudflare’s customers are protected against these attacks.
Teeworlds DDoS Attack
Type: Flood
How it works:Teeworlds is a fast-paced, open-source 2D multiplayer shooter game that uses a custom UDP-based protocol for real-time gameplay. Threat actors flood the target’s game server with spoofed or excessive UDP packets that mimic in-game actions or connection attempts. This can overwhelm server resources and cause lag or outages.
How to defend against the attack: Use Cloudflare Spectrum or Cloudflare Magic Transit to protect the servers. Cloudflare automatically detects and mitigates these types of attacks using real-time fingerprinting, blocking attack traffic while allowing real players through. Magic Transit also provides a packet-level firewall capability, the Magic Firewall which can be used to craft custom protection.
How to avoid unintended impact: When crafting custom rules, avoid blocking or aggressively rate-limiting UDP port 8303 directly as it can disrupt overall gameplay. Instead, rely on intelligent detection and mitigation services to avoid affecting legitimate users.
How it works: Exploits the Routing Information protocol version 1 (RIPv1), an old unauthenticated distance-vector routing protocol that uses UDP/520. Threat actors send spoofed routing updates to flood or confuse networks.
How to prevent becoming a reflection / amplification element: Disable RIPv1 on routers. Use RIPv2 with authentication where routing is needed.
How to defend against the attack: Block inbound UDP/520 from untrusted networks. Monitor for unexpected routing updates.
How to avoid unintended impact: RIPv1 is mostly obsolete; disabling it is generally safe. If legacy systems rely on it, validate routing behavior before changes.
RDP DDoS Attack
Type: Reflection + Amplification
How it works: The Remote Desktop Protocol (RDP) is used for remote access to Windows systems and typically runs over TCP port 3389. In some misconfigured or legacy setups, RDP can respond to unauthenticated connection attempts, making it possible to abuse for reflection or amplification. Threat actors send spoofed RDP initiation packets to exposed servers, causing them to reply to a victim, generating high volumes of unwanted traffic.
How to defend against the attack: Use Cloudflare Magic Transit to protect your network infrastructure. Magic Transit provides L3/L4 DDoS protection, filtering out spoofed or malformed RDP traffic before it reaches your origin. For targeted application-layer abuse, Cloudflare Gateway or Zero Trust Network Access (ZTNA) can help secure remote desktop access behind authenticated tunnels.
How to avoid unintended impact: Do not block TCP/3389 globally if RDP is actively used. Instead, restrict RDP access to known IPs or internal networks, or use Cloudflare Tunnel with Zero Trust Network Access (ZTNA) to remove public exposure altogether while maintaining secure access for legitimate users.
DemonBot DDoS Attack
Type: Botnet-based Flood
How it works: DemonBot is a malware strain that infects Linux-based systems—particularly unsecured IoT devices—via open ports or weak credentials. Once infected, devices become part of a botnet that can launch high-volume UDP, TCP, and application-layer floods. Attacks are typically command-and-control (C2) driven and can generate significant volumetric traffic, often targeting gaming, hosting, or enterprise services. To avoid infection, leverage antivirus software and domain filtering.
How to defend against the attack: Use Cloudflare Magic Transit to absorb and filter large-scale network-layer floods before they reach your infrastructure. Cloudflare’s real-time traffic analysis and signature-based detection neutralize traffic originating from DemonBot-infected devices. For application-layer services, Cloudflare DDoS protection and WAF can mitigate targeted HTTP floods and connection abuse.
How to avoid unintended impact: Instead of broadly blocking traffic types or ports, rely on Cloudflare’s adaptive mitigation to distinguish between legitimate users and botnet traffic. Combine with IP reputation filtering, geo-blocking, and rate limiting to reduce false positives and maintain service availability.
VxWorks Flood DDoS Attack
Type: Flood (IoT-based)
How it works:VxWorks is a real-time operating system (RTOS) used in millions of embedded and IoT devices (e.g., routers, industrial controllers). Devices running outdated or misconfigured versions of VxWorks can be compromised and used to launch DDoS attacks. Once infected—often via public exploits or weak credentials—they send high volumes of UDP, TCP, or ICMP traffic to overwhelm targets, similar to traditional IoT botnets.
How to defend against the attack: Deploy Cloudflare Magic Transit to block volumetric traffic at the network edge. Cloudflare uses real-time fingerprinting and proprietary heuristics to identify traffic from compromised VxWorks devices and mitigate it in real-time. For application services, Cloudflare’s DDoS mitigationandGateway services provide additional protection against protocol-level abuse.
How to avoid unintended impact: Avoid over-blocking UDP or ICMP traffic, as it may disrupt legitimate diagnostics or real-time services. Instead, use Cloudflare’s intelligent filtering, rate limiting, and geo/IP reputation tools to safely mitigate attacks while avoiding impact to legitimate traffic.
Most DDoS attacks are small and short. In 2025 Q2, 94% of L3/4 DDoS attacks didn’t exceed 500 Mbps. Similarly, around 85% of L3/4 DDoS attacks didn’t exceed 50,000 pps. The majority of HTTP DDoS attacks are also small, 65% stay below 50K rps. “Small”, though, is a relative term.
An average modern server typically refers to a general-purpose physical or virtual machine with around 4–8 CPU cores (e.g. Intel Xeon Silver), 16–64 GB RAM, and a 1 Gbps NIC, running a Linux OS like Ubuntu or CentOS with NGINX or similar software. This setup can handle ~100,000–500,000 pps, up to ~940 Mbps throughput, and around 10,000–100,000 rps for static content or 500–1,000 rps for database-backed dynamic applications, depending on tuning and workload.
Assuming the server is unprotected by a cloud DDoS protection service, if it’s targeted by “small” DDoS attacks during peak time traffic rates, it is very likely that the server won’t be able to handle it. Even “small” DDoS attacks can cause significant impact to unprotected servers.
DDoS attacks size and duration in 2025 Q2
While the majority of DDoS attacks are small, hyper-volumetric DDoS attacks are increasing in size and frequency. 6 out of every 100 HTTP DDoS attacks exceed 1M rps, and 5 out of every 10,000 L3/4 DDoS attacks exceed 1 Tbps — a 1,150% QoQ increase.
The largest attack in the world: 7.3 Tbps
Most DDoS attacks are short in duration, even the largest and most intense ones. Threat actors often rely on brief bursts of concentrated traffic—sometimes lasting as little as 45 seconds as seen with the monumental 7.3 Tbps DDoS attack — in an attempt to avoid detection, overwhelm targets and cause maximum disruption before defenses can fully activate. This tactic of short, high-intensity bursts makes detection and mitigation more challenging and underscores the need for always-on, real-time protection. Thankfully, Cloudflare’s autonomous DDoS defenses kick in immediately.
Helping build a better Internet
At Cloudflare, we’re committed to helping build a better Internet. A part of that mission is offering free, unmetered DDoS protection regardless of size, duration and quantity. We don’t just defend against DDoS attacks. The best defense is a good offense, and using our free ISP Botnet Threat Feed, we contribute to botnet takedowns.
While many still adopt protection reactively or rely on outdated solutions, our data shows proactive, always-on security is far more effective. Powered by a global network with 388 Tbps capacity across 330+ cities, we provide automated, in-line, battle-proven defense against all types of DDoS attacks.
Revenue NSW, in Australia, is New South Wales (NSW) state’s principal revenue management agency and aspires to be the world’s most innovative and customer-centric revenue agency. Revenue NSW exists to administer grants, resolve fines, and collect revenue to fund essential state services for the over 8 million people of NSW in a fair, efficient, and timely manner.
Analytics at Revenue NSW plays a key role in enabling the organization’s goals and purpose by delivering reliable, secure, and authoritative insights. These insights are key to:
Understanding customer attributes to enable empathetic and informed actions
Supporting policy development
Assisting in the sequencing of millions of decisions
Maintaining compliance and education
Fostering transparency by providing open data and insights directly to the public
The challenge
Revenue NSW Analytics consumes data from a multitude of operational databases and real-time interfaces and through internally generated reports and files received from external data partners such as other government departments and agencies. The varying technologies, formats, and complexities of these data sources created friction and inefficiencies in data transformation, consolidation, and analysis in an environment that is often time-critical. In addition, these analytics systems were previously hosted on dedicated hardware on-premises that was nearing end-of-life and wasn’t easy to scale efficiently. To address these challenges, Revenue NSW Analytics used their partnership with AWS to build a strategic, unified, scalable, frictionless and modern data environment to help them standardize data transformation and consolidation pipelines from the hundreds of data sources. Additionally, the modern data environment must provide a single source of truth and enable secure and seamless access to the data through a unified SQL interface regardless of the data’s original format or technology.
After understanding other offerings, Revenue NSW Analytics decided on a proof of concept (PoC) using Amazon Web Services (AWS) cloud-based services, including Amazon Redshift. The key goals of the PoC were to assess the completeness of the solution, its performance, and the potential change in total cost of ownership compared to their on-premises setup.
Amazon Redshift, with its integration options, columnar storage, and massively parallel processing (MPP) architecture, offered the desired end-state solution. Tests demonstrated a typical speed increase between 5- and 50-fold in query execution, with many results 100 times faster than the existing on-premises solution. Amazon Redshift also performed significantly better compared with other cloud-based solutions, offering up to 6 times better performance. The success of the initial PoC led Revenue NSW Analytics to further collaborate with AWS, working towards developing a prototype that incorporated Amazon Redshift alongside various data ingestion patterns.
The solution
To simplify data ingestion from the operational databases—which run on different database engines including Oracle, PostgreSQL, and Microsoft SQL—Revenue NSW Analytics used AWS Database Migration Service (AWS DMS) to perform a bulk initial load, followed by capturing ongoing changes from these databases into Amazon Redshift in near real time.
For data from Salesforce’s real-time API, Revenue NSW Analytics used Amazon AppFlow to automate the continuous pulling and ingesting of data into Amazon Redshift.
The hundreds of structured and semi-structured data files were handled using AWS Glue. These files are regularly uploaded to Amazon Simple Storage Service (Amazon S3), triggering the relevant AWS Glue extract, transform, and load (ETL) jobs in an event-based architecture to transfer the data into Amazon Redshift.
To facilitate repeatability and enable iteration, Revenue NSW Analytics used infrastructure-as-code (IaC) and continuous integration and delivery (CI/CD) pipelines to deploy the different components of the solution.
The following is a high-level architecture demonstrating how these different components and services fit together.
Along with standardization and unified access, the success criteria of the new data environment included the ease of transition, consolidation of processes to the new standardised pipelines, scalability, language uniformity, and availability. The combination of supporting standard SQL, AWS DMS, and Amazon AppFlow low-code capabilities, and supporting Python in AWS Glue, a popular programming language, played a crucial role in facilitating the successful transition and adoption of the cloud-based data environment.
Other success factors of this environment include the ability to work within current budgets, and the extendibility and modularity of the solution. As shown in the preceding high-level architecture, the solution runs on multiple building blocks that are decoupled, modular, and either serverless—like AWS Glue—or managed services that support seamless scalable configurations that don’t require rebuilds. This allowed Revenue NSW Analytics to start small with each use case, expand and grow as required, and pay only for what they need.
Moreover, with the new cloud-based data environment, Revenue NSW Analytics can access to up-to-date data in near real time, which is essential to fulfilling critical use cases such as information requests and assisting with compliance case identification. The automated data ingestion pipelines removed much of the boilerplate and heavy lifting, allowing Revenue NSW teams to work more efficiently and focus on the differentiators of their business, and in some cases, shorten workflow times from months to weeks or days.
Another significant factor contributing to the project’s success is the people at the heart of Revenue NSW Analytics. The teams allocated to own and deliver this platform are cross-functional, with adjoining responsibilities and skills, and were prepared through multiple in-person and online training sessions. The teams were empowered to trial individual services to deliver new use cases and iterate on the solution to learn from successes and innovate progressively. This approach, together with support Revenue NSW received from AWS specialist solution architects, helped to minimize the risk of knowledge gaps that often arise when separate teams are responsible for building and operating a system.
The hard work of the Analytics team, the investment of Revenue NSW Analytics leadership in its people, and the continuous support from AWS can truly be seen throughout the delivery of the data environment, resulting in the achievement of the intended outcomes.
Conclusion and call to action
Since going live with their cloud-based data environment on AWS, Revenue NSW has onboarded dozens of analysts who can get more done in less time. This is a result of establishing a single source of truth from different data sources in Amazon Redshift, so that analysts and data consumers don’t need to shop around to find the data that they need to complete their tasks. This new data environment also provides Revenue NSW with the ability to create improved conditions for:
Increasing agility by exposing reusable, trusted data services for people and AI
Empowering operational systems with services best provided by analytical approaches
Decommissioning heritage, costly infrastructure and data practices.
Successful delivery of the cloud-based data environment on AWS has led to further collaboration between AWS and Revenue NSW. This includes exploring the adoption of AI and machine learning (AI/ML) and generative AI to further improve the delivery of services for the people of NSW.
To learn more about customer success stories like this or how to get started with building a data environment on AWS, contact your AWS account team. You can read about similar customers by browsing Customer Success Stories on our website.
About the authors
Saeed Barghi is a Sr. Specialist Solutions Architect at Amazon Web Services (AWS) specializing in architecting enterprise data platforms and AI solutions. Based in Melbourne, Australia, Saeed works with public sector customers in Australia and New Zealand and helps his customers build fit-for-purpose and future-proof data platforms and AI solutions.
Miroslaw (Mick) Mioduszewski is the Director of Analytics at Revenue NSW Department of Customer service in NSW. He held multiple C-level roles in private and public companies as well as government, e.g. COO and CIO, as well as serving as company director. Mick holds computer science and business degrees, is a fellow of the Australian Institute of Company Directors and an industry fellow at the University of technology, Sydney.
Moha Alsouli is a Public Sector Solutions Architect at Amazon Web Services (AWS) in Sydney. He is dedicated to supporting state and local government customers deliver citizen services, through solution design, reviews, optimisation, and architecture guidance. Moha is also specialising in generative artificial intelligence (AI) on AWS.
To provide the best experiences, we use technologies like cookies to store and/or access device information. Consenting to these technologies will allow us to process data such as browsing behavior or unique IDs on this site. Not consenting or withdrawing consent, may adversely affect certain features and functions.
Functional
Always active
The technical storage or access is strictly necessary for the legitimate purpose of enabling the use of a specific service explicitly requested by the subscriber or user, or for the sole purpose of carrying out the transmission of a communication over an electronic communications network.
Preferences
The technical storage or access is necessary for the legitimate purpose of storing preferences that are not requested by the subscriber or user.
Statistics
The technical storage or access that is used exclusively for statistical purposes.The technical storage or access that is used exclusively for anonymous statistical purposes. Without a subpoena, voluntary compliance on the part of your Internet Service Provider, or additional records from a third party, information stored or retrieved for this purpose alone cannot usually be used to identify you.
Marketing
The technical storage or access is required to create user profiles to send advertising, or to track the user on a website or across several websites for similar marketing purposes.

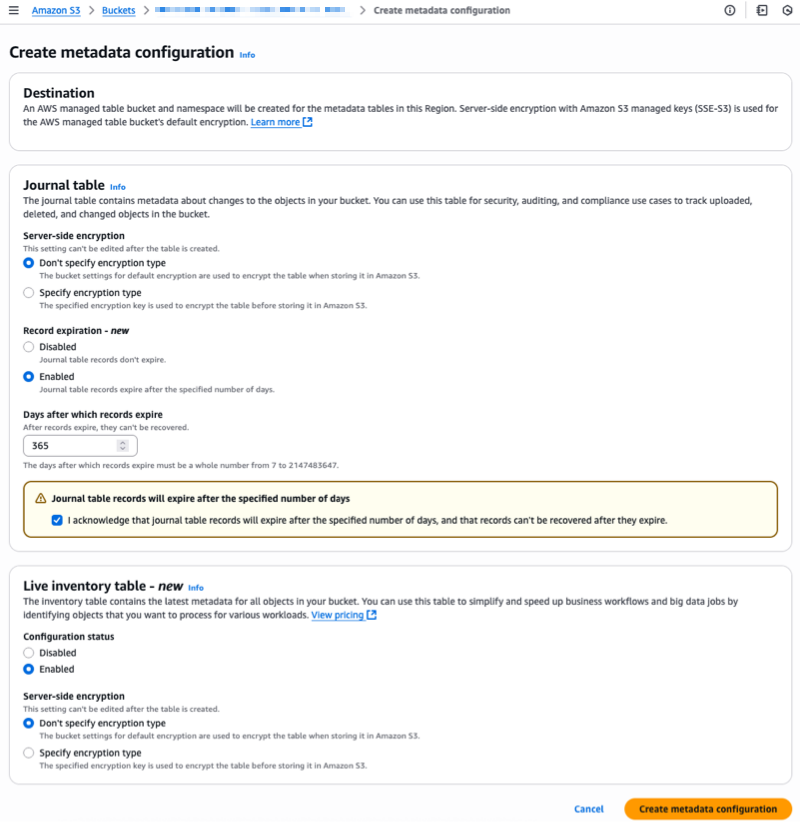 For Journal table, I can choose the Server-side encryption option and the Record expiration period. For Live Inventory table, I choose Enabled and I can select the Server-side encryption options.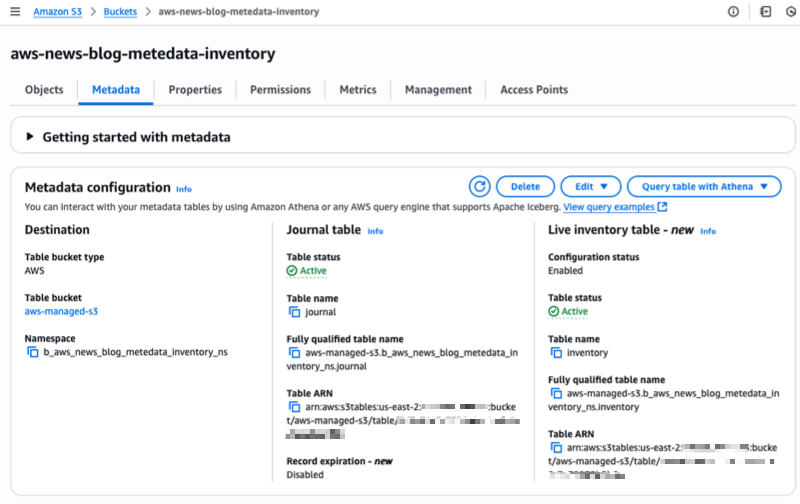
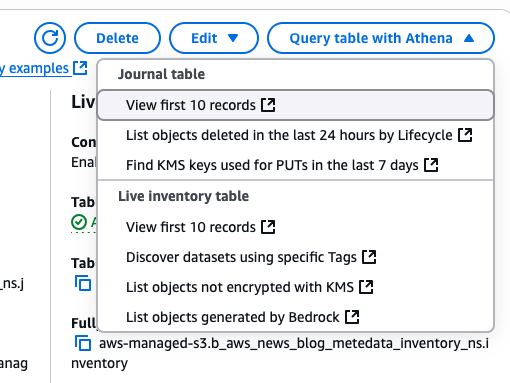
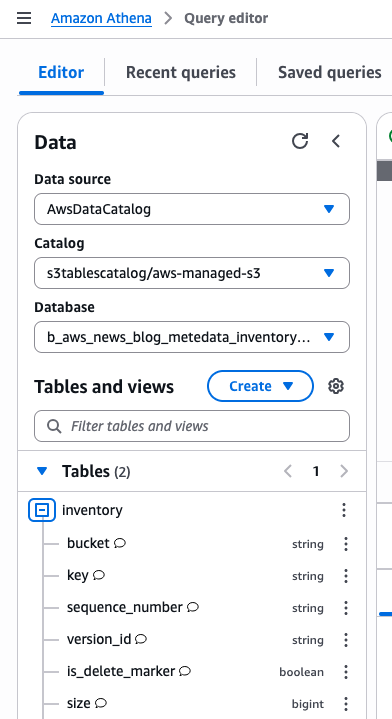
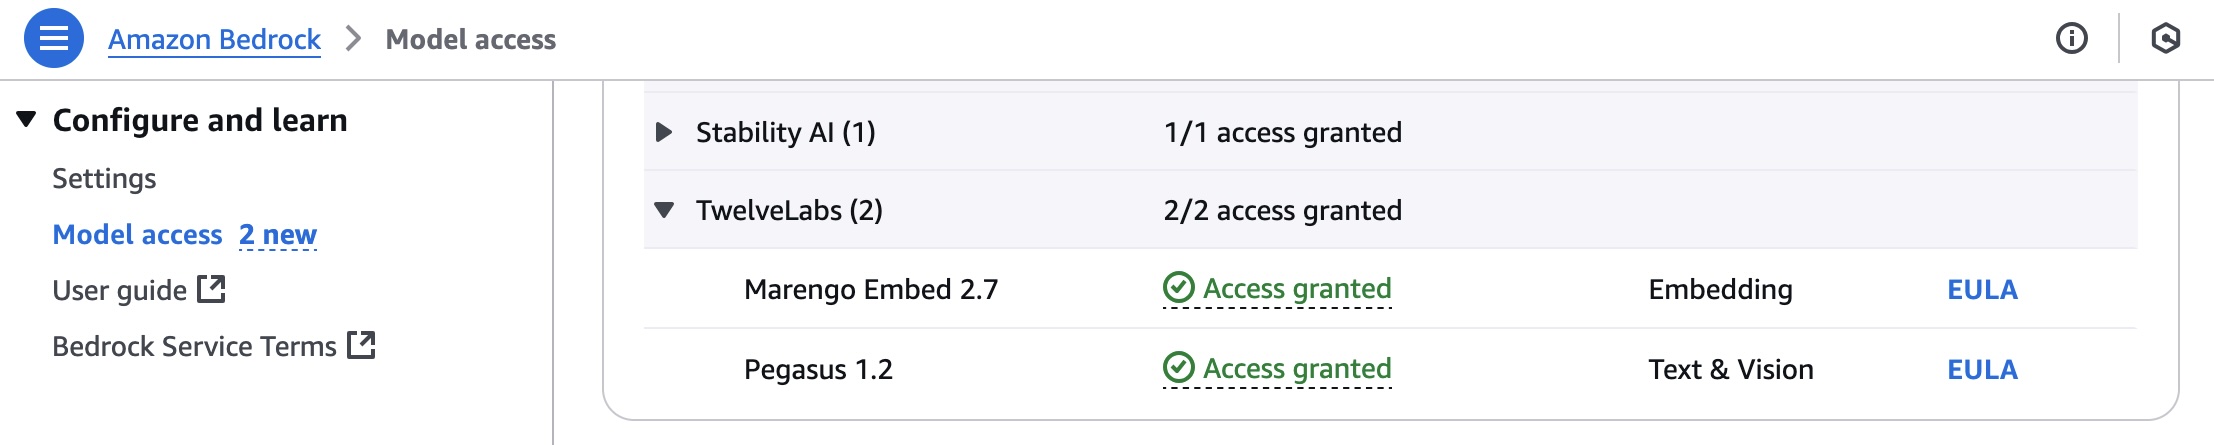
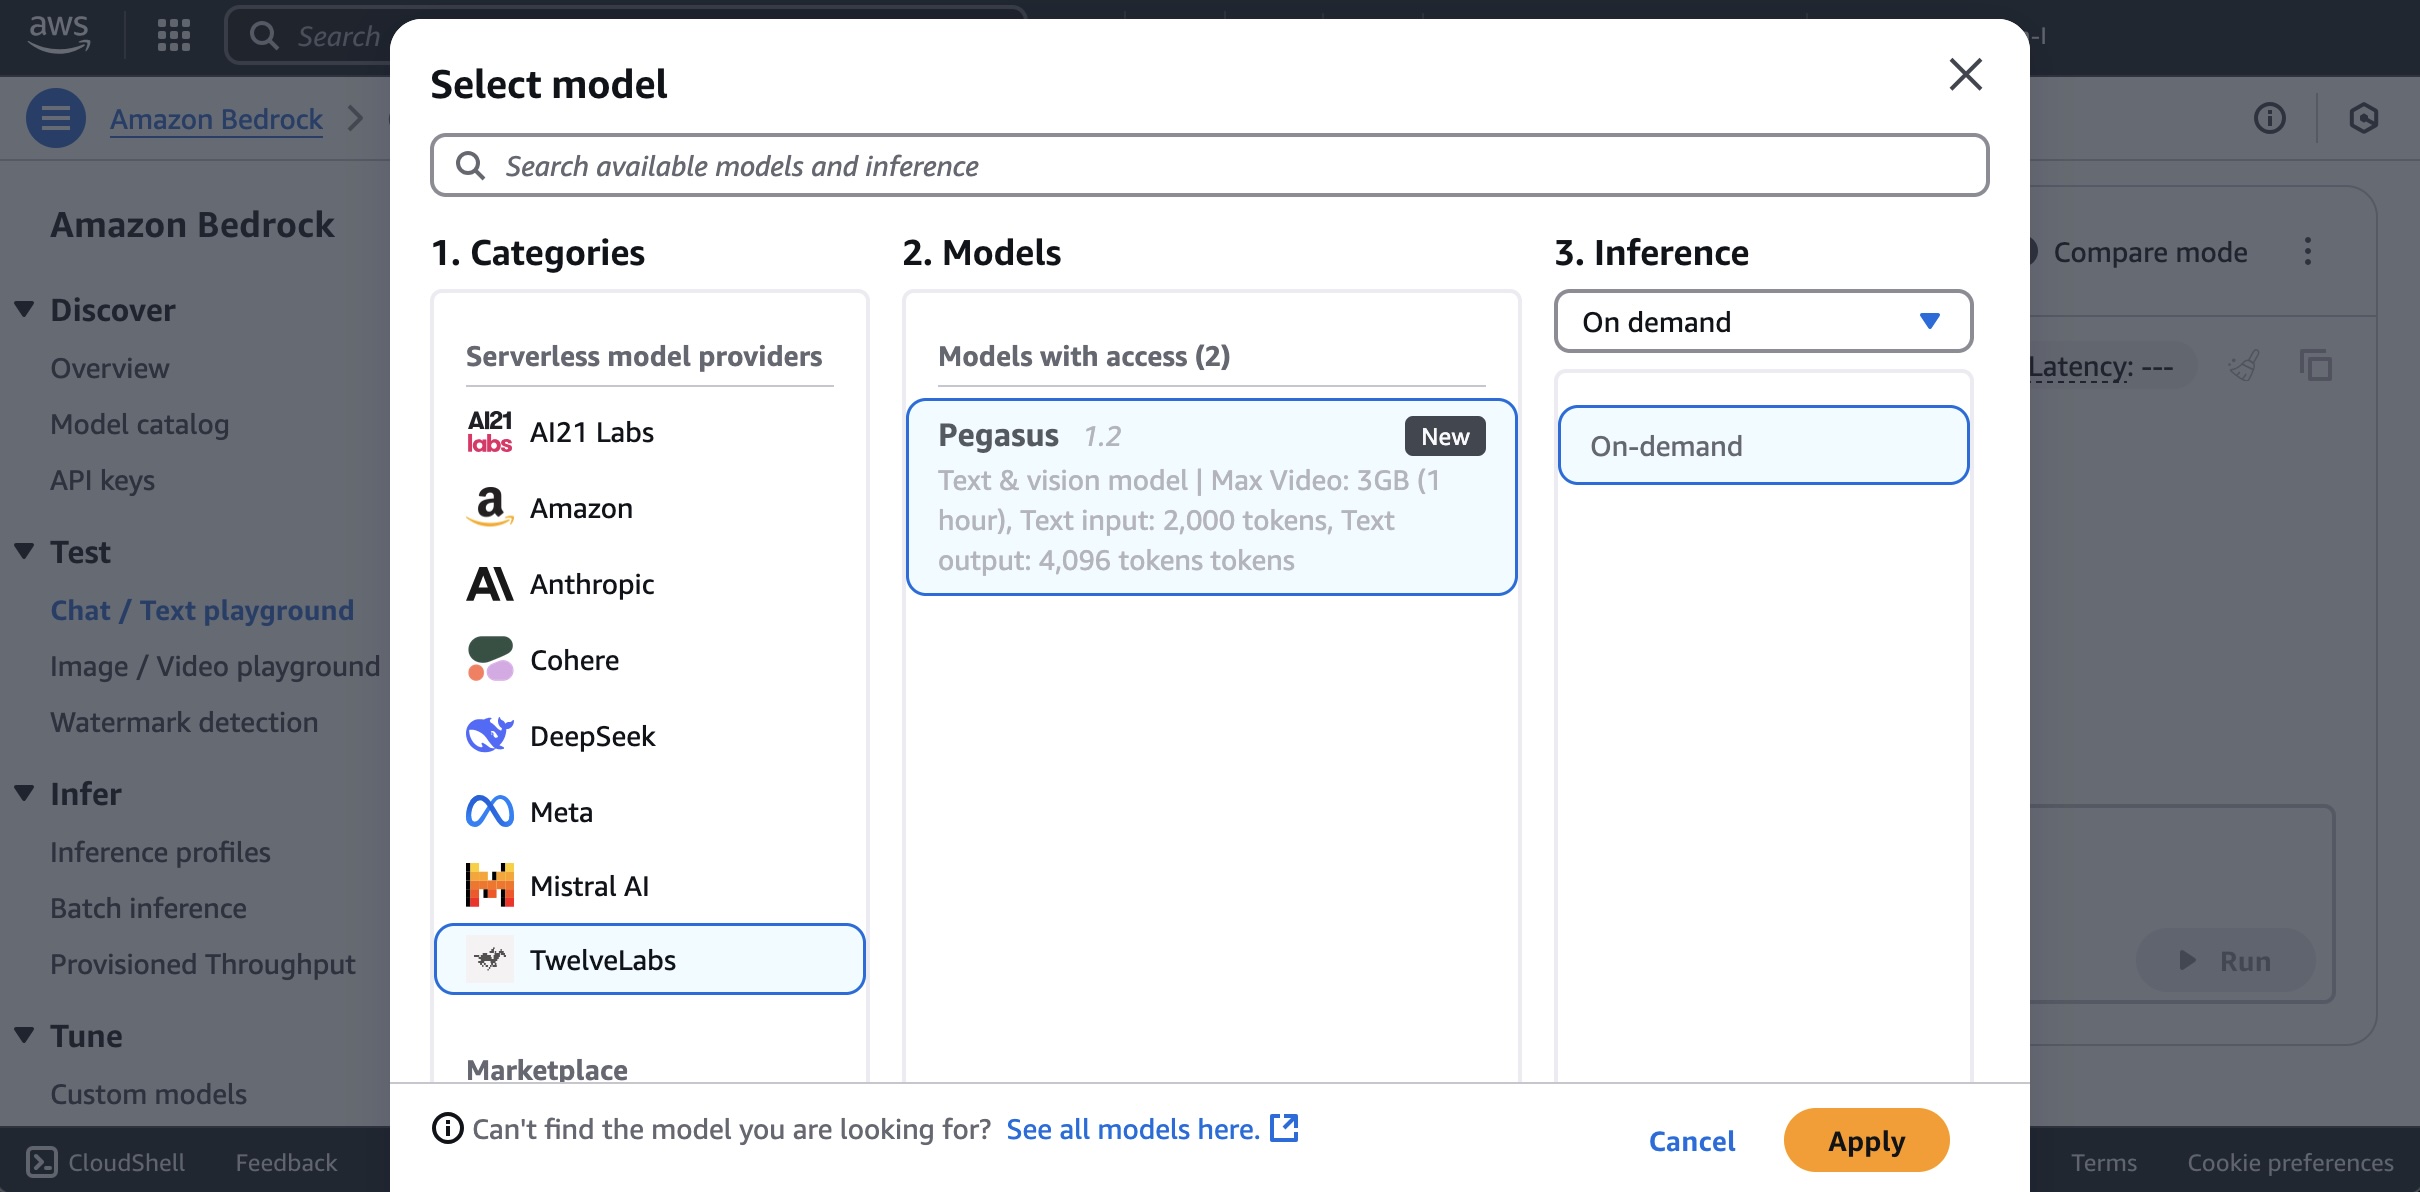
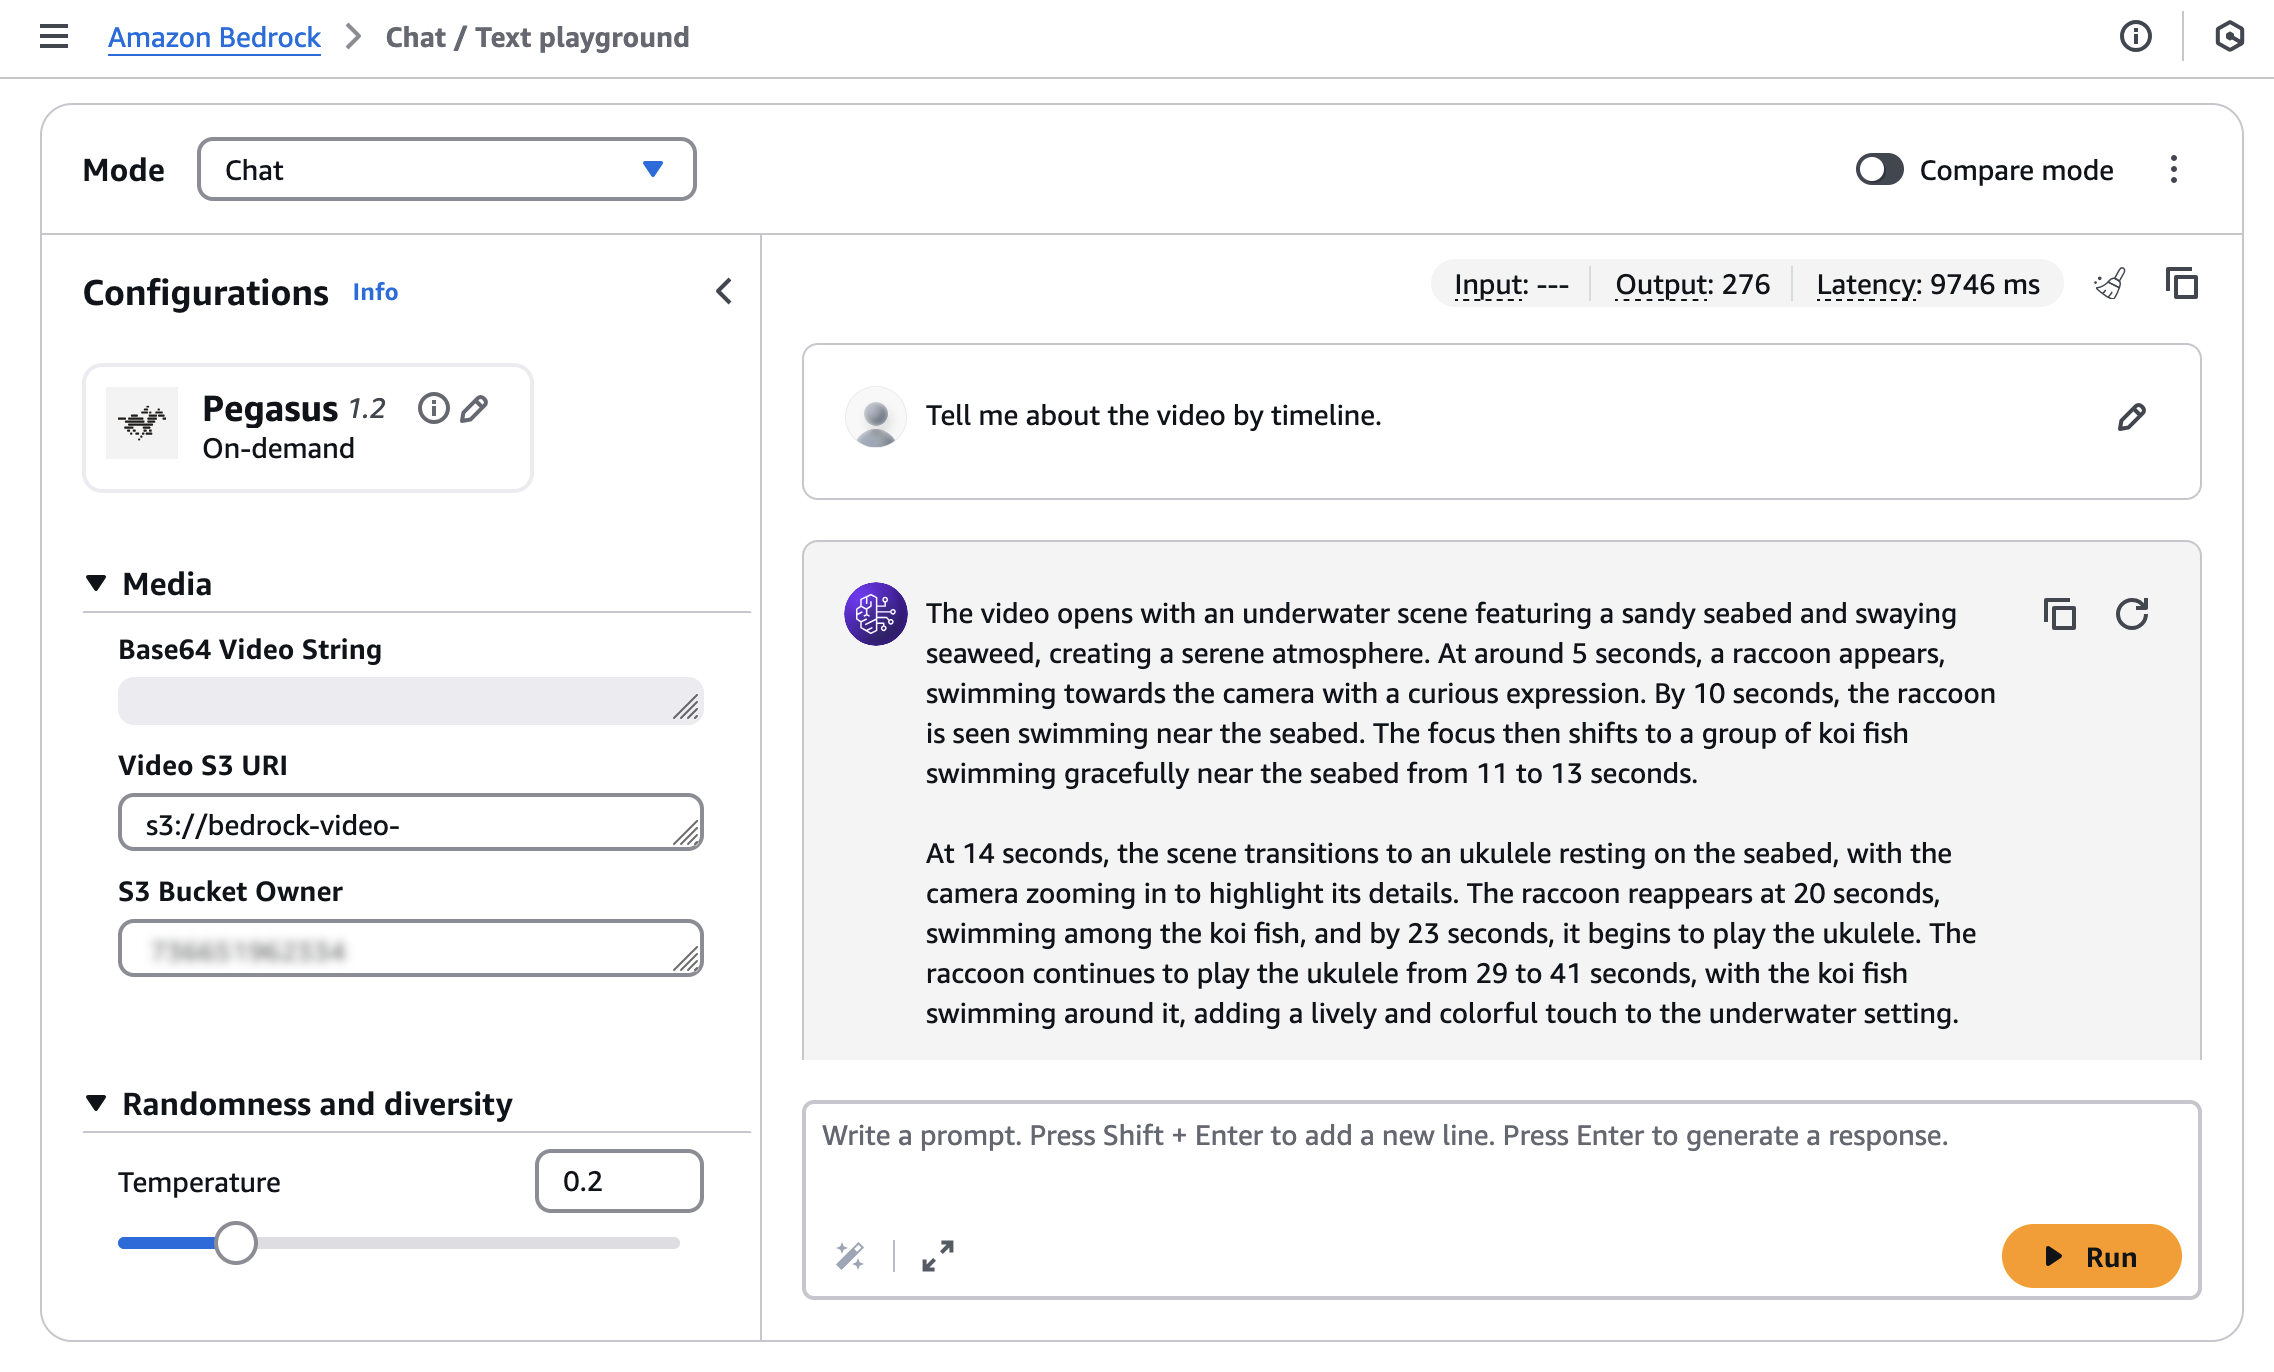


 Chiho Sugimoto is a Cloud Support Engineer on the AWS Big Data Support team. She is passionate about helping customers build data lakes using ETL workloads. She loves planetary science and enjoys studying the asteroid Ryugu on weekends.
 Noritaka Sekiyama is a Principal Big Data Architect at the AWS Analytics product team. He’s responsible for designing new features in AWS products, building software artifacts, and providing architecture guidance to customers. In his spare time, he enjoys cycling on his road bike.
 Matt Su is a Senior Product Manager on the AWS Glue team. He enjoys helping customers uncover insights and make better decisions using their data with AWS Analytics services. In his spare time, he enjoys skiing and gardening.


 Naohisa Takahashi is a Senior Cloud Support Engineer on the AWS Support Engineering team. He supports customers resolve technical issues and launch systems. In his spare time, he plays board games with his friends.
 Noritaka Sekiyama is a Principal Big Data Architect with AWS Analytics services. He’s responsible for building software artifacts to help customers. In his spare time, he enjoys cycling on his road bike.
 Iris Tian is a UX designer on the Amazon SageMaker Unified Studio team. She designs intuitive, end-to-end experiences that simplify and streamline workflows across data processing and orchestration. In her spare time, she enjoys snowboarding and visiting museums.
 Regan Baum is a Senior Software Development Engineer on the Amazon SageMaker Unified Studio team. She designs, implements, and maintains features that enable customers to manage their workflows in SageMaker Unified Studio. Outside of work, she enjoys hiking and running.
 Yuhang Huang is a Software Development Manager on the Amazon SageMaker Unified Studio team. He leads the engineering team to design, build, and operate scheduling and orchestration capabilities in SageMaker Unified Studio. In his free time, he enjoys playing tennis.
 Gal Heyne is a Senior Technical Product Manager for AWS Analytics services with a strong focus on AI/ML and data engineering. She is passionate about developing a deep understanding of customers’ business needs and collaborating with engineers to design simple-to-use data products.




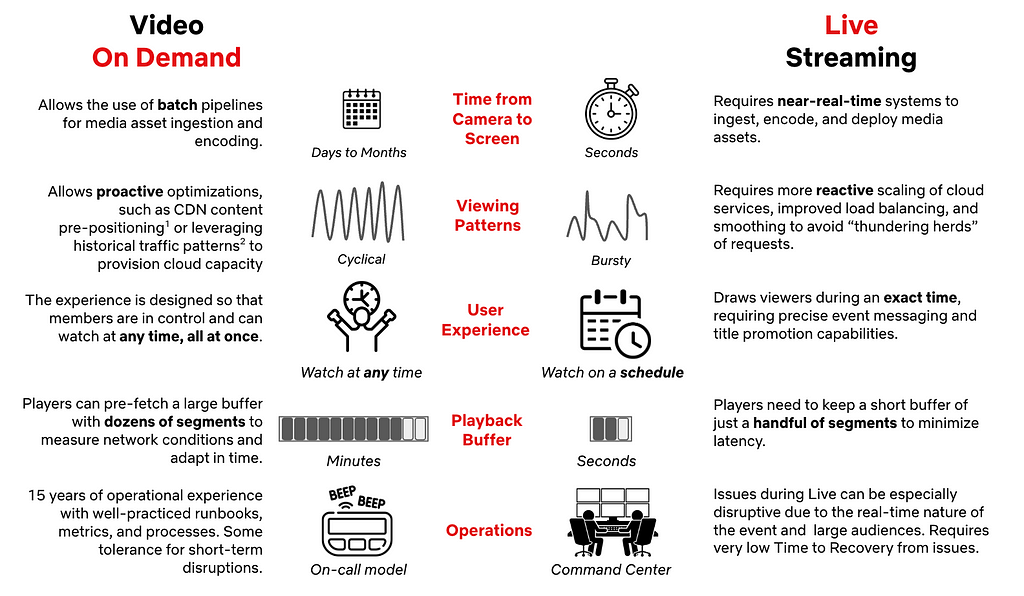
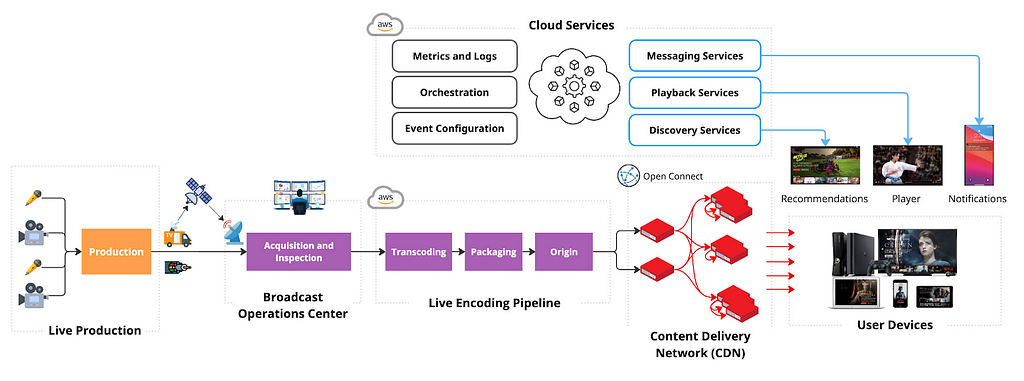
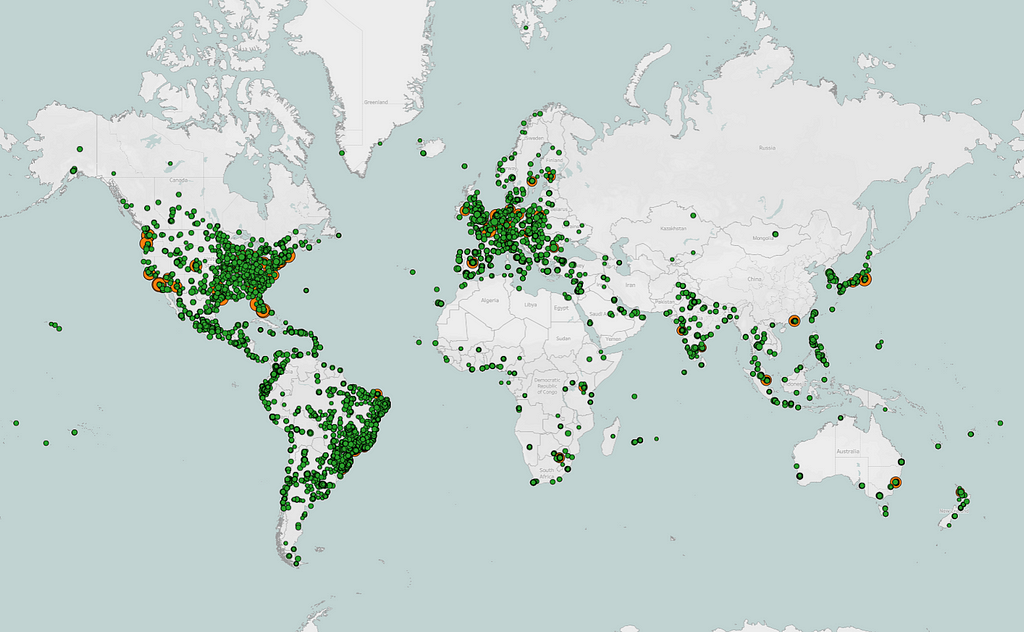
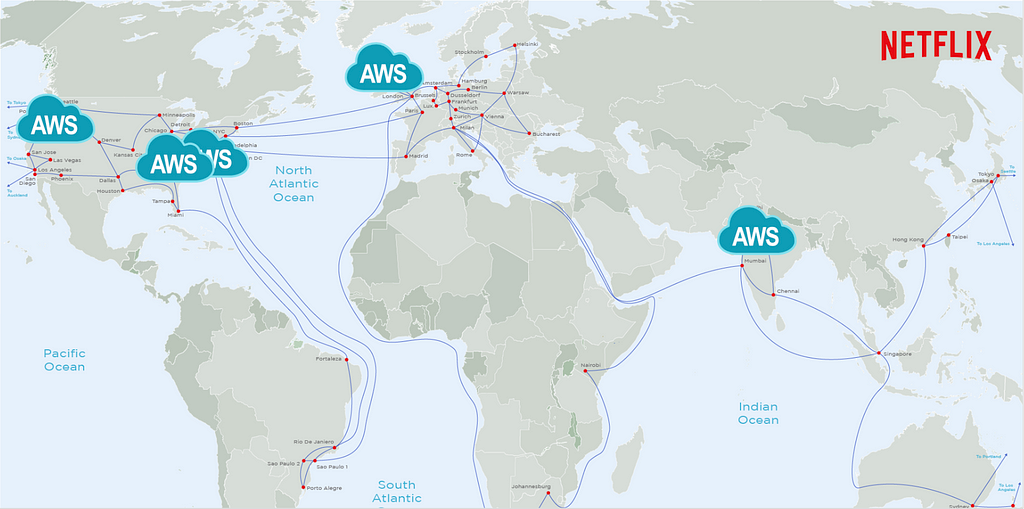


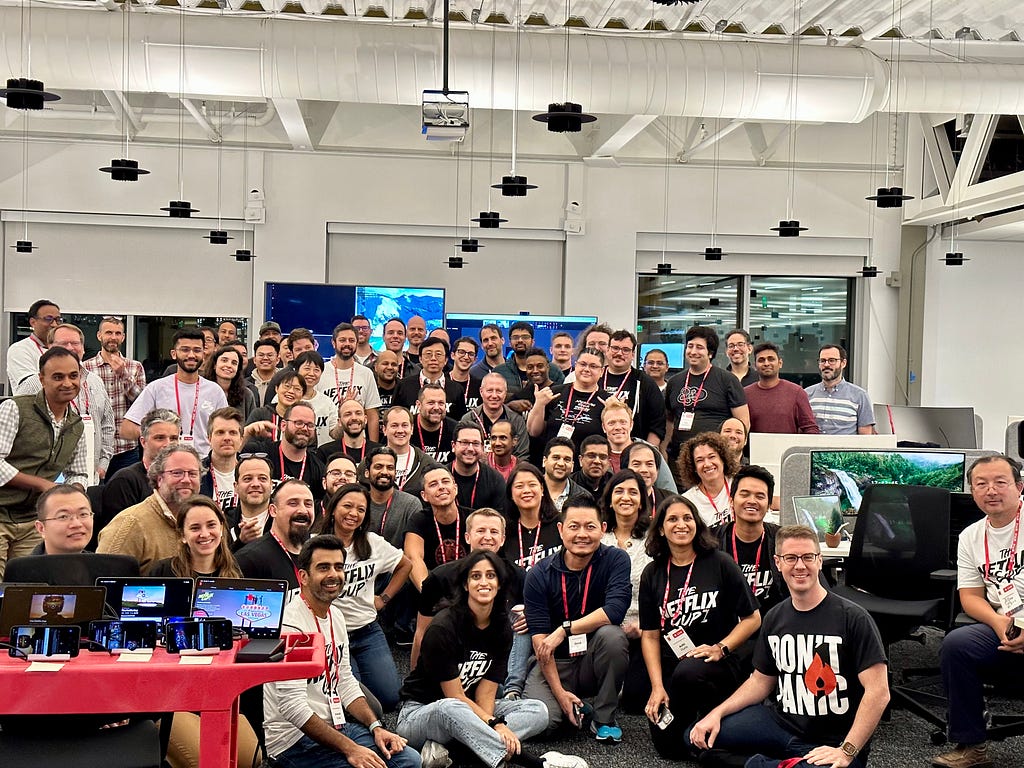


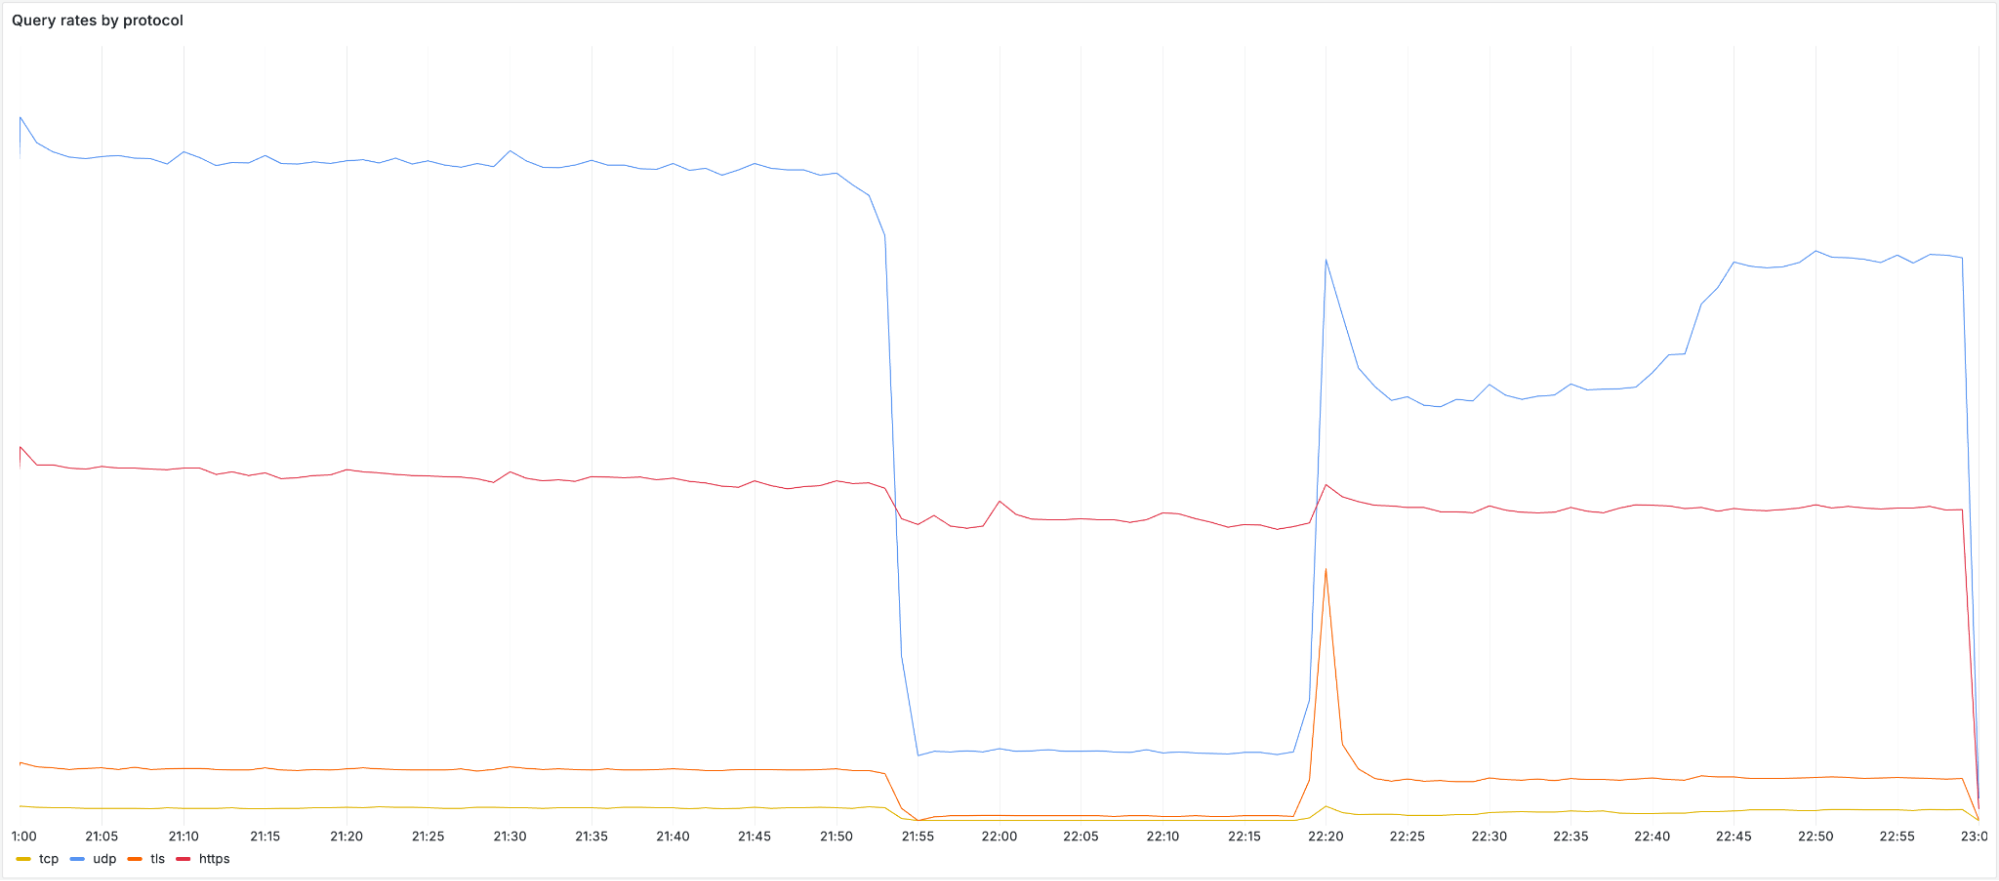

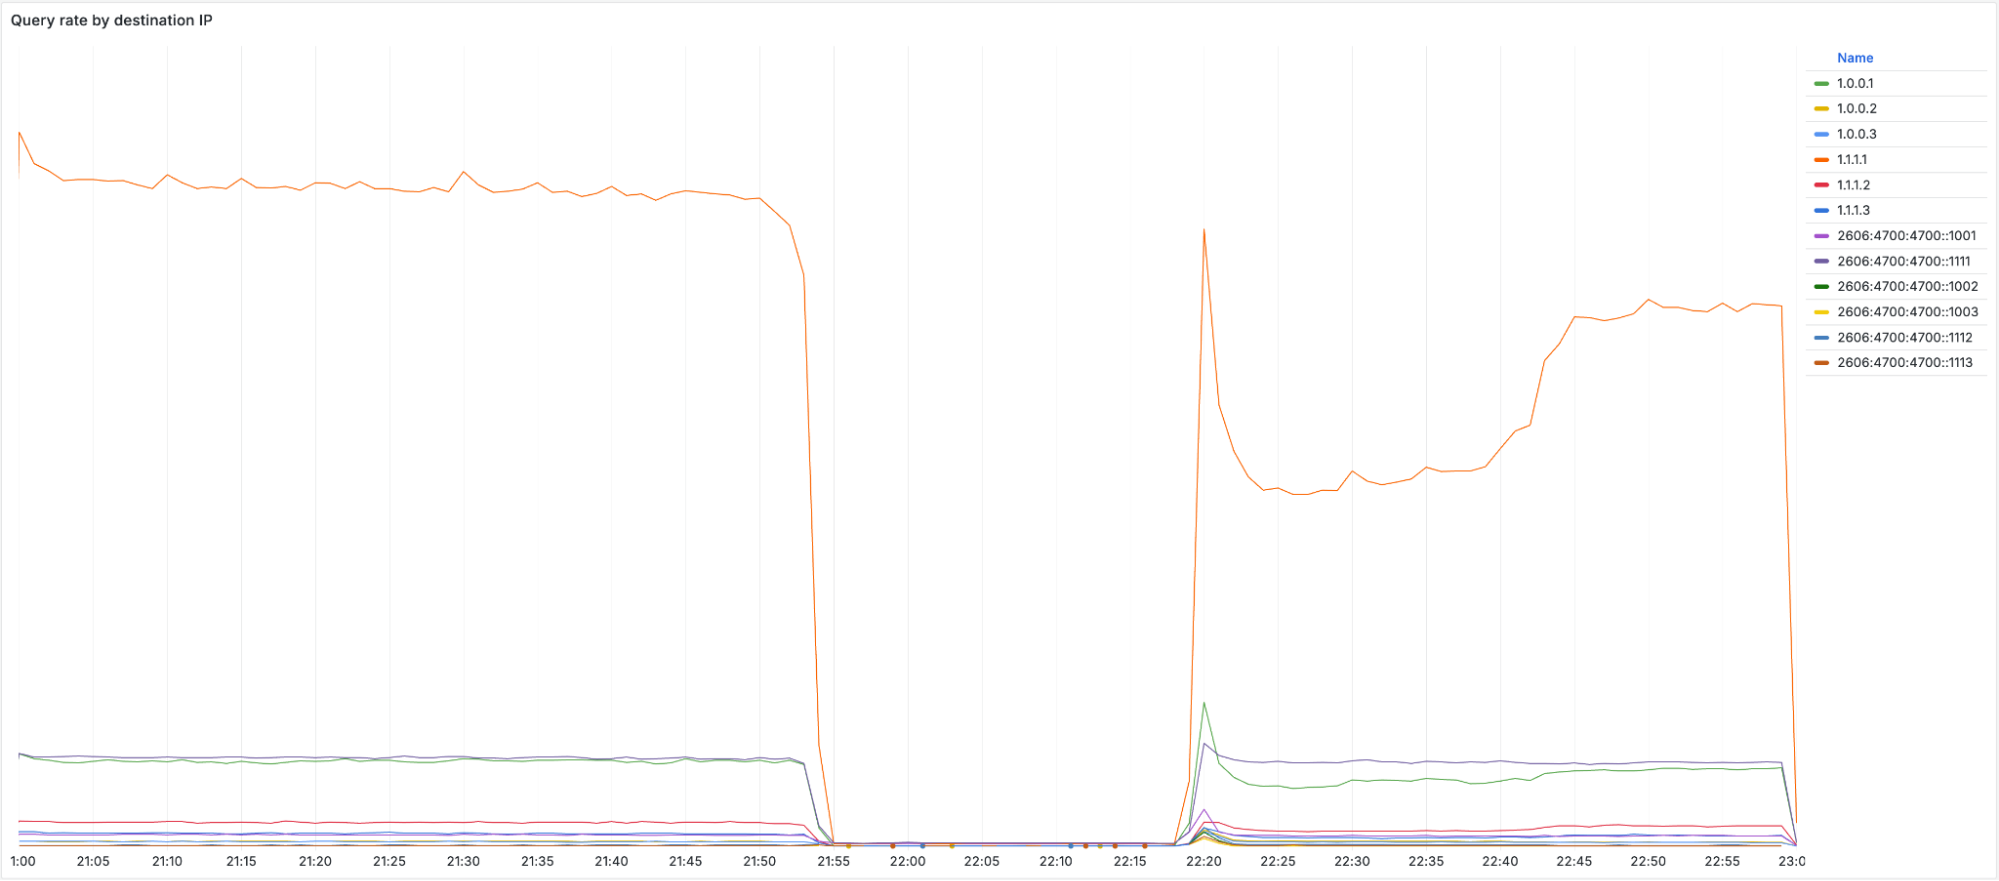
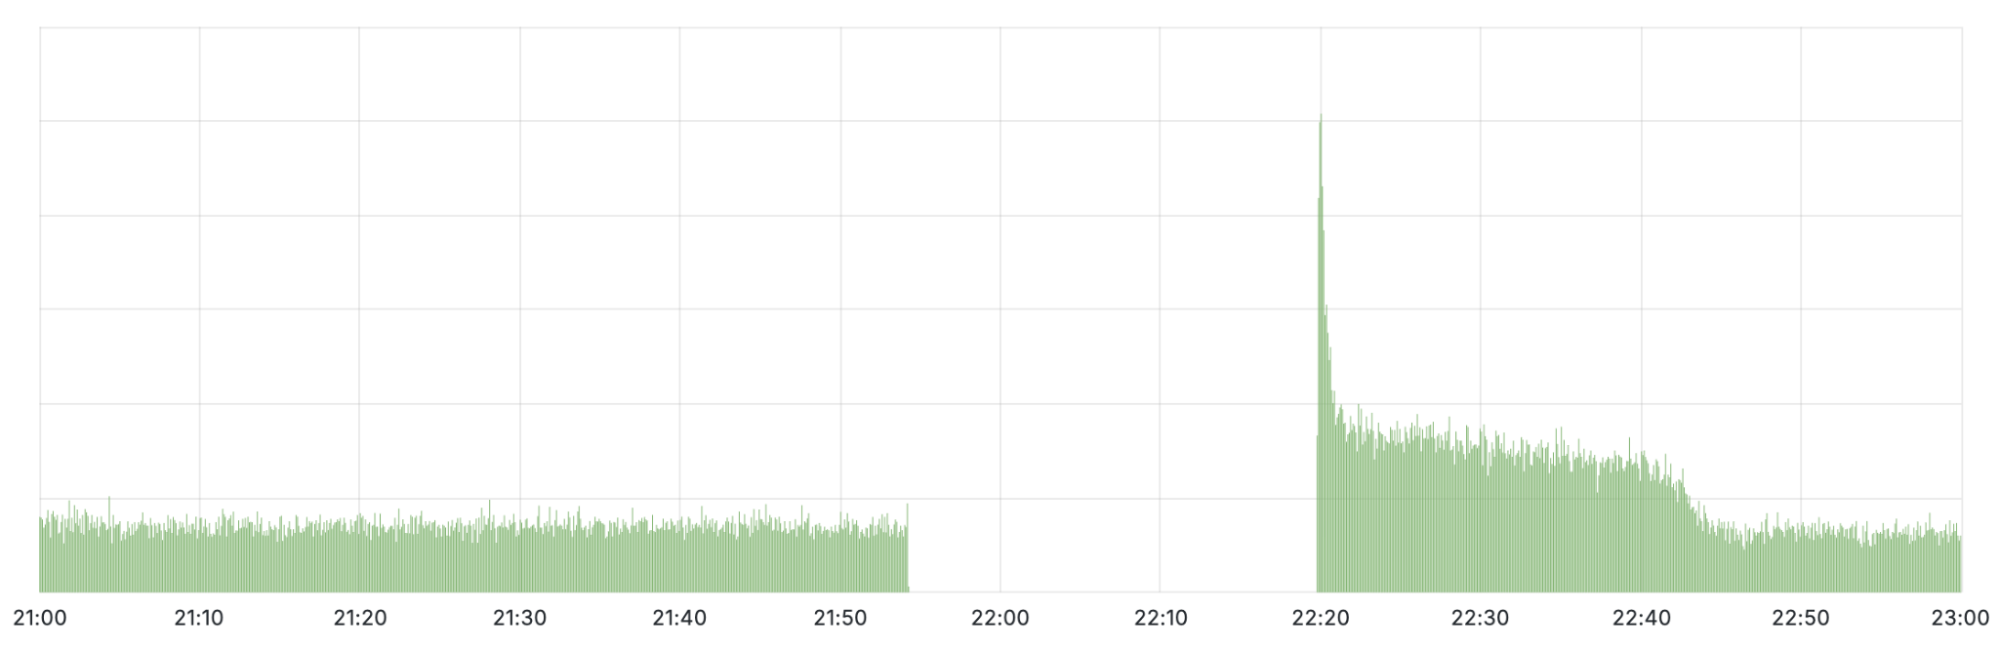
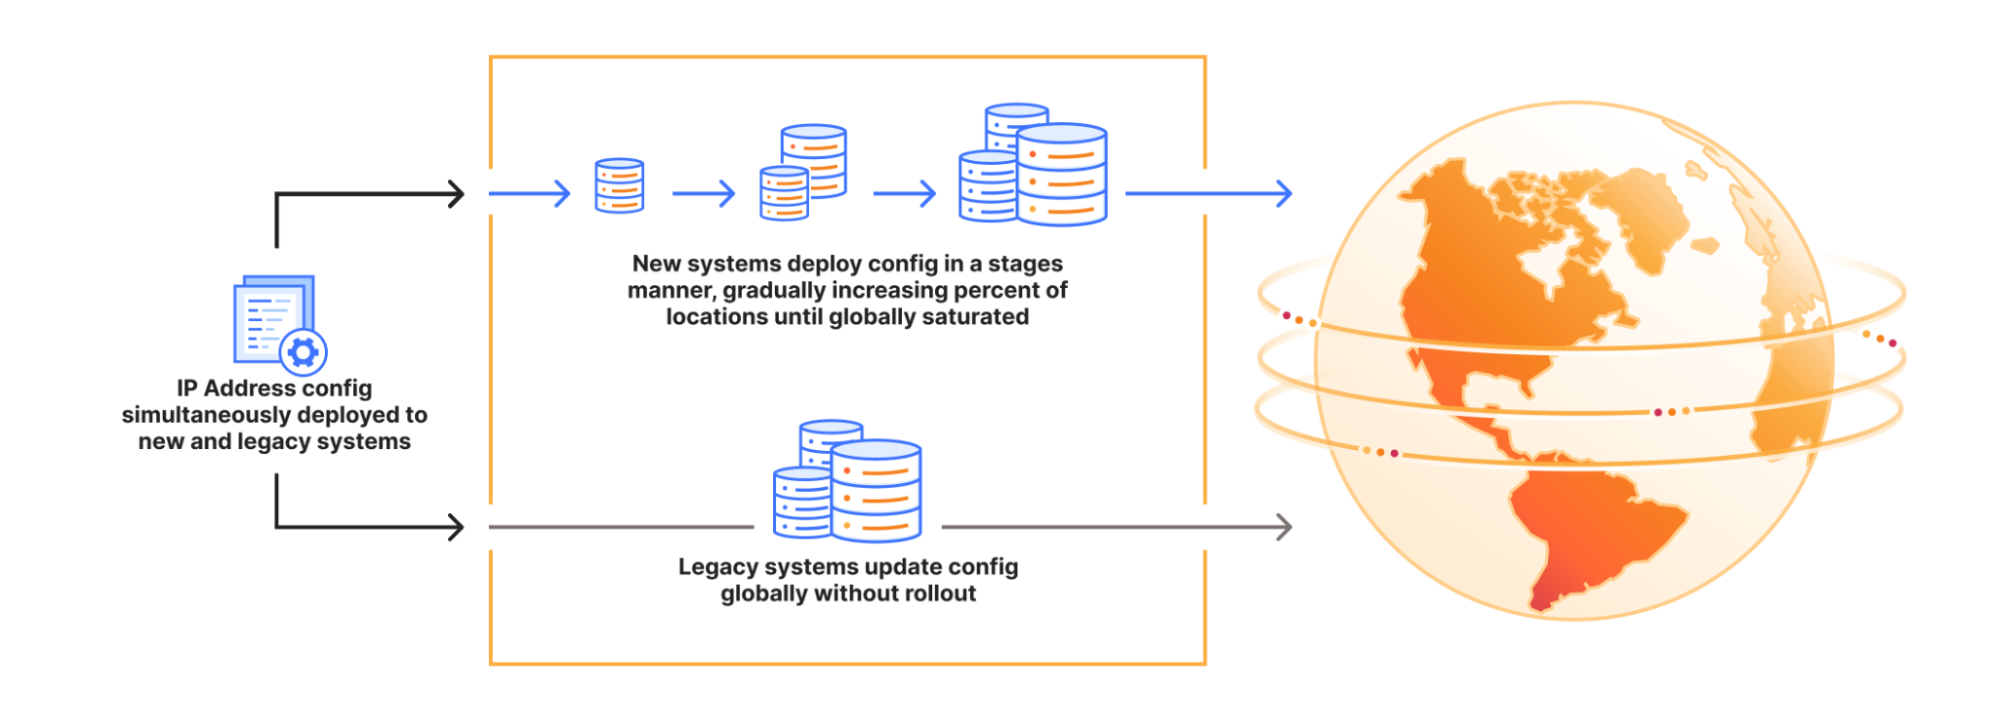

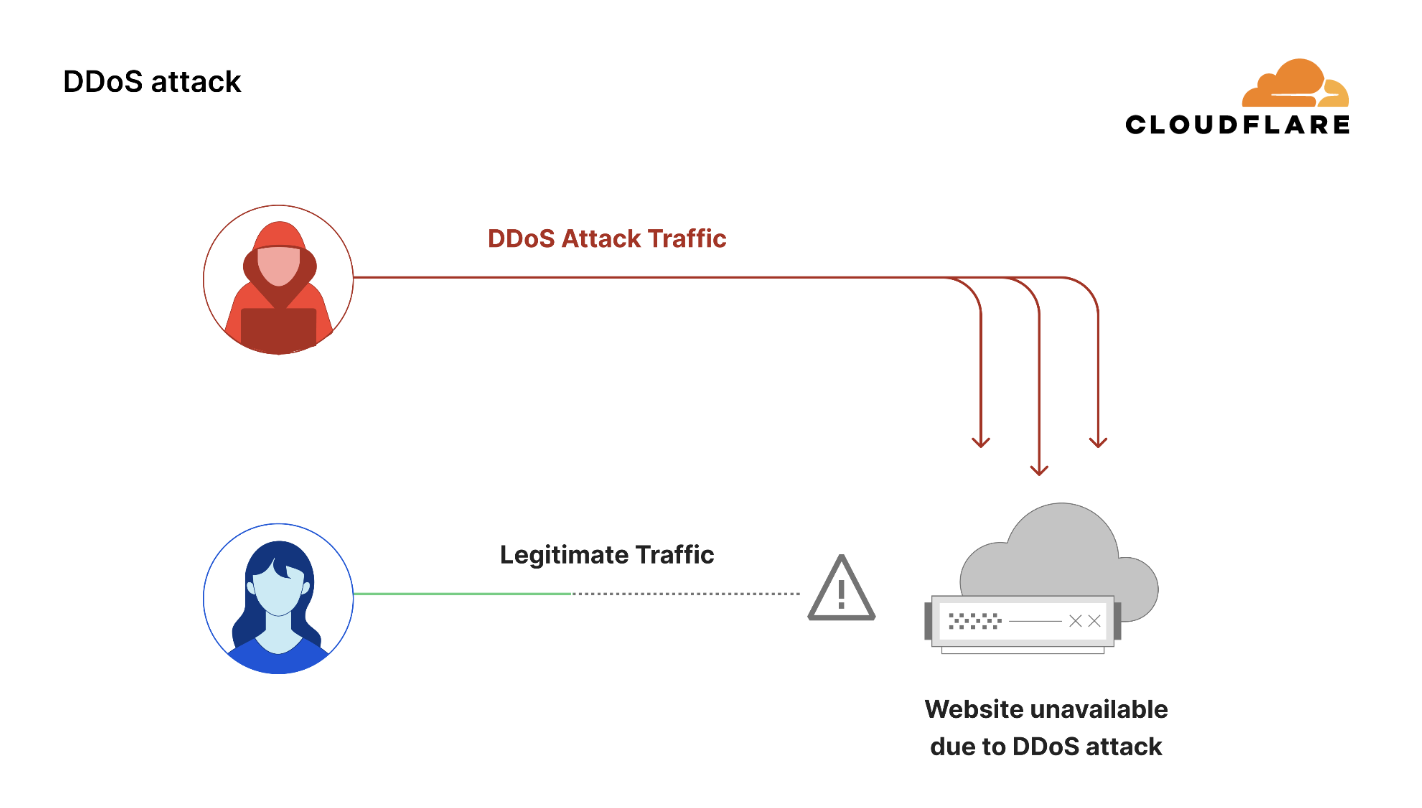
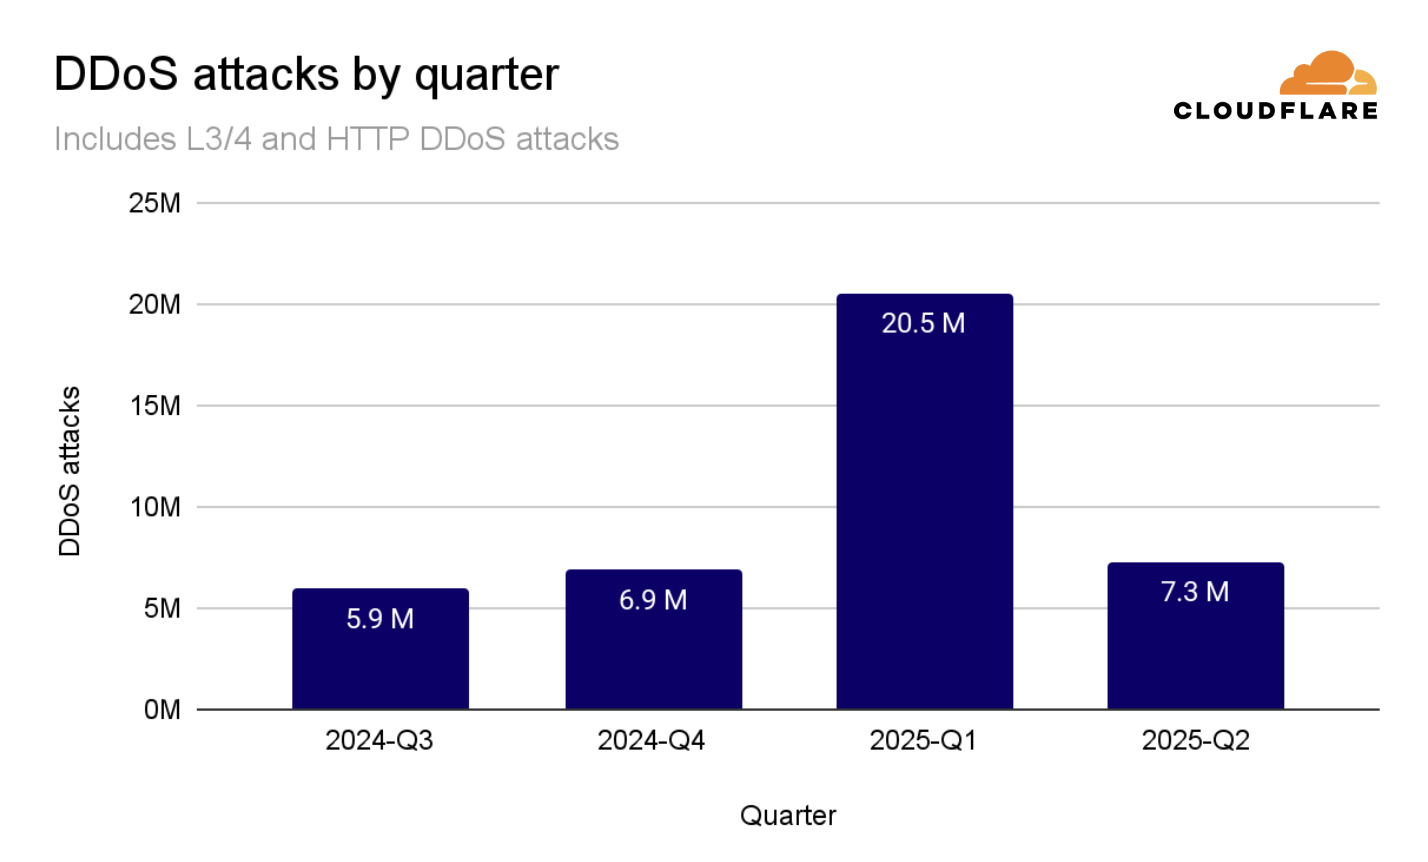
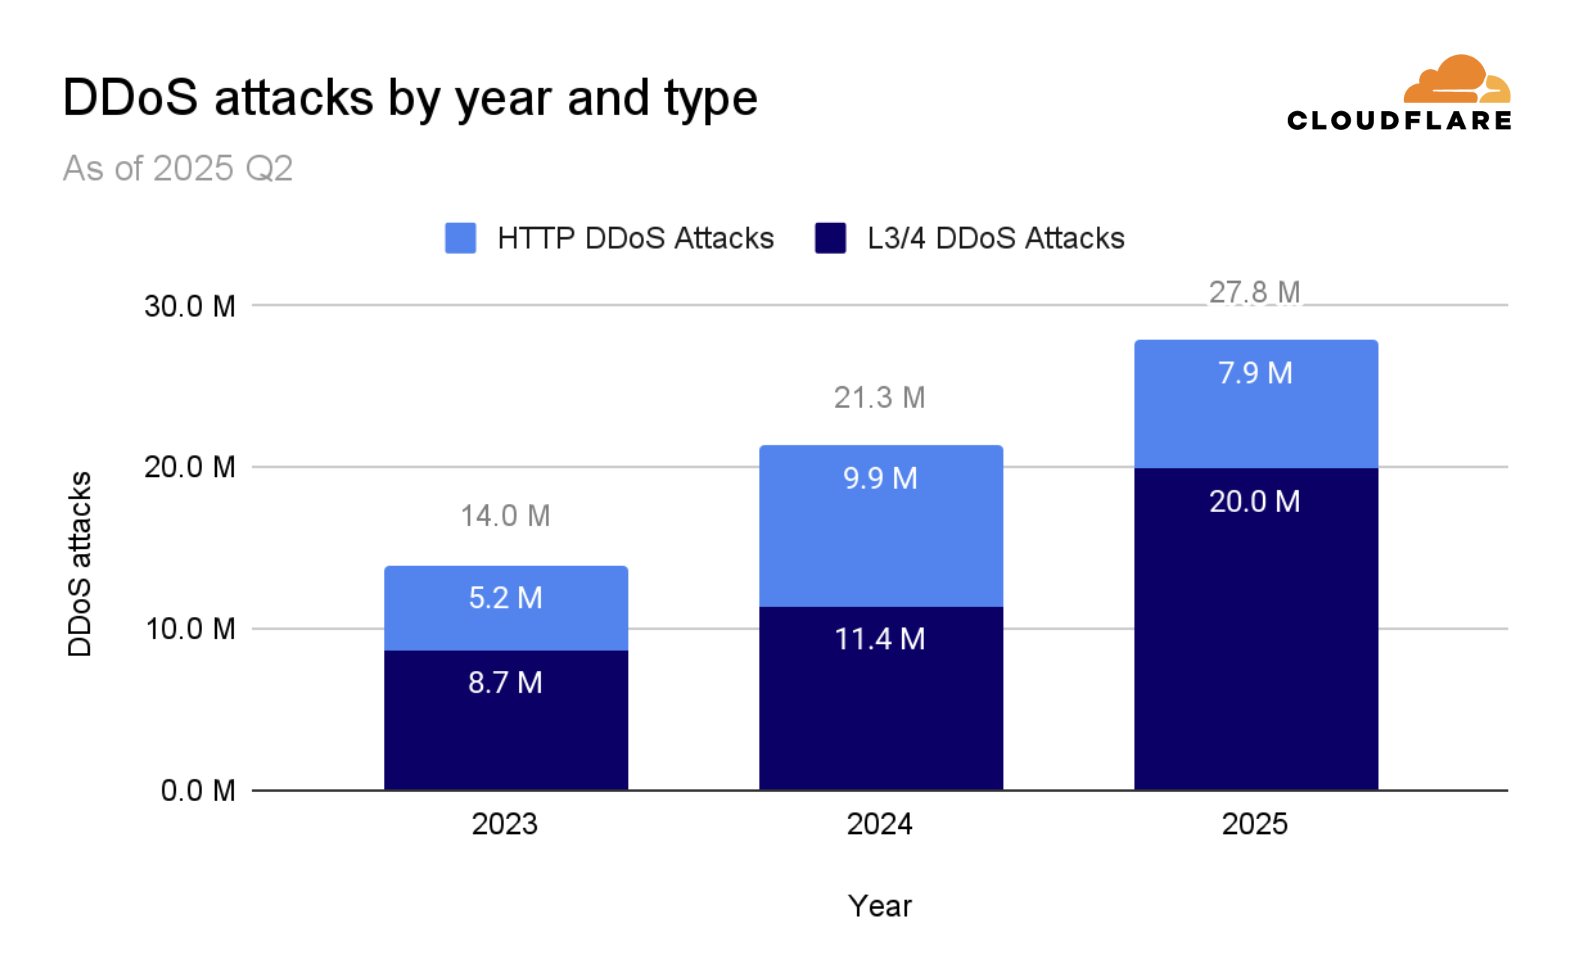
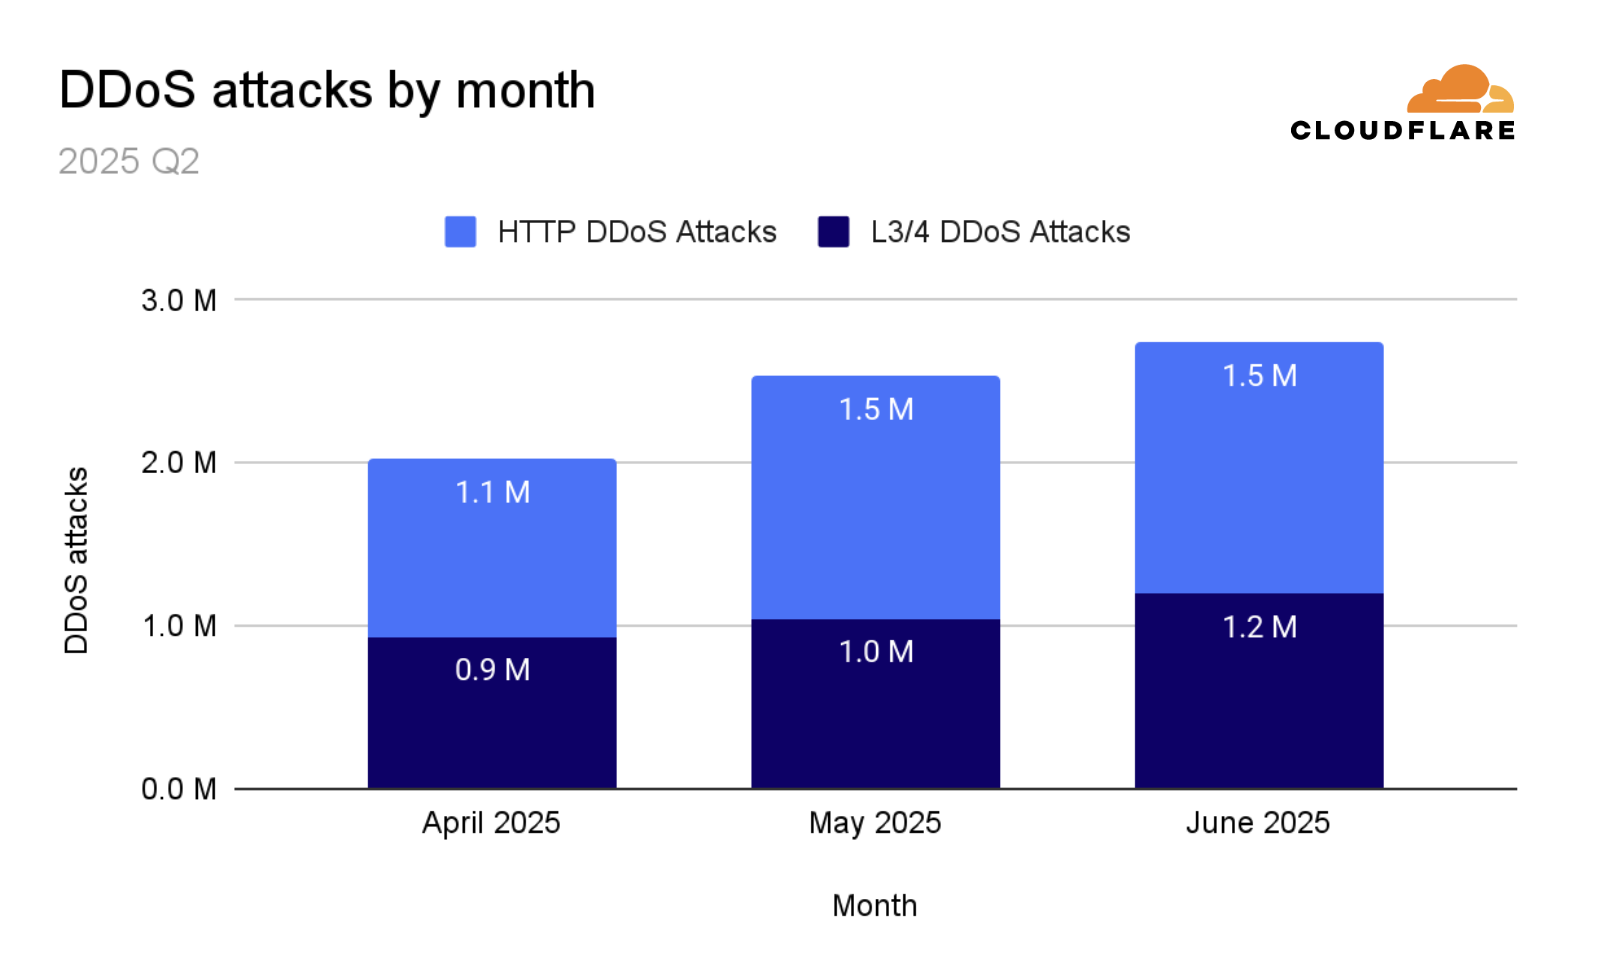
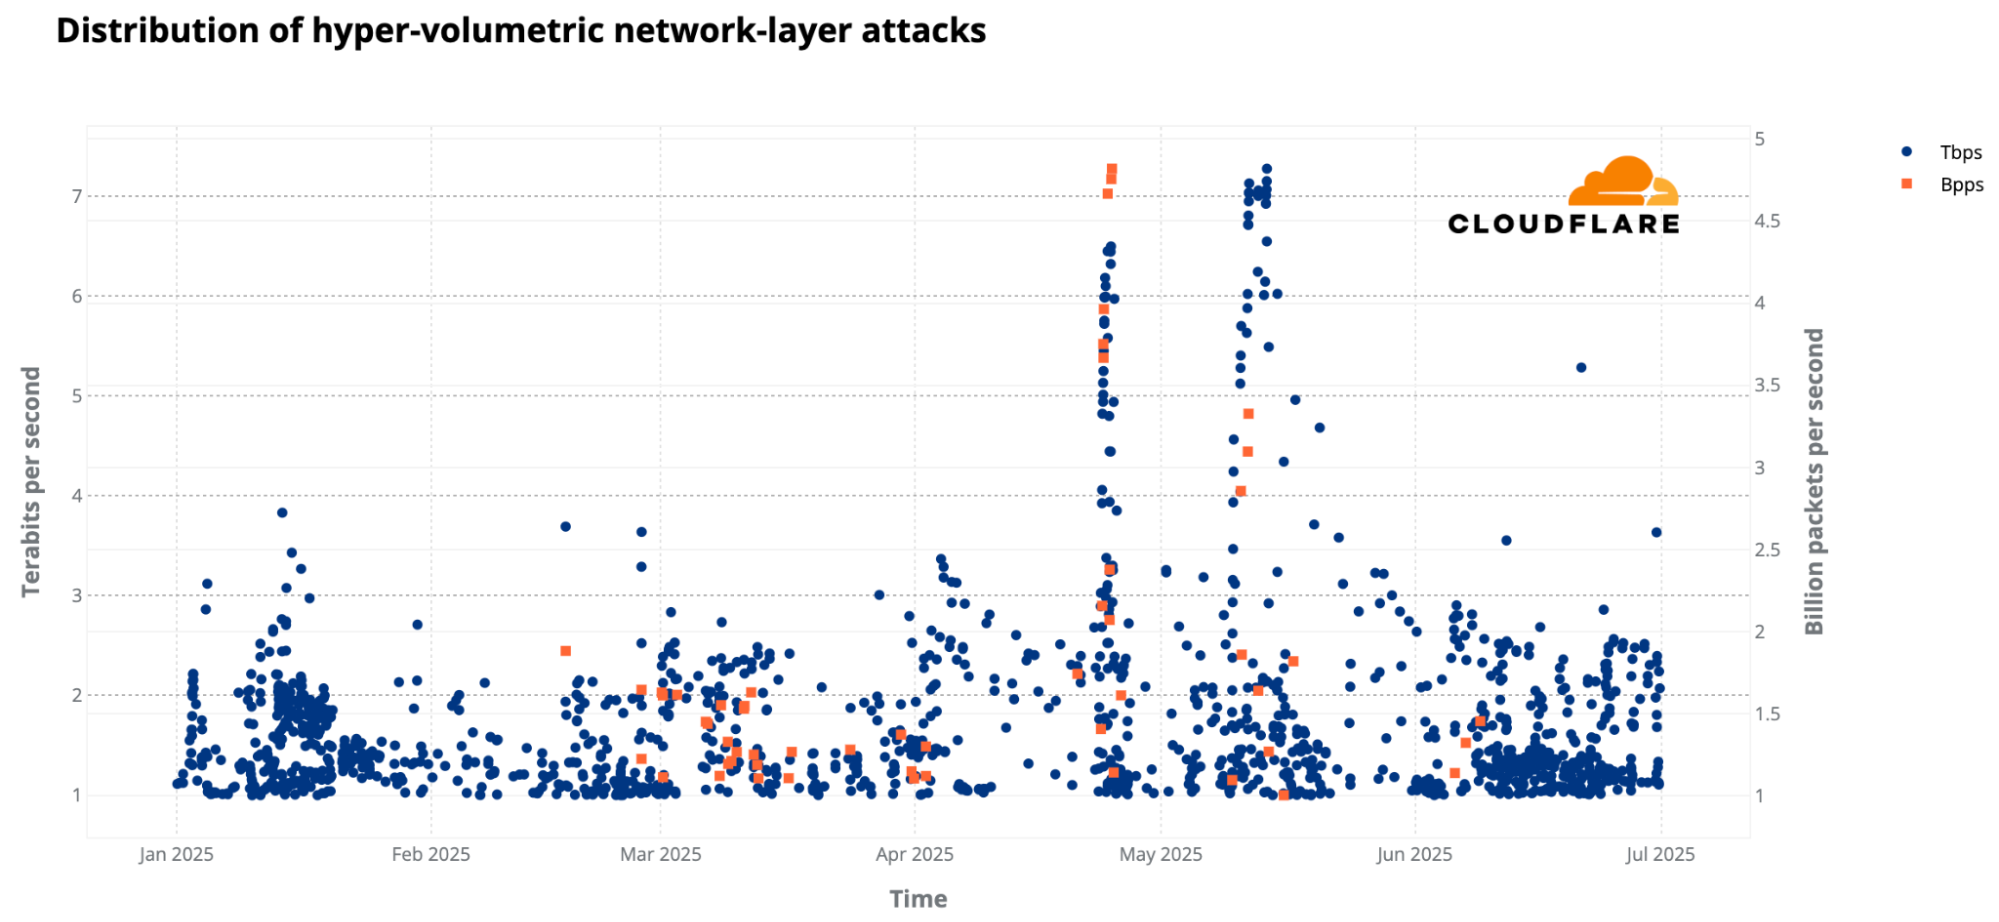
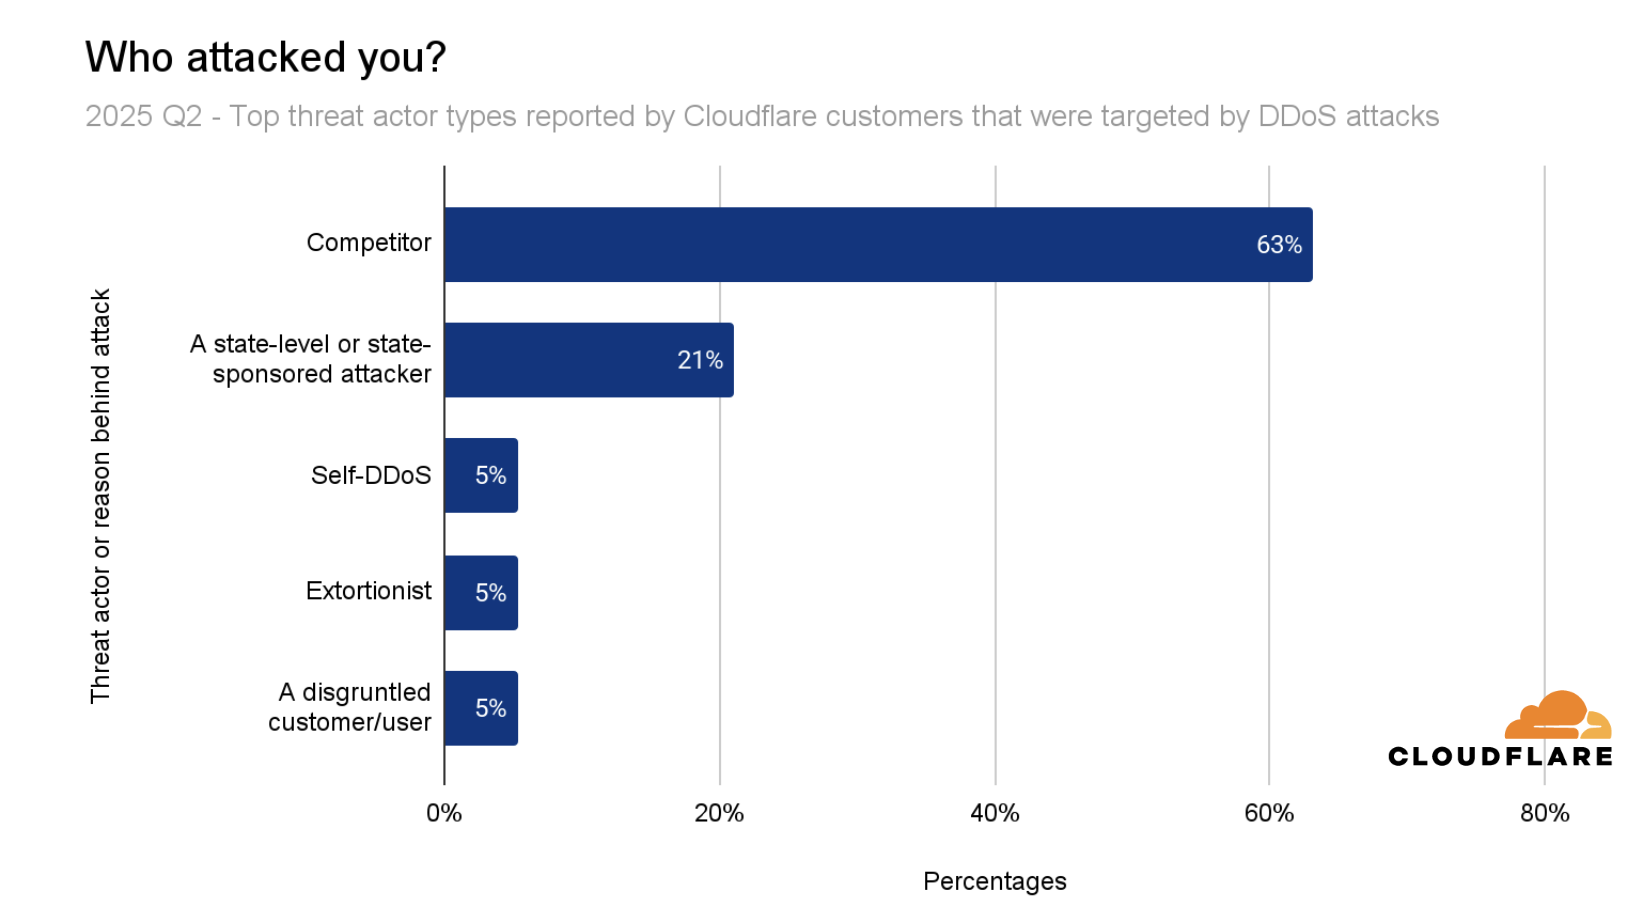
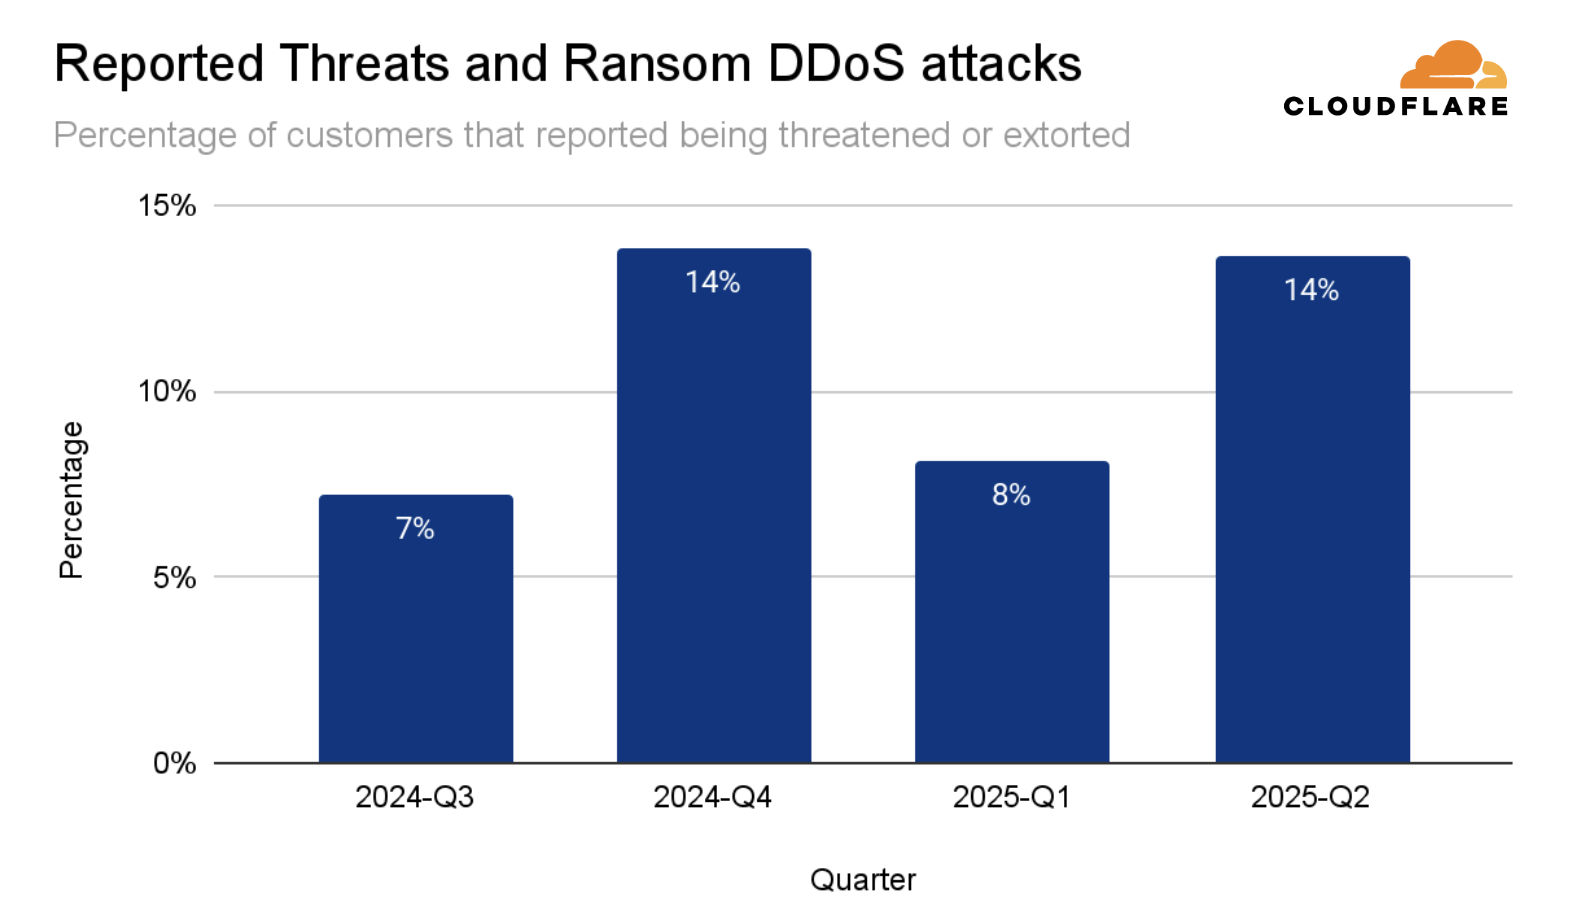
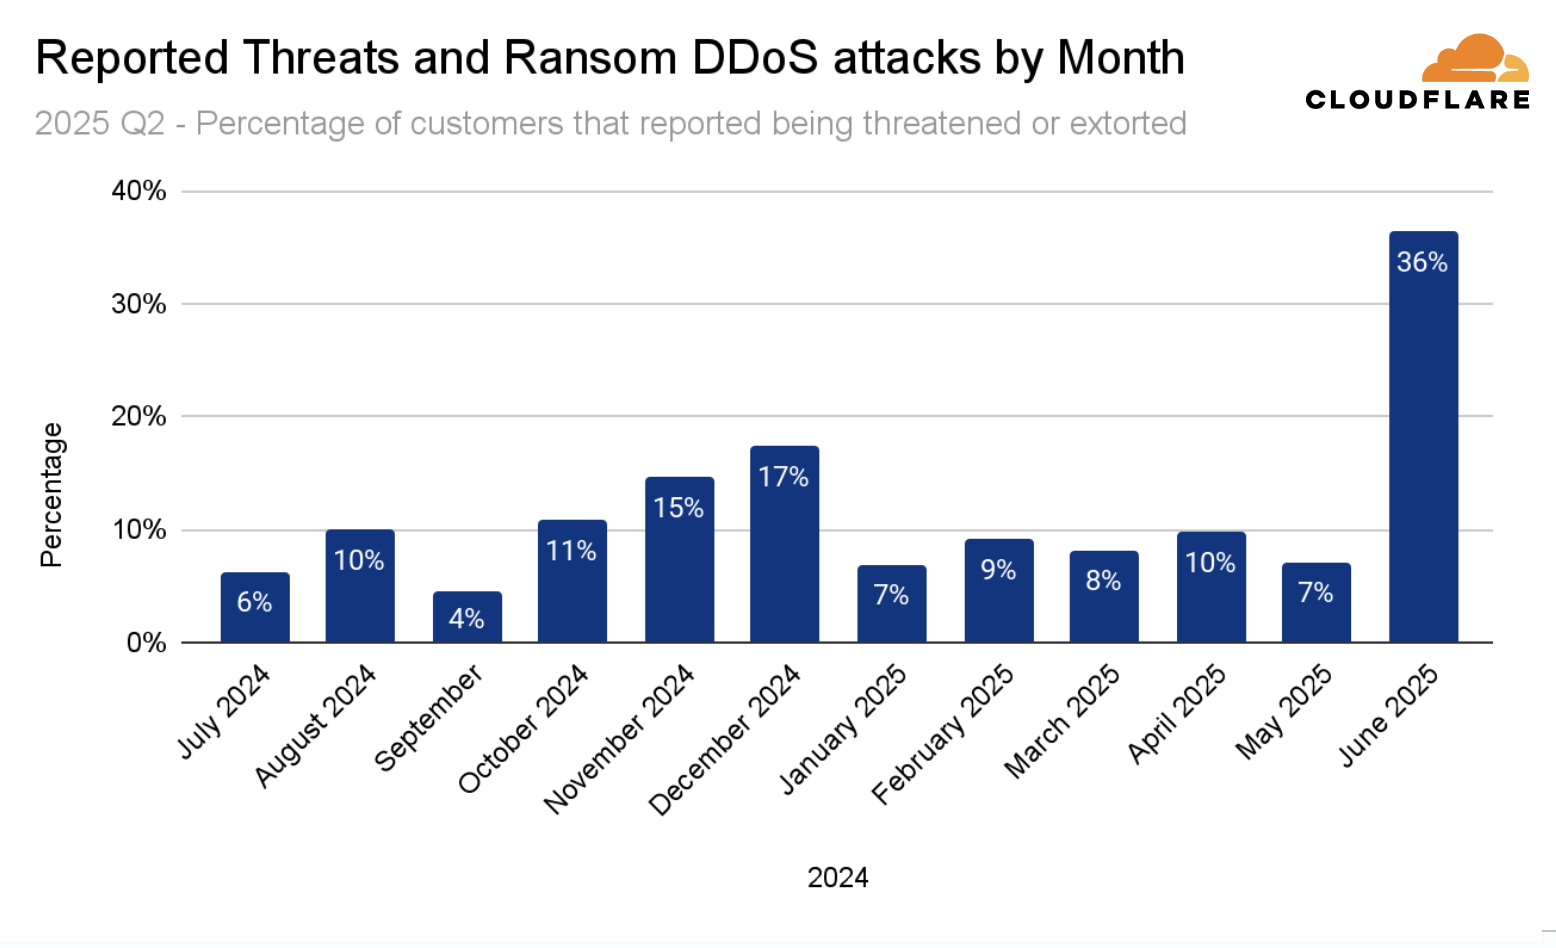
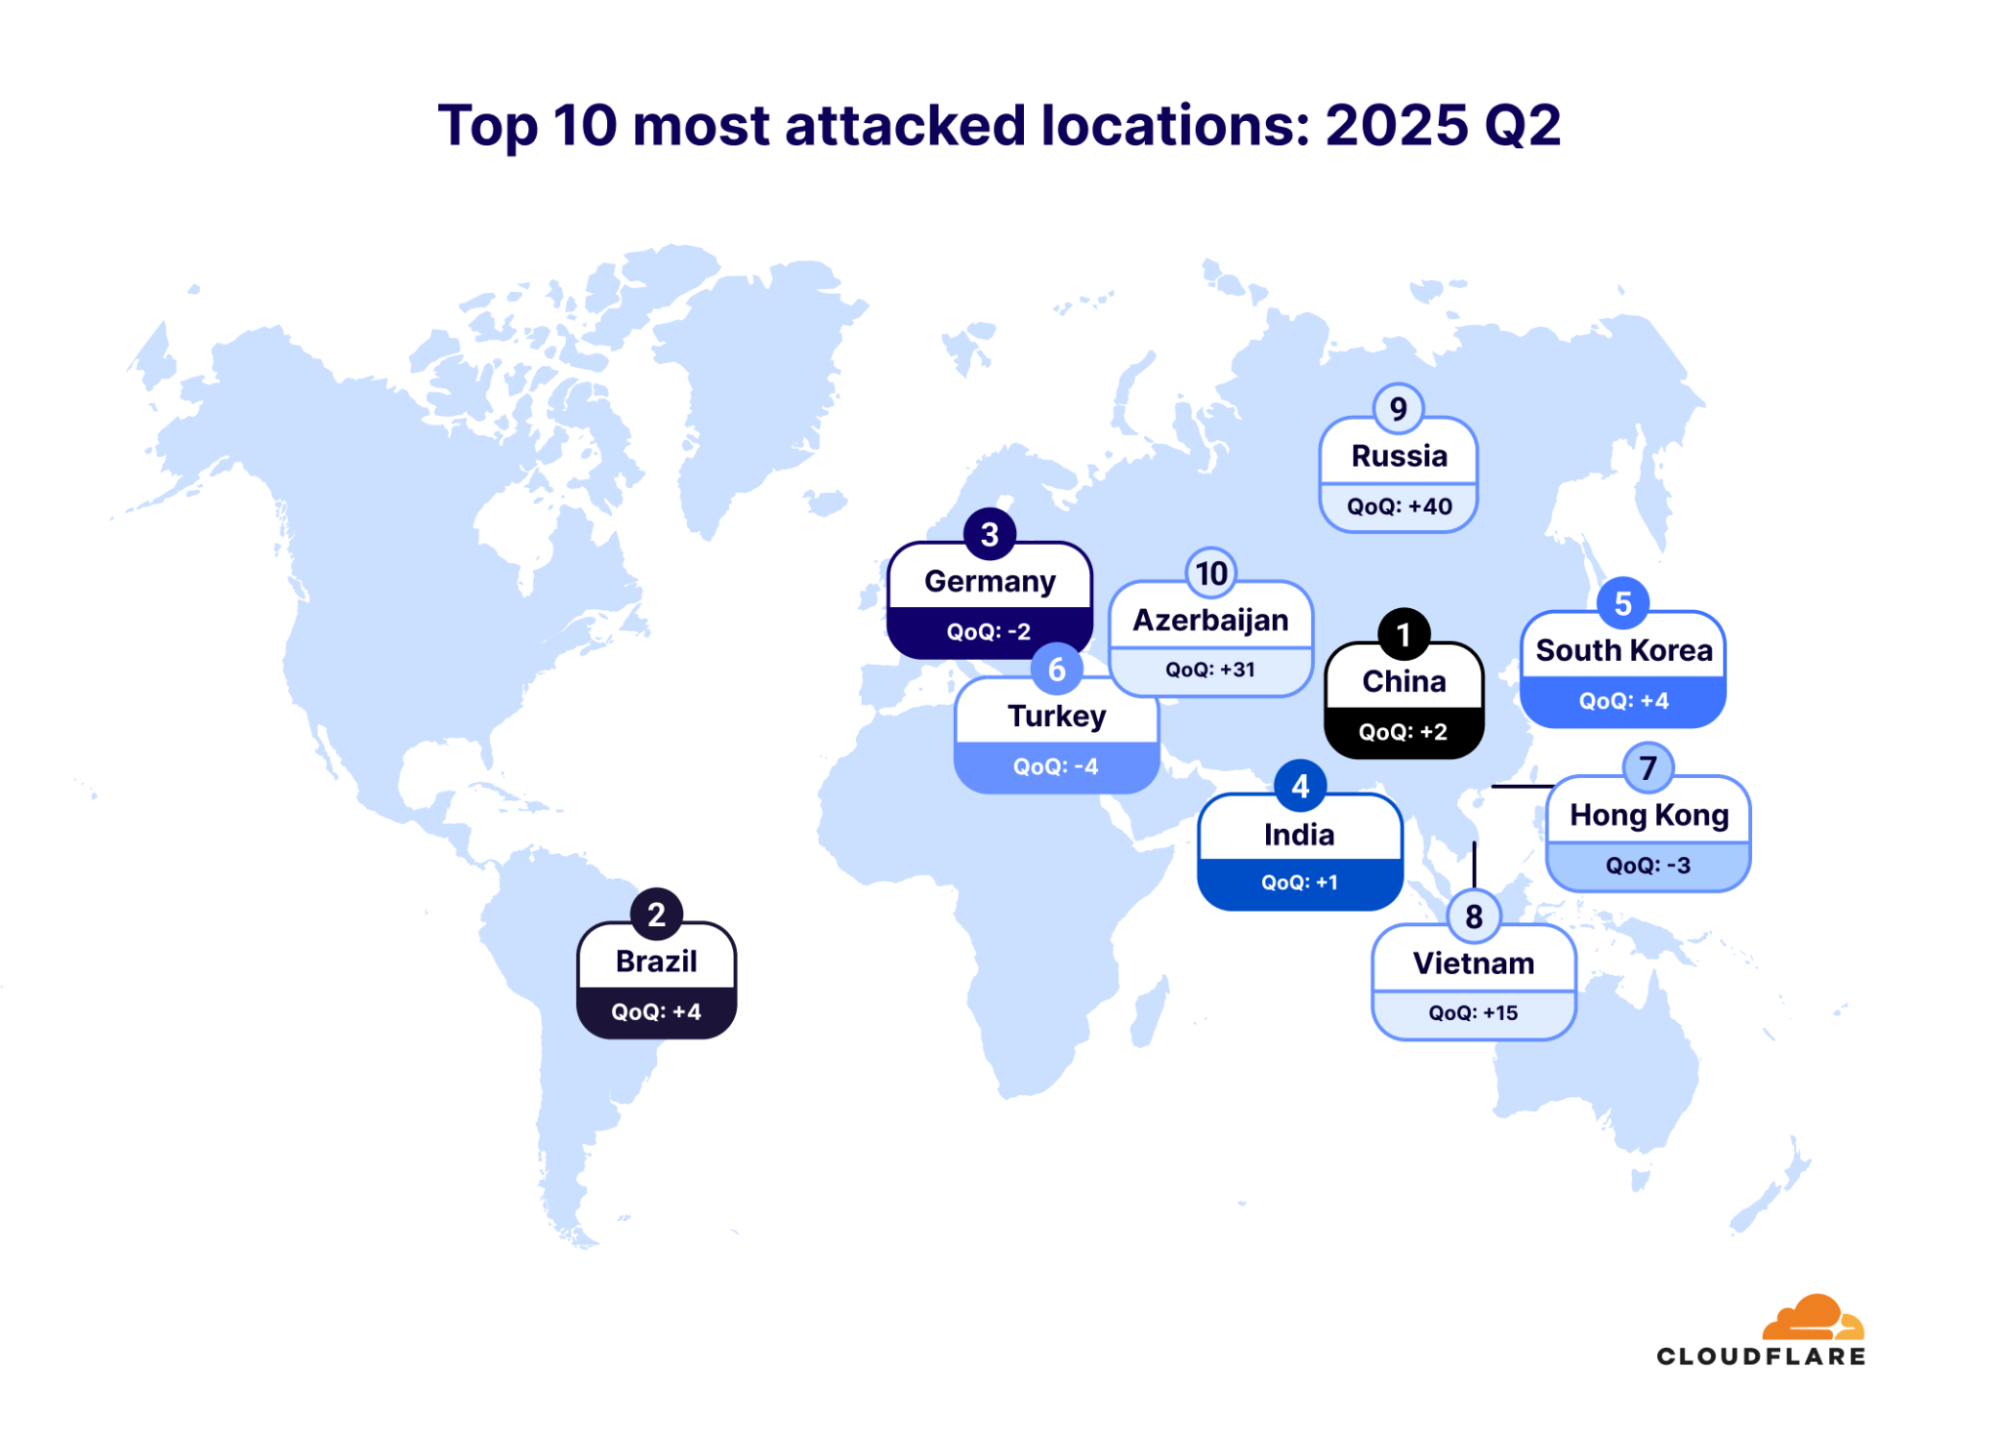
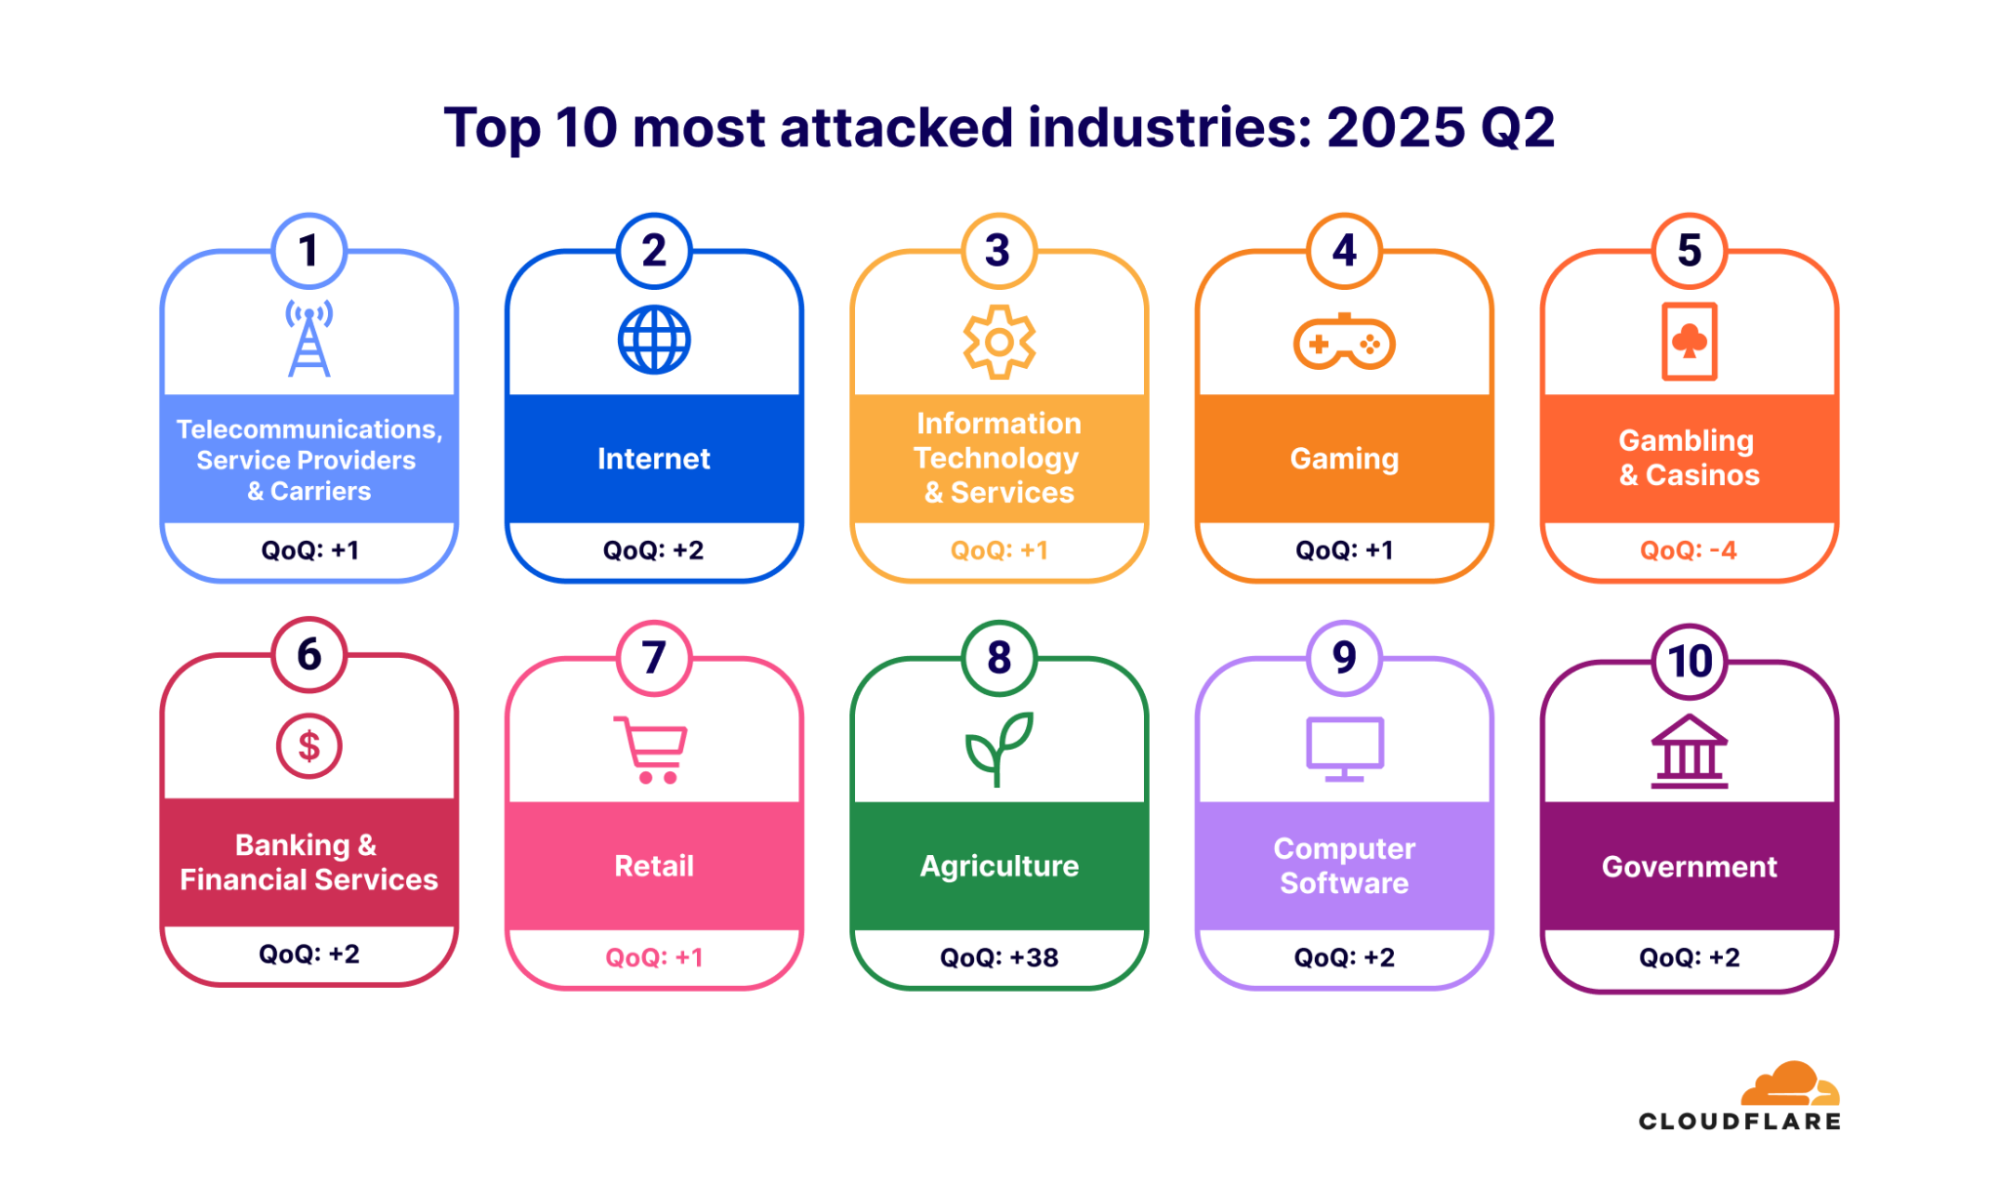
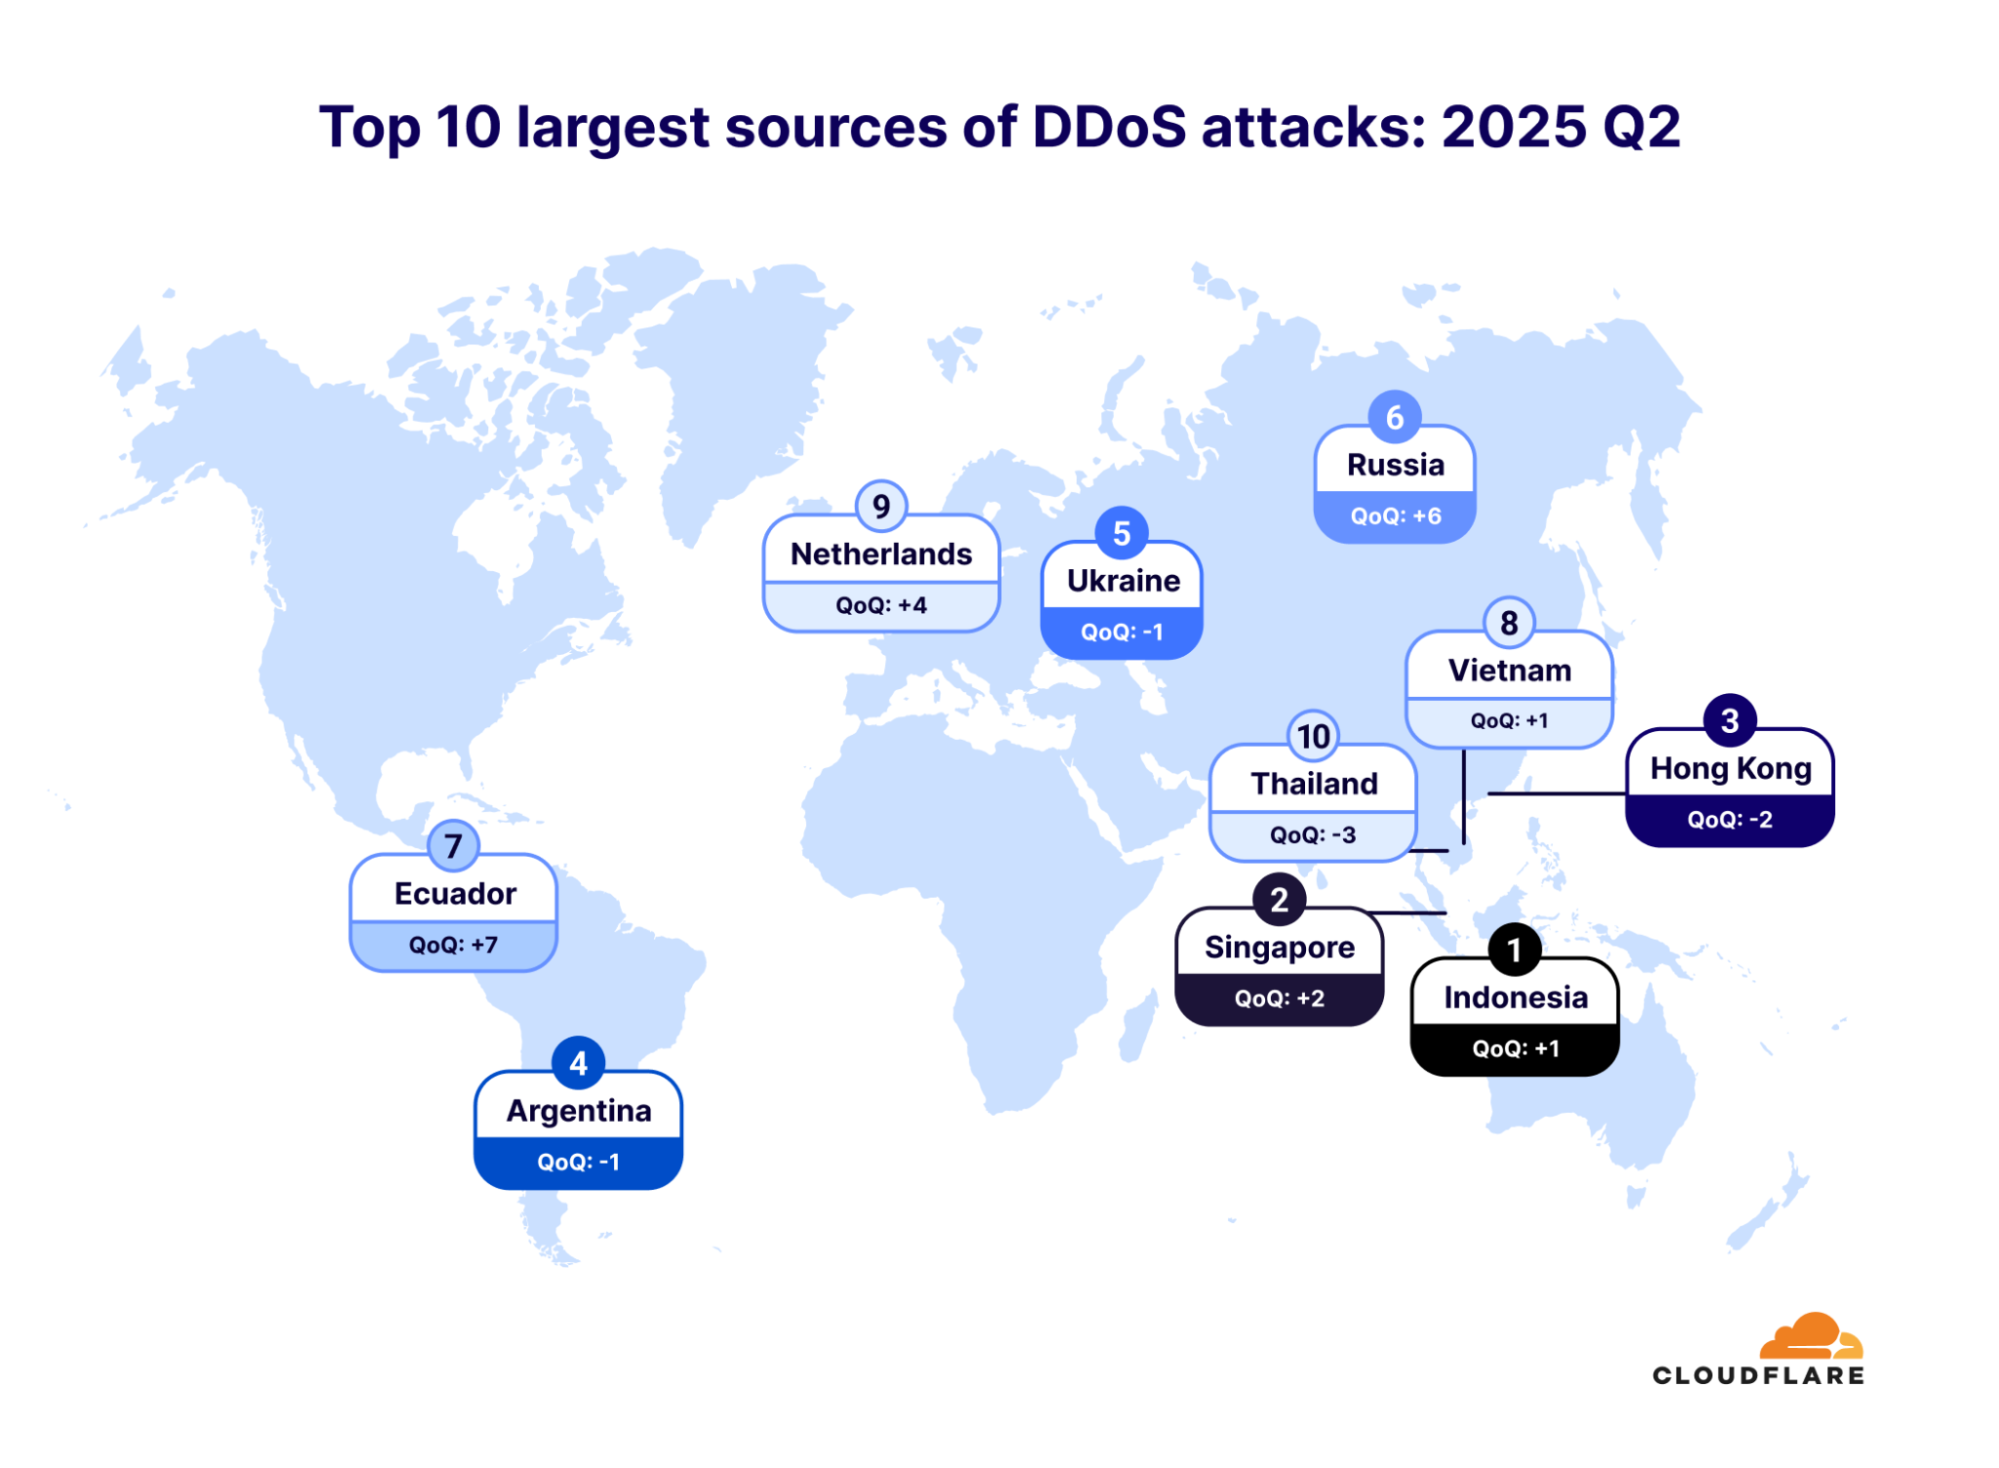
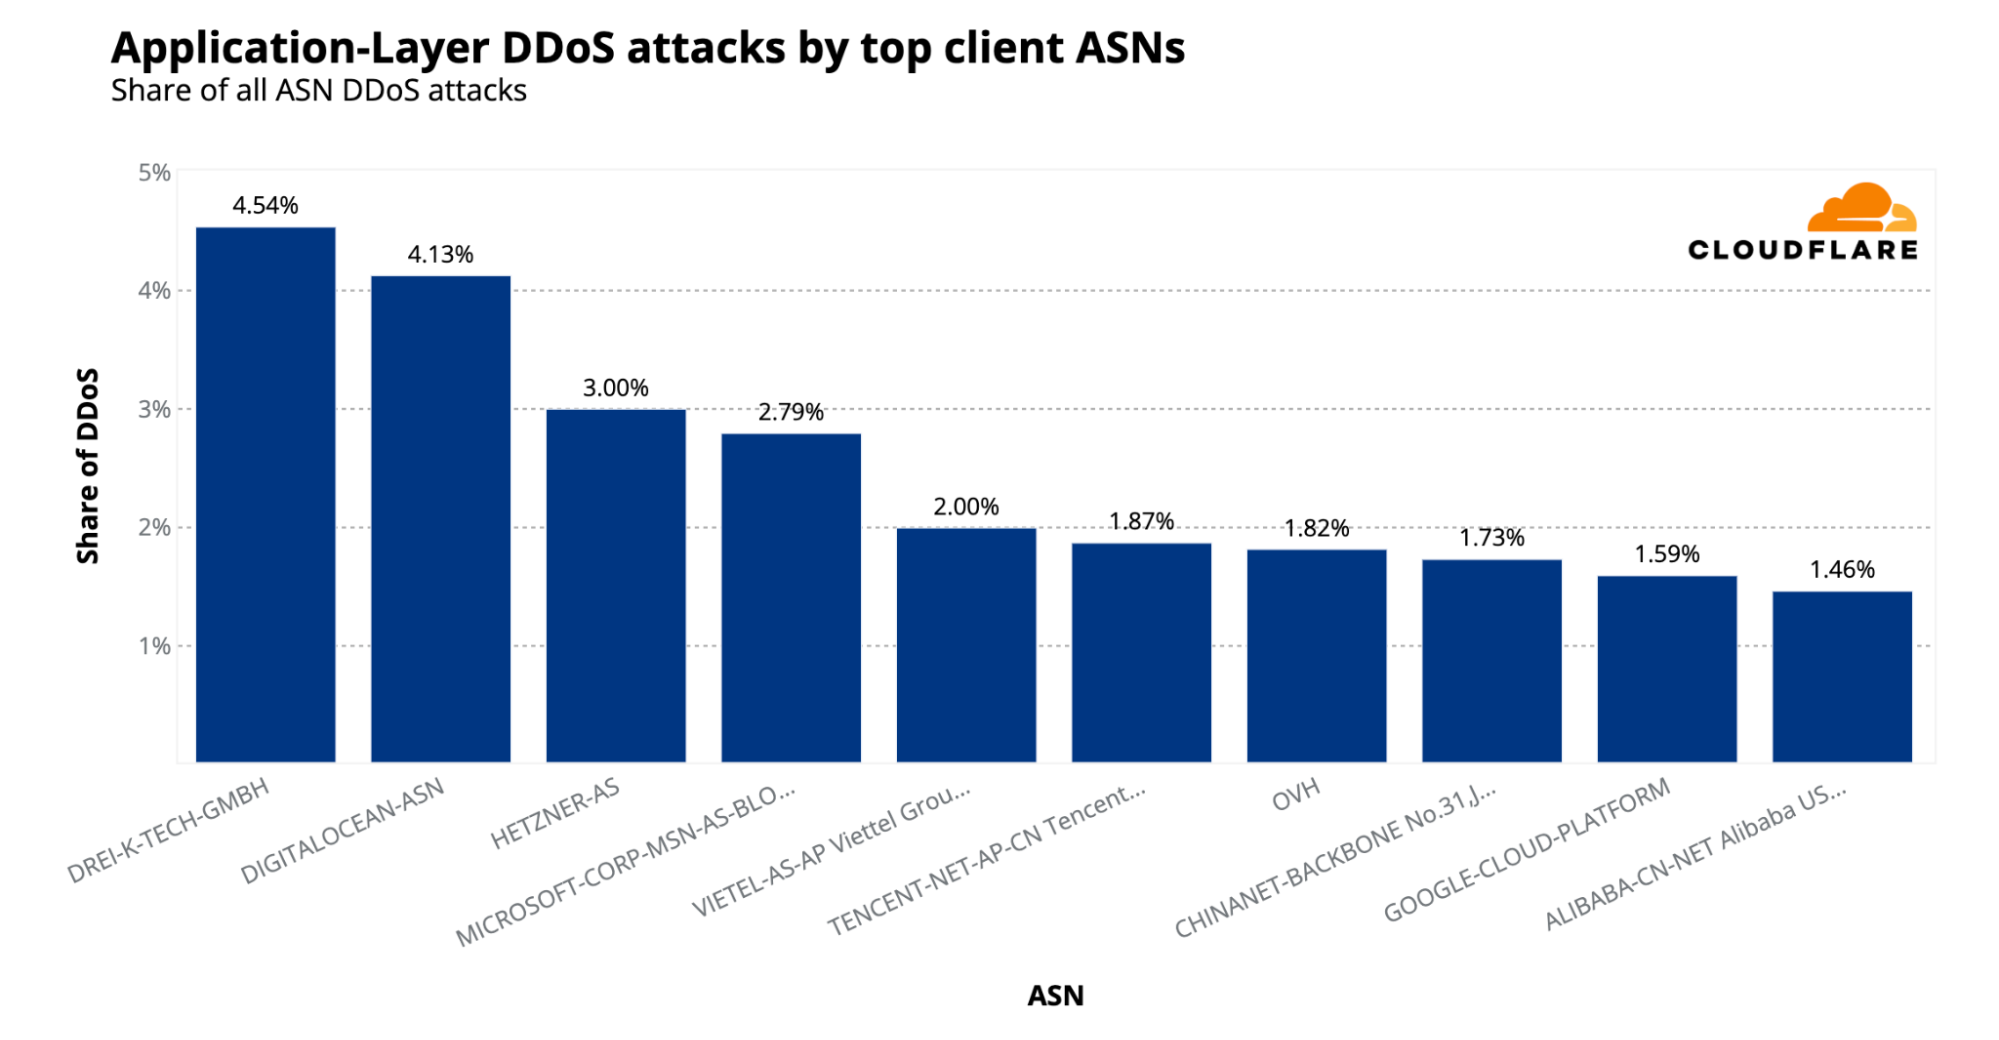
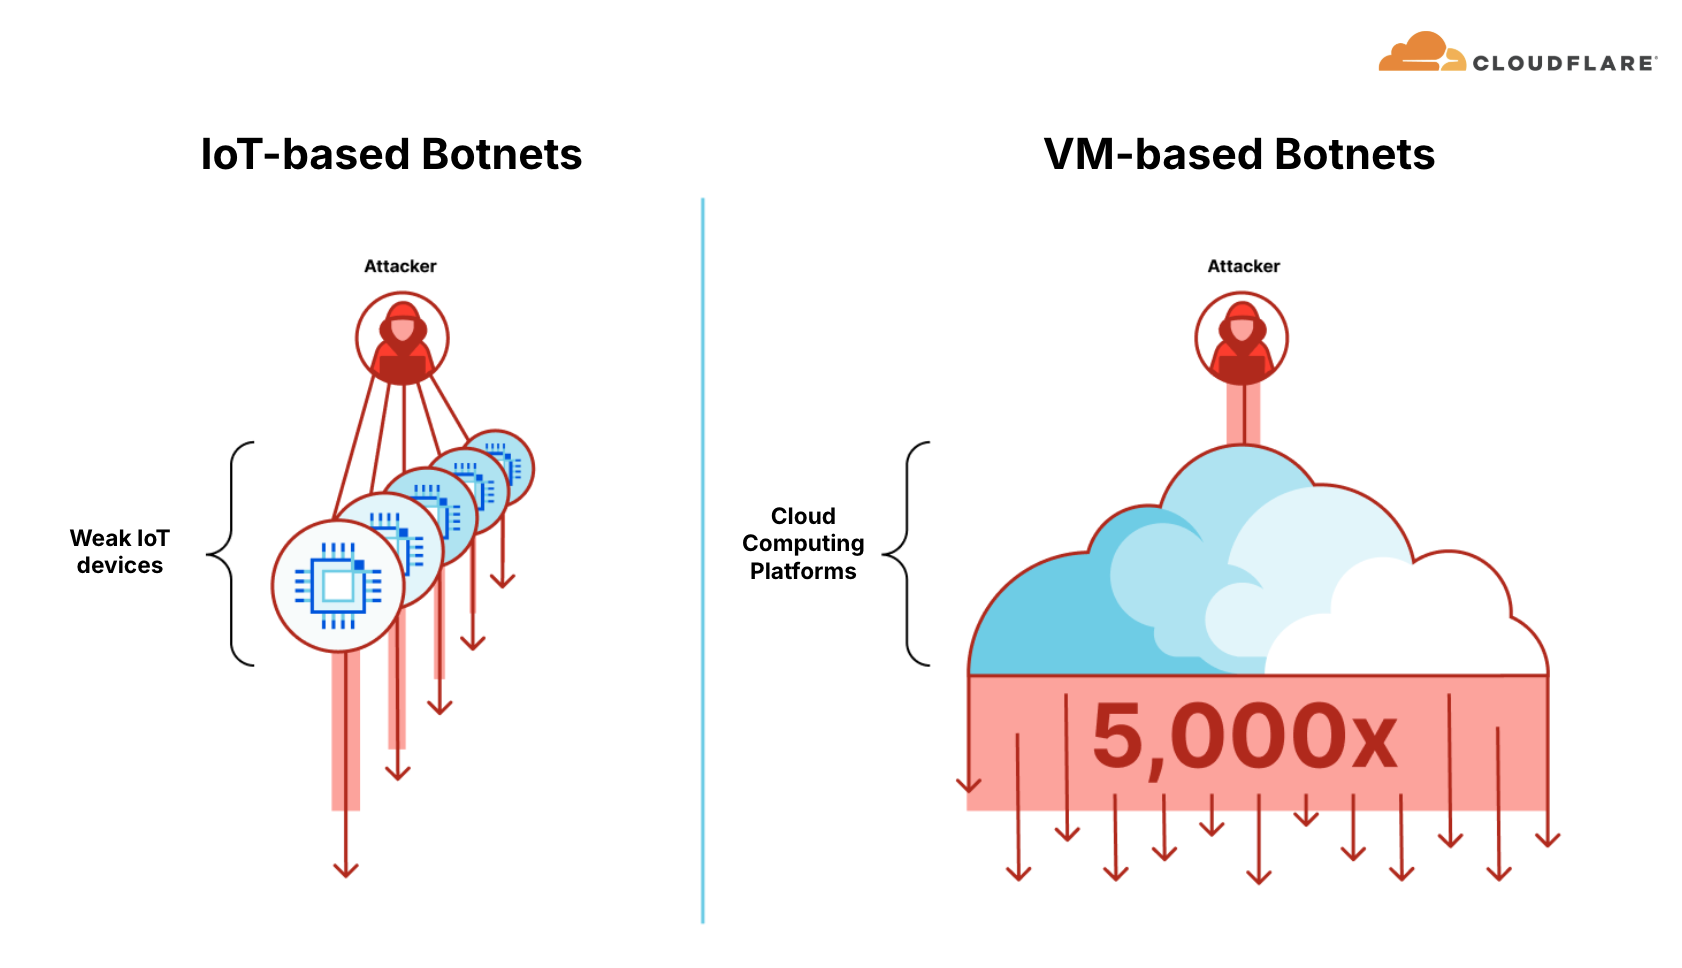
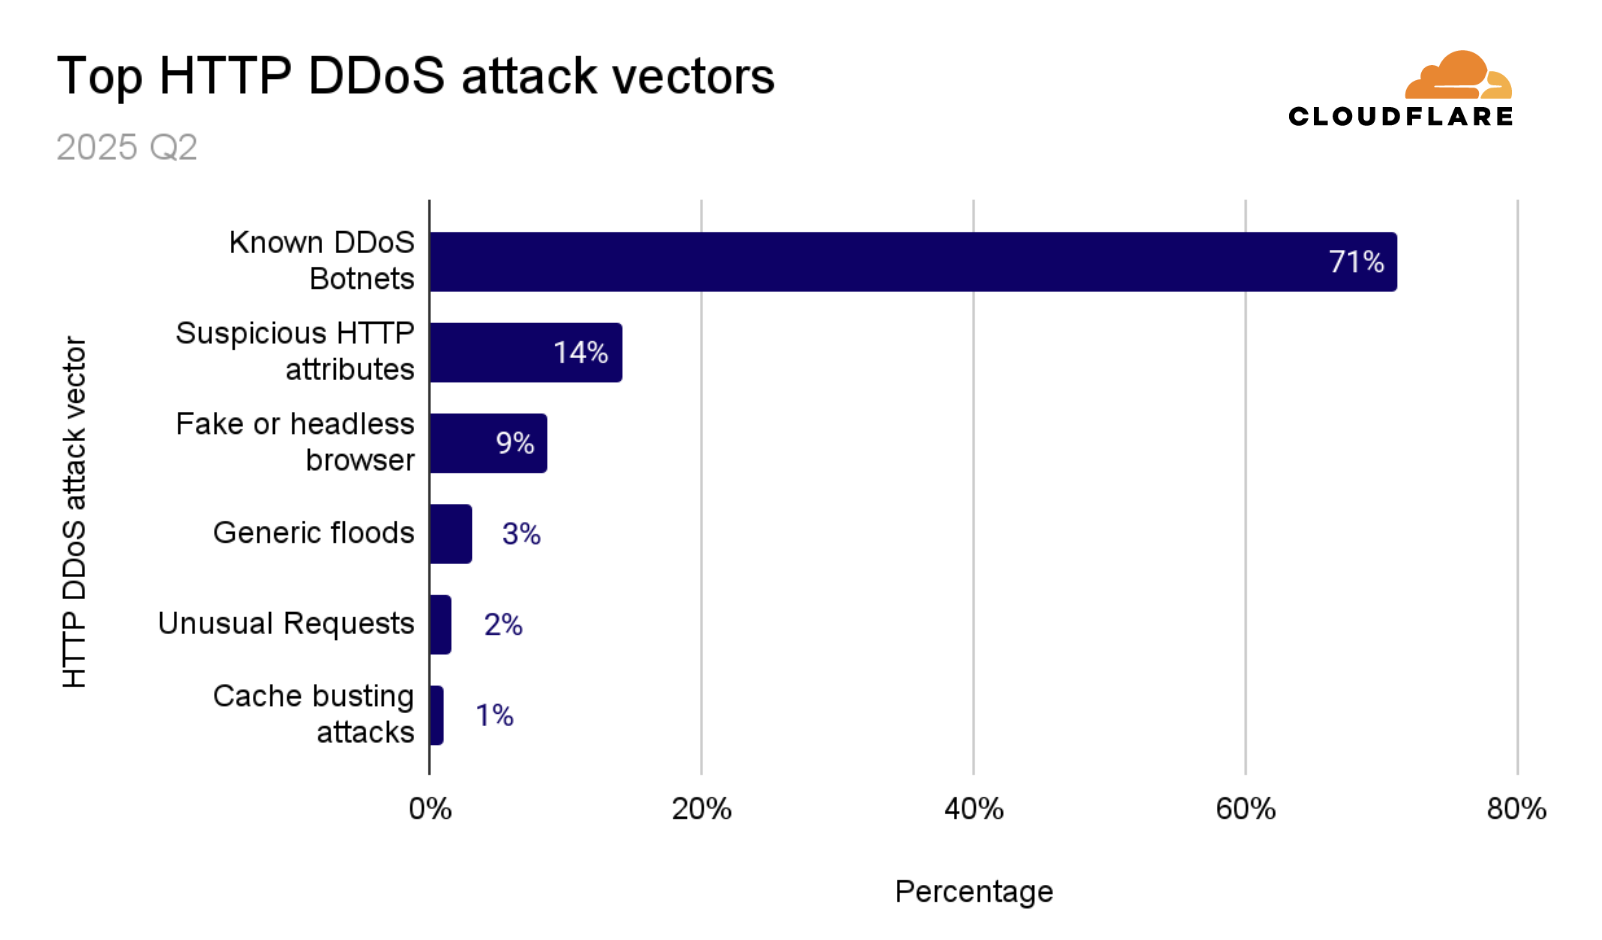
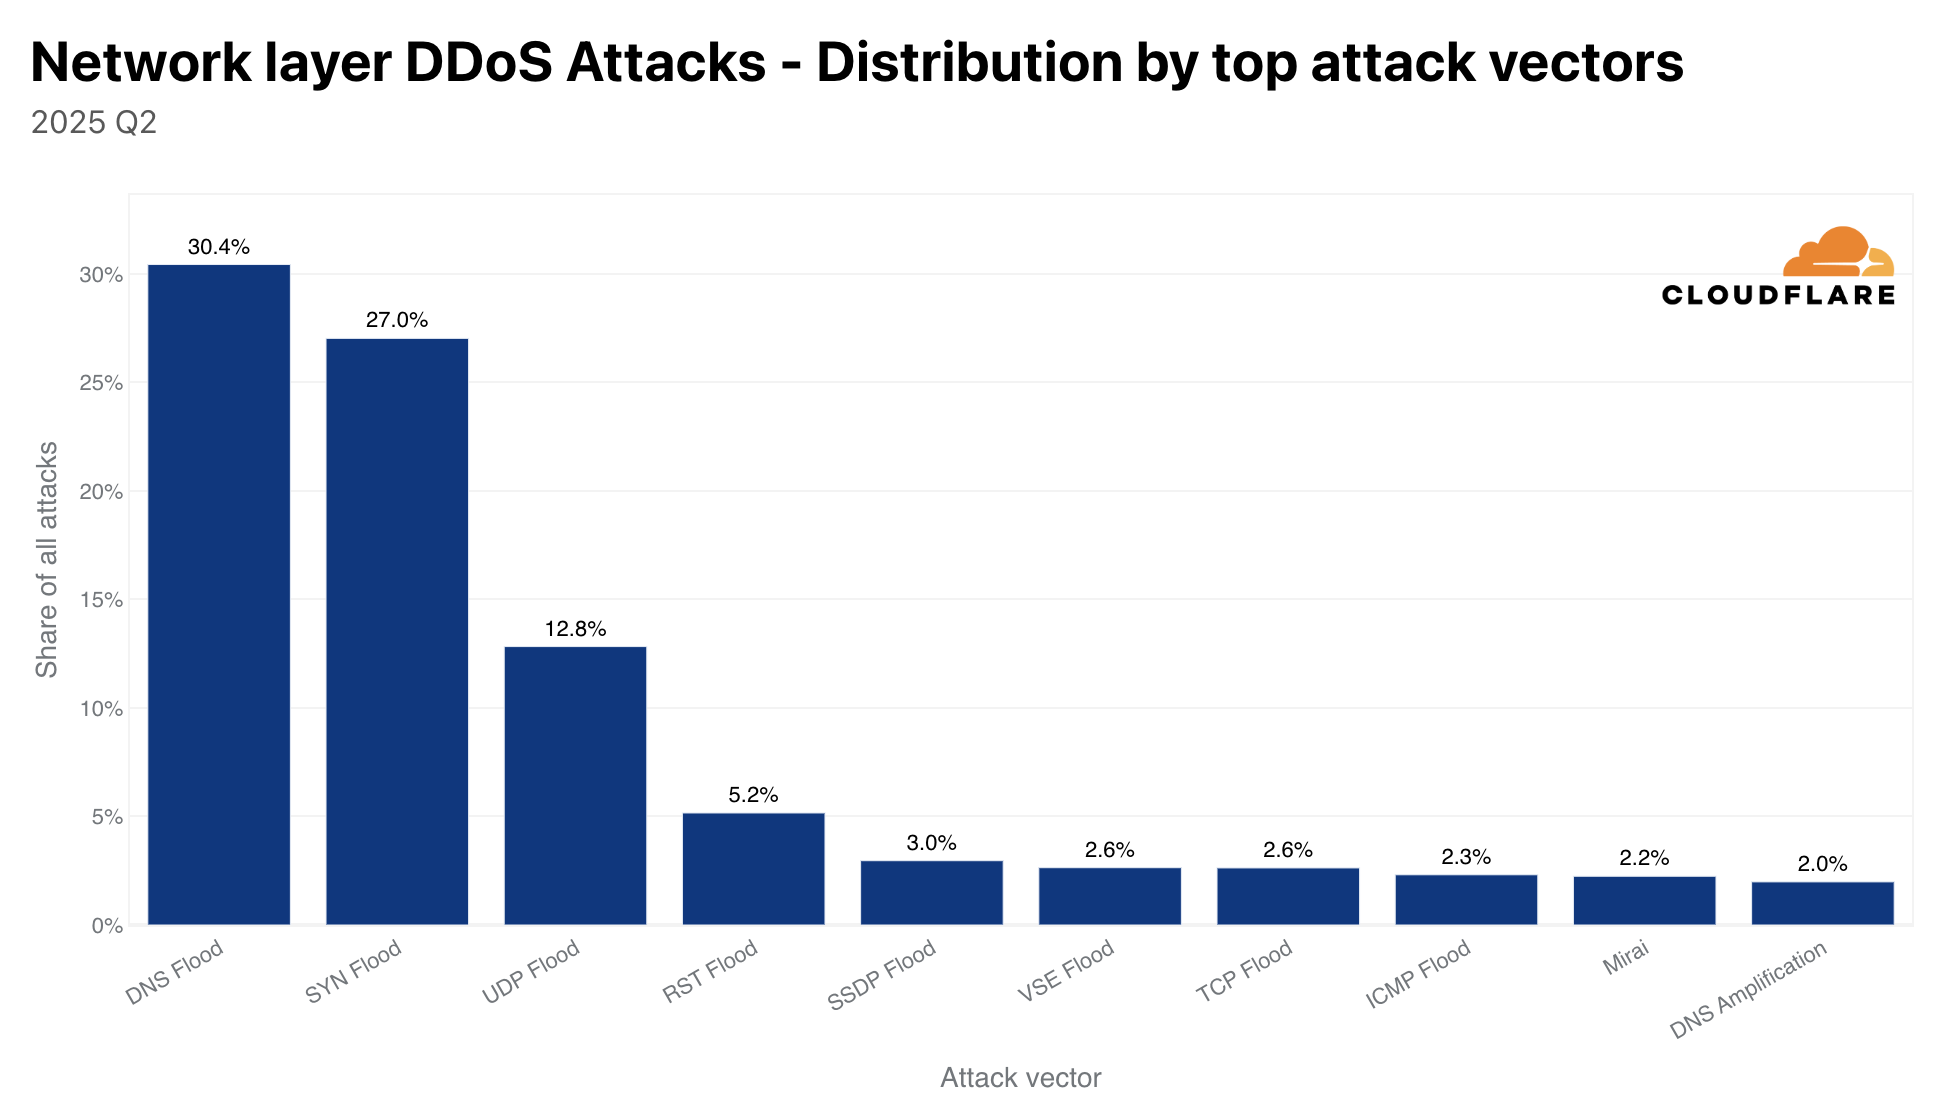
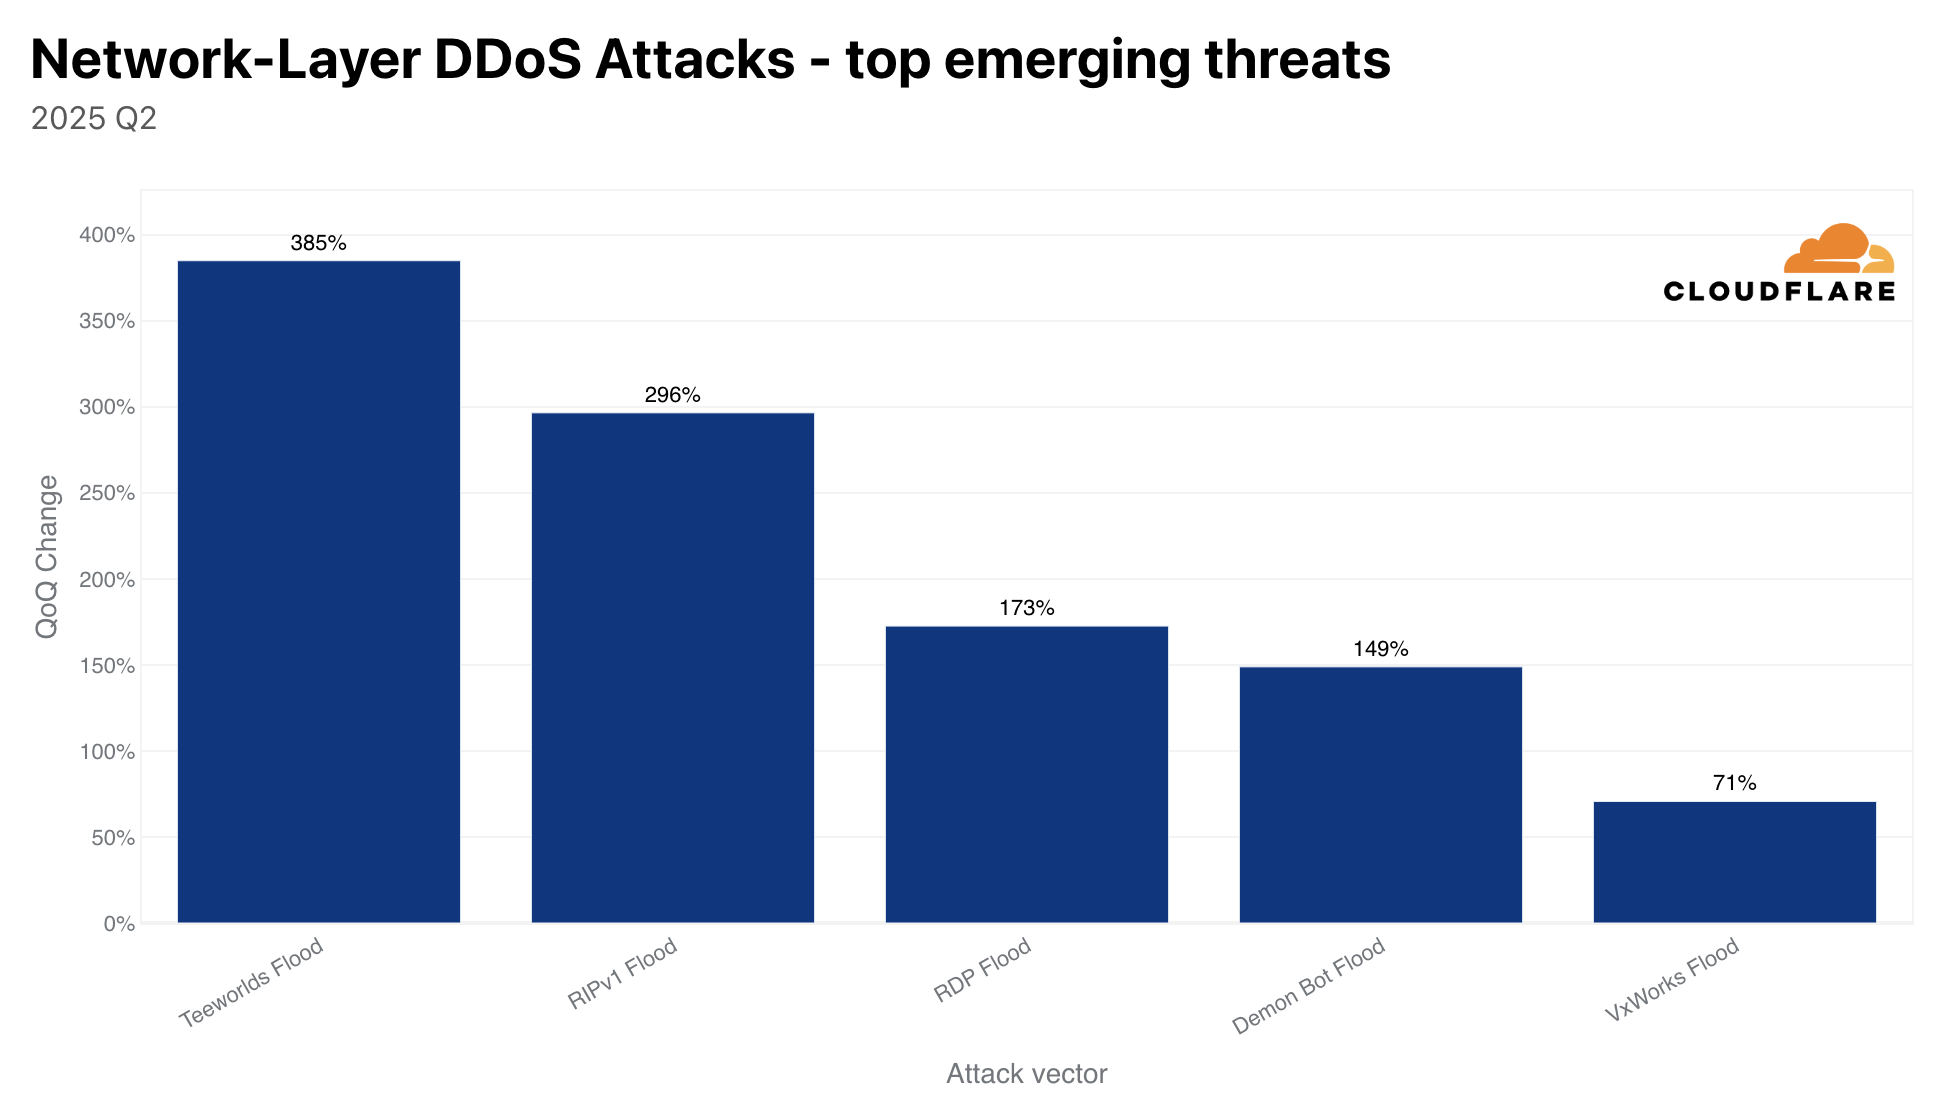

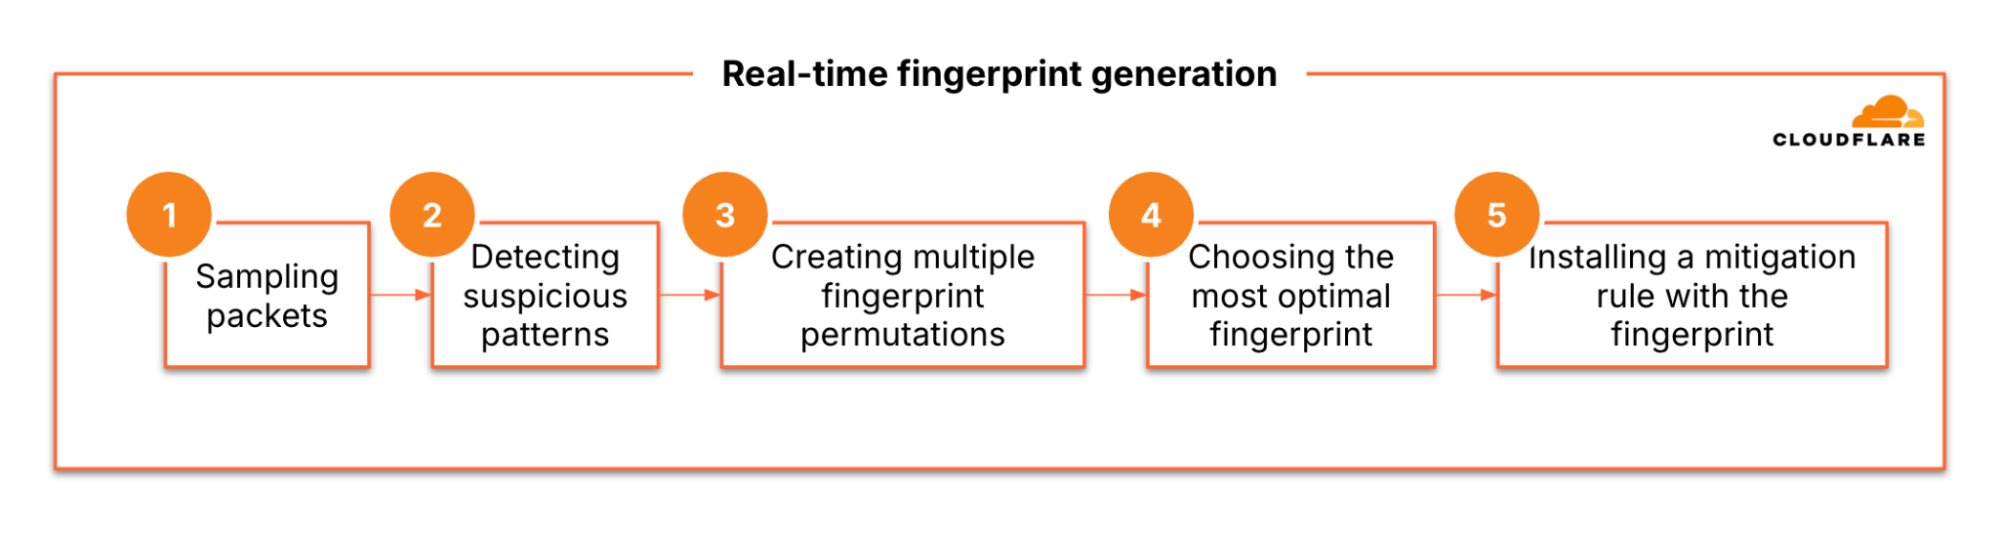
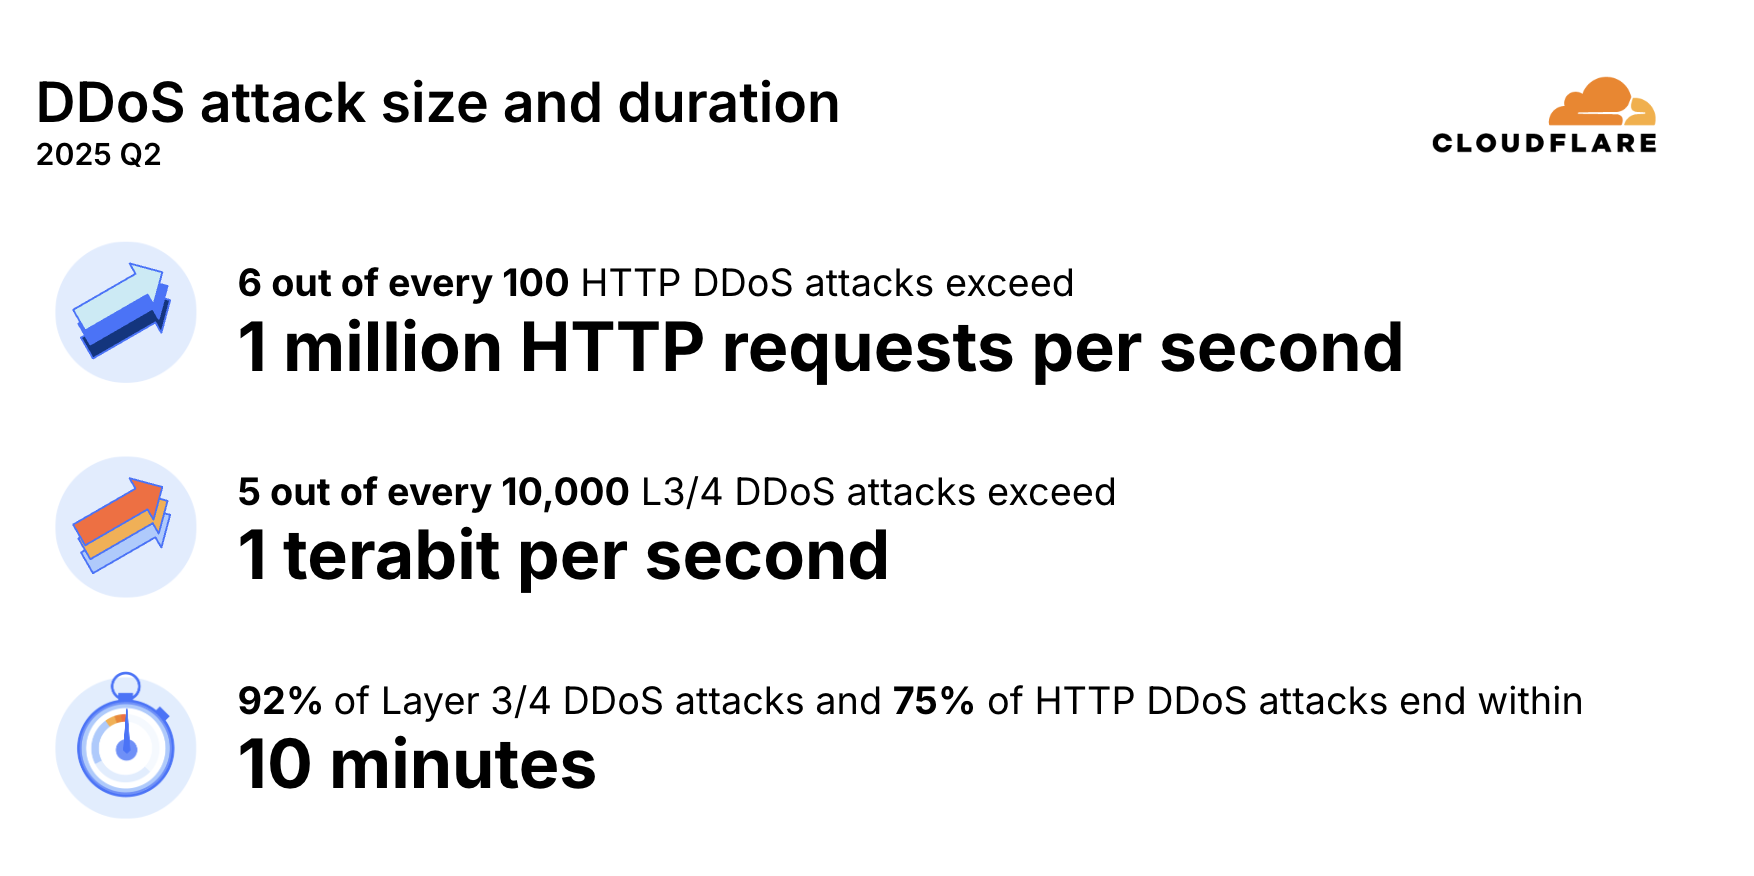
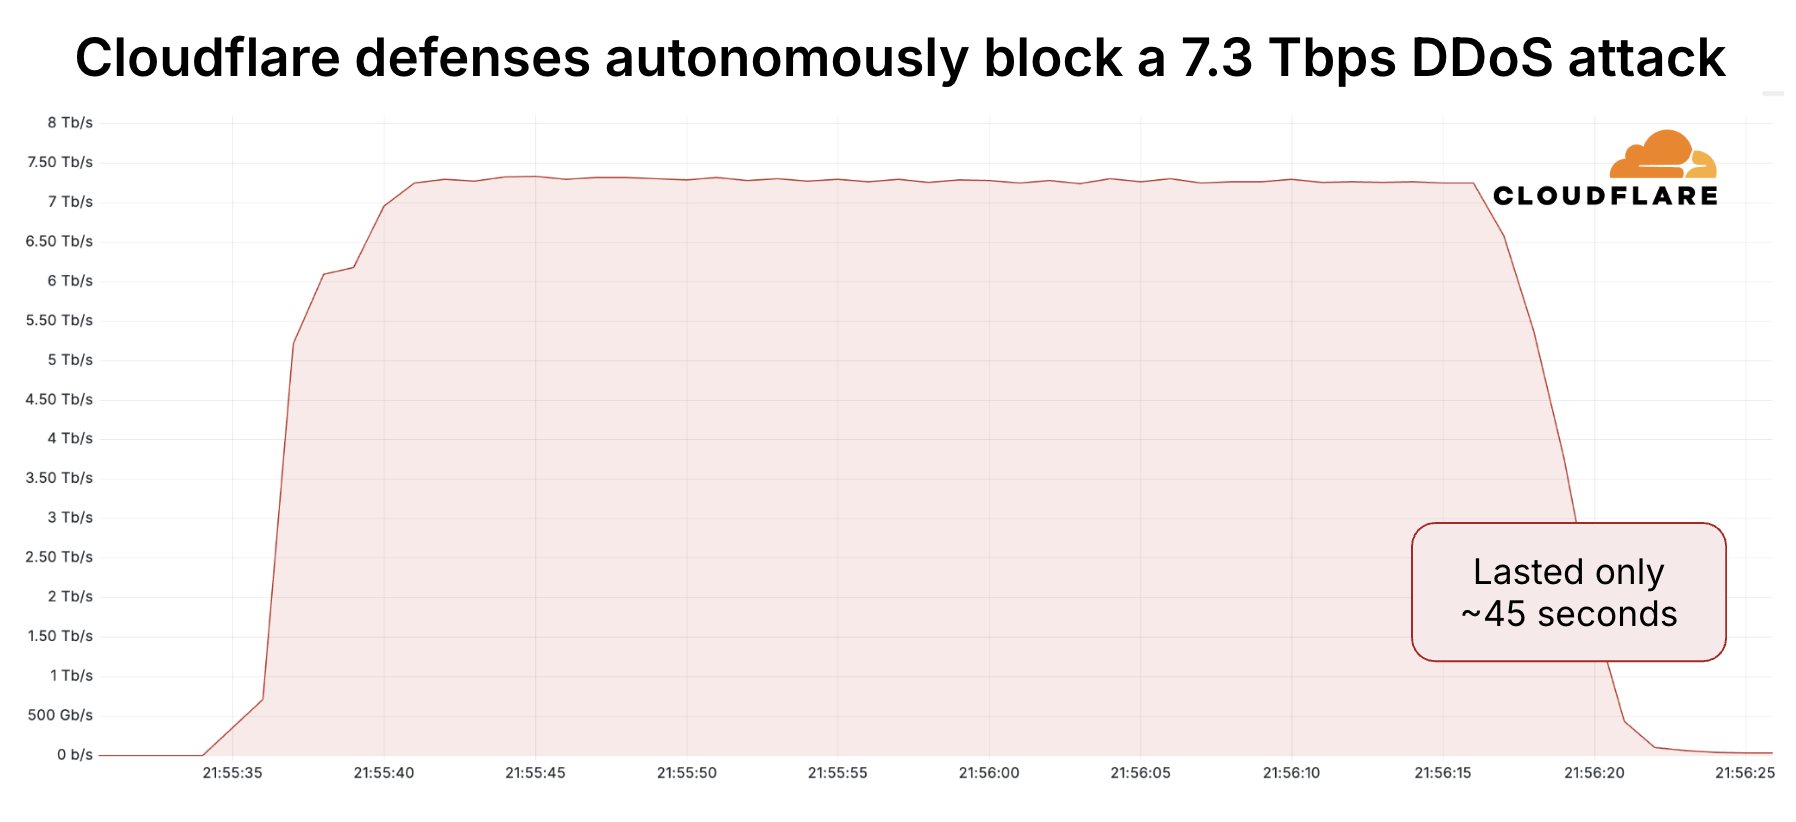

 Saeed Barghi is a Sr. Specialist Solutions Architect at Amazon Web Services (AWS) specializing in architecting enterprise data platforms and AI solutions. Based in Melbourne, Australia, Saeed works with public sector customers in Australia and New Zealand and helps his customers build fit-for-purpose and future-proof data platforms and AI solutions.
 Miroslaw (Mick) Mioduszewski is the Director of Analytics at Revenue NSW Department of Customer service in NSW. He held multiple C-level roles in private and public companies as well as government, e.g. COO and CIO, as well as serving as company director. Mick holds computer science and business degrees, is a fellow of the Australian Institute of Company Directors and an industry fellow at the University of technology, Sydney.
 Moha Alsouli is a Public Sector Solutions Architect at Amazon Web Services (AWS) in Sydney. He is dedicated to supporting state and local government customers deliver citizen services, through solution design, reviews, optimisation, and architecture guidance. Moha is also specialising in generative artificial intelligence (AI) on AWS.