The PineTime is an inexpensive
smartwatch developed by PINE64 that is
designed to run open-source operating systems. Despite its low cost, however,
it has most of the features expected from more expensive, proprietary
smartwatches. Because it runs open-source software, though, interested
developers
can add any other useful features that they dream up.
Както писа “Биволъ” (вижте долу) на 22 септември 2023 г., доклад на вътрешната Анкетна комисия на ПП “Зелено движение” (част от Обединение “Демократична България”), публикуван в сайта ни, разкрива сериозни…
The highly respected SC Awards program, hosted by SC Media, recognizes the solutions, organizations, and people driving innovation and success in information security. Now in its 26th year, the SC Awards continue to grow and evolve.
Rapid7 is proud to announce we have received not one, but two prestigious SC Awards this year! InsightVM is the 2023 SC Award recipient for Best Vulnerability Management Solution and InsightIDR received the award in the brand new Best Threat Detection Technology category.
This year, SC’s panel of independent industry leaders, from sectors including healthcare, financial services, manufacturing, consulting, and education sorted through a record number of entries. Additionally, SC added several new award categories and several modified categories to the competition.
Why InsightVM was selected
InsightVM is a vulnerability management tool that provides visibility into an organization’s security program, enabling security teams to reduce attack surface and security risk. The tool helps manage and mature vulnerability management programs by identifying vulnerabilities, prioritizing remediation efforts, and tracking progress against key metrics.
SC Media says InsightVM was selected for its ability to support the entire vulnerability management lifecycle and enabling security teams to manage their program more effectively. SC also noted the solution’s integration with Project Sonar for external-facing asset and threat exposure monitoring, as well as its robust tagging system to prioritize critical assets for remediation. Finally, they noted that live dashboards, Remediation Projects, and Goals and SLAs ease collaboration with stakeholders.
InsightVM was designed to provide a shared view and common language needed to collaborate with traditionally siloed teams and drive impactful remediation. As a result, easy collaboration stands out to customers as well.
“We’ve got at least five different teams that have responsibility for their own systems,” said Nick Defoe, Director of Information Security, US Signal. “Using the dashboard interface, we’ve been able to build out the reporting for each individual team. Getting these disparate groups all into one platform where they can see what they need to do for vulnerability management has been critical to our success.”
Why InsightIDR was selected
InsightIDR, Rapid7’s cloud-native XDR and next-gen SIEM, offers unified and transformed security data to detect real attacks and provide high-context insights to stop threats early in the attack chain.
According to SC Media, InsightIDR was selected because it empowers teams to deliver sophisticated detection and response outcomes with greater efficiency and efficacy, wherever they are in their security journey. This tracks with customers, as well.
In a recent Techvalidate survey, 92% of Rapid7 customers reported that InsightIDR creates efficiency and scale, and it offers savings that make it an accessible and robust solution for diverse industries and teams.
“When I put Rapid7 in place my response time went from three to four hours to ten to fifteen minutes,” said Kerry LeBlanc, IT Security Engineer, Bioventus. “I see what it is and how to remediate it. Everything is right there. I can query the endpoint or get information and pull up different things on the user.”
SC also noted InsightIDR’s “complete visibility, coverage, superior signal-to-noise, and smarter responses.” InsightIDR provides this complete visibility and coverage with a native endpoint agent, network sensors, collectors and APIs. Lightweight, software-based collection technology and integrations go beyond unifying data to correlate, attribute, and enrich diverse datasets into a single, harmonious picture — unlocking efficiency to give teams time back, ensure that they find real threats faster, and that they can respond quickly and completely.
License plate scanners aren’t new. Neither is using them for bulk surveillance. What’s new is that AI is being used on the data, identifying “suspicious” vehicle behavior:
Typically, Automatic License Plate Recognition (ALPR) technology is used to search for plates linked to specific crimes. But in this case it was used to examine the driving patterns of anyone passing one of Westchester County’s 480 cameras over a two-year period. Zayas’ lawyer Ben Gold contested the AI-gathered evidence against his client, decrying it as “dragnet surveillance.”
And he had the data to back it up. A FOIA he filed with the Westchester police revealed that the ALPR system was scanning over 16 million license plates a week, across 480 ALPR cameras. Of those systems, 434 were stationary, attached to poles and signs, while the remaining 46 were mobile, attached to police vehicles. The AI was not just looking at license plates either. It had also been taking notes on vehicles’ make, model and color—useful when a plate number for a suspect vehicle isn’t visible or is unknown.
Вътрешен доклад на Анкетна комисия в ПП “Зелено движение”, което е част от коалицията “Демократична България” разкрива сериозни нарушения в партийната финансова и кадрова дисциплина. “Биволъ” разполага с целия доклад…
This post is a deep dive into the design of Cedar, an open source language for writing and evaluating authorization policies. Using Cedar, you can control access to your application’s resources in a modular and reusable way. You write Cedar policies that express your application’s permissions, and the application uses Cedar’s authorization engine to decide which access requests to allow. This decouples access control from the application logic, letting you write, update, audit, and reuse authorization policies independently of application code.
Cedar’s authorization engine is built to a high standard of performance and correctness. Application developers report typical authorization latencies of less than 1 ms, even with hundreds of policies. The resulting authorization decision — Allow or Deny — is provably correct, thanks to the use of verification-guided development. This high standard means your application can use Cedar with confidence, just like Amazon Web Services (AWS) does as part of the Amazon Verified Permissions and AWS Verified Access services.
Cedar’s design is based on three core tenets: usability, speed, and safety. Cedar policies are intuitive to read because they’re defined using your application’s vocabulary—for example, photos organized into albums for a photo-sharing application. Cedar’s policy structure reflects common authorization use cases and enables fast evaluation. Cedar’s semantics are intuitive and safer by default: policies combine to allow or deny access according to rules you already know from AWS Identity and Access Management (IAM).
This post shows how Cedar’s authorization semantics, data model, and policy syntax work together to make the Cedar language intuitive to use, fast, and safe. We cover each of these in turn and highlight how their design reflects our tenets.
The Cedar authorization semantics: Default deny, forbid wins, no ordering
We show how Cedar works on an example application for sharing photos, called PhotoFlash, illustrated in Figure 1.
Figure 1: An example PhotoFlash account. User Jane has two photos, four albums, and three user groups
PhotoFlash lets users like Jane upload photos to the cloud, tag them, and organize them into albums. Jane can also share photos with others, for example, letting her friends view photos in her trips album. PhotoFlash provides a point-and-click interface for users to share access, and then stores the resulting permissions as Cedar policies.
When a user attempts to perform an action on a resource (for example, view a photo), PhotoFlash calls the Cedar authorization engine to determine whether access is allowed. The authorizer evaluates the stored policies against the request and application-specific data (such as a photo’s tags) and returns Allow or Deny. If it returns Allow, PhotoFlash proceeds with the action. If it returns Deny, PhotoFlash reports that the action is not permitted.
Let’s look at some policies and see how Cedar evaluates them to authorize requests safely and simply.
Default deny
To let Jane’s friends view photos in her trips album, PhotoFlash generates and stores the following Cedar permit policy:
// Policy A: Jane's friends can view photos in Jane's trips album.
permit(
  principal in Group::"jane/friends",
  action == Action::"viewPhoto",
  resource in Album::"jane/trips");
Cedar policies define who (the principal) can do what (the action) on what asset (the resource). This policy allows the principal (a PhotoFlash User) in Jane’s friends group to view the resources (a Photo) in Jane’s trips album.
Cedar’s authorizer grants access only if a request satisfies a specific permit policy. This semantics is default deny: Requests that don’t satisfy any permit policy are denied.
Given only our example Policy A, the authorizer will allow Alice to view Jane’s flower.jpg photo. Alice’s request satisfies Policy A because Alice is one of Jane’s friends (see Figure 1). But the authorizer will deny John’s request to view this photo. That’s because John isn’t one of Jane’s friends, and there is no other permit that grants John access to Jane’s photos.
Forbid wins
While PhotoFlash allows individual users to choose their own permissions, it also enforces system-wide security rules.
For example, PhotoFlash wants to prevent users from performing actions on resources that are owned by someone else and tagged as private. If a user (Jane) accidentally permits someone else (Alice) to view a private photo (receipt.jpg), PhotoFlash wants to override the user-defined permission and deny the request.
In Cedar, such guardrails are expressed as forbid policies:
// Policy B: Users can't perform any actions on private resources they don't own.
forbid(principal, action, resource)
when {
  resource.tags.contains("private") &&
  !(resource in principal.account)
};
This PhotoFlash policy says that a principal is forbidden from taking an action on a resource when the resource is tagged as private and isn’t contained in the principal’s account.
Cedar’s authorizer makes sure that forbids override permits. If a request satisfies a forbid policy, it’s denied regardless of what permissions are satisfied.
For example, the authorizer will deny Alice’s request to view Jane’s receipt.jpg photo. This request satisfies Policy A because Alice is one of Jane’s friends. But it also satisfies the guardrail in Policy B because the photo is tagged as private. The guardrail wins, and the request is denied.
No ordering
Cedar’s authorization decisions are independent of the order the policies are evaluated in. Whether the authorizer evaluates Policy A first and then Policy B, or the other way around, doesn’t matter. As you’ll see later, the Cedar language design ensures that policies can be evaluated in any order to reach the same authorization decision. To understand the combined meaning of multiple Cedar policies, you need only remember that access is allowed if the request satisfies a permit policy and there are no applicable forbid policies.
Safe by default and intuitive
We’ve proved (using automated reasoning) that Cedar’s authorizer satisfies the default deny, forbids override permits, and order independence properties. These properties help make Cedar’s behavior safe by default and intuitive. Amazon IAM has the same properties. Cedar builds on more than a decade of IAM experience by formalizing and enforcing these properties as parts of its design.
Now that we’ve seen how Cedar authorizes requests, let’s look at how its data model and syntax support writing policies that are quick to read and evaluate.
The Cedar data model: entities with attributes, arranged in a hierarchy
Cedar policies are defined in terms of a vocabulary specific to your application. For example, PhotoFlash organizes photos into albums and users into groups while a task management application organizes tasks into lists. You reflect this vocabulary into Cedar’s data model, which organizes entities into a hierarchy. Entities correspond to objects within your application, such as photos and users. The hierarchy reflects grouping of entities, such as nesting of photos into albums. Think of it as a directed-acyclic graph. Figure 2 shows the entity hierarchy for PhotoFlash that matches Figure 1.
Figure 2: An example hierarchy for PhotoFlash, matching the illustration in Figure 1
Entities are stored objects that serve as principals, resources, and actions in Cedar policies. Policies refer to these objects using entity references, such as Album::”jane/art”.
Policies use the in operator to check if the hierarchy relates two entities. For example, Photo::”flower.jpg” in Account::”jane” is true for the hierarchy in Figure 2, but Photo::”flower.jpg” in Album::”jane/conference” is not. PhotoFlash can persist the entity hierarchy in a dedicated entity store, or compute the relevant parts as needed for an authorization request.
Each entity also has a record that maps named attributes to values. An attribute stores a Cedar value: an entity reference, record, string, 64-bit integer, boolean, or a set of values. For example, Photo::”flower.jpg” has attributes describing the photo’s metadata, such as tags, which is a set of strings, and raw, which is an entity reference to another Photo. Cedar supports a small collection of operators that can be applied to values; these operators are carefully chosen to enable efficient evaluation.
Built-in support for role and attribute-based access control
If the concepts you’ve seen so far seem familiar, that’s not surprising. Cedar’s data model is designed to allow you to implement time-tested access control models, including role-based and attribute-based access control (RBAC and ABAC). The entity hierarchy and the in operator support RBAC-style roles as groups, while entity records and the . operator let you express ABAC-style permissions using per-object attributes.
The Cedar syntax: Structured, loop-free, and stateless
Cedar uses a simple, structured syntax for writing policies. This structure makes Cedar policies simple to understand and fast to authorize at scale. Let’s see how by taking a closer look at Cedar’s syntax.
Structure for readability and scalable authorization
Figure 3 illustrates the structure of Cedar policies: an effect and scope, optionally followed by one or more conditions.
The effect of a policy is to either permit or forbid access. The scope can use equality (==) or membership (in) constraints to restrict the principals, actions, and resources to which the policy applies. Policy conditions are expressions that further restrict when the policy applies.
This structure makes policies straightforward to read and understand: The scope expresses an RBAC rule, and the conditions express ABAC rules. For example, PhotoFlash Policy A has no conditions and expresses a single RBAC rule. Policy B has an open (unconstrained) scope and expresses a single ABAC rule. A quick glance is enough to see if a policy is just an RBAC rule, just an ABAC rule, or a mix of both.
Figure 3: Cedar policy structure, illustrated on PhotoFlash Policy A and B
Scopes also enable scalable authorization for large policy stores through policy slicing. This is a property of Cedar that lets applications authorize a request against a subset of stored policies, supporting real-time decisions even for stores with thousands of policies. With slicing, an application needs to pass a policy to the authorizer only when the request’s principal and resource are descendants of the principal and resource entities specified in the policy’s scope. For example, PhotoFlash needs to include Policy A only for requests that involve the descendants of Group::”jane/friends” and Album::”jane/trips”. But Policy B must be included for all requests because of its open scope.
No loops or state for fast evaluation and intuitive decisions
Policy conditions are Boolean-valued expressions. The Cedar expression language has a familiar syntax that includes if-then-else expressions, short-circuiting Boolean operators (!, &&, ||), and basic operations on Cedar values. Notably, there is no way to express looping or to change the application state (for example, mutate an attribute).
Cedar excludes loops to bound authorization latency. With no loops or costly built-in operators, Cedar policies terminate in O(n2) steps in the worst case (when conditions contain certain set operations), or O(n) in the common case.
Cedar also excludes stateful operations for performance and understandability. Since policies can’t change the application state, their evaluation can be parallelized for better performance, and you can reason about them in any order to see what accesses are allowed.
Learn more
In this post, we explored how Cedar’s design supports intuitive, fast, and safe authorization. With Cedar, your application’s access control rules become standalone policies that are clear, auditable, and reusable. You enforce these policies by calling Cedar’s authorizer to decide quickly and safely which requests are allowed. To learn more, see how to use Cedar to secure your app, and how we built Cedar to a high standard of assurance. You can also visit the Cedar website and blog, try it out in the Cedar playground, and join us on Cedar’s Slack channel.
If you have feedback about this post, submit comments in the Comments section below. If you have questions about this post, contact AWS Support.
Want more AWS Security news? Follow us on Twitter.
In a few days, I will board a plane towards the south. My tour around Latin America starts. But I won’t be alone in this adventure, you can find some other News Blog authors, like Jeff or Seb, speaking at AWS Community Days and local events in Peru, Argentina, Chile, and Uruguay. If you see us, come and say hi. We would love to meet you.
Last Week’s Launches Here are some launches that got my attention during the previous week.
AWS AppSync now supports JavaScript for all resolvers in GraphQL APIs – Last year, we announced that AppSync now supports JavaScript pipeline resolvers. And starting last week, developers can use JavaScript to write unit resolvers, pipeline resolvers, and AppSync functions that are run on the AppSync Javascript runtime.
AWS CodePipeline now supports GitLab – Now you can use your GitLab.com source repository to build, test, and deploy code changes using AWS CodePipeline, in addition to other providers like AWS CodeCommit, Bitbucket, GitHub.com, and GitHub Enterprise Server.
New instance types: Amazon EC2 M7a and Amazon EC2 Hpc7a – The new Amazon EC2 M7a is a general purpose instance type powered by 4th Gen AMD EPYC processor. In the announcement blog, you can find all the specifics for this instance type. The new Amazon EC2 Hpc7a instances are also powered by 4th Gen AMD EPYC processors. These instance types are optimized for high performance computing and Channy Yun wrote a blog post describing the different characteristics of the Amazon EC2 Hpc7a instance type.
AWS DeepRacer Educator Playbooks – Last week we introduced the AWS DeepRacer educator playblooks, these are a tool for educators to integrate foundational machine learning (ML) curriculum and labs into their classrooms. Educators can use these playbooks to easily upskill students in the basics of ML with autonomous vehicles.
The Official AWS Podcast – Listen each week for updates on the latest AWS news and deep dives into exciting use cases. There are also official AWS podcasts in several languages. Check out the ones in French, German, Italian, and Spanish.
AWS Open-Source News and Updates – This is a newsletter curated by my colleague Ricardo to bring you the latest open source projects, posts, events, and more.
Upcoming AWS Events Check your calendars and sign up for these AWS events:
JoinAWS Hybrid Cloud & Edge Day to learn how to deploy your applications in the everywhere cloud
AWS Global Summits – The 2023 AWS Summits season is almost ending with the last two in-person events in Mexico City (August 30) and Johannesburg (September 26).
AWS re:Invent(November 27–December 1) – But don’t worry because re:Invent season is coming closer. Join us to hear the latest from AWS, learn from experts, and connect with the global cloud community. Registration is now open.
AWS Community Days– Join a community-led conference run by AWS user group leaders in your region:Taiwan (August 26), Aotearoa (September 6), Lebanon (September 9), Munich (September 14), Argentina (September 16), Spain (September 23), and Chile (September 30). Check all the upcoming AWS Community Days here.
CDK Day (September 29) – A community-led fully virtual event with tracks in English and in Spanish about CDK and related projects. Learn more in the website.
That’s all for this week. Check back next Monday for another Week in Review!
Amazon OpenSearch Service is a managed service that makes it easy to deploy, operate, and scale OpenSearch clusters in AWS to perform interactive log analytics, real-time application monitoring, website search, and more. OpenSearch is an open source, distributed search and analytics suite.
When working with OpenSearch Service, shard strategy is key. Shards distribute your workload across the data nodes of your cluster. When creating an index, you tell OpenSearch Service how many primary shards to create and how many replicas to create of each shard. The primary shards are independent partitions of the full dataset. OpenSearch Service automatically distributes your data across the primary shards in an index. Our recommendation is to use two replicas for your index. For example, if you set your index’s shard count to three primary shards and two replicas, you will have a total of nine shards. Properly configured indexes can help boost overall domain performance, whereas a misconfigured index will lead to storage and performance skew.
OpenSearch Service distributes the shards in your indexes to the data nodes in your domain, ensuring that no primary shard and its replicas are placed on the same node. The data for the shards are stored in the node’s storage. If your indexes (and therefore their shards) are very different sizes, the storage used on the data nodes in the domain will be unequal, or skewed. Storage skew leads to uneven memory and CPU utilization, intermittent and uneven latency, and uneven queueing and rejecting of requests. Therefore, it’s important to configure and maintain indexes such that shards can be distributed evenly across the data nodes of your cluster.
In this post, we explore how to deploy Amazon CloudWatch metrics using an AWS CloudFormation template to monitor an OpenSearch Service domain’s storage and shard skew. This solution uses an AWS Lambda function to extract storage and shard distribution metadata from your OpenSearch Service domain, calculates the level of skew, and then pushes this information to CloudWatch metrics so that you can easily monitor, alert, and respond.
Solution overview
The solution and associated resources are available for you to deploy into your own AWS account as a CloudFormation template. The template deploys the following resources:
An AWS Identity and Access Management (IAM) role for the Lambda function called OpensearchSkewMetricsLambdaRole. This allows write access to CloudWatch metrics and access to the CloudWatch log group and OpenSearch APIs.
An AWS Lambda function called Opensearch-SkewMetricsPublisher-py.
An Amazon CloudWatch log group for the Lambda function called /aws/lambda/Opensearch-skewmetrics-publisher-py.
This post requires you to add a Lambda role to the OpenSearch Service domain’s security configuration access policy. If your domain is using fine-grained access control, then you need to follow the steps as described in the section Mapping roles to users to enable access for the newly deployed Lambda execution role to the domain after deploying the CloudFormation template.
Deploy the CloudFormation template
To deploy the CloudFormation template, complete the following steps:
Select the Region where you’re running your OpenSearch Service domain.
To launch your CloudFormation stack, choose Launch Stack
For Stack name, enter a name for the stack (maximum length 30 characters).
For MetricIdentifier, enter a unique identifier that will help you identify the custom CloudWatch metrics for your domain.
For OpensearchDomainURL, enter the domain endpoint that you are monitoring.
Choose Next.
Select I acknowledge that AWS CloudFormation might create IAM resources, then choose Create stack.
Wait for the stack creation to complete.
On the Lambda console, choose Functions in the navigation pane.
Choose the Lambda function called Opensearch-SkewMetricsPublisher-py-<stackname>.
In the Code section, choose Test.
Keep the default values for the test event and run a quick test.
Make sure to grant the Lambda execution role permission to the OpenSearch Service domain’s resource-based policy, if you are using one. If fine-grained access control is enabled on the domain, then follow the steps in Mapping roles to users (as mentioned in the prerequisites) to allow the Lambda function to read from the domain in read-only access.
The Lambda function that sends OpenSearch domain metrics to CloudWatch is set to a default frequency of 1 day. You can change this configuration to monitor the domain at the required granularity by updating the event schedule for the rule deployed by the CloudFormation stack on the EventBridge console. Note that if the frequency is set to 1 minute, this will trigger the Lambda function every minute and will increase the Lambda cost.
This solution uses the cat/allocation API, which provides the number of data nodes in the domain along with each data node’s number of shards and storage usage attributes. For further details on domain storage and shard skew, refer to Node shard and storage skew. The Lambda function processes and sorts each data node’s storage and shard skew from the average value. Any data node’s skew above 10% from the average is generally considered to be significantly skewed. This will start to impact CPU, network, and disk bandwidth usage because the nodes with the highest storage utilization tend to be the resource-strained nodes, whereas nodes with less than 10% usage represent underutilized capacity.
Refer to Demystifying Elasticsearch shard allocation for details related to shard size and shard count strategy. In general, we recommend keeping shard sizes between 10–30 GB for workloads where search latency is a key performance objective and 30–50 GB for write-heavy workloads. For shard count, we recommend maintaining index shard counts that are divisible by the data node count. For additional details, refer to Sizing Amazon OpenSearch Service domains and Shard strategy.
View skew metrics in CloudWatch
After you run this solution in your account, it will create two CloudWatch metrics for monitoring. To access these CloudWatch metrics, use the following steps:
On the CloudWatch console, under Metrics in the navigation pane, choose All metrics.
Choose Browse and select Custom namespaces. You should see two custom metrics ending with _storageworkspace and _shardworkspace, respectively.
Choose either of the custom metrics and then select NodeID.
On the list of node IDs, select all the nodes displayed in the list, and the graph will be plotted automatically.
You can hover the mouse over the plotted lines to see the node skew information.
The following screenshots show examples of how the CloudWatch metrics will appear on the console.
The storage skew metrics will be similar to the following screenshot. Storage skew metrics shows the domain storage skew. If you hover over the graph, it shows the node list with available nodes in the domain. This list is sorted by the storage size (largest to smallest). The Lambda function will periodically post the latest storage skew results.
The shard skew metrics will be similar to the following screenshot. Shard skew metrics show the domain shard skew. If you hover over the graph, it shows the node list with available nodes in the domain. This list is sorted by the shard size (largest to smallest). The Lambda function will periodically post the latest storage skew results.
Storage skew occurs when one or more nodes within the domain has significantly more storage than other nodes. The CloudWatch metric will show higher deviation of storage usage for these nodes vs. other nodes. Similarly, shard skew occurs when one or more nodes has significantly more shards than others nodes. The CloudWatch metric will show higher deviation for these nodes vs. other nodes in the domain. When the domain storage or shard skew is detected, you can raise a support case to work with the AWS team for remediation actions. See How do I rebalance the uneven shard distribution in my Amazon OpenSearch Service cluster for information on how to take remediation actions to configure your domain shard strategy for optimal performance.
Costs
The cost associated with using this solution would be minimal, around few cents per month since it generates CloudWatch metrics. The solution also runs Lambda code, and in this case the Lambda functions make API calls. For pricing details, refer to Amazon CloudWatch Pricing and AWS Lambda Pricing.
Clean up
If you decide that you no longer want to keep the Lambda function and associated resources, you can navigate to the AWS CloudFormation console, choose the stack, and choose Delete.
If you want to add the CloudWatch skew monitor metrics mechanism back in at any point, you can create the stack again from the CloudFormation template.
Conclusion
You can use this solution to get a better understanding of your OpenSearch Service domain’s storage and shard skew to improve its performance and possibly lower the cost of operating your domain. See Use Elasticsearch’s _rollover API For efficient storage distribution for more details related to shard allocation and efficient storage distribution strategy.
About the authors
Nikhil Agarwal is Sr. Technical Manager with Amazon Web Services. He is passionate about helping customers achieve operational excellence in their cloud journey and working activity on technical solutions. He is also AI/ML enthusiastic and deep dives into customer’s ML-specific use cases. Outside of work, he enjoys traveling with family and exploring different gadgets.
Karthik Chemudupati is a Principal Technical Account Manager (TAM) with AWS, focused on helping customers achieve cost optimization and operational excellence. He has more than 19 years of IT experience in software engineering, cloud operations and automations. Karthik joined AWS in 2016 as a TAM and worked with more than dozen Enterprise Customers across US-West. Outside of work, he enjoys spending time with his family.
Gene Alpert is a Senior Analytics Specialist with AWS Enterprise Support. He has been focused on our Amazon OpenSearch Service customers and ecosystem for the past three years. Gene joined AWS in 2017. Outside of work he enjoys mountain biking, traveling, and playing Population:One in VR.
The open source Git project just released Git 2.42 with features and bug fixes from over 78 contributors, 17 of them new. We last caught up with you on the latest in Git back when 2.41 was released.
To celebrate this most recent release, here’s GitHub’s look at some of the most interesting features and changes introduced since last time.
Faster object traversals with bitmaps
Many long-time readers of these blog posts will recall our coverage of reachability bitmaps. Most notably, we covered Git’s new multi-pack reachability bitmaps back in our coverage of the 2.34 release towards the end of 2021.
If this is your first time here, or you need a refresher on reachability bitmaps, don’t worry. Reachability bitmaps allow Git to quickly determine the result set of a reachability query, like when serving fetches or clones. Git stores a collection of bitmaps for a handful of commits. Each bit position is tied to a specific object, and the value of that bit indicates whether or not it is reachable from the given commit.
This often allows Git to compute the answers to reachability queries using bitmaps much more quickly than without, particularly for large repositories. For instance, if you want to know the set of objects unique to some branch relative to another, you can build up a bitmap for each endpoint (in this case, the branch we’re interested in, along with main), and compute the AND NOT between them. The resulting bitmap has bits set to “1” for exactly the set of objects unique to one side of the reachability query.
But what happens if one side doesn’t have bitmap coverage, or if the branch has moved on since the last time it was covered with a bitmap?
In previous versions of Git, the answer was that Git would build up a complete bitmap for all reachability tips relative to the query. It does so by walking backwards from each tip, assembling its own bitmap, and then stopping as soon as it finds an existing bitmap in history. Here’s an example of the existing traversal routine:
Figure 1: Bitmap-based traversal computing the set of objects unique to `main` in Git 2.41.0.
There’s a lot going on here, but let’s break it down. Above we have a commit graph, with five branches and one tag. Each of the commits are indicated by circles, and the references are indicated by squares pointing at their respective referents. Existing bitmaps can be found for both the v2.42.0 tag, and the branch bar.
In the above, we’re trying to compute the set of objects which are reachable from main, but aren’t reachable from any other branch. By inspection, it’s clear that the answer is {C₆, C₇}, but let’s step through how Git would arrive at the same result:
For each branch that we want to exclude from the result set (in this case, foo, bar, baz, and quux), we walk along the commit graph, marking each of the corresponding bits in our have‘s bitmap in the top-left.
If we happen to hit a portion of the graph that we’ve covered already, we can stop early. Likewise, if we find an existing bitmap (like what happens when we try to walk beginning at branch bar), we can OR in the bits from that commit’s bitmap into our have‘s set, and move on to the next branch.
Then, we repeat the same process for each branch we do want to keep (in this case, just main), this time marking or ORing bits into the have‘s bitmap.
Finally, once we have a complete bitmap representing each side of the reachability query, we can compute the result by AND NOTing the two bitmaps together, leaving us with the set of objects unique to main.
We can see that in the above, having existing bitmap coverage (as is the case with branch bar) is extremely beneficial, since they allow us to discover the set of objects reachable from a certain point in the graph immediately without having to open up and parse objects.
But what happens when bitmap coverage is sparse? In that case, we end up having to walk over many objects in order to find an existing bitmap. Oftentimes, the additional overhead of maintaining a series of bitmaps outweighs the benefits of using them in the first place, particularly when coverage is poor.
In this release, Git introduces a new variant of the bitmap traversal algorithm that often out performs the existing implementation, particularly when bitmap coverage is sparse.
The new algorithm represents the unwanted side of the reachability query as a bitmap from the query’s boundary, instead of the union of bitmap(s) from the individual tips on the unwanted side. The exact definition of what a query boundary is is slightly technical, but for our purposes you can think of it as the first commit in the wanted set of objects which is also reachable from at least one unwanted object.
In the above example, this is commit C₅, which is reachable from both main (which is in the wanted half of the reachability query) along with bar and baz (both of which are in the unwanted half). Let’s step through computing the same result using the boundary-based approach:
Figure 2: The same traversal as above, instead using the boundary commit-based approach.
The approach here is similar to the above, but not quite the same. Here’s the process:
We first discover the boundary commit(s), in this case C₅.
We then walk backwards from the set of boundary commit(s) we just discovered until we find a reachability bitmap (or reach the beginning of history). At each stage along the walk, we mark the corresponding bit in the have‘s bitmap.
Then, we build up a complete bitmap on the want‘s side by starting a walk from main until either we hit an existing bitmap, the beginning of history, or an object marked in the previous step.
Finally, as before, we compute the AND NOT between the two bitmaps, and return the results.
When there are bitmaps close to the boundary commit(s), or the unwanted half of the query is large, this algorithm often vastly outperforms the existing traversal. In the toy example above, you can see we compute the answer much more quickly when using the boundary-based approach. But in real-world examples, between a 2- and 15-fold improvement can be observed between the two algorithms.
If you’ve ever scripted around Git before, you are likely familiar with its for-each-ref command. If not, you likely won’t be surprised to learn that this command is used to enumerate references in your repository, like so:
$ git for-each-ref --sort='-*committerdate' refs/tags
264b9b3b04610cb4c25e01c78d9a022c2e2cdf19 tag    refs/tags/v2.42.0-rc2
570f1f74dee662d204b82407c99dcb0889e54117 tag    refs/tags/v2.42.0-rc1
e8f04c21fdad4551047395d0b5ff997c67aedd90 tag    refs/tags/v2.42.0-rc0
32d03a12c77c1c6e0bbd3f3cfe7f7c7deaf1dc5e tag    refs/tags/v2.41.0
[...]
for-each-ref is extremely useful for listing references, finding which references point at a given object (with --points-at), which references have been merged into a given branch (with --merged), or which references contain a given commit (with --contains).
Git relies on the same machinery used by for-each-ref across many different components, including the reference advertisement phase of pushes. During a push, the Git server first advertises a list of references that it wants the client to know about, and the client can then exclude those objects (and anything reachable from them) from the packfile they generate during the push.
Suppose that you have some references that you don’t want to advertise to clients during a push? For example, GitHub maintains a pair of references for each open pull request, like refs/pull/NNN/head and refs/pull/NNN/merge, which aren’t advertised to pushers. Luckily, Git has a mechanism that allows server operators to exclude groups of references from the push advertisement phase by configuring the transfer.hideRefs variable.
Git implements the functionality configured by transfer.hideRefs by enumerating all references, and then inspecting each one to see whether or not it should advertise that reference to pushers. Here’s a toy example of a similar process:
Figure 3: Running `for-each-ref` while excluding the `refs/pull/` hierarchy.
Here, we want to list every reference that doesn’t begin with refs/pull/. In order to do that, Git enumerates each reference one-by-one, and performs a prefix comparison to determine whether or not to include it in the set.
For repositories that have a small number of hidden references, this isn’t such a big deal. But what if you have thousands, tens of thousands, or even more hidden references? Performing that many prefix comparisons only to throw out a reference as hidden can easily become costly.
In Git 2.42, there is a new mechanism to more efficiently exclude references. Instead of inspecting each reference one-by-one, Git first locates the start and end of each excluded region in its packed-refs file. Once it has this information, it creates a jump list allowing it to skip over whole regions of excluded references in a single step, rather than discarding them one by one, like so:
Figure 4: The same `for-each-ref` invocation as above, this time using a jump list as in Git 2.42.
Like the previous example, we still want to discard all of the refs/pull references from the result set. To do so, Git finds the first reference beginning with refs/pull (if one exists), and then performs a modified binary search to find the location of the first reference after all of the ones beginning with refs/pull.
It can then use this information (indicated by the dotted yellow arrow) to avoid looking at the refs/pull hierarchy entirely, providing a measurable speed-up over inspecting and discarding each hidden reference individually.
In Git 2.42, you can try out this new functionality with git for-each-ref‘s new --exclude option. This release also uses this new mechanism to improve the reference advertisement above, as well as analogous components for fetching. In extreme examples, this can provide a 20-fold improvement in the CPU cost of advertising references during a push.
Git 2.42 also comes with a pair of new options in the git pack-refs command, which is responsible for updating the packed-refs file with any new loose references that aren’t stored. In certain scenarios (such as a reference being frequently updated or deleted), it can be useful to exclude those references from ever entering the packed-refs file in the first place.
git pack-refs now understands how to tweak the set of references it packs using its new --include and --exclude flags.
Preserving precious objects from garbage collection
In our last set of release highlights, we talked about a new mechanism for collecting unreachable objects in Git known as cruft packs. Git uses cruft packs to collect and track the age of unreachable objects in your repository, gradually letting them age out before eventually being pruned from your repository.
But Git doesn’t simply delete every unreachable object (unless you tell it to with --prune=now). Instead, it will delete every object except those that meet one of the below criteria:
The object is reachable, in which case it cannot be deleted ever.
The object is unreachable, but was modified after the pruning cutoff.
The object is unreachable, and hasn’t been modified since the pruning cutoff, but is reachable via some other unreachable object which has been modified recently.
But what do you do if you want to hold onto an object (or many objects) which are both unreachable and haven’t been modified since the pruning cutoff?
Historically, the only answer to this question was that you should point a reference at those object(s). That works if you have a relatively small set of objects you want to hold on to. But what if you have more precious objects than you could feasibly keep track of with references?
Git 2.42 introduces a new mechanism to preserve unreachable objects, regardless of whether or not they have been modified recently. Using the new gc.recentObjectsHook configuration, you can configure external program(s) that Git will run any time it is about to perform a pruning garbage collection. Each configured program is allowed to print out a line-delimited sequence of object IDs, each of which is immune to pruning, regardless of its age.
Even if you haven’t started using cruft packs yet, this new configuration option works even when using loose objects to hold unreachable objects which have not yet aged out of your repository.
This makes it possible to store a potentially large set of unreachable objects which you want to retain in your repository indefinitely using an external mechanism, like a SQLite database. To try out this new feature for yourself, you can run:
If you’ve read these blog posts before, you may recall our coverage of the sparse index feature, which allows you to check out a narrow cone of your repository instead of the whole thing.
Over time, many commands have gained support for working with the sparse index. For commands that lacked support for the sparse index, invoking those commands would cause your repository to expand the index to cover the entire repository, which can be a potentially expensive operation.
This release, the diff-tree command joined the group of commands with full support for the sparse index, meaning that you can now use diff-tree without expanding your index.
This work was contributed by Shuqi Liang, one of the Git project’s Google Summer of Code (GSoC) students. You can read more about their project here, and follow along with their progress on their blog.
If you’ve gotten this far in the blog post and thought that we were done talking about git for-each-ref, think again! This release enhances for-each-ref‘s --format option with a handful of new ways to format a reference.
The first set of new options enables for-each-ref to show a handful of GPG-related information about commits at reference tips. You can ask for the GPG signature directly, or individual components of it, like its grade, the signer, key, fingerprint, and so on. For example,
This work was contributed by Kousik Sanagavarapu, another GSoC student working on Git! You can read more about their project here, and keep up to date with their work on their blog.
Earlier in this post, we talked about git rev-list, a low-level utility for listing the set of objects contained in some query.
In our early examples, we discussed a straightforward case of listing objects unique to one branch. But git rev-list supports much more complex modifiers, like --branches, --tags, --remotes, and more.
In addition to specifying modifiers like these on the command-line, git rev-list has a --stdin mode which allows for reading a line-delimited sequence of commits (optionally prefixed with ^, indicating objects reachable from those commit(s) should be excluded) from the command’s standard input.
Previously, support for --stdin extended only to referring to commits by their object ID, without support for more complex modifiers like the ones listed earlier. In Git 2.42, git rev-list --stdin can now accept the same set of modifiers given on the command line, making it much more useful when scripting.
Picture this: you’re working away on your repository, typing up a tag message for a tag named foo. Suppose that in the background, you have some repeating task that fetches new commits from your remote repository. If you happen to fetch a tag foo/bar while writing the tag message for foo, Git will complain that you cannot have both tag foo and foo/bar.
OK, so far so good: Git does not support this kind of tag hierarchy1. But what happened to your tag message? In previous versions of Git, you’d be out of luck, since your in-progress message at $GIT_DIR/TAG_EDITMSG is deleted before the error is displayed. In Git 2.42, Git delays deleting the TAG_EDITMSG until after the tag is successfully written, allowing you to recover your work later on.
In other git tag-related news, this release comes with a fix for a subtle bug that appeared when listing tags. git tag can list existing tags with the -l option (or when invoked with no arguments). You can further refine those results to only show tags which point at a given object with the --points-at option.
But what if you have one or more tags that point at the given object through one or more other tags instead of directly? Previous versions of Git would fail to report those tags. Git 2.42 addresses this by dereferencing tags through multiple layers before determining whether or not it points to a given object.
Finally, back in Git 2.38, git cat-file --batch picked up a new -z flag, allowing you to specify NUL-delimited input instead of delimiting your input with a standard newline. This flag is useful when issuing queries which themselves contain newlines, like trying to read the contents of some blob by path, if the path contains newlines.
But the new -z option only changed the rules for git cat-file‘s input, leaving the output still delimited by newlines. Ordinarily, this won’t cause any problems. But if git cat-file can’t locate an object, it will print out ” missing”, followed by a newline.
If the given query itself contains a newline, the result is unparseable. To address this, git cat-file has a new mode, -Z (as opposed to its lowercase variant, -z) which changes both the input and output to be NUL-delimited.
Doing so would introduce a directory/file-conflict. Since Git stores loose tags at paths like $GIT_DIR/refs/tags/foo/bar, it would be impossible to store a tag foo, since it would need to live at $GIT_DIR/refs/tags/foo, which already exists as a directory. ↩
We’re pleased to announce that we’ve launched a Landing Zone for the Baseline Informatiebeveiliging Overheid (BIO) framework to support our Dutch customers in their compliance needs with the BIO framework.
Amazon Web Services (AWS) customers across the Dutch public sector can use AWS certified services with confidence, knowing that the AWS services listed in the certificate adhere to the strict requirements imposed on the consumption of cloud-based services.
Baseline Informatiebeveiliging Overheid
The BIO framework is an information security framework that the four layers of the Dutch public sector are required to adhere to. This means that it’s mandatory for the Dutch central government, all provinces, municipalities, and regional water authorities to be compliant with the BIO framework.
To support AWS customers in demonstrating their compliance with the BIO framework, AWS developed a Landing Zone for the BIO framework. This Landing Zone for the BIO framework is a pre-configured AWS environment that includes a subset of the technical requirements of the BIO framework. It’s a helpful tool that provides a starting point from which customers can further build their own AWS environment.
In addition to the BIO framework, there’s another information security framework designed specifically for the use of cloud services. It is called BIO Thema-uitwerking Clouddiensten. The BIO Thema-uitwerking Clouddiensten is a guidance document for Dutch cloud service consumers to help them formulate controls and objectives when using cloud services. Consumers can view it as an additional control framework on top of the BIO framework.
AWS strives to continuously bring services into scope of its compliance programs to help you meet your architectural and regulatory needs.
To learn more about our compliance and security programs, see AWS Compliance Programs. As always, we value your feedback and questions; reach out to the AWS Compliance team through the Contact Us page.
If you have feedback about this post, submit comments in the Comments section below.
Want more AWS Security how-to content, news, and feature announcements? Follow us on Twitter.
Amazon OpenSearch Service has long supported both lexical and vector search, since the introduction of its kNN plugin in 2020. With recent developments in generative AI, including AWS’s launch of Amazon Bedrock earlier in 2023, you can now use Amazon Bedrock-hosted models in conjunction with the vector database capabilities of OpenSearch Service, allowing you to implement semantic search, retrieval augmented generation (RAG), recommendation engines, and rich media search based on high-quality vector search. The recent launch of the vector engine for Amazon OpenSearch Serverless makes it even easier to deploy such solutions.
OpenSearch Service supports a variety of search and relevance ranking techniques. Lexical search looks for words in the documents that appear in the queries. Semantic search, supported by vector embeddings, embeds documents and queries into a semantic high-dimension vector space where texts with related meanings are nearby in the vector space and therefore semantically similar, so that it returns similar items even if they don’t share any words with the query.
We’ve put together two demos on the public OpenSearch Playground to show you the strengths and weaknesses of the different techniques: one comparing textual vector search to lexical search, the other comparing cross-modal textual and image search to textual vector search. With OpenSearch’s Search Comparison Tool, you can compare the different approaches. For the demo, we’re using the Amazon Titan foundation model hosted on Amazon Bedrock for embeddings, with no fine tuning. The dataset consists of a selection of Amazon clothing, jewelry, and outdoor products.
Background
A search engine is a special kind of database, allowing you to store documents and data and then run queries to retrieve the most relevant ones. End-user search queries usually consist of text entered in a search box. Two important techniques for using that text are lexical search and semantic search. In lexical search, the search engine compares the words in the search query to the words in the documents, matching word for word. Only items that have all or most of the words the user typed match the query. In semantic search, the search engine uses a machine learning (ML) model to encode text from the source documents as a dense vector in a high-dimensional vector space; this is also called embedding the text into the vector space. It similarly codes the query as a vector and then uses a distance metric to find nearby vectors in the multi-dimensional space. The algorithm for finding nearby vectors is called kNN (k Nearest Neighbors). Semantic search does not match individual query terms—it finds documents whose vector embedding is near the query’s embedding in the vector space and therefore semantically similar to the query, so the user can retrieve items that don’t have any of the words that were in the query, even though the items are highly relevant.
Textual vector search
The demo of textual vector search shows how vector embeddings can capture the context of your query beyond just the words that compose it.
In the text box at the top, enter the query tennis clothes. On the left (Query 1), there’s an OpenSearch DSL (Domain Specific Language for queries) semantic query using the amazon_products_text_embedding index, and on the right (Query 2), there’s a simple lexical query using the amazon_products_text index. You’ll see that lexical search doesn’t know that clothes can be tops, shorts, dresses, and so on, but semantic search does.
Compare semantic and lexical results
Similarly, in a search for warm-weather hat, the semantic results find lots of hats suitable for warm weather, whereas the lexical search returns results mentioning the words “warm” and “hat,” all of which are warm hats suitable for cold weather, not warm-weather hats. Similarly, if you’re looking for long dresses with long sleeves, you might search for long long-sleeved dress. A lexical search ends up finding some short dresses with long sleeves and even a child’s dress shirt because the word “dress” appears in the description, whereas the semantic search finds much more relevant results: mostly long dresses with long sleeves, with a couple of errors.
Cross-modal image search
The demo of cross-modal textual and image search shows searching for images using textual descriptions. This works by finding images that are related to your textual descriptions using a pre-production multi-modal embedding. We’ll compare searching for visual similarity (on the left) and textual similarity (on the right). In some cases, we get very similar results.
Compare image and textual embeddings
For example, sailboat shoes does a good job with both approaches, but white sailboat shoes does much better using visual similarity. The query canoe finds mostly canoes using visual similarity—which is probably what a user would expect—but a mixture of canoes and canoe accessories such as paddles using textual similarity.
If you are interested in exploring the multi-modal model, please reach out to your AWS specialist.
Building production-quality search experiences with semantic search
These demos give you an idea of the capabilities of vector-based semantic vs. word-based lexical search and what can be accomplished by utilizing the vector engine for OpenSearch Serverless to build your search experiences. Of course, production-quality search experiences use many more techniques to improve results. In particular, our experimentation shows that hybrid search, combining lexical and vector approaches, typically results in a 15% improvement in search result quality over lexical or vector search alone on industry-standard test sets, as measured by the NDCG@10 metric (Normalized Discounted Cumulative Gain in the first 10 results). The improvement is because lexical outperforms vector for very specific names of things, and semantic works better for broader queries. For example, in the semantic vs. lexical comparison, the query saranac 146, a brand of canoe, works very well in lexical search, whereas semantic search doesn’t return relevant results. This demonstrates why the combination of semantic and lexical search provides superior results.
Conclusion
OpenSearch Service includes a vector engine that supports semantic search as well as classic lexical search. The examples shown in the demo pages show the strengths and weaknesses of different techniques. You can use the Search Comparison Tool on your own data in OpenSearch 2.9 or higher.
Further information
For further information about OpenSearch’s semantic search capabilities, see the following:
Stavros Macrakis is a Senior Technical Product Manager on the OpenSearch project of Amazon Web Services. He is passionate about giving customers the tools to improve the quality of their search results.
Making a filesystem implementation robust in the face of maliciously
created filesystem images is a challenging task even when the
implementation is actively maintained, which many in the kernel are not. There is a way to
make that task even harder, though: modify that filesystem image behind the
implementation’s back while it is mounted. A recent discussion on the
linux-fsdevel list reveals an ongoing disagreement over whether (and how)
this threat should be addressed.
The Document Foundation
has announced
the release of LibreOffice 7.6 Community. It is the last release
using the existing numbering scheme as the office suite will move to date-based
release numbers starting with LibreOffice 24.2 in
February, 2024. Highlights of this release include support for
document themes, including import and export of them, a new navigation
panel for Impress and Draw, zoom-gesture support, font-handling
improvements, and lots more; the release
notes have all the details.
LibreOffice 7.6 Community’s new features have been developed by 148
contributors: 61% of code commits are from the 52 developers employed by
three companies sitting in TDF’s Advisory Board – Collabora, Red Hat and
allotropia – or other organizations, 15% are from 7 developers at The
Document Foundation, and the remaining 24% are from 89 individual
volunteers.
Other 202 volunteers – representing hundreds of other people providing
translations – have committed localizations in 160 languages. LibreOffice
7.6 Community is released in 120 different language versions, more than any
other free or proprietary software, and as such can be used in the native
language (L1) by over 5.4 billion people worldwide. In addition, over 2.3
billion people speak one of those 120 languages as their second language
(L2).
Security updates have been issued by Debian (fastdds, flask, and kernel), Fedora (chromium, dotnet6.0, dotnet7.0, gerbv, java-1.8.0-openjdk, libreswan, procps-ng, and spectre-meltdown-checker), SUSE (chromium, kernel-firmware, krb5, opensuse-welcome, and python-mitmproxy), and Ubuntu (clamav, firefox, and vim).
Cloudflare has a unique vantage point on the Internet. From this position, we are able to see, explore, and identify trends that would otherwise go unnoticed. In this report we are doing just that and sharing our insights into Internet-wide application security trends.
Since the last report, our network is bigger and faster: we are now processing an average of 46 million HTTP requests/second and 63 million at peak. We consistently handle approximately 25 million DNS queries per second. That's around 2.1 trillion DNS queries per day, and 65 trillion queries a month. This is the sum of authoritative and resolver requests served by our infrastructure. Summing up both HTTP and DNS requests, we get to see a lot of malicious traffic. Focusing on HTTP requests only, in Q2 2023 Cloudflare blocked an average of 112 billion cyber threats each day, and this is the data that powers this report.
But as usual, before we dive in, we need to define our terms.
Definitions
Throughout this report, we will refer to the following terms:
Mitigated traffic: any eyeball HTTP* request that had a “terminating” action applied to it by the Cloudflare platform. These include the following actions: BLOCK, CHALLENGE, JS_CHALLENGE and MANAGED_CHALLENGE. This does not include requests that had the following actions applied: LOG, SKIP, ALLOW. In contrast to last year, we now exclude requests that had CONNECTION_CLOSE and FORCE_CONNECTION_CLOSE actions applied by our DDoS mitigation system, as these technically only slow down connection initiation. They also accounted for a relatively small percentage of requests. Additionally, we improved our calculation regarding the CHALLENGE type actions to ensure that only unsolved challenges are counted as mitigated. A detailed description of actions can be found in our developer documentation.
Bot traffic/automated traffic: any HTTP* request identified by Cloudflare’s Bot Management system as being generated by a bot. This includes requests with a bot score between 1 and 29 inclusive. This has not changed from last year’s report.
API traffic: any HTTP* request with a response content type of XML or JSON. Where the response content type is not available, such as for mitigated requests, the equivalent Accept content type (specified by the user agent) is used instead. In this latter case, API traffic won’t be fully accounted for, but it still provides a good representation for the purposes of gaining insights.
Unless otherwise stated, the time frame evaluated in this post is the 3 month period from April 2023 through June 2023 inclusive.
Finally, please note that the data is calculated based only on traffic observed across the Cloudflare network and does not necessarily represent overall HTTP traffic patterns across the Internet.
* When referring to HTTP traffic we mean both HTTP and HTTPS.
Global traffic insights
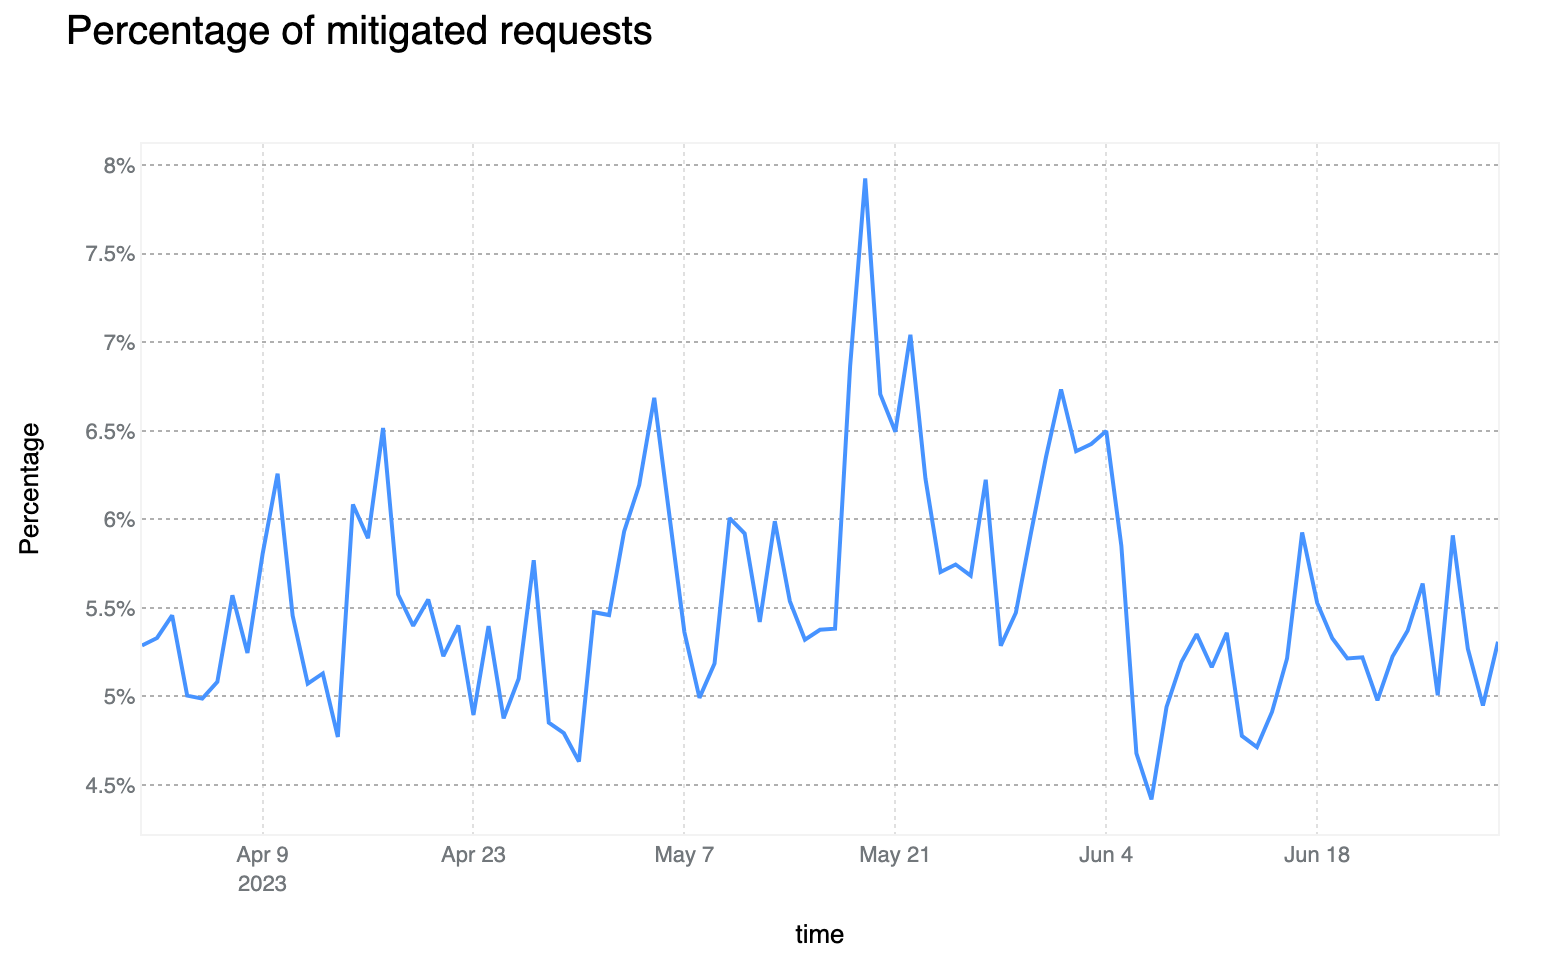
Mitigated daily traffic stable at 6%, spikes reach 8%
Although daily mitigated HTTP requests decreased by 2 percentage points to 6% on average from 2021 to 2022, days with larger than usual malicious activity can be clearly seen across the network. One clear example is shown in the graph below: towards the end of May 2023, a spike reaching nearly 8% can be seen. This is attributable to large DDoS events and other activity that does not follow standard daily or weekly cycles and is a constant reminder that large malicious events can still have a visible impact at a global level, even at Cloudflare scale.
75% of mitigated HTTP requests were outright BLOCKed. This is a 6 percentage point decrease compared to the previous report. The majority of other requests are mitigated with the various CHALLENGE type actions, with managed challenges leading with ~20% of this subset.
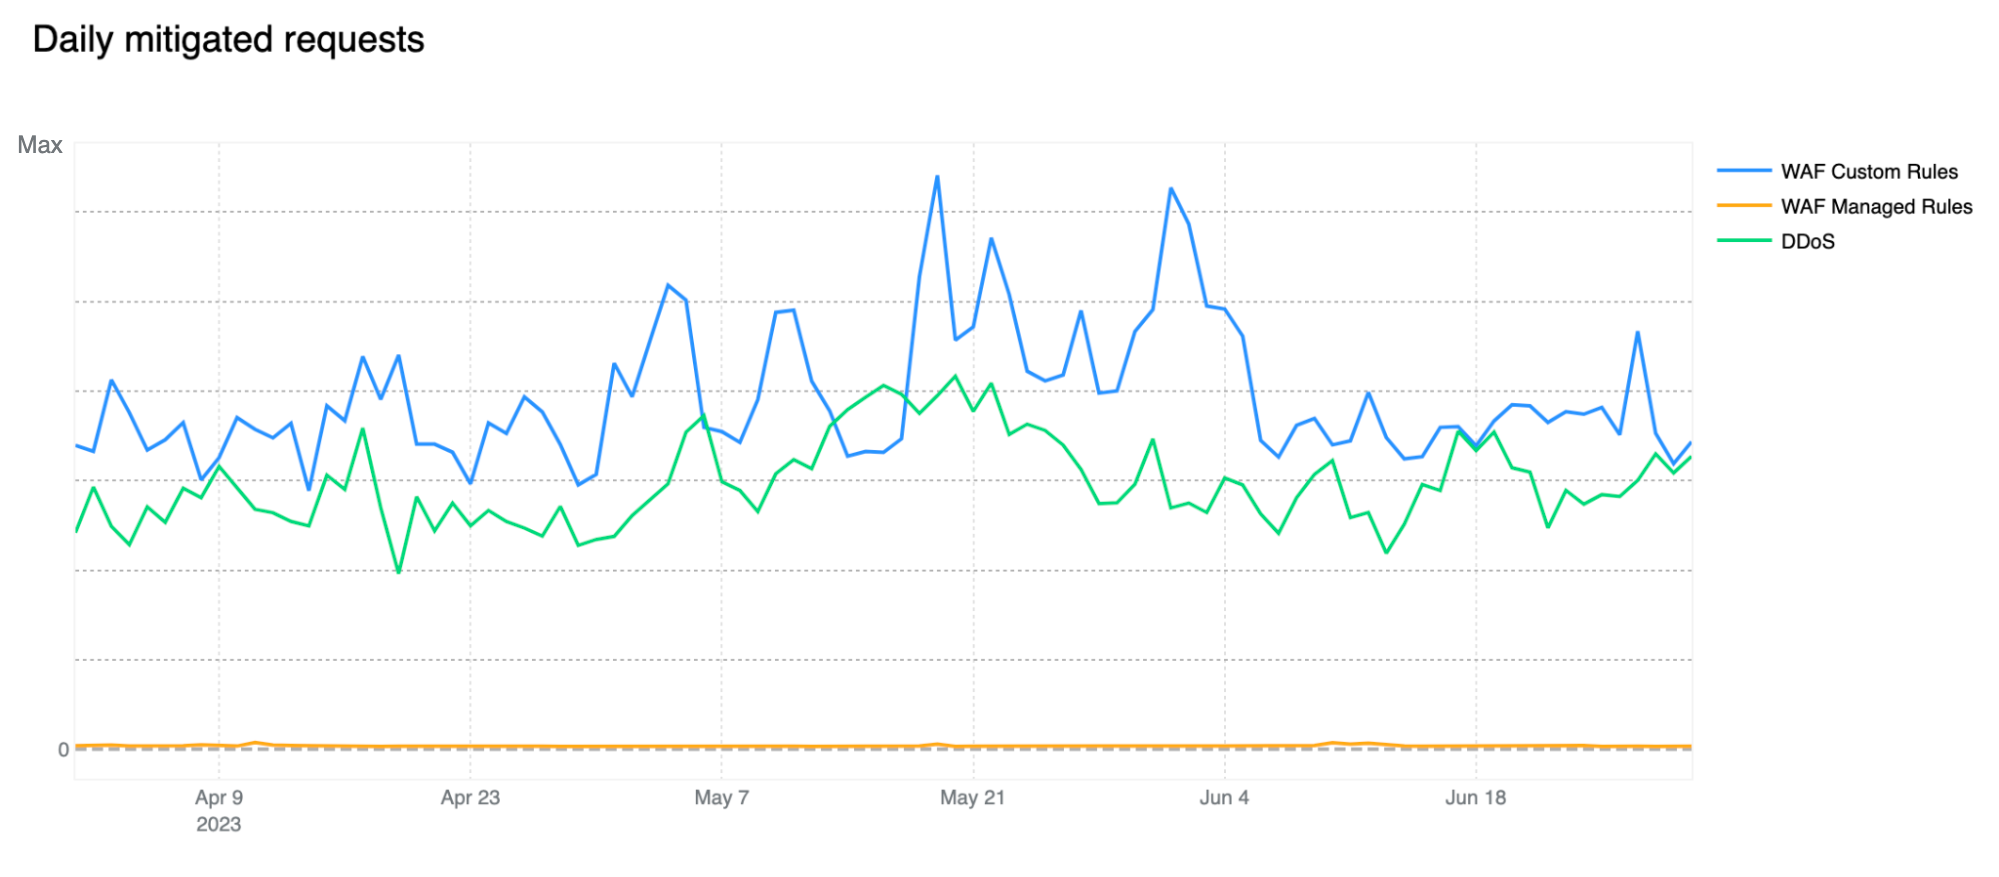
Shields up: customer configured rules now biggest contributor to mitigated traffic
In our previous report, our automated DDoS mitigation system accounted for, on average, more than 50% of mitigated traffic. Over the past two quarters, due to both increased WAF adoption, but most likely organizations better configuring and locking down their applications from unwanted traffic, we’ve seen a new trend emerge, with WAF mitigated traffic surpassing DDoS mitigation. Most of the increase has been driven by WAF Custom Rule BLOCKs rather than our WAF Managed Rules, indicating that these mitigations are generated by customer configured rules for business logic or related purposes. This can be clearly seen in the chart below.
Note that our WAF Managed Rules mitigations (yellow line) are negligible compared to overall WAF mitigated traffic also indicating that customers are adopting positive security models by allowing known good traffic as opposed to blocking only known bad traffic. Having said that, WAF Managed Rules mitigations reached as much as 1.5 billion/day during the quarter.
Our DDoS mitigation is, of course, volumetric and the amount of traffic matching our DDoS layer 7 rules should not be underestimated, especially given that we are observing a number of novel attacks and botnets being spun up across the web. You can read a deep dive on DDoS attack trends in our Q2 DDoS threat report.
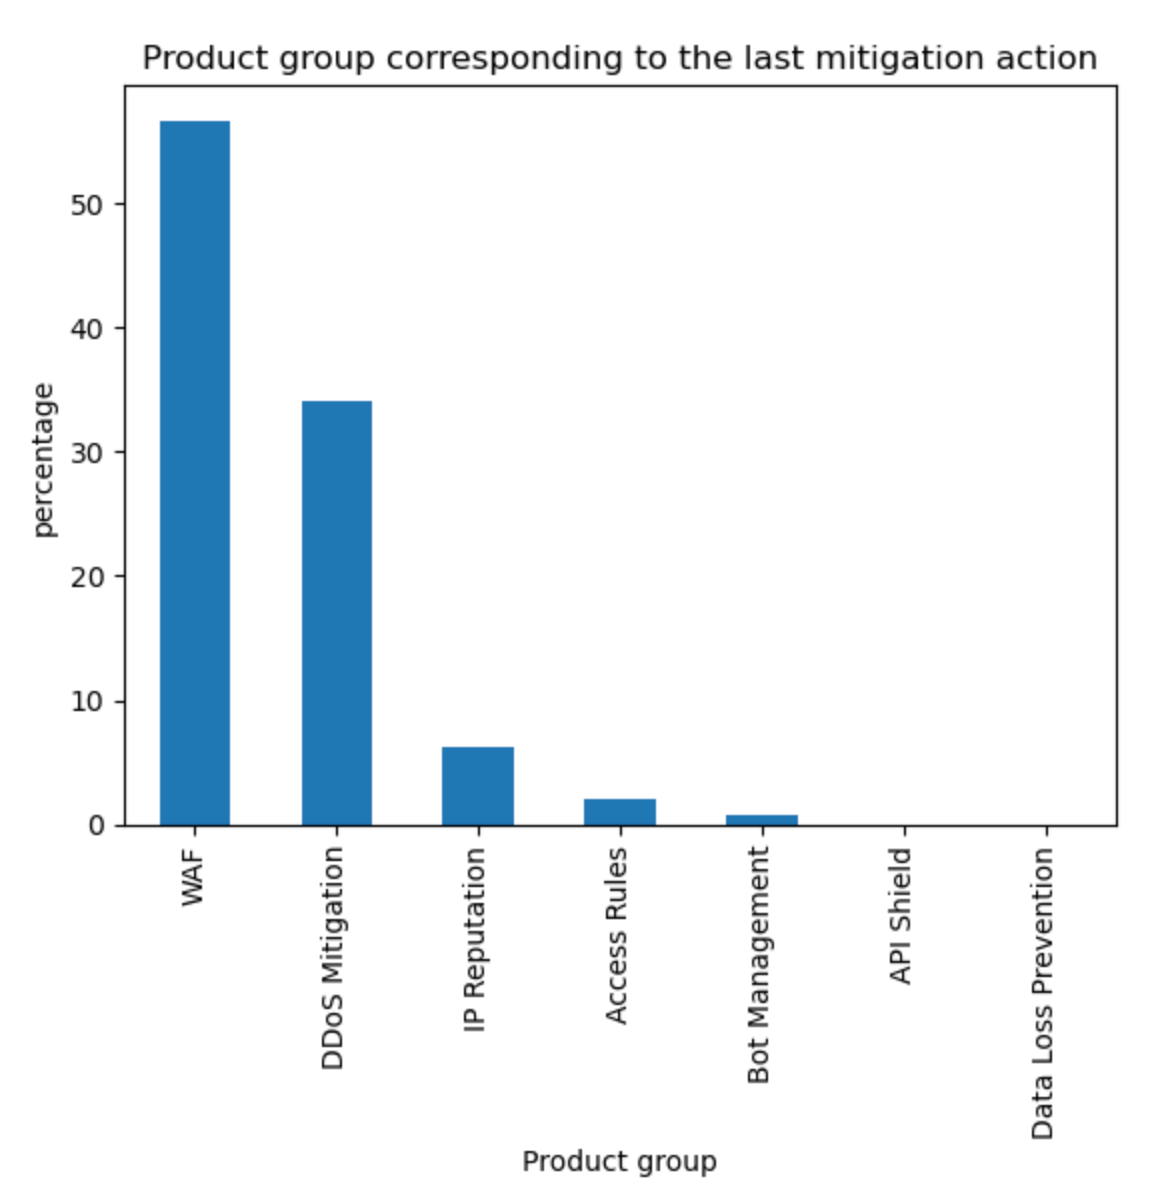
Aggregating the source of mitigated traffic, the WAF now accounts for approximately 57% of all mitigations. Tabular format below with other sources for reference.
Source
Percentage %
WAF
57%
DDoS Mitigation
34%
IP Reputation
6%
Access Rules
2%
Other
1%
Application owners are increasingly relying on geo location blocks
Given the increase in mitigated traffic from customer defined WAF rules, we thought it would be interesting to dive one level deeper and better understand what customers are blocking and how they are doing it. We can do this by reviewing rule field usage across our WAF Custom Rules to identify common themes. Of course, the data needs to be interpreted correctly, as not all customers have access to all fields as that varies by contract and plan level, but we can still make some inferences based on field “categories”. By reviewing all ~7M WAF Custom Rules deployed across the network and focusing on main groupings only, we get the following field usage distribution:
Field
Used in percentage % of rules
Geolocation fields
40%
HTTP URI
31%
IP address
21%
Other HTTP fields (excluding URI)
34%
Bot Management fields
11%
IP reputation score
4%
Notably, 40% of all deployed WAF Custom Rules use geolocation-related fields to make decisions on how to treat traffic. This is a common technique used to implement business logic or to exclude geographies from which no traffic is expected and helps reduce attack surface areas. While these are coarse controls which are unlikely to stop a sophisticated attacker, they are still efficient at reducing the attack surface.
Another notable observation is the usage of Bot Management related fields in 11% of WAF Custom Rules. This number has been steadily increasing over time as more customers adopt machine learning-based classification strategies to protect their applications.
Old CVEs are still exploited en masse
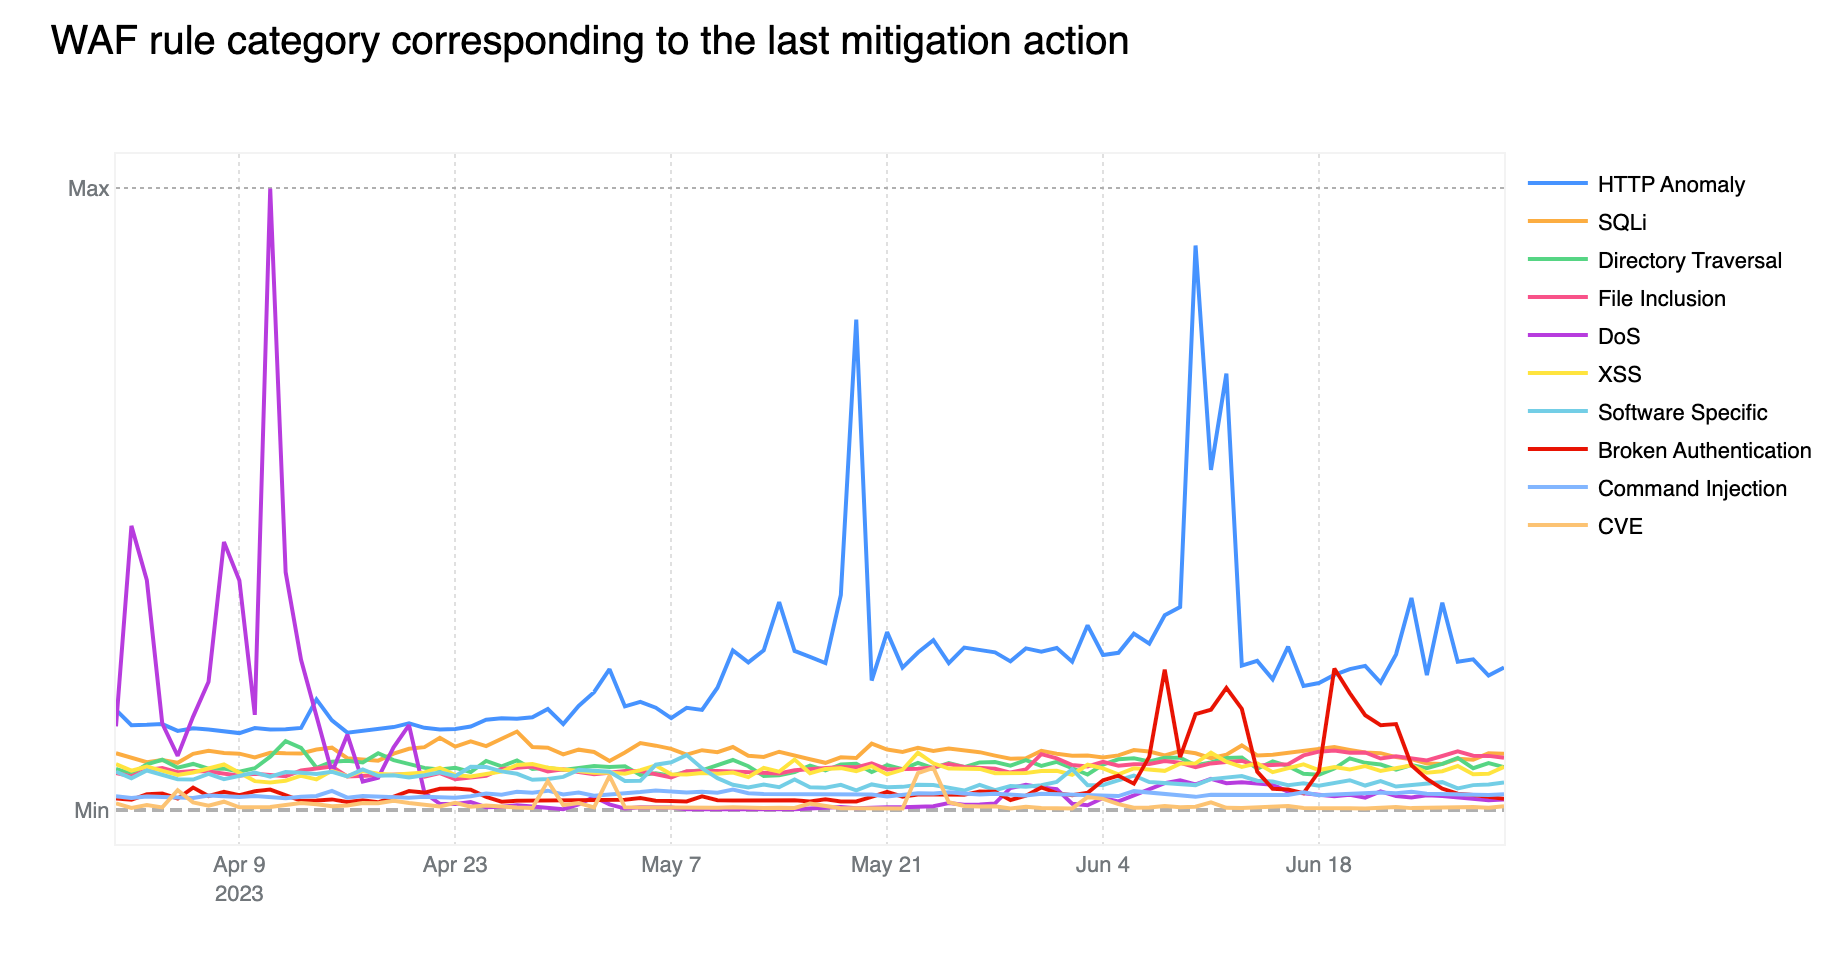
Contributing ~32% of WAF Managed Rules mitigated traffic overall, HTTP Anomaly is still the most common attack category blocked by the WAF Managed Rules. SQLi moved up to second position, surpassing Directory Traversal with 12.7% and 9.9% respectively.
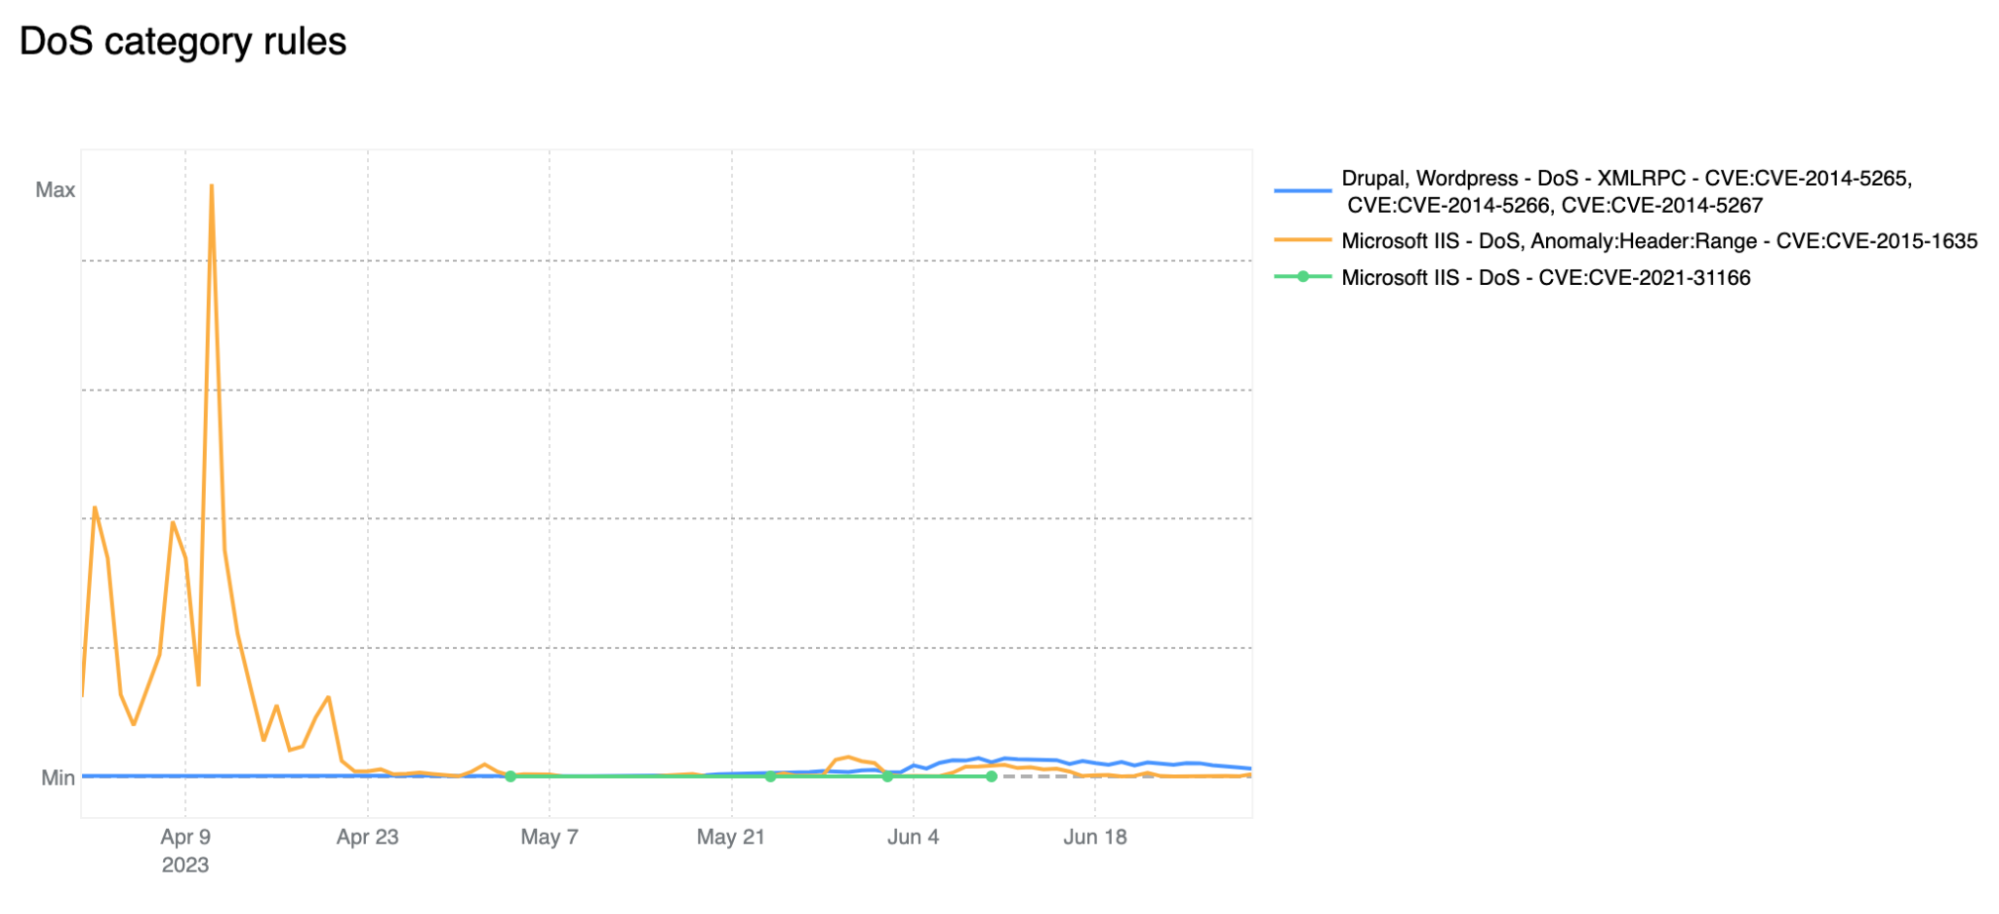
If we look at the start of April 2023, we notice the DoS category far exceeding the HTTP Anomaly category. Rules in the DoS category are WAF layer 7 HTTP signatures that are sufficiently specific to match (and block) single requests without looking at cross request behavior and that can be attributed to either specific botnets or payloads that cause denial of service (DoS). Normally, as is the case here, these requests are not part of “distributed” attacks, hence the lack of the first “D” for “distributed” in the category name.
Tabular format for reference (top 10 categories):
Source
Percentage %
HTTP Anomaly
32%
SQLi
13%
Directory Traversal
10%
File Inclusion
9%
DoS
9%
XSS
9%
Software Specific
7%
Broken Authentication
6%
Common Injection
3%
CVE
1%
Zooming in, and filtering on the DoS category only, we find that most of the mitigated traffic is attributable to one rule: 100031 / ce02fd… (old WAF and new WAF rule ID respectively). This rule, with a description of “Microsoft IIS – DoS, Anomaly:Header:Range – CVE:CVE-2015-1635” pertains to a CVE dating back to 2015 that affected a number of Microsoft Windows components resulting in remote code execution*. This is a good reminder that old CVEs, even those dating back more than 8 years, are still actively exploited to compromise machines that may be unpatched and still running vulnerable software.
* Due to rule categorisation, some CVE specific rules are still assigned to a broader category such as DoS in this example. Rules are assigned to a CVE category only when the attack payload does not clearly overlap with another more generic category.
Another interesting observation is the increase in Broken Authentication rule matches starting in June. This increase is also attributable to a single rule deployed across all our customers, including our FREE users: “WordPress – Broken Access Control, File Inclusion”. This rule is blocking attempts to access wp-config.php – the WordPress default configuration file which is normally found in the web server document root directory, but of course should never be accessed directly via HTTP.
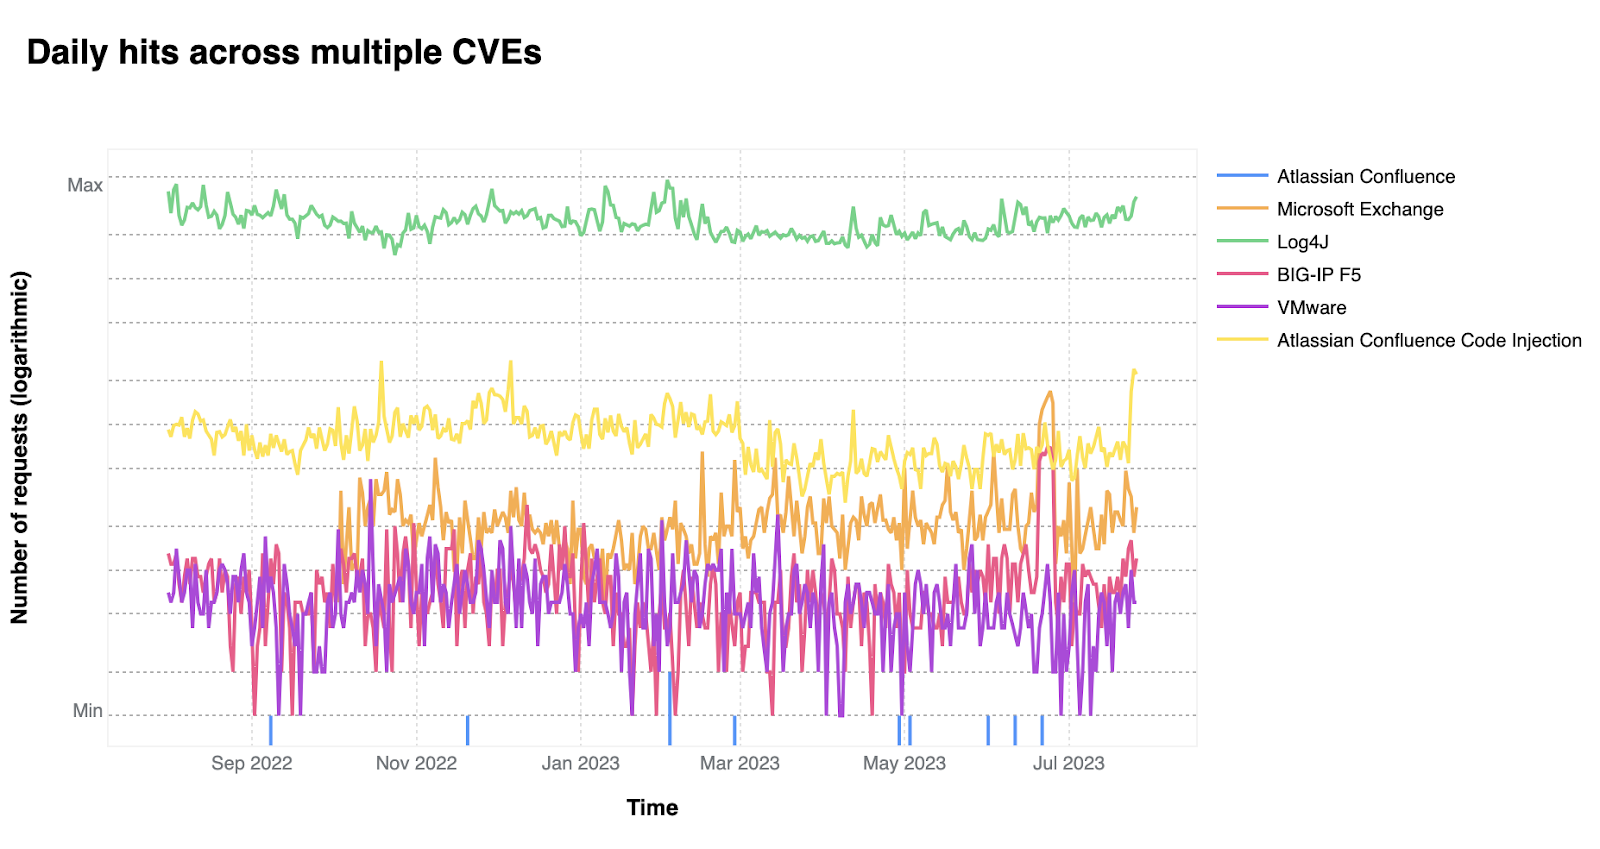
On a similar note, CISA/CSA recently published a report highlighting the 2022 Top Routinely Exploited Vulnerabilities. We took this opportunity to explore how each CVE mentioned in CISA’s report was reflected in Cloudflare’s own data. The CISA/CSA discuss 12 vulnerabilities that malicious cyber actors routinely exploited in 2022. However, based on our analysis, two CVEs mentioned in the CISA report are responsible for the vast majority of attack traffic we have seen in the wild: Log4J and Atlassian Confluence Code Injection. Our data clearly suggests a major difference in exploit volume between the top two and the rest of the list. The following chart compares the attack volume (in logarithmic scale) of the top 6 vulnerabilities of the CISA list according to our logs.
Bot traffic insights
Cloudflare’s Bot Management continues to see significant investment as the addition of JavaScript Verified URLs for greater protection against browser-based bots, Detection IDs are now available in Custom Rules for additional configurability, and an improved UI for easier onboarding. For self-serve customers, we’ve added the ability to “Skip” Super Bot Fight Mode rules and support for WordPress Loopback requests, to better integrate with our customers’ applications and give them the protection they need.
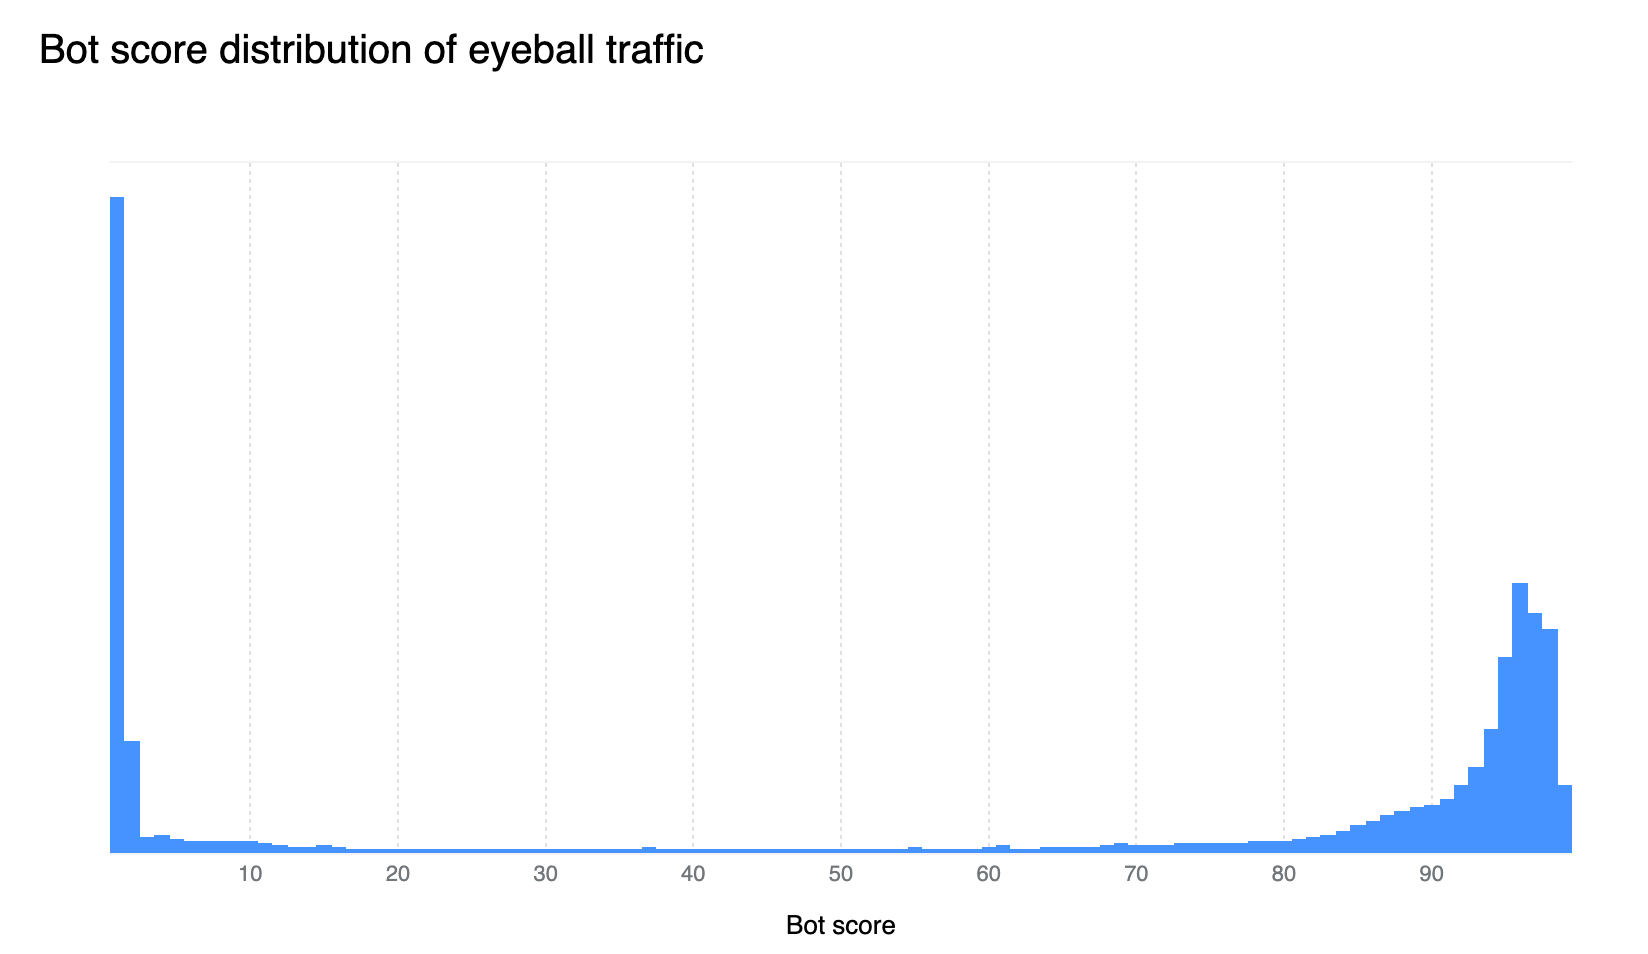
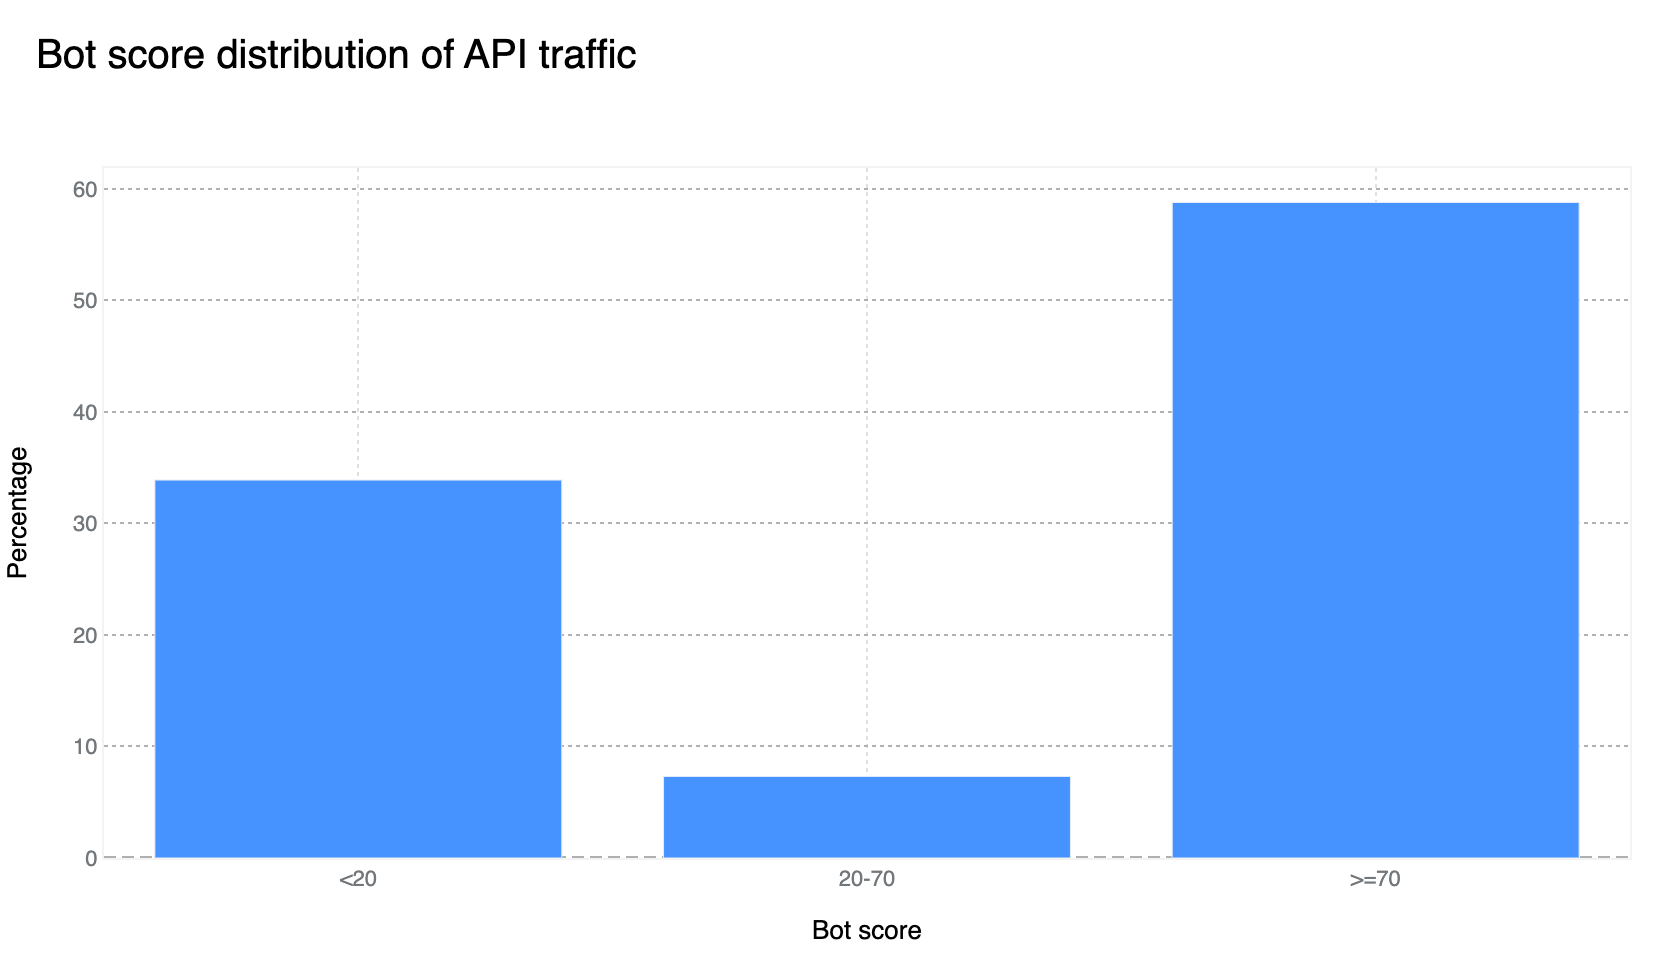
Our confidence in the Bot Management classification output remains very high. If we plot the bot scores across the analyzed time frame, we find a very clear distribution, with most requests either being classified as definitely bot (score below 30) or definitely human (score greater than 80), with most requests actually scoring less than 2 or greater than 95. This equates, over the same time period, to 33% of traffic being classified as automated (generated by a bot). Over longer time periods we do see the overall bot traffic percentage stable at 29%, and this reflects the data shown on Cloudflare Radar.
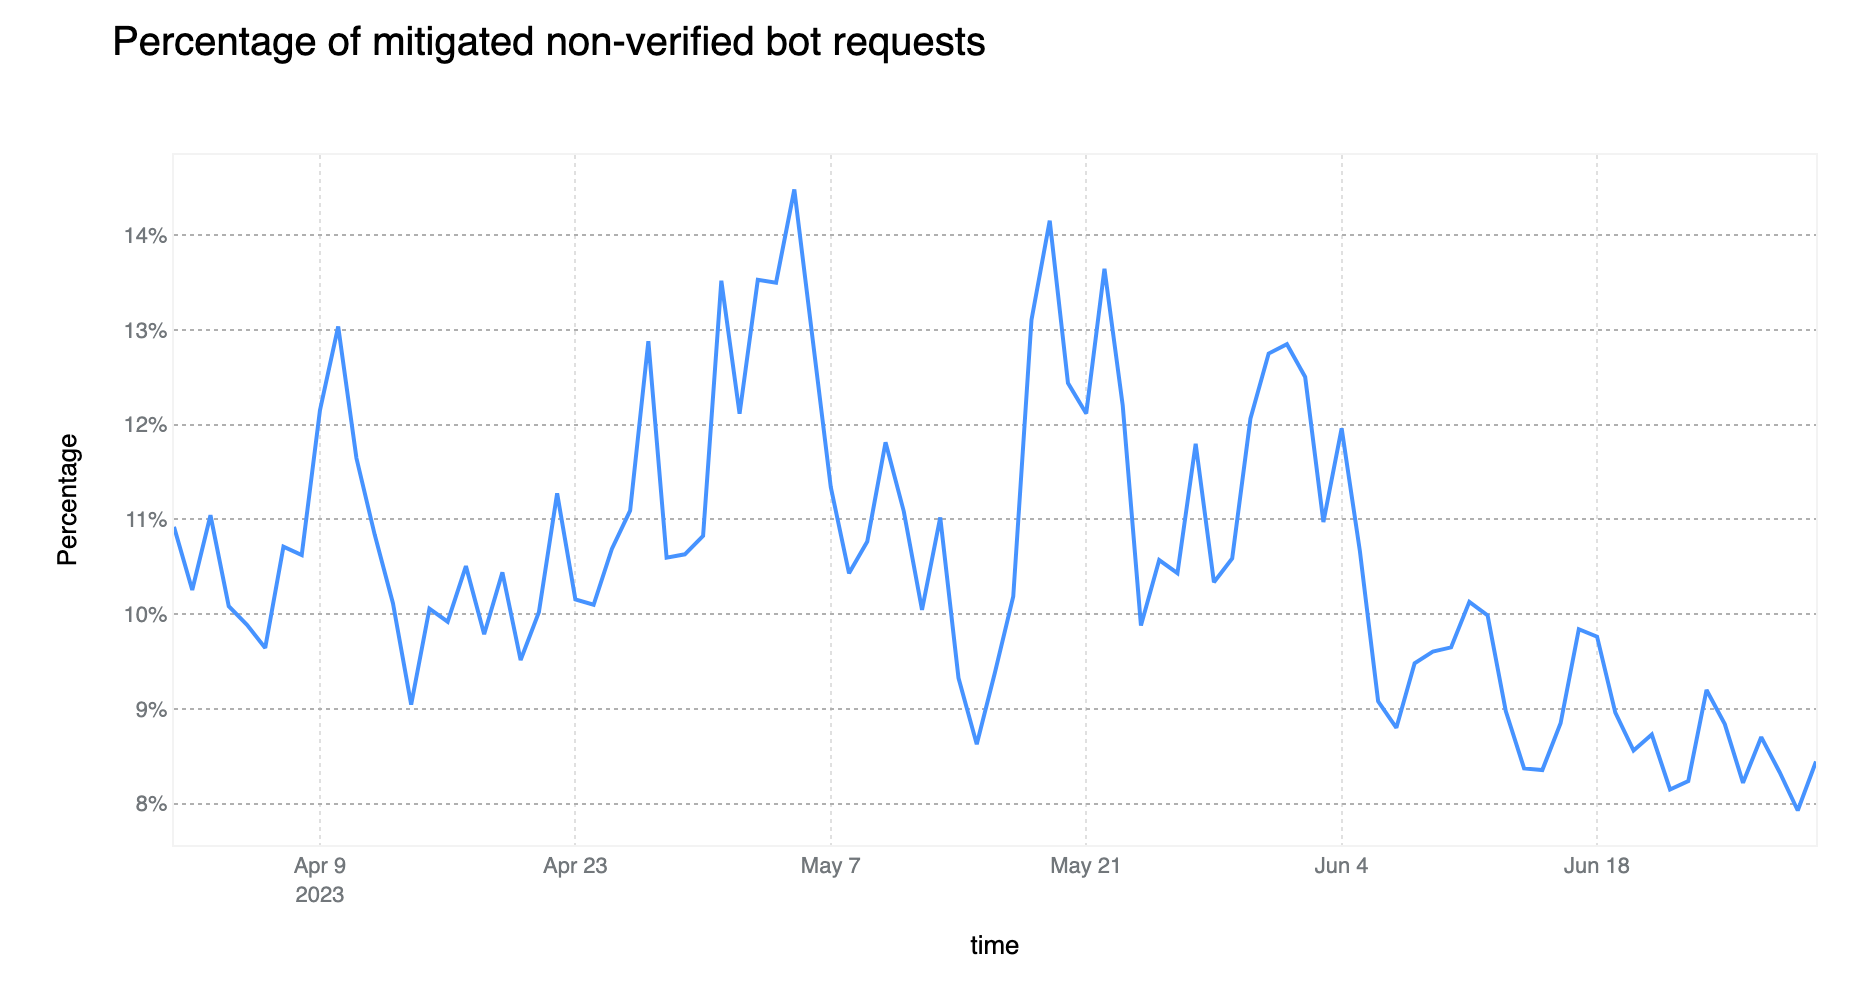
On average, more than 10% of non-verified bot traffic is mitigated
Compared to the last report, non-verified bot HTTP traffic mitigation is currently on a downward trend (down 6 percentage points). However, the Bot Management field usage within WAF Custom Rules is non negligible, standing at 11%. This means that there are more than 700k WAF Custom Rules deployed on Cloudflare that are relying on bot signals to perform some action. The most common field used is cf.client.bot, an alias to cf.bot_management.verified_bot which is powered by our list of verified bots and allows customers to make a distinction between “good” bots and potentially “malicious” non-verified ones.
Enterprise customers have access to the more powerful cf.bot_management.score which provides direct access to the score computed on each request, the same score used to generate the bot score distribution graph in the prior section.
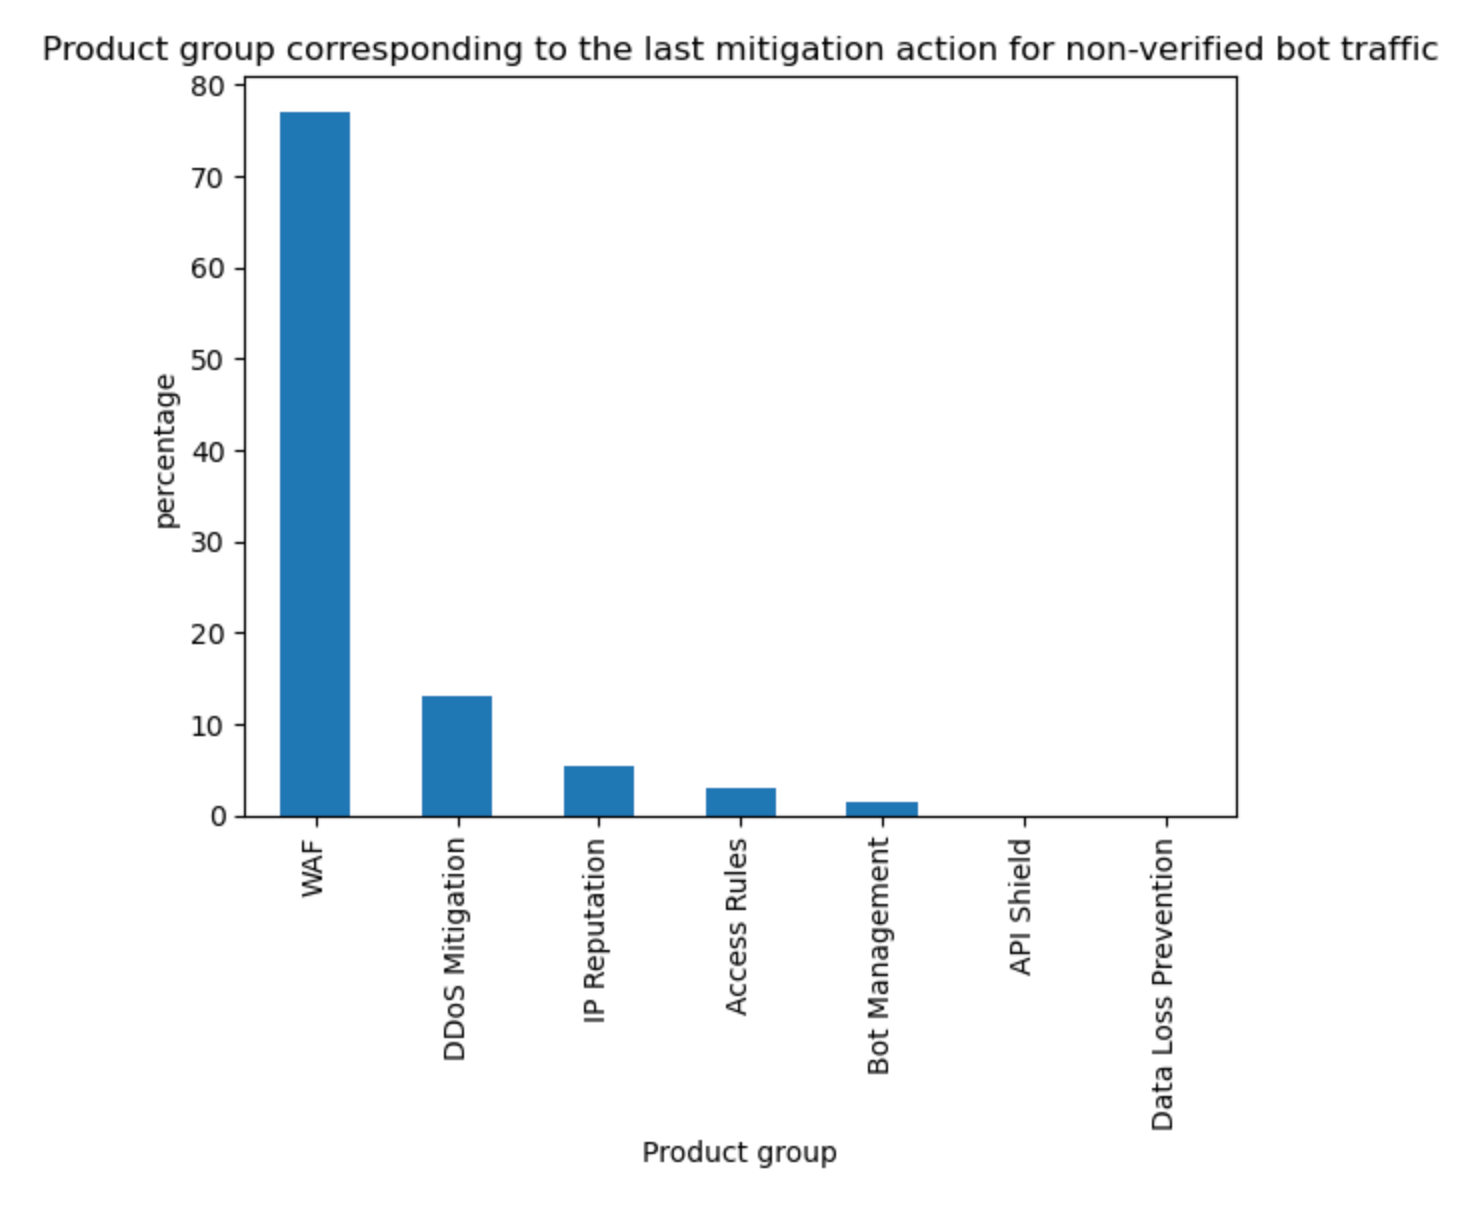
The above data is also validated by looking at what Cloudflare service is mitigating unverified bot traffic. Although our DDoS mitigation system is automatically blocking HTTP traffic across all customers, this only accounts for 13% of non-verified bot mitigations. On the other hand, WAF, and mostly customer defined rules, account for 77% of such mitigations, much higher than mitigations across all traffic (57%) discussed at the start of the report. Note that Bot Management is specifically called out but refers to our “default” one-click rules, which are counted separately from the bot fields used in WAF Custom Rules.
Tabular format for reference:
Source
Percentage %
WAF
77%
DDoS Mitigation
13%
IP reputation
5%
Access Rules
3%
Other
1%
API traffic insights
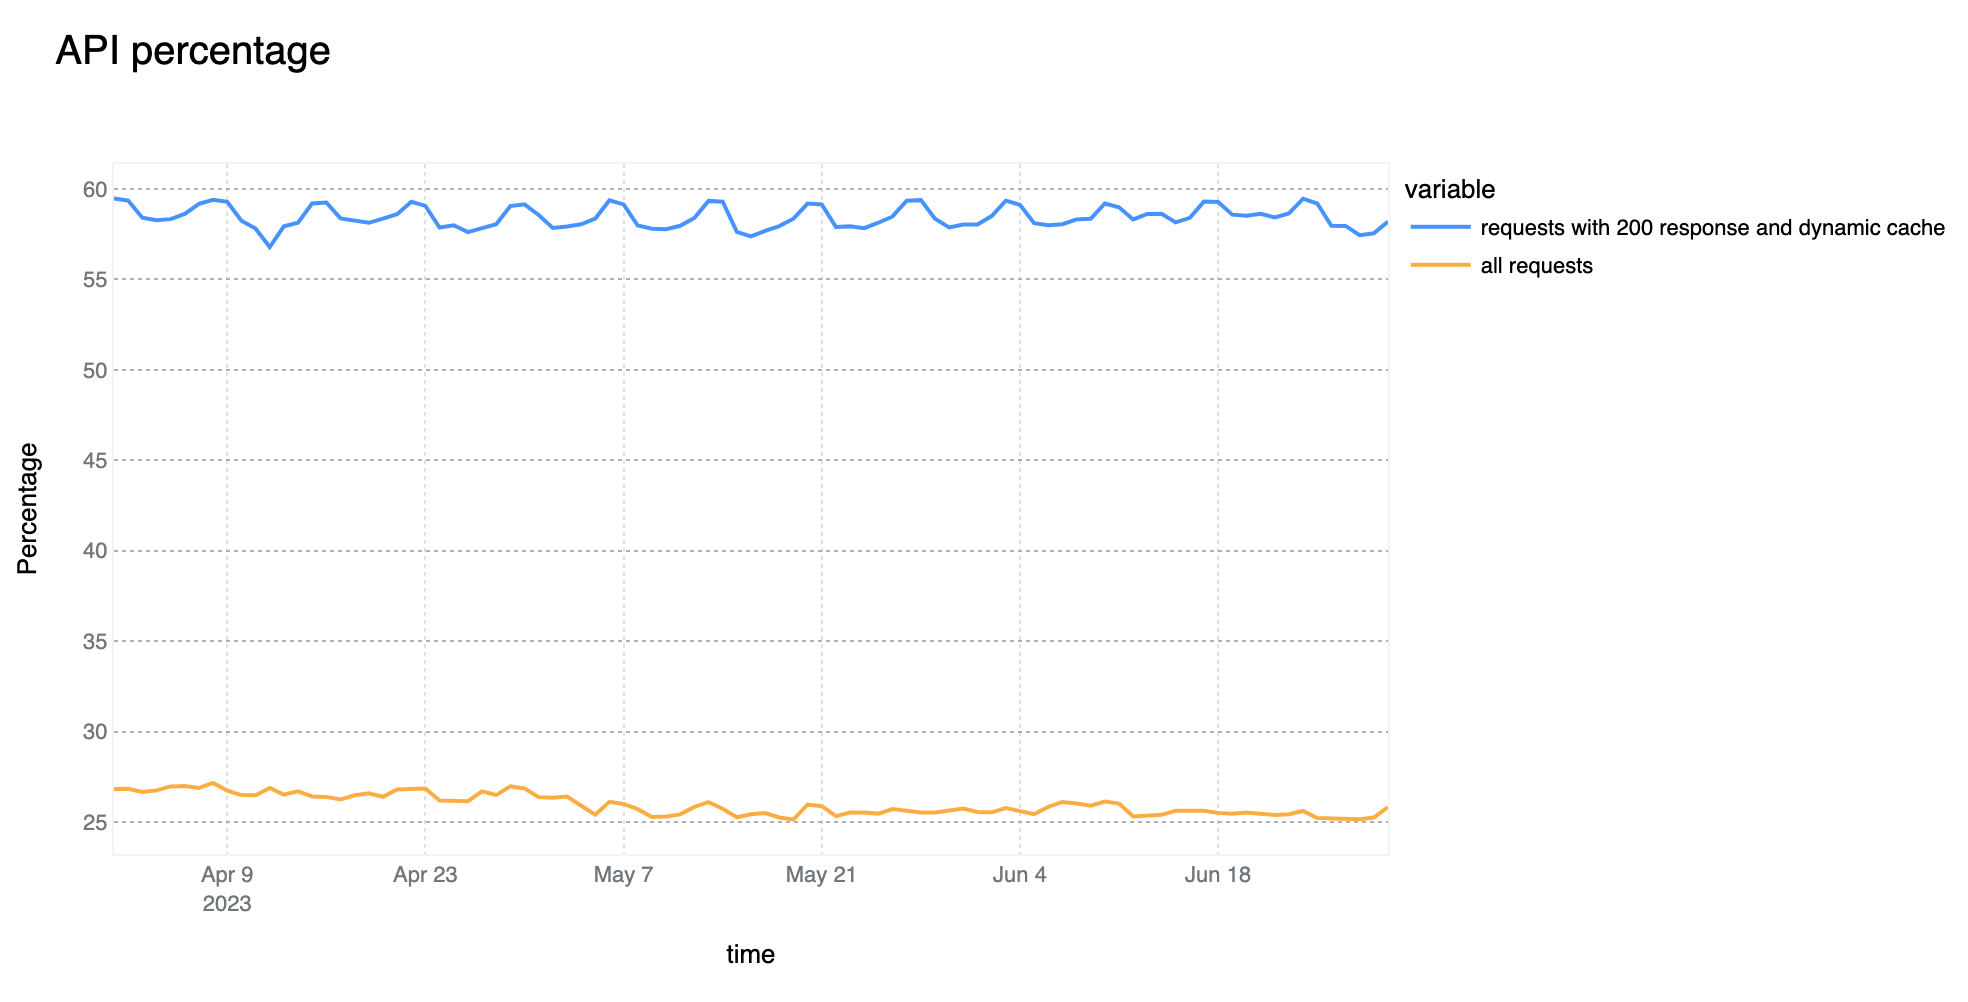
58% of dynamic (non cacheable) traffic is API related
The growth of overall API traffic observed by Cloudflare is not slowing down. Compared to last quarter, we are now seeing 58% of total dynamic traffic be classified as API related. This is a 3 percentage point increase as compared to Q1.
Our investment in API Gateway is also following a similar growth trend. Over the last quarter we have released several new API security features.
First, we’ve made API Discovery easier to use with a new inbox view. API Discovery inventories your APIs to prevent shadow IT and zombie APIs, and now customers can easily filter to show only new endpoints found by API Discovery. Saving endpoints from API Discovery places them into our Endpoint Management system.
Next, we’ve added a brand new API security feature offered only at Cloudflare: the ability to control API access by client behavior. We call it Sequence Mitigation. Customers can now create positive or negative security models based on the order of API paths accessed by clients. You can now ensure that your application’s users are the only ones accessing your API instead of brute-force attempts that ignore normal application functionality. For example, in a banking application you can now enforce that access to the funds transfer endpoint can only be accessed after a user has also accessed the account balance check endpoint.
We’re excited to continue releasing API security and API management features for the remainder of 2023 and beyond.
65% of global API traffic is generated by browsers
The percentage of API traffic generated by browsers has remained very stable over the past quarter. With this statistic, we are referring to HTTP requests that are not serving HTML based content that will be directly rendered by the browser without some preprocessing, such as those more commonly known as AJAX calls which would normally serve JSON based responses.
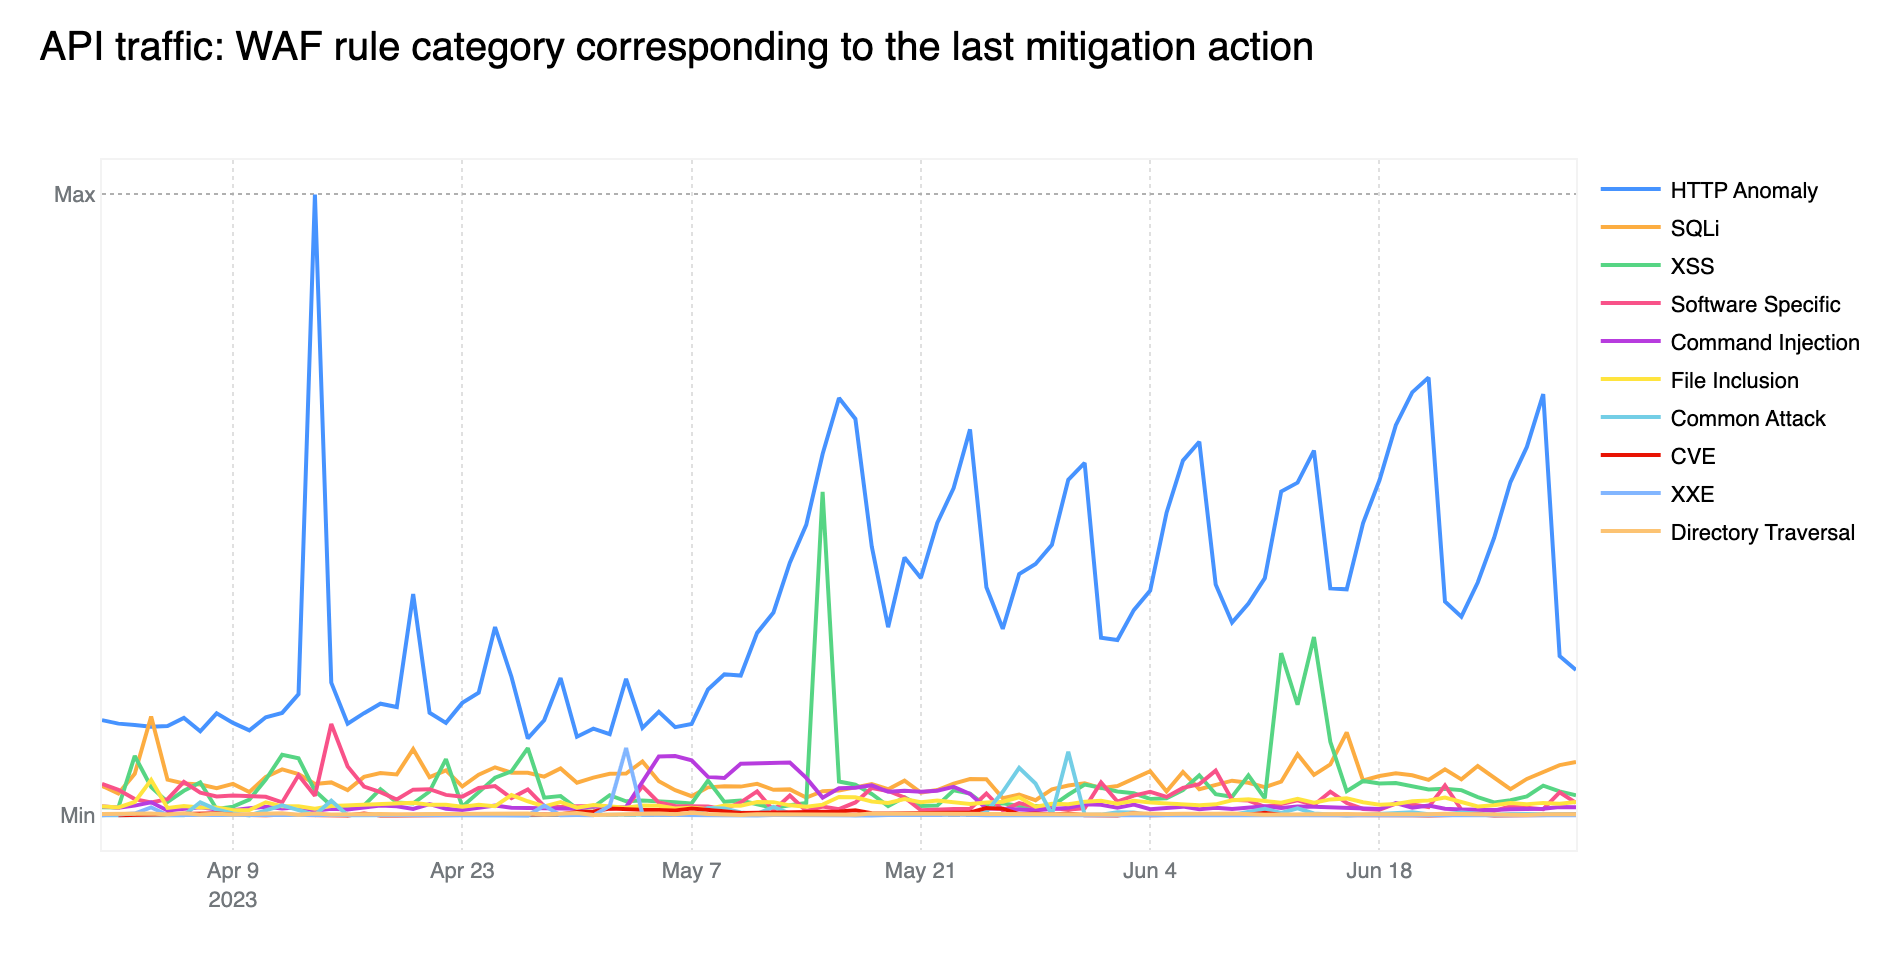
HTTP Anomalies are the most common attack vector on API endpoints
Just like last quarter, HTTP Anomalies remain the most common mitigated attack vector on API traffic. SQLi injection attacks, however, are non negligible, contributing approximately 11% towards the total mitigated traffic, closely followed by XSS attacks, at around 9%.
Tabular format for reference (top 5):
Source
Percentage %
HTTP Anomaly
64%
SQLi
11%
XSS
9%
Software Specific
5%
Command Injection
4%
Looking forward
As we move our application security report to a quarterly cadence, we plan to deepen some of the insights and to provide additional data from some of our newer products such as Page Shield, allowing us to look beyond HTTP traffic, and explore the state of third party dependencies online.
Stay tuned and keep an eye on Cloudflare Radar for more frequent application security reports and insights.
The collective thoughts of the interwebz
Manage Consent
To provide the best experiences, we use technologies like cookies to store and/or access device information. Consenting to these technologies will allow us to process data such as browsing behavior or unique IDs on this site. Not consenting or withdrawing consent, may adversely affect certain features and functions.
Functional
Always active
The technical storage or access is strictly necessary for the legitimate purpose of enabling the use of a specific service explicitly requested by the subscriber or user, or for the sole purpose of carrying out the transmission of a communication over an electronic communications network.
Preferences
The technical storage or access is necessary for the legitimate purpose of storing preferences that are not requested by the subscriber or user.
Statistics
The technical storage or access that is used exclusively for statistical purposes.The technical storage or access that is used exclusively for anonymous statistical purposes. Without a subpoena, voluntary compliance on the part of your Internet Service Provider, or additional records from a third party, information stored or retrieved for this purpose alone cannot usually be used to identify you.
Marketing
The technical storage or access is required to create user profiles to send advertising, or to track the user on a website or across several websites for similar marketing purposes.


 Nikhil Agarwal is Sr. Technical Manager with Amazon Web Services. He is passionate about helping customers achieve operational excellence in their cloud journey and working activity on technical solutions. He is also AI/ML enthusiastic and deep dives into customer’s ML-specific use cases. Outside of work, he enjoys traveling with family and exploring different gadgets.
 Karthik Chemudupati is a Principal Technical Account Manager (TAM) with AWS, focused on helping customers achieve cost optimization and operational excellence. He has more than 19 years of IT experience in software engineering, cloud operations and automations. Karthik joined AWS in 2016 as a TAM and worked with more than dozen Enterprise Customers across US-West. Outside of work, he enjoys spending time with his family.
 Gene Alpert is a Senior Analytics Specialist with AWS Enterprise Support. He has been focused on our Amazon OpenSearch Service customers and ecosystem for the past three years. Gene joined AWS in 2017. Outside of work he enjoys mountain biking, traveling, and playing Population:One in VR.


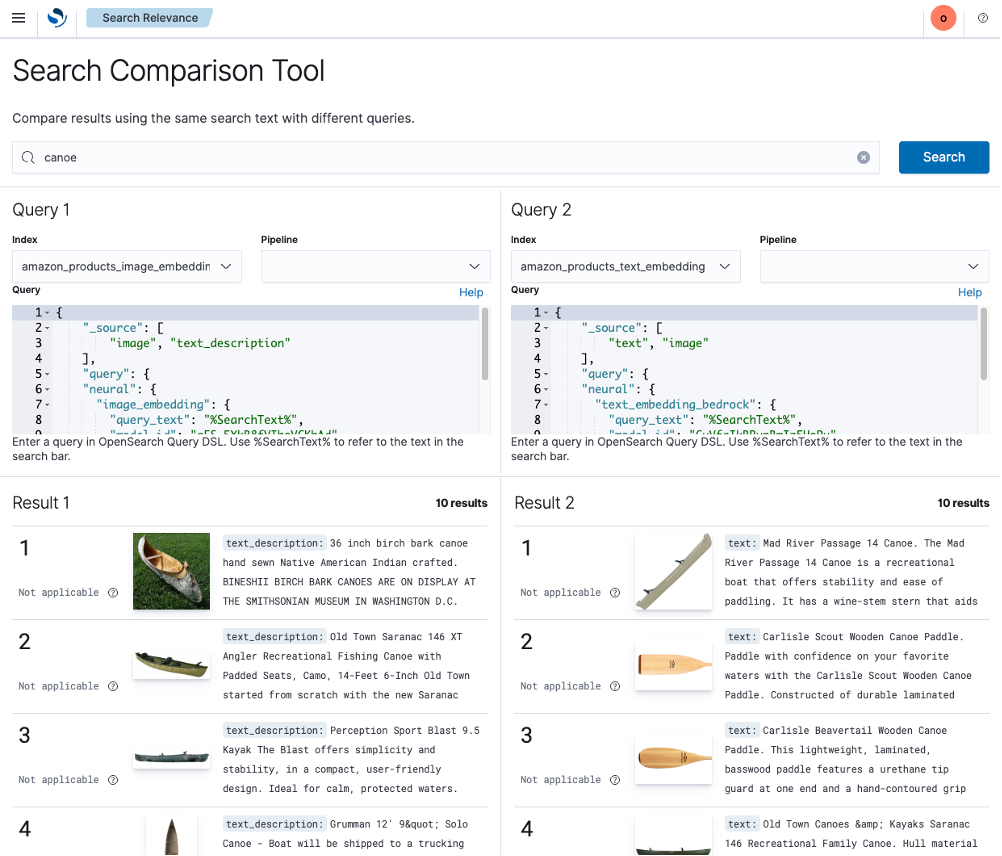
 Stavros Macrakis is a Senior Technical Product Manager on the OpenSearch project of Amazon Web Services. He is passionate about giving customers the tools to improve the quality of their search results.