How we’re learning to explain AI terms for young people and educators

Post Syndicated from Veronica Cucuiat original https://www.raspberrypi.org/blog/explaining-ai-terms-young-people-educators/

What do we talk about when we talk about artificial intelligence (AI)? It’s becoming a cliche to point out that, because the term “AI” is used to describe so many different things nowadays, it’s difficult to know straight away what anyone means when they say “AI”. However, it’s true that without a shared understanding of what AI and related terms mean, we can’t talk about them, or educate young people about the field.

A group of young people demonstrate a project at Coolest Projects.

So when we started designing materials for the Experience AI learning programme in partnership with leading AI unit Google DeepMind, we decided to create short explanations of key AI and machine learning (ML) terms. The explanations are doubly useful:

  1. They ensure that we give learners and teachers a consistent and clear understanding of the key terms across all our Experience AI resources. Within the Experience AI Lessons for Key Stage 3 (age 11–14), these key terms are also correlated to the target concepts and learning objectives presented in the learning graph. 
  2. They help us talk about AI and AI education in our team. Thanks to sharing an understanding of what terms such as “AI”, “ML”, “model”, or “training” actually mean and how to best talk about AI, our conversations are much more productive.

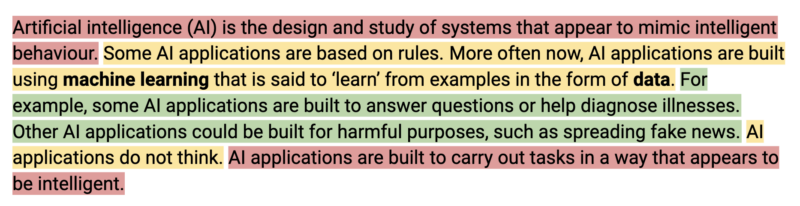
As an example, here is our explanation of the term “artificial intelligence” for learners aged 11–14:

Artificial intelligence (AI) is the design and study of systems that appear to mimic intelligent behaviour. Some AI applications are based on rules. More often now, AI applications are built using machine learning that is said to ‘learn’ from examples in the form of data. For example, some AI applications are built to answer questions or help diagnose illnesses. Other AI applications could be built for harmful purposes, such as spreading fake news. AI applications do not think. AI applications are built to carry out tasks in a way that appears to be intelligent.

You can find 32 explanations in the glossary that is part of the Experience AI Lessons. Here’s an insight into how we arrived at the explanations.

Reliable sources

In order to ensure the explanations are as precise as possible, we first identified reliable sources. These included among many others:

Explaining AI terms to Key Stage 3 learners: Some principles

Vocabulary is an important part of teaching and learning. When we use vocabulary correctly, we can support learners to develop their understanding. If we use it inconsistently, this can lead to alternate conceptions (misconceptions) that can interfere with learners’ understanding. You can read more about this in our Pedagogy Quick Read on alternate conceptions.

Some of our principles for writing explanations of AI terms were that the explanations need to: 

  • Be accurate
  • Be grounded in education research best practice
  • Be suitable for our target audience (Key Stage 3 learners, i.e. 11- to 14-year-olds)
  • Be free of terms that have alternative meanings in computer science, such as “algorithm”

We engaged in an iterative process of writing explanations, gathering feedback from our team and our Experience AI project partners at Google DeepMind, and adapting the explanations. Then we went through the feedback and adaptation cycle until we all agreed that the explanations met our principles.

A real banana and an image of a banana shown on the screen of a laptop are both labelled "Banana".
Image: Max Gruber / Better Images of AI / Ceci n’est pas une banane / CC-BY 4.0

An important part of what emerged as a result, aside from the explanations of AI terms themselves, was a blueprint for how not to talk about AI. One aspect of this is avoiding anthropomorphism, detailed by Ben Garside from our team here.

As part of designing the the Experience AI Lessons, creating the explanations helped us to:

  • Decide which technical details we needed to include when introducing AI concepts in the lessons
  • Figure out how to best present these technical details
  • Settle debates about where it would be appropriate, given our understanding and our learners’ age group, to abstract or leave out details

Using education research to explain AI terms

One of the ways education research informed the explanations was that we used semantic waves to structure each term’s explanation in three parts: 

  1. Top of the wave: The first one or two sentences are a high-level abstract explanation of the term, kept as short as possible, while introducing key words and concepts.
  2. Bottom of the wave: The middle part of the explanation unpacks the meaning of the term using a common example, in a context that’s familiar to a young audience. 
  3. Top of the wave: The final one or two sentences repack what was explained in the example in a more abstract way again to reconnect with the term. The end part should be a repeat of the top of the wave at the beginning of the explanation. It should also add further information to lead to another concept. 

Most explanations also contain ‘middle of the wave’ sentences, which add additional abstract content, bridging the ‘bottom of the wave’ concrete example to the ‘top of the wave’ abstract content.

Here’s the “artificial intelligence” explanation broken up into the parts of the semantic wave:

  • Artificial intelligence (AI) is the design and study of systems that appear to mimic intelligent behaviour. (top of the wave)
  • Some AI applications are based on rules. More often now, AI applications are built using machine learning that is said to ‘learn’ from examples in the form of data. (middle of the wave)
  • For example, some AI applications are built to answer questions or help diagnose illnesses. Other AI applications could be built for harmful purposes, such as spreading fake news (bottom of the wave)
  • AI applications do not think. (middle of the wave)
  • AI applications are built to carry out tasks in a way that appears to be intelligent. (top of the wave)
Our "artificial intelligence" explanation broken up into the parts of the semantic wave.
Our “artificial intelligence” explanation broken up into the parts of the semantic wave. Red = top of the wave; yellow = middle of the wave; green = bottom of the wave

Was it worth our time?

Some of the explanations went through 10 or more iterations before we agreed they were suitable for publication. After months of thinking about, writing, correcting, discussing, and justifying the explanations, it’s tempting to wonder whether I should have just prompted an AI chatbot to generate the explanations for me.

A window of three images. On the right is a photo of a big tree in a green field in a field of grass and a bright blue sky. The two on the left are simplifications created based on a decision tree algorithm. The work illustrates a popular type of machine learning model: the decision tree. Decision trees work by splitting the population into ever smaller segments. I try to give people an intuitive understanding of the algorithm. I also want to show that models are simplifications of reality, but can still be useful, or in this case visually pleasing. To create this I trained a model to predict pixel colour values, based on an original photograph of a tree.
Rens Dimmendaal & Johann Siemens / Better Images of AI / Decision Tree reversed / CC-BY 4.0

I tested this idea by getting a chatbot to generate an explanation of “artificial intelligence” using the prompt “Explain what artificial intelligence is, using vocabulary suitable for KS3 students, avoiding anthropomorphism”. The result included quite a few inconsistencies with our principles, as well as a couple of technical inaccuracies. Perhaps I could have tweaked the prompt for the chatbot in order to get a better result. However, relying on a chatbot’s output would mean missing out on some of the value of doing the work of writing the explanations in collaboration with my team and our partners.

The visible result of that work is the explanations themselves. The invisible result is the knowledge we all gained, and the coherence we reached as a team, both of which enabled us to create high-quality resources for Experience AI. We wouldn’t have gotten to know what resources we wanted to write without writing the explanations ourselves and improving them over and over. So yes, it was worth our time.

What do you think about the explanations?

The process of creating and iterating the AI explanations highlights how opaque the field of AI still is, and how little we yet know about how best to teach and learn about it. At the Raspberry Pi Foundation, we now know just a bit more about that and are excited to share the results with teachers and young people.

You can access the Experience AI Lessons and the glossary with all our explanations at experience-ai.org. The glossary of AI explanations is just in its first published version: we will continue to improve it as we find out more about how to best support young people to learn about this field.

Let us know what you think about the explanations and whether they’re useful in your teaching. Onwards with the exciting work of establishing how to successfully engage young people in learning about and creating with AI technologies.

The post How we’re learning to explain AI terms for young people and educators appeared first on Raspberry Pi Foundation.

Zabbix SNMP monitoring one-day training course

Post Syndicated from Arturs Lontons original https://blog.zabbix.com/zabbix-snmp-monitoring-one-day-training-course/25746/

SNMP – Simple network management protocol is a networking protocol that is extremely prevalent in network hardware such as switches and routers, as well as a variety of other devices such as printers, power supplies and even regular server hosts. Depending on the device, a wide array of metrics can be retrieved by using SNMP without the need to deploy any additional software on the target device. Our newly introduced Zabbix SNMP monitoring one-day extra course will teach you all you need to know about SNMP and how to use Zabbix to get the most out of your SNMP devices with the most optimal data collection approach.

Course contents

The goal of the course is to introduce the core concepts behind SNMP and provide the attendees with the skills necessary to extract the required metrics from SNMP endpoints. The course covers topics such as:

  • SNMP core concepts
  • SNMP command line utilities
  • Differences between SNMP versions
  • SNMP resource discovery with Zabbix Low-level discovery feature
  • Optimizing SNMP data collection with the SNMP walk[*] item introduced in Zabbix 6.4
  • Configuring and monitoring SNMP traps

The course will be hosted by a Zabbix Certified Trainer with thorough experience in SNMP monitoring and Zabbix configuration. The courses are designed with open Q&A sessions in mind, where attendees can discuss their current and potential use cases and how the course contents can be applied to their own real-life scenarios.

Zabbix Certified Specialist on-site training

SNMP monitoring in Zabbix 6.4 and newer versions

Zabbix 6.4 introduces a whole new approach to bulk SNMP monitoring – the walk[*] item. During the course, attendees will learn how the new bulk data collection approach greatly increases the metric collection speed and reduces the potential performance impact on the monitoring endpoint. The course covers the main differences between the old and new approaches and demonstrates how the new SNMP items can be configured in the correct manner. Trainers will also demonstrate and provide the opportunity to practice SNMP resource discovery with the new walk[*] item and Zabbix low-level discovery (LLD) features.

Practical tasks

Depending on the device and vendor, configuring SNMP monitoring can be both very simple or it may require understanding the underlying OID structure to find the data that you’re looking for. To guide our students through real-life scenarios in understanding how SNMP monitoring may differ across devices and vendors, the course includes practical tasks, during which the participants will get the opportunity to configure Zabbix SNMP monitoring for an array of network devices belonging to a selection of the most popular vendors, such as Cisco, HP and Mikrotik. By the end of the course, students will have both a theoretical and practical understanding of SNMP as a protocol and how it can be used by Zabbix for metric collection and problem detection.

At the end of the course, every attendee will receive the course attendance certificate.

Sign up for the SNMP monitoring Zabbix training course and check our other one-day extra courses by visiting the Zabbix Training Extra Courses page.

The post Zabbix SNMP monitoring one-day training course appeared first on Zabbix Blog.

AWS Week in Review – Automate DLQ Redrive for SQS, Lambda Supports Ruby 3.2, and More – June 12, 2023

Post Syndicated from Marcia Villalba original https://aws.amazon.com/blogs/aws/aws-week-in-review-automate-dlq-redrive-for-sqs-lambda-supports-ruby-3-2-and-more-june-12-2023/

Today I’m boarding a plane for Madrid. I will attend the AWS Summit Madrid this Thursday, and I will take Serverlesspresso with me. Serverlesspresso is a demo that we take to events, in where you can learn how to build event-driven architectures with serverless. If you are visiting an AWS Summit, most probably you will find one of our booths.

Serverlesspresso at Madrid

Last Week’s Launches
Here are some launches that got my attention during the previous week.

Amazon SQS – Customers were very excited when we announced the DLQ redrive for Amazon SQS as that feature helped them to easily redirect the failed messages. This week we added support for AWS SDK and CLI for this feature, allowing you to redrive the messages on the DLQ automatically, making it even easier to use this feature. You can read Seb’s blog post about this new feature to learn how to get started.

AWS Lambda – AWS Lambda now supports Ruby 3.2. Ruby 3.2 has many new improvements, for example, passing anonymous arguments to functions or having endless methods. Check out this blog post that goes in depth into each of the new features.

Amazon Fraud DetectorAmazon Fraud Detector supports event orchestration with Amazon EventBridge. This is a very important feature because now you can act on the different events that Fraud Detector emits, for example, send notifications to different stakeholders.

AWS Glue – This week, AWS Glue made two important announcements. First, it announced the general availability of AWS Glue for Ray, a new data integration engine option for AWS Glue. Ray is a popular new open-source compute framework that helps developers to scale their Python workloads. In addition, AWS Glue announced AWS Glue Data Quality, a new capability that automatically measures and monitors data lake and data pipeline quality.

Amazon Elastic Container Registry (Amazon ECR)AWS Signer and Amazon ECR announced a new feature that allows you to sign and verify container images. You can use Signer to validate that only container images you have approved are deployed in your Amazon Elastic Kubernetes Service (Amazon EKS) clusters.

Amazon QuickSightAmazon QuickSight now supports APIs to automate asset deployment, so you can replicate the same QuickSight assets in multiple Regions and account easily. You can read more on how to use those APIs in this blog post.

For a full list of AWS announcements, be sure to keep an eye on the What’s New at AWS page.

Other AWS News
Some other updates and news that you may have missed:

Upcoming AWS Events
Check your calendars and sign up for these AWS events:

  • AWS Silicon Innovation Day (June 21) – A one-day virtual event that focuses on AWS Silicon and how you can take advantage of AWS’s unique offerings. Learn more and register here.
  • AWS Global Summits – There are many summits going on right now around the world: Toronto (June 14), Madrid (June 15), and Milano (June 22).
  • AWS Community Day – Join a community-led conference run by AWS user group leaders in your region: Chicago (June 15), Manila (June 29–30), Chile (July 1), and Munich (September 14).
  • CDK Day CDK Day is happening again this year on September 29. The call for papers for this event is open, and this year we are also accepting talks in Spanish. Submit your talk here.

That’s all for this week. Check back next Monday for another Week in Review!

This post is part of our Week in Review series. Check back each week for a quick roundup of interesting news and announcements from AWS!

— Marcia

Improve table readability and identify outliers with data bars in Amazon QuickSight

Post Syndicated from Bhupinder Chadha original https://aws.amazon.com/blogs/big-data/improve-table-readability-and-identify-outliers-with-data-bars-in-amazon-quicksight/

Amazon QuickSight is a scalable, serverless, machine learning (ML)-powered business intelligence (BI) solution that makes it simple to connect to your data, create interactive dashboards, get access to ML-enabled insights, enable natural language querying of your data, and share visuals and dashboards with tens of thousands of internal and external users, either within QuickSight itself or embedded into any application.

Recently, we launched some new features for tables and pivot tables in QuickSight centered around interactivity and performance. These new features enabled users to alter field visibility, load tables faster, and build consistency across different interactions. In the continuous streak of providing rich user experiences and readability, QuickSight is now introducing data bars for table visual.

In this post, we demonstrate how to use data bars to improve table readability and identify outliers.

Introduction to data bars

Tables are a popular way of organizing and presenting data, but it could be difficult for reading and understanding data, especially in large datasets. One way to make table presentation effective is to provide a visual representation with data bars.

Data bars are essentially bar charts displayed for a given column, where the length of the bar represents each cell value relative to the range of values within the same column. Data bars are very efficient in enabling user focus on outliers and emerging data patterns or trends, especially when dealing with large volumes of data. Data bars improve the readability and navigation of complex tables by integrating tabular data with visualizations. Their visual nature enables quick comprehension and understanding, making them a popular choice for displaying and analyzing data. With QuickSight, you can now use data bars on numeric fields and adjust your color scheme for both positive and negative values individually.

Solution overview

Our use case focuses on AnyHealth Inc., a large hospital corporation in the US. They manage different hospitals across different regions of the country. As part of their analytics requirements, they want to be able to quickly find outliers and determine health economics outcomes. They use QuickSight for their visualizations. With the recent addition of data bars to the available table visuals, AnyHealth can get these insights with ease. Not only that, they can also get the information by reading through the cells. With data bars, they are instantly able to identify the outliers visually, identify values that significantly deviate from rest of the data, and monitor emerging trends. With data bars, understanding and reading the tables has been a breeze.

In the following sections, we examine two use cases using data bars in QuickSight.

Identify outliers with data bars visually

To add a table visual to the analysis with data bars, we create a table visual with at least one metric in the Values field well. In this example, we create a table to load profits across various hospitals and categories. The following screenshot shows our initial data.

Complete the following steps to configure a visualization:

  1. On the table visual, choose the pencil icon to open the Format visual navigation pane.
  2. In the navigation pane, expand the Visuals drop-down menu and choose ADD DATA BARS.
  3. For Value field, choose Profit. By default, data bars are configured for two colors: green for positive values and red for negative values.

Note: Data bars are applicable only on the Values field of the visual.

  1. To further configure these colors, choose the paint bucket icon and choose your preferred color.
  2. Close the Data bars menu.

The data bars visualization now appears in the table and an instant outlier can be identified at South Hospital in Ante/Post Partum category.

Display various metrics on the same scale

AnyHealth often has several metrics that they want to visualize and compare side by side, sliced by a single dimension on a same metric scale. For this use case, they want to visualize revenue, profit, and price sliced by the Hospital dimension. Having all these metrics on the same scale is challenging because the numbers vary greatly. With data bars, AnyHealth was able to achieve this in a very simple and clean way, which enabled them to show their data without additional calculations.

The following screenshot shows the example implementation.

Conclusion

In this post, we looked at the data bars feature in QuickSight, its various use cases, and how to configure them. With data bars, you can analyze and quickly scan a table to see the values of a cell. Furthermore, you can use data bars to identify outliers visually that deviate from the rest of the data. Data bars can be very powerful when it comes to understanding and reading data in tables. Start using data bars to enrich your dashboards’ current visualization and unlock new business use cases today!

If you have any questions or feedback, please leave a comment.

For additional discussions and help getting answers to your questions, check out the QuickSight Community.


About the authors

Bhupinder Chadha is a senior product manager for Amazon QuickSight focused on visualization and front end experiences. He is passionate about BI, data visualization and low-code/no-code experiences. Prior to QuickSight he was the lead product manager for Inforiver, responsible for building a enterprise BI product from ground up. Bhupinder started his career in presales, followed by a small gig in consulting and then PM for xViz, an add on visualization product.

Raji Sivasubramaniam is a Sr. Solutions Architect at AWS, focusing on Analytics. Raji is specialized in architecting end-to-end Enterprise Data Management, Business Intelligence and Analytics solutions for Fortune 500 and Fortune 100 companies across the globe. She has in-depth experience in integrated healthcare data and analytics with wide variety of healthcare datasets including managed market, physician targeting and patient analytics.

Srikanth Baheti is a Specialized World Wide Principal Solution Architect for Amazon QuickSight. He started his career as a consultant and worked for multiple private and government organizations. Later he worked for PerkinElmer Health and Sciences & eResearch Technology Inc, where he was responsible for designing and developing high traffic web applications, highly scalable and maintainable data pipelines for reporting platforms using AWS services and Serverless computing.

CVE-2023-27997: Critical Fortinet Fortigate Remote Code Execution Vulnerability

Post Syndicated from Drew Burton original https://blog.rapid7.com/2023/06/12/etr-cve-2023-27997-critical-fortinet-fortigate-remote-code-execution-vulnerability/

CVE-2023-27997: Critical Fortinet Fortigate Remote Code Execution Vulnerability

On July 9, 2023, Fortinet silently patched a purported critical remote code execution (RCE) vulnerability in Fortigate SSL VPN firewalls. According to Lexfo Security’s Charles Fol, who discovered the vulnerability, the flaw is heap-based and reachable pre-authentication on every SSL VPN appliance. Fortinet is expected to publish their advisory for CVE-2023-27997 tomorrow, June 13, 2023. The company has a history of issuing security patches prior to disclosing critical vulnerabilities. Presumably, this policy is meant to give customers time to update their devices before threat actors exploit flaws, but in practice, it gives attackers a head start on attack development while keeping vulnerable organizations in the dark.

Rapid7 is not aware of any exploitation of this vulnerability at time of writing. We do expect CVE-2023-27997 will be leveraged by attackers, but heap-based exploits are notoriously tricky, and it’s unlikely that we’ll see automated exploitation at scale. Nevertheless, we recommend that Fortigate customers update immediately as a matter of habit, despite the fact that Fortinet’s advisory is not yet available. According to reports, security fixes were released on Friday in FortiOS firmware versions 6.0.17, 6.2.15, 6.4.13, 7.0.12, and 7.2.5.

As of June 12, there were roughly 210,700 Fortigate devices with the SSL VPN component exposed to the public internet, the majority of which are in the United States, followed by Japan and Taiwan.

Fortinet device vulnerabilities are historically popular with attackers of all skill levels, though exploitability varies on a vuln-by-vuln basis. The U.S. government recently released a security bulletin that highlighted state-sponsored threat actors gaining access to networks via Fortigate devices. Fortinet vulnerabilities are also popular with initial access broker groups that sell access to potential victims’ networks to ransomware groups.

Affected Products

To date these are the reported affected versions of the Fortigate devices configured as SSL VPNs :

  • 7.0.12
  • 7.2.5
  • 6.4.13
  • 6.2.15

Remediation

Update FortiOS firmware to version 6.0.17, 6.2.15, 6.4.13, 7.0.12, or 7.2.5 as soon as possible.

Rapid7 customers

An authenticated check for CVE-2023-27997 is in development and expected to be available to InsightVM and Nexpose customers in today’s (June 12, 2023) content release.

How to send geofenced marketing messages using Amazon Pinpoint

Post Syndicated from Zach Elliott original https://aws.amazon.com/blogs/messaging-and-targeting/send-geofenced-marketing-messages-using-amazon-pinpoint/

Introduction

Geofencing, which creates a virtual geographical boundary that triggers a marketing action to a mobile device when a user enters or exits that boundary, can be used in marketing messages to drive more traffic and increase conversions. Amazon Pinpoint, AWS’ multichannel communication tool, can be used to create mobile notifications using geofencing technology, so customers receive notifications about a business when they’re close by that physical location.

Ways retailers can use geofencing:

There are a number of different use cases that retail or location-based businesses can use geofencing to drive customer conversions:

  1. Target the customer with real-time offers and promotions when the customer is near the store: Detecting and establishing an interaction with the customer while in the store improves the customer experience. Using geofencing, retailers will be able to detect the presence and will be able to send coupon or promotional notifications.
  2. Improve product search in the store: As the consumer enters the geofenced store, activate the product search for the store to help the consumer to search and navigate easily within the store.
  3. Get more information about the customer in the store: Retailers will be able to collect more accurate consumer behavior inside the store by recording the interaction between the consumers and product search, and using geofencing and position to calculate the dwell time inside the store or how long the consumer is waiting in the queue.

In this blog we will talk about how you can use Amazon Location Service to trigger a notification using Amazon Pinpoint when a consumer enters a geofenced store.

Architecture Overview

Architecture Overview for Pinpoint and Geofencing Solution

Fig. 1: Geofencing and Pinpoint – Sample Architecture

Figure 1 depicts the solution architecture and resources deployed by the AWS CloudFormation Template, described in more detail in later sections. In the solution workflow:

  1.  Store Management defines a Geofence around store locations they wish to enroll using Amazon Location Service Geofencing and circular geofences.
  2. A customer who has opted into location tracking using the app will update an Amazon Location Service Tracker Resource. This tracker will be evaluated against the store geofences.
  3. If a geofence ENTER event is triggered, a message is sent to Amazon EventBridge.
  4. EventBridge will trigger an AWS Lambda function.
  5. The Lambda function looks up the Store Information in an Amazon DynamoDB table that matches the geofence ID in order to enrich the email.
  6. Event is sent to a Pinpoint Journey with information from the Geofence event as well as store info.
  7. Personalized email is sent to customer via Pinpoint

Configuring AWS Cloudformation

To deploy the Amazon Location Service resources as well as EventBridge, DynamoDB, and Lambda, we have created an AWS Cloudformation Template.

Use this link to launch the CloudFormation stack in the US-West-2 region. Selecting the button next to “I acknowledge that AWS CloudFormation might create IAM resources.” click Create stack

Fig 2. Cloudformation Console

Fig. 2: AWS CloudFormation Console showing stack options.

Once the stack is complete. We can begin configuring Pinpoint.

Configuring Pinpoint

Our project was created for us via the CloudFormation template, but we still need to configure some items in Pinpoint. First, we’ll set up our email identity to send and receive messages from; for the purposes of this blog, you’ll use the same email address for sending and receiving the email, but in a production environment, your sending identity could either be a specific email address you’ve verified for messaging, or an entire email domain you’ve verified via DNS.

Configuring email channel

Adding an email

  1. On the left-side Pinpoint menu, expand the Email option and choose Email identities
  2. Select Verify email identity
  3. Enter an email address you have access to for the confirmation step
  4. Select Verify email address
Fig. 3: Verifying email identity

Fig. 3: AWS Console showing email verification

Fig. 4: Email verification options

Fig. 4: Email verification options

Now, check your inbox for a verification email. It should look something like this:

Fig. 5: Email Verification message from Amazon Pinpoint

Fig. 5: Email Verification message from Amazon Pinpoint

Click the link to verify your email address. Now we can begin sending and receiving messages at this address.

Now that we have a verified email, we can configure the email channel.

Configuring the email channel

  1. On the left-side Pinpoint menu, navigate to All projects and select CoffeeShop
  2. Navigate to Settings and select Email
  3. Select Edit next to Identity details
  4. Select the checkbox for Enable the email channel for this project
  5. Select Use an existing email address and select the address you verified in the previous step.
  6. Select Save
Fig. 6: Configuring the email channel

Fig. 6: Configuring the email channel

Configuring email template

Next, we need to define what our email looks like that is sent to our customers when they enter a geofence. We’ve provided HTML code for a basic Coffee Shop template here

Configure email template

  1. On the left-side Pinpoint menu, navigate to Message templates, select Create template
  2. Name the template CoffeeShopGeoTarget and set the subject to “We haven’t seen you in a while”
  3. Paste the contents of the HTML template into the Message field.
  4. Select Create
Fig. 7: Configuring the email template

Fig. 7: Configuring the email template

You can see multiple attributes are used in the template. These attributes come from our segment in the case of FirstName, and DynamoDB in the case of the store name and address.

Configuring email segment

Now we need to define who we are going to send an email to. For this, we need to set up our segment within Pinpoint. We’ve provided a sample segment file here. Download this file and open it in a text editor.

Fig. 8: Configuring the email segment

Fig. 8: Configuring the email segment

Replace all the values with your own information . The email needs to be the same email we verified in an earlier step. Create a UserID for the user that can be used to uniquely identify them. Leave ChannelType as “EMAIL” to indicate we are using the email channel in Pinpoint, and leave OptOut as “NONE” which indicates the user would like to receive all communications and has not opted-out of receiving notifications. Once the information is edited, save the file.

Importing the segment

  1. On the left-side Pinpoint menu, navigate to All projects, and select your CoffeeShop Project
  2. Navigate to Segments and select Import a segment
  3. Drag the downloaded csv file into the Drop files here box.
  4. Select Create Segment
Fig. 9: Importing a segment

Fig. 9: Importing a segment

Configuring Journey

In this post, we will be setting up a very simple Journey that sends an email anytime a user enters a geofence. If we wanted to go a step farther, we could add additional activities later in the Journey such as determining if the customer purchased something based on receiving the email, and sending them targeted emails based on the drink they ordered.
Now that we’ve added the email channel, we can set up our journey.

Configuring journey entry

  1. On the left-side Pinpoint menu, navigate to the CoffeeShop Project and select Journeys
  2. Select Create journey
  3. Name the journey “CoffeeShopGeoTarget
  4. Set the entry condition to “geofence enter”
  5. Select Save
Fig. 10: Journey event configuration

Fig. 10: Journey event configuration

Configuring journey activity

  1. Select the Add activity icon
  2. Select Send an email from the dropdown
  3. Choose the email template we created earlier
  4. Enter the verified email we configured earlier
  5. Select Save
Fig. 11: Journey email destination configuration

Fig. 11: Journey email destination configuration

Reviewing Journey

  1. Select Review
  2. Select Mark as reviewed
  3. Select Publish
Fig. 12: Reviewing the Journey

Fig. 12: Reviewing the Journey

Once we publish our journey, a 5 minute timer will start, which will give us time to set up our tracking environment.

Configuring Amazon Location Resources

Now that we’ve configured Pinpoint to send geotargeted emails, we need to set up our Geofences as well as emulate a person passing nearby our coffee shops. To do that, we will use the AWS CLI and AWS Cloudshell .

To open AWS CloudShell, select it in the upper right near the region selection.

Fig. 13: Location of AWS Cloudshell in the AWS Console

Fig. 13: Location of AWS Cloudshell in the AWS Console

AWS CloudShell will now open in the bottom half of the AWS Console , note it may take up to a minute on first launch. First, we’ll create our geofences. For this, we will use Circular geofences around a point location. In this case, we will create two geofences, one for a Coffee shop at Amazon’s Doppler office, and one for a shop at Amazon’s Nitro North office. These correlate with the DynamoDB store information table.

aws location put-geofence --collection-name StoreCollection --geofence-id store_1508 --geometry 'Circle={Center=[-122.33826293063228, 47.61530011310656], Radius=100}'

Successful Geofence creation will create output similar to the below:

{
"CreateTime": "2023-04-21T19:31:57.807000+00:00",
"GeofenceId": "store_1508",
"UpdateTime": "2023-04-21T19:31:57.807000+00:00"
}

Next we create our second geofence:

aws location put-geofence --collection-name StoreCollection --geofence-id store_1509 --geometry 'Circle={Center=[-122.34051934099395, 47.61751544952795], Radius=100}'

Successful Geofence creation will create output similar to the below:

{
"CreateTime": "2023-04-21T19:32:41.980000+00:00",
"GeofenceId": "store_1509",
"UpdateTime": "2023-04-21T19:32:41.980000+00:00"
}

Now that our geofences are created, we can emulate a person walking by and triggering a geofence. We will do this using Amazon Location Service Trackers. In CloudShell, enter the following command:

aws location batch-update-device-position --tracker-name CustomerDevices --updates Accuracy={Horizontal=0},DeviceId=111,Position=-122.33811005706218,47.61541094771129,SampleTime=$(date +%s)

When this command is issued, a geofence is then evaluated which will trigger an event sent to Amazon EventBridge. This event then triggers a Lambda, which creates an event with Pinpoint. This triggers the Journey, which sends an email.

Now check your email, you should see a customized email with the store you were close to and your name . Note because we are not using domain verification, you may receive a warning on the email message. See our documentation on how to use domain verification.

Fig. 14: Email received from Amazon Pinpoint

Fig. 14: Email received from Amazon Pinpoint

Next Steps

For this blog, we used the default Journey configuration. However, we can further optimize our Journey by following Tips and best practices for journeys. You can also set up push notifications or in-app notifications to further optimize the customer experience to catch them in the moment they walk by, instead of when they may check their email next. You can read more about push notifications here.

Clean up

Deleting CloudFormation template

  1. In the AWS Console, navigate to the AWS CloudFormation console. Select the PinpointGeotarget stack
  2. Select Delete Stack

Deleting Pinpoint resources

  1. In the AWS Console, navigate to the Pinpoint Console
  2. Select Message templates
  3. Select the CoffeeShop template
  4. Select Delete then confirm you wish to delete it

Removing email identity

  1. In the AWS Console, navigate to the Pinpoint Console
  2. Navigate to Email, and select Email identities
  3. Select the radio button next to the verified email you configured
  4. Select Remove email identity
  5. Type Delete to confirm the removal

Conclusion

In this post, we explored how you can detect the presence of the customer whenever they cross near the geofenced physical store, using Amazon Location Service in which Amazon EventBridge receives the event, triggers an AWS Lambda function, and then triggers a Journey in Amazon Pinpoint to send a notification to the customer with a coupon.

Further more, integrating this solution with your customer data platform and with Amazon Personalize will help you to personalize the promotions and vouchers to fit the tastes and tendencies of customers

Zach Elliott works as a Solutions Architect focusing on Amazon Location Service at AWS. He is passionate about helping customers build geospatial solutions on AWS. He is also part of the IoT Subject Matter Expert community at AWS and loves helping customers develop unique IoT-based solutions.

Anshul Srivastava Headshot

With an illustrious track record as a technology thought-leader, Anshul joined AWS in 2016 and is the EMEA technology leader for retail. He is responsible for defining and executing the company’s retail technology strategy, which includes building retail-focused solutions with services like Amazon Forecast and Amazon Personalize, as well as experiences like Frictionless Shopping with AI/ML and IoT services from AWS. Anshul also works very closely with AWS global retail customers to help transform their businesses with cutting-edge AWS technologies.

Joulica unifies real-time and historical customer experience analytics with Amazon QuickSight

Post Syndicated from Tony McCormack original https://aws.amazon.com/blogs/big-data/joulica-unifies-real-time-and-historical-customer-experience-analytics-with-amazon-quicksight/

This is a guest post by Tony McCormack from Joulica.

Joulica is an Ireland-based startup in the contact center industry. Our founders previously led contact center research and development for a global contact center technology provider, and we founded Joulica because we saw that the shift to the cloud and growing demand for data and analytics would transform the customer service industry. Our platform delivers real-time and historical analytics across the wide variety of data sources and customer interaction channels that are now common in most organizations.

It is our mission to make customer experience analytics accessible to all users in an organization. Our customers need to have instant access to the current state of ongoing customer engagements as well trends and historical data patterns. They find it difficult to harness all of the data sources needed to achieve this, particularly in real time. To help solve this problem, we chose Amazon QuickSight, a cloud-native business intelligence tool that allows you to embed insightful analytics into any application with customized, interactive visuals and dashboards.

In this post, we discuss how QuickSight has allowed us to achieve our goal of unifying real-time and historical analytics for our customers.

Embedding QuickSight to provide a 360-degree view

At Joulica, our specialty is real-time analytics. Real-time analytics means that as soon as new data is available, analytics are updated, including any visualizations that are currently being viewed by end-users. The rich embedding capability of QuickSight allowed us to use QuickSight for historical analytics and our technology for real-time analytics, all in one place. Visual embedding with QuickSight has saved us greater than two resource years of research and development time, enabling us to serve customers sooner. We have also been able integrate Joulica real-time analytics into QuickSight dashboards—so within QuickSight, our users can use both standard QuickSight visualizations and Joulica widgets, as shown in the following example.

Our customer journey analytics go beyond typical contact center reporting, and stitches together how customers interact with organizations across channels. By pushing our analytics to QuickSight, we allow users to dive deep into patterns as well as individual customer journeys.

Integration with Amazon Connect and other AWS services

One of the main reasons we chose QuickSight was because of its alignment with Amazon Connect and the extended set of Contact Center services that AWS provides. As the leading provider of analytics for Amazon Connect, this was essential. We are deeply integrated with the full capabilities of Amazon Connect, including Amazon Lex and Contact Lens. In the preceding example of a QuickSight dashboard, we see that as soon as a KPI is updated, the visualization automatically updates. Behind the scenes, Joulica is ingesting Agent Event Streams, Contact Events, and a host of real-time data feeds from Amazon Connect, analyzing them and pushing a stream of real-time analytics to these widgets. This enables our customers to have up-to-date information, in addition to the historical context, empowering them to improve contact center performance and make better decisions. This is all visualized within QuickSight.

We can also ingest data from Amazon Kinesis and Apache Kafka, allowing live analytics from additional data sources to be visualized.

Empowering our customers with insights in QuickSight

The key goals driving the need for analytics in the contact center industry are customer experience optimization as well as efficiency gains. This is relevant across all customer touchpoints, including digital channels, traditional contact center channels, and emerging areas such as social and smart devices. In addition to KPIs related to service levels and agent performance, organizations need access to customer feedback and sentiment analytics, as well as an explanation of how these are related to business performance such as sales and customer retention. With QuickSight, we can offer out-of-the box analytics for all of these areas. The following example shows how easy it is to use the Quicksight visual embedding feature to extend one of our real-time visualizations to show a geographic breakdown of customer survey results.

Thanks to the QuickSight and AWS pay-as-you-go pricing model, we can provide real-time and historical embedded analytics to our customers automatically. We have saved significantly by choosing QuickSight, both in cost and development time, and the cost savings provided by Quicksight is passed down to our customers. Like AWS, our pricing is usage-based, meaning that our customers can scale as their operations grow.

We currently have customers in North America, United Kingdom, the EU, and APAC. As we continue to grow, we plan to explore other QuickSight features like Amazon QuickSight Q, as we pursue providing more ways for our customers to analyze, visualize, and interpret their contact center data.

To learn more about how you can embed customized data visuals and interactive dashboards into any application, visit Amazon QuickSight Embedded. To learn more about Joulica, please visit Joulica.io.


About the Author

Tony McCormack is the CEO and Co-founder of Joulica. Based in Galway, Ireland, he is focused on providing enterprise-grade reporting and analytics for Amazon Connect, Salesforce Service Cloud, and other platforms in the customer experience market. He has extensive experience in the contact center domain, with a passion for real-time analytics and their integration into end-user applications.

AWS Glue streaming application to process Amazon MSK data using AWS Glue Schema Registry

Post Syndicated from Vivekanand Tiwari original https://aws.amazon.com/blogs/big-data/aws-glue-streaming-application-to-process-amazon-msk-data-using-aws-glue-schema-registry/

Organizations across the world are increasingly relying on streaming data, and there is a growing need for real-time data analytics, considering the growing velocity and volume of data being collected. This data can come from a diverse range of sources, including Internet of Things (IoT) devices, user applications, and logging and telemetry information from applications, to name a few. By harnessing the power of streaming data, organizations are able to stay ahead of real-time events and make quick, informed decisions. With the ability to monitor and respond to real-time events, organizations are better equipped to capitalize on opportunities and mitigate risks as they arise.

One notable trend in the streaming solutions market is the widespread use of Apache Kafka for data ingestion and Apache Spark for streaming processing across industries. Amazon Managed Streaming for Apache Kafka (Amazon MSK) is a fully managed Apache Kafka service that offers a seamless way to ingest and process streaming data.

However, as data volume and velocity grow, organizations may need to enrich their data with additional information from multiple sources, leading to a constantly evolving schema. The AWS Glue Schema Registry addresses this complexity by providing a centralized platform for discovering, managing, and evolving schemas from diverse streaming data sources. Acting as a bridge between producer and consumer apps, it enforces the schema, reduces the data footprint in transit, and safeguards against malformed data.

To process data effectively, we turn to AWS Glue, a serverless data integration service that provides an Apache Spark-based engine and offers seamless integration with numerous data sources. AWS Glue is an ideal solution for running stream consumer applications, discovering, extracting, transforming, loading, and integrating data from multiple sources.

This post explores how to use a combination of Amazon MSK, the AWS Glue Schema Registry, AWS Glue streaming ETL jobs, and Amazon Simple Storage Service (Amazon S3) to create a robust and reliable real-time data processing platform.

Overview of solution

In this streaming architecture, the initial phase involves registering a schema with the AWS Glue Schema Registry. This schema defines the data being streamed while providing essential details like columns and data types, and a table is created in the AWS Glue Data Catalog based on this schema. This schema serves as a single source of truth for producer and consumer and you can leverage the schema evolution feature of AWS Glue Schema Registry to keep it consistent as the data changes over time. Refer appendix section for more information on this feature. The producer application is able to retrieve the schema from the Schema Registry, and uses it to serialize the records into the Avro format and ingest the data into an MSK cluster. This serialization ensures that the records are properly structured and ready for processing.

Next, an AWS Glue streaming ETL (extract, transform, and load) job is set up to process the incoming data. This job extracts data from the Kafka topics, deserializes it using the schema information from the Data Catalog table, and loads it into Amazon S3. It’s important to note that the schema in the Data Catalog table serves as the source of truth for the AWS Glue streaming job. Therefore, it’s crucial to keep the schema definition in the Schema Registry and the Data Catalog table in sync. Failure to do so may result in the AWS Glue job being unable to properly deserialize records, leading to null values. To avoid this, it’s recommended to use a data quality check mechanism to identify such anomalies and take appropriate action in case of unexpected behavior. The ETL job continuously consumes data from the Kafka topics, so it’s always up to date with the latest streaming data. Additionally, the job employs checkpointing, which keeps track of the processed records and allows it to resume processing from where it left off in the event of a restart. For more information about checkpointing, see the appendix at the end of this post.

After the processed data is stored in Amazon S3, we create an AWS Glue crawler to create a Data Catalog table that acts as a metadata layer for the data. The table can be queried using Amazon Athena, a serverless, interactive query service that enables running SQL-like queries on data stored in Amazon S3.

The following diagram illustrates our solution architecture.

architecture diagram

For this post, we are creating the solution resources in the us-east-1 region using AWS CloudFormation templates. In the following sections, we will show you how to configure your resources and implement the solution.

Prerequisites

Create and download a valid key to SSH into an Amazon Elastic Compute Cloud (Amazon EC2) instance from your local machine. For instructions, see Create a key pair using Amazon EC2.

Configure resources with AWS CloudFormation

To create your solution resources, complete the following steps:

  1. Launch the stack vpc-subnet-and-mskclient using the CloudFormation template vpc-subnet-and-mskclient.template. This stack creates an Amazon VPC, private and public subnets, security groups, interface endpoints, an S3 bucket, an AWS Secrets Manager secret, and an EC2 instance.
    launch stack 1
  2. Provide parameter values as listed in the following table.

    Parameters Description
    EnvironmentName Environment name that is prefixed to resource names.
    VpcCIDR IP range (CIDR notation) for this VPC.
    PublicSubnet1CIDR IP range (CIDR notation) for the public subnet in the first Availability Zone.
    PublicSubnet2CIDR IP range (CIDR notation) for the public subnet in the second Availability Zone.
    PrivateSubnet1CIDR IP range (CIDR notation) for the private subnet in the first Availability Zone.
    PrivateSubnet2CIDR IP range (CIDR notation) for the private subnet in the second Availability Zone.
    KeyName Key pair name used to log in to the EC2 instance.
    SshAllowedCidr CIDR block for allowing SSH connection to the instance. Check your public IP using http://checkip.amazonaws.com/ and add /32 at the end of the IP address.
    InstanceType Instance type for the EC2 instance.
  3. When stack creation is complete, retrieve the EC2 instance PublicDNS and S3 bucket name (for key BucketNameForScript) from the stack’s Outputs tab.Cloudformation stack 1 - output
  4. Log in to the EC2 instance using the key pair you created as a prerequisite.
  5. Clone the GitHub repository, and upload the ETL script from the glue_job_script folder to the S3 bucket created by the CloudFormation template:
    $ git clone https://github.com/aws-samples/aws-glue-msk-with-schema-registry.git 
    $ cd aws-glue-msk-with-schema-registry 
    $ aws s3 cp glue_job_script/mskprocessing.py s3://{BucketNameForScript}/

  6. Launch another stack amazon-msk-and-glue using template amazon-msk-and-glue.template. This stack creates an MSK cluster, schema registry, schema definition, database, table, AWS Glue crawler, and AWS Glue streaming job.
    launch stack 1
  7. Provide parameter values as listed in the following table.

    Parameters Description Sample value
    EnvironmentName Environment name that is prefixed to resource names. amazon-msk-and-glue
    VpcId ID of the VPC for security group. Use the VPC ID created with the first stack. Refer to the first stack’s output.
    PrivateSubnet1 Subnet used for creating the MSK cluster and AWS Glue connection. Refer to the first stack’s output.
    PrivateSubnet2 Second subnet for the MSK cluster. Refer to the first stack’s output.
    SecretArn Secrets Manager secret ARN for Amazon MSK SASL/SCRAM authentication. Refer to the first stack’s output.
    SecurityGroupForGlueConnection Security group used by the AWS Glue connection. Refer to the first stack’s output.
    AvailabilityZoneOfPrivateSubnet1 Availability Zone for the first private subnet used for the AWS Glue connection.
    SchemaRegistryName Name of the AWS Glue schema registry. test-schema-registry
    MSKSchemaName Name of the schema. test_payload_schema
    GlueDataBaseName Name of the AWS Glue Data Catalog database. test_glue_database
    GlueTableName Name of the AWS Glue Data Catalog table. output
    ScriptPath AWS Glue ETL script absolute S3 path. For example, s3://bucket-name/mskprocessing.py. Use the target S3 path from the previous steps.
    GlueWorkerType Worker type for AWS Glue job. For example, Standard, G.1X, G.2X, G.025X. G.1X
    NumberOfWorkers Number of workers in the AWS Glue job. 5
    S3BucketForOutput Bucket name for writing data from the AWS Glue job. aws-glue-msk-output-{accId}-{region}
    TopicName MSK topic name that needs to be processed. test

    The stack creation process can take around 15–20 minutes to complete. You can check the Outputs tab for the stack after the stack is created.

    Cloudformation stack 2 output

    The following table summarizes the resources that are created as a part of this post.

    Logical ID Type
    VpcEndoint AWS::EC2::VPCEndpoint
    VpcEndoint AWS::EC2::VPCEndpoint
    DefaultPublicRoute AWS::EC2::Route
    EC2InstanceProfile AWS::IAM::InstanceProfile
    EC2Role AWS::IAM::Role
    InternetGateway AWS::EC2::InternetGateway
    InternetGatewayAttachment AWS::EC2::VPCGatewayAttachment
    KafkaClientEC2Instance AWS::EC2::Instance
    KeyAlias AWS::KMS::Alias
    KMSKey AWS::KMS::Key
    KmsVpcEndoint AWS::EC2::VPCEndpoint
    MSKClientMachineSG AWS::EC2::SecurityGroup
    MySecretA AWS::SecretsManager::Secret
    PrivateRouteTable1 AWS::EC2::RouteTable
    PrivateSubnet1 AWS::EC2::Subnet
    PrivateSubnet1RouteTableAssociation AWS::EC2::SubnetRouteTableAssociation
    PrivateSubnet2 AWS::EC2::Subnet
    PrivateSubnet2RouteTableAssociation AWS::EC2::SubnetRouteTableAssociation
    PublicRouteTable AWS::EC2::RouteTable
    PublicSubnet1 AWS::EC2::Subnet
    PublicSubnet1RouteTableAssociation AWS::EC2::SubnetRouteTableAssociation
    PublicSubnet2 AWS::EC2::Subnet
    PublicSubnet2RouteTableAssociation AWS::EC2::SubnetRouteTableAssociation
    S3Bucket AWS::S3::Bucket
    S3VpcEndoint AWS::EC2::VPCEndpoint
    SecretManagerVpcEndoint AWS::EC2::VPCEndpoint
    SecurityGroup AWS::EC2::SecurityGroup
    SecurityGroupIngress AWS::EC2::SecurityGroupIngress
    VPC AWS::EC2::VPC
    BootstrapBrokersFunctionLogs AWS::Logs::LogGroup
    GlueCrawler AWS::Glue::Crawler
    GlueDataBase AWS::Glue::Database
    GlueIamRole AWS::IAM::Role
    GlueSchemaRegistry AWS::Glue::Registry
    MSKCluster AWS::MSK::Cluster
    MSKConfiguration AWS::MSK::Configuration
    MSKPayloadSchema AWS::Glue::Schema
    MSKSecurityGroup AWS::EC2::SecurityGroup
    S3BucketForOutput AWS::S3::Bucket
    CleanupResourcesOnDeletion AWS::Lambda::Function
    BootstrapBrokersFunction AWS::Lambda::Function

Build and run the producer application

After successfully creating the CloudFormation stack, you can now proceed with building and running the producer application to publish records on MSK topics from the EC2 instance, as shown in the following code. Detailed instructions including supported arguments and their usage are outlined in the README.md page in the GitHub repository.

$ cd amazon_msk_producer 
$ mvn clean package 
$ BROKERS={OUTPUT_VAL_OF_MSKBootstrapServers – Ref. Step 6}
$ REGISTRY_NAME={VAL_OF_GlueSchemaRegistryName - Ref. Step 6}
$ SCHEMA_NAME={VAL_OF_SchemaName– Ref. Step 6}
$ TOPIC_NAME="test"
$ SECRET_ARN={OUTPUT_VAL_OF_SecretArn – Ref. Step 3}
$ java -jar target/amazon_msk_producer-1.0-SNAPSHOT-jar-with-dependencies.jar -brokers $BROKERS -secretArn $SECRET_ARN -region us-east-1 -registryName $REGISTRY_NAME -schema $SCHEMA_NAME -topic $TOPIC_NAME -numRecords 10

If the records are successfully ingested into the Kafka topics, you may see a log similar to the following screenshot.

kafka log

Grant permissions

Confirm if your AWS Glue Data Catalog is being managed by AWS Lake Formation and grant necessary permissions. To check if Lake Formation is managing the permissions for the newly created tables, we can navigate to the Settings page on the Lake Formation console, or we can use the Lake Formation CLI command get-data-lake-settings.

If the check boxes on the Lake Formation Data Catalog settings page are unselected (see the following screenshot), that means that the Data Catalog permissions are being managed by LakeFormation.

Lakeformation status

If using the Lake Formation CLI, check if the values of CreateDatabaseDefaultPermissions and CreateTableDefaultPermissions are NULL in the output. If so, this confirms that the Data Catalog permissions are being managed by AWS Lake Formation.

If we can confirm that the Data Catalog permissions are being managed by AWS Lake Formation, we have to grant DESCRIBE and CREATE TABLE permissions for the database, and SELECT, ALTER, DESCRIBE and INSERT permissions for the table to the AWS Identity and Access Management role (IAM role) used by AWS Glue streaming ETL job before starting the job. Similarly, we have to grant DESCRIBE permissions for the database and DESCRIBE AND SELECT permissions for the table to the IAM principals using Amazon Athena to query the data. We can get the AWS Glue service IAM role, database, table, streaming job name, and crawler names from the Outputs tab of the CloudFormation stack amazon-msk-and-glue. For instructions on granting permissions via AWS Lake Formation, refer to Granting Data Catalog permissions using the named resource method.

Run the AWS Glue streaming job

To process the data from the MSK topic, complete the following steps:

  1. Retrieve the name of the AWS Glue streaming job from the amazon-msk-and-glue stack output.
  2. On the AWS Glue console, choose Jobs in the navigation pane.
  3. Choose the job name to open its details page.
  4. Choose Run job to start the job.

Because this is a streaming job, it will continue to run indefinitely until manually stopped.

Run the AWS Glue crawler

Once AWS Glue streaming job starts processing the data, you can use the following steps to check the processed data, and create a table using AWS Glue Crawler to query it

  1. Retrieve the name of the output bucket S3BucketForOutput from the stack output and validate if output folder has been created and contains data.
  2. Retrieve the name of the Crawler from the stack output.
  3. Navigate to the AWS Glue Console.
  4. In the left pane, select Crawlers.
  5. Run the crawler.

In this post, we run the crawler one time to create the target table for demo purposes. In a typical scenario, you would run the crawler periodically or create or manage the target table another way. For example, you could use the saveAsTable() method in Spark to create the table as part of the ETL job itself, or you could use enableUpdateCatalog=True in the AWS Glue ETL job to enable Data Catalog updates. For more information about this AWS Glue ETL feature, refer to Creating tables, updating the schema, and adding new partitions in the Data Catalog from AWS Glue ETL jobs.

Validate the data in Athena

After the AWS Glue crawler has successfully created the table for the processed data in the Data Catalog, follow these steps to validate the data using Athena:

  1. On the Athena console, navigate to the query editor.
  2. Choose the Data Catalog as the data source.
  3. Choose the database and table that the crawler created.
  4. Enter a SQL query to validate the data.
  5. Run the query.

The following screenshot shows the output of our example query.

Athena output

Clean up

To clean up your resources, complete the following steps:

  1. Delete the CloudFormation stack amazon-msk-and-glue.
  2. Delete the CloudFormation stack vpc-subnet-and-mskclient.

Conclusion

This post provided a solution for building a robust streaming data processing platform using a combination of Amazon MSK, the AWS Glue Schema Registry, an AWS Glue streaming job, and Amazon S3. By following the steps outlined in this post, you can create and control your schema in the Schema Registry, integrate it with a data producer to ingest data into an MSK cluster, set up an AWS Glue streaming job to extract and process data from the cluster using the Schema Registry, store processed data in Amazon S3, and query it using Athena.

Let’s start using AWS Glue Schema Registry to manage schema evolution for streaming data ETL with AWS Glue. If you have any feedback related to this post, please feel free to leave them in the comments section below.

Appendix

This appendix section provides more information about Apache Spark Structured Streaming Checkpointing feature and a brief summary on how schema evolution can be handled using AWS Glue Schema Registry.

Checkpointing

Checkpointing is a mechanism in Spark streaming applications to persist enough information in a durable storage to make the application resilient and fault-tolerant. The items stored in checkpoint locations are mainly the metadata for application configurations and the state of processed offsets. Spark uses synchronous checkpointing, meaning it ensures that the checkpoint state is updated after every micro-batch run. It stores the end offset value of each partition under the offsets folder for the corresponding micro-batch run before processing, and logs the record of processed batches under the commits folder. In the event of a restart, the application can recover from the last successful checkpoint, provided the offset hasn’t expired in the source Kafka topic. If the offset has expired, we have to set the property failOnDataLoss to false so that the streaming query doesn’t fail as a result of this.

Schema evolution

As the schema of data evolves over time, it needs to be incorporated into producer and consumer applications to avert application failure due to data encoding issues. The AWS Glue Schema Registry offers a rich set of options for schema compatibility such as backward, forward, and full to update the schema in the Schema Registry. Refer to Schema versioning and compatibility for the full list.

The default option is backward compatibility, which satisfies the majority of use cases. This option allows you to delete any existing fields and add optional fields. Steps to implement schema evolution using the default compatibility are as follows:

  1. Register the new schema version to update the schema definition in the Schema Registry.
  2. Upon success, update the AWS Glue Data Catalog table using the updated schema.
  3. Restart the AWS Glue streaming job to incorporate the changes in the schema for data processing.
  4. Update the producer application code base to build and publish the records using the new schema, and restart it.

About the Authors

Author Headshot - Vivekanand TiwariVivekanand Tiwari is a Cloud Architect at AWS. He finds joy in assisting customers on their cloud journey, especially in designing and building scalable, secure, and optimized data and analytics workloads on AWS. During his leisure time, he prioritizes spending time with his family.

Author Headshot - Subramanya VajirayaSubramanya Vajiraya is a Sr. Cloud Engineer (ETL) at AWS Sydney specialized in AWS Glue. He is passionate about helping customers solve issues related to their ETL workload and implement scalable data processing and analytics pipelines on AWS. Outside of work, he enjoys going on bike rides and taking long walks with his dog Ollie, a 2-year-old Corgi.

Author Headshot - Akash DeepAkash Deep is a Cloud Engineer (ETL) at AWS with a specialization in AWS Glue. He is dedicated to assisting customers in resolving issues related to their ETL workloads and creating scalable data processing and analytics pipelines on AWS. In his free time, he prioritizes spending quality time with his family.

МЕЖДУНАРОДЕН ФОРУМ СЪБИРА В БУРГАС УТВЪРДЕНИ СПЕЦИАЛИСТИ И МЛАДИ ТВОРЦИ ЗА ДЕБАТ ПО ТЕМАТА ЗА СПАСЯВАНЕТО НА БЪЛГАРСКИТЕ ЕВРЕИ

Post Syndicated from Биволъ original https://bivol.bg/forum-v-burgas.html

понеделник 12 юни 2023


Темата за спасяването на българските евреи и отдаването на почит на невинните жертви на Холокоста с течение на годините предизвиква все по-засилен интерес. 80-годишнината от този уникален акт на човечност в България е в…

Читателите посочиха фаворитите си в Десетия литературен фестивал на “Алеф”

Post Syndicated from Биволъ original https://bivol.bg/chitateli-alef-konkurs.html

понеделник 12 юни 2023


Приключи гласуването на читателската аудитория за номинираните разкази в Десетия международен литературен ученически конкурс „Който спаси един човешки живот, спасява цяла вселена”. Творбите на 20-те номинирани млади български автори събраха…

Escrow Buddy: An open-source tool from Netflix for remediation of missing FileVault keys in MDM

Post Syndicated from Netflix Technology Blog original https://netflixtechblog.com/escrow-buddy-an-open-source-tool-from-netflix-for-remediation-of-missing-filevault-keys-in-mdm-815aef5107cd

Netflix has open-sourced Escrow Buddy, which helps Security and IT teams ensure they have valid FileVault recovery keys for all their Macs in MDM.

To be a client systems engineer is to take joy in small endpoint automations that make your fellow employees’ day a little better. When somebody is unable to log into their FileVault-encrypted Mac, few words are more joyful to hear than a support technician saying, “I’ve got your back. Let’s look up the recovery key.”

Securely and centrally escrowing FileVault personal recovery keys is one of many capabilities offered by Mobile Device Management (MDM). A configuration profile that contains the FDERecoveryKeyEscrow payload will cause any new recovery key generated on the device, either by initially enabling FileVault or by manually changing the recovery key, to be automatically escrowed to your MDM for later retrieval if needed.

The problem of missing FileVault keys

However, just because you’re deploying the MDM escrow payload to your managed Macs doesn’t necessarily mean you have valid recovery keys for all of them. Recovery keys can be missing from MDM for numerous reasons:

  • FileVault may have been enabled prior to enrollment in MDM
  • The MDM escrow payload may not have been present on the Mac due to scoping issues or misconfiguration on your MDM
  • The Macs may be migrating from a different MDM in which the keys are stored
  • MDM database corruption or data loss events may have claimed some or all of your escrowed keys

Regardless of the cause, the effect is people who get locked out of their Macs must resort to wiping their computer and starting fresh — a productivity killer if your data is backed up, and a massive data loss event if it’s not backed up.

Less than ideal solutions

IT and security teams have approached this problem from multiple angles in the past. On a per-computer basis, a new key can be generated by disabling and re-enabling FileVault, but this leaves the computer in an unencrypted state briefly and requires multiple steps. The built-in fdesetup command line tool can also be used to generate a new key, but not all users are comfortable entering Terminal commands. Plus, neither of these ideas scale to meet the needs of a fleet of Macs hundreds or thousands strong.

Another approach has been to use a tool capable of displaying an onscreen text input field to the user in order to display a password prompt, and then pass the provided password as input to the fdesetup tool for generating a new key. However, this requires IT and security teams to communicate in advance of the remediation campaign to affected users, in order to give them the context they need to respond to the additional password prompt. Even more concerning, this password prompt approach has a detrimental effect on security culture because it contributes to “consent fatigue.” Users will be more likely to approve other types of password prompt, which may inadvertently prime them to be targeted by malware or ransomware.

The ideal solution would be one which can be automated across your entire fleet while not requiring any additional user interaction.

Crypt and its authorization plugin

macOS authorization plugins provide a way to connect with Apple’s authorization services API and participate in decisions around user login. They can also facilitate automations that require information available only in the “login window” context, such as the provided username and password.

Relatively few authorization plugins are broadly used within the Mac admin community, but one popular example is the Crypt agent. In its typical configuration the Crypt agent enforces FileVault upon login and escrows the resulting recovery key to a corresponding Crypt server. The agent also enables rotation of recovery keys after use, local storage and validation of recovery keys, and other features.

While the Crypt agent can be deployed standalone and configured to simply regenerate a key upon next login, escrowing keys to MDM isn’t Crypt’s primary use case. Additionally, not all organizations have the time, expertise, or interest to commit to hosting a Crypt server and its accompanying database, or auditing the parts of Crypt’s codebase relating to its server capabilities.

Introducing Escrow Buddy

Inspired by Crypt’s example, our Client Systems Engineering team created a minimal authorization plugin focused on serving the needs of organizations who escrow FileVault keys to MDM only. We call this new tool Escrow Buddy.

Escrow Buddy logo

Escrow Buddy’s authorization plugin includes a mechanism that, when added to the macOS login authorization database, will use the logging in user’s credentials as input to the fdesetup tool to automatically and seamlessly generate a new key during login. By integrating with the familiar and trusted macOS login experience, Escrow Buddy eliminates the need to display additional prompts or on-screen messages.

Security and IT teams can take advantage of Escrow Buddy in three steps:

  1. Ensure your MDM is deploying the FDERecoveryKeyEscrow payload to your managed Macs. This will ensure any newly generated FileVault key, no matter the method of generation, will be automatically escrowed to MDM.
  2. Deploy Escrow Buddy. The latest installer is available here, and you can choose to deploy to all your managed Macs or just the subset for which you need to escrow new keys.
  3. On Macs that lack a valid escrowed key, configure your MDM to run this command in root context:
defaults write /Library/Preferences/com.netflix.Escrow-Buddy.plist GenerateNewKey -bool true

That’s it! At next startup or login, the specified Macs should generate a new key, which will be automatically escrowed to your MDM when the Mac next responds to a SecurityInfo command. (Timing varies by MDM vendor but this is often during an inventory update.)

Community contribution

Netflix is making Escrow Buddy’s source available via the Mac Admins Open Source organization on GitHub, the home of many other important projects in the Mac IT and security community, including Nudge, InstallApplications, Outset, and the Munki signed builds. Thousands of organizations worldwide benefit from the tools and ideas shared by the Mac admin community, and Netflix is excited that Escrow Buddy will be among them.

The Escrow Buddy repository leverages GitHub Actions to streamline the process of building new codesigned and notarized releases when new changes are merged into the main branch. Our hope is that this will make it easy for contributors to collaborate and improve upon Escrow Buddy.

A rising tide…

Escrow Buddy represents our desire to elevate the industry standard around FileVault key regeneration. If your organization currently employs a password prompt workflow for this scenario, please consider trying Escrow Buddy instead. We hope you’ll find it more automatic, more supportive of security culture, and enables you to more often say “I’ve got your back” to your fellow employees who need a recovery key.

Elliot Jordan


Escrow Buddy: An open-source tool from Netflix for remediation of missing FileVault keys in MDM was originally published in Netflix TechBlog on Medium, where people are continuing the conversation by highlighting and responding to this story.

[$] Deadline servers as a realtime throttling replacement

Post Syndicated from original https://lwn.net/Articles/934415/

The CPU scheduler’s one job at any given time is to run the task that has
the strongest claim to the CPU. There are many factors that complicate
that job, not the least of which is that the “strongest claim” is sometimes
a bit of a fuzzy concept. Realtime throttling, a mechanism designed to
keep a runaway realtime task from monopolizing the CPU, is one case where
developers have concluded that the task with, ostensibly, the highest
priority should not actually be the one that runs. But realtime throttling
has rarely pleased anybody; the deadline-server
infrastructure patches
posted by Daniel Bristot de Oliveira are the
latest attempt to find a better solution.

New – Move Payment Processing to the Cloud with AWS Payment Cryptography

Post Syndicated from Danilo Poccia original https://aws.amazon.com/blogs/aws/new-move-payment-processing-to-the-cloud-with-aws-payment-cryptography/

Cryptography is everywhere in our daily lives. If you’re reading this blog, you’re using HTTPS, an extension of HTTP that uses encryption to secure communications. On AWS, multiple services and capabilities help you manage keys and encryption, such as:

HSMs are physical devices that securely protect cryptographic operations and the keys used by these operations. HSMs can help you meet your corporate, contractual, and regulatory compliance requirements. With CloudHSM, you have access to general-purpose HSMs. When payments are involved, there are specific payment HSMs that offer capabilities such as generating and validating the personal identification number (PIN) and the security code of a credit or debit card.

Today, I am happy to share the availability of AWS Payment Cryptography, an elastic service that manages payment HSMs and keys for payment processing applications in the cloud.

Applications using payments HSMs have challenging requirements because payment processing is complex, time sensitive, and highly regulated and requires the interaction of multiple financial service providers and payment networks. Every time you make a payment, data is exchanged between two or more financial service providers and must be decrypted, transformed, and encrypted again with a unique key at each step.

This process requires highly performant cryptography capabilities and key management procedures between each payment service provider. These providers might have thousands of keys to protect, manage, rotate, and audit, making the overall process expensive and difficult to scale. To add to that, payment HSMs historically employ complex and error-prone processes, such as exchanging keys in a secure room using multiple hand-carried paper forms, each with separate key components printed on them.

Introducing AWS Payment Cryptography
AWS Payment Cryptography simplifies your implementation of cryptographic functions and key management used to secure data in payment processing in accordance with various payment card industry (PCI) standards.

With AWS Payment Cryptography, you can eliminate the need to provision and manage on-premises payment HSMs and use the provided tools to avoid error-prone key exchange processes. For example, with AWS Payment Cryptography, payment and financial service providers can begin development within minutes and plan to exchange keys electronically, eliminating manual processes.

To provide its elastic cryptographic capabilities in a compliant manner, AWS Payment Cryptography uses HSMs with PCI PTS HSM device approval. These capabilities include encryption and decryption of card data, key creation, and pin translation. AWS Payment Cryptography is also designed in accordance with PCI security standards such as PCI DSS, PCI PIN, and PCI P2PE, and it provides evidence and reporting to help meet your compliance needs.

You can import and export symmetric keys between AWS Payment Cryptography and on-premises HSMs under key encryption key (KEKs) using the ANSI X9 TR-31 protocol. You can also import and export symmetric KEKs with other systems and devices using the ANSI X9 TR-34 protocol, which allows the service to exchange symmetric keys using asymmetric techniques.

To simplify moving consumer payment processing to the cloud, existing card payment applications can use AWS Payment Cryptography through the AWS SDKs. In this way, you can use your favorite programming language, such as Java or Python, instead of vendor-specific ASCII interfaces over TCP sockets, as is common with payment HSMs.

Access can be authorized using AWS Identity and Access Management (IAM) identity-based policies, where you can specify which actions and resources are allowed or denied and under which conditions.

Monitoring is important to maintain the reliability, availability, and performance needed by payment processing. With AWS Payment Cryptography, you can use Amazon CloudWatch, AWS CloudTrail, and Amazon EventBridge to understand what is happening, report when something is wrong, and take automatic actions when appropriate.

Let’s see how this works in practice.

Using AWS Payment Cryptography
Using the AWS Command Line Interface (AWS CLI), I create a double-length 3DES key to be used as a card verification key (CVK). A CVK is a key used for generating and verifying card security codes such as CVV, CVV2, and similar values.

Note that there are two commands for the CLI (and similarly two endpoints for API and SDKs):

  • payment-cryptography for control plane operation such as listing and creating keys and aliases.
  • payment-cryptography-data for cryptographic operations that use keys, for example, to generate PIN or card validation data.

Creating a key is a control plane operation:

aws payment-cryptography create-key \
    --no-exportable \
    --key-attributes KeyAlgorithm=TDES_2KEY,
                     KeyUsage=TR31_C0_CARD_VERIFICATION_KEY,
                     KeyClass=SYMMETRIC_KEY,
                     KeyModesOfUse='{Generate=true,Verify=true}'
{
    "Key": {
        "KeyArn": "arn:aws:payment-cryptography:us-west-2:123412341234:key/42cdc4ocf45mg54h",
        "KeyAttributes": {
            "KeyUsage": "TR31_C0_CARD_VERIFICATION_KEY",
            "KeyClass": "SYMMETRIC_KEY",
            "KeyAlgorithm": "TDES_2KEY",
            "KeyModesOfUse": {
                "Encrypt": false,
                "Decrypt": false,
                "Wrap": false,
                "Unwrap": false,
                "Generate": true,
                "Sign": false,
                "Verify": true,
                "DeriveKey": false,
                "NoRestrictions": false
            }
        },
        "KeyCheckValue": "B2DD4E",
        "KeyCheckValueAlgorithm": "ANSI_X9_24",
        "Enabled": true,
        "Exportable": false,
        "KeyState": "CREATE_COMPLETE",
        "KeyOrigin": "AWS_PAYMENT_CRYPTOGRAPHY",
        "CreateTimestamp": "2023-05-26T14:25:48.240000+01:00",
        "UsageStartTimestamp": "2023-05-26T14:25:48.220000+01:00"
    }
}

To reference this key in the next steps, I can use the Amazon Resource Name (ARN) as found in the KeyARN property, or I can create an alias. An alias is a friendly name that lets me refer to a key without having to use the full ARN. I can update an alias to refer to a different key. When I need to replace a key, I can just update the alias without having to change the configuration or the code of your applications. To be recognized easily, alias names start with alias/. For example, the following command creates the alias alias/my-key for the key I just created:

aws payment-cryptography create-alias --alias-name alias/my-key \
    --key-arn arn:aws:payment-cryptography:us-west-2:123412341234:key/42cdc4ocf45mg54h
{
    "Alias": {
        "AliasName": "alias/my-key",
        "KeyArn": "arn:aws:payment-cryptography:us-west-2:123412341234:key/42cdc4ocf45mg54h"
    }
}

Before I start using the new key, I list all my keys to check their status:

aws payment-cryptography list-keys
{
    "Keys": [
        {
            "KeyArn": "arn:aws:payment-cryptography:us-west-2:123421341234:key/42cdc4ocf45mg54h",
            "KeyAttributes": {
                "KeyUsage": "TR31_C0_CARD_VERIFICATION_KEY",
                "KeyClass": "SYMMETRIC_KEY",
                "KeyAlgorithm": "TDES_2KEY",
                "KeyModesOfUse": {
                    "Encrypt": false,
                    "Decrypt": false,
                    "Wrap": false,
                    "Unwrap": false,
                    "Generate": true,
                    "Sign": false,
                    "Verify": true,
                    "DeriveKey": false,
                    "NoRestrictions": false
                }
            },
            "KeyCheckValue": "B2DD4E",
            "Enabled": true,
            "Exportable": false,
            "KeyState": "CREATE_COMPLETE"
        },
        {
            "KeyArn": "arn:aws:payment-cryptography:us-west-2:123412341234:key/ok4oliaxyxbjuibp",
            "KeyAttributes": {
                "KeyUsage": "TR31_C0_CARD_VERIFICATION_KEY",
                "KeyClass": "SYMMETRIC_KEY",
                "KeyAlgorithm": "TDES_2KEY",
                "KeyModesOfUse": {
                    "Encrypt": false,
                    "Decrypt": false,
                    "Wrap": false,
                    "Unwrap": false,
                    "Generate": true,
                    "Sign": false,
                    "Verify": true,
                    "DeriveKey": false,
                    "NoRestrictions": false
                }
            },
            "KeyCheckValue": "905848",
            "Enabled": true,
            "Exportable": false,
            "KeyState": "DELETE_PENDING"
        }
    ]
}

As you can see, there is another key I created before, which has since been deleted. When a key is deleted, it is marked for deletion (DELETE_PENDING). The actual deletion happens after a configurable period (by default, 7 days). This is a safety mechanism to prevent the accidental or malicious deletion of a key. Keys marked for deletion are not available for use but can be restored.

In a similar way, I list all my aliases to see to which keys they are they referring:

aws payment-cryptography list-aliases
{
    "Aliases": [
        {
            "AliasName": "alias/my-key",
            "KeyArn": "arn:aws:payment-cryptography:us-west-2:123412341234:key/42cdc4ocf45mg54h"
        }
    ]
}

Now, I use the key to generate a card security code with the CVV2 authentication system. You might be familiar with CVV2 numbers that are usually written on the back of a credit card. This is the way they are computed. I provide as input the primary account number of the credit card, the card expiration date, and the key from the previous step. To specify the key, I use its alias. This is a data plane operation:

aws payment-cryptography-data generate-card-validation-data \
    --key-identifier alias/my-key \
    --primary-account-number=171234567890123 \
    --generation-attributes CardVerificationValue2={CardExpiryDate=0124}
{
    "KeyArn": "arn:aws:payment-cryptography:us-west-2:123412341234:key/42cdc4ocf45mg54h",
    "KeyCheckValue": "B2DD4E",
    "ValidationData": "343"
}

I take note of the three digits in the ValidationData property. When processing a payment, I can verify that the card data value is correct:

aws payment-cryptography-data verify-card-validation-data \
    --key-identifier alias/my-key \
    --primary-account-number=171234567890123 \
    --verification-attributes CardVerificationValue2={CardExpiryDate=0124} \
    --validation-data 343
{
    "KeyArn": "arn:aws:payment-cryptography:us-west-2:123412341234:key/42cdc4ocf45mg54h",
    "KeyCheckValue": "B2DD4E"
}

The verification is successful, and in return I get back the same KeyCheckValue as when I generated the validation data.

As you might expect, if I use the wrong validation data, the verification is not successful, and I get back an error:

aws payment-cryptography-data verify-card-validation-data \
    --key-identifier alias/my-key \
    --primary-account-number=171234567890123 \
    --verification-attributes CardVerificationValue2={CardExpiryDate=0124} \
    --validation-data 999

An error occurred (com.amazonaws.paymentcryptography.exception#VerificationFailedException)
when calling the VerifyCardValidationData operation:
Card validation data verification failed

In the AWS Payment Cryptography console, I choose View Keys to see the list of keys.

Console screenshot.

Optionally, I can enable more columns, for example, to see the key type (symmetric/asymmetric) and the algorithm used.

Console screenshot.

I choose the key I used in the previous example to get more details. Here, I see the cryptographic configuration, the tags assigned to the key, and the aliases that refer to this key.

Console screenshot.

AWS Payment Cryptography supports many more operations than the ones I showed here. For this walkthrough, I used the AWS CLI. In your applications, you can use AWS Payment Cryptography through any of the AWS SDKs.

Availability and Pricing
AWS Payment Cryptography is available today in the following AWS Regions: US East (N. Virginia) and US West (Oregon).

With AWS Payment Cryptography, you only pay for what you use based on the number of active keys and API calls with no up-front commitment or minimum fee. For more information, see AWS Payment Cryptography pricing.

AWS Payment Cryptography removes your dependencies on dedicated payment HSMs and legacy key management systems, simplifying your integration with AWS native APIs. In addition, by operating the entire payment application in the cloud, you can minimize round-trip communications and latency.

Move your payment processing applications to the cloud with AWS Payment Cryptography.

Danilo

Hands-on with an AMD Pensando DSC2-100G Elba DPU in a Secret Lab

Post Syndicated from Patrick Kennedy original https://www.servethehome.com/hands-on-with-an-amd-pensando-elba-dpu-in-a-secret-lab-arm-nvidia-dell-vmware-esxi-upt/

We get hands-on with the AMD Pensando DSC2-100G Elba DPU in a secret lab to see the hardware and how VMware integrates the 100GbE cards into vSphere

The post Hands-on with an AMD Pensando DSC2-100G Elba DPU in a Secret Lab appeared first on ServeTheHome.

Security updates for Monday

Post Syndicated from original https://lwn.net/Articles/934456/

Security updates have been issued by Debian (pypdf2 and thunderbird), Fedora (chromium, dbus, mariadb, matrix-synapse, sympa, and thunderbird), Scientific Linux (python and python3), SUSE (chromium, gdb, and openldap2), and Ubuntu (jupyter-core, requests, sssd, and vim).

Protecting GraphQL APIs from malicious queries

Post Syndicated from John Cosgrove original http://blog.cloudflare.com/protecting-graphql-apis-from-malicious-queries/

Protecting GraphQL APIs from malicious queries

Protecting GraphQL APIs from malicious queries

Starting today, Cloudflare’s API Gateway can protect GraphQL APIs against malicious requests that may cause a denial of service to the origin. In particular, API Gateway will now protect against two of the most common GraphQL abuse vectors: deeply nested queries and queries that request more information than they should.

Typical RESTful HTTP APIs contain tens or hundreds of endpoints. GraphQL APIs differ by typically only providing a single endpoint for clients to communicate with and offering highly flexible queries that can return variable amounts of data. While GraphQL’s power and usefulness rests on the flexibility to query an API about only the specific data you need, that same flexibility adds an increased risk of abuse. Abusive requests to a single GraphQL API can place disproportional load on the origin, abuse the N+1 problem, or exploit a recursive relationship between data dimensions. In order to add GraphQL security features to API Gateway, we needed to obtain visibility inside the requests so that we could apply different security settings based on request parameters. To achieve that visibility, we built our own GraphQL query parser. Read on to learn about how we built the parser and the security features it enabled.

The power of GraphQL

Unlike a REST API, where the API’s users are limited to what data they can query and change on a per-endpoint basis, a GraphQL API offers users the ability to query and change any data they wish with an open-ended, yet structured request to a single endpoint. This open-endedness makes GraphQL APIs very powerful. Each user can query for a completely custom set of data and receive their custom response in a single HTTP request. Here are two example queries and their responses. These requests are typically sent via HTTP POST methods to an endpoint at /graphql.

# A query asking for multiple nested subfields of the "hero" object. This query has a depth level of 2.
{
  hero {
    name
    friends {
      name
    }
  }
}

# The corresponding response.
{
  "data": {
    "hero": {
      "name": "R2-D2",
      "friends": [
        {
          "name": "Luke Skywalker"
        },
        {
          "name": "Han Solo"
        },
        {
          "name": "Leia Organa"
        }
      ]
    }
  }
}

# A query asking for just one subfield on the same "hero" object. This query has a depth level of 1.
{
  hero {
    name
  }
}

# The corresponding response.
{
  "data": {
    "hero": {
      "name": "R2-D2"
    }
  }
}

These custom queries give GraphQL endpoints more flexibility than conventional REST endpoints. But this flexibility also means GraphQL APIs can be subject to very different load or security risks based on the requests that they are receiving. For example, an attacker can request the exact same, valid data as a benevolent user would, but exploit the data’s self-referencing structure and ask that an origin return hundreds of thousands of rows replicated over and over again. Let’s consider an example, in which we operate a petitioning platform where our data model contains petitions and signers objects. With GraphQL, an attacker can, in a single request, query for a single petition, then for all people who signed that petition, then for all petitions each of those people have signed, then for all people that signed any of those petitions, then for all petitions that… you see where this is going!

query {
 petition(ID: 123) {
   signers {
     nodes {
       petitions {
         nodes {
           signers {
             nodes {
               petitions {
                 nodes {
                    ...
                 }
               }
             }
           }
         }
       }
     }
   }
 }
}

A rate limit won’t protect against such an attack because the entire query fits into a single request.

So how can we secure GraphQL APIs? There is little agreement in the industry around what makes a GraphQL endpoint secure. For some, this means rejecting invalid queries. Normally, an invalid query refers to a query that would fail to compile by a GraphQL server and not cause any substantial load on the origin, but would still add noise and error logs and reduce operational visibility. For others, this means creating complexity-based rate limits or perhaps flagging broken object-level authorization. Still others want deeper visibility into query behavior and an ability to validate queries against a predefined schema.

When creating new features in API Gateway, we often start by providing deeper visibility for customers into their traffic behavior related to the feature in question. This way we create value from the large amount of data we see in the Cloudflare network, and can have conversations with customers where we ask: “Now that you have these data insights, what actions would you like to take with them?”. This process puts us in a good position to build a second, more actionable iteration of the feature.

We decided to follow the same process with GraphQL protection, with parsing GraphQL requests and gathering data as our first goal.

Parsing GraphQL quickly

As a starting point, we wanted to collect request query size and depth attributes. These attributes offer a surprising amount of insight into the query – if the query is requesting a single field at depth level 15, is it really innocuous or is it exploiting some recursive data relationship? if the query is asking for hundreds of fields at depth level 3, why wouldn’t it just ask for the entire object at level 2 instead?

To do this, we needed to parse queries without adding latency to incoming requests. We evaluated multiple open source GraphQL parsers and quickly realized that their performance would put us at the risk of adding hundreds of microseconds of latency to the request duration. Our goal was to have a p95 parsing time of under 50 microseconds. Additionally, the infrastructure we were planning to use to ship this functionality has a strict no-heap-allocation policy – this means that any memory allocated by a parser to process a request has to be amortized by being reused when parsing any subsequent requests. Parsing GraphQL in a no-allocation manner is not a fundamental technical requirement for us over the long-term, but it was a necessity if we wanted to build something quickly with confidence that the proof of concept will meet our performance expectations.

Meeting the latency and memory allocation constraints meant that we had to write a parser of our own. Building an entire abstract syntax tree of unpredictable structure requires allocating memory on the heap, and that’s what made conventional parsers unfit for our requirements. What if instead of building a tree, we processed the query in a streaming fashion, token by token? We realized that if we were to write our own GraphQL lexer that produces a list of GraphQL tokens (“comment”, “string”, “variable name”, “opening parenthesis”, etc.), we could use a number of heuristics to infer the query depth and size without actually building a tree or fully validating the query. Using this approach meant that we could deliver the new feature fast, both in engineering time and wall clock time – and, most importantly, visualize data insights for our customers.

To start, we needed to prepare GraphQL queries for parsing. Most of the time, GraphQL queries are delivered as HTTP POST requests with application/json or application/graphql Content-Type. Requests with application/graphql content type are easy to work with – they contain the raw query you can just parse. However, JSON-encoded queries present a challenge since JSON objects contain escaped characters – normally, any deserialization library will allocate new memory into which the raw string is copied with escape sequences removed, but we committed to allocating no memory, remember? So to parse GraphQL queries encoded in JSON fields, we used serde RawValue to locate the JSON field in which the escaped query was placed and then iterated over the constituent bytes one-by-one, feeding them into our tokenizer and removing escape sequences on the fly.

Once we had our query input ready, we built a simple Rust program that converts raw GraphQL input into a list of lexical tokens according to the GraphQL grammar. Tokenization is the first step in any parser – our insight was that this step was all we needed for what we wanted to achieve in the MVP.

mutation CreateMessage($input: MessageInput) {
    createMessage(input: $input) {
        id
    }
}

For example, the mutation operation above gets converted into the following list of tokens:

name
name
punctuator (
punctuator $
name
punctuator :
name
punctuator )
punctuator {
name
punctuator (
name
punctuator :
punctuator $
name
punctuator )
punctuator {
name
punctuator }
punctuator }

With this list of tokens available to us, we built our validation engine and added the ability to calculate query depth and size. Again, everything is done one-the-fly in a single pass. A limitation of this approach is that we can’t parse 100% of the requests – there are some syntactic features of GraphQL that we have to fail open on; however, a major advantage of this approach is its performance – in our initial trial run against a stream of 10s of thousands of requests per second, we achieved a p95 parsing time of 25 microseconds. This is a good starting point to collect some data and to prototype our first GraphQL security features.

Getting started

Today, any API Gateway customer can use the Cloudflare GraphQL API to retrieve information about depth and size of GraphQL queries we see for them on the edge.

As an example, we’ve run the analysis below visualizing over 400,000 data points for query sizes and depths for a production domain utilizing API Gateway.

First let’s look at query sizes in our sample:

Protecting GraphQL APIs from malicious queries

It looks like queries almost never request more than 60 fields. Let’s also look at query depths:

Protecting GraphQL APIs from malicious queries

It looks like queries are never more than seven levels deep.

These two insights can be converted into security rules: we added three new Wirefilter fields that API Gateway customers can use to protect their GraphQL endpoints:

1. cf.api_gateway.graphql.query_size
2. cf.api_gateway.graphql.query_depth
3. cf.api_gateway.graphql.parsed_successfully

For now, we recommend the use of cf.api_gateway.graphql.parsed_successfully in all rules. Rules created with the use of this field will be backwards compatible with future GraphQL protection releases.

If a customer feels that there is nothing out of the ordinary with the traffic sample and that it represents a meaningful amount of normal usage, they can manually create and deploy the following custom rule to log all queries that were parsed by Cloudflare and that look like outliers:

cf.api_gateway.graphql.parsed_successfully and
(cf.api_gateway.graphql.query_depth > 7 or 
cf.api_gateway.graphql.query_size > 60)

Learn more and run your own analysis with our documentation.

What’s next?

We are already receiving feedback from our first customers and are planning out the next iteration of this feature. These are the features we will build next:

  • Integrating GraphQL security with complexity-based rate limiting such that we automatically calculate query cost and let customers rate limit eyeballs based on the total query execution cost the eyeballs use during their entire session.
  • Allowing customers to configure specifically which endpoints GraphQL security features run on.
  • Creating data insights on the relationship between query complexity and the time it takes the customer origin to respond to the query.
  • Creating automatic GraphQL threshold recommendations based on historical trends.

If you’re an Enterprise customer that hasn't purchased API Gateway and you’re interested in protecting your GraphQL APIs today, you can get started by enabling the API Gateway trial inside the Cloudflare Dashboard or by contacting your account manager. Check out our documentation on the feature to get started once you have access.

The collective thoughts of the interwebz