The buffer head is a kernel data structure that dates back to the first
Linux release; for much of the time since then, kernel developers have been hoping to get rid of it. Hannes Reinecke
started a plenary session at the 2023 Linux Storage, Filesystem, Memory-Management
and BPF Summit by saying that everybody agrees that buffer heads are a
bad idea, but there is less agreement on how to take them out of the
kernel. The core functionality they provide — facilitating sector-size I/O
operations to a block device underlying a filesystem — must be provided
somehow.
We’re excited to announce Secrets Store – Cloudflare’s new secrets management offering!
A secrets store does exactly what the name implies – it stores secrets. Secrets are variables that are used by developers that contain sensitive information – information that only authorized users and systems should have access to.
If you’re building an application, there are various types of secrets that you need to manage. Every system should be designed to have identity & authentication data that verifies some form of identity in order to grant access to a system or application. One example of this is API tokens for making read and write requests to a database. Failure to store these tokens securely could lead to unauthorized access of information – intentional or accidental.
The stakes with secret’s management are high. Every gap in the storage of these values has potential to lead to a data leak or compromise. A security administrator’s worst nightmare.
Developers are primarily focused on creating applications, they want to build quickly, they want their system to be performant, and they want it to scale. For them, secrets management is about ease of use, performance, and reliability. On the other hand, security administrators are tasked with ensuring that these secrets remain secure. It’s their responsibility to safeguard sensitive information, ensure that security best practices are met, and to manage any fallout of an incident such as a data leak or breach. It’s their job to verify that developers at their company are building in a secure and foolproof manner.
In order for developers to build at high velocity and for security administrators to feel at ease, companies need to adopt a highly reliable and secure secrets manager. This should be a system that ensures that sensitive information is stored with the highest security measures, while maintaining ease of use that will allow engineering teams to efficiently build.
Why Cloudflare is building a secrets store
Cloudflare’s mission is to help build a better Internet – that means a more secure Internet. We recognize our customers’ need for a secure, centralized repository for storing sensitive data. Within the Cloudflare ecosystem, are various places where customers need to store and access API and authorization tokens, shared secrets, and sensitive information. It’s our job to make it easy for customers to manage these values securely.
The need for secrets management goes beyond Cloudflare. Customers have sensitive data that they manage everywhere – at their cloud provider, on their own infrastructure, across machines. Our plan is to make our Secrets Store a one-stop shop for all of our customer’s secrets.
The evolution of secrets at Cloudflare
In 2020, we launched environment variables and secrets for Cloudflare Workers, allowing customers to create and encrypt variables across their Worker scripts. By doing this, developers can obfuscate the value of a variable so that it’s no longer available in plaintext and can only be accessed by the Worker.
Adoption and use of these secrets is quickly growing. We now have more than three million Workers scripts that reference variables and secrets managed through Cloudflare. One piece of feedback that we continue to hear from customers is that these secrets are scoped too narrowly.
Today, customers can only use a variable or secret within the Worker that it’s associated with. Instead, customers have secrets that they share across Workers. They don’t want to re-create those secrets and focus their time on keeping them in sync. They want account level secrets that are managed in one place but are referenced across multiple Workers scripts and functions.
Outside of Workers, there are many use cases for secrets across Cloudflare services.
Inside our Web Application Firewall (WAF), customers can make rules that look for authorization headers in order to grant or deny access to requests. Today, when customers create these rules, they put the authorization header value in plaintext, so that anyone with WAF access in the Cloudflare account can see its value. What we’ve heard from our customers is that even internally, engineers should not have access to this type of information. Instead, what our customers want is one place to manage the value of this header or token, so that only authorized users can see, create, and rotate this value. Then when creating a WAF rule, engineers can just reference the associated secret e.g.“account.mysecretauth”. By doing this, we help our customers secure their system by reducing the access scope and enhance management of this value by keeping it updated in one place.
With new Cloudflare products and features quickly developing, we’re hearing more and more use cases for a centralized secrets manager. One that can be used to store Access Service tokens or shared secrets for Webhooks.
With the new account level Secrets Store, we’re excited to give customers the tools they need to manage secrets across Cloudflare services.
Securing the Secret Store
To have a secrets store, there are a number of measures that need to be in place, and we’re committing to providing these for our customers.
First, we’re going to give the tools that our customers need to restrict access to secrets. We will have scope permissions that will allow admins to choose which users can view, create, edit, or remove secrets. We also plan to add the same level of granularity to our services – giving customers the ability to say “only allow this Worker to access this secret and only allow this set of Firewall rules to access that secret”.
Next, we’re going to give our customers extensive audits that will allow them to track the access and use of their secrets. Audit logs are crucial for security administrators. They can be used to alert team members that a secret was used by an unauthorized service or that a compromised secret is being accessed when it shouldn’t be. We will give customers audit logs for every secret-related event, so that customers can see exactly who is making changes to secrets and which services are accessing and when.
In addition to the built-in security of the Secrets Store, we’re going to give customers the tools to rotate their encryption keys on-demand or at a cadence that fits the right security posture for them.
Sign up for the beta
We’re excited to get the Secrets Store in our customer’s hands. If you’re interested in using this, please fill out this form, and we’ll reach out to you when it’s ready to use.
“Our goal for LangChain is to empower developers around the world to build with AI. We want LangChain to work wherever developers are building, and to spark their creativity to build new and innovative applications. With this new launch, we can't wait to see what developers build with LangChainJS and Cloudflare Workers. And we're excited to put more of Cloudflare's developer tools in the hands of our community in the coming months.” – Harrison Chase, Co-Founder and CEO, LangChain
In this post, we’ll share why we’re so excited about LangChain and walk you through how to build your first LangChainJS + Cloudflare Workers application.
For the uninitiated, LangChain is a framework for building applications powered by large language models (LLMs). It not only lets you fairly seamlessly switch between different LLMs, but also gives you the ability to chain prompts together. This allows you to build more sophisticated applications across multiple LLMs, something that would be way more complicated without the help of LangChain.
Building your first LangChainJS + Cloudflare Workers application
There are a few prerequisites you have to set up in order to build this application:
An OpenAI account: If you don’t already have one, you can sign up for free.
A paid Cloudflare Workers account: If you don’t already have an account, you can sign up here and upgrade your Workers for $5 per month.
Node & npm: If this is your first time working with node, you can get it here.
Next create a new folder called langchain-workers, navigate into that folder and then within that folder run wrangler init.
When you run wrangler init you’ll select the following options:
✔Would you like to use git to manage this Worker? … yes
✔ No package.json found. Would you like to create one? … yes
✔ Would you like to use TypeScript? … no
✔ Would you like to create a Worker at src/index.js? › Fetch handler
✔ Would you like us to write your first test? … no
With our Worker created, we’ll need to set up the environment variable for our OpenAI API Key. You can create an API key in your OpenAI dashboard. Save your new API key someplace safe, then open your wrangler.toml file and add the following lines at the bottom (making sure to insert you actual API key):
[vars]
OPENAI_API_KEY = "sk…"
Then we’ll install LangChainjs using npm:
npm install langchain
Before we start writing code we can make sure everything is working properly by running wrangler dev. With wrangler dev running you can press b to open a browser. When you do, you'll see “Hello World!” in your browser.
A sample application
One common way you may want to use a language model is to combine it with your own text. LangChain is a great tool to accomplish this goal and that’s what we’ll be doing today in our sample application. We’re going to build an application that lets us use the OpenAI language model to ask a question about an article on Wikipedia. Because I live in (and love) Brooklyn, we’ll be using the Wikipedia article about Brooklyn. But you can use this code for any Wikipedia article, or website, you’d like.
Because language models only know about the data that they were trained on, if we want to use a language model with new or specific information we need a way to pass a model that information. In LangChain we can accomplish this using a ”document”. If you’re like me, when you hear “document” you often think of a specific file format but in LangChain a document is an object that consists of some text and optionally some metadata. The text in a document object is what will be used when interacting with a language model and the metadata is a way that you can track information about your document.
Most often you’ll want to create documents from a source of pre-existing text. LangChain helpfully provides us with different document loaders to make loading text from many different sources easy. There are document loaders for different types of text formats (for example: CSV, PDFs, HTML, unstructured text) and that content can be loaded locally or from the web. A document loader will both retrieve the text for you and load that text into a document object. For our application, we’ll be using the webpages with Cheerio document loader. Cheerio is a lightweight library that will let us read the content of a webpage. We can install it using npm install cheerio.
After we’ve installed cheerio we’ll import the CheerioWebBaseLoader at the top of our src/index.js file:
import { CheerioWebBaseLoader } from "langchain/document_loaders/web/cheerio";
With CheerioWebBaseLoader imported, we can start using it within our fetch function:.
In this code, we’re configuring our loader with the Wikipedia URL for the article about Brooklyn, run the load() function and log the result to the console. Like I mentioned earlier, if you want to try this with a different Wikipedia article or website, LangChain makes it very easy. All we have to do is change the URL we’re passing to our CheerioWebBaseLoader.
Let’s run wrangler dev, load up our page locally and watch the output in our console. You should see:
Loaded page
Array(1) [ Document ]
Our document loader retrieved the content of the webpage, put that content in a document object and loaded it into an array.
This is great, but there’s one more improvement we can make to this code before we move on – splitting our text into multiple documents.
Many language models have limits on the amount of text you can pass to them. As well, some LLM APIs charge based on the amount of text you send in your request. For both of these reasons, it’s helpful to only pass the text you need in a request to a language model.
Currently, we’ve loaded the entire content of the Wikipedia page about Brooklyn into one document object and would send the entirety of that text with every request to our language model. It would be more efficient if we could only send the relevant text to our language model when we have a question. The first step in doing this is to split our text into smaller chunks that are stored in multiple document objects. To assist with this LangChain gives us the very aptly named Text Splitters.
We can use a text splitter by updating our loader to use the loadAndSplit() function instead of load(). Update the line where we assign docs to this:
const docs = await loader.loadAndSplit();
Now start the application again with wrangler dev and load our page. This time in our console you’ll see something like this:
Instead of an array with one document object, our document loader has now split the text it retrieved into multiple document objects. It’s still a single Wikipedia article, LangChain just split that text into chunks that would be more appropriately sized for working with a language model.
Even though our text is split into multiple documents, we still need to be able to understand what text is relevant to our question and should be sent to our language model. To do this, we’re going to introduce two new concepts – embeddings and vector stores.
Embeddings are a way of representing text with numerical data. For our application we’ll be using OpenAI Embeddings to generate our embeddings based on the document objects we just created. When you generate embeddings the result is a vector of floating point numbers. This makes it easier for computers to understand the relatedness of the strings of text to each other. For each document object we pass the embedding API, a vector will be created.
When we compare vectors, the closer numbers are to each other the more related the strings are. Inversely, the further apart the numbers are then the less related the strings are. It can be helpful to visualize how these numbers would allow us to place each document in a virtual space:
In this illustration, you could imagine how the text in the document objects that are bunched together would be more similar than the document object further off. The grouped documents could be text pulled from the article’s section on the history of Brooklyn. It’s a longer section that would have been split into multiple documents by our text splitter. But even though the text was split the embeddings would allow us to know this content is closely related to each other. Meanwhile, the document further away could be the text on the climate of Brooklyn. This section was smaller, not split into multiple documents, and the current climate is not as related to the history of Brooklyn, so it’s placed further away.
Embeddings are a pretty fascinating and complicated topic. If you’re interested in understanding more, here's a great explainer video that takes an in-depth look at the embeddings.
Once you’ve generated your documents and embeddings, you need to store them someplace for future querying. Vector stores are a kind of database optimized for storing & querying documents and their embeddings. For our vector store, we’ll be using MemoryVectorStore which is an ephemeral in-memory vector store. LangChain also has support for many of your favorite vector databases like Chroma and Pinecone.
We’ll start by adding imports for OpenAIEmbeddings and MemoryVectorStore at the top of our file:
import { OpenAIEmbeddings } from "langchain/embeddings/openai";
import { MemoryVectorStore } from "langchain/vectorstores/memory";
Then we can remove the console.log() function we had in place to show how our loader worked and replace them with the code to create our Embeddings and Vector store:
const store = await MemoryVectorStore.fromDocuments(docs, new OpenAIEmbeddings({ openAIApiKey: env.OPENAI_API_KEY}));
With our text loaded into documents, our embeddings created and both stored in a vector store we can now query our text with our language model. To do that we’re going to introduce the last two concepts that are core to building this application – models and chains.
When you see models in LangChain, it’s not about generating or creating models. Instead, LangChain provides a standard interface that lets you access many different language models. In this app, we’ll be using the OpenAI model.
Chains enable you to combine a language model with other sources of information, APIs, or even other language models. In our case, we’ll be using the RetreivalQAChain. This chain retrieves the documents from our vector store related to a question and then uses our model to answer the question using that information.
To start, we’ll add these two imports to the top of our file:
import { OpenAI } from "langchain/llms/openai";
import { RetrievalQAChain } from "langchain/chains";
Then we can put this all into action by adding the following code after we create our vector store:
        const model = new OpenAI({ openAIApiKey: env.OPENAI_API_KEY});
        const chain = RetrievalQAChain.fromLLM(model, store.asRetriever());

        const question = "What is this article about? Can you give me 3 facts about it?";

        const res = await chain.call({
            query: question,
        });

        return new Response(res.text);
In this code the first line is where we instantiate our model interface and pass it our API key. Next we create a chain passing it our model and our vector store. As mentioned earlier, we’re using a RetrievalQAChain which will look in our vector store for documents related to our query and then use those documents to get an answer for our query from our model.
With our chain created, we can call the chain by passing in the query we want to ask. Finally, we send the response text we got from our chain as the response to the request our Worker received. This will allow us to see the response in our browser.
With all our code in place, let’s test it again by running wrangler dev. This time when you open your browser you will see a few facts about Brooklyn:
Right now, the question we’re asking is hard coded. Our goal was to be able to use LangChain to ask any question we want about this article. Let’s update our code to allow us to pass the question we want to ask in our request. In this case, we’ll pass a question as an argument in the query string (e.g. ?question=When was Brooklyn founded). To do this we’ll replace the line we’re currently assigning our question with the code needed to pull a question from our query string:
        const { searchParams } = new URL(request.url);
        const question = searchParams.get('question') ?? "What is this article about? Can you give me 3 facts about it?";
This code pulls all the query parameters from our URL using a JavaScript URL’s native searchParams property, and gets the value passed in for the “question” parameter. If a value isn’t present for the “question” parameter, we’ll use the default question text we were using previously thanks to JavaScripts’s nullish coalescing operator.
With this update, run wrangler dev and this time visit your local url with a question query string added. Now instead of giving us a few fun facts about Brooklyn, we get the answer of when Brooklyn was founded. You can try this with any question you may have about Brooklyn. Or you can switch out the URL in our document loader and try asking similar questions about different Wikipedia articles.
With our code working locally, we can deploy it with wrangler publish. After this command completes you’ll receive a Workers URL that runs your code.
You + LangChain + Cloudflare Workers
You can find our full LangChain example application on GitHub. We can’t wait to see what you all build with LangChain and Cloudflare Workers. Join us on Discord or tag us on Twitter as you’re building. And if you’re ever having any trouble or questions, you can ask on community.cloudflare.com.
I remember when the first iPhone was announced in 2007. This was NOT an iPhone as we think of one today. It had warts. A lot of warts. It couldn’t do MMS for example. But I remember the possibility it brought to mind. No product before had seemed like anything more than a product. The iPhone, or more the potential that the iPhone hinted at, had an actual impact on me. It changed my thinking about what could be.
In the years since no other product came close to matching that level of awe and wonder. That changed in March of this year. The release of GPT-4 had the same impact I remember from the iPhone launch. It’s still early, but it's opened the imagination, and fears, of millions of developers in a way I haven’t seen since that iPhone announcement.
That excitement has led to an explosion of development and hundreds of new tools broadly grouped into a category we call generative AI. Generative AI systems create content mimicking a particular style. New images that look like Banksy or lyrics that sound like Taylor Swift. All of these Generative AI tools, whether built on top of GPT-4 or something else, use the same basic model technique: a transformer.
Attention is all you need
GPT-4 (Generative Pretrained Transformer) is the most advanced version of a transformer model. Transformer models all emerged from a seminal paper written in 2017 by researchers at the University of Toronto and the team at Google Brain, titled Attention is all you need. The key insight from the paper is the self-attention mechanism. This mechanism replaced recurrent and convolutional layers, allowing for faster training and better performance.
The secret power of transformer models is their ability to efficiently process large amounts of data in parallel. It's the transformers' gargantuan scale and extensive training that makes them so appealing and versatile, turning them into the Swiss Army knife of natural language processing. At a high level, Large Language Models (LLMs) are just transformer models that use an incredibly large number of parameters (billions), and are trained on incredibly large amounts of unsupervised text (the Internet). Hence large, and language.
Unleashing the potential of LLMs in consumer-facing AI tools has opened a world of possibilities. But possibility also means new risk: developers must now navigate the unique security challenges that arise from making powerful new tools widely available to the masses.
First and foremost, consumer-facing applications inherently expose the underlying AI systems to millions of users, vastly increasing the potential attack surface. Since developers are targeting a consumer audience, they can't rely on trusted customers or limit access based on geographic location. Any security measure that makes it too difficult for consumers to use defeats the purpose of the application. Consequently, developers must strike a delicate balance between security and usability, which can be challenging.
The current popularity of AI tools makes explosive takeoff more likely than in the past. This is great! Explosive takeoff is what you want! But, that explosion can also lead to exponential growth in costs, as the computational requirements for serving a rapidly growing user base can become overwhelming.
In addition to being popular, Generative AI apps are unique in that calls to them are incredibly resource intensive, and therefore expensive for the owner. In comparison, think about a more traditional API that Cloudflare has protected for years. A product API. Sites don’t want competitors calling their product API and scraping data. This has an obvious negative business impact. However, it doesn’t have a direct infrastructure cost. A product list API returns a small amount of text. An attacker calling it 4 million times will have a negligible cost to an infrastructure bill. But generative models can cost cents, or in the case of image generation even tens of cents per call. An attacker gaining access and generating millions of calls has a real cost impact to the developers providing those APIs.
Not only are the costs for generating content high, but the value that end users are willing to pay is high as well. Customers tell us that they have seen multiple instances of bad actors accessing an API without paying, then reselling the content they generate for 50 cents or more per call. The huge monetary opportunity of exploitation means attackers are highly motivated to come back again and again, refactoring their approach each time.
Last, consumer-facing LLM applications are generally designed as a single entry point for customers, almost always accepting query text as input. The open-text nature of these calls makes it difficult to predict the potential impact of a single request. For example, a complex query might consume significant resources or trigger unexpected behavior. While these APIs are not GraphQL based, the challenges are similar. When you accept unstructured submissions, it's harder to create any type of rule to prevent abuse.
Tips for protecting your Generative AI application
So you've built the latest generative AI sensation, and the world is about to be taken by storm. But that success is also about to make you a target. What's the trick to stopping all those attacks you’re about to see? Well, unfortunately there isn’t one. For all the reasons above, this is a hard, persistent problem with no simple solution. But, we’ve been fortunate to work with many customers who have had that target on their back for months, and we’ve learned a lot from that experience. Here are some recommendations that will give you a good foundation for making sure that you, and only you, reap the rewards of your hard work.
1. Enforce tokens for each user. Enforcing usage based on a specific user or user session is straightforward. But sometimes you want to allow anonymous usage. While anonymous usage is great for demos and testing, it can lead to abuse. If you must allow anonymous usage, create a “stickier” identification scheme that persists browser restarts and incognito mode. Your goal isn’t to track specific users, but instead to understand how much an anonymous user has already used your service so far in demo / free mode.
2. Manage quotas carefully. Your service likely incurs costs and charges users per API call, so it likely makes sense to set a limit on the number of times any user can call your API. You may not ever intend for the average user to hit this limit, but having limits in place will protect against that user’s API key becoming compromised and shared amongst many users. It also protects against programming errors that could result in 100x or 1000x expected usage, and a large unexpected bill to the end user.
3. Block certain ASNs (autonomous system numbers) wholesale. Blocking ASNs, or even IPs wholesale is an incredibly blunt tool. In general Cloudflare rarely recommends this approach to customers. However, when tools are as popular as some generative AI applications, attackers are highly motivated to send as much traffic as possible to those applications. The fastest and cheapest way to accomplish this is through data centers that usually share a common ASN. Some ASNs belong to ISPs, and source traffic from people browsing the Internet. But other ASNs belong to cloud compute providers, and mainly source outbound traffic from virtual servers. Traffic from these servers can be overwhelmingly malicious. For example, several of our customers have found ASNs where 88-90% of the traffic turns out to be automated, while this number is usually only 30% for average traffic. In cases this extreme, blocking entire ASNs can make sense.
4. Implement smart rate limits. Counting not only requests per minute and requests per session, but also IPs per token and tokens per IP can guard against abuse. Tracking how many different IPs are using a particular token at any one time can alert you to a user's token being leaked. Similarly, if one IP is rotating through tokens, looking at each token’s session traffic would not alert you to the abuse. You’d need to look at how many tokens that single IP is generating in order to pinpoint that specific abusive behavior.
5. Rate limit on something other than the user. Similar to enforcing tokens on each user, your real time rate limits should also be set on your sticky identifier.
6. Have an option to slow down attackers. Customers often think about stopping abuse in terms of blocking traffic from abusers. But blocking isn’t the only option. Attacks not only need to be successful, they also need to be economically feasible. If you can make requests more difficult or time-consuming for abusers, you can ruin their economics. You can do this by implementing a waiting room, or by challenging users. We recommend a challenge option that doesn’t give real users an awful experience. Challenging users can also be quickly enabled or disabled as you see abuse spike or recede.
7. Map and analyze sequences. By sampling user sessions that you suspect of abuse, you can inspect their requests path-by-path in your SIEM. Are they using your app as expected? Or are they circumventing intended usage? You might benefit from enforcing a user flow between endpoints.
8. Build and validate an API schema. Many API breaches happen due to permissive schemas. Users are allowed to send in extra fields in requests that grant them too many privileges or allow access to other users’ data. Make sure you build a verbose schema that outlines what intended usage is by identifying and cataloging all API endpoints, then making sure all specific parameters are listed as required and have type limits to them.
We recently went through the transition to an OpenAPI schema ourselves for api.cloudflare.com. You can read more about how we did it here. Our schema looks like this:
/zones:
    get:
      description: List, search, sort, and filter your zones.
      operationId: zone-list-zones
      responses:
        4xx:
          content:
            application/json:
              schema:
                allOf:
                - $ref: '#/components/schemas/components-schemas-response_collection'
                - $ref: '#/components/schemas/api-response-common-failure'
          description: List Zones response failure
        "200":
          content:
            application/json:
              schema:
                $ref: '#/components/schemas/components-schemas-response_collection'
          description: List Zones response
      security:
      - api_email: []
        api_key: []
      summary: List Zones
      tags:
      - Zone
      x-cfPermissionsRequired:
        enum:
        - '#zone:read'
      x-cfPlanAvailability:
        business: true
        enterprise: true
        free: true
        pro: true
9. Analyze the depth and complexity of queries. Are your APIs driven by GraphQL? GraphQL queries can be a source of abuse since they allow such free-form requests. Large, complex queries can grow to overwhelm origins if limits aren’t in place. Limits help guard against outright DoS attacks as well as developer error, keeping your origin healthy and serving requests to your users as expected.
For example, if you have statistics about your GraphQL queries by depth and query size, you could execute this TypeScript function to analyze them by quantile:
import * as ss from 'simple-statistics';

function calculateQuantiles(data: number[], quantiles: number[]): {[key: number]: string} {
    let result: {[key: number]: string} = {};
    for (let q of quantiles) {
        // Calculate quantile, convert to fixed-point notation with 2 decimal places
        result[q] = ss.quantile(data, q).toFixed(2);
    }
    return result;
}

// Example usage:
let queryDepths = [2, 2, 2, 2, 2, 2, 2, 4, 4, 4, 4, 4, 1, 1, 1, 1, 1, 1, 1, 1];
let querySizes = [11, 11, 11, 11, 11, 11, 11, 11, 11, 11, 2, 2, 2, 2, 2, 2, 2, 2, 2, 2];

console.log(calculateQuantiles(queryDepths, [0.5, 0.75, 0.95, 0.99]));
console.log(calculateQuantiles(querySizes, [0.5, 0.75, 0.95, 0.99]));
The results give you a sense for the depth of the average query hitting your endpoint, grouped by quantile:
Actual data from your production environment would provide a threshold to start an investigation into which queries to further log or limit. A simpler option is to use a query analysis tool, like Cloudflare’s, to make the process automatic.
10. Use short-lived access tokens and long-lived refresh tokens upon successful authentication of your users. Implement token validation in a middleware layer or API Gateway, and be sure to have a dedicated token renewal endpoint in your API. JSON Web Tokens (JWTs) are popular choices for these short-lived tokens. When access tokens expire, allow users to obtain new ones using their refresh tokens. Revoke refresh tokens when necessary to maintain system security. Adopting this approach enhances your API's security and user experience by effectively managing access and mitigating the risks associated with compromised tokens.
11. Communicate directly with your users. All of the above recommendations are going to make it a bit more cumbersome for some of your customers to use your product. You are going to get complaints. You can reduce these by first, giving clear communication to your users explaining why you put these measures in place. Write a blog about what security measures you did and did not decide to implement and have dev docs explaining troubleshooting steps to resolve. Second, give your users concrete steps they can take if they are having trouble, and a clear way to contact you directly. Feeling inconvenienced can be frustrating, but feeling stuck can lose you a customer.
Conclusion: this is the beginning
Generative AI, like the first iPhone, has sparked a surge of excitement and innovation. But that excitement also brings risk, and innovation brings new security holes and attack vectors. The broadness and uniqueness of generative AI applications in particular make securing them particularly challenging. But as every scout knows, being prepared ahead of time means less stress and worry during the journey. Implementing the tips we've shared can establish a solid foundation that will let you sit back and enjoy the thrill of building something special, rather than worrying what might be lurking around the corner.
Cloudflare’s website, application security and performance products handle upwards of 46 million HTTP requests per second, every second. These products were originally built as a set of native Linux services, but we’re increasingly building parts of the system using our Cloudflare Workers developer platform to make these products faster, more robust, and easier to develop. This blog post digs into how and why we’re doing this.
System architecture
Our architecture can best be thought of as a chain of proxies, each communicating over HTTP. At first, these proxies were all implemented based on NGINX and Lua, but in recent years many of them have been replaced – often by new services built in Rust, such as Pingora.
The proxies each have distinct purposes – some obvious, some less so. One which we’ll be discussing in more detail is the FL service, which performs “Front Line” processing of requests, applying customer configuration to decide how to handle and route the request.
This architecture has worked well for more than a decade. It allows parts of the system to be developed and deployed independently, parts of the system to be scaled independently, and traffic to be routed to different nodes in our systems according to load, or to ensure efficient cache utilization.
So, why change it?
At the level of latency we care about, service boundaries aren’t cheap, particularly when communicating over HTTP. Each step in the chain adds latency due to communication overheads, so we can’t add more services as we develop new products. And we have a lot of products, with many more on the way.
To avoid this overhead, we put most of the logic for many different products into FL. We’ve developed a simple modular architecture in this service, allowing teams to make and deploy changes with some level of isolation. This has become a very complex service which takes a constant effort by a team of skilled engineers to maintain and operate.
Even with this effort, the developer experience for Cloudflare engineers has often been much harder than we would like. We need to be able to start working on implementing any change quickly, but even getting a version of the system running in a local development environment is hard, requiring installation of custom tooling and Linux kernels.
The structure of the code limits the ease of making changes. While some changes are easy to make, other things run into surprising limits due to the underlying platform. For example, it is not possible to perform I/O in many parts of the code which handle HTTP response processing, leading to complex workarounds to preload resources in case they are needed.
Deploying updates to the software is high risk, so is done slowly and with care. Massive improvements have been made in the past years to our processes here, but it’s not uncommon to have to wait a week to see changes reach production, and changes tend to be deployed in large batches, making it hard to isolate the effect of each change in a release.
Finally, the code has a modular structure, but once in production there is limited isolation and sandboxing, so tracing potential side effects is hard, and debugging often requires knowledge of the whole system, which takes years of experience to obtain.
Developer platform to the rescue
As soon as Cloudflare workers became part of our stack in 2017, we started looking at ways to use them to improve our ability to build new products. Now, in 2023, many of our products are built in part using workers and the wider developer platform; for example, read this post from the Waiting Room team about how they use Workers and Durable Objects, or this post about our cache purge system doing the same. Products like Cloudflare Zero Trust, R2, KV, Turnstile, Queues, and Exposed credentials check are built using Workers at large scale, handling every request processed by the products. We also use Workers for many of our pieces of internal tooling, from dashboards to building chatbots.
While we can and do spend time improving the tooling and architecture of all our systems, the developer platform is focussed all the time on making developers productive, and being as easy to use as possible. Many of the other posts this week on this blog talk about our work here. On the developer platform, any customer can get something running in minutes, and build and deploy full complex systems within days.
We have been working to give developers working on internal Cloudflare products the same benefits.
Customer workers vs internal workers
At this point, we need to talk about two different types of worker.
The first type is created when a customer writes a Cloudflare Worker. The code is deployed to our network, and will run whenever a request to the customer’s site matches the worker’s route. Many Cloudflare engineering teams use workers just like this to build parts of our product – for example, we wrote about our Coreless Purge system for Cache recently. In these cases, our engineering teams are using exactly the same process and tooling as any Cloudflare customer would use.
However, we also have another type of worker, which can only be deployed by Cloudflare. These are not associated with a single customer. Instead, they are run for all customers for which a particular product or other piece of logic needs to be performed.
For the rest of this post, we’re only going to be talking about these internal workers. The underlying tech is the same – the difference to remember is that these workers run in response to requests from many Cloudflare customers rather than one.
Initial integration of internal workers
We first integrated internal workers into our architecture in 2019, in a very simple way. An ordered chain of internal workers was created, which run before any customer scripts.
I previously said that adding more steps in our chain would cause excessive latency. So why isn’t this a problem for internal workers?
The answer is that these internal workers run within the same service as each other, and as customer workers which are operating on the request. So, there’s no need to marshal the request into HTTP to pass it on to the next step in the chain; the runtime just needs to pass a memory reference around, and perform a lightweight shift of control. There is still a cost of adding more steps – but the cost per step is much lower.
The integration gave us several benefits immediately. We were able to take advantage of the strong sandbox model for workers, removing any risk of unexpected side effects between customers or requests. It also allowed isolated deployments – teams could deploy their updates on their own schedule, without waiting for or disrupting other teams.
However, it also had a number of limitations. Internal workers could only run in one place in the lifetime of a request. This meant they couldn’t affect services running before them, such as the Cloudflare WAF.
Also, for security reasons, internal workers were published with an internal API using special credentials, rather than the public workers API. In 2019, this was no big deal, but since then there has been a ton of work to improve tooling such as wrangler, and build the developer platform. All of this tooling was unavailable for internal workers.
We had very limited observability of internal workers, lacking metrics and detailed logs, making them hard to debug.
We realized that we could do a lot more with the platform to improve our development processes. We also wondered how far it would be possible to go with the platform. Would it be possible to migrate all the logic implemented in the NGINX-based FL service to the developer platform? And if not, why not?
So we started, in late 2021, with a prototype. This routed traffic directly from our TLS ingress service to our workers runtime, skipping the FL service. We named this prototype Flame.
It worked. Just about. Most importantly for a prototype, we could see that we were missing some fundamental capabilities. We couldn’t access other Cloudflare internal services, such as our DNS infrastructure or our customer configuration database, and we couldn’t emit request logs to our data pipeline, for analytics and billing purposes.
We rely heavily on caching for performance, and there was no way to cache state between requests. We also couldn’t emit HTTP requests directly to customer origins, or to our cache, without using our full existing chain-of-proxies pipeline.
Also, the developer experience for this prototype was very poor. We couldn’t take advantage of all the developer experience work being put into wrangler, due to the need to use special APIs to deploy internal workers. We couldn’t record metrics and traces to our standard observability tooling systems, so we were blind to the behavior of the system in production. And we had no way to perform a controlled and gradual deployment of updated code.
Improving the developer platform for internal services
We set out to address these problems one by one. Wherever possible, we wanted to use the same tooling for internal purposes as we provide to customers. This not only reduces the amount of tooling we need to support, but also means that we understand the problems our customers face better, and can improve their experience as well as ours.
Tooling and routing
We started with the basics – how can we deploy code for internal services to the developer platform.
I mentioned earlier that we used special internal APIs for deploying our internal workers, for “security reasons”. We reviewed this with our security team, and found that we had good protections on our API to identify who was publishing a worker. The main thing we needed to add was a secure registry of accounts which were allowed to use privileged resources. Initially we did this by hard-coding a set of permissions into our API service – later this was replaced by a more flexible permissions control plane.
Even more importantly, there is a strong distinction between publishing a worker and deploying a worker.
Publishing is the process of pushing the worker to our configuration store, so that the code to be run can be loaded when it is needed. Internally, each worker version which is published creates a new artifact in our store.
The Workers runtime uses a capability-based security model. When it is published, each script is bundled together with a list of bindings, representing the capabilities that the script has to access other resources. This mechanism is a key part of providing safety – in order to be able to access resources, the script must have been published by an account with the permissions to provide the capabilities. The secure management of bindings to internal resources is a key part of our ability to use the developer platform for internal systems.
Deploying is the process of hooking up the worker to be triggered when a request comes in. For a customer worker, deployment means attaching the worker to a route. For our internal workers, deployment means updating a global configuration store with the details of the specific artifact to run.
After some work, we were finally able to use wrangler to build and publish internal services. But there was a problem! In order to deploy an internal worker, we needed to know the identifier for the artifact which was published. Fortunately, this was a simple change: we updated wrangler to output debug information which contained this information.
A big benefit of using wrangler is that we could make tools like “wrangler test” and “wrangler dev” work. An engineer can check out the code, and get going developing their feature with well-supported tooling, and within a realistic environment.
Event logging
We run a comprehensive data pipeline, providing streams of data for our customers to allow them to see what is happening on their sites, for our operations teams to understand how our system is behaving in production, and for us to provide services like DoS protection and accurate billing.
This pipeline starts from our network as messages in Cap’n Proto format. So we needed to build a new way to push pieces of log data to our internal pipeline, from inside a worker. The pipeline starts with a service called “logfwdr”, so we added a new binding which allowed us to push an arbitrary log message to the logfwdr service. This work was later a foundation of the Workers Analytics Engine bindings, which allow customers to use the same structured logging capabilities.
Observability
Observability is the ability to see how code is behaving. If you don’t have good observability tooling, you spend most of your time guessing. It’s inefficient and frankly unsafe to operate such a system.
At Cloudflare, we have very many systems for observability, but three of the most important are:
Unstructured logs (“syslogs”). These are ingested to systems such as Kibana, which allow searching and visualizing the logs.
Metrics. Also emitted from all our systems, these are a set of numbers representing things like “CPU usage” or “requests handled”, and are ingested to a massive Prometheus system. These are used for understanding the overall behavior of our systems, and for alerting us when unexpected or undesirable changes happen.
Traces. We use systems based around Open Telemetry to record detailed traces of the interactions of the components of our system. This lets us understand which information is being passed between each service, and the time being spent in each service.
Initial support for syslogs, metrics and traces for internal workers was built by our observability team, who provided a set of endpoints to which workers could push information. We wrapped this in a simple library, called “flame-common”, so that emitting observability events could be done without needing to think about the mechanics behind it.
Our initial wrapper looked something like this:
import { ObservabilityContext } from "flame-common";

export default {
    async fetch(
        request: Request,
        env: Env,
        ctx: ExecutionContext
    ): Promise<Response> {

        const obs = new ObservabilityContext(request, env, ctx);

        // Logging to syslog and kibana
        obs.logInfo("some information")
        obs.logError("an error occurred")

        // Metrics to Prometheus
        obs.counter("rps", "how many requests per second my service is doing")?.inc();

        // Tracing
        obs.startSpan("my code");
        obs.addAttribute("key", 42);
    },
};
An awkward part of this API was the need to pass the “ObservabilityContext” around to be able to emit events. Resolving this was one of the reasons that we recently added support for AsyncLocalStorage to the Workers runtime.
While our current observability system works, the internal implementation isn’t as efficient as we would like. So, we’re also working on adding native support for emitting events, metrics and traces from the Workers runtime. As we did with the Workers Analytics Engine, we want to find a way to do this which can be hooked up to our internal systems, but which can also be used by customers to add better observability to their workers.
Accessing internal resources
One of our most important internal services is our configuration store, Quicksilver. To be able to move more logic into the developer platform, we need to be able to access this configuration store from inside internal workers. We also need to be able to access a number of other internal services – such as our DNS system, and our DoS protection systems.
Our systems use Cap’n Proto in many places as a serialization and communication mechanism, so it was natural to add support for Cap’n Proto RPC to our Workers runtime. The systems which we need to talk to are mostly implemented in Go or Rust, which have good client support for this protocol.
We therefore added support for making connections to internal services over Cap’n Proto RPC to our Workers runtime. Each service will listen for connections from the runtime, and publish a schema to be used to communicate with it. The Workers runtime manages the conversion of data from JavaScript to Cap’n Proto, according to a schema which is bundled together with the worker at publication time. This makes the code for talking to an internal service, in this case our DNS service being used to identify the account owning a particular hostname, as simple as:
let ownershipInterface = env.RRDNS.getCapability();

let query = {
  request: {
    queryName: url.hostname,
    connectViaAddr: control_header.connect_via_addr,
  },
};

let response = await ownershipInterface.lookupOwnership(query);
Caching
Computers run on cache, and our services are no exception. Looking at the previous example, if we have 10,000 requests coming in quick succession for the same hostname, we don’t want to look up the hostname in our DNS system for each one. We want to cache the lookups.
At first sight, this is incompatible with the design of workers, where we give no guarantees of state being preserved between requests. However, we have added a new internal binding to provide a “volatile in-memory cache”. Wherever it is possible to efficiently share this cache between workers, we will do so.
The following flowchart describes the semantics of this cache.
To use the cache, we simply need to wrap a block of code in a call to the cache:
const owner = await env.OWNERSHIPCACHE.read<OwnershipData>(
  key,
  async (key) => {
    let ownershipInterface = env.RRDNS.getCapability();

    let query = {
      request: {
        queryName: url.hostname,
        connectViaAddr: control_header.connect_via_addr,
      },
    };

    let response = await ownershipInterface.lookupOwnership(query);
    const value = response.response;
    const expiration = new Date(Date.now() + 30_000);
    return { value, expiration };
  }
);
This cache drastically reduces the number of calls needed to fetch external resources. We are likely to improve it further, by adding support for refreshing in the background to reduce P99 latency, and improving observability of its usage and hit rates.
Direct egress from workers
If you looked at the architecture diagrams above closely, you might have noticed that the next step after the Workers runtime is always FL. Historically, the runtime only communicated with the FL service – allowing some product logic which was implemented in FL to be performed after workers had processed the requests.
However, in many cases this added unnecessary overhead; no logic actually needs to be performed in this step. So, we’ve added the ability for our internal workers to control how egress of requests works. In some cases, egress will go directly to our cache systems. In others, it will go directly to the Internet.
Gradual deployment
As mentioned before, one of the critical requirements is that we can deploy changes to our code in a gradual and controlled manner. In the rare event that something goes wrong, we need to make sure that it is detected as soon as possible, rather than triggering an issue across our entire network.
Teams using internal workers have built a number of different systems to address this issue, but they are all somewhat hard to use, with manual steps involving copying identifiers around, and triggering advancement at the right times. Manual effort like this is inefficient – we want developers to be thinking at a higher level of abstraction, not worrying about copying and pasting version numbers between systems.
We’ve therefore built a new deployment system for internal workers, based around a few principles:
Control deployments through git. A deployment to an internal-only environment would be triggered by a merge to a staging branch (with appropriate reviews). A deployment to production would be triggered by a merge to a production branch.
Progressive deployment. A deployment starts with the lowest impact system (ideally, a pre-production system which mirrors production, but has no customer impact if it breaks). It then progresses through multiple stages, each one with a greater level of impact, until the release is completed.
Health-mediated advancement. Between each stage, a set of end-to-end tests is performed, metrics are reviewed, and a minimum time must elapse. If any of these fail, the deployment is paused, or reverted; and this happens automatically, without waiting for a human to respond.
This system allows developers to focus on the behavior of their system, rather than the mechanics of a deployment.
There are still plenty of plans for further improvement to many of these systems – but they’re running now in production for many of our internal workers.
Moving from prototype to production
Our initial prototype has done its job: it’s shown us what capabilities we needed to add to our developer platform to be able to build more of our internal systems on it. We’ve added a large set of capabilities for internal service development to the developer platform, and are using them in production today for relatively small components of the system. We also know that if we were about to build our application security and performance products from scratch today, we could build them on the platform.
But there’s a world of difference between having a platform that is capable of running our internal systems, and migrating existing systems over to it. We’re at a very early stage of migration; we have real traffic running on the new platform, and expect to migrate more pieces of logic, and some full production sites, to run without depending on the FL service within the next few months.
We’re also still working out what the right module structure for our system is. As discussed, the platform allows us to split our logic into many separate workers, which communicate efficiently, internally. We need to work out what the right level of subdivision is to match our development processes, to keep our code understandable and maintainable, while maintaining efficiency and throughput.
What’s next?
We have a lot more exploration and work to do. Anyone who has worked on a large legacy system knows that it is easy to believe that rewriting the system from scratch would allow you to fix all its problems. And anyone who has actually done this knows that such a project is doomed to be many times harder than you expect – and risks recreating all the problems that the old architecture fixed long ago.
Any rewrite or migration we perform will need to give us a strong benefit, in terms of improved developer experience, reliability and performance.
And it has to be possible to migrate without slowing down the pace at which we develop new products, even for a moment.
In fact, this isn’t even the first time we’ve rewritten our entire technical architecture for this very system. The first version of our performance and security proxy was implemented in PHP. This was retired in 2013 after an effort to rebuild the system from scratch. One interesting aspect of that rewrite is that it was done without stopping. The new system was so much easier to build that the developers working on it were able to catch up with the changes being made in the old system. Once the new system was mostly ready, it started handling requests; and if it found it wasn’t able to handle a request, it fell back to the old system. Eventually, enough logic was implemented that the old system could be turned off, leading to:
Our systems are a lot more complicated than they were in 2013. The approach we’re taking is one of gradual change. We will not rebuild our systems as a new, standalone reimplementation. Instead, we will identify separable parts of our systems, where we can have a concrete benefit in the immediate future, and migrate these to new architectures. We’ll then learn from these experiences, feed them back into improving our platform and tooling, and identify further areas to work on.
Modularity of our code is of key importance; we are designing a system that we expect to be modified by many teams. To control this complexity, we need to introduce strong boundaries between code modules, allowing reasoning about the system to be done at a local level, rather than needing global knowledge.
Part of the answer may lie in producing multiple different systems for different use cases. Part of the strength of the developer platform is that we don’t have to publish a single version of our software – we can have as many as we need, running concurrently on the platform.
The Internet is a wild place, and we see every odd technical behavior you can imagine. There are standards and RFCs which we do our best to follow – but what happens in practice is often undocumented. Whenever we change any edge case behavior of our system, which is sometimes unavoidable with a migration to a new architecture, we risk breaking an assumption that someone has made. This doesn’t mean we can never make such changes – but we do need to be deliberate about it and understand the impact, so that we can minimize disruption.
To help with this, another essential piece of the puzzle is our testing infrastructure. We have many tests that run on our software and network, but we’re building new capabilities to test every edge-case behavior of our system, in production, before and after each change. This will let us experiment with a great deal more confidence, and decide when we migrate pieces of our system to new architectures whether to be “bug-for-bug” compatible, and if not, whether we need to warn anyone about the change. Again – this isn’t the first time we’ve done such a migration: for example, when we rebuilt our DNS pipeline to make it three times faster, we built similar tooling to allow us to see if the new system behaved in any way differently from the earlier system.
The one thing I’m sure of is that some of the things we learn will surprise us and make us change direction. We’ll use this to improve the capabilities and ease of use of the developer platform. In addition, the scale at which we’re running these systems will help to find any previously hidden bottlenecks and scaling issues in the platform. I look forward to talking about our progress, all the improvements we’ve made, and all the surprise lessons we’ve learnt, in future blog posts.
I want to know more
We’ve covered a lot here. But maybe you want to know more, or you want to know how to get access to some of the features we’ve talked about here for your own projects.
If you’re interested in hearing more about this project, or in letting us know about capabilities you want to add to the developer platform, get in touch on Discord.
At GitHub, our favorite people are developers. We love to make them happy and productive, and today, on Global Accessibility Awareness Day, we want to celebrate their achievements by sharing some great stories about a few developers with disabilities alongside news of recent accessibility improvements at GitHub that help them do the best work of their lives.
Amplifying the voices of disabled developers
People with disabilities frequently encounter biases that prevent their full and equal participation in all areas of life, including education and employment. That’s why GitHub and The ReadME Project are thrilled to provide a platform for disabled developers to showcase their contributions and counteract bias.
Paul Chiou, a developer who’s paralyzed from the neck down, is breaking new ground in the field of accessibility automation, while pursuing his Ph.D. Paul uses a computer with custom hardware and software he designed and built, and this lived experience gives him a unique insight into the needs of other people with disabilities. The barriers he encounters push him to innovate, both in his daily life and in his academic endeavors. Learn more about Paul and his creative solutions in this featured article and video profile.
Becky Tyler found her way to coding via gaming, but she games completely with her eyes, just like everything else she does on a computer, from painting to livestreaming to writing code. Her desire to play Minecraft led her down the path of open source software and collaboration, and now she’s studying computer science at the University of Dundee. Learn more about Becky in this featured article and video profile.
Dr. Annalu Waller leads the Augmentative and Alternative Communication Research Group at the University of Dundee. She’s also Becky’s professor. Becky calls her a “taskmaster,” but the profile of Annalu’s life shows how her lived experience informed her high expectations for her students—especially those with disabilities—and gave her a unique ability to absorb innovations and use them to benefit people with disabilities.
Anton Mirhorodchenko has difficulty speaking and typing with his hands, and speaks English as a second language. Anton has explored ways to use ChatGPT and GitHub Copilot to not only help him communicate and express his ideas, but also develop software from initial architecture all the way to code creation. Through creative collaboration with his AI teammates, Anton has become a force to be reckoned with, and he recently shared his insights in this guide on how to harness the power of generative AI for software development.
npm is the default package manager for JavaScript and the largest software registry in the world. To empower every developer to contribute to and benefit from this amazing resource, the npm team recently completed an accessibility bug bash and removed hundreds of potential barriers. Way to go, npm team!
The GitHub.com team has also been hard at work on accessibility and they recently shipped several improvements:
Great accessibility starts with design, requiring an in-depth understanding of the needs of users with disabilities and their assistive technologies. The GitHub Design organization has been leaning into accessibility for years, and this blog post explores how it has built a culture of accessibility and shifted accessibility left in the GitHub development process.
When I think about the future of technology, I think about GitHub Copilot—an AI pair programmer that boosts developers’ productivity and breaks down barriers to software development. The GitHub Copilot team recently shipped accessibility improvements for keyboard-only and screen reader users.
GitHub Next, the team behind GitHub Copilot, also recently introduced GitHub Copilot Voice, an experiment currently in technical preview. GitHub Copilot Voice empowers developers to code completely hands-free using only their voice. That’s a huge win for developers who have difficulty typing with their hands. Sign up for the technical preview if you can benefit from this innovation.
Giving back to our community
As we work to empower all developers to build on GitHub, we regularly contribute back to the broader accessibility community that has been so generous to us. For example, all accessibility improvements in Primer are available for direct use by the community.
Our accessibility team includes multiple Hubbers with disabilities—including myself. GitHub continually improves the accessibility and inclusivity of the processes we use to communicate and collaborate. One recent example is the process we use for retrospectives. At the end of our most recent retrospective, I observed that, as a person with blindness, it was the most accessible and inclusive retrospective I have ever attended. That observation prompted the team to share the process we use for inclusive retrospectives so other teams can benefit from our learnings.
More broadly, Hubbers regularly give back to the causes we care about. During a recent social giving event, I invited Hubbers to support the Seeing Eye because that organization has made such a profound impact in my life as a person with blindness. Our goal was to raise $5,000 so we could name and support a Seeing Eye puppy that will eventually provide independence and self-confidence to a person with blindness. I was overwhelmed by the generosity of my coworkers when they donated more than $15,000! So, we now get to name three puppies and I’m delighted to introduce you to the first one. Meet Octo!
Photo courtesy of The Seeing Eye
Looking ahead
GitHub CEO, Thomas Dohmke, frequently says, “GitHub thrives on developer happiness.” I would add that the GitHub accessibility program thrives on the happiness of developers with disabilities. Our success is measured by their contributions. Our job is to remove barriers from their path and celebrate their accomplishments. We’re delighted with our progress thus far, but we are just getting warmed up. Stay tuned for more great things to come! In the meantime, learn more about the GitHub accessibility program at accessibility.github.com.
We launched Workers for Platforms, our Workers offering for SaaS businesses, almost exactly one year ago to the date! We’ve seen a wide array of customers using Workers for Platforms – from e-commerce to CMS, low-code/no-code platforms and also a new wave of AI businesses running tailored inference models for their end customers!
Let’s take a look back and recap why we built Workers for Platforms, show you some of the most interesting problems our customers have been solving and share new features that are now available!
What is Workers for Platforms?
SaaS businesses are all too familiar with the never ending need to keep up with their users' feature requests. Thinking back, the introduction of Workers at Cloudflare was to solve this very pain point. Workers gave our customers the power to program our network to meet their specific requirements!
Need to implement complex load balancing across many origins? Write a Worker. Want a custom set of WAF rules for each region your business operates in? Go crazy, write a Worker.
We heard the same themes coming up with our customers – which is why we partnered with early customers to build Workers for Platforms. We worked with the Shopify Oxygen team early on in their journey to create a built-in hosting platform for Hydrogen, their Remix-based eCommerce framework. Shopify’s Hydrogen/Oxygen combination gives their merchants the flexibility to build out personalized shopping for buyers. It’s an experience that storefront developers can make their own, and it’s powered by Cloudflare Workers behind the scenes. For more details, check out Shopify’s “How we Built Oxygen” blog post.
Oxygen is Shopify's built-in hosting platform for Hydrogen storefronts, designed to provide users with a seamless experience in deploying and managing their ecommerce sites. Our integration with Workers for Platforms has been instrumental to our success in providing fast, globally-available, and secure storefronts for our merchants. The flexibility of Cloudflare's platform has allowed us to build delightful merchant experiences that integrate effortlessly with the best that the Shopify ecosystem has to offer. – Lance Lafontaine, Senior Developer Shopify Oxygen
Another customer that we’ve been working very closely with is Grafbase. Grafbase started out on the Cloudflare for Startups program, building their company from the ground up on Workers. Grafbase gives their customers the ability to deploy serverless GraphQL backends instantly. On top of that, their developers can build custom GraphQL resolvers to program their own business logic right at the edge. Using Workers and Workers for Platforms means that Grafbase can focus their team on building Grafbase, rather than having to focus on building and architecting at the infrastructure layer.
Our mission at Grafbase is to enable developers to deploy globally fast GraphQL APIs without worrying about complex infrastructure. We provide a unified data layer at the edge that accelerates development by providing a single endpoint for all your data sources. We needed a way to deploy serverless GraphQL gateways for our customers with fast performance globally without cold starts. We experimented with container-based workloads and FaaS solutions, but turned our attention to WebAssembly (Wasm) in order to achieve our performance targets. We chose Rust to build the Grafbase platform for its performance, type system, and its Wasm tooling. Cloudflare Workers was a natural fit for us given our decision to go with Wasm. On top of using Workers to build our platform, we also wanted to give customers the control and flexibility to deploy their own logic. Workers for Platforms gave us the ability to deploy customer code written in JavaScript/TypeScript or Wasm straight to the edge. – Fredrik Björk, Founder & CEO at Grafbase
Over the past year, it’s been incredible seeing the velocity that building on Workers allows companies both big and small to move at.
New building blocks
Workers for Platforms uses Dynamic Dispatch to give our customers, like Shopify and Grafbase, the ability to run their own Worker before user code that’s written by Shopify and Grafbase’s developers is executed. With Dynamic Dispatch, Workers for Platforms customers (referred to as platform customers) can authenticate requests, add context to a request or run any custom code before their developer’s Workers (referred to as user Workers) are called.
This is a key building block for Workers for Platforms, but we’ve also heard requests for even more levels of visibility and control from our platform customers. Delivering on this theme, we’re releasing three new highly requested features:
Outbound Workers
Dynamic Dispatch gives platforms visibility into all incoming requests to their user’s Workers, but customers have also asked for visibility into all outgoing requests from their user’s Workers in order to do things like:
Log all subrequests in order to identify malicious hosts or usage patterns
Create allow or block lists for hostnames requested by user Workers
Configure authentication to your APIs behind the scenes (without end developers needing to set credentials)
Outbound Workers sit between user Workers and fetch() requests out to the Internet. User Workers will trigger a FetchEvent on the Outbound Worker and from there platform customers have full visibility over the request before it’s sent out.
It’s also important to have context in the Outbound Worker to answer questions like “which user Worker is this request coming from?”. You can declare variables to pass through to the Outbound Worker in the dispatch namespaces binding:
From there, the variables declared in the binding can be accessed in the Outbound Worker through env. <VAR_NAME>.
Custom Limits
Workers are really powerful, but, as a platform, you may want guardrails around their capabilities to shape your pricing and packaging model. For example, if you run a freemium model on your platform, you may want to set a lower CPU time limit for customers on your free tier.
Custom Limits let you set usage caps for CPU time and number of subrequests on your customer’s Workers. Custom limits are set from within your dynamic dispatch Worker allowing them to be dynamically scripted. They can also be combined to set limits based on script tags.
Here’s an example of a Dynamic Dispatch Worker that puts both Outbound Workers and Custom Limits together:
export default {
async fetch(request, env) {
  try {
    let workerName = new URL(request.url).host.split('.')[0];
    let userWorker = env.dispatcher.get(
      workerName,
      {},
      {// outbound arguments
       outbound: {
           customer_name: workerName,
           url: request.url},
        // set limits
       limits: {cpuMs: 10, subRequests: 5}
      }
    );
    return await userWorker.fetch(request);
  } catch (e) {
    if (e.message.startsWith('Worker not found')) {
      return new Response('', { status: 404 });
    }
    return new Response(e.message, { status: 500 });
  }
}
};
They’re both incredibly simple to configure, and the best part – the configuration is completely programmatic. You have the flexibility to build on both of these features with your own custom logic!
Tail Workers
Live logging is an essential piece of the developer experience. It allows developers to monitor for errors and troubleshoot in real time. On Workers, giving users real time logs though wrangler tail is a feature that developers love! Now with Tail Workers, platform customers can give their users the same level of visibility to provide a faster debugging experience.
Tail Worker logs contain metadata about the original trigger event (like the incoming URL and status code for fetches), console.log() messages and capture any unhandled exceptions. Tail Workers can be added to the Dynamic Dispatch Worker in order to capture logs from both the Dynamic Dispatch Worker and any User Workers that are called.
A Tail Worker can be configured by adding the following to the wrangler.toml file of the producing script
Tail Workers are full-fledged Workers empowered by the usual Worker ecosystem. You can send events to any HTTP endpoint, like for example a logging service that parses the events and passes on real-time logs to customers.
Try it out!
All three of these features are now in open beta for users with access to Workers for Platforms. For more details and try them out for yourself, check out our developer documentation:
Workers for Platforms is an enterprise only product (for now) but we’ve heard a lot of interest from developers. In the later half of the year, we’ll be bringing Workers for Platforms down to our pay as you go plan! In the meantime, if you’re itching to get started, reach out to us through the Cloudflare Developer Discord (channel name: workers-for-platforms).
Every day, most of us both consume and create data. For example, we interpret data from weather forecasts to predict our chances of a good weather for a special occasion, and we create data as our carbon footprint leaves a trail of energy consumption information behind us. Data is important in our lives, and countries around the world are expanding their school curricula to teach the knowledge and skills required to work with data, including at primary (K–5) level.
Kate FarrellProf. Judy Robertson
In our most recent research seminar, attendees heard about a research-based initiative called Data Education in Schools. The speakers, Kate Farrell and Professor Judy Robertson from the University of Edinburgh, Scotland, shared how this project aims to empower learners to develop data literacy skills and succeed in a data-driven world.
“Data literacy is the ability to ask questions, collect, analyse, interpret and communicate stories about data.”
– Kate Farrell & Prof. Judy Robertson
Being a data citizen
Scotland’s national curriculum does not explicitly mention data literacy, but the topic is embedded in many subjects such as Maths, English, Technologies, and Social Studies. Teachers in Scotland, particularly in primary schools, have the flexibility to deliver learning in an interdisciplinary way through project-based learning. Therefore, the team behind Data Education in Schools developed a set of cross-curricular data literacy projects. Educators and education policy makers in other countries who are looking to integrate computing topics with other subjects may also be interested in this approach.
Data citizens have skills they need to thrive in a world shaped by digital technology.
The Data Education in Schools projects are aimed not just at giving learners skills they may need for future jobs, but also at equipping them as data citizens in today’s world. A data citizen can think critically, interpret data, and share insights with others to effect change.
Kate and Judy shared an example of data citizenship from a project they had worked on with a primary school. The learners gathered data about how much plastic waste was being generated in their canteen. They created a data visualisation in the form of a giant graph of types of rubbish on the canteen floor and presented this to their local council.
Sorting food waste from lunch by type of material
As a result, the council made changes that reduced the amount of plastic used in the canteen. This shows how data citizens are able to communicate insights from data to influence decisions.
A cycle for data literacy projects
Across its projects, the Data Education in Schools initiative uses a problem-solving cycle called the PPDAC cycle. This cycle is a useful tool for creating educational resources and for teaching, as you can use it to structure resources, and to concentrate on areas to develop learner skills.
The PPDAC data problem-solving cycle
The five stages of the cycle are:
Problem: Identifying the problem or question to be answered
Plan: Deciding what data to collect or use to answer the question
Analysis: Preparing, modelling, and visualising the data, e.g. in a graph or pictogram
Conclusion: Reviewing what has been learned about the problem and communicating this with others
Smaller data literacy projects may focus on one or two stages within the cycle so learners can develop specific skills or build on previous learning. A large project usually includes all five stages, and sometimes involves moving backwards — for example, to refine the problem — as well as forwards.
Data literacy for primary school learners
At primary school, the aim of data literacy projects is to give learners an intuitive grasp of what data looks like and how to make sense of graphs and tables. Our speakers gave some great examples of playful approaches to data. This can be helpful because younger learners may benefit from working with tangible objects, e.g. LEGO bricks, which can be sorted by their characteristics. Kate and Judy told us about one learner who collected data about their clothes and drew the results in the form of clothes on a washing line — a great example of how tangible objects also inspire young people’s creativity.
As learners get older, they can begin to work with digital data, including data they collect themselves using physical computing devices such as BBC micro:bit microcontrollers or Raspberry Pi computers.
Free resources for primary (and secondary) schools
For many attendees, one of the highlights of the seminar was seeing the range of high-quality teaching resources for learners aged 3–18 that are part of the Data Education in Schools project. These include:
Data 101 videos: A set of 11 videos to help primary and secondary teachers understand data literacy better.
Lesson resources: Lots of projects to develop learners’ data literacy skills. These are mapped to the Scottish primary and secondary curriculum, but can be adapted for use in other countries too.
More resources are due to be published later in 2023, including a set of prompt cards to guide learners through the PPDAC cycle, a handbook for teachers to support the teaching of data literacy, and a set of virtual data-themed escape rooms.
You may also be interested in the units of work on data literacy skills that are part of The Computing Curriculum, our complete set of classroom resources to teach computing to 5- to 16-year-olds.
Join our next seminar on primary computing education
At our next seminar we welcome Aim Unahalekhaka from Tufts University, USA,who will share research about a rubric to evaluate young learners’ ScratchJr projects. If you have a tablet with ScratchJr installed, make sure to have it available to try out some activities. The seminar will take place online on Tuesday 6 June at 17.00 UK time, sign up now to not miss out.
To find out more about connecting research to practice for primary computing education, you can see a list of our upcoming monthly seminars on primary (K–5) teaching and learning and watch the recordings of previous seminars in this series.
Лидерите на страните от Лигата на арабските държави (Арабска лига) ще проведат среща на върха в Рияд на 19 май, на която ще присъства и сирийският президент Башар Асад. Това се случва за първи път след повече от десетилетие – през 2011 г. членството на Сирия в организацията беше замразено заради бруталното потушаване на избухналите бунтове срещу авторитарния модел на управление.
На фона на дипломатическите действия през последните няколко месеца, реабилитирането на сирийския режим в международната общност не буди изненада. Опустошителните земетресения в Сирия и Турция ускориха комуникацията между страните в региона и Дамаск проведе важни срещи с високопоставени представители на Оман и Обединените арабски емирства. Значима роля изиграха Египет и Саудитска Арабия, които посрещнаха сирийския външен министър през миналия месец. Двете държави инициираха повторното приобщаване на Сирия и обявиха, че ще възобновят дейността на дипломатическите си мисии. Междувременно Тунис и Сирия излязоха с официални съобщения, че посолствата им отново ще отворят врати след дълго прекъсване.
Впоследствие външните министри на страните от Арабската лига единодушно възстановиха членството на Сирия в организацията, а малко по-късно саудитският крал покани Асад да се присъедини към срещата на върха в Рияд, насрочена за 19 май. Затоплянето на отношенията обаче не протича съвсем безоблачно. Катар например се противопоставя на нормализацията на връзките с режима на Асад, а САЩ не спестиха критики, отхвърляйки възможността за вдигане на едностранно наложените санкции срещу сирийския режим. Недоволство изразиха също активисти и членове на вътрешната сирийска опозиция.
Резкият дипломатически завой на част от арабските държави е пряко свързан с дългогодишния конфликт в Сирия, с противоборството между редица вътрешни и международни актьори на нейна територия, както и с борбата за надмощие в региона. Някои коментатори разглеждат решението на Арабската лига като символичен акт, който трудно може да разклати регионалния баланс. По-правдоподобно обаче е твърдението, че реабилитирането на Асад е плод на променящите се геополитически реалности. Активното членство на Сирия в официална международна организация под егидата на ООН има не просто символен характер. То дава на Асад международна легитимност и легално основание да участва при вземането на важни за арабската общност решения като висш сирийски представител.
На точното място в точното време
Промяната на политиката към Сирия е съпътствана от процес на помирение между два от борещите се за надмощие регионални съперника – Саудитска Арабия и Иран. През април външните министри на двете страни проведоха среща в Пекин с посредничеството на Китай. Там те заявиха, че ще възобновят работата на дипломатическите си мисии за първи път след двустранната криза от 2016 г.
На 10 май в Москва пък се проведе среща между външните министри на Русия, Турция, Иран и Сирия. Те обсъдиха възможностите за сътрудничество между Турция и Сирия по отношение на бежанската криза и намиране на изход от сирийския конфликт. Таймингът на срещите в Пекин и Москва и решението на Арабската лига да възстанови членството на Сирия не е случаен. Това е точният времеви прозорец, който позволява на Асад да излезе от състоянието на международна изолация. Какво означава това за заинтересованите страни?
Съюзниците Иран, Русия и Китай
Трите страни влизат в обща графа като най-верните съюзници на режима на Асад. Те му оказват дипломатическа и военно-техническа помощ срещу бунтовническите сили и осигуряват политически чадър в Съвета за сигурност на ООН. Голямата обща цел е изтласкването на западните съюзници (и в частност на САЩ) като водеща сила в Близкия изток. В контекста на проксивойната в Сирия реабилитирането на Асад в Арабската лига е своеобразна геополитическа победа над САЩ и Европейския съюз.
Благодарение на посредническата роля на Китай по отношение на Иран и Саудитска Арабия, както и на Русия по отношение на Сирия и Турция, Пекин и Москва съумяват да заздравят връзките си със страните от региона, ограничавайки значително влиянието на основния си съперник – САЩ. Засиленото сътрудничество между Китай, Русия и Иран в сферата на отбраната и енергетиката допълнително укрепва позициите им. Политиката на прагматични отношения спрямо водещи регионални сили като Турция (член на НАТО) и Саудитска Арабия (доверен съюзник на САЩ) също ограничава полето за изява на западните сили.
Чрез утвърждаването на Асад на международната сцена и опитите за посредничество по отношение на регионалните конфликти Русия на свой ред търси изход от международната изолация, в която се намира след инвазията в Украйна. Това позволява на Путин да компенсира загубата на пазари и влияние на запад, като засили ролята и влиянието си в един от най-чувствителните региони в света – Близкия изток.
Медиаторските усилия на Китай спрямо Саудитска Арабия и Иран също не са безкористни. Чрез успокояване на напрежението между двете страни източноазиатската държава създава предпоставки за известно еманципиране на Саудитска Арабия от САЩ по отношение на икономическата политика и сигурността в региона. Това благоприятства и стремежите на Китай за задълбочаване на икономическото си влияние в арабския свят. Иран пък се стреми да отслаби най-големите си идеологически врагове (САЩ и ЕС), изповядващи ценности в разрез с теократичния ирански политически модел.
Турция: уж в опозиция, но не съвсем
По време на гражданската война Турция подпомага военноопозиционната на Асад бунтовническа коалиция, известна като Syrian National Army (SNA). Главните цели на Турция към момента са две: да разреши бежанския въпрос (в момента югоизточната ни съседка подслонява около 4 млн. сирийци) и да възпрепятства кюрдските амбиции за установяване на независима държава или политическа автономия на територията на Северна Сирия. Реабилитирането на Асад е в съзвучие с тези две цели.
Още в края на миналата година самият Ердоган заговори за възстановяване на отношенията между Турция и Сирия по египетски модел. През ноември Ердоган се срещна за кратко с египетския си колега Ел-Сиси по време на Световното първенство по футбол. Последваха срещи на министерско ниво, които заздравиха двустранните дипломатически отношения след години на противопоставяне. Сирийският модел ще бъде противоположен – разговорите в Москва на 10 май с участието на външните министри на Турция и Сирия предшестват потенциална среща на върха между Ердоган и Асад. Тя обаче може да се осъществи само при благоприятен за Ердоган изход на предстоящия балотаж, след като президентските избори не излъчиха победител на първия тур.
Американски учени и анализатори пренебрегнаха възможността за среща между двамата президенти преди изборите в Турция заради опасенията на Сирия, че Ердоган ще извлече политически дивиденти, свързани с разрешаването на бежанския въпрос. Интересите на Турция и Сирия се преплитат по сложен начин. Анкара иска да нанесе удар и да отслаби кюрдските формирования в Сирия (PYD и YPG) с помощта на Асад под предлог за борба с тероризма. Турция счита кюрдските организации в Сирия за тясно свързани с обявената от нея за терористична групировка ПКК. Това пък ще помогне на сирийския режим да затвърди териториалната цялост на страната, което би съдействало за доброволното завръщане на част от сирийските бежанци. Проблем обаче е подкрепата на западните сили за PYD и YPG, които, освен че са основна част от ключовата демократична опозиция срещу Асад (Syrian Democratic Forces, SDF), изиграват водеща роля в битката срещу ИДИЛ.
Подкрепа отдалече: САЩ и ЕС
Както стана ясно, западните съюзници подпомагат опозиционната коалиция SDF, която се бори както срещу режима на Асад, така и срещу терористичната организация ИДИЛ. Основните цели на Запада по време на гражданската война са свалянето на Асад, търсенето на отговорност за военните престъпления, които е извършил, борбата срещу тероризма (в частност срещу ИДИЛ и други групировки на територията на Сирия) и възстановяване на човешките права.
САЩ се обявиха против политиката на помирение между арабските държави и режима на Асад, защото този подход легитимира неговата власт и се разглежда като дипломатическа победа за Русия, Иран и Китай. Все пак Щатите се застъпват за политическо решение на кризата в Сирия. ЕС ще излезе със собствено становище по казуса, но няма изгледи западните санкции срещу режима на Асад да паднат. В края на април Съюзът наложи пореден пакет от санкции срещу приближени на Асад лица, свързани с трафика на наркотици (предимно каптагон и амфетамин), който носи на режима солидни приходи в продължение на години. Интересите на западния блок се сблъскват с турските по отношение на бунтовническите коалиции, които освен срещу Асад воюват и помежду си – SNA (подкрепяна от Турция) и SDF (подкрепяна от САЩ и ЕС).
Неясно бъдеще
Въпреки обстоятелствата, които позволиха на враждуващи страни в сирийския конфликт да помирят позициите си по отношение на Асад, бъдещето на региона остава несигурно. Според генералния секретар на Арабската лига Ахмед Абул Гейт завръщането на Сирия в организацията не означава непременно нормализация на отношенията, доколкото страните членки са свободни сами да определят подхода си. Последващата реабилитация на Асад в международните отношения ще зависи от множество фактори, включително от склонността на сирийския режим да прави политически отстъпки за разрешаване на кризата, от развитието на сирийско-турските отношения, от геополитическата схватка между глобалните и регионалните сили, както и от реакцията на вътрешните опозиционни сирийски групировки. Едно обаче е сигурно – новият дипломатическия курс ще продължи да размества пластовете на влияние в региона.
Колаж: Тоест. Снимки: Fabio Rodrigues Pozzebom / ABr: Башар Асад на посещение в Бразилия. Canva: Алепо, Сирия, след началото на войната.
У нас 2013 г. беше година на протести. Протести не само срещу назначението на Делян Пеевски за шеф на ДАНС през юни (#ДАНСwithme) или непоносимо скъпата енергия през февруари, но и срещу политическото статукво по принцип. Протести, които постепенно преляха и в относително затворения и привидно експертен свят на архитектурата.
Интересното е, че 2013-та беше година на протести по цял свят.
Две години след Арабската пролет вълната на гражданското недоволство продължи да се надига и избухна глобално именно тогава, с рекорден брой протести – някои от които с милиони участници. В Египет 17 милиона души излязоха по улиците на 30 юни 2013 г. в демонстрация срещу действащия президент Мохамед Морси, организирана от гражданско движение. В Индия милиони протестираха срещу бедността и неравенството. В Бразилия всичко започна като демонстрация срещу повишените цени на градския транспорт и в крайна сметка се превърна в огромен протест срещу корупцията.
Защо започвам този текст с 2013 г.? Защото
последните 10 години са времето, в което гражданското общество в България излезе с устрем в градската среда.
И то не само за да протестира в нея, но и за да коментира проблемите ѝ. Хората започнаха да изразяват отношение и да реагират на недомислици, корупционни практики и градски проблеми, от които преди се възмущаваха предимно архитекти и урбанисти. Протестиращите станаха чувствителни не само към политиката и хляба, а и към по-абстрактни ценности, като морал и естетика на градската среда. Някои от най-мощните протести бяха свързани именно с презастрояване, културно наследство и лоша архитектура.
Активизъм и политически промени
В Истанбул например през същата тази 2013 година централният площад „Таксим“ беше окупиран цяло лято от демонстранти срещу намерението на президента Реджеп Тайип Ердоган да застрои един от последните публични паркове – парк „Гези“ – с луксозен комплекс от мол и джамия. Тези протести впоследствие въвлякоха близо 3,5 млн. души в цяла Турция и се оказаха едно от най-сериозните предизвикателства в десетилетното управление на Ердоган.
В България хората също се престрашиха да поискат по-добра среда. През 2014 г. видинчани протестираха срещу реконструкция на автогара в защитен район. Перничани протестираха срещу смяната на гранитните плочи на площад „Кракра“. Софиянци протестираха срещу махането на паветата на ул. „Цар Иван Асен II“. Търговците на Женския пазар протестираха срещу реконструкцията на пазара, а живеещите в квартала излязоха в подкрепа на реконструкцията (и против търговците). През 2016 г. жива верига от пловдивчани се опита да спре разрушаването на поредния бивш тютюнев склад – културно наследство в града, а „Тютюневият град“ в Пловдив и Пловдивският панаир се оказаха теми, които възпаляват мигновено гражданското общество.
протестите могат лесно да ескалират от устройствено-архитектурни в политически.
Стана ясно, че обществената енергия по въпросите на градската среда може да бъде насочвана и да формира истински политически играчи.
В края на ноември 2017 г. неправителствената организация „Спаси София“ използва вълненията около паветата на ремонтиращия се столичен булевард „Дондуков“ и организира мащабен протест, който, както казаха организаторите,
е за всеки от проблемите на София – ремонти на ремонтите, бавен и нередовен градски транспорт, мръсен въздух, презастрояване и липсваща квартална инфраструктура, неизползваеми велоалеи, унищожаване на архитектурното наследство на града.
Доживяхме, както каза един виден български интелектуалец тогава, и до протест срещу ремонтите в София. Същият интелектуалец направи притеснителна за властта аналогия с 1989 г., когато протестите започнали като екологични, за да не изглеждат политически. И се оказа прав. През 2017 г. протестите изглеждаха естетически, но всъщност бяха политически. Само за пет години „Спаси София“ се превърна от Facebook явление в реален политически играч.
През 2014 г. урбанистът Павел Янчев припозна процеса като урбанистичен активизъм, в който
неправителствена организация, група граждани, независима институция или отделни личности поемат пътя на неформален (или формален) разговор с институции и се опитват да влияят на вземането на политически решения и преформулират идеологията за бъдещото изграждане на образа и пространствата на града.
Той очерта примери за такъв активизъм в София, засягащ публичните градски пространства.
Няколко години по-късно спокойно можем да надградим, като добавим фронта на културното наследство, битката за качество на ремонтите, желанието за граждански контрол над устройствените политики, възникващите квартални общности, борбата за междублокови пространства, за повече дървета, за чист въздух и срещу презастрояването.
И ето как активизмът, наред с ангажирането на обществото с проблемите на града и държавата, индиректно заяви желание да участва в тяхното управление. Това е феномен, който трябва да бъде анализиран и който може да промени изцяло правилата на политическата игра, ако бъде използван умно.
През 2013–2014 г. все още никой не говореше за социални балони и умиращи авторитети, за маргинализираната роля на експертите и за хоризонтално общество. Тогава всички искрено се радвахме, че проблемите на градската среда, културното наследство и изобщо на застроения свят около нас вълнуват все повече хора, а гласът им не остава нечут. Именно тогава беше началото на тази голяма вълна, която можем да наречем „архитектурно гражданско общество“. Тя е все още в пика си и тепърва предстои да прелее от големите в малките градове, от малките към големите проблеми.
Как може гражданското общество да помогне на политиката през градската среда и архитектурата?
Факт е, че архитектите не са публични интелектуалци. Те рядко вземат отношение по въпроси извън тяхната тясно специализирана област и избягват да участват шумно в дебатите на нашето време. Но ето ви едно мнение от дълбините на архитектурния балон.
Местните избори през есента на 2023 г. са възможност за експеримент, който може да отрази пълнокръвно духа на времето, а то е време на градски активизъм. Тогава успешната политика е включващ процес, който протича отдолу нагоре, ангажира едновременно гражданите и партиите, които междувременно са осъзнали, че пътят към повишена избирателна активност и смислени промени минава по дълга, неблагодарна и трънлива пътека – въвличане на гражданското общество и използване на неговата енергия, строене на коалиции, даване на власт и глас на жителите на града.
Градската среда е пространство, което засяга всички. Тук няма начин да си отвратен от политиката, да си безразличен, уморен или циничен.
Все някой проблем ще успее да запали точно теб – счупената плочка пред входа, мястото на детето в детската градина, онова кръгово кръстовище, което просто не работи, онази пешеходна пътека, на която постоянно стават катастрофи, красивата къща до вас, която събарят, безжалостно изрязаните корони на редицата прекрасни липи до апартамента на баба ти, които после умират. Въздухът, достъпът до планината, данъците и задръстванията. Просто няма как да останеш безразличен.
гражданите не бива да са потребители на местни политики, а съучастници в тяхното създаване и прилагане.
Кварталните екипи на „Спаси София“ също работят на терен, за да чуят и обобщят нуждите на софиянци. Това е нов, позитивен процес, който не просто поправя дефицитите на нашата версия за представителна демокрация, а е и авангарден политически модел в глобален план.
Възможно ли е истинско въвличане на гражданите без популизъм?
Може ли да се създадат осмислени политики като процес, а не скучни програми, спуснати две седмици преди изборите? Има ли шанс партиите да погледнат отвъд партийното кадруване и стандартните комуникационни шаблони? И не на последно място, могат ли политиците да говорят за истинските грижи и проблеми на хората, за толкова важното ни ежедневие, без да се ограничават до безперспективни слогани, като „Да спрем корупцията“ и „Да привлечем инвестиции“?
Ако този процес продължи в София и прелее и извън границите на столицата – в градове като Пловдив, Русе, Варна, навсякъде всъщност, – тогава може би най-после ще спрем да говорим за политическа криза, за умора, безразличие и за края на либералната демокрация. Този процес е ключов за ангажиране на обществото с изборния процес и той трябва да върне партиите обратно долу, при хората. Тогава избирателите ще започнат да гласуват. А градовете ни евентуално ще станат за хората.
Културното наследство е отделен фронт на градски активизъм, за който може много да се пише. Там се сблъскват корупция и гражданско възмущение, тестват се социални разслоения и културни противоречия. Битките са ожесточени – независимо къде и независимо за какво: горящи тютюневи складове, паметници, небостъргачи и исторически центрове, съборени сгради. Темата е гореща глобално, а за опазване и гражданска мобилизация трябва да се говори постоянно. Именно тази тема ще бъде разгледана на предстоящата лекция GEGEN DIE WAND (Срещу стената). Градски активизъм и културно наследство на 22 май 2023 г. от 19:00 часа в залата на Гьоте-институт, където ще сравним ситуацията в три държави – България, Германия и Турция.
В края на април, благодарение на пилотна програма на Гьоте-институт и мрежата „Традуки“, имах възможността да посетя тазгодишното издание на отменяния три поредни години Лайпцигски панаир на книгата заедно с още девет литературни професионалисти от останалите страни на Балканите.
Гостуването ни се проведе в рамките на традиционния фокус на панаира върху литературите от Централна, Източна и Югоизточна Европа, а тазгодишната програма на „Традуки“ под мотото „Между редовете – между времената“ включваше литературни четения и дискусии с над 40 автори от Албания, Босна и Херцеговина, България, Косово, Хърватия, Черна гора, Северна Македония, Румъния, Сърбия и Словения.
Освен специално обособената сцена Traduki-Kafana на територията на панаира, където ежедневно се провеждаха представяния, всяка държава имаше и свой собствен изложбен щанд (за България това ставаше за първи път от 1999 г., когато страната е била почетен гост). А едно от най-популярните събития в съпътстващата програма на литературния фестивал Leipzig liest беше т.нар. Balkannacht, или Балканска нощ, която включваше музика и четения на автори от региона.
Може би точно заради това толкова осезаемо, почти вездесъщо присъствие на литератури (а съoтветно и на езици) от Югоизточна Европа на панаира, на мен
започнаха да ми се привиждат балкански връзки и да ми се причуват славянски думи дори и там, където реално ги нямаше.
Името на гореспоменатия фестивал например, макар много добре да знам, че всъщност означава „Лайпциг чете“, постоянно ми създаваше допълнителни книжни и дървесни асоциации с листове и листа.
Тези асоциации вероятно бяха подсилени и от факта, че навсякъде из града беше пълно с разлистени и разцъфнали дървета.
Докато си въобразявах фалшиви етимологични връзки между несродни езици и се захласвах по цъфтящите в розово японски вишни, белите цветчета на черешите и лилавите люлякови храсти, даже и не подозирах, че славянското наименование на друго дърво съвсем наистина стои в корена на името на германския град.
Наименованието Лайпциг, оказва се, произлиза от славянската дума „липа“.
Първоначално наречен Lipsk („място при липите“) на лужишките езици, градът и до днес е запазил това (или сходни на него) наименование на някои славянски езици, където връзката с „липа“ е доста по-видима: на полски той е известен като Lipsk, а на чешки и словашки – като Lipsko.
Според неправителствената организация за опазване на околната среда и природата BUND 34% от дърветата по улиците на Лайпциг са липови¹. Това ме кара да подозирам, че етимологичната връзка между името на града и дървото може би щеше да бъде малко по-осезаема, ако бях посетила Лайпциг не в края на април, а през лятото, когато липите цъфтят и ухаят. (Липовият цъфтеж е отразен по един особено очарователен начин в наименованията на летните месеци на някои славянски езици: на хърватски lipanj означава „юни“, докато на украински месец юли се нарича „липень“, а на полски – lipiec².)
Но да се върнем към книжно-дървесните връзки, които, за радост, не спират дотук.
Друго дърво, което според BUND също се среща в Лайпциг, е дъбът, принадлежащ към семейство Букови, а техен член, разбира се, е и самият бук. Не е нужно човек да е експерт лингвист, за да забележи
връзката между немското название на дървото (Buche) и немската дума за „книга“ (Buch), която – както и английската book – му дължи произхода си:
според водещата етимологична теория немските и английските „книги“ получават наименованието си от бука, чиято дървесина била използвана за таблети и дъсчици, върху които били дълбани древни руни³.
Въпреки че българската дума „книга“ не споделя тази етимология, букът все пак се е промъкнал в друга ключова за писането и четенето дума, която Българският етимологичен речник определя като „стара германска заемка“, а именно думата „буква“. (Букът се е промъкнал също и в нейните производни, като „буквар“, „буквален“⁴ и чудесната дума „буквоед“, за чийто автор се смята Ботев⁵.)
Доста по-сложна, объркваща и оспорвана обаче е ситуацията с произхода на думата „книга“.
В сравнение с десетината реда, отделени на „буква“, Българският етимологичен речник се занимава с думата „книга“ в продължение на цели две и половина страници, изпълнени с повече или по-малко вероятни, главозамайващи, трудни за разшифроване предположения за произхода ѝ, като например „стара културна източна заемка може би от хуни, авари и първобългари“.
Проследени са възможните връзки на думата с различни, знайни и незнайни, древни и съвременни езици и езикови групи, вариращи от унгарски и полски, през асирийски, алтайски, китайски, латински, до староруски и старонорвежки, като в списъка с нейни производни на други славянски езици с обезпокояваща честота се появява дефиницията „трети стомах на преживен бозайник“.
Доста интересна, особено в контекста на книжно-дървесните връзки, описани в настоящия текст, ми се стори включената в речника теория на цяла група езиковеди, които „се застъпват за домашно потекло и свързват с праслав. *kьнь, *kьneja, срв. пол. kien ’дънер; дебел клон; кърпел’, kniejа ’гъсталак, дебри’, пол, остар. knowie ’трескà; парче дърво’, рус. диал. кнея ’храсталак, горичка’, струс. кнѣсъ ’греда на покрив’, като приемат прв. знач. ’дървени дъсчици, върху които са дълбани разни мнемотехнически знаци’ и виждат смислова успоредица в лат. соех (< caudex) ’дънер, пън’ > ’дъсчици за писане’ > ’ръкопис, свезка, бележник, книга’, нем. Buch = Buchenholz“.
Точно когато книжните и дървесните връзки започват удобно да се навързват обаче, речникът отбелязва:
но това обяснение се натъква на културноисторически и словотворни мъчнотии.
Друга теория за произхода на думата „книга“, която доста добре би сe вързала с немската нишка, преминаваща през този текст, е, че праславянският ѝ корен kъňiga представлява заемка от старогерманската дума kenning („символ, знак“) или от друг германски източник, като готическата 𐌺𐌿𐌽𐌽𐌰𐌽 (kunnan) и старонорвежката kunna („да знам“). Тази теория обаче също остава недоказана. В края на краищата
категоричен отговор за произхода на думата „книга“ така и не откривам.
След като превъзмогвам първоначалната си фрустрация, успявам все пак да открия някаква закономерност, а даже и правота във факта, че точно етимологията на „книга“ се оказва толкова оплетена и неясна. Та нали сама по себе си книгата, или поне добрата книга, по дефиниция е нещо сложно, съдържащо множество – понякога противоречиви – възможности, пътища, нишки и идеи, с други думи – „мъчнотии“. Същевременно нашата задача като читатели е ако не задължително да ги разнищим, то със сигурност да позволим на тези противоречивости да влязат в съзнанието ни и – дума по дума, ред по ред, лист по лист – да променят начина, по който виждаме, осмисляме и общуваме със света.
1 Немското наименование на липите – Linden, автоматично предизвиква асоциации с друг германски град заради култовия булевард Unter den Linden в Берлин. Но все пак и из Лайпциг има множество локации, чиито наименования произлизат от немската дума, сред които присъединеното към града някогашно село Lindenthal, кварталът Lindenau, раздeлен на нова и стара част (Neulindenau и Altlindenau), който е бил старото индустриално сърце на Лайпциг, улиците Lindenauer Markt, An den Linden, Lindenpark и т.н.
2 За разлика от прозаичния латински произход на имената на месеците на български (и на много други близки и далечни езици), в някои от славянските езици те носят доста поетични и изпълнени със смисъл названия, отразяващи метеорологичните условия, природните събития и/или човешките дейности през различни периоди на годината. На хърватски например, освен че lipanj означава „юни“, „януари“ е siječanj (от „сеч“), „февруари“ е veljača (от „валяне“, „търкаляне“ – заради нестабилното време), „март“ е ožujak (от „лъжа“ – заради лъжливото време), „април“ е travanj (от „трева“), „май“ е svibanj (от „сви̑б“, наименованието на дряна, чието латинско име е Cornus sanguinea), „юли“ е srpanj (от „сърп“, заради жътвата), „август“ е kolovoz (заради извозването на житото), „септември“ е rujan (от „руен“), „октомври“ е listopad, „ноември“ е studeni, а „декември“ е prosinac (според някои източници като месец на молитвата, от pròsiti, „да се моля“, или пък от prosínuti, „да просветвам“ – заради зимното слънцестоене).
3 Макар да няма етимологична връзка с германските Buch и book, френската дума за „книга“ – livre, също има „дървесен произход“, поне според една от етимологичните теории, която сочи като първоизточник латинското liber – „слой от дървесната кора“, върху който се е пишело. Другата теория за произхода на френската „книга“ е от протоиндоевропейския корен *h₁lewdʰ-, или „хора“, откъдето произлизат немските Leute, руските „люди“, староанглийските leod, както и старогръцкото ἐλεύθερος (eleutheros), което означава „свободен“, откъдето е и връзката с liberty, liberté („свобода“).
4 Както личи от мотото на Лайпцигския панаир – Buchstäblich überraschend („Буквално изненадващ“), немската дума за „буквално“ също произлиза от Buch – за разлика от английската (literal), която се е формирала на основата на латинския корен. (Да не се бърка с literary („литературен“), макар че, разбира се, двете думи са свързани.)
5 Противно на очакванията, думата „азбука“ произлиза не от „буква“, а от имената на първите две старобългарски букви от глаголицата азъ и боукꙑ, като калка от старогръцката ἀλφάβητος (alphábētos), от ἄλφα (álpha) и βῆτα (bêta). От своя страна думата alphabet, разбира се, преминава и в много други езици, включително английски, френски и немски, в руски („алфавит“), а даже и в турски (alfabe) и баски (alfabetoa). Подобен принцип за образуване на думата, макар и с малко по-различен краен резултат, е приложен и на унгарски (ábécé), босненски (abeceda) и литовски (abėcėlė).
В рубриката „От дума на дума“ Екатерина Петрова търси актуални, интересни или новопоявили се думи от нашето ежедневие и проследява често изненадващия им произход, развитието на значенията им във времето и взаимовръзките им с близки и далечни езици.
Note: Timestamps used in this article are in UTC+8 Singapore time, unless stated otherwise.
Background
When we upgraded to Xcode 13.1 in April 2022, we noticed a few issues such as instability of the CI tests and other problems related to the switch to Xcode 13.1.
After taking a step back, we investigated this issue by integrating some observability tools into our iOS CI development process. This gave us a comprehensive perspective of the entire process, from the beginning to the end of the UITest job. In this article, we share the improvements we made, the insights we gathered, and the impact of these improvements on the overall process and resource utilisation.
Solution
In the following sections, we elaborate the various steps we took to investigate the issues, like unstable CI tests and high CPU utilisation, and the improvements we made to make our iOS CI infrastructure more reliable.
Analyse Xcode 13.1 CPU utilisation
As an iOS developer, we are certain that you have also experienced Spotlight process-related CPU usage problems with Xcode 13.1, which have since been resolved in Xcode 13.2. After investigating, we found that the CPU usage issues were one of the root causes of UITest’s instability and it was something we needed to fix urgently. We decided not to wait for Apple’s update as it would cost us more time to perform another round of migration.
Before we started UITest, we moved the spotlight.app into a new folder. When the test was complete, we restored the application to its original location. This significantly decreased CPU utilisation by more than 50%.
This section helps you better visualise how the different versions of Xcode affected CPU utilisation.
Xcode 12.1
Xcode 13.1 before fix
Xcode 13.1 after fix
Remove iOS Safari’s dependency during deep link testing
As a superapp, there are countless scenarios that need to be thoroughly tested at Grab before the feature is released in production. One of these tests is deep link testing.
More than 10% of the total number of tests are deep link tests. Typically, it is advised to mock the dependencies throughout the test to ensure that it runs quickly and reliably. However, this creates another reliance on iOS Safari.
As a result, we created a mock browser in UITest. We used the URL to the mock browser as the launch argument, and the same URL is then called back. This method results in a 20% reduction in CI time and more stable tests.
Boot the iOS simulator with permission
It is always a good idea to reset the simulator before running UITest so that there are no residual presets or simulated data from a different test. Additionally, using any of the simulator’s services (location, ATT, contacts, etc.) will prompt the simulator to request permission, which slows down execution. We used UIInterruptionHandler (a handler block for managing alerts and other dialogues) to manage asynchronous UI interruptions during the test.
We wanted to reduce the time taken for test execution, which we knew includes many permissions. Therefore, in order to speed up execution, we boot the simulator with permissions. This removes the need for permissions during UITest, which speeds up performance by 5%.
Monitor HTTP traffic during the UITest
When writing tests, it is important to mock all resources as this enables us to focus on the code that’s being tested and not how external dependencies interact or respond. However, with a large team working concurrently, it can be challenging to ensure that nothing is actually downloaded from the internet.
Developers often make changes to code, and UITests are essential for ensuring that these modifications do not adversely affect existing functionality. It is advised to mock all dependencies while writing tests to simulate all possible behavior. We discovered that a significant number of resources were being downloaded each time we ran the tests, which was highly inefficient.
In large teams working simultaneously, preventing downloads from the internet can be quite challenging. To tackle this issue, we devised a custom tool that tracks all URLs accessed throughout the UITest. This enabled us to identify resources being downloaded from the internet during the testing process.
By using our custom tool to analyse network traffic, we were able to ensure that no resources were being downloaded during testing. Instead, we relied on mocked dependencies, resulting in reduced testing times and improved stability.
GitLab load runner analysis
At Grab, we have many teams of developers who maintain the app, make code changes, and raise merge requests (MRs) on a daily basis. To make sure that new changes don’t conflict with existing code, these MRs are integrated with CI.
Additionally, to manage the number of MRs, we maintain a list of clusters that run test runners concurrently for better resource utilisation and performance. We frequently run these tests to determine how many parallel processors are required for stable results.
####Return HTTP responses to the local mock server
We have a tool that we use to mock API requests, which we improved to also support HTML responses. This increases the scope of testing and ensures the HTML response sequences work properly.
Use explicit waiting commands
When running multiple tests, timing issues are inevitable and they cause tests to occasionally pass and fail. To mitigate this, most of the developers prefer to add a sleep command so there is time for the element to render properly before we verify it – but this slows down execution. In order to improve CI execution, we introduced a link that allows us to track sleep function usage and suggest developers use waitForExistence wrappers in UI tests.
Track each failure state
With large codebases, it is quite common to see flakiness in UITests, where tests occasionally succeed and fail without any code changes. This means that test results can be inconsistent and in some cases, faulty. Faulty testing can be frustrating, and quite expensive. This is because engineers need to re-trigger entire builds, which ends up consuming more time.
Initially, we used an internal tool that required all tests to pass on the first run, before merging was allowed. However, we realised that this significantly increased engineers’ manual retry time, hence, we modified the rules to allow merging as long as a subsequent retry passes the tests. This minor change improved our engineers’ CI overall experience and did not result in more flaky tests.
Learnings/Conclusion
Our journey to improve iOS CI infrastructure is still ongoing, but from this experience, we learnt several things:
Focus on the feature being tested by ensuring all external responses are mocked.
A certain degree of test flakiness is expected, but you should monitor past trends. If flakiness increases, there’s probably a deeper lying issue within your code.
Regularly monitor resource utilisation and performance – detecting a sudden spike early could save you a lot of time and money.
About five years ago I announced that AWS Documentation is Now Open Source and on GitHub. After a prolonged period of experimentation we will archive most of the repos starting the week of June 5th, and will devote all of our resources to directly improving the AWS documentation and website.
The primary source for most of the AWS documentation is on internal systems that we had to manually sync with the GitHub repos. Despite the best efforts of our documentation team, keeping the public repos in sync with our internal ones has proven to be very difficult and time consuming, with several manual steps and some parallel editing. With 262 separate repos and thousands of feature launches every year, the overhead was very high and actually consumed precious time that could have been put to use in ways that more directly improved the quality of the documentation.
Our intent was to increase value to our customers through openness and collaboration, but we learned through customer feedback that this wasn’t necessarily the case. After carefully considering many options we decided to retire the repos and to invest all of our resources in making the content better.
Repos containing code samples, sample apps, CloudFormation templates, configuration files, and other supplementary resources will remain as-is since those repos are primary sources and get a high level of engagement.
To help us improvement the documentation, we’re also focusing more resources on your feedback:
We watch the thumbs-up and thumbs-down metrics on a weekly basis, and use the metrics as top-level pointers to areas of the documentation that could be improved. The incoming feedback creates tickets that are routed directly to the person or the team that is responsible for the page. I strongly encourage you to make frequent use of both feedback mechanisms.
This is a guest post by Kenta Oda from SOFTBRAIN Co., Ltd.
Softbrain is a leading Japanese producer of software for sales force automation (SFA) and customer relationship management (CRM). Our main product, e-Sales Manager (eSM), is an SFA/CRM tool that provides sales support to over 5,500 companies in Japan. We provide our sales customers with a one-stop source for information and visualization of sales activity, improving their efficiency and agility, which leads to greater business opportunity.
With increasing demand from our customers for analyzing data from different angles throughout the sales process, we needed an embedded analytics tool. We chose Amazon QuickSight, a cloud-native business intelligence (BI) tool that allows you to embed insightful analytics into any application with customized, interactive visuals and dashboards. It integrates seamlessly with eSM and is easy to use at a low cost.
In this post, we discuss how QuickSight is helping us provide our sales customers with the insights they need, and why we consider this business decision a win for Softbrain.
There were four things we were looking for in an embedded analytics solution:
Rich visualization – With our previous solution, which was built in-house, there were only four types of visuals, so it was difficult to combine multiple graphs for an in-depth analysis.
Development speed – We needed to be able to quickly implement BI functionalities. QuickSight requires minimal development due to its serverless architecture, embedding, and API.
Cost – We moved from Tableau to QuickSight because QuickSight allowed us to provide data analysis and visualizations to our customers at a competitive price—ensuring that more of our customers can afford it.
Ease of use – QuickSight is cloud-based and has an intuitive UX for our sales customers to work with.
Innovating with QuickSight
Individual productivity must be greatly improved to keep up with the shifting labor market in Japan. At Softbrain, we aim to innovate using the latest technology to provide science-based insights into customer and sales interactions, enabling those who use eSM to be much more productive. Sales reps and managers are able to make informed decisions.
By using QuickSight as our embedded analytics solution, we can offer data visualizations at a much lower price point, making it much more accessible for our customers than we could with other BI solutions. When we combine the process management system offered by eSM with the intuitive user experience and rich visualization capability of QuickSight, we empower customers to understand their sales data, which sits in Amazon Simple Storage Service (Amazon S3) and Amazon Aurora, and act on it.
Seamless console embedding
What sets QuickSight apart from other BI tools is console embedding, which means our customers have the ability to build their own dashboards within eSM. They can choose which visualizations they want and take an in-depth look at their data. Sales strategy requires agility, and our customers need more than a fixed dashboard. QuickSight offers freedom and flexibility with console embedding.
Console embedding allows eSM to be a one-stop source for all the information sales reps and managers need. They can access all the analyses they need to make decisions right from their web browser because QuickSight is fully managed and serverless. With other BI solutions, the user would need to have the client application installed on their computer to create their own dashboards.
Empowering our sales customers
With insights from QuickSight embedded into eSM, sales reps can analyze the gap between their budget and actual revenue to build an action plan to fill the gap. They can use their dashboards to analyze data on a weekly and monthly basis. They can share this information at meetings and explore the data to figure out why there might be low attainment for certain customers. Our customers can use eSM and QuickSight to understand why win or loss opportunities are increasing. Managers can analyze and compare the performance of their sales reps to learn what high-performing reps are doing and help low performers. Sales reps can also evaluate their own performance.
Driving 95% customer retention rate
All of these insights come from putting sales data into eSM and QuickSight. It’s no secret that our customers love QuickSight. We can boast a 95% customer retention rate and offer QuickSight as an embedded BI solution at largest scale in Japan.
To learn more about how you can embed customized data visuals and interactive dashboards into any application, visit Amazon QuickSight Embedded.
About the author
Kenta Oda is the Chief Technology Officer at SOFTBRAIN Co., Ltd. He is in responsible of new product development with keen insight on better customer experience and go-to-market strategy.
Customers are adopting Amazon Managed Service for Apache Kafka (Amazon MSK) as a fast and reliable streaming platform to build their enterprise data hub. In addition to streaming capabilities, setting up Amazon MSK enables organizations to use a pub/sub model for data distribution with loosely coupled and independent components.
To publish and distribute the data between Apache Kafka clusters and other external systems including search indexes, databases, and file systems, you’re required to set up Apache Kafka Connect, which is the open-source component of Apache Kafka framework, to host and run connectors for moving data between various systems. As the number of upstream and downstream applications grow, so does the complexity to manage, scale, and administer the Apache Kafka Connect clusters. To address these scalability and manageability concerns, Amazon MSK Connect provides the functionality to deploy fully managed connectors built for Apache Kafka Connect, with the capability to automatically scale to adjust with the workload changes and pay only for the resources consumed.
For our use case, an enterprise wants to build a centralized data repository that has multiple producer and consumer applications. To support streaming data from applications with different tools and technologies, Amazon MSK is selected as the streaming platform. One of the primary applications that currently writes data to Amazon RDS for MySQL would require major design changes to publish data to MSK topics and write to the database at the same time. Therefore, to minimize the design changes, this application would continue writing the data to Amazon RDS for MySQL with the additional requirement to synchronize this data with the centralized streaming platform Amazon MSK to enable real-time analytics for multiple downstream consumers.
To solve this use case, we propose the following architecture that uses Amazon MSK Connect, a feature of Amazon MSK, to set up a fully managed Apache Kafka Connect connector for moving data from Amazon RDS for MySQL to an MSK cluster using the open-source JDBC connector from Confluent.
Set up the AWS environment
To set up this solution, you need to create a few AWS resources. The AWS CloudFormation template provided in this post creates all the AWS resources required as prerequisites:
An RDS for MySQL DB instance to act as the source for the streaming data flow
An MSK cluster to act as the target for the streaming data flow
An Amazon Elastic Compute Cloud (Amazon EC2) instance to act as the Kafka client and MySQL client for various administration and data validation tasks
The following table lists the parameters you must provide for the template.
Parameter Name
Description
Keep Default Value
Stack name
Name of CloudFormation stack.
No
DBInstanceID
Name of RDS for MySQL instance.
No
DBName
Database name to store sample data for streaming.
Yes
DBInstanceClass
Instance type for RDS for MySQL instance.
No
DBAllocatedStorage
Allocated size for DB instance (GiB).
No
DBUsername
Database user for MySQL database access.
No
DBPassword
Password for MySQL database access.
No
JDBCConnectorPluginBukcetName
Bucket for storing MSK Connect connector JAR files and plugin.
No
ClientIPCIDR
IP address of client machine to connect to EC2 instance.
No
EC2KeyPair
Key pair to be used in your EC2 instance. This EC2 instance will be used as a proxy to connect from your local machine to the EC2 client instance.
No
EC2ClientImageId
Latest AMI ID of Amazon Linux 2. You can keep the default value for this post.
Yes
VpcCIDR
IP range (CIDR notation) for this VPC.
No
PrivateSubnetOneCIDR
IP range (CIDR notation) for the private subnet in the first Availability Zone.
No
PrivateSubnetTwoCIDR
IP range (CIDR notation) for the private subnet in the second Availability Zone.
No
PrivateSubnetThreeCIDR
IP range (CIDR notation) for the private subnet in the third Availability Zone.
No
PublicSubnetCIDR
IP range (CIDR notation) for the public subnet.
No
To launch the CloudFormation stack, choose Launch Stack:
After the CloudFormation template is complete and the resources are created, the Outputs tab shows the resource details.
Validate sample data in the RDS for MySQL instance
To prepare the sample data for this use case, complete the following steps:
SSH into the EC2 client instance MSKEC2Client using the following command from your local terminal:
ssh -i <keypair><user>@<hostname>
Run the following commands to validate the data has been loaded successfully:
$ mysql -h <rds_instance_endpoint_name> -u <user_name> -p

MySQL [(none)]> use dms_sample;

MySQL [dms_sample]> select mlb_id, mlb_name, mlb_pos, mlb_team_long, bats, throws from mlb_data limit 5;
Synchronize all tables’ data from Amazon RDS to Amazon MSK
To sync all tables from Amazon RDS to Amazon MSK, create an Amazon MSK Connect managed connector with the following steps:
On the Amazon MSK console, choose Custom plugins in the navigation pane under MSK Connect.
Choose Create custom plugin.
For S3 URI – Custom plugin object, browse to the ZIP file named confluentinc-kafka-connect-jdbc-plugin.zip (created by the CloudFormation template) for the JDBC connector in the S3 bucket bkt-msk-connect-plugins-<aws_account_id>.
For Custom plugin name, enter msk-confluent-jdbc-plugin-v1.
Enter an optional description.
Choose Create custom plugin.
After the custom plugin has been successfully created, it will be available in Active status
Choose Connectors in the navigation pane under MSK Connect.
Choose Create connector.
Select Use existing custom plugin and under Custom plugins, select the plugin msk-confluent-jdbc-plugin-v1 that you created earlier.
Choose Next.
For Connector name, enter msk-jdbc-connector-rds-to-msk.
Enter an optional description.
For Cluster type, select MSK cluster.
For MSK clusters, select the cluster you created earlier.
For Authentication, choose IAM.
Under Connector configurations, enter the following settings:
### CONNECTOR SPECIFIC SETTINGS

### Provide the configuration properties to connect to source and destination endpoints including authentication

### mechanism, credentials and task details such as polling interval, source and destination object names, data

### transfer mode, parallelism

### Many of these properties are connector and end-point specific, so please review the connector documentation ### for more details

connector.class=io.confluent.connect.jdbc.JdbcSourceConnector

connection.user=admin

connection.url=jdbc:mysql://<rds_instance_endpoint_name>:3306/dms_sample

connection.password=XXXXX

tasks.max=1

poll.interval.ms=300000

topic.prefix=rds-to-msk-

mode=bulk

connection.attempts=1

### CONVERTING KAFKA MESSAGE BYTES TO JSON

value.converter=org.apache.kafka.connect.json.JsonConverter

key.converter=org.apache.kafka.connect.storage.StringConverter

value.converter.schemas.enable=false

key.converter.schemas.enable=false

###GENERIC AUTHENTICATION SETTINGS FOR KAFKA CONNECT

security.protocol=SASL_SSL

sasl.mechanism=AWS_MSK_IAM

ssl.truststore.location=~/kafka.truststore.jks

ssl.keystore.location=~/kafka.client.keystore.jks

sasl.client.callback.handler.class=software.amazon.msk.auth.iam.IAMClientCallbackHandler

sasl.jaas.config=software.amazon.msk.auth.iam.IAMLoginModule required;
The following table provides a brief summary of all the preceding configuration options.
Configuration Options
Description
connector.class
JAVA class for the connector
connection.user
User name to authenticate with the MySQL endpoint
connection.url
JDBC URL identifying the hostname and port number for the MySQL endpoint
connection.password
Password to authenticate with the MySQL endpoint
tasks.max
Maximum number of tasks to be launched for this connector
poll.interval.ms
Time interval in milliseconds between subsequent polls for each table to pull new data
topic.prefix
Custom prefix value to append with each table name when creating topics in the MSK cluster
mode
The operation mode for each poll, such as bulk, timestamp, incrementing, or timestamp+incrementing
connection.attempts
Maximum number of retries for JDBC connection
security.protocol
Sets up TLS for encryption
sasl.mechanism
Identifies the SASL mechanism to use
ssl.truststore.location
Location for storing trusted certificates
ssl.keystore.location
Location for storing private keys
sasl.client.callback.handler.class
Encapsulates constructing a SigV4 signature based on extracted credentials
sasl.jaas.config
Binds the SASL client implementation
In the Connector capacity section, select Autoscaled for Capacity type and keep the default value of 1 for MCU count per worker.
Set 4 for Maximum number of workers and keep all other default values for Workers and Autoscaling utilization thresholds.
For Worker configuration, select Use the MSK default configuration.
Under Access permissions, choose the custom IAM role msk-connect-rds-jdbc-MSKConnectServiceIAMRole-* created earlier.
For Log delivery, select Deliver to Amazon CloudWatch Logs.
For Log group, choose the log group msk-jdbc-source-connector created earlier.
Choose Next.
Under Review and Create, validate all the settings and choose Create connector.
After the connector has transitioned to RUNNING status, the data should start flowing from the RDS instance to the MSK cluster.
Validate the data
To validate and compare the data, complete the following steps:
SSH into the EC2 client instance MSKEC2Client using the following command from your local terminal:
ssh -i <keypair><user>@<hostname>
To connect to the MSK cluster with IAM authentication, enter the latest version of the aws-msk-iam-auth JAR file in the class path:
On the Amazon MSK console, choose Clusters in the navigation pane and choose the cluster MSKConnect-msk-connect-rds-jdbc.
On the Cluster summary page, choose View client information.
In the View client information section, under Bootstrap servers, copy the private endpoint for Authentication type IAM.
Set up additional environment variables for working with the latest version of Apache Kafka installation and connecting to Amazon MSK bootstrap servers, where <bootstrap servers> is the list of bootstrap servers that allow connecting to the MSK cluster with IAM authentication:
Set up a config file named client/properties to be used for authentication:
$ cd /home/ec2-user/kafka/config/

$ vi client.properties

# Sets up TLS for encryption and SASL for authN.

security.protocol = SASL_SSL

# Identifies the SASL mechanism to use.

sasl.mechanism = AWS_MSK_IAM

# Binds SASL client implementation.

sasl.jaas.config = software.amazon.msk.auth.iam.IAMLoginModule required;

# Encapsulates constructing a SigV4 signature based on extracted credentials.

# The SASL client bound by "sasl.jaas.config" invokes this class.

sasl.client.callback.handler.class = software.amazon.msk.auth.iam.IAMClientCallbackHandler
Validate the list of topics created in the MSK cluster:
$ cd /home/ec2-user/kafka/

$ bin/kafka-topics.sh --list --bootstrap-server $BOOTSTRAP_SERVERS --command-config /home/ec2-user/kafka/config/client.properties
Validate that data has been loaded to the topics in the MSK cluster:
Synchronize data using a query to Amazon RDS and write to Amazon MSK
To synchronize the results of a query that flattens data by joining multiple tables in Amazon RDS for MySQL, create an Amazon MSK Connect managed connector with the following steps:
On Amazon MSK console, choose Connectors in the navigation pane under MSK Connect.
Choose Create connector.
Select Use existing custom plugin and under Custom plugins, select the pluginmsk-confluent-jdbc-plugin-v1.
For Connector name, enter msk-jdbc-connector-rds-to-msk-query.
Enter an optional description.
For Cluster type, select MSK cluster.
For MSK clusters, select the cluster you created earlier.
For Authentication, choose IAM.
Under Connector configurations, enter the following settings:
### CONNECTOR SPECIFIC SETTINGS

connector.class=io.confluent.connect.jdbc.JdbcSourceConnector

connection.user=admin

connection.url=jdbc:mysql://<rds_instance_endpoint_name>:3306/dms_sample

connection.password=XXXXX

tasks.max=1

poll.interval.ms=300000

topic.prefix=rds-to-msk-query-topic

mode=bulk

connection.attempts=1

query=select last_name, name as team_name, sport_type_name, sport_league_short_name, sport_division_short_name from dms_sample.sport_team join dms_sample.player on player.sport_team_id = sport_team.id;

### CONVERTING KAFKA MESSAGE BYTES TO JSON

value.converter=org.apache.kafka.connect.json.JsonConverter

key.converter=org.apache.kafka.connect.storage.StringConverter

value.converter.schemas.enable=false

key.converter.schemas.enable=false

###GENERIC AUTHENTICATION SETTINGS FOR KAFKA CONNECT

security.protocol=SASL_SSL

sasl.mechanism=AWS_MSK_IAM

ssl.truststore.location=~/kafka.truststore.jks

ssl.keystore.location=~/kafka.client.keystore.jks

sasl.client.callback.handler.class=software.amazon.msk.auth.iam.IAMClientCallbackHandler

sasl.jaas.config=software.amazon.msk.auth.iam.IAMLoginModule required;
In the Connector capacity section, select Autoscaled for Capacity type and keep the default value of 1 for MCU count per worker.
Set 4 for Maximum number of workers and keep all other default values for Workers and Autoscaling utilization thresholds.
For Worker configuration, select Use the MSK default configuration.
Under Access permissions, choose the custom IAM role role_msk_connect_serivce_exec_custom.
For Log delivery, select Deliver to Amazon CloudWatch Logs.
For Log group, choose the log group created earlier.
Choose Next.
Under Review and Create, validate all the settings and choose Create connector.
Once the connector has transitioned to RUNNING status, the data should start flowing from the RDS instance to the MSK cluster.
For data validation, SSH into the EC2 client instance MSKEC2Client and run the following command to see the data in the topic:
To clean up your resources and avoid ongoing charges, complete the following the steps:
On the Amazon MSK console, choose Connectors in the navigation pane under MSK Connect.
Select the connectors you created and choose Delete.
On the Amazon S3 console, choose Buckets in the navigation pane.
Search for the bucket with the naming convention bkt-msk-connect-plugins-<aws_account_id>.
Delete all the folders and objects in this bucket.
Delete the bucket after all contents have been removed.
To delete all other resources created using the CloudFormation stack, delete the stack via the AWS CloudFormation console.
Conclusion
Amazon MSK Connect is a fully managed service that provisions the required resources, monitors the health and delivery state of connectors, maintains the underlying hardware, and auto scales connectors to balance the workloads. In this post, we saw how to set up the open-source JDBC connector from Confluent to stream data between an RDS for MySQL instance and an MSK cluster. We also explored different options to synchronize all the tables as well as use the query-based approach to stream denormalized data into the MSK topics.
Manish Virwani is a Sr. Solutions Architect at AWS. He has more than a decade of experience designing and implementing large-scale big data and analytics solutions. He provides technical guidance, design advice, and thought leadership to some of the key AWS customers and partners.
Indira Balakrishnan is a Principal Solutions Architect in the AWS Analytics Specialist SA Team. She is passionate about helping customers build cloud-based analytics solutions to solve their business problems using data-driven decisions. Outside of work, she volunteers at her kids’ activities and spends time with her family.
The collective thoughts of the interwebz
Manage Consent
To provide the best experiences, we use technologies like cookies to store and/or access device information. Consenting to these technologies will allow us to process data such as browsing behavior or unique IDs on this site. Not consenting or withdrawing consent, may adversely affect certain features and functions.
Functional
Always active
The technical storage or access is strictly necessary for the legitimate purpose of enabling the use of a specific service explicitly requested by the subscriber or user, or for the sole purpose of carrying out the transmission of a communication over an electronic communications network.
Preferences
The technical storage or access is necessary for the legitimate purpose of storing preferences that are not requested by the subscriber or user.
Statistics
The technical storage or access that is used exclusively for statistical purposes.The technical storage or access that is used exclusively for anonymous statistical purposes. Without a subpoena, voluntary compliance on the part of your Internet Service Provider, or additional records from a third party, information stored or retrieved for this purpose alone cannot usually be used to identify you.
Marketing
The technical storage or access is required to create user profiles to send advertising, or to track the user on a website or across several websites for similar marketing purposes.


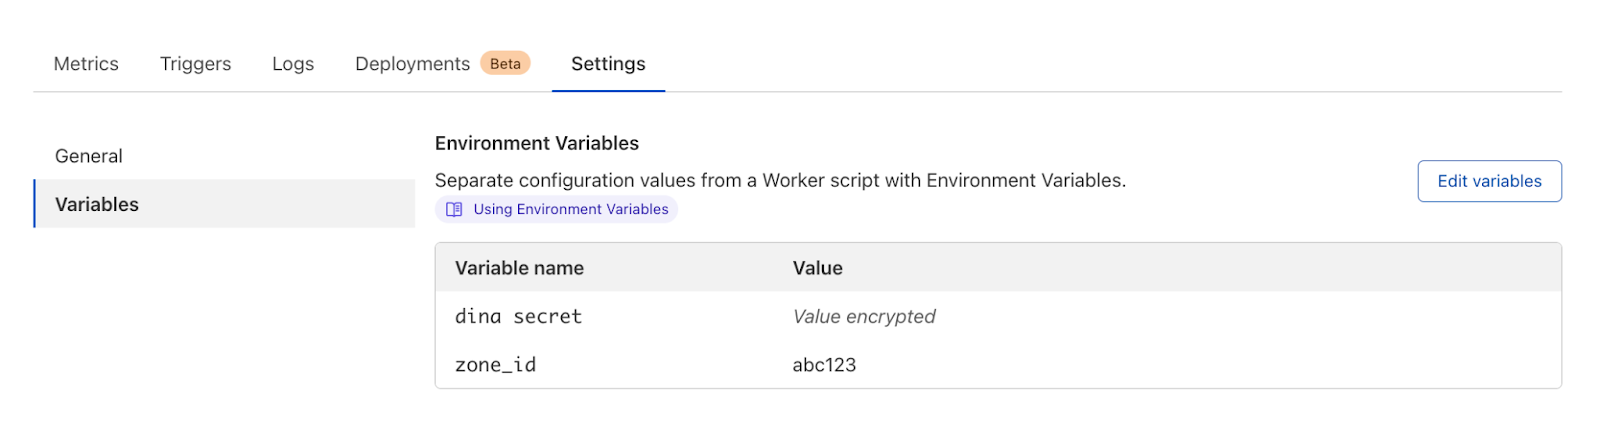


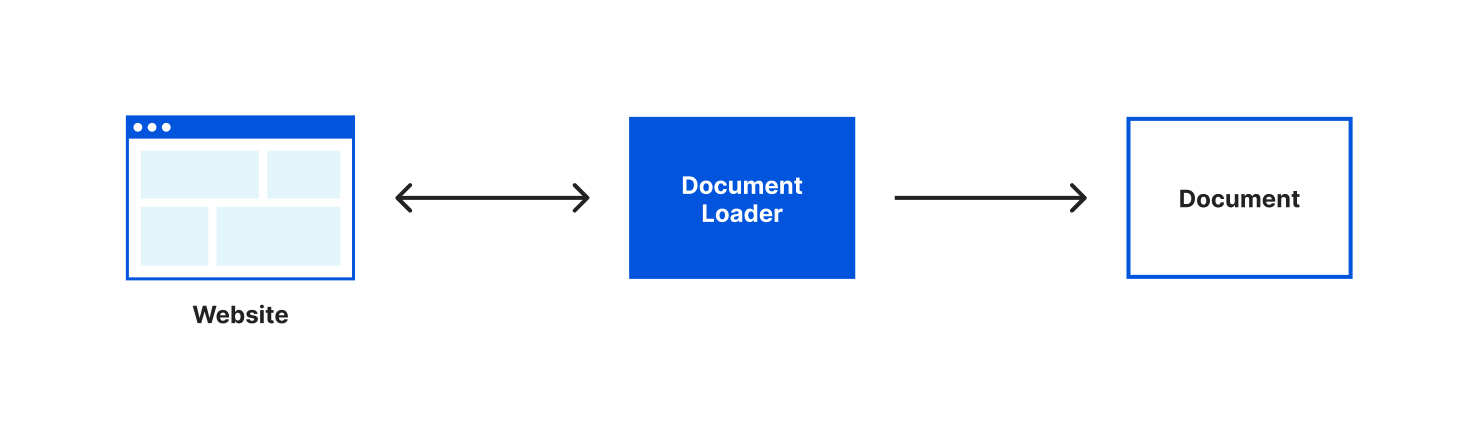
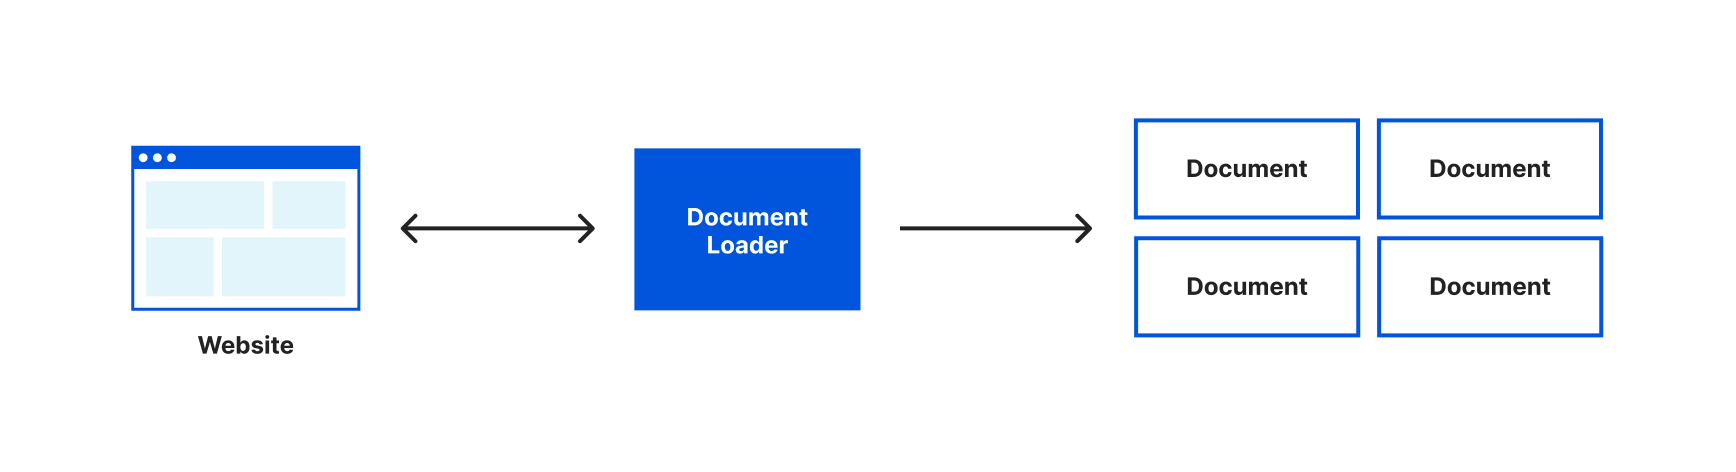
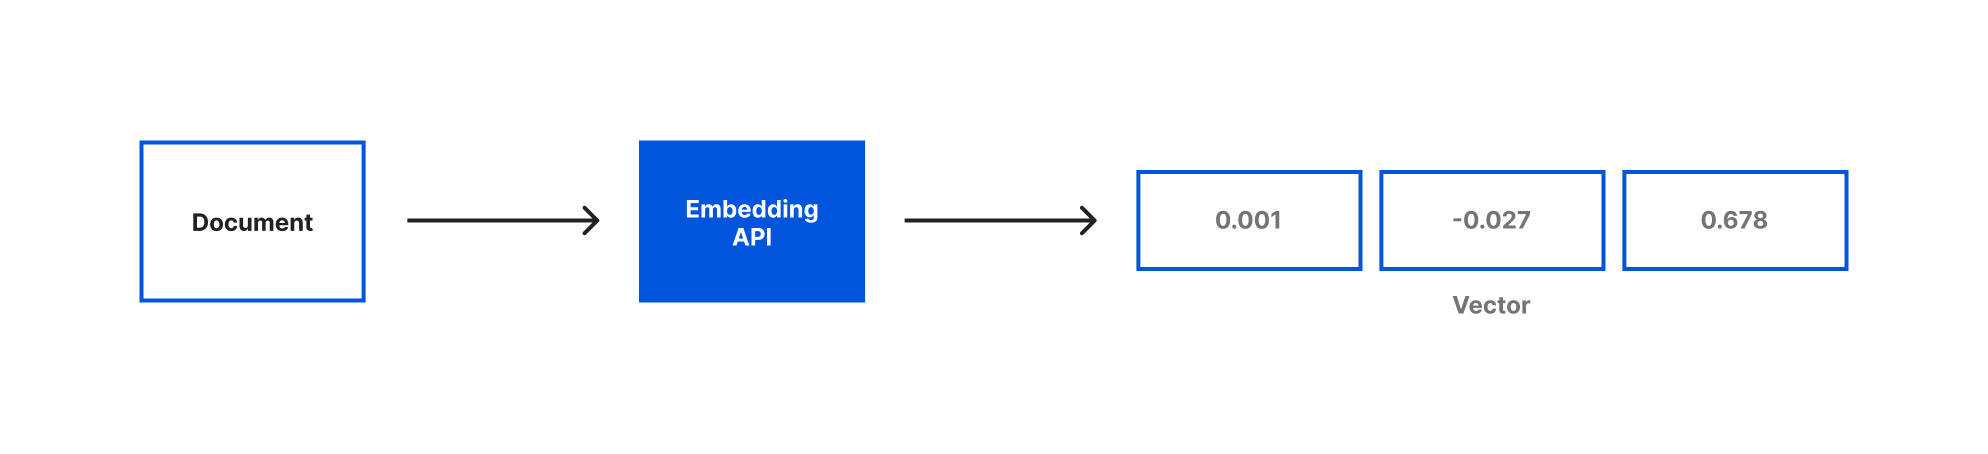
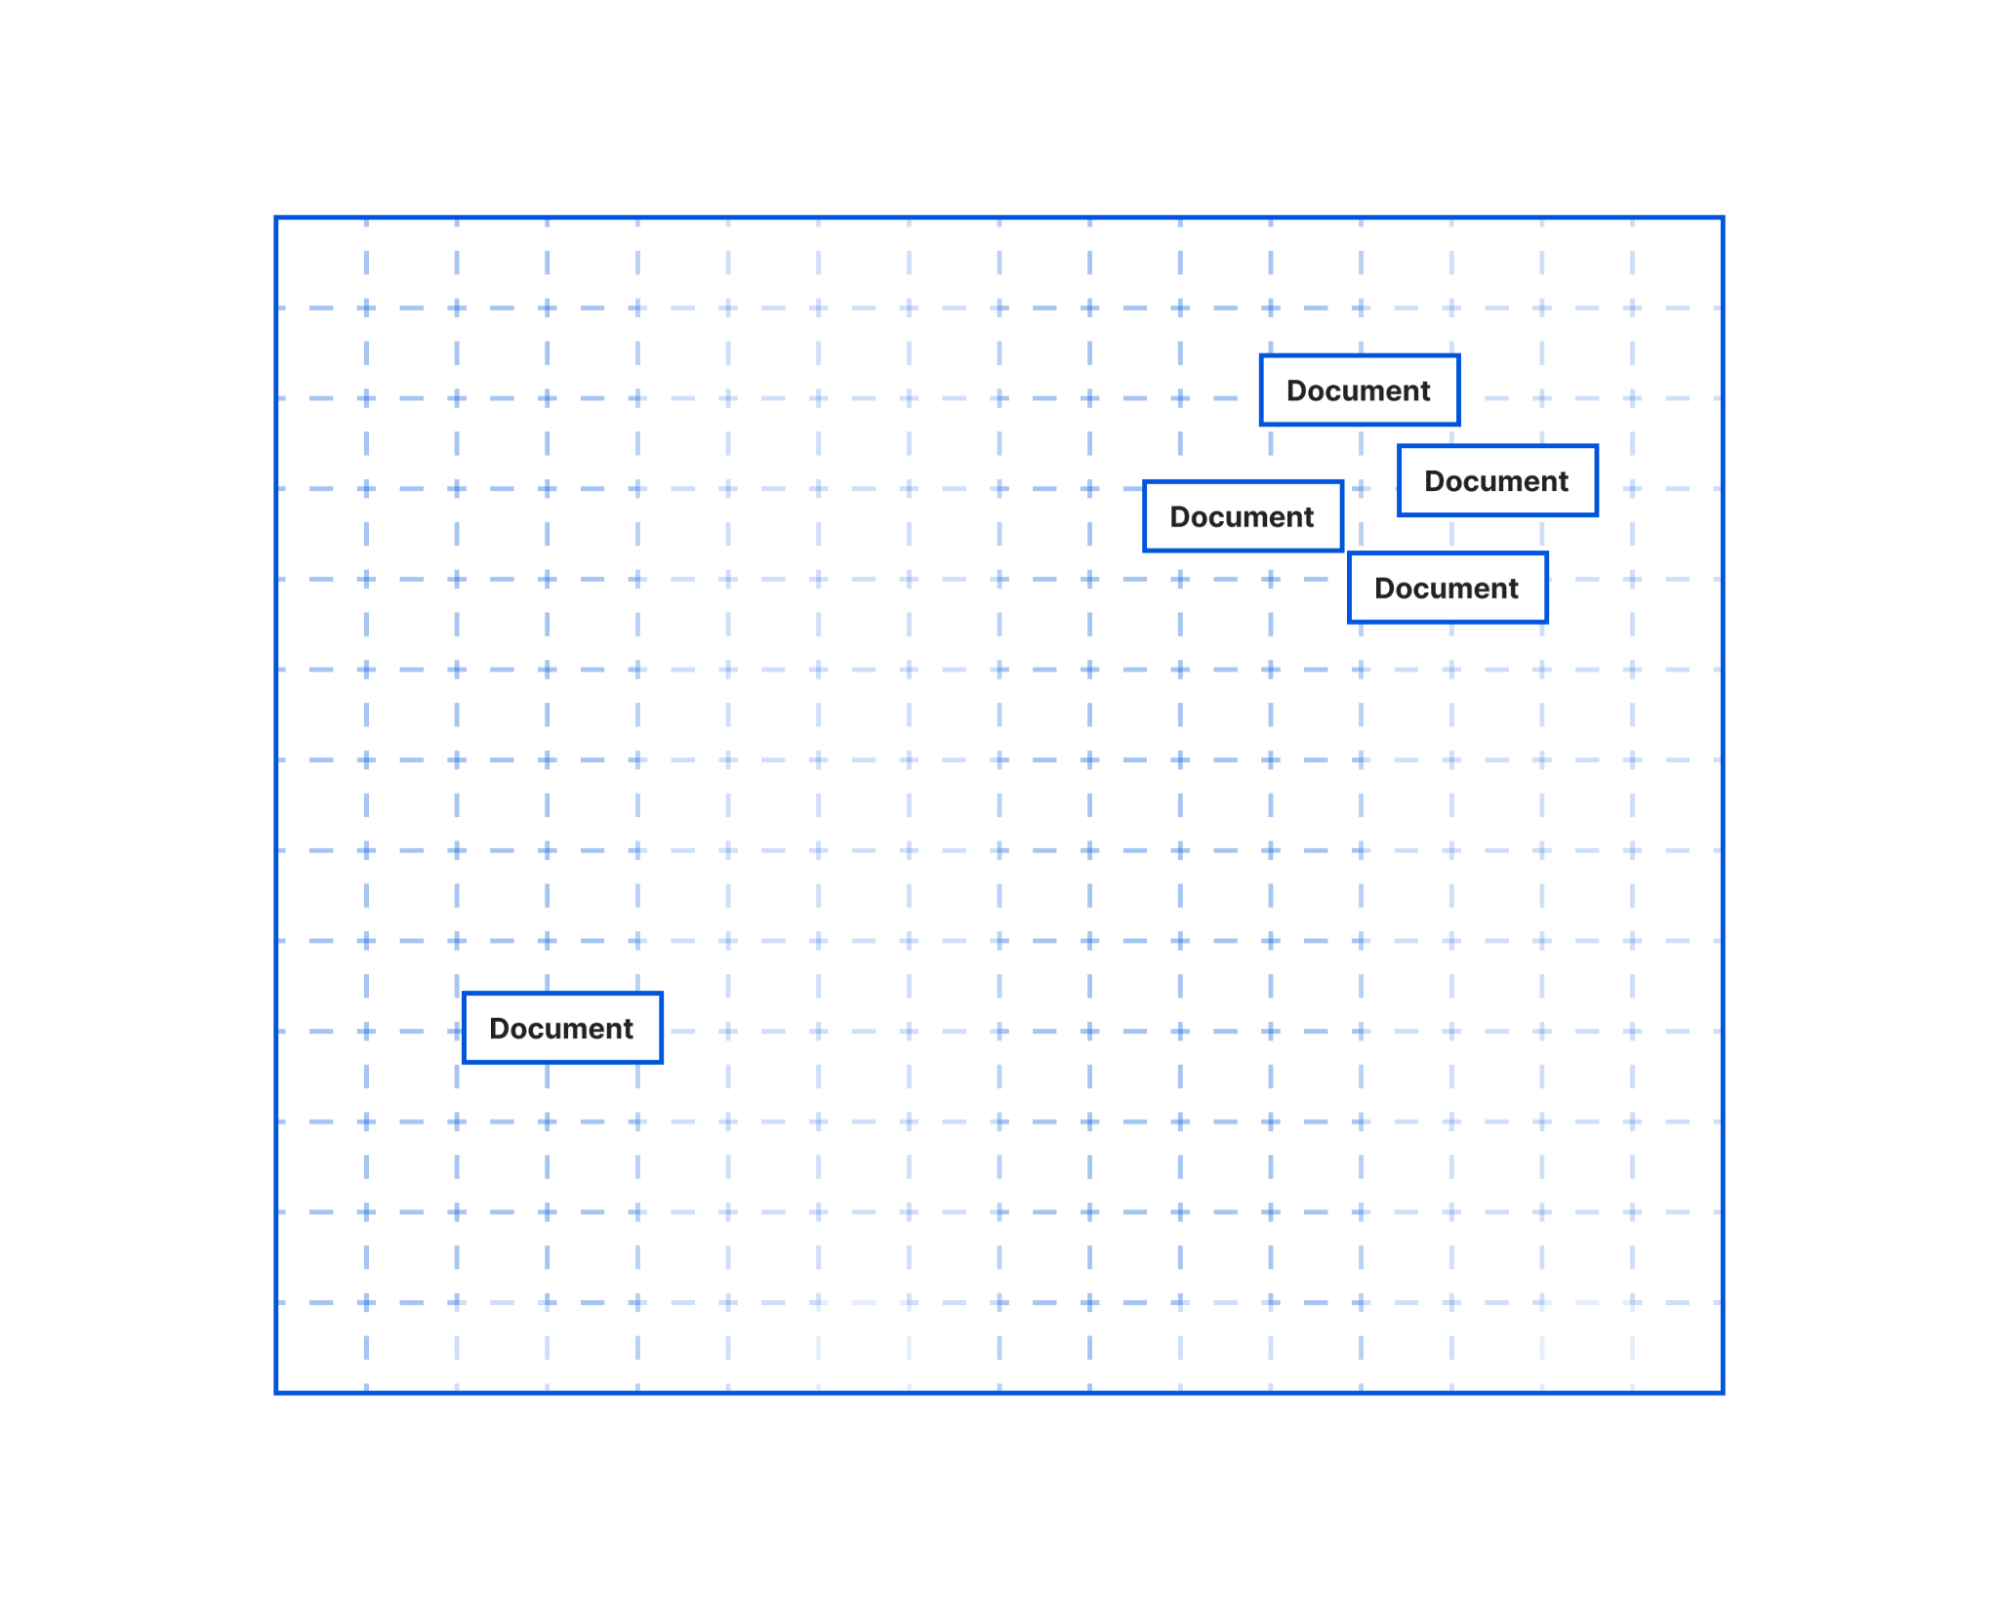
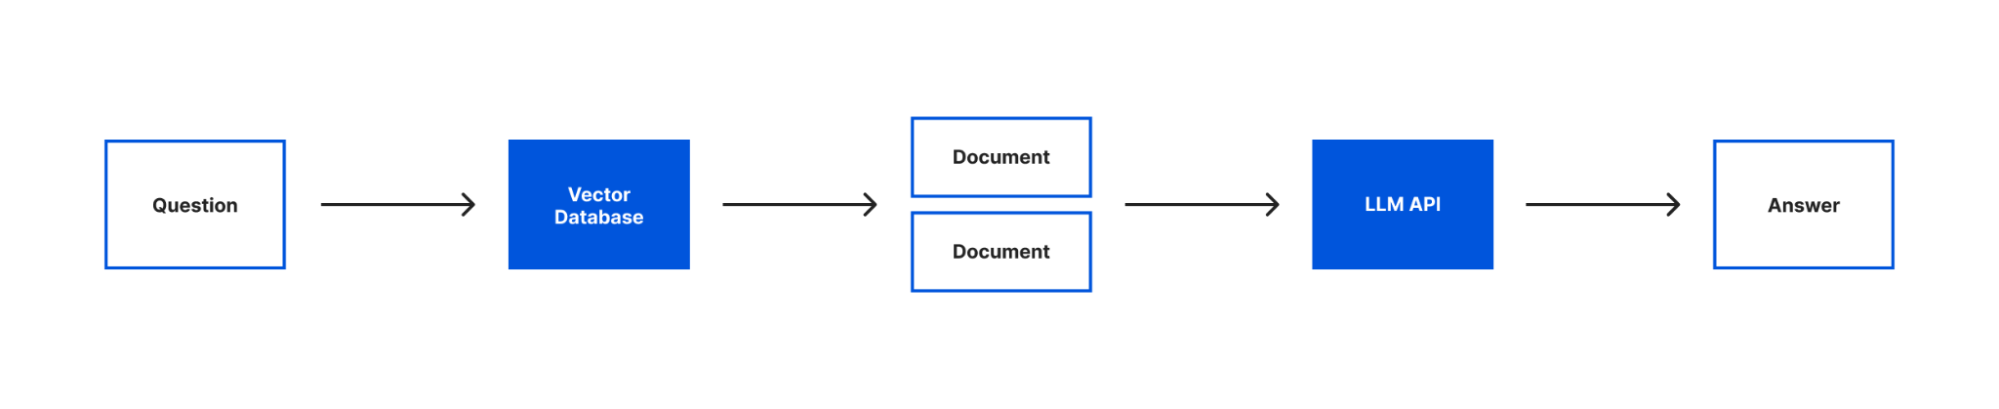
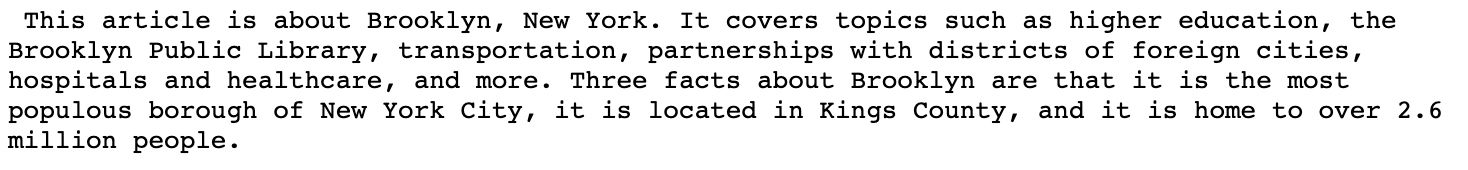


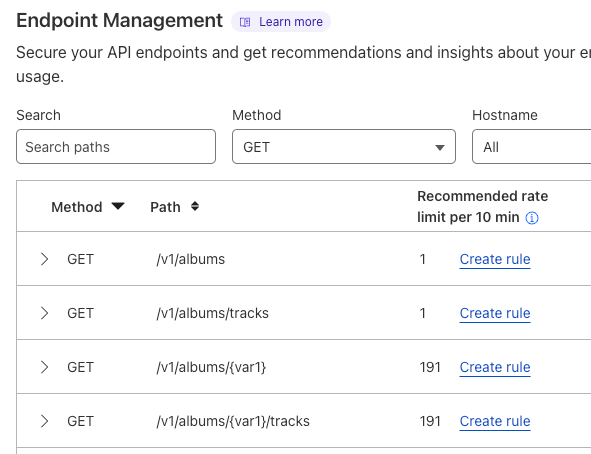
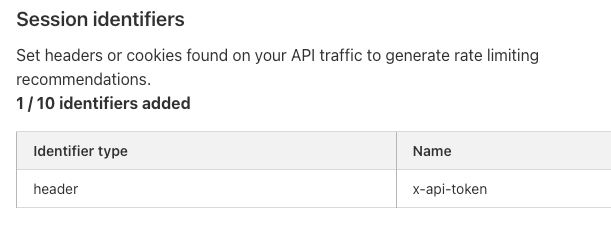
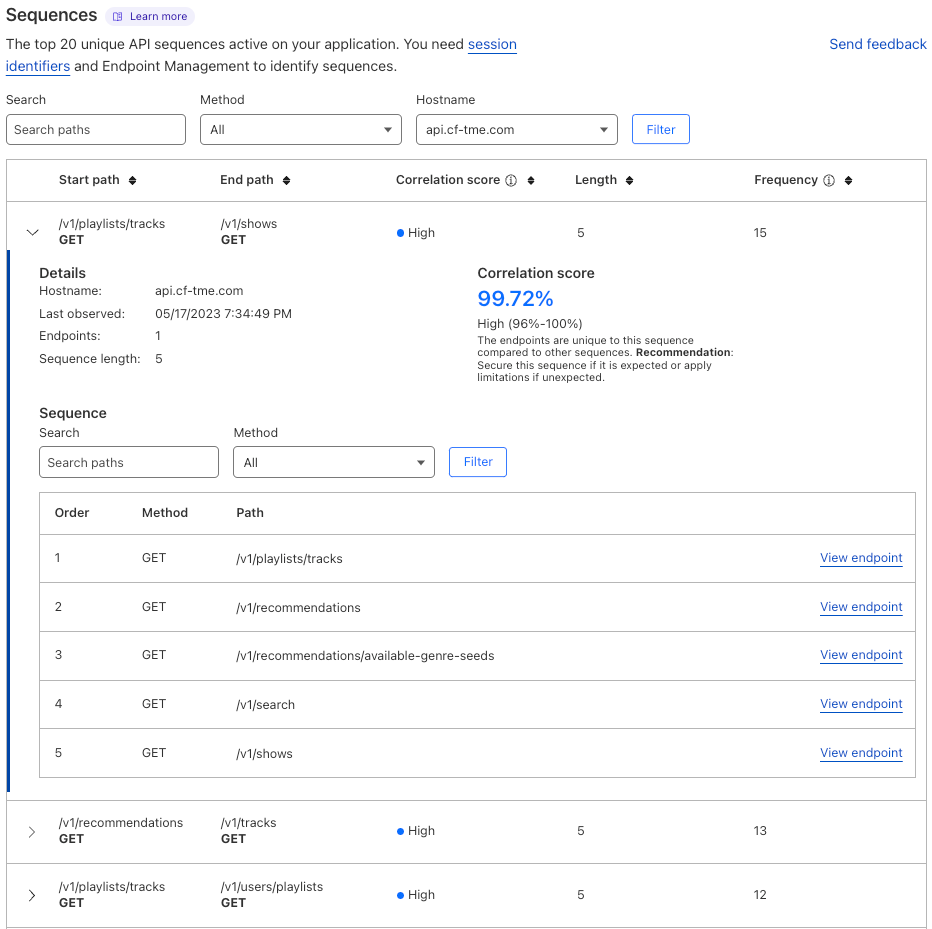


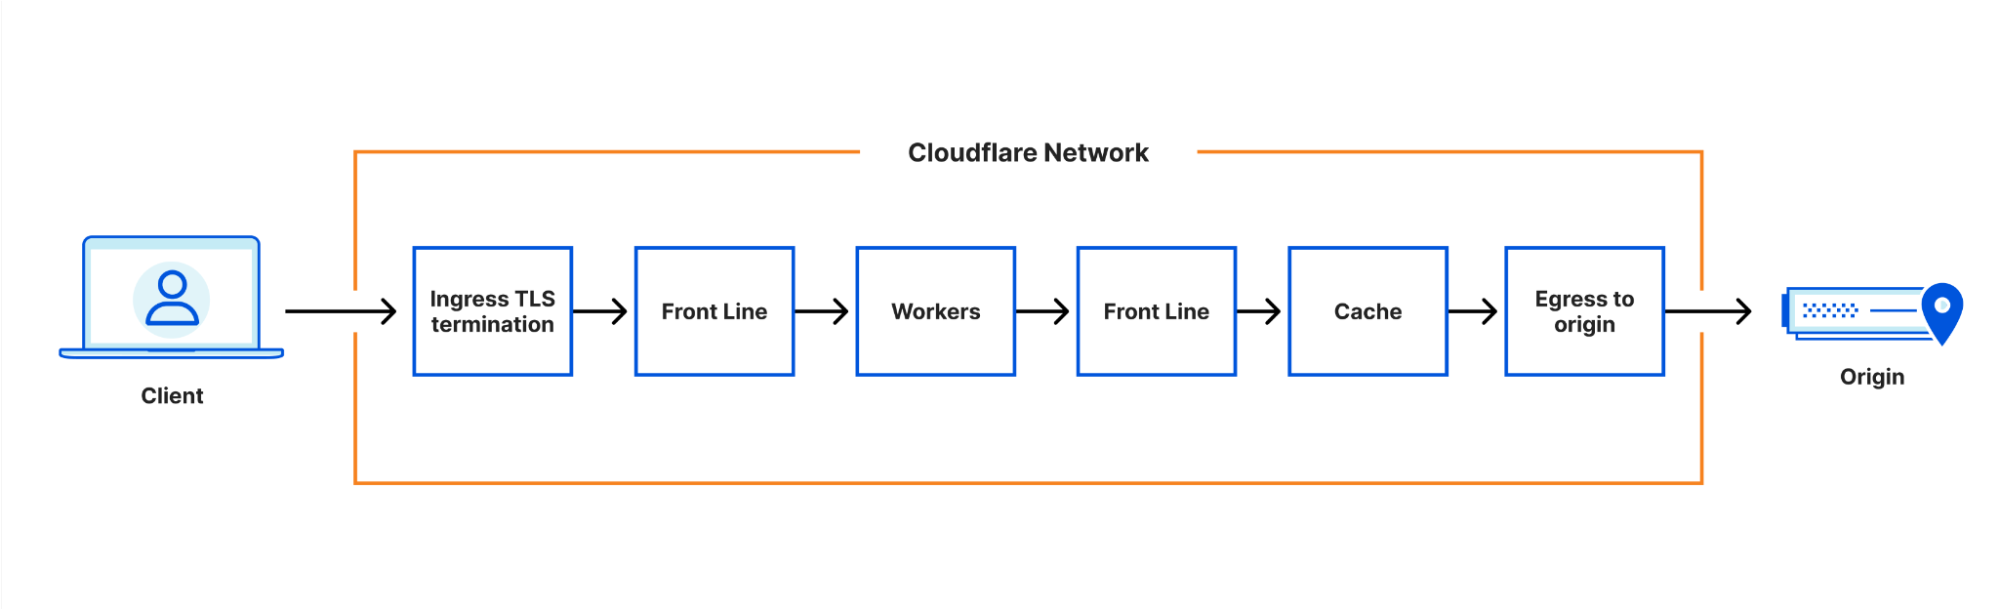
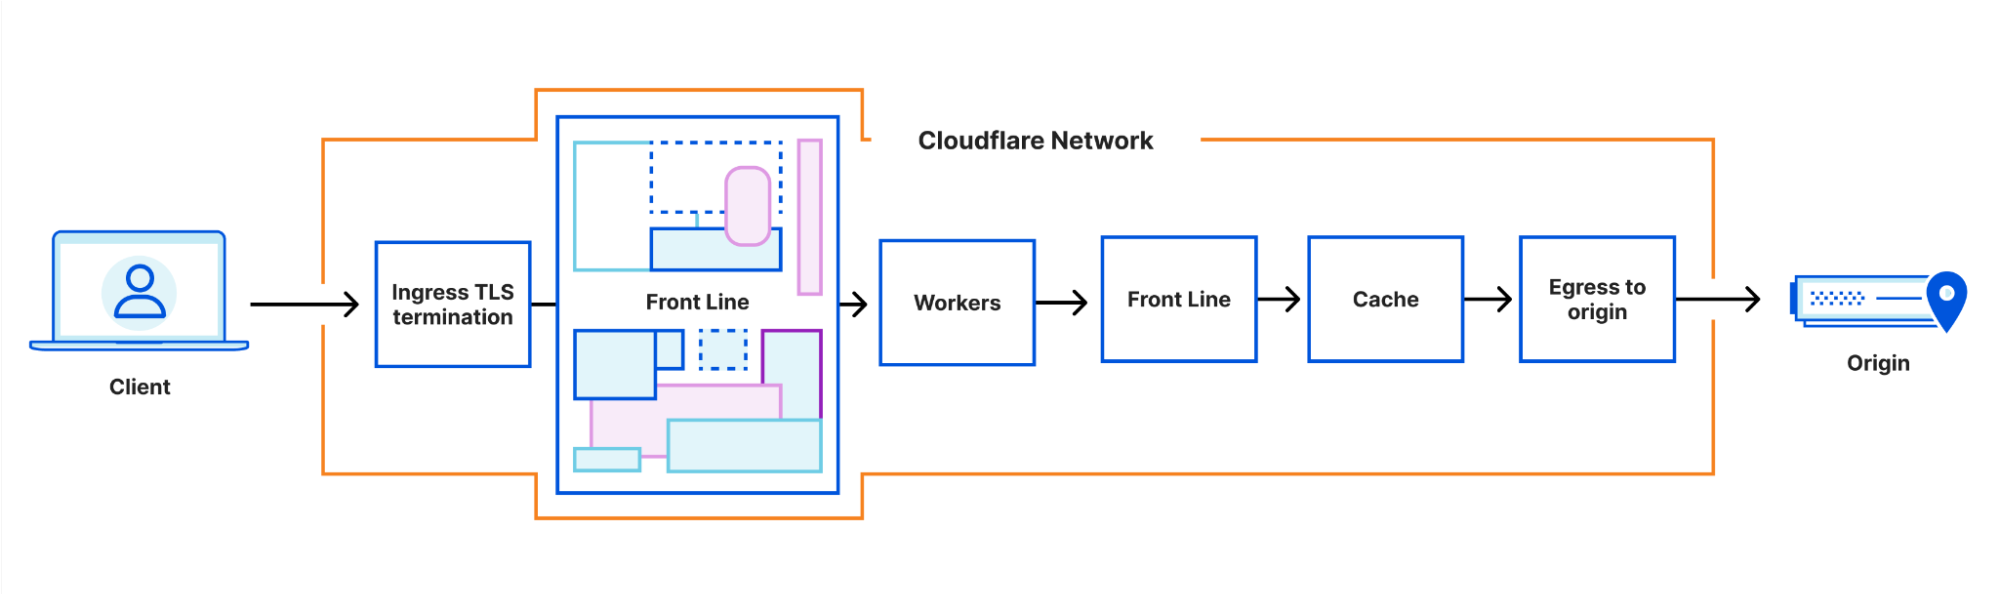
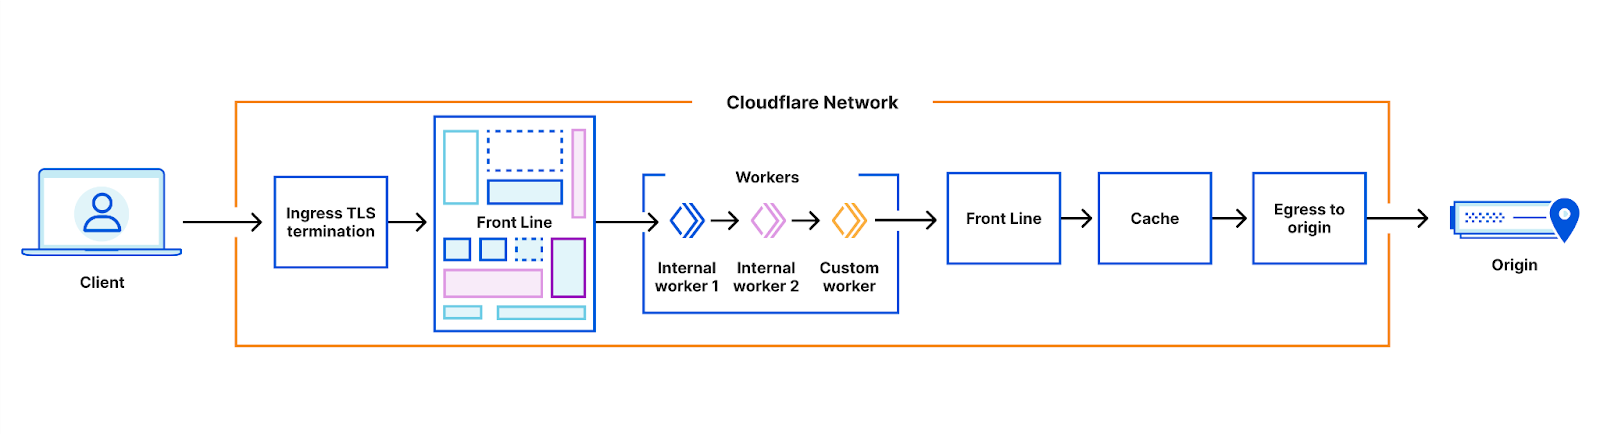
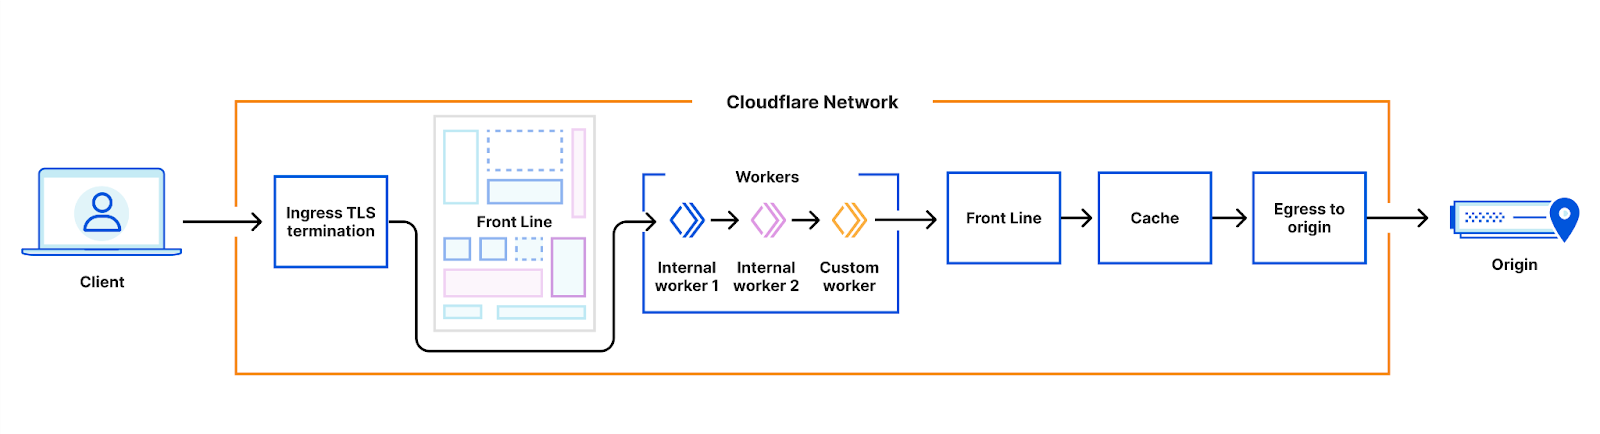
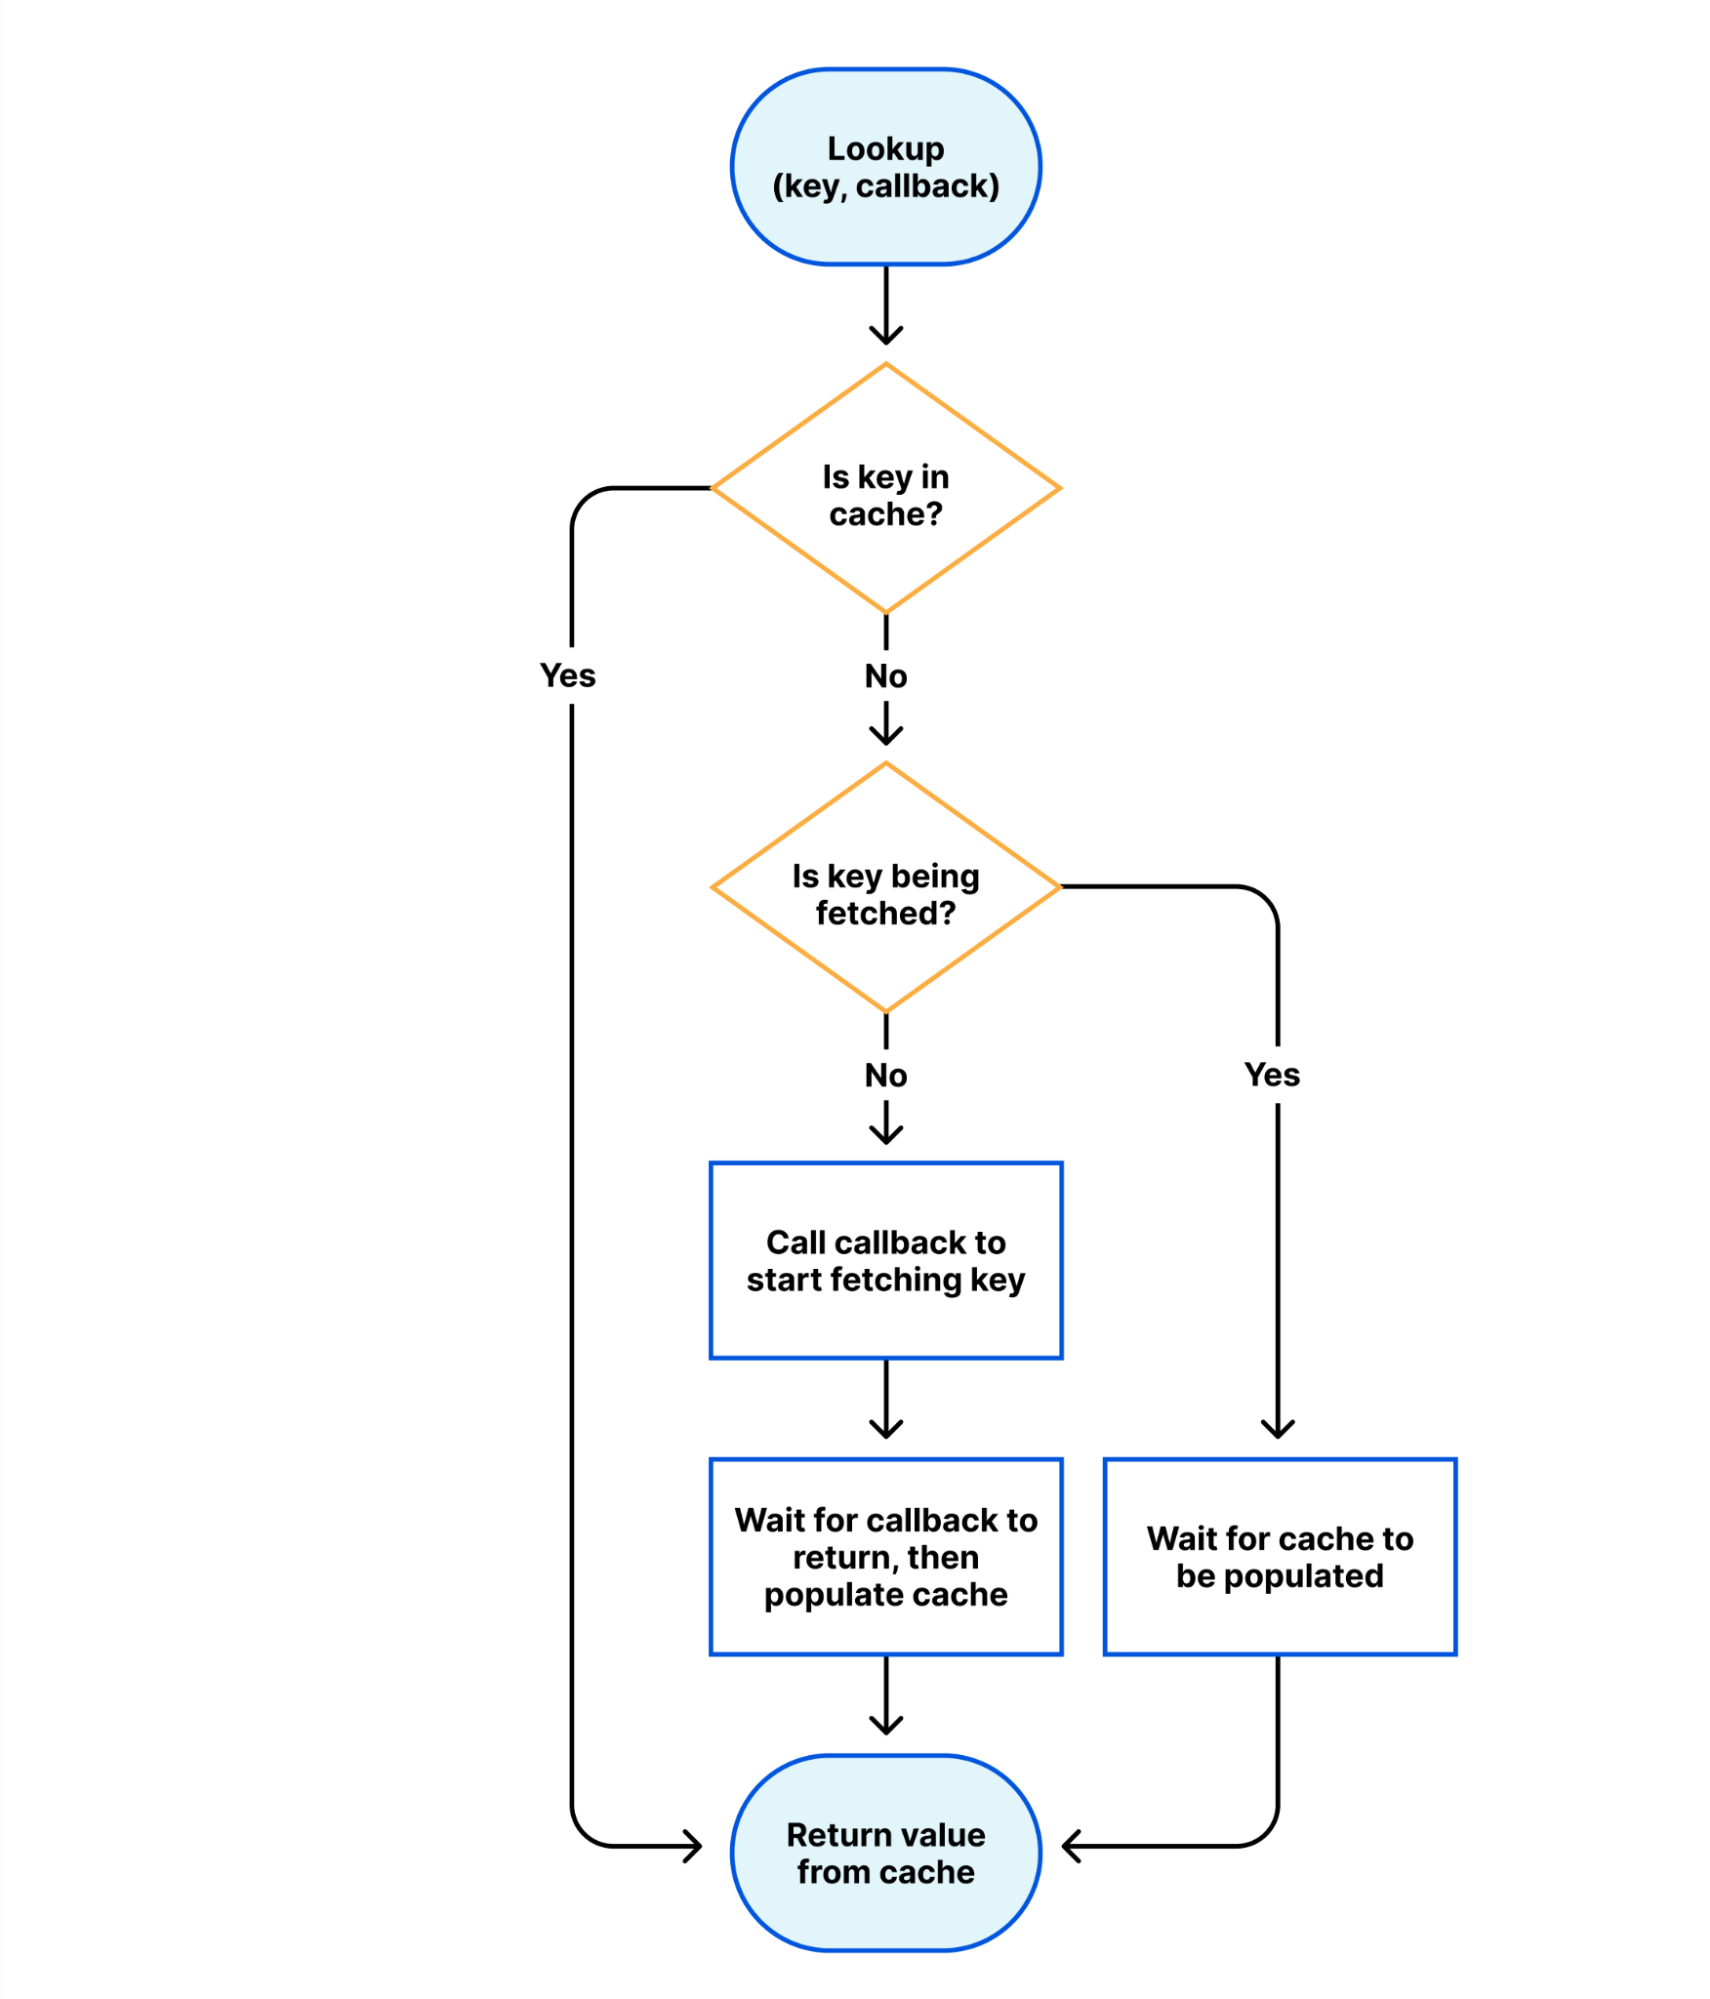
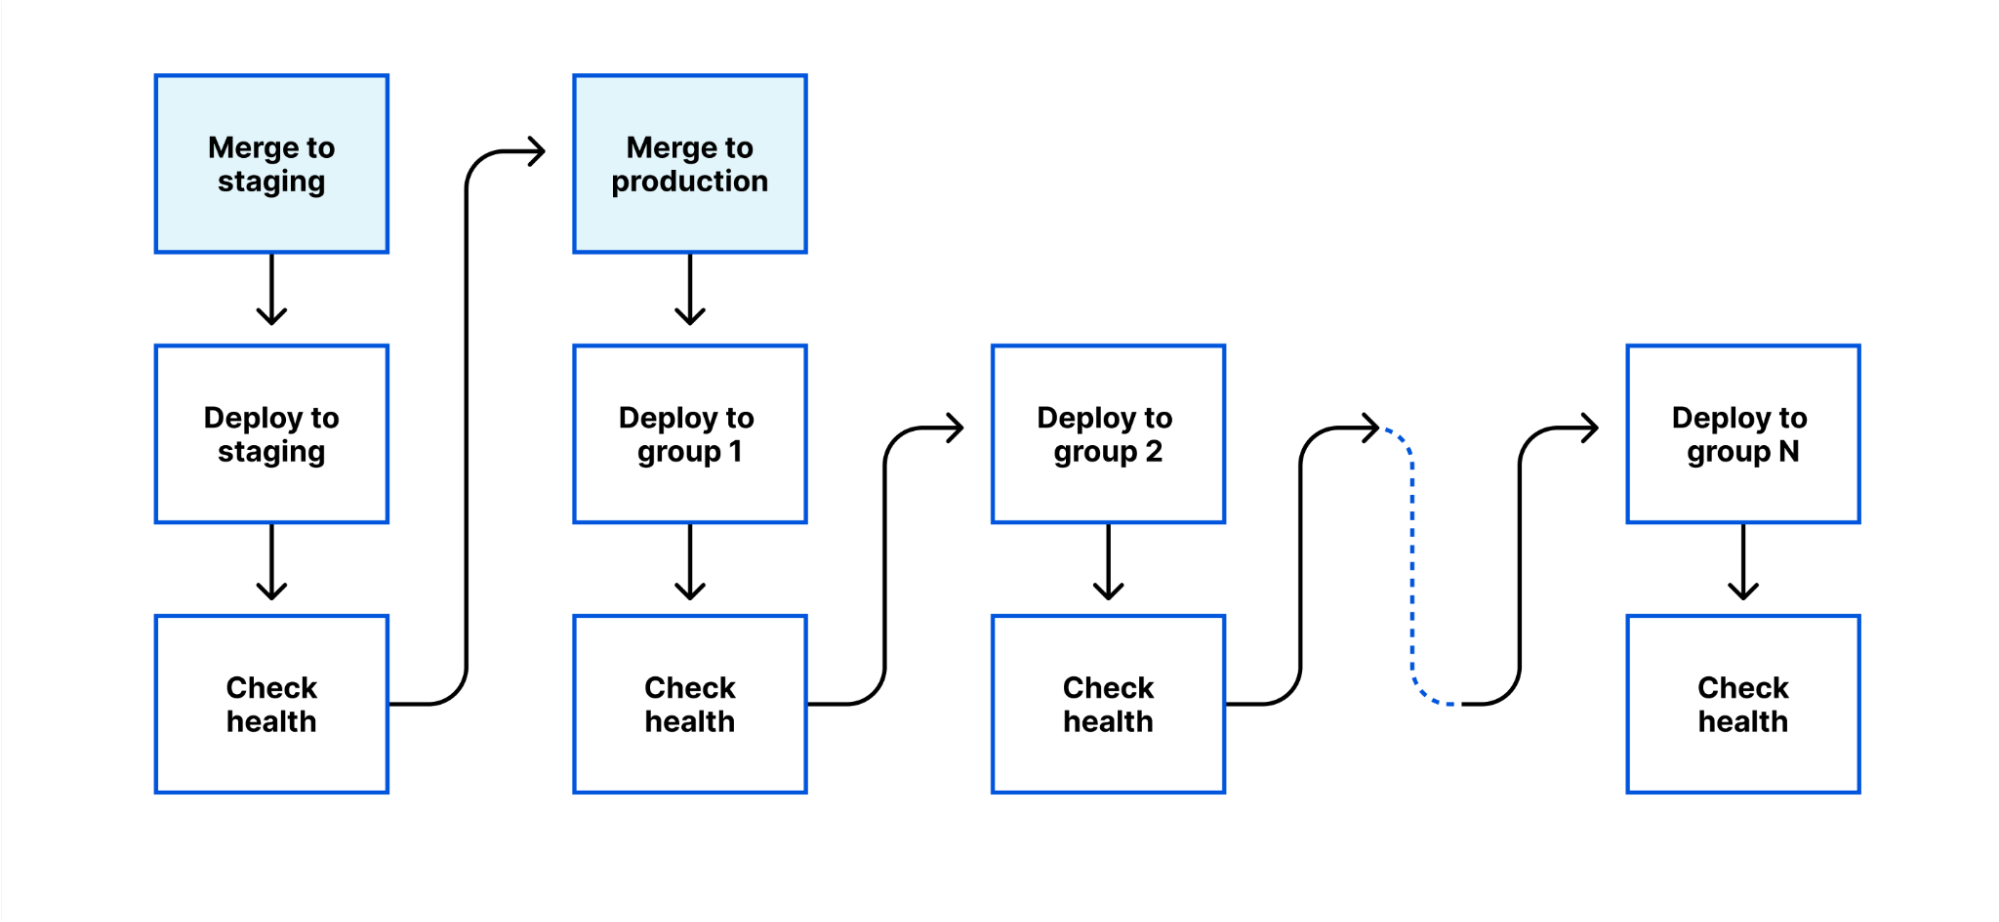


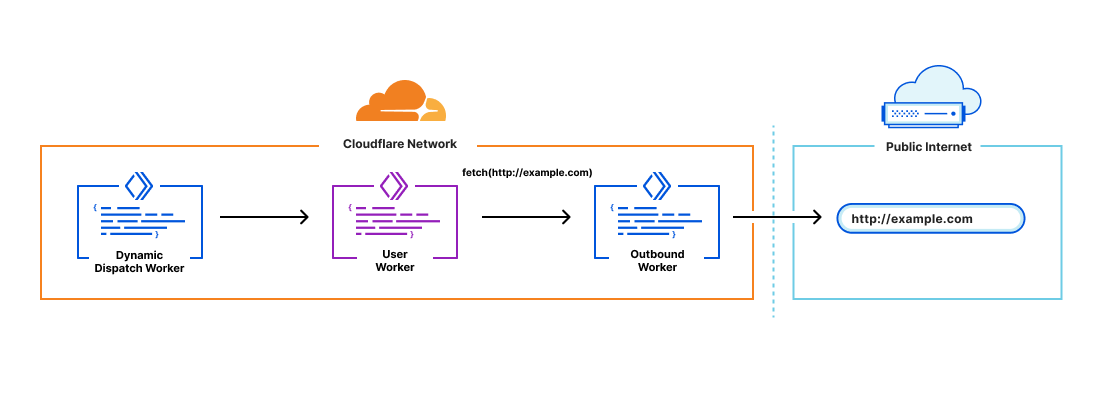


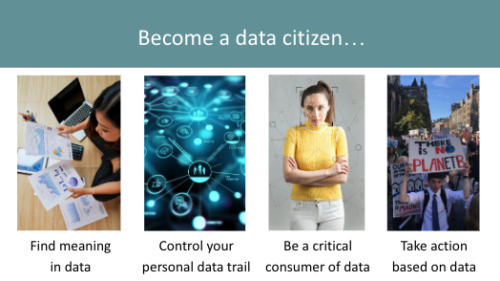

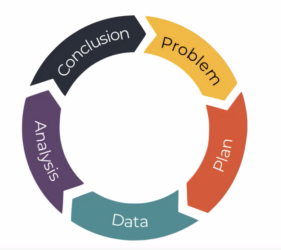


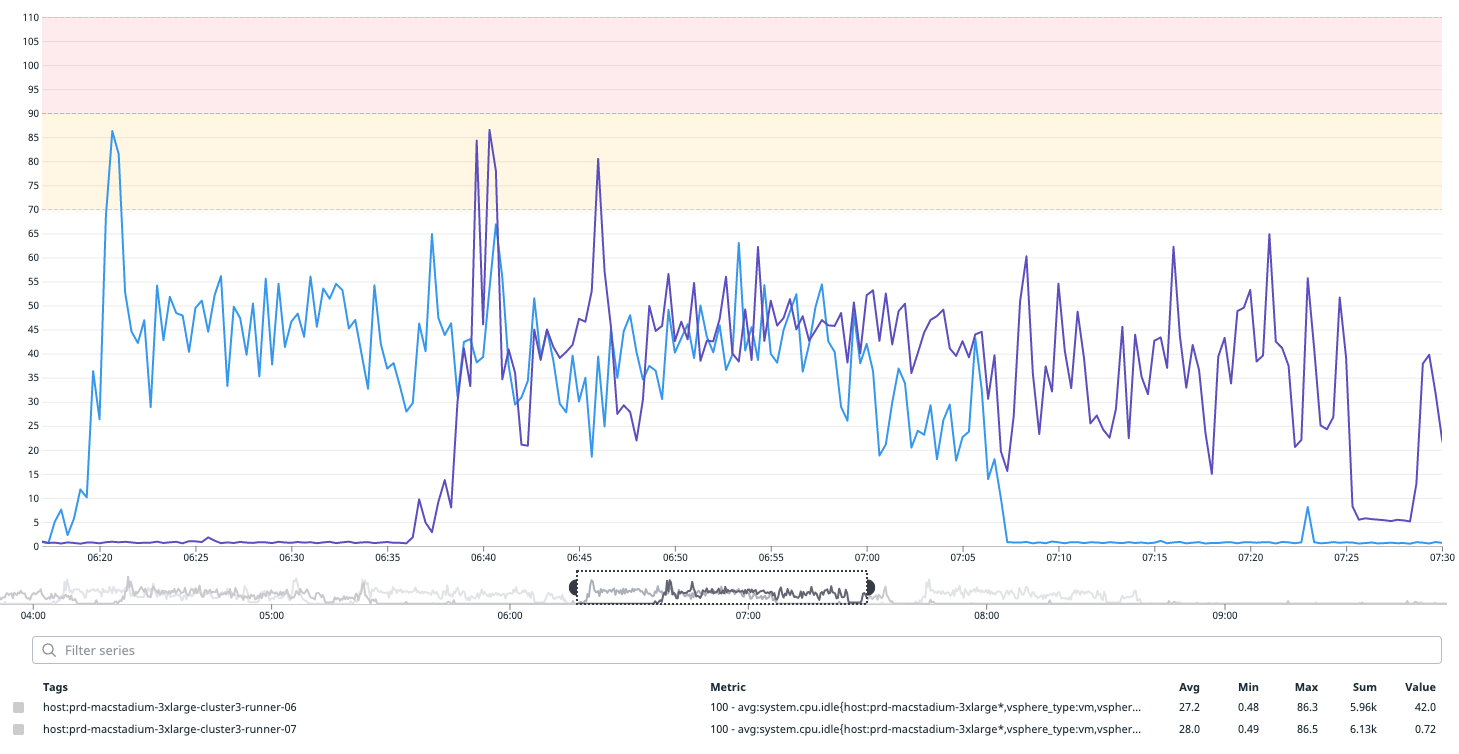
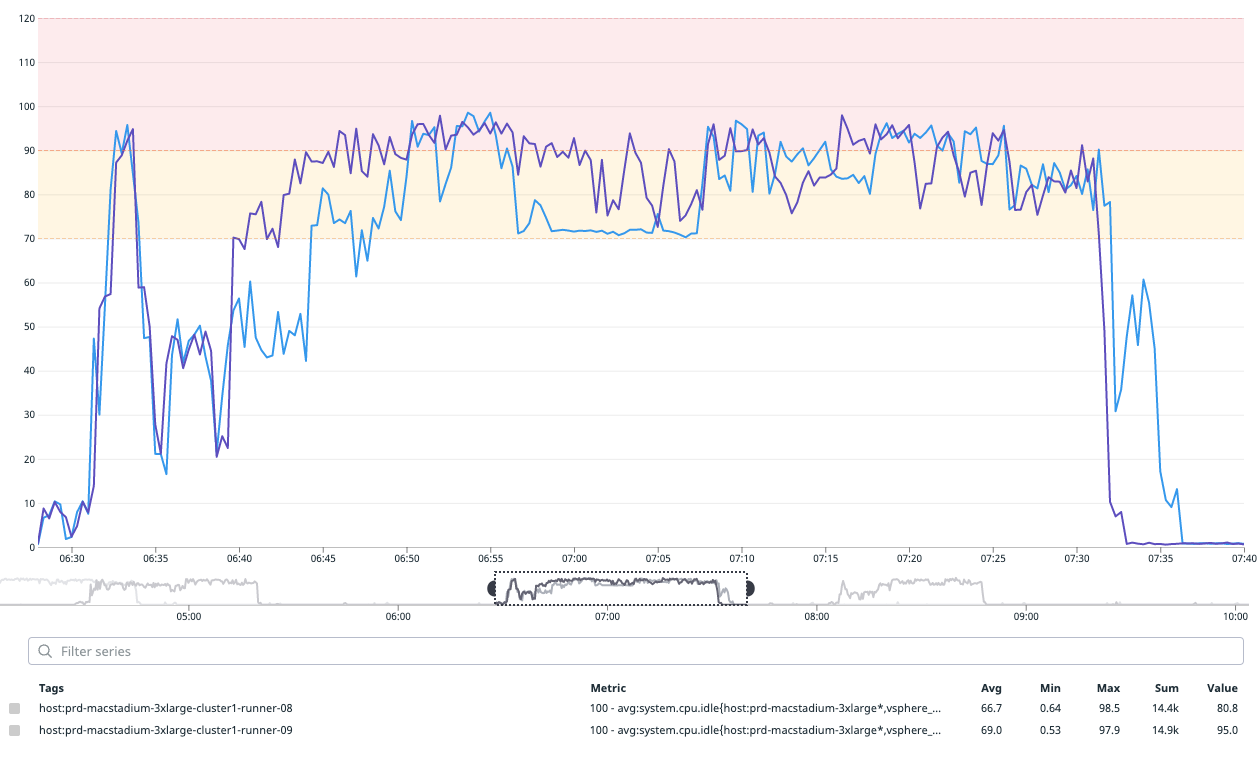
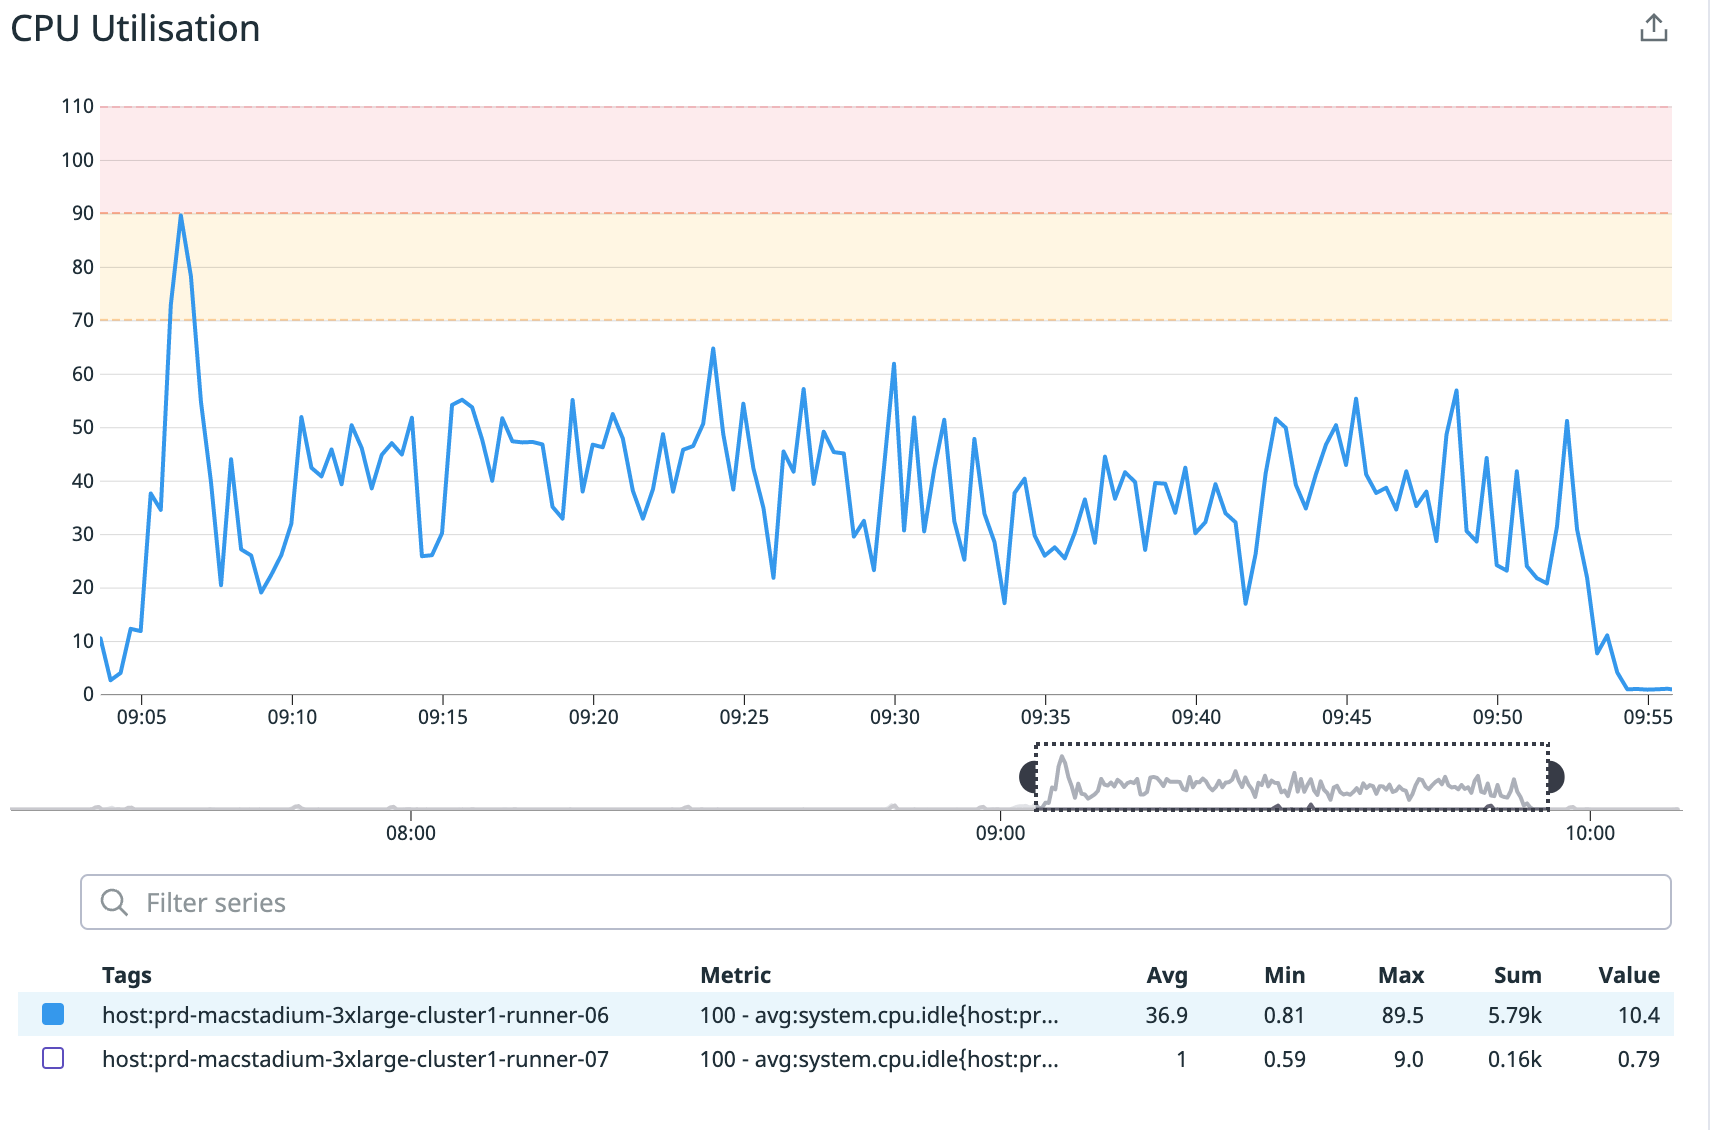

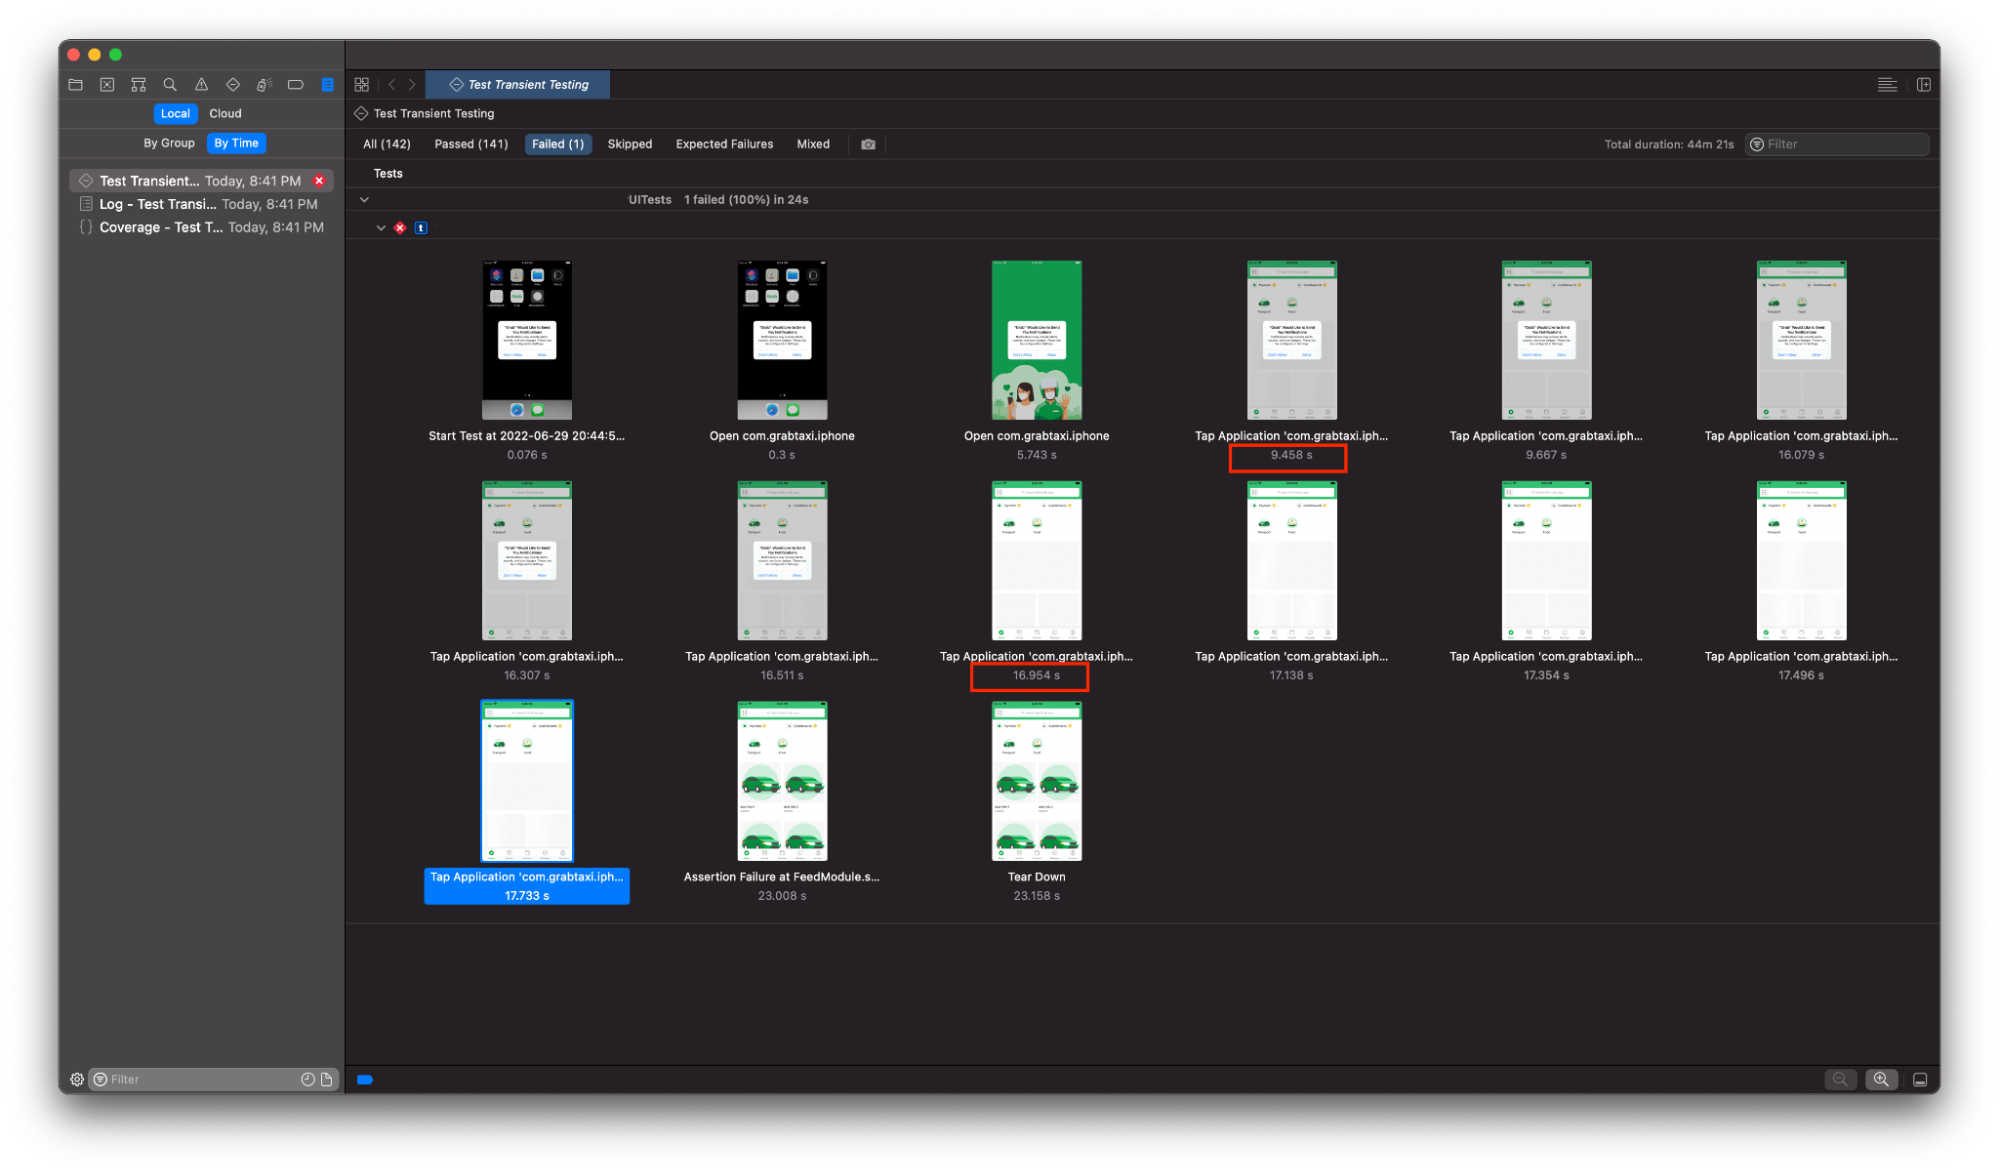
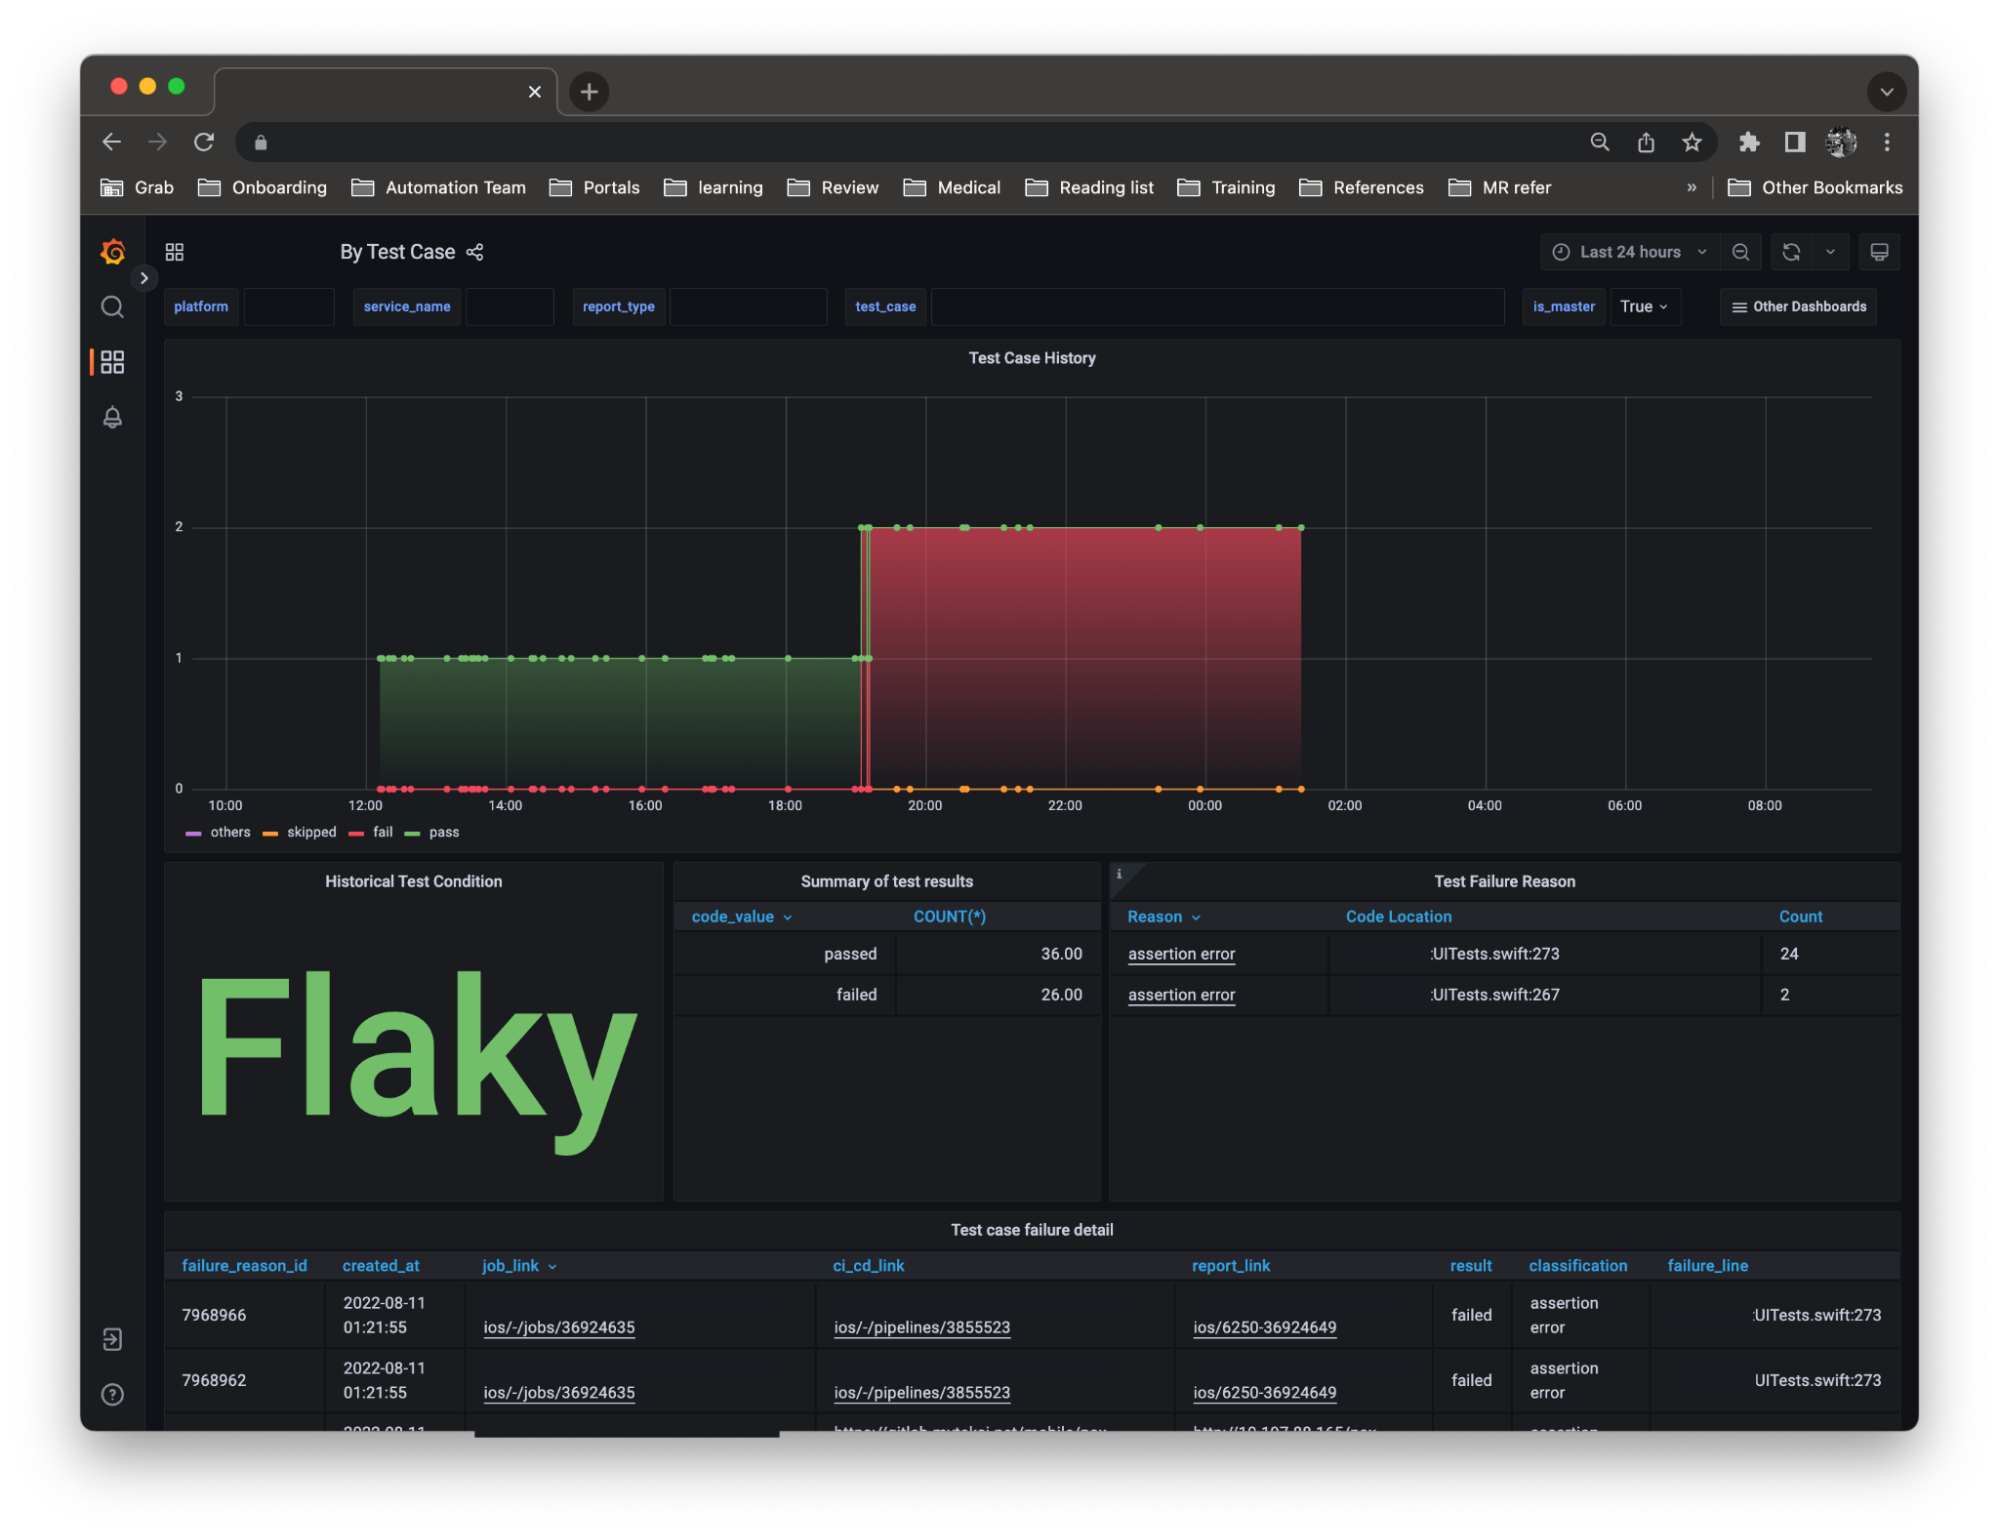

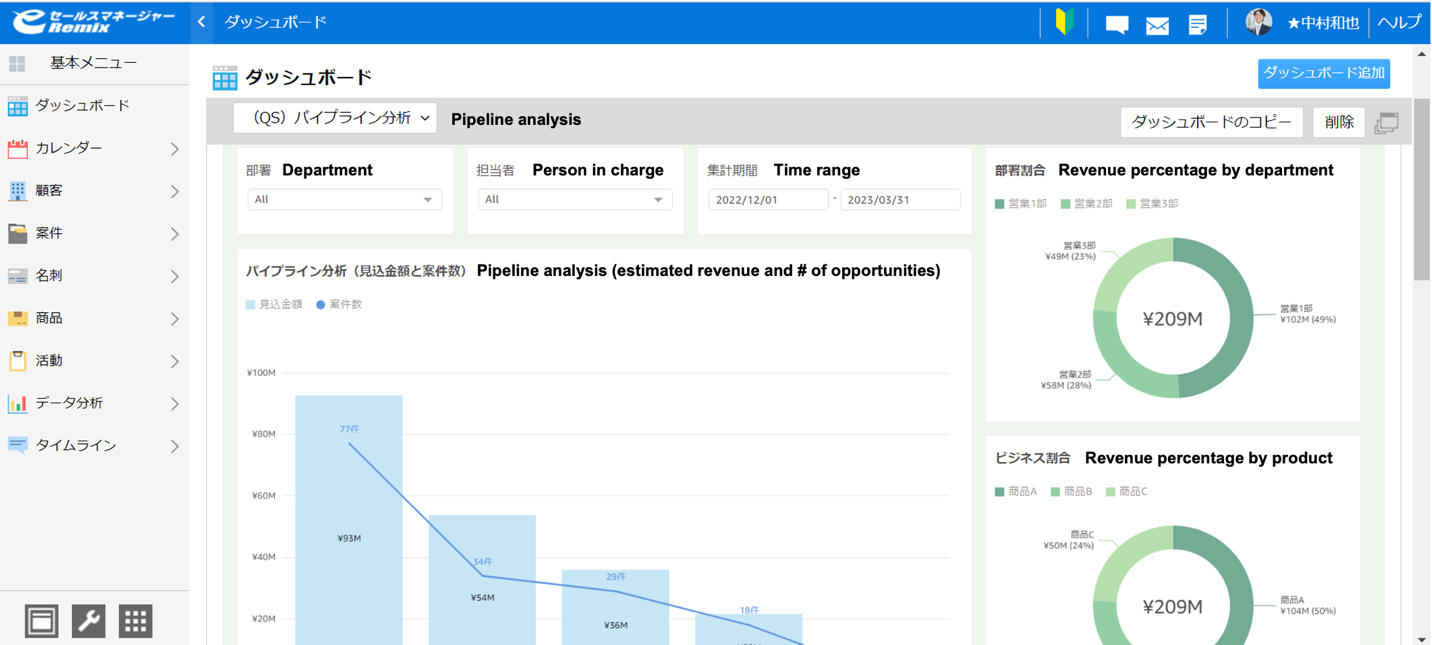

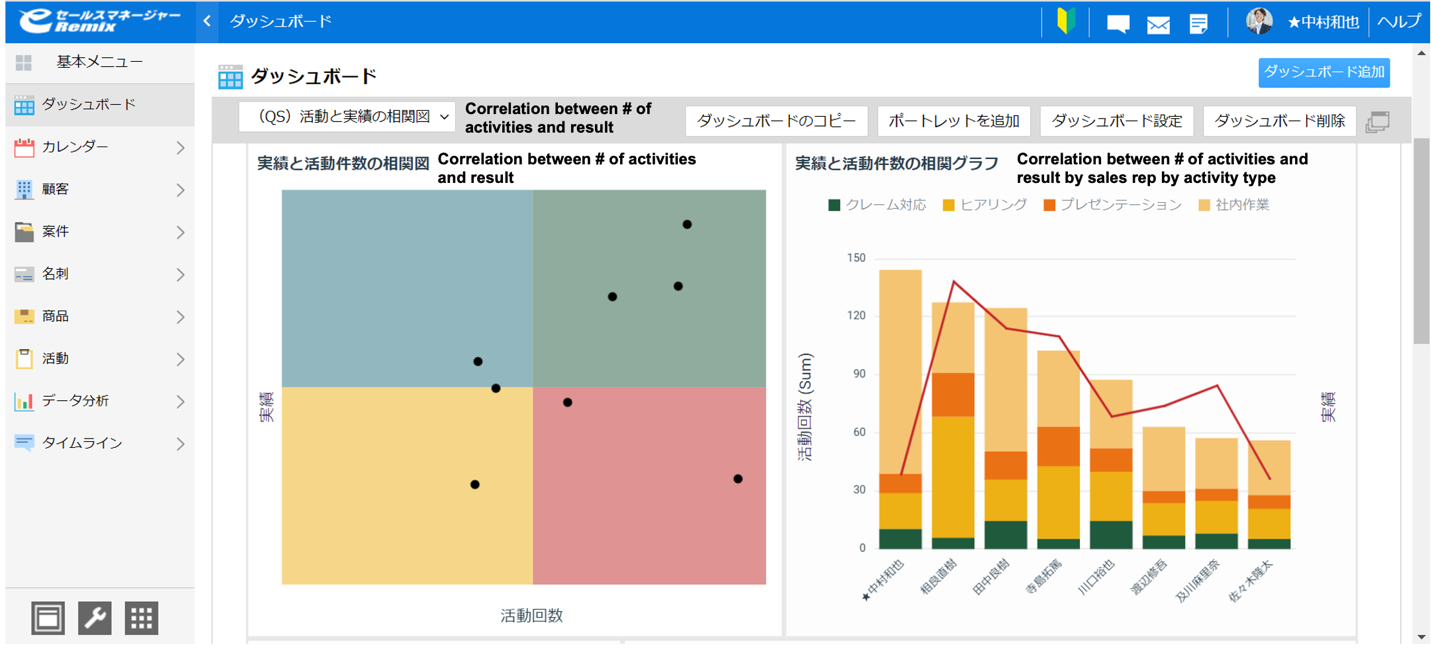
 Kenta Oda is the Chief Technology Officer at SOFTBRAIN Co., Ltd. He is in responsible of new product development with keen insight on better customer experience and go-to-market strategy.


 Manish Virwani is a Sr. Solutions Architect at AWS. He has more than a decade of experience designing and implementing large-scale big data and analytics solutions. He provides technical guidance, design advice, and thought leadership to some of the key AWS customers and partners.
 Indira Balakrishnan is a Principal Solutions Architect in the AWS Analytics Specialist SA Team. She is passionate about helping customers build cloud-based analytics solutions to solve their business problems using data-driven decisions. Outside of work, she volunteers at her kids’ activities and spends time with her family.