Tag Archives: Amazon DataZone

How Volkswagen Autoeuropa built a data mesh to accelerate digital transformation using Amazon DataZone

Post Syndicated from Dhrubajyoti Mukherjee original https://aws.amazon.com/blogs/big-data/how-volkswagen-autoeuropa-built-a-data-mesh-to-accelerate-digital-transformation-using-amazon-datazone/

This is a joint blog post co-authored with Martin Mikoleizig from Volkswagen Autoeuropa.

Volkswagen Autoeuropa is a Volkswagen Group plant that produces the T-Roc. The plant is located near Lisbon, Portugal and produces about 934 cars per day. In 2023, Volkswagen Autoeuropa represented 1.3% of the national GDP of Portugal and 4% in national export of goods impact with a sales volume of 3.3511 billion Euros. Volkswagen Autoeuropa aims to become a data-driven factory and has been using cutting-edge technologies to enhance digitalization efforts.

In this post, we discuss how Volkswagen Autoeuropa used Amazon DataZone to build a data marketplace based on data mesh architecture to accelerate their digital transformation. The data mesh, built on Amazon DataZone, simplified data access, improved data quality, and established governance at scale to power analytics, reporting, AI, and machine learning (ML) use cases. As a result, the data solution offers benefits such as faster access to data, expeditious decision making, accelerated time to value for use cases, and enhanced data governance.

Understanding Volkswagen Autoeuropa’s challenges

At the time of writing this post, Volkswagen Autoeuropa has already implemented more than 15 successful digital use cases in the context of real-time visualization, business intelligence, industrial computer vision, and AI.

Before the AWS partnership, Volkswagen Autoeuropa faced the following challenges.

  • Long lead time to access data – The digital use cases launched by Volkswagen Autoeuropa spent most of their project time getting access to the data that was relevant to their use cases. After the right data for the use case was found, the IT team provided access to the data through manual configuration. The lead time to access data was often from several days to weeks.
  • Insufficient data governance and auditing – Data was shared directly to use cases by copying it. Therefore, the IT team connected the data manually from their sources to the desired destinations multiple times. This process wasn’t centrally tracked to discover any information on the data sharing process. For example, if the data was copied in the past, how many use cases have access to the data, when access was granted, and who granted the access.
  • Redundant effort to process the same information – Because the IT team copied the data sources based on the exact use case requirements, they shared specific columns of the tables from the data. As additional use cases requested access to the same data with different column requirements, even more copies of the data were created.
  • Repeated process to establish security and governance guardrails – Each time the IT and the security team provided a connection to a new data source, they had to set up the security and governance guardrails. This required repeated manual effort.
  • Data quality issues – Because the data was processed redundantly and shared multiple times, there was no guarantee of or control over the quality of the data. This led to reduced trust in the data.
  • Absence of data catalog and metadata management – Data didn’t have any metadata associated with it, and so use cases couldn’t consume the data without further explanation from the data source owners and specialists. Furthermore, no process to discover new data existed. Similar to the consumption process, use cases would consult specialists to understand the context of the data and if it could provide value.

Envisioning a data solution for Volkswagen Autoeuropa

To address these challenges, Volkswagen Autoeuropa embarked on a bold vision. They envisioned a seamless data consumption process, similar to an online shopping experience. They envisioned a data marketplace where data users could browse and access high-quality, secure data with clear specifications, business context, and relevant attributes. This vision materialized into a project aimed at transforming data accessibility and governance as the foundation for the digital ecosystem. The vision to be realized: Data as seamless as online shopping.

In collaboration with Amazon Web Services (AWS), Volkswagen Autoeuropa joined the Enhanced Plant Onboarding Program of the Global Volkswagen Group’s Digital Production Platform (DPP EPO) strategy. Through this partnership, AWS and Volkswagen Autoeuropa created a data marketplace that significantly improved data availability.

In the discovery phase of the project, Volkswagen Autoeuropa and AWS evaluated several options to build the data solution. In the end, Volkswagen Autoeuropa chose a solution based on data mesh architecture using Amazon DataZone. Being a managed service, Amazon DataZone provided the necessary speed and agility to build the solution. At the same time, it led to higher operational efficiencies and lower operational overhead. The team adopted a data mesh architecture because the principles of the data mesh aligned with Volkswagen Autoeuropa’s vision of being a data driven factory.

Solution overview

This section describes the key features and architecture of the Volkswagen Autoeuropa data solution. The solution is based on a data mesh architecture.

Data solution features

The following figure shows the key capabilities of the Volkswagen Autoeuropa data solution.

The key capabilities of the solution are:

  • Data quality – In the solution, we’ve built a data quality framework to streamline the process of data quality checks and publishing quality scores. It uses AWS Glue Data Quality to generate recommendation rulesets, run orchestrated jobs, store results, and send notifications to users. This framework can be seamlessly integrated into AWS Glue jobs, providing a quality score for data pipeline jobs. In addition, the quality score is published in the Amazon DataZone data portal, allowing consumers to subscribe to the data based on its quality score.Assigning a quality score to the data helps build trust in the data, and shifts the responsibility of maintaining data quality to the data owner. As a result, the quality of the results delivered by these use cases improves.
  • Data registration – The producers sign in to the Amazon DataZone data portal using their AWS Identity and Access Management (IAM) credentials or single sign-on with integration through AWS IAM Identity Center. They register their data assets, which are stored in Amazon Simple Storage Service (Amazon S3), in the Amazon DataZone data catalog. The metadata of the data assets is stored in an AWS Glue catalog and made available in the business data catalog of Amazon DataZone and in the Amazon DataZone data source. The producers add business context such as business unit name, data owner contact information, and data refresh frequency using Amazon DataZone glossaries and metadata forms. In addition, they use generative AI capabilities to generate business metadata. After the business metadata is generated, they review the changes and modify the metadata if needed.Because all data products in Volkswagen Autoeuropa are now registered in the same location, the likelihood of data duplication is significantly reduced. Moreover, the data producers are improving the quality of the data by adding business context to it.
  • Data discovery – The consumers sign in to the Amazon DataZone data portal using their IAM credentials or single sign-on with integration through IAM Identity Center and search the data using keywords in the search bar. After the results are returned, they can further filter the results using glossary terms and project names. Finally, they review the business metadata of the data assets to evaluate if the data is relevant to their business use cases. They can check the quality score of the data assets and the refresh schedule for their use cases.With a data discovery capability in place, consumers can gain information about the data without the need to consult the source system owners or specialists.
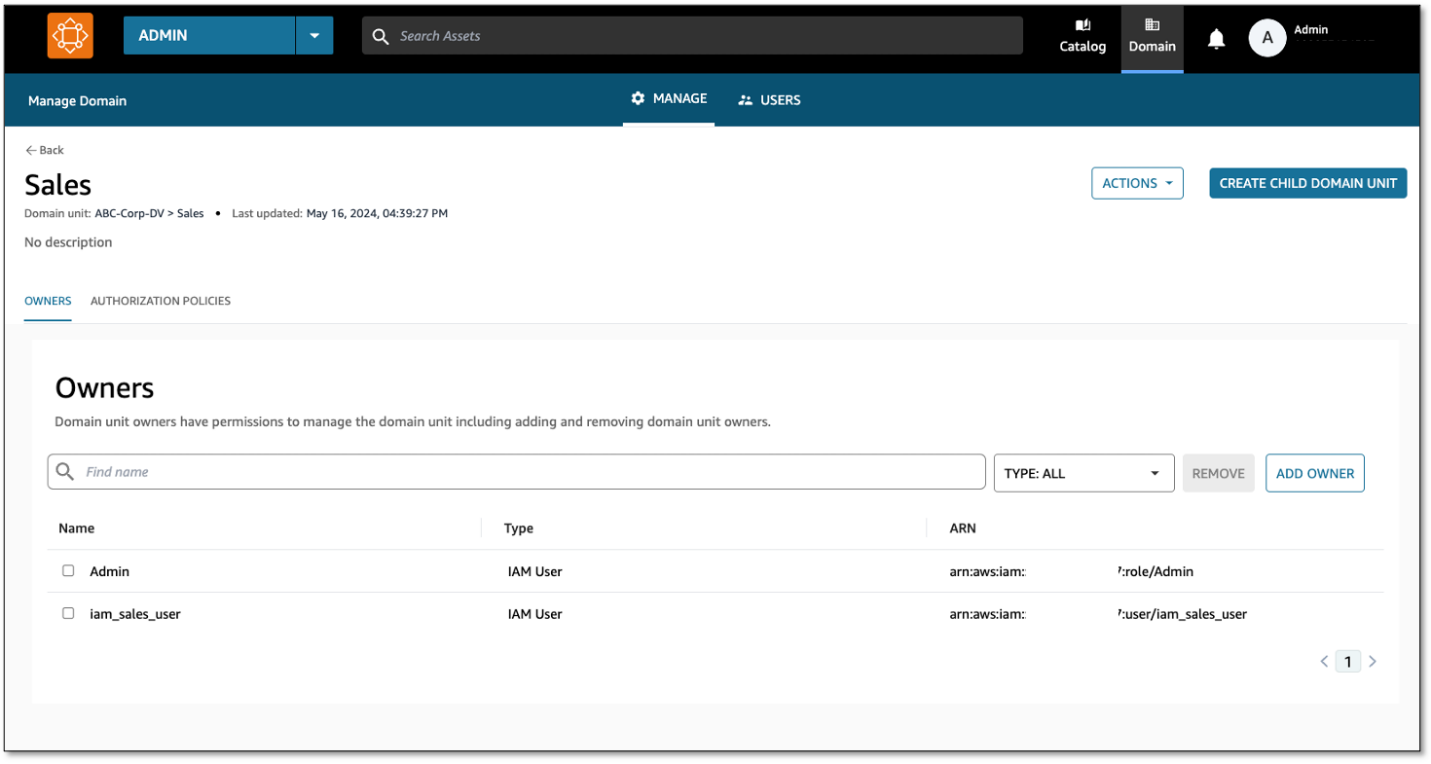
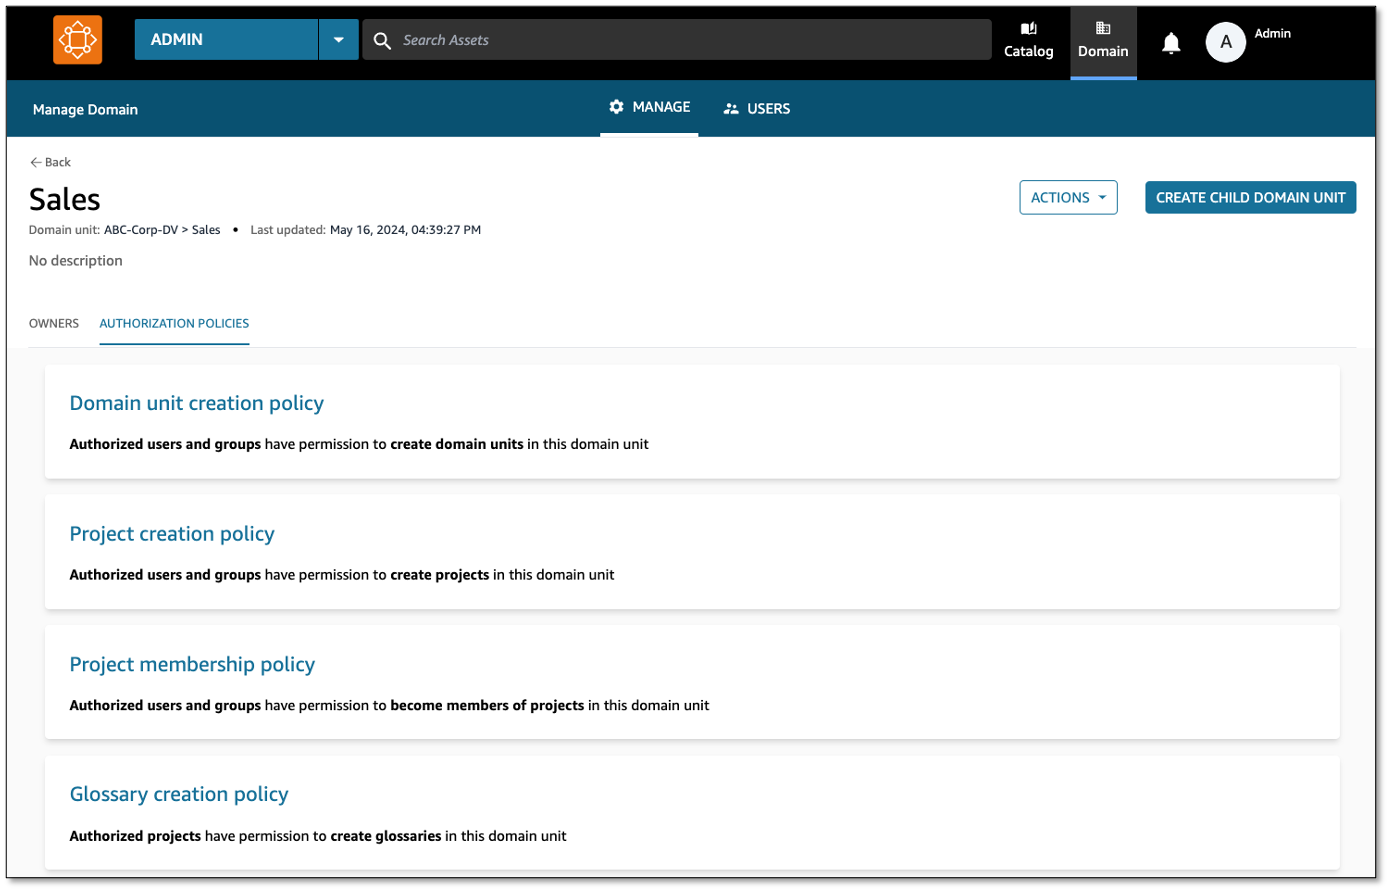
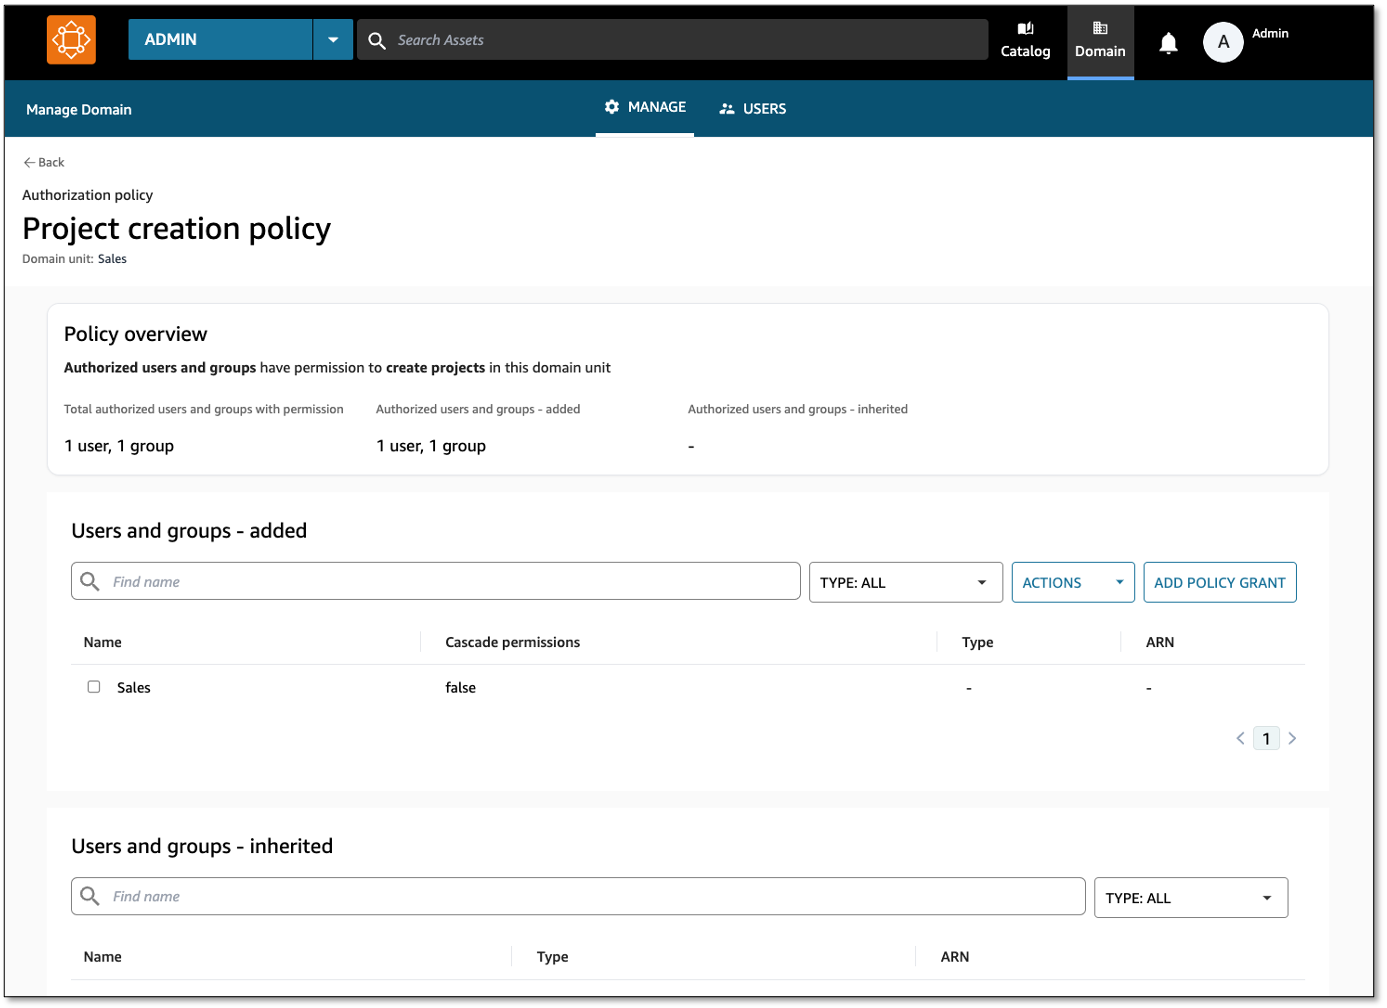
  • Data access management – When the consumers find a data asset that’s relevant to their use case, they request access to it using the subscription feature of Amazon DataZone. Data is classified as public, internal, and confidential. For public and internal data assets, the access request is automatically approved. For confidential data assets, the data producer team reviews the access request and either accepts or rejects the subscription request.With a central place to manage data access, data owners can view which use cases have access to their data and when the access request was granted. The fine-grained access control feature of Amazon DataZone gives data owners granular control of their data at the row and column levels.
  • Data consumption – Upon approval of the subscription request, Amazon DataZone provisions the backend infrastructure to make the data accessible to the corresponding consumers. After this process is complete, the consumers can access the data through Amazon Athena using the deep link feature of Amazon DataZone. The data consumption pattern in Volkswagen Autoeuropa supports two use cases:
    • Cloud-to-cloud consumption – Both data assets and consumer teams or applications are hosted in the cloud.
    • Cloud-to-on-premises consumption – Data assets are hosted in the cloud and consumer use cases or applications are hosted on-premises.

Requirements specific to a use case requires access to the relevant data assets; sharing data to use cases using Amazon DataZone doesn’t require creating multiple copies. As a result, duplication and processing of data. Furthermore, by reducing the number of copies of the data, the overall quality of the data products improves. In addition, the backend automation of Amazon DataZone to make data available to use cases reduces the manual effort and improves the lead time to access data.

  • Single collaborative environment – The Amazon DataZone data portal provides a single collaborative environment to the users in Volkswagen Autoeuropa. Data consumers such as use case owners, data engineers, data scientists, and ML engineers can browse and request access to data assets. At the same time, data producers, such as use case owners and source system owners, can publish and curate their data in the Amazon DataZone data portal. This collaborative experience promotes teamwork and accelerates the realization of business value. Furthermore, the security and governance guardrails scales across the organization as the number of use cases increases.

Data solution architecture

The following figure displays the reference architecture of the data solution at Volkswagen Autoeuropa. In the next part of the post, we discuss how we arrived at the solution.

The architecture includes:

  1. The data from SAP applications, manufacturing execution systems (MES), and supervisory control and data acquisition (SCADA) systems is ingested into the producer accounts of Volkswagen Autoeuropa.
  2. In the producer account, raw data is transformed using AWS Glue. The technical metadata of the data is stored in AWS Glue catalog. The data quality is measured using the data quality framework. The data stored in Amazon Simple Storage Service (Amazon S3) is registered as an asset in the Amazon DataZone data catalog hosted in the central governance account.
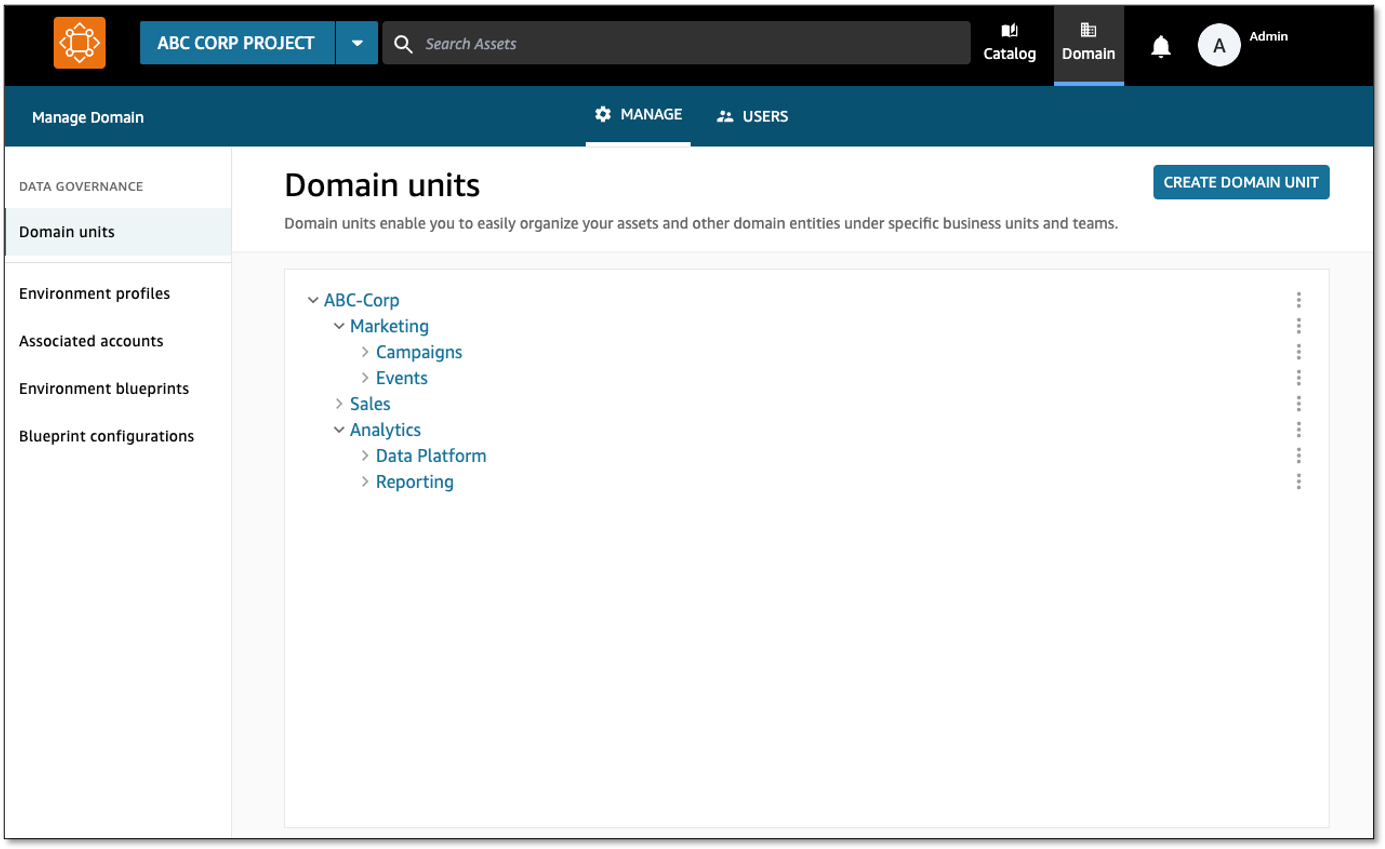
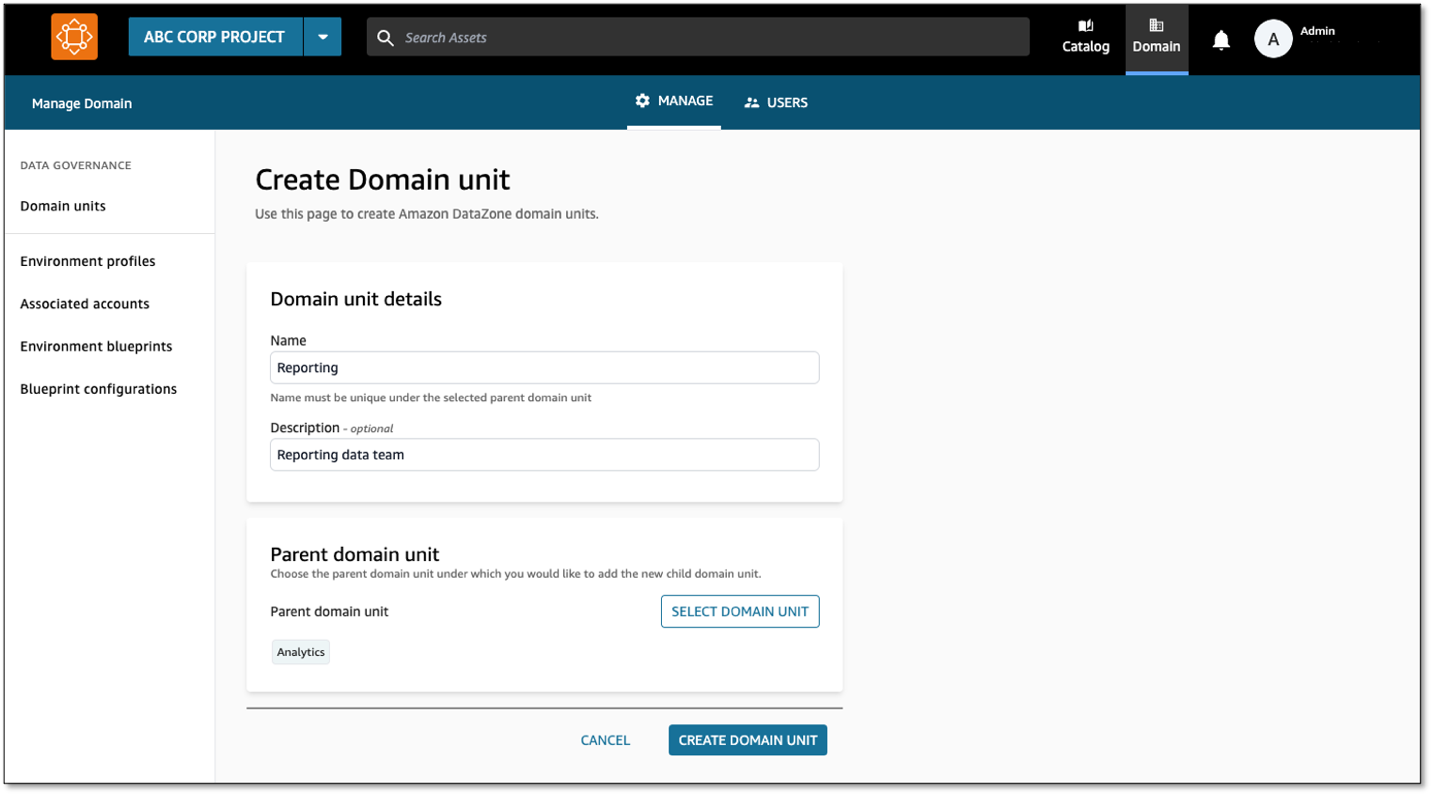
  3. The central governance account hosts the Amazon DataZone domain and the related Amazon DataZone data portal. The AWS accounts of the data producers and consumers are associated with the Amazon DataZone domain. Amazon DataZone projects belonging to the data producers and consumers are created under the related Amazon DataZone domain units.
  4. Consumers of the data products sign in to the Amazon DataZone data portal hosted in the central governance account using their IAM credentials or single sign-on with integration through IAM Identity Center. They search, filter, and view asset information (for example, data quality, business, and technical metadata).
  5. After the consumer finds the asset they need, they request access to the asset using the subscription feature of Amazon DataZone. Based on the validity of the request, the asset owner approves or rejects the request.
  6. After the subscription request is granted and fulfilled, the asset is accessed in the consumer account for a one-time query using Athena and Microsoft Power BI applications hosted on premises. This consumption pattern can be extended for AI and machine learning (AI/ML) model development using Amazon SageMaker and reporting purposes using Amazon QuickSight.

User journey

After discussing the desired system with the use case teams and stakeholders and analyzing the current workflow, Volkswagen Autoeuropa grouped the user personas of the data solution into three main categories: data producer, data consumer, and data solution administrator. This sets the foundation for the desired user experience and what’s needed to achieve the solution goals.

Data producer

Data producers create the data products in the data solution. There are two types of data producers.

  • Data source owners – Data source owners publish the raw data in the Amazon DataZone data portal. These data products are attributed as source-based data.
  • Use case owners – Use case owners publish data that’s fit for consumption by other use cases. These data products are called consumer-based data.

The following figure shows the user journey of a data producer:


A data producer’s journey includes:

  1. Identify data of interest
    1. Identify data (Volkswagen Autoeuropa network).
    2. Perform data quality checks (Volkswagen Autoeuropa network).
  2. Connect data to the data solution
    1. Ingest data into the data solution (Amazon DataZone portal).
    2. Start process to connect data using AWS Glue.
  3. Locate the data source in the data solution
    1. Register data (Amazon DataZone portal).
    2. Add data to the inventory in Amazon DataZone.
  4. Add or edit metadata
    1. Add or edit metadata (Amazon DataZone portal).
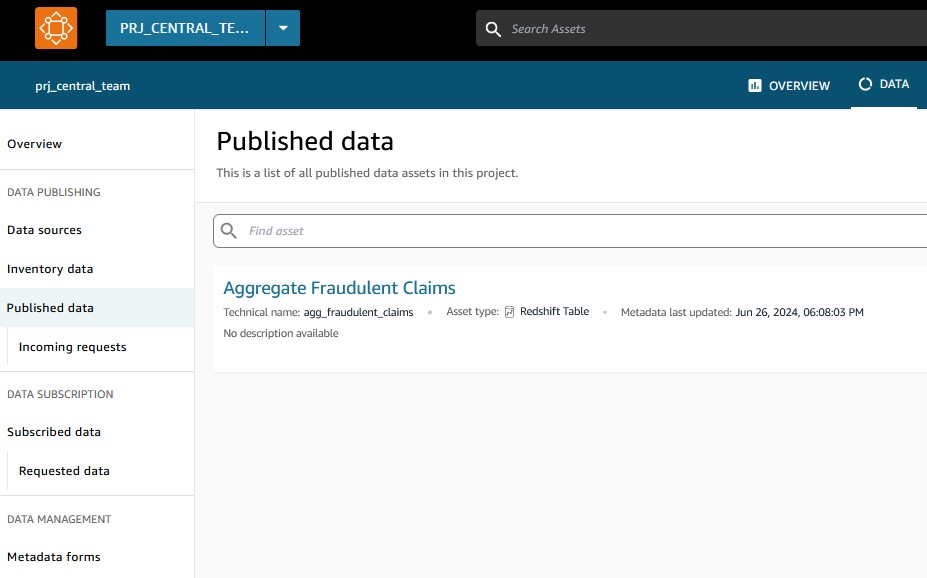
    2. Publish data assets (Amazon DataZone portal).
  5. Approve or reject subscription request
    1. Review subscription requests.
  6. Maintain data assets
    1. Manage data assets (Amazon DataZone portal).

Data consumer

Data consumers use data for business analytics, machine learning, AI, and business reporting. Data consumers are data engineers, data scientists, ML engineers, and business users. The following diagram shows the journey of a data consumer.

A data consumer’s journey includes:

  1. Access Amazon DataZone portal
    1. Amazon DataZone portal – Access is granted based on the user’s assigned domain and projects.
  2. Search for data assets
    1. Data assets in Amazon DataZone portal – Search for data and brows the results by glossary terms or the project name. Use additional filters to refine the results.
  3. View business metadata
    1. Select a data asset to see additional information – Review the description, data quality score and metadata.
  4. Request access to data (subscribe)
    1. Subscribe to request access.
    2. After the subscription request is approved, review the data products that you have access to.
    3. Query the data to view and consume the data.
  5. Retrieve additional data
    1. Repeat the steps as needed to access and retrieve additional data.

Data solution administrator

Data solution administrators are responsible for performing administrative tasks on the data solution. The following figure shows the common tasks performed by the data solution administrator.

A data administrator’s journey includes:

  1. Manage projects
    1. Manage Amazon DataZone domain.
    2. Manage Amazon DataZone projects within the domain.
  2. Manage environment
    1. Set up the environment to manage the infrastructure.
  3. Manage business metadata glossary
    1. Manage and enable Amazon DataZone glossaries and metadata forms.
  4. Manage data assets
    1. Manage assets.
    2. Query the data to view and consume the data.
  5. Manage access to data solution
    1. Monitor and revoke access when appropriate.

Conclusion

In this post, you learned how Volkswagen Autoeuropa embarked on a bold vision to become a data driven factory. It shows how this vision was put into action by building a data solution based on data mesh architecture using Amazon DataZone. It highlights the key features and architecture of the data solutions and presents the user journey. As of writing this post, Volkswagen Autoeuropa reduced the data discovery time from days to minutes using the data solution. The time to access data took several weeks before the Volkswagen Autoeuropa and AWS collaboration. Now, with the help of the data solution, the data access time has been reduced to several minutes.

In May 2024, the team achieved a major milestone by successfully offering data on the data solution and transporting it instantly to Power BI, a process that previously took several weeks.

“After one year of work, we did the full roundtrip from offering data on our new data marketplace built using Amazon DataZone to transporting it instantly to third-party tools, a process that previously took several weeks. This was a big achievement for our team.”

– Jorge Paulino, Product owner of the data solution. Volkswagen Autoeuropa.

The next post of the two-part series details discusses how we built the solution, its technical details, and the business value created.

If you want to harness the agility and scalability of a data mesh architecture and Amazon DataZone to accelerate innovation and drive business value for your organization, we have the resources to get you started. Be sure to check out the AWS Prescriptive Guidance: Strategies for building a data mesh-based enterprise solution on AWS. This comprehensive guide covers the key considerations and best practices for establishing a robust, well-governed data mesh on AWS. From aligning your data mesh with overall business strategy to scaling the data mesh across your organization, this Prescriptive Guidance provides a clear roadmap to help you succeed.

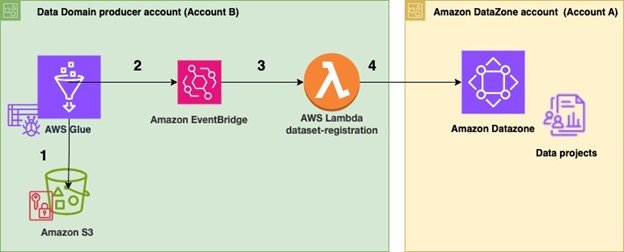
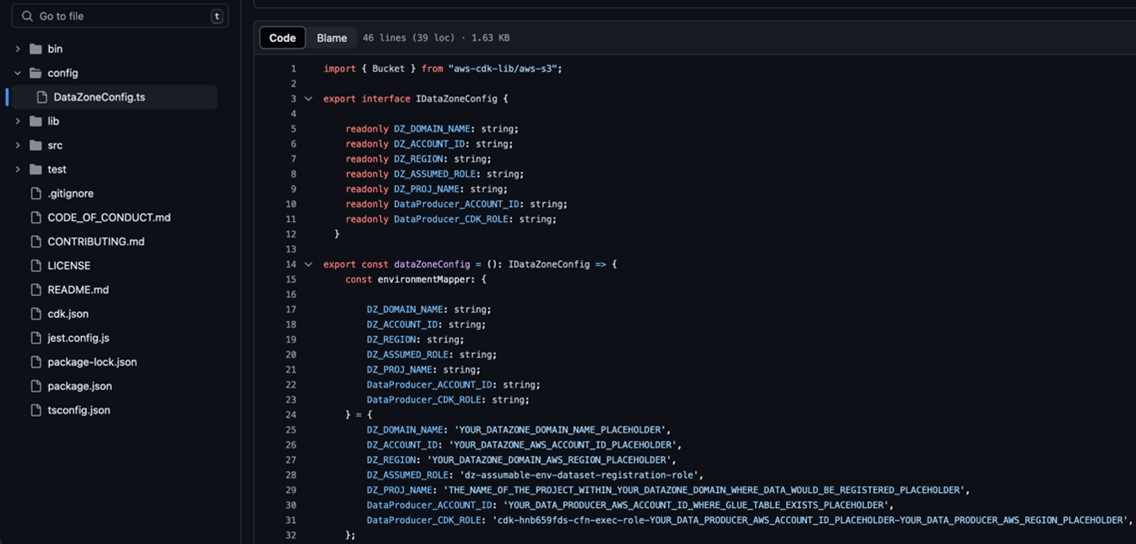
If you’re curious to get hands-on, see the GitHub repository: Building an enterprise Data Mesh with Amazon DataZone, Amazon DataZone, AWS CDK, and AWS CloudFormation. This open source project delivers a step-by-step guide to build a data mesh architecture using Amazon DataZone, AWS Cloud Development Kit (AWS CDK), and AWS CloudFormation.


About the Authors

Dhrubajyoti Mukherjee is a Cloud Infrastructure Architect with a strong focus on data strategy, data analytics, and data governance at Amazon Web Services (AWS). He uses his deep expertise to provide guidance to global enterprise customers across industries, helping them build scalable and secure AWS solutions that drive meaningful business outcomes. Dhrubajyoti is passionate about creating innovative, customer-centric solutions that enable digital transformation, business agility, and performance improvement. An active contributor to the AWS community, Dhrubajyoti authors AWS Prescriptive Guidance publications, blog posts, and open-source artifacts, sharing his insights and best practices with the broader community. Outside of work, Dhrubajyoti enjoys spending quality time with his family and exploring nature through his love of hiking mountains.

Ravi Kumar is a Data Architect and Analytics expert at Amazon Web Services; he finds immense fulfillment in working with data. His days are dedicated to designing and analyzing complex data systems, uncovering valuable insights that drive business decisions. Outside of work, he unwinds by listening to music and watching movies, activities that allow him to recharge after a long day of data wrangling.

Martin Mikoleizig studied mechanical engineering and production technology at the RWTH Aachen University before starting to work in Dr. h.c. Ing. F. Porsche AG 2015 as a production planner for the engine assembly. In several years as a Project Manager on Testing Technology for new engine models he also introduced several innovations like human-machine-collaborations and intelligent assistance systems. From 2017, he was responsible for the Shopfloor IT team of the module lines in Zuffenhausen before he became responsible for the Planning of the E-Drive assembly at Porsche. Beside this he was responsible for the Digitalisation Strategy of the Production Ressort at Porsche. Since October 2022, he has been assigned to Volkswagen Autoeuropa in Portugal in the role of a Digital Transformation Manager for the plant driving the Digital Transformation towards a Data Driven Factory.

Weizhou Sun is a Lead Architect at Amazon Web Services, specializing in digital manufacturing solutions and IoT. With extensive experience in Europe, she has enhanced operational efficiencies, reducing latency and increasing throughput. Weizhou’s expertise includes Industrial Computer Vision, predictive maintenance, and predictive quality, consistently delivering top performance and client satisfaction. A recognized thought leader in IoT and remote driving, she has contributed to business growth through innovations and open-source work. Committed to knowledge sharing, Weizhou mentors colleagues and contributes to practice development. Known for her problem-solving skills and customer focus, she delivers solutions that exceed expectations. In her free time, Weizhou explores new technologies and fosters a collaborative culture.

Shameka Almond is an Advisory Consultant at Amazon Web Services. She works closely with enterprise customers to help them better understand the business impact and value of implementing data solutions, including data governance best practices. Shameka has over a decade of wide-ranging IT experience in the manufacturing and aerospace industries, and the nonprofit sector. She has supported several data governance initiatives, helping both public and private organizations identify opportunities for improvement and increased efficiency. Outside of the office she enjoys hosting large family gatherings, and supporting community outreach events dedicated to introducing students in K-12 to STEM.

Adjoa Taylor has over 20 years of experience in industrial manufacturing, providing industry and technology consulting services, digital transformation, and solution delivery. Currently Adjoa leads Product Centric Digital Transformation, enabling customers to solve complex manufacturing problems by leveraging Smart Factory and Industry leading transformation mechanisms. Most recently driving value with AI/ML and generative AI use-cases for the plant floor. Adjoa is an experienced leader spending over 20 years of her career delivering projects in countries throughout North America, Latin America, Europe, and Asia. Through prior roles, Adjoa brings deep experience across multiple business segments with a focus on business outcome driven solutions. Adjoa is passionate about helping customers solve problems while realizing the art of the possible via the right impacting value-based solution.

Streamline AI-driven analytics with governance: Integrating Tableau with Amazon DataZone

Post Syndicated from Ramesh H Singh original https://aws.amazon.com/blogs/big-data/streamline-ai-driven-analytics-with-governance-integrating-tableau-with-amazon-datazone/

Amazon DataZone is a data management service that makes it faster and easier for customers to catalog, discover, share, and govern data stored across AWS, on premises, and from third-party sources. Amazon DataZone recently announced the expansion of data analysis and visualization options for your project-subscribed data within Amazon DataZone using the Amazon Athena JDBC driver.

Collaborating closely with our partners, we have tested and validated Amazon DataZone authentication via the Athena JDBC connection, providing an intuitive and secure connection experience for users. With this integration, you can now seamlessly query your governed data lake assets in Amazon DataZone using popular business intelligence (BI) and analytics tools, including partner solutions like Tableau.

Ali Tore, Senior Vice President of Advanced Analytics at Salesforce, highlighting the value of this integration, says

“We’re excited to partner with Amazon to bring Tableau’s powerful data exploration and AI-driven analytics capabilities to customers managing data across organizational boundaries with Amazon DataZone. This integration enables our customers to seamlessly explore data with AI in Tableau, build visualizations, and uncover insights hidden in their governed data, all while leveraging Amazon DataZone to catalog, discover, share, and govern data across AWS, on premises, and from third-party sources—enhancing both governance and decision-making.”

With this launch, Amazon DataZone strengthens its commitment to empowering enterprise customers with secure, governed access to data across the tools and platforms they rely on. For example, Guardant Health uses Amazon DataZone to democratize data access across its organization, enabling diverse teams to efficiently access, query, and analyze data tailored to their specific needs.

Rajesh Kucharlapati, Senior Director of Data, CRM, and Analytics at Guardant Health, says

“By harmonizing data across multiple business domains, we foster a culture of data sharing. Using Amazon DataZone lets us avoid building and maintaining an in-house platform, allowing our developers to focus on tailored solutions. Leveraging AWS’s managed service was crucial for us to access business insights faster, apply standardized data definitions, and tap into generative AI potential. We also needed an easy connection process for widely-used analytics tools like Tableau, DBeaver, and Domino, directly within Amazon DataZone projects. This new JDBC connectivity feature enables our governed data to flow seamlessly into these tools, supporting productivity across our teams.”

Use case

Amazon DataZone addresses your data sharing challenges and optimizes data availability. Here’s how:

  • Data product creation – As a data producer, you can create and catalog data products while enforcing governance, making your data findable, accessible, interoperable, and reusable (FAIR).
  • Streamlined access – As a data consumer, you can easily locate and subscribe to data from multiple sources within a single project. You can analyze this data using a variety of tools, including built-in AWS options such as Amazon Athena, Amazon Redshift, and Amazon SageMaker.
  • Integration with partner tools – The addition of support for partner analytics tools offers you greater flexibility and efficiency in your workflows. You can now use your tool of choice, including Tableau, to quickly derive business insights from your data while using standardized definitions and decentralized ownership. Refer to the detailed blog post on how you can use this to connect through various other tools.

Prerequisites

To get started, complete these steps:

  1. Download and install the latest Athena JDBC driver for Tableau.
  2. Copy the JDBC connection string from the Amazon DataZone portal into the JDBC connection configuration to establish a connection from Tableau. This will direct you to authenticate using single sign-on with your corporate credentials.

When you’re connected, you can query, visualize, and share data—governed by Amazon DataZone—within Tableau.

The following diagram shows the high-level architecture of the Tableau integration.

Solution walkthrough: Configure Tableau to access project-subscribed data assets

To configure Tableau to access project-subscribed data assets, follow these detailed steps:

  1. Download the latest Athena driver. If Tableau has the Athena driver preinstalled, it could be the older (v2) version. To confirm compatibility with Amazon DataZone, you’ll need the latest (v3) driver that includes the necessary authentication features. To download the latest JDBC driver version x, visit Athena JDBC 3.x driver.
  2. Install the driver. Copy the JDBC driver file to the appropriate folder for your operating system:
    • For macOS: ~/Library/Tableau/Drivers
    • For Windows: C:\Program Files\Tableau\Drivers
  3. On the Amazon DataZone console, select your project, as shown in the following screenshot of DataZone Console.
  4. To capture the JDBC connection parameters, follow these steps:
    1. On the project page, review the connection options under ANALYTICS TOOLS. Choose Connect with JDBC.
    2. In the JDBC parameters dialog box, select Using IDC auth and copy the JDBC URL. Optionally, you can use Using IAM auth to connect with your Amazon DataZone project as an AWS Identity and Access Management (IAM) role (from a server), provided that you are added as a project member within that project. The following screenshot shows the dialog box.
  5. To configure the Tableau desktop for connection, follow these steps:
    1. On the To a Server connection menu, select Other Databases (JDBC).
    2. Paste the copied JDBC URL into the URL field, leaving the other fields (Dialect, Username, Password) unchanged.
  6. To sign in with single sign-on, choose Sign in, as shown in the following screenshot. You’ll be redirected to authenticate with AWS IAM Identity Center. Use the credentials for your AWS single sign-on account.
  7. After you’re signed in, you’ll be prompted to authorize the DataZoneAuthPlugin. Choose Allow access to authorize access to Amazon DataZone from Tableau, as shown in the following screenshot.
  8. After the connection is established, a success message will appear, as shown in the following screenshot.

You can now view your project’s subscribed data directly within Tableau and build dashboards.

Conclusion

Amazon DataZone continues to expand its offerings, providing you with more flexibility in how you access, analyze, and visualize your subscribed data. With support for the Athena JDBC driver, you can now use a wide range of popular BI and analytics tools including Tableau, making governed data within Amazon DataZone more accessible than ever before.

In this post, you learned how the recent enhancements in Amazon DataZone facilitate a seamless connection with Tableau. By integrating Tableau with the comprehensive data governance capabilities of Amazon DataZone, we’re empowering data consumers to quickly and seamlessly explore and analyze their governed data. This integration helps organizations break down silos, foster collaboration, and make informed decisions, all while maintaining the security and control needed in today’s complex, distributed data landscape.

The feature is supported in all AWS commercial Regions where Amazon DataZone is currently available. Check out the video below and the detailed blog post to learn how to connect Amazon DataZone to external analytics tools via JDBC. Get started with our technical documentation.

Related blog posts


About the Authors

Ramesh H Singh is a Senior Product Manager Technical (External Services) at AWS in Seattle, Washington, currently with the Amazon DataZone team. He is passionate about building high-performance ML/AI and analytics products that enable enterprise customers to achieve their critical goals using cutting-edge technology. Connect with him on LinkedIn.

Adiascar Cisneros is a Tableau Senior Product Manager based in Atlanta, GA. He focuses on the integration of the Tableau Platform with AWS services to amplify the value users get from our products and accelerate their journey to valuable, actionable insights. His background includes analytics, infrastructure, network security, and migrations. Follow him on LinkedIn.

Joel Farvault is Principal Specialist SA Analytics for AWS with 25 years’ experience working on enterprise architecture, data governance and analytics, mainly in the financial services industry. Joel has led data transformation projects on fraud analytics, claims automation, and Master Data Management. He leverages his experience to advise customers on their data strategy and technology foundations.

Yogesh Dhimate is a Sr. Partner Solutions Architect at AWS, leading technology partnership with Tableau. Prior to joining AWS, Yogesh worked with leading companies including Salesforce driving their industry solution initiatives. With over 20 years of experience in product management and solutions architecture Yogesh brings unique perspective in cloud computing and artificial intelligence.

Ariana Rahgozar is a Sr. Senior Solutions Architect at AWS, leading customers design and implement technical solutions as part of their cloud journey.

Expanding data analysis and visualization options: Amazon DataZone now integrates with Tableau, Power BI, and more

Post Syndicated from Ramesh H Singh original https://aws.amazon.com/blogs/big-data/expanding-data-analysis-and-visualization-options-amazon-datazone-now-integrates-with-tableau-power-bi-and-more/

Amazon DataZone  now launched authentication supports through the  Amazon Athena JDBC driver, allowing data users to seamlessly query their subscribed data lake assets via popular business intelligence (BI) and analytics tools like Tableau, Power BI, Excel, SQL Workbench, DBeaver, and more. This integration empowers data users to access and analyze governed data within Amazon DataZone using familiar tools, boosting both productivity and flexibility.

Customers use Amazon DataZone to streamline data access and governance by enabling data users to locate and subscribe to data from multiple sources within a single project. Amazon DataZone natively integrates with Amazon-specific options like Amazon Athena, Amazon Redshift, and Amazon SageMaker, allowing users to analyze their project governed data. With this launch of JDBC connectivity, Amazon DataZone expands its support for data users, including analysts and scientists, allowing them to work in their preferred environments—whether it’s SQL Workbench, Domino, or Amazon-native solutions—while ensuring secure, governed access within Amazon DataZone.

Collaborating closely with our partners, we have tested and validated Amazon DataZone authentication via the Athena JDBC connection, providing an intuitive and secure connection experience for users. With this integration, you can now seamlessly query your governed data lake assets in Amazon DataZone using popular business intelligence (BI) and analytics tools, including partner solutions like Tableau.

Ali Tore, Senior Vice President of Advanced Analytics at Salesforce, highlighting the value of this integration, says

“We’re excited to partner with Amazon to bring Tableau’s powerful data exploration and AI-driven analytics capabilities to customers managing data across organizational boundaries with Amazon DataZone. This integration enables our customers to seamlessly explore data with AI in Tableau, build visualizations, and uncover insights hidden in their governed data, all while leveraging Amazon DataZone to catalog, discover, share, and govern data across AWS, on premises, and from third-party sources—enhancing both governance and decision-making.”

With this launch, Amazon DataZone strengthens its commitment to empowering enterprise customers with secure, governed access to data across the tools and platforms they rely on. For example, Guardant Health uses Amazon DataZone to democratize data access across its organization, enabling diverse teams to efficiently access, query, and analyze data tailored to their specific needs.

Rajesh Kucharlapati, Senior Director of Data, CRM, and Analytics at Guardant Health, says

“By harmonizing data across multiple business domains, we foster a culture of data sharing. Using Amazon DataZone lets us avoid building and maintaining an in-house platform, allowing our developers to focus on tailored solutions. Leveraging AWS’s managed service was crucial for us to access business insights faster, apply standardized data definitions, and tap into generative AI potential. We also needed an easy connection process for widely-used analytics tools like Tableau, DBeaver, and Domino, directly within Amazon DataZone projects. This new JDBC connectivity feature enables our governed data to flow seamlessly into these tools, supporting productivity across our teams.”

Getting started

To get started, download and install the latest Athena JDBC driver for your tool of choice. After installation, copy the JDBC connection string from the Amazon DataZone portal into the JDBC connection configuration to establish a connection from your tool. This will direct you to authenticate using single sign-on (SSO) with your corporate credentials. After connecting, you can query, visualize, and share data—governed by Amazon DataZone—within the tools you already know and trust.

In this post, we’ll guide you through connecting various analytics tools to Amazon DataZone using the Athena JDBC driver, enabling seamless access to your subscribed data within your Amazon DataZone projects.

Solution overview

To demonstrate these capabilities, consider a use case where your marketing team wants to drive a campaign that’s focused on product adoption. To achieve this, you need access to sales orders, shipment details, and customer data owned by the retail team. The retail team, acting as the data producer, publishes the necessary data assets to Amazon DataZone, allowing you, as a consumer, to discover and subscribe to these assets.

After the subscription is approved, the data assets become available within your marketing team’s project environment in Amazon DataZone. You can then use your preferred tool (for example, DBeaver, as shown in the following diagram) to perform data exploration.

Prerequisites

To follow along with this post, you need to have the following prerequisites in place:

  1. AWS account – You must have an active AWS account. If you don’t have one, see How do I create and activate a new AWS account?.
  2. Amazon DataZone resources – You need a domain for Amazon DataZone, an Amazon DataZone project, and a new Amazon DataZone project environment (DefaultDataLake environment with a DataLakeProfile).
  3. Publish data assets – As the data producer from the retail team, you must ingest individual data assets into Amazon DataZone. For this use case, create a data source and import the technical metadata of four data assets—customers, order_items, orders, products, reviews, and shipments—from AWS Glue Data Catalog. Ensure the data assets are enriched with business descriptions and published to the catalog.
  4. Subscribe data assets – As a data analyst from the marketing team, you must discover and subscribe to the data assets. The data producer from the retail team will review and approve your subscription. Upon successful fulfillment, the data assets will be added to your data lake environment. For detailed subscription instructions, see the Amazon DataZone User Guide.

The following figure shows the subscribed assets added to the data lake environment in your marketing project.

In the following sections, we will walk you through the steps to configure DBeaver to consume the subscribed assets from Amazon DataZone.

Configuring DBeaver to access subscribed data assets

In this section, you configure DBeaver to access the subscribed assets from the Marketing project

To configure DBeaver:

  1. Connect with JDBC: In the Amazon DataZone portal, navigate to the Marketing project, select the Environments tab and select Connect with JDBC.
    1. Select Marketing from the list in the top navigation are.
    2. Choose Environments
    3. Select Connect with JDBC.

  1. A new screen will display the JDBC connection parameters. Make sure to capture these details for configuring the database connection in DBeaver, including the JDBC URL, Domain ID, Environment ID, Region, and IDC Issuer URL.
  2. Download and install the latest Athena driver:
    • If DBeaver has the Athena driver pre-installed, it might be the older (v2) version. To ensure compatibility with Amazon DataZone, you need the latest driver (v3), which includes the necessary authentication features.
    • Download the latest JDBC driver—version 3.x.
    • To install the latest driver:
      • Go to Database and then to Driver Manager in DBeaver.
      • Select the Athena driver and choose Edit.
      • Choose Download to fetch the latest driver version.
      • If prompted, select the appropriate version and confirm the download.
  1. In the DBeaver SQL client, create a new database connection and select the Athena driver.
  2. In the Driver Properties section, enter the parameters that you captured from Amazon DataZone:
    • CredentialsProvider: The credentials provider to authenticate requests to AWS
    • DataZoneDomainId: The ID of your Amazon DataZone domain
    • DataZoneDomainRegion: The AWS Region where your domain is hosted.
    • DataZoneEnvironmentId: The ID of your DefaultDataLake environment.
    • IdentityCenterIssuerUrl: The issuer URL used by AWS IAM Identity Center for token issuance.
    • OutputLocation: Amazon S3 path for storing query results.
    • Region: The Region where the environment is created.
    • Workgroup: Amazon Athena workgroup of the environment.

  1. Choose Test connection.
  2. You will be redirected to the IAM Identity Center sign-in portal. Sign in with your credentials. If you’re already signed in through single sign-on (SSO), this step will be skipped.
  3. After you sign in, you will be prompted to authorize the DataZoneAuthPlugin. Choose Allow access to authorize access to Amazon DataZone from DBeaver.
  4. After the connection is established, a success message will appear as shown in the screenshot
  5. You can now view and query all subscribed assets directly within DBeaver.

These steps might also apply to other analytics tools and clients that support JDBC connections. If you’re using a different tool, you might need to adapt these instructions accordingly to ensure proper configuration and access to Amazon DataZone data assets.

Integration with other applications

You can use similar steps for other BI and analytics tools that support standard database connections.

Connect to Tableau Desktop

Use the Athena JDBC driver to connect Tableau to Amazon DataZone and visualize your subscribed data.

To connect to Tableau Desktop:

  1. Make sure that you’re using the latest Athena JDBC 3.x driver.
  2. Copy the JDBC driver file and place it in the appropriate folders for your operating system
    • For Mac OS: ~/Library/Tableau/Drivers
    • For Windows: C:\Program Files\Tableau\Drivers 
  3. Open Tableau Desktop. From the To a Server connection menu, select Other Databases (JDBC) to connect to Amazon DataZone.
  4. Paste the JDBC connection string you copied from the DataZone portal into the URL Leave other fields such as Dialect, Username, and Password blank and choose Sign in.
  5. This will redirect you to authenticate with IAM Identity Center. Enter the credentials of the Identity Center user that you used to sign in to the DataZone portal. Authorize the DataZoneAuthPlugin to access Amazon DataZone from Tableau. Once the connection is established with the success message, you now view your project’s subscribed data directly within Tableau and build dashboards.

See the Amazon DataZone and Tableau blog post for step-by-step instructions.

Connect to Microsoft Power BI

Now, let’s look at connecting Amazon DataZone with Microsoft Power BI on Windows.

While Amazon Athena provides a native ODBC driver for connecting to ODBC-compatible tools like Microsoft Power BI, it currently doesn’t support Amazon DataZone authentication. Therefore, in this post, we will use an ODBC-JDBC bridge to connect Amazon DataZone with Microsoft Power BI using the Athena JDBC driver, which supports DataZone authentication.

In this post, we’re using the ZappySys driver as the ODBC-JDBC bridge. This is a third-party solution that requires a separate licensing fee, which isn’t included in the AWS solution. You can choose to use any other solution for ODBC-JDBC bridge.

To connect to Power BI:

  1. Make sure that you have administrator privileges to run the ODBC Data Source Administrator.
  2. From the Windows Start menu, run the ODBC Data Source Administrator (the 64-bit version) using run as Administrator.
  3. Create a New Data Source with the ZappySys JDBC Bridge Driver. You will be prompted to enter your connection details.
  4. Paste the JDBC URL you copied from the DataZone portal in the Connection String, along with the driver class and JDBC driver file. Make sure that you’re using the latest Athena JDBC 3.x driver.
  5. Choose Test Connection. A new dialog window will pop up after the connection is successful.
  6. After configuring the data source, launch Power BI. Create a blank report or use an existing report to integrate the new visuals. Choose Get Data and select the name of the data source you created. This will open a new browser window to authenticate your credentials. Allow access to authorize the DataZone plugin. After authorization is complete, you can build your reports in Microsoft Power BI with the subscribed data assets.

Connect to SQL Workbench

Discover how SQL Workbench can connect to Amazon DataZone for users who prefer a SQL interface to query data lake tables and views subscribed through projects in Amazon DataZone.

To connect to SQL Workbench

  1. Make sure that you’re using the latest Athena JDBC 3.x driver.
  2. Open SQL Workbench/J and choose Manage Drivers.
  3. Select the option to add a new driver. Enter a name for it, such as DatazoneAthenaJDBC, and import the driver you downloaded in the previous steps.
  4. Create a new connection and enter a name it, such as datazone-profile. In the Driver option, select the driver you configured.
  5. For the URL, enter the string jdbc:athena://region=us-east-1; (In the example, the Virginia Region is being used). Choose Extended Properties.
  6. Under Extended Properties, add the following parameters that you copied from the DataZone portal and choose OK. You can also include these parameters in the JDBC (URL) connection string.

    1. The parameters to add are:
      • Workgroup
      • DataZoneEndpointOverride
      • OutputLocation
      • DataZoneDomainId
      • IdentityCenterIssuerURL
      • CredentialsProvider
      • DatazoneEnvironmentId
      • DataZoneDomainRegain

  1. You will be prompted to sign in and authenticate. Allow access and authorization to Amazon DataZone.
  2. After successful connection, in SQL Workbench/J, under Database Explorer, select the desired database. For example, select the database that has access to the subscribed data asset orders. Select the data asset and execute the query.

Cleanup

To ensure no additional charges are incurred after testing, be sure to delete the Amazon DataZone domain. See Delete Amazon DataZone domains for instructions.

Conclusion

Amazon DataZone continues to expand its offerings, providing you with more flexibility to access, analyze, and visualize your subscribed data. With support for the Athena JDBC driver, you can now use a wide range of popular BI and analytics tools, making data accessed through Amazon DataZone more accessible than ever before. Whether you’re using Tableau, Power BI, or other familiar tools, the integration with Amazon DataZone ensures that your data remains secure and accessible to authorized users.

The feature is supported in all AWS commercial Regions where Amazon DataZone is currently available. Watch the video below to learn how to connect Amazon DataZone to external analytics tools via JDBC. Get started with our technical documentation.


About the Authors

Ramesh H Singh is a Senior Product Manager Technical (External Services) at AWS in Seattle, Washington, currently with the Amazon DataZone team. He is passionate about building high-performance ML/AI and analytics products that enable enterprise customers to achieve their critical goals using cutting-edge technology. Connect with him on LinkedIn.

Eric Fleishman is a software engineer at AWS in Seattle. He loves diving into cloud technology and solving complex problems to build impactful solutions. Outside of work, he is all about staying active—whether its snowboarding down the slopes or working out. He enjoys pushing his limits and embracing new challenges.

Theo Tolv is a Senior Analytics Architect based in Stockholm, Sweden. He’s worked with small and big data for most of his career, and has built applications running on AWS since 2008. In his spare time he likes to tinker with electronics and read space opera.

Joel Farvault is Principal Specialist SA Analytics for AWS with 25 years’ experience working on enterprise architecture, data governance and analytics, mainly in the financial services industry. Joel has led data transformation projects on fraud analytics, claims automation, and Master Data Management. He leverages his experience to advise customers on their data strategy and technology foundations.

Lakshmi Nair is a Senior Analytics Specialist Solutions Architect at AWS. She specializes in designing advanced analytics systems across industries. She focuses on crafting cloud-based data platforms, enabling real-time streaming, big data processing, and robust data governance.

Fabricio Hamada is a Senior Data Strategy Solutions Architect at AWS.

Lionel Pulickal is Sr. Solutions Architect at AWS

Demystify data sharing and collaboration patterns on AWS: Choosing the right tool for the job

Post Syndicated from Ramakant Joshi original https://aws.amazon.com/blogs/big-data/demystify-data-sharing-and-collaboration-patterns-on-aws-choosing-the-right-tool-for-the-job/

Data is the most significant asset of any organization. However, enterprises often encounter challenges with data silos, insufficient access controls, poor governance, and quality issues. Embracing data as a product is the key to address these challenges and foster a data-driven culture.

In this context, the adoption of data lakes and the data mesh framework emerges as a powerful approach. By decentralizing data ownership and distribution, enterprises can break down silos and enable seamless data sharing. Cataloging data, making the data searchable, implementing robust security and governance, and establishing effective data sharing processes are essential to this transformation. AWS offers services like AWS Data Exchange, AWS Glue, AWS Clean Rooms and Amazon DataZone to help organizations unlock the full potential of their data.

Personas

Let’s identify the various roles involved in the data sharing process.

First of all, there are data producers, which might include internal teams/systems, third-party producers, and partners. The data consumers include internal stakeholders/systems, external partners, and end-customers. At the core of this ecosystem lies the enterprise data platform. When considering enterprises, numerous personas come into play:

  • Line of business users – These personas need to classify data, add business context, collaborate effectively with other lines of business, gain enhanced visibility into business key performance indicators (KPIs) for improved outcomes, and explore opportunities for monetizing data
  • Partners – Partners should be able to share data, collaborate with other partners and customers.
  • Data scientists and business analysts – These personas should be able to access the data, analyze it and generate actionable business insights
  • Data engineers – Data engineers are tasked with building the proper data pipeline and cataloging the data that meets the diverse needs of stakeholders, including business analysts, data scientists, partners, and line of business users
  • Data security and governance officers – Data security involves making sure producers and consumers have appropriate access to the data, implementing right access permissions, and maintaining compliance with industry regulations, particularly in highly regulated sectors like healthcare, life sciences, and financial services. This persona is also responsible for enhancing data governance by tracking lineage, and establishing data mesh policies

Choosing the right tool for the job

Now that you have identified the various personas, it’s important to select the appropriate tools for each role:

  • Starting with the producers, if your data source includes a software as a service (SaaS) platform, AWS Glue offers options to automate data flows between software service providers and AWS services.
  • For producers seeking collaboration with partners, AWS Clean Rooms facilitates secure collaboration and analysis of collective datasets without the need to share or duplicate underlying data.
  • When dealing with third-party data sources, AWS Data Exchange simplifies the discovery, subscription, and utilization of third-party data from a diverse range of producers or providers. As a producer, you can also monetize your data through the subscription model using AWS Data Exchange.
  • Within your organization, you can democratize data with governance, using Amazon DataZone, which offers built-in governance features.
  • For SaaS consumers, AWS Glue supports bidirectional transfer and serves both as a producer and consumer tool for various SaaS providers.

Let’s briefly describe the capabilities of the AWS services we referred above:

AWS Glue is a fully managed, serverless, and scalable extract, transform, and load (ETL) service that simplifies the process of discovering, preparing, and loading data for analytics. It provides data catalog, automated crawlers, and visual job creation to streamline data integration across various data sources and targets.

AWS Data Exchange enables you to find, subscribe to, and use third-party datasets in the AWS Cloud. It also provides a platform through which a data producer can make their data available for consumption for subscribers. It is a data marketplace featuring over 300 providers offering thousands of datasets accessible through files, Amazon Redshift tables, and APIs. This service supports consolidated billing and subscription management, offering you the flexibility to explore 1,000 free datasets and samples. You don’t need to set up a separate billing mechanism or payment method specifically for AWS Data Exchange subscriptions.

AWS Clean Rooms is designed to assist companies and their partners in securely analyzing and collaborating on collective datasets without revealing or sharing underlying data. You can swiftly create a secure data clean room, fostering collaboration with other entities on the AWS Cloud to derive unique insights for initiatives such as advertising campaigns or research and development. This service protects underlying data through a comprehensive set of privacy-enhancing controls and flexible analysis rules tailored to specific business needs.

Amazon DataZone is a data management service that makes it fast and straightforward to catalog, discover, share, and govern data stored across AWS, on-premises, and third-party sources. With Amazon DataZone, administrators and data stewards who oversee an organization’s data assets can manage and govern access to data using fine-grained controls. These controls are designed to grant access with the right level of privileges and context. Amazon DataZone makes it straightforward for engineers, data scientists, product managers, analysts, and business users to access data throughout an organization so they can discover, use, and collaborate to derive data-driven insights.

Use cases

Let’s review some example use cases to understand how these diverse services can be effectively applied within a business context to achieve the desired outcomes. In this particular scenario, we focus on a company named AnyHealth, which operates in the healthcare and life sciences sector. This company encompasses multiple lines of businesses, specializing in the sale of various scientific equipment. Three key requirements have been identified:

  • Sales and customer visibility by line of business – AnyHealth wants to gain insights into the sales performance and customer demands specific to each line of business. This necessitates a comprehensive view of sales activities and customer requirements tailored to individual lines of business.
  • Cross-organization supply chain and inventory visibility – The company faces challenges related to supply chain and inventory management, especially in global crisis situations like a pandemic. They want to address instances where inventory items are idle in one line of business while there is demand for the same items in another. To overcome this, they want to establish cross-organizational visibility of supply chain and inventory data, breaking down silos and achieving prompt responses to business demands.
  • Cross-sell and up-sell opportunities – AnyHealth intends to boost sales by implementing cross-selling and up-selling strategies. To achieve this, they plan to use machine learning (ML) models to extract insights from data. These insights will then be provided to sales representatives and resellers, enabling them to identify and capitalize on opportunities effectively.

In the following sections, we discuss how to address each requirement in more detail and the AWS services that best fit each solution.

Sales and customer visibility by line of business

The first requirement involves obtaining visibility into sales and customer demand by line of business. The key consumers of this data include line of business leaders, business analysts, and various other business stakeholders.

The initial step is to ingest sales and order data into the platform. Currently, this data is centralized in the ERP system, specifically SAP. The objective is to regularly retrieve this data and capture any changes that occur. The data engineers are instrumental in building this pipeline. Given that we are dealing with a SaaS integration, AWS Glue is the logical choice for seamless data ingestion.

Next, we focus on building the enterprise data platform where the accumulated data will be hosted. This platform will incorporate robust cataloging, making sure the data is easily searchable, and will enforce the necessary security and governance measures for selective sharing among business stakeholders, data engineers, analysts, security and governance officers. In this context, Amazon DataZone is the optimal choice for managing the enterprise data platform.

As stated earlier, the first step involves data ingestion. Data is ingested from a third-party vendor SaaS solution (SAP), and the data engineer uses AWS Glue. Utilizing the SAP data connector, the data engineer establishes a connection with the SAP environment, running scheduled jobs.

The data lands in Amazon Simple Storage Service (Amazon S3). Additional AWS Glue jobs are created to transform and curate the data. The curated data is placed in a designated bucket and AWS Glue crawlers are run to catalog the data. This cataloged data is then managed through Amazon DataZone.

In Amazon DataZone, the data security officer creates the corporate domain. She/he creates producer projects and enables access to data engineers, and business analysts. Data engineers ensure sales and customer data is available from the source into the Amazon DataZone project. Business analysts enhance the data with business metadata/glossaries and publish the same as data assets or data products. The data security officer sets permissions in Amazon DataZone to allow users to access the data portal. Users can search for assets in the Amazon DataZone catalog, view the metadata assigned to them, and access the assets.

Amazon Athena is used to query, and explore the data. Amazon QuickSight is used to read from Amazon Athena and generate reports that is consumed by the line of business users and other stakeholders.

The following diagram illustrates the solution architecture using AWS services.

Cross-organization supply chain and inventory visibility

For the second requirement, the objective is to achieve visibility of supply chain and inventory across the organization. The key stakeholders remain line of business users. They would like to get a cross-organization visibility of supply chain and inventory data. The aim is to ingest supply chain and inventory information in a scheduled manner from the ERP system (SAP), and also capture any changes in the supply chain and inventory data. The persona involved in setting up the data ingestion pipeline is a data engineer. Given that we are extracting data from SAP, AWS Glue is the suitable choice for this requirement.

The next step involves obtaining economic indicators and weather information from third-party sources. AnyHealth, with its diverse lines of business, including one that manufactures medical equipment such as inhalers for asthma treatment, recognizes the significance of collecting weather information, particularly data about pollen, because it directly impacts the patient population. Additionally, socioeconomic conditions play a crucial role in government-assisted programs related to out-of-hospital care. To incorporate this third-party data, AWS Data Exchange is the logical choice.

Finally, all the accumulated data needs to be hosted on the enterprise data platform, with cataloging, and robust security and governance measures. In this context, Amazon DataZone is the preferred solution.

The pipeline begins with the ingestion of data from SAP, facilitated by AWS Glue. The data lands in Amazon S3, where AWS Glue jobs are used to curate the data, generate curated tables, and then AWS Glue crawlers are used to catalog the data.

AWS Data Exchange serves as the platform for collecting economic trends and weather information. The business analyst leverages AWS Data Exchange to retrieve data from various sources. In the AWS Data Exchange marketplace, they identify the data set, subscribe to the data, and subsequently consume it. Any changes in the source data invokes events, which updates the data object in the Amazon S3 bucket.

Amazon DataZone is used to manage and govern the datalake. Similar to the first use case, the data security officer creates a producer project. The data owner from LoB creates supply chain and inventory data assets in the producer project and publishes the same. From the consumer perspective, the data security officer also creates a consumer project, which allows the sales and marketing teams from different LoBs to search for the supply chain and inventory data published by the producer. Consumers request access to the published supply chain and inventory data, and the producer grants the necessary access. Amazon Athena is used to query, and explore the data. Amazon QuickSight is used to read from Amazon Athena and generate reports.

The following diagram illustrates this architecture.

Cross-sell and up-sell opportunities

The third requirement involves identifying cross-sell and up-sell opportunities. The key business consumers in this context are the sales representatives and resellers. AnyHealth operates globally, selling products in Europe, America, and Asia. Direct business transactions with consumers occur in America and Europe, and resellers facilitate sales in Asia, where AnyHealth lacks a direct relationship with the consumers.

The enterprise data platform is used to host and analyze the sales data and identify the customer demand. This data platform is managed by Amazon Data Zone. Cross-sell and up-sell opportunities, derived through ML models, are integrated into the customer relationship management (CRM) system, which in this case is Salesforce. Sales representatives access this data from Salesforce to engage with the market and collaborate with customers. AWS Glue is used for this integration.

Typically, resellers don’t provide their partners direct access to their customer data. Although AnyHealth doesn’t have direct access, understanding customer personas and profile information is essential to equip resellers with right offers to cross-sell and up-sell products. AWS Clean Rooms enables collaboration on collective datasets with stringent security controls, enabling insights without sharing the underlying data.

By addressing these requirements, AnyHealth can effectively identify and capitalize on cross-sell and up-sell opportunities, tailoring their approach based on the distinct dynamics of direct and reseller-based business models across various regions.

The initial step in the architecture involves a pipeline where SAP data is ingested into Amazon S3 and curated using AWS Glue job. The curated data is cataloged, governed and managed using Amazon DataZone.

In this scenario, where sales and customer information are acquired, data scientists build ML models to identify cross-sell and upsell opportunities. Using Amazon DataZone, these opportunities are shared with line of business users, providing transparency regarding the opportunities presented to sales reps and resellers. The cross-sell and upsell insights are pushed to Salesforce through AWS Glue, with an event-driven workflow for timely communication to sales reps. However, for resellers, a different pipeline is needed as AnyHealth doesn’t have direct access to the customer sales data. AnyHealth uses AWS Clean Rooms for this purpose.

With AWS Clean Rooms, the collaboration is started by AnyHealth (the collaboration initiator) who invites resellers to join. Resellers participate in the collaboration, and share the customer profile and segment information, while maintaining privacy by excluding customer names and contact details. AnyHealth uses the customer profile information and order trends to identify cross-sell and upsell opportunities. These opportunities are shared with the reseller to pursue further and position products in the market.

The following diagram illustrates this architecture.

Final architecture

Let’s now examine the complete architecture which covers all three use cases. In this architecture, purpose-built services like AWS Data Exchange, AWS Glue, AWS Clean Rooms and Amazon DataZone, have been used. The seamless integration of these services works cohesively to achieve end-to-end business objectives.

The following diagram illustrates this architecture.

To strengthen the security posture of your cloud infrastructure, we recommend using AWS Identity and Access Management (IAM), which allows you to manage access to AWS resources by creating users, groups, and roles with specific permissions. Additionally, you can use AWS Key Management Service (AWS KMS), which enables you to create, manage, and control encryption keys used to protect your data, so only authorized entities can access sensitive information. To provide an audit trail for compliance, you can use AWS CloudTrail, which records API calls made within your AWS account.

Conclusion

In this post, we discussed how to choose right tool for building an enterprise data platform and enabling data sharing, collaboration and access within your organization and with third-party providers. We addressed three business use cases using AWS Glue, AWS Data Exchange, AWS Clean Rooms, and Amazon DataZone through three different use cases.

To learn more about these services, check out the AWS Blogs for Amazon DataZone, AWS Glue, AWS Clean Rooms, and AWS Data Exchange.


About the authors

Ramakant Joshi is an AWS Solutions Architect, specializing in the analytics and serverless domain. He has a background in software development and hybrid architectures, and is passionate about helping customers modernize their cloud architecture.

Debaprasun Chakraborty is an AWS Solutions Architect, specializing in the analytics domain. He has around 20 years of software development and architecture experience. He is passionate about helping customers in cloud adoption, migration and strategy.

Seamless integration of data lake and data warehouse using Amazon Redshift Spectrum and Amazon DataZone

Post Syndicated from Lakshmi Nair original https://aws.amazon.com/blogs/big-data/seamless-integration-of-data-lake-and-data-warehouse-using-amazon-redshift-spectrum-and-amazon-datazone/

Unlocking the true value of data often gets impeded by siloed information. Traditional data management—wherein each business unit ingests raw data in separate data lakes or warehouses—hinders visibility and cross-functional analysis. A data mesh framework empowers business units with data ownership and facilitates seamless sharing.

However, integrating datasets from different business units can present several challenges. Each business unit exposes data assets with varying formats and granularity levels, and applies different data validation checks. Unifying these necessitates additional data processing, requiring each business unit to provision and maintain a separate data warehouse. This burdens business units focused solely on consuming the curated data for analysis and not concerned with data management tasks, cleansing, or comprehensive data processing.

In this post, we explore a robust architecture pattern of a data sharing mechanism by bridging the gap between data lake and data warehouse using Amazon DataZone and Amazon Redshift.

Solution overview

Amazon DataZone is a data management service that makes it straightforward for business units to catalog, discover, share, and govern their data assets. Business units can curate and expose their readily available domain-specific data products through Amazon DataZone, providing discoverability and controlled access.

Amazon Redshift is a fast, scalable, and fully managed cloud data warehouse that allows you to process and run your complex SQL analytics workloads on structured and semi-structured data. Thousands of customers use Amazon Redshift data sharing to enable instant, granular, and fast data access across Amazon Redshift provisioned clusters and serverless workgroups. This allows you to scale your read and write workloads to thousands of concurrent users without having to move or copy the data. Amazon DataZone natively supports data sharing for Amazon Redshift data assets. With Amazon Redshift Spectrum, you can query the data in your Amazon Simple Storage Service (Amazon S3) data lake using a central AWS Glue metastore from your Redshift data warehouse. This capability extends your petabyte-scale Redshift data warehouse to unbounded data storage limits, which allows you to scale to exabytes of data cost-effectively.

The following figure shows a typical distributed and collaborative architectural pattern implemented using Amazon DataZone. Business units can simply share data and collaborate by publishing and subscribing to the data assets.

hubandspoke

The Central IT team (Spoke N) subscribes the data from individual business units and consumes this data using Redshift Spectrum. The Central IT team applies standardization and performs the tasks on the subscribed data such as schema alignment, data validation checks, collating the data, and enrichment by adding additional context or derived attributes to the final data asset. This processed unified data can then persist as a new data asset in Amazon Redshift managed storage to meet the SLA requirements of the business units. The new processed data asset produced by the Central IT team is then published back to Amazon DataZone. With Amazon DataZone, individual business units can discover and directly consume these new data assets, gaining insights to a holistic view of the data (360-degree insights) across the organization.

The Central IT team manages a unified Redshift data warehouse, handling all data integration, processing, and maintenance. Business units access clean, standardized data. To consume the data, they can choose between a provisioned Redshift cluster for consistent high-volume needs or Amazon Redshift Serverless for variable, on-demand analysis. This model enables the units to focus on insights, with costs aligned to actual consumption. This allows the business units to derive value from data without the burden of data management tasks.

This streamlined architecture approach offers several advantages:

  • Single source of truth – The Central IT team acts as the custodian of the combined and curated data from all business units, thereby providing a unified and consistent dataset. The Central IT team implements data governance practices, providing data quality, security, and compliance with established policies. A centralized data warehouse for processing is often more cost-efficient, and its scalability allows organizations to dynamically adjust their storage needs. Similarly, individual business units produce their own domain-specific data. There are no duplicate data products created by business units or the Central IT team.
  • Eliminating dependency on business units – Redshift Spectrum uses a metadata layer to directly query the data residing in S3 data lakes, eliminating the need for data copying or relying on individual business units to initiate the copy jobs. This significantly reduces the risk of errors associated with data transfer or movement and data copies.
  • Eliminating stale data – Avoiding duplication of data also eliminates the risk of stale data existing in multiple locations.
  • Incremental loading – Because the Central IT team can directly query the data on the data lakes using Redshift Spectrum, they have the flexibility to query only the relevant columns needed for the unified analysis and aggregations. This can be done using mechanisms to detect the incremental data from the data lakes and process only the new or updated data, further optimizing resource utilization.
  • Federated governance – Amazon DataZone facilitates centralized governance policies, providing consistent data access and security across all business units. Sharing and access controls remain confined within Amazon DataZone.
  • Enhanced cost appropriation and efficiency – This method confines the cost overhead of processing and integrating the data with the Central IT team. Individual business units can provision the Redshift Serverless data warehouse to solely consume the data. This way, each unit can clearly demarcate the consumption costs and impose limits. Additionally, the Central IT team can choose to apply chargeback mechanisms to each of these units.

In this post, we use a simplified use case, as shown in the following figure, to bridge the gap between data lakes and data warehouses using Redshift Spectrum and Amazon DataZone.

custom blueprints and spectrum

The underwriting business unit curates the data asset using AWS Glue and publishes the data asset Policies in Amazon DataZone. The Central IT team subscribes to the data asset from the underwriting business unit. 

We focus on how the Central IT team consumes the subscribed data lake asset from business units using Redshift Spectrum and creates a new unified data asset.

Prerequisites

The following prerequisites must be in place:

  • AWS accounts – You should have active AWS accounts before you proceed. If you don’t have one, refer to How do I create and activate a new AWS account? In this post, we use three AWS accounts. If you’re new to Amazon DataZone, refer to Getting started.
  • A Redshift data warehouse – You can create a provisioned cluster following the instructions in Create a sample Amazon Redshift cluster, or provision a serverless workgroup following the instructions in Get started with Amazon Redshift Serverless data warehouses.
  • Amazon Data Zone resources – You need a domain for Amazon DataZone, an Amazon DataZone project, and a new Amazon DataZone environment (with a custom AWS service blueprint).
  • Data lake asset – The data lake asset Policies from the business units was already onboarded to Amazon DataZone and subscribed by the Central IT team. To understand how to associate multiple accounts and consume the subscribed assets using Amazon Athena, refer to Working with associated accounts to publish and consume data.
  • Central IT environment – The Central IT team has created an environment called env_central_team and uses an existing AWS Identity and Access Management (IAM) role called custom_role, which grants Amazon DataZone access to AWS services and resources, such as Athena, AWS Glue, and Amazon Redshift, in this environment. To add all the subscribed data assets to a common AWS Glue database, the Central IT team configures a subscription target and uses central_db as the AWS Glue database.
  • IAM role – Make sure that the IAM role that you want to enable in the Amazon DataZone environment has necessary permissions to your AWS services and resources. The following example policy provides sufficient AWS Lake Formation and AWS Glue permissions to access Redshift Spectrum:
{
	"Version": "2012-10-17",
	"Statement": [{
		"Effect": "Allow",
		"Action": [
			"lakeformation:GetDataAccess",
			"glue:GetTable",
			"glue:GetTables",
			"glue:SearchTables",
			"glue:GetDatabase",
			"glue:GetDatabases",
			"glue:GetPartition",
			"glue:GetPartitions"
		],
		"Resource": "*"
	}]
}

As shown in the following screenshot, the Central IT team has subscribed to the data Policies. The data asset is added to the env_central_team environment. Amazon DataZone will assume the custom_role to help federate the environment user (central_user) to the action link in Athena. The subscribed asset Policies is added to the central_db database. This asset is then queried and consumed using Athena.

The goal of the Central IT team is to consume the subscribed data lake asset Policies with Redshift Spectrum. This data is further processed and curated into the central data warehouse using the Amazon Redshift Query Editor v2 and stored as a single source of truth in Amazon Redshift managed storage. In the following sections, we illustrate how to consume the subscribed data lake asset Policies from Redshift Spectrum without copying the data.

Automatically mount access grants to the Amazon DataZone environment role

Amazon Redshift automatically mounts the AWS Glue Data Catalog in the Central IT Team account as a database and allows it to query the data lake tables with three-part notation. This is available by default with the Admin role.

To grant the required access to the mounted Data Catalog tables for the environment role (custom_role), complete the following steps:

  1. Log in to the Amazon Redshift Query Editor v2 using the Amazon DataZone deep link.
  2. In the Query Editor v2, choose your Redshift Serverless endpoint and choose Edit Connection.
  3. For Authentication, select Federated user.
  4. For Database, enter the database you want to connect to.
  5. Get the current user IAM role as illustrated in the following screenshot.

getcurrentUser from Redshift QEv2

  1. Connect to Redshift Query Editor v2 using the database user name and password authentication method. For example, connect to dev database using the admin user name and password. Grant usage on the awsdatacatalog database to the environment user role custom_role (replace the value of current_user with the value you copied):
GRANT USAGE ON DATABASE awsdatacatalog to "IAMR:current_user"

grantpermissions to awsdatacatalog

Query using Redshift Spectrum

Using the federated user authentication method, log in to Amazon Redshift. The Central IT team will be able to query the subscribed data asset Policies (table: policy) that was automatically mounted under awsdatacatalog.

query with spectrum

Aggregate tables and unify products

The Central IT team applies the necessary checks and standardization to aggregate and unify the data assets from all business units, bringing them at the same granularity. As shown in the following screenshot, both the Policies and Claims data assets are combined to form a unified aggregate data asset called agg_fraudulent_claims.

creatingunified product

These unified data assets are then published back to the Amazon DataZone central hub for business units to consume them.

unified asset published

The Central IT team also unloads the data assets to Amazon S3 so that each business unit has the flexibility to use either a Redshift Serverless data warehouse or Athena to consume the data. Each business unit can now isolate and put limits to the consumption costs on their individual data warehouses.

Because the intention of the Central IT team was to consume data lake assets within a data warehouse, the recommended solution would be to use custom AWS service blueprints and deploy them as part of one environment. In this case, we created one environment (env_central_team) to consume the asset using Athena or Amazon Redshift. This accelerates the development of the data sharing process because the same environment role is used to manage the permissions across multiple analytical engines.

Clean up

To clean up your resources, complete the following steps:

  1. Delete any S3 buckets you created.
  2. On the Amazon DataZone console, delete the projects used in this post. This will delete most project-related objects like data assets and environments.
  3. Delete the Amazon DataZone domain.
  4. On the Lake Formation console, delete the Lake Formation admins registered by Amazon DataZone along with the tables and databases created by Amazon DataZone.
  5. If you used a provisioned Redshift cluster, delete the cluster. If you used Redshift Serverless, delete any tables created as part of this post.

Conclusion

In this post, we explored a pattern of seamless data sharing with data lakes and data warehouses with Amazon DataZone and Redshift Spectrum. We discussed the challenges associated with traditional data management approaches, data silos, and the burden of maintaining individual data warehouses for business units.

In order to curb operating and maintenance costs, we proposed a solution that uses Amazon DataZone as a central hub for data discovery and access control, where business units can readily share their domain-specific data. To consolidate and unify the data from these business units and provide a 360-degree insight, the Central IT team uses Redshift Spectrum to directly query and analyze the data residing in their respective data lakes. This eliminates the need for creating separate data copy jobs and duplication of data residing in multiple places.

The team also takes on the responsibility of bringing all the data assets to the same granularity and process a unified data asset. These combined data products can then be shared through Amazon DataZone to these business units. Business units can only focus on consuming the unified data assets that aren’t specific to their domain. This way, the processing costs can be controlled and tightly monitored across all business units. The Central IT team can also implement chargeback mechanisms based on the consumption of the unified products for each business unit.

To learn more about Amazon DataZone and how to get started, refer to Getting started. Check out the YouTube playlist for some of the latest demos of Amazon DataZone and more information about the capabilities available.


About the Authors

Lakshmi Nair is a Senior Analytics Specialist Solutions Architect at AWS. She specializes in designing advanced analytics systems across industries. She focuses on crafting cloud-based data platforms, enabling real-time streaming, big data processing, and robust data governance.

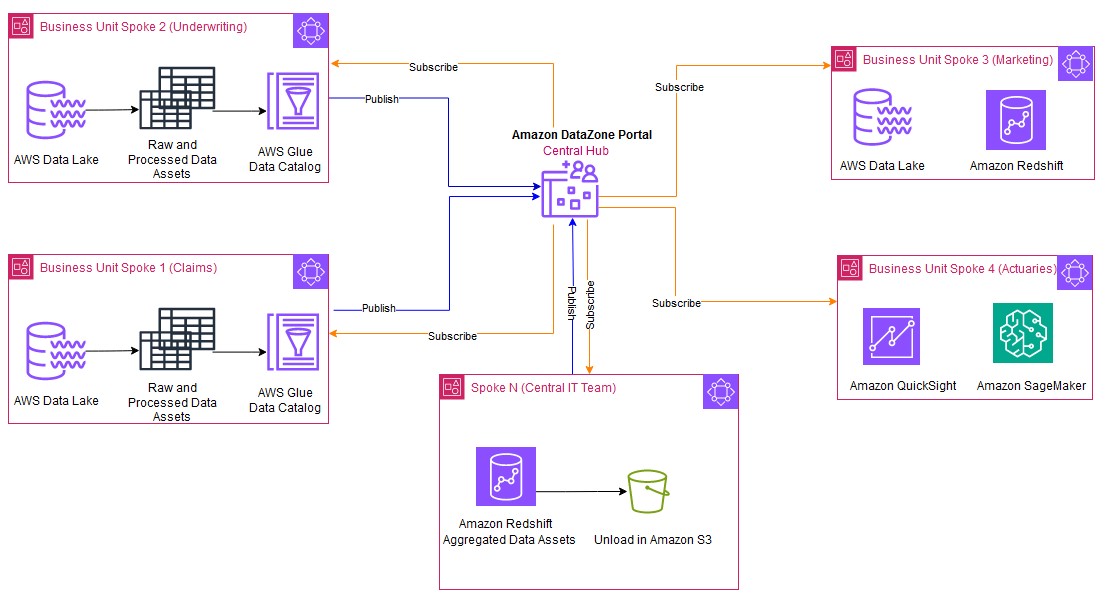
Srividya Parthasarathy is a Senior Big Data Architect on the AWS Lake Formation team. She enjoys building analytics and data mesh solutions on AWS and sharing them with the community.

Implement data quality checks on Amazon Redshift data assets and integrate with Amazon DataZone

Post Syndicated from Lakshmi Nair original https://aws.amazon.com/blogs/big-data/implement-data-quality-checks-on-amazon-redshift-data-assets-and-integrate-with-amazon-datazone/

Data quality is crucial in data pipelines because it directly impacts the validity of the business insights derived from the data. Today, many organizations use AWS Glue Data Quality to define and enforce data quality rules on their data at rest and in transit. However, one of the most pressing challenges faced by organizations is providing users with visibility into the health and reliability of their data assets. This is particularly crucial in the context of business data catalogs using Amazon DataZone, where users rely on the trustworthiness of the data for informed decision-making. As the data gets updated and refreshed, there is a risk of quality degradation due to upstream processes.

Amazon DataZone is a data management service designed to streamline data discovery, data cataloging, data sharing, and governance. It allows your organization to have a single secure data hub where everyone in the organization can find, access, and collaborate on data across AWS, on premises, and even third-party sources. It simplifies the data access for analysts, engineers, and business users, allowing them to discover, use, and share data seamlessly. Data producers (data owners) can add context and control access through predefined approvals, providing secure and governed data sharing. The following diagram illustrates the Amazon DataZone high-level architecture. To learn more about the core components of Amazon DataZone, refer to Amazon DataZone terminology and concepts.

DataZone High Level Architecture

To address the issue of data quality, Amazon DataZone now integrates directly with AWS Glue Data Quality, allowing you to visualize data quality scores for AWS Glue Data Catalog assets directly within the Amazon DataZone web portal. You can access the insights about data quality scores on various key performance indicators (KPIs) such as data completeness, uniqueness, and accuracy.

By providing a comprehensive view of the data quality validation rules applied on the data asset, you can make informed decisions about the suitability of the specific data assets for their intended use. Amazon DataZone also integrates historical trends of the data quality runs of the asset, giving full visibility and indicating if the quality of the asset improved or degraded over time. With the Amazon DataZone APIs, data owners can integrate data quality rules from third-party systems into a specific data asset. The following screenshot shows an example of data quality insights embedded in the Amazon DataZone business catalog. To learn more, see Amazon DataZone now integrates with AWS Glue Data Quality and external data quality solutions.

In this post, we show how to capture the data quality metrics for data assets produced in Amazon Redshift.

Amazon Redshift is a fast, scalable, and fully managed cloud data warehouse that allows you to process and run your complex SQL analytics workloads on structured and semi-structured data. Amazon DataZone natively supports data sharing for Amazon Redshift data assets.

With Amazon DataZone, the data owner can directly import the technical metadata of a Redshift database table and views to the Amazon DataZone project’s inventory. As these data assets gets imported into Amazon DataZone, it bypasses the AWS Glue Data Catalog, creating a gap in data quality integration. This post proposes a solution to enrich the Amazon Redshift data asset with data quality scores and KPI metrics.

Solution overview

The proposed solution uses AWS Glue Studio to create a visual extract, transform, and load (ETL) pipeline for data quality validation and a custom visual transform to post the data quality results to Amazon DataZone. The following screenshot illustrates this pipeline.

Glue ETL pipeline

The pipeline starts by establishing a connection directly to Amazon Redshift and then applies necessary data quality rules defined in AWS Glue based on the organization’s business needs. After applying the rules, the pipeline validates the data against those rules. The outcome of the rules is then pushed to Amazon DataZone using a custom visual transform that implements Amazon DataZone APIs.

The custom visual transform in the data pipeline makes the complex logic of Python code reusable so that data engineers can encapsulate this module in their own data pipelines to post the data quality results. The transform can be used independently of the source data being analyzed.

Each business unit can use this solution by retaining complete autonomy in defining and applying their own data quality rules tailored to their specific domain. These rules maintain the accuracy and integrity of their data. The prebuilt custom transform acts as a central component for each of these business units, where they can reuse this module in their domain-specific pipelines, thereby simplifying the integration. To post the domain-specific data quality results using a custom visual transform, each business unit can simply reuse the code libraries and configure parameters such as Amazon DataZone domain, role to assume, and name of the table and schema in Amazon DataZone where the data quality results need to be posted.

In the following sections, we walk through the steps to post the AWS Glue Data Quality score and results for your Redshift table to Amazon DataZone.

Prerequisites

To follow along, you should have the following:

The solution uses a custom visual transform to post the data quality scores from AWS Glue Studio. For more information, refer to Create your own reusable visual transforms for AWS Glue Studio.

A custom visual transform lets you define, reuse, and share business-specific ETL logic with your teams. Each business unit can apply their own data quality checks relevant to their domain and reuse the custom visual transform to push the data quality result to Amazon DataZone and integrate the data quality metrics with their data assets. This eliminates the risk of inconsistencies that might arise when writing similar logic in different code bases and helps achieve a faster development cycle and improved efficiency.

For the custom transform to work, you need to upload two files to an Amazon Simple Storage Service (Amazon S3) bucket in the same AWS account where you intend to run AWS Glue. Download the following files:

Copy these downloaded files to your AWS Glue assets S3 bucket in the folder transforms (s3://aws-glue-assets<account id>-<region>/transforms). By default, AWS Glue Studio will read all JSON files from the transforms folder in the same S3 bucket.

customtransform files

In the following sections, we walk you through the steps of building an ETL pipeline for data quality validation using AWS Glue Studio.

Create a new AWS Glue visual ETL job

You can use AWS Glue for Spark to read from and write to tables in Redshift databases. AWS Glue provides built-in support for Amazon Redshift. On the AWS Glue console, choose Author and edit ETL jobs to create a new visual ETL job.

Establish an Amazon Redshift connection

In the job pane, choose Amazon Redshift as the source. For Redshift connection, choose the connection created as prerequisite, then specify the relevant schema and table on which the data quality checks need to be applied.

dqrulesonredshift

Apply data quality rules and validation checks on the source

The next step is to add the Evaluate Data Quality node to your visual job editor. This node allows you to define and apply domain-specific data quality rules relevant to your data. After the rules are defined, you can choose to output the data quality results. The outcomes of these rules can be stored in an Amazon S3 location. You can additionally choose to publish the data quality results to Amazon CloudWatch and set alert notifications based on the thresholds.

Preview data quality results

Choosing the data quality results automatically adds the new node ruleOutcomes. The preview of the data quality results from the ruleOutcomes node is illustrated in the following screenshot. The node outputs the data quality results, including the outcomes of each rule and its failure reason.

previewdqresults

Post the data quality results to Amazon DataZone

The output of the ruleOutcomes node is then passed to the custom visual transform. After both files are uploaded, the AWS Glue Studio visual editor automatically lists the transform as mentioned in post_dq_results_to_datazone.json (in this case, Datazone DQ Result Sink) among the other transforms. Additionally, AWS Glue Studio will parse the JSON definition file to display the transform metadata such as name, description, and list of parameters. In this case, it lists parameters such as the role to assume, domain ID of the Amazon DataZone domain, and table and schema name of the data asset.

Fill in the parameters:

  • Role to assume is optional and can be left empty; it’s only needed when your AWS Glue job runs in an associated account
  • For Domain ID, the ID for your Amazon DataZone domain can be found in the Amazon DataZone portal by choosing the user profile name

datazone page

  • Table name and Schema name are the same ones you used when creating the Redshift source transform
  • Data quality ruleset name is the name you want to give to the ruleset in Amazon DataZone; you could have multiple rulesets for the same table
  • Max results is the maximum number of Amazon DataZone assets you want the script to return in case multiple matches are available for the same table and schema name

Edit the job details and in the job parameters, add the following key-value pair to import the right version of Boto3 containing the latest Amazon DataZone APIs:

--additional-python-modules

boto3>=1.34.105

Finally, save and run the job.

dqrules post datazone

The implementation logic of inserting the data quality values in Amazon DataZone is mentioned in the post Amazon DataZone now integrates with AWS Glue Data Quality and external data quality solutions . In the post_dq_results_to_datazone.py script, we only adapted the code to extract the metadata from the AWS Glue Evaluate Data Quality transform results, and added methods to find the right DataZone asset based on the table information. You can review the code in the script if you are curious.

After the AWS Glue ETL job run is complete, you can navigate to the Amazon DataZone console and confirm that the data quality information is now displayed on the relevant asset page.

Conclusion

In this post, we demonstrated how you can use the power of AWS Glue Data Quality and Amazon DataZone to implement comprehensive data quality monitoring on your Amazon Redshift data assets. By integrating these two services, you can provide data consumers with valuable insights into the quality and reliability of the data, fostering trust and enabling self-service data discovery and more informed decision-making across your organization.

If you’re looking to enhance the data quality of your Amazon Redshift environment and improve data-driven decision-making, we encourage you to explore the integration of AWS Glue Data Quality and Amazon DataZone, and the new preview for OpenLineage-compatible data lineage visualization in Amazon DataZone. For more information and detailed implementation guidance, refer to the following resources:


About the Authors

Fabrizio Napolitano is a Principal Specialist Solutions Architect for DB and Analytics. He has worked in the analytics space for the last 20 years, and has recently and quite by surprise become a Hockey Dad after moving to Canada.

Lakshmi Nair is a Senior Analytics Specialist Solutions Architect at AWS. She specializes in designing advanced analytics systems across industries. She focuses on crafting cloud-based data platforms, enabling real-time streaming, big data processing, and robust data governance.

Varsha Velagapudi is a Senior Technical Product Manager with Amazon DataZone at AWS. She focuses on improving data discovery and curation required for data analytics. She is passionate about simplifying customers’ AI/ML and analytics journey to help them succeed in their day-to-day tasks. Outside of work, she enjoys nature and outdoor activities, reading, and traveling.

Organize content across business units with enterprise-wide data governance using Amazon DataZone domain units and authorization policies

Post Syndicated from David Victoria original https://aws.amazon.com/blogs/big-data/organize-content-across-business-units-with-enterprise-wide-data-governance-using-amazon-datazone-domain-units-and-authorization-policies/

Amazon DataZone has announced a set of new data governance capabilities—domain units and authorization policies—that enable you to create business unit-level or team-level organization and manage policies according to your business needs. With the addition of domain units, users can organize, create, search, and find data assets and projects associated with business units or teams. With authorization policies, those domain unit users can set access policies for creating projects and glossaries, and using compute resources within Amazon DataZone.

As an Amazon DataZone administrator, you can now create domain units (such as Sales or Marketing) under the top-level domain and assign domain unit owners to further manage the data team’s structure. Amazon DataZone users can log in to the portal to browse and search the catalog by domain units, and subscribe to data produced by specific business units. Additionally, authorization policies can be configured for a domain unit permitting actions such as who can create projects, metadata forms, and glossaries within their domain units. Authorized portal users can then log in to the Amazon DataZone portal and create entities such as projects and create metadata forms using the authorized projects.

Amazon DataZone enables you to discover, access, share, and govern data at scale across organizational boundaries, reducing the undifferentiated heavy lifting of making data and analytics tools accessible to everyone in the organization. With Amazon DataZone, data users like data engineers, data scientists, and data analysts can share and access data across AWS accounts using a unified data portal, allowing them to discover, use, and collaborate on this data across their teams and organizations. Additionally, data owners and data stewards can make data discovery simpler by adding business context to data while balancing access governance to the data in the UI.

In this post, we discuss common approaches to structuring domain units, use cases that customers in the healthcare and life sciences (HCLS) industry encounter, and how to get started with the new domain units and authorization policies features from Amazon DataZone.

Approaches to structuring domain units

Domains are top-level entities that encompass multiple domain units as sub-entities, each with specific policies. Organizations can adopt different approaches when defining and structuring domains and domain units. Some strategies align these units with data domains, whereas others follow organizational structures or lines of business. In this section, we explore a few examples of domains, domain units, and how to organize data assets and products within these constructs.

Domains aligned with the organization

Domain units can be built using the organizational structure, lines of businesses, or use cases. For example, HCLS organizations typically have a range of domains that encompass various aspects of their operations and services. Customers are using domains and domain units to improve searchability and findability of data assets within an organized tree-like structure, and enable individual organizational units to control their own authorization policies.

One of the core benefits of organizing entities as domain units is to enable search and self-service access across various domain units. The following are some common domain units within the HCLS sector:

  • Commercials – Commercial aspects of products or services related to the life sciences and activities such as market analysis, product positioning, pricing, distribution, and customer engagement. There could be several child domain units, such as contract research organization.
  • Research and development – Pharmaceutical and medical device development. Some examples of child domain units include drug discovery and clinical trials management.
  • Clinical services – Hospital and clinic management. Examples of child domain units include physician and nursing services.
  • Revenue cycle management – Patient billing and claims processing. Examples of child domain units include insurance and payer relations.

The following are common domains and domain units that apply across industries:

  • Supply chain and logistics – Procurement and inventory management.
  • Regulatory compliance and quality assurance – Compliance with industry specific regulations, quality management systems, and accreditation.
  • Marketing – Strategies, techniques, and practices aimed at promoting products, services, or ideas to potential customers. Some examples of child domain units are campaigns and events.
  • Sales – Sales process, key performance indicators (KPIs), and metrics.

For example, one of our customers, AWS Data Platform, uses Amazon DataZone to provide secure, trusted, convenient, and fast access to AWS business data.

“At AWS, our vision is to provide customers with reliable, secure, and self-service access to exabyte-scale data while ensuring data governance and compliance. With Amazon DataZone domain units, we are able to organize a vast and growing number of datasets to align with the organizational structure of the customers my teams serve internally. This simplifies data discovery and helps us organize business units’ data in a hierarchical manner for data-driven decision-making at AWS. Amazon DataZone authorization policies coupled with domain units enable a powerful yet flexible way of decentralizing data governance and helps tailor access policies to individual business units. With these features, we are able to reduce the undifferentiated heavy lift while building and managing data products.”

– Arnaud Mauvais, Director of Software Development at AWS.

Domains aligned with data ownership

The term data domain is crucial within the realm of data governance. It signifies a distinct field or classification of data that an organization oversees and regulates. Data domains form a foundational pillar in data governance frameworks. The concept of data domains plays a pivotal role in data governance, empowering organizations to systematically structure, administer, and harness their data assets. This strategic approach aligns data resources with business goals, fostering informed decision-making processes.

You can either define each data domain as a top-level domain or define a top-level data domain (for example, Organization) with several child domain units, such as:

  • Customer data – This domain unit includes all data related to customers, such as customer profiles. Several other child domain units with policies can be built within customer domain units, such as customer interactions and profiles.
  • Financial data – This domain unit encompasses data related to financial information.
  • Human resources data – This domain unit includes employee-related data.
  • Product data – This domain unit covers data related to products or services offered by the organization.

Authorization policies for domains and domain units

Amazon DataZone domain units provide you with a robust and flexible data governance solution tailored to your organizational structure. These domain units empower individual business lines or teams to establish their own authorization policies, enabling self-service governance over critical actions such as publishing data assets and utilizing compute resources within Amazon DataZone. The authorization policies enabled by domain units allow you to grant granular access rights to users and groups, empowering them to manage domain units, project memberships, and creation of content such as projects, metadata forms, glossaries and custom asset types.

Domain governance authorization policies help organizations maintain data privacy, confidentiality, and integrity by controlling and limiting access to sensitive or critical data. They also support data-driven decision-making by making sure authorized users have appropriate access to the information they need to perform their duties. Similarly, authorization policies can help organizations govern the management of organizational domains, collaboration, and metadata. These policies can help define roles like data governance owner, data product owners, and data stewards.

Additionally, these policies facilitate metadata management, glossary administration, and domain ownership, so data governance practices are aligned with the specific needs and requirements of each business line or team. By using domain units and their associated authorization policies, organizations can decentralize data governance responsibilities while maintaining a consistent and controlled approach to data asset and metadata management. This distributed governance model promotes ownership and accountability within individual business lines, fostering a culture of data stewardship and enabling more agile and responsive data management practices.

Use cases for domain units

Amazon DataZone domain units help customers in various industries securely and efficiently govern their data, collaborate on important data management initiatives, and help in complying with relevant regulations. These capabilities are particularly valuable for customers in industries with strict data privacy and security requirements, such as HCLS, financial services, and the public sector. Amazon DataZone domain units enable you to maintain control over your data while facilitating seamless collaboration and helping you adhere to regulations like Health Insurance Portability and Accountability Act (HIPAA), General Data Protection Regulation (GDPR), and others specific to your industry.

The following are key benefits of Amazon DataZone domain units for HCLS customers:

  • Secure and compliant data sharing – Amazon DataZone domain units help provide a secure mechanism for you to share sensitive data, such as protected health information (PHI) and personally identifiable information (PII). This helps organizations with regulatory requirements maintain the privacy and security of their data.
  • Scalable and flexible data management – Amazon DataZone domain units offer a scalable and flexible data management solution that enables you to manage and curate your data, while also enabling efficient data discovery and access.
  • Streamlined collaboration and governance – The platform provides a centralized and controlled environment for teams to collaborate on data-driven projects. It enables effective data governance, allowing you to define and enforce policies, provide clarity on who has access to data, and maintain control over sensitive information.
  • Granular authorization policies – Amazon DataZone domain units allow you to define and enforce fine-grained authorization policies, maintain tight control over your data, and streamline data-driven collaboration and governance across your teams.

Solution overview

On the AWS Management Console, the administrator (AWS account user) creates the Amazon DataZone domain. As the creator of the domain, they can choose to add other single sign-on (SSO) and AWS Identity and Access Management (IAM) users as owners to manage the domain. Under the domain, domain units (such as Sales, Marketing, and Finance) can be created to reflect a hierarchy that aligns with the organization’s data ecosystem. Ownership of these domain units can be assigned to business leaders, who may expand a hierarchy representing their data teams and later set policies that enable users and projects to perform specific actions. With the domain structure in place, you can organize your assets under appropriate domain units. The organization of assets to domain units starts with projects being assigned to a domain unit at time of creation and assets then being cataloged within the project. Catalog consumers then browse the domain hierarchy to find assets related to specific business functions. They can also search for assets using a domain unit as a search facet.

Domain units set the foundation for how authorization policies permit users to perform actions in Amazon DataZone, such as who can create and join projects. Amazon DataZone creates a set of managed authorization policies for every domain unit, and domain unit owners create grants within a policy to users and projects.

There are two Amazon DataZone entities that have policies created on them. The first is a domain unit where the owners can decide who may perform actions such as creating domains, projects, joining projects, creating metadata forms, and so on. The policies have an option to cascade the grant down through child domain units. These policies are managed through the Amazon DataZone portal, and their grants can be applied to two principal types:

  • User-based policies – These policies grant users (IAM, SSO, and SSO groups) permission to perform an action (such as create domain units and projects, join projects, and take ownership of domain units and projects)
  • Project-based policies – These policies grant a project permission to perform an action (such as create metadata forms, glossaries, or custom asset types)

The second Amazon DataZone entity is a blueprint (defines the tools and services for Amazon DataZone environments), where a data platform user (AWS account user) who owns the Amazon DataZone blueprint can decide which projects use their resources through environment profile creation on the Amazon DataZone portal. There are two approaches to specify which projects can use the blueprint to create an environment profile:

  • Account users can use domain units as a delegation mechanism to pass the trust of using the blueprint to a business leader (domain unit owner) on the Amazon DataZone portal
  • Account users can directly grant a specific project permission to use the blueprint

These policies can be managed through the console and Amazon DataZone portal.

The following figure is an example domain structure for the ABC Corp domain. Domain units are created under the ABC Corp domain with domain unit owners assigned. Authorization policies are applied for each domain unit and dictate the actions users and projects can perform.

For more information about Amazon DataZone components, refer to Amazon DataZone terminology and concepts.

In the following sections, we walk through the steps to get started with the data management governance capabilities in Amazon DataZone.

Create an Amazon DataZone domain

With Amazon DataZone, administrators log in to the console and create an Amazon DataZone domain. Additional domain unit owners can be added to help manage the domain. For more information, refer to Managing Amazon DataZone domains and user access.

Create domain units to represent your business units

To create a domain unit, complete the following steps:

  1. Log in to the DataZone data portal and choose Domain in toolbar to view your domain units.
  2. As the domain unit owner, choose Create Domain Unit.
  3. Provide your domain unit details (representing different lines of business).
  4. You can create additional domain units in a nested fashion.
  5. For each domain unit, assign owners to manage the domain unit and its authorization policies.

Apply authorization policies so domain units can self-govern

Amazon DataZone managed authorization policies are available for every domain unit, and domain unit owners can grant access through that policy to users and projects. Policies are either user-based (granted to users) or project-based (granted to projects).

  1. On the Authorization Policies tab of a domain unit, grant authorization policies to users or projects permitting them to perform certain actions. For this example, we choose Project creation policy for the Sales domain.
  2. Choose Add Policy Grant to add either select users and groups, all users, or all groups.

With this, a Sales team member can log in to the data portal and create projects under the Sales domain.

Conclusion

In this post, we discussed common approaches to structuring domain units, use cases that customers in the HCLS industry encounter, and how to get started with the new domain units and authorization policies features from Amazon DataZone.

Domain units provide clean separation between data areas, making the discoverability of data efficient for users. Authorization policies, in combination with domain units, provide the governance layer controlling access to the data and provide control over how the data is cataloged. Together, Amazon DataZone domain units and authorization policies make organization and governance possible across your data.

Amazon DataZone domain units and authorization policies are available in all AWS Regions where Amazon DataZone is available. To learn more, refer to Working with domain units.


About the Authors

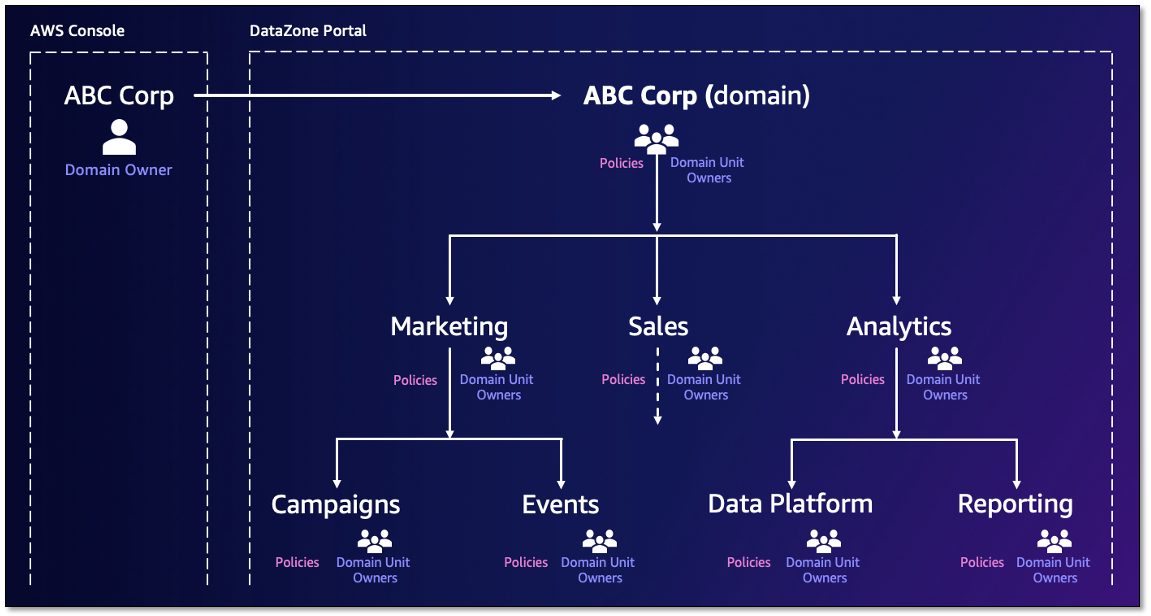
David Victoria is a Senior Technical Product Manager with Amazon DataZone at AWS. He focuses on improving administration and governance capabilities needed for customers to support their analytics systems. He is passionate about helping customers realize the most value from their data in a secure, governed manner. Outside of work, he enjoys hiking, traveling, and making his newborn baby laugh.

Nora O Sullivan is a Senior Solutions Architect at AWS. She focuses on helping HCLS customers choose the right AWS services for their data and analytics needs so they can derive value from their data. Outside of work, she enjoys golfing and discovering new wines and authors.

Navneet Srivastava, a Principal Specialist and Analytics Strategy Leader, develops strategic plans for building an end-to-end analytical strategy for large biopharma, healthcare, and life sciences organizations. Navneet is responsible for helping life sciences organizations and healthcare companies deploy data governance and analytical applications, electronic medical records, devices, and AI/ML-based applications while educating customers about how to build secure, scalable, and cost-effective AWS solutions. His expertise spans across data analytics, data governance, AI, ML, big data, and healthcare-related technologies.

AWS Weekly Roundup: Mithra, Amazon Titan Image Generator v2, AWS GenAI Lofts, and more (August 12, 2024)

Post Syndicated from Channy Yun (윤석찬) original https://aws.amazon.com/blogs/aws/aws-weekly-roundup-mithra-amazon-titan-image-generator-v2-aws-genai-lofts-and-more-august-12-2024/

When Dr. Swami Sivasubramanian, VP of AI and Data, was an intern at Amazon in 2005, Dr. Werner Vogels, CTO of Amazon, was his first manager. Nineteen years later, the two shared a stage at the VivaTech Conference to reflect on Amazon’s history of innovation—from pioneering the pay-as-you-go model with Amazon Web Services (AWS) to transforming customer experiences using “good old-fashioned AI”—as well as what really keeps them up at night in the age of generative artificial intelligence (generative AI).

Asked if competitors ever kept him up at night, Dr. Werner insisted that listening to customer needs—such as guardrails, security, and privacy—and building products based on those needs is what drives success at Amazon. Dr. Swami said he viewed Amazon SageMaker and Amazon Bedrock as prime examples of successful products that have emerged as a result of this customer-first approach. “If you end up chasing your competitors, you are going to end up building what they are building,” he added. “If you actually listen to your customers, you are actually going to lead the way in innovation.” To learn four more lessons on customer-obsessed innovation, visit our AWS Careers blog.

For example, for customer-obsessed security, we build and use Mithra, a powerful neural network model to detect and respond to cyber threats. It analyzes up to 200 trillion internet domain requests daily from the AWS global network, identifying an average of 182,000 new malicious domains with remarkable accuracy. Mithra is just one example of how AWS uses global scale, advanced artificial intelligence and machine learning (AI/ML) technology, and constant innovation to lead the way in cloud security, making the internet safer for everyone. To learn more, visit the blog post of Chief Information Security Officer at Amazon CJ Moses, How AWS tracks the cloud’s biggest security threats and helps shut them down.

Last week’s launches
Here are some launches that got my attention:

Amazon Titan Image Generator v2 in Amazon Bedrock – With the new Amazon Titan Image Generator v2 model, you can guide image creation using a text prompt and reference images, control the color palette of generated images, remove backgrounds, and customize the model to maintain brand style and subject consistency. To learn more, visit my blog post, Amazon Titan Image Generator v2 is now available in Amazon Bedrock.

Regional expansion of Anthropic’s Claude models in Amazon Bedrock – The Claude 3.5 Sonnet, Anthropic’s latest high-performance AI model, is now available in US West (Oregon), Europe (Frankfurt), Asia Pacific (Tokyo), and Asia Pacific (Singapore) Regions in Amazon Bedrock. The Claude 3 Haiku, Anthropic’s compact and affordable AI model, is now available in Asia Pacific (Tokyo) and Asia Pacific (Singapore) Regions in Amazon Bedrock.

Private IPv6 addressing for VPCs and subnets – You can now address private IPv6 for VPCs and subnets with Amazon VPC IP Address Manager (IPAM). Within IPAM, you can configure private IPv6 addresses in a private scope, provision Unique Local IPv6 Unicast Addresses (ULA) and Global Unicast Addresses (GUA), and use them to create VPCs and subnets for private access. To learn more, visit see the Understanding IPv6 addressing on AWS and designing a scalable addressing plan and VPC documentation,

Up to 30 GiB/s of read throughput in Amazon EFS – We are increasing the read throughput to 30 GiB/s, extending simple, fully elastic, and provisioning-free experience of Amazon EFS to support throughput-intensive AI and ML workloads for model training, inference, financial analytics, and genomic data analysis.

Large language models (LLMs) in Amazon Redshift ML – You can use pre-trained publicly available LLMs in Amazon SageMaker JumpStart as part of Amazon Redshift ML. For example, you can use LLMs to summarize feedback, perform entity extraction, and conduct sentiment analysis on data in your Amazon Redshift table, so you can bring the power of generative AI to your data warehouse.

Data products in Amazon DataZone – You can create data products in Amazon DataZone, which enable the grouping of data assets into well-defined, self-contained packages tailored for specific business use cases. For example, a marketing analysis data product can bundle various data assets such as marketing campaign data, pipeline data, and customer data. To learn more, visit this AWS Big Data blog post.

For a full list of AWS announcements, be sure to keep an eye on the What’s New at AWS page.

Other AWS news
Here are some additional news items that you might find interesting:

AWS Goodies by Jeff Barr – Want to discover more exciting news about AWS? Jeff Barr is always in catch-up mode, doing his best to share all of the interesting things that he finds or that are shared with him. You can find his goodies once a week. Follow his LinkedIn page.

AWS and Multicloud – You might have missed a great article about the existing capabilities AWS has and the continued enhancements we’ve made in multicloud environments. In the post, Jeff covers the AWS approach to multicloud, provides you with some real-world examples, and reviews some of the newest multicloud and hybrid capabilities found across the lineup of AWS services.

Code transformation in Amazon Q Developer – At Amazon, we asked a small team to use Amazon Q Developer Agent for code transformation to migrate more than 30,000 production applications from older Java versions to Java 17. By using Amazon Q Developer to automate these upgrades, the team saved over 4,500 developer years of effort compared to what it would have taken to do all of these upgrades manually and saved the company $260 million in annual savings by moving to the latest Java version.

Contributing to AWS CDKAWS Cloud Development Kit (AWS CDK) is an open source software development framework to model and provision your cloud application resources using familiar programming languages. Contributing to AWS CDK not only helps you deepen your knowledge of AWS services but also allows you to give back to the community and improve a tool you rely on.

Upcoming AWS events
Check your calendars and sign up for these AWS events:

AWS re:Invent 2024 – Dive into the first-round session catalog. Explore all the different learning opportunities at AWS re:Invent this year and start building your agenda today. You’ll find sessions for all interests and learning styles.

AWS Innovate Migrate, Modernize, Build – Learn about proven strategies and practical steps for effectively migrating workloads to the AWS Cloud, modernizing applications, and building cloud-native and AI-enabled solutions. Don’t miss this opportunity to learn with the experts and unlock the full potential of AWS. Register now for Asia Pacific, Korea, and Japan (September 26).

AWS Summits – The 2024 AWS Summit season is almost wrapping up! Join free online and in-person events that bring the cloud computing community together to connect, collaborate, and learn about AWS. Register in your nearest city: São Paulo (August 15), Jakarta (September 5), and Toronto (September 11).

AWS Community Days – Join community-led conferences that feature technical discussions, workshops, and hands-on labs led by expert AWS users and industry leaders from around the world: New Zealand (August 15), Colombia (August 24), New York (August 28), Belfast (September 6), and Bay Area (September 13).

AWS GenAI Lofts – Meet AWS AI experts and attend talks, workshops, fireside chats, and Q&As with industry leaders. All lofts are free and are carefully curated to offer something for everyone to help you accelerate your journey with AI. There are lofts scheduled in San Francisco (August 14–September 27), São Paulo (September 2–November 20), London (September 30–October 25), Paris (October 8–November 25), and Seoul (November).

You can browse all upcoming in-person and virtual events.

That’s all for this week. Check back next Monday for another Weekly Roundup!

Channy

This post is part of our Weekly Roundup series. Check back each week for a quick roundup of interesting news and announcements from AWS!

Introducing data products in Amazon DataZone: Simplify discovery and subscription with business use case based grouping

Post Syndicated from Jason Hines original https://aws.amazon.com/blogs/big-data/introducing-data-products-in-amazon-datazone-simplify-discovery-and-subscription-with-business-use-case-based-grouping/

We are excited to announce a new feature in Amazon DataZone that allows data producers to group data assets into well-defined, self-contained packages (data products) tailored for specific business use cases. For example, a marketing analysis data product can bundle various data assets such as marketing campaign data, pipeline data, and customer data. This simplifies the process for data consumers to find datasets, understand their context through shared metadata, and access comprehensive datasets for specific use cases through a single workflow. With the grouping capabilities of data products, data producers can manage and control access to the underlying data assets with just a few steps.

Customers often face challenges in locating and accessing the fragmented data they need, expending time and resources in the process. With Amazon DataZone, they can use data products to enhance data cataloging and subscription processes, aligning these more closely with business objectives while eliminating redundancy in handling individual assets.

In this post, we highlight the key benefits of data products, outline their essential features and workflows, and demonstrate how customers can use these features for easier publishing, discovery, and subscription.

Key benefits of data products

Customers use Amazon DataZone to create data meshes and adopt a culture that emphasizes data as a product. Amazon DataZone facilitates the publication of data assets from diverse sources that are enriched with their business context. It is crucial to organize assets into cohesive units with relational context to maximize the potential of data as a product and drive business use cases.

Amazon DataZone now offers the capability to group data assets with shared metadata into cohesive, business use case based data products, enhancing both the publishing and subscription processes. Data products provide three core benefits that help customers address their business challenges:

  • Simplified discovery – Data consumers can quickly identify interconnected data assets by searching for and finding them as a single unit. This reduces the time and effort required to find all relevant information and lowers the risk of missing important data.
  • Unified access model – Data products simplify access to data with a single request by implementing a unified access model. This eliminates the need for multiple permissions, speeding up the initiation of data analysis.
  • Reduced administrative overhead – By cataloging assets as data product units, data producers reduce administrative overhead by enabling metadata and access control management at the product level rather than individually. This makes access governance and data utilization more efficient, ensuring alignment with business goals and easy accessibility for its intended use. Data governance teams can monitor consumption rates for these data products, providing valuable insights into data literacy maturity.

For example, one of our customers, Natera, uses Amazon DataZone to create tailored datasets for their specific needs. Mirko Buholzer, VP of software engineering at Natera, says

“At Natera, our mission to revolutionize precision medicine depends on managing and leveraging our vast clinical and genomic data. With the Amazon DataZone data products feature, we can create tailored datasets for specific uses like reproductive health, oncology, or organ transplantation. This streamlines data discovery and access for our researchers and data scientists, enabling quick analysis of relevant data. Additionally, it will help physicians and patients gain deeper insights in combination with our clinical tests, ultimately improving patient outcomes.”

With data products, Amazon DataZone now supports business use case based grouping, enhancing data publishing, discovery, and subscription. This feature enables the following capabilities, as shown in the following image:

  • Data product creation and publishing – Producers can create data products by selecting assets from their project’s inventory, setting up shared metadata, and publishing these products to make them discoverable to consumers.
  • Data discovery and subscription – Consumers can search for and subscribe to data product units. Subscription requests are sent within a single workflow to producers for approval. Subscription approval processes, such as approve, reject, and revoke, ensure that access is managed securely. Once approved, access grants for the individual assets within the data product are automatically managed by the system.
  • Data product lifecycle management – Producers have control over the lifecycle of data products, including the ability to edit them and remove them from the catalog. When a producer edits product metadata or adds or removes assets from a data product, they republish it as a new version, and subscriptions are updated without any reapproval.

Solution overview

To demonstrate these capabilities and workflows, consider a use case where a product marketing team wants to drive a campaign on product adoption. To be successful, they need access to sales data, customer data, and review data of similar products. The sales data engineer, acting as the data producer, owns this data and understands the common requests from customers to access these different data assets for sales-related analysis. The data producer’s objective is to group these assets so consumers, such as the product marketing team, can find them together and seamlessly subscribe to perform analysis.

The following high-level implementation steps show how to achieve this use case with data products in Amazon DataZone and are detailed in the following sections.

  1. Data publisher creates and publishes data product
    1. Create data product – The data publisher (the project contributor for the producing project) provides a name and description and adds assets to the data product.
    2. Curate data product – The data publisher adds a readme, glossaries, and metadata forms to the data product.
    3. Publish data product – The data publisher publishes the data product to make it discoverable to consumers.
  2. Data consumer discovers and subscribes to data product
    1. Search data product – The data consumer (the project member of the consuming project) looks for the desired data product in the catalog.
    2. Request subscription – The data consumer submits a request to access the data product.
    3. Data owner approves subscription request – The data owner reviews and approves the subscription request.
    4. Review access approval and grant – The system manages access grants for the underlying assets.
    5. Query subscribed data – The data consumer receives approval and can now access and query the data assets within the subscribed data product.
  3. Data owner maintains lifecycle of data product
    1. Revise data product – The data owner (the project owner for the producing project) updates the data product as needed.
    2. Unpublish data product – The data owner removes the data product from the catalog if necessary.
    3. Delete data product – The data owner permanently deletes the data product if it is no longer needed.
    4. Revoke subscription – The data owner manages subscriptions and revokes access if required.

Prerequisites

To follow along with this post, ensure the publisher of the product sales data asset has ingested individual data assets into Amazon DataZone. In our use case, a data engineer in sales owns the following AWS Glue tables: customers, order_items, orders, products, reviews, and shipments. The data engineer has added a data source to bring these six data assets into the sales producer project inventory, ingesting the metadata in Amazon DataZone. For instructions on ingesting metadata for AWS Glue tables, refer to Create and run an Amazon DataZone data source for the AWS Glue Data Catalog. For Amazon Redshift, see Create and run an Amazon DataZone data source for Amazon Redshift.

On the producer side, a sales product project has been created with a data lake environment. A data source was created to ingest the technical metadata from the AWS Glue salesdb database, which contains the six AWS Glue tables mentioned previously. On the consumer side, a marketing consumer project with a data lake environment has been established.

Data publisher creates and publishes data product

Sign in to Amazon DataZone data portal as a data publisher in the sales producer project. You can now create a data product to group inventory assets relevant to the sales analysis use case. Use the following steps to create and publish a data product, as shown in the following screenshot.

  1. Select DATA in the top ribbon of the Sales Product Project
  2. Select Inventory data in the navigation pane
  3. Choose DATA PRODUCTS to create a data product

Create data product

Follow these steps to create a data product:

  1. Choose Create new data product. Under Details, in the name field, enter “Sales Data Product.” In the description, enter “A data product containing the following 6 assets: Product, Shipments, Order Items, Orders, Customers, and Reviews,” as shown in the following screenshot.
  2. Select Choose assets to add the data assets. Select CHOOSE on the right side next to each of the six data products. Be sure to go to the second page to select the sixth asset. After all are selected, choose the blue CHOOSE button at the bottom of the page, as shown in the following screenshot. Then choose Create to create the data product.

Curate data product

You can curate the sales data product by adding a readme, glossary term, and metadata forms to provide business context to the data product, as shown in the following screenshot.

  1. Choose Add terms under GLOSSARY TERMS. Select a glossary term that you have added to your glossary, for example, Sales. Refer to Create, edit, or delete a business glossary for how to create a business glossary.
  2. Choose Add metadata form to add a form such as a business owner. Refer to Create, edit, or delete metadata forms for how to create a metadata form. In this example, we added Ownership as a metadata form.

Publish data product

Follow these steps to publish a data product.

  1. Once all the necessary business metadata has been added, choose Publish to publish the data product to the business catalog, as shown in the following screenshot.
  2. In the pop-up, choose Publish data product.

The six data assets in the data product will also be published but will only be discoverable through the data product unless published individually. Consumers cannot subscribe to the individual data assets unless they are published and made discoverable in the catalog separately.

Data consumer discovers and subscribes to data product

Now, as the marketing user, inside of the marketing project, you can find and subscribe to the sales data product.

Search data product

Sign in to the Amazon DataZone data portal as a marketing user in the marketing consumer project. In the search bar, enter “sales” or any other metadata that you added to the sales data product.

Once you find the appropriate data product, select it. You can view the metadata added and see which data assets are included in the data product by selecting the DATA ASSETS tab, as shown in the following screenshot.

Request subscription

Choose Subscribe to bring up the Subscribe to Sales Data Product modal. Make sure the project is your consumer project, for example, Marketing Consumer Project. In Reason for request, enter “Running a marketing campaign for the latest sales play.” Choose SUBSCRIBE.

The request will be routed to the sales producer project for approval.

Data owner approves subscription request

Sign in to Amazon DataZone as the project owner for the sales producer project to approve the request. You will see an alert in the task notification bar. Choose the notification icon on the top right to see the notifications, then choose Subscription Request Created, as shown in the following screenshot.

You can also view incoming subscription requests by choosing DATA in the blue ribbon at the top. Then choose Incoming requests in the navigation pane, REQUESTED under Incoming requests, and then View request, as shown in the following screenshot.

On the Subscription request pop-up, you will see who requested access to the Sales Data Product, from which project, the requested date and time, and their reason for requesting it. You can enter a Decision comment and then choose APPROVE.

Review access approval and grant

The marketing consumer is now approved to access the six assets included in the sales data product. Sign in to Amazon DataZone as a marketing user in the marketing consumer project. A new event will appear, showing that the SUBSCRIPTION REQUEST APPROVED has been completed.

You can view this in two different ways. Choose the notification icon on the top right and then EVENTS under Notifications, as shown in the first following screenshot. Alternatively, select DATA in the blue ribbon bar, then Subscribed data, and then Data products, as shown in the second following screenshot.

Choose the Sales Data Product and then Data assets. Amazon DataZone will automatically add the six data assets to the AWS Glue tables that the marketing consumer can use. Wait until you see that all six assets have been added to one environment, as shown in the following screenshot, before proceeding.

Query subscribed data

Once you complete the previous step, return to the main page of the marketing consumer project by choosing Marketing Consumer Project in the top left pull-down project selector, then choose OVERVIEW. The data can now be consumed through the Amazon Athena deep link on the right side. Choose Query data to open Athena, as shown in the following screenshot. In the Open Amazon Athena window, choose Open Amazon Athena.

A new window will open where the marketing consumer has been federated into the role that Amazon DataZone uses for granting permissions to the marketing consumer project data lake environment. The workgroup defaults to the appropriate workgroup that Amazon DataZone manages. Make sure that the Database under Data is the sub_db for the marketing consumer data lake environment. There will be six tables listed that correspond to the original six data assets added to the sales data product. Run your query. In this case, we used a query that looked for the top five best-selling products, as shown in the following code snippet and screenshot.

SELECT p.product_name, SUM(oi.quantity) AS total_quantity FROM order_items oi JOIN products p ON oi.product_id = p.product_idGROUP BY p.product_nameORDER BY total_quantity DESC 
LIMIT 5;

Data owner maintains lifecycle of data product

Follow these steps to maintain the lifecycle of the data product.

Revise data product

The data owner updates the data product, which includes editing metadata and adding or removing assets as needed. For detailed instructions, refer to Republish data products.

The sales data engineer has been tasked with removing one of the assets, the reviews table, from the sales data product.

  1. Open the SALES PRODUCER PROJECT by selecting it from the top project selector.
  2. Select DATA in the top ribbon.
  3. Select Published data in the navigation pane.
  4. Choose DATA PRODUCTS on the right side.
  5. Choose Sales Data Product.

The following screenshot shows these steps.

Once in the data product, the data engineer can add and remove metadata or assets. In To change any of the assets in the data product, follow these steps, as shown in the following screenshot.

  1. Select ASSETS in Sales Data Product.
  2. Select any of the assets. For this example, we remove the Reviews
  3. Select the three dots on the right side.
  4. Select Remove asset.
  5. A pop-up will appear confirming that you want to remove the asset. Choose Remove. The Reviews asset will now have a status of Removing asset: This asset is still available to subscribers.
  6. Republish the data product to remove access to this asset from all subscribers. Choose REPUBLISH and REPUBLISH DATA PRODUCT in the pop-up.
  7. To confirm the asset has been removed, sign in to the marketing project as the consumer. Open the Amazon Athena deep link on the OVERVIEW After selecting the sub_db associated with the marketing consumer data lake environment, only five tables are visible because the Reviews table was removed from the data product, as shown in the following screenshot.

The consumer doesn’t have to take any action after a data product has been republished. If the data engineer had changed any of the business metadata, such as by adding a metadata form, updating the readme, or adding glossary terms and republishing, the consumer would see those changes reflected when viewing the data product under the subscribed data.

Unpublish data product

The data owner removes the data product from the catalog, making it no longer discoverable to the organization. You can choose to retain existing subscription access for the underlying assets. For detailed instructions, refer to refer to Unpublish data product.

Delete data product

The data owner permanently deletes the data product if it is no longer needed. Before deletion, you need to revoke all subscriptions. This action will not delete the underlying data assets. For detailed instructions, refer to Delete Data Product.

Revoke subscription

The data owner manages subscriptions and may revoke a subscription after it has been approved. For detailed instructions, refer to Revoke subscription.

Cleanup

To ensure no additional charges are incurred after testing, be sure to delete the Amazon DataZone domain. Refer to Delete domains for the process.

Conclusion

Data products are crucial for improving decision-making accuracy and speed in modern businesses. Beyond making raw data available, they offer strategic packaging, curation, and discoverability. Data products help customers address the difficulty of locating and accessing fragmented data, which reduces the time and resources needed to perform this important task.

Amazon DataZone already facilitates data cataloging from various sources. Building on this capability, this new feature streamlines data utilization by bundling data into purpose-built data products aligned with business goals. As a result, customers can unlock the full potential of their data.

The feature is supported in all the AWS commercial Regions where Amazon DataZone is currently available. To get started, check out the Working with data products.


About the authors

Jason Hines is a Senior Solutions Architect, at AWS, specializing in serving global customers in the Healthcare and Life Sciences industries. With over 25 years of experience, he has worked with numerous Fortune 100 companies across multiple verticals, bringing a wealth of knowledge and expertise to his role. Outside of work, Jason has a passion for an active lifestyle. He enjoys various outdoor activities such as hiking, scuba diving, and exploring nature. Maintaining a healthy work-life balance is essential to him.

Ramesh H Singh is a Senior Product Manager Technical (External Services) at AWS in Seattle, Washington, currently with the Amazon DataZone team. He is passionate about building high-performance ML/AI and analytics products that enable enterprise customers to achieve their critical goals using cutting-edge technology. Connect with him on LinkedIn.

Leonardo Gomez is a Principal Analytics Specialist Solutions Architect at AWS. He has over a decade of experience in data management, helping customers around the globe address their business and technical needs. Connect with him on LinkedIn.

Federating access to Amazon DataZone with AWS IAM Identity Center and Okta

Post Syndicated from Carlos Gallegos original https://aws.amazon.com/blogs/big-data/federating-access-to-amazon-datazone-with-aws-iam-identity-center-and-okta/

Many customers rely today on Okta or other identity providers (IdPs) to federate access to their technology stack and tools. With federation, security teams can centralize user management in a single place, which helps simplify and brings agility to their day-to-day operations while keeping highest security standards.

To help develop a data-driven culture, everyone inside an organization can use Amazon DataZone. To realize the benefits of using Amazon DataZone for governing data and making it discoverable and available across different teams for collaboration, customers integrate it with their current technology stack. Handling access through their identity provider and preserving a familiar single sign-on (SSO) experience enables customers to extend the use of Amazon DataZone to users across teams in the organization without any friction while keeping centralized control.

Amazon DataZone is a fully managed data management service that makes it faster and simpler for customers to catalog, discover, share, and govern data stored across Amazon Web Services (AWS), on premises, and third-party sources. It also makes it simpler for data producers, analysts, and business users to access data throughout an organization so that they can discover, use, and collaborate to derive data-driven insights.

You can use AWS IAM Identity Center to securely create and manage identities for your organization’s workforce, or sync and use identities that are already set up and available in Okta or other identity provider, to keep centralized control of them. With IAM Identity Center you can also manage the SSO experience of your organization centrally, across your AWS accounts and applications.

This post guides you through the process of setting up Okta as an identity provider for signing in users to Amazon DataZone. The process uses IAM Identity Center and its native integration with Amazon DataZone to integrate with external identity providers. Note that, even though this post focuses on Okta, the presented pattern relies on the SAML 2.0 standard and so can be replicated with other identity providers.

Prerequisites

To build the solution presented in this post, you must have:

Process overview

Throughout this post you’ll follow these high-level steps:

  1. Establish a SAML connection between Okta and IAM Identity Center
  2. Set up automatic provisioning of users and groups in IAM Identity Center so that users and groups in the Okta domain are created in Identity Center.
  3. Assign users and groups to your AWS accounts in IAM Identity Center by assuming an AWS Identity and Access Management (IAM) role.
  4. Access the AWS Management Console and Amazon DataZone portal through Okta SSO.
  5. Manage Amazon DataZone specific permissions in the Amazon DataZone portal.

Setting up user federation with Okta and IAM Identity Center

This guide follows the steps in Configure SAML and SCIM with Okta and IAM Identity Center.

Before you get started, review the following items in your Okta setup:

  • Every Okta user must have a First name, Last name, Username and Display name value specified.
  • Each Okta user has only a single value per data attribute, such as email address or phone number. Users that have multiple values will fail to synchronize. If there are users that have multiple values in their attributes, remove the duplicate attributes before attempting to provision the user in IAM Identity Center. For example, only one phone number attribute can be synchronized. Because the default phone number attribute is work phone, use the work phone attribute to store the user’s phone number, even if the phone number for the user is a home phone or a mobile phone.
  • If you update a user’s address you must have streetAddress, city, state, zipCode and the countryCode value specified. If any of these values aren’t specified for the Okta user at the time of synchronization, the user (or changes to the user) won’t be provisioned.

Okta account

1) Establish a SAML connection between Okta and AWS IAM Identity Center

Now, let’s establish a SAML connection between Okta and AWS IAM Identity Center. First, you’ll create an application in Okta to establish the connection:

  1. Sign in to the Okta admin dashboard, expand Applications, then select Applications.
  2. On the Applications page, choose Browse App Catalog.
  3. In the search box, enter AWS IAM Identity Center, then select the app to add the IAM Identity Center app.

IAM identity center app in Okta

  1. Choose the Sign On tab.

IAM identity center app in Okta - sign on

  1. Under SAML Signing Certificates, select Actions, and then select View IdP Metadata. A new browser tab opens showing the document tree of an XML file. Select all of the XML from <md:EntityDescriptor> to </md:EntityDescriptor> and copy it to a text file.
  2. Save the text file as metadata.xml.

Identity provider metadata in Okta

Leave the Okta admin dashboard open, you will continue using it in the later steps.

Second, you’re going to set up Okta as an external identity provider in IAM Identity Center:

  1. Open the IAM Identity Center console as a user with administrative privileges.
  2. Choose Settings in the navigation pane.
  3. On the Settings page, choose Actions, and then select Change identity source.

Identity provider source in IAM identity center

  1. Under Choose identity source, select External identity provider, and then choose Next.

Identity provider source in IAM identity center

  1. Under Configure external identity provider, do the following:
    1. Under Service provider metadata, choose Download metadata file to download the IAM Identity Center metadata file and save it on your system. You will provide the Identity Center SAML metadata file to Okta later in this tutorial.
      1. Copy the following items to a text file for easy access (you’ll need these values later):
        • IAM Identity Center Assertion Consumer Service (ACS) URL
        • IAM Identity Center issuer URL
    2. Under Identity provider metadata, under IdP SAML metadata, choose Choose file and then select the metadata.xml file you created in the previous step.
    3. Choose Next.
  2. After you read the disclaimer and are ready to proceed, enter accept.
  3. Choose Change identity source.

Identity provider source in IAM identity center

Leave the AWS console open, because you will use it in the next procedure.

  1. Return to the Okta admin dashboard and choose the Sign On tab of the IAM Identity Center app, then choose Edit.
  2. Under Advanced Sign-on Settings enter the following:
    1. For ACS URL, enter the value you copied for IAM Identity Center Assertion Consumer Service (ACS) URL.
    2. For Issuer URL, enter the value you copied for IAM Identity Center issuer URL.
    3. For Application username format, select one of the options from the drop-down menu.
      Make sure the value you select is unique for each user. For this tutorial, select Okta username.
  3. Choose Save.

IAM identity center app in Okta - sign on

2) Set up automatic provisioning of users and groups in AWS IAM Identity Center

You are now able to set up automatic provisioning of users from Okta into IAM Identity Center. Leave the Okta admin dashboard open and return to the IAM Identity Center console for the next step.

  1. In the IAM Identity Center console, on the Settings page, locate the Automatic provisioning information box, and then choose Enable. This enables automatic provisioning in IAM Identity Center and displays the necessary System for Cross-domain Identity Management (SCIM) endpoint and access token information.

Automatic provisioning in IAM identity center

  1. In the Inbound automatic provisioning dialog box, copy each of the values for the following options:
    • SCIM endpoint
    • Access token

You will use these values to configure provisioning in Okta later.

  1. Choose Close.

Automatic provisioning in IAM identity center

  1. Return to the Okta admin dashboard and navigate to the IAM Identity Center app.
  2. On the AWS IAM Identity Center app page, choose the Provisioning tab, and then in the navigation pane, under Settings, choose Integration.
  3. Choose Edit, and then select the check box next to Enable API integration to enable provisioning.
  4. Configure Okta with the SCIM provisioning values from IAM Identity Center that you copied earlier:
    1. In the Base URL field, enter the SCIM endpoint Make sure that you remove the trailing forward slash at the end of the URL.
    2. In the API Token field, enter the Access token value.
  5. Choose Test API Credentials to verify the credentials entered are valid. The message AWS IAM Identity Center was verified successfully! displays.
  6. Choose Save. You are taken to the Settings area, with Integration selected.

API Integration in Okta

  1. Review the following setup before moving forward. In the Provisioning tab, in the navigation pane under Settings, choose To App. Check that all options are enabled. They should be enabled by default, but if not, enable them.

Application provision in Okta

3) Assign users and groups to your AWS accounts in AWS IAM Identity Center by assuming an AWS IAM role

By default, no groups nor users are assigned to your Okta IAM Identity Center app. Complete the following steps to synchronize users with IAM Identity Center.

  1. In the Okta IAM Identity Center app page, choose the Assignments tab. You can assign both people and groups to the IAM Identity Center app.
    1. To assign people:
      1. In the Assignments page, choose Assign, and then choose Assign to people.
      2. Select the Okta users that you want to have access to the IAM Identity Center app. Choose Assign, choose Save and Go Back, and then choose Done.
        This starts the process of provisioning the individual users into IAM Identity Center.

      Users assignment in Okta

    1. To assign groups:
      1. Choose the Push Groups tab. You can create rules to automatically provision Okta groups into IAM Identity Center.

      Groups assignment in Okta

      1. Choose the Push Groups drop-down list and select Find groups by rule.
      2. In the By rule section, set a rule name and a condition. For this post we’re using AWS SSO Rule as rule name and starts with awssso as a group name condition. This condition can be different depending on the name of the group you want to sync.
      3. Choose Create Rule

      Okta SSO group rule

      1. (Optional) To create a new group choose Directory in the navigation pane, and then choose Groups.

      Group creation in Okta

      1. Choose Add group and enter a name, and then choose Save.

      Group creation in Okta

      1. After you have created the group, you can assign people to it. Select the group name to manage the group’s users.

      Group user assign in Okta

      1. Choose Assign people and select the users that you want to assign to the group.

      Group user assign in Okta

      1. You will see the users that are assigned to the group.

      Group user assign in Okta

      1. Going back to Applications in the navigation pane, select the AWS IAM Identity Center app and choose the Push Groups tab. You should have the groups that match the rule synchronized between Okta and IAM Identity Center. The group status should be set to Active after the group and its members are updated in Identity Center.

      Active groups in Okta

  1. Return to the IAM Identity Center console. In the navigation pane, choose Users. You should see the user list that was updated by Okta.

Active users in IAM identity center

  1. In the left navigation, select Groups, you should see the group list that was updated by Okta.

Active groups in IAM identity center

Congratulations! You have successfully set up a SAML connection between Okta and AWS and have verified that automatic provisioning is working.

OPTIONAL: If you need to provide Amazon DataZone console access to the Okta users and groups, you can manage these permissions through the IAM Identity Center console.

  1. In the IAM Identity Center navigation pane, under Multi-account permissions, choose AWS accounts.
  2. On the AWS accounts page, the Organizational structure displays your organizational root with your accounts underneath it in the hierarchy. Select the checkbox for your management account, then choose Assign users or groups.

IAM Roles in IAM identity center

  1. The Assign users and groups workflow displays. It consists of three steps:
    1. For Step 1: Select users and groups choose the user that will be performing the administrator job function. Then choose Next.
    2. For Step 2: Select permission sets choose Create permission set to open a new tab that steps you through the three sub-steps involved in creating a permission set.
      1. For Step 1: Select permission set type complete the following:
        • In Permission set type, choose Predefined permission set.
        • In Policy for predefined permission set, choose AdministratorAccess.
      2. Choose Next.
      3. For Step 2: Specify permission set details, keep the default settings, and choose Next.
        The default settings create a permission set named AdministratorAccess with session duration set to one hour. You can also specify reduced permissions with a custom policy just to allow Amazon DataZone console access.
      4. For Step 3: Review and create, verify that the Permission set type uses the AWS managed policy AdministratorAccess or your custom policy. Choose Create. On the Permission sets page, a notification appears informing you that the permission set was created. You can close this tab in your web browser now.
  2. On the Assign users and groups browser tab, you are still on Step 2: Select permission sets from which you started the create permission set workflow.
  3. In the Permissions sets area, Refresh. The AdministratorAccess permission or your custom policy set you created appears in the list. Select the checkbox for that permission set, and then choose Next.

IAM Roles in IAM identity center

    1. For Step 3: Review and submit review the selected user and permission set, then choose Submit.
      The page updates with a message that your AWS account is being configured. Wait until the process completes.
    2. You are returned to the AWS accounts page. A notification message informs you that your AWS account has been re-provisioned, and the updated permission set is applied. When a user signs in, they will have the option of choosing the AdministratorAccess role or a custom policy role.

4) Access the AWS console and Amazon DataZone portal through Okta SSO

Now, you can test your user access into the console and Amazon DataZone portal using the Okta external identity application.

  1. Sign in to the Okta dashboard using a test user account.
  2. Under My Apps, select the AWS IAM Identity Center icon.

IAM identity center access in Okta

  1. Complete the authentication process using your Okta credentials.

IAM identity center access in Okta

4.1) For administrative users

  1. You’re signed in to the portal and can see the AWS account icon. Expand that icon to see the list of AWS accounts that the user can access. In this tutorial, you worked with a single account, so expanding the icon only shows one account.
  2. Select the account to display the permission sets available to the user. In this tutorial you created the AdministratorAccess permission set.
  3. Next to the permission set are links for the type of access available for that permission set. When you created the permission set, you specified both management console and programmatic access be enabled, so those two options are present. Select Management console to open the console.

AWS Management console

  1. The user is signed in to the console. Using the search bar, look for Amazon DataZone service and open it.
  2. Open the Amazon DataZone console and make sure you have enabled SSO users through IAM Identity Center. In case you haven’t, you can follow the steps in Enable IAM Identity Center for Amazon DataZone.

Note: In this post, we followed the default IAM Identity Center for Amazon DataZone configuration, which has implicit user assignment mode enabled. With this option, any user added to your Identity Center directory can access your Amazon DataZone domain automatically. If you opt for using explicit user assignment instead, remember that you need to manually add users to your Amazon DataZone domain in the Amazon DataZone console for them to have access.
To learn more about how to manage user access to an Amazon DataZone domain, see Manage users in the Amazon DataZone console.

  1. Choose the Open data portal to access the Amazon DataZone Portal.

DataZone console

4.2) For all other users

  1. Choose the Applications tab in the AWS access portal window and choose the Amazon DataZone data portal application link.

DataZone application

  1. In the Amazon DataZone data portal, choose SIGN IN WITH SSO to continue

DataZone portal

Congratulations! Now you’re signed in to the Amazon DataZone data portal using your user that’s managed by Okta.

DataZone portal

5) Manage Amazon DataZone specific permissions in the Amazon DataZone portal

After you have access to the Amazon DataZone portal, you can work with projects, the data assets within, environments, and other constructs that are specific to Amazon DataZone. A project is the overarching construct that brings together people, data, and analytics tools. A project has two roles: owner and contributor. Next, you’ll learn how a user can be made an owner or contributor of existing projects.

These steps must be completed by the existing project owner in the Amazon DataZone portal:

  1. Open the Amazon DataZone portal, select the project in the drop-down list on the left top of the portal and choose the project you own

DataZone project

  1. In the project window, choose the Members tab to see the current users in the project and add a new one.

DataZone project members

  1. Choose Add Members to add a new user. Make sure the User type is SSO User to add an Okta user. Look for the Okta user in the name drop-down list, select it, and select a project role for it. Finally, choose Add Members to add the user.

DataZone project members

  1. The Okta user has been granted the selected project role and can interact with the project, assets, and tools.

DataZone project members

  1. You can also grant permissions to SSO Groups. Choose Add members, then select SSO group in the drop-down list, next select the Group name, set the assigned project role, and choose Add Members.

DataZone project members

  1. The Okta group has been granted the project role and can interact with the project, assets, and tools.

DataZone project members

You can also manage SSO user and group access to the Amazon DataZone data portal from the console. See Manage users in the Amazon DataZone console for additional details.

Clean up

To ensure a seamless experience and avoid any future charges, we kindly request that you follow these steps:

By following these steps, you can effectively clean up the resources utilized in this blog post and prevent any unnecessary charges from accruing.

Summary

In this post, you followed a step-by-step guide to set up and use Okta to federate access to Amazon DataZone with AWS IAM Identity Center. You also learned how to group users and manage their permission in Amazon DataZone. As a final thought, now that you’re familiar with the elements involved in the integration of an external identity provider such as Okta to federate access to Amazon DataZone, you’re ready to try it with other identity providers.

To learn more about, see Managing Amazon DataZone domains and user access.


About the Authors

Carlos Gallegos is a Senior Analytics Specialist Solutions Architect at AWS. Based in Austin, TX, US. He’s an experienced and motivated professional with a proven track record of delivering results worldwide. He specializes in architecture, design, migrations, and modernization strategies for complex data and analytics solutions, both on-premises and on the AWS Cloud. Carlos helps customers accelerate their data journey by providing expertise in these areas. Connect with him on LinkedIn.

Jose Romero is a Senior Solutions Architect for Startups at AWS. Based in Austin, TX, US. He’s passionate about helping customers architect modern platforms at scale for data, AI, and ML. As a former senior architect in AWS Professional Services, he enjoys building and sharing solutions for common complex problems so that customers can accelerate their cloud journey and adopt best practices. Connect with him on LinkedIn.

Arun Pradeep Selvaraj is a Senior Solutions Architect at AWS. Arun is passionate about working with his customers and stakeholders on digital transformations and innovation in the cloud while continuing to learn, build, and reinvent. He is creative, fast-paced, deeply customer-obsessed and uses the working backwards process to build modern architectures to help customers solve their unique challenges. Connect with him on LinkedIn.

Get started with the new Amazon DataZone enhancements for Amazon Redshift

Post Syndicated from Carmen Manzulli original https://aws.amazon.com/blogs/big-data/get-started-with-the-new-amazon-datazone-enhancements-for-amazon-redshift/

In today’s data-driven landscape, organizations are seeking ways to streamline their data management processes and unlock the full potential of their data assets, while controlling access and enforcing governance. That’s why we introduced Amazon DataZone.

Amazon DataZone is a powerful data management service that empowers data engineers, data scientists, product managers, analysts, and business users to seamlessly catalog, discover, analyze, and govern data across organizational boundaries, AWS accounts, data lakes, and data warehouses.

On March 21, 2024, Amazon DataZone introduced several exciting enhancements to its Amazon Redshift integration that simplify the process of publishing and subscribing to data warehouse assets like tables and views, while enabling Amazon Redshift customers to take advantage of the data management and governance capabilities or Amazon DataZone.

These updates empower the experience for both data users and administrators.

Data producers and consumers can now quickly create data warehouse environments using preconfigured credentials and connection parameters provided by their Amazon DataZone administrators.

Additionally, these enhancements grant administrators greater control over who can access and use the resources within their AWS accounts and Redshift clusters, and for what purpose.

As an administrator, you can now create parameter sets on top of DefaultDataWarehouseBlueprint by providing parameters such as cluster, database, and an AWS secret. You can use these parameter sets to create environment profiles and authorize Amazon DataZone projects to use these environment profiles for creating environments.

In turn, data producers and data consumers can now select an environment profile to create environments without having to provide the parameters themselves, saving time and reducing the risk of issues.

In this post, we explain how you can use these enhancements to the Amazon Redshift integration to publish your Redshift tables to the Amazon DataZone data catalog, and enable users across the organization to discover and access them in a self-service fashion. We present a sample end-to-end customer workflow that covers the core functionalities of Amazon DataZone, and include a step-by-step guide of how you can implement this workflow.

The same workflow is available as video demonstration on the Amazon DataZone official YouTube channel.

Solution overview

To get started with the new Amazon Redshift integration enhancements, consider the following scenario:

  • A sales team acts as the data producer, owning and publishing product sales data (a single table in a Redshift cluster called catalog_sales)
  • A marketing team acts as the data consumer, needing access to the sales data in order to analyze it and build product adoption campaigns

At a high level, the steps we walk you through in the following sections include tasks for the Amazon DataZone administrator, Sales team, and Marketing team.

Prerequisites

For the workflow described in this post, we assume a single AWS account, a single AWS Region, and a single AWS Identity and Access Management (IAM) user, who will act as Amazon DataZone administrator, Sales team (producer), and Marketing team (consumer).

To follow along, you need an AWS account. If you don’t have an account, you can create one.

In addition, you must have the following resources configured in your account:

  • An Amazon DataZone domain with admin, sales, and marketing projects
  • A Redshift namespace and workgroup

If you don’t have these resources already configured, you can create them by deploying an AWS CloudFormation stack:

  1. Choose Launch Stack to deploy the provided CloudFormation template.
  2. For AdminUserPassword, enter a password, and take note of this password to use in later steps.
  3. Leave the remaining settings as default.
  4. Select I acknowledge that AWS CloudFormation might create IAM resources, then choose Submit.
  5. When the stack deployment is complete, on the Amazon DataZone console, choose View domains in the navigation pane to see the new created Amazon DataZone domain.
  6. On the Amazon Redshift Serverless console, in the navigation pane, choose Workgroup configuration and see the new created resource.

You should be logged in using the same role that you used to deploy the CloudFormation stack and verify that you’re in the same Region.

As a final prerequisite, you need to create a catalog_sales table in the default Redshift database (dev).

  1. On the Amazon Redshift Serverless console, selected your workgroup and choose Query data to open the Amazon Redshift query editor.
  2. In the query editor, choose your workgroup and select Database user name and password as the type of connection, then provide your admin database user name and password.
  3. Use the following query to create the catalog_sales table, which the Sales team will publish in the workflow:
    CREATE TABLE catalog_sales AS 
    SELECT 146776932 AS order_number, 23 AS quantity, 23.4 AS wholesale_cost, 45.0 as list_price, 43.0 as sales_price, 2.0 as discount, 12 as ship_mode_sk,13 as warehouse_sk, 23 as item_sk, 34 as catalog_page_sk, 232 as ship_customer_sk, 4556 as bill_customer_sk
    UNION ALL SELECT 46776931, 24, 24.4, 46, 44, 1, 14, 15, 24, 35, 222, 4551
    UNION ALL SELECT 46777394, 42, 43.4, 60, 50, 10, 30, 20, 27, 43, 241, 4565
    UNION ALL SELECT 46777831, 33, 40.4, 51, 46, 15, 16, 26, 33, 40, 234, 4563
    UNION ALL SELECT 46779160, 29, 26.4, 50, 61, 8, 31, 15, 36, 40, 242, 4562
    UNION ALL SELECT 46778595, 43, 28.4, 49, 47, 7, 28, 22, 27, 43, 224, 4555
    UNION ALL SELECT 46779482, 34, 33.4, 64, 44, 10, 17, 27, 43, 52, 222, 4556
    UNION ALL SELECT 46779650, 39, 37.4, 51, 62, 13, 31, 25, 31, 52, 224, 4551
    UNION ALL SELECT 46780524, 33, 40.4, 60, 53, 18, 32, 31, 31, 39, 232, 4563
    UNION ALL SELECT 46780634, 39, 35.4, 46, 44, 16, 33, 19, 31, 52, 242, 4557
    UNION ALL SELECT 46781887, 24, 30.4, 54, 62, 13, 18, 29, 24, 52, 223, 4561

Now you’re ready to get started with the new Amazon Redshift integration enhancements.

Amazon DataZone administrator tasks

As the Amazon DataZone administrator, you perform the following tasks:

  1. Configure the DefaultDataWarehouseBlueprint.
    • Authorize the Amazon DataZone admin project to use the blueprint to create environment profiles.
    • Create a parameter set on top of DefaultDataWarehouseBlueprint by providing parameters such as cluster, database, and AWS secret.
  2. Set up environment profiles for the Sales and Marketing teams.

Configure the DefaultDataWarehouseBlueprint

Amazon DataZone blueprints define what AWS tools and services are provisioned to be used within an Amazon DataZone environment. Enabling the data warehouse blueprint will allow data consumers and data producers to use Amazon Redshift and the Query Editor for data sharing, accessing, and consuming.

  1. On the Amazon DataZone console, choose View domains in the navigation pane.
  2. Choose your Amazon DataZone domain.
  3. Choose Default Data Warehouse.

If you used the CloudFormation template, the blueprint is already enabled.

Part of the new Amazon Redshift experience involves the Managing projects and Parameter sets tabs. The Managing projects tab lists the projects that are allowed to create environment profiles using the data warehouse blueprint. By default, this is set to all projects. For our purpose, let’s grant only the admin project.

  1. On the Managing projects tab, choose Edit.

  1. Select Restrict to only managing projects and choose the AdminPRJ project.
  2. Choose Save changes.

With this enhancement, the administrator can control which projects can use default blueprints in their account to create environment profile

The Parameter sets tab lists parameters that you can create on top of DefaultDataWarehouseBlueprint by providing parameters such as Redshift cluster or Redshift Serverless workgroup name, database name, and the credentials that allow Amazon DataZone to connect to your cluster or workgroup. You can also create AWS secrets on the Amazon DataZone console. Before these enhancements, AWS secrets had to be managed separately using AWS Secrets Manager, making sure to include the proper tags (key-value) for Amazon Redshift Serverless.

For our scenario, we need to create a parameter set to connect a Redshift Serverless workgroup containing sales data.

  1. On the Parameter sets tab, choose Create parameter set.
  2. Enter a name and optional description for the parameter set.
  3. Choose the Region containing the resource you want to connect to (for example, our workgroup is in us-east-1).
  4. In the Environment parameters section, select Amazon Redshift Serverless.

If you already have an AWS secret with credentials to your Redshift Serverless workgroup, you can provide the existing AWS secret ARN. In this case, the secret must be tagged with the following (key-value): AmazonDataZoneDomain: <Amazon DataZone domain ID>.

  1. Because we don’t have an existing AWS secret, we create a new one by choosing Create new AWS Secret.
  2. In the pop-up, enter a secret name and your Amazon Redshift credentials, then choose Create new AWS Secret.

Amazon DataZone creates a new secret using Secrets Manager and makes sure the secret is tagged with the domain in which you’re creating the parameter set.

  1. Enter the Redshift Serverless workgroup name and database name to complete the parameters list. If you used the provided CloudFormation template, use sales-workgroup for the workgroup name and dev for the database name.
  2. Choose Create parameter set.

You can see the parameter set created for your Redshift environment and the blueprint enabled with a single managing project configured.


Set up environment profiles for the Sales and Marketing teams

Environment profiles are predefined templates that encapsulate technical details required to create an environment, such as the AWS account, Region, and resources and tools to be added to projects. The next Amazon DataZone administrator task consists of setting up environment profiles, based on the default enabled blueprint, for the Sales and Marketing teams.

This task will be performed from the admin project in the Amazon DataZone data portal, so let’s follow the data portal URL and start creating an environment profile for the Sales team to publish their data.

  1. On the details page of your Amazon DataZone domain, in the Summary section, choose the link for your data portal URL.

When you open the data portal for the first time, you’re prompted to create a project. If you used the provided CloudFormation template, the projects are already created.

  1. Choose the AdminPRJ project.
  2. On the Environments page, choose Create environment profile.
  3. Enter a name (for example, SalesEnvProfile) and optional description (for example, Sales DWH Environment Profile) for the new environment profile.
  4. For Owner, choose AdminPRJ.
  5. For Blueprint, select the DefaultDataWarehouse blueprint (you’ll only see blueprints where the admin project is listed as a managing project).
  6. Choose the current enabled account and the parameter set you previously created.

Then you will see each pre-compiled value for Redshift Serverless. Under Authorized projects, you can pick the authorized projects allowed to use this environment profile to create an environment. By default, this is set to All projects.

  1. Select Authorized projects only.
  2. Choose Add projects and choose the SalesPRJ project.
  3. Configure the publishing permissions for this environment profile. Because the Sales team is our data producer, we select Publish from any schema.
  4. Choose Create environment profile.

Next, you create a second environment profile for the Marketing team to consume data. To do this, you repeat similar steps made for the Sales team.

  1. Choose the AdminPRJ project.
  2. On the Environments page, choose Create environment profile.
  3. Enter a name (for example, MarketingEnvProfile) and optional description (for example, Marketing DWH Environment Profile).
  4. For Owner, choose AdminPRJ.
  5. For Blueprint, select the DefaultDataWarehouse blueprint.
  6. Select the parameter set you created earlier.
  7. This time, keep All projects as the default (alternatively, you could select Authorized projects only and add MarketingPRJ).
  8. Configure the publishing permissions for this environment profile. Because the Marketing team is our data consumer, we select Don’t allow publishing.
  9. Choose Create environment profile.

With these two environment profiles in place, the Sales and Marketing teams can start working on their projects on their own to create their proper environments (resources and tools) with fewer configurations and less risk to incur errors, and publish and consume data securely and efficiently within these environments.

To recap, the new enhancements offer the following features:

  • When creating an environment profile, you can choose to provide your own Amazon Redshift parameters or use one of the parameter sets from the blueprint configuration. If you choose to use the parameter set created in the blueprint configuration, the AWS secret only requires the AmazonDataZoneDomain tag (the AmazonDataZoneProject tag is only required if you choose to provide your own parameter sets in the environment profile).
  • In the environment profile, you can specify a list of authorized projects, so that only authorized projects can use this environment profile to create data warehouse environments.
  • You can also specify what data authorized projects are allowed to be published. You can choose one of the following options: Publish from any schema, Publish from the default environment schema, and Don’t allow publishing.

These enhancements grant administrators more control over Amazon DataZone resources and projects and facilitate the common activities of all roles involved.

Sales team tasks

As a data producer, the Sales team performs the following tasks:

  1. Create a sales environment.
  2. Create a data source.
  3. Publish sales data to the Amazon DataZone data catalog.

Create a sales environment

Now that you have an environment profile, you need to create an environment in order to work with data and analytics tools in this project.

  1. Choose the SalesPRJ project.
  2. On the Environments page, choose Create environment.
  3. Enter a name (for example, SalesDwhEnv) and optional description (for example, Environment DWH for Sales) for the new environment.
  4. For Environment profile, choose SalesEnvProfile.

Data producers can now select an environment profile to create environments, without the need to provide their own Amazon Redshift parameters. The AWS secret, Region, workgroup, and database are ported over to the environment from the environment profile, streamlining and simplifying the experience for Amazon DataZone users.

  1. Review your data warehouse parameters to confirm everything is correct.
  2. Choose Create environment.

The environment will be automatically provisioned by Amazon DataZone with the preconfigured credentials and connection parameters, allowing the Sales team to publish Amazon Redshift tables seamlessly.

Create a data source

Now, let’s create a new data source for our sales data.

  1. Choose the SalesPRJ project.
  2. On the Data page, choose Create data source.
  3. Enter a name (for example, SalesDataSource) and optional description.
  4. For Data source type, select Amazon Redshift.
  5. For Environment¸ choose SalesDevEnv.
  6. For Redshift credentials, you can use the same credentials you provided during environment creation, because you’re still using the same Redshift Serverless workgroup.
  7. Under Data Selection, enter the schema name where your data is located (for example, public) and then specify a table selection criterion (for example, *).

Here, the * indicates that this data source will bring into Amazon DataZone all the technical metadata from the database tables of your schema (in this case, a single table called catalog_sales).

  1. Choose Next.

On the next page, automated metadata generation is enabled. This means that Amazon DataZone will automatically generate the business names of the table and columns for that asset. 

  1. Leave the settings as default and choose Next.
  2. For Run preference, select when to run the data source. Amazon DataZone can automatically publish these assets to the data catalog, but let’s select Run on demand so we can curate the metadata before publishing.
  3. Choose Next.
  4. Review all settings and choose Create data source.
  5. After the data source has been created, you can manually pull technical metadata from the Redshift Serverless workgroup by choosing Run.

When the data source has finished running, you can see the catalog_sales asset correctly added to the inventory.

Publish sales data to the Amazon DataZone data catalog

Open the catalog_sales asset to see details of the new asset (business metadata, technical metadata, and so on).

In a real-world scenario, this pre-publishing phase is when you can enrich the asset providing more business context and information, such as a readme, glossaries, or metadata forms. For example, you can start accepting some metadata automatically generated recommendations and rename the asset or its columns in order to make them more readable, descriptive, and easy to search and understand from a business user.

For this post, simply choose Publish asset to complete the Sales team tasks.

Marketing team tasks

Let’s switch to the Marketing team and subscribe to the catalog_sales asset published by the Sales team. As a consumer team, the Marketing team will complete the following tasks:

  1. Create a marketing environment.
  2. Discover and subscribe to sales data.
  3. Query the data in Amazon Redshift.

Create a marketing environment

To subscribe and access Amazon DataZone assets, the Marketing team needs to create an environment.

  1. Choose the MarketingPRJ project.
  2. On the Environments page, choose Create environment.
  3. Enter a name (for example, MarketingDwhEnv) and optional description (for example, Environment DWH for Marketing).
  4. For Environment profile, choose MarketingEnvProfile.

As with data producers, data consumers can also benefit from a pre-configured profile (created and managed by the administrator) in order to speed up the environment creation process, avoiding mistakes and reducing risks of errors.

  1. Review your data warehouse parameters to confirm everything is correct.
  2. Choose Create environment.

Discover and subscribe to sales data

Now that we have a consumer environment, let’s search the catalog_sales table in the Amazon DataZone data catalog.

  1. Enter sales in the search bar.
  2. Choose the catalog_sales table.
  3. Choose Subscribe.
  4. In the pop-up window, choose your marketing consumer project, provide a reason for the subscription request, and choose Subscribe.

When you get a subscription request as a data producer, Amazon DataZone will notify you through a task in the sales producer project. Because you’re acting as both subscriber and publisher here, you will see a notification.

  1. Choose the notification, which will open the subscription request.

You can see details including which project has requested access, who is the requestor, and why access is needed.

  1. To approve, enter a message for approval and choose Approve.

Now that subscription has been approved, let’s go back to the MarketingPRJ. On the Subscribed data page, catalog_sales is listed as an approved asset, but access hasn’t been granted yet. If we choose the asset, you can see that Amazon DataZone is working on the backend to automatically grant the access. When it’s complete, you’ll see the subscription as granted and the message “Asset added to 1 environment.”

Query data in Amazon Redshift

Now that the marketing project has access to the sales data, we can use the Amazon Redshift Query Editor V2 to analyze the sales data.

  1. Under MarketingPRJ, go to the Environments page and select the marketing environment.
  2. Under the analytics tools, choose Query data with Amazon Redshift, which redirects you to the query editor within the environment of the project.
  3. To connect to Amazon Redshift, choose your workgroup and select Federated user as the connection type.

When you’re connected, you will see the catalog_sales table under the public schema.

  1. To make sure that you have access to this table, run the following query:
SELECT * FROM catalog_sales LIMIT 10

As a consumer, you’re now able to explore data and create reports, or you can aggregate data and create new assets to publish in Amazon DataZone, becoming a producer of a new data product to share with other users and departments.

Clean up

To clean up your resources, complete the following steps:

  1. On the Amazon DataZone console, delete the projects used in this post. This will delete most project-related objects like data assets and environments.
  2. Clean up all Amazon Redshift resources (workgroup and namespace) to avoid incurring additional charges.

Conclusion

In this post, we demonstrated how you can get started with the new Amazon Redshift integration in Amazon DataZone. We showed how to streamline the experience for data producers and consumers and how to grant administrators control over data resources.

Embrace these enhancements and unlock the full potential of Amazon DataZone and Amazon Redshift for your data management needs.

Resources

For more information, refer to the following resources:


About the author

Carmen is a Solutions Architect at AWS, based in Milan (Italy). She is a Data Lover that enjoys helping companies in the adoption of Cloud technologies, especially with Data Analytics and Data Governance. Outside of work, she is a creative people who loves being in contact with nature and sometimes practicing adrenaline activities.

How ATPCO enables governed self-service data access to accelerate innovation with Amazon DataZone

Post Syndicated from Brian Olsen original https://aws.amazon.com/blogs/big-data/how-atpco-enables-governed-self-service-data-access-to-accelerate-innovation-with-amazon-datazone/

This blog post is co-written with Raj Samineni  from ATPCO.

In today’s data-driven world, companies across industries recognize the immense value of data in making decisions, driving innovation, and building new products to serve their customers. However, many organizations face challenges in enabling their employees to discover, get access to, and use data easily with the right governance controls. The significant barriers along the analytics journey constrain their ability to innovate faster and make quick decisions.

ATPCO is the backbone of modern airline retailing, enabling airlines and third-party channels to deliver the right offers to customers at the right time. ATPCO’s reach is impressive, with its fare data covering over 89% of global flight schedules. The company collaborates with more than 440 airlines and 132 channels, managing and processing over 350 million fares in its database at any given time. ATPCO’s vision is to be the platform driving innovation in airline retailing while remaining a trusted partner to the airline ecosystem. ATPCO aims to empower data-driven decision-making by making high quality data discoverable by every business unit, with the appropriate governance on who can access what.

In this post, using one of ATPCO’s use cases, we show you how ATPCO uses AWS services, including Amazon DataZone, to make data discoverable by data consumers across different business units so that they can innovate faster. We encourage you to read Amazon DataZone concepts and terminologies first to become familiar with the terms used in this post.

Use case

One of ATPCO’s use cases is to help airlines understand what products, including fares and ancillaries (like premium seat preference), are being offered and sold across channels and customer segments. To support this need, ATPCO wants to derive insights around product performance by using three different data sources:

  • Airline Ticketing data – 1 billion airline ticket sales data processed through ATPCO
  • ATPCO pricing data – 87% of worldwide airline offers are powered through ATPCO pricing data. ATPCO is the industry leader in providing pricing and merchandising content for airlines, global distribution systems (GDSs), online travel agencies (OTAs), and other sales channels for consumers to visually understand differences between various offers.
  • De-identified customer master data – ATPCO customer master data that has been de-identified for sensitive internal analysis and compliance.

In order to generate insights that will then be shared with airlines as a data product, an ATPCO analyst needs to be able to find the right data related to this topic, get access to the data sets, and then use it in a SQL client (like Amazon Athena) to start forming hypotheses and relationships.

Before Amazon DataZone, ATPCO analysts needed to find potential data assets by talking with colleagues; there wasn’t an easy way to discover data assets across the company. This slowed down their pace of innovation because it added time to the analytics journey.

Solution

To address the challenge, ATPCO sought inspiration from a modern data mesh architecture. Instead of a central data platform team with a data warehouse or data lake serving as the clearinghouse of all data across the company, a data mesh architecture encourages distributed ownership of data by data producers who publish and curate their data as products, which can then be discovered, requested, and used by data consumers.

Amazon DataZone provides rich functionality to help a data platform team distribute ownership of tasks so that these teams can choose to operate less like gatekeepers. In Amazon DataZone, data owners can publish their data and its business catalog (metadata) to ATPCO’s DataZone domain. Data consumers can then search for relevant data assets using these human-friendly metadata terms. Instead of access requests from data consumer going to a ATPCO’s data platform team, they now go to the publisher or a delegated reviewer to evaluate and approve. When data consumers use the data, they do so in their own AWS accounts, which allocates their consumption costs to the right cost center instead of a central pool. Amazon DataZone also avoids duplicating data, which saves on cost and reduces compliance tracking. Amazon DataZone takes care of all of the plumbing, using familiar AWS services such as AWS Identity and Access Management (IAM), AWS Glue, AWS Lake Formation, and AWS Resource Access Manager (AWS RAM) in a way that is fully inspectable by a customer.

The following diagram provides an overview of the solution using Amazon DataZone and other AWS services, following a fully distributed AWS account model, where data sets like airline ticket sales, ticket pricing, and de-identified customer data in this use case are stored in different member accounts in AWS Organizations.

Implementation

Now, we’ll walk through how ATPCO implemented their solution to solve the challenges of analysts discovering, getting access to, and using data quickly to help their airline customers.

There are four parts to this implementation:

  1. Set up account governance and identity management.
  2. Create and configure an Amazon DataZone domain.
  3. Publish data assets.
  4. Consume data assets as part of analyzing data to generate insights.

Part 1: Set up account governance and identity management

Before you start, compare your current cloud environment, including data architecture, to ATPCO’s environment. We’ve simplified this environment to the following components for the purpose of this blog post:

  1. ATPCO uses an organization to create and govern AWS accounts.
  2. ATPCO has existing data lake resources set up in multiple accounts, each owned by different data-producing teams. Having separate accounts helps control access, limits the blast radius if things go wrong, and helps allocate and control cost and usage.
  3. In each of their data-producing accounts, ATPCO has a common data lake stack: An Amazon Simple Storage Service (Amazon S3) bucket for data storage, AWS Glue crawler and catalog for updating and storing technical metadata, and AWS LakeFormation (in hybrid access mode) for managing data access permissions.
  4. ATPCO created two new AWS accounts: one to own the Amazon DataZone domain and another for a consumer team to use for analytics with Amazon Athena.
  5. ATPCO enabled AWS IAM Identity Center and connected their identity provider (IdP) for authentication.

We’ll assume that you have a similar setup, though you might choose differently to suit your unique needs.

Part 2: Create and configure an Amazon DataZone domain

After your cloud environment is set up, the steps in Part 2 will help you create and configure an Amazon DataZone domain. A domain helps you organize your data, people, and their collaborative projects, and includes a unique business data catalog and web portal that publishers and consumers will use to share, collaborate, and use data. For ATPCO, their data platform team created and configured their domain.

Step 2.1: Create an Amazon DataZone domain

Persona: Domain administrator

Go to the Amazon DataZone console in your domain account. If you use AWS IAM Identity Center for corporate workforce identity authentication, then select the AWS Region in which your Identity Center instance is deployed. Choose Create domain.

  1. Enter a name and description.
  2. Leave Customize encryption settings (advanced) cleared.
  3. Leave the radio button selected for Create and use a new role. AWS creates an IAM role in your account on your behalf with the necessary IAM permissions for accessing Amazon DataZone APIs.
  4. Leave clear the quick setup option for Set-up this account for data consumption and publishing because we don’t plan to publish or consume data in our domain account.
  5. Skip Add new tag for now. You can always come back later to edit the domain and add tags.
  6. Choose Create Domain.

After a domain is created, you will see a domain detail page similar to the following. Notice that IAM Identity Center is disabled by default.

Step 2.2: Enable IAM Identity Center for your Amazon DataZone domain and add a group

Persona: Domain administrator

By default, your Amazon domain, its APIs, and its unique web portal are accessible by IAM principals in this AWS account with the necessary datazone IAM permissions. ATPCO wanted its corporate employees to be able to use Amazon DataZone with their corporate single sign-on SSO credentials without needing secondary federation to IAM roles. AWS Identity Center is the AWS cross-service solution for passing identity provider credentials. You can skip this step if you plan to use IAM principals directly for accessing Amazon DataZone.

Navigate to your Amazon DataZone domain’s detail page and choose Enable IAM Identity Center.

  • Scroll down to the User management section and select Enable users in IAM Identity Center. When you do, User and group assignment method options appear below. Turn on Require assignments. This means that you need to explicitly allow (add) users and groups to access your domain. Choose Update domain.

Now let’s add a group to the domain to provide its members with access. Back on your domain’s detail page, scroll to the bottom and choose the User management tab. Choose Add, and select Add SSO Groups from the drop-down.

  1. Enter the first letters of the group name and select it from the options. After you’ve added the desired groups, choose Add group(s).
  2. You can confirm that the groups are added successfully on the domain’s detail page, under the User management tab by selecting SSO Users and then SSO Groups from the drop-down.

Step 2.3: Associate AWS accounts with the domain for segregated data publishing and consumption

Personas: Domain administrator and AWS account owners

Amazon DataZone supports a distributed AWS account structure, where data assets are segregated from data consumption (such as Amazon Athena usage), and data assets are in their own accounts (owned by their respective data owners). We call these associated accounts. Amazon DataZone and the other AWS services it orchestrates take care of the cross-account data sharing. To make this work, domain and account owners need to perform a one-time account association: the domain needs to be shared with the account, and the account owner needs to configure it for use with Amazon DataZone. For ATPCO, there are four desired associated accounts, three of which are the accounts with data assets stored in Amazon S3 and cataloged in AWS Glue (airline ticketing data, pricing data, and de-identified customer data), and a fourth account that is used for an analyst’s consumption.

The first part of associating an account is to share the Amazon DataZone domain with the desired accounts (Amazon DataZone uses AWS RAM to create the resource policy for you). In ATPCO’s case, their data platform team manages the domain, so a team member does these steps.

  1. Todo this in the Amazon DataZone console, sign in to the domain account and navigate to the domain detail page, and then scroll down and choose the Associated Accounts tab. Choose Request association.
  2. Enter the AWS account ID of the first account to be associated.
  3. Choose Add another account and repeat step one for the remaining accounts to be associated. For ATPCO, there were four to-be associated accounts.
  4. When complete, choose Request Association.

The second part of associating an account is for the account owner to then configure their account for use by Amazon DataZone. Essentially, this process means that the account owner is allowing Amazon DataZone to perform actions in the account, like granting access to Amazon DataZone projects after a subscription request is approved.

  1. Sign in to the associated account and go to the Amazon DataZone console in the same Region as the domain. On the Amazon DataZone home page, choose View requests.
  2. Select the name of the inviting Amazon DataZone domain and choose Review request.

  1. Choose the Amazon DataZone blueprint you want to enable. We select Data Lake in this example because ATPCO’s use case has data in Amazon S3 and consumption through Amazon Athena.

  1. Leave the defaults as-is in the Permissions and resources The Glue Manage Access role allows Amazon DataZone to use IAM and LakeFormation to manage IAM roles and permissions to data lake resources after you approve a subscription request in Amazon DataZone. The Provisioning role allows Amazon DataZone to create S3 buckets and AWS Glue databases and tables in your account when you allow users to create Amazon DataZone projects and environments. The Amazon S3 bucket for data lake is where you specify which S3bucket is used by Amazon DataZone when users store data with your account.

  1. Choose Accept & configure association. This will take you to the associated domains table for this associated account, showing which domains the account is associated with. Repeat this process for other to-be associated accounts.

After the associations are configured by accounts, you will see the status reflected in the Associated accounts tab of the domain detail page.

Step 2.4: Set up environment profiles in the domain

Persona: Domain administrator

The final step to prepare the domain is making the associated AWS accounts usable by Amazon DataZone domain users. You do this with an environment profile, which helps less technical users get started publishing or consuming data. It’s like a template, with pre-defined technical details like blueprint type, AWS account ID, and Region. ATPCO’s data platform team set up an environment profile for each associated account.

To do this in the Amazon DataZone console, the data platform team member sign in to the domain account and navigates to the domain detail page, and chooses Open data portal in the upper right to go to the web-based Amazon DataZone portal.

  1. Choose Select project in the upper-left next to the DataZone icon and select Create Project. Enter a name, like Domain Administration and choose Create. This will take you to your new project page.
  2. In the Domain Administration project page, choose the Environments tab, and then choose Environment profiles in the navigation pane. Select Create environment profile.
    1. Enter a name, such as Sales – Data lake blueprint.
    2. Select the Domain Administration project as owner, and the DefaultDataLake as the blueprint.
    3. Select the AWS account with sales data as well as the preferred Region for new resources, such as AWS Glue and Athena consumption.
    4. Leave All projects and Any database
    5. Finalize your selection by choosing Create Environment Profile.

Repeat this step for each of your associated accounts. As a result, Amazon DataZone users will be able to create environments in their projects to use AWS resources in specific AWS accounts forpublishing or consumption.

Part 3: Publish assets

With Part 2 complete, the domain is ready for publishers to sign in and start publishing the first data assets to the business data catalog so that potential data consumers find relevant assets to help them with their analyses. We’ll focus on how ATPCO published their first data asset for internal analysis—sales data from their airline customers. ATPCO already had the data extracted, transformed, and loaded in a staged S3 bucket and cataloged with AWS Glue.

Step 3.1: Create a project

Persona: Data publisher

Amazon DataZone projects enable a group of users to collaborate with data. In this part of the ATPCO use case, the project is used to publish sales data as an asset in the project. By tying the eventual data asset to a project (rather than a user), the asset will have long-lived ownership beyond the tenure of any single employee or group of employees.

  1. As a data publisher, obtain theURL of the domain’s data portal from your domain administrator, navigate to this sign-in page and authenticate with IAM or SSO. After you’re signed in to the data portal, choose Create Project, enter a name (such as Sales Data Assets) and choose Create.
  2. If you want to add teammates to the project, choose Add Members. On the Project members page, choose Add Members, search for the relevant IAM or SSO principals, and select a role for them in the project. Owners have full permissions in the project, while contributors are not able to edit or delete the project or control membership. Choose Add Members to complete the membership changes.

Step 3.2: Create an environment

Persona: Data publisher

Projects can be comprised of several environments. Amazon DataZone environments are collections of configured resources (for example, an S3 bucket, an AWS Glue database, or an Athena workgroup). They can be useful if you want to manage stages of data production for the same essential data products with separate AWS resources, such as raw, filtered, processed, and curated data stages.

  1. While signed in to the data portal and in the Sales Data Assets project, choose the Environments tab, and then select Create Environment. Enter a name, such as Processed, referencing the processed stage of the underlying data.
  2. Select the Sales – Data lake blueprint environment profile the domain administrator created in Part 2.
  3. Choose Create Environment. Notice that you don’t need any technical details about the AWS account or resources! The creation process might take several minutes while Amazon DataZone sets up Lake Formation, Glue, and Athena.

Step 3.3: Create a new data source and run an ingestion job

Persona: Data publisher

In this use case, ATPCO has cataloged their data using AWS Glue. Amazon DataZone can use AWS Glue as a data source. Amazon DataZone data source (for AWS Glue) is a representation of one or more AWS Glue databases, with the option to set table selection criteria based on their name. Similar to how AWS Glue crawlers scan for new data and metadata, you can run an Amazon DataZone ingestion job against an Amazon DataZone data source (again, AWS Glue) to pull all of the matching tables and technical metadata (such as column headers) as the foundation for one or more data assets. An ingestion job can be run manually or automatically on a schedule.

  1. While signed in to the data portal and in the Sales Data Assets project, choose the Data tab, and then select Data sources. Choose Create Data Source, and enter a name for your data source, such as Processed Sales data in Glue, select AWS Glue as the type, and choose Next.
  2. Select the Processed environment from Step 3.2. In the database name box, enter a value or select from the suggested AWS Glue databases that Amazon DataZone identified in the AWS account. You can add additional criteria and another AWS Glue database.
  3. For Publishing settings, select No. This allows you to review and enrich the suggested assets before publishing them to the business data catalog.
  4. For Metadata generation methods, keep this box selected. Amazon DataZone will provide you with recommended business names for the data assets and its technical schema to publish an asset that’s easier for consumers to find.
  5. Clear Data quality unless you have already set up AWS Glue data quality. Choose Next.
  6. For Run preference, select to run on demand. You can come back later to run this ingestion job automatically on a schedule. Choose Next.
  7. Review the selections and choose Create.

To run the ingestion job for the first time, choose Run in the upper right corner. This will start the job. The run time is dependent on the quantity of databases, tables, and columns in your data source. You can refresh the status by choosing Refresh.

Step 3.4: Review, curate, and publish assets

Persona: Data publisher

After the ingestion job is complete, the matching AWS Glue tables will be added to the project’s inventory. You can then review the asset, including automated metadata generated by Amazon DataZone, add additional metadata, and publish the asset.

  • While signed in to the data portal and in the Sales Data Assets project, go to the Data tab, and select Inventory. You can review each of the data assets generated by the ingestion job. Let’s select the first result. In the asset detail page, you can edit the asset’s name and description to make it easier to find, especially in a list of search results.
  • You can edit the Read Me section and add rich descriptions for the asset, with markdown support. This can help reduce the questions consumers message the publisher with for clarification.
  • You can edit the technical schema (columns), including adding business names and descriptions. If you enabled automated metadata generation, then you’ll see recommendations here that you can accept or reject.
  • After you are done enriching the asset, you can choose Publish to make it searchable in the business data catalog.

Have the data publisher for each asset follow Part 3. For ATPCO, this means two additional teams followed these steps to get pricing and de-identified customer data into the data catalog.

Part 4: Consume assets as part of analyzing data to generate insights

Now that the business data catalog has three published data assets, data consumers will find available data to start their analysis. In this final part, an ATPCO data analyst can find the assets they need, obtain approved access, and analyze the data in Athena, forming the precursor of a data product that ATPCO can then make available to their customer (such as an airline).

Step 4.1: Discover and find data assets in the catalog

Persona: Data consumer

As a data consumer, obtain the URL of the domain’s data portal from your domain administrator, navigate to in the sign-in page, and authenticate with IAM or SSO. In the data portal, enter text to find data assets that match what you need to complete your analysis. In the ATPCO example, the analyst started by entering ticketing data. This returned the sales asset published above because the description noted that the data was related to “sales, including tickets and ancillaries (like premium seat selection preferences).”

The data consumer reviews the detail page of the sales asset, including the description and human-friendly terms in the schema, and confirms that it’s of use to the analysis. They then choose Subscribe. The data consumer is prompted to select a project for the subscription request, in which case they follow the same instructions as creating a project in Step 3.1, naming it Product analysis project. Enter a short justification of the request. Choose Subscribe to send the request to the data publisher.

Repeat Steps 4.2 and 4.3 for each of the needed data assets for the analysis. In the ATPCO use case, this meant searching for and subscribing to pricing and customer data.

While waiting for the subscription requests to be approved, the data consumer creates an Amazon DataZone environment in the Product analysis project, similar to Step 3.2. The data consumer selects an environment profile for their consumption AWS account and the data lake blueprint.

Step 4.2: Review and approve subscription request

Persona: Data publisher

The next time that a member of the Sales Data Assets project signs in to the Amazon DataZone data portal, they will see a notification of the subscription request. Select that notification or navigate in the Amazon DataZone data portal to the project. Choose the Data tab and Incoming requests and then the Requested tab to find the request. Review the request and decide to either Approve or Reject, while providing a disposition reason for future reference.

Step 4.3: Analyze data

Persona: Data consumer

Now that the data consumer has subscribed to all three data assets needed (by repeating steps 4.1-4.2 for each asset), the data consumer navigates to the Product analysis project in the Amazon DataZone data portal. The data consumer can verify that the project has data asset subscriptions by choosing the Data tab and Subscribed data.

Because the project has an environment with the data lake blueprint enabled in their consumption AWS account, the data consumer will see an icon in the right-side tab called Query Data: Amazon Athena. By selecting this icon, they’re taken to the Amazon Athena console.

In the Amazon Athena console, the data consumer sees the data assets their DataZone project is subscribed to (from steps 4.1-4.2). They use the Amazon Athena query editor to query the subscribed data.

Conclusion

In this post, we walked you through an ATPCO use case to demonstrate how Amazon DataZone allows users across an organization to easily discover relevant data products using business terms. Users can then request access to data and build products and insights faster. By providing self-service access to data with the right governance guardrails, Amazon DataZone helps companies tap into the full potential of their data products to drive innovation and data-driven decision making. If you’re looking for a way to unlock the full potential of your data and democratize it across your organization, then Amazon DataZone can help you transform your business by making data-driven insights more accessible and productive.

To learn more about Amazon DataZone and how to get started, refer to the Getting started guide. See the YouTube playlist for some of the latest demos of Amazon DataZone and short descriptions of the capabilities available.


About the Author

Brian Olsen is a Senior Technical Product Manager with Amazon DataZone. His 15 year technology career in research science and product has revolved around helping customers use data to make better decisions. Outside of work, he enjoys learning new adventurous hobbies, with the most recent being paragliding in the sky.

Mitesh Patel is a Principal Solutions Architect at AWS. His passion is helping customers harness the power of Analytics, machine learning and AI to drive business growth. He engages with customers to create innovative solutions on AWS.

Raj Samineni is the Director of Data Engineering at ATPCO, leading the creation of advanced cloud-based data platforms. His work ensures robust, scalable solutions that support the airline industry’s strategic transformational objectives. By leveraging machine learning and AI, Raj drives innovation and data culture, positioning ATPCO at the forefront of technological advancement.

Sonal Panda is a Senior Solutions Architect at AWS with over 20 years of experience in architecting and developing intricate systems, primarily in the financial industry. Her expertise lies in Generative AI, application modernization leveraging microservices and serverless architectures to drive innovation and efficiency.

Streamline your data governance by deploying Amazon DataZone with the AWS CDK

Post Syndicated from Bandana Das original https://aws.amazon.com/blogs/big-data/streamline-your-data-governance-by-deploying-amazon-datazone-with-the-aws-cdk/

Managing data across diverse environments can be a complex and daunting task. Amazon DataZone simplifies this so you can catalog, discover, share, and govern data stored across AWS, on premises, and third-party sources.

Many organizations manage vast amounts of data assets owned by various teams, creating a complex landscape that poses challenges for scalable data management. These organizations require a robust infrastructure as code (IaC) approach to deploy and manage their data governance solutions. In this post, we explore how to deploy Amazon DataZone using the AWS Cloud Development Kit (AWS CDK) to achieve seamless, scalable, and secure data governance.

Overview of solution

By using IaC with the AWS CDK, organizations can efficiently deploy and manage their data governance solutions. This approach provides scalability, security, and seamless integration across all teams, allowing for consistent and automated deployments.

The AWS CDK is a framework for defining cloud IaC and provisioning it through AWS CloudFormation. Developers can use any of the supported programming languages to define reusable cloud components known as constructs. A construct is a reusable and programmable component that represents AWS resources. The AWS CDK translates the high-level constructs defined by you into equivalent CloudFormation templates. AWS CloudFormation provisions the resources specified in the template, streamlining the usage of IaC on AWS.

Amazon DataZone core components are the building blocks to create a comprehensive end-to-end solution for data management and data governance. The following are the Amazon DataZone core components. For more details, see Amazon DataZone terminology and concepts.

  • Amazon DataZone domain – You can use an Amazon DataZone domain to organize your assets, users, and their projects. By associating additional AWS accounts with your Amazon DataZone domains, you can bring together your data sources.
  • Data portal – The data portal is outside the AWS Management Console. This is a browser-based web application where different users can catalog, discover, govern, share, and analyze data in a self-service fashion.
  • Business data catalog – You can use this component to catalog data across your organization with business context and enable everyone in your organization to find and understand data quickly.
  • Projects – In Amazon DataZone, projects are business use case-based groupings of people, assets (data), and tools used to simplify access to AWS analytics.
  • Environments – Within Amazon DataZone projects, environments are collections of zero or more configured resources on which a given set of AWS Identity and Access Management (IAM) principals (for example, users with a contributor permissions) can operate.
  • Amazon DataZone data source – In Amazon DataZone, you can publish an AWS Glue Data Catalog data source or Amazon Redshift data source.
  • Publish and subscribe workflows – You can use these automated workflows to secure data between producers and consumers in a self-service manner and make sure that everyone in your organization has access to the right data for the right purpose.

We use an AWS CDK app to demonstrate how to create and deploy core components of Amazon DataZone in an AWS account. The following diagram illustrates the primary core components that we create.

In addition to the core components deployed with the AWS CDK, we provide a custom resource module to create Amazon DataZone components such as glossaries, glossary terms, and metadata forms, which are not supported by AWS CDK constructs (at the time of writing).

Prerequisites

The following local machine prerequisites are required before starting:

Deploy the solution

Complete the following steps to deploy the solution:

  1. Clone the GitHub repository and go to the root of your downloaded repository folder:
    git clone https://github.com/aws-samples/amazon-datazone-cdk-example.git
    cd amazon-datazone-cdk-example

  2. Install local dependencies:
    $ npm ci ### this will install the packages configured in package-lock.json

  3. Sign in to your AWS account using the AWS CLI by configuring your credential file (replace <PROFILE_NAME> with the profile name of your deployment AWS account):
    $ export AWS_PROFILE=<PROFILE_NAME>

  4. Bootstrap the AWS CDK environment (this is a one-time activity and not needed if your AWS account is already bootstrapped):
    $ npm run cdk bootstrap

  5. Run the script to replace the placeholders for your AWS account and AWS Region in the config files:
    $ ./scripts/prepare.sh <<YOUR_AWS_ACCOUNT_ID>> <<YOUR_AWS_REGION>>

The preceding command will replace the AWS_ACCOUNT_ID_PLACEHOLDER and AWS_REGION_PLACEHOLDER values in the following config files:

  • lib/config/project_config.json
  • lib/config/project_environment_config.json
  • lib/constants.ts

Next, you configure your Amazon DataZone domain, project, business glossary, metadata forms, and environments with your data source.

  1. Go to the file lib/constants.ts. You can keep the DOMAIN_NAME provided or update it as needed.
  2. Go to the file lib/config/project_config.json. You can keep the example values for projectName and projectDescription or update them. An example value for projectMembers has also been provided (as shown in the following code snippet). Update the value of the memberIdentifier parameter with an IAM role ARN of your choice that you would like to be the owner of this project.
    "projectMembers": [
                {
                    "memberIdentifier": "arn:aws:iam::AWS_ACCOUNT_ID_PLACEHOLDER:role/Admin",
                    "memberIdentifierType": "UserIdentifier"
                }
            ]

  3. Go to the file lib/config/project_glossary_config.json. An example business glossary and glossary terms are provided for the projects; you can keep them as is or update them with your project name, business glossary, and glossary terms.
  4. Go to the lib/config/project_form_config.json file. You can keep the example metadata forms provided for the projects or update your project name and metadata forms.
  5. Go to the lib/config/project_enviornment_config.json file. Update EXISTING_GLUE_DB_NAME_PLACEHOLDER with the existing AWS Glue database name in the same AWS account where you are deploying the Amazon DataZone core components with the AWS CDK. Make sure you have at least one existing AWS Glue table in this AWS Glue database to publish as a data source within Amazon DataZone. Replace DATA_SOURCE_NAME_PLACEHOLDER and DATA_SOURCE_DESCRIPTION_PLACEHOLDER with your choice of Amazon DataZone data source name and description. An example of a cron schedule has been provided (see the following code snippet). This is the schedule for your data source run; you can keep the same or update it.
    "Schedule":{
       "schedule":"cron(0 7 * * ? *)"
    }

Next, you update the trust policy of the AWS CDK deployment IAM role to deploy a custom resource module.

  1. On the IAM console, update the trust policy of the IAM role for your AWS CDK deployment that starts with cdk-hnb659fds-cfn-exec-role- by adding the following permissions. Replace ${ACCOUNT_ID} and ${REGION} with your specific AWS account and Region.
         {
             "Effect": "Allow",
             "Principal": {
                 "Service": "lambda.amazonaws.com"
             },
             "Action": "sts:AssumeRole",
             "Condition": {
                 "ArnLike": {
                     "aws:SourceArn": [
                         
                         "arn:aws:lambda:${REGION}:{ACCOUNT_ID}:function:DataZonePreqStack-GlossaryLambda*",
                         "arn:aws:lambda:${REGION}:{ACCOUNT_ID}:function:DataZonePreqStack-GlossaryTermLambda*",
                         "arn:aws:lambda:${REGION}:{ACCOUNT_ID}:function:DataZonePreqStack-FormLambda*"
                     ]
                 }
             }
         }

Now you can configure data lake administrators in Lake Formation.

  1. On the Lake Formation console, choose Administrative roles and tasks in the navigation pane.
  2. Under Data lake administrators, choose Add and add the IAM role for AWS CDK deployment that starts with cdk-hnb659fds-cfn-exec-role- as an administrator.

This IAM role needs permissions in Lake Formation to create resources, such as an AWS Glue database. Without these permissions, the AWS CDK stack deployment will fail.

  1. Deploy the solution:
    $ npm run cdk deploy --all

  2. During deployment, enter y if you want to deploy the changes for some stacks when you see the prompt Do you wish to deploy these changes (y/n)?.
  3. After the deployment is complete, sign in to your AWS account and navigate to the AWS CloudFormation console to verify that the infrastructure deployed.

You should see a list of the deployed CloudFormation stacks, as shown in the following screenshot.

  1. Open the Amazon DataZone console in your AWS account and open your domain.
  2. Open the data portal URL available in the Summary section.
  3. Find your project in the data portal and run the data source job.

This is a one-time activity if you want to publish and search the data source immediately within Amazon DataZone. Otherwise, wait for the data source runs according to the cron schedule mentioned in the preceding steps.

Troubleshooting

If you get the message "Domain name already exists under this account, please use another one (Service: DataZone, Status Code: 409, Request ID: 2d054cb0-0 fb7-466f-ae04-c53ff3c57c9a)" (RequestToken: 85ab4aa7-9e22-c7e6-8f00-80b5871e4bf7, HandlerErrorCode: AlreadyExists), change the domain name under lib/constants.ts and try to deploy again.

If you get the message "Resource of type 'AWS::IAM::Role' with identifier 'CustomResourceProviderRole1' already exists." (RequestToken: 17a6384e-7b0f-03b3 -1161-198fb044464d, HandlerErrorCode: AlreadyExists), this means you’re accidentally trying to deploy everything in the same account but a different Region. Make sure to use the Region you configured in your initial deployment. For the sake of simplicity, the DataZonePreReqStack is in one Region in the same account.

If you get the message “Unmanaged asset” Warning in the data asset on your datazone project, you must explicitly provide Amazon DataZone with Lake Formation permissions to access tables in this external AWS Glue database. For instructions, refer to Configure Lake Formation permissions for Amazon DataZone.

Clean up

To avoid incurring future charges, delete the resources. If you have already shared the data source using Amazon DataZone, then you have to remove those manually first in the Amazon DataZone data portal because the AWS CDK isn’t able to automatically do that.

  1. Unpublish the data within the Amazon DataZone data portal.
  2. Delete the data asset from the Amazon DataZone data portal.
  3. From the root of your repository folder, run the following command:
    $ npm run cdk destroy --all

  4. Delete the Amazon DataZone created databases in AWS Glue. Refer to the tips to troubleshoot Lake Formation permission errors in AWS Glue if needed.
  5. Remove the created IAM roles from Lake Formation administrative roles and tasks.

Conclusion

Amazon DataZone offers a comprehensive solution for implementing a data mesh architecture, enabling organizations to address advanced data governance challenges effectively. Using the AWS CDK for IaC streamlines the deployment and management of Amazon DataZone resources, promoting consistency, reproducibility, and automation. This approach enhances data organization and sharing across your organization.

Ready to streamline your data governance? Dive deeper into Amazon DataZone by visiting the Amazon DataZone User Guide. To learn more about the AWS CDK, explore the AWS CDK Developer Guide.


About the Authors

Bandana Das is a Senior Data Architect at Amazon Web Services and specializes in data and analytics. She builds event-driven data architectures to support customers in data management and data-driven decision-making. She is also passionate about enabling customers on their data management journey to the cloud.

Gezim Musliaj is a Senior DevOps Consultant with AWS Professional Services. He is interested in various things CI/CD, data, and their application in the field of IoT, massive data ingestion, and recently MLOps and GenAI.

Sameer Ranjha is a Software Development Engineer on the Amazon DataZone team. He works in the domain of modern data architectures and software engineering, developing scalable and efficient solutions.

Sindi Cali is an Associate Consultant with AWS Professional Services. She supports customers in building data-driven applications in AWS.

Bhaskar Singh is a Software Development Engineer on the Amazon DataZone team. He has contributed to implementing AWS CloudFormation support for Amazon DataZone. He is passionate about distributed systems and dedicated to solving customers’ problems.

How Volkswagen streamlined access to data across multiple data lakes using Amazon DataZone – Part 1

Post Syndicated from Bandana Das original https://aws.amazon.com/blogs/big-data/how-volkswagen-streamlined-access-to-data-across-multiple-data-lakes-using-amazon-datazone-part-1/

Over the years, organizations have invested in creating purpose-built, cloud-based data lakes that are siloed from one another. A major challenge is enabling cross-organization discovery and access to data across these multiple data lakes, each built on different technology stacks. A data mesh addresses these issues with four principles: domain-oriented decentralized data ownership and architecture, treating data as a product, providing self-serve data infrastructure as a platform, and implementing federated governance. Data mesh enables organizations to organize around data domains with a focus on delivering data as a product.

In 2019, Volkswagen AG (VW) and Amazon Web Services (AWS) formed a strategic partnership to co-develop the Digital Production Platform (DPP), aiming to enhance production and logistics efficiency by 30 percent while reducing production costs by the same margin. The DPP was developed to streamline access to data from shop-floor devices and manufacturing systems by handling integrations and providing standardized interfaces. However, as applications evolved on the platform, a significant challenge emerged: sharing data across applications stored in multiple isolated data lakes in Amazon Simple Storage Service (Amazon S3) buckets in individual AWS accounts without having to consolidate data into a central data lake. Another challenge is discovering available data stored across multiple data lakes and facilitating a workflow to request data access across business domains within each plant. The current method is largely manual, relying on emails and general communication, which not only increases overhead but also varies from one use case to another in terms of data governance. This blog post introduces Amazon DataZone and explores how VW used it to build their data mesh to enable streamlined data access across multiple data lakes. It focuses on the key aspect of the solution, which was enabling data providers to automatically publish data assets to Amazon DataZone, which served as the central data mesh for enhanced data discoverability. Additionally, the post provides code to guide you through the implementation.

Introduction to Amazon DataZone

Amazon DataZone is a data management service that makes it faster and easier for customers to catalog, discover, share, and govern data stored across AWS, on premises, and third-party sources. Key features of Amazon DataZone include a business data catalog that allows users to search for published data, request access, and start working on data in days instead of weeks. Amazon DataZone projects enable collaboration with teams through data assets and the ability to manage and monitor data assets across projects. It also includes the Amazon DataZone portal, which offers a personalized analytics experience for data assets through a web-based application or API. Lastly, Amazon DataZone governed data sharing ensures that the right data is accessed by the right user for the right purpose with a governed workflow.

Architecture for Data Management with Amazon DataZone

Figure 1: Data mesh pattern implementation on AWS using Amazon DataZone

The architecture diagram (Figure 1) represents a high-level design based on the data mesh pattern. It separates source systems, data domain producers (data publishers), data domain consumers (data subscribers), and central governance to highlight key aspects. This cross-account data mesh architecture aims to create a scalable foundation for data platforms, supporting producers and consumers with consistent governance.

  1. A data domain producer resides in an AWS account and uses Amazon S3 buckets to store raw and transformed data. Producers ingest data into their S3 buckets through pipelines they manage, own, and operate. They are responsible for the full lifecycle of the data, from raw capture to a form suitable for external consumption.
  2. A data domain producer maintains its own ETL stack using AWS Glue, AWS Lambda to process, AWS Glue Databrew to profile the data and prepare the data asset (data product) before cataloguing it into AWS Glue Data Catalog in their account.
  3. A second pattern could be that a data domain producer prepares and stores the data asset as table within Amazon Redshift using AWS S3 Copy.
  4. Data domain producers publish data assets using datasource run to Amazon DataZone in the Central Governance account. This populates the technical metadata in the business data catalog for each data asset. The business metadata, can be added by business users to provide business context, tags, and data classification for the datasets. Producers control what to share, for how long, and how consumers interact with it.
  5. Producers can register and create catalog entries with AWS Glue from all their S3 buckets. The central governance account securely shares datasets between producers and consumers via metadata linking, with no data (except logs) existing in this account. Data ownership remains with the producer.
  6. With Amazon DataZone, once data is cataloged and published into the DataZone domain, it can be shared with multiple consumer accounts.
  7. The Amazon DataZone Data portal provides a personalized view for users to discover/search and submit requests for subscription of data assets using a web-based application. The data domain producer receives the notification of subscription requests in the Data portal and can approve/reject the requests.
  8. Once approved, the consumer account can read and further process data assets to implement various use cases with AWS Lambda, AWS Glue, Amazon Athena, Amazon Redshift query editor v2, Amazon QuickSight (Analytics use cases) and with Amazon Sagemaker (Machine learning use cases).

Manual process to publish data assets to Amazon DataZone

To publish a data asset from the producer account, each asset must be registered in Amazon DataZone as a data source for consumer subscription. The Amazon DataZone User Guide provides detailed steps to achieve this. In the absence of an automated registration process, all required tasks must be completed manually for each data asset.

How to automate publishing data assets from AWS Glue Data Catalog from the producer account to Amazon DataZone

Using the automated registration workflow, the manual steps can be automated for any new data asset that needs to be published in an Amazon DataZone domain or when there’s a schema change in an already published data asset.

The automated solution reduces the repetitive manual steps to publish the data sources (AWS Glue tables) into an Amazon DataZone domain.

Architecture for automated data asset publish

Figure 2 Architecture for automated data publish to Amazon DataZone

To automate publishing data assets:

  1. In the producer account (Account B), the data to be shared resides in an Amazon S3 bucket (Figure 2). An AWS Glue crawler is configured for the dataset to automatically create the schema using AWS Cloud Development Kit (AWS CDK).
  2. Once configured, the AWS Glue crawler crawls the Amazon S3 bucket and updates the metadata in the AWS Glue Data Catalog. The successful completion of the AWS Glue crawler generates an event in the default event bus of Amazon EventBridge.
  3. An EventBridge rule is configured to detect this event and invoke a dataset-registration AWS Lambda function.
  4. The AWS Lambda function performs all the steps to automatically register and publish the dataset in Amazon Datazone.

Steps performed in the dataset-registration AWS Lambda function

    • The AWS Lambda function retrieves the AWS Glue database and Amazon S3 information for the dataset from the Amazon Eventbridge event triggered by the successful run of the AWS Glue crawler.
    • It obtains the Amazon DataZone Datalake blueprint ID from the producer account and the Amazon DataZone domain ID and project ID by assuming an IAM role in the central governance account where the Amazon Datazone domain exists.
    • It enables the Amazon DataZone Datalake blueprint in the producer account.
    • It checks if the Amazon Datazone environment already exists within the Amazon DataZone project. If it does not, then it initiates the environment creation process. If the environment exists, it proceeds to the next step.
    • It registers the Amazon S3 location of the dataset in Lake Formation in the producer account.
    • The function creates a data source within the Amazon DataZone project and monitors the completion of the data source creation.
    • Finally, it checks whether the data source sync job in Amazon DataZone needs to be started. If new AWS Glue tables or metadata is created or updated, then it starts the data source sync job.

Prerequisites

As part of this solution, you will publish data assets from an existing AWS Glue database in a producer account into an Amazon DataZone domain for which the following prerequisites need to be performed.

  1. You need two AWS accounts to deploy the solution.
    • One AWS account will act as the data domain producer account (Account B) which will contain the AWS Glue dataset to be shared.
    • The second AWS account is the central governance account (Account A), which will have the Amazon DataZone domain and project deployed. This is the Amazon DataZone account.
    • Ensure that both the AWS accounts belong to the same AWS Organization
  2. Remove the IAMAllowedPrincipals permissions from the AWS Lake Formation tables for which Amazon DataZone handles permissions.
  3. Make sure in both AWS accounts that you have cleared the checkbox for Default permissions for newly created databases and tables under the Data Catalog settings in Lake Formation (Figure 3).

    Figure 3: Clear default permissions in AWS Lake Formation

  4. Sign in to Account A (central governance account) and make sure you have created an Amazon DataZone domain and a project within the domain.
  5. If your Amazon DataZone domain is encrypted with an AWS Key Management Service (AWS KMS) key, add Account B (producer account) to the key policy with the following actions:
    {
      "Sid": "Allow use of the key",
      "Effect": "Allow",
      "Principal": {
        "AWS": "arn:aws:iam::<Account B>:root"
      },
      "Action": [
        "kms:Encrypt",
        "kms:Decrypt",
        "kms:ReEncrypt*",
        "kms:GenerateDataKey*",
        "kms:DescribeKey"
      ],
      "Resource": "*"
    }

  6. Ensure you have created an AWS Identity and Access Management (IAM) role that Account B (producer account) can assume and this IAM role is added as a member (as contributor) of your Amazon DataZone project. The role should have the following permissions:
    • This IAM role is called dz-assumable-env-dataset-registration-role in this example. Adding this role will enable you to successfully run the dataset-registration Lambda function. Replace the account-region, account id, and DataZonekmsKey in the following policy with your information. These values correspond to where your Amazon DataZone domain is created and the AWS KMS key Amazon Resource Name (ARN) used to encrypt the Amazon DataZone domain.
      {
          "Version": "2012-10-17",
          "Statement": [
               {
                  "Action": [
                      "DataZone:CreateDataSource",
                     "DataZone:CreateEnvironment",
                     "DataZone:CreateEnvironmentProfile",
                     "DataZone:GetDataSource",
                     "DataZone:GetEnvironment",
                     "DataZone:GetEnvironmentProfile",
                     "DataZone:GetIamPortalLoginUrl",
                     "DataZone:ListDataSources",
                      "DataZone:ListDomains",
                      "DataZone:ListEnvironmentProfiles",
                      "DataZone:ListEnvironments",
                      "DataZone:ListProjectMemberships",
                     "DataZone:ListProjects",
                      "DataZone:StartDataSourceRun"
                  ],
                  "Resource": "*",
                  "Effect": "Allow"
              },
              {
                  "Action": [
                       "kms:Decrypt",
                      "kms:DescribeKey",
                      "kms:GenerateDataKey"
                  ],
                 "Resource": "arn:aws:kms:${account_region}:${account_id}:key/${DataZonekmsKey}",
                  "Effect": "Allow"
              }
          ]
      }

    • Add the AWS account in the trust relationship of this role with the following trust relationship. Replace ProducerAccountId with the AWS account ID of Account B (data domain producer account).
      {
          "Version": "2012-10-17",
          "Statement": [
              {
                  "Effect": "Allow",
                  "Principal": {
                      "AWS": [
                          "arn:aws:iam::${ProducerAccountId}:root",
                      ]
                  },
                  "Action": "sts:AssumeRole"
              }
          ]
      } }

  7. The following tools are needed to deploy the solution using AWS CDK:

Deployment Steps

After completing the pre-requisites, use the AWS CDK stack provided on GitHub to deploy the solution for automatic registration of data assets into DataZone domain

  1. Clone the repository from GitHub to your preferred IDE using the following commands.
    git clone https://github.com/aws-samples/automate-and-simplify-aws-glue-data-asset-publish-to-amazon-datazone.git
    
    cd automate-and-simplify-aws-glue-data-asset-publish-to-amazon-datazone

  2. At the base of the repository folder, run the following commands to build and deploy resources to AWS.
    npm install 
    npm run lint

  3. Sign in to the AWS account B (the data domain producer account) using AWS Command Line Interface (AWS CLI) with your profile name.
  4. Ensure you have configured the AWS Region in your credential’s configuration file.
  5. Bootstrap the CDK environment with the following commands at the base of the repository folder. Replace <PROFILE_NAME> with the profile name of your deployment account (Account B). Bootstrapping is a one-time activity and is not needed if your AWS account is already bootstrapped.
    export AWS_PROFILE=<PROFILE_NAME>
    npm run cdk bootstrap

  6. Replace the placeholder parameters (marked with the suffix _PLACEHOLDER) in the file config/DataZoneConfig.ts (Figure 4).
    • Amazon DataZone domain and project name of your Amazon DataZone instance. Make sure all names are in lowercase.
    • The AWS account ID and Region.
    • The assumable IAM role from the prerequisites.
    • The deployment role starting with cfn-xxxxxx-cdk-exec-role-.

Figure 4: Edit the DataZoneConfig file

  1. In the AWS Management Console for Lake Formation, select Administrative roles and tasks from the navigation pane (Figure 5) and make sure the IAM role for AWS CDK deployment that starts with cfn-xxxxxx-cdk-exec-role- is selected as an administrator in Data lake administrators. This IAM role needs permissions in Lake Formation to create resources, such as an AWS Glue database. Without these permissions, the AWS CDK stack deployment will fail.

Figure 5: Add cfn-xxxxxx-cdk-exec-role- as a Data Lake administrator

  1. Use the following command in the base folder to deploy the AWS CDK solution
    npm run cdk deploy --all

During deployment, enter y if you want to deploy the changes for some stacks when you see the prompt Do you wish to deploy these changes (y/n)?

  1. After the deployment is complete, sign in to your AWS account B (producer account) and navigate to the AWS CloudFormation console to verify that the infrastructure deployed. You should see a list of the deployed CloudFormation stacks as shown in Figure 6.

Figure 6: Deployed CloudFormation stacks

Test automatic data registration to Amazon DataZone

To test, we use the Online Retail Transactions dataset from Kaggle as a sample dataset to demonstrate the automatic data registration.

  1. Download the Online Retail.csv file from Kaggle dataset.
  2. Login to AWS Account B (producer account) and navigate to the Amazon S3 console, find the DataZone-test-datasource S3 bucket, and upload the csv file there (Figure 7).

Figure 7: Upload the dataset CSV file

  1. The AWS Glue crawler is scheduled to run at a specific time each day. However for testing, you can manually run the crawler by going to the AWS Glue console and selecting Crawlers from the navigation pane. Run the on-demand crawler starting with DataZone-. After the crawler has run, verify that a new table has been created.
  2. Go to the Amazon DataZone console in AWS account A (central governance account) where you deployed the resources. Select Domains in the navigation pane (Figure 8), then Select and open your domain.

    Figure 8: Amazon DataZone domains

  3. After you open the Datazone Domain, you can find the Amazon Datazone data portal URL in the Summary section (Figure 9). Select and open data portal.

    Figure 9: Amazon DataZone data portal URL

  4. In the data portal find your project (Figure 10). Then select the Data tab at the top of the window.

    Figure 10: Amazon DataZone Project overview

  5. Select the section Data Sources (Figure 11) and find the newly created data source DataZone-testdata-db.

    Figure 11:  Select Data sources in the Amazon Datazone Domain Data portal

  6. Verify that the data source has been successfully published (Figure 12).

    Figure 12:  The data sources are visible in the Published data section

  7. After the data sources are published, users can discover the published data and can submit a subscription request. The data producer can approve or reject requests. Upon approval, users can consume the data by querying data in Amazon Athena. Figure 13 illustrates data discovery in the Amazon DataZone data portal.

    Figure 13: Example data discovery in the Amazon DataZone portal

Clean up

Use the following steps to clean up the resources deployed through the CDK.

  1. Empty the two S3 buckets that were created as part of this deployment.
  2. Go to the Amazon DataZone domain portal and delete the published data assets that were created in the Amazon DataZone project by the dataset-registration Lambda function.
  3. Delete the remaining resources created using the following command in the base folder:
    npm run cdk destroy --all

Conclusion

By using AWS Glue and Amazon DataZone, organizations can make their data management easier and allow teams to share and collaborate on data smoothly. Automatically sending AWS Glue data to Amazon DataZone not only makes the process simple but also keeps the data consistent, secure, and well-governed. Simplify and standardize publishing data assets to Amazon DataZone and streamline data management with Amazon DataZone. For guidance on establishing your organization’s data mesh with Amazon DataZone, contact your AWS team today.


About the Authors

Bandana Das is a Senior Data Architect at Amazon Web Services and specializes in data and analytics. She builds event-driven data architectures to support customers in data management and data-driven decision-making. She is also passionate about enabling customers on their data management journey to the cloud.

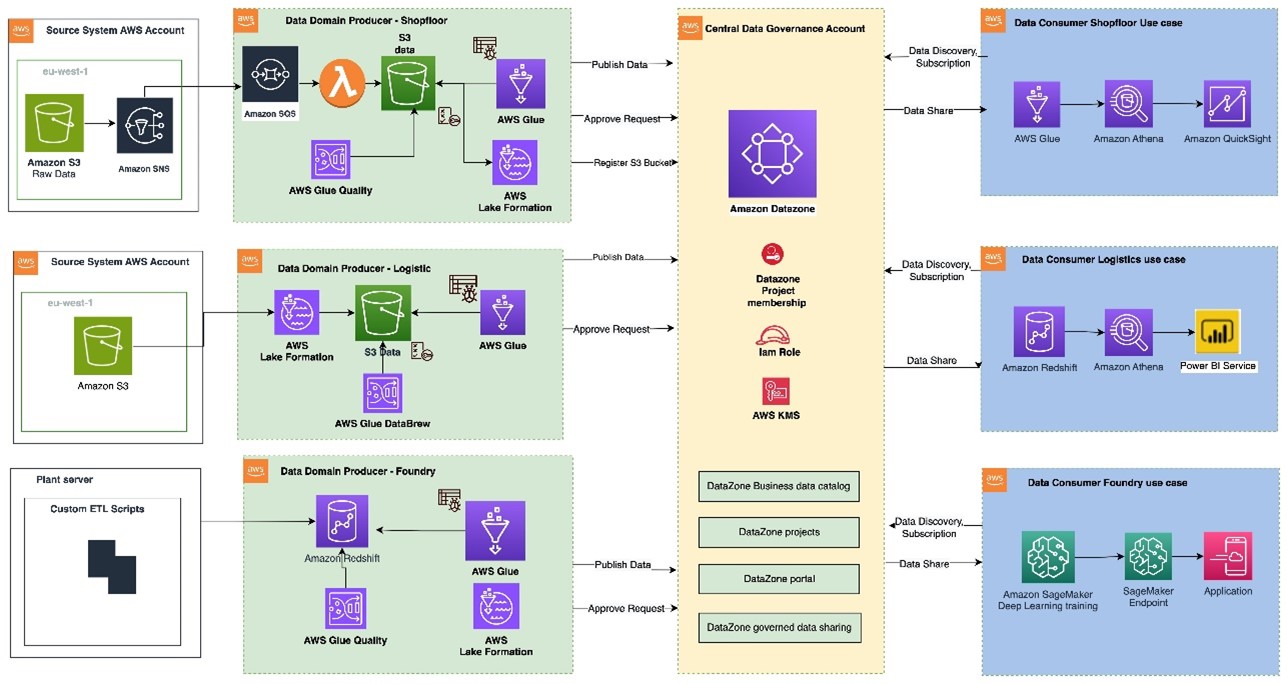
Anirban Saha is a DevOps Architect at AWS, specializing in architecting and implementation of solutions for customer challenges in the automotive domain. He is passionate about well-architected infrastructures, automation, data-driven solutions and helping make the customer’s cloud journey as seamless as possible. Personally, he likes to keep himself engaged with reading, painting, language learning and traveling.

Chandana Keswarkar is a Senior Solutions Architect at AWS, who specializes in guiding automotive customers through their digital transformation journeys by using cloud technology. She helps organizations develop and refine their platform and product architectures and make well-informed design decisions. In her free time, she enjoys traveling, reading, and practicing yoga.

Sindi Cali is a ProServe Associate Consultant with AWS Professional Services. She supports customers in building data driven applications in AWS.

Amazon DataZone introduces OpenLineage-compatible data lineage visualization in preview

Post Syndicated from Leonardo Gomez original https://aws.amazon.com/blogs/big-data/amazon-datazone-introduces-openlineage-compatible-data-lineage-visualization-in-preview/

We are excited to announce the preview of API-driven, OpenLineage-compatible data lineage in Amazon DataZone to help you capture, store, and visualize lineage of data movement and transformations of data assets on Amazon DataZone.

With the Amazon DataZone OpenLineage-compatible API, domain administrators and data producers can capture and store lineage events beyond what is available in Amazon DataZone, including transformations in Amazon Simple Storage Service (Amazon S3), AWS Glue, and other AWS services. This provides a comprehensive view for data consumers browsing in Amazon DataZone, who can gain confidence of an asset’s origin, and data producers, who can assess the impact of changes to an asset by understanding its usage.

In this post, we discuss the latest features of data lineage in Amazon DataZone, its compatibility with OpenLineage, and how to get started capturing lineage from other services such as AWS Glue, Amazon Redshift, and Amazon Managed Workflows for Apache Airflow (Amazon MWAA) into Amazon DataZone through the API.

Why it matters to have data lineage

Data lineage gives you an overarching view into data assets, allowing you to see the origin of objects and their chain of connections. Data lineage enables tracking the movement of data over time, providing a clear understanding of where the data originated, how it has changed, and its ultimate destination within the data pipeline. With transparency around data origination, data consumers gain trust that the data is correct for their use case. Data lineage information is captured at levels such as tables, columns, and jobs, allowing you to conduct impact analysis and respond to data issues because, for example, you can see how one field impacts downstream sources. This equips you to make well-informed decisions before committing changes and avoid unwanted changes downstream.

Data lineage in Amazon DataZone is an API-driven, OpenLineage-compatible feature that helps you capture and visualize lineage events from OpenLineage-enabled systems or through an API, to trace data origins, track transformations, and view cross-organizational data consumption. The lineage visualized includes activities inside the Amazon DataZone business data catalog. Lineage captures the assets cataloged as well as the subscribers to those assets and to activities that happen outside the business data catalog captured programmatically using the API.

Additionally, Amazon DataZone versions lineage with each event, enabling you to visualize lineage at any point in time or compare transformations across an asset’s or job’s history. This historical lineage provides a deeper understanding of how data has evolved, which is essential for troubleshooting, auditing, and enforcing the integrity of data assets.

The following screenshot shows an example lineage graph visualized with the Amazon DataZone data catalog.

Introduction to OpenLineage compatible data lineage

The need to capture data lineage consistently across various analytical services and combine them into a unified object model is key in uncovering insights from the lineage artifact. OpenLineage is an open source project that offers a framework to collect and analyze lineage. It also offers reference implementation of an object model to persist metadata along with integration to major data and analytics tools.

The following are key concepts in OpenLineage:

  • Lineage events – OpenLineage captures lineage information through a series of events. An event is anything that represents a specific operation performed on the data that occurs in a data pipeline, such as data ingestion, transformation, or data consumption.
  • Lineage entitiesEntities in OpenLineage represent the various data objects involved in the lineage process, such as datasets and tables.
  • Lineage runs – A lineage run represents a specific run of a data pipeline or a job, encompassing multiple lineage events and entities.
  • Lineage form types – Form types, or facets, provide additional metadata or context about lineage entities or events, enabling richer and more descriptive lineage information. OpenLineage offers facets for runs, jobs, and datasets, with the option to build custom facets.

The Amazon DataZone data lineage API is OpenLineage compatible and extends OpenLineage’s functionality by providing a materialization endpoint to persist the lineage outputs in an extensible object model. OpenLineage offers integrations for certain sources, and integration of these sources with Amazon DataZone is straightforward because the Amazon DataZone data lineage API understands the format and translates to the lineage data model.

The following diagram illustrates an example of the Amazon DataZone lineage data model.

In Amazon DataZone, every lineage node represents an underlying resource—there is a 1:1 mapping of the lineage node with a logical or physical resource such as table, view, or asset. The nodes represent a specific job with a specific run, or a node for a table or asset, and one node for a subscription target.

Each version of a node captures what happened to the underlying resource at that specific timestamp. In Amazon DataZone, lineage not only shares the story of data movement outside it, but it also represents the lineage of activities inside Amazon DataZone, such as asset creation, curation, publishing, and subscription.

To hydrate the lineage model in Amazon DataZone, two types of lineage are captured:

  • Lineage activities inside Amazon DataZone – This includes assets added to the catalog and published, and then details about the subscriptions are captured automatically. When you’re in the producer project context (for example, if the project you’re selected is the owning project of the asset you are browsing and you’re a member of that project), you will see two states of the dataset node:
    • The inventory asset type node defines the asset in the catalog that is in an unpublished stage. Other users can’t subscribe to the inventory asset. To learn more, refer to Creating inventory and published data in Amazon DataZone.
    • The published asset type represents the actual asset that is discoverable by data users across the organization. This is the asset type that can be subscribed by other project members. If you are a consumer and not part of the producing project of that asset, you will only see the published asset node.
  • Lineage activities outside of Amazon DataZone can be captured programmatically using the PostLineageEvent With these events captured either upstream or downstream of cataloged assets, data producers and consumers get a comprehensive view of data movement to check the origin of data or its consumption. We discuss how to use the API to capture lineage events later in this post.

There are two different types of lineage nodes available in Amazon DataZone:

  • Dataset node – In Amazon DataZone, lineage visualizes nodes that represent tables and views. Depending on the context of the project, the producers will be able to view both the inventory and published asset, whereas consumers can only view the published asset. When you first open the lineage tab on the asset details page, the cataloged dataset node will be the starting point for lineage graph traversal upstream or downstream. Dataset nodes include lineage nodes automated from Amazon DataZone and custom lineage nodes:
    • Automated dataset nodes – These nodes include information about AWS Glue or Amazon Redshift assets published in the Amazon DataZone catalog. They’re automatically generated and include a corresponding AWS Glue or Amazon Redshift icon within the node.
    • Custom dataset nodes – These nodes include information about assets that are not published in the Amazon DataZone catalog. They’re created manually by domain administrators (producers) and are represented by a default custom asset icon within the node. These are essentially custom lineage nodes created using the OpenLineage event format.
  • Job (run) node – This node captures the details of the job, which represents the latest run of a particular job and its run details. This node also captures multiple runs of the job and can be viewed on the History tab of the node details. Node details are made visible when you choose the icon.

Visualizing lineage in Amazon DataZone

Amazon DataZone offers a comprehensive experience for data producers and consumers. The asset details page provides a graphical representation of lineage, making it straightforward to visualize data relationships upstream or downstream. The asset details page provides the following capabilities to navigate the graph:

  • Column-level lineage – You can expand column-level lineage when available in dataset nodes. This automatically shows relationships with upstream or downstream dataset nodes if source column information is available.
  • Column search – If the dataset has more than 10 columns, the node presents pagination to navigate to columns not initially presented. To quickly view a particular column, you can search on the dataset node that lists just the searched column.
  • View dataset nodes only – If you want filter out the job nodes, you can choose the Open view control icon in the graph viewer and toggle the Display dataset nodes only This will remove all the job nodes from the graph and let you navigate just the dataset nodes.
  • Details pane – Each lineage node captures and displays the following details:
    • Every dataset node has three tabs: Lineage info, Schema, and History. The History tab lists the different versions of lineage event captured for that node.
    • The job node has a details pane to display job details with the tabs Job info and History. The details pane also captures queries or expressions run as part of the job.
  • Version tabs – All lineage nodes in Amazon DataZone data lineage will have versioning, captured as history, based on lineage events captured. You can view lineage at a selected timestamp that opens a new tab on the lineage page to help compare or contrast between the different timestamps.

The following screenshot shows an example of data lineage visualization.

You can experience the visualization with sample data by choosing Preview on the Lineage tab and choosing the Try sample lineage link. This opens a new browser tab with sample data to test and learn about the feature with or without a guided tour, as shown in the following screenshot.

Solution overview

Now that we understand the capabilities of the new data lineage feature in Amazon DataZone, let’s explore how you can get started in capturing lineage from AWS Glue tables and ETL (extract, transform, and load) jobs, Amazon Redshift, and Amazon MWAA.

The getting started scripts are also available in Amazon DataZone’s new GitHub repository.

Prerequisites

For this walkthrough, you should have the following prerequisites:

If the AWS account you use to follow this post uses AWS Lake Formation to manage permissions on the AWS Glue Data Catalog, make sure that you log in as a user with access to create databases and tables. For more information, refer to Implicit Lake Formation permissions.

Launch the CloudFormation stack

To create your resources for this use case using AWS CloudFormation, complete the following steps:

  1. Launch the CloudFormation stack in us-east-1:
  2. For Stack name, enter a name for your stack.
  3. Choose Next.
  4. Select I acknowledge that AWS CloudFormation might create IAM resources with custom names.
  5. Choose Create stack.

Wait for the stack formation to finish provisioning the resources. When you see the CREATE_COMPLETE status, you can proceed to the next steps.

Capture lineage from AWS Glue tables

For this example, we use CloudShell, which is a browser-based shell, to run the commands necessary to harvest lineage metadata from AWS Glue tables. Complete the following steps:

  1. On the AWS Glue console, choose Crawlers in the navigation pane.
  2. Select the AWSomeRetailCrawler crawler created by the CloudFormation template.
  3. Choose Run.

When the crawler is complete, you’ll see a Succeeded status.

Now let’s harvest the lineage metadata using CloudShell.

  1. Download the extract_glue_crawler_lineage.py file.
  2. On the Amazon DataZone console, open CloudShell.
  1. On the Actions menu, choose Update file.
  2. Upload the extract_glue_crawler_lineage.py file.

  3. Run the following commands:
    sudo yum -y install python3
    python3 -m venv env
    . env/bin/activate
    pip install boto3

You should get the following results.

  1. After all the libraries and dependencies are configured, run the following command to harvest the lineage metadata from the inventory table:
    python extract_glue_crawler_lineage.py -d awsome_retail_db -t inventory -r us-east-1 -i dzd_Your_doamin

  2. The script asks for verification of the settings provided; enter Yes.

You should receive a notification indicating that the script ran successfully.

After you capture the lineage information from the Inventory table, complete the following steps to run the data source.

  1. On the Amazon DataZone data portal, open the Sales
  2. On the Data tab, choose Data sources in the navigation pane.
  1. Select your data source job and choose Run.

For this example, we had a data source job called SalesDLDataSourceV2 already created pointing to the awesome_retail_db database. To learn more about how to create data source jobs, refer to Create and run an Amazon DataZone data source for the AWS Glue Data Catalog.

After the job runs successfully, you should see a confirmation message.

Now let’s view the lineage diagram generated by Amazon DataZone.

  1. On the Data inventory tab, choose the Inventory table.
  2. On the Inventory asset page, choose the new Lineage tab.

On the Lineage tab, you can see that Amazon DataZone created three nodes:

  • Job / Job run – This is based on the AWS Glue crawler used to harvest the asset technical metadata
  • Dataset – This is based on the S3 object that contains the data related to this asset
  • Table – This is the AWS Glue table created by the crawler

If you choose the Dataset node, Amazon DataZone offers information about the S3 object used to create the asset.

Capture data lineage for AWS Glue ETL jobs

In the previous section, we covered how to generate a data lineage diagram on top of a data asset. Now let’s see how we can create one for an AWS Glue job.

The CloudFormation template that we launched earlier created an AWS Glue job called Inventory_Insights. This job gets data from the Inventory table and creates a new table called Inventory_Insights with the aggregated data of the total products available in all the stores.

The CloudFormation template also copied the openlineage-spark_2.12-1.9.1.jar file to the S3 bucket created for this post. This file is necessary to generate lineage metadata from the AWS Glue job. We use version 1.9.1, which is compatible with AWS Glue 3.0, the version used to create the AWS Glue job for this post. If you’re using a different version of AWS Glue, you need to download the corresponding OpenLineage Spark plugin file that matches your AWS Glue version.

The OpenLineage Spark plugin is not able to extract data lineage from AWS Glue Spark jobs that use AWS Glue DynamicFrames. Use Spark SQL DataFrames instead.

  1. Download the extract_glue_spark_lineage.py file.
  2. On the Amazon DataZone console, open CloudShell.
  3. On the Actions menu, choose Update file.
  4. Upload the extract_glue_spark_lineage.py file.
  5. On the CloudShell console, run the following command (if your CloudShell session expired, you can open a new session):
    python extract_glue_spark_lineage.py —region "us-east-1" —domain-identifier 'dzd_Your Domain'

  6. Confirm the information showed by the script by entering yes.

You will see the following message; this means that the script is ready to get the AWS Glue job lineage metadata after you run it.

Now let’s run the AWS Glue job created by the Cloud formation template.

  1. On the AWS Glue console, choose ETL jobs in the navigation pane.
  2. Select the Inventory_Insights job and choose Run job.

On the Job details tab, you will notice that the job has the following configuration:

  • Key --conf with value extraListeners=io.openlineage.spark.agent.OpenLineageSparkListener --conf spark.openlineage.transport.type=console --conf spark.openlineage.facets.custom_environment_variables=[AWS_DEFAULT_REGION;GLUE_VERSION;GLUE_COMMAND_CRITERIA;GLUE_PYTHON_VERSION;]
  • Key --user-jars-first with value true
  • Dependent JARs path set as the S3 path s3://{your bucket}/lib/openlineage-spark_2.12-1.9.1.jar
  • The AWS Glue version set as 3.0

During the run of the job, you will see the following output on the CloudShell console.

This means that the script has successfully harvested the lineage metadata from the AWS Glue job.

Now let’s create an AWS Glue table based on the data created by the AWS Glue job. For this example, we use an AWS Glue crawler.

  1. On the AWS Glue console, choose Crawlers in the navigation pane.
  2. Select the AWSomeRetailCrawler crawler created by the CloudFormation template and choose Run.

When the crawler is complete, you will see the following message.

Now let’s open the Amazon DataZone portal to see how the diagram is represented in Amazon DataZone.

  1. On the Amazon DataZone portal, choose the Sales project.
  2. On the Data tab, choose Inventory data in the navigation pane.
  3. Choose the inventory insights asset

On the Lineage tab, you can see the diagram created by Amazon DataZone. It shows three nodes:

    • The AWS Glue crawler used to create the AWS Glue table
    • The AWS Glue table created by the crawler
    • The Amazon DataZone cataloged asset
  1. To see the lineage information about the AWS Glue job that you ran to create the inventory_insights table, choose the arrows icon on the left side of the diagram.

Now you can see the full lineage diagram for the Inventory_insights table.

  1. Choose the blue arrow icon in the inventory node to the left of the diagram.

You can see the evolution of the columns and the transformations that they had.

When you choose any of the nodes that are part of the diagram, you can see more details. For example, the inventory_insights node shows the following information.

Capture lineage from Amazon Redshift

Let’s explore how to generate a lineage diagram from Amazon Redshift. In this example, we use AWS Cloud9 because it allows us to configure the connection to the virtual private cloud (VPC) where our Redshift cluster resides. For more information about AWS Cloud9, refer to the AWS Cloud9 User Guide.

The CloudFormation template included as part of this post doesn’t cover the creation of a Redshift cluster or the creation of the tables used in this section. To learn more about how to create a Redshift cluster, see Step 1: Create a sample Amazon Redshift cluster. We use the following query to create the tables needed for this section of the post:

Create SCHEMA market

create table market.retail_sales (
  id BIGINT primary key,
  name character varying not null
);

create table market.online_sales (
  id BIGINT primary key,
  name character varying not null
);

/* Important to insert some data in the table */
INSERT INTO market.retail_sales
VALUES (123, 'item1')

INSERT INTO market.online_sales
VALUES (234, 'item2')

create table market.sales AS
Select id, name from market.retail_sales
Union ALL
Select id, name from market.online_sales;

Remember to add the IP address of your AWS Cloud9 environment to the security group with access to the Redshift cluster.

  1. Download the requirements.txt and extract_redshift_lineage.py files.
  2. On the File menu, choose Upload Local Files.
  3. Upload the requirements.txt and extract_redshift_lineage.py files.
  4. Run the following commands:
    # Install Python 
    sudo yum -y install python3
    
    # dependency set up 
    python3 -m venv env 
    . env/bin/activate
    
    pip install -r requirements.txt

You should be able to see the following messages.

  1. To set the AWS credentials, run the following command:
    export AWS_ACCESS_KEY_ID=<<Your Access Key>>
    export AWS_SECRET_ACCESS_KEY=<<Your Secret Access Key>>
    export AWS_SESSION_TOKEN=<<Your Session Token>>

  2. Run the extract_redshift_lineage.py script to harvest the metadata necessary to generate the lineage diagram:
    python extract_redshift_lineage.py \
     -r region \
     -i dzd_your_dz_domain_id \
     -n your-redshift-cluster-endpoint \
     -t your-rs-port \
     -d your-database \
     -s the-starting-date

  3. Next, you will be prompted to enter the user name and password for the connection to your Amazon DataZone database.
  4. When you receive a confirmation message, enter yes.

If the configuration was done correctly, you will see the following confirmation message.

Now let’s see how the diagram was created in Amazon DataZone.

  1. On the Amazon DataZone data portal, open the Sales project.
  2. On the Data tab, choose Data sources.
  3. Run the data source job.

For this post, we already created a data source job called Sales_DW_Enviroment-default-datasource to add the Redshift data source to our Amazon DataZone project. To learn how to create a data source job, refer to Create and run an Amazon DataZone data source for Amazon Redshift

After you run the job, you’ll see the following confirmation message.

  1. On the Data tab, choose Inventory data in the navigation pane.
  2. Choose the total_sales asset.
  1. Choose the Lineage tab.

Amazon DataZone create a three-node lineage diagram for the total sales table; you can choose any node to view its details.

  1. Choose the arrows icon next to the Job/ Job run node to view a more complete lineage diagram.
  1. Choose the Job / Job run

The Job Info section shows the query that was used to create the total sales table.

Capture lineage from Amazon MWAA

Apache Airflow is an open-source platform for developing, scheduling, and monitoring batch-oriented workflows. Amazon MWAA is a managed service for Airflow that lets you use your current Airflow platform to orchestrate your workflows. OpenLineage supports integration with Airflow 2.6.3 using the openlineage-airflow package, and the same can be enabled on Amazon MWAA as a plugin. Once enabled, the plugin converts Airflow metadata to OpenLineage events, which are consumable by DataZone.PostLineageEvent.

The following diagram shows the setup required in Amazon MWAA to capture data lineage using OpenLineage and publish it to Amazon DataZone.

The workflow uses an Amazon MWAA DAG to invoke a data pipeline. The process is as follows:

  1. The openlineage-airflow plugin is configured on Amazon MWAA as a lineage backend. Metadata about the DAG run is passed to the plugin, which converts it into OpenLineage format.
  2. The lineage information collected is written to Amazon CloudWatch log group according to the Amazon MWAA environment.
  3. A helper function captures the lineage information from the log file and publishes it to Amazon DataZone using the PostLineageEvent API.

The example used in the post uses Amazon MWAA version 2.6.3 and OpenLineage plugin version 1.4.1. For other Airflow versions supported by OpenLineage, refer to Supported Airflow versions.

Configure the OpenLineage plugin on Amazon MWAA to capture lineage

When harvesting lineage using OpenLineage, a Transport configuration needs to be set up, which tells OpenLineage where to emit the events to, for example the console or an HTTP endpoint. You can use ConsoleTransport, which logs the OpenLineage events in the Amazon MWAA task CloudWatch log group, which can then be published to Amazon DataZone using a helper function.

Specify the following in the requirements.txt file added to the S3 bucket configured for Amazon MWAA:

openlineage-airflow==1.4.1

In the Airflow logging configuration section under the MWAA configuration for the Airflow environment, enable Airflow task logs with log level INFO. The following screenshot shows a sample configuration.

A successful configuration will add a plugin to Airflow, which can be verified from the Airflow UI by choosing Plugins on the Admin menu.

In this post, we use a sample DAG to hydrate data to Redshift tables. The following screenshot shows the DAG in graph view.

Run the DAG and upon successful completion of a run, open the Amazon MWAA task CloudWatch log group for your Airflow environment (airflow-env_name-task) and filter based on the expression console.py to select events emitted by OpenLineage. The following screenshot shows the results.

Publish lineage to Amazon DataZone

Now that you have the lineage events emitted to CloudWatch, the next step is to publish them to Amazon DataZone to associate them to a data asset and visualize them on the business data catalog.

  1. Download the files requirements.txt and airflow_cw_parse_log.py and gather environment details like AWS region, Amazon MWAA environment name and Amazon DataZone Domain ID.
  2. The Amazon MWAA environment name can be obtained from the Amazon MWAA console.
  3. The Amazon DataZone domain ID can be obtained from Amazon DataZone service console or from the Amazon DataZone portal.
  4. Navigate to CloudShell and choose Upload files on the Actions menu to upload the files requirements.txt and extract_airflow_lineage.py.

  5. After the files are uploaded, run the following script to filter lineage events from the Airflow task logs and publish them to Amazon DataZone:
    # Set up virtual env and install dependencies
    python -m venv env
    pip install -r requirements.txt
    . env/bin/activate
    
    # run the script
    python extract_airflow_lineage.py \
      --region us-east-1 \
      --domain-identifier your_domain_identifier \
      --airflow-environment-name your_airflow_environment_name

The function extract_airflow_lineage.py filters the lineage events from the Amazon MWAA task log group and publishes the lineage to the specified domain within Amazon DataZone.

Visualize lineage on Amazon DataZone

After the lineage is published to DataZone, open your DataZone project, navigate to the Data tab and chose a data asset that was accessed by the Amazon MWAA DAG. In this case, it is a subscribed asset.

Navigate to the Lineage tab to visualize the lineage published to Amazon DataZone.

Choose a node to look at additional lineage metadata. In the following screenshot, we can observe the producer of the lineage has been marked as airflow.

Conclusion

In this post, we shared the preview feature of data lineage in Amazon DataZone, how it works, and how you can capture lineage events, from AWS Glue, Amazon Redshift, and Amazon MWAA, to be visualized as part of the asset browsing experience.

To learn more about Amazon DataZone and how to get started, refer to the Getting started guide. Check out the YouTube playlist for some of the latest demos of Amazon DataZone and short descriptions of the capabilities available.


About the Authors

Leonardo Gomez is a Principal Analytics Specialist at AWS, with over a decade of experience in data management. Specializing in data governance, he assists customers worldwide in maximizing their data’s potential while promoting data democratization. Connect with him on LinkedIn.

Priya Tiruthani is a Senior Technical Product Manager with Amazon DataZone at AWS. She focuses on improving data discovery and curation required for data analytics. She is passionate about building innovative products to simplify customers’ end-to-end data journey, especially around data governance and analytics. Outside of work, she enjoys being outdoors to hike, capture nature’s beauty, and recently play pickleball.

Ron Kyker is a Principal Engineer with Amazon DataZone at AWS, where he helps drive innovation, solve complex problems, and set the bar for engineering excellence for his team. Outside of work, he enjoys board gaming with friends and family, movies, and wine tasting.

Srinivasan Kuppusamy is a Senior Cloud Architect – Data at AWS ProServe, where he helps customers solve their business problems using the power of AWS Cloud technology. His areas of interests are data and analytics, data governance, and AI/ML.

AWS Weekly Roundup: Amazon S3 Access Grants, AWS Lambda, European Sovereign Cloud Region, and more (July 8, 2024).

Post Syndicated from Sébastien Stormacq original https://aws.amazon.com/blogs/aws/aws-weekly-roundup-amazon-s3-access-grants-aws-lambda-european-sovereign-cloud-region-and-more-july-8-2024/

I counted only 21 AWS news since last Monday, most of them being Regional expansions of existing services and capabilities. I hope you enjoyed a relatively quiet week, because this one will be busier.

This week, we’re welcoming our customers and partners at the Jacob Javits Convention Center for the AWS Summit New York on Wednesday, July 10. I can tell you there is a stream of announcements coming, if I judge by the number of AWS News Blog posts ready to be published.

I am writing these lines just before packing my bag to attend the AWS Community Day in Douala, Cameroon next Saturday. I can’t wait to meet our customers and partners, students, and the whole AWS community there.

But for now, let’s look at last week’s new announcements.

Last week’s launches
Here are the launches that got my attention.

Amazon Simple Storage Service (Amazon S3) Access Grants now integrate with Amazon SageMaker and open souce Python frameworksAmazon S3 Access Grants maps identities in directories such as Active Directory or AWS Identity and Access Management (IAM) principals, to datasets in S3. The integration with Amazon SageMaker Studio for machine learning (ML) helps you map identities to your machine learning (ML) datasets in S3. The integration with the AWS SDK for Python (Boto3) plugin replaces any custom code required to manage data permissions, so you can use S3 Access Grants in open source Python frameworks such as Django, TensorFlow, NumPy, Pandas, and more.

AWS Lambda introduces new controls to make it easier to search, filter, and aggregate Lambda function logsYou can now capture your Lambda logs in JSON structured format without bringing your own logging libraries. You can also control the log level (for example, ERROR, DEBUG, or INFO) of your Lambda logs without making any code changes. Lastly, you can choose the Amazon CloudWatch log group to which Lambda sends your logs.

Amazon DataZone introduces fine-grained access controlAmazon DataZone has introduced fine-grained access control, providing data owners granular control over their data at row and column levels. You use Amazon DataZone to catalog, discover, analyze, share, and govern data at scale across organizational boundaries with governance and access controls. Data owners can now restrict access to specific records of data instead of granting access to an entire dataset.

AWS Direct Connect proposes native 400 Gbps dedicated connections at select locationsAWS Direct Connect provides private, high-bandwidth connectivity between AWS and your data center, office, or colocation facility. Native 400 Gbps connections provide higher bandwidth without the operational overhead of managing multiple 100 Gbps connections in a link aggregation group. The increased capacity delivered by 400 Gbps connections is particularly beneficial to applications that transfer large-scale datasets, such as for ML and large language model (LLM) training or advanced driver assistance systems for autonomous vehicles.

For a full list of AWS announcements, be sure to keep an eye on the What’s New at AWS page.

Other AWS news
Here are some additional news items that you might find interesting:

The list of services available at launch in the upcoming AWS Europe Sovereign Cloud Region is available – we shared the list of AWS services that will be initially available at launch in the new AWS European Sovereign Cloud Region. The list has no surprises. Services for security, networking, storage, computing, containers, artificial intelligence (AI), and serverless will be available at launch. We are building the AWS European Sovereign Cloud to offer public sector organizations and customers in highly regulated industries further choice to help them meet their unique digital sovereignty requirements, as well as stringent data residency, operational autonomy, and resiliency requirements. This is an investment of 7.8 billion euros (approximately $8.46 billion). The new Region will be available by the end of 2025.

Upcoming AWS events
Check your calendars and sign up for upcoming AWS events:

AWS Summits – Join free online and in-person events that bring the cloud computing community together to connect, collaborate, and learn about AWS. To learn more about future AWS Summit events, visit the AWS Summit page. Register in your nearest city: New York (July 10), Bogotá (July 18), and Taipei (July 23–24).

AWS Community Days – Join community-led conferences that feature technical discussions, workshops, and hands-on labs led by expert AWS users and industry leaders from around the world. Upcoming AWS Community Days are in Cameroon (July 13), Aotearoa (August 15), and Nigeria (August 24).

Browse all upcoming AWS led in-person and virtual events and developer-focused events.

That’s all for this week. Check back next Monday for another Weekly Roundup!

— seb

This post is part of our Weekly Roundup series. Check back each week for a quick roundup of interesting news and announcements from AWS!

Enhance data security with fine-grained access controls in Amazon DataZone

Post Syndicated from Deepmala Agarwal original https://aws.amazon.com/blogs/big-data/enhance-data-security-with-fine-grained-access-controls-in-amazon-datazone/

Fine-grained access control is a crucial aspect of data security for modern data lakes and data warehouses. As organizations handle vast amounts of data across multiple data sources, the need to manage sensitive information has become increasingly important. Making sure the right people have access to the right data, without exposing sensitive information to unauthorized individuals, is essential for maintaining data privacy, compliance, and security.

Today, Amazon DataZone has introduced fine-grained access control, providing you granular control over your data assets in the Amazon DataZone business data catalog across data lakes and data warehouses. With the new capability, data owners can now restrict access to specific records of data at row and column levels, instead of granting access to the entire data asset. For example, if your data contains columns with sensitive information such as personally identifiable information (PII), you can restrict access to only the necessary columns, making sure sensitive information is protected while still allowing access to non-sensitive data. Similarly, you can control access at the row level, allowing users to see only the records that are relevant to their role or task.

In this post, we discuss how to implement fine-grained access control with row and column asset filters using this new feature in Amazon DataZone.

Row and column filters

Row filters enable you to restrict access to specific rows based on criteria you define. For instance, if your table contains data for two regions (America and Europe) and you want to make sure that employees in Europe only access data relevant to their region, you can create a row filter that excludes rows where the region is not Europe (for example, region != 'Europe'). This way, employees in America won’t have access to Europe’s data.

Column filters allow you to limit access to specific columns within your data assets. For example, if your table includes sensitive information such as PII, you can create a column filter to exclude PII columns. This makes sure subscribers can only access non-sensitive data.

The row and column asset filters in Amazon DataZone enable you to control who can access what using a consistent, business user-friendly mechanism for all of your data across AWS data lakes and data warehouses. To use fine-grained access control in Amazon DataZone, you can create row and column filters on top of your data assets in the Amazon DataZone business data catalog. When a user requests a subscription to your data asset, you can approve the subscription by applying the appropriate row and column filters. Amazon DataZone enforces these filters using AWS Lake Formation and Amazon Redshift, making sure the subscriber can only access the rows and columns that they are authorized to use.

Solution overview

To demonstrate the new capability, we consider a sample customer use case where an electronics ecommerce platform is looking to implement fine-grained access controls using Amazon DataZone. The customer has multiple product categories, each operated by different divisions of the company. The platform governance team wants to make sure each division has visibility only to data belonging to their own categories. Additionally, the platform governance team needs to adhere to the finance team requirements that pricing information should be visible only to the finance team.

The sales team, acting as the data producer, has published an AWS Glue table called Product sales that contains data for both Laptops and Servers categories to the Amazon DataZone business data catalog using the project Product-Sales. The analytic teams in both the laptop and server divisions need to access this data for their respective analytics projects. The data owner’s objective is to grant data access to consumers based on the division they belong to. This means giving access to only rows of data with laptop sales to the laptops sales analytics team, and rows with servers sales to the server sales analytics team. Additionally, the data owner wants to restrict both teams from accessing the pricing data. This post demonstrates the implementation steps to achieve this use case in Amazon DataZone.

The steps to configure this solution are as follows:

  1. The publisher creates asset filters for limiting access:
    1. We create two row filters: a Laptop Only row filter that limits access to only the rows of data with laptop sales, and a Server Only row filter that limits access to the rows of data with server sales.
    2. We also create a column filter called exclude-price-columns that excludes the price-related columns from the Product Sales
  2. Consumers discover and request subscriptions:
    1. The analyst from the laptops division requests a subscription to the Product Sales data asset.
    2. The analyst from the servers division also request a subscription to the Product Sales data asset.
    3. Both subscription requests are sent to the publisher for approval.
  3. The publisher approves the subscriptions and applies the appropriate filters:
    1. The publisher approves the request from the analysts in the laptops division, applying the Laptop Only row filter and the exclude-price-columns columns filter.
    2. The publisher approves the request from the consumer in the servers division, applying the Server Only row filter and the exclude-price-columns columns filter.
  4. Consumers access the authorized data in Amazon Athena:
    1. After the subscription is approved, we query the data in Athena to make sure that the analyst from the laptops division can now access only the product sales data for the Laptop
    2. Similarly, the analyst from the servers division can access only the product sales data for the Server
    3. Both consumers can see all columns except the price-related columns, as per the applied column filter.

The following diagram illustrates the solution architecture and process flow.

Prerequisites

To follow along with this post, the publisher of the product sales data asset must have published a sales dataset in Amazon DataZone.

Publisher creates asset filters for limiting access

In this section, we detail the steps the publisher takes to create asset filers.

Create row filters

This dataset contains the product categories Laptops and Servers. We want to restrict access to the dataset that is authorized based on the product category. We use the row filter feature in Amazon DataZone to achieve this.

Amazon DataZone allows you to create row filters that can be used when approving subscriptions to make sure that the subscriber can only access rows of data as defined in the row filters. To create a row filter, complete the following steps:

  1. On the Amazon DataZone console, navigate to the product-sales project (the project to which the asset belongs).
  2. Navigate to the Data tab for the project.
  3. Choose Inventory data in the navigation pane, then the asset Product Sales, where you want to create the row filter.

You can add row filters for assets of type AWS Glue tables or Redshift tables.

  1. On the asset detail page, on the Asset filters tab, choose Add asset filter.

We create two row filters, one each for the Laptops and Servers categories.

  1. Complete the following steps to create a laptop only asset row filter:
    1. Enter a name for this filter (Laptop Only).
    2. Enter a description of the filter (Allow rows with product category as Laptop Only).
    3. For the filter type, select Row filter.
    4. For the row filter expression, enter one or more expressions:
      1. Choose the column Product Category from the column dropdown menu.
      2. Choose the operator = from the operator dropdown menu.
      3. Enter the value Laptops in the Value field.
    5. If you need to add another condition to the filter expression, choose Add condition. For this post, we create a filter with one condition.
    6. When using multiple conditions in the row filter expression, choose And or Or to link the conditions.
    7. You can also define the subscriber visibility. For this post, we kept the default value (No, show values to subscriber).
    8. Choose Create asset filter.
  2. Repeat the same steps to create a row filter called Server Only, except this time enter the value Servers in the Value field.

Create column filters

Next, we create column filters to restrict access to columns with price-related data. Complete the following steps:

  1. In the same asset, add another asset filter of type column filter.
  2. On the Asset filters tab, choose Add asset filter.
  3. For Name, enter a name for the filter (for this post, exclude-price-columns).
  4. For Description, enter a description of the filters (for this post, exclude price data columns).
  5. For the filter type, select Column to create the column filter. This will display all the available columns in the data asset’s schema.
  6. Select all columns except the price-related ones.
  7. Choose Create asset filter.

Consumers discover and request subscriptions

In this section, we switch to the role of an analyst from the laptop division who is working within the project Sales Analytics - Laptop. As the data consumer, we search the catalog to find the Product Sales data asset and request access by subscribing to it.

  1. Log in to your project as a consumer and search for the Product Sales data asset.
  2. On the Product Sales data asset details page, choose Subscribe.
  3. For Project, choose Sales Analytics – Laptops.
  4. For Reason for request, enter the reason for the subscription request.
  5. Choose Subscribe to submit the subscription request.

Publisher approves subscriptions with filters

After the subscription request is submitted, the publisher will receive the request, and they can approve it by following these steps:

  1. As the publisher, open the project Product-Sales.
  2. On the Data tab, choose Incoming requests in the left navigation pane.
  3. Locate the request and choose View request. You can filter by Pending to see only requests that are still open.

This opens the details of the request, where you can see details like who requested the access, for what project, and the reason for the request.

  1. To approve the request, there are two options:
    1. Full access – If you choose to approve the subscription with full access option, the subscriber will get access to all the rows and columns in our data asset.
    2. Approve with row and column filters – To limit access to specific rows and columns of data, you can choose the option to approve with row and column filters. For this post, we use both filters that we created earlier.
  2. Select Choose filter, then on the dropdown menu, choose the Laptops Only and pii-col-filter
  3. Choose Approve to approve the request.

After access is granted and fulfilled, the subscription looks as shown in the following screenshot.

  1. Now let’s log in as a consumer from the server division.
  2. Repeat the same steps, but this time, while approving the subscription, the publisher of sales data approves with the Server only The other steps remain the same.

Consumers access authorized data in Athena

Now that we have successfully published an asset to the Amazon DataZone catalog and subscribed to it, we can analyze it. Let’s log in as a consumer from the laptop division.

  1. In the Amazon DataZone data portal, choose the consumer project Sales Analytics - Laptops.
  2. On the Schema tab, we can view the subscribed assets.
  3. Choose the project Sales Analytics - Laptops and choose the Overview
  4. In the right pane, open the Athena environment.

We can now run queries on the subscribed table.

  1. Choose the table under Tables and views, then choose Preview to view the SELECT statement in the query editor.
  2. Run a query as the consumer of Sales Analytics - Laptops, in which we can view data only with product category Laptops.

Under Tables and views, you can expand the table product_sales. The price-related columns are not visible in the Athena environment for querying.

  1. Next, you can switch to the role of analyst from the server division and analyze the dataset in similar way.
  2. We run the same query and see that under product_category, the analyst can see Servers only.

Conclusion

Amazon DataZone offers a straightforward way to implement fine-grained access controls on top of your data assets. This feature allows you to define column-level and row-level filters to enforce data privacy before the data is available to data consumers. Amazon DataZone fine-grained access control is generally available in all AWS Regions that support Amazon DataZone.

Try out the fine-grained access control feature in your own use case, and let us know your feedback in the comments section.


About the Authors

Deepmala Agarwal works as an AWS Data Specialist Solutions Architect. She is passionate about helping customers build out scalable, distributed, and data-driven solutions on AWS. When not at work, Deepmala likes spending time with family, walking, listening to music, watching movies, and cooking!

Leonardo Gomez is a Principal Analytics Specialist Solutions Architect at AWS. He has over a decade of experience in data management, helping customers around the globe address their business and technical needs. Connect with him on LinkedIn.

Utkarsh Mittal is a Senior Technical Product Manager for Amazon DataZone at AWS. He is passionate about building innovative products that simplify customers’ end-to-end analytics journeys. Outside of the tech world, Utkarsh loves to play music, with drums being his latest endeavor.

Amazon DataZone enhances data discovery with advanced search filtering

Post Syndicated from Chaitanya Vejendla original https://aws.amazon.com/blogs/big-data/amazon-datazone-enhances-data-discovery-with-advanced-search-filtering/

Amazon DataZone, a fully managed data management service, helps organizations catalog, discover, analyze, share, and govern data between data producers and consumers. We are excited to announce the introduction of advanced search filtering capabilities in the Amazon DataZone business data catalog.

With the improved rendering of glossary terms, you can now navigate large sets of terms with ease in an expandable and collapsible hierarchy, reducing the time and effort required to locate specific data assets. The introduction of logical operators (AND and OR) for filtering allows for more precise searches, enabling you to combine multiple criteria in a way that best suits your needs. The descriptive summary of search criteria helps users keep track of their applied filters, making it simple to adjust search parameters on the fly.

In this post, we discuss how these new search filtering capabilities enhance the user experience and boost the accuracy of search results, facilitating the ability to find data quickly.

Challenges

Many of our customers manage vast numbers of data assets within the Amazon DataZone catalog for discoverability. Data producers tag these assets with business glossary terms to classify and enhance discovery. For example, data assets owned by a particular department can be tagged with the glossary term for that department, like “Marketing.”

Data consumers searching for the right data assets use faceted search with various criteria, including business glossary terms, and apply filters to refine their search results. However, finding the right data assets can be challenging, especially when it involves combining multiple filters. Customers wanted more flexibility and precision in their search capabilities, such as:

  • A more intuitive way to navigate through extensive lists of glossary terms
  • The ability to apply more nuanced search logic to refine search results with greater precision
  • A summary of applied filters to effortlessly review and adjust search criteria

New features in Amazon DataZone

With the latest release, Amazon DataZone now supports features that enhance search flexibility and accuracy:

  • Improved rendering of glossary terms – Glossary terms are now displayed in a hierarchical view, providing a more organized structure. You can navigate and select from long lists of glossary terms presented in an expandable and collapsible hierarchy within the search facets. For instance, a data scientist can quickly find specific customer demographic data without sifting through an overwhelming flat list.
  • Logical operators for refined search – You can now choose logical operators to refine your search results, offering greater control and precision. For example, a financial analyst preparing a report on investment performance can use AND logic to combine criteria like investment type and region to pinpoint the exact data needed, or use OR logic to broaden the search to include any investments that meet either criterion.
  • Summary of search criteria – A descriptive summary of applied search filters is now provided, allowing you to review and manage your search criteria with ease. For example, a project manager can quickly adjust filters to find project-related assets matching specific phases or statuses.

These enhancements enable you to better understand the relationships between different search facets, enhancing the overall search experience and making it effortless to find the right data assets.

Use case overview

To demonstrate these search enhancements, we set up a new Amazon DataZone domain with two projects:

  • Marketing project – Publishes campaign-related data assets from the Marketing department. These data assets have been tagged with relevant business glossary terms corresponding to marketing.
  • Sales project – Publishes sales-related datasets from the Sales department. These data assets have been tagged with relevant business glossary terms corresponding to sales.

The following screenshots show examples of the different tagged assets.

In the following sections, we demonstrate the improvements in the user search experience for this use case.

Improved rendering of glossary terms

As a data consumer, you want to discover data assets using the faceted search capability within Amazon DataZone.

The search result panel has been enhanced to display glossaries and glossary terms in a hierarchical fashion. This allows you to expand and collapse sections for a more intuitive search experience.

For example, if you want to find product sales data assets from the Corporate Sales department, you can select the appropriate term within the glossary. The selection criteria and the corresponding result list show a total of 18 data assets, as shown in the following screenshot.

Next, if you want to further refine your search to focus only on the product category of Smartphones, you can do so.

Because OR is the default logical operator for your search within the glossary terms, it lists all the assets that are either part of Corporate Sales or tagged with Smartphones.

Logical operators for refined search

You now have the flexibility to change the default operator to AND to list only those data assets that are part of Corporate Sales and tagged with Smartphones, narrowing down the result set.

Additionally, you can further filter based on the asset type by selecting the available options. When you select Glue Table as your asset type, it defaults to the AND condition across the glossary terms and the asset type filter, thereby showing the data assets that satisfy all the filter conditions.

You also have the flexibility to change the operator to OR across these filters, yielding a more exhaustive list of data assets.

Summary of search criteria

As we showed in the preceding screenshots, the results also display a summary of the filters you applied for the search. This enables you to review and better manage your search criteria.

Conclusion

This post demonstrated new Amazon DataZone search enhancement features that streamline data discovery for a more intuitive user experience. These enhancements are designed to empower data consumers within organizations to make more informed decisions, faster. By streamlining the search process and making it more intuitive, Amazon DataZone continues to support the growing needs of data-driven businesses, helping you unlock the full potential of your data assets.

For more information about Amazon DataZone and to get started, refer to the Amazon DataZone User Guide.


About the authors

Chaitanya Vejendla is a Senior Solutions Architect specialized in DataLake & Analytics primarily working for Healthcare and Life Sciences industry division at AWS. Chaitanya is responsible for helping life sciences organizations and healthcare companies in developing modern data strategies, deploy data governance and analytical applications, electronic medical records, devices, and AI/ML-based applications, while educating customers about how to build secure, scalable, and cost-effective AWS solutions. His expertise spans across data analytics, data governance, AI, ML, big data, and healthcare-related technologies.

Ramesh H Singh is a Senior Product Manager Technical (External Services) at AWS in Seattle, Washington, currently with the Amazon DataZone team. He is passionate about building high-performance ML/AI and analytics products that enable enterprise customers to achieve their critical goals using cutting-edge technology.

Rishabh Asthana is a Front-end Engineer at AWS, working with the Amazon DataZone team based in New York City, USA.

Somdeb Bhattacharjee is an Enterprise Solutions Architect based out of New York, USA focused on helping customers on their cloud journey. He has interest in Databases, Big Data and Analytics.

AWS Weekly Roundup: AI21 Labs’ Jamba-Instruct in Amazon Bedrock, Amazon WorkSpaces Pools, and more (July 1, 2024)

Post Syndicated from Esra Kayabali original https://aws.amazon.com/blogs/aws/aws-weekly-roundup-ai21-labs-jamba-instruct-in-amazon-bedrock-amazon-workspaces-pools-and-more-july-1-2024/

AWS Summit New York is 10 days away, and I am very excited about the new announcements and more than 170 sessions. There will be A Night Out with AWS event after the summit for professionals from the media and entertainment, gaming, and sports industries who are existing Amazon Web Services (AWS) customers or have a keen interest in using AWS Cloud services for their business. You’ll have the opportunity to relax, collaborate, and build new connections with AWS leaders and industry peers.

Let’s look at the last week’s new announcements.

Last week’s launches
Here are the launches that got my attention.

AI21 Labs’ Jamba-Instruct now available in Amazon Bedrock – AI21 Labs’ Jamba-Instruct is an instruction-following large language model (LLM) for reliable commercial use, with the ability to understand context and subtext, complete tasks from natural language instructions, and ingest information from long documents or financial filings. With strong reasoning capabilities, Jamba-Instruct can break down complex problems, gather relevant information, and provide structured outputs to enable uses like Q&A on calls, summarizing documents, building chatbots, and more. For more information, visit AI21 Labs in Amazon Bedrock and the Amazon Bedrock User Guide.

Amazon WorkSpaces Pools, a new feature of Amazon WorkSpaces – You can now create a pool of non-persistent virtual desktops using Amazon WorkSpaces and save costs by sharing them across users who receive a fresh desktop each time they sign in. WorkSpaces Pools provides the flexibility to support shared environments like training labs and contact centers, and some user settings like bookmarks and files stored in a central storage repository such as Amazon Simple Storage Service (Amazon S3) or Amazon FSx can be saved for improved personalization. You can use AWS Auto Scaling to automatically scale the pool of virtual desktops based on usage metrics or schedules. For pricing information, refer to the Amazon WorkSpaces Pricing page.

API-driven, OpenLineage-compatible data lineage visualization in Amazon DataZone (preview)Amazon DataZone introduces a new data lineage feature that allows you to visualize how data moves from source to consumption across organizations. The service captures lineage events from OpenLineage-enabled systems or through API to trace data transformations. Data consumers can gain confidence in an asset’s origin, and producers can assess the impact of changes by understanding its consumption through the comprehensive lineage view. Additionally, Amazon DataZone versions lineage with each event to enable visualizing lineage at any point in time or comparing transformations across an asset or job’s history. To learn more, visit Amazon DataZone, read my News Blog post, and get started with data lineage documentation.

Knowledge Bases for Amazon Bedrock now offers observability logs – You can now monitor knowledge ingestion logs through Amazon CloudWatch, S3 buckets, or Amazon Data Firehose streams. This provides enhanced visibility into whether documents were successfully processed or encountered failures during ingestion. Having these comprehensive insights promptly ensures that you can efficiently determine when your documents are ready for use. For more details on these new capabilities, refer to the Knowledge Bases for Amazon Bedrock documentation.

Updates and expansion to the AWS Well-Architected Framework and Lens Catalog – We announced updates to the AWS Well-Architected Framework and Lens Catalog to provide expanded guidance and recommendations on architectural best practices for building secure and resilient cloud workloads. The updates reduce redundancies and enhance consistency in resources and framework structure. The Lens Catalog now includes the new Financial Services Industry Lens and updates to the Mergers and Acquisitions Lens. We also made important updates to the Change Enablement in the Cloud whitepaper. You can use the updated Well-Architected Framework and Lens Catalog to design cloud architectures optimized for your unique requirements by following current best practices.

Cross-account machine learning (ML) model sharing support in Amazon SageMaker Model RegistryAmazon SageMaker Model Registry now integrates with AWS Resource Access Manager (AWS RAM), allowing you to easily share ML models across AWS accounts. This helps data scientists, ML engineers, and governance officers access models in different accounts like development, staging, and production. You can share models in Amazon SageMaker Model Registry by specifying the model in the AWS RAM console and granting access to other accounts. This new feature is now available in all AWS Regions where SageMaker Model Registry is available except GovCloud Regions. To learn more, visit the Amazon SageMaker Developer Guide.

AWS CodeBuild supports Arm-based workloads using AWS Graviton3AWS CodeBuild now supports natively building and testing Arm workloads on AWS Graviton3 processors without additional configuration, providing up to 25% higher performance and 60% lower energy usage than previous Graviton processors. To learn more about CodeBuild’s support for Arm, visit our AWS CodeBuild User Guide.

For a full list of AWS announcements, be sure to keep an eye on the What’s New at AWS page.

We launched existing services and instance types in additional Regions:

Other AWS news
Here are some additional news items that you might find interesting:

Top reasons to build and scale generative AI applications on Amazon Bedrock – Check out Jeff Barr’s video, where he discusses why our customers are choosing Amazon Bedrock to build and scale generative artificial intelligence (generative AI) applications that deliver fast value and business growth. Amazon Bedrock is becoming a preferred platform for building and scaling generative AI due to its features, innovation, availability, and security. Leading organizations across diverse sectors use Amazon Bedrock to speed their generative AI work, like creating intelligent virtual assistants, creative design solutions, document processing systems, and a lot more.

Four ways AWS is engineering infrastructure to power generative AI – We continue to optimize our infrastructure to support generative AI at scale through innovations like delivering low-latency, large-scale networking to enable faster model training, continuously improving data center energy efficiency, prioritizing security throughout our infrastructure design, and developing custom AI chips like AWS Trainium to increase computing performance while lowering costs and energy usage. Read the new blog post about how AWS is engineering infrastructure for generative AI.

AWS re:Inforce 2024 re:Cap – It’s been 2 weeks since AWS re:Inforce 2024, our annual cloud-security learning event. Check out the summary of the event prepared by Wojtek.

Upcoming AWS events
Check your calendars and sign up for upcoming AWS events:

AWS Summits – Join free online and in-person events that bring the cloud computing community together to connect, collaborate, and learn about AWS. To learn more about future AWS Summit events, visit the AWS Summit page. Register in your nearest city: New York (July 10), Bogotá (July 18), and Taipei (July 23–24).

AWS Community Days – Join community-led conferences that feature technical discussions, workshops, and hands-on labs led by expert AWS users and industry leaders from around the world. Upcoming AWS Community Days are in Cameroon (July 13), Aotearoa (August 15), and Nigeria (August 24).

Browse all upcoming AWS led in-person and virtual events and developer-focused events.

That’s all for this week. Check back next Monday for another Weekly Roundup!

— Esra

This post is part of our Weekly Roundup series. Check back each week for a quick roundup of interesting news and announcements from AWS!

Introducing end-to-end data lineage (preview) visualization in Amazon DataZone

Post Syndicated from Esra Kayabali original https://aws.amazon.com/blogs/aws/introducing-end-to-end-data-lineage-preview-visualization-in-amazon-datazone/

Amazon DataZone is a data management service to catalog, discover, analyze, share, and govern data between data producers and consumers in your organization. Engineers, data scientists, product managers, analysts, and business users can easily access data throughout your organization using a unified data portal so that they can discover, use, and collaborate to derive data-driven insights.

Now, I am excited to announce in preview a new API-driven and OpenLineage compatible data lineage capability in Amazon DataZone, which provides an end-to-end view of data movement over time. Data lineage is a new feature within Amazon DataZone that helps users visualize and understand data provenance, trace change management, conduct root cause analysis when a data error is reported, and be prepared for questions on data movement from source to target. This feature provides a comprehensive view of lineage events, captured automatically from Amazon DataZone’s catalog along with other events captured programmatically outside of Amazon DataZone by stitching them together for an asset.

When you need to validate how the data of interest originated in the organization, you may rely on manual documentation or human connections. This manual process is time-consuming and can result in inconsistency, which directly reduces your trust in the data. Data lineage in Amazon DataZone can raise trust by helping you understand where the data originated, how it has changed, and its consumption in time. For example, data lineage can be programmatically setup to show the data from the time it was captured as raw files in Amazon Simple Storage Service (Amazon S3), through its ETL transformations using AWS Glue, to the time it was consumed in tools such as Amazon QuickSight.

With Amazon DataZone’s data lineage, you can reduce the time spent mapping a data asset and its relationships, troubleshooting and developing pipelines, and asserting data governance practices. Data lineage helps you gather all lineage information in one place using API, and then provide a graphical view with which data users can be more productive, make better data-driven decisions, and also identify the root cause of data issues.

Let me tell you how to get started with data lineage in Amazon DataZone. Then, I will show you how data lineage enhances the Amazon DataZone data catalog experience by visually displaying connections about how a data asset came to be so you can make informed decisions when searching or using the data asset.

Getting started with data lineage in Amazon DataZone
In preview, I can get started by hydrating lineage information into Amazon DataZone programmatically by either directly creating lineage nodes using Amazon DataZone APIs or by sending OpenLineage compatible events from existing pipeline components to capture data movement or transformations that happens outside of Amazon DataZone. For information about assets in the catalog, Amazon DataZone automatically captures lineage of its states (i.e., inventory or published states), and its subscriptions for producers, such as data engineers, to trace who is consuming the data they produced or for data consumers, such as data analyst or data engineers, to understand if they are using the right data for their analysis.

With the information being sent, Amazon DataZone will start populating the lineage model and will be able to map the identifier sent through the APIs with the assets already cataloged. As new lineage information is being sent, the model starts creating versions to start the visualization of the asset at a given time, but it also allows me to navigate to previous versions.

I use a preconfigured Amazon DataZone domain for this use case. I use Amazon DataZone domains to organize my data assets, users, and projects. I go to the Amazon DataZone console and choose View domains. I choose my domain Sales_Domain and choose Open data portal.

I have five projects under my domain: one for a data producer (SalesProject) and four for data consumers (MarketingTestProject, AdCampaignProject, SocialCampaignProject, and WebCampaignProject). You can visit Amazon DataZone Now Generally Available – Collaborate on Data Projects across Organizational Boundaries to create your own domain and all the core components.

I enter “Market Sales Table” in the Search Assets bar and then go to the detail page for the Market Sales Table asset. I choose the LINEAGE tab to visualize lineage with upstream and downstream nodes.

I can now dive into asset details, processes, or jobs that lead to or from those assets and drill into column-level lineage.

Interactive visualization with data lineage
I will show you the graphical interface using various personas who regularly interact with Amazon DataZone and will benefit from the data lineage feature.

First, let’s say I am a marketing analyst, who needs to confirm the origin of a data asset to confidently use in my analysis. I go to the MarketingTestProject page and choose the LINEAGE tab. I notice the lineage includes information about the asset as it occurs inside and out of Amazon DataZone. The labels Cataloged, Published, and Access requested represent actions inside the catalog. I expand the market_sales dataset item to see where the data came from.

I now feel assured of the origin of the data asset and trust that it aligns with my business purpose ahead of starting my analysis.

Second, let’s say I am a data engineer. I need to understand the impact of my work on dependent objects to avoid unintended changes. As a data engineer, any changes made to the system should not break any downstream processes. By browsing lineage, I can clearly see who has subscribed and has access to the asset. With this information, I can inform the project teams about an impending change that can affect their pipeline. When a data issue is reported, I can investigate each node and traverse between its versions to dive into what has changed over time to identify the root cause of the issue and fix it in a timely manner.

Finally, as an administrator or steward, I am responsible for securing data, standardizing business taxonomies, enacting data management processes, and for general catalog management. I need to collect details about the source of data and understand the transformations that have happened along the way.

For example, as an administrator looking to respond to questions from an auditor, I traverse the graph upstream to see where the data is coming from and notice that the data is from two different sources: online sale and in-store sale. These sources have their own pipelines until the flow reaches a point where the pipelines merge.

While navigating through the lineage graph, I can expand the columns to ensure sensitive columns are dropped during the transformation processes and respond to the auditors with details in a timely manner.

Join the preview
Data lineage capability is available in preview in all Regions where Amazon DataZone is generally available. For a list of Regions where Amazon DataZone domains can be provisioned, visit AWS Services by Region.

Data lineage costs are dependent on storage usage and API requests, which are already included in Amazon DataZone’s pricing model. For more details, visit Amazon DataZone pricing.

To learn more about data lineage in Amazon DataZone, visit the Amazon DataZone User Guide.

— Esra